Polymeric Hydrogels for Drug Delivery Marte Kee Andersen Chemical Engineering and Biotechnology Supervisor: Wilhelm Robert Glomm, IKP Co-supervisor: Sulalit Bandyopadhyay, IKP Department of Chemical Engineering Submission date: July 2014 Norwegian University of Science and Technology

Welcome message from author
This document is posted to help you gain knowledge. Please leave a comment to let me know what you think about it! Share it to your friends and learn new things together.
Transcript

Polymeric Hydrogels for Drug Delivery
Marte Kee Andersen
Chemical Engineering and Biotechnology
Supervisor: Wilhelm Robert Glomm, IKPCo-supervisor: Sulalit Bandyopadhyay, IKP
Department of Chemical Engineering
Submission date: July 2014
Norwegian University of Science and Technology


i
Preface The thesis is being delivered to the the Chemical Engineering Department at Norwegian
University of Science and Technology (NTNU) under Dr. Wilhelm Robert Glomm,
Trondheim spring 2014. The project was part of a larger research study of Sulalit
Bandyopadhyay, PhD student.
The purpose of this thesis was to study the nanogels as potential drug delivery systems for
treatment of diseases in the human body. The loading and release kinetics was studied for
experimentally and biologically relevant drugs to/from nanogel networks.
Declaration of compliance I declare that this is an independent work according to the exam regulations of the Norwegian
University of Science and Technology (NTNU).
Place and date: Trondheim, 02.07.2014 Signature:

ii
Acknowledgement I express my sincerely gratitude to my supervisor Dr. Wilhelm Robert Glomm, Senior
Researcher at SINTEF and Professor II at NTNU, for his scientific advices and enthusiasm.
The understanding of every aspect of the thesis would not have been accomplished without his
great ideas and explanations.
I would truly like to thank my co-supervisor Sulalit Bandyopadhyay, PhD student, Chemical
Engineering Department, NTNU, for his patience and support. This thesis would not have seen
the light of the day without both his theoretical and practical guidance. The magnitude of gratitude
for his effort in this thesis cannot be covered in words, but will never be forgotten.
Finally, I want to thank Birgitte Hjelmeland McDonagh, PhD student, Chemical Engineering
Department, NTNU for always having an open door and for sharing her knowledge. Her positive
energy has been hopefully reflected in this thesis.

iii
Abstract Targeting specific drugs to a diseased site is widely studied both in vitro and in vivo, but very few
systems have made entry into the clinical market. The systems today cause unwanted side effects
due to the lack of specific targeting. This means that a larger dose is required to treat the disease.
An interesting option to study within drug delivery systems is the synthesis and proper
optimization of Poly(N-Isopropylacrylamide) (PNIPAm), a thermo-responsive polymer. This
polymer can be cross-linked with Acrylic Acid (AAc) to form nanogels, which are in the form as
hydrogels. PNIPAm/AAc can undergo a volume phase transition at and above its specific volume
phase transition temperature (VPTT). This can trigger release of drugs at targeted sites in vivo.
The work described in this thesis focused on studying the loading and release of the
PNIPAm/AAc nanogels. The loading has been assumed to occur in the hydrophilic state of the
polymer, when the network can contain high ratio of water. In this state the hydroxyl groups of
AAc are de–protonated and Coulombic repulsive forces dominate. The drug solution has been
introduced to freeze-dried nanogels when they were in the solid state. In this state the polymers
can be compared to a sponge which absorbs the solution. This loading mechanism is known as the
breathing in mechanism. This mechanism has been used to load two biologically relevant drugs;
paracetamol (commonly used experimental drug in the laboratory) and Cytochrome C (a
hydrophilic protein which is biologically relevant and whose properties are dependent on pH).
The nanogels have been synthesized, freeze-dried and suspended in solution (1 mg/mL). The
properties of these freeze-dried nanogels have been mapped using dynamic light scattering (DLS).
The nanogel swelling/de-swelling kinetics have been confirmed to be reversible and the VPTT
has been measured at 36 °C (synthesized with 3 mM sodium dodecyl sulphate (SDS) and 8 % N,
N’ – Methylenebis(acrylamide) (BIS)) and 39 °C (synthesized with 4 mM SDS and 5 % BIS)
respectively.
The loading studies with paracetamol indicated that the drug is relatively hydrophobic. This drug
has shown to have higher loading - (61 %) and encapsulation efficiencies (16 mg drug/mg
polymer) at elevated temperature, when the nanogel was de-swollen and was in the hydrophobic
state. This implied that the nanogel made hydrophobic interactions with the drug. Raising the
temperature higher has shown to give squeezing release. The release has also been observed when
lowering the temperature below VPTT (when the drug was swollen and hydrophilic). The loading
and release studies of paracetamol have also been performed by changing the pH. At pH 3 the
hydroxyl groups of AAc is highly protonated (pKa = 4.25), which gave polymer/paracetamol
interactions and thereby relatively high loading - (60 %) and encapsulation efficiencies (14 mg
drug/mg polymer). An increase of the pH to 7 has also given efficient release (46 %) due to the
de–protonation of the hydroxyl groups.
In contrast to the measurements of the free (i.e.; not bound) paracetamol for the calculations of
loading and release; the bound Cytochrome C was measured after dialysis. Through this method
the free Cytochrome C was shown to diffuse through the dialysis membrane, while successful
loading and release were proven by measurements of the bound protein. Cytochrome C loading –
and encapsulation efficiencies have been calculated to be 86 % and 0.17 mg drug/mg polymer
respectively. Release studies of the protein have been performed at 39 °C, and with three

iv
different surrounding pHs: At normal pH conditions, at lowered pH (pH 3) and in PBS solution.
The fastest and most efficient release has been observed with lowered pH (24 % release after 24
h).
The nanogels have shown successful loading and release of both hydrophobic and hydrophilic
drug molecules by triggering release with change in temperature and pH. This makes them very
interesting as drug carriers. The nanogels have the ability to target the desired site with proper
modifications, and to exhibit controllable release. This along with stability and degradability of
the nanogels can be achieved by modification of the surface. Modification with Poly(Ethylene
glycol) (PEG) will avoid early renal clearance of the nanogels. The nanogels can also be
incorporated to metal nanoparticles (NPs) which will make it possible to use an electromagnetic
field to trigger the release of incorporated drug (in addition to enabled detection and imaging).
v
Sammendrag Å rette spesifikke medikamenter til seter ved syke celler er mye studert både in vitro og in
vivo, men svært få systemer har gjort inntreden i det kliniske markedet. Systemene i dag
forårsaker uønskede bivirkninger på grunn av manglene spesifikk målretting. Dette betyr at en
større dose er nødvendig for å behandle sykdommen. En interessant mulighet å forske på
innenfor forskning på medikament systemer er syntesen og riktig optimalisering av Poly(N-
Isopropylakrylamid) (PNIPAm), et termoresponsivt polymer. Dette polymeret kan bli
kryssbundet med Akrylsyre (AAc) og danne nanogeler i form av hydrogeler. PNIPAm/AAc
kan gjennomgå en volum-fase endring når den gjennomgår overgang ved og over en
volumfaseovergangstemperatur (VPTT). Dette kan utløse frigjøring av medikamenter på
målrettede områder in vivo.
Dette arbeidet fokuserte på å studere lasting og frigivelse av PNIPAm /AAc nanogeler.
Lastingen er antatt å forekomme i den hydrofile tilstand av polymeren, når nettverket kan
inneholde høy andel vann. I denne tilstanden er mange av hydroksylgruppene til AAc
uprotonerte og de frastøtende Coulombic kreftene dominerer. Medikamentene i løsning har
blitt introdusert til nanogelene via frysetørking. I denne tilstand kan nanogelene
sammenlignes med en svamp som absorberer oppløsningen. Denne lastemekanismen er kjent
som puste-inn mekanismen. Denne mekanismen har vært brukt til å laste to biologiske
aktuelle medikamenter; paracetamol (som vanligvis brukes som eksperimentelt medikament
på laboratoriet) og Cytokrom C (et hydrofilt protein som er biologisk relevant, og kan
avhenge av pH).
Nanogelene har blitt syntetisert, frysetørket og re-introdusert til løsning (1 mg/mL).
Egenskapene til disse frysetørkede nanogelene er blitt kartlagt ved hjelp av dynamisk
lysspredning (DLS). Den nanogel svellings-/krympings-kinetikken har blitt bekreftet å være
reversibel og VPTT har blitt målt til hhv. 36 °C (syntetisert med 3 mm natriumdodecylsulfat
(SDS) og 8% N, N '- Metylenbis(akrylamid) (BIS)) og 39 °C (syntetisert med 4 mM SDS og
5% BIS).
Studiene med lasting av paracetamol indikerte at medikamentet er relativt hydrofobt. Dette
stoffet har vist seg å ha høyere lastings- (61 %) og innkapslings-effektivitet (16 mg
medikament / mg polymer) ved forhøyet temperatur, når nanogelen var i krympet tilstand og i
den hydrofobe tilstanden. Dette innebar at nanogelen hadde laget hydrofobe interaksjoner
med stoffet. Ved å øke temperaturen ytterligere har en klemme-frigjøring av medikamentet
blitt bekreftet. Det har også blitt observert frigjøring ved senking av temperaturen til under
VPTT (i svellet og hydrofil tilstand). Lastings- og frigjøringsstudium av paracetamol har også
blitt utført ved å forandre pH. Ved pH 3 er hydroksylgruppene til AAc sterkt protonert (pKa =
4.25), noe som ga polymer-paracetamol interaksjoner og dermed forholdsvis høy lastings- (60
%) og innkapslings-effektivitet (14 mg medikament/mg polymer). En økning av pH til 7 har
også gitt effektiv frigjøring (46 %) på grunn av uprotonererte hydroksylgrupper.
I motsetning til målinger av fri paracetamol for beregningene av lasting og frigjøring ble det
bundne Cytokrom C målt etter dialyse. Ved denne fremgangsmåte ble det frie Cytokrom C

vi
bekreftet diffundert gjennom dialysemembranen, imens vellykket lasting og frigjøring ble
påvist ved målinger av proteinet bundet til polymeren. Cytokrom C lastings- og innkapslings-
effektivitetene ble beregnet til 86 %, og 0,17 mg medikament/mg polymer. Frigjøringsstudier
av proteinet har blitt utført ved 39 °C, og ved tre forskjellige pH-verdier: Ved normale pH-
betingelser, ved senket pH (pH 3) og i PBS-løsning. Den raskeste og mest effektive
frigjøringen har blitt observert med senket pH (24 % utgivelse etter 24 timer).
Vellykket lasting og frigjøring av nanogelene har blitt bekreftet som vellykket. Dette av både
hydrofobe og hydrofile medikamenter ved å utløse frigjøring med endring i temperatur og pH.
Dette gjør dem til interessante medikament-leveringssystemer. Nanogelene har mulighet til
målretting til de ønskede setene med de riktige modifikasjonene, og kontrollert frigjørelse av
medikamentet. Dette, sammen med stabilitet og forlenget levetid i blodet kan oppnås ved
modifisering av overflaten. Modifisering av Poly(etylenglykol) (PEG) vil unngå tidlig
klarering av nanogelene. Nanogelene kan også bli inkorporert til metall-nanopartikler (NPer)
Dette vil gjøre det mulig å anvende et elektromagnetisk felt for å utløse frigjøring av
medikament (i tillegg til å muliggjøre deteksjon og avbildning).

vii
Table of contents Preface ......................................................................................................................................... i
Acknowledgement ...................................................................................................................... ii
Abstract ..................................................................................................................................... iii
Sammendrag ............................................................................................................................... v
Table of contents ...................................................................................................................... vii
Abbreviations ............................................................................................................................. x
1 Introduction ........................................................................................................................ 1
2 Theory ................................................................................................................................ 3
2.1 Nanotechnology in drug delivery ................................................................................ 3
2.1.1 The aim of nanotechnology .................................................................................. 3
2.1.2 Advantages of NPs ............................................................................................... 4
2.1.3 Administration of the NP ..................................................................................... 4
2.1.4 Passive – and active targeting .............................................................................. 5
2.1.5 Multifunctional NPs ............................................................................................. 5
2.2 Biodegradable drug carriers......................................................................................... 6
2.2.1 Avoidance of the elimination routes in the body ................................................. 6
2.2.2 Degradation .......................................................................................................... 7
2.2.3 Triggering release by degradation ........................................................................ 7
2.3 Core/shell hydrogels .................................................................................................... 7
2.3.1 pH – and temperature–responsive polymers ........................................................ 7
2.3.2 Conformational changes of PNIPAm/AAc .......................................................... 8
2.3.3 Interactions between core and shell ..................................................................... 9
2.3.4 Influences of core and shell ................................................................................ 10
2.3.5 Location of incorporated drug ............................................................................ 10
2.4 Paracetamol ............................................................................................................... 10
2.5 Cytochrome C ............................................................................................................ 12
2.6 Loading of the drugs .................................................................................................. 12
2.6.1 Definition of loading and release ....................................................................... 12
2.6.2 Loading – and encapsulation efficiency ............................................................. 13
2.6.3 Loading methods ................................................................................................ 13
2.6.4 Interactions between the carrier and the drug .................................................... 14
2.6.5 Loading with peptides and proteins ................................................................... 14
2.6.6 Charge localization ............................................................................................. 15

viii
2.7 Release of the drugs ................................................................................................... 15
2.7.1 Release mechanisms ........................................................................................... 15
2.7.2 Triggered release ................................................................................................ 16
2.8 Hydrogels and VPTT ................................................................................................. 16
2.8.1 Characteristics of the hydrogels ......................................................................... 16
2.8.2 Temperature dependent transition ...................................................................... 17
2.9 Transition from microgels to nanogels ...................................................................... 18
2.9.1 Advantages of the nanogels ................................................................................ 18
2.9.2 Elimination of NPs ............................................................................................. 19
2.9.3 NPs as nanogels .................................................................................................. 19
2.9.4 Nanospheres and - capsules ................................................................................ 19
2.9.5 Nanogels with surface functionalities ................................................................ 20
2.9.6 Uptake of the nanogels ....................................................................................... 20
3 Materials and methods ..................................................................................................... 21
3.1 Material ...................................................................................................................... 21
3.1.1 Reagents ............................................................................................................. 21
3.2 Characterization methods .......................................................................................... 21
3.2.1 DLS .................................................................................................................... 21
3.2.2 UV-VIS .............................................................................................................. 22
3.3 Methods ..................................................................................................................... 23
3.3.1 Recrystallization of NIPAm ............................................................................... 23
3.3.2 Precipitation polymerization of the PNIPAm/AAc nanogels ............................ 24
3.3.3 Dialysis ............................................................................................................... 26
3.3.4 Freeze-drying ..................................................................................................... 26
3.3.5 Loading ............................................................................................................... 27
3.3.6 Release ............................................................................................................... 28
4 Results and Discussion ..................................................................................................... 30
4.1 Re-crystallization of NIPAm ..................................................................................... 30
4.2 Synthesis of PNIPAm ................................................................................................ 30
4.3 The effect of the surfactant ........................................................................................ 31
4.4 Characterization of the nanogels ............................................................................... 33
4.4.1 Stability and dilution of the nanogels ................................................................. 33
4.4.2 The cuvettes ........................................................................................................ 34
ix
4.4.3 The size of the nanogels ..................................................................................... 35
4.4.4 The VPTT ........................................................................................................... 37
4.4.5 The reversibility of the hydrogel network .......................................................... 39
4.4.6 The size of the particles as a function of temperature at high and low pH ........ 39
4.4.7 The zeta potential ............................................................................................... 40
4.5 Loading and release studies ....................................................................................... 44
4.5.1 Scattering polymers ............................................................................................ 44
4.5.2 Loading paracetamol .......................................................................................... 45
4.5.3 Release of paracetamol ....................................................................................... 54
4.5.4 Loading of Cytochrome C .................................................................................. 55
4.5.5 Release of Cytochrome C ................................................................................... 59
5 Conclusion ........................................................................................................................ 62
6 Future work ...................................................................................................................... 64
6.1 Drug release studies of Cytochrome C ...................................................................... 64
6.2 Polymers incorporated to magnetic NPs. .................................................................. 64
6.3 Incorporation of PEG................................................................................................. 65
7 Bibliography ..................................................................................................................... 67
Appendix A – The risk assessment ........................................................................................... A
Appendix B – Calculations ....................................................................................................... B
Appendix C – Calculations of the VPTT .................................................................................. C

x
Abbreviations AAc – Acrylic Acid
BBB - Blood-brain barrier
BIS - N, N’ – Methylenebis(acrylamide)
DLS – Dynamic light scattering
EPR - Enhanced permeability and retention
IgG – Immunoglobulin G
KPS – Potassium persulphate
MFNP – Multifunctional nanoparticle
MWCO - Molecular weight cut-off
NIPAm – N-Isopropylacrylamide
NP – Nanoparticle
PBS - Phosphate buffer saline
PDI – Polydispersity index
PEG – Poly(Ethylene glycol)
PNIPAm - Poly(N-Isopropylacrylamide)
RES -Reticulo-endothelial system
SDS – Sodium dodecyl sulphate
UV-VIS – Ultraviolet visible spectrophotometry
vdw - Van der Waals
VPTT - Volume phase transition temperature
1
1 Introduction Most of the drug delivery systems available today for treatment of various diseases are
expensive. An exception for this is targeting medicine-capsules (gelatin or matrices). To
utilize and optimize these systems, the properties of the drug and its interaction in the body
have to be investigated more.[1] Most of the treatment of diseases (including cancer) will not
be that specific to the target diseased cells, but spread to the other healthy cells as well. Since
a significant amount of the drug will go to these healthy cells, a larger dose is required to have
efficient drug to all the unwanted cells. The attack of the healthy cells can also cause side-
effects. A good option to avoid this is with targeted drug delivery nanocarriers.[2]
The use of polymeric nanoparticles (NPs) is of potential interest in the field of targeted drug
delivery systems owing to multiple degrees of freedom like bio-degradability, hydrophobicity
and the form (particles, capsules) in which they can be produced. Targeting specific drugs to a
diseased site is widely studied both in vitro and in vivo, but very few systems have made entry
into the clinical market. The systems today cause unwanted side effects due to the lack of
specific targeting which means that a larger dose is required to treat the disease. A feasible
option to investigate in such cases is with nanocarriers capable of targeted delivery of
cargo.[2]
These systems allow site-specific drug delivery, in addition to stimuli-responsive control of
the release of the drug. They shield the drug and keep it from reacting with the immediate
environment. Polymers intended for such application should be able to exhibit low viscosity
when injected into the body, but once in the body it should own the mechanical properties
characteristic of the polymer matrix. This is possible with polymers sensitive to a change in
the external environments.[2]
The polymers have to be incorporated with cell specific markers dependent on the application
to reach the desired target. To make the polymer target specific, the pH can be an interesting
option to regulate, i.e. in cancer therapy; the drug carriers are easily accumulated in the tumor
cells because of their loose junction and insufficient lymphatic drainage.[3] Further, the
carriers will be transported into the cell by endocytic vesicles of the cell which change from
early to late endocytes. The late endocytes are changed to lysosomes which will have lower
pH (~5) than the healthy cells (~7.4). The lysosome trapped drug carriers will then be able to
release the drug due to a pH change. This makes it possible to release the drug from a pH-
sensitive drug carrier.[3]
In this regard, there has been a tremendous focus on nanogels (polymers in the nanometer
range) as a need to understand how thermo and pH responsive hydrophilic polymers can
influence potential applications in delivery of specific drugs to targeted locations. Nanogels
comprising stimuli sensitive blocks, synthesized in the nano regime yield a wide range of
novel properties that can be effectively utilized for various bio-medical applications. The
current work has focused on smart nanogels in targeted drug delivery. Multiple stimuli
dependence can be achieved by incorporating temperature and pH sensitive blocks in the

2
polymer backbone. Both pH and temperature dependence can be achieved in a polymer by
incorporating the temperature dependent Poly(N-Isopropylacrylamide) (PNIPAm) with the pH-
dependent Poly(Acrylic acid) (Poly(AAc)).
The main scope of this thesis is to study the loading and release mechanism of relevant drug
molecules from the nanogel network. The lack of knowledge of specific targeting systems is
the driving force, since this will cause many side effects and cost barriers. The goal is to
deliver a product that can protect the desired drugs from the immune system, target the
specific sites and exhibit controllable release.
The loading mechanism chosen is known as the breathing in mechanism which has proven to
be an effective way of entrapping the drug in the network. The interaction between polymer-
paracetamol is going to be investigated, and hydrophobic characteristics of the drug have been
mapped. The interaction between nanogel-Cytochrome C on the other hand showed promising
hydrophilic characteristics and was able to release with increased temperature and pH.
These findings make the nanogels potential drug carriers, but the interactions between the
network and each desired drug has to be carefully mapped. This can prevent non-specific
release of drugs and thereby decrease the toxic effect, in addition to a decrease in the amount of
relevant drug. The biodegradable nanogels will also avoid early clearance and hinder the
accumulation of drug carrier. This will reduce the costs of the drug carrier systems significantly,
which is a large problem with treatment of diseases today.
The characteristics of biodegradation are highlighted since this is a desired quality when
introducing an unknown substance to the body. This is followed up by introduction of
core/shell nanogel, since these gels are utilized in this study. The loading/release kinetics are
also explained, and thereby the characteristics of the interactions between nanogel and loaded
cargo. This section comes after the introduction of the two molecules chosen in this study.
Thereafter, nanogels with potential for temperature and pH responses with special highlights
on volume phase transition temperature (VPTT). A gel network that exhibits a VPTT and
used in this study is the PNIPAm/AAc nanogels. The first polymer block is temperature
responsive, while the other is pH–dependent. The properties of PNIPAm/AAc polymers are
highlighted. These networks can be directly exploited for delivering desired cargo to the
target site.
In the first sections the focus will be on microgels ( micrometer) since these larger gels are
more studied. However, since the microgels and nanogels have appreciable similarities in
physico-chemical properties, the studies with microgels will most likely apply for the smaller
gels as well. The consequences of the transition from microgels to nanogels are explained in
the last section.
3
2 Theory
2.1 Nanotechnology in drug delivery
2.1.1 The aim of nanotechnology
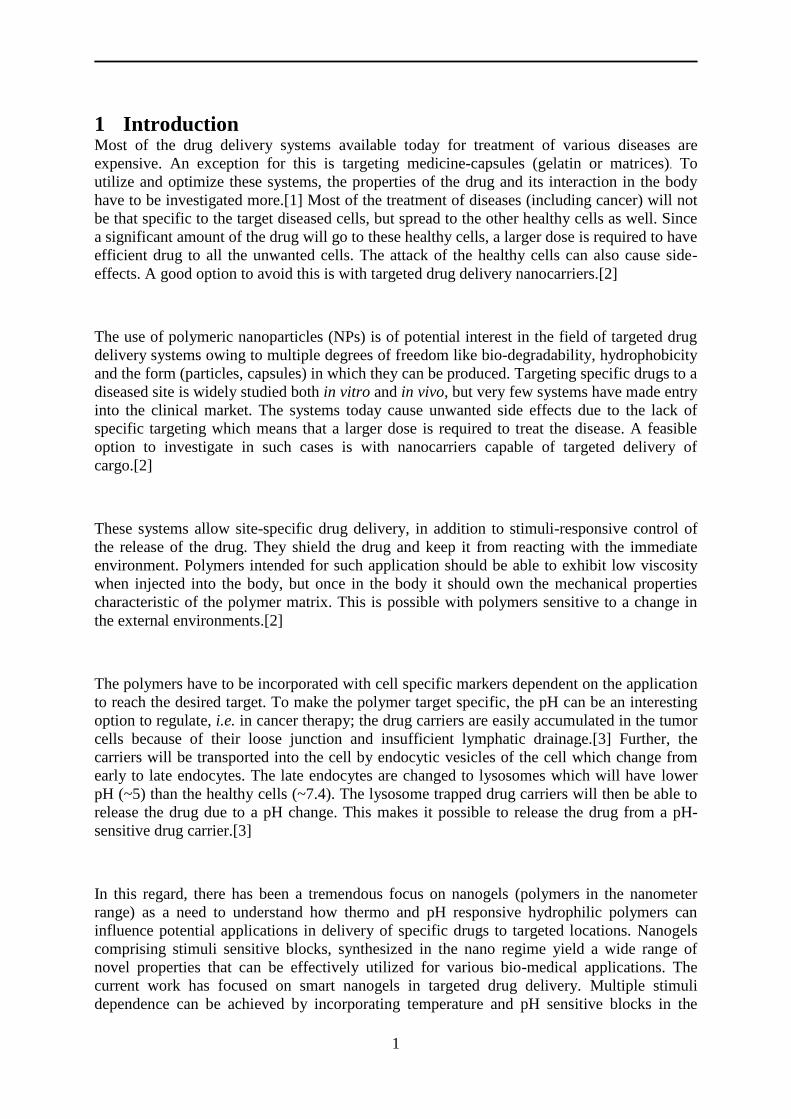
In 2010 the global market for drug delivery systems was recorded at 131.6 billion dollars and
is estimated to reach 175.6 billion at the end of 2016.[4] The drug’s efficiency and
marketability are dependent on the chosen delivery system. New delivery systems have made
it possible to give already existing drugs a new chance. The delivery system is usually made
with a carrier which often attaches or adsorbs the drug, and then releases the drug upon a
change of the external environment.[4] This is shown as an example in Figure 1 by loading
cargo to nanogels and release is triggered by a change like temperature or pH.
Figure 1 – Shows drug loaded nanogels sensitive to external stimuli. Release is triggered by change in the
external environment.
Qualities like stability, size distribution and targeting specificity have to be prioritized when
designing a drug carrier.[5] Delivery systems within nanotechnology have developed as a
huge interest during the last decades. This exhilarating area uses NPs. These particles have the
ability to deliver multiple molecules to different sites in the body and keep them sustained
over time.[4]
The drug delivery technology has incorporated nanotechnology in many areas. Many NP-
mediated therapeutic agents are commercially available. Several NP based therapeutic and
diagnostic agents have been developed. Among these systems are treatment of HIV, diabetes,
pain, asthma, allergy influenza and cancer. It is especially interesting in the field of cancer
research because nanotechnology offers ways of targeting specific sites in the body and to
distinguish healthy cells from the diseased.[4] Delivery of down-regulating drugs (drugs that
will decrease the receptors on the cell surface) is not desired in healthy cells, and this can be
avoided by using NPs as drug carriers loaded with multiple drugs (for instance hydrophobic
paclitaxel, DNA, siRNA and hydrophilic doxorubicin) for different functionalities to target
different metabolic pathways of the tumor.[6, 7]
When developing these systems, the most important issues are safety and toxicology. Thus,
NPs should be appropriately examined for cytotoxicity both in vitro and in vivo. A huge gap
between research exploration and nano-scaled pharmaceutical ingredient delivery still
exists.[4]
4
2.1.2 Advantages of NPs
In addition to selective targeting, the specific NPs can reach extended circulation time in the
blood, have little immunogenicity, superior biocompatibility, and can possible exhibit
competent penetration of barriers such as the blood-brain barrier (BBB).[4] The size,
morphology and surface charge of the NPs can also be easily controlled. Another advantage is
the possibilities for modifications. For example, the drug can be discharged during delivery
and targeting, and the particle degradation can change through proper modifications. Surface
modification and size will decide qualities of the NPs, thereby the capacity to release the
drug.[4] The incorporation of drug to NPs will give the drug better probability of being
transported into the cells via an endocytosis mechanism which is a more efficient transporting
mechanism.[8] The endocytosis process of NPs is an activation energy process which
involves interaction and collision between the particles and cells. This process is dependent
on ionic interactions, and since the cell membranes are negatively charged, the nanocarriers
can be modified with positive charge for increased interaction and uptake. The surface charge
along with size and hydrophobicity of the particles play an important role in the uptake of
incorporated drugs. The size influences the nanocarrier’s intracellular uptake within cells and
macrophages.[8]
2.1.3 Administration of the NP
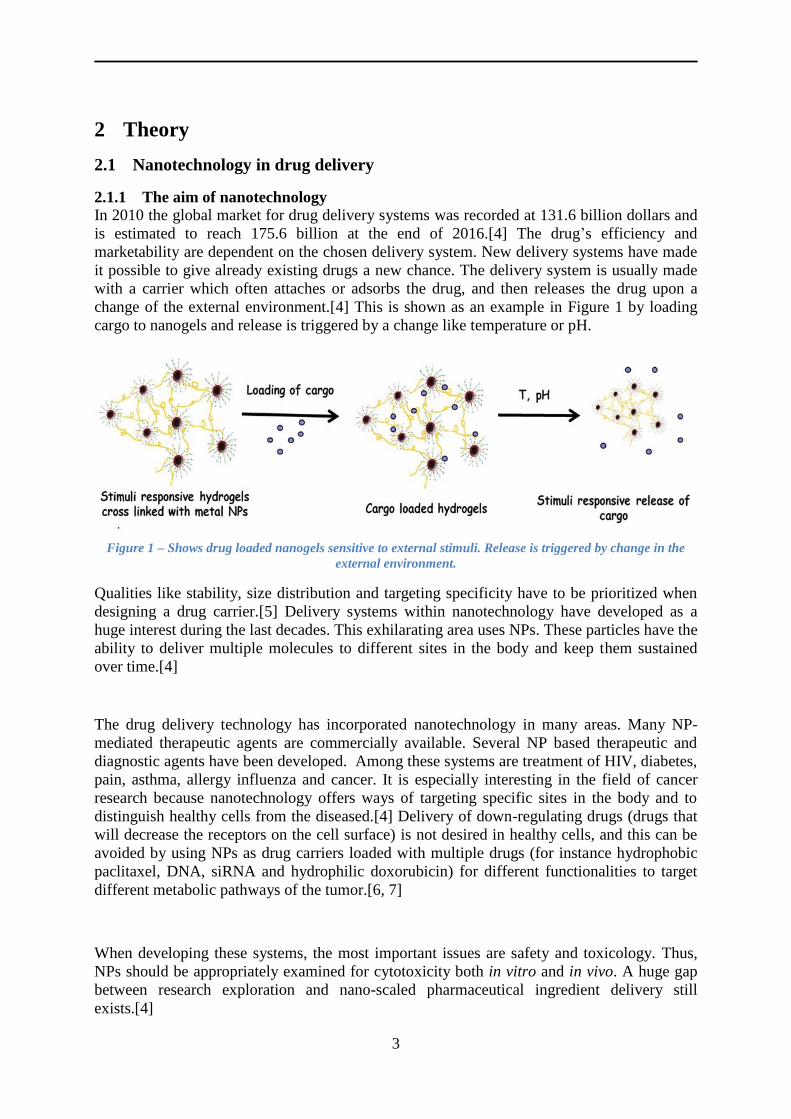
The drug incorporated in the NP has many possibilities and can be administrated through
various routes as illustrated in Figure 2. Depending on the content, there are some routes that
should be neglected. For instance, oral administration of polyacids will give limited network
swelling and slow drug release because of the low pH in the stomach and thereby protonated
hydroxyl groups. In contrast, higher pH in the small intestine will cause acid dissociation, so
the network will swell and cause drug release in part of the gastrointestinal tract where
absorption can occur and where drug hydrolysis is less acute.[9]
Figure 2 Administration routes of NPs into the body - oral delivery[4, 8], cancer chemotherapy[4, 6, 10],
vaccine delivery, ocular delivery, pulmonary drug delivery, dermal and transdermal delivery and delivery
systems coupled to implants[4].

5
2.1.4 Passive – and active targeting
Once the drug has followed an administration route it will be taken up through either passive
or active targeting. Passive targeting exploits the enhanced permeability and retention (EPR)-
effect to target tumour cells. This kind of targeting arises because of the circulation of the drug in
the blood. The specific drug carriers accumulate near the targeted cells, extravasate, leading to
retention in the cell and finally distribute. The increase of the EPR-effect gives better specific
targeting, but in the drug delivery this is hard to accomplish. This applies particularly to the tumor
cells which change constantly. To increase this effect more information about the distribution of
the drug and the dose have to be clear.[11]
Active delivery requires more modification of the surface of drug carriers; bioactive
molecules, such as hormones, carbohydrates, peptides and proteins (especially folic acid and
its derivatives) have been used as ligands to give nanocarriers specific targeting properties
towards drug delivery to diseased cells.[6]
2.1.5 Multifunctional NPs
Figure 3 – Qualities that the surface modifications can provide to the nanocarrier.[12]
Surface modifications of the NPs have made it possible to avoid rapid phagocytosis
(particularly after intravenous administration). In addition, less drug leakage and thereby less
peripheral toxicity can be achieved by surface modified NPs.[4] These surface modifications
can provide many properties for the NPs, which are illustrated in Figure 3. These make the
NPs multifunctional.[12] In contrast to the conventional drug delivery methods available
today, the multifunctional NPs offer drug delivery methods that can co-deliver multiple
components, target and possess possibility of simultaneous therapy and diagnosis.[6] A
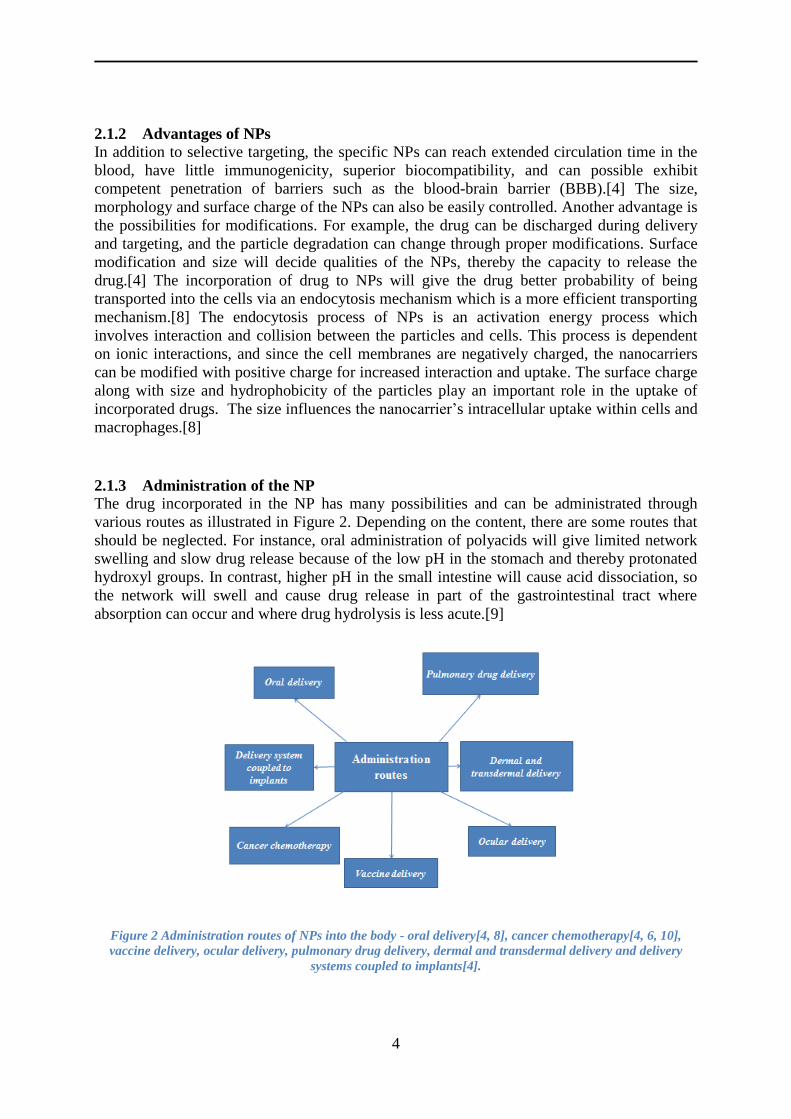
multifunctional NP (MFNP) is shown in Figure 4. The surface functionalities can be varied,
and thereby provide different qualities for the NPs. This system will have combined
properties, like target specificity, optimized optical, electrical and/or magnetic properties and
analysis capabilities.[12]
6
Figure 4 – Schematic illustration of a multifunctional NP.[12]
2.2 Biodegradable drug carriers
2.2.1 Avoidance of the elimination routes in the body
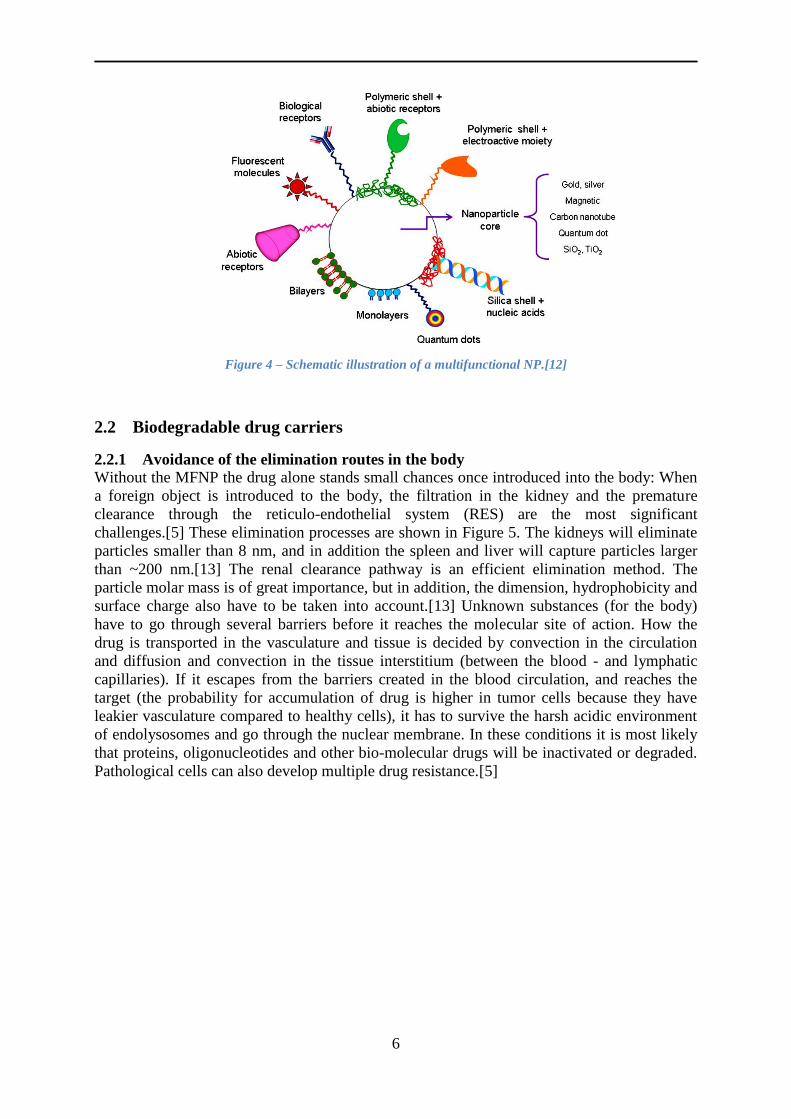
Without the MFNP the drug alone stands small chances once introduced into the body: When
a foreign object is introduced to the body, the filtration in the kidney and the premature
clearance through the reticulo-endothelial system (RES) are the most significant
challenges.[5] These elimination processes are shown in Figure 5. The kidneys will eliminate
particles smaller than 8 nm, and in addition the spleen and liver will capture particles larger
than ~200 nm.[13] The renal clearance pathway is an efficient elimination method. The
particle molar mass is of great importance, but in addition, the dimension, hydrophobicity and
surface charge also have to be taken into account.[13] Unknown substances (for the body)
have to go through several barriers before it reaches the molecular site of action. How the
drug is transported in the vasculature and tissue is decided by convection in the circulation
and diffusion and convection in the tissue interstitium (between the blood - and lymphatic
capillaries). If it escapes from the barriers created in the blood circulation, and reaches the
target (the probability for accumulation of drug is higher in tumor cells because they have
leakier vasculature compared to healthy cells), it has to survive the harsh acidic environment
of endolysosomes and go through the nuclear membrane. In these conditions it is most likely
that proteins, oligonucleotides and other bio-molecular drugs will be inactivated or degraded.
Pathological cells can also develop multiple drug resistance.[5]

7
Figure 5 – The possible eliminators for the drug (carrier).[14, 15]
2.2.2 Degradation
To avoid the drastic removal of the polymer by the body’s defense mechanism, biodegradable
polymers are desired. These polymers are complicated and they should not cause unwanted
responses in the body. The degradation should also happen in a controlled manner.[1] The
decrease in the size can cause variations in the physiochemical and structural properties. This
can lead to numerous material interactions which may produce toxic effects.[4] The decrease
in size will make the degraded particle have different properties when it is decomposed. The
decomposition can be tuned by modifying cross-linker density within the network.[13]
2.2.3 Triggering release by degradation
Degradation of drug carrier can be used to trigger release of drugs. Self-degrading drug
carriers can be tuned to have a release rate that can go anywhere between seconds to days.
This is possible by varying the composition of the drug carrier. Related to the self-degradation
is the chemical and/or enzymatic triggering, which is interesting in cancer therapy. Change in
pH can break disulfide cross–links, and the polymer will then degrade. The cross-linking
plays an important role when degrading a polymer[9], as the cross-linker has proven to
influence density, size and mechanical properties within a polymer network.[16]
2.3 Core/shell hydrogels
2.3.1 pH – and temperature–responsive polymers
Chemical degradation has been partly achieved with biodegradable pH–responsive Poly(AAc)
microgels. These microgels were cross-linked with disulfide groups that swelled by chemical
reduction of the disulfide bonds. The chemical degradation was much similar to the physically
cross-linked gels, but this proves that the microgels can be triggered to swell by rupturing
cross-links either by physical or chemical parameters.[9]
The microgels offer drug delivery systems that have advantages such as conformational
stabilization of the drug. They introduce efficient loading and release of drugs and in the years
8
to come, the microgels will be more focused on as delivery systems for bio-macromolecules
(such as proteins, peptides, siRNA etc.).[5, 9] This is due to the discovery of their ability to
provide stability through secondary and tertiary structures, avoidance of aggregation and
chemical/enzymatic degradation. In addition they can reduce toxicity and other biological
effects, as well as retain biological activity of the drug. The understanding of how to utilize
these qualities of the microgels for loading and release has been focused on in the last years.
The microgels can be functionalized in order to be triggered by multiple and diverse factors.
The gel’s interactions can be controlled by pH, hydrophobicity and charge. Tuning these
factors correctly, a homogeneous and predictable microgel with the desired properties can be
achieved.[9]
2.3.2 Conformational changes of PNIPAm/AAc
The microgels of Poly(AAc) are pH-dependent. Above the pKa,-value the AAc–polymer
interactions will be enhanced and impaired below pH 3. At the latter pH, it has been observed
that anionic microgel films in multilayers did not load any molecules.[16] These microgels
have been cross-linked with PNIPAm and biodegradable disulfide groups. These microgels
showed to swell up by chemical reduction of the bonds. In addition, biodegradable cross-
linked PNIPAm/AAc have shown degradation–limited swelling kinetics.[9] The PNIPAm is a
widely studied temperature-responsive hydrogel.[13] PNIPAm exhibits low cytotoxicity.[17]
The polymer has increased surface charge density over the transition temperature, and the
major driving force for collapse is hydrophobic interactions.[8] PNIPAm alone is a non-
biodegradable polymer.[17] This quality of PNIPAm is due to its tendency to self-crosslink
during the synthesis. This makes PNIPAm-network unpredictable and non-degradable which
is not a quality desired in drug delivery.[18] There exist uncertainties regarding the toxicity of
PNIPAm which have to be further investigated.[9] Another disadvantage of this polymer is
that smart drug delivery systems based on this polymer show slow swelling/de-swelling
transitions. This is due to formation of hydrophobic skin that inhibits the release of drug and
limits de-swelling of gels. A method to avoid these disadvantages is to incorporate
hydrophilic polymer into the hydrogel, which will enhance the flux of water from the bulk
which will therefore permit more efficient collapse. Hydrophilic polymers that are acidic or
basic have been incorporated to the polymer chain, which make them dependent on pH.
Depending on the pKa-value, the solubility of the polymers will change. These synthetically,
especially acid-based, polymers are mostly developed with relation to drug delivery.[17] The
incorporation of a hydrophilic co-monomer can also make the polymer network degradable.
[18] Comparing PNIPAm to PNIPAm/AAc, the latter has larger free volume and diffusion
may be easier through the polymer shells and the carboxyl groups of AAc introduce tunability
of its properties.[19]
When the lightly cross-linked PNIPAm/AAc particles are exposed to change in temperature
or pH they have the ability to undergo drastic changes in the conformation. This is illustrated
in Figure 6 and this gives qualities that enable the gels to deliver bio-macromolecular drugs in
a controlled manner.[9]

9
Figure 6 – Shows the size as a function of a) temperature and b) pH.[20]
Temperature- and pH-dependent polymers are highly popular in drug delivery research.
Different pH environments will create different interactions.[16] Close to the pKa-value of
AAc monomer (pKa = 4.25), an increase of the AAc ratio will give a decrease in the VPTT of
PNIPAm/AAc. In addition, close to pKa, the average particle size increases significantly,
while the zeta potential is lowered. This is due to the fact that at higher pH values, a pH-
responsive swelling behavior is observed owing to the de-protonation of AAc segments which
leads to electrostatic repulsion between carboxylate anions. This causes an increase in the
osmotic pressure inside the particles, thereby increasing the swelling of the polymeric
networks.[21]
2.3.3 Interactions between core and shell
The temperature – and pH responsive polymers can be modified to have multiple orthogonal
functionalities, which the core/shell structure gives a robust platform for.[16] Core/shell
particles introduce controlled (shell-mediated) biological interactions in addition to good
carrier (core-based) properties. The core and shell are mechanically bonded together and
influence each other physico-chemically. This is especially true for the polymer PNIPAm,
which is thermo-responsive due to thermodynamic coupling. The core and shell de-solvation
will influence each other.[22] Research with PNIPAm has shown radial distribution of
connectivity with higher density of polymer in the core.[13]
In a study, both core and shell were synthesized in aqueous solution at 70 °C. The collapsed
PNIPAm microgel core served as nuclei for the growth of the PNIPAm/AAc shell. Both
transmission electron microscopy and dynamic light scattering (DLS) were used to observe
the properties of the gel. The gel showed low polydispersity and it was confirmed that

10
addition of the shell showed a particle size increase. The gel also showed a sharp interface
without significant interpenetration between the core and shell. In addition, studies have
shown that PNIPAm/AAc particles have energy transfer across the core/shell interface when
they collapse. These core/shell nanogels have been optimized through the synthesis towards
drug delivery by adding alkyne or azide groups which can give the gel the appropriate
functionalities for the desired applications.[16]
2.3.4 Influences of core and shell
Multi-responsive PNIPAm/AAc gels have been synthesized proving that the distribution of
the functional groups is important. The introduction of PNIPAm/AAc as core particles has
proven to increase the original VPTT-values when increasing pH from 3.5 to 6.5 because
increasing the pH causes de-protonation of AAc. The increased solvated ions will increase the
swelling and inhibit chain collapse of the particle. This result will again lead to increased
osmotic pressure and Coulombic repulsion. In addition to the PNIPAm/AAc core particle, a
PNIPAm shell has been introduced. The shell collapsed at 32°C, and hindered the core
collapse. This hindrance was increased at pH 6.5 because of the shell-dominance. The shell
has a compression effect which leads to decrease in the average inter-chain distance in the
core and thus decreases the VPTT of it. This study was also performed with PNIPAm in the
core and PNIPAm/AAc in the shell. The shell was not much influenced by the core in this
study. The end conclusion of these two studies was that when looking at the characteristics of
these core/shell gels, it is just as important to look at the whole exterior as each individual
component.[16]
2.3.5 Location of incorporated drug
Recent studies of core/shell particles in the form of gels have shown more binding events on
the periphery of the particles in the gel compared to the interior. This can be explained by the
more reachable and available sites on the surface. The interior of the particle is restricted by
the polymer network and is therefore less reachable for the drugs.[16]
2.4 Paracetamol One drug commonly used in laboratory experiments as a standard drug is paracetamol. This
drug is also called acetaminophen, and has the systemic IUPAC-name N-(4-
hydroxyphenyl)acetamide.[23] The structure is shown in Figure 7.
Figure 7 – The chemical structure of Paracetamol.[24]
This drug is used as a pain reliever (analgesic) and fever reducer (antipyretic). Post-surgical
pain and providing palliative care in advanced cancer therapy can also be managed by this
drug. It is in the class of “aniline analgesics” and does not exhibit significant anti-
inflammatory activity. In therapeutic doses, it is not considered carcinogenic. The way

11
paracetamol operates is not yet completely known. The known factor is that it works as an
inhibitor of cyclooxygenase, and that it is restricted by for instance high level of peroxides
present in inflammatory lesions. To convert it into a non-toxic drug, paracetamol follows
three metabolic pathways as can be seen in Figure 8.[23, 25] These pathways consist of
Glucuronidation (2/3 of the entire metabolism), Sulphation (sulphate conjugation) and N-
hydroxylation followed by Glutathione conjugation.[23]
Figure 8 – The metabolic pathways for paracetamol.[25]
These pathways give products that are non-toxic and inactive, and they will be excreted by the
kidneys. However, in the third pathway a toxic intermediate product; N-acetyl-p-benzo-
quinone imine which is an alkylating metabolite is produced. It is further irreversibly
conjugated by Glutathione’s sulfhydryl groups, but in the intermediate state it is a form of
toxication.[23, 26]
Paracetamol can be recognized using the Ultraviolet visible spectrophotometry (UV-VIS) and
the major absorbance peak of paracetamol is observed at a wavelength of 243 nm.[23] The
solubility of the drug is expressed in Equation 2.1.
Cs =
(2.1)
Where mvdr is the “dry residue” mass, mv the sample vial and mvs the sample vial with the
saturated solution. The solubility of the drug has been determined by Roger A. Granberg and
Åke C. Rasmuson, which is shown in Table 1. This solubility applies for the drug in
water.[27]
Table 1 – Shows the solubility of paracetamol (Cs) given as g paracetamol/kg of water at the corresponding
temperatures.
Temperature 0°C 5°C 10°C 15°C 20°C 25°C 30°C
Cs 7.21 8.21 9.44 10.97 12.78 14.90 17.39

12
Although paracetamol has an appreciable solubility in water, it is hydrophobic than many
other clinically relevant drugs.
2.5 Cytochrome C Another drug commonly used and which is more hydrophilic than Paracetamol is Cytochrome
C. This molecule is illustrated in Figure 9.
Figure 9 – Illustration of Cytochrome C.[28]
Cytochrome C is a hydrophilic protein important for cellular oxidation and is a universal link
in the respiratory chain as it forms electron-bridge between respirable substrates and oxygen.
The mitochondrial drug is released into the cytoplasm and stimulates apoptosis, and is
considered an important mediator in apoptotic pathways.[29] Cytochrome C is a biologically
relevant molecule showing wide conformational variations at different pH conditions and is
quite ideally suited to study interactions at clinically relevant pHs. The isoelectric point of
Cytochrome C is at pH 10 – 10.5.[30] At neutral pH the protein exhibits positive charge (+8).
This molecule is a basic redox-heme-protein and plays an important role in the biological
respiratory chain.[31] Cytochrome C is an efficient biological electron carrier due to ready
interconversion of it between ferrous and ferric states.[29] This protein’s heme-group shows a
characteristic UV-VIS peak at 409 nm.
2.6 Loading of the drugs
2.6.1 Definition of loading and release
To load the drugs, freeze-dried polymers can be used. Loading doses is often higher than the
dose delivered and is administrated to establish therapeutic level of medication.[32]
Successful loading can be achieved by compatible carriers and appropriate location of the
molecules in/on the carrier. The stability of the molecules is important during loading, storage
and release of them. This will especially apply for proteins, peptides and oligonucleotides
since they may lose their biological activity.[33] Sustained release systems give prolonged
time of drug molecules in the blood or tissue. Sustained controlled release is necessary to give
desired drug concentration to the target tissue or - cells. Controlled release is defined as rate-
controlled drug delivery. These systems have an ability to specify the release rate and
duration in vivo.[34]
13
Loading and release have proven to be influenced by different bindings between the drug and
drug carrier, and in the form of a gel network these factors will be influenced by size, cross–
linking density and network homogeneity.[9]
2.6.2 Loading – and encapsulation efficiency
The loading of drug and the loading mechanism onto PNIPAm/AAc particles is dependent on
the ratio of cross-linker and AAc.[9] In addition, the heterogeneity and hydrophobicity of the
polymer network will influence the loading/release kinetics. For example in a study by Bysell
et al. the swelling kinetics decreased when increasing the hydrophobicity with hydrophobic
modification of PNIPAm microgel.[9] This gave both smaller temperature-induced collapse
and lower rate of de-swelling. By adding voids to the PNIPAm microgels the temperature
response increased, which indicated that the (de)swelling kinetics can be tuned by the size and
number of voids. This influence of heterogeneous gels makes it important to make them
monodisperse and uniform.[9] In addition, the loading is dependent on the type of surface-
active materials and stabilizers present.[4]
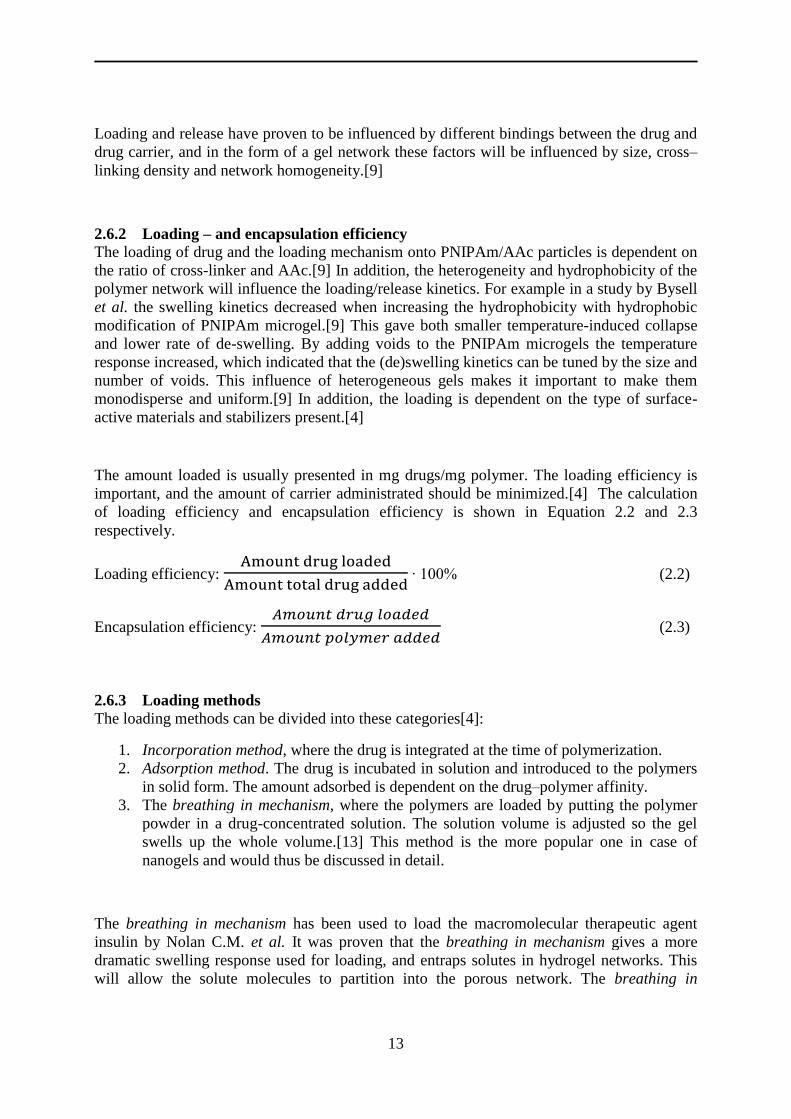
The amount loaded is usually presented in mg drugs/mg polymer. The loading efficiency is
important, and the amount of carrier administrated should be minimized.[4] The calculation
of loading efficiency and encapsulation efficiency is shown in Equation 2.2 and 2.3
respectively.
Loading efficiency:
∙ 100% (2.2)
Encapsulation efficiency:
(2.3)
2.6.3 Loading methods
The loading methods can be divided into these categories[4]:
1. Incorporation method, where the drug is integrated at the time of polymerization.
2. Adsorption method. The drug is incubated in solution and introduced to the polymers
in solid form. The amount adsorbed is dependent on the drug–polymer affinity.
3. The breathing in mechanism, where the polymers are loaded by putting the polymer
powder in a drug-concentrated solution. The solution volume is adjusted so the gel
swells up the whole volume.[13] This method is the more popular one in case of
nanogels and would thus be discussed in detail.
The breathing in mechanism has been used to load the macromolecular therapeutic agent
insulin by Nolan C.M. et al. It was proven that the breathing in mechanism gives a more
dramatic swelling response used for loading, and entraps solutes in hydrogel networks. This
will allow the solute molecules to partition into the porous network. The breathing in

14
mechanism was shown to be more efficient than loading with simple equilibrium
partitioning.[35]
2.6.4 Interactions between the carrier and the drug
The loading (as well as release) of drug from a polymer network is very much dependent on
the interactions between them. This was confirmed by a study with PNIPAm functionalized
with amine to give surface charge, and without affecting the temperature dependence. The
human Immunoglobulin G (IgG) was then adsorbed to the polymer; at low temperatures
(swollen PNIPAm) the adsorption was low as a consequence of low Van der Waals (vdw)
interactions between polymer and drug. Above the transition temperature, PNIPAm is denser,
which leads to higher vdw–interactions and thus higher adsorption of IgG.[9]
Hydrophobic – and non–electrostatic interactions are of great importance when loading
amphiphilic drugs.[9] However, the most important interaction is the ionic interaction
between the drug and the carrier as the drug enters the binding seat.[4] Many studies have
proven that introducing an ionic interface between drug and matrix will give efficient drug
loading. The ionic interface will be inversely related to the distance between two charged
atoms, and the environment also has to be taken into consideration. Hydrophilic interfaces
and equilibrium of electrostatic interaction have shown to give proper adsorption and
release.[4]
The microgel loading of hydrophilic and charged bio-macromolecules will be easier if the
hydrogel is hydrophilic, or has some hydrophilic compartments. This kind of gels also
provides a hydrophilic matrix. This will not cause significant conformational changes and
aggregation of proteins and peptides, although this depend on interaction strength, in contrast
to hydrophobic surfaces. This advantage of (partly) hydrophilic hydrogels helps bio-
macromolecules maintain their biological effect. This effect has also been proven when
incorporating an enzyme to the hydrogel; the enzyme alone loses biological activity, but no
loss in colloidal stability is observed when incorporating it to PNIPAm microgels. In addition,
less conformational changes are observed when increasing the temperature and higher
thermally stability for the microgel-loaded enzyme.[9]
The nature of the microgel is not the only factor controlling the drug loading efficiency but
also the drug itself. It has for example been shown that polyelectrolytes with lower pKa-value
adsorb better than those with higher pKa–value. This is probably due to the fact that weak
polyelectrolytes are more coiled up at intermediate pH. In contrast, the strong polyelectrolytes
exhibit strong interactions and thereby topological restrictions and the result of fewer
electrostatic bonds and larger average pore size, thereby less efficient loading. Inefficient
loading will also occur if the drug forms a shell on the microgel.[9]
2.6.5 Loading with peptides and proteins
The shell formation around the microgel has been confirmed through a study with peptides
incorporated to Poly(AAc) microgels . This study was performed to clarify the drug’s ability
15
to influence the loading. Here, it was shown that the size of the peptides played an important
role for loading; small peptides seemed to distribute evenly throughout the gel, while larger
peptides formed a shell around the microgel. In addition, at pH 4.5, when the hydroxyl groups
are protonated, smaller peptides were needed to form a shell. This is due to lower degree of
dissociation and correspondingly smaller mesh size before peptide binding. The conclusion
from this study by Bysell et al. was that the peptide–microgel binding depends on the peptide
size and the degree of charged hydroxyl groups. This is the general rule, but shell formation is
also dependent on peptide charge densities and distribution, pH and ionic strength. The degree
of peptide incorporation affects loading, release rate and chemical and enzymatic degradation
of the peptide. It has also been proven that the peptides can be cyclized without effecting the
loading and release, and can improve proteolytical and chemical stability or other advantages
of cyclic peptides compared to linearity.[9]
The polyelectrolytic peptides have a relatively uniform charge density, they should avoid
shell formation and the release of them should be triggered and controlled. There exist many
research papers with microgels and peptide/protein as drugs.[9] Proteins and peptides are
hydrophilic and charged, which means that electrostatic interactions are important between
them and charged gels. A study with bovine serum albumine on PNIPAm/AAc showed that
maximum adsorption on the gel was close to the isoelectric point of BSA. At this pH, the
lowest inter-protein repulsion is present. In addition, when the gel is more charged, the
adsorption of the polypeptide increases, but at a certain point of charge it starts to decrease.[9]
2.6.6 Charge localization
The efficiency of both loading and are also dependent on the localization of charge on the
drug: Charge localized on one part of the drug has proven to give more significant de-
swelling of the polymer compared to drugs with even distribution of charge. The drug with
charge at one part has also shown better loading, but at high ionic strength the release was
better for the evenly distributed drug. This study was performed with fully charged
Poly(AAc/Acrylamide). To compare, low-charged microgels (25 %) did not have the ability
to differ these differently charged drugs.[9]
2.7 Release of the drugs
2.7.1 Release mechanisms
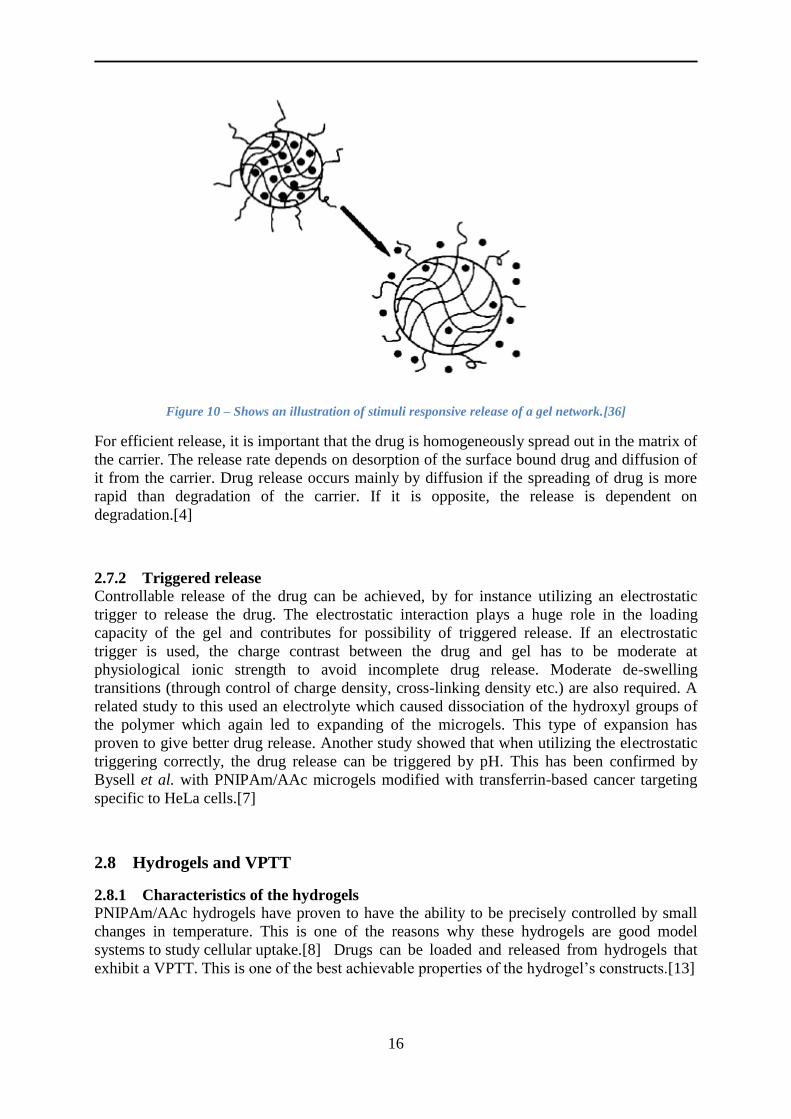
The principle of a stimuli responsive release of the drug is illustrated in Figure 10. The release
can either happen by “squashing release” of the incorporated drug or reduced drug release due
to entrapment. This possibility of variation can give triggered drug release. In addition, a
temperature-dependent gel, like PNIPAm, can vary the activity of the drug when it goes from
swollen to de-swollen state.[9]
16
Figure 10 – Shows an illustration of stimuli responsive release of a gel network.[36]
For efficient release, it is important that the drug is homogeneously spread out in the matrix of
the carrier. The release rate depends on desorption of the surface bound drug and diffusion of
it from the carrier. Drug release occurs mainly by diffusion if the spreading of drug is more
rapid than degradation of the carrier. If it is opposite, the release is dependent on
degradation.[4]
2.7.2 Triggered release
Controllable release of the drug can be achieved, by for instance utilizing an electrostatic
trigger to release the drug. The electrostatic interaction plays a huge role in the loading
capacity of the gel and contributes for possibility of triggered release. If an electrostatic
trigger is used, the charge contrast between the drug and gel has to be moderate at
physiological ionic strength to avoid incomplete drug release. Moderate de-swelling
transitions (through control of charge density, cross-linking density etc.) are also required. A
related study to this used an electrolyte which caused dissociation of the hydroxyl groups of
the polymer which again led to expanding of the microgels. This type of expansion has
proven to give better drug release. Another study showed that when utilizing the electrostatic
triggering correctly, the drug release can be triggered by pH. This has been confirmed by
Bysell et al. with PNIPAm/AAc microgels modified with transferrin-based cancer targeting
specific to HeLa cells.[7]
2.8 Hydrogels and VPTT
2.8.1 Characteristics of the hydrogels
PNIPAm/AAc hydrogels have proven to have the ability to be precisely controlled by small
changes in temperature. This is one of the reasons why these hydrogels are good model
systems to study cellular uptake.[8] Drugs can be loaded and released from hydrogels that
exhibit a VPTT. This is one of the best achievable properties of the hydrogel’s constructs.[13]

17
When the gel network goes through a de-swelling it can reorganize, causing dramatic changes
in the surface chemistry or energy. This is a good quality in cellular therapy.[13] The gel has
the ability to swell and de-swell almost reversibly, causing changes in the surface chemistry
and energy, due to expulsion of encapsulated solutes.[16] In a solution the de-swollen gels
still consist of water, typically ~20 %.[18] These hydrogels are excellent drug carriers as they
exhibit similar Young’s modulus to that of the cell’s extracellular matrix. The hydrogels have
tissue-like mechanical properties, and the ability to contain large fractions of water that make
them capable to resist protein adsorption or cell adhesion.[16] Nano-sized hydrogels,
nanogels, have proven to avoid many side-effects (like toxicity and non-specific targeting)
that come with the treatment for diseases today.[37] Hydrogels that respond to external
stimuli are important due to the ability for controlled release of drugs.[17]
2.8.2 Temperature dependent transition
The temperature of the conformational change of the hydrogel is referred to as the VPTT. The
VPTT describes a network that goes from a highly swollen state to a collapsed and
dehydrated state. This phenomenon is driven by entropy. This is a good advantage in drug
delivery, as it can control uptake and release of drugs. That is why polymer networks that
exhibit VPTT is one of the most studied drug delivery systems.[35] The volume phase
transition can be triggered by temperature, as seen in Figure 11. This figure shows a
reversible swelling transition. Over the VPTT the polymer will be in the collapsed state,
expelling the water. Below the VPTT it will be hydrated and swollen.[13, 38]
Figure 11 – Temperature dependent swelling and de-swelling of a hydrogel network[38].
18
2.9 Transition from microgels to nanogels
2.9.1 Advantages of the nanogels
In drug delivery research there is a profound literature on microgels.[9, 22, 35, 39] The
microgels have shown to reduce chronic inflammation, they have been successfully used in
sensing, drug delivery and as implantable biomaterials. These microgels have a larger size
range than the nanogels. Both gels can be produced by almost similar synthesis methods, but
with different reaction conditions and mole ratios of the reactants. The microgels and
nanogels have similar physical and chemical properties, but the smaller size will give
nanogels the ability for better controlled release.[40]
There is a limited number of studies of nanogels on the other hand[16], although they offer
many advantages over these larger gels: In contrast to the large hydrophilic molecules, they
can penetrate membranes to access the cytoplasm, and they are not filtered by the kidneys as
fast as the larger ones. [5] In addition, bioaccumulation can be reduced and the clearance by
renal filtration can be improved.[37] Small gel networks can also be designed to respond to
different stimuli, [9] and it is easier to create complex interfaces with smaller gels.[16] In
addition, the tiny size and mobility of NPs make them able to locate wide ranges of targets.[4]
The nanogels are always in the form of hydrogels. Advantage of small gels (~50-200 nm) is
that they are favored in case of intravenous drug delivery.[16] They can also cause fast
response (while injected directly into the blood for example), which also opens for
opportunities in other delivery routes.[9] Intravenous delivery has been done with nanogels
consisting of PNIPMAm. These gels have shown to encapsulate, retain and deliver siRNA to
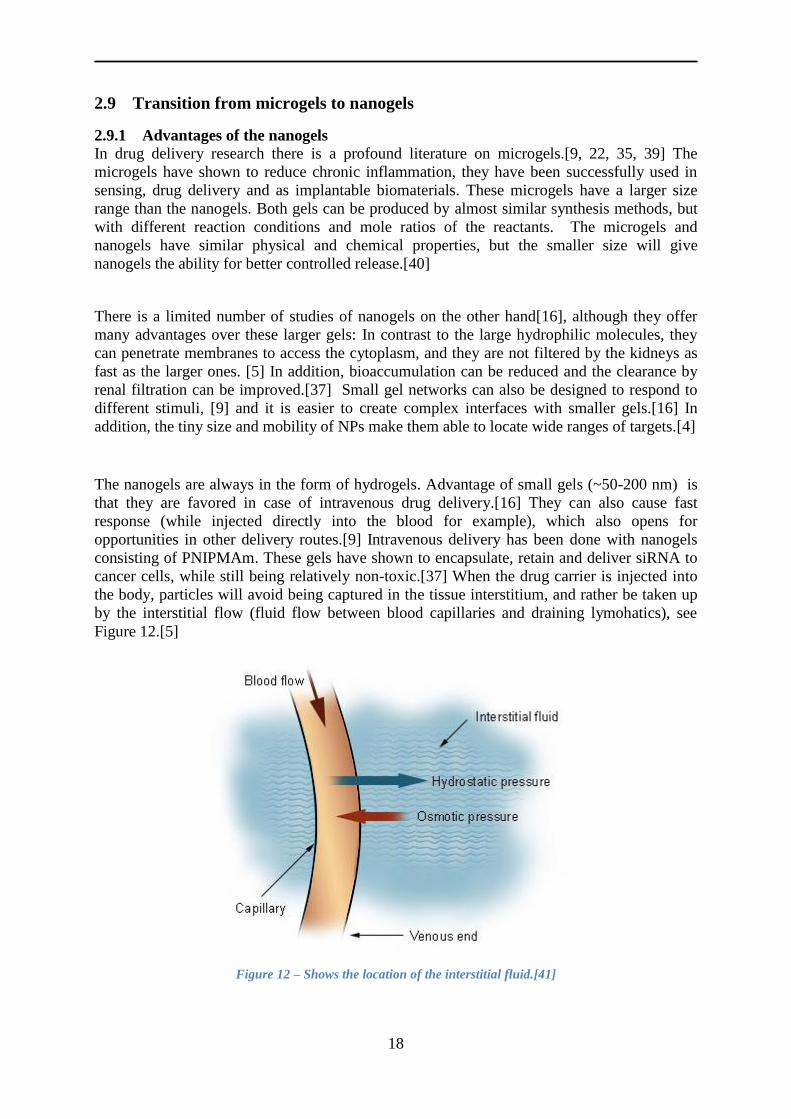
cancer cells, while still being relatively non-toxic.[37] When the drug carrier is injected into
the body, particles will avoid being captured in the tissue interstitium, and rather be taken up
by the interstitial flow (fluid flow between blood capillaries and draining lymohatics), see
Figure 12.[5]
Figure 12 – Shows the location of the interstitial fluid.[41]
19
2.9.2 Elimination of NPs
The clearance by renal filtration is the most effective NP elimination route in the body. Other
elimination methods of the NPs involve liver sequestration and subsequent reticuloendothelial
macrophage uptake and hepatobiliary excretion into the intestine. Besides elimination by
clearance, erosion is a possibility which can also modulate the release of drugs through
network decomposition. This most likely changes the colloidal properties of the gel, and it is
essential that it is monitored during degradation of the polymer.[37]
Studies with nanogels have shown that the gels can erode depending on both pH and
temperature. The nanogels showed higher degradation at higher pH and at elevated
temperatures. This tunability of the drug carriers makes them ideal towards intravenous drug
delivery. The particles also showed loss in light scattering, which means that the particles
undergo loss of mass as well as overall decrease in particle number density.[37]
2.9.3 NPs as nanogels
In the recent years, NPs in the form of nanogels have been under high focus for targeted drug
delivery applications.[16, 37] The conventional drugs used today in drug delivery have poor
water solubility, rapid clearance from circulation, low bioavailability, and inefficient cell
entry.[37] The porous polymeric nanogels consist of cross-linked polymer chains which are
formed by either self-assembly or covalent linkages. Due to the porosity of the gel, it can
contain high amounts of drug, compared to other organic carriers such as micelles or
liposomes. It has also the advantage of changing its morphology when introduced to a change
in the external environment. These qualities are highly desired in drug delivery research as it
improves the in vivo delivery.[6]
In general the NPs have shown higher intracellular uptake compared to the micro-sized
particles. Several in vitro studies have indicated that the particle size can control cellular
uptake. For instance, NPs larger than 230 nm have shown to congregate in the organ
(especially spleen) due to the capillary size of the organ. Small changes of the size of the NPs
can influence their cellular uptake and bioavailability.[4]
2.9.4 Nanospheres and - capsules
Comparing gels as nanospheres with -capsules one can describe the spheres as less
complicated. The sphere and capsule is shown in Figure 13 In addition the spheres have more
of an abrupt volume transition due to connectivity throughout the particles. Physiochemical
interactions and covalent bonds in the gels allow stimuli-controlled drug release.[9] This
release, in addition to the uptake, can also be tuned by the porosity of the polymeric network
(mesh size). The porosity can be controlled by cross-linking density and electrostatic
repulsion (increase/decrease).[16]

20
Figure 13 – Nanosphere to the left and nanocapsule to the right.[42]
2.9.5 Nanogels with surface functionalities
The advantage of nanogels is their small size compared to the conventional delivery systems
today, which contributes with in vivo solubility and stability for the drugs injected and more
drugs being able to penetrate the cellular membrane of the target. Due to the nanogels’ small
size, the surface to volume ratio is high which means that the huge surface area can provide
many opportunities when functionalized.[6] This high surface area means that the majority of
the drug will be coupled with in or near the exterior of the nanogel which will result in fast
release.[4]
This high surface area characteristic of the nanogels can make them specific to targeting. The
surface can be modified to own properties that will give the nanogel longer circulation time in
the blood with induced targeting delivery. Other surface functionalization can give the
nanogel capability of penetrating the tumor cell, gain diagnostic properties and/or help target
the desired cell.[6]
2.9.6 Uptake of the nanogels
By adding desired properties, active targeting can also be promoted for nanogels.[16] Studies
have implied that nanogel uptake is primarly driven by Ephrin type A receptor 2 binding (a
gene).[13, 43] The chemosensitization has been proven to be increased with just the nanogel,
but the total therapeutic effect was influenced by this and the loaded drug (in this case
siRNA).[13]
Nanogels offer high swelling qualities, non-fouling characteristics and have shown to be able
to retain and release macromolecules. They are capable of intravenous administration as
colloidal dispersions and they show similar properties to that of the bulk synthetic
hydrogels.[37] Studies have shown that it is possible with faster de-swelling kinetics than
macrogels, making the reaction to external stimuli more rapid with smaller gels.[16]

21
3 Materials and methods
3.1 Material
3.1.1 Reagents
Sodium dodecyl sulphate (SDS), Potassium persulphate (KPS), N, N’ –
Methylenebis(acrylamide) (BIS), N-isopropylacrylamide (NIPAm), Acrylic Acid (AAc)
(1.051 g/mL), Cytochrome C from bovine heart, Monopotassium phosphate, KH2PO4 (50
mM) and Phosphate buffer saline (PBS) have been purchased from Sigma Aldrich.
Paracetamol has been purchased from Weifa and Di-Potassium hydrogen phosphate trihydrate
(K2HPO4) (50mM) and n-Hexaan from Merck Millipore.
3.2 Characterization methods
3.2.1 DLS
3.2.1.1 The principle of DLS Light scattering can be used to analyze the structure of the hydrogel (phase-transition
behavior, mass transport through the network, colloidal stability etc.).[44] The DLS measures
the intensity of the scattered light, which is a fluctuating quantity as a result of Brownian
motions of the suspected particles.[45]
The DLS can be used to measure the size, distribution and diffusion coefficient of a polymer
solution. This can also be called a photon correlation spectroscopy, and is a time-dependent
light scattering.[46, 47] It is a quick method that characterizes the hydrodynamic size and
analyzes the response and stability of the particles.[46] The intensity of the center of the
scattering varies because of the random motion of the particles.[47] The diffusion coefficient
in a dilute dispersion (measures the interactions between particle and solution) is described in
Equation 3.1.
D =
(3.1)
Where kB is the Boltzmann constant, T is the absolute temperature of the diffusion, ƞ is the
intrinsic viscosity and RH is the hydrodynamic radius.[47]
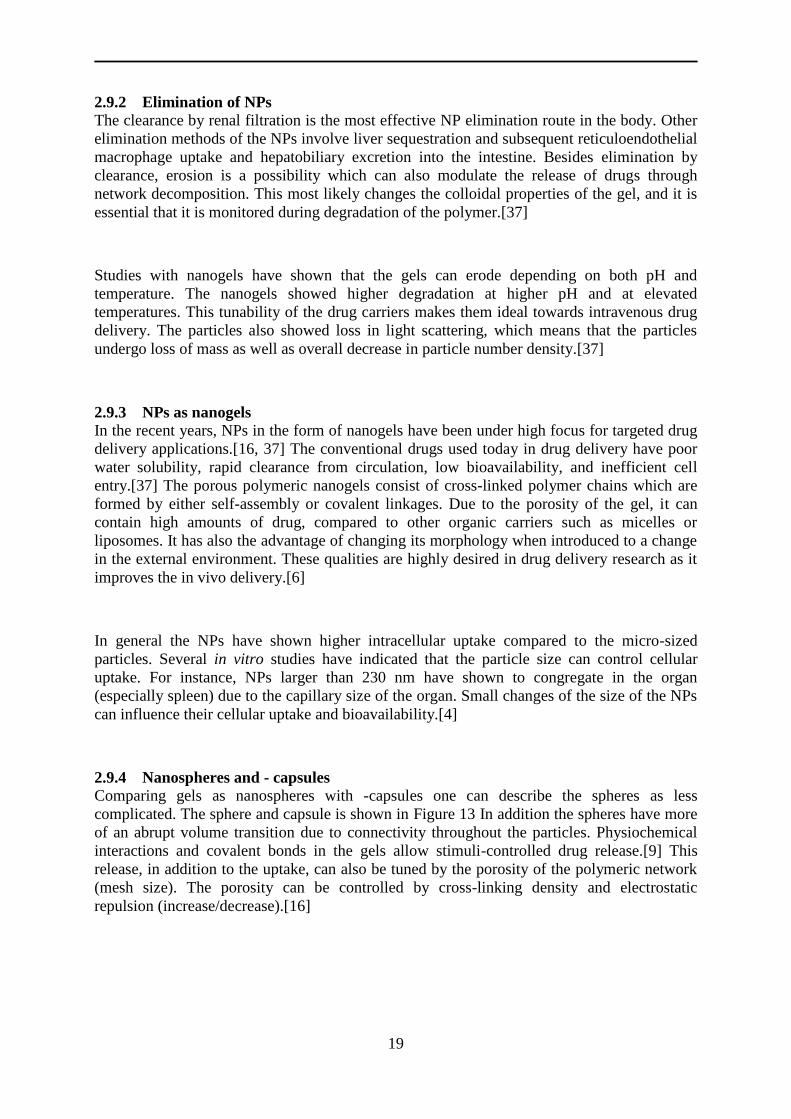
3.2.1.2 Nano Sizer An instrument used to measure DLS is the Nano Sizer. This is a particle size analyzer which
can measure the molecular weight or size of the particles. It has a range from below a
nanometer up to microns.[48, 49] The Zeta Sizer in the Nano Range (Nano Sizer) is shown in
Figure 14 a, and uses DLS to measure the size. The principle of the measurement of this
instrument is illustrated in Figure 14 b.[50] The size is calculated from the diffusion
coefficient of the particles that move by Brownian motions by Stoke-Einsteins
relationship.[51] The instrument also measures the zeta potential, 𝜉, by following the
Smoluchowski equation given in Equation 3.2.[52]
υE = 4
(1+ ) (3.2)
Where υE is the mobility of the particles in an electric field, к is the Debye-Hückel parameter,
22
and are the relative dielectric constant and the electrical permittivity of vacuum
respectively, μ is the solution viscosity and r is the particle radius.[52]
Figure 14 – a) Zeta Sizer, Nano Range ZS[50] b) Measurement of a sample in the Zeta Sizer.[53]
To determine the zeta potential, laser doppler micro-electrophoresis is used. This sets up an
electric field in the solution which triggers the molecules to move. The electrophoretic
mobility is calculated from this using a phase analysis light scattering, and from this the zeta
potential is calculated.[50]
3.2.1.3 Nano Sizer measurements
The Nano Sizer was turned on with the setting to measure both the size of the particles and
their zeta potential. The zeta potential was measured in the zeta cuvette and the size was
measured through the glass size cuvette. The synthesized solutions were diluted (100 times)
with filtrated deionized water before measuring.
3.2.2 UV-VIS
3.2.2.1 The principle of Ultraviolet–Visible Spectrophotometry The amount of drug loaded to the polymers can be calculated based on the results from the
Ultraviolet-Visible Spectrophotometry (UV-VIS). The UV-VIS measures the amount of
ultraviolet or visible radiation absorbed by a substance in solution. This instrument can give
both quantitative information with use of a calibration curve and a qualitative analysis by
calculations of the absorbed radiation.[23, 40] The UV-VIS gives possibility for rapid
analysis of small concentrations based on the Beer-Lambert’s law. This law is expressed by
Equation 3.3.[23]
A = a b c (3.3)
Where the absorbance/optical density is A, absorptivity/extinction coefficient is a, the path
length of radiation through sample (cm) is b and c is the concentration of solute in solution).
The only variable is the concentration.[23]
The principle of UV-VIS is to measure the absorbance of a solute in a transparent solution at
a suitable wavelength. This is dependent on the nature of the sample and is normally chosen
around the substance’s maximum absorption. The absorption should be adjusted to ~0.9 to
optimize the accuracy and precision of the measurement.[23] The absorbing component can
(a)
(b)

23
be calculated by using one of the three procedures; standard absorptivity value, single or
double point standardization and calibration graph. The first one is used when it is difficult to
get a sample of a reference substance. The second is a measurement with a standard solution
and a solution with the reference/standard substance. The last one is usually done before the
second procedure. It involves standard solutions with known concentrations and the
corresponding measurement of the absorbance.[23] In recent studies, a main problem with
this kind of sensing systems has been false positive results due to specific secondary binding
or non-specific adsorption of other species in solutions.[16]
3.2.2.2 Analysis The UV-VIS was switched on and a baseline was made before measuring the solutions. The
cuvettes used were made of quartz and they are shown in Figure 15.
Figure 15 – Shows the two quartz cuvettes used for UV-VIS analysis.[54]
3.3 Methods
3.3.1 Recrystallization of NIPAm
The NIPAm was recrystallized using a setup shown in Figure 16. The one- necked glass flask
was cleaned with n-hexane, before adding 50 mL of n-hexane (for 5 g of the monomer) to the
flask. Recrystallization was done at 110°C for 2 hours.
The reaction vessel was thereafter put directly in an ice bath for 20 minutes. The solution was
then filtered using a Filter Paper Circles (90 mm). When the monomer was dry the sample
was weighed and stored in the refrigerator for further use.
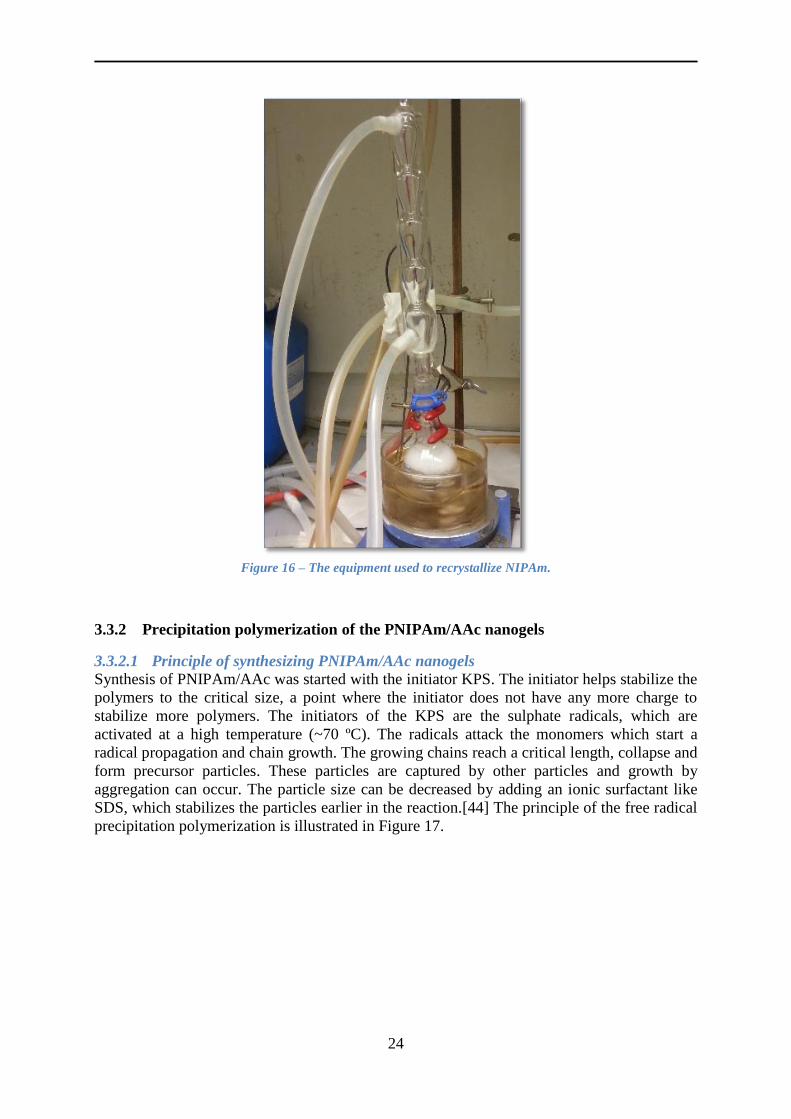
24
Figure 16 – The equipment used to recrystallize NIPAm.
3.3.2 Precipitation polymerization of the PNIPAm/AAc nanogels
3.3.2.1 Principle of synthesizing PNIPAm/AAc nanogels
Synthesis of PNIPAm/AAc was started with the initiator KPS. The initiator helps stabilize the
polymers to the critical size, a point where the initiator does not have any more charge to
stabilize more polymers. The initiators of the KPS are the sulphate radicals, which are
activated at a high temperature (~70 ºC). The radicals attack the monomers which start a
radical propagation and chain growth. The growing chains reach a critical length, collapse and
form precursor particles. These particles are captured by other particles and growth by
aggregation can occur. The particle size can be decreased by adding an ionic surfactant like
SDS, which stabilizes the particles earlier in the reaction.[44] The principle of the free radical
precipitation polymerization is illustrated in Figure 17.
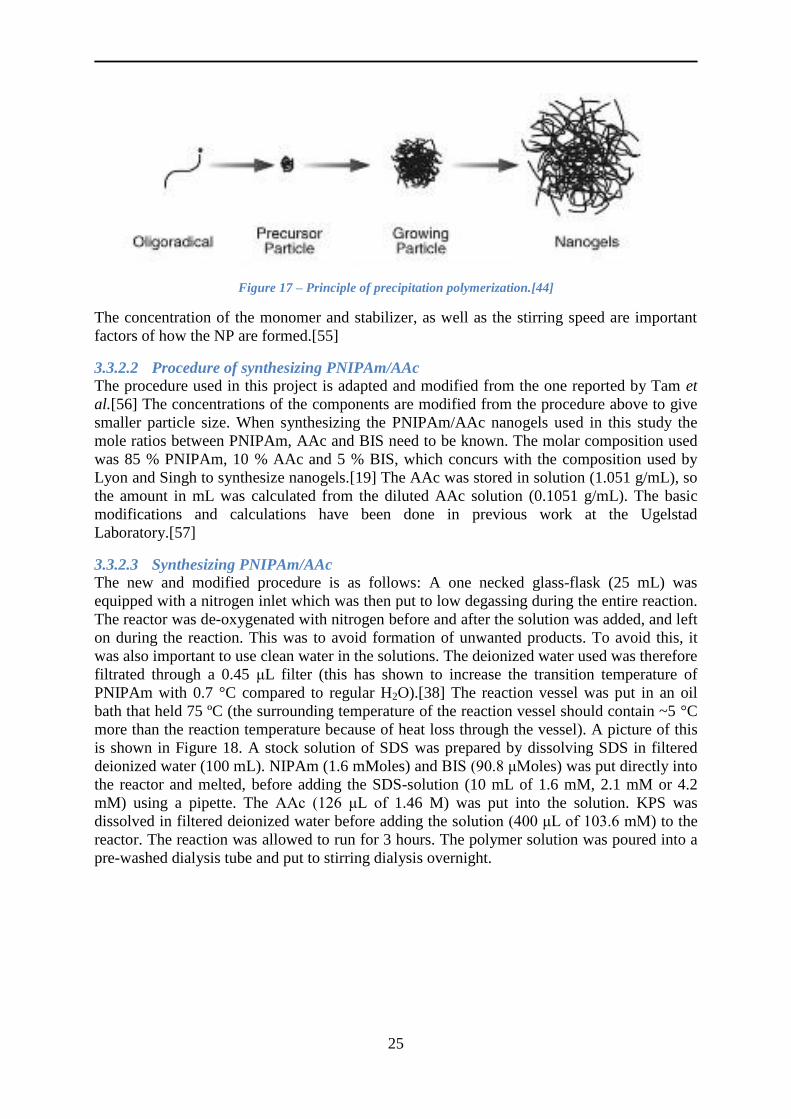
25
Figure 17 – Principle of precipitation polymerization.[44]
The concentration of the monomer and stabilizer, as well as the stirring speed are important
factors of how the NP are formed.[55]
3.3.2.2 Procedure of synthesizing PNIPAm/AAc
The procedure used in this project is adapted and modified from the one reported by Tam et
al.[56] The concentrations of the components are modified from the procedure above to give
smaller particle size. When synthesizing the PNIPAm/AAc nanogels used in this study the
mole ratios between PNIPAm, AAc and BIS need to be known. The molar composition used
was 85 % PNIPAm, 10 % AAc and 5 % BIS, which concurs with the composition used by
Lyon and Singh to synthesize nanogels.[19] The AAc was stored in solution (1.051 g/mL), so
the amount in mL was calculated from the diluted AAc solution (0.1051 g/mL). The basic
modifications and calculations have been done in previous work at the Ugelstad
Laboratory.[57]
3.3.2.3 Synthesizing PNIPAm/AAc
The new and modified procedure is as follows: A one necked glass-flask (25 mL) was
equipped with a nitrogen inlet which was then put to low degassing during the entire reaction.
The reactor was de-oxygenated with nitrogen before and after the solution was added, and left
on during the reaction. This was to avoid formation of unwanted products. To avoid this, it
was also important to use clean water in the solutions. The deionized water used was therefore
filtrated through a 0.45 μL filter (this has shown to increase the transition temperature of
PNIPAm with 0.7 °C compared to regular H2O).[38] The reaction vessel was put in an oil
bath that held 75 ºC (the surrounding temperature of the reaction vessel should contain ~5 °C
more than the reaction temperature because of heat loss through the vessel). A picture of this
is shown in Figure 18. A stock solution of SDS was prepared by dissolving SDS in filtered
deionized water (100 mL). NIPAm (1.6 mMoles) and BIS (90.8 μMoles) was put directly into
the reactor and melted, before adding the SDS-solution (10 mL of 1.6 mM, 2.1 mM or 4.2
mM) using a pipette. The AAc (126 μL of 1.46 M) was put into the solution. KPS was
dissolved in filtered deionized water before adding the solution (400 μL of 103.6 mM) to the
reactor. The reaction was allowed to run for 3 hours. The polymer solution was poured into a
pre-washed dialysis tube and put to stirring dialysis overnight.

26
Figure 18 – The setup for the synthesizing of PNIPAm/AAc.
3.3.3 Dialysis
3.3.3.1 The reason for dialysis
Dialysis is a way to clean the polymers and remove unwanted molecules/atoms.[55] Dialysis
was used in this study because it is a fast and easy method of cleaning. In dialysis the polymer
solution is placed in a dialysis tube which will get rid of all the unwanted compounds (salts,
monomer, initiator, etc.) except the polymer in the solution, due to its high molecular weight.
This is dependent on molecular weight cut-off (MWCO) of the dialysis membrane. The
polymer can then stay in the tube, and all the other compounds will diffuse out of the tube and
into the water due to the difference in chemical potential inside and outside of the tube.[55]
3.3.3.2 Procedure of dialysis
A dialysis tube (MWCO 14 000) was prepared by softening in water before adding a clip-on
to one of the ends of the tube. The dialysis tube was washed a couple of times with deionized
water before the polymer was transferred into it. The other clip-on was placed in the other
end, and the tube was then placed in a large beaker under continuous stirring. The dialysis
water was changed after 1–3 hours, and left overnight.
3.3.4 Freeze-drying
The solution polymers can be freeze-dried to form hygroscopic, low density powder.
Introduction of drug solutions to polymers in this state has shown high efficiency of loading
and encapsulation.[13]

27
3.3.4.1 Freeze-drying the solution polymers
The polymer solution (~10 mL) was put into a round flask suitable for one of the inlets to the
freeze–dryer. It was then cooled down by stirring the flask in liquid nitrogen for a couple of
minutes until the solution became solid. The flask was placed on to the freeze-dryer until the
solution was completely dry (~3 hours). The freeze-dried polymer was weighed and stored for
further used. The product obtained after freeze-drying is shown in Figure 19.
Figure 19 – Freeze-dried PNIPAm/AAc nanogels.
3.3.5 Loading
The freeze-dried polymers were introduced into a solution of paracetamol or Cytochrome C
through the breathing in mechanism. The incorporation method was also tried with
paracetamol as a loading mechanism. These loading mechanisms have been previously
described in Section 2.6.2.
3.3.5.1 Paracetamol loaded by the incorporation method
The Paracetamol (132 μmoles) was added one hour after starting the precipitation
polymerization of PNIPAm/AAc.
3.3.5.2 Breathing in of Paracetamol
The Paracetamol (10 mL of 66.2 mM) was put into a solution containing the polymer in the
solid state (final conc. 2 mg/mL) and put to shaking for 24 hours before centrifugation.
3.3.5.3 Breathing in and loading study of Cytochrome C
The Cytochrome C (10 mL of 8.11 ∙ 10-3
mM) was put into a solution containing the polymer
in the solid state (final conc. 2 mg/mL) and put to stir for 3 hours. The solutions before and
after incorporating the Cytochrome C solution to the nanogels through the breathing in
mechanism are shown in Figure 20. After the incorporation to the polymers the solution turns
from an iron-colored solution (shown to the left of the figure) to a white color with a pale
iron-color (shown to the right).

28
Figure 20 – Shows the Cytochrome C solutions without the polymers (left) and with the polymers (right).
Dialysis was used for the loading study of Cytochrome C (8.11 ∙ 10-3
mM). The drug was first
stirred for three hours after incorporation to the polymer (2 mg/mL). The solution was put into
a tube and left for 24 hours of dialysis. The solution was diluted (2 times) and the
concentration of the drug was measured at time point of 0, 1, 3, 6 and 24 hours using the UV-
VIS.
The loading – and encapsulation efficiency of Cytochrome C was calculated using Equations
3.4 and 3.5 respectively.
Loading efficiency:
(3.4)
Where is the concentration of drug/polymer solution before loading and is the conc.
after loading (the Cytochrome C left in the polymer solution).
Encapsulation efficiency:
(3.5)
Where is the concentration of the polymer in the drug solution, and the factor of 100 in the
above equation is because the loading efficiency is given in percentage.
3.3.6 Release
3.3.6.1 Release of paracetamol
The paracetamol loaded PNIPAm/AAc nanogels was placed into a flask with a stirrer and
placed on a heater at 50 °C. The solution was stirred for ~30 minutes before analyzing. The
release of paracetamol was calculated as shown in Equation 3.6.
100% - loading efficiency (3.6)
3.3.6.2 Release of Cytochrome C
The Cytochrome C loaded PNIPAm/AAc nanogels was placed into a pre-washed dialysis tube
and left in a large beaker. The beaker was equipped with a magnet and placed on a magnet
stirrer that maintained 39 °C. The solution was diluted (2 times), analyzed in the UV-VIS and
the release was measured at different time points.
29
The release of Cytochrome was calculated as shown in Equation 3.7. The amount released
was calculated relatively to the amount loaded, shown in Appendix B.
∙ 100% (3.7)

30
4 Results and Discussion
4.1 Re-crystallization of NIPAm The nanogels used to load the drugs were synthesized from the re-crystallized monomer. The
first monomer batch used had already been re-crystallized, but more was required. A
monomer batch has therefore been re-crystallized during this study. The size difference of the
synthesized nanogels (using the two different batches of the monomer) under identical
conditions are negligible (~2 % below VPTT and ~7 % over). Similar variations have also
been observed during repetitive measurements of the same solution.
4.2 Synthesis of PNIPAm The original procedure of synthesizing PNIPAm given by Tam et al. has been modified. The
mole ratio of the components has been changed; The NIPAm concentration has been slightly
increased from the original 0.130 M to 0.149 M.
The particle size of the nanogels should ideally be ~50–200 nm to avoid the elimination
routes in the body (Section 2.2.1) and due to that this size range is favored for intravenous
drug delivery.[16] Small sizes of the nanogels have many advantages, such as avoidance of
early clearance and easier modifications compared to larger networks (Section 2.9.1). This is
why the size of the nanogels was tried to be optimized.
The mole ratio of BIS has been changed from 5 to 8 % (8 % BIS, 82.3 % NIPAm and 9.7 %
AAc) when trying to optimize the size. However, the standard ratio of BIS used has been 5 %.
The BIS concentration is an important factor that determines the morphology of the
nanogels.[18] Different cross-linker concentration also contributes with different mechanical
properties, density and size of the gel network.[16] The KPS was kept approximately the
same as in the original procedure. These optimizations of the mole ratios have been taken
from previous work done at the Ugelstad Laboratory.[57] Addition of initiator made the
solution turbid. The time it took for the solution to go from colorless to turbid was dependent
on the SDS concentration. Lower concentration made the solution turbid after a shorter period
of time. The reason for this is that the mole ratio of SDS has changed. This means that there
are more ions in the solution which retard the initial growth rate of the oligo-radical.
In order to decrease the particle size the SDS concentration has been increased from 0.4 mM
to 1.6, 2.0 and 4.0 mM. In the presence of the ionic surfactant, the precipitation
polymerization has shown to create nano-sized particles as also observed by Hendrickson et
al.[16] This is due to the fact that the surfactant decreases the probability for particle
aggregation (the gel growth occurs mainly through monomer or oligomer addition). The
stabilizer at high temperature favors small particles. Manipulating the temperature has
therefore been tried in this study. An attempt to synthesize small particles has been to ramp up
the reaction temperature. An increase in temperature will compensate for the decreasing
propagation rate when the monomer is consumed and increase the reaction kinetics.[16] This
concurs with a study done by Lyon et al. where it was raised from 45 to 65 °C.[21] In the
present study, the starting reaction temperature was set to 50 °C. This lowered reaction

31
temperature reduces the oligomeric radical concentration which lowers the abundance of
collapsed nuclei. This favors the particle growth mechanism without appreciable nuclei
aggregation because it is unlikely for bimolecular termination of two radicals on different
nuclei. In addition, the concentration of the monomer is highest right after the initiation. The
lower nuclei concentration combined with the high monomer concentration gives a higher
propagation rate than initiation rate. This will give growth of nuclei with same speed in early
polymerization stages. However, the propagation rate will decrease since the monomer
concentration decreases. Due to this the temperature is thereafter raised.[21] The temperature
in this study was increased to 80 °C after an hour. This gives an increase in the decomposition
of persulphate and generates more radicals. When the temperature is increased, the monomer
concentration is low and the growth on the nuclei/precursor particle is favored over nucleation
because of decrease in monomer concentration and stronger vdw-forces between nuclei and/or
precursor radicals than the forces before the nucleation stage. The sulphate end-groups create
electrostatic repulsion and the particles are stabilized from coagulating while still capturing
oligomeric radicals and unstable nuclei, and no secondary nucleation from unstable nuclei are
expected to be formed. A similar trend has been observed by Lyon et al. in their study of
microgels.[21]
This ramping of the reaction temperature gave smaller size of the particles in this study.
However, the heater makes it difficult to get uniform reaction temperature when increasing it
since it takes time before it stabilizes at these elevated temperatures. The reaction temperature
was therefore set constant at 70 °C. This was also considered reasonable since the easiest and
most effective way of decreasing the particle size was shown to be the increase of the
surfactant concentration during synthesis.
4.3 The effect of the surfactant The decrease in particle size with increasing surfactant concentration is shown in Figure 21 as
a function of temperature to illustrate the influence of the SDS concentration.
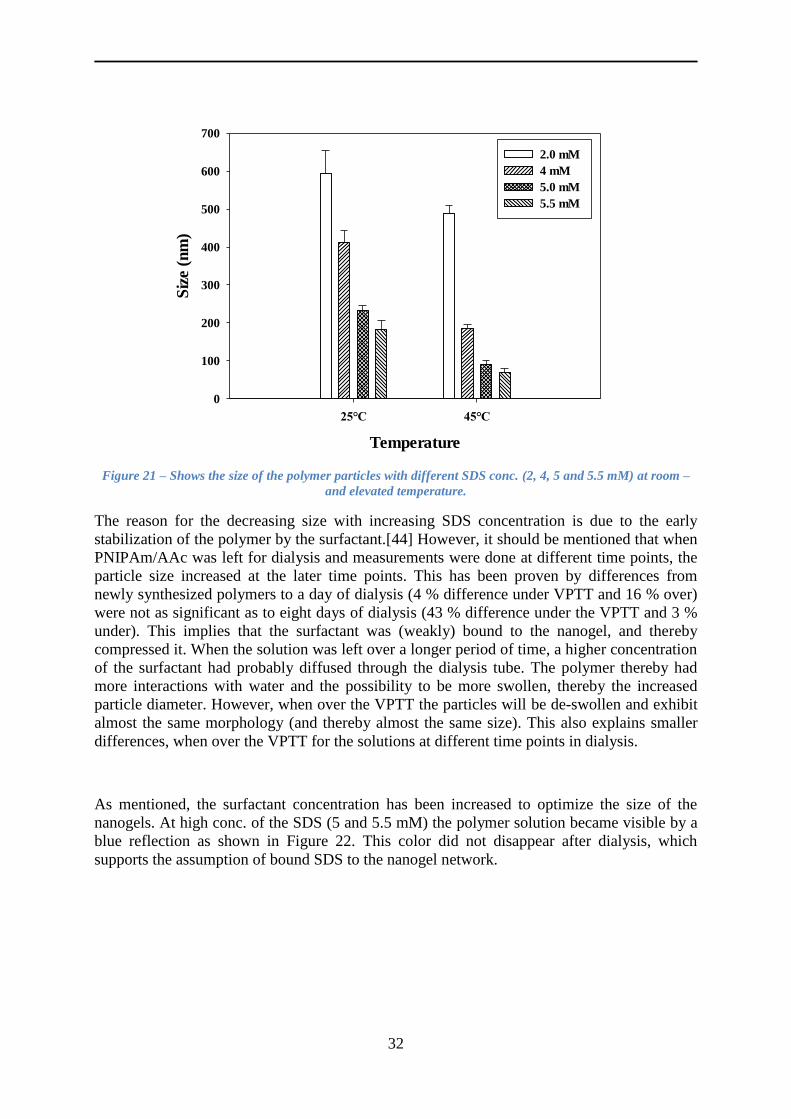
32
Temperature
25°C 45°C
Siz
e (
nm
)
0
100
200
300
400
500
600
700
2.0 mM
4 mM
5.0 mM
5.5 mM
Figure 21 – Shows the size of the polymer particles with different SDS conc. (2, 4, 5 and 5.5 mM) at room –
and elevated temperature.
The reason for the decreasing size with increasing SDS concentration is due to the early
stabilization of the polymer by the surfactant.[44] However, it should be mentioned that when
PNIPAm/AAc was left for dialysis and measurements were done at different time points, the
particle size increased at the later time points. This has been proven by differences from
newly synthesized polymers to a day of dialysis (4 % difference under VPTT and 16 % over)
were not as significant as to eight days of dialysis (43 % difference under the VPTT and 3 %
under). This implies that the surfactant was (weakly) bound to the nanogel, and thereby
compressed it. When the solution was left over a longer period of time, a higher concentration
of the surfactant had probably diffused through the dialysis tube. The polymer thereby had
more interactions with water and the possibility to be more swollen, thereby the increased
particle diameter. However, when over the VPTT the particles will be de-swollen and exhibit
almost the same morphology (and thereby almost the same size). This also explains smaller
differences, when over the VPTT for the solutions at different time points in dialysis.
As mentioned, the surfactant concentration has been increased to optimize the size of the
nanogels. At high conc. of the SDS (5 and 5.5 mM) the polymer solution became visible by a
blue reflection as shown in Figure 22. This color did not disappear after dialysis, which
supports the assumption of bound SDS to the nanogel network.

33
Figure 22 – Shows the difference in color of a solution synthesized with 1.6 mM SDS (left) and 5 mM SDS
(right).
Since it was difficult to quantify the surfactant concentration inside the dialysis tube, a
phosphate–buffer was used as an attempt to get rid of all the surfactant molecules. The buffer
was used due to the assumption that it could act as an ion exchanger: The potassium–ions can
replace the sodium ions of SDS. The principle of this is shown in Figure 23. The potassium
has higher affinity towards the de-protonated hydroxyl group of AAc due to the charge
density mapping between COO- and K
+. The charge density mapping of these ions will be
higher than for COO- and Na
+. It is much easier for the outer shell electrons of K
+ (than Na
+)
to be shared with the negative oxygen center.
Figure 23 – Sodium bound to the AAc can be replaced by potassium ions of phosphate – buffer.[58]
The phosphate–buffer was made by tuning a solution of K2HPO4 (50 mM) and KH2PO4
(50 mM) to pH 7.4. The water in the beaker was replaced by the buffer and the polymer
solution in dialysis tube was put to stir in it. After an hour of dialysis, the polymer solution
seemed to have diffused out of the tube. This confirmed the assumption that potassium can
replace the sodium of SDS. Thereby the surfactant molecules alone were able to diffuse out of
the tube, and the original water solution in the tube was replaced with the buffer. This also
explained the change of color in the tube; the solution turned from its normal turbid white
color to transparent. In addition, much less fluid was observed, which can imply that K2HPO4
and KH2PO4 replaced the larger SDS molecules. The solution in the tube was analyzed in the
DLS, and no particles were present. This implied that the nanogels probably degraded in the
absence of the surfactant.
4.4 Characterization of the nanogels
4.4.1 Stability and dilution of the nanogels
When measuring the particles using the DLS, three parallel measurements were taken. The
solutions at elevated temperatures were allowed to stabilize at the given temperature for few
minutes before measuring.
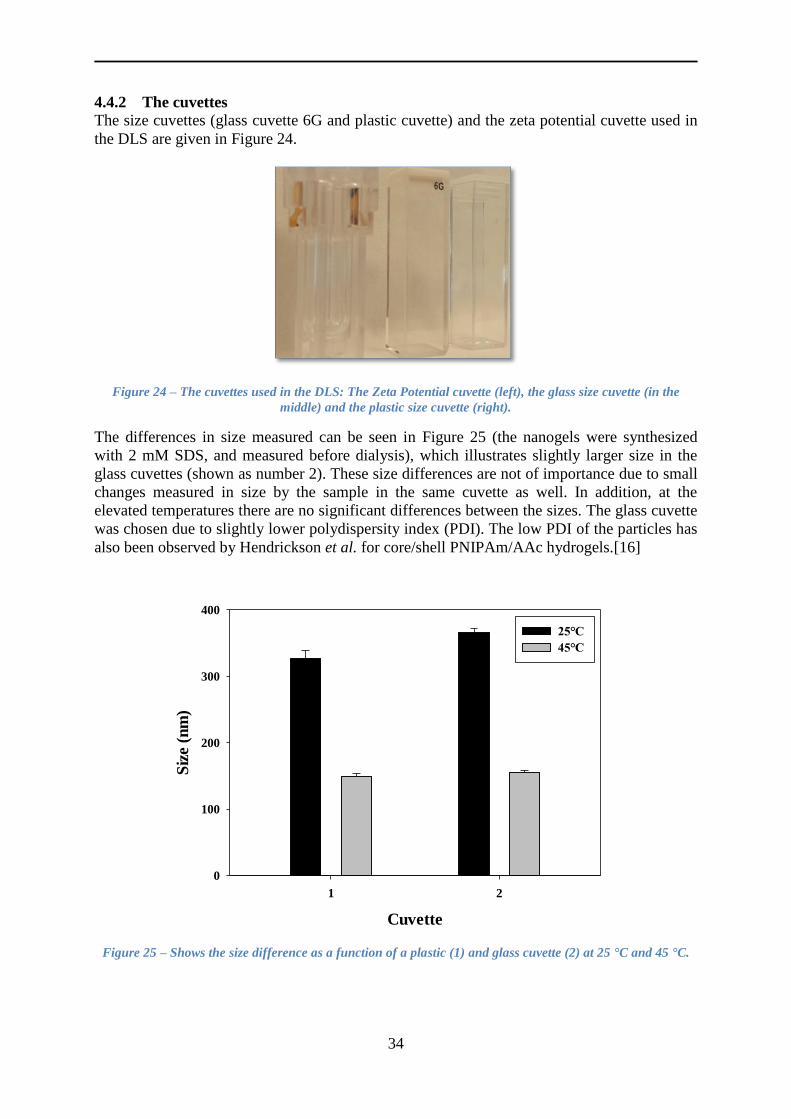
34
4.4.2 The cuvettes
The size cuvettes (glass cuvette 6G and plastic cuvette) and the zeta potential cuvette used in
the DLS are given in Figure 24.
Figure 24 – The cuvettes used in the DLS: The Zeta Potential cuvette (left), the glass size cuvette (in the
middle) and the plastic size cuvette (right).
The differences in size measured can be seen in Figure 25 (the nanogels were synthesized
with 2 mM SDS, and measured before dialysis), which illustrates slightly larger size in the
glass cuvettes (shown as number 2). These size differences are not of importance due to small
changes measured in size by the sample in the same cuvette as well. In addition, at the
elevated temperatures there are no significant differences between the sizes. The glass cuvette
was chosen due to slightly lower polydispersity index (PDI). The low PDI of the particles has
also been observed by Hendrickson et al. for core/shell PNIPAm/AAc hydrogels.[16]
Cuvette
1 2
Siz
e (
nm
)
0
100
200
300
400
25°C
45°C
Figure 25 – Shows the size difference as a function of a plastic (1) and glass cuvette (2) at 25 °C and 45 °C.

35
4.4.3 The size of the nanogels
4.4.3.1 Freeze-dried polymers
The DLS was used to establish possible size - and PDI differences from the original polymer
solution and the freezed-dried polymers (1 mg/mL). The difference between before and after
freeze-drying the solution is shown in Figure 26 (these nanogels were synthesized with 2 mM
SDS).
Polymer - conditon
1 2
Siz
e (
nm
)
0
100
200
300
400
Figure 26 – Shows the difference in size between polymers before freeze-drying (1) and after (2) at 25 °C and
45 °C.
The differences in particle size before and after freeze-drying are < 4 %, which is considered
insignificant (due to observation of these size changes also in the same solution). However,
the PDI before and after introducing the polymers into the solid state has decreased at room
temperature. This can be due to the fact that the particles swell more uniformly when
introduced to the solution in the solid state, rather than under the synthesis of the polymers.
All measurements in the DLS were continued with the freeze-dried polymers at concentration
of 1 mg/mL.
4.4.3.2 Particle size as a function of time in the solid state
Freeze-dried polymers (8 % BIS, 2 mM SDS) were kept in the solid state. However,
differences were observed when the polymers were left in this state and analyzed at two
different time points (after a day and after a week). Differences in size were observed both at
25 °C and 45 °C as shown in Figure 27. This is probably due to less stability of the polymers
in the solid state. The nanogels will be more stable in solution, and should thereby not be held
in the solid state for a longer period of time. This is also confirmed by higher PDI after a
week in the solid state.
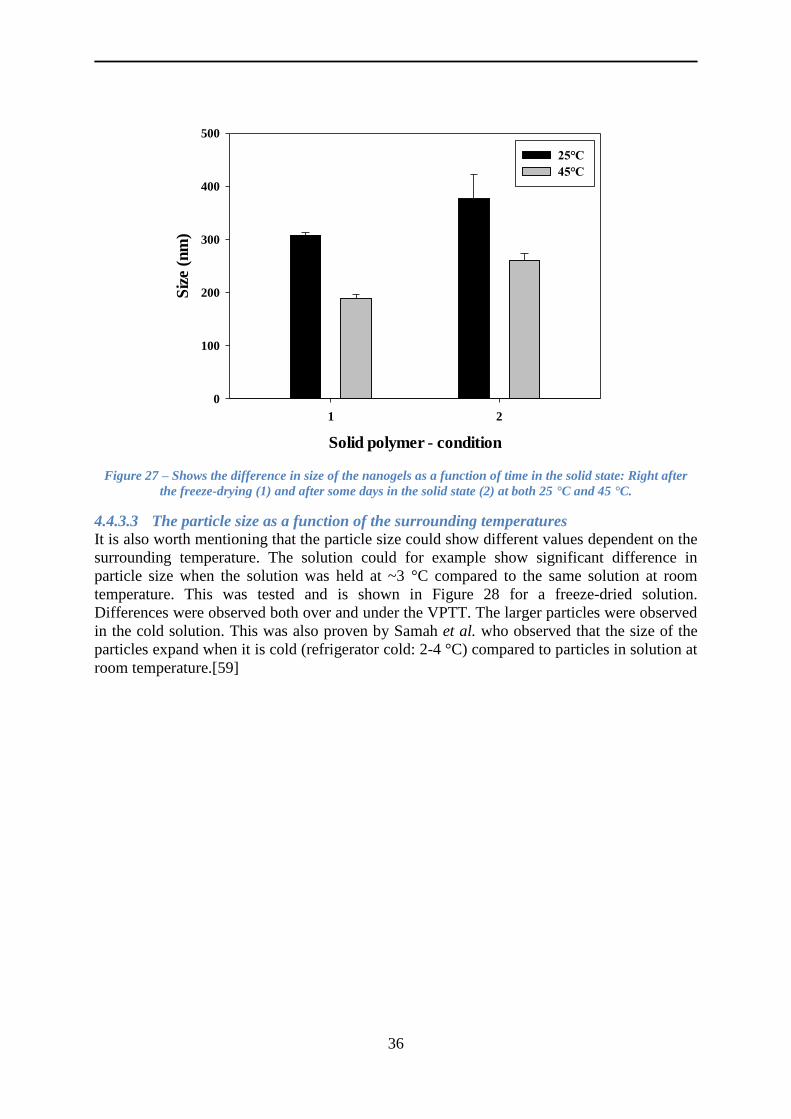
36
Solid polymer - condition
1 2
Siz
e (
nm
)
0
100
200
300
400
500
25°C
45°C
Figure 27 – Shows the difference in size of the nanogels as a function of time in the solid state: Right after
the freeze-drying (1) and after some days in the solid state (2) at both 25 °C and 45 °C.
4.4.3.3 The particle size as a function of the surrounding temperatures
It is also worth mentioning that the particle size could show different values dependent on the
surrounding temperature. The solution could for example show significant difference in
particle size when the solution was held at ~3 °C compared to the same solution at room
temperature. This was tested and is shown in Figure 28 for a freeze-dried solution.
Differences were observed both over and under the VPTT. The larger particles were observed
in the cold solution. This was also proven by Samah et al. who observed that the size of the
particles expand when it is cold (refrigerator cold: 2-4 °C) compared to particles in solution at
room temperature.[59]
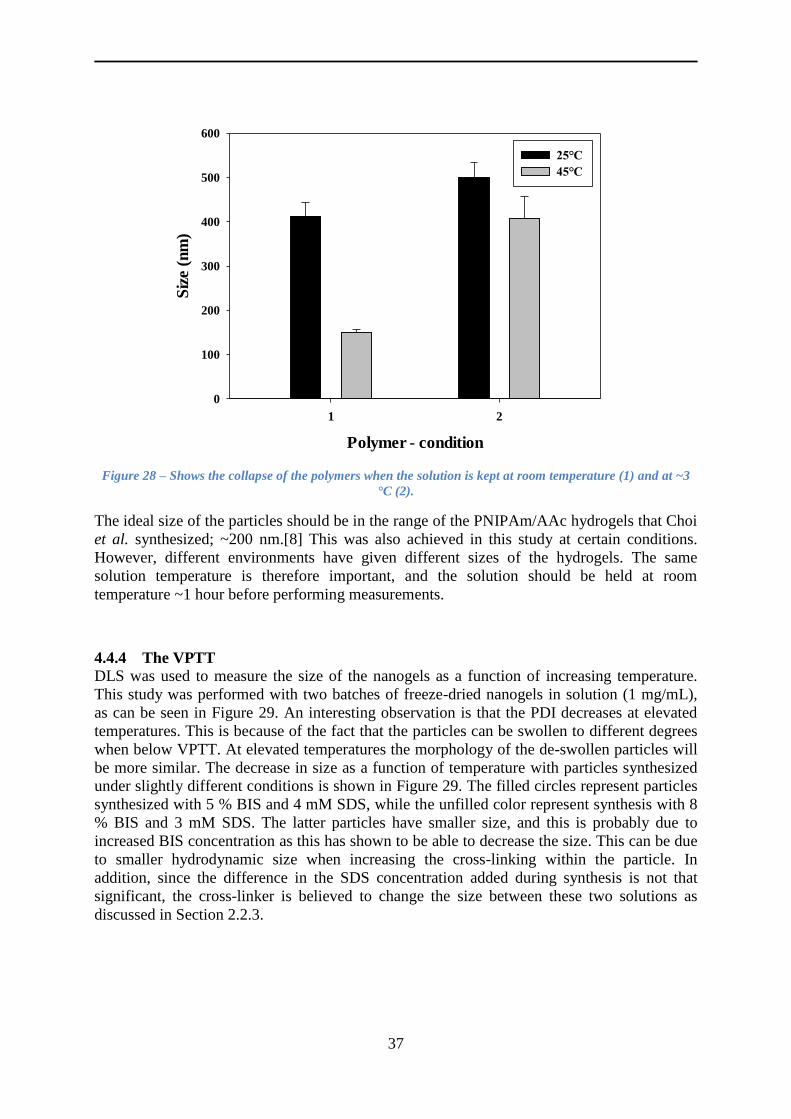
37
Polymer - condition
1 2
Siz
e (
nm
)
0
100
200
300
400
500
600
25°C
45°C
Figure 28 – Shows the collapse of the polymers when the solution is kept at room temperature (1) and at ~3
°C (2).
The ideal size of the particles should be in the range of the PNIPAm/AAc hydrogels that Choi
et al. synthesized; ~200 nm.[8] This was also achieved in this study at certain conditions.
However, different environments have given different sizes of the hydrogels. The same
solution temperature is therefore important, and the solution should be held at room
temperature ~1 hour before performing measurements.
4.4.4 The VPTT
DLS was used to measure the size of the nanogels as a function of increasing temperature.
This study was performed with two batches of freeze-dried nanogels in solution (1 mg/mL),
as can be seen in Figure 29. An interesting observation is that the PDI decreases at elevated
temperatures. This is because of the fact that the particles can be swollen to different degrees
when below VPTT. At elevated temperatures the morphology of the de-swollen particles will
be more similar. The decrease in size as a function of temperature with particles synthesized
under slightly different conditions is shown in Figure 29. The filled circles represent particles
synthesized with 5 % BIS and 4 mM SDS, while the unfilled color represent synthesis with 8
% BIS and 3 mM SDS. The latter particles have smaller size, and this is probably due to
increased BIS concentration as this has shown to be able to decrease the size. This can be due
to smaller hydrodynamic size when increasing the cross-linking within the particle. In
addition, since the difference in the SDS concentration added during synthesis is not that
significant, the cross-linker is believed to change the size between these two solutions as
discussed in Section 2.2.3.
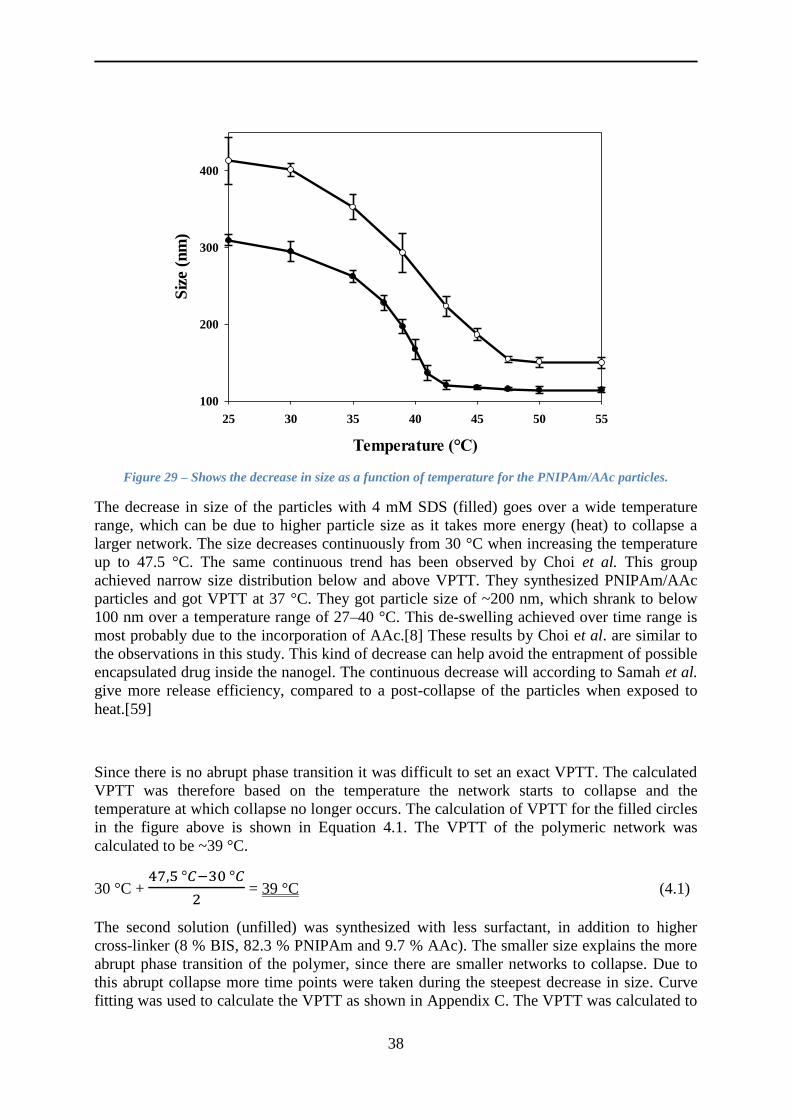
38
Temperature (°C)
25 30 35 40 45 50 55
Siz
e (
nm
)
100
200
300
400
Figure 29 – Shows the decrease in size as a function of temperature for the PNIPAm/AAc particles.
The decrease in size of the particles with 4 mM SDS (filled) goes over a wide temperature
range, which can be due to higher particle size as it takes more energy (heat) to collapse a
larger network. The size decreases continuously from 30 °C when increasing the temperature
up to 47.5 °C. The same continuous trend has been observed by Choi et al. This group
achieved narrow size distribution below and above VPTT. They synthesized PNIPAm/AAc
particles and got VPTT at 37 °C. They got particle size of ~200 nm, which shrank to below
100 nm over a temperature range of 27–40 °C. This de-swelling achieved over time range is
most probably due to the incorporation of AAc.[8] These results by Choi et al. are similar to
the observations in this study. This kind of decrease can help avoid the entrapment of possible
encapsulated drug inside the nanogel. The continuous decrease will according to Samah et al.
give more release efficiency, compared to a post-collapse of the particles when exposed to
heat.[59]
Since there is no abrupt phase transition it was difficult to set an exact VPTT. The calculated
VPTT was therefore based on the temperature the network starts to collapse and the
temperature at which collapse no longer occurs. The calculation of VPTT for the filled circles
in the figure above is shown in Equation 4.1. The VPTT of the polymeric network was
calculated to be ~39 °C.
30 °C +
= 39 °C (4.1)
The second solution (unfilled) was synthesized with less surfactant, in addition to higher
cross-linker (8 % BIS, 82.3 % PNIPAm and 9.7 % AAc). The smaller size explains the more
abrupt phase transition of the polymer, since there are smaller networks to collapse. Due to
this abrupt collapse more time points were taken during the steepest decrease in size. Curve
fitting was used to calculate the VPTT as shown in Appendix C. The VPTT was calculated to
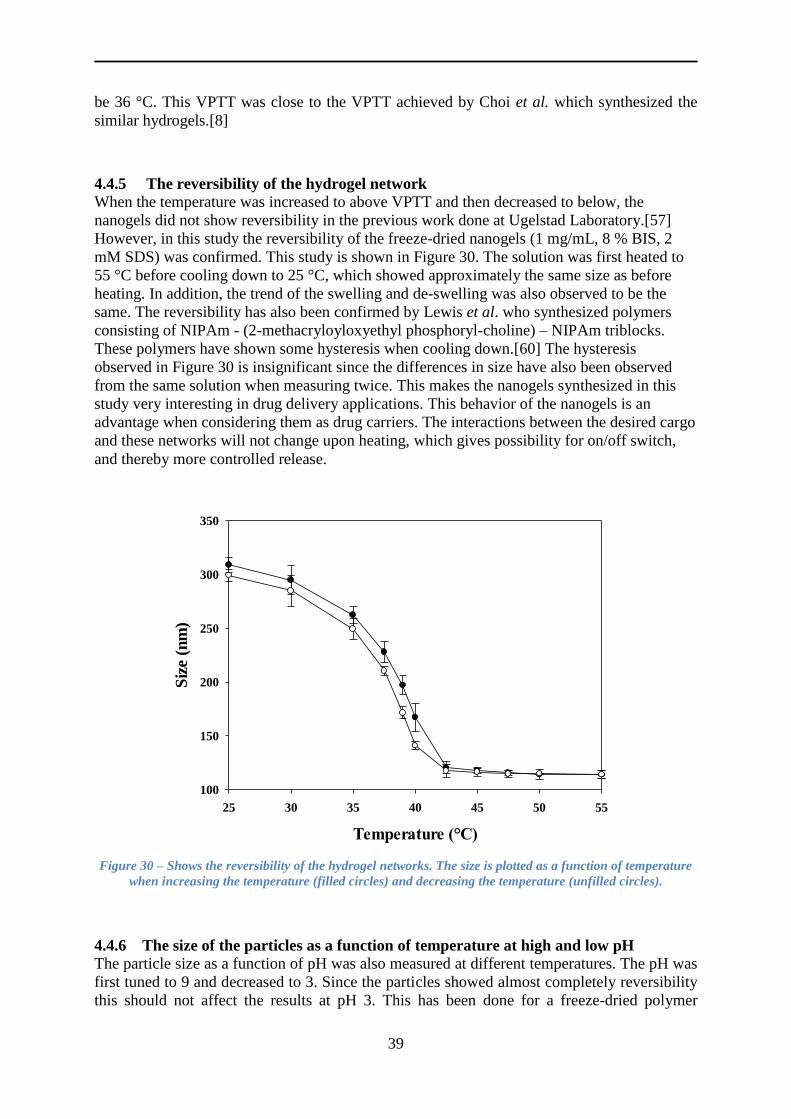
39
be 36 °C. This VPTT was close to the VPTT achieved by Choi et al. which synthesized the
similar hydrogels.[8]
4.4.5 The reversibility of the hydrogel network
When the temperature was increased to above VPTT and then decreased to below, the
nanogels did not show reversibility in the previous work done at Ugelstad Laboratory.[57]
However, in this study the reversibility of the freeze-dried nanogels (1 mg/mL, 8 % BIS, 2
mM SDS) was confirmed. This study is shown in Figure 30. The solution was first heated to
55 °C before cooling down to 25 °C, which showed approximately the same size as before
heating. In addition, the trend of the swelling and de-swelling was also observed to be the
same. The reversibility has also been confirmed by Lewis et al. who synthesized polymers
consisting of NIPAm - (2-methacryloyloxyethyl phosphoryl-choline) – NIPAm triblocks.
These polymers have shown some hysteresis when cooling down.[60] The hysteresis
observed in Figure 30 is insignificant since the differences in size have also been observed
from the same solution when measuring twice. This makes the nanogels synthesized in this
study very interesting in drug delivery applications. This behavior of the nanogels is an
advantage when considering them as drug carriers. The interactions between the desired cargo
and these networks will not change upon heating, which gives possibility for on/off switch,
and thereby more controlled release.
Temperature (°C)
25 30 35 40 45 50 55
Siz
e (
nm
)
100
150
200
250
300
350
Figure 30 – Shows the reversibility of the hydrogel networks. The size is plotted as a function of temperature
when increasing the temperature (filled circles) and decreasing the temperature (unfilled circles).
4.4.6 The size of the particles as a function of temperature at high and low pH
The particle size as a function of pH was also measured at different temperatures. The pH was
first tuned to 9 and decreased to 3. Since the particles showed almost completely reversibility
this should not affect the results at pH 3. This has been done for a freeze-dried polymer

40
solution (1.6 mM SDS) and is plotted in Figure 31. At pH 9 the size of the particles did not
show any significant differences due to the inhibited chain collapse of the particles caused by
Coulombic repulsion of the de-protonated hydroxyl groups. The strong repulsive forces of the
shell dominate and this causes decrease in the average inter-chain distance in the core as
stated by Hendrickson et al. with the study of PNIPAm/AAc core/shell hydrogels.[16] This is
the reason of the retarded collapse of the particles (Section 2.3.4).
The particle size at pH 3 increased when increasing the temperature. This can be explained by
the fact that the particles are in a hydrophobic state at low pH. When over the VPTT, the
hydrophobic interactions are strongly dominating, and attraction between the particles will
occurs causing aggregation. This assumption is also supported by observation of the increased
PDI when increasing the temperature.
pH - condition
pH 9 pH 3
Siz
e (
nm
)
0
100
200
300
400
500
600
700
25°C
50°C
Figure 31 – Shows the polymer size as function of pH 9 and pH 3 at 25°C (black) and 50°C (gray).
4.4.7 The zeta potential
4.4.7.1 Variation of the zeta potential with pH and temperature
The zeta potential for the same polymer solution at pH 3 and 9 were also measured. This
observation is interesting as the zeta potential has a direct connection with the actual gel
charge density (in addition to the degree of surface charge) and particle topology (“hairiness”)
as studied by Lyon et al.[18] The zeta potential for the different pH–values is shown in Figure
32 as a function of temperature. The solution was tuned to pH 9 with NaOH (< 0.1 M) before
adding HCl (0.1 M) tuning the solution to pH 3. The zeta potential for pH 9 is approximately
the same both before and after increasing the temperature. This concurs with the small change
in particle size due to the dominating repulsive forces which is observed by Hendrickson et
al.[16]

41
The zeta potential before and after increasing the temperature above VPTT is on the other
hand significant for the polymer solution at pH 3. The potential decreases when the
temperature is increased. At room temperature, the polymers will be protonated, favoring the
inter-molecular forces. The negative surface charge was therefore absent and approximately
neutral zeta potential was observed. When increasing the temperature the particles are
assumed to be aggregated, thereby the increased particle size and PDI.
pH - condition
pH 9 pH 3
Zeta
po
ten
tia
l (m
V)
-25
-20
-15
-10
-5
0
25°C
50°C
Figure 32 – Shows the zeta potential as a function of pH 3 and pH 9 at 25°C (filled circles) and 50°C (unfilled
circles).
The study showed that the repulsive forces are highly dominating at pH 9 and that the
particles are very hydrophobic at room temperature at pH 3. This was confirmed by both the
size of the particles and the zeta potential as shown in Figure 31 and Figure 32.
4.4.7.2 Variations of the zeta potential caused by the surfactant
The zeta potential for the polymer-solution with different SDS concentration was another
interesting observation, shown in Figure 33. The zeta potential is given as a function of the
SDS concentrations used during the synthesis of PNIPAm/AAc with very low concentration
of the surfactant (0.4 mM) (concentration used by Tam et al.) [56], and two different
concentrations used in the study (2 mM and 4 mM) at 25 °C, and 50 °C. The decreasing zeta
potential as a function of increasing SDS concentration confirms that the surfactant has not
been completely removed during the dialysis. The surfactant will contribute towards the
negative surface charge and thus towards lower zeta potential when increasing the
concentration of the surfactant. The three samples have an increased zeta potential when
increasing the temperature (~16 %). This is due to the hydrophobic interactions when the
particles have collapsed as described in Section 2.3.2. The surface charge density has
increased as stated by Choi et al.[8], but particles will make inter-molecular interactions and
probably entrap the surfactant inside the polymeric network. This will contribute to more H+-
ions in the solution.

42
SDS conc. (mM)
0 1 2 3 4 5
Zeta
po
ten
tia
l (m
V)
-42
-40
-38
-36
-34
-32
-30
-28
-26
25°C
50°C
Figure 33 – The zeta potential as a function of different SDS conc. (1.6, 2.0. and 4.0 mM (3)) at 25°C (filled
circles) and 50°C (unfilled circles).
The increased zeta potential as a function of the SDS conc. and temperature should be noted
since this can influence interactions that the nanogels make. However, the heating effect on
the zeta potential was lowered after the particles were freeze-dried. In addition, the potential
increased as can be seen in Figure 34. The zeta potential is given as a function of the nanogels
before freeze-drying and the nanogels freeze-dried in solution (1 mg/mL) at 25 °C and 50 °C.
Both solutions were synthesized under the same reaction conditions with SDS concentration
of 4 mM. However, since the zeta potential decreases after the freeze-drying this can indicate
that the SDS molecules is removed during the freeze-drying (which concurs to the previous
assumption that the zeta potential is affected by the surfactant). This assumption also explains
why the zeta potential is approximately the same (~7 % change) before and after increasing
the temperature. However, the freeze-drying did not show any significant effect on the size of
the nanogels. This is most likely due to different concentration in the solutions before and
after freeze-drying because the polymer swells better in more dilute solutions.

43
Polymer - condition
Before freeze-drying After freeze-drying
Zeta
po
ten
tia
l (m
V)
-42
-40
-38
-36
-34
-32
-30
-28
-26
25°C
50°C
Figure 34 – Shows the zeta potential as a function of hydrogel before freeze-drying and the freeze-dried
polymer in solution (1 mg/mL) at 25 °C (filled circles) and 50 °C (unfilled circles).
Due to the observation that the zeta potential of the freeze-dried polymers did not vary that
much over and under the VPTT, the pH was measured for freeze-dried polymers in solution
with different SDS concentration. The pH variations in Figure 35 are considered insignificant
as the change is ~10 %. This observation implies that the AAc is more exposed after removal
of SDS, which is also supported by the observation of pH 4.9 in the polymer solution before
freeze-drying. The freeze-dried polymer’s interactions are therefore not to be influenced by
the surfactant.

44
SDS concentration (mM)
1,5 2,0 2,5 3,0 3,5 4,0 4,5
pH
3,6
3,7
3,8
3,9
4,0
4,1
4,2
Figure 35 – Shows the pH as a function of the SDS conc. of 1.6, 2.0 and 4.0 mM SDS.
4.5 Loading and release studies
4.5.1 Scattering polymers
The nanogels have also been analyzed in the UV-VIS to establish any scattering. This
analysis revealed a possible disturbance from the nanogels. A peak at ~209 nm is observed in
Figure 36. This shoulder decreased with decreasing concentration of the polymer, until it
vanished. However this peak is not observed at concentrations at which the paracetamol is
measured.
Figure 36 – Shows scattering of the polymer (in polymer solution with concentration of 1 mg/mL.
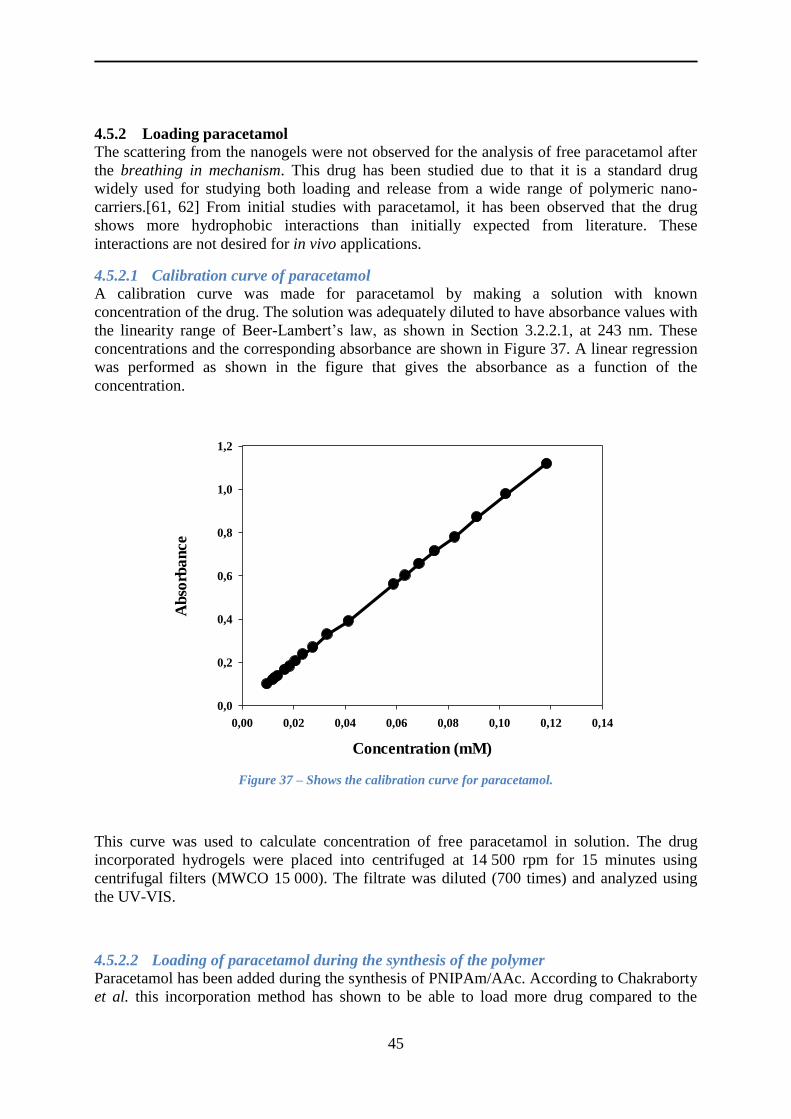
45
4.5.2 Loading paracetamol
The scattering from the nanogels were not observed for the analysis of free paracetamol after
the breathing in mechanism. This drug has been studied due to that it is a standard drug
widely used for studying both loading and release from a wide range of polymeric nano-
carriers.[61, 62] From initial studies with paracetamol, it has been observed that the drug
shows more hydrophobic interactions than initially expected from literature. These
interactions are not desired for in vivo applications.
4.5.2.1 Calibration curve of paracetamol
A calibration curve was made for paracetamol by making a solution with known
concentration of the drug. The solution was adequately diluted to have absorbance values with
the linearity range of Beer-Lambert’s law, as shown in Section 3.2.2.1, at 243 nm. These
concentrations and the corresponding absorbance are shown in Figure 37. A linear regression
was performed as shown in the figure that gives the absorbance as a function of the
concentration.
Concentration (mM)
0,00 0,02 0,04 0,06 0,08 0,10 0,12 0,14
Ab
sorb
an
ce
0,0
0,2
0,4
0,6
0,8
1,0
1,2
Figure 37 – Shows the calibration curve for paracetamol.
This curve was used to calculate concentration of free paracetamol in solution. The drug
incorporated hydrogels were placed into centrifuged at 14 500 rpm for 15 minutes using
centrifugal filters (MWCO 15 000). The filtrate was diluted (700 times) and analyzed using
the UV-VIS.
4.5.2.2 Loading of paracetamol during the synthesis of the polymer
Paracetamol has been added during the synthesis of PNIPAm/AAc. According to Chakraborty
et al. this incorporation method has shown to be able to load more drug compared to the
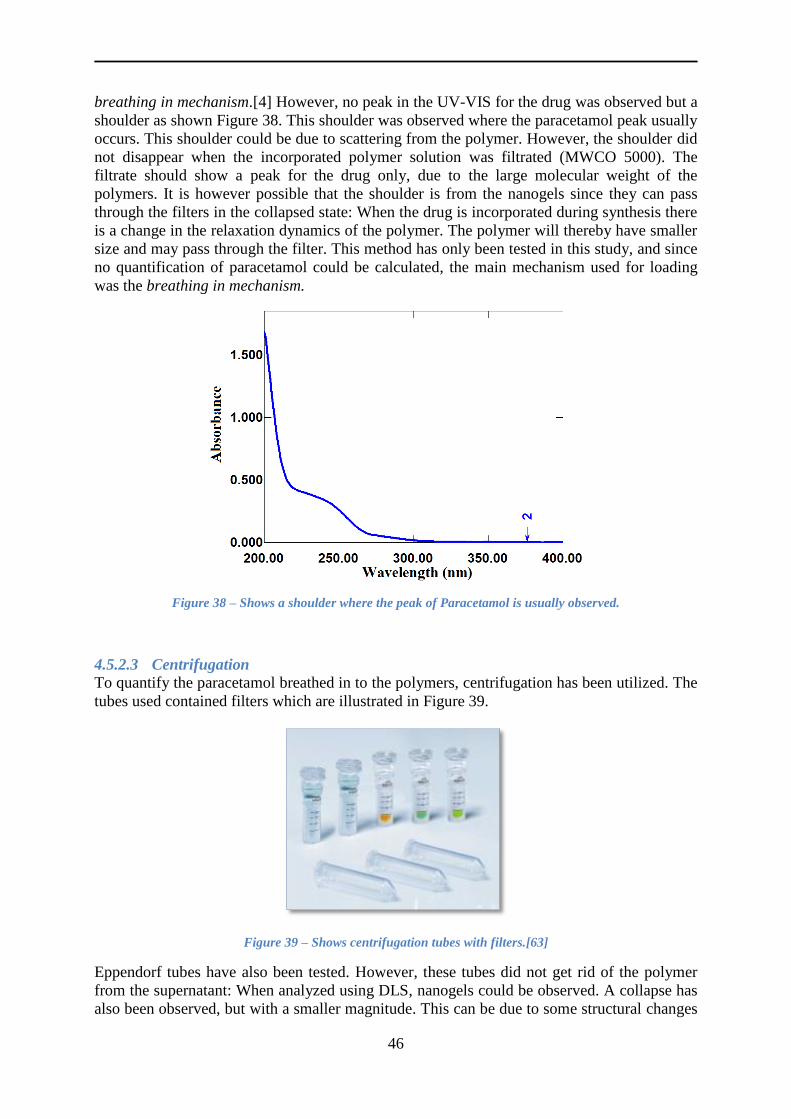
46
breathing in mechanism.[4] However, no peak in the UV-VIS for the drug was observed but a
shoulder as shown Figure 38. This shoulder was observed where the paracetamol peak usually
occurs. This shoulder could be due to scattering from the polymer. However, the shoulder did
not disappear when the incorporated polymer solution was filtrated (MWCO 5000). The
filtrate should show a peak for the drug only, due to the large molecular weight of the
polymers. It is however possible that the shoulder is from the nanogels since they can pass
through the filters in the collapsed state: When the drug is incorporated during synthesis there
is a change in the relaxation dynamics of the polymer. The polymer will thereby have smaller
size and may pass through the filter. This method has only been tested in this study, and since
no quantification of paracetamol could be calculated, the main mechanism used for loading
was the breathing in mechanism.
Figure 38 – Shows a shoulder where the peak of Paracetamol is usually observed.
4.5.2.3 Centrifugation
To quantify the paracetamol breathed in to the polymers, centrifugation has been utilized. The
tubes used contained filters which are illustrated in Figure 39.
Figure 39 – Shows centrifugation tubes with filters.[63]
Eppendorf tubes have also been tested. However, these tubes did not get rid of the polymer
from the supernatant: When analyzed using DLS, nanogels could be observed. A collapse has
also been observed, but with a smaller magnitude. This can be due to some structural changes

47
of the polymers when centrifuging. This excluded the centrifugation tubes without the filters
for analysis of incorporated paracetamol.
The filters in the centrifugation tubes were changed to filters with known MWCO (from 5000
to 3000 Da). This was because paracetamol is a small molecule with molecular weight of
151,163 g/mol, and it was assumed that the filters would allow free passage of paracetamol
into the filtrate solution, while the polymers would be captured by the filters. A possible error
that could occur was drug entrapped in the filters, blocked by the polymers. This could be a
possibility since the nanogels get stuck in the filter, and the drug has to pass through these
networks. It is therefore possible that the nanogels bind the drug when it is forced down to the
filters during the centrifugation. This has been tested and the paracetamol concentration was
approximately the same before and after centrifugation, which excluded this assumption as a
possible error. This observation was compared with the filtrated drug and the drug in the
polymer solution. The drug concentration had the same concentration before and after
introducing the drug solution to the polymers. The disturbance from the polymers was not
observed, which implied that the drug molecules “hid” the less polymer molecules. This
assumption is difficult to confirm with the UV-VIS. However, this is of no importance for this
study as the paracetamol was quantified. The importance of this observation was that after
loading the filtrate showed less drug conc. than in the drug/polymer solution, which implied
that there had been loading.
Most of the studies of paracetamol have been used with MWCO 5000, while the filters with
MWCO 3000 were used for pH-study of paracetamol. Due to the smaller pores, the time of
centrifugation had to be increased to 40 minutes. This has not showed to have an influence on
the concentration of drug when measuring the concentration before and after centrifugation.
These observations have been done before and after loading, and thereby the breathing in
mechanism has been chosen as the loading mechanism used for the loading studies.
4.5.2.4 Loading with the breathing in mechanism
After the filtration, the paracetamol in the filtrate has been analyzed in the UV-VIS and the
concentration has been calculated using the calibration curve shown in Figure 37. Parallel
loading batches were analyzed, and loading of paracetamol (66.2 mM) has been observed as
shown in Figure 40. However, it should be mentioned that the loading has not been stable, as
some of the parallels showed no loading. This could be explained by the assumption of a
more hydrophobic drug. If the drug reaches interactions with hydrophobic sites when the
polymer is swollen there may be loading. This loading will be random and may not always
occur. This assumption is supported by the higher and more stable loading at elevated
temperature as shown in the figure below. This was proven for these parallels, in addition to
the parallels that showed no loading.
Both parallels given in Figure 40 were heated at 45 °C (~1 hour). However, two different
dilution factors were used when heating the solution: 5 (for the solution with 0.4 mg/mL
polymer) and 10 (for the solution with 2 mg/mL polymer). This implies the loading is not as
efficient in diluted solutions. This is in agreement with the fact that a concentrated solution is
needed in when utilizing the breathing in mechanism, which is a highly effective loading
method.[13] It is therefore not possible to compare these solutions. It is however interesting to
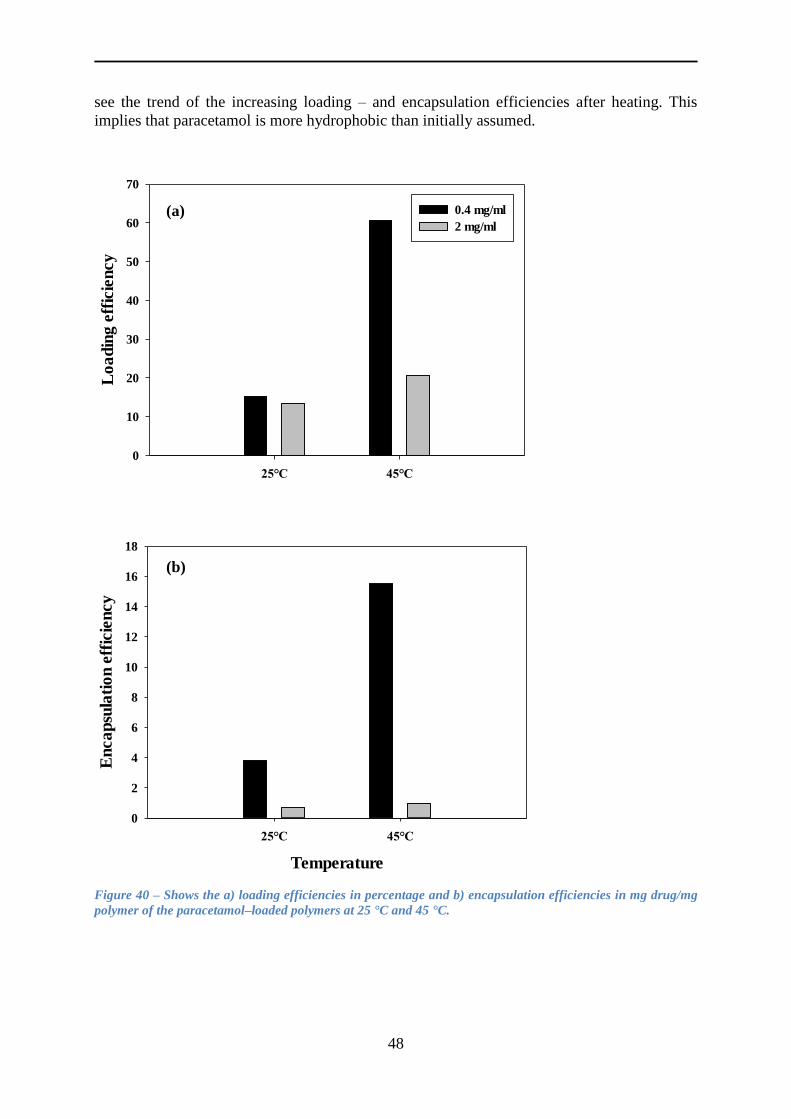
48
see the trend of the increasing loading – and encapsulation efficiencies after heating. This
implies that paracetamol is more hydrophobic than initially assumed.
25°C 45°C
Lo
ad
ing
eff
icie
ncy
0
10
20
30
40
50
60
70
0.4 mg/ml
2 mg/ml
Temperature
25°C 45°C
En
ca
psu
lati
on
eff
icie
ncy
0
2
4
6
8
10
12
14
16
18
Figure 40 – Shows the a) loading efficiencies in percentage and b) encapsulation efficiencies in mg drug/mg
polymer of the paracetamol–loaded polymers at 25 °C and 45 °C.
(b)
)
(a)

49
4.5.2.5 Optimizing the paracetamol – and polymer concentration
The efficiencies of loading have been tried to optimize with the polymer - and drug
concentration as shown in Figure 41.
0 2 4 6 8 10 12
Lo
ad
ing
eff
icie
ncy
10
20
30
40
50
60
Different drug conc.
Different polymer conc.
Conc. (mg/ml)
0 2 4 6 8 10 12
En
ca
psu
lati
on
eff
icie
ncy
0
1
2
3
4
5
Figure 41 – Shows the (a) loading efficiencies in percentage and (b) encapsulation efficiencies in mg drug/mg
polymer as a function of the concentration of drug (filled circles) or polymer (unfilled circles).
The encapsulation – and loading efficiencies were calculated with Equation 3.1 and 3.2 in
Section 2.6.2 and an example of these calculations is given in Appendix B.
(a)
(b)
)

50
Three drug concentrations have been tested: 16.5, 33.1 and 66.2 mM at constant polymer
conc. (0.4 mg/mL). The loading efficiency was slightly higher for 33.1 mM drug, but since
the encapsulation efficiency was significantly higher for the highest drug concentration this
has further been used.
The polymer concentrations tested were 0.4, 0.8, 1.6 and 2 mg/mL with constant paracetamol
conc. (33.1 mM). The lowest polymer concentration has shown significantly higher
encapsulation efficiency, while the highest polymer concentration has shown significantly
higher loading efficiency. Both concentrations have been used in the initial paracetamol
studies. However, the highest polymer concentration has been chosen in further studies due to
the need of high enough polymer concentration if multiple drugs are desired in the network.
More available sites will be required in these studies, which is relevant for studies of targeted
drug delivery systems.
The loading – and encapsulation efficiencies achieved show the trend of loading, it is
however important to note that the parallels did not show the same efficiencies as pointed out
in Section 4.5.2.4. The assumption of randomly hydrophobic interactions with paracetamol
and polymer also concur with the observation of lower loading – and encapsulation
efficiencies when repeating a loading experiment. This can be seen by comparing the two
parallels shown in Section 4.5.2.5 and the figure above (66.2 mM drug and 0.4 mg/mL
polymer).
The aim of these observations has been to optimize the concentrations, which has made the
quantification of the loaded drug less important. The interesting observation has been the
concentrations that have given the highest efficiencies, which has been used in the further
studies described below.
4.5.2.6 Loading at elevated temperature
The optimized polymer (2 mg/mL) and drug (66.2 mM) concentrations have been used when
trying to load at elevated temperature. This loading study has been performed due to the
observation of higher and more stable loading when over the VPTT. The drug was introduced
to the polymers at 50 ºC and shaken for 24 hours at 37 ºC. Two loading methods were used:
Introduction of the solid drug to the polymer and the solid polymer introduced to the drug
solution. Both methods seemed to load the polymer. An encapsulation efficiency of 2.7 mg
drug/mg polymer and a loading efficiency of 53-54 % were achieved with both methods.
These efficiencies are given in Figure 42. The loading efficiency had a lower value compared
to the efficiency achieved by Lyon and Smith (93 %). They used the breathing in mechanism
to entrap siRNA to Poly(N-isopropylmethacrylamide) nanogels. The encapsulation efficiency
was on the other hand significantly larger compared to the same study (16 μg siRNA/mg
polymer).[13] This could be due to different polymer or/and drug used, or the duration of the
loading.
The loading – and encapsulation efficiencies have been confirmed to increase at elevated
temperatures, which support the assumption of hydrophobic interactions between paracetamol
and the polymer.
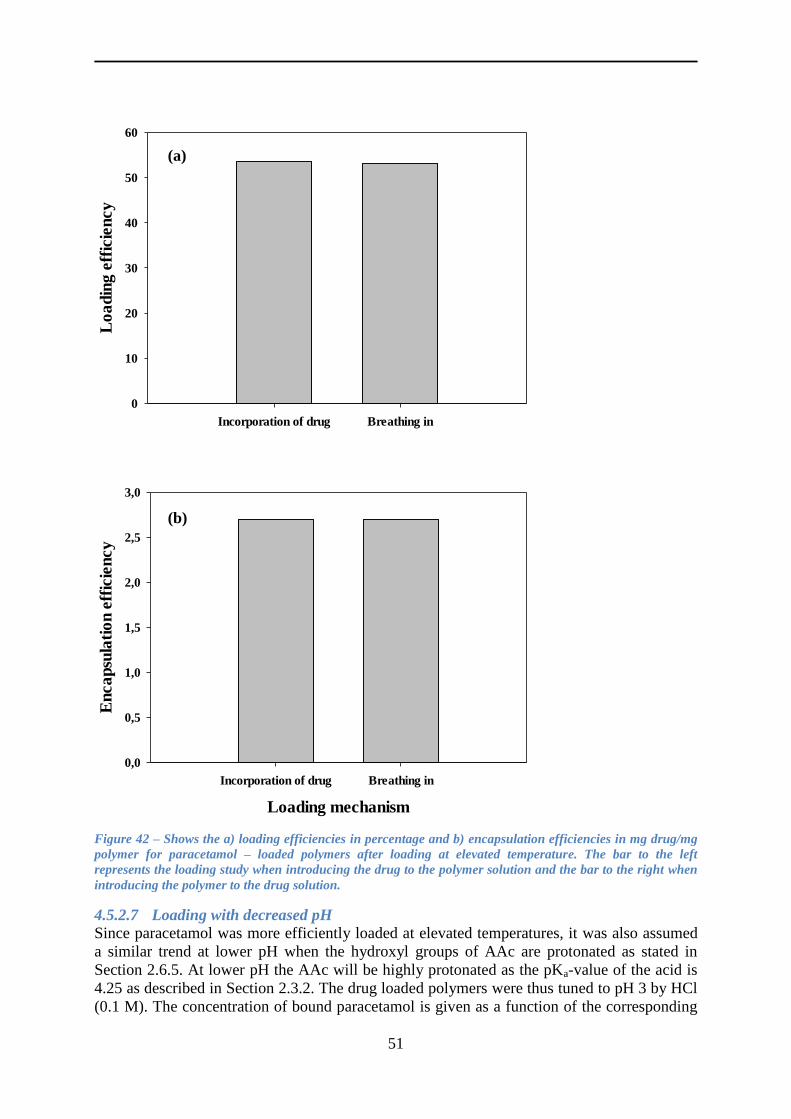
51
Incorporation of drug Breathing in
Lo
ad
ing
eff
icie
ncy
0
10
20
30
40
50
60
Loading mechanism
Incorporation of drug Breathing in
En
ca
psu
lati
on
eff
icie
ncy
0,0
0,5
1,0
1,5
2,0
2,5
3,0
Figure 42 – Shows the a) loading efficiencies in percentage and b) encapsulation efficiencies in mg drug/mg
polymer for paracetamol – loaded polymers after loading at elevated temperature. The bar to the left
represents the loading study when introducing the drug to the polymer solution and the bar to the right when
introducing the polymer to the drug solution.
4.5.2.7 Loading with decreased pH
Since paracetamol was more efficiently loaded at elevated temperatures, it was also assumed
a similar trend at lower pH when the hydroxyl groups of AAc are protonated as stated in
Section 2.6.5. At lower pH the AAc will be highly protonated as the pKa-value of the acid is
4.25 as described in Section 2.3.2. The drug loaded polymers were thus tuned to pH 3 by HCl
(0.1 M). The concentration of bound paracetamol is given as a function of the corresponding
(a)
(b)
52
conditions in Figure 43. The condition represents the pH and how long the solution has been
stirring at the given pH.
The measurement at pH 4.61 (normal pH of the polymer/paracetamol solution as both
polymer and drug influence the pH) the breathing in mechanism has been used (with 66.2
mM paracetamol and 2 mg/mL polymer). As can be seen from the figure; after introducing
the drug to the polymers by shaking the solution a couple of minutes some loading has been
observed at normal conditions. This could imply that loading of 24 hours is not necessary to
load the polymers, but this needs to be further investigated. However, more loading has been
observed when decreasing the pH. After 30 minutes of stirring the solution at pH 3 has shown
a loading efficiency of almost 60 % and an encapsulation efficiency of 14.1 mg drug/mg
polymer. These efficiencies cannot be completely compared with the efficiencies achieved
when raising the temperature to 45 °C in water due to the dilution factor used. The
efficiencies achieved when loading at higher temperature are on the other hand comparable,
but the encapsulation efficiency achieved by decreased pH is significantly higher. It should be
noted that the nanogels did not completely collapse at the loading at elevated temperatures,
and higher loading may be achieved by increasing the temperature further (for example to 45
°C).
These loading studies suggest that hydrophobic interactions exist between the drug and
polymer. These observations made it very interesting to study the nature of the release from
the network.

53
pH 4.61 (0h) pH 3 (0h) pH 3 (1/2h)
Lo
ad
ing
eff
icie
ncy
25
30
35
40
45
50
55
60
65
Condition
pH 4.61 (0h) pH 3 (0h) pH 3 (1/2h)
En
ca
psu
lati
on
eff
icie
ncy
7
8
9
10
11
12
13
14
15
Figure 43 – Shows the a) loading efficiencies in percentage and b) encapsulation efficiencies in mg drug/mg
polymer of the paracetamol–loaded polymers. These efficiencies are given as a function of pH 4.61 (the
filtrate before adjusting pH), pH = 3 (right after adjusting the pH and pH 3 after 30 minutes of stirring the
solution at pH 3.
(a)
(b)
(a)
(b)
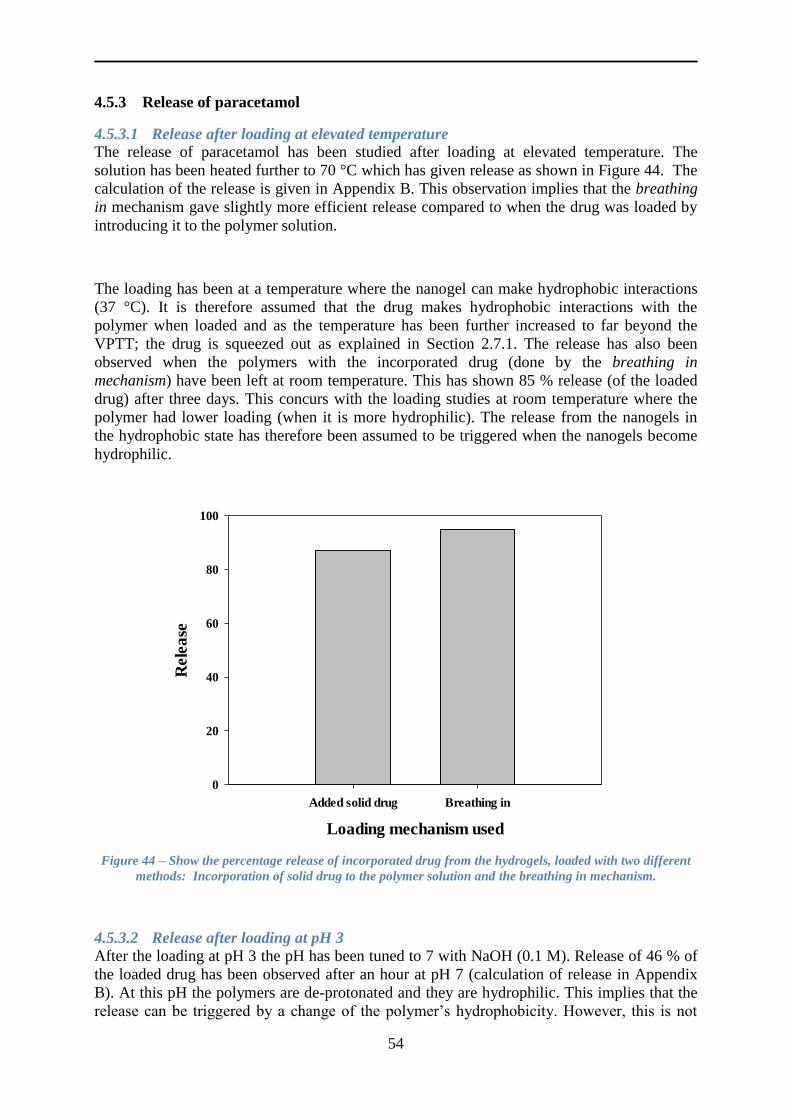
54
4.5.3 Release of paracetamol
4.5.3.1 Release after loading at elevated temperature
The release of paracetamol has been studied after loading at elevated temperature. The
solution has been heated further to 70 °C which has given release as shown in Figure 44. The
calculation of the release is given in Appendix B. This observation implies that the breathing
in mechanism gave slightly more efficient release compared to when the drug was loaded by
introducing it to the polymer solution.
The loading has been at a temperature where the nanogel can make hydrophobic interactions
(37 °C). It is therefore assumed that the drug makes hydrophobic interactions with the
polymer when loaded and as the temperature has been further increased to far beyond the
VPTT; the drug is squeezed out as explained in Section 2.7.1. The release has also been
observed when the polymers with the incorporated drug (done by the breathing in
mechanism) have been left at room temperature. This has shown 85 % release (of the loaded
drug) after three days. This concurs with the loading studies at room temperature where the
polymer had lower loading (when it is more hydrophilic). The release from the nanogels in
the hydrophobic state has therefore been assumed to be triggered when the nanogels become
hydrophilic.
Loading mechanism used
Added solid drug Breathing in
Rele
ase
0
20
40
60
80
100
Figure 44 – Show the percentage release of incorporated drug from the hydrogels, loaded with two different
methods: Incorporation of solid drug to the polymer solution and the breathing in mechanism.
4.5.3.2 Release after loading at pH 3
After the loading at pH 3 the pH has been tuned to 7 with NaOH (0.1 M). Release of 46 % of
the loaded drug has been observed after an hour at pH 7 (calculation of release in Appendix
B). At this pH the polymers are de-protonated and they are hydrophilic. This implies that the
release can be triggered by a change of the polymer’s hydrophobicity. However, this is not

55
desired when introducing the drug incorporated nanogel to the body; the drug will be released
already in the blood stream and the targeting will not be specific.
The release of paracetamol has been confirmed when the nanogels are hydrophilic. Random
loading has been confirmed at the same state in the loading studies (due to random
interactions), and more efficient and stable loading have been observed when the nanogels
enter the hydrophobic state. The drugs hydrophobic characteristics make it difficult to use the
drug in vivo.
4.5.4 Loading of Cytochrome C
In order to ascertain the hydrophobicity of paracetamol, the biologically relevant model
protein - Cytochrome C has been chosen. It being a protein not only shows pH-dependent
properties but also mimics physio-chemical properties of several hydrophilic clinically
relevant drug molecules like siRNA, pro-drugs and peptides.
4.5.4.1 Calibration curve of Cytochrome C
Cytochrome C was analyzed and a calibration curve was made based on the absorbance
values, shown in Figure 45. The Cytochrome C concentration used was 8.11 ∙ 10-3
mM when
introducing it to the polymer solution (2 mg/mL). The Cytochrome C solution has been
diluted (2 times) before measured in the UV-VIS. The concentration has been calculated by
the absorbance value from the calibration curve. The values are taken at 409 nm, where the
heme-group of the protein is observed.
Concentration (mM)
0,000 0,002 0,004 0,006 0,008 0,010 0,012
Ab
sorb
an
ce
0,0
0,2
0,4
0,6
0,8
1,0
Figure 45 – Shows the calibration curve of Cytochrome C.
Since this drug is a protein, it was assumed that heat would affect it. Due to this assumption
the drug has been heated to 50 °C. Cytochrome C solution (4.06 ∙ 10-3
mM) has been analyzed
in the UV-VIS before and after heating as shown in Figure 46. The light blue line was before

56
heating, and the dark blue line was after heating (50 ºC). This study has discovered a
difference between the abs. lines. However, the magnitude of the heme–group showed
approximately the same value. The calibration curve was also assumed valid for studies
performed at high temperatures.
Figure 46 – Shows the difference between heated (dark blue) and not heated Cytochrome C (light blue).
4.5.4.2 Polymers introduced to the solution of Cytochrome C Cytochrome C has shown a larger peak at 409 nm (where the heme–group of Cytochrome C
has been identified) in the polymer solution compared to a pure Cytochrome C solution. This
trend is shown in Figure 47. As seen in this figure, Cytochrome C has gained higher
absorbance when it has been introduced to the polymer solution. In addition, a peak at ~209
nm has also been observed. This has complicated the calculations of loaded and released drug.
However, the calibration curve has been used to calculate the concentration with the
assumption of a proportional relationship between the absorbance and concentration also
when the polymer is added. Examples of the calculations of bound Cytochrome C are given in
Appendix B.
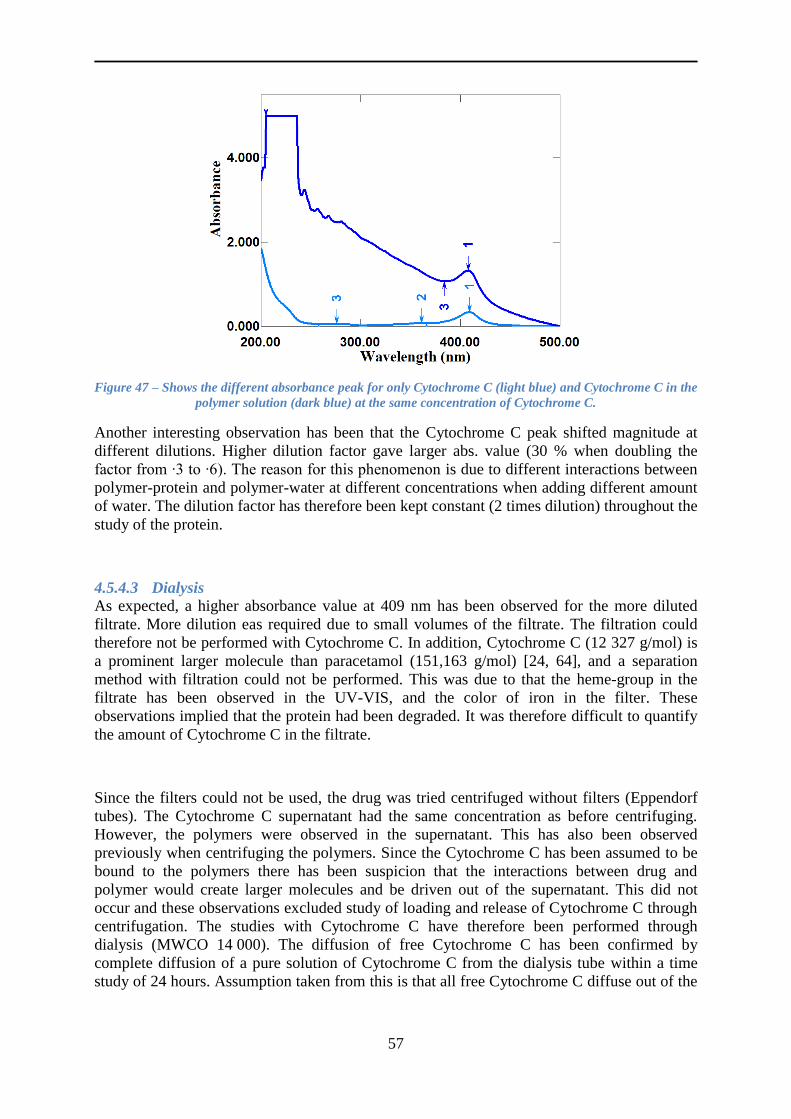
57
Figure 47 – Shows the different absorbance peak for only Cytochrome C (light blue) and Cytochrome C in the
polymer solution (dark blue) at the same concentration of Cytochrome C.
Another interesting observation has been that the Cytochrome C peak shifted magnitude at
different dilutions. Higher dilution factor gave larger abs. value (30 % when doubling the
factor from ∙3 to ∙6). The reason for this phenomenon is due to different interactions between
polymer-protein and polymer-water at different concentrations when adding different amount
of water. The dilution factor has therefore been kept constant (2 times dilution) throughout the
study of the protein.
4.5.4.3 Dialysis
As expected, a higher absorbance value at 409 nm has been observed for the more diluted
filtrate. More dilution eas required due to small volumes of the filtrate. The filtration could
therefore not be performed with Cytochrome C. In addition, Cytochrome C (12 327 g/mol) is
a prominent larger molecule than paracetamol (151,163 g/mol) [24, 64], and a separation
method with filtration could not be performed. This was due to that the heme-group in the
filtrate has been observed in the UV-VIS, and the color of iron in the filter. These
observations implied that the protein had been degraded. It was therefore difficult to quantify
the amount of Cytochrome C in the filtrate.
Since the filters could not be used, the drug was tried centrifuged without filters (Eppendorf
tubes). The Cytochrome C supernatant had the same concentration as before centrifuging.
However, the polymers were observed in the supernatant. This has also been observed
previously when centrifuging the polymers. Since the Cytochrome C has been assumed to be
bound to the polymers there has been suspicion that the interactions between drug and
polymer would create larger molecules and be driven out of the supernatant. This did not
occur and these observations excluded study of loading and release of Cytochrome C through
centrifugation. The studies with Cytochrome C have therefore been performed through
dialysis (MWCO 14 000). The diffusion of free Cytochrome C has been confirmed by
complete diffusion of a pure solution of Cytochrome C from the dialysis tube within a time
study of 24 hours. Assumption taken from this is that all free Cytochrome C diffuse out of the

58
tube after 24 hours. The Cytochrome left in the solution was therefore bound to the high
molecular weight polymer.
4.5.4.4 Loading
The dialysis has been used for the loading study, which is a new method of quantified
loading. Different time points have been taken and the loading has been calculated differently
than for paracetamol due to that bound drug has been analyzed. An example of the
calculations of loaded Cytochrome C is given in Appendix B.
According to the assumption that all of the free Cytochrome had diffused out in 24 hours the
last time point has been taken after 24 hours. These time points are given with the decreasing
concentration of the drug in Figure 48. The incorporated polymer used was synthesized with 2
mM SDS.
The concentration of Cytochrome C decreases from the time point 0 to 6 hours. Thereby it
can be assumed that most of the free Cytochrome C already had diffused out during the first
hours of dialysis since it is hydrophilic. The concentration differences between the deionized
water outside the tubes and drug solution with the polymers (synthesized with 2 mM SDS) in
the tube was more significant at the start of the dialysis and more of the drug is thereby forced
out through osmosis caused by higher concentration gradient. The loading – and
encapsulation efficiencies of Cytochrome C in this study has been calculated to be 85.6 % and
0.167 mg drug/mg polymer respectively.
Time (hours)
0 5 10 15 20 25 30
Co
nc. o
f C
yto
ch
rom
e C
(m
M)
0,0130
0,0135
0,0140
0,0145
0,0150
0,0155
0,0160
Figure 48 – Shows the Cytochrome C conc. as a function of time in loading study performed through dialysis.
After confirming successful loading of Cytochrome C through dialysis, the release kinetics of
the drug was ready to be studied.
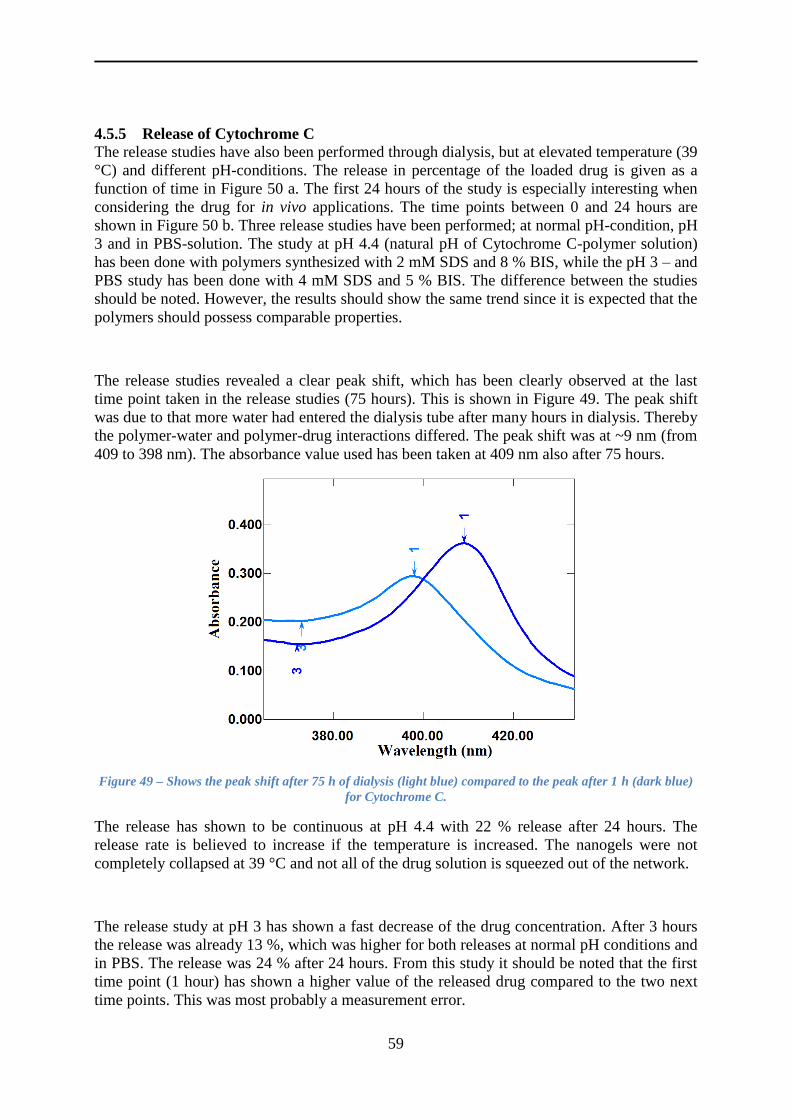
59
4.5.5 Release of Cytochrome C
The release studies have also been performed through dialysis, but at elevated temperature (39
°C) and different pH-conditions. The release in percentage of the loaded drug is given as a
function of time in Figure 50 a. The first 24 hours of the study is especially interesting when
considering the drug for in vivo applications. The time points between 0 and 24 hours are
shown in Figure 50 b. Three release studies have been performed; at normal pH-condition, pH
3 and in PBS-solution. The study at pH 4.4 (natural pH of Cytochrome C-polymer solution)
has been done with polymers synthesized with 2 mM SDS and 8 % BIS, while the pH 3 – and
PBS study has been done with 4 mM SDS and 5 % BIS. The difference between the studies
should be noted. However, the results should show the same trend since it is expected that the
polymers should possess comparable properties.
The release studies revealed a clear peak shift, which has been clearly observed at the last
time point taken in the release studies (75 hours). This is shown in Figure 49. The peak shift
was due to that more water had entered the dialysis tube after many hours in dialysis. Thereby
the polymer-water and polymer-drug interactions differed. The peak shift was at ~9 nm (from
409 to 398 nm). The absorbance value used has been taken at 409 nm also after 75 hours.
Figure 49 – Shows the peak shift after 75 h of dialysis (light blue) compared to the peak after 1 h (dark blue)
for Cytochrome C.
The release has shown to be continuous at pH 4.4 with 22 % release after 24 hours. The
release rate is believed to increase if the temperature is increased. The nanogels were not
completely collapsed at 39 °C and not all of the drug solution is squeezed out of the network.
The release study at pH 3 has shown a fast decrease of the drug concentration. After 3 hours
the release was already 13 %, which was higher for both releases at normal pH conditions and
in PBS. The release was 24 % after 24 hours. From this study it should be noted that the first
time point (1 hour) has shown a higher value of the released drug compared to the two next
time points. This was most probably a measurement error.
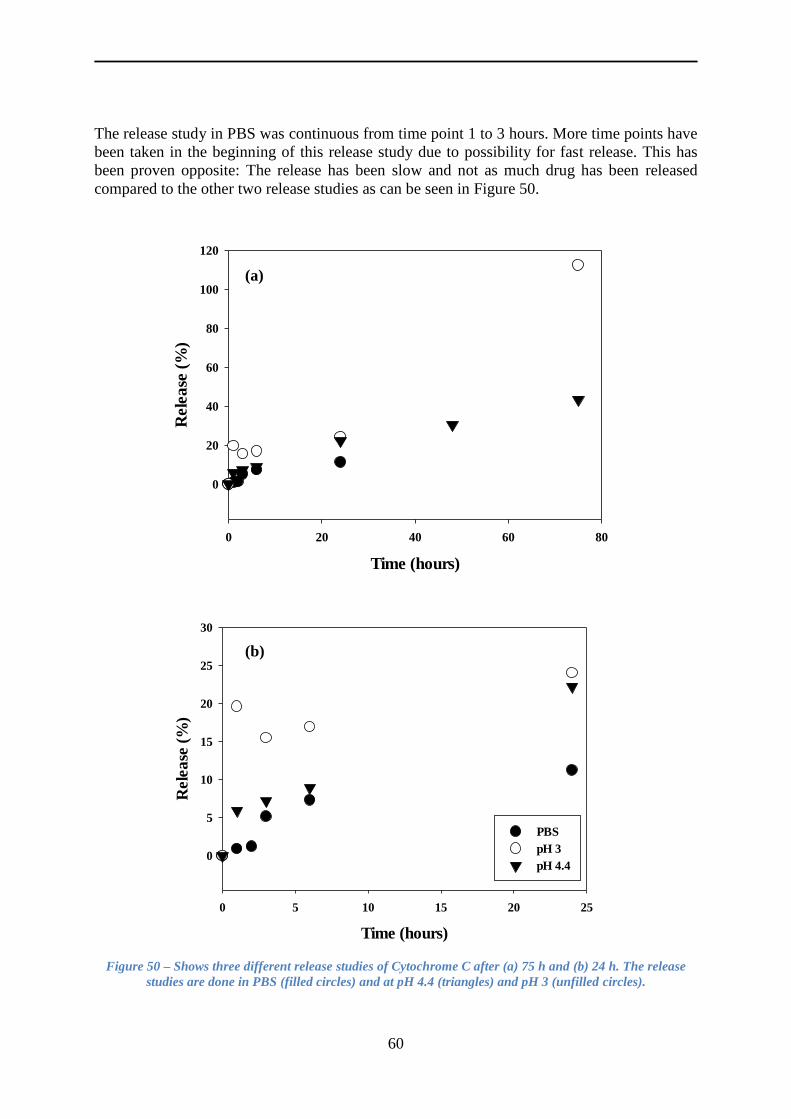
60
The release study in PBS was continuous from time point 1 to 3 hours. More time points have
been taken in the beginning of this release study due to possibility for fast release. This has
been proven opposite: The release has been slow and not as much drug has been released
compared to the other two release studies as can be seen in Figure 50.
Time (hours)
0 20 40 60 80
Rele
ase
(%
)
0
20
40
60
80
100
120
Time (hours)
0 5 10 15 20 25
Rele
ase
(%
)
0
5
10
15
20
25
30
PBS
pH 3
pH 4.4
Figure 50 – Shows three different release studies of Cytochrome C after (a) 75 h and (b) 24 h. The release
studies are done in PBS (filled circles) and at pH 4.4 (triangles) and pH 3 (unfilled circles).
(a)
(b)
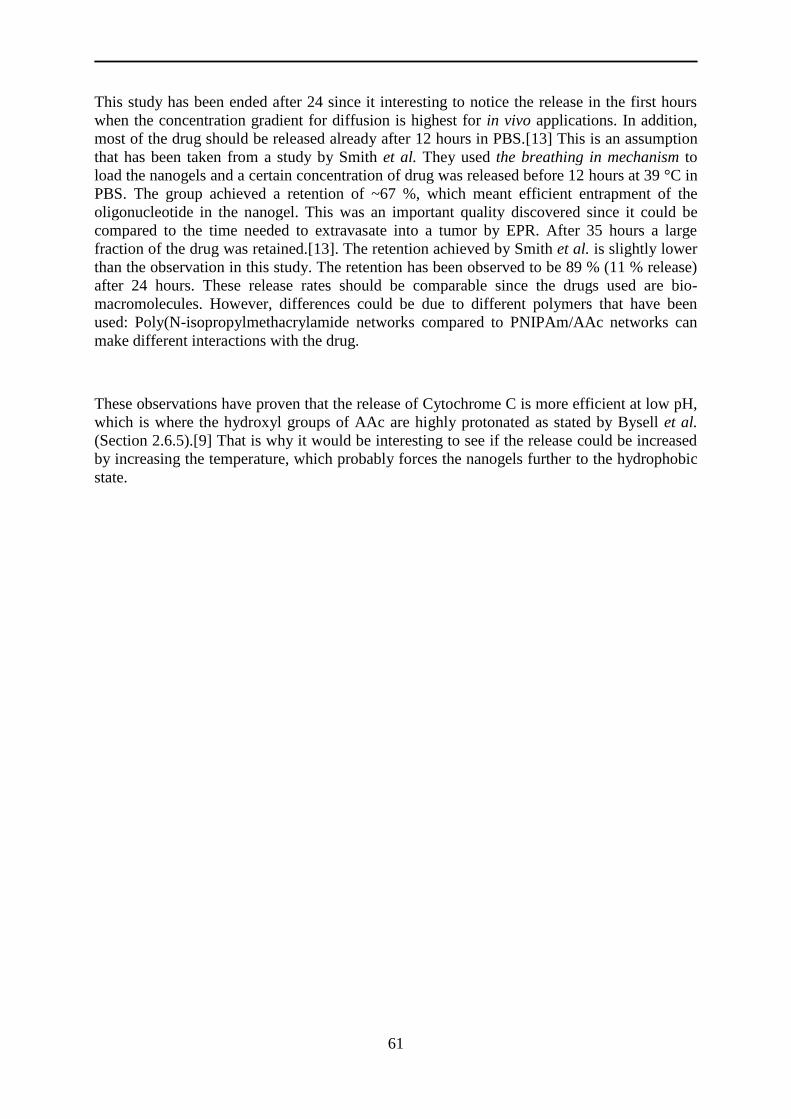
61
This study has been ended after 24 since it interesting to notice the release in the first hours
when the concentration gradient for diffusion is highest for in vivo applications. In addition,
most of the drug should be released already after 12 hours in PBS.[13] This is an assumption
that has been taken from a study by Smith et al. They used the breathing in mechanism to
load the nanogels and a certain concentration of drug was released before 12 hours at 39 °C in
PBS. The group achieved a retention of ~67 %, which meant efficient entrapment of the
oligonucleotide in the nanogel. This was an important quality discovered since it could be
compared to the time needed to extravasate into a tumor by EPR. After 35 hours a large
fraction of the drug was retained.[13]. The retention achieved by Smith et al. is slightly lower
than the observation in this study. The retention has been observed to be 89 % (11 % release)
after 24 hours. These release rates should be comparable since the drugs used are bio-
macromolecules. However, differences could be due to different polymers that have been
used: Poly(N-isopropylmethacrylamide networks compared to PNIPAm/AAc networks can
make different interactions with the drug.
These observations have proven that the release of Cytochrome C is more efficient at low pH,
which is where the hydroxyl groups of AAc are highly protonated as stated by Bysell et al.
(Section 2.6.5).[9] That is why it would be interesting to see if the release could be increased
by increasing the temperature, which probably forces the nanogels further to the hydrophobic
state.

62
5 Conclusion The PNIPAm/AAc nanogels were synthesized under different reaction conditions in order to
optimize the size. Once the optimization was achieved, nanogels that showed around 50 %
collapse above VPTT were used for loading and release studies. DLS measurements
confirmed the reversibility in the collapse of the nanogels, indicating their application for
controlled release with a capacity to store the cargo over prolonged time. The temperature –
and pH sensitive responses exhibited by these nanogels are ideally suited for loading and
release studies of biologically relevant molecules.
The drug molecules chosen for the study is paracetamol and Cytochrome C. These were tried
to be loaded using different mechanisms. Paracetamol showed no detectable loading via
incorporation method while the breathing in mechanism showed considerable loading at high
temperature (61 % and 16 mg drug/mg polymer) and low pH (60 % and 14 mg drug/mg
polymer).In order to enhance the loading and encapsulation efficiencies, different paracetamol
and polymer concentrations were tried out. The highest loading – and encapsulation
efficiency have been achieved with high paracetamol concentration (66 mM), while
increasing the polymer concentration increases loading efficiency and decreases the
encapsulation efficiency. This indicates that the available sites for drug interaction are
enhanced with higher concentration of polymers while more drugs can attach at the same
polymer concentration owing to a higher drug concentration gradient (high paracetamol
concentration). The high loading observed at high temperature and low pH is a proof of the
hypothesized hydrophobic interactions between the paracetamol and the nanogels.
Successful release of paracetamol has been achieved by increasing the temperature of the
loaded paracetamol solution to 70 °C. The corresponding release of paracetamol measured
after an hour was found to be 95 %. Further increase in temperature has been assumed to
cause a squeezing release of the drug from the nanogels. The release could also be observed
when increasing pH from 3 to 7 (46 % release). Drug delivery applications require controlled
release at or close to body temperature (~37 °C) or in a region of low pH (tumour pH ~4).
Therefore, the paracetamol loaded nanogels show less promising applications towards the
required goal. Hence, it was decided to study the loading and release kinetics of a hydrophilic
protein – Cytochrome C as an example of a molecule that shows conformational changes with
pH.
Cytochrome C (8 μM) has been successfully loaded to the nanogels (2 mg/mL) with high
loading – and encapsulation efficiencies of 86 % and 0.17 mg drug/mg polymer respectively.
Unlike the standard protocol used for measuring free paracetamol concentration
(centrifugation using filters); Cytochrome C was analyzed by measuring the bound protein
(after the free Cytochrome had diffused out through the dialysis membrane).
Release studies for Cytochrome C have been done under three different conditions, while the
temperature has been kept constant at 39 °C. A release of 11 %, 22 % and 24 % (after 24
hours) of the loaded Cytochrome has been observed in PBS, at pH of the polymer-drug
solution and at pH 3 respectively. Although, the release kinetics has been observed to be slow,

63
it is believed that a combination of high temperature and low pH can make the release faster
and more efficient. The high retention capacities of the nanogels enable successive cycles of
drug release over sustained periods. These nanogels can be further studied by modifying the
surface using Poly(Ethylene glycol) (PEG) or/and binding to metallic NPs to introduce
theranostic properties. Multiple drugs loading can be achieved with these highly functional
nanoconstructs.

64
6 Future work
6.1 Drug release studies of Cytochrome C Cytochrome C shows possible changes when heating it. That is why it would be interesting to
look at the loading/release kinetics dependent on the pH only. Conformational changes can
occur at different pH’s, which would make these very relevant studies of the protein.
Cytochrome C shows release at elevated temperature. This release rate is believed to increase
if increasing the temperature and lower the pH. Since higher release rate is observed at pH 3,
this pH would be interesting to use when releasing the drug at 45 °C. However, the
temperature effect on the morphology of the protein should be mapped. In addition, to utilize
this high temperature the surface of the hydrogel network needs to be modified.
The successful loading and the release of Cytochrome C shows that similar hydrophilic
molecules like siRNA, pro-drugs and peptides can also be studied using these nanogels.
6.2 Polymers incorporated to magnetic NPs. One modification of the polymers is to incorporate then with magnetic NPs. This is shown in
Figure 51 with gold NP incorporated with functionalized polymers.[65]
Figure 51 – Shows example of a metal NP incorporated with functionalized polymers.[65]
The inorganic NPs are defined as one of the two nanocarrier categories which consist of
inorganic – and organic/polymeric nanocarriers. The inorganic nanocarriers, such as
mesoporous silica, magnetic NPs, gold NPs and quantum dots, possess capabilities for
tracking and their rigid surface can be functionalized. The organic/polymer nanocarriers will
be highly flexible in terms of chemistry and structure. Along with the polymeric NPs
(nanogels etc.) are the micelles, dendrimers and liposomes which consist of amphiphilic
copolymers with biocompatibility.[6] The polymeric and inorganic NPs can be combined to
give multiple functions. This is relevant when considering that the VPTT for PNIPAm/AAc
nanogels is higher than the body temperature. To trigger the de-swelling, magnetic field can
be used if the hydrogel is modified with metal NPs. This will lead to de-swelling transitions

65
and a squashing release of drugs when heated magnetically.[9] For example, PNIPAm/AAc
coated Au - NPs show a decrease in size at high temperature and low pH.[19]
It would also be interesting to try to transport the drug carriers while over the VPTT, since the
particle size is smaller and thereby they are more readily taken up within cells. Increased
uptake above the transition temperature has been proven by Choi et al. by introducing sub-
micrometer particles into cells in a temperature-dependent manner. They showed that
molecularly design stimuli-sensitive hydrogels of PNIPAm/AAc could serve as useful carriers
for intracellular delivery of macromolecular drugs.[8]
Another study has confirmed effective heating with Fe–containing PNIPAm microgels. These
NPs were heated by a local oscillating magnetic field and de-swelling was observed with
increasing temperature. This type of heating is less restricted than heating by light (restriction
of human tissue), but a powerful enough magnetic source is required to achieve localized
heating.[9]
A possible problem using metal NP is the shallow light penetration when heating. This needs
to be further investigated, along with the investigation of non – ideal behavior of the gels,
such as inhomogeneous distribution within the gels (shell formation), incomplete drug loading
and slow/incomplete drug release. When these factors are mapped, they can perhaps be
avoided, and the opportunities that come with gels as delivering systems can be fully
utilized.[9]
6.3 Incorporation of PEG The NPs can also be functionalized PEG (MW ~ 1000) to give longer circulation time in the
blood, and thereby increase the possibility for the NPs to reach the desired target.[5, 16] This
is given as an example in Figure 52, with a PEGylated NP which is used as drug delivery
system.[66]
Figure 52 – Shows an example of a PEGylated NP used in drug delivery.[66]
66
Drug carriers with a PEGylated interface have shown to make it difficult for body proteins to
adhere during circulation of the nanocarriers inside the body. This is due to PEG’s
hydrophilicity, high biocompatibility and high conformational flexibility.[16] This polymer
can reduce the toxicity in vivo and enhanced permeation of the nanocarriers.[6] In addition,
PEGylated proteins have shown to be able to evade premature clearance through RES. For
example in delivering of diabetes type 2 drugs, the half-life was increased from two hours to
more than 100 in the circulation time when incorporated with a PEG-like hydrophilic
polypeptide.[5] Due to PEG’s positive charge (the cells are negatively charged), the polymer
will also provide more readily transport into the cells.[8] Efficient internalization in
endosomes and cytosol has for example been achieved by surface modification with PEG
onto gold NPs.[4]
PEG incorporated to PNIPAm has shown reversibly temperature-dependent swelling/de-
swelling transitions. These systems have reduced solvency and increased de-swelling with
increased temperature.[9] PEG also showed to change the phase transition temperature. Due
to the incorporation of the hydrophilic polymer the particle requires more thermal energy to
collapse. This has been proven with PNIPAm microgels cross-linked with BIS, which
originally had a VPTT of 31°C increased to 36 °C. In addition the collapse happened over a
wider temperature range.[16]
Over the volume transition of polymer network the polymer will have twice the level of
protein adhesion compared to the swollen state, but by incorporation of PEG this adhesion
can be significantly reduced, both over and under the volume transition.[16]
Charge modifications with PEG of the surface give the NPs the ability to alter the electrostatic
BBB permeability more easily, which is very difficult to cross even today. This gives new
hope for delivering drugs to difficult reachable sites over the BBB, like to brain tumors and
the central nervous system (for example in treatment for Alzheimer’s, prion disease and many
other diseases without cure today).[4]

67
7 Bibliography 1. Mark Saltzman, W. and V. P. Torschilin, Drug delivery systems. AccessScience,
2012(11.04.2014). 2. Vilar, G., J. Tulla-Puche, and F. Albericio, Polymers and Drug Delivery Systems. 2012. 3. Bae, Y., et al., Design of Environment-Sensitive Supramolecular Assemblies for Intracellular
Drug Delivery: Polymeric Micelles that are Responsive to Intracellular pH Change. Angewandte Chemie International Edition, 2003. 42(38): p. 4640-4643.
4. Chakraborty, C., et al., Nanoparticles as 'smart' pharmaceutical delivery. Frontiers in bioscience (Landmark edition), 2013. 18: p. 1030-1050.
5. Hubbell, J.A. and A. Chilkoti, Nanomaterials for Drug Delivery. Science, 2012. 337(6092): p. 303-305.
6. Jia, F., et al., Multifunctional nanoparticles for targeted delivery of immune activating and cancer therapeutic agents. Journal of Controlled Release, 2013. 172(3): p. 1020-1034.
7. TheFreeDictionary, Down-regulation. 2014. 8. Choi, S.H., J.J. Yoon, and T.G. Park, Galactosylated Poly(N-isopropylacrylamide) Hydrogel
Submicrometer Particles for Specific Cellular Uptake within Hepatocytes. Journal of Colloid and Interface Science, 2002. 251(1): p. 57-63.
9. Bysell, H., et al., Microgels and microcapsules in peptide and protein drug delivery. Advanced Drug Delivery Reviews, 2011. 63(13): p. 1172-1185.
10. UK, C.R. How chemotherapy kills cancer cells. 2013 08.05.2014]; Available from: http://www.cancerresearchuk.org/cancer-help/about-cancer/treatment/chemotherapy/about/how-chemotherapy-works.
11. Wu, X. and P. Lee, Preparation and Characterization of Thermal- and pH-Sensitive Nanospheres. Pharmaceutical Research, 1993. 10(10): p. 1544-1547.
12. de Dios, A.S. and M.E. Díaz-García, Multifunctional nanoparticles: Analytical prospects. Analytica Chimica Acta, 2010. 666(1–2): p. 1-22.
13. Smith, M.H. and L.A. Lyon, Multifunctional Nanogels for siRNA Delivery. Accounts of Chemical Research, 2011. 45(7): p. 985-993.
14. R, R., et al. Nanomedicine: towards development of patient-friendly drug-delivery systems for oncological applications. 2012 26.05.2014]; Available from: http://openi.nlm.nih.gov/detailedresult.php?img=3292417_ijn-7-1043f3&req=4.
15. Dobner, K. Second Study Released Linking Kidney Disease to Synthetic Cannabinoids. 2013 26.05.2014]; Available from: http://tothemaximusblog.org/?p=3555.
16. Hendrickson, G.R., et al., Design of Multiresponsive Hydrogel Particles and Assemblies. Advanced Functional Materials, 2010. 20(11): p. 1697-1712.
17. Santos, J.R., N.M. Alves, and J.F. Mano, New Thermo-responsive Hydrogels Based on Poly (N-isopropylacrylamide)/ Hyaluronic Acid Semi-interpenetrated Polymer Networks: Swelling Properties and Drug Release Studies. Journal of Bioactive and Compatible Polymers, 2010. 25(2): p. 169-184.
18. Hu, X., Z. Tong, and L.A. Lyon, Control of Poly(N-isopropylacrylamide) Microgel Network Structure by Precipitation Polymerization near the Lower Critical Solution Temperature. Langmuir, 2011. 27(7): p. 4142-4148.
19. Singh, N. and L.A. Lyon, Au Nanoparticle Templated Synthesis of pNIPAm Nanogels. Chemistry of Materials, 2007. 19(4): p. 719-726.
20. Mohsen, R., et al., Characterization of thermo and pH responsive NIPAM based microgels and their membrane blocking potential. Colloids and Surfaces A: Physicochemical and Engineering Aspects, 2013. 428(0): p. 53-59.
21. Meng, Z., M. Smith, and L.A. Lyon, Temperature-programmed synthesis of micron-sized multi-responsive microgels. Colloid and Polymer Science, 2009. 287(3): p. 277-285.
22. Hu, X., Z. Tong, and L.A. Lyon, Multicompartment Core/Shell Microgels. Journal of the American Chemical Society, 2010. 132(33): p. 11470-11472.

68
23. S., B., et al., UV-Visible Spectrophotometric Method Development and Validation of Assay of Paracetamol Tablet Formulation. J Anal Bioanal Techniques, 2012. 3(6).
24. Wikipedia. Paracetamol. 2014 21.05.2014]; Available from: http://en.wikipedia.org/wiki/Paracetamol.
25. Borelli, J. and S. Musso. Paracetamol. 2011 26.05.2014]; Available from: http://flipper.diff.org/app/items/3869.
26. The-glutathione-experts. What is Glutathione (GSH)? 2013 01.07.2014]; Available from: http://www.glutathioneexperts.com/what-is-glutathione.html.
27. Granberg, R.A. and Å.C. Rasmuson, Solubility of Paracetamol in Pure Solvents. Journal of Chemical & Engineering Data, 1999. 44(6): p. 1391-1395.
28. Wikipedia. Cytochrome. 2014 04.06.2014]; Available from: http://en.wikipedia.org/wiki/Cytochrome.
29. Sigma-Aldrich. Cytochrome c from bovine heart. 2014 04.06.2014]; Available from: http://www.sigmaaldrich.com/catalog/product/sigma/c3131?lang=en®ion=NO.
30. Sigma-Aldrich, Cytochrome C. 2014. 31. Shervedani, R.K. and M.S. Foroushani, Direct electrochemistry of cytochrome c immobilized
on gold electrode surface via Zr(IV) ion glue and its activity for ascorbic acid. Bioelectrochemistry, 2014. 98(0): p. 53-63.
32. TheFreeDictionary. Loading dose. 2014 30.05.2014]; Available from: http://medical-dictionary.thefreedictionary.com/loading+dose.
33. Lehto, V.P. and J. Riikonen, 14 - Drug loading and characterization of porous silicon materials, in Porous Silicon for Biomedical Applications, H.A. Santos, Editor 2014, Woodhead Publishing. p. 337-355.
34. Mane, P. A seminar on sustained release drug delivery system. 2009 30.05.2014]; Available from: http://www.slideshare.net/prashantmane01/sustained-release-drug-delivery-system.
35. Nolan, C.M., L.T. Gelbaum, and L.A. Lyon, 1H NMR Investigation of Thermally Triggered Insulin Release from Poly(N-isopropylacrylamide) Microgels. Biomacromolecules, 2006. 7(10): p. 2918-2922.
36. Oh, J.K., et al., The development of microgels/nanogels for drug delivery applications. Progress in Polymer Science, 2008. 33(4): p. 448-477.
37. Smith, M.H., et al., Monitoring the Erosion of Hydrolytically-Degradable Nanogels via Multiangle Light Scattering Coupled to Asymmetrical Flow Field-Flow Fractionation. Analytical Chemistry, 2009. 82(2): p. 523-530.
38. Sun, S., et al., Chain Collapse and Revival Thermodynamics of Poly(N-isopropylacrylamide) Hydrogel. The Journal of Physical Chemistry B, 2010. 114(30): p. 9761-9770.
39. Jones, C. and L. Lyon, Synthesis and Characterization of Multiresponsive Core-shell Microgels. Macromolecules, 2000. 33: p. 8301 - 8306.
40. Bandyopadhyay, S., Personal communication, 2014. 41. Wikipedia. Interstitial fluid. 2014 26.05.2014]; Available from:
http://en.wikipedia.org/wiki/Interstitial_fluid. 42. Bshsagar. Nanoparticles. 2013 11.05.2014]; Available from:
http://www.pharmainfo.net/nanoparticles. 43. GeneCards. EPH Receptor A2. 2014 01.07.2014]; Available from:
http://www.genecards.org/cgi-bin/carddisp.pl?gene=EPHA2. 44. Nayak, S. and L.A. Lyon, Soft Nanotechnology with Soft Nanoparticles. Angewandte Chemie
International Edition, 2005. 44(47): p. 7686-7708. 45. Kratz, K., T. Hellweg, and W. Eimer, Influence of charge density on the swelling of colloidal
poly(N-isopropylacrylamide-co-acrylic acid) microgels. Colloids and Surfaces A: Physicochemical and Engineering Aspects, 2000. 170(2–3): p. 137-149.
46. Bae, Y.H. and K. Park, Targeted drug delivery to tumors: myths, reality and possibility. J Control Release, 2011. 153(3): p. 198-205.
69
47. Hiemenz, P.C. and R. Rajagopalan, Principles of Colloid and Surface Chemistry. Third ed. Dynamic light scattering 1997, Boca Raton CRC Press
48. Malvern. ZetaSizer range. 2014 21.05.2014]; Available from: http://www.malvern.com/en/support/product-support/zetasizer-range/zetasizer-nano-range/.
49. Malvern. Zetasizer Nano S. 2014 21.05.2014]; Available from: http://www.malvern.com/en/products/product-range/zetasizer-range/zetasizer-nano-range/zetasizer-nano-s/default.aspx.
50. Malvern. Zetasizer Nano ZS. 2014 21.05.2014]; Available from: http://www.malvern.com/en/products/product-range/zetasizer-range/zetasizer-nano-range/zetasizer-nano-z/default.aspx.
51. Edward, J.T., Molecular volumes and the Stokes-Einstein equation. Journal of Chemical Education, 1970. 47(4): p. 261.
52. Sze, A., et al., Zeta-potential measurement using the Smoluchowski equation and the slope of the current–time relationship in electroosmotic flow. Journal of Colloid and Interface Science, 2003. 261(2): p. 402-410.
53. MalvernNanoSizer-UserManual. 54. Sigma-Aldrich. Hellma® fluorescence cuvettes, standard cells, Macro. 2014 25.06.2014];
Available from: http://www.sigmaaldrich.com/catalog/product/sigma/z600172?lang=en®ion=NO.
55. Soppimath, K.S., et al., Biodegradable polymeric nanoparticles as drug delivery devices. Journal of Controlled Release, 2001. 70(1–2): p. 1-20.
56. Tam, K.C., X.Y. Wu, and R.H. Pelton, Viscometry—a useful tool for studying conformational changes of poly(N-isopropylacrylamide) in solutions. Polymer, 1992. 33(2): p. 436-438.
57. Andersen, M.K., Smart nanoparticles for targeted drug delivery, Specialzation project, 2013. 58. ICS, I.C.s. Acrylic Acid. 2013 28.06.2014]; Available from: http://ics-
chemicals.com/products/acrylic-acid/. 59. Abu Samah, N.H. and C.M. Heard, Enhanced in vitro transdermal delivery of caffeine using a
temperature- and pH-sensitive nanogel, poly(NIPAM-co-AAc). Int J Pharm, 2013. 453(2): p. 630-40.
60. Li, C., et al., Synthesis and Characterization of Biocompatible Thermo-Responsive Gelators Based on ABA Triblock Copolymers. Biomacromolecules, 2005. 6(2): p. 994-999.
61. Anirudhan, T.S., S.S. Gopal, and S. Sandeep, Synthesis and characterization of montmorillonite/N-(carboxyacyl) chitosan coated magnetic particle nanocomposites for controlled delivery of paracetamol. Applied Clay Science, 2014. 88–89(0): p. 151-158.
62. Yisarakun, W., et al., Chronic paracetamol treatment increases alterations in cerebral vessels in cortical spreading depression model. Microvascular Research, 2014. 94(0): p. 36-46.
63. Sigma-Aldrich. Vivaspin 500 centrifugal concentrators. 2014; Available from: http://www.sigmaaldrich.com/catalog/product/sigma/z629367?lang=en®ion=NO.
64. Sigma-Aldrich. Cytochrome c from bovine heart. 2014 21.05.2014]; Available from: http://www.sigmaaldrich.com/catalog/product/sigma/c2037?lang=en®ion=NO.
65. Mangeney, C., et al., Synthesis and Properties of Water-Soluble Gold Colloids Covalently Derivatized with Neutral Polymer Monolayers. Journal of the American Chemical Society, 2002. 124(20): p. 5811-5821.
66. F, B., et al. PEGylated Versus Non-PEGylated γFe2O3@Alendronate Nanoparticles. 2012 20.04.2014]; Available from: http://omicsonline.org/1948-593X/JBABM-04-039.php?aid=6232.
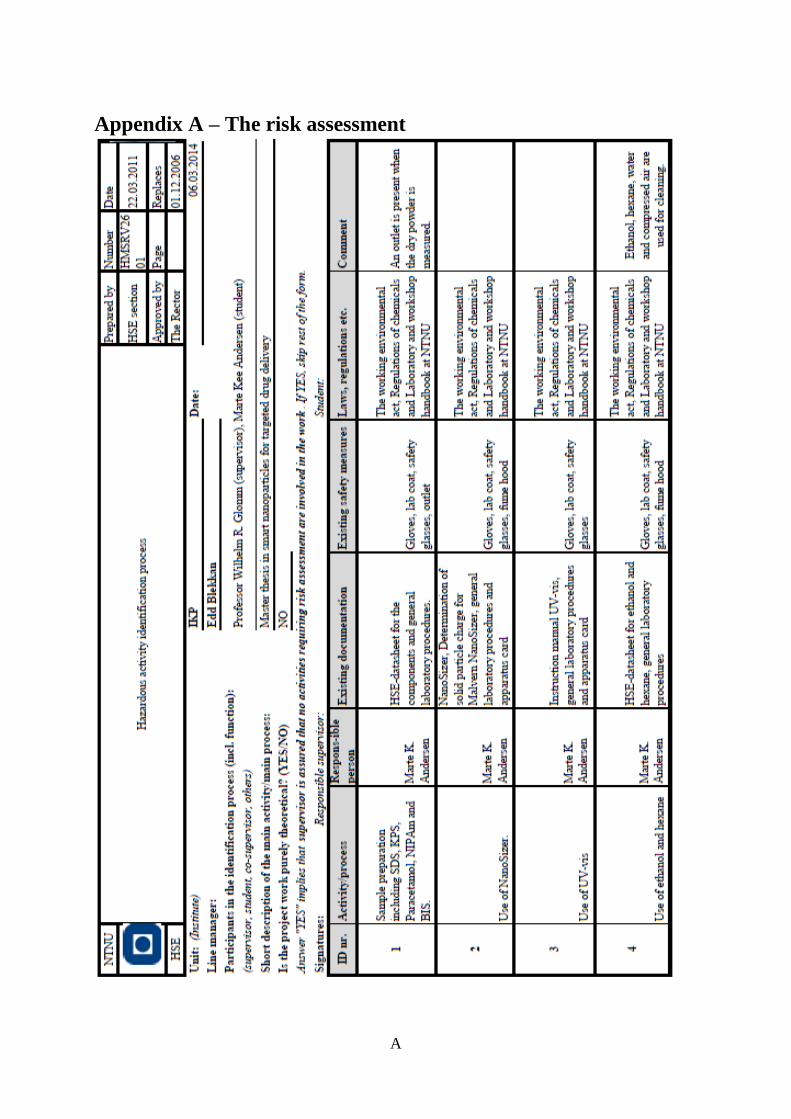
A
Appendix A – The risk assessment
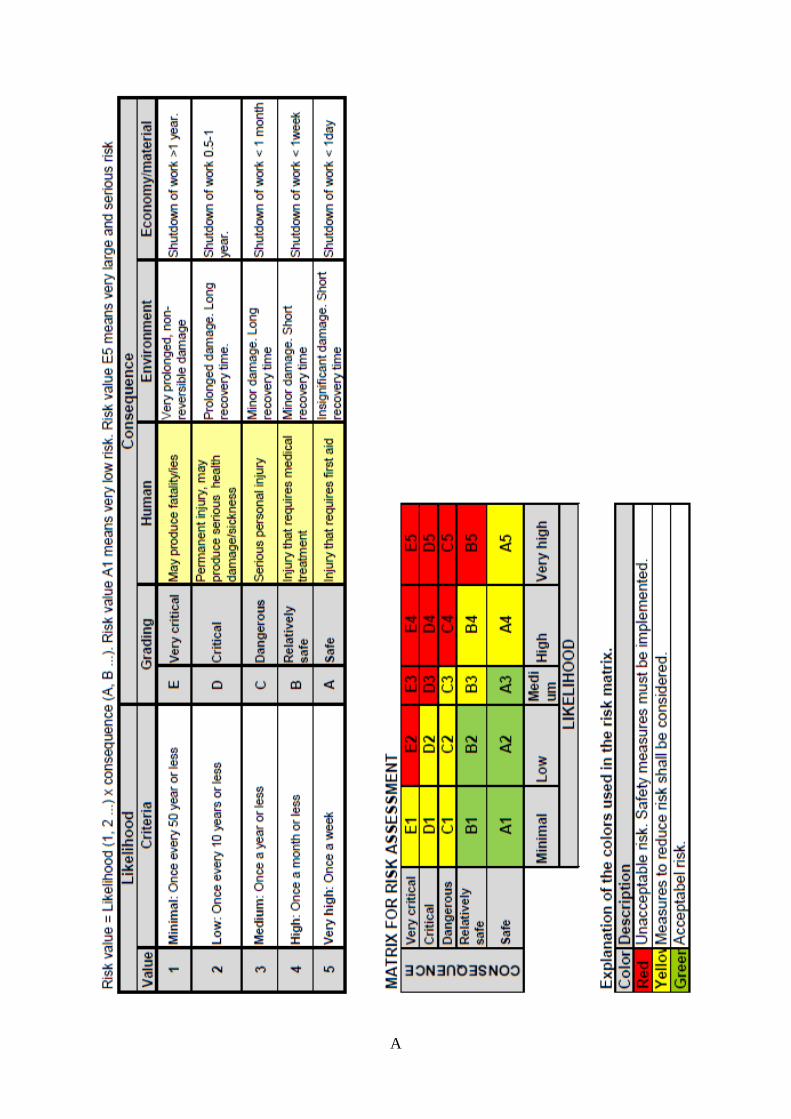
A
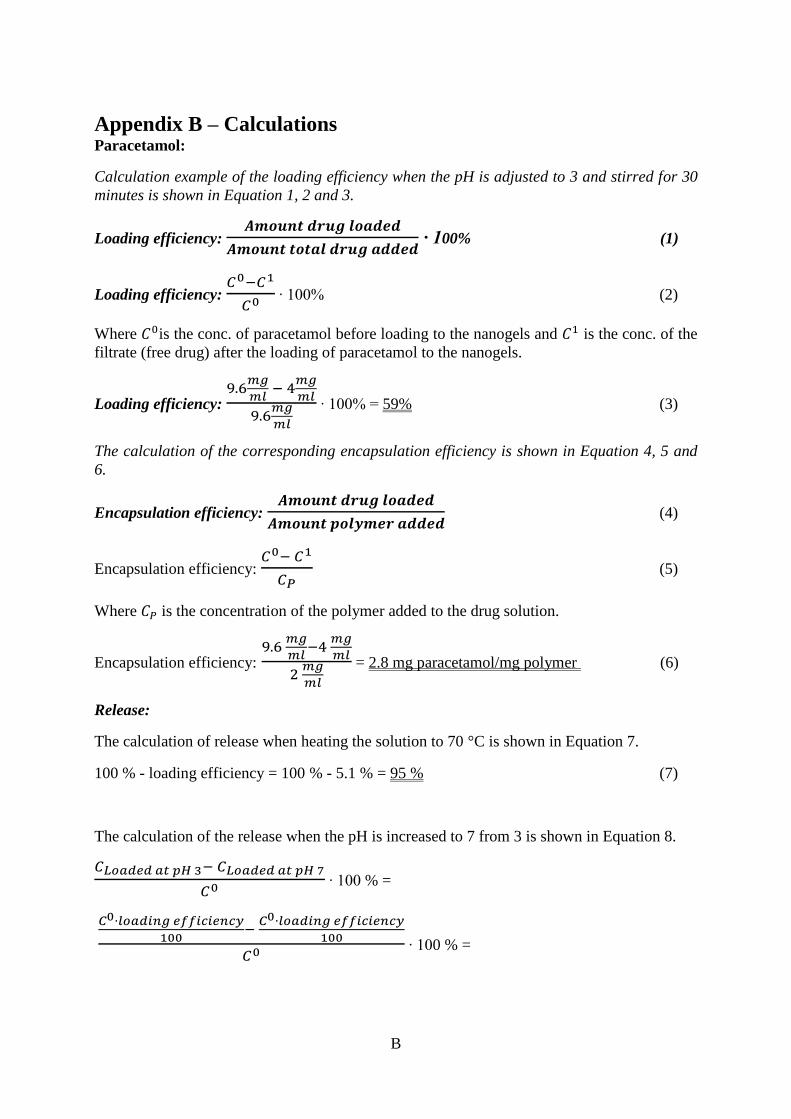
B
Appendix B – Calculations Paracetamol:
Calculation example of the loading efficiency when the pH is adjusted to 3 and stirred for 30
minutes is shown in Equation 1, 2 and 3.
Loading efficiency:
∙ 100% (1)
Loading efficiency:
∙ 100% (2)
Where is the conc. of paracetamol before loading to the nanogels and is the conc. of the
filtrate (free drug) after the loading of paracetamol to the nanogels.
Loading efficiency:
∙ 100% = 59% (3)
The calculation of the corresponding encapsulation efficiency is shown in Equation 4, 5 and
6.
Encapsulation efficiency:
(4)
Encapsulation efficiency:
(5)
Where is the concentration of the polymer added to the drug solution.
Encapsulation efficiency:
= 2.8 mg paracetamol/mg polymer (6)
Release:
The calculation of release when heating the solution to 70 °C is shown in Equation 7.
100 % - loading efficiency = 100 % - 5.1 % = 95 % (7)
The calculation of the release when the pH is increased to 7 from 3 is shown in Equation 8.
∙ 100 % =
∙ 100 % =

B
(
)
∙ 100 % = 46 % (8)
Cytochrome C:
The calculation of the loading – and encapsulation efficiency when the drug is loaded at
normal conditions (pH 4.4) after 24 h is shown in Equation 9, 10 and 11.
Loading efficiency:
(9)
Where is the concentration of drug/polymer solution before loading and is the
concentration after loading (the Cytochrome C left in the polymer solution).
∙ 100 % = 85 % (10)
Encapsulation efficiency:
=
= 85 μg drug/mg polymer (11)
Where is the concentration of the polymer in the drug solution.
Release:
The calculation of the release at pH 3 and after 1 hour is shown in Equation 12.
∙ 100 % =
∙ 100 % =
∙ 100 %
=
∙ 100 % = 20 % (12)
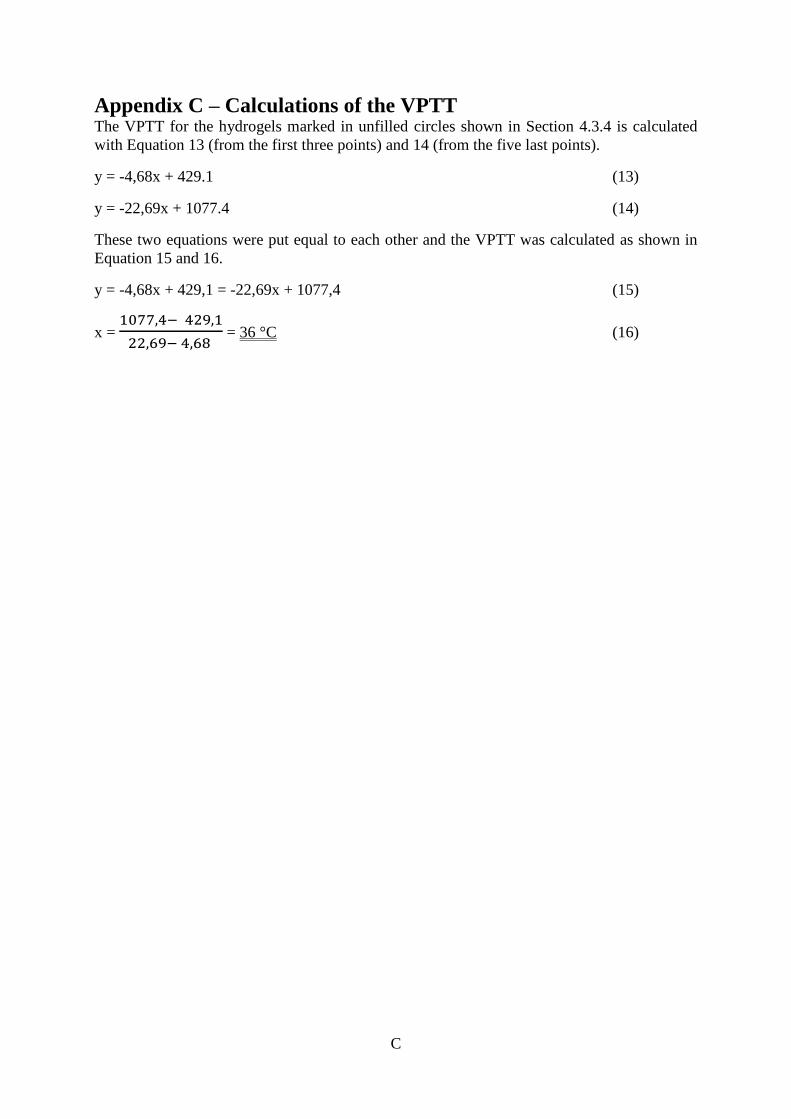
C
Appendix C – Calculations of the VPTT The VPTT for the hydrogels marked in unfilled circles shown in Section 4.3.4 is calculated
with Equation 13 (from the first three points) and 14 (from the five last points).
y = -4,68x + 429.1 (13)
y = -22,69x + 1077.4 (14)
These two equations were put equal to each other and the VPTT was calculated as shown in
Equation 15 and 16.
y = -4,68x + 429,1 = -22,69x + 1077,4 (15)
x =
= 36 °C (16)
Related Documents