HAL Id: hal-00328366 https://hal.archives-ouvertes.fr/hal-00328366 Submitted on 2 Aug 2004 HAL is a multi-disciplinary open access archive for the deposit and dissemination of sci- entific research documents, whether they are pub- lished or not. The documents may come from teaching and research institutions in France or abroad, or from public or private research centers. L’archive ouverte pluridisciplinaire HAL, est destinée au dépôt et à la diffusion de documents scientifiques de niveau recherche, publiés ou non, émanant des établissements d’enseignement et de recherche français ou étrangers, des laboratoires publics ou privés. Polycyclic aromatic hydrocarbons (PAHs) in the atmospheres of two French alpine valleys: sources and temporal patterns Jean-Luc Besombes, N. Chevron, P. Masclet, G. Aymoz, J. L. Jaffrezo, Nicolas Marchand To cite this version: Jean-Luc Besombes, N. Chevron, P. Masclet, G. Aymoz, J. L. Jaffrezo, et al.. Polycyclic aromatic hydrocarbons (PAHs) in the atmospheres of two French alpine valleys: sources and temporal pat- terns. Atmospheric Chemistry and Physics, European Geosciences Union, 2004, 4 (5), pp.1181. hal- 00328366

Welcome message from author
This document is posted to help you gain knowledge. Please leave a comment to let me know what you think about it! Share it to your friends and learn new things together.
Transcript
HAL Id: hal-00328366https://hal.archives-ouvertes.fr/hal-00328366
Submitted on 2 Aug 2004
HAL is a multi-disciplinary open accessarchive for the deposit and dissemination of sci-entific research documents, whether they are pub-lished or not. The documents may come fromteaching and research institutions in France orabroad, or from public or private research centers.
L’archive ouverte pluridisciplinaire HAL, estdestinée au dépôt et à la diffusion de documentsscientifiques de niveau recherche, publiés ou non,émanant des établissements d’enseignement et derecherche français ou étrangers, des laboratoirespublics ou privés.
Polycyclic aromatic hydrocarbons (PAHs) in theatmospheres of two French alpine valleys: sources and
temporal patternsJean-Luc Besombes, N. Chevron, P. Masclet, G. Aymoz, J. L. Jaffrezo,
Nicolas Marchand
To cite this version:Jean-Luc Besombes, N. Chevron, P. Masclet, G. Aymoz, J. L. Jaffrezo, et al.. Polycyclic aromatichydrocarbons (PAHs) in the atmospheres of two French alpine valleys: sources and temporal pat-terns. Atmospheric Chemistry and Physics, European Geosciences Union, 2004, 4 (5), pp.1181. �hal-00328366�
Atmos. Chem. Phys., 4, 1167–1181, 2004www.atmos-chem-phys.org/acp/4/1167/SRef-ID: 1680-7324/acp/2004-4-1167
AtmosphericChemistry
and Physics
Polycyclic aromatic hydrocarbons (PAHs) in the atmospheres of twoFrench alpine valleys: sources and temporal patterns
N. Marchand1, *, J. L. Besombes1, N. Chevron1, P. Masclet1, G. Aymoz2, and J. L. Jaffrezo2
1LCME, ESIGEC, Universite de Savoie, 73376 le Bourget du Lac, France2LGGE, CNRS, Universite Joseph Fourier, 24 rue Moliere, 38402 St Martin d’Heres, France* Now at: LaMP, CNRS, Universite Blaise Pascal, 14 avenue des Landais, 63177 Aubiere, France
Received: 5 December 2003 – Published in Atmos. Chem. Phys. Discuss.: 2 February 2004Revised: 29 June 2004 – Accepted: 12 July 2004 – Published: 2 August 2004
Abstract. Alpine valleys represent some of the most impor-tant crossroads for international heavy-duty traffic in Europe,but the full impact of this traffic on air quality is not knowndue to a lack of data concerning these complex systems. Aspart of the program “Pollution des Vallees Alpines” (POVA),we performed two sampling surveys of polycyclic aromatichydrocarbons (PAHs) in two sensitive valleys: the Chamonixand Maurienne Valleys, between France and Italy. Samplingcampaigns were performed during the summer of 2000 andthe winter of 2001, with both periods taking place duringthe closure of the “Tunnel du Mont-Blanc”. The first objec-tive of this paper is to describe the relations between PAHconcentrations, external parameters (sampling site localiza-tion, meteorological parameters, sources), and aerosol char-acteristics, including its carbonaceous fraction (OC and EC).The second objective is to study the capacity of PAH pro-files to accurately distinguish the different emission sources.Temporal evolution of the relative concentration of an indi-vidual PAH (CHR) and the PAH groups BghiP+COR andBbF+BkF is studied in order to differentiate wood combus-tion, gasoline, and diesel emissions, respectively. The re-sults show that the total particulate PAH concentrations werehigher in the Chamonix valley during both seasons, despitethe cessation of international traffic. Seasonal cycles, withhigher concentrations in winter, are also stronger in this val-ley. During winter, particulate PAH concentration can reachvery high levels (up to 155 ng.m−3) in this valley during coldanticyclonic periods. The examination of sources shows theimpact during summer of heavy-duty traffic in the Mauri-enne valley and of gasoline vehicles in the Chamonix valley.During winter, Chamonix is characterized by the strong in-fluence of wood combustion in residential fireplaces, even if
Correspondence to:N. Marchand([email protected])
the temporal evolution of specific PAH ratios are difficult tointerpret. Information on sources given by PAH profiles canonly be considered in qualitative terms.
1 Introduction
Alpine valleys are unique transportation pathways in Europe,with a small number of corridors supporting the large traf-fic of heavy-duty trucks. This traffic, in addition to localemissions, can induce high levels of pollutants in these deepvalleys when subjected to specific atmospheric dynamics inmountainous areas (Prevot et al., 2000). The results pre-sented here were obtained during the program “Pollution desVallees Alpines” (POVA). This program focuses on atmo-spheric chemistry in two transit corridors between Franceand Italy: the Chamonix and Maurienne valleys (Fig. 1).This study benefits from an exceptional context: the clo-sure of the “Tunnel du Mont Blanc” in the Chamonix val-ley for nearly 3 years after a large accident in March 1999.Consequently, most heavy-duty traffic in the area was takingplace through the “Tunnel du Frejus”, in the Maurienne val-ley. This traffic was as large as that expected for 2010 (in2001, an average of 7428 vehicles per day, including 4244trucks). The general objectives of the POVA program are thecomparative studies of atmospheric pollution and the mod-eling of atmospheric emissions and transport in these twoFrench alpine valleys before and after the reopening of the“Tunnel du Mont Blanc” to heavy-duty traffic. The programincludes several field campaigns, associated with 3D model-ing (Brulfert et al., submitted, 20041). In this context, our
1Brulfert, G., Chemel, C., Chaxel, E., and Chollet, J. P.: Mod-elling photochemistry in alpine valleys, Atmos. Chem. Phys., sub-mitted, 2004.
© European Geosciences Union 2004
1168 N. Marchand et al.: Polycyclic aromatic hydrocarbons (PAHs)
specific objectives are to obtain a better knowledge of theparticulate pollution and to estimate the respective influencesof the main aerosol sources.
Investigations on the carbonaceous fraction of aerosols canyield information on their nature and sources. This fraction iscomposed of many compounds which constitute the organiccarbon (OC) and elemental carbon (EC) components (Pennerand Novakov, 1996). Within the organic carbon component,the Polycyclic Aromatic Hydrocarbons (PAHs) are prevalentconstituents of atmospheric pollution. Due to their low nat-ural emission (Dachs et al., 1996; Nikolaou et al., 1984),PAHs are good tracers of anthropogenic sources of input tothe atmosphere. They are mainly formed during incompletecombustion or pyrolysis of organic materials, including oilderivatives, coals, natural gas, biomass and household wastes(Besombes et al., 2001). In addition, because of their poten-tial carcinogenic effects (IARC 1983, 1987), PAHs are nowregarded as priority pollutants by both the United States En-vironmental Protection Agency and the European Environ-ment Agency.
In urban and near-city environments, the main PAHsources are vehicular emissions and domestic heating (Si-moneit, 2002; Nikolaou et al., 1984; Rogge et al., 1996;Li and Kamens, 1993), with the contribution of the latterincreasing significantly during winter (Schauer and Cass,2000; Carrichia et al., 1999; Pistikopoulos et al., 1990a;Nielsen, 1996). Studies of PAH chemical signatures havebeen performed for more than 30 years. Due to the largechanges in emission ratios and chemical profiles betweeneach of these sources, PAHs have tentatively been used fortheir discriminative and apportionment capability in air qual-ity studies (Khalili et al., 1995; Li and Kamens, 1993; Pis-tikopoulos et al., 1990a; Nielsen, 1996; Aceves and Grimalt,1993; Harrison et al., 1996, Kavouras et al., 2001). However,great variability is observed in the emission ratios of PAHs(see Sect. 3). Therefore, it is generally difficult to quantifythe impact of several sources based only on PAHs. Our studytakes place in a simpler context, with fewer source types thanthose found in the urban environment. It is therefore inter-esting to evaluate our ability to resolve these sources in thevalleys with PAH profiles.
As part of the POVA program, two intensive field cam-paigns were performed in the summer of 2000 and the win-ter of 2001. After summarizing our current knowledge ofPAH emissions from anthropogenic sources, we discuss ourresults in terms of comparisons of concentrations and PAHprofiles between seasons and valleys. The first objective ofour study is to describe the relations between PAH concentra-tions, external parameters (sampling site localization, mete-orological parameters, sources), and aerosol characteristics,including its carbonaceous fraction (OC and EC). The sec-ond objective is to study the capacity of PAH profiles to ac-curately discriminate sources.
2 Experimental section
2.1 Sampling campaigns and sampling sites
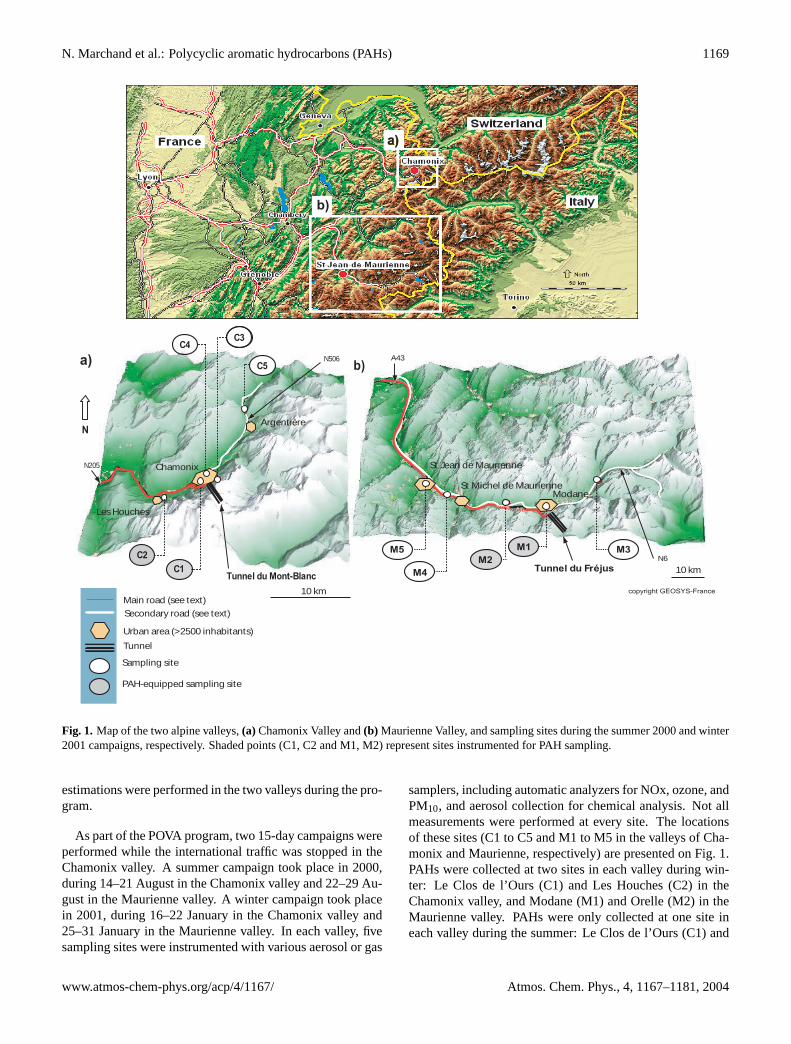
Figure 1 presents the morphology of the two valleys investi-gated. The Chamonix valley, about 17 km in length, is sur-rounded by mountains reaching between 3000 and 4800 mabove sea level (m a.s.l.). It is characterized by some of thesteepest slopes in the Alps. The valley floor, oriented SW-NE and at about 1000 m a.s.l., is very narrow and seldomexceeds a width of 1.5 km. The Maurienne valley is muchlonger (roughly 130 km) and wider (up to several km at someplaces). The narrowest part (less than 1 km) is located inthe Orelle pass (M2). The surrounding peaks vary between2500 and 3800 m a.s.l., and the valley floor increases from555 m a.s.l. (in Saint Jean de Maurienne, M5) to 1373 m a.s.l.(in Sollieres, M3). The lower section of the valley, from thebeginning of the valley to Orelle, has an approximate NW-SE orientation. A second section, from Orelle (M2) to theupper part of the valley, possesses an approximate SW-NEorientation.
The two valleys are among the most important Europeannorth-south routes across the Alps. Each valley allows a di-rect connection between France and Italy via highways intheir respective tunnels. Since the closure of “Tunnel duMont-Blanc”, the traffic in the Chamonix valley is essentiallylinked to local and tourism activities, with most of the trafficrepresented by personal vehicles (on average, only 2% of thetraffic consists of tourism buses and light-duty trucks for lo-cal delivery).The average traffic density was about 13 300 ve-hicles per day (veh.d−1) during the period June 2000–April2002, with a maximum of about 30 000 veh.d−1 during Au-gust on National Road 205 (N205). The weekly traffic alsoshowed a slight maximum on Saturday, corresponding to el-evated tourist activity. It should be noted that 50.1% of per-sonal vehicles are using diesel fuel in France (estimate de-rived for the year 2000).
In the Maurienne valley, the traffic is distributed on amain road (N6) and the highway (A43). The personal ve-hicle traffic was of the order of 6000 veh.d−1 during ourstudy, with a small maximum on weekends. The heavy-duty traffic essentially takes place on the highway, with anaverage of about 3000 trucks.d−1. It reaches a maximumon Wednesdays (6000 trucks.d−1), with a minimum on Sun-days (<1000 trucks.d−1). Industrial activities are only tak-ing place in the Maurienne valley, with some chemical andmetallurgic plants located near the main towns in the valley(Saint Jean (site M5) and Saint Michel de Maurienne).
In alpine valleys, wood-burning sources are potentially im-portant. On a regional scale (Region Rhones-Alpes), woodburning represents 20% of the total energy used for indi-vidual heating (value derived for the year 1996). The con-tribution of wood burning can be considered more impor-tant in the valleys because of specific climactic conditions,traditions, and tourist activities. Nevertheless, no precise
Atmos. Chem. Phys., 4, 1167–1181, 2004 www.atmos-chem-phys.org/acp/4/1167/
N. Marchand et al.: Polycyclic aromatic hydrocarbons (PAHs) 1169
C2C1
N
Tunnel du Mont-Blanc
C4
C5
C3
a)
N205
N506
M2Tunnel du Fréjus
M3
M4
M5 M1
St Michel de Maurienne
A43
N6
copyright GEOSYS-France
b)
a)
b)
Chamonix
Les Houches
Argentière
Modane
St Jean de Maurienne
Main road (see text)
Secondary road (see text)
Urban area (>2500 inhabitants)
Tunnel
Sampling site
PAH-equipped sampling site
10 km
10 km
Fig. 1. Map of the two alpine valleys,(a) Chamonix Valley and(b) Maurienne Valley, and sampling sites during the summer 2000 and winter2001 campaigns, respectively. Shaded points (C1, C2 and M1, M2) represent sites instrumented for PAH sampling.
estimations were performed in the two valleys during the pro-gram.
As part of the POVA program, two 15-day campaigns wereperformed while the international traffic was stopped in theChamonix valley. A summer campaign took place in 2000,during 14–21 August in the Chamonix valley and 22–29 Au-gust in the Maurienne valley. A winter campaign took placein 2001, during 16–22 January in the Chamonix valley and25–31 January in the Maurienne valley. In each valley, fivesampling sites were instrumented with various aerosol or gas
samplers, including automatic analyzers for NOx, ozone, andPM10, and aerosol collection for chemical analysis. Not allmeasurements were performed at every site. The locationsof these sites (C1 to C5 and M1 to M5 in the valleys of Cha-monix and Maurienne, respectively) are presented on Fig. 1.PAHs were collected at two sites in each valley during win-ter: Le Clos de l’Ours (C1) and Les Houches (C2) in theChamonix valley, and Modane (M1) and Orelle (M2) in theMaurienne valley. PAHs were only collected at one site ineach valley during the summer: Le Clos de l’Ours (C1) and
www.atmos-chem-phys.org/acp/4/1167/ Atmos. Chem. Phys., 4, 1167–1181, 2004
1170 N. Marchand et al.: Polycyclic aromatic hydrocarbons (PAHs)
Modane (M1). Sampling sites can be described using criteriaproposed by the European Environmental Agency (Larssenet al., 1999). According to these criteria, we can classifyC1 and M1 as Urban Background sites (<2500 vehicles/daywithin 50 m), and C2 and M2 as Near City Background sites(distance from large pollution sources: 3–10 km).
2.2 Sample collection and analysis
The sampling and analytical procedures for the determina-tion of PAH atmospheric concentrations are described in de-tail by Besombes et al. (2001). Briefly, airborne particu-lates were collected by high-volume samplers (50 m3.h−1
on average) on pre-cleaned glass fiber filters (GF/F What-mann filter, 210×270 mm). Sampling duration at all siteswas 24 h (starting at 08:00 h local) during the summer cam-paign, and 12:00 h (starting at 08:00 h and 20:00 h local,respectively) during the winter campaign. After collection,filters were stored at a low temperature (−4◦C) in aluminumsheets sealed in polyethylene bags, until analysis.
Samples were subjected to soxhlet extraction for 3 h(BUCHI B-811) with a mixture of dichloromethane andcyclohexane (2/1 v/v). PAH analyses were performedby reversed-phase high-performance liquid chromatogra-phy on a Vydac C18 column (length 25 cm, granulom-etry 5µm, and internal diameter 4.5 mm) with a ternaryelution gradient (methanol, water acetonitrile). All sol-vents were degassed using helium sparging to eliminatepossible oxygen quenching during fluorescence. PAHswere identified and quantified by UV fluorescence atvariable excitation and emission wavelengths. Withthis method, the following 11 PAHs were determinedquantitatively: fluoranthene (FLA), pyrene (PYR), chry-sene (CHR), benzo[a]anthracene (BaA), benzo(e)pyrene(BeP), benzo[b]fluoranthene (BbF), benzo[k]fluoranthene(BkF), benzo[a]pyrene (BaP), benzo[ghi]perylene (BghiP),indeno(1,2,3-cd)pyrene (IP), and coronene (COR). Overallanalytical and sampling errors were estimated between 18and 41%, depending on the PAH considered (Marchand,2003).
Measurements for NOx (Thermo Environmental Instru-ments 42C) and PM10 (TEOM1400A, R and P) were con-ducted on a 15 min basis at the same sites. Parallel samplingfor EC and OC analysis were conducted with open-face fil-ters on a 4 or 6-h basis, according to the site and the sea-son. We used QMA quartz filters (47 mm) pre-fired for 1 hat 800◦C in order to lower the blank levels. Filters were keptand transported by packs of 20 in leak-proof glass jars be-fore sampling. After sampling, they were stored at−18◦Cin individual Petri slides wrapped in aluminum foil in sealedbags, until analysis. Analyses for OC and EC took place atINW, Gent, Belgium, using a thermo-optical method on aSunset Lab analyzer (Birch and Carry, 1996). The tempera-ture ramp uses four steps up to 870◦C under pure helium forthe quantification of OC, and four steps up to 900◦C with a
mixture of 98% He+2% O2 for that of EC. Arithmetic meanswere used to calculate 12 or 24 h average concentrations forthe same time steps as the PAH samplings.
3 A short review of studies on particulate PAH emis-sions
There is a large amount of literature dealing with emissionsof PAH by various anthropogenic combustion sources. Asmentioned previously, residential heating with wood fires, aswell as vehicular emissions, are considered the main sourcesof PAHs in urban and near-city environments. Table 1 sum-marizes some of the emission rates of total particulate PAHpresented in published studies. Calculations of total particu-late PAH emission rates have been made of the basis of thefollowing 11 PAHs: FLA, PYR, BaA, CHR, BeP, BbF, BkF,BaP, BghiP, IP and COR.
Wood combustion, as a domestic heating source, plays asignificant role in contributing to organic carbon (OC) emis-sions. Schauer et al. (1996) and Schauer and Cass (2000)calculated that an urban environment in Los Angeles experi-enced an annual average contribution by wood combustion toambient OC in a range between 5 and 22% (year 1982), withmaxima between 30 and 65% during winter months (resultsfor the year 1996). With a PAH/OC ratio higher in emissionsresulting from wood combustion than those from vehicularemissions (Table 1), wood combustion in residential areascan represent one of the most significant PAH sources (Liand Kamens, 1993). This is corroborated by very high PAHemission rates (ranging between 4 and 14 mg kg−1 of burnedwood), being 1 to 3 orders of magnitude larger than those cal-culated from vehicular emissions (Table 1). The latter emis-sion rates are estimated between 0.01 and 0.07 mg kg−1 forrecent gasoline-powered light vehicles, and between 0.25 and1.4 mg kg−1 for heavy-duty trucks.
The large standard deviations with these values make itvery difficult to obtain precise estimates of emission rates,due mainly to the large number of parameters influencingsuch estimates. In the case of vehicular emissions, the mostimportant parameter influencing the variability of emissionrates is the engine temperature. Indeed, Combet et al. (1993)highlighted a PAH emission that was 20 times larger dur-ing a cold start than during warm use, for gasoline-poweredlight vehicles (average of 10 vehicles on a slow urban cy-cle). This difference between cold start and warm use alsoexists for diesel vehicles, but to a lesser extent (with a factorof 1.5 only, for an average of 20 vehicles). Fabrication year,as well as mean velocity, also has a significant influence onPAH emission rates (Combet et al., 1993). The use of a cat-alytic converter decreases the quantities of emitted PAH bya factor ranging between 20 and 1000 (Schauer et al., 2002;Rogge et al., 1993; Paturel et al., 1996). Finally, the com-position of the fuel, especially its concentration of PAH, alsoinfluences the quantities emitted into the atmosphere (Marr
Atmos. Chem. Phys., 4, 1167–1181, 2004 www.atmos-chem-phys.org/acp/4/1167/
N. Marchand et al.: Polycyclic aromatic hydrocarbons (PAHs) 1171
Table 1. Emission rates of PAH [µg.kg−1] for different sources.
PAH (6)a Emission rate 6/OC Observations Reference(µg.kg−1) (‰)
Vehicular sourcesGasolineCatalysed-equipped light vehicles 8.1‡ (0.7)b 0.02 Average of 9 vehicles (1986–1994)d,e Schauer et al. (2002)Catalysed-equipped light vehicles 350 (26)c 2.8 Average of 7 vehicles (1977–1983)d,e Rogge et al. (1993)Light vehicles 72.5† – Calculated from tunnel measurements (San Francisco) Miguel et al. (1998)
DieselHeavy-duty trucks 240 (60.2)b 0.5 Average of 2 heavy-duty trucks (1987)d,e Rogge et al. (1993)Heavy-duty trucks 1403† – Calculated from tunnel measurements (San Francisco) Miguel et al. (1998)
Wood combustion in residential fireplaces13 700‡ 2.5 Pine Schauer et al. (2001)6900‡ – Pine Rogge et al. (1998)5000‡ 1.7 Oak Schauer et al. (2001)4900‡ - Oak Rogge et al. (1998)3700‡ 1 Eucalyptus Schauer et al. (2001)
Coal 950.103 82 Average of 4 coal ranks Oros and Simoneit (2000)a: Total concentration of the following 11 PAHs in the particulate phase (6): FLA. PYR. BaA. CHR. BeP. BbF. BkF. BaP. BghiP. IP. COR;‡: 6 without COR;†: 6 without COR and BeP;b: Values in parentheses refer toµg.km−1 emission rates reported by authors; conversion intoµg.kg−1 is carried out while considering arespective density of gasoline and diesel of 743 and 830 g.L−1 (Miguel et al., 1998). The fuel consumption taken into account is 8.5 km.L−1
for gasoline-powered light vehicles (Miguel et al., 1998) and 12 km.L−1 for heavy-duty trucks (Rogge et al., 1993);c: conversion intoµg.kg−1 is carried out while considering a fuel density of 743 g.L−1 and a fuel consumption of 9.9 km.L−1 (Rogge et al.,1993)d: Vehicles year of fabrication;e: FTP ( Federal Test Procedure) procedure: urban cycle.
et al., 1999; Mi et al., 1998; Rogge et al., 1993). Marr etal. (1999) highlighted a strong correlation between chemicalcomposition and PAH emission rates for gasoline-poweredlight vehicles, underlining the importance of unburned fuelas a significant PAH source. For diesel vehicles, the com-position of the engine oil seems to be the important factorinfluencing PAH emissions (Schauer et al., 2002).
In the case of residential heating, combustion conditions(temperature, moisture, availability of oxygen) largely influ-ence emission rates, as does the nature of the fuel (wood type,presence of foliage)(Standley and Simoneit, 1987; Jenkins etal., 1996). Jenkins et al. (1996) report that smoldering com-bustions emit 4–5 times more PAHs that flaming combus-tions.
With the entire range of PAHs being emitted more or lessby each type of source, many studies over the last 30 yearsfocused on the determination of PAH chemical profiles asfingerprints of such sources (Li and Kamens, 1993). Thesestudies resulted in many observations in which emission ra-tios were considered source-specific.
First of all, gasoline vehicular emissions are characterizedby PAHs with higher molecular weight than those measured
in diesel exhaust. This is particularly the case for BghiPand COR (Rogge et al., 1993; Miguel et al., 1998; Migueland Pereira, 1989), and seems to be correlated with engineoperating temperatures (Rogge et al., 1993; Combet et al.,1993; Schauer et al., 2002). Combet et al. (1993) showedthat BghiP emission rates were approximately 55% higherduring warm driving cycles than during cold driving cycles.The same result is obtained for IP, but to a lesser extent (in-crease of 25% only). These results are also in line with thestudy of Marr et al. (1999), which showed a direct correlationbetween fuel and exhaust compositions for gasoline vehicles.In this study, only BghiP showed emission rates that wereclearly higher than those extrapolated from the fuel composi-tion. This result suggests pyrosynthetic formation processeswithin the engine, processes that require high temperatures(Marr et al., 1999; Combet et al., 1993). Thus, gasolineemissions can be characterized by an abundance of BghiPand COR (Nielsen, 1996; Li and Kamens, 1993; Rogge etal., 1993).
Marr et al. (1999) did not demonstrate any correlationbetween fuel and exhaust compositions for diesel vehicles.This suggests the importance of unburned lubricating oil
www.atmos-chem-phys.org/acp/4/1167/ Atmos. Chem. Phys., 4, 1167–1181, 2004
1172 N. Marchand et al.: Polycyclic aromatic hydrocarbons (PAHs)
-10 -8 -6 -4 -2 0 2 410
20
30
40
50
60
70
FLA+PYR
%
T (˚C)
-10 -8 -6 -4 -2 0 2 4
5
10
15
20
25
30
%
T (˚C)
CHR BaA
a
b
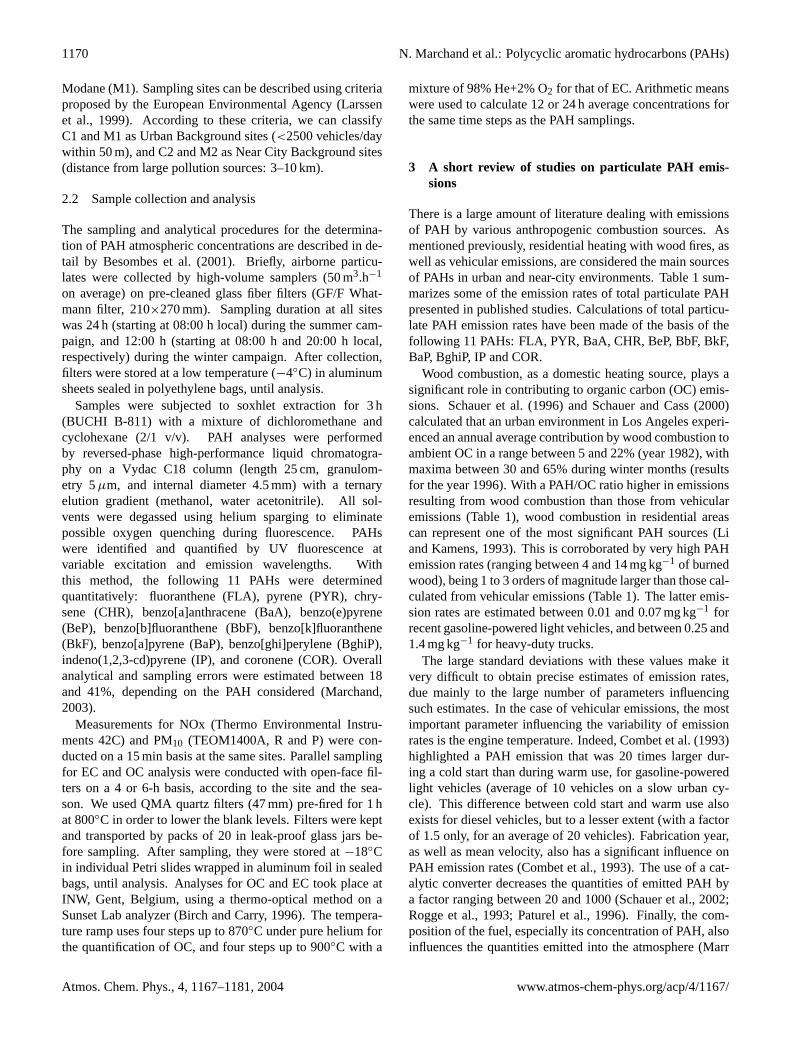
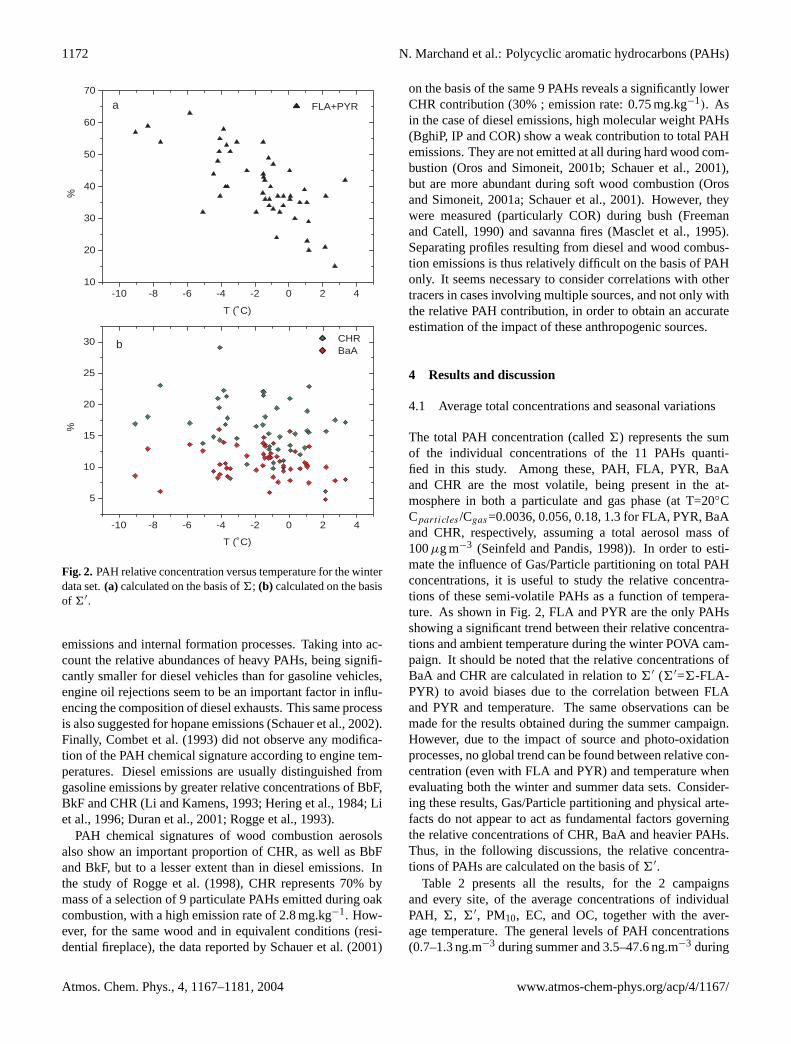
Fig. 2. PAH relative concentration versus temperature for the winterdata set.(a) calculated on the basis of6; (b) calculated on the basisof 6′.
emissions and internal formation processes. Taking into ac-count the relative abundances of heavy PAHs, being signifi-cantly smaller for diesel vehicles than for gasoline vehicles,engine oil rejections seem to be an important factor in influ-encing the composition of diesel exhausts. This same processis also suggested for hopane emissions (Schauer et al., 2002).Finally, Combet et al. (1993) did not observe any modifica-tion of the PAH chemical signature according to engine tem-peratures. Diesel emissions are usually distinguished fromgasoline emissions by greater relative concentrations of BbF,BkF and CHR (Li and Kamens, 1993; Hering et al., 1984; Liet al., 1996; Duran et al., 2001; Rogge et al., 1993).
PAH chemical signatures of wood combustion aerosolsalso show an important proportion of CHR, as well as BbFand BkF, but to a lesser extent than in diesel emissions. Inthe study of Rogge et al. (1998), CHR represents 70% bymass of a selection of 9 particulate PAHs emitted during oakcombustion, with a high emission rate of 2.8 mg.kg−1. How-ever, for the same wood and in equivalent conditions (resi-dential fireplace), the data reported by Schauer et al. (2001)
on the basis of the same 9 PAHs reveals a significantly lowerCHR contribution (30% ; emission rate: 0.75 mg.kg−1). Asin the case of diesel emissions, high molecular weight PAHs(BghiP, IP and COR) show a weak contribution to total PAHemissions. They are not emitted at all during hard wood com-bustion (Oros and Simoneit, 2001b; Schauer et al., 2001),but are more abundant during soft wood combustion (Orosand Simoneit, 2001a; Schauer et al., 2001). However, theywere measured (particularly COR) during bush (Freemanand Catell, 1990) and savanna fires (Masclet et al., 1995).Separating profiles resulting from diesel and wood combus-tion emissions is thus relatively difficult on the basis of PAHonly. It seems necessary to consider correlations with othertracers in cases involving multiple sources, and not only withthe relative PAH contribution, in order to obtain an accurateestimation of the impact of these anthropogenic sources.
4 Results and discussion
4.1 Average total concentrations and seasonal variations
The total PAH concentration (called6) represents the sumof the individual concentrations of the 11 PAHs quanti-fied in this study. Among these, PAH, FLA, PYR, BaAand CHR are the most volatile, being present in the at-mosphere in both a particulate and gas phase (at T=20◦CCparticles /Cgas=0.0036, 0.056, 0.18, 1.3 for FLA, PYR, BaAand CHR, respectively, assuming a total aerosol mass of100µg m−3 (Seinfeld and Pandis, 1998)). In order to esti-mate the influence of Gas/Particle partitioning on total PAHconcentrations, it is useful to study the relative concentra-tions of these semi-volatile PAHs as a function of tempera-ture. As shown in Fig. 2, FLA and PYR are the only PAHsshowing a significant trend between their relative concentra-tions and ambient temperature during the winter POVA cam-paign. It should be noted that the relative concentrations ofBaA and CHR are calculated in relation to6′ (6′=6-FLA-PYR) to avoid biases due to the correlation between FLAand PYR and temperature. The same observations can bemade for the results obtained during the summer campaign.However, due to the impact of source and photo-oxidationprocesses, no global trend can be found between relative con-centration (even with FLA and PYR) and temperature whenevaluating both the winter and summer data sets. Consider-ing these results, Gas/Particle partitioning and physical arte-facts do not appear to act as fundamental factors governingthe relative concentrations of CHR, BaA and heavier PAHs.Thus, in the following discussions, the relative concentra-tions of PAHs are calculated on the basis of6′.
Table 2 presents all the results, for the 2 campaignsand every site, of the average concentrations of individualPAH, 6, 6′, PM10, EC, and OC, together with the aver-age temperature. The general levels of PAH concentrations(0.7–1.3 ng.m−3 during summer and 3.5–47.6 ng.m−3 during
Atmos. Chem. Phys., 4, 1167–1181, 2004 www.atmos-chem-phys.org/acp/4/1167/
N. Marchand et al.: Polycyclic aromatic hydrocarbons (PAHs) 1173
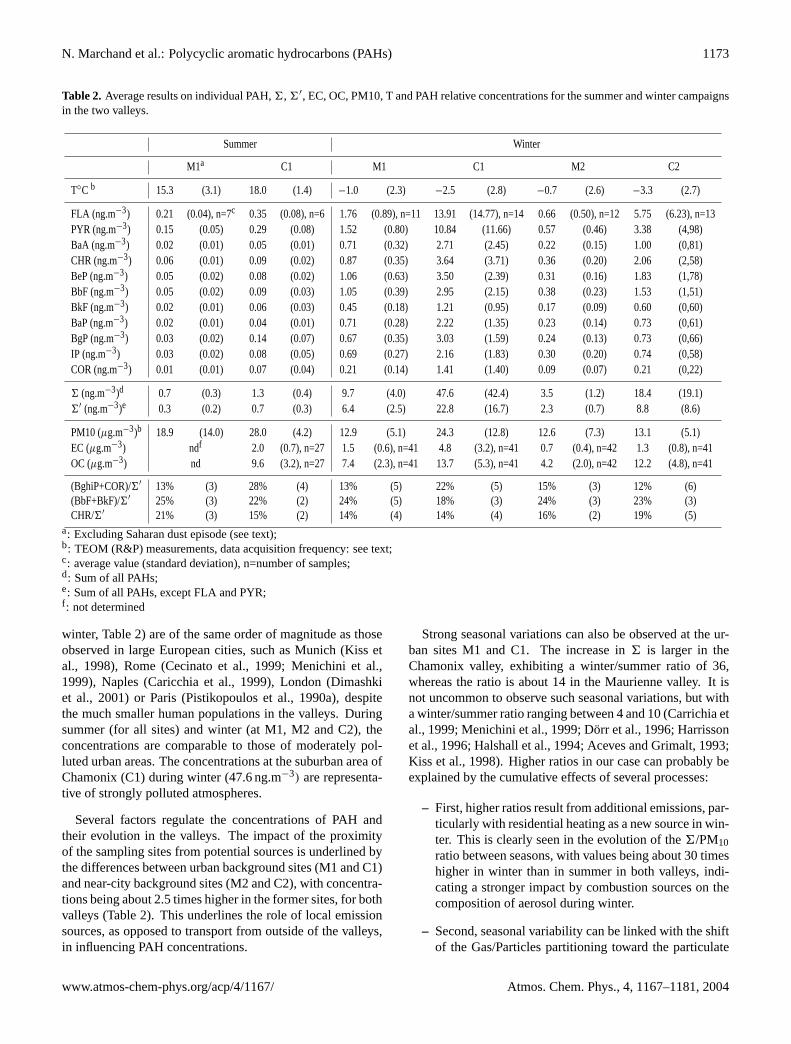
Table 2. Average results on individual PAH,6, 6′, EC, OC, PM10, T and PAH relative concentrations for the summer and winter campaignsin the two valleys.
Summer Winter
M1a C1 M1 C1 M2 C2
T◦C b 15.3 (3.1) 18.0 (1.4) −1.0 (2.3) −2.5 (2.8) −0.7 (2.6) −3.3 (2.7)
FLA (ng.m−3) 0.21 (0.04), n=7c 0.35 (0.08), n=6 1.76 (0.89), n=11 13.91 (14.77), n=14 0.66 (0.50), n=12 5.75 (6.23), n=13PYR (ng.m−3) 0.15 (0.05) 0.29 (0.08) 1.52 (0.80) 10.84 (11.66) 0.57 (0.46) 3.38 (4,98)BaA (ng.m−3) 0.02 (0.01) 0.05 (0.01) 0.71 (0.32) 2.71 (2.45) 0.22 (0.15) 1.00 (0,81)CHR (ng.m−3) 0.06 (0.01) 0.09 (0.02) 0.87 (0.35) 3.64 (3.71) 0.36 (0.20) 2.06 (2,58)BeP (ng.m−3) 0.05 (0.02) 0.08 (0.02) 1.06 (0.63) 3.50 (2.39) 0.31 (0.16) 1.83 (1,78)BbF (ng.m−3) 0.05 (0.02) 0.09 (0.03) 1.05 (0.39) 2.95 (2.15) 0.38 (0.23) 1.53 (1,51)BkF (ng.m−3) 0.02 (0.01) 0.06 (0.03) 0.45 (0.18) 1.21 (0.95) 0.17 (0.09) 0.60 (0,60)BaP (ng.m−3) 0.02 (0.01) 0.04 (0.01) 0.71 (0.28) 2.22 (1.35) 0.23 (0.14) 0.73 (0,61)BgP (ng.m−3) 0.03 (0.02) 0.14 (0.07) 0.67 (0.35) 3.03 (1.59) 0.24 (0.13) 0.73 (0,66)IP (ng.m−3) 0.03 (0.02) 0.08 (0.05) 0.69 (0.27) 2.16 (1.83) 0.30 (0.20) 0.74 (0,58)COR (ng.m−3) 0.01 (0.01) 0.07 (0.04) 0.21 (0.14) 1.41 (1.40) 0.09 (0.07) 0.21 (0,22)
6 (ng.m−3)d 0.7 (0.3) 1.3 (0.4) 9.7 (4.0) 47.6 (42.4) 3.5 (1.2) 18.4 (19.1)6′ (ng.m−3)e 0.3 (0.2) 0.7 (0.3) 6.4 (2.5) 22.8 (16.7) 2.3 (0.7) 8.8 (8.6)
PM10 (µg.m−3)b 18.9 (14.0) 28.0 (4.2) 12.9 (5.1) 24.3 (12.8) 12.6 (7.3) 13.1 (5.1)EC (µg.m−3) ndf 2.0 (0.7), n=27 1.5 (0.6), n=41 4.8 (3.2), n=41 0.7 (0.4), n=42 1.3 (0.8), n=41OC (µg.m−3) nd 9.6 (3.2), n=27 7.4 (2.3), n=41 13.7 (5.3), n=41 4.2 (2.0), n=42 12.2 (4.8), n=41
(BghiP+COR)/6′ 13% (3) 28% (4) 13% (5) 22% (5) 15% (3) 12% (6)(BbF+BkF)/6′ 25% (3) 22% (2) 24% (5) 18% (3) 24% (3) 23% (3)CHR/6′ 21% (3) 15% (2) 14% (4) 14% (4) 16% (2) 19% (5)
a: Excluding Saharan dust episode (see text);b: TEOM (R&P) measurements, data acquisition frequency: see text;c: average value (standard deviation), n=number of samples;d: Sum of all PAHs;e: Sum of all PAHs, except FLA and PYR;f : not determined
winter, Table 2) are of the same order of magnitude as thoseobserved in large European cities, such as Munich (Kiss etal., 1998), Rome (Cecinato et al., 1999; Menichini et al.,1999), Naples (Caricchia et al., 1999), London (Dimashkiet al., 2001) or Paris (Pistikopoulos et al., 1990a), despitethe much smaller human populations in the valleys. Duringsummer (for all sites) and winter (at M1, M2 and C2), theconcentrations are comparable to those of moderately pol-luted urban areas. The concentrations at the suburban area ofChamonix (C1) during winter (47.6 ng.m−3) are representa-tive of strongly polluted atmospheres.
Several factors regulate the concentrations of PAH andtheir evolution in the valleys. The impact of the proximityof the sampling sites from potential sources is underlined bythe differences between urban background sites (M1 and C1)and near-city background sites (M2 and C2), with concentra-tions being about 2.5 times higher in the former sites, for bothvalleys (Table 2). This underlines the role of local emissionsources, as opposed to transport from outside of the valleys,in influencing PAH concentrations.
Strong seasonal variations can also be observed at the ur-ban sites M1 and C1. The increase in6 is larger in theChamonix valley, exhibiting a winter/summer ratio of 36,whereas the ratio is about 14 in the Maurienne valley. It isnot uncommon to observe such seasonal variations, but witha winter/summer ratio ranging between 4 and 10 (Carrichia etal., 1999; Menichini et al., 1999; Dorr et al., 1996; Harrissonet al., 1996; Halshall et al., 1994; Aceves and Grimalt, 1993;Kiss et al., 1998). Higher ratios in our case can probably beexplained by the cumulative effects of several processes:
– First, higher ratios result from additional emissions, par-ticularly with residential heating as a new source in win-ter. This is clearly seen in the evolution of the6/PM10ratio between seasons, with values being about 30 timeshigher in winter than in summer in both valleys, indi-cating a stronger impact by combustion sources on thecomposition of aerosol during winter.
– Second, seasonal variability can be linked with the shiftof the Gas/Particles partitioning toward the particulate
www.atmos-chem-phys.org/acp/4/1167/ Atmos. Chem. Phys., 4, 1167–1181, 2004
1174 N. Marchand et al.: Polycyclic aromatic hydrocarbons (PAHs)
0 10 20 30 40 504
6
8
10
12
14
%
O3 (ppbv)
% BaP Winter % BaP Summer
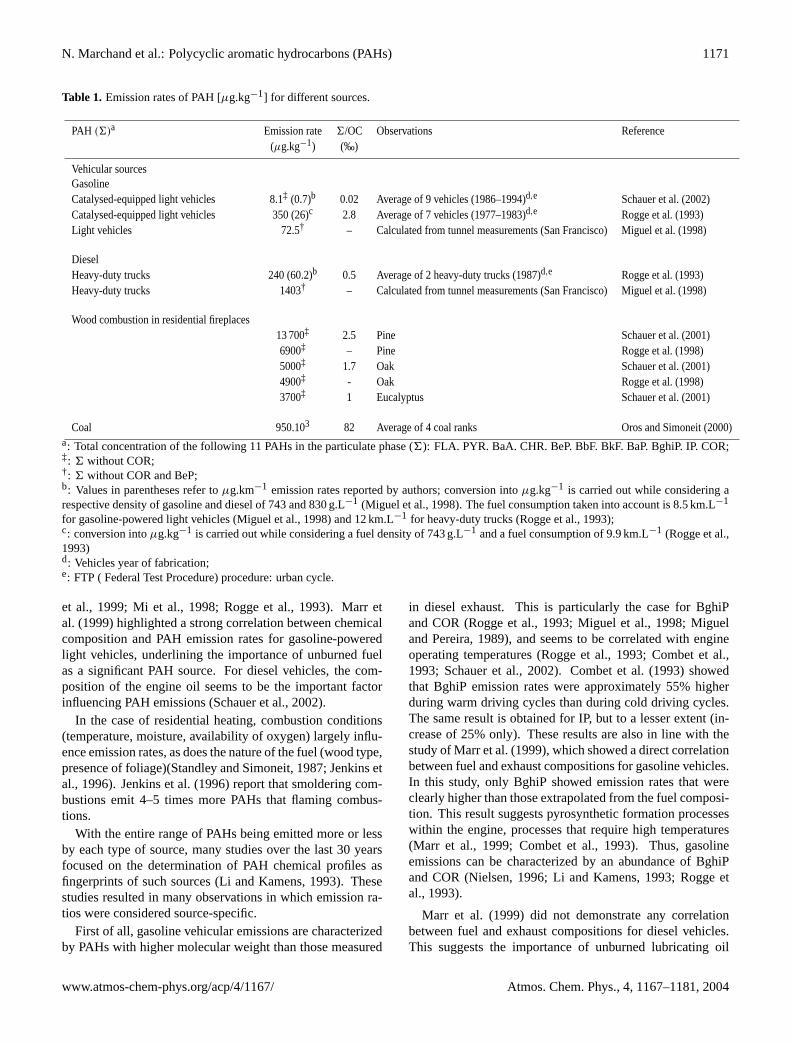
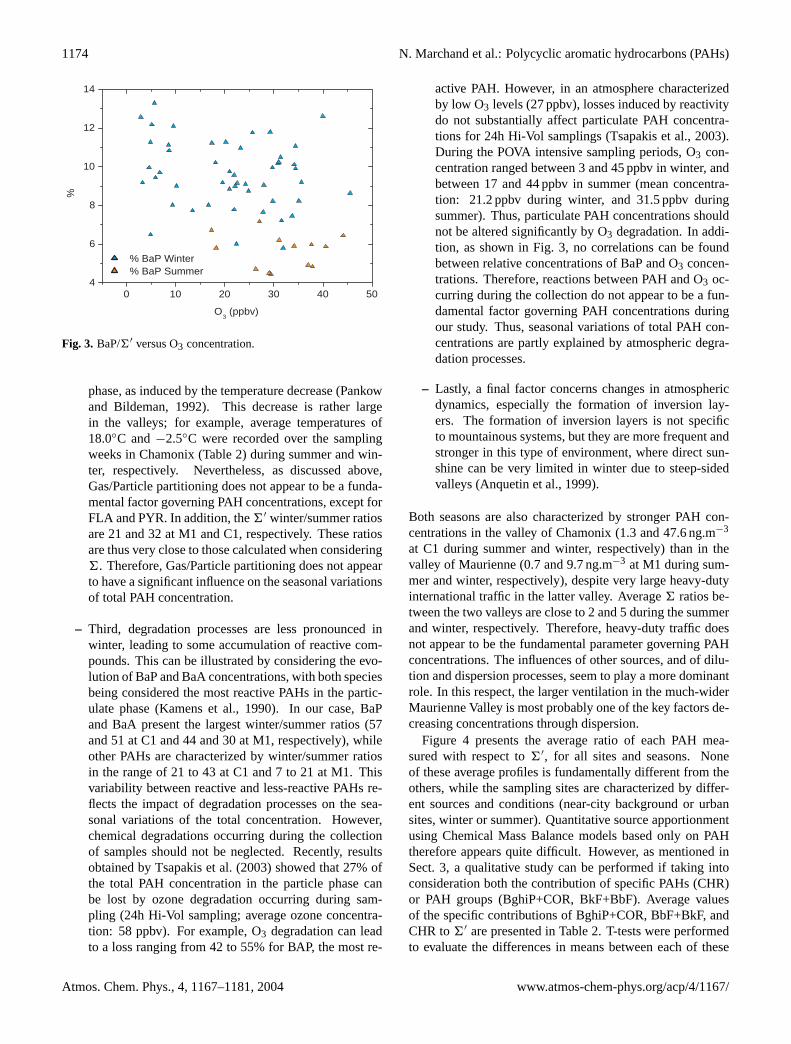
Fig. 3. BaP/6′ versus O3 concentration.
phase, as induced by the temperature decrease (Pankowand Bildeman, 1992). This decrease is rather largein the valleys; for example, average temperatures of18.0◦C and−2.5◦C were recorded over the samplingweeks in Chamonix (Table 2) during summer and win-ter, respectively. Nevertheless, as discussed above,Gas/Particle partitioning does not appear to be a funda-mental factor governing PAH concentrations, except forFLA and PYR. In addition, the6′ winter/summer ratiosare 21 and 32 at M1 and C1, respectively. These ratiosare thus very close to those calculated when considering6. Therefore, Gas/Particle partitioning does not appearto have a significant influence on the seasonal variationsof total PAH concentration.
– Third, degradation processes are less pronounced inwinter, leading to some accumulation of reactive com-pounds. This can be illustrated by considering the evo-lution of BaP and BaA concentrations, with both speciesbeing considered the most reactive PAHs in the partic-ulate phase (Kamens et al., 1990). In our case, BaPand BaA present the largest winter/summer ratios (57and 51 at C1 and 44 and 30 at M1, respectively), whileother PAHs are characterized by winter/summer ratiosin the range of 21 to 43 at C1 and 7 to 21 at M1. Thisvariability between reactive and less-reactive PAHs re-flects the impact of degradation processes on the sea-sonal variations of the total concentration. However,chemical degradations occurring during the collectionof samples should not be neglected. Recently, resultsobtained by Tsapakis et al. (2003) showed that 27% ofthe total PAH concentration in the particle phase canbe lost by ozone degradation occurring during sam-pling (24h Hi-Vol sampling; average ozone concentra-tion: 58 ppbv). For example, O3 degradation can leadto a loss ranging from 42 to 55% for BAP, the most re-
active PAH. However, in an atmosphere characterizedby low O3 levels (27 ppbv), losses induced by reactivitydo not substantially affect particulate PAH concentra-tions for 24h Hi-Vol samplings (Tsapakis et al., 2003).During the POVA intensive sampling periods, O3 con-centration ranged between 3 and 45 ppbv in winter, andbetween 17 and 44 ppbv in summer (mean concentra-tion: 21.2 ppbv during winter, and 31.5 ppbv duringsummer). Thus, particulate PAH concentrations shouldnot be altered significantly by O3 degradation. In addi-tion, as shown in Fig. 3, no correlations can be foundbetween relative concentrations of BaP and O3 concen-trations. Therefore, reactions between PAH and O3 oc-curring during the collection do not appear to be a fun-damental factor governing PAH concentrations duringour study. Thus, seasonal variations of total PAH con-centrations are partly explained by atmospheric degra-dation processes.
– Lastly, a final factor concerns changes in atmosphericdynamics, especially the formation of inversion lay-ers. The formation of inversion layers is not specificto mountainous systems, but they are more frequent andstronger in this type of environment, where direct sun-shine can be very limited in winter due to steep-sidedvalleys (Anquetin et al., 1999).
Both seasons are also characterized by stronger PAH con-centrations in the valley of Chamonix (1.3 and 47.6 ng.m−3
at C1 during summer and winter, respectively) than in thevalley of Maurienne (0.7 and 9.7 ng.m−3 at M1 during sum-mer and winter, respectively), despite very large heavy-dutyinternational traffic in the latter valley. Average6 ratios be-tween the two valleys are close to 2 and 5 during the summerand winter, respectively. Therefore, heavy-duty traffic doesnot appear to be the fundamental parameter governing PAHconcentrations. The influences of other sources, and of dilu-tion and dispersion processes, seem to play a more dominantrole. In this respect, the larger ventilation in the much-widerMaurienne Valley is most probably one of the key factors de-creasing concentrations through dispersion.
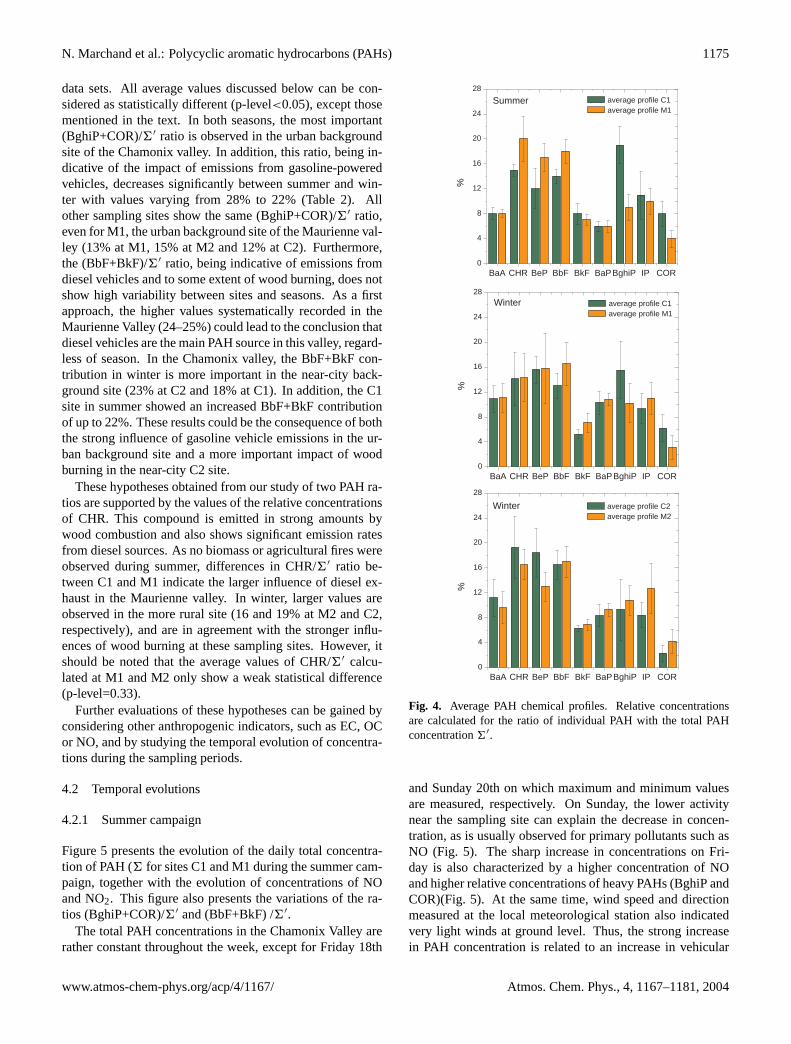
Figure 4 presents the average ratio of each PAH mea-sured with respect to6′, for all sites and seasons. Noneof these average profiles is fundamentally different from theothers, while the sampling sites are characterized by differ-ent sources and conditions (near-city background or urbansites, winter or summer). Quantitative source apportionmentusing Chemical Mass Balance models based only on PAHtherefore appears quite difficult. However, as mentioned inSect. 3, a qualitative study can be performed if taking intoconsideration both the contribution of specific PAHs (CHR)or PAH groups (BghiP+COR, BkF+BbF). Average valuesof the specific contributions of BghiP+COR, BbF+BkF, andCHR to6′ are presented in Table 2. T-tests were performedto evaluate the differences in means between each of these
Atmos. Chem. Phys., 4, 1167–1181, 2004 www.atmos-chem-phys.org/acp/4/1167/
N. Marchand et al.: Polycyclic aromatic hydrocarbons (PAHs) 1175
data sets. All average values discussed below can be con-sidered as statistically different (p-level<0.05), except thosementioned in the text. In both seasons, the most important(BghiP+COR)/6′ ratio is observed in the urban backgroundsite of the Chamonix valley. In addition, this ratio, being in-dicative of the impact of emissions from gasoline-poweredvehicles, decreases significantly between summer and win-ter with values varying from 28% to 22% (Table 2). Allother sampling sites show the same (BghiP+COR)/6′ ratio,even for M1, the urban background site of the Maurienne val-ley (13% at M1, 15% at M2 and 12% at C2). Furthermore,the (BbF+BkF)/6′ ratio, being indicative of emissions fromdiesel vehicles and to some extent of wood burning, does notshow high variability between sites and seasons. As a firstapproach, the higher values systematically recorded in theMaurienne Valley (24–25%) could lead to the conclusion thatdiesel vehicles are the main PAH source in this valley, regard-less of season. In the Chamonix valley, the BbF+BkF con-tribution in winter is more important in the near-city back-ground site (23% at C2 and 18% at C1). In addition, the C1site in summer showed an increased BbF+BkF contributionof up to 22%. These results could be the consequence of boththe strong influence of gasoline vehicle emissions in the ur-ban background site and a more important impact of woodburning in the near-city C2 site.
These hypotheses obtained from our study of two PAH ra-tios are supported by the values of the relative concentrationsof CHR. This compound is emitted in strong amounts bywood combustion and also shows significant emission ratesfrom diesel sources. As no biomass or agricultural fires wereobserved during summer, differences in CHR/6′ ratio be-tween C1 and M1 indicate the larger influence of diesel ex-haust in the Maurienne valley. In winter, larger values areobserved in the more rural site (16 and 19% at M2 and C2,respectively), and are in agreement with the stronger influ-ences of wood burning at these sampling sites. However, itshould be noted that the average values of CHR/6′ calcu-lated at M1 and M2 only show a weak statistical difference(p-level=0.33).
Further evaluations of these hypotheses can be gained byconsidering other anthropogenic indicators, such as EC, OCor NO, and by studying the temporal evolution of concentra-tions during the sampling periods.
4.2 Temporal evolutions
4.2.1 Summer campaign
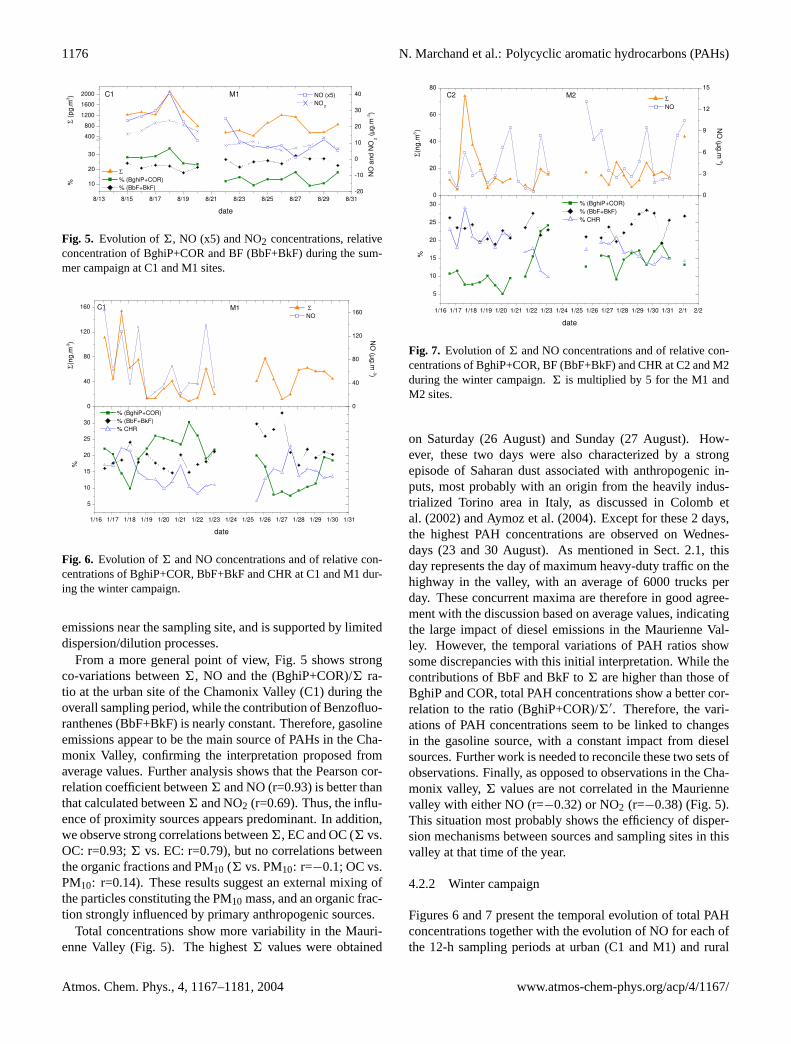
Figure 5 presents the evolution of the daily total concentra-tion of PAH (6 for sites C1 and M1 during the summer cam-paign, together with the evolution of concentrations of NOand NO2. This figure also presents the variations of the ra-tios (BghiP+COR)/6′ and (BbF+BkF) /6′.
The total PAH concentrations in the Chamonix Valley arerather constant throughout the week, except for Friday 18th
BaA CHR BeP BbF BkF BaPBghiP IP COR0
4
8
12
16
20
24
28
Summer
%
average profile C1 average profile M1
BaA CHR BeP BbF BkF BaPBghiP IP COR0
4
8
12
16
20
24
28
Winter
%
average profile C2 average profile M2
BaA CHR BeP BbF BkF BaPBghiP IP COR0
4
8
12
16
20
24
28
Winter
%
average profile C1 average profile M1
Fig. 4. Average PAH chemical profiles. Relative concentrationsare calculated for the ratio of individual PAH with the total PAHconcentration6′.
and Sunday 20th on which maximum and minimum valuesare measured, respectively. On Sunday, the lower activitynear the sampling site can explain the decrease in concen-tration, as is usually observed for primary pollutants such asNO (Fig. 5). The sharp increase in concentrations on Fri-day is also characterized by a higher concentration of NOand higher relative concentrations of heavy PAHs (BghiP andCOR)(Fig. 5). At the same time, wind speed and directionmeasured at the local meteorological station also indicatedvery light winds at ground level. Thus, the strong increasein PAH concentration is related to an increase in vehicular
www.atmos-chem-phys.org/acp/4/1167/ Atmos. Chem. Phys., 4, 1167–1181, 2004
1176 N. Marchand et al.: Polycyclic aromatic hydrocarbons (PAHs)
8/13 8/15 8/17 8/19 8/21 8/23 8/25 8/27 8/29 8/31
10
20
30
400
800
1200
1600
2000
-20
-10
0
10
20
30
40M1C1
%
Σ (
pg
.m-3)
date
Σ
% (BghiP+COR)
% (BbF+BkF)
NO
an
d N
O2 (
µg
.m-3)
NO (x5)
NO2
Fig. 5. Evolution of6, NO (x5) and NO2 concentrations, relativeconcentration of BghiP+COR and BF (BbF+BkF) during the sum-mer campaign at C1 and M1 sites.
0
40
80
120
160
C1 M1
Σ
(ng.m
-3)
Σ
NO
0
40
80
120
160
NO
(µg.m
-3)
1/16 1/17 1/18 1/19 1/20 1/21 1/22 1/23 1/24 1/25 1/26 1/27 1/28 1/29 1/30 1/31
5
10
15
20
25
30
%
date
% (BghiP+COR)
% (BbF+BkF)
% CHR
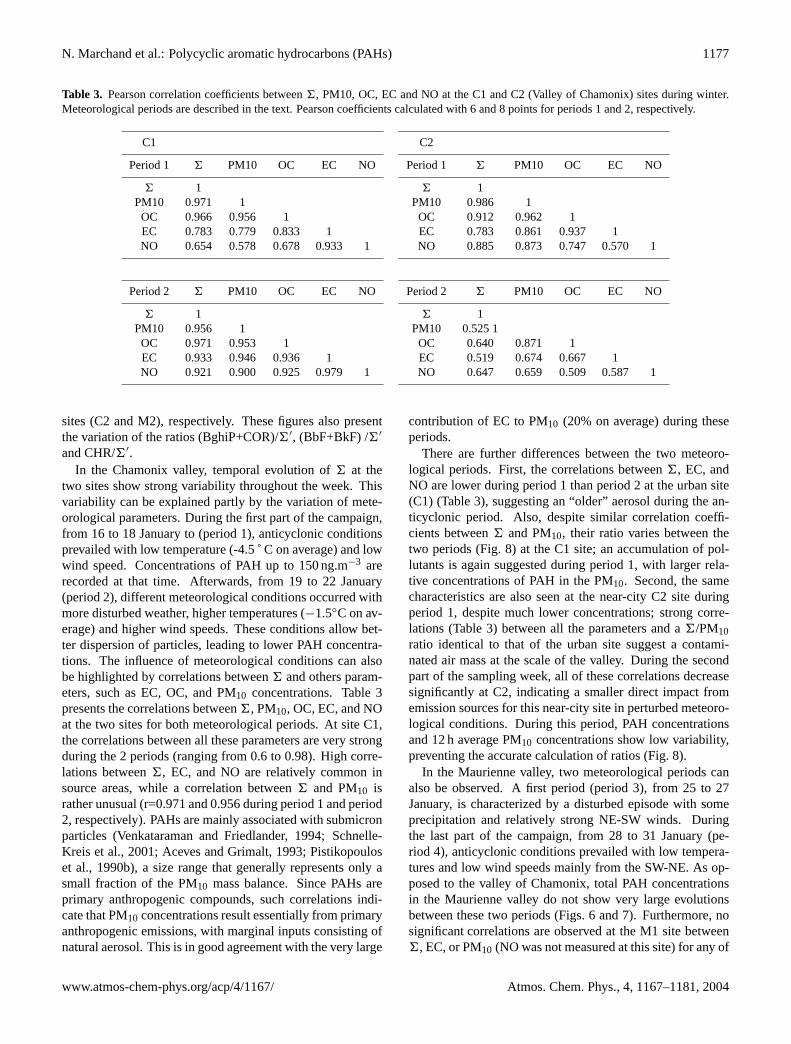
Fig. 6. Evolution of6 and NO concentrations and of relative con-centrations of BghiP+COR, BbF+BkF and CHR at C1 and M1 dur-ing the winter campaign.
emissions near the sampling site, and is supported by limiteddispersion/dilution processes.
From a more general point of view, Fig. 5 shows strongco-variations between6, NO and the (BghiP+COR)/6 ra-tio at the urban site of the Chamonix Valley (C1) during theoverall sampling period, while the contribution of Benzofluo-ranthenes (BbF+BkF) is nearly constant. Therefore, gasolineemissions appear to be the main source of PAHs in the Cha-monix Valley, confirming the interpretation proposed fromaverage values. Further analysis shows that the Pearson cor-relation coefficient between6 and NO (r=0.93) is better thanthat calculated between6 and NO2 (r=0.69). Thus, the influ-ence of proximity sources appears predominant. In addition,we observe strong correlations between6, EC and OC (6 vs.OC: r=0.93;6 vs. EC: r=0.79), but no correlations betweenthe organic fractions and PM10 (6 vs. PM10: r=−0.1; OC vs.PM10: r=0.14). These results suggest an external mixing ofthe particles constituting the PM10 mass, and an organic frac-tion strongly influenced by primary anthropogenic sources.
Total concentrations show more variability in the Mauri-enne Valley (Fig. 5). The highest6 values were obtained
0
20
40
60
80
M2C2
Σ
NO
Σ
(ng
.m-3
)
0
3
6
9
12
15
NO
(µg
.m-3)
1/16 1/17 1/18 1/19 1/20 1/21 1/22 1/23 1/24 1/25 1/26 1/27 1/28 1/29 1/30 1/31 2/1 2/2
5
10
15
20
25
30
%
date
% (BghiP+COR)
% (BbF+BkF)
% CHR
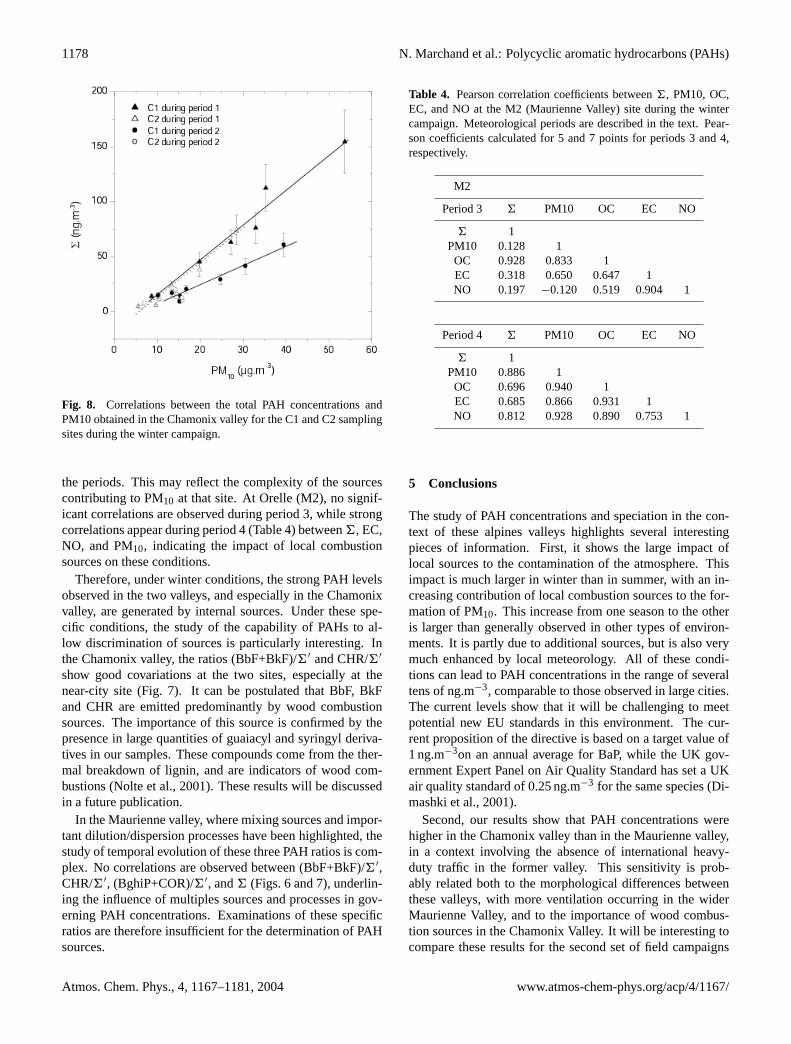
Fig. 7. Evolution of6 and NO concentrations and of relative con-centrations of BghiP+COR, BF (BbF+BkF) and CHR at C2 and M2during the winter campaign.6 is multiplied by 5 for the M1 andM2 sites.
on Saturday (26 August) and Sunday (27 August). How-ever, these two days were also characterized by a strongepisode of Saharan dust associated with anthropogenic in-puts, most probably with an origin from the heavily indus-trialized Torino area in Italy, as discussed in Colomb etal. (2002) and Aymoz et al. (2004). Except for these 2 days,the highest PAH concentrations are observed on Wednes-days (23 and 30 August). As mentioned in Sect. 2.1, thisday represents the day of maximum heavy-duty traffic on thehighway in the valley, with an average of 6000 trucks perday. These concurrent maxima are therefore in good agree-ment with the discussion based on average values, indicatingthe large impact of diesel emissions in the Maurienne Val-ley. However, the temporal variations of PAH ratios showsome discrepancies with this initial interpretation. While thecontributions of BbF and BkF to6 are higher than those ofBghiP and COR, total PAH concentrations show a better cor-relation to the ratio (BghiP+COR)/6′. Therefore, the vari-ations of PAH concentrations seem to be linked to changesin the gasoline source, with a constant impact from dieselsources. Further work is needed to reconcile these two sets ofobservations. Finally, as opposed to observations in the Cha-monix valley,6 values are not correlated in the Mauriennevalley with either NO (r=−0.32) or NO2 (r=−0.38) (Fig. 5).This situation most probably shows the efficiency of disper-sion mechanisms between sources and sampling sites in thisvalley at that time of the year.
4.2.2 Winter campaign
Figures 6 and 7 present the temporal evolution of total PAHconcentrations together with the evolution of NO for each ofthe 12-h sampling periods at urban (C1 and M1) and rural
Atmos. Chem. Phys., 4, 1167–1181, 2004 www.atmos-chem-phys.org/acp/4/1167/
N. Marchand et al.: Polycyclic aromatic hydrocarbons (PAHs) 1177
Table 3. Pearson correlation coefficients between6, PM10, OC, EC and NO at the C1 and C2 (Valley of Chamonix) sites during winter.Meteorological periods are described in the text. Pearson coefficients calculated with 6 and 8 points for periods 1 and 2, respectively.
C1
Period 1 6 PM10 OC EC NO
6 1PM10 0.971 1OC 0.966 0.956 1EC 0.783 0.779 0.833 1NO 0.654 0.578 0.678 0.933 1
Period 2 6 PM10 OC EC NO
6 1PM10 0.956 1OC 0.971 0.953 1EC 0.933 0.946 0.936 1NO 0.921 0.900 0.925 0.979 1
C2
Period 1 6 PM10 OC EC NO
6 1PM10 0.986 1OC 0.912 0.962 1EC 0.783 0.861 0.937 1NO 0.885 0.873 0.747 0.570 1
Period 2 6 PM10 OC EC NO
6 1PM10 0.525 1OC 0.640 0.871 1EC 0.519 0.674 0.667 1NO 0.647 0.659 0.509 0.587 1
sites (C2 and M2), respectively. These figures also presentthe variation of the ratios (BghiP+COR)/6′, (BbF+BkF) /6′
and CHR/6′.In the Chamonix valley, temporal evolution of6 at the
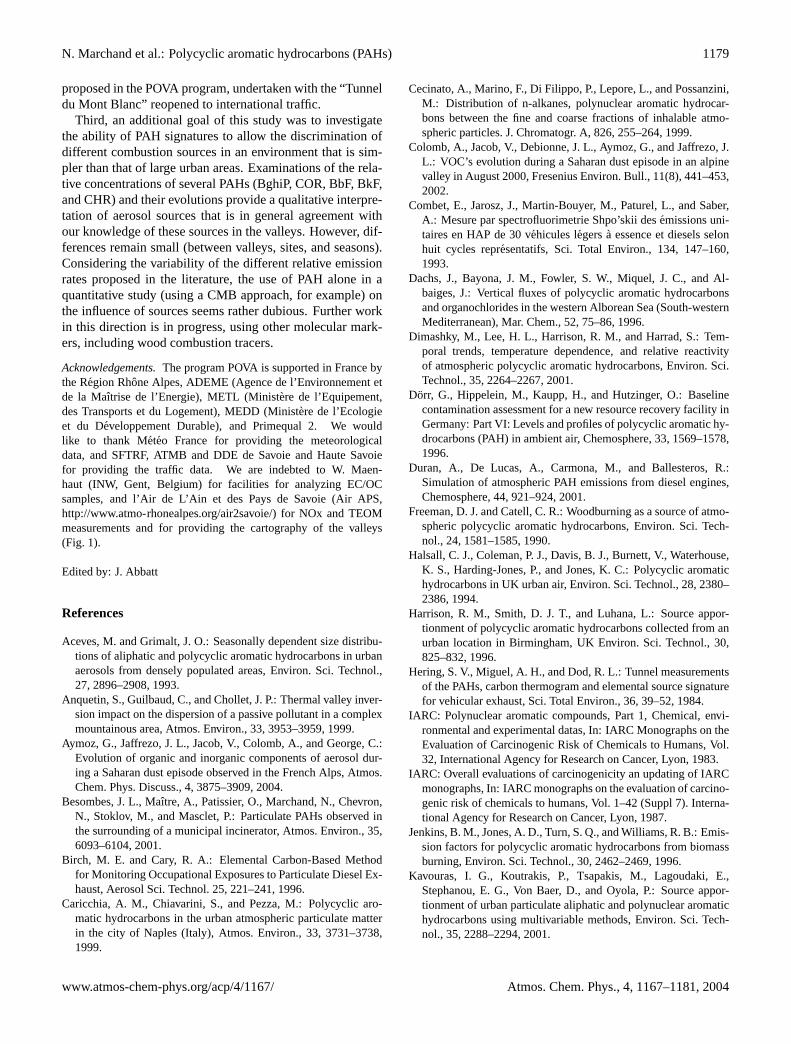
two sites show strong variability throughout the week. Thisvariability can be explained partly by the variation of mete-orological parameters. During the first part of the campaign,from 16 to 18 January to (period 1), anticyclonic conditionsprevailed with low temperature (-4.5 ˚ C on average) and lowwind speed. Concentrations of PAH up to 150 ng.m−3 arerecorded at that time. Afterwards, from 19 to 22 January(period 2), different meteorological conditions occurred withmore disturbed weather, higher temperatures (−1.5◦C on av-erage) and higher wind speeds. These conditions allow bet-ter dispersion of particles, leading to lower PAH concentra-tions. The influence of meteorological conditions can alsobe highlighted by correlations between6 and others param-eters, such as EC, OC, and PM10 concentrations. Table 3presents the correlations between6, PM10, OC, EC, and NOat the two sites for both meteorological periods. At site C1,the correlations between all these parameters are very strongduring the 2 periods (ranging from 0.6 to 0.98). High corre-lations between6, EC, and NO are relatively common insource areas, while a correlation between6 and PM10 israther unusual (r=0.971 and 0.956 during period 1 and period2, respectively). PAHs are mainly associated with submicronparticles (Venkataraman and Friedlander, 1994; Schnelle-Kreis et al., 2001; Aceves and Grimalt, 1993; Pistikopouloset al., 1990b), a size range that generally represents only asmall fraction of the PM10 mass balance. Since PAHs areprimary anthropogenic compounds, such correlations indi-cate that PM10 concentrations result essentially from primaryanthropogenic emissions, with marginal inputs consisting ofnatural aerosol. This is in good agreement with the very large
contribution of EC to PM10 (20% on average) during theseperiods.
There are further differences between the two meteoro-logical periods. First, the correlations between6, EC, andNO are lower during period 1 than period 2 at the urban site(C1) (Table 3), suggesting an “older” aerosol during the an-ticyclonic period. Also, despite similar correlation coeffi-cients between6 and PM10, their ratio varies between thetwo periods (Fig. 8) at the C1 site; an accumulation of pol-lutants is again suggested during period 1, with larger rela-tive concentrations of PAH in the PM10. Second, the samecharacteristics are also seen at the near-city C2 site duringperiod 1, despite much lower concentrations; strong corre-lations (Table 3) between all the parameters and a6/PM10ratio identical to that of the urban site suggest a contami-nated air mass at the scale of the valley. During the secondpart of the sampling week, all of these correlations decreasesignificantly at C2, indicating a smaller direct impact fromemission sources for this near-city site in perturbed meteoro-logical conditions. During this period, PAH concentrationsand 12 h average PM10 concentrations show low variability,preventing the accurate calculation of ratios (Fig. 8).
In the Maurienne valley, two meteorological periods canalso be observed. A first period (period 3), from 25 to 27January, is characterized by a disturbed episode with someprecipitation and relatively strong NE-SW winds. Duringthe last part of the campaign, from 28 to 31 January (pe-riod 4), anticyclonic conditions prevailed with low tempera-tures and low wind speeds mainly from the SW-NE. As op-posed to the valley of Chamonix, total PAH concentrationsin the Maurienne valley do not show very large evolutionsbetween these two periods (Figs. 6 and 7). Furthermore, nosignificant correlations are observed at the M1 site between6, EC, or PM10 (NO was not measured at this site) for any of
www.atmos-chem-phys.org/acp/4/1167/ Atmos. Chem. Phys., 4, 1167–1181, 2004
1178 N. Marchand et al.: Polycyclic aromatic hydrocarbons (PAHs)
Fig. 8. Correlations between the total PAH concentrations andPM10 obtained in the Chamonix valley for the C1 and C2 samplingsites during the winter campaign.
the periods. This may reflect the complexity of the sourcescontributing to PM10 at that site. At Orelle (M2), no signif-icant correlations are observed during period 3, while strongcorrelations appear during period 4 (Table 4) between6, EC,NO, and PM10, indicating the impact of local combustionsources on these conditions.
Therefore, under winter conditions, the strong PAH levelsobserved in the two valleys, and especially in the Chamonixvalley, are generated by internal sources. Under these spe-cific conditions, the study of the capability of PAHs to al-low discrimination of sources is particularly interesting. Inthe Chamonix valley, the ratios (BbF+BkF)/6′ and CHR/6′
show good covariations at the two sites, especially at thenear-city site (Fig. 7). It can be postulated that BbF, BkFand CHR are emitted predominantly by wood combustionsources. The importance of this source is confirmed by thepresence in large quantities of guaiacyl and syringyl deriva-tives in our samples. These compounds come from the ther-mal breakdown of lignin, and are indicators of wood com-bustions (Nolte et al., 2001). These results will be discussedin a future publication.
In the Maurienne valley, where mixing sources and impor-tant dilution/dispersion processes have been highlighted, thestudy of temporal evolution of these three PAH ratios is com-plex. No correlations are observed between (BbF+BkF)/6′,CHR/6′, (BghiP+COR)/6′, and6 (Figs. 6 and 7), underlin-ing the influence of multiples sources and processes in gov-erning PAH concentrations. Examinations of these specificratios are therefore insufficient for the determination of PAHsources.
Table 4. Pearson correlation coefficients between6, PM10, OC,EC, and NO at the M2 (Maurienne Valley) site during the wintercampaign. Meteorological periods are described in the text. Pear-son coefficients calculated for 5 and 7 points for periods 3 and 4,respectively.
M2
Period 3 6 PM10 OC EC NO
6 1PM10 0.128 1OC 0.928 0.833 1EC 0.318 0.650 0.647 1NO 0.197 −0.120 0.519 0.904 1
Period 4 6 PM10 OC EC NO
6 1PM10 0.886 1OC 0.696 0.940 1EC 0.685 0.866 0.931 1NO 0.812 0.928 0.890 0.753 1
5 Conclusions
The study of PAH concentrations and speciation in the con-text of these alpines valleys highlights several interestingpieces of information. First, it shows the large impact oflocal sources to the contamination of the atmosphere. Thisimpact is much larger in winter than in summer, with an in-creasing contribution of local combustion sources to the for-mation of PM10. This increase from one season to the otheris larger than generally observed in other types of environ-ments. It is partly due to additional sources, but is also verymuch enhanced by local meteorology. All of these condi-tions can lead to PAH concentrations in the range of severaltens of ng.m−3, comparable to those observed in large cities.The current levels show that it will be challenging to meetpotential new EU standards in this environment. The cur-rent proposition of the directive is based on a target value of1 ng.m−3on an annual average for BaP, while the UK gov-ernment Expert Panel on Air Quality Standard has set a UKair quality standard of 0.25 ng.m−3 for the same species (Di-mashki et al., 2001).
Second, our results show that PAH concentrations werehigher in the Chamonix valley than in the Maurienne valley,in a context involving the absence of international heavy-duty traffic in the former valley. This sensitivity is prob-ably related both to the morphological differences betweenthese valleys, with more ventilation occurring in the widerMaurienne Valley, and to the importance of wood combus-tion sources in the Chamonix Valley. It will be interesting tocompare these results for the second set of field campaigns
Atmos. Chem. Phys., 4, 1167–1181, 2004 www.atmos-chem-phys.org/acp/4/1167/
N. Marchand et al.: Polycyclic aromatic hydrocarbons (PAHs) 1179
proposed in the POVA program, undertaken with the “Tunneldu Mont Blanc” reopened to international traffic.
Third, an additional goal of this study was to investigatethe ability of PAH signatures to allow the discrimination ofdifferent combustion sources in an environment that is sim-pler than that of large urban areas. Examinations of the rela-tive concentrations of several PAHs (BghiP, COR, BbF, BkF,and CHR) and their evolutions provide a qualitative interpre-tation of aerosol sources that is in general agreement withour knowledge of these sources in the valleys. However, dif-ferences remain small (between valleys, sites, and seasons).Considering the variability of the different relative emissionrates proposed in the literature, the use of PAH alone in aquantitative study (using a CMB approach, for example) onthe influence of sources seems rather dubious. Further workin this direction is in progress, using other molecular mark-ers, including wood combustion tracers.
Acknowledgements.The program POVA is supported in France bythe Region Rhone Alpes, ADEME (Agence de l’Environnement etde la Maıtrise de l’Energie), METL (Ministere de l’Equipement,des Transports et du Logement), MEDD (Ministere de l’Ecologieet du Developpement Durable), and Primequal 2. We wouldlike to thank Meteo France for providing the meteorologicaldata, and SFTRF, ATMB and DDE de Savoie and Haute Savoiefor providing the traffic data. We are indebted to W. Maen-haut (INW, Gent, Belgium) for facilities for analyzing EC/OCsamples, and l’Air de L’Ain et des Pays de Savoie (Air APS,http://www.atmo-rhonealpes.org/air2savoie/) for NOx and TEOMmeasurements and for providing the cartography of the valleys(Fig. 1).
Edited by: J. Abbatt
References
Aceves, M. and Grimalt, J. O.: Seasonally dependent size distribu-tions of aliphatic and polycyclic aromatic hydrocarbons in urbanaerosols from densely populated areas, Environ. Sci. Technol.,27, 2896–2908, 1993.
Anquetin, S., Guilbaud, C., and Chollet, J. P.: Thermal valley inver-sion impact on the dispersion of a passive pollutant in a complexmountainous area, Atmos. Environ., 33, 3953–3959, 1999.
Aymoz, G., Jaffrezo, J. L., Jacob, V., Colomb, A., and George, C.:Evolution of organic and inorganic components of aerosol dur-ing a Saharan dust episode observed in the French Alps, Atmos.Chem. Phys. Discuss., 4, 3875–3909, 2004.
Besombes, J. L., Maıtre, A., Patissier, O., Marchand, N., Chevron,N., Stoklov, M., and Masclet, P.: Particulate PAHs observed inthe surrounding of a municipal incinerator, Atmos. Environ., 35,6093–6104, 2001.
Birch, M. E. and Cary, R. A.: Elemental Carbon-Based Methodfor Monitoring Occupational Exposures to Particulate Diesel Ex-haust, Aerosol Sci. Technol. 25, 221–241, 1996.
Caricchia, A. M., Chiavarini, S., and Pezza, M.: Polycyclic aro-matic hydrocarbons in the urban atmospheric particulate matterin the city of Naples (Italy), Atmos. Environ., 33, 3731–3738,1999.
Cecinato, A., Marino, F., Di Filippo, P., Lepore, L., and Possanzini,M.: Distribution of n-alkanes, polynuclear aromatic hydrocar-bons between the fine and coarse fractions of inhalable atmo-spheric particles. J. Chromatogr. A, 826, 255–264, 1999.
Colomb, A., Jacob, V., Debionne, J. L., Aymoz, G., and Jaffrezo, J.L.: VOC’s evolution during a Saharan dust episode in an alpinevalley in August 2000, Fresenius Environ. Bull., 11(8), 441–453,2002.
Combet, E., Jarosz, J., Martin-Bouyer, M., Paturel, L., and Saber,A.: Mesure par spectrofluorimetrie Shpo’skii desemissions uni-taires en HAP de 30 vehicules legersa essence et diesels selonhuit cycles representatifs, Sci. Total Environ., 134, 147–160,1993.
Dachs, J., Bayona, J. M., Fowler, S. W., Miquel, J. C., and Al-baiges, J.: Vertical fluxes of polycyclic aromatic hydrocarbonsand organochlorides in the western Alborean Sea (South-westernMediterranean), Mar. Chem., 52, 75–86, 1996.
Dimashky, M., Lee, H. L., Harrison, R. M., and Harrad, S.: Tem-poral trends, temperature dependence, and relative reactivityof atmospheric polycyclic aromatic hydrocarbons, Environ. Sci.Technol., 35, 2264–2267, 2001.
Dorr, G., Hippelein, M., Kaupp, H., and Hutzinger, O.: Baselinecontamination assessment for a new resource recovery facility inGermany: Part VI: Levels and profiles of polycyclic aromatic hy-drocarbons (PAH) in ambient air, Chemosphere, 33, 1569–1578,1996.
Duran, A., De Lucas, A., Carmona, M., and Ballesteros, R.:Simulation of atmospheric PAH emissions from diesel engines,Chemosphere, 44, 921–924, 2001.
Freeman, D. J. and Catell, C. R.: Woodburning as a source of atmo-spheric polycyclic aromatic hydrocarbons, Environ. Sci. Tech-nol., 24, 1581–1585, 1990.
Halsall, C. J., Coleman, P. J., Davis, B. J., Burnett, V., Waterhouse,K. S., Harding-Jones, P., and Jones, K. C.: Polycyclic aromatichydrocarbons in UK urban air, Environ. Sci. Technol., 28, 2380–2386, 1994.
Harrison, R. M., Smith, D. J. T., and Luhana, L.: Source appor-tionment of polycyclic aromatic hydrocarbons collected from anurban location in Birmingham, UK Environ. Sci. Technol., 30,825–832, 1996.
Hering, S. V., Miguel, A. H., and Dod, R. L.: Tunnel measurementsof the PAHs, carbon thermogram and elemental source signaturefor vehicular exhaust, Sci. Total Environ., 36, 39–52, 1984.
IARC: Polynuclear aromatic compounds, Part 1, Chemical, envi-ronmental and experimental datas, In: IARC Monographs on theEvaluation of Carcinogenic Risk of Chemicals to Humans, Vol.32, International Agency for Research on Cancer, Lyon, 1983.
IARC: Overall evaluations of carcinogenicity an updating of IARCmonographs, In: IARC monographs on the evaluation of carcino-genic risk of chemicals to humans, Vol. 1–42 (Suppl 7). Interna-tional Agency for Research on Cancer, Lyon, 1987.
Jenkins, B. M., Jones, A. D., Turn, S. Q., and Williams, R. B.: Emis-sion factors for polycyclic aromatic hydrocarbons from biomassburning, Environ. Sci. Technol., 30, 2462–2469, 1996.
Kavouras, I. G., Koutrakis, P., Tsapakis, M., Lagoudaki, E.,Stephanou, E. G., Von Baer, D., and Oyola, P.: Source appor-tionment of urban particulate aliphatic and polynuclear aromatichydrocarbons using multivariable methods, Environ. Sci. Tech-nol., 35, 2288–2294, 2001.
www.atmos-chem-phys.org/acp/4/1167/ Atmos. Chem. Phys., 4, 1167–1181, 2004
1180 N. Marchand et al.: Polycyclic aromatic hydrocarbons (PAHs)
Khalili, N. R., Scheff, P. A., and Holsen, T. M.: PAH source fin-gerprints for coke ovens, diesel and gasoline engines, highwaytunnels, and wood combustion emissions, Atmos. Environ., 29,533–542, 1995.
Kamens, R. M., Guo, J., Guo, Z., and McDow, S. R.: Polynu-clear aromatic hydrocarbon degradation by heterogeneous re-actions with N2O5 on atmospheric particles, Atmos. Environ.,24A, 1161–1173, 1990.
Kiss, G., Varga-Puchony, Z., Rohrbacher, G., and Hlavay, J.: Dis-tribution of polycyclic aromatic hydrocarbons on atmosphericaerosol particles of different sizes, Atmos. Res., 46, 253–261,1998.
Larssen, S., Sluyter, R., and Helmis, C.: Criteria for EUROAIR-NET, the EEA air quality monitoring and information network,EEA Technical Report, http://reports.eea.eu.int/TEC12/en, 1999.
Li, C. K. and Kamens, R. M.: The use of polycyclic aromatic hy-drocarbons as sources signatures in receptor modeling, Atmos.Environ., 27A, 523–532, 1993.
Li, H., Banner, C. D., Mason, G. G., Westerholm, R. N., andRafter, J. J.: Determination of polycyclic aromatic compoundsand dioxin receptor ligands present in diesel exhaust particulateextracts, Atmos. Environ., 30, 3537–3543, 1996.
Marchand, N.: Etude de la composante organique de l’aerosol at-mospherique: cas de deux vallees alpines (Chamonix et Mau-rienne) et developpement analytique, PhD thesis, Universite deSavoie, (in French), 2003.
Marr, L. C., Kirchstetter, T. W., Harley, R. A., Miguel, A. H., Her-ing, S. V., and Hammond, S. K.: Characterization of polycyclicaromatic hydrocarbons in motor vehicles fuels and exhaust emis-sions, Environ. Sci. Technol., 33, 3091–3099, 1999.
Masclet, P., Cachier, H., Liousse, C., and Wortham, H.: Emissionsof polycyclic aromatic hydrocarbons by savannah fires, J. Atmos.Chem., 22, 41–54, 1995.
Menichini, E., Montfredi, F., and Merli, F.: The temporal variabilityof the profile of carcinogenic polycyclic aromatic hydrocarbonsin urban: a study in a medium traffic area in Rome, Atmos. Env-iron., 33, 3739–3750, 1999.
Mi, H. H., Lee, W. J., Chen, S. J., Lin, T. C., Wu, T. L, and Hu, J.-C.: Effect of gasoline additives on PAH emission, Chemosphere,36(9), 2031–2041, 1998.
Miguel, A. H. and Pereira, A. A. P.: Benzo(k)fluoranthene,Benzo(ghi)perylene, and Indeno(1,2,3-c,d)pyrene: New tracersof automotive emissions in receptor modelling, Aerosol Sci.Technol., 10, 292–295, 1989.
Miguel, A. H., Kirchstetter, T. W., Harley, R. B., and Hering, R.A.: On-Road emissions of particulate polycyclic aromatic hy-drocarbons and black carbon from gasoline and diesel vehicles,Environ. Sci. Technol., 32, 450–455, 1998.
Nielsen, T.: Traffic contribution of polycyclic aromatic hydrocar-bons in the center of a large city, Atmos. Environ., 30, 3481–3490, 1996.
Nikolaou, K., Masclet, P., and Mouvier, G.: Sources and chemi-cal reactivity of polynuclear hydrocarbons in the atmosphere acritical review, Sci. Total Environ., 32, 103–132, 1984.
Nolte, C. G., Schauer, J. J., Cass, G. R., and Simoneit, B. R. T.:Highly polar organic compounds in wood smoke and in the am-bient atmosphere, Environ. Sci. Technol., 35, 1912–1919, 2001.
Oros, D. R. and Simoneit, B. R. T.: Identification and emission ratesof molecular tracers in coal smoke particulate matter, Fuel, 79,
515–536, 2000.Oros, D. R. and Simoneit, B. R. T.: Identification and emission
factors of molecular tracers in organic aerosols from biomassburning Part 1, Temperate climate conifers, Appl. Geochem., 16,1513–1544, 2001a.
Oros, D. R. and Simoneit, B. R. T.: Identification and emission fac-tors of molecular tracers in organic aerosols from biomass burn-ing Part 2, Deciduous trees, Appl. Geochem., 16, 1545–1565,2001b.
Pankow, J. F. and Bidleman, T. F.: Interdependence of the slopesand intercepts from log-log correlations of measured gas-particlepartitioning and vapor pressure, I. Theory and Analysis of avail-able data, Atmos. Environ., 26A, 1071–1080, 1992.
Paturel, L., Saber, A., Combet, E., and Joumard, R.: Analysisof PAH emissions from passenger cars by high resolution Sh-pol’skii spectrofluorimetry, Polycyclic Aromatic Compounds, 9,331–339, 1996.
Penner, J. E. and Novakov, T.: Carbonaceous particles in the atmo-sphere: A historical perspective to the fifth international confer-ence on carbonaceous particles in the atmosphere, J. Geophys.Res., 101, 373–378, 1996.
Pistikopoulos, P., Masclet, P., and Mouvier, G.: A receptor modeladapted to reactive species Polycyclic Aromatic Hydrocarbons;evaluation of source contributions in a open urban Site – I. Parti-cle Compounds, Atmos. Environ., 24A, 1189–1197, 1990a.
Pistikopoulos, P., Wortham, H. M., Gomes, L., Masclet-Beyne, S.,Bon-Nguyen, E., Masclet, P., and Mouvier, G.: Mechanisms offormation of particulate aromatic hydrocarbons in relation to theparticles size distribution Effects on meso-scale transport, At-mos. Environ., 24A, 2573–2584, 1990b.
Prevot, A. S. H., Dommen, J., Baumle, M., and Furger, M.: Diurnalvariations of volatile organic compounds and local circulationsystems in an Alpine valley, Atmos. Environ., 34, 1413–1423,2000.
Rogge, W. F., Hidemann, L. M., Mazurek, M. A., and Cass, G.R.: Sources of fine organic aerosol 2. Noncatalyst and catalyst-equipped automobiles and heavy duty diesel trucks, Environ. Sci.Technol., 27, 636–651, 1993.
Rogge, W. F., Hidemann, L. M., Mazurek, M. A., and Cass,G. R.: Mathematical modeling of atmospheric fine particulate-associated primary organic compounds concentrations, J. Geo-phys. Res., 101, D14, 19 379–19 394, 1996.
Rogge, W. F., Hidemann, L. M., Mazurek, M. A., Cass, G. R., andSimoneit, B. R. T.: Sources of fine organic aerosol 9. Pine, Oak,Synthetic Log combustion in residential fireplaces, Environ. Sci.Technol., 32, 13–22, 1998.
Schauer, J. J., Rogge, W. F., Hildemann, L. M., Mazurek, M. A.,and Cass, G. R.: Source apportionment of airborne particulatematter using organics compounds as tracers, Atmos. Environ.,30, 3837–3855, 1996.
Schauer, J. J. and Cass, G. R.: Source apportionment of wintertimegas-phase and particle-phase air pollutants using organic com-pounds as tracers, Environ. Sci. Technol., 34, 1821–1832, 2000.
Schauer, J. J., Kleeman, M. J., Cass, G. R., and Simoneit, B. R. T.:Measurement of emissions from air pollution sources, 3. C1-C29organic compounds from fireplace combustion of wood, Environ.Sci. Technol., 35, 1716–1728, 2001.
Schauer, J. J., Kleeman, M. J., Cass, G. R., and Simoneit, B. R. T.:Measurement of emissions from air pollution sources, 5. C1-C32
Atmos. Chem. Phys., 4, 1167–1181, 2004 www.atmos-chem-phys.org/acp/4/1167/
N. Marchand et al.: Polycyclic aromatic hydrocarbons (PAHs) 1181
organic compounds from Gasoline-Powered Motor Vehicles, En-viron. Sci. Technol., 36, 1169–1180, 2002.
Schnelle-Kreis, J., Gebefugi, I., Welzl, G., Jaensch, T., and Kettrup,A.: Occurrence of particles-associated polycyclic aromatic com-pounds in ambient air of the city of Munich, Atmos. Environ.,35, S71–S81, 2001.
Seinfeld, J. H. and Pandis, S.: Atmospheric Chemistry and Physics:From Air Pollution to Climate Change, Wiley Interscience, NewYork, 1998.
Simoneit, B. R. T.: Biomass burning – A review of organic tracersfor smoke from incomplete combustion, Appl. Geochem., 17,129–162, 2002.
Standley, L. J. and Simoneit, B. R. T.: Characterization of ex-tractable plant wax, resin and thermally matured components insmoke particles from prescribed burns, Environ. Sci. Technol.,21, 163–169, 1987.
Tsapakis, M. and Stephanou, E. G.: Collection of gas and particlesemi-volatile organic compounds: use of an oxidant denuder tominimize polycyclic aromatic hydrocarbons degradation duringhigh-volume sampling, Atmos. Environ., 37, 4935–4944, 2003.
Venkataraman, C. and Friedlander, S. K.: Size distributions of Poly-cyclic aromatic hydrocarbons and elemental carbon, 2. Ambi-ent measurements and effects of atmospheric processes, Environ.Sci. Technol., 28, 563–572, 1994.
www.atmos-chem-phys.org/acp/4/1167/ Atmos. Chem. Phys., 4, 1167–1181, 2004
Related Documents