AARJMD VOLUME 1 ISSUE 18 (FEBRUARY 2014) ISSN : 2319 - 2801 Asian Academic Research Journal of Multidisciplinary www.asianacademicresearch.org 800 A Peer Reviewed International Journal of Asian Academic Research Associates AARJMD ASIAN ACADEMIC RESEARCH JOURNAL OF MULTIDISCIPLINARY TEMPORAL VARIABILITY IN FEEDING GUILDS OF POLYCHAETE FAUNA AT THE MOUTH OF THE BONNY ESTUARY, NIGERIA. JOHN ONWUTEAKA* * Department of Applied and Environmental Biology Rivers State University of Science and TechnologyPort Harcourt, Nigeria Abstract Temporal variations in feeding guilds of Polychaetes were studied at the mouth on Bonny River bar in the eastern delta of the Niger delta in Nigeria. The trophic group composition identified the existence of five (5) groups namely Carnivores (C), Surface Deposit Feeders (SDF), Subsurface Deposit Feeders (SSDF); Herbivores (HBVR) and Suspension Feeders (SF). The study showed evidence of monthly variability within-feeding guilds. However no pattern of seasonal variation was evident as there was no significant difference between the wet season months of June 2010, August2010 and October 2010 and the dry season months of February 2011 and April 2011. However within –group variation showed a consistent pattern of significant difference between the carnivore feeding group and the other four feeding guilds in June 2010 and 2011(SSDF, SDF, HBVR, SF) , three feeding groups in February and April 2011(SDF, HBVR, SF) ; two feeding groups in October 2010(HBVR, SF) and one feeding group in August 2010 (SF). The consistently dominance of the carnivore group throughout the survey period is linked to the likely presence of coarse sediments created by the regular maintenance dredging activity at the river mouth to enable large vessels load oil and gas products. Keywords: Temporal Variation, Polychaete feeding Guilds, Bonny River

Welcome message from author
This document is posted to help you gain knowledge. Please leave a comment to let me know what you think about it! Share it to your friends and learn new things together.
Transcript
AARJMD VOLUME 1 ISSUE 18 (FEBRUARY 2014) ISSN : 2319 - 2801
Asian Academic Research Journal of Multidisciplinary
www.asianacademicresearch.org
800
A Peer Reviewed International Journal of Asian
Academic Research Associates
AARJMD
ASIAN ACADEMIC RESEARCH
JOURNAL OF MULTIDISCIPLINARY
TEMPORAL VARIABILITY IN FEEDING GUILDS OF
POLYCHAETE FAUNA AT THE
MOUTH OF THE BONNY ESTUARY, NIGERIA.
JOHN ONWUTEAKA*
* Department of Applied and Environmental Biology
Rivers State University of Science and
TechnologyPort Harcourt, Nigeria
Abstract
Temporal variations in feeding guilds of Polychaetes were studied at the mouth on Bonny
River bar in the eastern delta of the Niger delta in Nigeria. The trophic group composition
identified the existence of five (5) groups namely Carnivores (C), Surface Deposit Feeders
(SDF), Subsurface Deposit Feeders (SSDF); Herbivores (HBVR) and Suspension Feeders
(SF). The study showed evidence of monthly variability within-feeding guilds. However no
pattern of seasonal variation was evident as there was no significant difference between the
wet season months of June 2010, August2010 and October 2010 and the dry season months
of February 2011 and April 2011. However within –group variation showed a consistent
pattern of significant difference between the carnivore feeding group and the other four
feeding guilds in June 2010 and 2011(SSDF, SDF, HBVR, SF) , three feeding groups in
February and April 2011(SDF, HBVR, SF) ; two feeding groups in October 2010(HBVR,
SF) and one feeding group in August 2010 (SF). The consistently dominance of the
carnivore group throughout the survey period is linked to the likely presence of coarse
sediments created by the regular maintenance dredging activity at the river mouth to enable
large vessels load oil and gas products.
Keywords: Temporal Variation, Polychaete feeding Guilds, Bonny River
AARJMD VOLUME 1 ISSUE 18 (FEBRUARY 2014) ISSN : 2319 - 2801
Asian Academic Research Journal of Multidisciplinary
www.asianacademicresearch.org
801
1.0 Introduction
The Bonny estuary is recognized as one of the most important river system in the eastern
delta providing transportation for oil and gas services into the inland Ports at Onne and
Okirika and Port Harcourt for commerce. The estuary which supports large scale maritime
activity also support a diverse ecology and rich fisheries and has been the focus of many
multidisciplinary research (RPI 1985, IPS 1989, 1990 and 1992). In these studies, NNPC/RPI
(1985) extensively provided information on the physicochemistry and Plankton,Ombu
(1987), and Ekweozor et al. (1989) on benthos and Hart and Chindah (1998) on intertidal
macrofauna while Chindah and Osuamkpe (1994), on fisheries of Bonny estuary. While these
studies provide information of environmental response to changes that may result from
pollution, many other environmental stresses such as dredging exist and studies that focus on
trophic levels are needed to complement the efforts of past research. In order to complement
past research efforts, the present study conducted a survey of the temporal variation in the
feeding groups of subtidal Polychaetes within the Polyhaline environment at the mouth of
Bonny River where salinity values remain stable without variation (NEDECO 1961,
NNPC/RPI 1985). As a result this study intends to evaluate the temporal variation in
composition of feeding groups of Polychaetes in the absence of a seasonal salinity gradient.
2.0 Study Area
The study area is located within the mouth of the Bonny River Estuary as shown in Fig 1.0.
Bonny River Estuary has been described with a tidal penetration extending inland over 40
kilometers. The extended salinity propagation of the Bonny tidal basin is due to the
morphology which induces a high tidal conductivity (NEDECO 1963). These studies show
that the mouth of the river remain at salinities of 20 ppt throughout the year through the wet
and dry season because of the ineffectual influence of fresh water discharge.
3.0 Field Procedures
Samples at the river mouth were collected in three locations, upper, mid and lower areas as
shown in Fig 1.0.The stations were chosen around buoys on the river to make it easier to
anchor the boat within the strong current. At each location five random sites were sampled by
collecting with a 0.023m2 Ekman grab. All samples from the sites at each location were
AARJMD VOLUME 1 ISSUE 18 (FEBRUARY 2014) ISSN : 2319 - 2801
Asian Academic Research Journal of Multidisciplinary
www.asianacademicresearch.org
802
composited. The three locations were sampled every two months through a 12 month period
by using waypoints loaded into a GPS to collect samples from the same location as closely as
possible. The grab samples were washed with water in a 45µ nitex bags, and preserved in
10% buffered formalin. Rose Bengal stain was added. Each preserved samples were hand
sorted. All polychaetes were sorted, identified with stereo and compound microscope and
categorized into families and generic groups. Polychaete texts used were Day (1967) and
Fauchald (1977). The trophic group classification applied for each family was simplified from
the scheme proposed by Fauchald and Jumars (1979) with individuals being assigned to
broad feeding categories—predators (carnivores plus omnivores), surface deposit feeders,
burrowing subsurface deposit feeders (hereafter termed burrowers) and filter feeders.
4.0 Statistical analyses
Temporal variation was analyzed with SAS JMP Statistical software by using the abundances
of Polychaetes in different trophic groupings. An analysis of variance to fit means and to test
that they are equal was performed with multiple comparison tests on means, with means
comparison circles and outlier box plots overlaid on each group. The box plots summarize the
distribution of points at each factor level. Each multiple comparison test is represented by a
comparison circles plot, which is a visual representation of group mean comparisons. Overlap
marks show for each diamond and are computed as group mean. Overlap marks in one
diamond that are closer to the mean of another diamond than that diamond's overlap marks
indicate that those two groups are not different at the 95% confidence level.
5.0 Results
The trophic group composition identified the existence of five (5) groups namely Carnivores
(C), Surface Deposit Feeders (SDF), Subsurface Deposit Feeders (SSDF); Herbivores
(HBVR) and Suspension Feeders (SF). The carnivores are represented by the six species of
Lumbrinereis; Lumbrinereis sp.1, Lumbrinereis sp.3, Lumbrinereis sp.4, Lumbrinereis
coccinea, Lumbrinereis latra, Lumbrinereis tetraura, and the two species of Aglaophamus;
Aglaophamus sp1. Aglaophamus sp2. and a Nepthys species; Nephyts sp. Other carnivores
include the two species of Glycera; Glycinde sp and Sigambra tentaculata.
AARJMD VOLUME 1 ISSUE 18 (FEBRUARY 2014) ISSN : 2319 - 2801
Asian Academic Research Journal of Multidisciplinary
www.asianacademicresearch.org
803
The surface deposit feeders are represented by Paraleiocapitella sp., Tharynx
dorsobranchialis, Isolda wlydahensis, and Aricidea (Aricidea) sp. nov. and Paraonis sp. The
sub surface deposit feeders are represented by six species namely Cossura sp.2, Scoloplos
(leo) sp.1, Scoloplos (Leo) sp.2, Sternapsis scutata, Notomastus sp.1, and Notomastus sp.2.
The herbivours were Gyptis sp., Lysidice collaris, and Ceratonereis sp. 1, Ceratonereis sp.
The species Malacoceros sp. was the only suspension feeder.
The monthly variation in abundance for all the trophic groups is shown in Fig 2.0. The
monthly variation for carnivore feeding group varied from lowest values in June 2010 to peak
in April 2011. For the Surface Deposit Feeders (SDF) variation was from low in June 2010 to
peak in June 2011. The monthly variation of the sub surface deposit feeders indicates a peak
in abundance between October 2010 and April 2011. Lowest abundance was observed in
June 2010. For the herbivore feeding group significantly low numbers were observed from
June 2010 with peak values in February and April 2011. The suspension feeders showed very
low occurrence values in August 2010 with the highest occurrence value in February 2011.
5.1 Between- Month-Variation
The one way analysis of variance in figs 6-10 shows the graphical scatterplot for each trophic
group with the X axis scaled proportional to the sample size of each month. The Analysis of
Variance uses the Means Diamond option which draws a 95% means diamond for each
group. In fig 6, the mean month scores of the Carnivores appear to be similar for October
2010, February 2011, April 2011, June 2011 all being above the mean while the scores for
June 2010 and August 2010 are the same and appear to be less that the former group. The
boxplots which compare the different months on a numeric response shows that the months
clearly differ in the carnivore abundance per month with variability highest in the month of
October 2010 and the least in the month of June 2010.
In fig 7.0 the mean month scores of the surface deposit feeders for the months of October
2010, February 2011 and June 2011 appear to the be the same as they are above the grand
mean while the mean months scores for the months of June 2010 and August 2010 are same
and appear to be similar that the former group as they are below the grand mean. The
AARJMD VOLUME 1 ISSUE 18 (FEBRUARY 2014) ISSN : 2319 - 2801
Asian Academic Research Journal of Multidisciplinary
www.asianacademicresearch.org
804
boxplots shows that the months clearly differ in the surface deposit feeders’ abundance per
month with variability highest in the month of June 2011 and the least in the months of
February and April 2011.
In fig 8.0 the month scores for the months of October 2010, February and April 2011 are
similar being above the grand mean while the mean month scores for June 2010, August 2010
and June 2011 are similar being below the grand mean. The box plots however show
variability in abundance per month to be highest in the month of February 2011 followed by
April 2011 and least in the month of June 2010.
In Fig 9.0 the mean month scores of the herbivores for the months of February and April
2011 are same being above the grand mean while those of the months of June, August,
October 2010 and June 2011 are the same being below the grand mean. The boxplots
however show variability in monthly abundance to be highest in the months of February and
June 2011 with the least in the month of August and October 2010. In fig 10 the Suspension
feeders show a similar mean month scores for June 2010 and June 2011 with an overlap with
the month of Feb 2011 all being above the grand mean. Below the grand mean, the months of
August 2010 and April 2011 are same, overlapping with the month of October 2010 which is
also below the grand mean. The variability in monthly abundance is highest in the months of
February and June 2011 and least in the month of October 2010.
5.2 Within Group Variation
The within-group variation graphical scatterplot for the feeding groups are shown in figs 11-
16. In fig 11.0 the mean month scores for the month of June 2010 for Carnivore feeding
group is significantly different from the other feeding group as shown by both the student t
and Hsu pair comparisons. There is no significant difference in abundance between
herbivores, surface deposit feeders, subsurface deposit feeders and suspension feeders. The
boxplots however show within month variability being highest in surface deposit feeder and
least and similar in carnivore, subsurface deposit feeder and suspension feeder. In fig 12.0 the
mean month score shows a significant difference between the carnivore and the suspension
feeders for the month of August 2010. No significant difference is observed in variation in
AARJMD VOLUME 1 ISSUE 18 (FEBRUARY 2014) ISSN : 2319 - 2801
Asian Academic Research Journal of Multidisciplinary
www.asianacademicresearch.org
805
abundance between carnivores, surface deposit feeders, subsurface deposit feeders and the
herbivores.
The within-group month variation mean scores for October 2010 indicate a significant
difference in abundance between the herbivores, suspension feeders and Carnivores. No
significant difference within month variation is observed between the carnivores, subsurface
deposit feeders and surface deposit feeders even though the mean score of the surface deposit
feeders is below the grand mean in the graphic scatter plot. The box plots show that the five
types of feeding groups clearly differ in the within month variation with Carnivores being the
most variable and herbivores and suspension feeders being the least. In fig 14.0 the within
month scores of abundance for February 2011 shows there is significant difference between
carnivores and herbivores, surface deposit feeders and suspension feeders. The box plots
show highest variability in abundance for the subsurface feeders followed by carnivores. The
least within month variability is observed for surface deposit feeders and suspension feeders.
In fig 15.0 the within-group variation means scores for April 2011 show that there is a
significant difference between the carnivores and herbivores, surface deposit feeders and
suspension feeders only. The box plots show high variation in abundance for the carnivore
feeding group followed by the subsurface deposit feeders. Clearly very little variation existed
within the month in herbivore, surface deposit and suspension feeding groups as their box
plots cluster around their individual mean.
In Fig 16.0 the within-month variation mean scores for the month of June 2011 shows that
the carnivore feeding group differ significantly from the subsurface deposit feeders, surface
deposit feeders, suspension feeders and herbivores. The mean scores of within-group
variability for the subsurface deposit feeders, surface deposit feeders, suspension feeders and
herbivores appear to be the same. The box plots show that the five types of feeding groups
clearly differ in the within group variation with surface deposit feeders being the most
variable followed by the carnivores and subsurface deposit feeders with the least variation in
the suspension feeding group.
AARJMD VOLUME 1 ISSUE 18 (FEBRUARY 2014) ISSN : 2319 - 2801
Asian Academic Research Journal of Multidisciplinary
www.asianacademicresearch.org
806
6.0 Discussion
The study has shown evidence of monthly variability within-feeding guilds. However the
variability response for the feeding groups does not show any pattern of seasonal variation as
there is no significant difference between the wet season months of June, August and October
and the dry season months of February and April. There is however a consistent pattern of
significant difference between the carnivore feeding group and the other four feeding guilds
in June 2010 and 2011, three feeding groups in February and April 2011; two feeding groups
in October 2010 and one feeding group in August 2010.
The results of this study seem to agree with those reported by Bianchi and Morri (1985) for
feeding groups found in the M. galloprovinciallis assemblage in a coastal deltaic assemblage.
Their results showed that detritivorous (deposit feeders) Polychaetes constituted 18% of the
total species, and filter feeders 10% whereas macrophagous (carnivores) exceeded 62%.
Similarly this pattern is followed in this study where the detritivores (Surface deposit feeders
and sub-surface deposit feeders) constitute 23% and 11% respectively whereas the filter
feeders and Herbivores constituted 2% and 10% respectively and the Carnivores with the
highest proportion of 54%. Among the Carnivores the Lumbrinereis tetraura account for
more than 34% of the total variation in this group of 14 species while within the subsurface
deposit feeders of 6 species Scoloplos(leo) sp.1 account for more than 40% of the variation
observed in the group. Within the surface deposit feeders comprising of 5 species Aricidea
(Aricidea) sp. nov. and Tharynx dorsobranchialis account for over 50% variation while
within the herbivore feeding guild Ceratonereis sp.1 and Gyptis sp. account for over 60%
variation evident.
The consistently high variability in the carnivore feeding guild is indicative of the fact that
other biotic and abiotic factors are regulating the observed populations since there is a stable
salinity resulting from the absence of dilution effects of freshwater streams discharging into
the Bonny River. Documented evidence shows that the dominance of carnivorous
polychaetes have shown a correlation with coarse sedimentary particles (Paiva (1993), Muniz
et al. (1998) and Muniz and Pires (1999). The preference of carnivores for coarser sediments
with low levels of mud and clay is also well known (Maurer and Leathem, 1981; Gaston,
1987; Gaston and Nasci, 1988; Tena et al., 1993).
AARJMD VOLUME 1 ISSUE 18 (FEBRUARY 2014) ISSN : 2319 - 2801
Asian Academic Research Journal of Multidisciplinary
www.asianacademicresearch.org
807
Coarser sedimentary particles which have large interstices among grains can create space
enough to favour the mobility and feeding of carnivores, abundance of prey and oxygenation
of the sediments (Fenchel, 1970). This observation correlates well with the anthropogenic
activities at the mouth of Bonny River where three major oil and gas firms (Shell Petroleum
Nigeria Limited, Nigerian National Petroleum Company and Mobil Producing Nigeria
Unlimited) dredge the channel to periodically enable them load oil and gas products. This
consistent maintenance dredging is likely to maintain continuously the settlement of coarser
sediments. The absence of low fine grained sand containing high organic matter content
would limit the abundance and distribution of the deposit and the suspension feeders.
The present study has shown that the feeding guilds of Polychaetes can be a good indicator of
environmental quality as they provide signals of any changes that might be taking place.
Attention is therefore needed in understanding the structure of the Polychaete communities at
the Bonny bar through many successional cycles in order to evaluate many of the biological
variables (predation, competition, food availability) that influence changes in community
structure under different stress conditions . This is because they live in the narrow surface
layer of the substrate and are the first organisms to be influenced by any environmental
changes.
AARJMD VOLUME 1 ISSUE 18 (FEBRUARY 2014) ISSN : 2319 - 2801
Asian Academic Research Journal of Multidisciplinary
www.asianacademicresearch.org
808
References
1. Bianchi, N.C. and Morri, C. (1985). Policheti come descrittori della strutura trofica
degli ecosistemi marini. Ocbalia 11: 203 -214.
2. Chindah, A. C. and Osuamkpe, A. (1994). The fish assemblage of the lower Bonny
River. Afri. J. Ecol. 32, 58 - 65.
3. Day, J.H. (1967). A Monograph of Polychaetes of Southern Africa. London (British
Museum of Natural History). Pt 1. Errantia 1-458: Part 2: Sedentaria: 459-
878.
4. Ekweozor I K E Ombo, E. I. and Ugbome, A. P. (1989). The effect of chronic oil
pollution in the central Bonny estuary. In: The petroleum industry and the
Nigerian Environment. Proc. of 1987, 198 – 207.
5. Fauchald, K. (1977). The polychaete worms, definitions and keys to the orders,
families and genera. Natural History Museum of Los Angeles County: Los
Angeles, CA (USA) Science Series 28:1-188.
6. Fauchald, K. and Jumars, P. A. (1979). The diet of worms: a study of polychaete
feeding guilds. Oceanogr. mar. Biol. a. rev., 17:193-284.
7. Fenchel, T. (1970). Studies on the decomposition of organic detritus derived from the
turtle grass Thalassia testudinum. Limnol. Oceanogr., 15(1):14-20.
8. Gaston, G. R. (1987). Benthic polychaeta of the Middle Atlantic Bight: feeding and
distribution. Mar. Ecol. Progr. Ser., 36:251-262.
9. Gaston, G. R. and Nasci, J. C. (1988). Estuarine macrobenthos in Calcasieu,
Lousiana: community and trophic structure. Estuaries, 11:201-211.
10. Hart, A. I. and Chindah, A. C. (1998). Preliminary study on the benthic microfauna
associated with different microhabitats in mangrove forest of Bonny estuary, Niger
Delta, Nigeria. Acta Hyrobiol., 40 (1): 9 – 15.
11. IPS (1989). Environmental data acquisition at some NNPC Operational areas. Vol.III
Biological studies. Rivers State University of Science and Technology Port Harcourt
Nigeria. Institute of Pollution Studies, SUST/IPS/TR/89/03.393pp.
12. IPS (1990). Baseline ecological studies of Bonny south (field) location. Final report
Rivers State University of Science and Technology Port Harcourt Nigeria.Institute of
Pollution Studies, RSUST/IPS/TR/89/02, 288pp.
AARJMD VOLUME 1 ISSUE 18 (FEBRUARY 2014) ISSN : 2319 - 2801
Asian Academic Research Journal of Multidisciplinary
www.asianacademicresearch.org
809
13. IPS (1992). Environmental Impact assessment study of the nitrogenous fertilizer
factory complex, Onne, Rivers State Nigeria. Rivers State University of Science and
Technology Port Harcourt Nigeria Institute of Pollution Studies. RSUST/IPS/91/06,
411pp.
14. Muniz, P.; Sumida, P. Y. G. and Pires-Vanin, A. M. S. (1998). Trophic structure of
polychaetes in two bays of the southeastern Brazilian Coast (Mar Virado and
Fortaleza, Ubatuba, São Paulo). Ocbalia, 24:39-53.
15. Muniz, P. and Pires, A. M. S. (1999). Trophic structure of polychaetes in the São
Sebastião Channel (Southeastern Brazil). Mar. Biol., 134(3):517-528.
16. Maurer, D.; Leathem, W. and Menzie, C. (1981). The impact of drilling fluid and well
cuttings on polychaete feeding guilds from the US Northeastern continental shelf. Mar.
Pollut. Bull., 13:342-347.
17. NEDECO, (1961). The waters of the Niger Delta. Report of an investigation by
NEDECO (Netherlands Engineering consultants). The Hague, pp: 210-228.
18. OMBU, E.I (1987). The impact of the Okrika oil terminal on the littorial benthos of
the central Bonny estuary, Nigeria. M. Phil. Thesis Rivers State University of Science
and Technology Port Harcourt Nigeria. 246pp.
19. Paiva, P. C. (1993). Trophic structure of a shelf polychaete taxocoenosis in southern
Brazil. Cah. Biol. mar., 35:39-55.
20. RPI/NNPC (1985). Environmental Baseline Studies for the establishment of control
criteria and Standards against petroleum related Pollution in Nigeria. South Carolina,
USA, XIII 45pp.
21. Tena, J.; Capaccioni-Azzati, R.; Torres-Gavila, F. J. and Porras, R. (1993).
Anélidos poliquetos delantepuro de Valencia: distribuición y categorías
tróficas. Publ. esp. Inst. Esp. oceanogr., 11:15-20.
AARJMD VOLUME 1 ISSUE 18 (FEBRUARY 2014) ISSN : 2319 - 2801
Asian Academic Research Journal of Multidisciplinary
www.asianacademicresearch.org
810
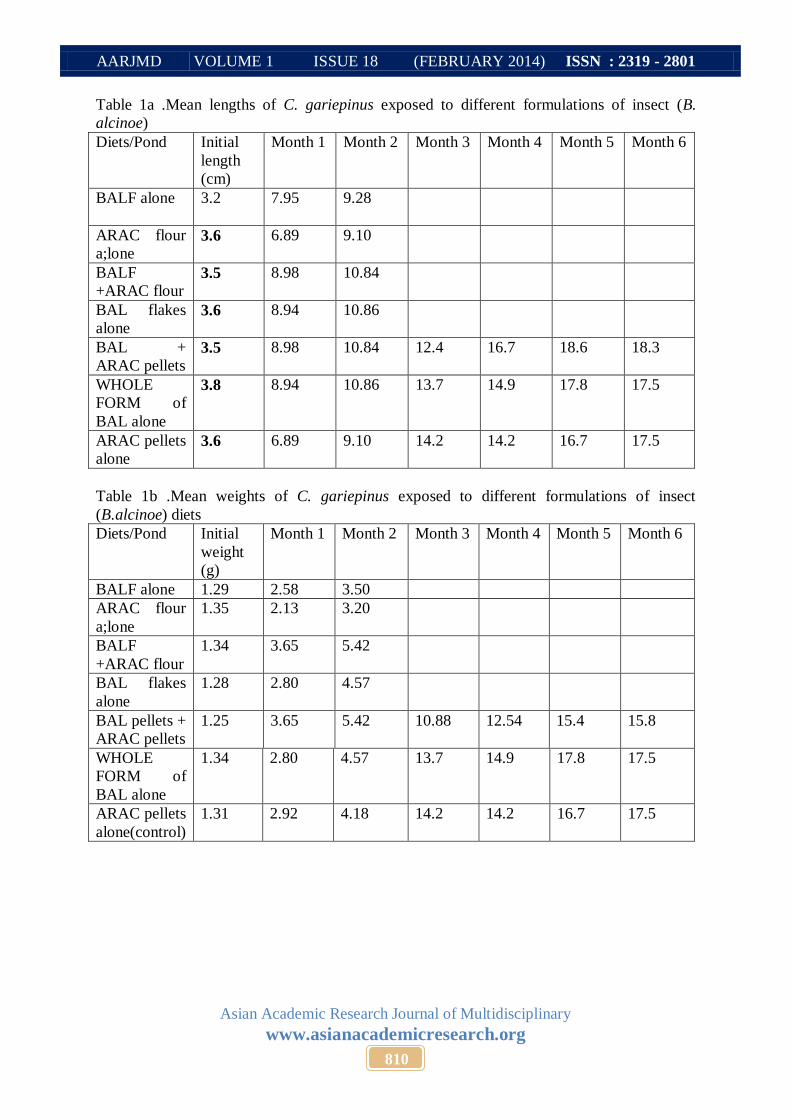
Table 1a .Mean lengths of C. gariepinus exposed to different formulations of insect (B.
alcinoe)
Diets/Pond Initial
length
(cm)
Month 1 Month 2 Month 3 Month 4 Month 5 Month 6
BALF alone 3.2
7.95 9.28
ARAC flour
a;lone 3.6 6.89 9.10
BALF
+ARAC flour 3.5 8.98 10.84
BAL flakes
alone 3.6 8.94 10.86
BAL +
ARAC pellets 3.5 8.98 10.84 12.4 16.7 18.6 18.3
WHOLE
FORM of
BAL alone
3.8 8.94 10.86 13.7 14.9 17.8 17.5
ARAC pellets
alone 3.6 6.89 9.10 14.2 14.2 16.7 17.5
Table 1b .Mean weights of C. gariepinus exposed to different formulations of insect
(B.alcinoe) diets
Diets/Pond Initial
weight
(g)
Month 1 Month 2 Month 3 Month 4 Month 5 Month 6
BALF alone 1.29 2.58 3.50
ARAC flour
a;lone
1.35 2.13 3.20
BALF
+ARAC flour
1.34 3.65 5.42
BAL flakes
alone
1.28 2.80 4.57
BAL pellets +
ARAC pellets
1.25 3.65 5.42 10.88 12.54 15.4 15.8
WHOLE
FORM of
BAL alone
1.34 2.80 4.57 13.7 14.9 17.8 17.5
ARAC pellets
alone(control)
1.31 2.92 4.18 14.2 14.2 16.7 17.5
AARJMD VOLUME 1 ISSUE 18 (FEBRUARY 2014) ISSN : 2319 - 2801
Asian Academic Research Journal of Multidisciplinary
www.asianacademicresearch.org
811
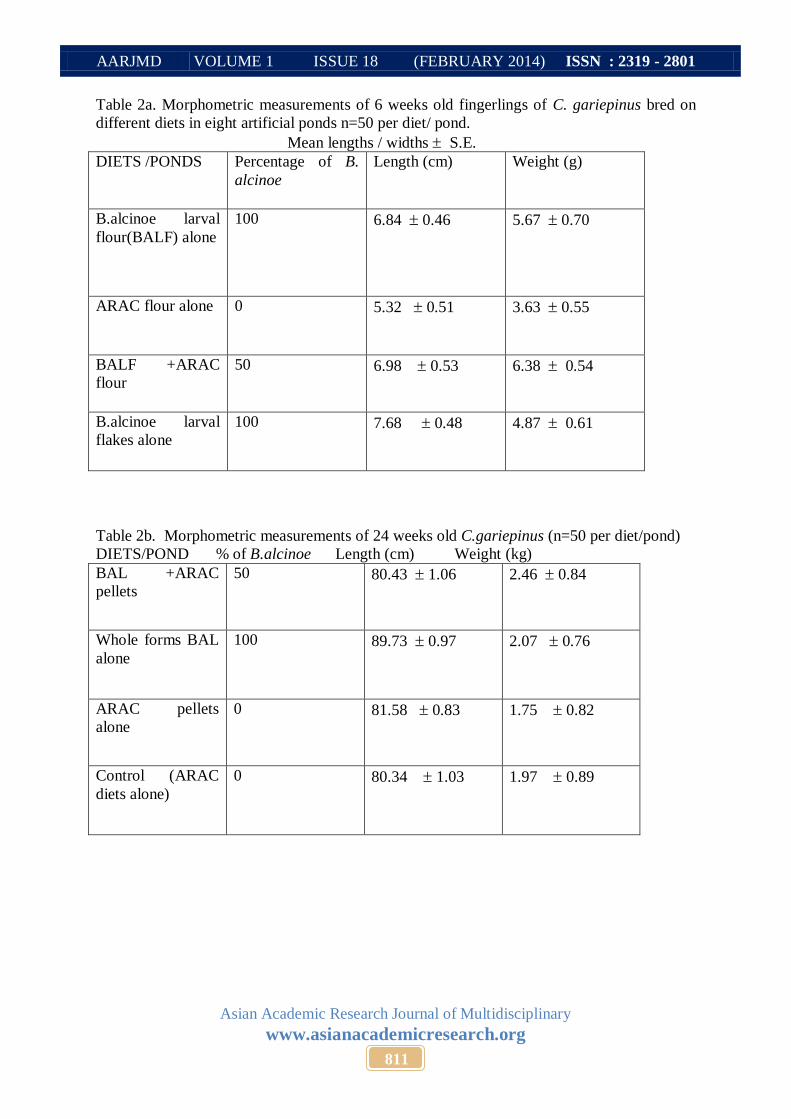
Table 2a. Morphometric measurements of 6 weeks old fingerlings of C. gariepinus bred on
different diets in eight artificial ponds n=50 per diet/ pond.
Mean lengths / widths S.E.
DIETS /PONDS Percentage of B.
alcinoe
Length (cm) Weight (g)
B.alcinoe larval
flour(BALF) alone
100 6.84 0.46 5.67 0.70
ARAC flour alone 0 5.32 0.51 3.63 0.55
BALF +ARAC
flour
50 6.98 0.53 6.38 0.54
B.alcinoe larval
flakes alone
100 7.68 0.48 4.87 0.61
Table 2b. Morphometric measurements of 24 weeks old C.gariepinus (n=50 per diet/pond)
DIETS/POND % of B.alcinoe Length (cm) Weight (kg)
BAL +ARAC
pellets
50 80.43 1.06 2.46 0.84
Whole forms BAL
alone
100 89.73 0.97 2.07 0.76
ARAC pellets
alone
0 81.58 0.83 1.75 0.82
Control (ARAC
diets alone)
0 80.34 1.03 1.97 0.89
AARJMD VOLUME 1 ISSUE 18 (FEBRUARY 2014) ISSN : 2319 - 2801
Asian Academic Research Journal of Multidisciplinary
www.asianacademicresearch.org
812
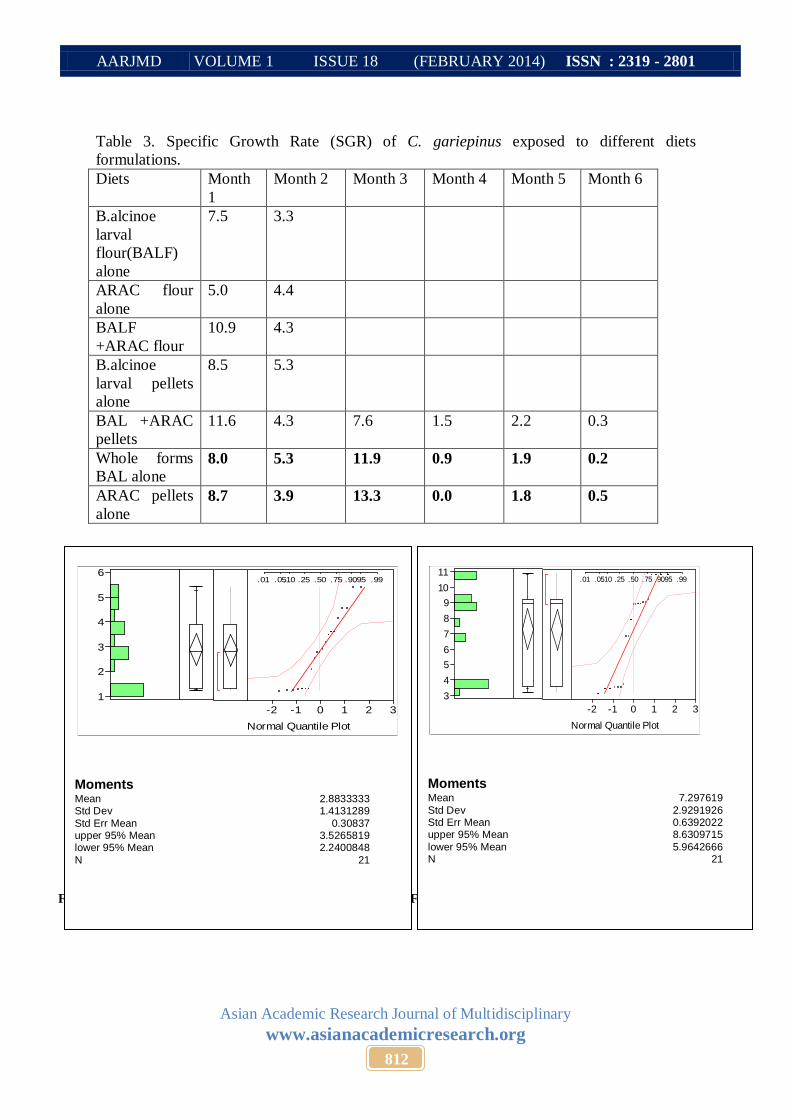
Table 3. Specific Growth Rate (SGR) of C. gariepinus exposed to different diets
formulations.
Diets Month
1
Month 2 Month 3 Month 4 Month 5 Month 6
B.alcinoe
larval
flour(BALF)
alone
7.5 3.3
ARAC flour
alone
5.0 4.4
BALF
+ARAC flour
10.9 4.3
B.alcinoe
larval pellets
alone
8.5 5.3
BAL +ARAC
pellets
11.6 4.3 7.6 1.5 2.2 0.3
Whole forms
BAL alone 8.0 5.3 11.9 0.9 1.9 0.2
ARAC pellets
alone
8.7 3.9 13.3 0.0 1.8 0.5
Fig 1a Mean Weight Distributions for Juvenile fishes Fig 1b. Mean Length Distributions for Juvenile fishes
3
4
5
6
7
8
9
10
11.01 .05.10 .25 .50 .75 .90.95 .99
-2 -1 0 1 2 3
Normal Quantile Plot
Moments Mean 7.297619
Std Dev 2.9291926 Std Err Mean 0.6392022 upper 95% Mean 8.6309715
lower 95% Mean 5.9642666 N 21
1
2
3
4
5
6.01 .05.10 .25 .50 .75 .90.95 .99
-2 -1 0 1 2 3
Normal Quantile Plot
Moments Mean 2.8833333 Std Dev 1.4131289
Std Err Mean 0.30837 upper 95% Mean 3.5265819 lower 95% Mean 2.2400848
N 21
AARJMD VOLUME 1 ISSUE 18 (FEBRUARY 2014) ISSN : 2319 - 2801
Asian Academic Research Journal of Multidisciplinary
www.asianacademicresearch.org
813
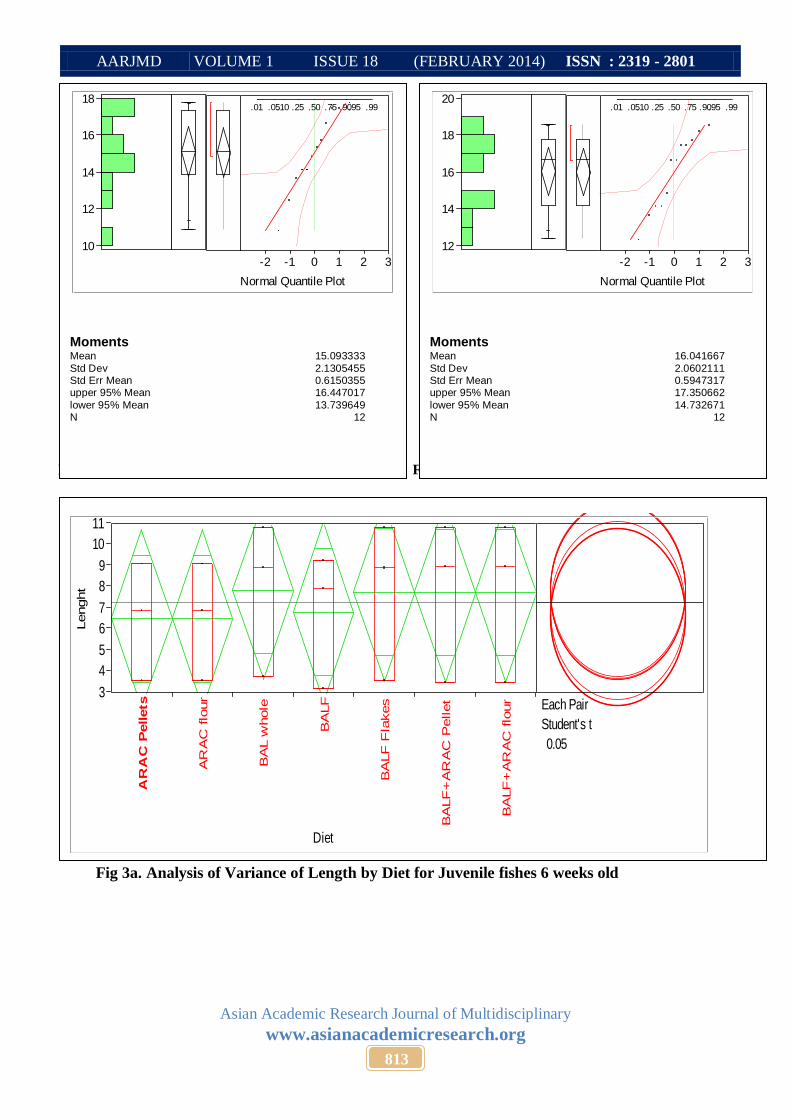
Fig 2a. Mean Weight Distributions for adult fishes Fig 2b. Mean Length Distributions for adult fishes
Fig 3a. Analysis of Variance of Length by Diet for Juvenile fishes 6 weeks old
12
14
16
18
20.01 .05.10 .25 .50 .75 .90.95 .99
-2 -1 0 1 2 3
Normal Quantile Plot
Moments Mean 16.041667
Std Dev 2.0602111 Std Err Mean 0.5947317 upper 95% Mean 17.350662
lower 95% Mean 14.732671 N 12
10
12
14
16
18.01 .05.10 .25 .50 .75 .90.95 .99
-2 -1 0 1 2 3
Normal Quantile Plot
Moments Mean 15.093333
Std Dev 2.1305455 Std Err Mean 0.6150355 upper 95% Mean 16.447017
lower 95% Mean 13.739649 N 12
Lenght
3
4
5
6
7
8
9
10
11
AR
AC
Pellets
AR
AC
flo
ur
BA
L w
hole
BA
LF
BA
LF
Fla
kes
BA
LF
+A
RA
C P
ellet
BA
LF
+A
RA
C flo
ur
Diet
Each Pair
Student's t
0.05
Analysis of Variance
Comparisons for each pair using Student's t
AARJMD VOLUME 1 ISSUE 18 (FEBRUARY 2014) ISSN : 2319 - 2801
Asian Academic Research Journal of Multidisciplinary
www.asianacademicresearch.org
814
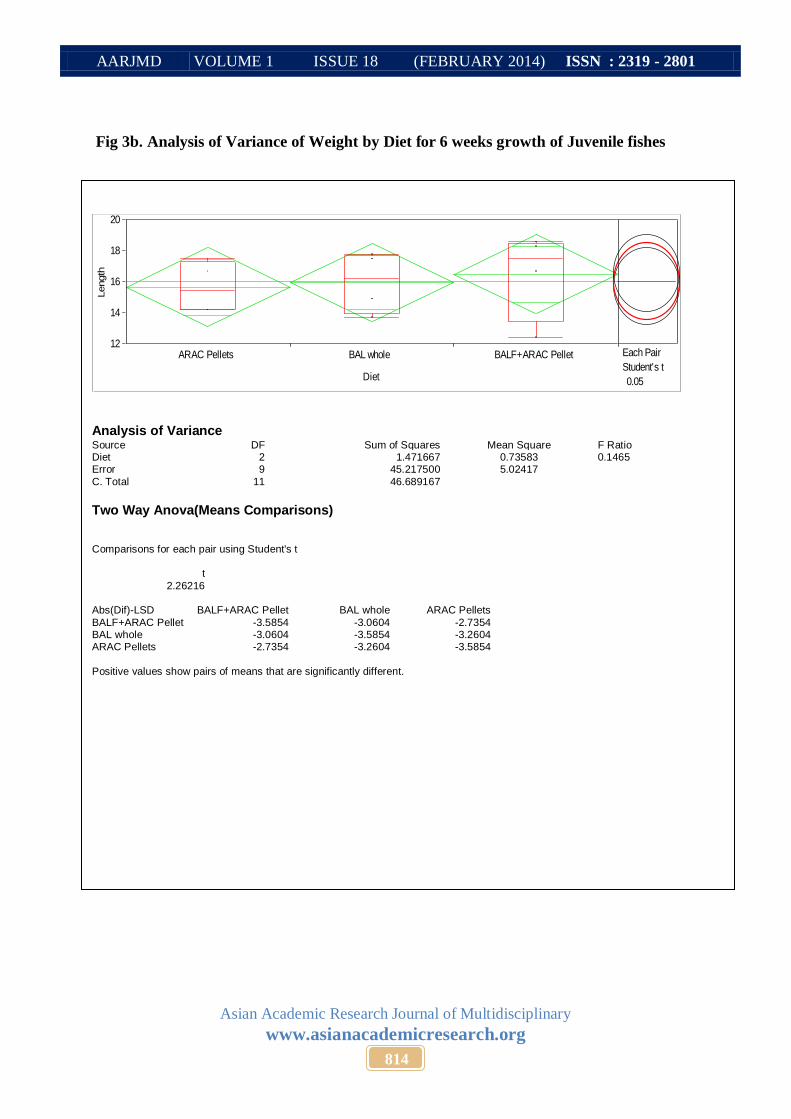
Fig 3b. Analysis of Variance of Weight by Diet for 6 weeks growth of Juvenile fishes
Length
12
14
16
18
20
ARAC Pellets BAL whole BALF+ARAC Pellet
Diet
Each Pair
Student's t
0.05
Analysis of Variance Source DF Sum of Squares Mean Square F Ratio Prob > F Diet 2 1.471667 0.73583 0.1465 0.8658 Error 9 45.217500 5.02417
C. Total 11 46.689167
Two Way Anova(Means Comparisons)
Comparisons for each pair using Student's t
t
2.26216 Abs(Dif)-LSD BALF+ARAC Pellet BAL whole ARAC Pellets
BALF+ARAC Pellet -3.5854 -3.0604 -2.7354 BAL whole -3.0604 -3.5854 -3.2604 ARAC Pellets -2.7354 -3.2604 -3.5854
Positive values show pairs of means that are significantly different.
AARJMD VOLUME 1 ISSUE 18 (FEBRUARY 2014) ISSN : 2319 - 2801
Asian Academic Research Journal of Multidisciplinary
www.asianacademicresearch.org
815
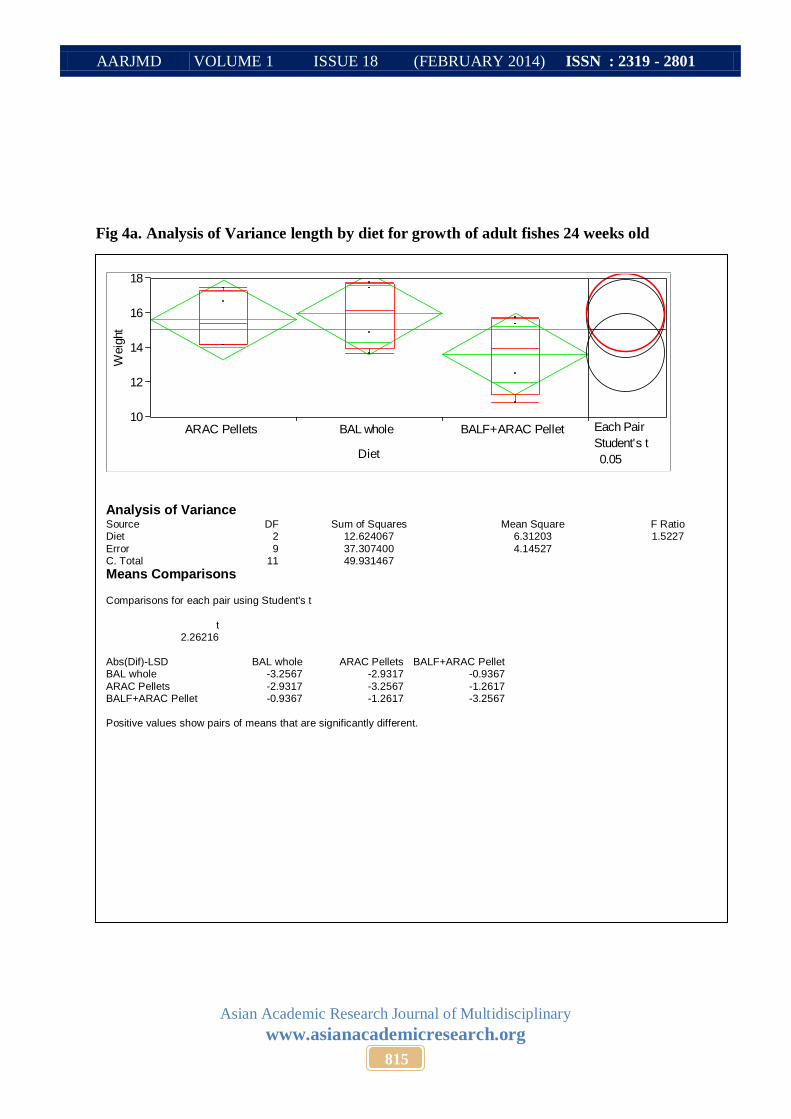
Fig 4a. Analysis of Variance length by diet for growth of adult fishes 24 weeks old
Weig
ht
10
12
14
16
18
ARAC Pellets BAL whole BALF+ARAC Pellet
Diet
Each Pair
Student's t
0.05
Analysis of Variance Source DF Sum of Squares Mean Square F Ratio Prob > F Diet 2 12.624067 6.31203 1.5227 0.2694
Error 9 37.307400 4.14527 C. Total 11 49.931467
Means Comparisons Comparisons for each pair using Student's t
t
2.26216
Abs(Dif)-LSD BAL whole ARAC Pellets BALF+ARAC Pellet BAL whole -3.2567 -2.9317 -0.9367
ARAC Pellets -2.9317 -3.2567 -1.2617 BALF+ARAC Pellet -0.9367 -1.2617 -3.2567
Positive values show pairs of means that are significantly different.
AARJMD VOLUME 1 ISSUE 18 (FEBRUARY 2014) ISSN : 2319 - 2801
Asian Academic Research Journal of Multidisciplinary
www.asianacademicresearch.org
816
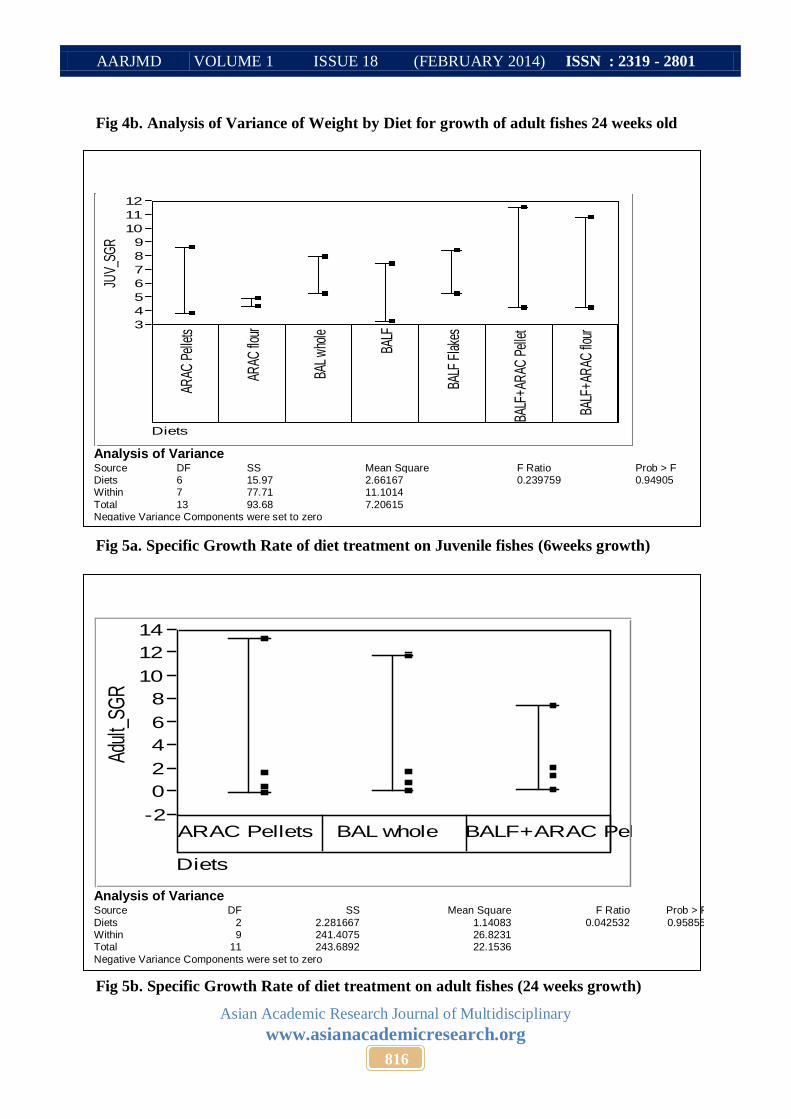
Fig 4b. Analysis of Variance of Weight by Diet for growth of adult fishes 24 weeks old
Fig 5a. Specific Growth Rate of diet treatment on Juvenile fishes (6weeks growth)
Fig 5b. Specific Growth Rate of diet treatment on adult fishes (24 weeks growth)
JUV_
SGR
3
4
5
6
7
8
9
10
11
12
ARAC
Pel
lets
ARAC
flou
r
BAL
who
le
BALF
BALF
Fla
kes
BALF
+AR
AC P
elle
t
BALF
+AR
AC fl
our
Diets
Analysis of Variance Source DF SS Mean Square F Ratio Prob > F Diets 6 15.97 2.66167 0.239759 0.94905 Within 7 77.71 11.1014
Total 13 93.68 7.20615 Negative Variance Components were set to zero
Adul
t_SG
R
-2
0
2
4
6
8
10
12
14
ARAC Pellets BAL whole BALF+ARAC Pellet
Diets
Analysis of Variance Source DF SS Mean Square F Ratio Prob > F
Diets 2 2.281667 1.14083 0.042532 0.95855 Within 9 241.4075 26.8231 Total 11 243.6892 22.1536
Negative Variance Components were set to zero
Related Documents