Poly(amidoamine) Dendrimers on Lipid Bilayers I: Free Energy and Conformation of Binding Christopher V. Kelly †,‡,§,∥ , Pascale R. Leroueil †,∥ , Elizabeth K. Nett ○ , Jeffery M. Wereszczynski ‡ , James R. Baker ∥,⊥ , Bradford G. Orr *,†,∥,∇ , Mark M. Banaszak Holl *,†,‡,§,∥,# , and Ioan Andricioaei *,∥,◆ Applied Physics Program, Biophysics, Graham Environmental Sustainability Institute, Michigan Nanotechnology Institute in Medicine and Biological Sciences, Department of Internal Medicine, Department of Chemistry, Department of Physics, University of Michigan, Ann Arbor, Michigan, Department of Biophysics, University of Wisconsin, Madison, Wisconsin, and Department of Chemistry, University of California, Irvine, California Abstract Third-generation (G3) poly(amidoamine) (PAMAM) dendrimers are simulated approaching 1,2- dimyristoyl-sn-glycero-3-phosphocholine (DMPC) bilayers with fully atomistic molecular dynamics, which enables the calculation of a free energy profile along the approach coordinate. Three different dendrimer terminations are examined: protonated primary amine, uncharged acetamide, and deprotonated carboxylic acid. As the dendrimer and lipids become closer, their attractive force increases (up to 240 pN) and the dendrimer becomes deformed as it interacts with the lipids. The total energy release upon binding of a G3–NH 3 + , G3–Ac, or G3–COO – dendrimer to a DMPC bilayer is, respectively, 36, 26, or 47 kcal/mol or, equivalently, 5.2, 3.2, or 4.7 × 10 –3 kcal/g. These results are analyzed in terms of the dendrimers’ size, shape, and atomic distributions as well as proximity of individual lipid molecules and particular lipid atoms to the dendrimer. For example, an area of 9.6, 8.2, or 7.9 nm 2 is covered on the bilayer for the G3–NH 3 + , G3–Ac, or G3–COO – dendrimers, respectively, while interacting strongly with 18–13 individual lipid molecules. Introduction Understanding the interaction of nanoparticles with biological membranes is of fundamental importance for both the design of effective nanodevices for medical applications and for avoiding unintended consequences from disruption of biological structures. Nanoparticles are chemically modified for precisely defined properties in attempts to create agents for gene © XXXX American Chemical Society * Corresponding authors. Phone: 734-763-2283(M.M.B.H.). Fax: 734-764-3323(M.M.B.H.). [email protected] (B.G.O.), [email protected] (M.M.B.H.), [email protected] (I.A.).. † Applied Physics Program, University of Michigan. ‡ Biophysics, University of Michigan. § Graham Environmental Sustainability Institute, University of Michigan. ∥ Michigan Nanotechnology Institute in Medicine and Biological Sciences, University of Michigan. ⊥ Department of Internal Medicine, University of Michigan. # Department of Chemistry, University of Michigan. ∇ Department of Physics, University of Michigan. ○ University of Wisconsin. ◆ University of California, Irvine. Supporting Information Available: Animations of G3–NH 3 + , G3–Ac, and G3–COO – binding to gel phase DMPC bilayer. This material is available free of charge via the Internet at http://pubs.acs.org. NIH Public Access Author Manuscript J Phys Chem B. Author manuscript; available in PMC 2010 August 23. Published in final edited form as: J Phys Chem B. 2008 August 7; 112(31): 9337–9345. doi:10.1021/jp801377a. NIH-PA Author Manuscript NIH-PA Author Manuscript NIH-PA Author Manuscript

Welcome message from author
This document is posted to help you gain knowledge. Please leave a comment to let me know what you think about it! Share it to your friends and learn new things together.
Transcript

Poly(amidoamine) Dendrimers on Lipid Bilayers I: Free Energyand Conformation of Binding
Christopher V. Kelly†,‡,§,∥, Pascale R. Leroueil†,∥, Elizabeth K. Nett○, Jeffery M.Wereszczynski‡, James R. Baker∥,⊥, Bradford G. Orr*,†,∥,∇, Mark M. BanaszakHoll*,†,‡,§,∥,#, and Ioan Andricioaei*,∥,◆Applied Physics Program, Biophysics, Graham Environmental Sustainability Institute, MichiganNanotechnology Institute in Medicine and Biological Sciences, Department of Internal Medicine,Department of Chemistry, Department of Physics, University of Michigan, Ann Arbor, Michigan,Department of Biophysics, University of Wisconsin, Madison, Wisconsin, and Department ofChemistry, University of California, Irvine, California
AbstractThird-generation (G3) poly(amidoamine) (PAMAM) dendrimers are simulated approaching 1,2-dimyristoyl-sn-glycero-3-phosphocholine (DMPC) bilayers with fully atomistic moleculardynamics, which enables the calculation of a free energy profile along the approach coordinate.Three different dendrimer terminations are examined: protonated primary amine, unchargedacetamide, and deprotonated carboxylic acid. As the dendrimer and lipids become closer, theirattractive force increases (up to 240 pN) and the dendrimer becomes deformed as it interacts withthe lipids. The total energy release upon binding of a G3–NH3
+, G3–Ac, or G3–COO– dendrimerto a DMPC bilayer is, respectively, 36, 26, or 47 kcal/mol or, equivalently, 5.2, 3.2, or 4.7 × 10⁻³
kcal/g. These results are analyzed in terms of the dendrimers’ size, shape, and atomic distributionsas well as proximity of individual lipid molecules and particular lipid atoms to the dendrimer. Forexample, an area of 9.6, 8.2, or 7.9 nm2 is covered on the bilayer for the G3–NH3
+, G3–Ac, orG3–COO– dendrimers, respectively, while interacting strongly with 18–13 individual lipidmolecules.
IntroductionUnderstanding the interaction of nanoparticles with biological membranes is of fundamentalimportance for both the design of effective nanodevices for medical applications and foravoiding unintended consequences from disruption of biological structures. Nanoparticlesare chemically modified for precisely defined properties in attempts to create agents for gene
© XXXX American Chemical Society*Corresponding authors. Phone: 734-763-2283(M.M.B.H.). Fax: 734-764-3323(M.M.B.H.). [email protected] (B.G.O.),[email protected] (M.M.B.H.), [email protected] (I.A.)..†Applied Physics Program, University of Michigan.‡Biophysics, University of Michigan.§Graham Environmental Sustainability Institute, University of Michigan.∥Michigan Nanotechnology Institute in Medicine and Biological Sciences, University of Michigan.⊥Department of Internal Medicine, University of Michigan.#Department of Chemistry, University of Michigan.∇Department of Physics, University of Michigan.○University of Wisconsin.◆University of California, Irvine.Supporting Information Available: Animations of G3–NH3+, G3–Ac, and G3–COO– binding to gel phase DMPC bilayer. Thismaterial is available free of charge via the Internet at http://pubs.acs.org.
NIH Public AccessAuthor ManuscriptJ Phys Chem B. Author manuscript; available in PMC 2010 August 23.
Published in final edited form as:J Phys Chem B. 2008 August 7; 112(31): 9337–9345. doi:10.1021/jp801377a.
NIH
-PA Author Manuscript
NIH
-PA Author Manuscript
NIH
-PA Author Manuscript
therapy and targeted drug delivery. As nanodevices approach a living animal cell, the firstinteraction is with the cellular plasma membrane. Nanometer-sized particles are especiallyeffective at penetrating the plasma membrane and altering the natural processes within thecell.1–8 Nanoparticles can be effective carriers of therapeutic cargos through the plasmamembrane, likely due to one of two internalization mechanisms: physical rupturing and poreformation1–3 or receptor-mediated, energy-dependent cellular processes, such asendocytosis.6–8
Synthetic polymer nanodevices have been developed from poly(lysine), poly(ethylenimine),and assorted dendrimers.9 Poly(amidoamine) (PAMAM) dendrimers are a widely studiedsynthetic polymer for both medical and basic science applications.10–12 Their structureincorporates the starburst addition of repeating units around the ethylenediamine core to thedesired generation (G) (Figure 1). Dendrimers are particularly useful due to their highhomogeneity (polydispersity index ≈1.01)2 and use as a framework in multifunctionalnanodevices. PAMAM dendrimers are natively terminated with primary amines and arecommonly modified by the covalent addition of small functional molecules (e.g.,chromophores, chemotherapeutics, targeting moieties) and less reactive terminations (e.g.,acetamide or hydroxyl) to create a nanodevice capable of targeting, binding, internalizing,labeling, and/or treating diseased cells.10,13–15
For example, acetylization of the PAMAM dendrimer's primary amine end groups canreduce nonspecific binding, enhance functional capabilities, and minimize nanoparticletoxicity.10,14–16 Positively charged nanoparticles are more likely to bind and internalize intocells than are the uncharged analogues.2,3 This strong relationship between nanoparticletermination and biological behavior demonstrates the importance of understanding themechanisms of nanoparticle–membrane interactions for effective nanodevice design.
Atomic force microscopy (AFM) has been used to experimentally study the effects ofPAMAM dendrimers on 1,2-dimyristoyl-sn-glycero-3-phosphocholine (DMPC) lipidbilayers with nanometer-scale resolution.17–19 Drastic differences in the dendrimer–lipidinteraction were observed for varying dendrimer termination. Charged G5 dendrimers at 20nM caused membrane disruption via removal of membrane material via the formation ofmembrane holes and the expansion of preexisting defects. In contrast, neutral G5 dendrimersat 20 nM did not cause as much membrane degradation but predominantly accumulatedaround the edge of preexisting holes without removing lipid molecules.
Ginzburg and Balijepalli20 have utilized continuum thermodynamic models to demonstratethe effects nanoparticle surface charge density has on membrane binding. This modelprovides a phase diagram of nanoparticle–membrane structures, including regimes ofnanoparticle binding within the bilayer's hydrophobic tails and enclosed within vesicles. Leeand Larson21 have looked at dendrimer–phospholipid binding in greater detail throughcoarse-grained simulations, providing qualitatively similar conclusions of nanoparticlecharge and size dependence on membrane disruption.
The research reported in this paper presents a quantitative analysis of molecular dynamicsimulations of the dendrimer–membrane binding process. To date, only a qualitative pictureexisted concerning the pore formation process by nanoparticles on lipid bilayers.20,21
Specifically, we examine the differences in energetics and forces of interaction betweencharged PAMAM dendrimers with zwitterionic DMPC bilayers. Three types of G3PAMAM dendrimers were examined: positively charged primary amine (G3–NH3
+),uncharged acetamide (G3–Ac), and negatively charged carboxyl (G3–COO–). TheCHARMM27 force field is used for atomistic Langevin dynamics simulations along aninteraction coordinate defined as the center-of-mass separation distance between the
Kelly et al. Page 2
J Phys Chem B. Author manuscript; available in PMC 2010 August 23.
NIH
-PA Author Manuscript
NIH
-PA Author Manuscript
NIH
-PA Author Manuscript

dendrimer and lipid bilayer. A distance-dependent dielectric function was used. A potentialof mean force is calculated along the interaction coordinate, from which the forces ofinteraction are extracted. Further, the dendrimers’ structure (radii of gyration, asphericities,and atomic distributions) and binding morphology are examined as a function of theirproximity to the lipid membrane.
MethodsUmbrella sampling22 and the weighted histogram analysis method (WHAM)23 wereemployed to extract the free energy of binding along the interaction coordinate defined asthe dendrimer and lipid bilayer center-of-mass separation distance. The potential of meanforce (PMF),24 or free energy, along the interaction coordinate (z) is extracted from thecoordinate's distribution function, averaged over all degrees of freedom as represented in theconfigurational vector (X):
(1)
with Boltzmann constant (kB), the temperature (T), and the CHARMM25 potential (V) withthe protein parameter set 22.26
The PMF along particular (slow) coordinates is a central concept in the statisticalmechanical representation of molecularsystemsandhasbeenwidelyusedincomputationalapplications27–30 The PMF reveals theequilibrium conformation (i.e., PMF minimum) and free energy changes. The negativegradient of the PMF is exactly the force averaged over the conformational ensemble.24 Inthe umbrella sampling calculation performed here long-time events along the interactioncoordinate are encouraged to happen within the nanosecond time scale by stepwise movingof the umbrella sampling window offset along the interaction coordinate.
The interaction coordinate (z), defined as the dendrimer–lipid center-of-mass separationdistance, was examined from values of 2.8–6.9 nm. Sampling dynamics occurred in equallyspaced windows along the interaction coordinate with 0.05 nm step size and a harmonicconfinement of the interaction coordinate to the window center by 500 kcal mol–1 nm–2. Tostart the simulations, the dendrimer and lipid bilayer were equilibrated with a harmonicconfinement to z = 6 nm for 500 ps. The result of this equilibration was used as the initialconditions for the production dynamics in the z = 6 nm window as well as the startingconfiguration for the equilibration at z = 5.95 nm, which lasted another 100 ps. The result ofthe equilibration at 5.95 nm was used to begin the z = 5.9 nm window equilibration and soforth until all windows from 6 to 2.8 nm were recursively equilibrated. Once each windowwas equilibrated, production runs were calculated in parallel for 4 ns per window withatomic configurations saved every 2 ps. To confirm that z > 6 nm was outside the interactionrange of the dendrimer with the lipid bilayers, further sampling windows were run for 6.05nm ≤ z ≤ 6.9 nm with identical recursive equilibration procedures starting from the z = 6 nmconfiguration and recursively stepping to larger z.
The interaction coordinate versus time was recorded during all production runs and laterused with WHAM to calculate the PMF.23,24 The recursive calculation of the PMF viaWHAM was performed until a fitting threshold of 0.001 kcal/mol was achieved.27 WHAMresults for the PMF were demonstrated to be dependent on the threshold such that morestringent thresholds resulted in a difference smaller than that between the PMF at z = 6 nmand z = 6.9 nm. Since the PMF at this extended range is flat and a sufficiently low threshold
Kelly et al. Page 3
J Phys Chem B. Author manuscript; available in PMC 2010 August 23.
NIH
-PA Author Manuscript
NIH
-PA Author Manuscript
NIH
-PA Author Manuscript
value was too costly to compute, a linear fit to the PMF was calculated for z = 6.0–6.9 nmand subtracted for the entirety of the PMF.
The initial structure for the DMPC bilayer originated from a preequilibrated patch of 32lipid molecules replicated 16 times to create a single patch with 512 lipid molecules, fromwhich a 10 nm diameter circular disk was extracted. Lipid equilibration occurred at everystep during the creation of the final 10 nm patch for greater than 200 ps each. Theequilibrated DMPC disk consisted of 263 phospholipid molecules at a lipid density (60 Å2/lipid) and bilayer thickness (4.3 nm) in agreement with experimental measurements ofDMPC bilayers.31,32
The focus of this paper is the examination of binding of dendrimers to a membrane withbiological relevance. The primary contribution to the initial binding of dendrimers tomembranes was thought to be the interaction between the charged dendrimer moieties withthe polar lipid head groups.33–35
Subsequently, the hydrophobic dendrimer moieties and lipid tails are likely playing animportant factor in the later pore formation and penetration of the dendrimer into the bilayer.This manuscript focuses on the initial binding of dendrimers to the lipid bilayer surface. Assuch, in the interest of computational efficiency, the lipid tail atoms have been fixed inlocation. Indeed, the PMF computations were not feasible allowing full lipid mobility. Thisapproximation limits the lateral and vertical motion of the individual lipid molecules andprevents lipid tail rearrangement from being incorporated into the resulting energeticcalculations. This lipid tail fixation is not expected to significantly affect the binding forlarge dendrimer–lipid separations (z ≥ 4 nm) but does affect the binding at smallerseparations. The effects of this approximation, and the influence of lipid tail mobility ingeneral, is the subject of a companion article.36
Three different PAMAM dendrimers of varying surface chemistry are simulated withDMPC bilayers using the CHARMM27 parameters for lipids37 and, for dendrimers,parameters from set 22, within the CHARMM c32b2 academic software package.37,38 TheG3 dendrimers natively contain 32 terminal groups, a net zero charge, and 1092 atomsbefore modifying the terminal chemistry. The terminations are modified to yield the G3–NH3
+, G3–Ac, and G3–COO– dendrimers (Figure 1), to make the dendrimers representativeof a physiological pH 7 environment.39 Dendrimer properties are given in Table 1 with eachprotonated primary amine terminal group having a +e charge and each deprotonatedcarboxylic acid terminal group having a –e charge. This yields three different dendrimersterminations giving the dendrimers a net charge of +32e, 0, or –32e. The initial structure forthe dendrimer was generated by a recursive script in CHARMM38 and equilibrated for over400 ps in the absence of lipids. At this point the temperature, potential energy, and radius ofgyration were stabilized. All images of the molecular structure within this manuscript werecreated with the software VMD.40
Electrostatic interactions are modeled with spatially dependent screening incorporated by anr-dependent dielectric function of the type ε(r) = 4r.41 This model accounts for the enthalpicelectrostatic screening effects of the solvent and counterions but does not incorporatesolvent or counterion entropic effects. Nonbonded interactions are cut off for atom–atomseparation distances greater than 1.3 nm and switched at 0.8 nm.
The accuracy of the distance-dependent dielectric function on the dendrimer structure hasbeen previously compared to molecular dynamics in explicit water with counterions withsatisfactory results.17,41–44 Although the 4r-dependent dielectric solvent model is anapproximation relative to explicit water solvation, the size of these simulations, ifsurrounded by appropriate explicit solvent molecules, would have created a system with a
Kelly et al. Page 4
J Phys Chem B. Author manuscript; available in PMC 2010 August 23.
NIH
-PA Author Manuscript
NIH
-PA Author Manuscript
NIH
-PA Author Manuscript

volume of 3600 nm3 and 260 000 atoms. Already, simulation of the system with implicitsolvent is computationally challenging, especially for the highly demanding process ofdeveloping a PMF, as is performed here. Similar calculations using explicit water arecurrently too computationally demanding. The distance-dependent dielectric simulations weperform provide new, meaningful details of the energetics and morphology of dendrimer–phospholipid binding, while avoiding drawbacks that explicit solvent simulations mayincorporate, such as excessive computation time impeding the achievement of ergodicity,slow water equilibration, or insufficient averaging of counterion distribution.
As an example of current difficulties using explicit solvent, recently Changand Violi45 haveperformed similar nanoparticle–lipid bilayer molecular dynamics on a considerably smallersystem and had difficulty achieving adequate equilibration of the explicit solvent. Theirstudy of lipid–nanoparticle interactions includes a carbon nanoparticle ( the size of theG3 dendrimer) and demonstrates hysteresis effects over the course of the simulations due tothe initial water molecule positions and slow water equilibration times. Therefore, the use ofimplicit solvent will be necessary for computational studies of the dynamics of nanoparticlesand membranes for the time being, especially nanoparticles of the relatively large size andinternal complexity of dendrimers.
An alternative to the 4r dielectric function is the use of generalized Born solvation models.46–48 For example, implicit solvent models using the analytical continuum electrostatics(ACE) or generalized Born using molecular volume (GBMV) analysis49,50 have beeneffectively utilized with the CHARMM force field to study protein folding/unfolding.51,52
ACE and GBMV and other models53 have demonstrated, for proteins, good agreement withthe thermal unfolding properties reported by experiments and MD simulations with explicitwater (with exceptions such as differences in solvent dynamics leading to a dewettingtransition.)54–56 However, our tentative utilization of generalized Born implicit solventmodels within simulations of dendrimers and lipids yielded results that were unsatisfactorybecause of the lack of well-established parameters for solvation of lipids in water.
Although an explicit atomic representation of water molecules is the most accurate means toaccount for the effect of the solvent on molecular kinetics and thermodynamics,55,56 wealready have presented the computational limitations regarding the simulation for 129windows for >35 000 dendrimer and lipid atoms in addition to explicit solvent atoms.Additionally the implicit solvent model enhances computational time due throughinstantaneous (adiabatic) equilibration of implicit water around the solute. If water would beexplicitly represented, it would be out of equilibrium for this duration and the objective ofsimulating representative dendrimer dynamics in equilibrated water would not be obtained.Implicit representation is not necessarily a poorer choice in this regard because it maintainsthe time scale separation of water dynamics and dendrimer dynamics by instantaneousrelaxation akin to an adiabatic separation. Given these considerations, in combination withthe necessity of many trajectories to sample even the most probable conformationsreasonably well, we have opted for an implicit water representation.
The constant temperature ensemble was generated using Langevin dynamics to simulate thethermal fluctuations within an implicit solvent by incorporating random fluctuations, (Ri(t)),and a damping constant (γ) into Newton's equations, as shown in eq 2. xi represents theposition of the ith atom of mass mi in CHARMM potential V:
(2)
Kelly et al. Page 5
J Phys Chem B. Author manuscript; available in PMC 2010 August 23.
NIH
-PA Author Manuscript
NIH
-PA Author Manuscript
NIH
-PA Author Manuscript

The friction coefficient γ is related to Ri(t) by fluctuation–dissipation; ⟨Ri(0) · Ri(t)⟩ =2mikBTγδ(t). For bulk water, γ = 91 ps–1. During equilibration, γ was decreased to 10 ps–1
because lower γ values accelerate molecular kinetics while yielding identical equilibriumstructures. During dynamics, we set γ = 50 ps–1 to mimic the decreased viscosity within thedendrimer. During both equilibration and production runs, the temperature was set to 300 K.
Results and DiscussionThe binding of G3–NH3
+, G3–Ac, and G3–COO– to DMPC bilayers was simulated (Figure2). The energetics, macromolecular structure, and mechanisms of interaction are examinedwith atomistic detail. The PMF has been calculated along the interaction coordinate definedas the center-of-mass separation for the dendrimer–lipid system from 2.8 to 6.9 nm (Figure3). The charged dendrimers (G3–NH3
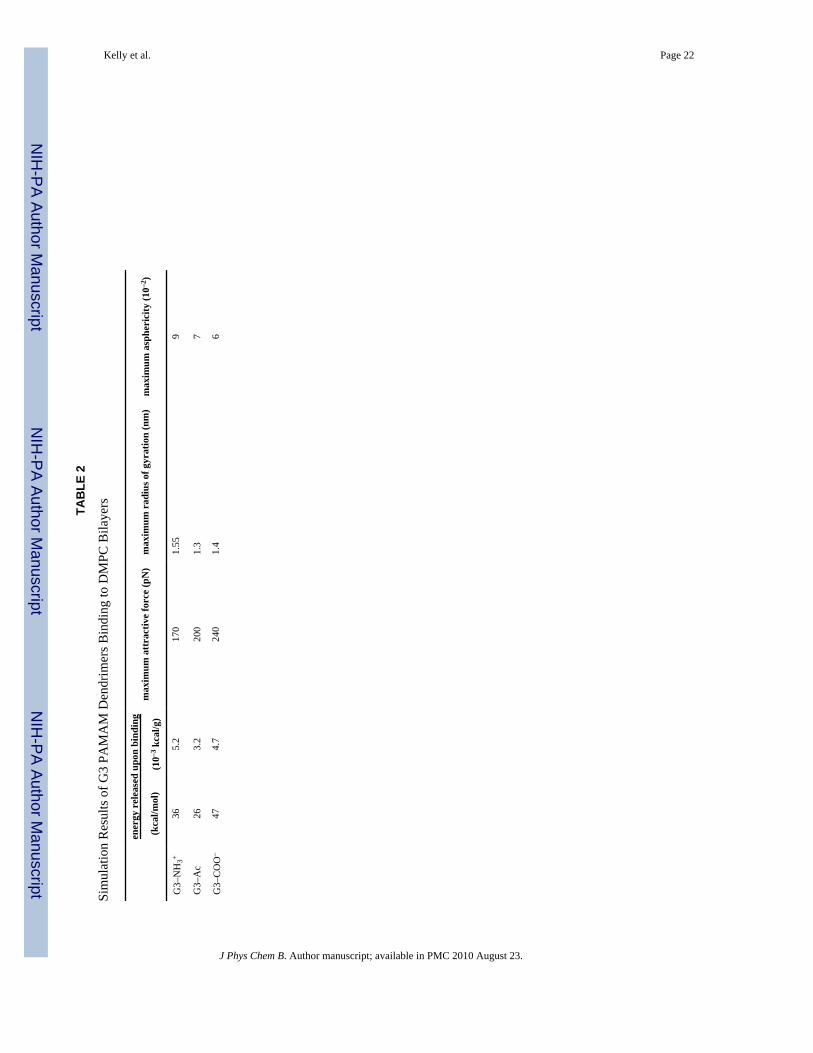
+ and G3–COO–3) are more strongly attracted to thelipids than the uncharged dendrimer (G3–Ac). As listed in Table 2, the total free energyreleased upon interaction with the bilayer is 36, 26, and 47 kcal/ mol for G3–NH3
+, G3–Ac,and G3–COO–, respectively. The majority of the released energy occurs at smallerseparation distances, where the dendrimer and lipid have made contact and the attractiveforce is large. Within these simulations, G3–COO– released the most energy per moleculeupon binding to the DMPC bilayer; however, G3–NH3
+ released the most energy per mass.As shown in Figure 3B and Table 2 with the mass-weighted energy release of binding perdendrimer is 5.2, 3.2, and 4.7 × 10⁻³ kcal/g for G3–NH3
+, G3–Ac, and G3–COO–,respectively. In both the per-molecule and per-mass analyses, G3–Ac released the leastenergy upon binding.
The derivative of the PMF as a function of the interaction coordinate is the mean forcebetween the dendrimer and lipid bilayer (Figure 4). The attractive force between thedendrimers and lipid bilayers ranged from 0 to 240 pN (Table 2), depending on dendrimertermination and dendrimer–lipid separation distance. The attractive force increases ascontact is made between the dendrimer and lipids and decreases to zero as the dendrimer andlipid approach their equilibrium separation distances of z ≈ 3 nm. The attractive force beforecontact is made (z > 4.5 nm) seems to depend only on the magnitude of dendrimer chargeand not on the sign of the charge; G3–NH3
+ and G3–COO– have similar forces of attraction(≈35 pN) in this range. At distances z < 4.5 nm, variables such as number of atoms perdendrimer and terminal group size contribute to the differences between the dendrimers. Themaximum attractive force is greatest for the carboxyl dendrimer, the largest of the threedendrimers examined.
The dendrimer structure is affected by the lipids, as quantified by the dendrimers’ radii ofgyration within each umbrella sampling window. A dendrimer's radius of gyration (RG)represents the magnitude by which the dendrimer atoms are stretched out away from theirclose-packed state. RG is calculated according to eq 3, incorporating the dendrimer's mass(M) and center of mass (x0), in addition to each dendrimer atom's mass (mi) and position(xi):
(3)
The radius of gyration increases, by 19% on average, as the dendrimer approaches the lipids(Figure 5A). As the system becomes close to the equilibrium separation (z < 3.7 nm) theradius of gyration decreases to approximately the initial, isolated values. The dendrimerelongates in response to the interactions with the lipid and settles into an equilibrated sizesimilar to that without the influence of lipids. Throughout the entire range of interaction
Kelly et al. Page 6
J Phys Chem B. Author manuscript; available in PMC 2010 August 23.
NIH
-PA Author Manuscript
NIH
-PA Author Manuscript
NIH
-PA Author Manuscript

coordinate, the size of the three dendrimers is ordered as G3-NH3+ > G3–COO–3 > G3–Ac,
with the smallest mass dendrimer demonstrating the largest RG.
The asphericity (A) is a quantifiable description of how deformed from a reference sphericalshape the dendrimer has become (Figure 5B). The asphericity has been calculated accordingto eq 4 by comparing the eigenvectors Ix,y,z of the dendrimer's moment of inertia matrix:57
(4)
The three dendrimers in this study have similar asphericity (A = 0.014) at z ≈ 6 nm, whichdemonstrates the slight asymmetry in the PAMAM dendrimer core. As the dendrimer andlipids become closer, the asphericities of the dendrimers increase to A ≥ 0.06 at z ≈ 4.2 nm,a 4.3-fold increase. With further decrease in separation, the dendrimer returns to a nearspherical shape and settles into the equilibrium interaction coordinate, z ≈ 3 nm, with A =0.015.
Upon decreasing dendrimer–lipid separation distance the dendrimer stretches normal to thebilayer for greater contact with the lipids. This transition to larger asphericity occurssimultaneously with the increasing dendrimer radius of gyration, increased attractive forceto the bilayer, and initial contact between the dendrimer and lipids. The charged dendrimerscontact the bilayer at z = 5.1 nm, whereas the uncharged dendrimer does not contact thebilayer until z = 4.5 nm (Figure 2).
Turning from these average quantities, it is useful to examine the distribution of thedendrimer atoms in more detail. This can provide an understanding of the dendrimerstructural change upon binding. Normalized histograms of radial atomic positions from thedendrimers’ centers of mass demonstrate the distribution of dendrimer atoms (Figure 6A–C)and the terminations (Figure 6D–F). At large bilayer–dendrimer separation, the atoms withinthe dendrimer are distributed with nearly uniform density. Specifically, the dendrimerterminal groups are distributed throughout the dendrimer with both large and smallseparation distances. This may be surprising, as the terminal groups might be expected toform an outer shell due to electrostatics. At z = 4.5 nm the charged terminal groups arepulled away from the dendrimer center as they become attracted to the DMPC bilayer.
The atomic details of the dendrimer-lipid interaction have been examined at the equilibriumseparation distance for all three dendrimers on the DMPC bilayer. Each atom in the DMPCmolecule has been compared by its proximity to the dendrimer, and differences in thebinding morphology of the three dendrimers are identified. The individual atoms on the lipidmolecules, as labeled in Figure 7A, have been examined via counting how many of eachDMPC atom type are within 2, 3, 4, 5, or 6 Å of the dendrimer (Figure 7B). This analysisconsiders all DMPC atoms of identical structure as a single type, and the resulting count isnormalized by the degeneracy of each atom type. The data of Figure 7B has been furthercompared in Figure 7C by subtracting the data of G3–Ac from the data of G3–NH3
+ andG3–COO–. In this way the binding morphology of the charged terminal groups can be moreclearly observed. Conclusions from this data include (1) fewer positively charged cholineatoms are close to G3–NH3
+, (2) more negatively charged phosphate atoms are close to G3–NH3
+, (3) fewer negatively charged phosphate atoms are close to G3–COO–, and (4) G3–NH3
+ are able to penetrate deeper into the DMPC bilayer and closer to more of the glycerolatoms.
Kelly et al. Page 7
J Phys Chem B. Author manuscript; available in PMC 2010 August 23.
NIH
-PA Author Manuscript
NIH
-PA Author Manuscript
NIH
-PA Author Manuscript
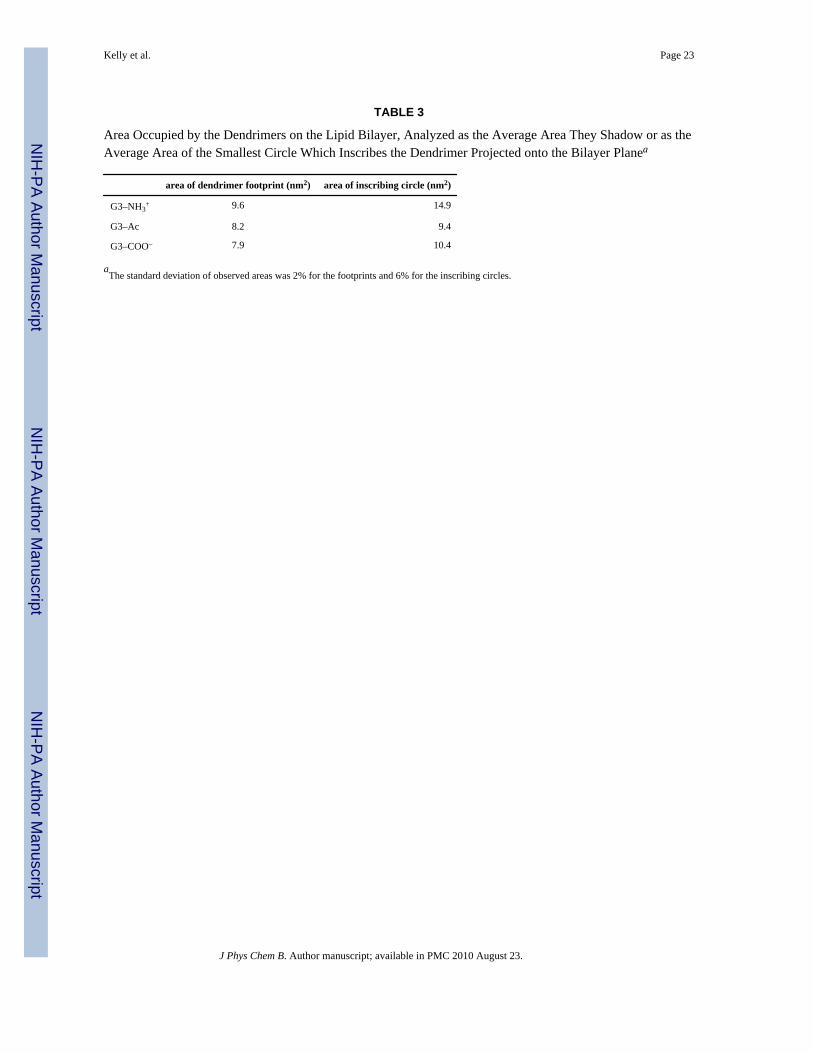
The morphology of the equilibrated structure is examined in terms of the area that thedendrimers occupy over the lipid bilayer. The dendrimers cover an area of 9.6, 8.2, or 7.9nm2 for G3–NH3
+, G3–Ac, or G3–COO–, respectively, with G3–NH3+ flattening out the
most in covering the greatest area of lipids. This analysis measures the footprint, or the areaof their shadow on the lipids. The structures have also been examined by the area of thesmallest circle inscribing the projection of the dendrimer onto the bilayer plane. Thesmallest circles containing the dendrimer have area of 14.9, 9.4, or 10.4 nm2 for G3–NH3
+,G3–Ac, or G3–COO–, respectively. By comparing the size of the inscribing circle to the sizeof the dendrimer footprint, it is revealed how spherically symmetrical and dense thedendrimers are over the bilayer. G3–NH3
+ stretches out the farthest on the bilayer, asrepresented by its largest inscribing circle. These effects are observed qualitatively in the topview of the bound dendrimers in Figure 8. Interestingly, G3–COO– is the largest massdendrimer but displays the smallest footprint upon binding to the lipids. This is one of themany ways by which the longer termination of G3–COO– affects atomic structure and yieldsconsiderable differences from the other terminations.
A final analysis of the morphology of the dendrimers equilibrated on the DMPC bilayerswas performed with a Voronoi diagram (Figure 8A–C).58 Each circle represents the centerof mass of a DMPC molecule on the top bilayer leaflet projected onto the bilayer plane. Thethin black lines represent the division between DMPC molecules and those points that arehalfway between the two closest lipids. This representation provides a mapping of the topDMPC leaflet with which we can map which DMPC molecules are strongly interacting withthe bound dendrimers. This has been represented by a coloration of the DMPC molecules onthe Voronoi diagram. DMPC molecules that are within 3 Å of the dendrimer for 100% of theacquired simulation frames of the equilibrated structure are colored red; those that are within3 Å of the dendrimer in 50–100% of frames are colored green, and 1–50% are colored blue.
The surprising result from these Voronoi diagrams is the similarity between the number anddistribution of lipids in close proximity to the dendrimers, regardless of the dendrimertermination. All three dendrimers are within 3 Å of 12–13 particular lipid molecules in all ofthe simulation frames, 5–8 lipids are within 3 Å for 50–100% of the frames, and 3–4 lipidsare within 3 Å for 1–50% of the frames. Variations between dendrimer bindingmorphologies (number of lipids, likelihood of switching between lipids, etc.) as a functionof dendrimer termination are possible, although not observed over this time scale. Combinedanalysis of Figure 8 and Table 3 provides a quantitative understanding of boundconfiguration of a G3 PAMAM dendrimer on a DMPC bilayer.
ConclusionsSimulations using an implicit solvent model have been performed to quantitatively analyzethe interaction between G3 PAMAM dendrimers, of varying terminal chemistry, to DMPCbilayers. These simulations have the advantage of making quantitative PMF calculationscomputationally feasible but are unable to include solvent or counterion entropic effects.The qualitative conclusions from these simulations are identical to those observedexperimentally: charged dendrimers more favorably interact with zwitterionic membranesthan do neutral dendrimers. Additionally, these simulations provide a quantitativedescription of this interaction. An average force of 35 pN attracts the charged dendrimers tothe lipid before the dendrimer and lipid make contact with each other. In contrast, neutraldendrimers have negligible interactions. After the dendrimer has made contact with thelipids, average attractive forces of 170, 200, and 240 pN are observed for G3–NH3
+, G3–Ac,and G3–COO–, respectively. A net free energy release for dendrimer binding to the DMPCbilayers is measured to be 36, 26, 47 kcal/mol and 5.2, 3.2, 4.7 × 10⁻³ kcal/g for G3–NH3
+,G3–Ac, and G3–COO–, respectively.
Kelly et al. Page 8
J Phys Chem B. Author manuscript; available in PMC 2010 August 23.
NIH
-PA Author Manuscript
NIH
-PA Author Manuscript
NIH
-PA Author Manuscript
These results are directly applicable to nanodevice design, or other nanoparticles, formedical purposes. This research contributes to the growing understanding of the criticalimportance of nanoparticle size and surface chemistry to biological activity. Nanodevicesutilized for gene delivery applications commonly exploit cationic nanoparticles for strongbinding to nucleic acids.9,10,60–62 However, targeting these gene delivery nanodevices ischallenging due to the influence of the remaining charged terminal groups. By furthercomparing the forces and energies of nonspecific nanoparticle binding to relevant systemcomponents, such as targeting moieties and cellular receptors, optimized nanoparticles canbe designed and implemented.
Supplementary MaterialRefer to Web version on PubMed Central for supplementary material.
AcknowledgmentsC.V.K. received fellowship support from the NIH Michigan Molecular Biophysics Training Program (T32GM008270-20), the Applied Physics Program, and the Graham Environmental Sustainability Institute.Computational time was provided by the Center for Advanced Computing at the University of Michigan andLawrence Livermore National Laboratory. The authors thank Christine Orme and Timothy Sullivan. This researchwas supported by a Grant from the National Institute of Biomedical Imaging and BioEngineering (R01-EB005028).I.A. gratefully acknowledges support from the NSF CAREER award program (CHE-0548047).
References and Notes1. Hong SP, Bielinska AU, Mecke A, Keszler B, Beals JL, Shi XY, Balogh L, Orr BG, Baker JR, Holl
MMB. Interaction of poly(amidoamine) dendrimers with supported lipid bilayers and cells: Holeformation and the relation to transport. Bioconjugate Chem 2004;15(4):774–782.
2. Hong SP, Leroueil PR, Janus EK, Peters JL, Kober MM, Islam MT, Orr BG, Baker JR, Holl MMB.Interaction of polycationic polymers with supported lipid bilayers and cells: Nanoscale holeformation and enhanced membrane permeability. Bioconjugate Chem 2006;17(3):728–734.
3. Leroueil PR, Hong SY, Mecke A, Baker JR, Orr BG, Holl MMB. Nanoparticle interaction withbiological membranes: Does nanotechnology present a janus face. Acc. Chem. Res 2007;40(5):335–342. [PubMed: 17474708]
4. Qiao R, Roberts AP, Mount AS, Klaine SJ, Ke PC. Translocation of C-60 and its derivatives acrossa lipid bilayer. Nano Lett 2007;7(3):614–619. [PubMed: 17316055]
5. Xing XL, He XX, Peng JF, Wang KM, Tan WH. Uptake of silica-coated nanoparticles by HeLacells. J. Nanosci. Nanotechnol 2005;5(10):1688–1693. [PubMed: 16245529]
6. Manunta M, Nichols BJ, Tan PH, Sagoo P, Harper J, George AJT. Gene delivery by dendrimersoperates via different pathways in different cells, but is enhanced by the presence of caveolin. J.Immunol. Methods 2006;314(1–2):134–146. [PubMed: 16893551]
7. Chithrani BD, Ghazani AA, Chan WCW. Determining the size and shape dependence of goldnanoparticle uptake into mammalian cells. Nano Lett 2006;6(4):662–668. [PubMed: 16608261]
8. Manunta M, Tan PH, Sagoo P, Kashefi K, George AJT. Gene delivery by dendrimers operates via acholesterol dependent pathway. Nucleic Acids Res 2004;32(9):2730–2739. [PubMed: 15148360]
9. Pack DW, Hoffman AS, Pun S, Stayton PS. Design and development of polymers for gene delivery.Nat. Rev. Drug Discovery 2005;4(7):581–593.
10. Quintana A, Raczka E, Piehler L, Lee I, Myc A, Majoros I, Patri AK, Thomas T, Mule J, Baker JR.Design and function of a dendrimer-based therapeutic nanodevice targeted to tumor cells throughthe folate receptor. Pharm. Res 2002;19(9):1310–1316. [PubMed: 12403067]
11. Duncan R, Izzo L. Dendrimer biocompatibility and toxicity. Adv. Drug Delivery Rev 2005;57(15):2215–2237.
12. Tomalia DA. Birth of a new macromolecular architecture: dendrimers as quantized building blocksfor nanoscale synthetic polymer chemistry. Prog. Polym. Sci 2005;30(3–4):294–324.
Kelly et al. Page 9
J Phys Chem B. Author manuscript; available in PMC 2010 August 23.
NIH
-PA Author Manuscript
NIH
-PA Author Manuscript
NIH
-PA Author Manuscript
13. Landmark KJ, DiMaggio S, Ward J, Kelly CV, Vogt S, Hong S, Kotlyar A, Penner-Hahn JE,James R, Baker J, Holl MMB, Orr BG. Synthesis, characterization, and in vitro testing ofsuperparamagnetic iron oxide nanoparticles targeted using folic acid-conjugated dendrimers. ACSNano 2008;2(4):773–783. [PubMed: 19206610]
14. Majoros IJ, Thomas TP, Mehta CB, Baker JR. Poly(amidoamine) dendrimer-based multifunctionalengineered nanodevice for cancer therapy. J. Med. Chem 2005;48(19):5892–5899. [PubMed:16161993]
15. Patri AK, Majoros IJ, Baker JR. Dendritic polymer macromolecular carriers for drug delivery.Curr. Opin. Chem. Biol 2002;6(4):466–471. [PubMed: 12133722]
16. Choi Y, Baker JR. Targeting cancer cells with DNA-assembled dendrimerss—A mix and matchstrategy for cancer. Cell Cycle 2005;4(5):669–671. [PubMed: 15846063]
17. Mecke A, Lee I, Baker JR, Holl MMB, Orr BG. Deformability of poly(amidoamine) dendrimers.Eur. Phys. J. E 2004;14(1):7–16. [PubMed: 15221586]
18. Mecke A, Majoros IJ, Patri AK, Baker JR, Holl MMB, Orr BG. Lipid bilayer disruption bypolycationic polymers: The roles of size and chemical functional group. Langmuir 2005;21(23):10348–10354. [PubMed: 16262291]
19. Mecke A, Uppuluri S, Sassanella TM, Lee DK, Ramamoorthy A, Baker JR, Orr BG, Holl MMB.Direct observation of lipid bilayer disruption by poly(amidoamine) dendrimers. Chem. Phys.Lipids 2004;132(1):3–14. [PubMed: 15530443]
20. Ginzburg VV, Balijepalli S. Modeling the thermodynamics of the interaction of nanoparticles withcell membranes. Nano Lett 2007;7(12):3716–3722. [PubMed: 17983249]
21. Lee H, Larson RG. Molecular dynamics simulations of PAMAM dendrimer-induced poreformation in DPPC bilayers with a coarse-grained model. J. Phys. Chem. B 2006;110:18204–18211. [PubMed: 16970437]
22. Torrie GM, Valleau JP. Nonphysical sampling distributions in Monte-Carlo free-energyestimationsumbrella sampling. J. Comput. Phys 1977;23(2):187–199.
23. Kumar S, Bouzida D, Swendsen RH, Kollman PA, Rosenberg JM. The weighted histogramanalysis method for free-energy calculations on biomolecules 0.1. the method. J. Comput. Chem1992;13(8):1011–1021.
24. Kirkwood J. Statistical mechanics of fluid mixtures. J. Chem. Phys 1935;3:300–313.25. Brooks BR, Bruccoleri RE, Olafson BD, States DJ, Swaminathan S, Karplus M. Charmms—a
program for macromolecular energy, minimization, and dynamics calculations. J. Comput. Chem1983;4(2):187–217.
26. MacKerell AD, Bashford D, Bellott M, Dunbrack RL, Evanseck JD, Field MJ, Fischer S, Gao J,Guo H, Ha S, Joseph-McCarthy D, Kuchnir L, Kuczera K, Lau FTK, Mattos C, Michnick S, NgoT, Nguyen DT, Prodhom B, Reiher WE, Roux B, Schlenkrich M, Smith JC, Stote R, Straub J,Watanabe M, Wiorkiewicz-Kuczera J, Yin D, Karplus M. All-atom empirical potential formolecular modeling and dynamics studies of proteins. J. Phys. Chem. B 1998;102(18):3586–3616.
27. Roux B. The calculation of the potential of mean force using computer-simulations. Comput. Phys.Commun 1995;91(1–3):275–282.
28. Mitchell JBO, Laskowski RA, Alex A, Thornton JM. BLEEP—Potential of mean force describingprotein–ligand interactions: I. Generating potential. J. Comput. Chem 1999;20:1165–1176.
29. Roux B, Karplus M. Ion-transport in a model gramicidin channels—structure and thermodynamics.Biophys. J 1991;59:961–981. [PubMed: 1714305]
30. Sprik M, Ciccotti G. Free energy from constrained molecular dynamics. J. Chem. Phys1998;109:7737–7744.
31. Johnson SJ, Bayerl TM, McDermott DC, Adam GW, Rennie AR, Thomas RK, Sackmann E.Structure of an adsorbed dimyristoylphosphatidylcholine bilayer measured with specular reflectionof neutrons. Biophys. J 1991;59(2):289–294. [PubMed: 2009353]
32. Kucerka N, Liu YF, Chu NJ, Petrache HI, Tristram-Nagle ST, Nagle JF. Structure of fullyhydrated fluid phase DMPC and DLPC lipid bilayers using X-ray scattering from orientedmultilamellar arrays and from unilamellar vesicles. Biophys. J 2005;88(4):2626–2637. [PubMed:15665131]
Kelly et al. Page 10
J Phys Chem B. Author manuscript; available in PMC 2010 August 23.
NIH
-PA Author Manuscript
NIH
-PA Author Manuscript
NIH
-PA Author Manuscript
33. Zhang ZY, Smith BD. High-generation polycationic dendrimers are unusually effective atdisrupting anionic vesicles: Membrane bending model. Bioconjugate Chem 2000;11(6):805–814.
34. Karoonuthaisiri N, Titiyevskiy K, Thomas JL. Destabilization of fatty acid-containing liposomesby polyamidoamine dendrimers. Colloids Surf., B 2003;27(4):365–375.
35. Fischer D, Li YX, Ahlemeyer B, Krieglstein J, Kissel T. In vitro cytotoxicity testing ofpolycations: influence of polymer structure on cell viability and hemolysis. Biomaterials2003;24(7):1121–1131. [PubMed: 12527253]
36. Kelly CV, Leroueil PR, Orr BG, Holl MMB, Andricioaei I. Poly(amidoamine) dendrimers on lipidbilayers II: effects of bilayer phase and dendrimer termination. J. Phys. Chem. B 2008;112:xxxx.
37. Feller SE, MacKerell AD. An improved empirical potential energy function for molecularsimulations of phospholipids. J. Phys. Chem. B 2000;104(31):7510–7515.
38. Mercier, GA. Dendrimer Builder. 1996.http://server.ccl.net/chemistry/ resources/messages/1996/05/20.009-dir/index.html
39. Maiti PK, Cagin T, Lin ST, Goddard WA. Effect of solvent and pH on the structure of PAMAMdendrimers. Macromolecules 2005;38(3):979–991.
40. Humphrey W, Dalke A, Schulten K. VMD: Visual molecular dynamics. J. Mol. Graphics1996;14(1):33.
41. Pickersgill RW. A rapid method of calculating charge charge interaction energies in proteins.Protein Eng 1988;2:247–248. [PubMed: 3237687]
42. Lee I, Athey BD, Wetzel AW, Meixner W, Baker JR. Structural molecular dynamics studies onpolyamidoamine dendrimers for a therapeutic application: Effects of pH and generation.Macromolecules 2002;35(11):4510–4520.
43. Paulo PMR, Lopes JNC, Costa SMB. Molecular dynamics simulations of charged dendrimers:Low-to-intermediate half-generation PAMAMs. J. Phys. Chem. B 2007;111(36):10651–10664.[PubMed: 17705526]
44. Brooks, CL.; Karplus, M.; Pettitt, BM. Proteins: A Theoretical PerspectiVe of Dynamics,Structure, and Thermodynamics. John Wiley & Sons; 1990.
45. Chang R, Violi A. Insights into the effect of combustion-generated carbon nanoparticles onbiological membranes: A computer simulation study. J. Phys. Chem. B 2006;110(10):5073–5083.[PubMed: 16526750]
46. Feig M, Brooks CL. Recent advances in the development and application of implicit solventmodels in biomolecule simulations. Curr. Opin. Struct. Biol 2004;14(2):217–224. [PubMed:15093837]
47. Bashford D, Case DA. Generalized born models of macromolecular solvation effects. Annu. Rev.Phys. Chem 2000;51:129–152. [PubMed: 11031278]
48. Qiu D, Shenkin PS, Hollinger FP, Still WC. The GB/SA continuum model for solvation. A fastanalytical method for the calculation of approximate Born radii. J. Phys. Chem. A 1997;101(16):3005–3014.
49. Dominy BN, Brooks CL. Development of a generalized born model parametrization for proteinsand nucleic acids. J. Phys. Chem. B 1999;103(18):3765–3773.
50. Schaefer M, Karplus M. A comprehensive analytical treatment of continuum electrostatics. J. Phys.Chem 1996;100:1578–1599.
51. Schaefer M, Bartels CM. Solution conformations and thermodynamics of structured peptides:Molecular dynamics simulation with an implicit solvation model. J. Mol. Biol 1998;284:835–848.[PubMed: 9826519]
52. Calimet N, Schaefer M, Simonson T. Protein molecular dynamics with the generalized Born/ACEsolvent model. Proteins 2001;45:144–158. [PubMed: 11562944]
53. Lazaridis T, Karplus M. Effective energy function for proteins in solution. Proteins: Struct. Funct.Genet 1999;35(2):133–152. [PubMed: 10223287]
54. Rhee YM, Sorin EJ, Jayachandran G, Lindahl E, Pande VS. Simulations of the role of water in theprotein-folding mechanism. Proc. Natl. Acad. Sci. U.S.A 2004;101:6456–6461. [PubMed:15090647]
Kelly et al. Page 11
J Phys Chem B. Author manuscript; available in PMC 2010 August 23.
NIH
-PA Author Manuscript
NIH
-PA Author Manuscript
NIH
-PA Author Manuscript
55. ten Wolde PR, Chandler D. Drying-induced hydrophobic polymer collapse. Proc. Natl. Acad. Sci.U.S.A 2002;99:6539–6543. [PubMed: 11983853]
56. Zhou RH, Huang XH, Margulis CJ, Berne BJ. Hydrophobic collapse in multidomain proteinfolding. Science 2004;305:1605–1609. [PubMed: 15361621]
57. Rudnick J, Gaspari G. The asphericity of random walks. J. Phys. A: Math. Gen 1986;19:L191–L193.
58. Voronoi GF. Nouvelles applications des paramètres continus à la théorie des formes quadratiques.J. Reine Angew. Math 1907;133:97178.
59. Moy VT, Florin EL, Gaub HE. Intermolecular forces and energies between ligands and receptors.Science 1994;266(5183):257–259. [PubMed: 7939660]
60. Han S, Mahato RI, Sung YK, Kim SW. Development of biomaterials for gene therapy. Mol. Ther2000;2(4):302–317. [PubMed: 11020345]
61. Tang MX, Redemann CT, Szoka FC. In vitro gene delivery by degraded polyamidoaminedendrimers. Bioconjugate Chem 1996;7(6):703–714.
62. Haensler J, Szoka FC. Polyamidoamin cascade polymers mediate efficient transfection of cells inculture. Bioconjugate Chem 1993;4(5):372–379.
Kelly et al. Page 12
J Phys Chem B. Author manuscript; available in PMC 2010 August 23.
NIH
-PA Author Manuscript
NIH
-PA Author Manuscript
NIH
-PA Author Manuscript
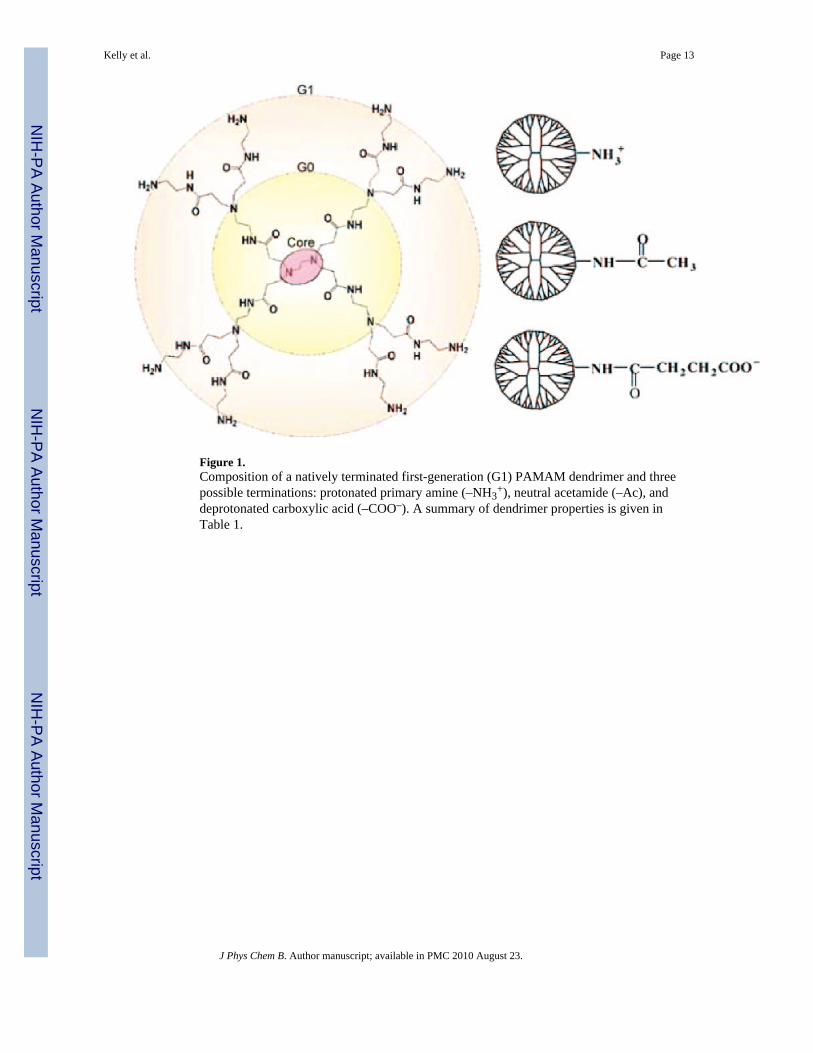
Figure 1.Composition of a natively terminated first-generation (G1) PAMAM dendrimer and threepossible terminations: protonated primary amine (–NH3
+), neutral acetamide (–Ac), anddeprotonated carboxylic acid (–COO–). A summary of dendrimer properties is given inTable 1.
Kelly et al. Page 13
J Phys Chem B. Author manuscript; available in PMC 2010 August 23.
NIH
-PA Author Manuscript
NIH
-PA Author Manuscript
NIH
-PA Author Manuscript
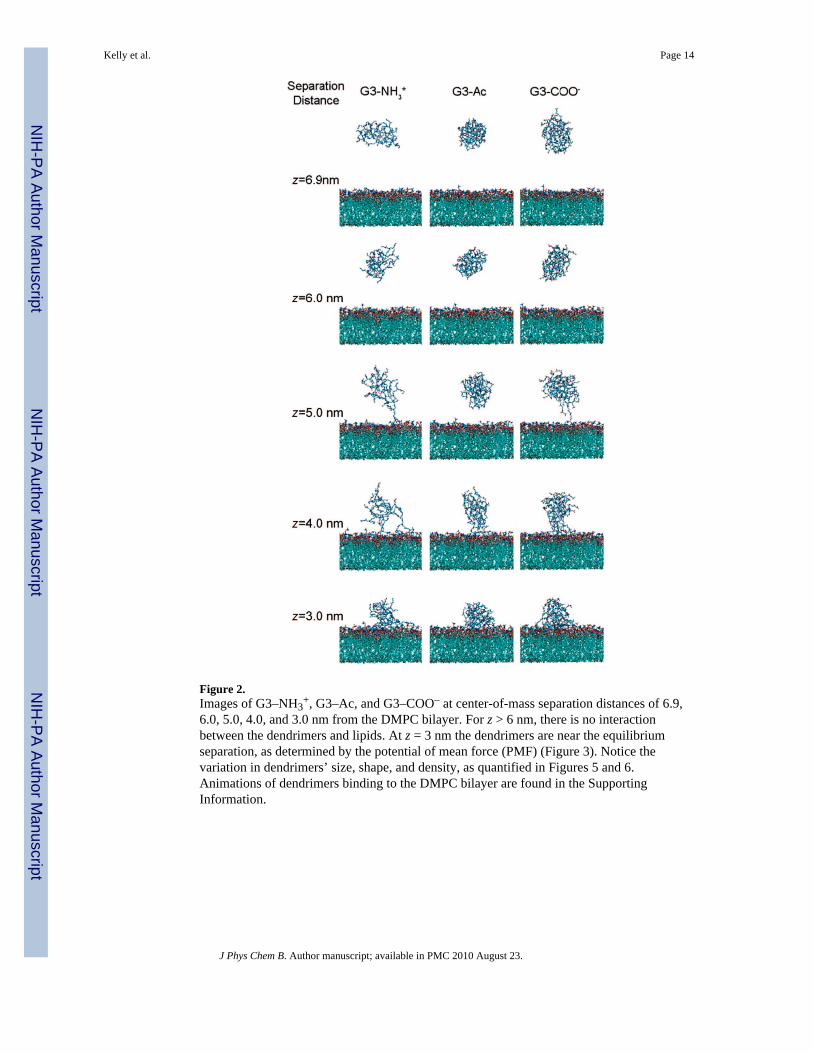
Figure 2.Images of G3–NH3
+, G3–Ac, and G3–COO– at center-of-mass separation distances of 6.9,6.0, 5.0, 4.0, and 3.0 nm from the DMPC bilayer. For z > 6 nm, there is no interactionbetween the dendrimers and lipids. At z = 3 nm the dendrimers are near the equilibriumseparation, as determined by the potential of mean force (PMF) (Figure 3). Notice thevariation in dendrimers’ size, shape, and density, as quantified in Figures 5 and 6.Animations of dendrimers binding to the DMPC bilayer are found in the SupportingInformation.
Kelly et al. Page 14
J Phys Chem B. Author manuscript; available in PMC 2010 August 23.
NIH
-PA Author Manuscript
NIH
-PA Author Manuscript
NIH
-PA Author Manuscript
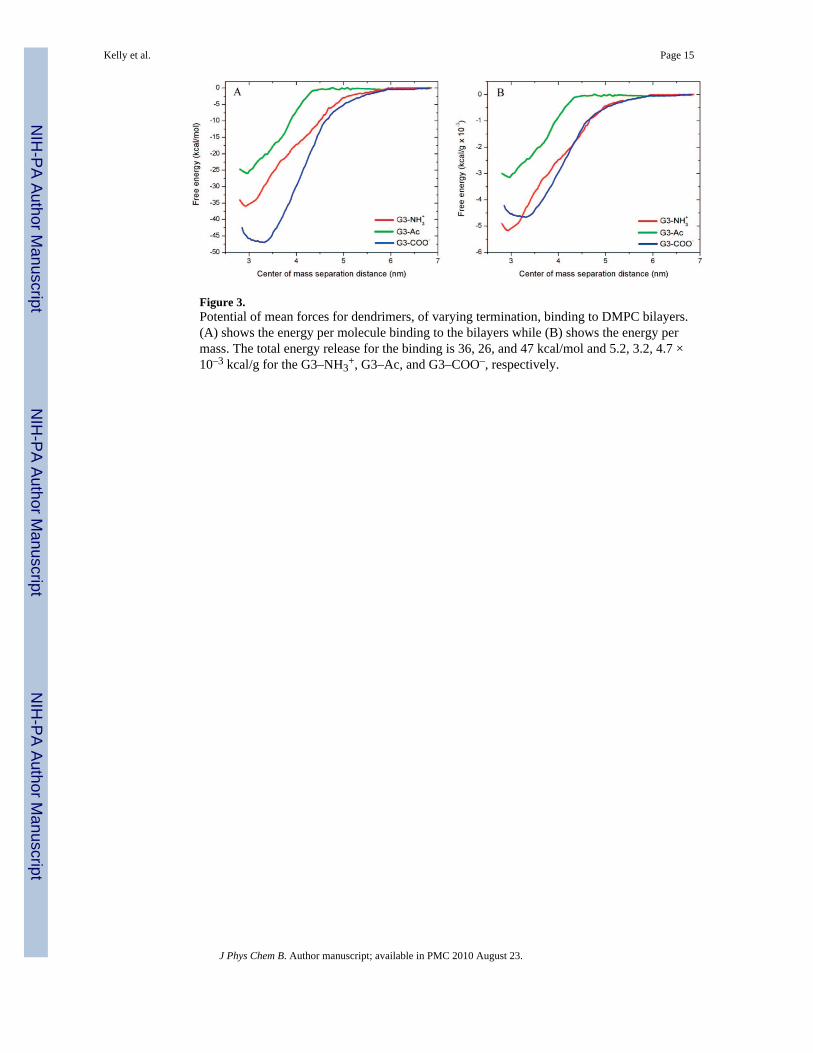
Figure 3.Potential of mean forces for dendrimers, of varying termination, binding to DMPC bilayers.(A) shows the energy per molecule binding to the bilayers while (B) shows the energy permass. The total energy release for the binding is 36, 26, and 47 kcal/mol and 5.2, 3.2, 4.7 ×10⁻³ kcal/g for the G3–NH3
+, G3–Ac, and G3–COO–, respectively.
Kelly et al. Page 15
J Phys Chem B. Author manuscript; available in PMC 2010 August 23.
NIH
-PA Author Manuscript
NIH
-PA Author Manuscript
NIH
-PA Author Manuscript

Figure 4.Attractive force between dendrimers of varying termination and a DMPC bilayer. There isno force at larger separation distances (z > 6 nm), which increases to 170, 200, and 240 pNfor G3–NH3
+, G3–Ac, and G3–COO–, respectively.
Kelly et al. Page 16
J Phys Chem B. Author manuscript; available in PMC 2010 August 23.
NIH
-PA Author Manuscript
NIH
-PA Author Manuscript
NIH
-PA Author Manuscript
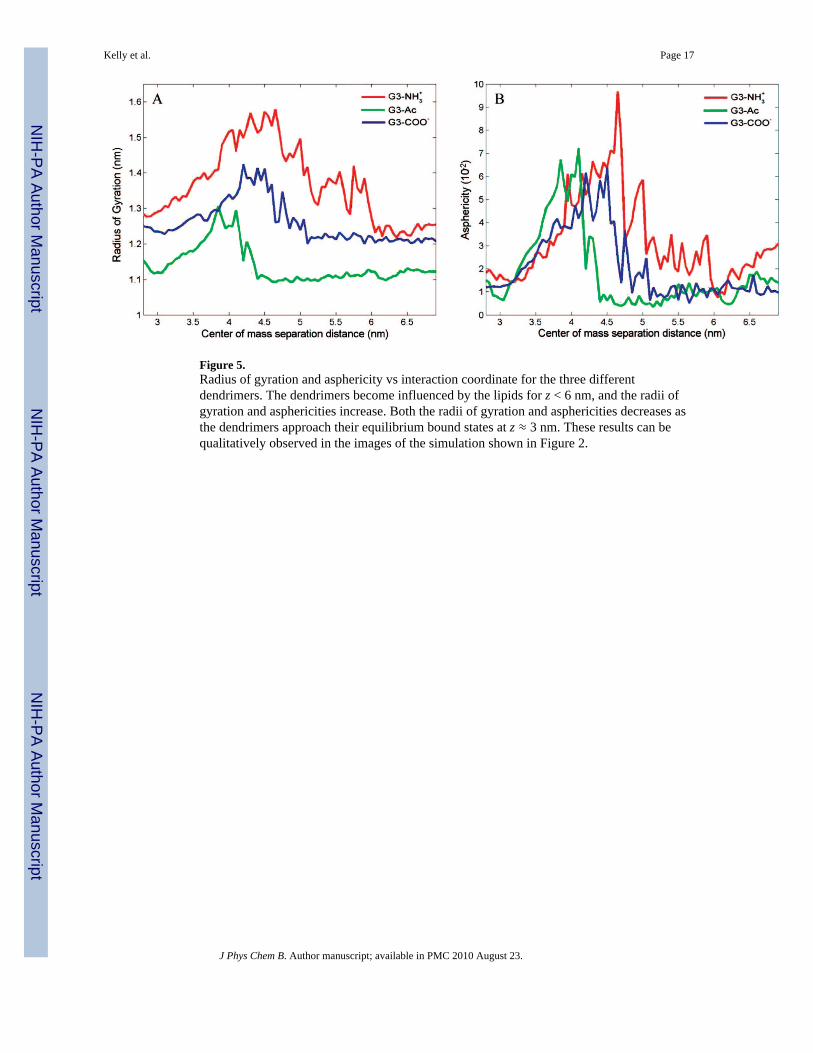
Figure 5.Radius of gyration and asphericity vs interaction coordinate for the three differentdendrimers. The dendrimers become influenced by the lipids for z < 6 nm, and the radii ofgyration and asphericities increase. Both the radii of gyration and asphericities decreases asthe dendrimers approach their equilibrium bound states at z ≈ 3 nm. These results can bequalitatively observed in the images of the simulation shown in Figure 2.
Kelly et al. Page 17
J Phys Chem B. Author manuscript; available in PMC 2010 August 23.
NIH
-PA Author Manuscript
NIH
-PA Author Manuscript
NIH
-PA Author Manuscript
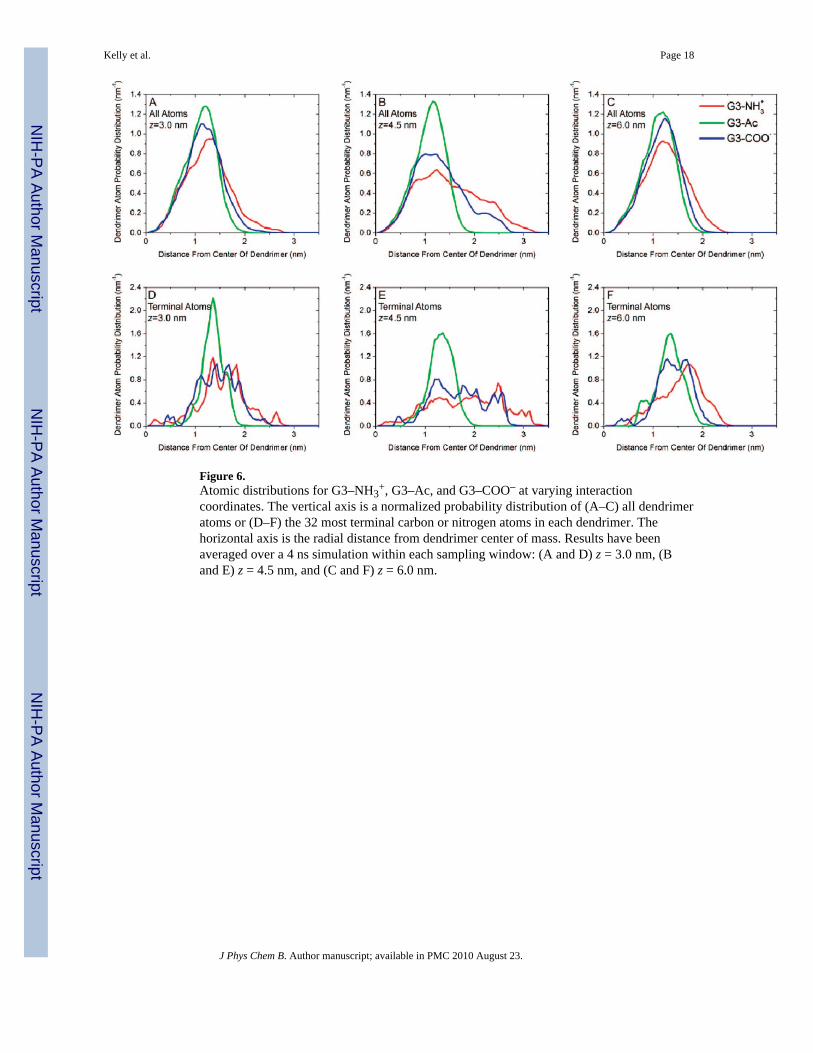
Figure 6.Atomic distributions for G3–NH3
+, G3–Ac, and G3–COO– at varying interactioncoordinates. The vertical axis is a normalized probability distribution of (A–C) all dendrimeratoms or (D–F) the 32 most terminal carbon or nitrogen atoms in each dendrimer. Thehorizontal axis is the radial distance from dendrimer center of mass. Results have beenaveraged over a 4 ns simulation within each sampling window: (A and D) z = 3.0 nm, (Band E) z = 4.5 nm, and (C and F) z = 6.0 nm.
Kelly et al. Page 18
J Phys Chem B. Author manuscript; available in PMC 2010 August 23.
NIH
-PA Author Manuscript
NIH
-PA Author Manuscript
NIH
-PA Author Manuscript

Figure 7.Plot of which DMPC atoms are in close proximity to each dendrimer at the equilibriumdendrimer–lipid separation distance. The atoms in each DMPC molecule have been assigneda number, according to (A), and plotted on the horizontal axis of (B) and (C). IdenticalDMPC atoms have been assigned the same number, and the results have been normalizedappropriately. The vertical axis of (B) represents the average number of DMPC atoms ofeach type that are within 2, 3, 4, 5, or 6 Å of the dendrimer at the equilibrium interactioncoordinate. (C) shows the difference between the charged and uncharged dendrimers.
Kelly et al. Page 19
J Phys Chem B. Author manuscript; available in PMC 2010 August 23.
NIH
-PA Author Manuscript
NIH
-PA Author Manuscript
NIH
-PA Author Manuscript
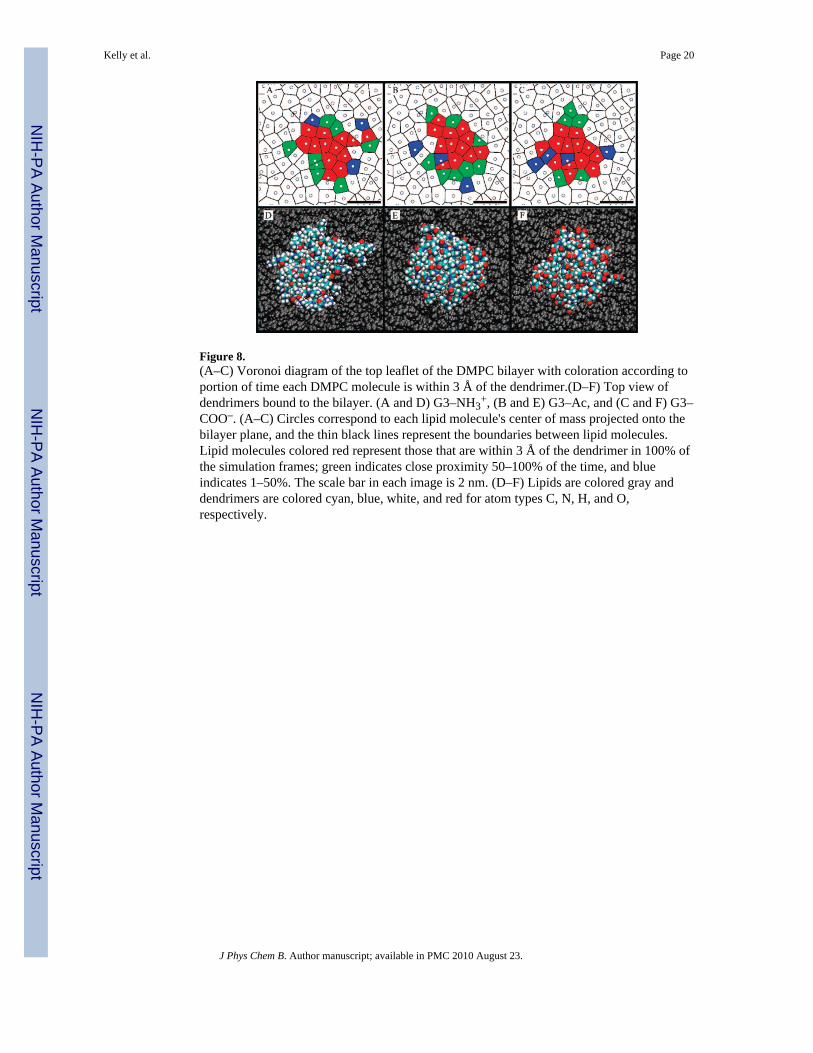
Figure 8.(A–C) Voronoi diagram of the top leaflet of the DMPC bilayer with coloration according toportion of time each DMPC molecule is within 3 Å of the dendrimer.(D–F) Top view ofdendrimers bound to the bilayer. (A and D) G3–NH3
+, (B and E) G3–Ac, and (C and F) G3–COO–. (A–C) Circles correspond to each lipid molecule's center of mass projected onto thebilayer plane, and the thin black lines represent the boundaries between lipid molecules.Lipid molecules colored red represent those that are within 3 Å of the dendrimer in 100% ofthe simulation frames; green indicates close proximity 50–100% of the time, and blueindicates 1–50%. The scale bar in each image is 2 nm. (D–F) Lipids are colored gray anddendrimers are colored cyan, blue, white, and red for atom types C, N, H, and O,respectively.
Kelly et al. Page 20
J Phys Chem B. Author manuscript; available in PMC 2010 August 23.
NIH
-PA Author Manuscript
NIH
-PA Author Manuscript
NIH
-PA Author Manuscript

NIH
-PA Author Manuscript
NIH
-PA Author Manuscript
NIH
-PA Author Manuscript
Kelly et al. Page 21
TABLE 1
Properties of the G3 PAMAM Dendrimers
terminal groupa no. of atoms per dendrimer mass (kDa) charge (e)
G3–NH3+ –NH3
+ 1124 6.94 +32
G3–Ac –NHCOCH3 1252 8.25 0
G3–COO– –NHCOCH2CH2COO– 1412 10.1 –32
aAll 32 primary amines of each G3 PAMAM dendrimer are converted to one of these three terminal groups, giving the dendrimers a +32e, 0, or –
32e net charge.
J Phys Chem B. Author manuscript; available in PMC 2010 August 23.
NIH
-PA Author Manuscript
NIH
-PA Author Manuscript
NIH
-PA Author Manuscript
Kelly et al. Page 22
TAB
LE 2
Sim
ulat
ion
Res
ults
of G
3 PA
MA
M D
endr
imer
s Bin
ding
to D
MPC
Bila
yers
ener
gy r
elea
sed
upon
bin
ding
max
imum
attr
activ
e fo
rce
(pN
)m
axim
um r
adiu
s of g
yrat
ion
(nm
)m
axim
um a
sphe
rici
ty (1
0–2)
(kca
l/mol
)(1
0–3 k
cal/g
)
G3–
NH
3+36
5.2
170
1.55
9
G3–
Ac
263.
220
01.
37
G3–
CO
O–
474.
724
01.
46
J Phys Chem B. Author manuscript; available in PMC 2010 August 23.
NIH
-PA Author Manuscript
NIH
-PA Author Manuscript
NIH
-PA Author Manuscript
Kelly et al. Page 23
TABLE 3
Area Occupied by the Dendrimers on the Lipid Bilayer, Analyzed as the Average Area They Shadow or as theAverage Area of the Smallest Circle Which Inscribes the Dendrimer Projected onto the Bilayer Planea
area of dendrimer footprint (nm2) area of inscribing circle (nm2)
G3–NH3+ 9.6 14.9
G3–Ac 8.2 9.4
G3–COO– 7.9 10.4
aThe standard deviation of observed areas was 2% for the footprints and 6% for the inscribing circles.
J Phys Chem B. Author manuscript; available in PMC 2010 August 23.
Related Documents