Poly (A) + Transcriptome Assessment of ERBB2-Induced Alterations in Breast Cell Lines Dirce Maria Carraro 1 *, Elisa Napolitano Ferreira 1,2 , Gustavo de Campos Molina 1 , Renato David Puga 1 , Eduardo Fernandes Abrantes 1 , Adriana Priscila Trape ´ 3 , Bedrich L. Ekhardt 4 , Diana Noronha Nunes 1,4 , Maria Mitzi Brentani 3 , Wadih Arap 4 , Renata Pasqualini 4 , Helena Brentani 1,3 , Emmanuel Dias-Neto 1,3,4 , Ricardo Renzo Brentani 1 1 Centro Internacional de Ensino e Pesquisa, Hospital AC Camargo, Sa ˜o Paulo, Sa ˜o Paulo, Brazil, 2 Instituto de Biocie ˆ ncias, Universidade de Sa ˜o Paulo, Sa ˜o Paulo, Sa ˜o Paulo, Brazil, 3 Faculdade de Medicina, Universidade de Sa ˜o Paulo, Sa ˜o Paulo, Sa ˜o Paulo, Brazil, 4 David H. Koch Center, The University of Texas M. D. Anderson Cancer Center, Houston, Texas, United States of America Abstract We report the first quantitative and qualitative analysis of the poly (A) + transcriptome of two human mammary cell lines, differentially expressing (human epidermal growth factor receptor) an oncogene over-expressed in approximately 25% of human breast tumors. Full-length cDNA populations from the two cell lines were digested enzymatically, individually tagged according to a customized method for library construction, and simultaneously sequenced by the use of the Titanium 454-Roche-platform. Comprehensive bioinformatics analysis followed by experimental validation confirmed novel genes, splicing variants, single nucleotide polymorphisms, and gene fusions indicated by RNA-seq data from both samples. Moreover, comparative analysis showed enrichment in alternative events, especially in the exon usage category, in ERBB2 over-expressing cells, data indicating regulation of alternative splicing mediated by the oncogene. Alterations in expression levels of genes, such as LOX, ATP5L, GALNT3, and MME revealed by large-scale sequencing were confirmed between cell lines as well as in tumor specimens with different ERBB2 backgrounds. This approach was shown to be suitable for structural, quantitative, and qualitative assessment of complex transcriptomes and revealed new events mediated by ERBB2 overexpression, in addition to potential molecular targets for breast cancer that are driven by this oncogene. Citation: Carraro DM, Ferreira EN, Molina GdC, Puga RD, Abrantes EF, et al. (2011) Poly (A) + Transcriptome Assessment of ERBB2-Induced Alterations in Breast Cell Lines. PLoS ONE 6(6): e21022. doi:10.1371/journal.pone.0021022 Editor: Paulo Lee Ho, Instituto Butantan, Brazil Received December 17, 2010; Accepted May 18, 2011; Published June 22, 2011 Copyright: ß 2011 Carraro et al. This is an open-access article distributed under the terms of the Creative Commons Attribution License, which permits unrestricted use, distribution, and reproduction in any medium, provided the original author and source are credited. Funding: This work was supported by Fundac ¸a ˜o de Amparo a ` Pesquisa do Estado de Sa ˜o Paulo (FAPESP - www.fapesp.br) grant number: 98/14335-2; Conselho Nacional de Desenvolvimento Cientı ´fico e Tecnolo ´ gico (CNPq) grant number: 484807/2007-2; the National Institutes of Health (NIH - www.nih.gov) and the Department of Defense (DOD - www.defense.gov). The funders had no role in study design, data collection and analysis, decision to publish, or preparation of the manuscript. Competing Interests: The authors have declared that no competing interests exist. * E-mail: [email protected] Introduction Global comparative analysis of transcriptomes is the most effective approach for definition of alterations in gene expression profiles and has led to the identification of key defective elements involved in complex diseases such as cancer. Different aspects of quantitative gene expression have been investigated in breast cancer by microarray-based analysis [1– 6], with important implications for prognosis [7,8]. At present, the management of breast cancer patients takes into consider- ation a combination of clinical and histopathological charac- teristics, together with the measurement of estrogen (ER) and progesterone (PR) hormone receptors and Her2/ERBB2 over- expression/amplification. ERBB2 (human epidermal growth factor receptor) is a member of the tyrosine kinase receptor family, and its amplification has long been considered to play a crucial role in the tumorigenic process [9,10]. ERBB2, overexpressed in 25 to 30% of human breast cancers [11,12], is associated with metastasis [13], and ERBB2-overexpressing cells are self-sufficient with respect to, anchorage-independent growth and efficient in invasion [14]. Patients bearing ERBB2-overexpressing tumors are usually treated with Trastuzumab (HerceptinH), a therapeutic monoclonal antibody against ERBB2. However, a significant fraction (,60%) of patients with metastatic breast tumors does not respond to the treatment [15], highlighting the necessity for continued investiga- tion of ERBB2-mediated modifications in breast cells. In light of the importance of ERBB2 in breast cancer, HB4a [16] and HB4aC5.2 [17], the parental and the ERBB2 overexpressing cell lines, respectively, have been used to investigate quantitative transcriptional alterations in mammary cells mediated by ERBB2 overexpression [18,19]. However, given the high complexity of the mammalian transcriptome [20,21] the use of more sensitive approaches that enable assessment of not only quantitative but also qualitative aspects of the transcriptome has presently been intensified. In this sense, clear consensus has emerged that next-generation sequencing (NGS), which provides digital-counting of the transcriptome, is more advantageous than other solely quantitative methodologies [22–26]. Here we present the first NGS-based qualitative and quantita- tive evaluation of the mammary cell transcriptome modulated by ERBB2 over-expression. By combining DpnII-restriction and PLoS ONE | www.plosone.org 1 June 2011 | Volume 6 | Issue 6 | e21022

Welcome message from author
This document is posted to help you gain knowledge. Please leave a comment to let me know what you think about it! Share it to your friends and learn new things together.
Transcript
Poly (A)+ Transcriptome Assessment of ERBB2-InducedAlterations in Breast Cell LinesDirce Maria Carraro1*, Elisa Napolitano Ferreira1,2, Gustavo de Campos Molina1, Renato David Puga1,
Eduardo Fernandes Abrantes1, Adriana Priscila Trape3, Bedrich L. Ekhardt4, Diana Noronha Nunes1,4,
Maria Mitzi Brentani3, Wadih Arap4, Renata Pasqualini4, Helena Brentani1,3, Emmanuel Dias-Neto1,3,4,
Ricardo Renzo Brentani1
1 Centro Internacional de Ensino e Pesquisa, Hospital AC Camargo, Sao Paulo, Sao Paulo, Brazil, 2 Instituto de Biociencias, Universidade de Sao Paulo, Sao Paulo, Sao Paulo,
Brazil, 3 Faculdade de Medicina, Universidade de Sao Paulo, Sao Paulo, Sao Paulo, Brazil, 4 David H. Koch Center, The University of Texas M. D. Anderson Cancer Center,
Houston, Texas, United States of America
Abstract
We report the first quantitative and qualitative analysis of the poly (A)+ transcriptome of two human mammary cell lines,differentially expressing (human epidermal growth factor receptor) an oncogene over-expressed in approximately 25% ofhuman breast tumors. Full-length cDNA populations from the two cell lines were digested enzymatically, individuallytagged according to a customized method for library construction, and simultaneously sequenced by the use of theTitanium 454-Roche-platform. Comprehensive bioinformatics analysis followed by experimental validation confirmed novelgenes, splicing variants, single nucleotide polymorphisms, and gene fusions indicated by RNA-seq data from both samples.Moreover, comparative analysis showed enrichment in alternative events, especially in the exon usage category, in ERBB2over-expressing cells, data indicating regulation of alternative splicing mediated by the oncogene. Alterations in expressionlevels of genes, such as LOX, ATP5L, GALNT3, and MME revealed by large-scale sequencing were confirmed between cell linesas well as in tumor specimens with different ERBB2 backgrounds. This approach was shown to be suitable for structural,quantitative, and qualitative assessment of complex transcriptomes and revealed new events mediated by ERBB2overexpression, in addition to potential molecular targets for breast cancer that are driven by this oncogene.
Citation: Carraro DM, Ferreira EN, Molina GdC, Puga RD, Abrantes EF, et al. (2011) Poly (A)+ Transcriptome Assessment of ERBB2-Induced Alterations in Breast CellLines. PLoS ONE 6(6): e21022. doi:10.1371/journal.pone.0021022
Editor: Paulo Lee Ho, Instituto Butantan, Brazil
Received December 17, 2010; Accepted May 18, 2011; Published June 22, 2011
Copyright: � 2011 Carraro et al. This is an open-access article distributed under the terms of the Creative Commons Attribution License, which permitsunrestricted use, distribution, and reproduction in any medium, provided the original author and source are credited.
Funding: This work was supported by Fundacao de Amparo a Pesquisa do Estado de Sao Paulo (FAPESP - www.fapesp.br) grant number: 98/14335-2; ConselhoNacional de Desenvolvimento Cientıfico e Tecnologico (CNPq) grant number: 484807/2007-2; the National Institutes of Health (NIH - www.nih.gov) and theDepartment of Defense (DOD - www.defense.gov). The funders had no role in study design, data collection and analysis, decision to publish, or preparation of themanuscript.
Competing Interests: The authors have declared that no competing interests exist.
* E-mail: [email protected]
Introduction
Global comparative analysis of transcriptomes is the most
effective approach for definition of alterations in gene
expression profiles and has led to the identification of key
defective elements involved in complex diseases such as cancer.
Different aspects of quantitative gene expression have been
investigated in breast cancer by microarray-based analysis [1–
6], with important implications for prognosis [7,8]. At present,
the management of breast cancer patients takes into consider-
ation a combination of clinical and histopathological charac-
teristics, together with the measurement of estrogen (ER) and
progesterone (PR) hormone receptors and Her2/ERBB2 over-
expression/amplification.
ERBB2 (human epidermal growth factor receptor) is a member
of the tyrosine kinase receptor family, and its amplification has
long been considered to play a crucial role in the tumorigenic
process [9,10]. ERBB2, overexpressed in 25 to 30% of human
breast cancers [11,12], is associated with metastasis [13], and
ERBB2-overexpressing cells are self-sufficient with respect to,
anchorage-independent growth and efficient in invasion [14].
Patients bearing ERBB2-overexpressing tumors are usually
treated with Trastuzumab (HerceptinH), a therapeutic monoclonal
antibody against ERBB2. However, a significant fraction (,60%)
of patients with metastatic breast tumors does not respond to the
treatment [15], highlighting the necessity for continued investiga-
tion of ERBB2-mediated modifications in breast cells.
In light of the importance of ERBB2 in breast cancer, HB4a
[16] and HB4aC5.2 [17], the parental and the ERBB2
overexpressing cell lines, respectively, have been used to
investigate quantitative transcriptional alterations in mammary
cells mediated by ERBB2 overexpression [18,19]. However, given
the high complexity of the mammalian transcriptome [20,21] the
use of more sensitive approaches that enable assessment of not
only quantitative but also qualitative aspects of the transcriptome
has presently been intensified. In this sense, clear consensus has
emerged that next-generation sequencing (NGS), which provides
digital-counting of the transcriptome, is more advantageous than
other solely quantitative methodologies [22–26].
Here we present the first NGS-based qualitative and quantita-
tive evaluation of the mammary cell transcriptome modulated by
ERBB2 over-expression. By combining DpnII-restriction and
PLoS ONE | www.plosone.org 1 June 2011 | Volume 6 | Issue 6 | e21022
parallel-tagged sequencing, we performed analysis of the poly (A)+
transcriptomes of two human mammary cell lines: HB4a [17] and
its ERBB2-overexpressing clone, C5.2 [16]. Whereas no qualita-
tive aspects were correlated with ERBB2 over-expression,
significant enrichment of alternative splicing events was shown
to be mediated by the overexpression of this oncogene.
Additionally, novel ERBB2-driven genes and transcript variants
were revealed in these cell lines and were also validated in tumor
specimens with high ERBB2 expression. Moreover, novel genes,
splicing variants, single nucleotide polymorphisms (SNPs) and
gene fusions were detected in sequences from both cell lines, data
contributing further to the definition of the human transcriptome.
Results
Whole transcriptome assessment of HB4a and C5.2 celllines
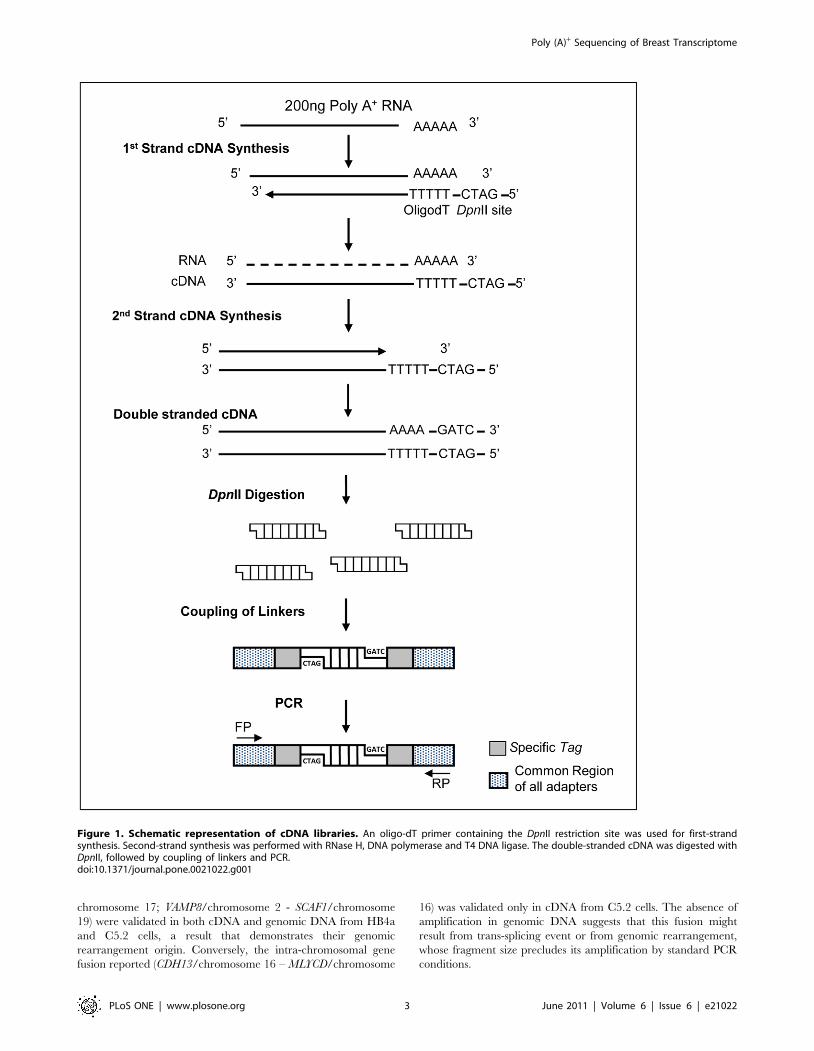
A customized method for simultaneous sequencing of the poly
(A)+ transcriptome of multiple samples was established. Double-
stranded cDNA converted from purified poly A+ mRNA from
HB4a and C5.2 cell lines was prepared and digested with the
frequent cutter DpnII. Adapters containing specific 4nt- barcode
were designed and added to DpnII digested cDNAs from both cell
lines, and samples were pooled before sequencing (Figure 1).
cDNA samples were sequenced on the Titanium 454-Roche
platform generating 802,214 reads, with a total of 160,223,981
high-quality nucleotides (Phred $20) (Figure 2). The mean size of
reads was 199.7666.72. Sequence reads were submitted to The
Sequence Read Archive (SRA) (accession number SRA012436.2).
Sequences were filtered to exclude mitochondrial DNA and
ribosomal RNAs, as well as sequences without adapters, yielding
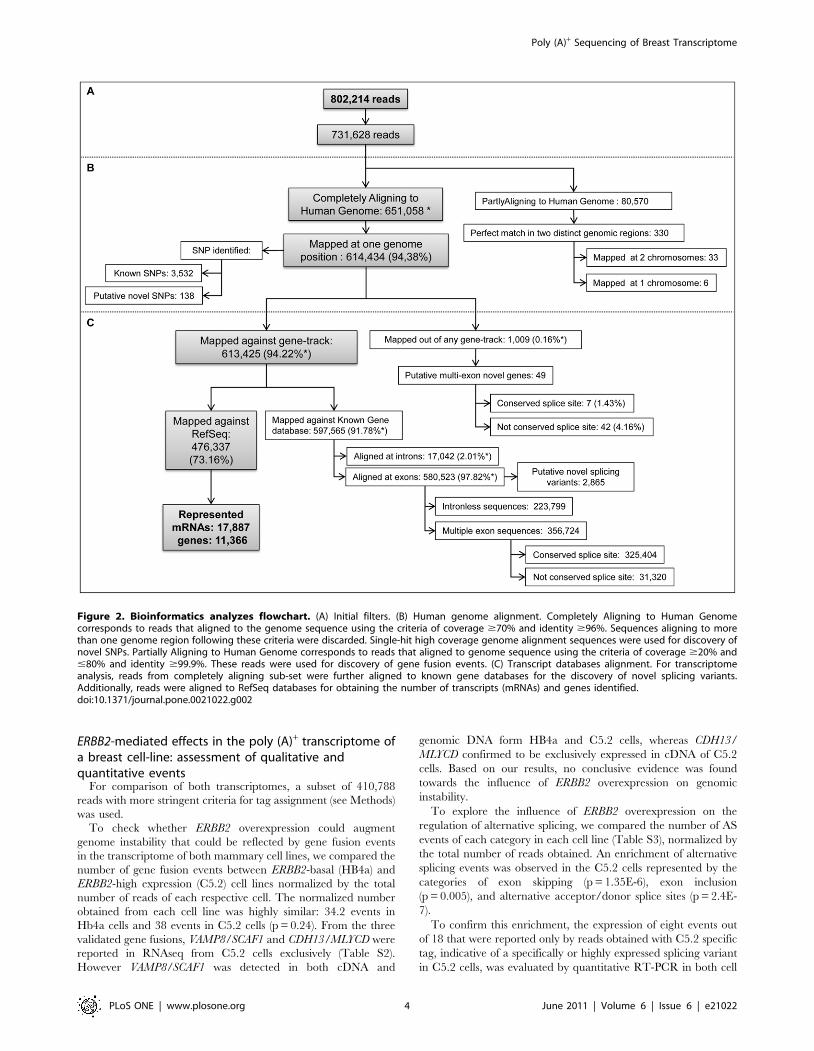
731,628 reads (91.2%) (Figure 2A). From this, two subsets were
separated according to genome alignment parameters that differed
in percentage of coverage and identity: a subset of completely
aligning reads and another subset of reads with partial alignment
to the human genome, respectively containing 651,058 reads
(89%) (coverage $70% and identity $96%) and 80,570 reads
(11%) (coverage $20% and #80% and identity $99.9%). From
the former, 614,434 (94.4%) that present single-hit matches
(Figure 2B) in the genome were used for gene coverage and
identification of novel genes, splicing variants and SNPs. From the
latter subset, reads that present perfect matches in two genomic
regions were used to assess gene-fusion events.
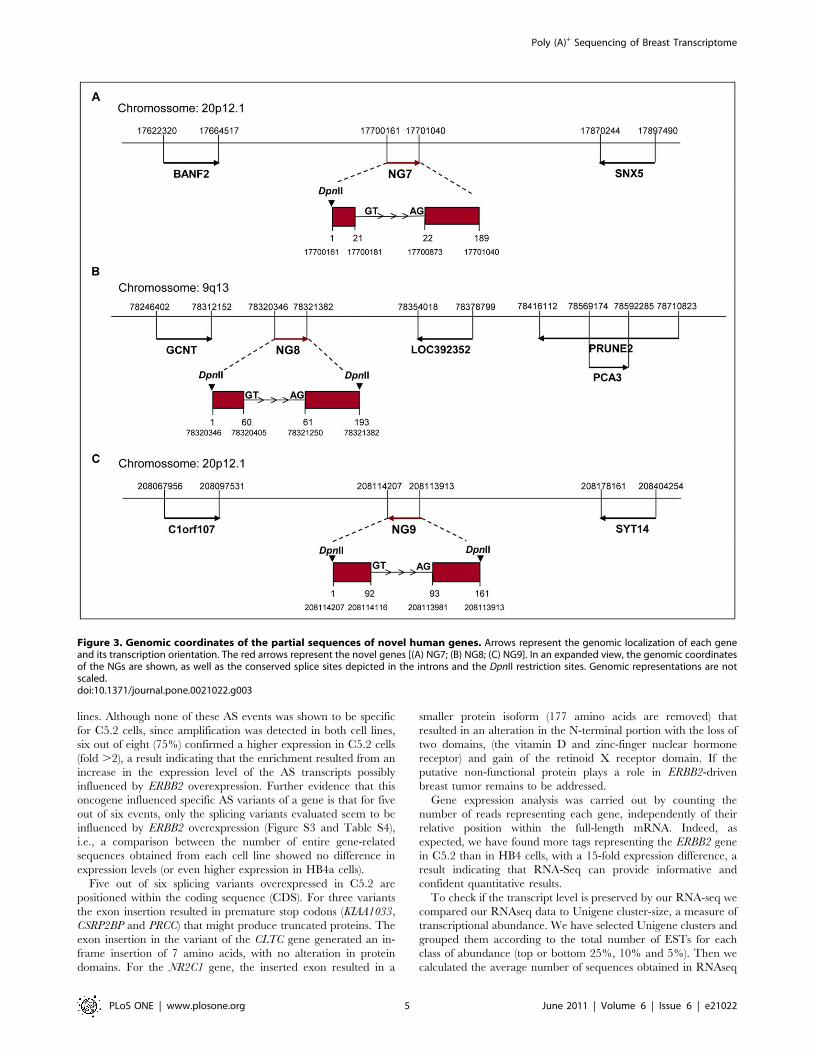
Gene coverage and novel genesA small fraction of 1,009 (0.16%) reads mapping out of any
gene-track position was explored to find novel human genes
(Figure 2C). Most of these sequences (960 reads) were single
continuous hits, and only a minority (49 sequences) was derived
from multiple-exon hits. Six out of the 49 multi-exon genes
exhibited canonical splice sites at their putative introns and were
selected for validation by the use of cDNA from these cell lines,
and three (50%) new human transcripts were thereby confirmed.
The minimal distance between the novel transcribed regions and
the known genes in the vicinity was 8 Kb (Figure 3), suggesting
that the three confirmed transcripts are not extensions of the
known genes.
From the 613,425 reads (98.83%) that could be mapped against
at least one gene track (Figure 2B), 476,337 reads (73.16%) were
aligned to RefSeq (Figure 2C) that demonstrated a expression of
38.9% (17,887 entries) of the complete RefSeq transcript
repertoire (build 36) in these cell lines. Given that 17,887 full-
length mRNAs correspond to 60,500,115 nt, the base-pair
representation was 23.48% (14,208,089 nt covered).
To estimate transcript representation we verified the read
distribution throughout the entire full-length mRNAs by calcula-
tion of their relative position as described [27]. A slightly higher
concentration of sequences was seen in the central portion of the
transcripts (Figure S1A). The 59 end of full transcripts was well-
represented, irrespective of the original transcript lengths (Figure
S1B). This fact shows high-quality RNA templates, efficient cDNA
synthesis and library construction methodology with no biased
representation of short transcripts.
Single nucleotide polymorphismThe 614,434 reads mapping at a single genome position were
used for assessment of novel SNPs (Figure 2B). According to a set
of parameters and criteria (see Methods), 3,532 known SNPs and
138 (3.8%) potentially novel SNPs were thereby revealed.
Eighteen putative SNPs were subjected to validation by Sanger-
sequencing of genomic DNA from both cell lines. A high
validation rate (89%) was obtained and revealed 16 new SNPs
(12 heterozygous and 4 homozygous SNPs) (Table S1 and Figure
S2). Nine of the 16 new SNPs were located in coding regions, and
four resulted in non-synonymous amino acid substitutions, all
predicted as benign substitutions by PolyPhen [28]. Intriguingly,
the different chromatogram peak height of DKK1 heterozygous
SNP observed in C5.2 cells was suggestive of an apparent allelic
expression imbalance in the ERBB2-overexpressing cell line.
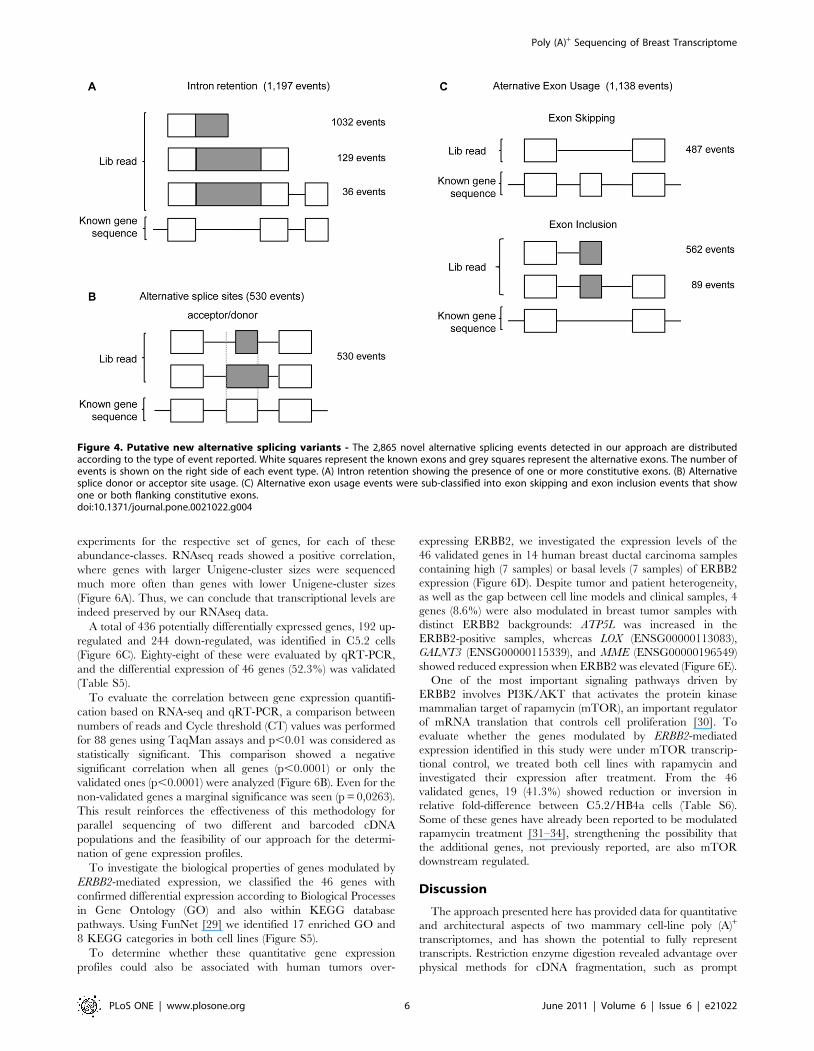
Novel splicing variantsPutative novel splicing variants could be identified from the
597,565 reads that aligned against mRNA databases (Figure 2C).
From them a total of 2,865 were potentially novel alternative
splicing (AS) events and were distributed in distinct categories
(Figure 4). For validation, we focused on the exon inclusion set
(Figure 4C), because the feasibility of designing primers in the
newly-included exons leads to more reliable results with regard to
the expression of specific variants. From the subset of 89 events
containing two known flanking exons (Figure 4C) 20 exon-
inclusion events were selected for validation. From them, 18 (90%)
new bona fide exon inclusion AS-variants (Figure S3) were
confirmed.
Gene fusionFrom the partially aligning subset (Figure 2B), reads that
presented perfect match in two distinct genomic regions were
considered as potential gene fusion events. After removing 26
false-positive candidates detected by the presence of DpnII
restriction sites at the fusion junction (Figure S4), which indicates
chimeric artifacts produced during library construction, 330 reads
remained. Next, chimeras within the same gene and between a
gene and its corresponding pseudogene were discarded. Finally,
reads presenting partial alignment to unique exonic regions were
selected resulting in a total of 39 gene fusion candidates, 33 inter
and 6 intra-chromosomal events (Figure 2B). From the 39 gene
fusion reads, 32 events presented micro-homology (27 inter- and 5
intra-chromosomal), and only one (inter-chromosomal) presented
2 bases that did not align to any of the regions involved in the
fusion, named short non-templated sequences (Table S2).
Ninety five percent of gene fusion events (37 out of 39) were
reported by more than 2 reads and 72% (28 out of 39) were
reported by both cell lines, suggesting that they are bona-fide gene
fusion events (Figure 5A). However, only 3 out of 14 events
randomly selected for validation (11 inter- and 3 intra-chromo-
somal) were confirmed by qRT-PCR assays using cDNA and
genomic DNA from both cells (Figure 5B; Table S2). The two
inter-chromosomal gene fusions (FTH1/chromosome 11 -EIF5A/
Poly (A)+ Sequencing of Breast Transcriptome
PLoS ONE | www.plosone.org 2 June 2011 | Volume 6 | Issue 6 | e21022
chromosome 17; VAMP8/chromosome 2 - SCAF1/chromosome
19) were validated in both cDNA and genomic DNA from HB4a
and C5.2 cells, a result that demonstrates their genomic
rearrangement origin. Conversely, the intra-chromosomal gene
fusion reported (CDH13/chromosome 16 – MLYCD/chromosome
16) was validated only in cDNA from C5.2 cells. The absence of
amplification in genomic DNA suggests that this fusion might
result from trans-splicing event or from genomic rearrangement,
whose fragment size precludes its amplification by standard PCR
conditions.
Figure 1. Schematic representation of cDNA libraries. An oligo-dT primer containing the DpnII restriction site was used for first-strandsynthesis. Second-strand synthesis was performed with RNase H, DNA polymerase and T4 DNA ligase. The double-stranded cDNA was digested withDpnII, followed by coupling of linkers and PCR.doi:10.1371/journal.pone.0021022.g001
Poly (A)+ Sequencing of Breast Transcriptome
PLoS ONE | www.plosone.org 3 June 2011 | Volume 6 | Issue 6 | e21022
ERBB2-mediated effects in the poly (A)+ transcriptome ofa breast cell-line: assessment of qualitative andquantitative events
For comparison of both transcriptomes, a subset of 410,788
reads with more stringent criteria for tag assignment (see Methods)
was used.
To check whether ERBB2 overexpression could augment
genome instability that could be reflected by gene fusion events
in the transcriptome of both mammary cell lines, we compared the
number of gene fusion events between ERBB2-basal (HB4a) and
ERBB2-high expression (C5.2) cell lines normalized by the total
number of reads of each respective cell. The normalized number
obtained from each cell line was highly similar: 34.2 events in
Hb4a cells and 38 events in C5.2 cells (p = 0.24). From the three
validated gene fusions, VAMP8/SCAF1 and CDH13/MLYCD were
reported in RNAseq from C5.2 cells exclusively (Table S2).
However VAMP8/SCAF1 was detected in both cDNA and
genomic DNA form HB4a and C5.2 cells, whereas CDH13/
MLYCD confirmed to be exclusively expressed in cDNA of C5.2
cells. Based on our results, no conclusive evidence was found
towards the influence of ERBB2 overexpression on genomic
instability.
To explore the influence of ERBB2 overexpression on the
regulation of alternative splicing, we compared the number of AS
events of each category in each cell line (Table S3), normalized by
the total number of reads obtained. An enrichment of alternative
splicing events was observed in the C5.2 cells represented by the
categories of exon skipping (p = 1.35E-6), exon inclusion
(p = 0.005), and alternative acceptor/donor splice sites (p = 2.4E-
7).
To confirm this enrichment, the expression of eight events out
of 18 that were reported only by reads obtained with C5.2 specific
tag, indicative of a specifically or highly expressed splicing variant
in C5.2 cells, was evaluated by quantitative RT-PCR in both cell
Figure 2. Bioinformatics analyzes flowchart. (A) Initial filters. (B) Human genome alignment. Completely Aligning to Human Genomecorresponds to reads that aligned to the genome sequence using the criteria of coverage $70% and identity $96%. Sequences aligning to morethan one genome region following these criteria were discarded. Single-hit high coverage genome alignment sequences were used for discovery ofnovel SNPs. Partially Aligning to Human Genome corresponds to reads that aligned to genome sequence using the criteria of coverage $20% and#80% and identity $99.9%. These reads were used for discovery of gene fusion events. (C) Transcript databases alignment. For transcriptomeanalysis, reads from completely aligning sub-set were further aligned to known gene databases for the discovery of novel splicing variants.Additionally, reads were aligned to RefSeq databases for obtaining the number of transcripts (mRNAs) and genes identified.doi:10.1371/journal.pone.0021022.g002
Poly (A)+ Sequencing of Breast Transcriptome
PLoS ONE | www.plosone.org 4 June 2011 | Volume 6 | Issue 6 | e21022
lines. Although none of these AS events was shown to be specific
for C5.2 cells, since amplification was detected in both cell lines,
six out of eight (75%) confirmed a higher expression in C5.2 cells
(fold .2), a result indicating that the enrichment resulted from an
increase in the expression level of the AS transcripts possibly
influenced by ERBB2 overexpression. Further evidence that this
oncogene influenced specific AS variants of a gene is that for five
out of six events, only the splicing variants evaluated seem to be
influenced by ERBB2 overexpression (Figure S3 and Table S4),
i.e., a comparison between the number of entire gene-related
sequences obtained from each cell line showed no difference in
expression levels (or even higher expression in HB4a cells).
Five out of six splicing variants overexpressed in C5.2 are
positioned within the coding sequence (CDS). For three variants
the exon insertion resulted in premature stop codons (KIAA1033,
CSRP2BP and PRCC) that might produce truncated proteins. The
exon insertion in the variant of the CLTC gene generated an in-
frame insertion of 7 amino acids, with no alteration in protein
domains. For the NR2C1 gene, the inserted exon resulted in a
smaller protein isoform (177 amino acids are removed) that
resulted in an alteration in the N-terminal portion with the loss of
two domains, (the vitamin D and zinc-finger nuclear hormone
receptor) and gain of the retinoid X receptor domain. If the
putative non-functional protein plays a role in ERBB2-driven
breast tumor remains to be addressed.
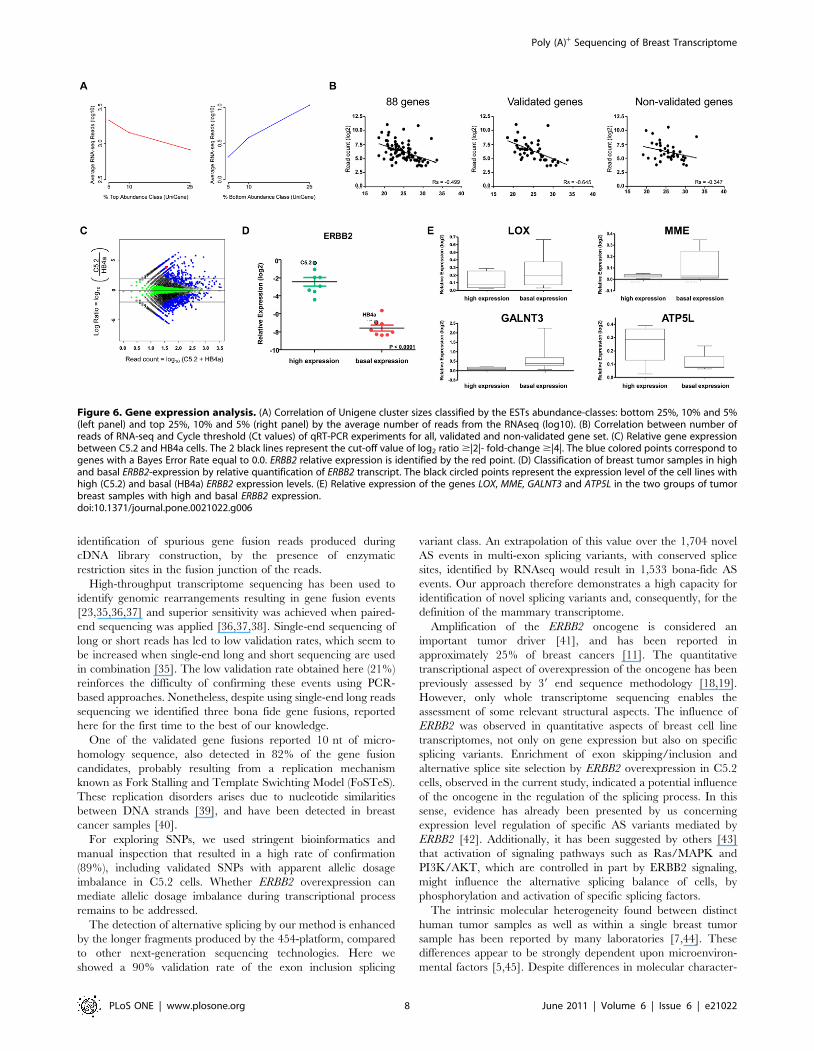
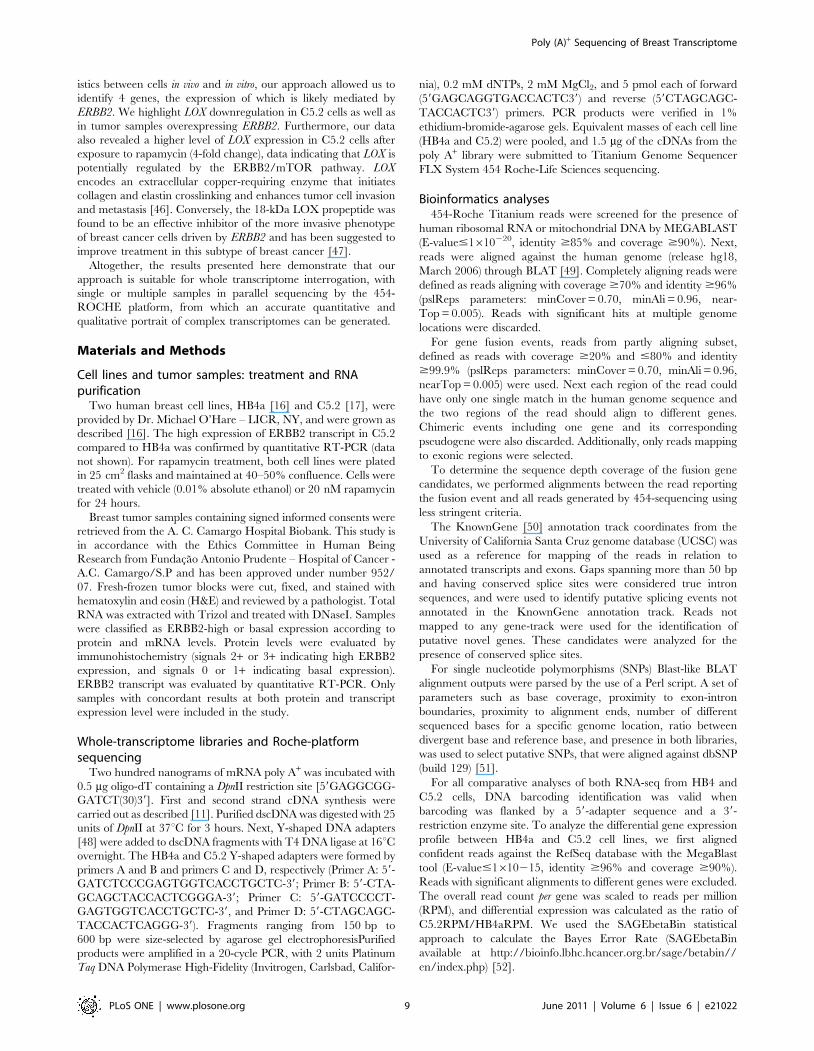
Gene expression analysis was carried out by counting the
number of reads representing each gene, independently of their
relative position within the full-length mRNA. Indeed, as
expected, we have found more tags representing the ERBB2 gene
in C5.2 than in HB4 cells, with a 15-fold expression difference, a
result indicating that RNA-Seq can provide informative and
confident quantitative results.
To check if the transcript level is preserved by our RNA-seq we
compared our RNAseq data to Unigene cluster-size, a measure of
transcriptional abundance. We have selected Unigene clusters and
grouped them according to the total number of ESTs for each
class of abundance (top or bottom 25%, 10% and 5%). Then we
calculated the average number of sequences obtained in RNAseq
Figure 3. Genomic coordinates of the partial sequences of novel human genes. Arrows represent the genomic localization of each geneand its transcription orientation. The red arrows represent the novel genes [(A) NG7; (B) NG8; (C) NG9]. In an expanded view, the genomic coordinatesof the NGs are shown, as well as the conserved splice sites depicted in the introns and the DpnII restriction sites. Genomic representations are notscaled.doi:10.1371/journal.pone.0021022.g003
Poly (A)+ Sequencing of Breast Transcriptome
PLoS ONE | www.plosone.org 5 June 2011 | Volume 6 | Issue 6 | e21022
experiments for the respective set of genes, for each of these
abundance-classes. RNAseq reads showed a positive correlation,
where genes with larger Unigene-cluster sizes were sequenced
much more often than genes with lower Unigene-cluster sizes
(Figure 6A). Thus, we can conclude that transcriptional levels are
indeed preserved by our RNAseq data.
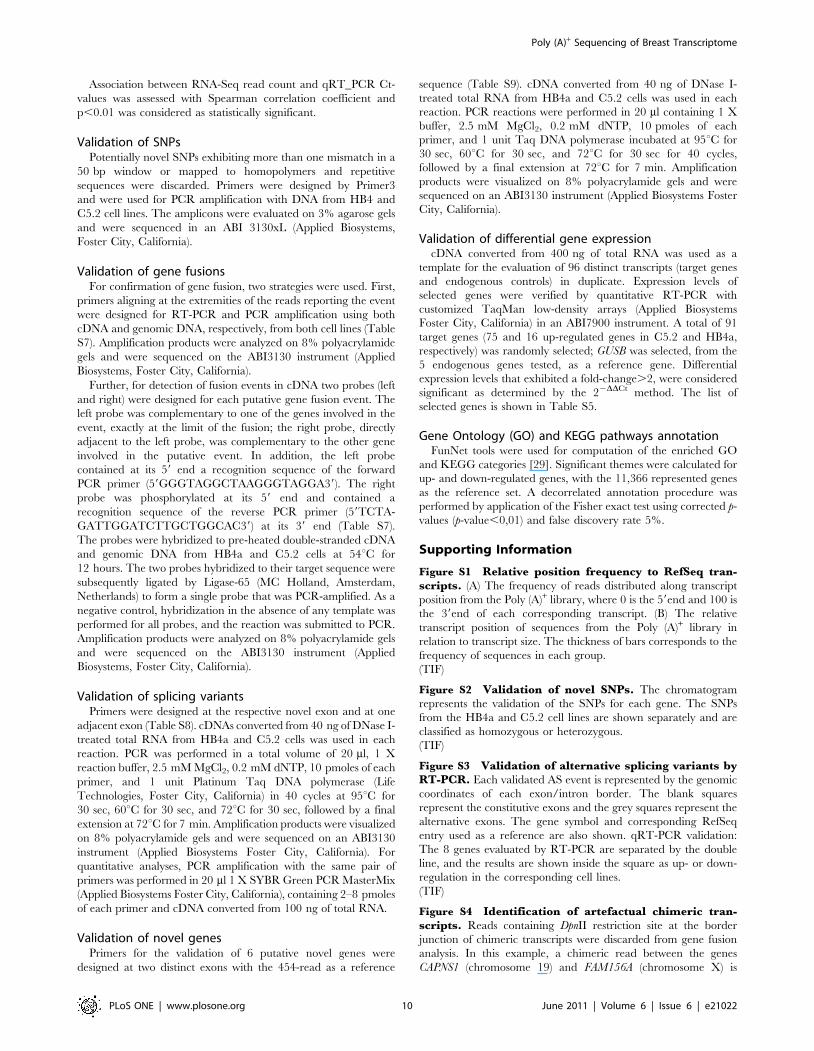
A total of 436 potentially differentially expressed genes, 192 up-
regulated and 244 down-regulated, was identified in C5.2 cells
(Figure 6C). Eighty-eight of these were evaluated by qRT-PCR,
and the differential expression of 46 genes (52.3%) was validated
(Table S5).
To evaluate the correlation between gene expression quantifi-
cation based on RNA-seq and qRT-PCR, a comparison between
numbers of reads and Cycle threshold (CT) values was performed
for 88 genes using TaqMan assays and p,0.01 was considered as
statistically significant. This comparison showed a negative
significant correlation when all genes (p,0.0001) or only the
validated ones (p,0.0001) were analyzed (Figure 6B). Even for the
non-validated genes a marginal significance was seen (p = 0,0263).
This result reinforces the effectiveness of this methodology for
parallel sequencing of two different and barcoded cDNA
populations and the feasibility of our approach for the determi-
nation of gene expression profiles.
To investigate the biological properties of genes modulated by
ERBB2-mediated expression, we classified the 46 genes with
confirmed differential expression according to Biological Processes
in Gene Ontology (GO) and also within KEGG database
pathways. Using FunNet [29] we identified 17 enriched GO and
8 KEGG categories in both cell lines (Figure S5).
To determine whether these quantitative gene expression
profiles could also be associated with human tumors over-
expressing ERBB2, we investigated the expression levels of the
46 validated genes in 14 human breast ductal carcinoma samples
containing high (7 samples) or basal levels (7 samples) of ERBB2
expression (Figure 6D). Despite tumor and patient heterogeneity,
as well as the gap between cell line models and clinical samples, 4
genes (8.6%) were also modulated in breast tumor samples with
distinct ERBB2 backgrounds: ATP5L was increased in the
ERBB2-positive samples, whereas LOX (ENSG00000113083),
GALNT3 (ENSG00000115339), and MME (ENSG00000196549)
showed reduced expression when ERBB2 was elevated (Figure 6E).
One of the most important signaling pathways driven by
ERBB2 involves PI3K/AKT that activates the protein kinase
mammalian target of rapamycin (mTOR), an important regulator
of mRNA translation that controls cell proliferation [30]. To
evaluate whether the genes modulated by ERBB2-mediated
expression identified in this study were under mTOR transcrip-
tional control, we treated both cell lines with rapamycin and
investigated their expression after treatment. From the 46
validated genes, 19 (41.3%) showed reduction or inversion in
relative fold-difference between C5.2/HB4a cells (Table S6).
Some of these genes have already been reported to be modulated
rapamycin treatment [31–34], strengthening the possibility that
the additional genes, not previously reported, are also mTOR
downstream regulated.
Discussion
The approach presented here has provided data for quantitative
and architectural aspects of two mammary cell-line poly (A)+
transcriptomes, and has shown the potential to fully represent
transcripts. Restriction enzyme digestion revealed advantage over
physical methods for cDNA fragmentation, such as prompt
Figure 4. Putative new alternative splicing variants - The 2,865 novel alternative splicing events detected in our approach are distributedaccording to the type of event reported. White squares represent the known exons and grey squares represent the alternative exons. The number ofevents is shown on the right side of each event type. (A) Intron retention showing the presence of one or more constitutive exons. (B) Alternativesplice donor or acceptor site usage. (C) Alternative exon usage events were sub-classified into exon skipping and exon inclusion events that showone or both flanking constitutive exons.doi:10.1371/journal.pone.0021022.g004
Poly (A)+ Sequencing of Breast Transcriptome
PLoS ONE | www.plosone.org 6 June 2011 | Volume 6 | Issue 6 | e21022
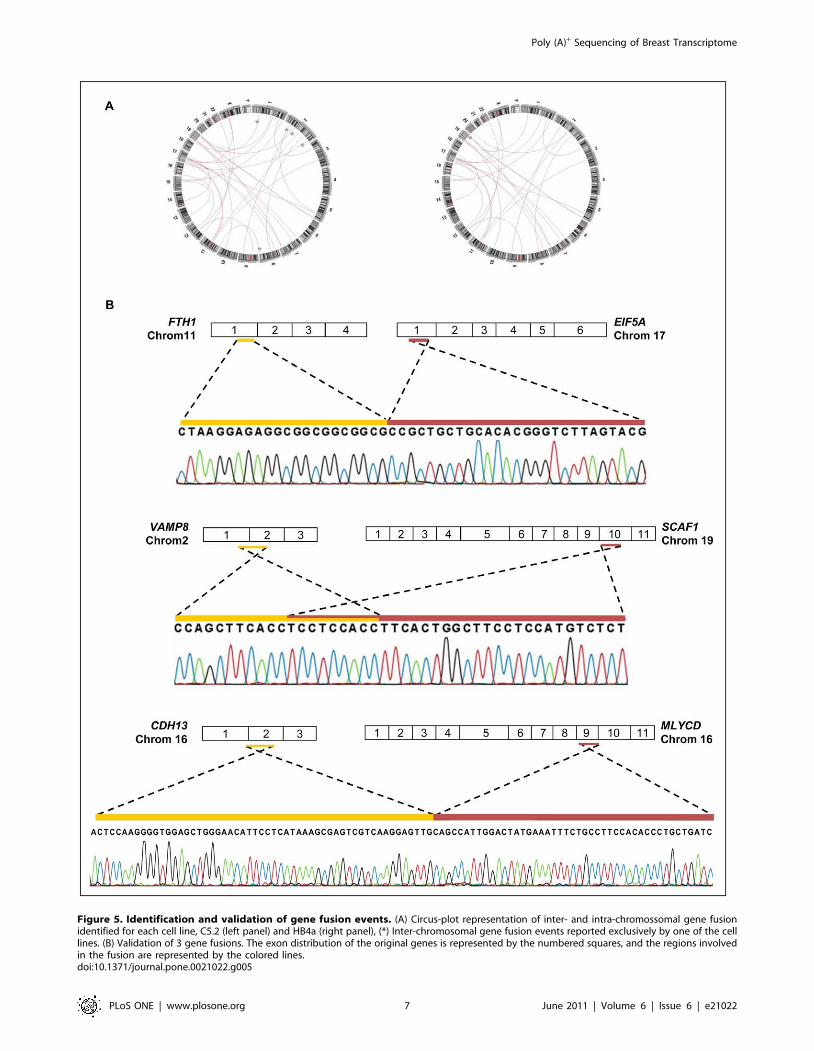
Figure 5. Identification and validation of gene fusion events. (A) Circus-plot representation of inter- and intra-chromossomal gene fusionidentified for each cell line, C5.2 (left panel) and HB4a (right panel), (*) Inter-chromosomal gene fusion events reported exclusively by one of the celllines. (B) Validation of 3 gene fusions. The exon distribution of the original genes is represented by the numbered squares, and the regions involvedin the fusion are represented by the colored lines.doi:10.1371/journal.pone.0021022.g005
Poly (A)+ Sequencing of Breast Transcriptome
PLoS ONE | www.plosone.org 7 June 2011 | Volume 6 | Issue 6 | e21022
identification of spurious gene fusion reads produced during
cDNA library construction, by the presence of enzymatic
restriction sites in the fusion junction of the reads.
High-throughput transcriptome sequencing has been used to
identify genomic rearrangements resulting in gene fusion events
[23,35,36,37] and superior sensitivity was achieved when paired-
end sequencing was applied [36,37,38]. Single-end sequencing of
long or short reads has led to low validation rates, which seem to
be increased when single-end long and short sequencing are used
in combination [35]. The low validation rate obtained here (21%)
reinforces the difficulty of confirming these events using PCR-
based approaches. Nonetheless, despite using single-end long reads
sequencing we identified three bona fide gene fusions, reported
here for the first time to the best of our knowledge.
One of the validated gene fusions reported 10 nt of micro-
homology sequence, also detected in 82% of the gene fusion
candidates, probably resulting from a replication mechanism
known as Fork Stalling and Template Swichting Model (FoSTeS).
These replication disorders arises due to nucleotide similarities
between DNA strands [39], and have been detected in breast
cancer samples [40].
For exploring SNPs, we used stringent bioinformatics and
manual inspection that resulted in a high rate of confirmation
(89%), including validated SNPs with apparent allelic dosage
imbalance in C5.2 cells. Whether ERBB2 overexpression can
mediate allelic dosage imbalance during transcriptional process
remains to be addressed.
The detection of alternative splicing by our method is enhanced
by the longer fragments produced by the 454-platform, compared
to other next-generation sequencing technologies. Here we
showed a 90% validation rate of the exon inclusion splicing
variant class. An extrapolation of this value over the 1,704 novel
AS events in multi-exon splicing variants, with conserved splice
sites, identified by RNAseq would result in 1,533 bona-fide AS
events. Our approach therefore demonstrates a high capacity for
identification of novel splicing variants and, consequently, for the
definition of the mammary transcriptome.
Amplification of the ERBB2 oncogene is considered an
important tumor driver [41], and has been reported in
approximately 25% of breast cancers [11]. The quantitative
transcriptional aspect of overexpression of the oncogene has been
previously assessed by 39 end sequence methodology [18,19].
However, only whole transcriptome sequencing enables the
assessment of some relevant structural aspects. The influence of
ERBB2 was observed in quantitative aspects of breast cell line
transcriptomes, not only on gene expression but also on specific
splicing variants. Enrichment of exon skipping/inclusion and
alternative splice site selection by ERBB2 overexpression in C5.2
cells, observed in the current study, indicated a potential influence
of the oncogene in the regulation of the splicing process. In this
sense, evidence has already been presented by us concerning
expression level regulation of specific AS variants mediated by
ERBB2 [42]. Additionally, it has been suggested by others [43]
that activation of signaling pathways such as Ras/MAPK and
PI3K/AKT, which are controlled in part by ERBB2 signaling,
might influence the alternative splicing balance of cells, by
phosphorylation and activation of specific splicing factors.
The intrinsic molecular heterogeneity found between distinct
human tumor samples as well as within a single breast tumor
sample has been reported by many laboratories [7,44]. These
differences appear to be strongly dependent upon microenviron-
mental factors [5,45]. Despite differences in molecular character-
Figure 6. Gene expression analysis. (A) Correlation of Unigene cluster sizes classified by the ESTs abundance-classes: bottom 25%, 10% and 5%(left panel) and top 25%, 10% and 5% (right panel) by the average number of reads from the RNAseq (log10). (B) Correlation between number ofreads of RNA-seq and Cycle threshold (Ct values) of qRT-PCR experiments for all, validated and non-validated gene set. (C) Relative gene expressionbetween C5.2 and HB4a cells. The 2 black lines represent the cut-off value of log2 ratio $|2|- fold-change $|4|. The blue colored points correspond togenes with a Bayes Error Rate equal to 0.0. ERBB2 relative expression is identified by the red point. (D) Classification of breast tumor samples in highand basal ERBB2-expression by relative quantification of ERBB2 transcript. The black circled points represent the expression level of the cell lines withhigh (C5.2) and basal (HB4a) ERBB2 expression levels. (E) Relative expression of the genes LOX, MME, GALNT3 and ATP5L in the two groups of tumorbreast samples with high and basal ERBB2 expression.doi:10.1371/journal.pone.0021022.g006
Poly (A)+ Sequencing of Breast Transcriptome
PLoS ONE | www.plosone.org 8 June 2011 | Volume 6 | Issue 6 | e21022
istics between cells in vivo and in vitro, our approach allowed us to
identify 4 genes, the expression of which is likely mediated by
ERBB2. We highlight LOX downregulation in C5.2 cells as well as
in tumor samples overexpressing ERBB2. Furthermore, our data
also revealed a higher level of LOX expression in C5.2 cells after
exposure to rapamycin (4-fold change), data indicating that LOX is
potentially regulated by the ERBB2/mTOR pathway. LOX
encodes an extracellular copper-requiring enzyme that initiates
collagen and elastin crosslinking and enhances tumor cell invasion
and metastasis [46]. Conversely, the 18-kDa LOX propeptide was
found to be an effective inhibitor of the more invasive phenotype
of breast cancer cells driven by ERBB2 and has been suggested to
improve treatment in this subtype of breast cancer [47].
Altogether, the results presented here demonstrate that our
approach is suitable for whole transcriptome interrogation, with
single or multiple samples in parallel sequencing by the 454-
ROCHE platform, from which an accurate quantitative and
qualitative portrait of complex transcriptomes can be generated.
Materials and Methods
Cell lines and tumor samples: treatment and RNApurification
Two human breast cell lines, HB4a [16] and C5.2 [17], were
provided by Dr. Michael O’Hare – LICR, NY, and were grown as
described [16]. The high expression of ERBB2 transcript in C5.2
compared to HB4a was confirmed by quantitative RT-PCR (data
not shown). For rapamycin treatment, both cell lines were plated
in 25 cm2 flasks and maintained at 40–50% confluence. Cells were
treated with vehicle (0.01% absolute ethanol) or 20 nM rapamycin
for 24 hours.
Breast tumor samples containing signed informed consents were
retrieved from the A. C. Camargo Hospital Biobank. This study is
in accordance with the Ethics Committee in Human Being
Research from Fundacao Antonio Prudente – Hospital of Cancer -
A.C. Camargo/S.P and has been approved under number 952/
07. Fresh-frozen tumor blocks were cut, fixed, and stained with
hematoxylin and eosin (H&E) and reviewed by a pathologist. Total
RNA was extracted with Trizol and treated with DNaseI. Samples
were classified as ERBB2-high or basal expression according to
protein and mRNA levels. Protein levels were evaluated by
immunohistochemistry (signals 2+ or 3+ indicating high ERBB2
expression, and signals 0 or 1+ indicating basal expression).
ERBB2 transcript was evaluated by quantitative RT-PCR. Only
samples with concordant results at both protein and transcript
expression level were included in the study.
Whole-transcriptome libraries and Roche-platformsequencing
Two hundred nanograms of mRNA poly A+ was incubated with
0.5 mg oligo-dT containing a DpnII restriction site [59GAGGCGG-
GATCT(30)39]. First and second strand cDNA synthesis were
carried out as described [11]. Purified dscDNA was digested with 25
units of DpnII at 37uC for 3 hours. Next, Y-shaped DNA adapters
[48] were added to dscDNA fragments with T4 DNA ligase at 16uCovernight. The HB4a and C5.2 Y-shaped adapters were formed by
primers A and B and primers C and D, respectively (Primer A: 59-
GATCTCCCGAGTGGTCACCTGCTC-39; Primer B: 59-CTA-
GCAGCTACCACTCGGGA-39; Primer C: 59-GATCCCCT-
GAGTGGTCACCTGCTC-39, and Primer D: 59-CTAGCAGC-
TACCACTCAGGG-39). Fragments ranging from 150 bp to
600 bp were size-selected by agarose gel electrophoresisPurified
products were amplified in a 20-cycle PCR, with 2 units Platinum
Taq DNA Polymerase High-Fidelity (Invitrogen, Carlsbad, Califor-
nia), 0.2 mM dNTPs, 2 mM MgCl2, and 5 pmol each of forward
(59GAGCAGGTGACCACTC39) and reverse (59CTAGCAGC-
TACCACTC39) primers. PCR products were verified in 1%
ethidium-bromide-agarose gels. Equivalent masses of each cell line
(HB4a and C5.2) were pooled, and 1.5 mg of the cDNAs from the
poly A+ library were submitted to Titanium Genome Sequencer
FLX System 454 Roche-Life Sciences sequencing.
Bioinformatics analyses454-Roche Titanium reads were screened for the presence of
human ribosomal RNA or mitochondrial DNA by MEGABLAST
(E-value#1610220, identity $85% and coverage $90%). Next,
reads were aligned against the human genome (release hg18,
March 2006) through BLAT [49]. Completely aligning reads were
defined as reads aligning with coverage $70% and identity $96%
(pslReps parameters: minCover = 0.70, minAli = 0.96, near-
Top = 0.005). Reads with significant hits at multiple genome
locations were discarded.
For gene fusion events, reads from partly aligning subset,
defined as reads with coverage $20% and #80% and identity
$99.9% (pslReps parameters: minCover = 0.70, minAli = 0.96,
nearTop = 0.005) were used. Next each region of the read could
have only one single match in the human genome sequence and
the two regions of the read should align to different genes.
Chimeric events including one gene and its corresponding
pseudogene were also discarded. Additionally, only reads mapping
to exonic regions were selected.
To determine the sequence depth coverage of the fusion gene
candidates, we performed alignments between the read reporting
the fusion event and all reads generated by 454-sequencing using
less stringent criteria.
The KnownGene [50] annotation track coordinates from the
University of California Santa Cruz genome database (UCSC) was
used as a reference for mapping of the reads in relation to
annotated transcripts and exons. Gaps spanning more than 50 bp
and having conserved splice sites were considered true intron
sequences, and were used to identify putative splicing events not
annotated in the KnownGene annotation track. Reads not
mapped to any gene-track were used for the identification of
putative novel genes. These candidates were analyzed for the
presence of conserved splice sites.
For single nucleotide polymorphisms (SNPs) Blast-like BLAT
alignment outputs were parsed by the use of a Perl script. A set of
parameters such as base coverage, proximity to exon-intron
boundaries, proximity to alignment ends, number of different
sequenced bases for a specific genome location, ratio between
divergent base and reference base, and presence in both libraries,
was used to select putative SNPs, that were aligned against dbSNP
(build 129) [51].
For all comparative analyses of both RNA-seq from HB4 and
C5.2 cells, DNA barcoding identification was valid when
barcoding was flanked by a 59-adapter sequence and a 39-
restriction enzyme site. To analyze the differential gene expression
profile between HB4a and C5.2 cell lines, we first aligned
confident reads against the RefSeq database with the MegaBlast
tool (E-value#1610215, identity $96% and coverage $90%).
Reads with significant alignments to different genes were excluded.
The overall read count per gene was scaled to reads per million
(RPM), and differential expression was calculated as the ratio of
C5.2RPM/HB4aRPM. We used the SAGEbetaBin statistical
approach to calculate the Bayes Error Rate (SAGEbetaBin
available at http://bioinfo.lbhc.hcancer.org.br/sage/betabin//
en/index.php) [52].
Poly (A)+ Sequencing of Breast Transcriptome
PLoS ONE | www.plosone.org 9 June 2011 | Volume 6 | Issue 6 | e21022
Association between RNA-Seq read count and qRT_PCR Ct-
values was assessed with Spearman correlation coefficient and
p,0.01 was considered as statistically significant.
Validation of SNPsPotentially novel SNPs exhibiting more than one mismatch in a
50 bp window or mapped to homopolymers and repetitive
sequences were discarded. Primers were designed by Primer3
and were used for PCR amplification with DNA from HB4 and
C5.2 cell lines. The amplicons were evaluated on 3% agarose gels
and were sequenced in an ABI 3130xL (Applied Biosystems,
Foster City, California).
Validation of gene fusionsFor confirmation of gene fusion, two strategies were used. First,
primers aligning at the extremities of the reads reporting the event
were designed for RT-PCR and PCR amplification using both
cDNA and genomic DNA, respectively, from both cell lines (Table
S7). Amplification products were analyzed on 8% polyacrylamide
gels and were sequenced on the ABI3130 instrument (Applied
Biosystems, Foster City, California).
Further, for detection of fusion events in cDNA two probes (left
and right) were designed for each putative gene fusion event. The
left probe was complementary to one of the genes involved in the
event, exactly at the limit of the fusion; the right probe, directly
adjacent to the left probe, was complementary to the other gene
involved in the putative event. In addition, the left probe
contained at its 59 end a recognition sequence of the forward
PCR primer (59GGGTAGGCTAAGGGTAGGA39). The right
probe was phosphorylated at its 59 end and contained a
recognition sequence of the reverse PCR primer (59TCTA-
GATTGGATCTTGCTGGCAC39) at its 39 end (Table S7).
The probes were hybridized to pre-heated double-stranded cDNA
and genomic DNA from HB4a and C5.2 cells at 54uC for
12 hours. The two probes hybridized to their target sequence were
subsequently ligated by Ligase-65 (MC Holland, Amsterdam,
Netherlands) to form a single probe that was PCR-amplified. As a
negative control, hybridization in the absence of any template was
performed for all probes, and the reaction was submitted to PCR.
Amplification products were analyzed on 8% polyacrylamide gels
and were sequenced on the ABI3130 instrument (Applied
Biosystems, Foster City, California).
Validation of splicing variantsPrimers were designed at the respective novel exon and at one
adjacent exon (Table S8). cDNAs converted from 40 ng of DNase I-
treated total RNA from HB4a and C5.2 cells was used in each
reaction. PCR was performed in a total volume of 20 ml, 1 X
reaction buffer, 2.5 mM MgCl2, 0.2 mM dNTP, 10 pmoles of each
primer, and 1 unit Platinum Taq DNA polymerase (Life
Technologies, Foster City, California) in 40 cycles at 95uC for
30 sec, 60uC for 30 sec, and 72uC for 30 sec, followed by a final
extension at 72uC for 7 min. Amplification products were visualized
on 8% polyacrylamide gels and were sequenced on an ABI3130
instrument (Applied Biosystems Foster City, California). For
quantitative analyses, PCR amplification with the same pair of
primers was performed in 20 ml 1 X SYBR Green PCR MasterMix
(Applied Biosystems Foster City, California), containing 2–8 pmoles
of each primer and cDNA converted from 100 ng of total RNA.
Validation of novel genesPrimers for the validation of 6 putative novel genes were
designed at two distinct exons with the 454-read as a reference
sequence (Table S9). cDNA converted from 40 ng of DNase I-
treated total RNA from HB4a and C5.2 cells was used in each
reaction. PCR reactions were performed in 20 ml containing 1 X
buffer, 2.5 mM MgCl2, 0.2 mM dNTP, 10 pmoles of each
primer, and 1 unit Taq DNA polymerase incubated at 95uC for
30 sec, 60uC for 30 sec, and 72uC for 30 sec for 40 cycles,
followed by a final extension at 72uC for 7 min. Amplification
products were visualized on 8% polyacrylamide gels and were
sequenced on an ABI3130 instrument (Applied Biosystems Foster
City, California).
Validation of differential gene expressioncDNA converted from 400 ng of total RNA was used as a
template for the evaluation of 96 distinct transcripts (target genes
and endogenous controls) in duplicate. Expression levels of
selected genes were verified by quantitative RT-PCR with
customized TaqMan low-density arrays (Applied Biosystems
Foster City, California) in an ABI7900 instrument. A total of 91
target genes (75 and 16 up-regulated genes in C5.2 and HB4a,
respectively) was randomly selected; GUSB was selected, from the
5 endogenous genes tested, as a reference gene. Differential
expression levels that exhibited a fold-change.2, were considered
significant as determined by the 22DDCt method. The list of
selected genes is shown in Table S5.
Gene Ontology (GO) and KEGG pathways annotationFunNet tools were used for computation of the enriched GO
and KEGG categories [29]. Significant themes were calculated for
up- and down-regulated genes, with the 11,366 represented genes
as the reference set. A decorrelated annotation procedure was
performed by application of the Fisher exact test using corrected p-
values (p-value,0,01) and false discovery rate 5%.
Supporting Information
Figure S1 Relative position frequency to RefSeq tran-scripts. (A) The frequency of reads distributed along transcript
position from the Poly (A)+ library, where 0 is the 59end and 100 is
the 39end of each corresponding transcript. (B) The relative
transcript position of sequences from the Poly (A)+ library in
relation to transcript size. The thickness of bars corresponds to the
frequency of sequences in each group.
(TIF)
Figure S2 Validation of novel SNPs. The chromatogram
represents the validation of the SNPs for each gene. The SNPs
from the HB4a and C5.2 cell lines are shown separately and are
classified as homozygous or heterozygous.
(TIF)
Figure S3 Validation of alternative splicing variants byRT-PCR. Each validated AS event is represented by the genomic
coordinates of each exon/intron border. The blank squares
represent the constitutive exons and the grey squares represent the
alternative exons. The gene symbol and corresponding RefSeq
entry used as a reference are also shown. qRT-PCR validation:
The 8 genes evaluated by RT-PCR are separated by the double
line, and the results are shown inside the square as up- or down-
regulation in the corresponding cell lines.
(TIF)
Figure S4 Identification of artefactual chimeric tran-scripts. Reads containing DpnII restriction site at the border
junction of chimeric transcripts were discarded from gene fusion
analysis. In this example, a chimeric read between the genes
CAPNS1 (chromosome 19) and FAM156A (chromosome X) is
Poly (A)+ Sequencing of Breast Transcriptome
PLoS ONE | www.plosone.org 10 June 2011 | Volume 6 | Issue 6 | e21022
shown. Colored lines highlight the regions involved in the fusion.
The nucleotide sequence corresponding to each gene is shown
with the DpnII restriction site highlighted in larger font size
(GATC).
(TIF)
Figure S5 Classification of differently expressed genesaccording to Gene Ontology and Kegg Pathways. GO
(Biological Process) and KEGG enriched categories in the 46
differentially expressed genes validated. The bar corresponds to
the percentage of differentially expressed genes in relation to all
annotated genes of the RNA-seq in the respective category. Up-
and down-regulated genes refer to the C5.2 cell line.
(TIF)
Table S1 Validation of SNPs. The gene symbol is used to
identify each selected SNP. The SNPs are localized according to
untranslated region (59 and 39 UTR) or coding sequence (CDS)
and mRNA coordinates. The nucleotide alteration is shown. The
amino acid alteration is shown only for non-synonymous cases.
Genotype identified for HB4a and C5.2 cell lines after Sanger
sequencing is shown. ND: Not determined.
(DOC)
Table S2 Characterization of gene fusion events. Gene
symbol of the genes involved in each fusion event are given. The
total number of reads reporting the fusion event is shown and also
the number reads identified by each library is shown in parenthesis
(C – C5.2 cells; H – Hb4a cells; U – reads of undefined origin).
MH – Number of bases with microhomology between the genes.
NT – Number of bases of short non-templated sequences. Genes
involved in more than one event identified by our data are colored
red. Genes involved in fusion events reported in the literature are
shown, and the corresponding genes(s) reported are identified by
their gene symbol. Light green highlights the events selected for
validation. Bright green highlights validated gene fusions.
(DOC)
Table S3 Alternative splicing events detected for eachcell line. The number of alternative splicing events detected for
each sample normalized by the total number of reads generated
for each cell line.
(DOC)
Table S4 Alternative splicing variants modulated byERBB2 expression. The position of the novel exon identified is
shown according to the number of the flanking exons. The
expression level obtained by qRT-PCR is reported as fold-change
between C5.2 and HB4a.
(DOC)
Table S5 Validation of differential gene expressionmodulated by ERBB2. The mRNA seq data is given as a fold-
change between C5.2 and HB4a cell lines. When no reads were
identified in the RNA-seq from one of the cell lines, we calculated
fold-change by replacing ‘‘0’’ by ‘‘1’’. Positive and negative values
correspond to higher expression in C5.2 and HB4a, respectively.
The qRT_PCR results are given as fold-change obtained by
22DDCT. In grey: genes validated in the qRT-PCR by the criterion
for differentially expressed genes as Fold-change.2.
(DOC)
Table S6 Effects of rapamycin treatment on genesinfluenced by ERBB2-mediated expression. The results
from quantitative RT-PCR on rapamycin-treated cell lines for the
46 validated genes are given as fold-change between C5.2 and
HB4a cell lines. Positive and negative values correspond to higher
expression in C5.2 and HB4a cell lines, respectively. The fourth
columns show the qRT_PCR results obtained from the C5.2 and
HB4a cell lines and from the cells lines after rapamycin treatment.
Response to rapamycin was considered when a decrease or
inversion of fold-change between C5.2 and HB4a cell lines
compared to non-treated cell lines was observed. Yes and No
represent response or no response to rapamycin, respectively. (nd)
Cycle threshold not determined.
(DOC)
Table S7 Validation of gene Fusion. The gene fusions
evaluated are characterized by the 2 chromosomes involved in the
event as well as the corresponding genes. The specific hybridiza-
tion sequence of the probes and the amplicon size expected after
PCR are shown.
(DOC)
Table S8 Novel alternative splicing variants. The forward
and reverse primer sequences used for each validation are shown
with the corresponding gene symbol and the amplicon size.
(DOC)
Table S9 Putative novel genes. The chromosome localiza-
tion of each putative novel gene is shown as well as the sequences
of forward and reverse primers and the respective amplicon size.
(DOC)
Acknowledgments
We thank the A. C. Camargo Hospital Biobank.
Author Contributions
Conceived and designed the experiments: DMC ENF GdCM WA RP HB
ED-N RRB. Performed the experiments: DMC ENF GdCM APT BLE
DNN ED-N. Analyzed the data: DMC ENF GdCM RDP EFA DNN
MMB HB ED-N RRB. Contributed reagents/materials/analysis tools:
DMC WA RP ED-N RRB. Wrote the paper: DMC ENF GdCM EFA
ED-N RRB. Performed the bioinformatics analyses: RDP EFA HB.
References
1. Veer LJ, Dai H, van de Vijver MJ, He YD, Hart AA, et al. (2002) Gene expression
proffiling predicts clinical outcome of breast cancer. Nature 415: 530–535.
2. Brentani RR, Carraro DM, Verjovski-Almeida S, Reis EM, Neves EJ, et al.
(2005) Gene expression arrays in cancer research: methods and applications.
Crit Rev Oncol Hematol 54: 95–105.
3. Folgueira MA, Carraro DM, Brentani H, Patrao DF, Barbosa EM, et al. (2005)
Gene expression profile associated with response to doxorubicin-based therapy
in breast cancer. Clin Cancer Res 11: 7434–7443.
4. Castro NP, Osorio CA, Torres C, Bastos EP, Mourao-Neto M, et al. (2008)
Evidence that molecular changes in cells occur before morphological alterations
during the progression of breast ductal carcinoma. Breast Cancer Res 10: R87.
doi: 10.1186/bcr2157.
5. Rozenchan PB, Carraro DM, Brentani H, de Carvalho Mota LD, Bastos EP,
et al. (2009) Reciprocal changes in gene expression profiles of cocultured breast
epithelial cells and primary fibroblasts. I J Cancer 125: 2767–2777.
6. Koike FMA, Brentani H, Carraro DM, De Camargo BFM, Hirata KML, et al.
(2009) Gene expression profile of residual breast cancer after doxorubicin
and cyclophosphamide neoadjuvant chemotherapy. Oncol Rep 4: 805–
813.
7. Perou CM, Sørlie T, Eisen MB, van de Rijn M, Jeffrey SS, et al. (2000)
Molecular portraits of human breast tumours. Nature 406: 747–752.
8. Sørlie T, Perou CM, Tibshirani R, Aas T, Geisler S, et al. (2001) Gene
expression patterns of breast carcinomas distinguish tumor subclasses with
clinical implications. Proc Natl Acad Sci U S A 98: 10869–10874.
9. Ross JS, Fletcher JA (1998) The HER-2/neu Oncogene in Breast Cancer:
Prognostic Factor, Predictive Factor, and Target for Therapy. Oncologist 3:
237–252.
10. Campbell CI, Petrik JJ, Moorehead RA (2010) ErbB2 enhances mammary
tumorigenesis, oncogene-independent recurrence and metastasis in a model of
IGF-IR-mediated mammary tumorigenesis. Molecular Cancer 9: 235–271.
Poly (A)+ Sequencing of Breast Transcriptome
PLoS ONE | www.plosone.org 11 June 2011 | Volume 6 | Issue 6 | e21022
11. Slamon DJ, Godolphin W, Jones LA, Holt JA, Wong SG, et al. (1989) Studies of
the HER-2/neu proto-oncogene in human breast and ovarian cancer. Science
244: 707–712.
12. Slamon DJ, Clark GM, Wong SG, Levin WJ, Ullrich A, et al. (1987) Human
breast cancer: correlation of relapse and survival with amplification of the HER-
2/neu oncogene. Science 235: 177–182.
13. Purdie CA, Baker L, Ashfield A, Chatterjee S, Jordan LB, et al. (2010) Increasedmortality in HER2 positive, oestrogen receptor positiveinvasive breast cancer: a
population-based study. B J Cancer 103: 475–481.
14. Menard S, Pupa SM, Campiglio M, Tagliabue E (2003) Biologic andtherapeutic role of HER2 in cancer. Oncogene 42: 6570–6578.
15. Vogel CL, Cobleigh MA, Tripathy D, Gutheil JC, Harris LN, et al. (2002)
Efficacy and Safety of Trastuzumab as a Single Agent in First-Line Treatment of
HER2-Overexpressing Metastatic Breast Cancer. Journal of Clinical Oncology20: 719–726.
16. Stamps AC, Davies SC, Burman J, O’Hare MJ (1994) Analysis of proviral
integration in human mammary epithelial cell lines immortalized by retroviral
infection with a temperature-sensitive SV40 T-antigen construct. I J Cancer 57:865–874.
17. Harris RA, Eichholtz TJ, Hiles ID, Page MJ, O’Hare MJ (1999) New model of
ErbB-2 over-expression in human mammary luminal epithelial cells. Int J Cancer80: 477–484.
18. Dos Santos ML, Palanch CG, Salaorni S, Da Silva WA, Jr., Nagai MA (2006)
Transcriptome characterization of human mammary cell lines expressing
different levels of ERBB2 by serial analysis of gene expression. Int J Oncol 28:1441–1461.
19. Dos Santos ML, Gimenes KP, Silva WA, Jr., Nagai MA (2009) Transcriptome
changes induced by docetaxel in human mammary cell lines expressing different
levels of ERBB2. Int J Mol Med 23: 733–743.
20. Graveley BR (2001) Alternative splicing: increasing diversity in the proteomic
world. Trends Genet 17: 100–107.
21. Harrow J, Denoeud F, Frankish A, Reymond A, Chen CK, et al. (2006)GENCODE: producing a reference annotation for ENCODE. Genome Biol 7
Suppl 1: S4.1–9.
22. Torres TT, Metta M, Ottenwalder B, Schlotterer C (2008) Gene expressionprofiling by massively parallel sequencing. Genome Res 18: 172–177.
23. Maher CA, Palanisamy N, Brenner JC, Cao X, Kalyana-Sundaram S, et al.
(2009) Chimeric transcript discovery by paired-end transcriptome sequencing.
Proc Nat Acad Sci U S A 106: 12353–12358.
24. Tang F, Barbacioru C, Wang Y, Nordman E, Lee C, et al. (2009) mRNA-Seq
whole-transcriptome analysis of a single cell. Nature Methods 6: 377–382.
25. Yassour M, Kaplan T, Fraser HB, Levin JZ, Pfiffner J, et al. (2009) Ab initioconstruction of a eukaryotic transcriptome by massively parallel mRNA
sequencing. Proc Natl Acad Sci U S A 106: 3264–3269.
26. Pleasance ED, Stephens PJ, O’Meara S, McBride DJ, Meynert A, et al. (2010) A
small-cell lung cancer genome with complex signatures of tobacco exposure.Nature 463: 184–190.
27. Dias-Neto E, Correa RG, Verjovski-Almeida S, Briones MR, Nagai MA, et al.
(2000) Shotgun sequencing of the human transcriptome with ORF expressedsequence tags. Proc Natl Acad Sci U S A 97: 3491–3496.
28. Ramensky V, Bork P, Sunyaev S (2002) Human non-synonymous SNPs: server
and survey. Nucleic Acids Res 30: 3894–3900.
29. Prifti E, Zucker J, Clement K, Henegar C (2008) FunNet: an integrative tool for
exploring transcriptional interactions. Bioinformatics 24: 2636–2638.
30. Janus A, Robak T, Smolewski P (2005) The mammalian target of the rapamycin
(mTOR) kinase pathway: its role in tumourigenesis and targeted antitumourtherapy. Cell Mol Biol Lett 10: 479–498.
31. Creighton CJ (2007) A gene transcription signature of the Akt/mTOR pathway
in clinical breast tumors. Oncogene 26: 4648–4655.32. Heinonen H, Nieminen A, Saarela M, Kallioniemi A, Klefstrom J, et al. (2008)
Deciphering downstream gene targets of PI3K/mTOR/p70S6K pathway in
breast cancer. BMC Genomics 9: 348. doi: 10.1186/1471-2164-9-348.33. Akcakanat A, Zhang L, Tsavachidis S, Meric-Bernstam F (2009) The
rapamycin-regulated gene expression signature determines prognosis for breastcancer. Mol Cancer 8: 75. doi: 10.1186/1476-4598-8-75.
34. Meric-Bernstam F, Gonzalez-Angulo AM (2009) Targeting the mTOR signaling
network for cancer therapy. J Clin Oncol 27: 2278–2287.35. Maher CA, Kumar-Sinha C, Cao X, Kalyana-Sundaram S, Han B, et al. (2009)
Transcriptome sequencing to detect gene fusions in cancer. Nature 458: 97–101.36. Edgren H, Murumagi A, Kangaspeska S, Nicorici D, Hongisto V, et al. (2011)
Identification of fusion genes in breast cancer by paired-end RNA-sequencing.Genome Biol 19: 12.
37. McManus CJ, Duff MO, Eipper-Mains J, Graveley BR (2010) Global analysis of
trans-splicing in Drosophila. Proc Natl Acad Sci U S A 107: 12975–12979.38. Wang XS, Prensner JR, Chen G, Cao Q, Han B, et al. (2009) An integrative
approach to reveal driver gene fusions from paired-end sequencing data incancer. Nat Biotechnol 27: 1005–1011.
39. Gu W, Zhang F, Lupski JR (2008) Mechanisms for human genomic
rearrangements. Pathogenetics 1: 4. doi:10.1186/1755-8417-1-4.40. Stephens PJ, McBride DJ, Lin ML, Varela I, Pleasance ED, et al. (2009)
Complex landscapes of somatic rearrangement in human breast cancergenomes. Nature 462: 1005–10.
41. Di Fiore PP, Pierce JH, Kraus MH, Segatro O, King CR, et al. (1987) Erbb-2 isa potent oncogene when overexpressed in NIHI/3T3 Cells. Science 237:
178–181.
42. Ferreira EN, Rangel MC, Galante PF, de Souza JE, Molina GC, et al. (2010)Alternative splicing enriched cDNA libraries identify breast cancer-associated
transcripts. BMC Genomics 11: Suppl 5: S4.43. Srebrow A, Kornblihtt AR (2006) The connection between splicing and cancer.
J Cell Sci 119: 2635–2641.
44. Stingl J, Caldas C (2007) Molecular heterogeneity of breast carcinomas and thecancer stem cell hypothesis. Nat Rev Cancer 7: 791–799.
45. Allinen M, Beroukhim R, Cai L, Brennan C, Lahti-Domenici J, et al. (2004)Molecular characterization of the tumor microenvironment in breast cancer.
Cancer Cell 6: 17–32.46. Noblesse E, Cenizo V, Bouez C, Borel A, Gleyzal C, et al. (2004) Lysyl oxidase-
like and lysyl oxidase are present in the dermis and epidermis of a skin equivalent
and in human skin and are associated to elastic fibers. J Invest Dermatol 122:621–630.
47. Min C, Kirsch KH, Zhao Y, Jeay S, Palamakumbura AH, et al. (2007) Thetumor suppressor activity of the lysyl oxidase propeptide reverses the invasive
phenotype of Her-2/neu-driven breast cancer. Cancer Res 67: 1105–1112.
48. Watahiki A, Waki K, Hayatsu N, Shiraki T, Kondo S, et al. (2004) Librariesenriched for alternatively spliced exons reveal splicing patterns in melanocytes
and melanomas. Nat Methods 3: 233–239.49. Kent WJ (2002) BLAT–the BLAST-like alignment tool. Genome Res 4:
656–664.50. Hsu F, Kent WJ, Clawson H, Kuhn RM, Diekhans M, et al. (2006) The UCSC
Known Genes. Bioinformatics 22: 1036–1046.
51. Sherry ST, Ward MH, Kholodov M, Baker J, Phan L, et al. (2001) dbSNP: theNCBI database of genetic variation. Nucleic Acids Res 29: 308–311.
52. Vencio RZ, Brentani H, Patrao DF, Pereira CA (2004) Bayesian modelaccounting for within-class biological variability in Serial Analysis of Gene
Expression (SAGE). BMC Bioinformatics 5: 119. doi: 10.1186/1471-2105-5-
119.
Poly (A)+ Sequencing of Breast Transcriptome
PLoS ONE | www.plosone.org 12 June 2011 | Volume 6 | Issue 6 | e21022
Related Documents