ORIGINAL PAPER Pollution of River Mahaweli and farmlands under irrigation by cadmium from agricultural inputs leading to a chronic renal failure epidemic among farmers in NCP, Sri Lanka J. M. R. S. Bandara • H. V. P. Wijewardena • Y. M. A. Y. Bandara • R. G. P. T. Jayasooriya • H. Rajapaksha Received: 13 November 2009 / Accepted: 7 October 2010 Ó Springer Science+Business Media B.V. 2010 Abstract Chronic renal failure (CRF) associated with elevated dietary cadmium (Cd) among farming communities in the irrigated agricultural area under the River Mahaweli diversion scheme has reached a significantly higher level of 9,000 patients. Cadmium, derived from contaminated phosphate fertilizer, in irrigation water finds its way into reservoirs, and finally to food, causing chronic renal failure among consumers. Water samples of River Mahaweli and its tributaries in the upper catchment were analyzed to assess the total cadmium contamination of river water and the possible source of cadmium. Except a single tributary (Ulapane Stream, 3.9 lg Cd/l), all other tested tributaries carried more than 5 lg Cd/l, the maximum concentration level accepted to be safe in drinking water. Seven medium-sized streams carrying surface runoff from tea estates had 5.1–10 lg Cd/l. Twenty larger tributaries (Oya), where the catchment is under vegetable and home garden cultivation, carried 10.1–15 lg Cd/l. Nine other major tributar- ies had extremely high levels of Cd, reaching 20 lg Cd/l. Using geographic information system (GIS), the area in the catchment of each tributary was studied. The specific cropping system in each watershed was determined. The total cadmium load- ing from each crop area was estimated using the rates and types of phosphate fertilizer used by the respec- tive farmers and the amount of cadmium contained in each type of fertilizer used. Eppawala rock phosphate (ERP), which is mostly used in tea estates, caused least pollution. The amount of cadmium in tributaries had a significant positive correlation with the cad- mium loading of the cropping system. Dimbula Tea Estate Stream had the lowest Cd loading (495.9 g/ha/ year), compared with vegetable-growing areas in Uma Oya catchment with 50,852.5 g Cd/ha/year. Kendall’s s rank correlation value of total Cd loading from the catchment by phosphate fertilizer used in all crops in the catchment to the Cd content in the tributaries was ?0.48. This indicated a major contri- bution by the cropping system in the upper catchment area of River Mahaweli to the eventual Cd pollution of river water. Low soil pH (4.5–5.2), higher organic matter content (2–3%), and 18–20 cmol/kg cation exchange capacity (CEC) in upcountry soil have a cumulative effect in the easy release of Cd from soil with the heavy surface runoff in the upcountry wet zone. In view of the existing water conveyance system from upcountry to reservoirs in North Central Province (NCP) through diversion of River Mahaw- eli, in addition to their own nonpoint pollution by triple superphosphate fertilizer (TSP), this demands a change in overall upper catchment management to J. M. R. S. Bandara (&) Á H. V. P. Wijewardena Á Y. M. A. Y. Bandara Á R. G. P. T. Jayasooriya Department of Agricultural Biology, University of Peradeniya, Peradeniya 20400, Sri Lanka e-mail: [email protected] H. Rajapaksha School of Molecular and Biomedical Sciences, The University of Adelaide, Adelaide, SA 5005, Australia 123 Environ Geochem Health DOI 10.1007/s10653-010-9344-4

Welcome message from author
This document is posted to help you gain knowledge. Please leave a comment to let me know what you think about it! Share it to your friends and learn new things together.
Transcript
ORIGINAL PAPER
Pollution of River Mahaweli and farmlands under irrigationby cadmium from agricultural inputs leading to a chronicrenal failure epidemic among farmers in NCP, Sri Lanka
J. M. R. S. Bandara • H. V. P. Wijewardena •
Y. M. A. Y. Bandara • R. G. P. T. Jayasooriya •
H. Rajapaksha
Received: 13 November 2009 / Accepted: 7 October 2010
� Springer Science+Business Media B.V. 2010
Abstract Chronic renal failure (CRF) associated
with elevated dietary cadmium (Cd) among farming
communities in the irrigated agricultural area under
the River Mahaweli diversion scheme has reached a
significantly higher level of 9,000 patients. Cadmium,
derived from contaminated phosphate fertilizer, in
irrigation water finds its way into reservoirs, and
finally to food, causing chronic renal failure among
consumers. Water samples of River Mahaweli and its
tributaries in the upper catchment were analyzed to
assess the total cadmium contamination of river water
and the possible source of cadmium. Except a single
tributary (Ulapane Stream, 3.9 lg Cd/l), all other
tested tributaries carried more than 5 lg Cd/l, the
maximum concentration level accepted to be safe in
drinking water. Seven medium-sized streams carrying
surface runoff from tea estates had 5.1–10 lg Cd/l.
Twenty larger tributaries (Oya), where the catchment
is under vegetable and home garden cultivation,
carried 10.1–15 lg Cd/l. Nine other major tributar-
ies had extremely high levels of Cd, reaching
20 lg Cd/l. Using geographic information system
(GIS), the area in the catchment of each tributary was
studied. The specific cropping system in each
watershed was determined. The total cadmium load-
ing from each crop area was estimated using the rates
and types of phosphate fertilizer used by the respec-
tive farmers and the amount of cadmium contained in
each type of fertilizer used. Eppawala rock phosphate
(ERP), which is mostly used in tea estates, caused
least pollution. The amount of cadmium in tributaries
had a significant positive correlation with the cad-
mium loading of the cropping system. Dimbula Tea
Estate Stream had the lowest Cd loading (495.9 g/ha/
year), compared with vegetable-growing areas in
Uma Oya catchment with 50,852.5 g Cd/ha/year.
Kendall’s s rank correlation value of total Cd loading
from the catchment by phosphate fertilizer used in all
crops in the catchment to the Cd content in the
tributaries was ?0.48. This indicated a major contri-
bution by the cropping system in the upper catchment
area of River Mahaweli to the eventual Cd pollution
of river water. Low soil pH (4.5–5.2), higher organic
matter content (2–3%), and 18–20 cmol/kg cation
exchange capacity (CEC) in upcountry soil have a
cumulative effect in the easy release of Cd from soil
with the heavy surface runoff in the upcountry wet
zone. In view of the existing water conveyance
system from upcountry to reservoirs in North Central
Province (NCP) through diversion of River Mahaw-
eli, in addition to their own nonpoint pollution by
triple superphosphate fertilizer (TSP), this demands a
change in overall upper catchment management to
J. M. R. S. Bandara (&) � H. V. P. Wijewardena �Y. M. A. Y. Bandara � R. G. P. T. Jayasooriya
Department of Agricultural Biology, University of
Peradeniya, Peradeniya 20400, Sri Lanka
e-mail: [email protected]
H. Rajapaksha
School of Molecular and Biomedical Sciences, The
University of Adelaide, Adelaide, SA 5005, Australia
123
Environ Geochem Health
DOI 10.1007/s10653-010-9344-4
minimize Cd pollution through agriculture inputs to
prevent CRF due to elevated dietary cadmium among
NCP farmers.
Keywords Phosphate fertilizer � Cadmium from
fertilizer � Chronic renal failure � Cadmium loading �Cadmium in tributaries � Cadmium mobility
Introduction
Chronic renal failure (CRF) associated with elevated
dietary cadmium was first reported in North Central
Province (NCP) of Sri Lanka in 1993. Bandara et al.
(2008) reported that the number of patients in NCP
was around 5,000. CRF cases in NCP steadily
increased to 7,650 in 2009, as reported by the Health
Ministry of Sri Lanka (Health Fund 2009). The
Government Information Department reported the
number treated for CRF by October 2009 in Anura-
dhapura Hospital to be 9,000 (Jayamanna 2009).
These cases are mainly from NCP, Uva Province
(Girandurukotte and Nikewewa), and North Western
Province. The total number of deaths reported from
CRF in Anuradhapura, NCP General Hospital is
1,082 to date, since 1993.
It was observed that the affected patients were
mostly (90–94.5%) rice farmers (Athuraliya et al.
2003) from farming communities under the major
irrigation scheme established with the diversion of
River Mahaweli in 1977. The average annual dis-
charge from River Mahaweli, amounting to 8.4 bil-
lion cubic meters, is used to irrigate 140,000 ha in
NCP (MAHAWELI 1988). The unique situation of
water reservoirs in NCP, fed by the waters of the
diverted River Mahaweli in addition to supply from
their own catchment, which are fed by drainage water
from rice fields, demands special study on the impact
of farming on water quality. The pattern of location
of reservoirs in a series of cascades and the irrigation
canals are described in detail by Bandara et al.
(2008). These reservoirs are the main sources of
drinking and irrigation water of NCP farmers.
Several researchers have reported the impact of
agriculture on the quality of irrigation and potable
water in the dry zone of Sri Lanka. These reports dealt
with direct contamination of water by either fertilizers
or pesticides applied in fields. Data reported were
mostly on the occurrence of excessive quantities of
nitrates and phosphates that led to eutrophication of
reservoirs and heavy nitrate levels in reservoirs and
ground water (Piyasiri 1995; Liyanege et al. 2000;
de Zoysa 2002). In a more comprehensive study on
water quality in NCP, Perera (2006) and Wickrama-
arachchi (2005) reported the occurrence of higher
quantities of the weedicide Propanil [1.02 mg/l in
reservoirs, 1.18 mg/l in canals, in comparison with
World Health Organization (WHO) recommended
maximum acceptable level (MAL) of 175 lg/l] and
the insecticide chlorpyrifos (2.8 and 6.77 mg/l in
reservoirs and canals, respectively, compared with
WHO MAL of 0.09 lg/l) in irrigation water. A
bioassay based on the rate of egg yolk utilization by
tilapia eggs proved the resilient efficacy of these
pesticides contaminating waterways and reservoirs.
Bandara et al. (2008), working on reservoirs used for
drinking purposes and irrigation of rice fields, fed with
either diverted Mahaweli water or precipitation in the
respective catchment area, reported significantly high
levels of cadmium (Cd), Iron (Fe), and lead (Pb) in
reservoir waters and reservoir sediments. No arsenic
(As) was detected in any of the reservoir sediments or
waters tested. Bandara et al. (2008) showed that mean
urinary cadmium (UCd) concentration in CRF
patients (7.58 ± 6.18 lg Cd/g creatinine) and those
without symptoms but exposed to elevated dietary
cadmium (11.62 ± 8.45 lg Cd/g creatinine) in the
same region were far above normal levels (2 lg Cd/g
creatinine, recommended by WHO). Biopsy reports of
CRF patients in Madawachchiya (NCP) show a
predominant factor of tubular interstitial dysfunction
with endocytosis and proximal tubular sclerosis, with
no glomerular renal dysfunction (Bandara et al.
2008), with 35% of the population having creatinine
clearance less than 30 ml/min. It is evident that
farmers in the region are exposed to elevated dietary
cadmium and also to cadmium from pesticides that
contain it as a contaminant in their formulations. Cd
was detected (0.5 ± 0.1 mg Cd/l) in a formulation of
bispyribac sodium, a weedicide very heavily used in
rice farming in NCP, as reported by Bandara et al.
(2008). The main source of Cd in the rice environ-
ment appears to be agrochemicals, with a major
contribution by contaminated low-grade triple super-
phosphate fertilizer (TSP) used in rice fields. Cad-
mium contamination in TSP used in Sri Lankan rice
Environ Geochem Health
123
fields mainly in the dry zone varied from 23 to
71.739 mg Cd/kg of P2O5 (Premarathna et al. 2005;
Bandara et al. 2008).
The objective of this study is to determine the
amount of cadmium added through the waters of
diverted River Mahaweli originating in different
catchment areas under various cropping systems
which eventually elevate the dietary cadmium in
NCP. This unique situation makes the region more
prone to chronic renal failure due to elevated dietary
intake of Cd compared with other regions of Sri
Lanka that cultivate rice.
Materials and methods
Study area
The total land area of Sri Lanka is 65,525 km2, of
which 59,217 km2 is covered by 103 distinct river
basins. Among these, the basin of River Mahaweli is
the largest, covering an area of over 10,000 km2,
representing one-sixth of the area of the island.
Mahaweli Basin covers a land area lying across five
of the nine provinces of Sri Lanka. The population in
Mahaweli Basin amounts to more than 2.8 million,
15% of the total population. The average annual
discharge from River Mahaweli is about 8.4 billion
cubic meters, which is used to irrigate 140,000 ha in
NCP, of which 75,361 ha was sowed with rice in the
year 2004. In the dry zone farmlands irrigated by
Mahaweli diversion schemes, the mean annual sur-
face runoff is 2.55 9 106 ha m and the runoff rainfall
ratio is 35.8%. NCP includes 4,000 small reservoirs,
arranged in 280 cascade systems (Bandara et al.
2008), most of which are fed with Mahaweli water
through diversions at several points of River
Mahaweli in the wet zone. Tributaries of Mahaweli
for sampling were selected mostly from the upper
catchment area of River Mahaweli and also at points
of diversion that carried irrigation water to dry zone
farmlands through reservoirs located in the dry zone
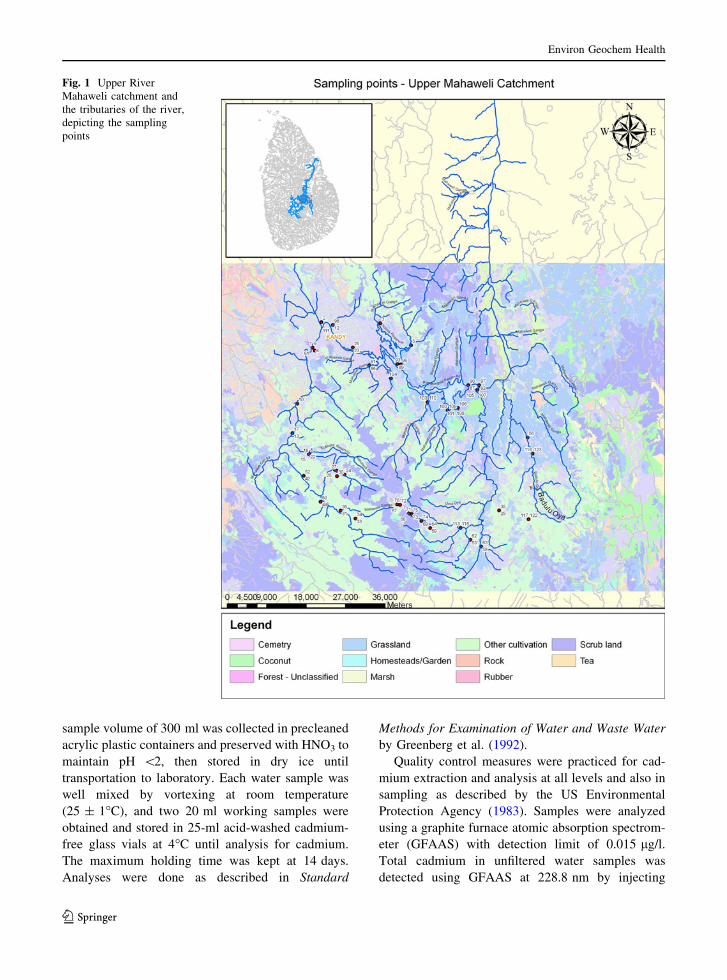
(Figs. 1, 4).
Sample collection
Sampling was done at 21 tributaries of River
Mahaweli, namely at: (1) Pinga Oya, (2) Hulu Ganga
(river), (3) Galmal Oya, (4) Mada Ela (canal), Kandy,
(5) Makandura Oya, (6) Watahena Oya, (7) Mal-
deniya Oya, (8) Huna Oya, (9) Pundalu Oya, (10)
Badulu Oya, (11) Talatu Oya, (12) Kurundu Oya,
(13) Mana Oya, (14) Belihul Oya, (15) Stream
(running through) Talawakele Estate, (16) Stream—
Fernlands Estate, (17) Stream—St Coombs TRI
Estate Talwakele, (18) Stream—Dimbula, (19)
Stream—Mount Vernon Estate, (20) Stream—Katab-
ula Tea Estate, and (21) Uma Oya. The manmade
reservoirs of the upper Mahaweli catchment that were
sampled were Polgolla Reservoir (at the mouth of the
underground diversion canal) and Kotmale Reservoir
(both left and right banks). Several samples were
taken at River Mahaweli, at Gampola Township near
the bridge, tributary near Ulapane, two locations near
New Bridge Talawakele, and other locations along
the major tributaries, represented by three-digit
numbers as follows: 201, 202, 203, and 204, from
Badulu Oya along Badulla Mahiyangana Road up to
Badulla Rawana Falls; 205, Diganatennea—Weli-
mada Bandarawela Road; 206, 207, 208, 209, 210,
211, 212, and 213, streams leading to Uma Oya up to
Welimada; and 214 and 215, Gregory Lake. Other
reservoirs sampled downstream of River Mahaweli
from the first diversion point at Polgolla were
Victoria left and right bank, Rantambe left and right
bank, and Randenigala Reservoir. In addition to
these, two more sampling points in Nuwara Eliya
were taken as reference from Gregory Lake situated
in Nuwara Eliya in the central highlands. The total
number of sampling locations amounted to 47. Water
samples from the rivers and reservoirs were collected
using a column sampler (2.13 m high, 76.2 mm
diameter) to obtain a composite water sample from
each sample point. A maximum of 2 m depth from
the surface was reached wherever possible. Three
samples from each location were taken, and a
composite sample was made for duplicate analysis.
Global positioning system (GPS) coordinates at each
sampling site were recorded using a portable GPS
recorder with accuracy of ±2 m to record the point of
sampling precisely for analysis of cropping systems
in the catchment of the tributaries (Fig. 1).
Analytical methods
Water samples were collected in acrylic plastic
containers. Containers were acid-rinsed (1:1 nitric
acid) prior to use for collection of water samples. A
Environ Geochem Health
123
sample volume of 300 ml was collected in precleaned
acrylic plastic containers and preserved with HNO3 to
maintain pH \2, then stored in dry ice until
transportation to laboratory. Each water sample was
well mixed by vortexing at room temperature
(25 ± 1�C), and two 20 ml working samples were
obtained and stored in 25-ml acid-washed cadmium-
free glass vials at 4�C until analysis for cadmium.
The maximum holding time was kept at 14 days.
Analyses were done as described in Standard
Methods for Examination of Water and Waste Water
by Greenberg et al. (1992).
Quality control measures were practiced for cad-
mium extraction and analysis at all levels and also in
sampling as described by the US Environmental
Protection Agency (1983). Samples were analyzed
using a graphite furnace atomic absorption spectrom-
eter (GFAAS) with detection limit of 0.015 lg/l.
Total cadmium in unfiltered water samples was
detected using GFAAS at 228.8 nm by injecting
Fig. 1 Upper River
Mahaweli catchment and
the tributaries of the river,
depicting the sampling
points
Environ Geochem Health
123
20 ll samples in triplicate. Cd content in HNO3 used
in precleaning of vials and in house standards were
also assessed. Reported results for the samples are
means of three replicate analyses. As an overall
quality control plan, continued calibration of the
instrument was practiced and performed by analyzing
one mid-concentration standard after every ten anal-
yses. Method blanks, in which deionized double-
distilled water was added to precleaned sample
bottles in the field and acidified with HNO3, were
analyzed. Standard solutions for analytical quality
assurance (VWR; VWR International Ltd., Poole,
UK) with Cd (NO3)2�4H2O in HNO3 (0.5 mol/l)
matrix containing 1,002 ± 5 mg Cd/l were used. It
was ensured that the relative percentage difference
between the initial calibration and the continuing
calibration was less than 15%.
Assessment of cropping systems area
and cadmium loading
The areas under different crops grown in the watershed
of the tributaries of River Mahaweli were assessed
using the detailed maps of the regions and the GIS
software available at the Land Use Division of the
Government Department of Agriculture, Sri Lanka.
The global positioning system (GPS) values at the
locations of sampling were recorded at the time of
water sampling using a GPS recorder with accuracy of
±2 m. GPS used WGS84 as the default coordinate
system for universal location. Although the World
Geodetic System (WGS) 1984 is the world standard
coordinate system, the Sri Lankan grid system makes
use of an ellipsoid that goes through the crest of Mount
Everest. The Sri Lankan grid system is also known as
Kandawala, which is the term preferred by the
European Professional Surveyors Group’s (EPSG)
working group on geodesy. The geographical coordi-
nates were converted to Kandawala using Pathfinder
software to identify the sheet numbers of natural
resource management data sheets. Land-use pattern
and area under different crops were estimated using
Kandy, Gampola, Nuwaraeliya, Matale, Badulla, and
Welimada region sheets available at the Natural
Resource Management Centre of the Department of
Agriculture, Peradeniya. The precise boundary of each
catchment was identified using ArcView 3.1a. The
total catchment area of the watershed and the area
under each crop were estimated using ArcGIS 9.3. The
total cadmium loading into tributaries from specific
cropping systems was estimated based on the rates and
frequency of fertilizer application per cropping season.
The fertilizer regimes practiced, type of phosphate
fertilizer used, and level of cadmium contained in
them, in each cropping system, were used in the
estimation of cadmium loading into the catchment and
eventually into tributaries. However, as the amount of
cadmium added by other regular inputs in agriculture
such as soil pH moderators such as dolomite
(9.06 mg Cd/kg), CaO (6.53 mg Cd/kg), organic
manure (0.43–0.97 mg Cd/kg), and weedicides and
pesticides (0–0.5 mg Cd/l) are negligible (Bandara
et al. 2008; Premarathna 2006) in the cadmium
loading assessment, only cadmium added via phos-
phate fertilizer was considered. Sri Lanka imported
triple superphosphate fertilizer (TSP) only from three
major suppliers, of which 81.55% was supplied by one
single foreign supplier in both 2006 and 2007 (DoC,
Sri Lanka Trade Reports 2007). The mean values of
cadmium contamination reported were 23.5 mg/kg of
TSP (Premarathna 2006) and 71.739 mg of Cd/kg of
TSP (Bandara et al. 2008). An average value of the two
reported levels of Cd contamination in TSP was taken,
as there is only one major supplier of TSP for the entire
agriculture sector in Sri Lanka. Eppawala rock phos-
phate is a locally produced rock phosphate from a
resource in Eppawala in NCP, Sri Lanka, and the sole
supplier of ERP to tea plantations is the Government of
Sri Lanka. Premarathna (2006) reported that ERP has
only 1.7 mg Cd/kg. Only ERP is used in tea estates of
Sri Lanka. The total cadmium loading was therefore
estimated as g Cd/year based on two seasons of
cropping per year in each catchment by obtaining the
product of mean Cd contamination for TSP or ERP in
the case of tea, the total amount of TSP or ERP added
per ha in a year, and the area under each crop under
consideration in a given catchment.
Statistical analysis
Kendall’s s rank correlation coefficient was estimated
as a measure of association of total cadmium loading
from areas of different cropping systems and the
amount of cadmium pollution per liter in Mahaweli
tributaries using Wessa’s (2009) Kendall s rank
correlation v1.0.10 in v1.123-c4 (free statistics soft-
ware online from Software Office for Research &
Development and Education).
Environ Geochem Health
123
Results and discussion
Figure 1 presents the area under the watershed of
River Mahaweli and the sampling points of its
tributaries. River Mahaweli is diverted partially into
the dry zone of Sri Lanka at Polgolla through an
underground tunnel. Polgolla Tunnel is important as
the key point of diversion of River Mahaweli to
North Central Province (Fig. 4), the ancient kingdom
of Rajarata, in view of the prevailing CRF epidemic
occurring there. The capacity of Polgolla Reservoir is
4.1 million cubic meters, originating from catchment
area of 738 km2.
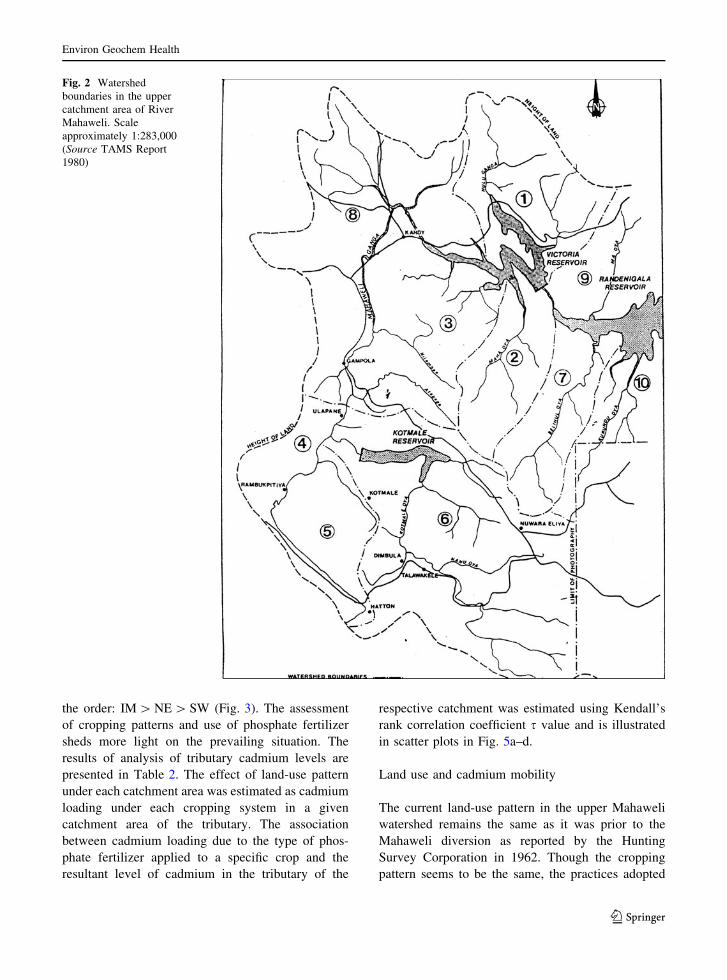
River Mahaweli originates in the Mount Sri Pada
Range near Hatton (Fig. 2 catchment number 5, C-5),
at 2,000 m altitude. It flows 335 km north and
northeast to drain into the sea at Trincomalee Bay.
Seven major tributaries, namely Kurundu Oya
(C-10), Belihul Oya (C-7), Mana Oya (C-2), and
Kotmale Oya (C-6) from the south, and Ma Oya
(C-9), Pinga Oya (C-8), and Hulu Ganga (C-1) from
the north, enter Mahaweli (Fig. 2). The total upper
catchment area of Mahaweli where this study was
conducted is about 316,000 ha. In the lower basin
there are three major tributaries that enter the
Mahaweli: Amban Ganga, Ulhitiya Oya, and
Kaudulla Oya (not illustrated in Fig. 2).
Cadmium in tributaries of River Mahaweli
The mean total cadmium concentrations in the
tributaries of Mahaweli, the main River Mahaweli,
and its reservoirs built within the upper catchment
area, categorized into four groups, are given in
Table 1. Both the main river and its tributaries carried
cadmium at levels considered to be unacceptable for
drinking purposes based on the maximum contami-
nant level (MCL) of 5 lg Cd/liter or ppb to protect
human health (EPA-USA 2000). Among the major
tributaries tested, only a single tributary (2.1%) had
acceptable levels of cadmium as recommended by the
US Environmental Protection Agency (EPA). Seven
medium-sized streams carrying runoff and drainage
water from tea estates had mean cadmium concen-
tration in the range 5.1–10 lg Cd/l. Among the larger
tributaries (Oyas), 20 Oyas, mainly carrying drainage
water from vegetable plots, carried mean total
cadmium in the range 10.1–15 lg Cd/l, and 9 others
had extremely high levels, reaching 20 lg Cd/l. The
main river and the reservoirs within the upper
catchment carried very high levels of cadmium
(extreme observed: 23.8 lg Cd/l in Maldeniya Oya,
21.8 lg Cd/l in Rantambe Reservoir). The sampling
was done during the months of November and
December (21 November to 30 December, 2008)
over a period of 7 weeks. The rivers and streams
were rich in runoff water, as it was after the
southwest monsoon and in the midst of intermonso-
onal convectional rains.
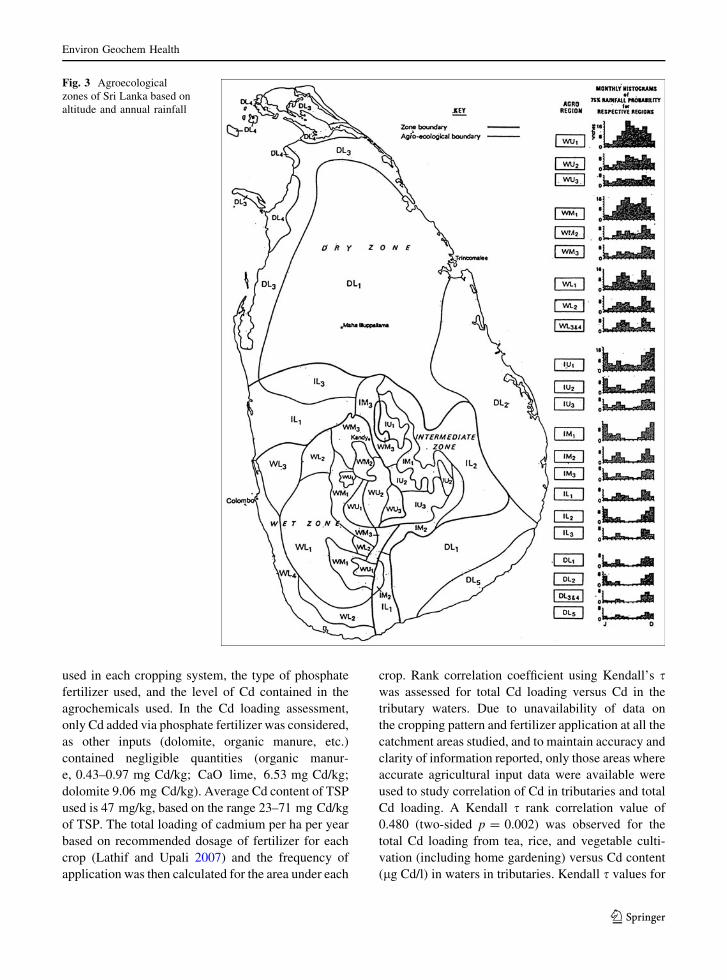
The effective precipitation in the upper catchment
(agroecological zones WU1, WU2, WU3, IU2 & IU3,
WM1, WM2 & WM3 in Fig. 3) was found to range
from 12 mm in September to 114 mm in November
(UNDP/FAO 1969). The mean annual rainfall ranges
from 1,650 mm in the downstream area to 5,300 mm
in the upper catchment. The amount of rainfall and
the resulting surface runoff depend on the intensity of
the monsoon, the main climatic determinant of the
island. The full force of the monsoon is received by
the highest parts of the hill country, while the lowland
plains and the shadow areas of the monsoon in the
hill country receive lower rainfall. The upper catch-
ment where we sampled receives the greatest rainfall
during the southwest monsoon from May to Septem-
ber, whereas the northeast monsoon from December
to January produces the least rainfall.
Premarathna et al. (2005) reported that the agri-
cultural soil in the upcountry wet zone in agroeco-
logical zones WU3, IU2, and IU3 within the
Mahaweli upper catchment region (Fig. 3) carries
higher levels of Cd (total Cd 0.51–3.86 mg/kg,
exchangeable Cd 0.26–1.24 mg/kg) as a result of
the use of contaminated TSP as phosphate fertilizer.
The low pH of upcountry soil (pH 4.5–4.8 surface
soil), though rich in organic matter (3–4%), leads to
easy leaching of soil Cd. Out of 39.5 9 109 m3 total
precipitation in the wet zone where the upper
catchment is located, the total runoff per annum is
25.9 9 109 m3, amounting to 65% runoff. This heavy
runoff is the reason for higher amount of cadmium in
the tributaries and River Mahaweli. Blennerhassett
(1998) reported the importance of the role of surface
runoff in the increase in phosphate and its associated
minerals in downstream tributaries (Fig. 4).
The sampling area of the upper catchment of River
Mahaweli is in the region where precipitation is
dominated by the intermonsoonal (IM) rain, then the
northeast (NE) or southwest (SW) monsoonal rains in
Environ Geochem Health
123
the order: IM [ NE [ SW (Fig. 3). The assessment
of cropping patterns and use of phosphate fertilizer
sheds more light on the prevailing situation. The
results of analysis of tributary cadmium levels are
presented in Table 2. The effect of land-use pattern
under each catchment area was estimated as cadmium
loading under each cropping system in a given
catchment area of the tributary. The association
between cadmium loading due to the type of phos-
phate fertilizer applied to a specific crop and the
resultant level of cadmium in the tributary of the
respective catchment was estimated using Kendall’s
rank correlation coefficient s value and is illustrated
in scatter plots in Fig. 5a–d.
Land use and cadmium mobility
The current land-use pattern in the upper Mahaweli
watershed remains the same as it was prior to the
Mahaweli diversion as reported by the Hunting
Survey Corporation in 1962. Though the cropping
pattern seems to be the same, the practices adopted
Fig. 2 Watershed
boundaries in the upper
catchment area of River
Mahaweli. Scale
approximately 1:283,000
(Source TAMS Report
1980)
Environ Geochem Health
123
today are more chemical based. The ever-increasing
use of agrochemicals and specifically excessive use
of fertilizer on field crops and vegetables intensively
grown under home garden systems contribute to the
nonpoint pollution that we experience today (Jaya-
thilake and Bandara 1989). The upper catchment has
four major land-use groups, namely tea, field crops,
home gardens with intensive vegetable cultivation,
and rice. In the region we studied, 30.7% comes
under intensely managed tea cultivation, 68.7% under
other crops, and the balance is marshy land. How-
ever, only a single stream, which carries water from a
predominantly tea area (50% of catchment area, C-4),
was below the US EPA recommended MCL of
5 lg Cd/l (Table 1). It appears that all other water-
sheds (Fig. 2) released higher levels of Cd to runoff
water. The physiographic properties of soil in the
study region (WU) are undulating to rolling (Soil
Science Society of Sri Lanka 1999). The amount of
cadmium in uncultivated soil is 0.51 mg/kg, in
contrast to 1.96 mg/kg in soil under vegetable
cultivation (Premarathna 2006). The other major
characteristics of uncultivated soil in the region are
presented in Table 3.
It is evident from Fig. 5 that the heavy Cd
contamination of tributary waters is due to the impact
of agricultural inputs.
The minimum Cd contamination occurred in
predominantly tea areas in the watershed, probably
due to low input of Cd from phosphate fertilizer. Tea
estates used direct unprocessed rock phosphate,
namely Eppawala rock phosphate (ERP), at the rate
of 123 kg/ha. ERP is a rock phosphate obtained
from a phosphate ore in Eppawala, Anuradhapura, Sri
Lanka, and it contains only 1.7 mg Cd/kg, compared
with imported triple superphosphate (rock phosphate
treated with sulfuric acid) that contains
23.5–71.739 mg Cd/kg (Bandara et al. 2008; Pre-
marathna 2006).
ERP is suitable for long-term crops, such as tea, in
acidic soils, compared with annuals, which need to be
supplied with TSP. However due to the properties of
the B horizon with accumulated clay in the soil profile
in the region and the rainfall pattern, the actual release
of Cd may vary. The total cadmium loading that
occurred in the catchment area in 1 year was therefore
estimated to study the potential relationship with the
Cd in the catchment, the tributaries, and the reservoirs.
The total Cd loading depends on the fertilizer regimesTa
ble
1M
ean
tota
lca
dm
ium
(lg
Cd
/l,b
oth
dis
solv
edan
dsu
spen
ded
coll
oid
al)
inw
ater
so
ftr
ibu
tari
eso
fM
ahaw
eli,
Riv
erM
ahaw
eli,
and
rese
rvo
irs
inth
eu
pp
erca
tch
men
tar
ea
fro
mP
olg
oll
ain
the
mid
seas
on
of
no
rth
wes
tm
on
soo
nin
20
08
Lo
adin
g
po
ints
0–
5l
gC
d/l
(WH
Oa)
5.1
–1
0lg
Cd
/l1
0.1
–1
5l
gC
d/l
15
.1–
23
lg
Cd
/l
Tri
bu
tari
esU
lap
ane
Stb
Wel
imad
aT
ow
nS
t,T
RI
St
Co
om
bs
St
Tal
awak
ele
Es
St,
Dim
bu
laE
sS
t,B
adu
lu
Oy
ad,B
adu
luO
ya
Bw
Rd
.B
and
araw
ela
St
20
4
Dig
anat
ann
e,B
adu
luO
ya
Bw
.U
ma
Oy
aS
trea
ms
20
6,2
07
,
20
8,K
uru
nd
uO
ya,
Mo
un
tV
ern
on
Es
St,
Fer
nla
nd
Esc
St,
Kat
abu
laE
sS
t,U
ma
Oy
aS
trea
ms
21
0,
21
1,
21
2,
21
3,
Ma
Oy
a,B
elih
ul
Oy
a,U
ma
Oy
a,T
alat
uO
ya,
Man
aO
ya,
Pu
nd
alu
Oy
a,M
ada
Ela
Kan
dy
Wat
ehen
aO
ya,
Mal
den
iya
Oy
a,P
ing
a
Oy
a,B
adu
luO
ya
Bad
.P
ass
Rd
,H
un
a
Oy
a,M
akan
du
raO
ya,
Gal
mal
Oy
a,H
ulu
Gan
ga
Mai
nri
ver
Nd
New
Bri
dg
eT
alaw
akel
eP
olg
oll
aT
un
nel
,G
amp
ola
Bri
dg
eG
atem
be
Bri
dg
e
Res
erv
oir
sK
otm
ale
rig
ht
ban
kV
icto
ria
rig
ht
ban
k,
Ko
tmal
ele
ftb
ank
,
Ran
den
igal
aR
es,
Gre
go
ryL
ake
Vic
tori
ale
ftb
ank
,R
anta
mb
e
aW
HO
reco
mm
end
atio
nas
the
max
imu
mac
cep
tab
lele
vel
of
cad
miu
min
dri
nk
ing
wat
erb
St
=st
ream
sca
rry
ing
surf
ace
run
off
and
gro
un
dw
ater
toM
ahaw
eli
cE
s=
tea
esta
tes
wh
ere
the
stre
ams
are
loca
ted
dO
yais
on
eo
fth
en
ativ
ete
rms
use
dfo
ra
med
ium
-siz
edri
ver
Environ Geochem Health
123
used in each cropping system, the type of phosphate
fertilizer used, and the level of Cd contained in the
agrochemicals used. In the Cd loading assessment,
only Cd added via phosphate fertilizer was considered,
as other inputs (dolomite, organic manure, etc.)
contained negligible quantities (organic manur-
e, 0.43–0.97 mg Cd/kg; CaO lime, 6.53 mg Cd/kg;
dolomite 9.06 mg Cd/kg). Average Cd content of TSP
used is 47 mg/kg, based on the range 23–71 mg Cd/kg
of TSP. The total loading of cadmium per ha per year
based on recommended dosage of fertilizer for each
crop (Lathif and Upali 2007) and the frequency of
application was then calculated for the area under each
crop. Rank correlation coefficient using Kendall’s swas assessed for total Cd loading versus Cd in the
tributary waters. Due to unavailability of data on
the cropping pattern and fertilizer application at all the
catchment areas studied, and to maintain accuracy and
clarity of information reported, only those areas where
accurate agricultural input data were available were
used to study correlation of Cd in tributaries and total
Cd loading. A Kendall s rank correlation value of
0.480 (two-sided p = 0.002) was observed for the
total Cd loading from tea, rice, and vegetable culti-
vation (including home gardening) versus Cd content
(lg Cd/l) in waters in tributaries. Kendall s values for
Fig. 3 Agroecological
zones of Sri Lanka based on
altitude and annual rainfall
Environ Geochem Health
123
the association of cadmium in tributaries with cad-
mium loading in individual crop areas are given in
Fig. 5.
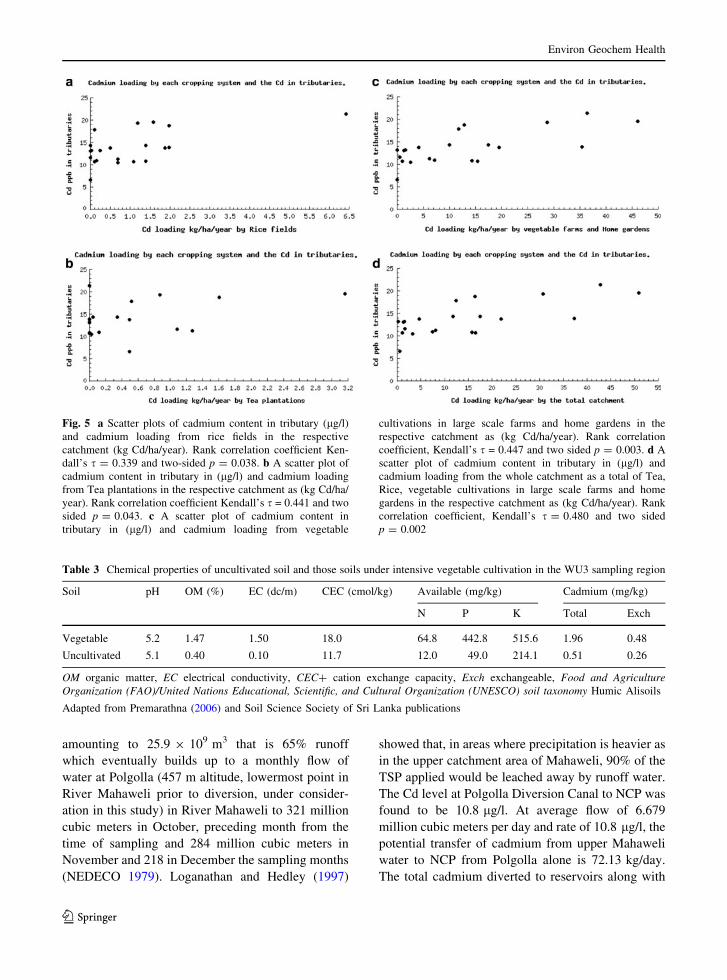
Figure 5 presents scatter plots of correlation
between cadmium loading in catchment area under
different cropping systems in upper Mahaweli catch-
ment area and the amount of cadmium in tributaries
in the respective catchment. The definite positive
correlation of 0.48 observed is a good indication of
the impact of use of contaminated phosphate fertilizer
in the upper catchment area. The ERP used was the
minimum contributor to Cd in water, and as such, tea
agronomy poses an insignificant threat, though veg-
etable and rice cultivation in the upper Mahaweli
catchment, if not properly managed, could be a
bigger problem. Premarathna et al. (2005) reported
the occurrence of 0.59–3.86 mg Cd/kg of soil in
upcountry soil traditionally cultivated with vegetables
such as cabbage, leeks, carrot, and potato. In addition
to TSP, another source of Cd that is regularly applied
to vegetable fields and home garden farms is
dolomite to bring pH to 7.0, which contains
9.06 mg Cd/kg. Sukreeyapongse et al. (2002)
showed that low pH favors release of cadmium from
soil, though higher organic carbon in soil favors
formation of colloidal cadmium or chelation with
humic substances. Sukreeyapongse et al. (2002)
showed that cadmium is released easily into water
when soil pH is low and organic carbon is relatively
higher. Soils that showed higher gradual release of
Cd to water had low pH (6.8), high carbon
(1.5–1.8%) with CEC 7.3–8.5 cmol/kg, and soil Cd
content of 2.3–7.0 lmol/kg. When compared with the
soils of upper catchment with total C 3–4%, pH
4.5–4.8 with CEC of 18–20 cmol/kg, the ease of Cd
release should be greater, based on which we should
expect a higher positive correlation between high Cd
content in soil in the catchment and Cd in river water.
Observations by Sukreeyapongse et al. (2002) stress
the fact ‘‘that the relative release rates for Cd, Cu, and
Pb showed uniform patterns when presented as a
function of pH, except for two soil samples with
different bonding strength of Cd and Cu. The relative
release rates could be described with pH-dependent
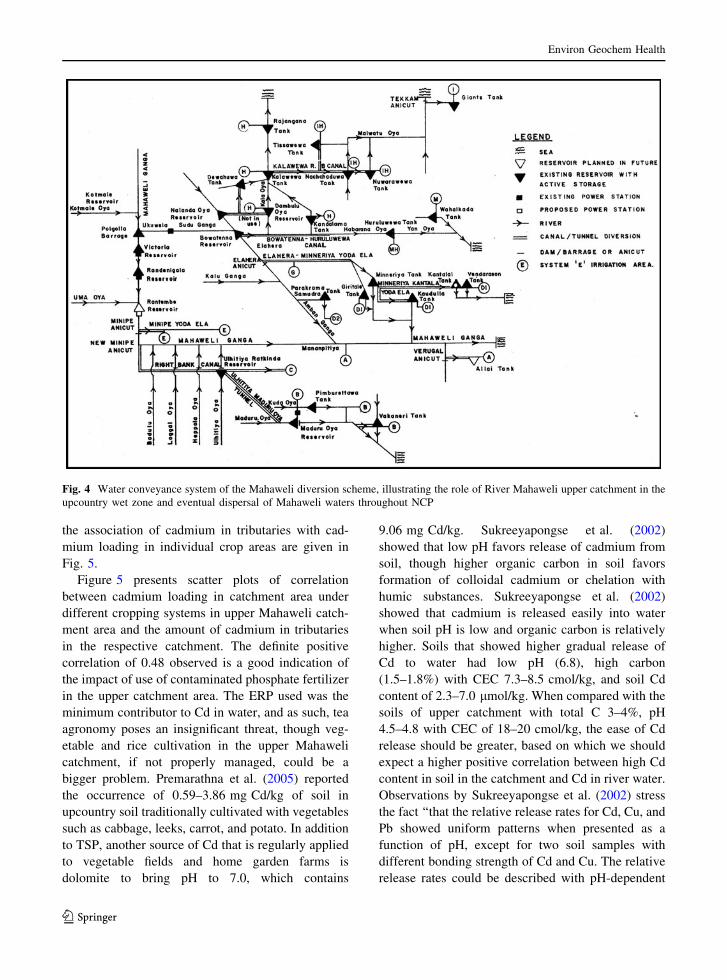
Fig. 4 Water conveyance system of the Mahaweli diversion scheme, illustrating the role of River Mahaweli upper catchment in the
upcountry wet zone and eventual dispersal of Mahaweli waters throughout NCP
Environ Geochem Health
123
kinetics previously used to describe metal release due
to proton-induced mineral dissolution. At a given pH,
the relative release rates were highest for Cd,
followed by Cu and Pb.’’ Their test system provided
information on how short-term (initial release), long-
term (release rates), and pH-dependent release are
controlled by the kinetics of the release processes.
Therefore, the relative release rates of heavy metals
bound to soil depend not only on pH and carbon
content in soil but also on the strength of metal
bonding to soil materials. In addition to the factors
mentioned so far, Krachler et al. (2005) introduced a
further possibility of interaction between biochelators
in soil and heavy metals that affects the final release
of Cd from the catchment to tributaries. Therefore, it
is possible to expect high but variable release of
cadmium into solution with high rainfall in the
catchment and that it may not exhibit a high
correlation with the fertilizer regimes practiced in
the cropping systems in the watershed.
Cadmium mobility
The mobility and fate of heavy metals in the soil
environment are directly related to their partitioning
between soil and soil solution. The presence of Cd2?
in the solid phase is a result of precipitation and
adsorption to components of the soil, processes that
are highly pH dependent (Lee et al. 1996).
The exchangeable Cd level in upcountry soil
varied from 0.32 to 1.24 mg/kg, and the mean cation
exchange capacity ranged from 11.7 in uncultivated
soil to 36.4 cmol(?) per kg in soils cultivated with
vegetables (Premarathna 2006). With an altitude up
to 2,000 m and a total catchment area of 316,000 ha
in the upper catchment and a total runoff per annum
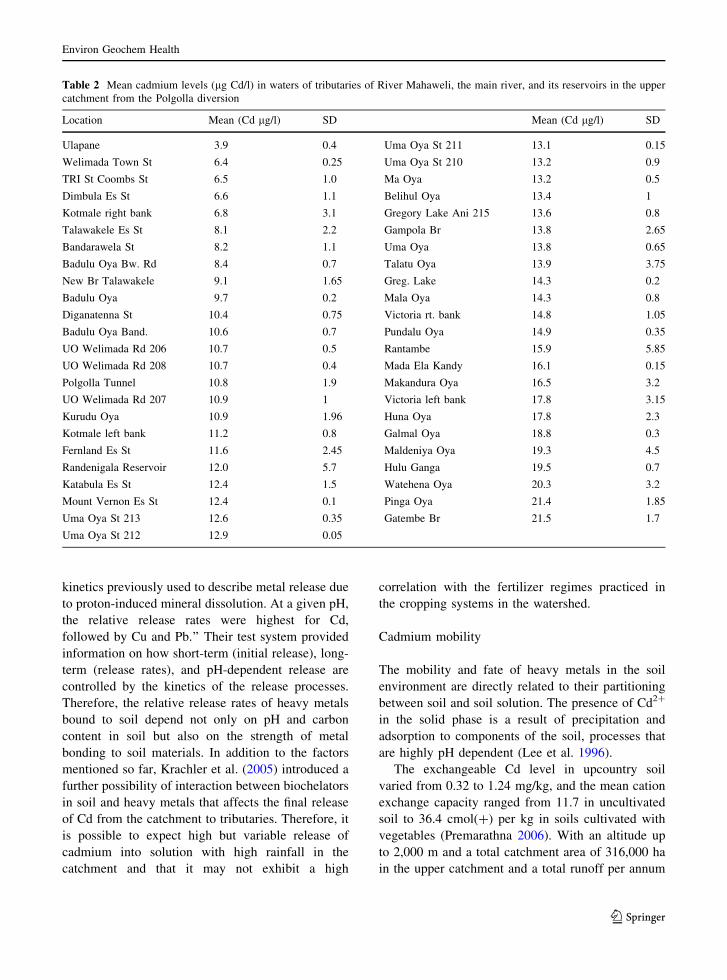
Table 2 Mean cadmium levels (lg Cd/l) in waters of tributaries of River Mahaweli, the main river, and its reservoirs in the upper
catchment from the Polgolla diversion
Location Mean (Cd lg/l) SD Mean (Cd lg/l) SD
Ulapane 3.9 0.4 Uma Oya St 211 13.1 0.15
Welimada Town St 6.4 0.25 Uma Oya St 210 13.2 0.9
TRI St Coombs St 6.5 1.0 Ma Oya 13.2 0.5
Dimbula Es St 6.6 1.1 Belihul Oya 13.4 1
Kotmale right bank 6.8 3.1 Gregory Lake Ani 215 13.6 0.8
Talawakele Es St 8.1 2.2 Gampola Br 13.8 2.65
Bandarawela St 8.2 1.1 Uma Oya 13.8 0.65
Badulu Oya Bw. Rd 8.4 0.7 Talatu Oya 13.9 3.75
New Br Talawakele 9.1 1.65 Greg. Lake 14.3 0.2
Badulu Oya 9.7 0.2 Mala Oya 14.3 0.8
Diganatenna St 10.4 0.75 Victoria rt. bank 14.8 1.05
Badulu Oya Band. 10.6 0.7 Pundalu Oya 14.9 0.35
UO Welimada Rd 206 10.7 0.5 Rantambe 15.9 5.85
UO Welimada Rd 208 10.7 0.4 Mada Ela Kandy 16.1 0.15
Polgolla Tunnel 10.8 1.9 Makandura Oya 16.5 3.2
UO Welimada Rd 207 10.9 1 Victoria left bank 17.8 3.15
Kurudu Oya 10.9 1.96 Huna Oya 17.8 2.3
Kotmale left bank 11.2 0.8 Galmal Oya 18.8 0.3
Fernland Es St 11.6 2.45 Maldeniya Oya 19.3 4.5
Randenigala Reservoir 12.0 5.7 Hulu Ganga 19.5 0.7
Katabula Es St 12.4 1.5 Watehena Oya 20.3 3.2
Mount Vernon Es St 12.4 0.1 Pinga Oya 21.4 1.85
Uma Oya St 213 12.6 0.35 Gatembe Br 21.5 1.7
Uma Oya St 212 12.9 0.05
Environ Geochem Health
123
amounting to 25.9 9 109 m3 that is 65% runoff
which eventually builds up to a monthly flow of
water at Polgolla (457 m altitude, lowermost point in
River Mahaweli prior to diversion, under consider-
ation in this study) in River Mahaweli to 321 million
cubic meters in October, preceding month from the
time of sampling and 284 million cubic meters in
November and 218 in December the sampling months
(NEDECO 1979). Loganathan and Hedley (1997)
showed that, in areas where precipitation is heavier as
in the upper catchment area of Mahaweli, 90% of the
TSP applied would be leached away by runoff water.
The Cd level at Polgolla Diversion Canal to NCP was
found to be 10.8 lg/l. At average flow of 6.679
million cubic meters per day and rate of 10.8 lg/l, the
potential transfer of cadmium from upper Mahaweli
water to NCP from Polgolla alone is 72.13 kg/day.
The total cadmium diverted to reservoirs along with
Fig. 5 a Scatter plots of cadmium content in tributary (lg/l)
and cadmium loading from rice fields in the respective
catchment (kg Cd/ha/year). Rank correlation coefficient Ken-
dall’s s = 0.339 and two-sided p = 0.038. b A scatter plot of
cadmium content in tributary in (lg/l) and cadmium loading
from Tea plantations in the respective catchment as (kg Cd/ha/
year). Rank correlation coefficient Kendall’s s = 0.441 and two
sided p = 0.043. c A scatter plot of cadmium content in
tributary in (lg/l) and cadmium loading from vegetable
cultivations in large scale farms and home gardens in the
respective catchment as (kg Cd/ha/year). Rank correlation
coefficient, Kendall’s s = 0.447 and two sided p = 0.003. d A
scatter plot of cadmium content in tributary in (lg/l) and
cadmium loading from the whole catchment as a total of Tea,
Rice, vegetable cultivations in large scale farms and home
gardens in the respective catchment as (kg Cd/ha/year). Rank
correlation coefficient, Kendall’s s = 0.480 and two sided
p = 0.002
Table 3 Chemical properties of uncultivated soil and those soils under intensive vegetable cultivation in the WU3 sampling region
Soil pH OM (%) EC (dc/m) CEC (cmol/kg) Available (mg/kg) Cadmium (mg/kg)
N P K Total Exch
Vegetable 5.2 1.47 1.50 18.0 64.8 442.8 515.6 1.96 0.48
Uncultivated 5.1 0.40 0.10 11.7 12.0 49.0 214.1 0.51 0.26
OM organic matter, EC electrical conductivity, CEC? cation exchange capacity, Exch exchangeable, Food and AgricultureOrganization (FAO)/United Nations Educational, Scientific, and Cultural Organization (UNESCO) soil taxonomy Humic Alisoils
Adapted from Premarathna (2006) and Soil Science Society of Sri Lanka publications
Environ Geochem Health
123
the cadmium input generated from irrigated TSP-
fertilized crop fields (rice and vegetables) in NCP
eventually settles in the sediments of reservoirs
(1.77–2.45 mg/kg) (Bandara et al. 2008). These sed-
iments eventually release Cd2? into reservoir water
(32–57 mg/l). In the ground water from upcountry
wet zone (WU1–WM3) we observed calcium (Ca2?)
content of 6.09–39.87 mg/l, and 310–1,200 mg/l in
the dry zone. Though Cd is retained in soil by
exchange reactions, in the presence of competitive
cations such as Ca2?, which is more prevalent in the
dry-zone soils, it competes better than Cd for
adsorption sites (Gomes et al. 2001). However, with
the varying water levels of the reservoir during drier
periods, where reducing conditions prevail, solubility
of Cd is higher under alkaline pH. Under the
prevailing conditions (F- content in dry zone waters
is 1–4 ppm, Herath et al. 2005; we also observed that
F- content in well water in the dry zone is
300–9,780 lg/l, whereas in the wet zone it is very
low at 40–700 lg/l), the Cd trapped in sediments
underwater forms soluble complexes with inorganic
and organic ligands, particularly F- and Cl- (Onyatta
and Huang 2008), to increase the mobility of Cd2?,
which results in higher cadmium levels in food crops,
leading to elevated dietary cadmium (Williams and
David 1973) in NCP and the rest of the island fed by
their agricultural products.
The total cadmium that is carried to reservoirs in
NCP from both the cadmium input from TSP-
fertilized crop fields (rice and vegetables) in NCP
and the diverted River Mahaweli and that eventually
settles in the sediments of reservoirs, as reported by
Bandara et al. (2008), amounts to 1.77–2.45 mg/kg
on dry weight basis. These sediments then release
Cd2? into reservoir water, leading to high level of Cd
in irrigation and drinking water. The dissolved Cd in
reservoir waters ranged from 0.03 to 0.06 mg/l,
which is a 10–20-fold increase over the maximum
contamination level (0.003 mg/l) defined by the
WHO for drinking water. It was observed that all
sources of water were contaminated with cadmium,
and the main source for all supplies is reservoir water.
The geometric mean cadmium content in drinking
water samples collected from domestic environments
of CRF patients based on the source were reservoir
water = 3.174 ± 4.658, shallow well = 6.931 ±
4.747, and agro well = 11.18 ± 2.782 lg/l (Bandara
et al. 2010).
Bandara et al. (2010) reported that mean Cd levels in
uncultivated soil in the districts of Anuradhapura and
Polonnaruwa of NCP were 0.023 ± 0.014 and 0.0052 ±
0.0043 mg/kg, respectively. Mean Cd content in culti-
vated soil on which TSP is applied is 0.1104 ± 0.186 in
Anuradhapura and 0.0159 ± 0.005 mg/kg in Polo-
nnaruwa. Soils of NCP are not naturally high in Cd, but
cadmium is added to soil through contaminated agricul-
tural inputs. A detailed study of cadmium transfer from
contaminated phosphate fertilizer used in lowland rice
farming and the resultant provisional tolerable weekly
intake (PTWI) by the farmer community in NCP was
reported by Bandara et al. (2008). Cadmium contami-
nation in the most common food crops grown under
lowland condition, namely rice and Nelumbo nucifera
(lotus) rhizomes, in the region where CRF is prevalent
were reported to be significantly higher than in other
regions of the island. The cadmium content in rice grains
collected from farms of CRF patients in NCP ranged
from 0.001 to 0.194 mg/kg dry weight, with mean of
0.0404 ± 0.0196 mg/kg, compared with a Sri Lankan
background value of 0.001 mg/kg. Rhizomes of 120-
day-old N. nucifera in NCP reservoirs carried mean
concentration of 252.82 mg Cd/kg of rhizome (Bandara
et al. 2008). Cadmium content in fish raised in freshwa-
ter reservoirs in the region significantly influenced the
total dietary cadmium. Tilapia fish (Oreochromis niloti-
cus) collected from Thuruwila Reservoir near Anura-
dhapura had 0.425 mg Cd/kg (Bandara et al. 2008). In
subsequent studies on Cd residues in tilapia and lula fish
(Channa striata) raised in NCP reservoirs fed with River
Mahaweli water, Bandara et al. (2010) observed that the
Cd content ranged from 0.5 to 90.7 lg/kg with mean of
21.8 lg/kg in herbivorous tilapia compared with car-
nivorous snakehead C. striata (lula) with Cd content of
1.2–114.4 lg/kg.
Therefore, it is evident that long-term use of Cd-
polluted TSP has contributed to excessive levels of
Cd in River Mahaweli and in turn in the reservoirs in
NCP. It is also possible to reduce the runoff Cd level
to acceptable levels recommended by the US EPA of
1-5 ppb by using ERP as used in tea estates or
possibly as compost prepared with ERP.
Acknowledgments Authors are grateful to Mr. K.A.
Kahandawa of IRIED, COMPAS Netherlands-Sri Lanka for
the financial assistance provided for the project. The logistic
support given by the Postgraduate Institute of Agriculture and
the Department of Agriculture Biology, Faculty of Agriculture
is gratefully acknowledged. We thank Prof. Janitha Liyange
Environ Geochem Health
123
and Mr. M.A. Upul of Department of Chemistry of University
of Kelaniya, for the graphite furnace AAS analysis of water
samples.
References
Athuraliya, T. N. C., Abeysekara, T., Kumarasiri, R.,
Abeysekara, C., Gooneratne, A., & Bandara, P. (2003). Abaseline study on early renal diseases in a selectedcommunity of the North-Central Province of Sri Lanka.Research report, Faculty of Medicine. Sri Lanka: Uni-
versity of Peradeniya.
Bandara, J. M. R. S., Senevirathna, D. M. A. N., Dasanayake,
D. M. R. S. B., Herath, V., Bandara, J. M. R. P.,
Abeysekara, T., et al. (2008). Chronic renal failure among
farm families in cascade irrigation systems in Sri Lanka
associated with elevated dietary cadmium levels in rice
and freshwater fish (Tilapia). Environmental Geochemis-try and Health, 30, 465–478.
Bandara, J. M. R. S., Wijewardena, H. V. P., Liyanege, J.,
Upul, M. A., & Bandara, J. M. U. A. (2010). Chronic renal
failure in Sri Lanka caused by elevated dietary cadmium:
Trojan horse of the green revolution. Toxicology Letters,198, 33–39.
Blennerhassett, J. D. (1998). Factors affecting phosphateconcentrations in surface and subsurface runoff fromsteep east coast hill country. A thesis presented in partial
fulfillment of the requirements for the degree of Masters
of Applied Science, Department of Soil Science, Massey
University.
De Zoysa, T. (2002). Water quality of Parakrama Samudraya(reservoir). Dissertation, Postgraduate Institute of Agri-
culture, University of Peradeniya, Sri Lanka.
DoC, Sri Lanka Trade Reports. (2007). www.doc.gov.lk/
web/an_onsri_trade.php. Accessed 1st Sept 2010.
EPA-USA. (2000). Technology transfer network, air toxic
website—cadmium compound (A). http://www.epa.gov./
ttn/atw/hlthe/cadmium.html. Accessed 23 Oct 2009.
Gomes, P. C., Fontes, M. P. F., da Silva, A. G., Mendonca, E.
S., & Netto, A. R. (2001). Selectivity sequence and
competitive adsorption of heavy metals by Brazilian soils.
Soil Science Society of America Journal, 65, 1115–1121.
Greenberg, A. E., Clesceri, L. S., & Eaton, A. D. (Eds.) (1992).
Standard methods for the examination of water andwastewater (18th ed.), 2005. Washington, DC: American
Public Health Association, American Water Works
Association and Water Environment Federation.
Health Fund. (2009). http://www.healthfund.gov.lk. Accessed
23 Oct 2009.
Herath, K. R. P. K., Illeperuma, O. A., Dharmagunawardhane,
H. A., & Haller, K. J. (2005). Environmental health riskfor the chronic renal failure in Sri Lanka. Paper presented
at the 31st congress on science and technology of Sur-
anaree University of Technology, Thailand, Satya Wa-
canan Christian University, Indonesia.
Jayamanna, D. (2009). Ayurvedic research on kidney ailment
in the NCP. The Island 28(292).
Jayathilake, J., & Bandara, J. M. R. S. (1989). Pesticide use by
vegetable farmers: case study in a multiple cropping
system in Sri Lanka. FAO Quarterly Newsletter, Asia andPacific Plant Protection Commission, 32(2), 28–38.
Krachler, R., Jirsa, F., & Ayromlou, S. (2005). Factors influ-
encing the dissolved iron input by river water to the open
ocean. BiogeoScience, 2, 311–315.
Lathif, M. A., & Upali, W. S. P. Y. (2007). Fertilizer recom-mendations for horticultural crops: Upcountry vegetables.
Peradeniya, Sri Lanka: HORDI, Department of
Agriculture.
Liyanege, C. E., Thabrew, M. I., & Kuruppuarachchi, D. S. P.
(2000). Nitrate pollution in ground water of Kalpitiya.
Journal of the National Science Council of Sri Lanka,28(2), 101–112.
Loganathan, P., & Hedley, M. J. (1997). Downward movement
of cadmium and phosphorous from phosphate fertilizers in
a pasture soil in New Zealand. Environmental Pollution,95(3), 319–324.
MAHAWELI. (1988). Projects & Programme 1983 and 1988.
Colombo, Sri Lanka: Mahaweli Authority of Sri Lanka.
NEDECO. (1979). Mahaweli Ganga development programmeimplementation strategy study. Annexes A to G. Colombo:
Mahaweli Development Board and NEDECO.
Onyatta, J. O., Huang, P. M. (2008). The influence of potassiumchloride on cadmium release from selected tropical soils.
Department of Soil Science, University of Saskatchewan,
51 Campus Drive, Saskatoon, SK, S7 N 5A8, http://
Canadanatres.psu.ac.th/Link/SoilCongress/bdd/symp6/738-
t.pdf.
Perera, W. (2006). Water pollution by pesticides. Paper pre-
sented at the seminar on Impact of agriculture on Sri
Lankan environment and remedial measures by the inte-
gration of IK with modern technology, Kandy, Sri Lanka.
Piyasiri, S. (1995). Eutrophication and blue-green algal prob-
lem in Kotmale reservoir in Sri Lanka. In K. H. Timotius
& F. Golthenboth (Eds.), Tropical limnology (Vol. 2,
pp. 161–169).
Premarathna, H. M. P. L. (2006). Soil and crop contaminationby toxic trace elements. M.Phil Thesis, PGIA, University
of Peradeniya, Peradeniya, Sri Lanka.
Premarathna, H. M. P. L., Hettiarachchci, G. M., & Indraratne,
S. P. (2005). Accumulation of cadmium in intensive
vegetable growing soils in the up-country. TropicalAgriculture Research, 17, 93–103.
Soil Science Society of Sri Lanka (1999). Soils of the wetzone
of Sri Lanka. In Mapa, R. B., Somasiri, S. & Nagarajah, S.
(Eds.), Morphology, characterization and classification.
Special publication no.1 (pp. 183). Colombo.
Lee, S.-Z., Herberte, A., Huang, C. P., Sparks, D. L., Sanders,
P., & Peijnenburg, W. G. M. (1996). Predicting soil–water
partition coefficients for cadmium. Environmental Scienceand Technology, 30(12), 3418–3424.
Sukreeyapongse, O., Holm, P. E., Strobel, B. W., Panic-
hsakpatana, S., Magid, J., & Hansen, H. C. B. (2002). pH-
dependent release of cadmium, copper, and lead from
natural and sludge-amended soils. Journal of EnvironmentQuality, 31, 1901–1909.
UNDP/FAO. (1969). Mahaweli Basin of Sri Lanka (presented
by S. S. de Silva). FAO Corporate Document Repository.Fisheries and Aquaculture Department.
US Environmental Protection Agency. (1983). Metals (atomicabsorption methods) sample handling and preservation.
Environ Geochem Health
123
In USEPA (Ed.), Methods for chemical analysis of water
and wastes (pp. 58–61). EPA-600/4-79-020, Ohio, USA.
Wessa, P. (2009). Kendall tau rank correlation (v1.0.10) in
Free software (v1.1.23-r4). Office for Research Develop-
ment and Education. URL: http://www.wessa.net/rwasp_
kendall.wasp/.
Wickramaarachchi, W. D. N. (2005). Irrigation water qualityalong the cascade system in the north east dry zone of Sri
Lanka. Dissertation, Postgraduate Institute of Agriculture,
University of Peradeniya, Sri Lanka.
Williams, C. H., & David, D. J. (1973). The effect of super-
phosphate on the cadmium content of soils and plants.
Australian Journal of Soil Research, 11(1), 43–56. doi:
10.1071/SR9730043.
Environ Geochem Health
123
Related Documents


![MAHAWELI GANGA IRRIGATION AND HYDRO …mahaweli.gov.lk/en/pdf/Library/Mahaweli Ganga Irrigation.pdf · MAHAWELI GANGA IRRIGATION AND ... The project appears feasible [possible] from](https://static.cupdf.com/doc/110x72/5b90159409d3f20e308d65d6/mahaweli-ganga-irrigation-and-hydro-ganga-irrigationpdf-mahaweli-ganga-irrigation.jpg)


