Political Uncertainty, Credit Risk Premium and Default Risk Gerardo Manzo PhD in Money and Finance University of Rome "Tor Vergata" . Visiting Scholar Researcher The University of Chicago Booth School of Business . Preliminary version: October 31, 2012 This version: August 31, 2013 Abstract I study the e/ect of political uncertainty on the credit risk premium (or distress risk ) and on the default risk (or jump-to-default risk ) embedded in the term structure of sovereign CDS spreads over the Euro zone. After calibrating the Pan and Singleton (2008) pricing model for sovereign Credit Default Swap spreads used to obtain a spread decomposition into two components, I nd that the credit risk premium accounts, on average, for the 42 percent of the observed spreads in the European credit market. Therefore, relying on a Vector Autoregressive approach, I show how political uncertainty has a signicant lead-lag relation with both credit measures, where a 10 percent increase in the degree of political uncertainty leads to a signicant increase in the two components of the credit risk of about 3 percent after a month. Additionally, individual countries react di/erently to variations in the degree of political uncertainty, highlighting a sort of heterogeneity in the European credit market. Hence, this work enriches the understanding about the macroeconomic forces that have driven variations in sovereign risk over the Euro zone and introduce political uncertainty as a signicant factor driving the European credit market. [JEL No. G12, G13, G18] Keywords: Political Uncertainty, Credit Default Swap, Credit Risk Premium, Default Risk, Panel VAR, Sovereign Debt, Term Structure 1 [email protected] .Gerardo Manzo is a PhD in Money and Finance at the University of Rome "Tor Vergata". The paper was written while Gerardo Manzo was a visiting scholar researcher at The University of Chicago Booth School of Business. The author is grateful to Pietro Veronesi, Lubos Pastor, Rosella Castellano, Ginevra Marandola, Ugo Zannini, Emanuele Brancati and Branimir Jovanovic, for their invaluable comments. This paper has been written as part of the requirements for the Ph.D in Money and Finance at the University of Rome "Tor Vergata". All errors are my responsibility. 1

Welcome message from author
This document is posted to help you gain knowledge. Please leave a comment to let me know what you think about it! Share it to your friends and learn new things together.
Transcript

Political Uncertainty, Credit Risk Premium and Default Risk
Gerardo Manzo�
PhD in Money and Finance
University of Rome "Tor Vergata"
� .�
Visiting Scholar Researcher
The University of Chicago Booth School of Business
� .�
Preliminary version: October 31, 2012
This version: August 31, 2013
Abstract
I study the e¤ect of political uncertainty on the credit risk premium (or distress risk ) and on the defaultrisk (or jump-to-default risk ) embedded in the term structure of sovereign CDS spreads over the Euro zone.After calibrating the Pan and Singleton (2008) pricing model for sovereign Credit Default Swap spreadsused to obtain a spread decomposition into two components, I �nd that the credit risk premium accounts,on average, for the 42 percent of the observed spreads in the European credit market. Therefore, relyingon a Vector Autoregressive approach, I show how political uncertainty has a signi�cant lead-lag relationwith both credit measures, where a 10 percent increase in the degree of political uncertainty leads to asigni�cant increase in the two components of the credit risk of about 3 percent after a month. Additionally,individual countries react di¤erently to variations in the degree of political uncertainty, highlighting asort of heterogeneity in the European credit market. Hence, this work enriches the understanding aboutthe macroeconomic forces that have driven variations in sovereign risk over the Euro zone and introducepolitical uncertainty as a signi�cant factor driving the European credit market.
[JEL No. G12, G13, G18]Keywords: Political Uncertainty, Credit Default Swap, Credit Risk Premium, Default Risk, Panel
VAR, Sovereign Debt, Term Structure
[email protected] .Gerardo Manzo is a PhD in Money and Finance at the University of Rome "Tor Vergata". Thepaper was written while Gerardo Manzo was a visiting scholar researcher at The University of Chicago Booth School of Business.The author is grateful to Pietro Veronesi, Lubos Pastor, Rosella Castellano, Ginevra Marandola, Ugo Zannini, Emanuele Brancatiand Branimir Jovanovic, for their invaluable comments. This paper has been written as part of the requirements for the Ph.Din Money and Finance at the University of Rome "Tor Vergata". All errors are my responsibility.
1

Does political uncertainty in the Euro zone matter for investors around the world? In other words, how
is the problem-solving ability of the European leading economies perceived by �nancial investors? Does
political uncertainty a¤ect symmetrically all the European countries, or could one con�gure a regional or a
geographic e¤ect?
Speci�c events can lead to dramatic changes in the willingness to bear sovereign credit risk, a¤ecting
adversely the �nancial markets. These changes are mostly re�ected in credit spread variations, which have
their own roots in the perceived default risk of that speci�c country, whose policy depends crucially on
political decisions of the European Union. I analyze this issue through the lens of the sovereign credit default
swap (CDS) market which allows for understanding the implied default risk of a country.
During a period of �nancial turmoil, making coherent political decisions in a short time is crucial for
avoiding crisis worsening. The issue becomes more serious when the core of the discussion is a country�s
bailout. Greece was rescued on May 2010 after a long period of hesitation which took about four months.
In fact, as reported by the New York Times in an article of February 15, 2010, "...opposition grew among
Germans to bailing out what they call spendthrifts to the south after years of belt-tightening by workers at
home". During those four months, investors were worried about the uncertainty concerning the �rst bail-out
in the European Union history, such that the cumulative return, from the beginning of 2010 to the day before
making the decision (May 10, 2010), accounted for a -26.89% for the Athens Stock Exchange index (ASE) and
67.22% for the 10-year Greek sovereign bond yield. Similar variations, just slightly di¤erent in magnitudes,
were experienced also by other peripheral countries such as Ireland, Italy, Portugal and Spain.
The Greek situation may be seen as a signal that the EU political environment is still far from being
stable. The rapid expansion of the CDS market over the period 2008 to 2012 may be seen as a signal of the
increasing risk aversion in the credit market.
This study is related to the literature that explains empirically sovereign CDS spreads variations through
a macroeconomic perspective.
It is closely related to the work of Pan and Singleton (2008), Longsta¤ et al. (2011) and And and Longsta¤
(2011). The former builds a sovereign CDS pricing model which allows for the spread decomposition into a
market price of risk and a default risk. They �nd that the market price of risk of some emerging markets,
2

such as Turkey, Mexico and Korea, is statistically correlated with some measures of �nancial market volatility
(VIX), global event risk (US credit spread) and macroeconomic policy (currency-implied volatility). Longsta¤
et al. (2011) calibrate the same pricing model over a wider set of emerging markets and then regress the
CDS spread components on local and global market variables, on di¤erent measures of risk premiums, such
as equity, volatility and term premia and on global capital �ows. They �nd that CDS-implied risk premia are
more related to global economic measures than to local variables. Ang and Longsta¤ (2011) improve the Pan
and Singleton (2008) sovereign model including a systematic risk and calibrating it cross-sectionally on two
huge geographic areas, Europe and the US. Their main results are that the Euro zone shares a systematic
credit risk greater than states in the US, and that credit risk is more a¤ected by �nancial markets than by
macroeconomic fundamentals.
Researchers have been analyzing the macroeconomic determinants of sovereign CDS spreads since the
data availability has allowed for the investigation of a pure measure of credit risk. Several works have focused
their attention on the sovereign debt situation in the Euro zone. Sgherri and Zoli (2009) analyze empirically
the determinants of the common time-varying factor implicit in the credit spread of 10 EU economies over the
period January 1999 to April 2009. They �nd that this factor is positively correlated with volatility in stock,
currency and emerging markets. Dieckmann and Plank (2009) study the determinants of CDS spreads during
the mid-2007 �nancial crisis for 18 European developed economies. They argue that the size and the pre-crisis
health of both the world and country�s �nancial market positively a¤ect the CDS spread. Moreover, they
stress the potential role of the private-to-public risk transfer channel - that is, more government guarantees
on the �nancial sectors, signi�cant extension of loans�amount to the banking system, etc. - which allows
investors to form expectations about future �nancial bailouts. Related to this work is Acharya et al. (2011)
which �rst models and then tests the two-way feedback e¤ect between the sovereign credit risk and �nancial
markets. When a sovereign comes into play to rescue its insolvent �nancial system with a debt expansion
�nanced by taxes, it induces a positive signal in the market which then turns into a negative one owing
to an increase in the marginal cost of raising the tax revenue (La¤er curve) and a more limited maximum
debt capacity. Hence, a distressed sovereign may exacerbate the �nancial sector�s solvency condition since it
would no longer be able to make any transfer. Another interesting study has been conducted by Brutti and
3

Sauré (2012) who assess the contribution of �nancial linkages to the transmission of sovereign default risk.
Thanks to a particular econometric tool, they are able to identify �nancial shocks that originated in Greece
and spread overall European countries. They �nd that "a 10 percent increase in the exposure to Greek debt
increases the rate of cross-country transmission of sovereign risk by 3.94 percent".
Alongside empirical studies on the macro-determinants of credit spread, theoretical and empirical works
on the role of political decisions in both stock and capital markets have recently been developed. Pastor and
Veronesi (2011a), Pastor and Veronesi (2011b) and Ulrich (2011), among others. The former theoretically in-
vestigates the e¤ect of the government�s policy decision on the stock prices in a Bayesian-learning equilibrium
framework. Their main result is that, on average, the stock price drops down, with this reduction being larger
when the announcement of a political change includes elements of surprise. Pastor and Veronesi (2011b)�s
model allows for the equity risk premium�s decomposition into three components related to three di¤erent
shocks. While the �rst two are deemed as economic shocks, the third one is the political shock which "a¤ect
investors�beliefs about which policy the government might adopt in the future". Moreover, using the Baker
et al. (2011)�s policy-related uncertainty index, they �nd empirical evidence that political uncertainty is
state-dependent, since it is higher when worse economic conditions are in play. Lastly, Ulrich (2011) analyze
the e¤ect of political uncertainty on the bond market through a pricing model that incorporates political
uncertainty. The latter regards the Ricardian equivalence uncertainty (or Knightian uncertainty), according
to which investors expect a non-zero consumption growth rate after the implementation of a government
policy. The model predicts that a government policy a¤ecting the business cycle leads to a positive risk
premium for investors.
My work introduces a novelty in the literature. To my best knowledge, it is the �rst in investigating the
linkage between implied-CDS risk premium and political uncertainty. While the former requires a theoretical
framework to be extracted from asset prices, it is challenging to measure the degree of political uncertainty
over time. As a result, Baker et al. (2011) have created a monthly index able to proxy for policy-related
uncertainty over time.
The analysis is conducted on a sample of 19 European countries, inside and outside the EU and EMU.
For each country, I calibrate the Pan and Singleton (2008) pricing model for sovereign CDS to decompose
4

the spread into the two components: the credit risk premium and the default risk. The former measures the
compensation investors demand for bearing the credit risk of that country due to unexpected variations in
the default intensity, namely, the probability of default, whereas the default risk is a residual measure that
is a proxy for the (negative) jump in the value of the contingent claim upon default. Several results emerge
from this analysis.
First, I �nd that the sovereign CDS market embodies credit risk features that allow countries to live in
di¤erent clusters. In fact, the Cluster Analysis shows a certain geography of the credit risk, where the biggest
group is comprised of the most e¢ cient economies or core economies, such as Austria, Finland, France,
Germany, Netherlands, Sweden and UK. Two more distinct groups are formed: the most worrying countries
or peripheral economies, such as Italy, Spain, Portugal, Ireland and Belgium1 and the Eastern countries, such
as Estonia, Romania, Latvia, Lithuania and Poland. In two di¤erent and very distant clusters are Greece
and Norway, deemed the riskiest and the safest countries of Europe, respectively.
Second, a principal component analysis, performed on the correlation matrix of daily variations of CDS
spreads, reveals commonality across countries and regions. It is done across the three macro European
regions as from the clusters�composition. On one hand, when the full sample is considered, the �rst three
components explain the 84 percent of the variability, which becomes higher (over 90%) when the clusters
are examined individually. Univariate regressions shows how the variations in the �rst PCs are signi�cantly
related to political uncertainty as well as European and US �nancial variables.
Third, alongside Pan and Singleton (2008) and Longsta¤ et al. (2011)�s works, the model calibration shows
that the credit environment is worse under the risk-neutral probabilities than under the objective probabilities
and provides larger and more persistent default intensities. Additionally, the credit risk premium accounts,
on average, for the 42 per cent of the observed Credit Default Swap spread.
Fourth, panel regressions of the variations in the credit risk premia show how a 10%-increase in political
uncertainty, after controlling for information already included in both the European and the US �nancial
markets, leads to a signi�cant increase in the credit risk premia of about 3.2 percent after a month. Such an
increase is slightly smaller in the case of the default risk, that is, 2.9 per cent but still signi�cant. Moreover,
1Belgium is included among the unstable countries since it has gone through a period of political instability from 2007 to2011. A point which will be clearer later on.
5

relying on a panel vector autoregressive (VAR) approach, I con�rm the signi�cant lead-lag relation of political
uncertainty with both the credit risk premia and the default risk. On an aggregate level, a shock to the credit
market that increases the default risk decreases the degree of political uncertainty after three months the
shock is generate. Such a result may signal the corrective or disciplinary role of the market in putting pressure
on policymakers to act so as to reduce political uncertainty in the presence of a serious risk of default rather
than "mere" variations in the risk aversion. Additionally, employing the VAR approach on a country level, I
explore the heterogeneity of the European countries�credit market in responding to variations in the degree
of political uncertainty and how the latter is in�uenced by the credit conditions of speci�c countries such
as the core and peripheral economies. Lastly, aggregating both the credit risk premia and the default risk
measures across the three macro regions, an interesting scenario emerges: a political shock has a signi�cant
impact on the risk premia of the peripheral economies after a month the shock is generated and on the default
risk of the core economies after three months, whereas a shock to the premia of the core economies leads to
an signi�cant increase in the degree of political uncertainty after two months. Moreover, the corrective role
of the market is con�rmed also on a regional level.
The remainder of the paper is organized as follows: Section 1 introduces description of the data, together
with the cluster analysis and the principal component analysis. The Pan and Singleton (2008) sovereign CDS
pricing model is shown in Section 2 as well as the way the credit risk premium and default risk measures
are extracted. Then, in Section 3, I calibrate the model, and, in Section 4, I stress and discuss the role of
political uncertainty in the credit market. Section 5 concludes the analysis.
1 The Data
Two types of data are used for the analysis: Credit Default Swap spreads and the European policy-related
uncertainty index.
A CDS is a �nancial derivative contract agreed between two parties: the buyer and the seller. The former
commits himself to a periodic payment, usually quarterly or semiannual, to the seller and is compensated on
the arrival of a speci�c credit event related to an underlying debt obligation such as a bond or a loan. While
6

for a company a credit event may be the bankruptcy or default, for a country it is not correct to talk about
a pure default. The most appropriate de�nition for sovereign credit event is provided by the International
Swaps and Derivatives Association (ISDA), which references four types of credit events: acceleration, failure
to pay, restructuring and repudiation. As pointed out by Pan and Singleton (2008), these events cannot
happen simultaneously, and, therefore, the contract may be executed as soon as one of them occurs2 .
CDS spreads are collected from the Markit database and cover a period of 1336 days from December 3,
2007 to January 22, 2013 for the maturities 1, 3, 5, and 7 and for 19 European countries, inside and outside
the European Union and the Economic and Monetary Union. Therefore, the total dataset consists of 101,536
daily spreads. The sample period is dictated by the data availability. Indeed, trading on CDS spreads of the
wealthiest countries, such as Norway, Sweden and Germany, is not available before our starting date since the
biggest worries about the debt situation have been in the game after the bankruptcy of Lehman Brothers,
which involved sharp increases in the spreads.
The European policy-related economic uncertainty index, provided by Baker et al. (2011), is a weighted
sum of two components: newspaper coverage of policy-related economic uncertainty and disagreement among
professional economic forecasters. The former is obtained by counting the number of articles including policy
relevant terms, such as "policy," "tax," "de�cit" and so on, and then detrended in order to take into account
the increasing number of news over years. Disagreement among forecasters is used as a proxy for uncertainty,
as has already been explored by authors such as Boero et al. (2008), Bomberger (1996) and Lahiri and Sheng
(2009), among others. Baker et al. (2011) utilize individual level forecasts regarding consumer prices and
federal government budget balances since they are directly in�uenced by monetary policy and �scal policy
actions. Then, these two components are standardized and added up in order to form a monthly index3 .
I consider Austria, Belgium, Estonia, Finland, France, Germany, Greece, Ireland, Italy, Netherlands,
Portugal, and Spain, as member of both the EU and the EMU, Latvia, Lithuania, Poland, Romania, Sweden
and UK as part only of the EU, and, �nally, Norway as an extra-EU and- EMU state, deemed the safest
country in all of Europe. In order to have a picture of European countries�performances over the concerning
2The literature has been focusing on CDS spreads instead of bond spread because they are not a¤ected by both �ight-to-quality e¤ect and contractual arrangements, such as seniority, coupon rates, guarantees and embedded options.
3 Index source: www.policyuncertainty.com for additional details.
7
period, Figure 1 depicts the average of the changes of the unemployment rate and the mean real GDP growth
rate over the period December 2007 to January 2013 for each country.
8
6
4
2
0
2
4
6
8
10
Austria [68.8]
Belgium [95.2]
Estonia [5.85]
Finland [42.1]
France [78.2]
Germany [74.4]
Greece [132.1]
Ireland [72.3]
Italy [115.4]
Latvia [32.2]
Lithuania [29.0]
Netherlands [59.5]
Norway [41.4]
Poland [51.3]
Portugal [87.8]
Romania [24.0]
Spain [54.2]
Sweden [38.4]
UK [67.8]
Austria [68.8]
Belgium [95.2]
Estonia [5.85]
Finland [42.1]
France [78.2]
Germany [74.4]
Greece [132.1]
Ireland [72.3]
Italy [115.4]
Latvia [32.2]
Lithuania [29.0]
Netherlands [59.5]
Norway [41.4]
Poland [51.3]
Portugal [87.8]
Romania [24.0]
Spain [54.2]
Sweden [38.4]
UK [67.8]
∆UnempReal GDP Growth
Figure 1. Performances of 19 European economies in terms of unemployment rate and real-GDP growthover the period 2007 to 2013. �Unemp is the average of changes in the quarterly unemployment rate fromthe last quarter of 2007 to the second quarter of 2012. Real �GDPgrowth is averaged yearly over theperiod 2007 to 2013, where the last observation is a forecast. Average Debt over GDP ratios in brackets.
The emerging picture points out the structural di¤erences faced by each country, with the peripheral
economies, such as Greece, Italy, Portugal and Spain, showing the worst performances.
Table 1 shows summary statistics of both 5-year spreads and the policy-related uncertainty index. All
the spreads are in basis points and, even if their underlying notional is in US dollars, they are free of units
of account. The polar mean values are those of Greece and Norway, that is, over the sample period the
protection buyer would pay, on average, 1391 bps per year to hedge against the Greek default risk, while
investors are willing to pay just 21 bps to protect themselves against a remote Norwegian default. Again,
the largest standard deviation is that of Greece, followed by Ireland and Portugal. The whole picture that
emerges from this summary indicates that there is a consistent time variation in CDS spreads. The last row
8

reports descriptive statistics for the policy-related uncertainty index.
1.1 The Geography of Credit Risk
Given the large number of countries used for the analysis, it may be worthwhile to check if they share some
particular features such that they can live in clusters. Indeed, as shown by Figure 1, some economies share
common features, such as the peripheral ones (Italy, Portugal, Spain Ireland and Greece) and the Eastern
countries (Estonia, Latvia, Lithuania, Poland and Romania).
I perform a multivariate cluster analysis according to the complete method. Such a method is applied in
the hierarchical cluster analysis whose purpose is to optimize an objective function which is usually a distance
between a pair of clusters. Starting with each variable being a cluster, a cluster is formed at each new step
such that the variation of the within-group variance, or the distance between cluster centers, is as small as
possible, while the between-group variance is as large as possible. The algorithm uses the largest distance
between objects in the two clusters. In this case, the distance is Euclidean and measures the similarity by
computing the square root of the sum of the squared di¤erences in the variables�values.
The cluster analysis is known to be performed according to several methods (or algorithms) and distances.
Therefore, the choice is rationally dictated by the cophenetic correlation which measures the faithfulness of
the pairwise distance between the original variables�values. In other words, the higher this correlation, the
better the solution�s quality.
First of all, I use the correlation matrix of daily changes of CDS spreads as a measure of similarity among
objects. Then, I apply the method through an algorithm that attempts to form clusters at each step as
indicated above. Moreover, such a method requires knowing the number of clusters a priori ; therefore, I use
a rule of thumb and select N=4 groups, where N is the number of variables.
Table 2 shows the cluster�s composition over di¤erent periods. As expected, some European regions share
common features. Over the full sample (Panel A), the largest cluster contains the core economies (Austria,
Finland, France,Germany, Netherlands, Sweden and UK), the most worrying or peripheral economies�cluster
(Belgium, Ireland, Italy, Portugal and Spain), the cluster of Eastern countries (Estonia, Latvia, Lithuania,
Poland and Romania), and �nally, Norway and Greece in two di¤erent and far groups. These two one-item
9

groups con�rms the polarity of their own credit risk. Indeed, Norway that is deemed the safest European
country, has an average surplus and debt of 13.6 and 41.1, respectively, as a percentage of GDP over the period
2008-2011, while Greece is the �rst European country that has experienced a default after the constituency
of the currency union. In fact, it has an average de�cit and debt over GDP of 11.2 and 138.2, respectively,
over the period 2008-2011. Thus, I name these two as polar economies.
The biggest and primary concerns about the debt situation in the Euro zone exacerbated early in 2010
when rising government de�cits and debt levels together with a lot of companies�and sovereigns�downgrades
led the European Finance Ministers and the IMF to approve a huge monetary rescue package for Greece, and
lay basis for a deeper �nancial stability, creating the EFSF. Therefore, the Greek bailout can be considered
as the biggest main event of the European debt crisis. According to this view, I divide the sample into two
sub-periods in order to �gure out whether this event has changed the credit risk composition in the Euro
zone. Panel B of Table 2 illustrates the clusters over the period December 3, 2007 to May 2010, when the �rst
rescue package was approved, while Panel C from the end of May 2010 to March 2012. I can see a di¤erent
composition except for the Eastern countries which still share common credit risk features. It is interesting to
note that the extra-EU country, Norway, always maintains a great distance from the rest of Europe. Greece
comes out of the cluster of the peripherals due mostly to its orderly default, that is, the agreement reached
by the majority of private sovereign bondholders on March 9th, 2012 which led to the suspension of trading
on Greek CDS contracts. In addition to this, Table 2 reports also the cophenetic correlation which ensures
the goodness of the �t.
1.2 Principal Component Analysis
The Principal Component Analysis (PCA) will help measuring the degree of heterogeneity in the European
credit market. The PCA is performed on the correlation matrix of monthly log-changes of 5-year CDS
spreads. Starting from daily observations, I pick up the mid most available spread of the month ending
up with a monthly time series of 61 observations. The mid observation is chosen such that the sample is
not a¤ected by stale observation. Moreover, the log-transformation allows for scaling the very large Greek
spreads.
10

The emerging correlation structure, not reported here, shows that almost 26 percent of the pairwise
correlations is greater than 80 percent. This is common especially among the core economies, e.g., France
and Germany, which have a correlation of 86 percent. Moreover, Greece and Portugal present the lowest
average correlations of 12 percent and 0.8 percent, respectively.
Bearing this comovements�picture in mind, Table 3 reports the variance explained by the PCs across
both the whole set of countries and the above clusters. The table illustrates that, over the full sample (Panel
A) the �rst three components explains almost 84% of the variability of sovereign CDS spreads changes, which
becomes bigger if performed across clusters. Indeed, the �rst three PCs explain the 91.2, 91.1 and 96.1 per
cent for the Peripheral, the Core and the Eastern economies, respectively.
It may be worth notice that the �rst PC of the cluster of the Peripheral economies is only 3.8 per cent
bigger than that of the whole set of countries. Such a small di¤erence may be associated with the negative
correlation between Ireland and Portugal over the last part of the sample, when on July 21, 2011 a draft
statement drawn down by EU countries was approved, allowing the Irish government to pay a smaller interest
rate on its bailout on a longer maturity4 . This involved a trend inversion for Irish CDS spread.
Panel C of Table 3 reports univariate regressions of the �rst-di¤erences of the �rst PCs for each cluster
and for the whole set of 19 countries (Europe19). Interestingly, political uncertainty is positively and signif-
icantly related to the the �rst PCs of the three clusters with a stronger relation with the Core economies. In
addition to this, all these variables are signi�cantly related to the �rst PCs with the global market having
the strongest relation. Both the �nancial uncertainty in the European stock market (V2X) and the cred-
itworthiness of the European industrial sector (iTraxx) are signi�cantly and positively related to the �rst
PCs. Moreover, spillover e¤ect from both the US �nancial market (VIX) and the US industrial sector (IG
CDX) are signi�cantly related to the credit risk in Europe. The TED spread is signi�cant for the Eastern
economies. This result is in line with the view that Eastern economies su¤er the most liquidity problems
since their non-well developed banking systems force them to rely heavily on foreign borrowing, especially
from the biggest US banks.
The whole picture that emerges from this statistical analysis is that CDS spread variations embed credit
4Up to that day, Ireland had paid an average interest rate of 5.8% with a maturity of 7.5 years. The new agreement statedan interest rate of 3.5% and doubled the maturity.
11

risk features that can be clustered over speci�c European regions and that there is a certain correlation
structure with political uncertainty and other European and US �nancial variables which lay the basis for a
deeper understanding. In fact, the next goal is to test the e¤ect of political uncertainty on what moves the
European credit market, namely, the credit risk premium and the default risk, after controlling for information
already embedded in the �nancial markets.
2 Credit Risk Premium and Default Risk
This section is preliminary for the empirical analysis since here I �rst present and then calibrate the Pan and
Singleton (2008) pricing model for sovereign CDS to extract the main variables for the empirical analysis,
namely, the credit risk premium and the default risk. Once again, the credit risk premium is the premium
an investor asks to bear the risk of that asset due to unexpected variation in the default intensity, whereas
the default risk is the negative jump upon default in the value of the contingent claim.
2.1 The Pricing Model
Even if a CDS contract written on a company�s bond di¤er from that written on a sovereign bond in its own
credit event de�nition, the theoretical pricing framework is still valid. Here I report a brief description of the
Pan and Singleton (2008) reduced-form model for sovereign CDS spreads.
A CDS contract with maturityM consists of two components, the buyer�s premium, de�ned as CDSt (M)
and paid quarterly or semiannually, and the amount the buyer gets from the seller upon a credit event occurs.
Assuming a semiannual payment and a notional equal to one, the premium leg, that is, the present value of
the premium �ows, is as follows
1
2CDSt (M)
2MXj=1
EQthe�
R t+:5jt (rs+�Qs)ds
i
where the term in brackets catches the risk-neutral survival-dependent nature of the payments, that is,
they are discounted according to a risk-free interest rate, rt, plus a default intensity, �Qt5 . Instead, the present
5 In reduced-form models, a default is modeled as the �rst arrival of a risk-neutral Poisson process whose stochastic intensityprocess is represented by �Qt . For more details, see Bielecki and Rutkowski (2002).
12

value of the amount the seller will pay upon a credit event is
LQZ t+M
t
EQth�Que
�R ut (rs+�
Qs)ds
idu
where LQ = 1�RQ is the loss given default, expressed as the face value minus the recovery rate, RQ.
As a plain IRSs, a CDS contract is written by both the buyer and the seller if it is worth zero at inception.
This allows us to infer the contract-implicit spreads as follows:
1
2CDSt (M)
2MXj=1
EQthe�
R t+:5jt (rs+�Qs)ds
i=�1�RQ
� Z t+M
t
EQth�Que
�R ut (rs+�
Qs)ds
idu
CDSt (M) =2�1�RQ
� R t+Mt
EQth�Que
�R ut (rs+�
Qs)ds
iduP2M
j=1 EQt
he�
R t+:5jt (rs+�Qs)ds
i (1)
According to the way one interprets the fractional recovery, the pricing model can be di¤erent. Following
Du¢ e and Singleton (2003), Pan and Singleton (2008) and Longsta¤ et al. (2011), I assume the fractional
recovery of face value (RFV), which, under the independence assumption between the intensity of default
and interest rate, allows for the expectation�s splitting, that is,
Z t+M
t
EQth�Que
�R ut (rs+�
Qs)ds
idu '
Z tM
t
EQthe�
R ut(rs)ds
iEQth�Que
�R ut (�
Qs)ds
idu
=
Z tM
t
D (t; u)EQth�Que
�R ut�Qsds
idu
where D (t; u) represents the price of a default-free zero coupon bond issued at time t and maturing at
time u, while the expectation term is nothing more than the risk-neutral death probability.
2.2 The Stochastic Default Intensity Process
The Pan and Singleton (2008) model is challenging for its assumption about the intensity process.
They assume that the arrival rate of a credit event, �Qt , follows a Black-Karasinski lognormal stochastic
process, whose conditional expectation is known not to have a closed-form solution, since the seminal work
13

of Black and Karasinki (1991).
The stochastic process, under the objective probabilities, has the following representation
d ln�Qt = kP��P � ln�Qt
�dt+ ��Qt
dBPt (2)
where kP is the mean reversion speed, �P the long-term mean level and ��Qt the local volatility for local
changes in ln�Qt .
Assuming an a¢ ne market price of risk �t,
�t = �0 + �1 ln�Qt (3)
the Girsanov theorem shows that under an equivalent change of measure, the stochastic process under
the risk-neutral probability becomes
d ln�Qt = kQ��Q � ln�Qt
�dt+ ��Qt
dBQt
with kQ = kP+�1��Qt and kQ�Q = kP�P��0��Qt preserving the same characteristics as under the objective
measure.
In order not to be confused about the notation, here I am considering the risk-neutral default intensity,
�Qt , under both probability measures. The reason why I deal with such a probabilistic framework is readily
shown by Yu, Fan (2002) who, analyzing such reduced-form pricing models, points out how they can only be
applicable prior to default, since they su¤er a survival bias, which is related to the process under the objective
measure6 . Therefore, the Pan and Singleton (2008) model is able to extract only the default risk premium
(or credit risk premium or distress risk), which is the compensation investors demand for bearing the risk
due to unexpected variations in the default intensity. It does not catch the default event risk premium (or
default risk or jump-to-default), that is, the (negative) jump in the value of the contingent claim at default.
As highlighted by Longsta¤ et al. (2011), the latter is typically measured as the ratio between the risk-
6This problem emerges when the default intensities under both measures are not asymptotically equivalent, allowing for adistinction between default risk premium and default event risk premium.
14
neutral and the objective intensity, �Qt =�Pt . However, the objective intensity is hard to infer from prices alone
because, being a rare event, it requires deeper understanding of the �nancial situation of a sovereign. Thus,
from market prices one is able to infer only the risk-neutral intensity under the objective probabilities.
Such a lognormal process has its own advantages. Indeed, as we know, a lognormal distribution has
fatter tails than the classical noncentral chi-squared distribution of the usually-used CIR process. Even if it
preserves the mean reverting feature, is strictly positive and has a distribution skewed to the right, it may
su¤er the explosion problem. But the main shortcoming is that the outcoming survival probabilities are not
available in closed-form.
Given the intensity dynamics as described by the SDE in equation 5, the risk-neutral survival probability
EQthe�
R ut�Qsds
iis measured by approximating numerically its corresponding PDE with a fully implicit �nite
di¤erence method7 .
2.3 Credit Risk Premium and Default Risk
This model can only infer the distress risk from CDS spreads. Such a risk may be priced in the market to
the extent that the implied risk-neutral probabilities di¤er from the objective ones, which catch investors�
expectations in the sovereign CDS market.
Therefore, following Pan and Singleton (2008) and Longsta¤ et al. (2011), I estimate CDS spreads under
the objective probabilities, also known as the pseudo CDS spread, this is,
CDSPt (M) =2�1�RQ
� R t+Mtt
EPh�Que
�R ut (rs+�
Qs)ds
iduP2M
j=1t EPhe�
R t+:5jt (rs+�Qs)ds
i (4)
where the expectations are taken under the natural probabilities.
Accordingly, the market price of distress risk premium or credit risk premium, CRPt (M), is measured
simply by the di¤erence between the CDS spread under Q in equation 1 and the pseudo one in equation 4,
7A numerical approximation, like �nite di¤erence methods, may lose stability at boundaries when the underlying processturns out to be pure convection (drift equal to zero) or pure di¤usion (volatility equal to zero). In order to avoid this, I applythe exponential �tted scheme which has good convergence properties and does not allow for spurious oscillations. For moredetails, see Du¤y (2001)
15

that is,
CRPt (M) = CDSt (M)� CDSPt (M) (5)
What here I call default risk is nothing more than the residual from the distress risk. In other words,
following the interpretation of the expected return given by Yu (2002), the risk premium deriving from the
di¤erence between a defaultable and a default-free bond, consists of the sum of two parties: the �rst is related
to variations in the spread, namely, in the unpredictable intensity (distress risk) and the second is related to
the default event (jump-to-default risk). Estimating the default event risk premium requires not only market
prices but also �nancial statement data, thus, following Longsta¤ et al. (2011), I quantify it as the di¤erence
between the CDS and its implicit CRP.
3 Estimation Strategy
The model is calibrated according to the quasi-maximum likelihood (Q-MLE) method, using the term-
structure of CDS spreads for the maturities 1-, 3-, 5- and 7-year. The approach is widely used in the term
structure literature and is referred to the dated works of Longsta¤ and Schwarts (1992) and Chen and Scott
(1993), and to the recent works of Du¤ee (2002), Pan and Singleton (2008) and Longsta¤ et al. (2011).
The underlying assumption is to assume that a CDS contract over a speci�c maturity is priced without
error. In such a way, one can invert the model and get the latent variable, that is, the unobservable default
intensity. This is possible thanks to the availability of a term structure of CDS spreads. A widely used
empirical trick is to choose the most liquid maturity and thus, I choose the 5-year CDS spread whose trading
volume has always been higher than other maturities8 .
The parameters are estimated with respect to the distribution of the implied-CDS default intensity. The
intensity, given by the SDE in equation 2 under the objective probabilities, has a lognormal density with
8Longsta¤ et al. (2011) argues that "We spoke with several sovereign CDS traders to investigate this [liquidity] issue. Thesetraders indicated that the liquidity and bid-ask spreads of the one-year, three-year, and �ve-year contracts are all reasonablysimilar, although the �ve-year contract typically has higher trading volume."
16

mean, mt, and variance, v:
m�t = ln��Qt�1
�e�k
P�t +�P
kP
�1� e�k
P�t�
v�t =�2�Qt
2kP
�1� e�2k
P�t�
Letting CDSt (M) be the vector of CDS spreads9 for maturities M = 1; 3; 7, I assume that the pricing
error � is normally distributed with mean zero and constant variance. Therefore, the model CDSt (M) =
h��Qt
�+ �t, where h (�) is the pricing function (equation 1) and �t the pricing error, is jointly estimated
according to the following joint density
fP��Qt ; �tjFt�1
�= fP
��Qt jFt�1
�� fP
��tj�Qt ;Ft�1
�= fP
��Qt j�
Qt�1
�� fP
��tj�Qt ;Ft�1
�
where the �rst term on the RHS comes from the Markov assumption of the stochastic process and
fP��tj�Qt ;Ft�1
�s N (0;), where = diag f� (1) ; � (3) ; � (7)g.
Finally, the parameter set consists of 8 parameters, that is, ��Qt ; kQ�Q; kQ; kP�P; kP; � (1) ; � (3) ; � (7).
The daily risk-free discount functions are bootstrapped from constant maturity bonds collected from the
H.15 release of the Federal Reserve system. Several methods can be used for getting discount functions
from market data, but their e¤ect in pricing CDS contract is negligible, since it enters the pricing function
symmetrically. Moreover, as shown by Du¢ e (2003), under some speci�c conditions, a CDS contract can be
replicated by an arbitrage-free portfolio by buying a default-free �oater and shorting a defaultable �oater. As
we know, the sensitivity of these securities to interest rate variations is very small, endorsing the assumption
about the method used to extract the discount function.
3.1 Parameters�Calibration
Table 4 reports the estimated parameters with standard errors in parentheses and average log-likelihoods10 .
9The pricing function is adjusted in order to account for the accrued credit-swap premium at default.10Given the large number of parameters, I set the algorithm�s convergence criterion equal to 10�17 in order to o¤set the
starting value problem. Standard errors are computed numerically.
17

As we can observe from the standard deviations, the model �ts the term structure well enough with some
exceptions for the 1-year CDS contract. This is a model�s feature already observed in Pan and Singleton
(2008) where the shorter maturities seem to be priced with greater errors. Moreover, the calibration con�rms
other empirical characteristics: the credit environment is worse under the risk neutral probabilities than
under the objective ones, kQ�Q > kP�P, allowing for larger and more persistent (kQ > kP) default intensities
under Q than under P for the majority of countries. Finally, kP > 0 for each country, meaning that the
process �Qt is P-stationary.
3.2 The Calibrated Credit Risk Components
Di¤erences in the calibrated parameters across probabilistic environments allow for inferring that a credit
risk premium is priced in the CDS market.
The credit risk premium for the 5-year CDS spread is computed as in equation 5. Table 5 reports summary
statistics for both the credit risk premia (CRP) and the default risk (DRP).It is worth notice that the mean
value goes from a minimum of 0.3 bps for UK to a maximum of 303.3 bps for Greece, whereas the default
risk ranges from a minimum of 8 bps of Norway to a maximum of 1142 bps of Greece. The default risk is on
average greater in magnitude than CRPs. This bigger magnitude is due to the way the default risk measure
is built. On one hand, being a residual measure, one may conclude that it can contain everything (more than
the default risk itself) except the credit risk premium. But, on the other hand, the theoretical issue explained
above asserts that it may be indeed deemed as a reliable measure of the jump-to-default risk, which is not
directly captured by reduced form models. In addition to this, the credit risk premium, on average, accounts
for a 42 per cent of the Credit Default Swap spread in Europe. In order to have a broader view of the CRP�s
evolution over time, Figure 2 plots four panels where countries are grouped in clusters as shown in Section
1.1.
18

Nov06 Aug09 May12 Feb150
20
40
60
80
100
120
140Core Economies
AustriaFranceNetherF inlandGermanSwedenUK
Nov06 Aug09 May12 Feb150
200
400
600
800
1000
1200Peripheral Economies
BelgiumItalyPortugalSpainIreland
Nov06 Aug09 May12 Feb150
50
100
150
200
250
300
350
400Eastern Economies
EstoniaLatviaLithuaniaPolandRomania
Jan00 May01 Sep02 Feb040
10
20
30
40Polar Economies
0
2000
4000
6000
8000GreeceNorway
Figure 2. Credit Risk Premium (CRP) extracted from the country speci�c Credit Default Swap termstructure by calibrating the Pan and Singleton (2008) Sovereign CDS pricing model. The CRPs are
grouped into three macro regions according to the outcome of the Cluster Analysis: Core, Peripheral andEastern Economies plus the group-stand-alone Polar Economies. Daily sample period December 3, 2007 to
Janury 22, 2013.
This graphical perspective con�rms that the sample can be readily split into two sub-periods, the Lehman
Brothers�bankruptcy and the Euro zone debt crisis. During these two sub-periods, all the economies expe-
rience large variations in the CRP, recording spikes of di¤erent magnitudes. While for the core economies
the CRP variations around the two macro events are comparable in magnitudes, the Eastern and peripheral
economies show opposite paths, with the formers much more a¤ected by the Lehman default rather than the
Euro debt crisis. Such a result may support the view that the European Union has di¤erent speeds, not only
for what is concerned with the growth rate or in�ation rate, but also for the perceived credit risk, allowing
for asymmetric e¤ects stirred up by a common shock that makes ine¢ cient a common policy intervention.
Moreover, as outlined by the PCA results, the Eastern countries have su¤ered the most shocks from the
�nancial crisis since these are economies with non-well developed banking systems that are forced to rely on
foreign borrowing, thus, exposed to spillover e¤ect.
19

4 Political Uncertainty and Credit Risk
Does political uncertainty a¤ect the risk perceptions of investors in the European credit market? In other
words, do investors require a higher risk premium in the presence of a higher degree of political uncertainty?
Is the default risk a¤ected by such an uncertainty?
I answer these questions by employing a set of panel regressions where I regress separately the two
components embedded in the credit market on the policy-uncertainty index adding step-by-step �nancial
control variables. The latter have the following purposes: �rstly, they make the analysis more robust in
case I can con�gure a signi�cant relation between political uncertainty and credit market; secondly, they
can dampen the main criticism on the policy-related uncertainty index, that is, the way it is built allows for
catching also economic and �nancial uncertainty rather than only political uncertainty. In fact, including
stock, credit and commodity markets in the analysis enables me to purify the political index from �nancial
and economic information, leaving out only the political part. This is possible because the above mentioned
markets are known to be very liquid, thus, they incorporate market information in a very fast way.
To this end, I include control variables such as the domestic stock market index as a proxy for the state
of local economies11 , the Eurostoxx50 and S&P500 implied volatilities (V2X and VIX ) to proxy respectively
for the European and US stock market uncertainty, the iTraxx Euro CDX and the IG US CDX to proxy
for the creditworthiness of the European and US industrial sector, respectively, the price-earning ratio of
the Dax and Eurostoxx50 Indices to proxy for the investors�expectation on the growth in Europe, the TED
spread for catching liquidity issues and the gold price that is deemed the safe-heaven asset during distress
periods. Such variables are chosen to the extent that I can control for Europe-speci�c variables and spillover
relations from the US market.
4.1 The Empirical Methodology: Panel Regressions
The analysis is performed on the log-di¤erences in order to i) scale the variables such that the exponential
increase in the Greek spread does not absorb all the variance, ii) measure the percentage e¤ect or relationship
11 I consider the following local stock markets: ATX (Austria), BEL 20 (Belgium), TALSE (Estonia), OMXH25EX (Finland),CAC 40 (France), DAX (Germany), ASE (Greece), ISEQ (Ireland), FTSE MIB (Italy), RIGSE (Latvia), VILSE (Lithuania),AEX (Netherlands), OSEBX (Norway), WIG (Poland), PSI 20 (Portugal), BET (Romania), IBEX (Spain), OMX (Sweden) andUKX (UK).
20
of the variables on the credit market. Moreover, to make the analysis more robust, I perform the panel
regressions clustering the errors across time. In such a way, I will be able to catch possible time-varying
dependences since it may be the case that during distress periods the correlation between markets increases
dramatically making the estimation less reliable. The econometric model is the following:
� lnYi;t = �1� lnPolIdxt + �2� lnPolIdxt�1 + Xi;t + �i + ui;t (6)
where Y is either the credit risk premium or the default risk, PolIdx is the policy-related uncertainty
index, Xi;t is the set of control variables and �i captures country �xed e¤ect.
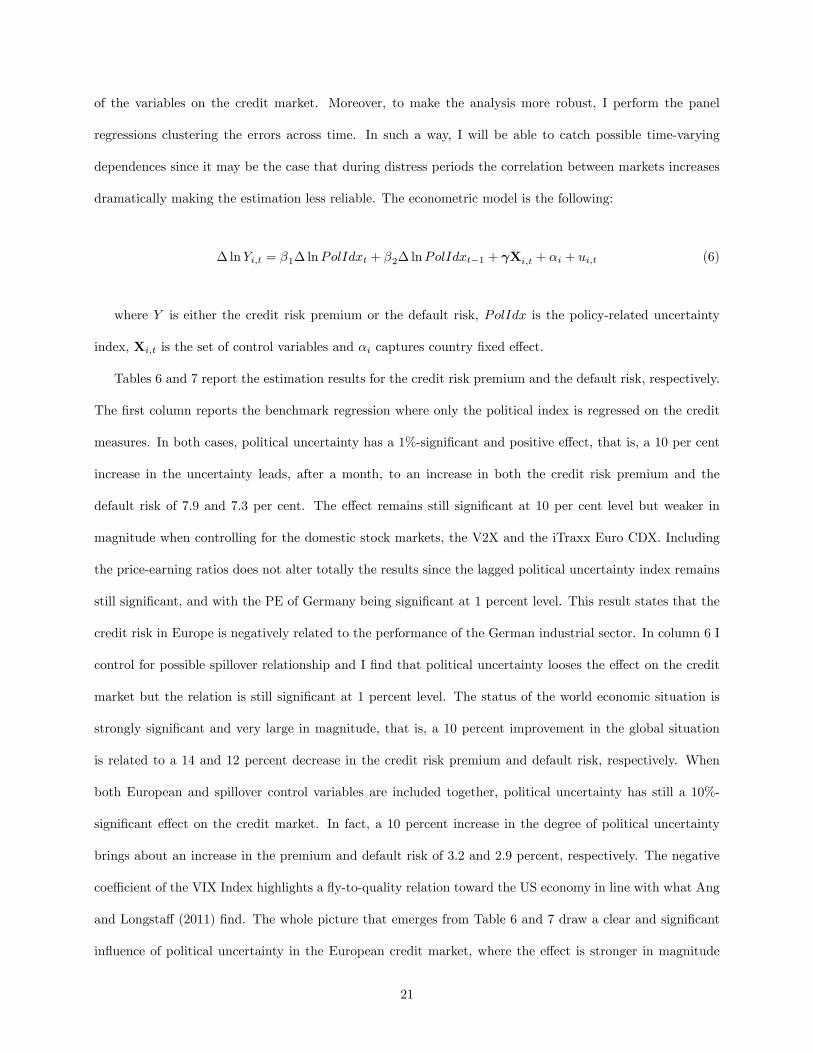
Tables 6 and 7 report the estimation results for the credit risk premium and the default risk, respectively.
The �rst column reports the benchmark regression where only the political index is regressed on the credit
measures. In both cases, political uncertainty has a 1%-signi�cant and positive e¤ect, that is, a 10 per cent
increase in the uncertainty leads, after a month, to an increase in both the credit risk premium and the
default risk of 7.9 and 7.3 per cent. The e¤ect remains still signi�cant at 10 per cent level but weaker in
magnitude when controlling for the domestic stock markets, the V2X and the iTraxx Euro CDX. Including
the price-earning ratios does not alter totally the results since the lagged political uncertainty index remains
still signi�cant, and with the PE of Germany being signi�cant at 1 percent level. This result states that the
credit risk in Europe is negatively related to the performance of the German industrial sector. In column 6 I
control for possible spillover relationship and I �nd that political uncertainty looses the e¤ect on the credit
market but the relation is still signi�cant at 1 percent level. The status of the world economic situation is
strongly signi�cant and very large in magnitude, that is, a 10 percent improvement in the global situation
is related to a 14 and 12 percent decrease in the credit risk premium and default risk, respectively. When
both European and spillover control variables are included together, political uncertainty has still a 10%-
signi�cant e¤ect on the credit market. In fact, a 10 percent increase in the degree of political uncertainty
brings about an increase in the premium and default risk of 3.2 and 2.9 percent, respectively. The negative
coe¢ cient of the VIX Index highlights a �y-to-quality relation toward the US economy in line with what Ang
and Longsta¤ (2011) �nd. The whole picture that emerges from Table 6 and 7 draw a clear and signi�cant
in�uence of political uncertainty in the European credit market, where the e¤ect is stronger in magnitude
21

on the credit risk premium that on the default risk. Interestingly, the set of variables is able to explain the
6 percent of the variation more in the default risk than those in the credit risk premium (R2 of 46.9 against
40.8 percent).
4.2 The Empirical Methodology: the VAR Approach
The previous section highlights a signi�cant e¤ect of political uncertainty on the European credit market,
but does not allow for catching a possible reverse relationship or e¤ect. Indeed, it can be the case that it
is the market to put pressure on governments, making them unable to implement some contingent measures
rather than other ones. The latter case may be partially due to a view, commonly held by policy makers,
according to which, �nancial speculators, through their huge bearish bets, have prevented the governments
from setting adequate measures, worsening the crisis. To this end, I employee a panel Vector Autoregressive
approach which is highly recommended when the goal is to study a phenomenon without any strong prior
about the causality�s direction.
There are several empirical studies that have already used both a VAR approach and a vector error
correction model (VECM) in analyzing CDS markets. This is concerned with that part of the literature which
has been dealing with understanding better whether the CDS market is more e¢ cient than the underlying
sovereign bond market. Arce at al. (2011) address the point at what market, CDS or bond, leads the price
discovery process and �nd that the latter is state-dependent, that is, both markets alternated the supremacy
over some speci�c events, such as the Lehman Brothers� default and the Bear Stearns� collapse. Similar
�ndings are shown by Coudert and Gex (2011) who state that the bond market has its own supremacy over
developed European economies, while the CDS market over emerging economies.
When dealing with VAR, the �rst step is to determine whether the VAR is performed in levels or �rst
di¤erences, and, whether any long-run relationship exists between the credit risk measures and the policy-
related uncertainty index, by exploring their own time-series characteristics. On one hand, I can argue several
reasons in favor of the stationarity of the CRP measures. First of all, given the short available sample, the
non-stationarity can emerge as a small sample property, which cannot be avoided since the dataset contains
also advanced economies for which no CDS contracts were traded before the mid-2007 �nancial crisis. In
22

addition, the model I calibrated is based on the assumption of a mean-reverting process, which is stationary
by construction. On the other hand, since I am going to use a VAR model, it is good and common practice
to study the characteristics of time-series in detail to check if they are cointegrated. Indeed, as we know,
the presence of cointegration leads to a di¤erent VAR representation: i.e., the VECM model. Therefore,
I implement Augmented Dickey-Fuller (ADF) and Phillip-Perron (PP) unit root tests and cointegration
test. The results are not reported here but available upon request. Basically, I �nd that the PP test
fails to reject the hypothesis of non-stationarity more often than the ADF test at 5 percent level for both
variables. Moreover, these variables are stationary in their �rst di¤erences, allowing for inferring that they
are integrated of order one. Given that unit root tests do not allow for a clear understanding about the
stationarity hypothesis, I test the cointegration relationship with the Johanses�s methodology (Johansen, S.
(1991)). I estimate a bivariate VAR comprised of the political index and the credit risk measures. Results
not reported here con�rm the absence of cointegration between the variables.
Hence, the econometric VAR model is the following:
� lnYi;t =
3Xp=1
�p� lnYi;t�p + �i + ui;t (7)
where Yi;t is either [PolIdxt; CRPt] or [PolIdxt; DRPt] and �i country-speci�c �xed e¤ect. Control
variables are not added since the lagged values already include aggregate market information. Table 8 report
the panel VAR estimation. Interestingly, there is no evidence of the credit market Granger-causing the degree
of political uncertainty. It is then con�rmed the panel results in the previous section. In fact, the political
uncertainty shows a longer and a grater e¤ect in magnitude on the credit risk premium than on the default
risk. But, according to Stock and Watson (2001) who state that "Because of the complicated dynamics in the
VAR, these statistics [impulse response functions] are more informative than the estimated VAR regression
coe¢ cients or R2�s", I estimate impulse response functions (IRFs).
When dealing with IRFs, the main issue is to chose the best Cholesky ordering, namely, the order of the
variables in the model because the �rst variable respond contemporaneously to the shock, whereas the second
one react with a lag. In other words, there is a hierarchy in the way shocks hit the variables. Moreover,
these functions require that a shock occurs only in one variable at a time, thus, a reasonable assumption is
23

to have independent shocks. This is reached by orthogonalizing the covariance matrix of the residuals by
using the Choleski decomposition. Therefore, I put political uncertainty �rst since my goal is to study the
evolution and propagation of political shocks to the credit market. Figure 3 plots the IRFs for both systems
as reported by Table 8.
1 2 3 4 5 6 70.1
0.08
0.06
0.04
0.02
0
0.02
0.04Response of Polit ical Uncertainty to Credit Risk Premia Shock
1 2 3 4 5 6 70.2
0.1
0
0.1
0.2
0.3Response of Credit Risk Premia to Polit ical Uncertainty Shock
1 2 3 4 5 6 70.3
0.2
0.1
0
0.1
0.2Response of Default Risk to Polit ical Uncertainty Shock
1 2 3 4 5 6 70.1
0.08
0.06
0.04
0.02
0
0.02
0.04Response of Polit ical Uncertainty to Default Risk Shock
Figure 3. Impulse Response Functions estimated from the panel VAR for the systems PoliticalUncertainty/Credit Risk Premia and Political uncertainty/Default Risk. The impulse is a Choleskione-standard deviation. Red dotted lines indicate the 95% con�dence intervals, generated by 500 MC
simulations. Montlhy sample period December 2007 to January 2013.
The top-left graph of Figure 3 shows how a political shock of ten standard deviations increases the
European credit risk premium of 1 percent and takes two months before disappearing. Additionally, a political
shock has a positive and signi�cant e¤ect also on the default risk that reaches a peak after one month, for
then decreasing and disappearing on the second month as shown by the top-right graph. Such a picture
highlights a scenario where investors ask a premium when political shocks hits the European credit market
with this e¤ect being larger on the risk premia. The bottom-left graphs does not show any signi�cant reverse
response of political uncertainty to a credit risk premium shock. The bottom-right plot depicts an interesting
24

and surprising scenario, that is, a shock to the credit market that increases the default risk in Europe leads
to a signi�cant decrease in the degree of political uncertainty after three months the shock is generated. This
may signal the corrective or disciplinary role of the market in putting pressure on policymakers to act so as
to reduce political uncertainty in the presence of a serious risk of default rather than "mere" variations in
the risk aversion.
4.2.1 Exploring the Heterogeneity in the Credit Market
The cluster analysis in Section 1.1 shows that the European credit market masks speci�c credit risk features
that can be clustered. In this section I investigate the relation between political uncertainty and the credit
market on a country level. Thus, a bivariate VAR approach is employed since I believe that the Granger
causality may be reverted for some countries. Indeed, it can happen that problems in the credit market of a
country increase the degree of political uncertainty. The econometric model is the following
� lnYi;t =
3Xp=1
�p� lnYi;t�p + Xi;t + �i + ui;t (8)
where Yi;t is either [PolIdxt; CRPt] or [PolIdxt; DRPt], �i captures country-speci�c �xed e¤ect and
Xi;t is the set of control variables that includes the local stock market, the VIX Index, the iTraxx Euro
CDX, the price-to-earning ratio of the Dax Index, the TED spread and the gold price. All the controls are
in log-di¤erences.
Tables 9a and 9b report the estimation output for the system political uncertainty/credit risk premium.
As expected, there is a sort of heterogeneity with which the credit risk premia react to variations in the
degree of political uncertainty. In the majority of cases there is a signi�cant and positive lead-lag relation
between political uncertainty and the credit risk premia. Interestingly, the state of the local economy is
negatively related to the premia in Europe, whereas the Eastern economies�credit risk premia are positively
related to the uncertainty in the US �nancial market as shown by the VIX coe¢ cients. Such a result still
support, once again, the view that these economies have been relying heavily on foreign borrowing, thus, very
exposed to spillover e¤ect. Moreover, the core and peripheral economies�premia are signi�cantly linked to the
performance of the German industrial sector, as the price-to-earnings ratio shows a clear relation. Finally,
25

all these variables explain, on average, almost the 56 percent of the variability in the credit risk premia
throughout Europe. Additionally, Table 9b depicts a scenario of a reverse causality for few countries that
have been experiencing serious debt issues such as Italy, Ireland, Spain and UK, where higher domestic distress
risk a¤ects signi�cantly the degree of political uncertainty in Europe. Interestingly, political uncertainty is
strongly and positively associated to spillover from the US �nancial market.
Slightly di¤erent are the scenarios concerning the default risk. Table 10a and 10b report the results.
There exists a signi�cant lead-lag e¤ect for fewer countries�default risk than the credit risk premia. Indeed,
this is the case of Austria, Belgium, Italy, Norway, Poland, Romania, Spain, Sweden and UK. Among those
countries, Belgium, Italy, Spain and UK have dramatically increased their debt during the �nancial crisis and
with the �rst three experienced heavy government crisis. Indeed, the beginning of the political instability
in Belgium coincides with the beginning of the mid-2007 �nancial crisis, when after the elections held in
the summer 2007, the government was formed only after 194 days. This was followed by another period of
instability after the elections held in June 2010, when the government formation was reached only after 541
days. The electoral debates were actually focused on state reforms, to which the topics of public debt, de�cit
cuts and socio-economic reforms were added after the �rst Greek bailout. Similar worries were in play for
the Italian and Spanish governments, which did no more than increase political instability in the Euro zone.
Interesting is the reverse lead-lag e¤ect of the default risk on the degree of political uncertainty. For more
than half of the countries in the sample, higher default risk leads to an increase in the political uncertainty
after two or three months. Comparing Tables 9b and 10b, there emerges that the one-month lead-lag relation
with political uncertainty is negative, even if not signi�cant at all, for almost all the countries. Such a scenario
may con�rm the corrective role of the market already highlighted on the aggregate level by the panel IRFs.
The whole picture that emerges shows how investors react heterogeneously to variations in the political
uncertainty and how the latter may be signi�cantly increased by investors� expectations on the country-
speci�c default risk.
To further explore the heterogeneity, I follow Longsta¤ et al. (2011) and I build regional credit risk premia
and default risk measures by taking the median value for each cluster, including Greece and Norway among
26

the peripheral and core economies, respectively 12 . The econometric model is still a bivariate V AR(3) as in
equation 8. Tables 11 reports the results for the credit risk premia. The whole picture that emerges highlights
a scenario where, on one hand, political uncertainty a¤ects the credit risk premia of both the peripheral and
Eastern economies, where a 10 percent increase in the degree of political uncertainty leads to an increase of
about 3.5 percent in the credit risk premia of the peripheral economies. On the other hand, a 10 percent
increase in the credit risk premium of the core economies leads to an increase in political uncertainty of
about 1.7 percent. Additionally, there exists spillover relations among the macro regions as shown by the
coe¢ cients CRPCoret , CRPPeripht and CRPEastt . Such a scenario is interesting in the sense that political
uncertainty that is generated mostly by the core economies a¤ects signi�cantly the other two macro regions,
but then, higher risk premia in these regions are associated with higher and signi�cant risk premia in the
core economies as highlighted by the variables CRPPeripht and CRPEastt . Slightly di¤erent is the scenario
on the default risk depicted by Table 12. Indeed, political uncertainty a¤ects the default risk of only the
core and the peripheral economies, but not the Eastern ones. This result is in line with their economic
fundamentals. Eastern countries lay in better economic conditions in terms of GDP growth, unemployment
rates and levels of indebtness with respect to their GDP. But there still exists spillover relations among the
default risk measures across the three macro regions. Once again, both the credit risk premium and the
default risk of the peripheral economies a¤ect negatively and signi�cantly the degree of political uncertainty.
Thus, I can state that the corrective role of the market is mostly focused on the creditworthiness of the most
indebted countries which may spread out serious contagion e¤ects.
To shed further light on the linkage between the political uncertainty and the regional credit risk, the
best practice is to look at what the impulse response functions do show about. Figures 4 and 5 plot the IRFs
for both systems.
12To be more precise, Longsta¤ et al. (2011) use the mean value whereas I employ a more robust measure, the median, sincethe high values of Greece absorb the entire variance and so altering the aggregation process.
27

1 2 3 4 5 6 70.04
0.02
0
0.02
0.04Response of Core Economies to Political Uncertainty Shock
1 2 3 4 5 6 70.02
0
0.02
0.04Response of Polit ical Uncertainty to Core Economies Shock
1 2 3 4 5 6 70.05
0
0.05Response of Peripheral Economies to Political Uncertainty Shock
1 2 3 4 5 6 70.04
0.02
0
0.02
0.04Response of Polit ical Uncertainty to Peripheral Economies Shock Shock
1 2 3 4 5 6 70.02
0
0.02
0.04
0.06Response of Eastern Economies to Polit ical Uncertainty Shock
1 2 3 4 5 6 70.02
0
0.02
0.04Response of Polit ical Uncertainty to Eastern Economies Shock Shock
Figure 4. Credit Risk Premia: Impulse Response Functions estimated from the bivariate VAR(3) withregional credit risk premia and the policy-related uncertainty index. The impulse is a Choleski
one-standard deviation. Red dotted lines indicate the 95% con�dence interval.
1 2 3 4 5 6 70.05
0
0.05
0.1
0.15Response of Core Economies to Political Uncertainty Shock
1 2 3 4 5 6 70.02
0
0.02
0.04Response of Political Uncertainty to Core Economies Shock
1 2 3 4 5 6 70.05
0
0.05Response of Peripheral Economies to Polit ical Uncertainty Shock
1 2 3 4 5 6 70.04
0.02
0
0.02
0.04Response of Political Uncertainty to Peripheral Economies Shock Shock
1 2 3 4 5 6 70.04
0.02
0
0.02
0.04Response of Eastern Economies to Polit ical Uncertainty Shock
1 2 3 4 5 6 70.02
0
0.02
0.04Response of Political Uncertainty to Eastern Economies Shock Shock
Figure 5. Default Risk : Impulse Response Functions estimated from the bivariate VAR(3) with regionaldefault risk measures and the policy-related uncertainty index. The impulse is a Choleski one-standard
deviation. Red dotted lines indicate the 95% con�dence interval.
28

IRFs depict a scenario where a political shock has a signi�cant impact on the risk premia of the peripheral
economies after a month the shock is generated, and on the default risk of the core economies after three
months, whereas a shock to the premia of the core economies leads to an signi�cant increase in the degree
of political uncertainty after two months. Interestingly, as already shown by Table 12, a shock to the credit
market of the peripheral economies that increases their default risk brings about a decrease in the political
uncertainty after a month. Such a result still con�rm the above mentioned view that it may be a signal of
the disciplinary or corrective role of the market, that is, a distress hitting highly indebted countries forces
policymakers to act accordingly decreasing de facto the political uncertainty. In other words, policymakers
react to signals sent by the market which moves according to the contingent economic and political situation.
5 Conclusions
In this work, I stress the role of political uncertainty in the European credit market.
I decompose the CDS spread into the sum of two components, namely, the credit risk premium or distress
risk and the default risk or jump-to-default risk. The former catches the compensation investors demand
for bearing the risk due to unexpected variations in the default intensity, whereas the jump-to-default risk
captures the sudden (negative) jump in the underlying bond value in case of default. The results show
a signi�cant in�uence of political uncertainty on the sovereign credit risk. In particular, a 10%-increase
in the degree of political uncertainty brings about a signi�cant and positive variation in both the credit
risk premia and the default risk of about 3 percent. Such a result is robust to controlling for information
already embedded in the European and US stock and credit markets. Moreover, the control variables play an
additional role in purifying the political uncertainty index from economic and �nancial information, leaving
out only the political part.
A panel Vector Autoregressive approach and then the impulse response functions highlight an interesting
result, that is, a shock to the credit market that increases the default risk in Europe leads to a signi�cant
decrease in the degree of political uncertainty after three months the shock is generated. This may signal
the corrective or disciplinary role of the market in putting pressure on policymakers to act so as to reduce
29

political uncertainty in the presence of a serious risk of default rather than "mere" variations in the risk
aversion. Further analysis on an country-individual and regional levels show how such a corrective role of
the market exists in the presence of a shock to the credit market of the peripheral economies, which are the
most worrying ones, given their high level of indebtness.
The global picture that emerges from this work enables me to conclude that, on one hand, political
uncertainty can be deemed as one the main driving factor of the European credit market, that contribute
signi�cantly to increase the investors�risk aversion, but, on the other hand, policymakers react accordingly
to turmoils in the credit market when there exists a serious risk of default, rather than simple variations in
the credit risk premia.
This work relies on a particular proxy for political uncertainty which has allowed me to study the phenom-
ena on a time series basis, instead of a simple event study analysis. To my best knowledge, currently, there
is no alternative way to proxy for variations in political uncertainty over time and on a monthly frequency.
Therefore, future research may improve the results of this work and make them more robust by estimating
the model on new and di¤erent time-series proxies for political uncertainty.
30

References
[1] Acharya, V., Drechsler, I., Schnabl, P., 2011. A Pyrrhic victory? Bank bailouts and sovereign creditrisk, NBER Working Paper Series No. 17136
[2] Ang, Andrew, and Francis A. Longsta¤, 2011, Systemic sovereign credit risk: lessons from the U.S. andEurope, NBER working paper series
[3] Ang, Andrew, and Geert Bekaert, 2002, International asset allocation with regime shifts, The Review ofFinancial Studies, Vol. 15, No.4, pp. 1137-1187
[4] Ang, Andrew, and Joseph Chen, 2001, Asymmetric correlation of equity portfolios, EFA
[5] Arce, Oscar, Sergio Mayordomo and Juan Ignacio Pena, 2011, Credit-risk valuation in the sovereignCDS and bonds markets: Evidence from the euro area crisis, CNMV working paper
[6] Augustin, Patrick, 2012, Sovereign credit default swap premia, Working paper, Stockholm School ofEconomics
[7] Baker, Scott R., Nicholas Bloom, and Steven J. Davis, 2011, Measuring economic policy uncertainty,Working paper, Stanford University.
[8] Bielecki, Thomas R., and M. Rutkowski, 2002, Credit Risk: Modelling, Valuation and Hedging (Springer-Verlag, Berlin)
[9] Black, Fischer and Piotr Karasinski, 1991, Bond and option pricing when short rates are lognormal,Financial Analysts Journal, Vol. 47, No. 4, pp. 52-59
[10] Boero, Gianna, Jeremy Smith, and Kenneth F. Wallis, 2008, Uncertainty and Disagreement in EconomicPrediction: The Bank of England Survey of External Forecasters, Economic Journal 118, 1107�1127
[11] Bomberger, W. A. 1996, Disagreement as a Measure of Uncertainty, Journal of Money, Credit andBanking, Vol. 28, No. 3, pp. 381-392
[12] Brutti, Filippo and Sauré, Philip U., 2012, Transmission of Sovereign Risk in the Euro Crisis, Workingpaper
[13] Chen, Ren-Raw, and Louis Scott, 1993, Maximum likelihood estimation for a multifactor equilibriummodel of the term structure of interest rates, Journal of Fixed Income 3, 14-31
[14] Coudert V., M. Gex, 2010, Credit Default Swap and Bond Markets: Which Leads The Other? FinancialStability Review, Financial Stability Review, Banque de France
[15] Dieckmann, Stephan and Thomas Plank, 2009, Default Risk of Advanced Economies: An EmpiricalAnalysis of Credit Default Swaps during the Financial Crisis, working paper, Wharton School of Business,University of Pennsylvania
[16] Du¤ee R. Gregory, 2002, Term premia and interest rate forecasts in a¢ ne models, The Journal ofFinance, Vol. 57, pp. 405-443
[17] Du¢ e, Darrel, 1998, Credit swap valuation, Stanford University
[18] Du¢ e, Darrel, and K. Singleton, 1999, Modeling Term Structures of Defaultable Bonds, Review ofFinancial Studies, 12, 687�720
[19] Du¢ e, Darrell, and Kenneth J. Singleton, 2003, Credit Risk: Pricing, Measurement, and Management(Princeton University Press, Princeton , NJ )
[20] Du¤y, D. 2001 Robust and Accurate Finite Di¤erence Methods in Option Pricing: One Factor Models,working report Datasim www.datasim-component.com
31

[21] Johansen, Søren, 1991, Estimation and Hypothesis Testing of Cointegration Vectors in Gaussian VectorAutoregressive Models, Econometrica 59 (6): 1551�1580.
[22] Lahiri, Kajal, and Xuguang Sheng, 2010, Measuring forecast uncertainty by disagreement: The missinglink, Journal of Applied Econometrics, Vol. 25, Issue 4, pp. 514-538
[23] Longsta¤ F.A., E.S. Schwartz, 1992, Interest rate volatility and the term structure: A two-factor generalequilibrium model, Journal of Finance, 47, pp. 1259�1282
[24] Longsta¤, Francis A., Jun Pan, Lasse H. Pedersen, and Kenneth J. Singleton, 2011, How Sovereign IsSovereign Credit Risk?, American Economic Journal : Macroeconomics, 3(2): 75�103
[25] Love, Inessa, and Lea Ziccino, 2006, Financial Development and Dynamic Investment Behavior: evidencefrom Panel VAR, The Quarterly Review of Economics and Finance, 46, 190-210.
[26] Pan, Jun, and Kenneth J. Singleton, 2008, Default and recovery implicit in the term structure of sovereignCDS spreads, Journal of Finance, Vol. 63, No. 5
[27] Pastor, Lubos and Pietro Veronesi Pietro, 2011a, Uncertainty about government policy and stock prices,forthcoming The Journal of Finance
[28] Pastor, Lubos and Pietro Veronesi, 2011b, Political Uncertainty and Risk Premia, Working paper, Uni-versity of Chicago
[29] Sgherri, Silvia, and Edda Zoli, 2009, Euro Area Sovereign Risk During the Crisis, IMF Working Papers09/222, International Monetary Fund
[30] Stock, James H., and Mark W. Watson, 2001, Vector autoregressions, The Journal of Economic Per-spectives 15.4: 101-115.
[31] Ulrich, Maxim, 2011, How does the bond market perceive government interventions?, Working paper,Columbia University
[32] Yu, Fan, 2002, Modeling expected return on defaultable bonds, Journal of Fixed Income 2, 69�81
32

Mean Median Std Dev Min MaxAustria 71.6 68 46.3 4 269Belgium 95.0 82.5 65.6 8 339Estonia 178.8 114.5 152.5 45 736Finland 35.8 30 21.9 4 92France 58.9 53 38.2 5 199German 32.3 31 17.7 4 91Greece 1391.3 291 2742.1 14 23572Ireland 335.7 224 267.5 11 1263Italy 172.9 137 121.4 15 502
Latvia 364.2 269 225.7 87 1161Lithuania 275.5 239 153.0 48 849
Netherlands 43.0 37 27.0 4 130Norway 21.0 18 11.5 3 64Poland 145.7 134 71.1 20 419Portugal 389.2 278 387.1 13 1554Romania 304.6 277 131.4 68 771Spain 176.1 165.5 114.1 13 504
Sweden 39.8 36.5 28.9 5 158UK 62.4 65 30.3 5 165
Pol Index 143.7 145.4 28.7 78.8 213.5
Table 1: The table reports summary statistics of 5-year Credit Default Swap spreads of 19 European countriesover the daily period from December 2007 to Janury 2013. The last row reports summary statistics of themonthly policy-related uncertainty index.
Full Sample (PanelA)Italy PortugalSpain Ireland GreeceBelgium Norway
Finland Germany Estonia PolandAustria UK Latvia RomaniaFrance Sweden LithuaniaNethercoph corr: 0.91
Before May 2010 (PanelB) After May 2010 (PanelC)Finland Austria Ireland Italy Italy GreeceNether Sweden Belgium Spain SpainFrance Greece Portugal NorwayGermany Portugal IrelandNorway Estonia Poland Austria Germany Estonia Poland
Latvia Romania UK Nether Latvia RomaniaUK Lithuania France Sweden Lithuania
Belgium Finlandcoph corr: 0.89 coph corr: 0.89
Table 2: Cluster Analysis�outcome applied on the correlation matrix of daily changes of 5-year CDS spreadsover the full sample (Panel A) and two sub samples (Panel B and C). The method (Complete) and thedistance (Euclidean) are selected to the extent that the cophenetic correlation (coph corr) is the highest.
33

Panel A Panel BEurope19 Peripheral Core Eastern% of Var Total % of Var Total % of Var Total % of Var Total
First 72.5408 72.54 76.3721 76.37 81.7923 81.79 88.938 88.94Second 6.7968 79.34 8.6969 85.07 5.1029 86.90 4.1697 93.11Third 4.6732 84.01 6.1548 91.22 4.2056 91.10 2.9927 96.10Fourth 2.6429 86.65 4.7432 95.97 2.8614 93.96 2.8152 98.92Fifth 2.3833 89.04 2.2405 98.21 2.0703 96.03 1.0846 100.00
Panel CPolIndex MSCI V 2X iTraxx PEDax V IX IGCDX TED Gold
Europe19 3.47** -11.3*** 2.20*** 4.30*** -2.10** 2.20*** 4.75*** 1.08** 4.74[2.34] [-7.14] [3.04] [4.80] [-2.35] [3.01] [4.71] [2.01] [1.61]
Periphery 1.04* -2.79*** 0.62** 1.43*** -0.53 0.39 1.36*** 0.33 0.71[1.69] [-3.46] [2.02] [3.69] [-1.41] [1.24] [3.05] [1.50] [0.58]
Core 2.69** -8.77*** 1.63*** 3.21*** -1.74** 1.61*** 3.56*** 0.71 3.64[2.25] [-6.68] [2.76] [4.35] [-2.44] [2.72] [4.30] [1.62] [1.54]
Eastern 1.99** -7.32*** 1.44*** 2.52*** -1.09* 1.71*** 3.04*** 0.87** 3.43*[2.13] [-7.60] [3.20] [4.39] [-1.92] [3.92] [4.87] [2.64] [1.89]
Table 3: Principal Component Analysis performed on the correlation matrix of monthly log-changes of 5-year CDS spread for the whole set of countries (Europe19) and for Core (Austria, Finland, France, Germany,Netherlands, Norway, Sweden, UK), Peripheral (Belgium, Greece, Ireland, Italy, Portugal, Spain) and EasternEconomies (Estonia, Latvia, Lithuania, Poland, Romania) over the period December 3, 2007 to January 22,2013. The subtable in the bottom reports the univariate regressions (with a constant) of the �rst-di¤erencesof the �rst PCs for each cluster on the Policy-related uncertainty index (PolIndex), the MSCI Global EquityIndex (MSCI), the Eurostoxx50 implied volatility (V2X), the iTraxx Euro CDX (iTraxx), the PE ratio of theDax Index (PE), the VIX, the IG CDX, the TED spread and the Gold price . First PCs are in �rst di¤erenceswheras the variables are in log-di¤erences. t-Stats in brackets. Level of signi�cance: 1***, 5** and 10* percent.
34

��QtkQ�Q kQ �P kP � (1) � (3) � (7) avg llk
AUT 0.99 5.96 -0.76 -2.42 0.23 0.04366 0.00004 0.00004 9.25(0.004) (0.0081) (0.0004) (0.0044) (0.0004) (0.0002) (0.000001) (0.000001)
BEL 1.21 1.29 -0.94 -3.24 0.11 0.07236 0.00031 0.00054 6.91(0.0171) (0.0122) (0.0024) (0.0072) (0.0013) (0.0001) (0.000006) (0.000014)
EST 0.5 -0.38 -1.02 -4.68 0.3 0.00367 0.00067 0.00096 6.74(0.009) (0.0245) (0.0075) (0.011) (0.0022) (0.000079) (0.000015) (0.000022)
FIN 0.72 5.08 -0.47 -2.57 0.28 0.00002 0.00003 0.00007 10.89(0.0037) (0.0054) (0.0004) (0.0056) (0.0005) (0.000519) (0.000002) (0.00009)
FRA 0.5 5.88 -0.67 -2.15 0.2 0.0639 0.00004 0.00007 9.22(0.0035) (0.0096) (0.0003) (0.0073) (0.0007) (0.000082) (0.000001) (0.000003)
GER 0.64 5.51 -0.56 -2.39 0.23 0.0515 0.00002 0.00002 9.87(0.0023) (0.0052) (0.0002) (0.0055) (0.0005) (0.000042) (0.000521) (0.000001)
GRE 1.03 -2.96 0.07 -3.13 0.07 0.00333 0.00014 0.00083 7.92(0.0157) (0.0015) (0.0004) (0.0017) (0.0004) (0.000092) (0.000004) (0.001032)
IRL 0.84 -0.69 -0.1 -6.91 0.71 0.00027 0.00017 0.00014 9(0.0144) (0.0093) (0.0015) (0.0083) (0.001) (0.000006) (0.000004) (0.000003)
ITA 1.09 5.56 -0.64 -2.13 0.25 0.00015 0.00017 0.00015 9.08(0.0029) (0.0076) (0.0008) (0.0043) (0.0005) (0.000003) (0.000006) (0.000006)
LAT 0.36 4.04 -0.95 -2.34 0.11 0.0007 0.001 0.0001 8.65(0.0059) (0.0133) (0.0023) (0.0055) (0.0007) (0.000014) (0.000002) (0.000003)
LTU 0.42 5.23 -1.05 -2.44 0.13 0.15222 0.00011 0.00008 8.28(0.0053) (0.0119) (0.0015) (0.0054) (0.0007) (0.000018) (0.000003) (0.000002)
NED 0.52 5.74 -0.57 -2.06 0.22 0.03743 0.00003 0.00003 9.69(0.0012) (0.0051) (0.0004) (0.0046) (0.0004) (0.000038) (0.000001) (0.000001)
NOR 0.41 4.96 -0.55 -1.82 0.24 0.04472 0.0001 0.00013 8.35(0.0027) (0.0063) (0.0004) (0.0034) (0.0003) (0.000003) (0.000003) (0.000003)
POL 0.26 5.63 -0.87 -2.53 0.36 0.03299 0.00075 0.00071 6.55(0.0025) (0.0114) (0.0012) (0.0052) (0.0007) (0.000423) (0.000017) (0.000015)
POR 0.79 -2.67 0.01 -2.86 0.03 0.00084 0.00039 0.00001 9.61(0.0046) (0.0009) (0.0002) (0.001) (0.0002) (0.000018) (0.000417) (0.000265)
ROU 1.16 -0.1 -0.27 -2.29 0.04 0.00044 0.00005 0.00013 8.91(0.008) (0.0036) (0.0007) (0.0033) (0.0004) (0.000011) (0.000001) (0.000005)
ESP 0.64 -0.21 0.01 -0.26 0.02 0.00063 0.00013 0.00003 8.26(0.0008) (0.0001) (0.00002) (0.0001) (0.00002) (0.000112) (0.000003) (0.000001)
SWE 0.54 6.18 -0.64 -2.28 0.22 0.04432 0.00002 0.00003 9.69(0.0013) (0.0042) (0.0004) (0.0067) (0.0006) (0.000006) (0.000001) (0.000001)
GBR 0.67 -1.61 0.23 -1.71 0.24 0.0001 0.00006 0.00004 9.54(0.0025) (0.0005) (0.0006) (0.0005) (0.0000) (0.000003) (0.000002) (0.000001)
Table 4: Calibration of the Pan and Singleton (2008) model for daily 5-year CDS spreads according to a quasimaximum likelihood method (Q-MLE). Numerical standard errors in parenthesis and average log-likelihoods(avg llk). The estimation is performed on the entire term-structure of 1-, 3-, 5- and 7-year CDS spreadscovering the daily period December 3, 2007 to Janury 22, 2013.
35

Panel A Panel BCredit Risk Premium Default Risk Credit Risk Premium (%)
Mean Std Dev Median Mean Std Dev Median Mean Std Dev Median34.1 22.8 32.1 37.5 23.5 36.1 Austria 47.1 1.0 47.041.5 28.4 35.9 53.5 37.2 46.2 Belgium 44.2 1.3 43.866.1 49.5 45.6 112.8 103.0 69.2 Estonia 38.9 2.5 39.618.4 11.8 15.2 17.4 10.1 15.0 Finland 50.4 1.9 50.628.3 17.8 25.9 30.7 20.3 27.4 France 48.6 1.1 48.510.6 6.4 9.7 21.7 11.3 21.1 Germany 31.6 2.1 31.6257.3 577.8 55.0 1142.1 2193.5 236.6 Greece 19.0 1.5 18.9303.3 251.4 196.2 32.4 16.3 27.7 Ireland 83.9 11.7 87.660.4 46.3 45.9 112.5 75.1 91.0 Italy 33.0 3.1 33.5110.5 68.0 83.2 253.7 158.0 186.6 Latvia 30.4 1.4 30.3103.7 53.6 91.8 171.9 99.5 147.1 Lithuania 38.3 1.5 38.48.5 9.7 4.8 34.5 17.8 32.3 Netherlands 14.4 9.0 12.813.0 7.2 11.1 8.0 4.3 6.9 Norway 61.5 0.6 61.765.0 32.6 59.5 80.7 38.6 75.0 Poland 44.3 1.0 44.499.7 93.3 75.1 289.5 293.8 201.5 Portugal 28.8 3.9 27.3125.5 49.4 116.0 179.1 82.1 161.2 Romania 41.7 1.3 41.868.5 44.2 63.8 107.6 69.9 101.6 Spain 39.1 0.7 39.019.3 13.4 17.9 20.6 15.5 18.6 Sweden 49.4 1.6 49.20.3 0.2 0.3 29.2 14.3 30.3 UK 53.2 0.5 53.275.5 72.8 51.8 144.0 172.9 80.6 mean 42.0 2.5 42.0
Table 5: Descriptive statistics of the two components (Panel A) embedded in the 5-year CDS spreads. Theestimation is performed on a daily basis with the Q-MLE method over the period December 3, 2007 toJanuary 22, 2013. The data are in basis points. Panel B reports the Credit Risk Premia as a percentage ofthe observed 5-year CDS spread.
36

(1) (2) (3) (4) (5) (6) (7)� lnCRPt � lnCRPt � lnCRPt � lnCRPt � lnCRPt � lnCRPt � lnCRPt
� lnPolIdxt 0.740*** 0.432** 0.320* 0.304* 0.279 0.513*** 0.452**[3.65] [2.48] [1.77] [1.71] [1.58] [2.77] [2.38]
� lnPolIdxt�1 0.791*** 0.367** 0.321* 0.320* 0.336* 0.268 0.318*[3.79] [2.38] [1.93] [1.91] [2.00] [1.47] [1.84]
� lnStockt -1.241*** -0.950*** -0.939*** -0.946*** -0.504**[-5.50] [-3.64] [-3.70] [-3.69] [-2.15]
� lnV 2Xt 0.0843 -0.0115 -0.0131 -0.00679 0.265[0.91] [-0.12] [-0.13] [-0.07] [1.57]
� ln iT raxxt 0.437*** 0.415** 0.399** 0.317[2.75] [2.55] [2.47] [0.95]
� lnPEEuro50t -0.0882[-0.84]
� lnPEDaxt -0.151*** -0.119***[-2.72] [-3.08]
� lnMSCIt -1.453*** -1.132***[-5.79] [-4.22]
� lnV IXt -0.201 -0.477**[-1.50] [-2.29]
� ln IGCDXt 0.246 -0.0981[1.60] [-0.28]
� lnTEDt 0.0663 0.0401[1.07] [0.64]
� lnGoldt 0.247 0.369[0.82] [1.19]
cons 0.005 0.0006 0.0002 0.0009 0.0007 -0.002 -0.009[0.16] [0.02] [0.01] [0.04] [0.03] [-0.09] [-0.37]
N 1129 1129 1129 1129 1129 1129 1129R2 0.193 0.307 0.350 0.352 0.361 0.379 0.408
Table 6: Credit Risk Premium: Panel regressions of CRP on the policy-related uncertainty index (PolIdx), thedomestic stock markets (Stock), the Eurostoxx50 and S&P500 implied volatility (V2X and VIX), the iTraxxEuro CDX and IG US CDX (iTraxx and IGCDX), the price-earning ratio of Eurostoxx50 and Dax Indices(PEdax and PEEuro50), the MSCI Global Equity Index (MSCI), the TED spread (TED) and the gold price(Gold). Tha variables are in log-di¤erences. Country �xed e¤ect included. Monthly sample period December3, 2007 to January 22, 2013. t-Stats in brackets, and errors clustered across time. Level of signi�cance: 1***,5** and 10* per cent.
37

(1) (2) (3) (4) (5) (6) (7)� lnDRPt � lnDRPt � lnDRPt � lnDRPt � lnDRPt � lnDRPt � lnDRPt
� lnPolIdxt 0.682*** 0.418*** 0.307* 0.291* 0.268* 0.465*** 0.404**[3.79] [2.75] [1.95] [1.90] [1.76] [3.01] [2.48]
� lnPolIdxt�1 0.730*** 0.355** 0.310** 0.309* 0.324** 0.253 0.294*[3.99] [2.51] [2.01] [1.98] [2.07] [1.54] [1.83]
� lnStockt -1.130*** -0.844*** -0.833*** -0.840*** -0.428**[-5.73] [-3.99] [-4.09] [-4.08] [-2.66]
� lnV 2Xt 0.0610 -0.0335 -0.0351 -0.0289 0.167[0.75] [-0.39] [-0.40] [-0.33] [1.13]
� ln iT raxxt 0.431*** 0.409*** 0.394*** 0.300[3.06] [2.83] [2.76] [0.99]
� lnPEEuro50t -0.0870[-0.87]
� lnPEDaxt -0.146*** -0.117***[-2.83] [-3.44]
� lnMSCIt -1.280*** -1.002***[-5.59] [-4.26]
� lnV IXt -0.184 -0.360**[-1.63] [-2.04]
� ln IGCDXt 0.260* -0.0676[1.92] [-0.21]
� lnTEDt 0.0631 0.0362[1.13] [0.62]
� lnGoldt 0.229 0.327[0.87] [1.19]
cons 0.005 0.0007 0.0002 0.001 0.0007 -0.001 -0.007[0.16] [0.03] [0.01] [0.04] [0.03] [-0.05] [-0.29]
N 1129 1129 1129 1129 1129 1129 1129R2 0.227 0.351 0.408 0.411 0.422 0.442 0.469
Table 7: Default Risk: Panel regressions of DRP on the policy-related uncertainty index (PolIdx), the domesticstock markets (Stock), the Eurostoxx50 and S&P500 implied volatility (V2X and VIX), the iTraxx Euro CDXand IG US CDX (iTraxx and IGCDX), the price-earning ratio of Eurostoxx50 and Dax Indices (PEdax andPEEuro50), the MSCI Global Equity Index (MSCI), the TED spread (TED) and the gold price (Gold). Thavariables are in log-di¤erences. Country �xed e¤ect included. Monthly sample period December 3, 2007 toJanuary 22, 2013. t-Stats in brackets and errors clustered across time. Level of signi�cance: 1***, 5** and10* per cent.
38

Panel A: Credit Risk Premium� lnPolIdxt�1 � lnPolIdxt�2 � lnPolIdxt�3 � lnCRPt�1 � lnCRPt�2 � lnCRPt�3
� lnCRPt 0.827*** 0.752** 0.836 -0.06 -0.00 -0.34[5.865] [2.375] [0.691] [-0.49] [-0.00] [-0.88]
� lnPolIdxt -0.15** 0.102 0.472 -0.06 0.047 -0.11[-2.49] [0.843] [0.997] [-1.42] [0.933] [-0.78]
Panel B : Default Risk� lnPolIdxt�1 � lnPolIdxt�2 � lnPolIdxt�3 � lnDRPt�1 � lnDRPt�2 � lnDRPt�3
� lnDRPt 0.759*** 0.433 -0.88 -0.13 0.157 0.274[7.21] [1.56] [-1.07] [-1.05] [0.85] [1.23]
� lnPolIdxt -0.17*** 0.100 0.446 -0.04 0.022 -0.10[-3.27] [0.99] [1.33] [-1.10] [0.42] [-1.07]
Table 8: Panel Vector Autoregressive approach: bivariate VAR(3) with Credit Risk Premium and Politi-cal uncertainty (Panel A) and Default Risk and Political uncertainty (Panel B). Tha variables are in log-di¤erences. Country �xed e¤ect included. Monthly sample period December 3, 2007 to January 22, 2013.t-Stats in brackets. Level of signi�cance: 1***, 5** and 10* per cent.
39

PolIdxt�1
PolIdxt�2
PolIdxt�3
CRPt�1
CRPt�2
CRPt�3
Stockt
VIXt
iTraxxt
PEDax
tTEDt
Goldt
cons
R2
AUT
0.44
0.65**
0.48*
0.03
0.03
-0.04
-1.211*
0.08
0.16
-0.18**
0.042
0.665
-0.01
.63
BEL
0.30
0.51**
0.16
0.06
-0.12
0.04
-1.25***
-0.23
0.58***
-0.23**
-0.014
0.592
-0.01
.59
EST
0.35**
0.30*
0.04
-0.01
0.07
0.05
-0.04
0.20***
0.31**
0.01
0.097*
0.274
-0.02
.64
FIN
-0.01
0.45*
0.39*
0.14
-0.05
-0.04
-1.34**
0.04
0.23
-0.23***
0.014
0.466
-0.01
.58
FRA
0.43**
0.48**
0.19
-0.14
0.03
-0.10
-2.11***
-0.11
0.30
-0.27**
0.028
0.386
0.01
.62
GER
0.36
0.80**
0.44
-0.03
-0.26**
0.00
-1.83**
-0.07
0.41
-0.26**
-0.009
0.631
0.01
.44
GRE
0.63*
0.43
0.23
-0.34
-0.03
0.03
-0.58
-0.33
0.79**
-0.19
-0.036
0.096
0.10**
.43
IRL
0.31
0.45*
0.14
-0.03
0.10
0.06
-1.16*
-0.19
0.50
-0.12
-0.017
0.318
0.01
.39
ITA
0.63***
0.65***
0.32
-0.14
0.08
-0.23***
-1.15***
-0.15
0.53***
-0.20**
-0.009
0.348
0.01
.70
LAT
0.15
0.29
0.17
0.07
-0.13
0.02
-0.58**
0.29***
0.22
-0.06
0.013
-0.110
-0.02
.63
LTU
0.25
0.28*
0.06
0.06
0.08
0.04
0.09
0.23**
0.33**
-0.01
0.093
0.061
-0.01
.60
NED
0.88
1.90***
1.19
-0.17
0.03
-0.04
-4.11***
-0.39
0.57
-0.17
0.030
0.285
-0.01
.41
NOR
0.60**
0.52**
-0.03
0.09
0.04
-0.04
-0.26
0.22
0.39
-0.15*
-0.075
0.593
0.00
.56
POL
0.23
0.52**
0.07
-0.15
0.05
-0.09
-1.08**
0.09
0.62***
-0.12**
-0.016
0.022
0.00
.68
POR
0.34
0.07
-0.29
0.02
-0.15
0.16
-0.68
-0.24*
0.54***
-0.31*
-0.025
0.273
0.02
.46
ROU
0.20
0.56***
0.23
-0.05
-0.07
-0.10
-0.45
0.20*
0.19
-0.01
0.052
0.027
-0.01
.64
ESP
0.52***
0.37**
0.27
-0.15
-0.11
-0.16
-1.45***
-0.19
0.20
-0.21**
-0.024
0.645*
0.02
.59
SWE
0.55**
0.95***
0.51**
0.08
-0.18
-0.01
-1.71**
-0.22
0.47**
-0.15*
-0.009
0.193
0.00
.61
GBR
0.39
0.53**
0.63**
-0.06
-0.07
-0.01
-1.75
-0.19
0.31
-0.13
-0.023
0.360
0.01
.47
Table9a:VectorAutoregressive:-CreditRiskPremiumasDependent-bivariateVAR(3)withCreditRiskPremiumandPoliticaluncertainty.The
variablesareinlog-di¤erences.MonthlysampleperiodDecember3,2007toJanuary22,2013.t-Statsarenotreportedandrobuststandarderrors.
Levelofsigni�cance:1***,5**and10*percent.
PolIdxt�1
PolIdxt�2
PolIdxt�3
CRPt�1
CRPt�2
CRPt�3
Stockt
VIXt
iTraxxt
PEDax
tTEDt
Goldt
cons
R2
AUT
-0.26*
0.12
-0.06
-0.05
0.11**
0.04
0.44
0.32***
0.23
-0.058*
0.07
-0.19
0.02
.54
BEL
-0.35***
0.08
0.05
-0.06
0.04
0.04
0.20
0.25**
0.17
-0.04
0.08
-0.05
0.02
.47
EST
-0.43***
0.00
-0.07
0.03
0.14
0.06
0.22
0.24***
0.19
-0.04
0.08
-0.05
0.02
.49
FIN
-0.35***
-0.04
0.00
-0.07
0.16**
-0.01
0.17
0.29***
0.17
-0.02
0.07
-0.19
0.02
.52
FRA
-0.29**
0.01
-0.09
-0.14**
0.17**
0.03
0.05
0.26***
0.23*
-0.03
0.04
-0.24
0.02
.57
GER
-0.42***
-0.02
-0.03
0.02
0.04
0.05
0.19
0.25**
0.16
-0.05
0.07
-0.04
0.02
.47
GRE
-0.30**
0.10
0.07
-0.02
0.05
-0.04
0.28
0.22**
0.19
-0.05
0.10
-0.20
0.03
.52
IRL
-0.28**
0.08
0.02
-0.09
0.14**
-0.01
0.32
0.30***
0.16
-0.03
0.07
0.02
0.02
.56
ITA
-0.38***
0.02
-0.03
-0.08
0.12*
0.04
0.24
0.27***
0.27**
-0.02
0.06
-0.17
0.02
.53
LAT
-0.50***
-0.08
-0.10
0.10
0.11
0.13*
0.10
0.21***
0.19
-0.060**
0.10
-0.04
0.02
.51
LTU
-0.40***
0.09
-0.01
0.05
0.14
0.05
0.37**
0.28***
0.14
-0.051*
0.10*
-0.14
0.02
.51
NED
-0.33***
0.07
0.04
-0.04
0.04
0.00
0.11
0.30***
0.15
-0.03
0.04
-0.13
0.02
.49
NOR
-0.32**
0.07
-0.02
-0.11
0.11*
0.06
0.00
0.23***
0.15
-0.04
0.08
-0.09
0.02
.52
POL
-0.39***
-0.01
-0.09
0.02
0.09
0.07
0.48*
0.28***
0.23*
-0.069*
0.07
-0.05
0.02
.51
POR
-0.32**
0.11
-0.03
-0.07
0.08
0.03
0.77**
0.29***
0.33**
-0.03
0.06
-0.01
0.02
.56
ROU
-0.36**
0.04
-0.03
0.01
0.12
0.05
0.29
0.26***
0.19
-0.03
0.10
-0.01
0.02
.49
ESP
-0.33***
0.13
-0.01
-0.15**
0.05
0.10*
0.21
0.21***
0.29**
-0.03
0.08
-0.17
0.02
.54
SWE
-0.41***
-0.03
-0.05
-0.01
0.10
0.02
0.30
0.29**
0.18
-0.05
0.08
-0.14
0.02
.49
GBR
-0.31***
0.02
-0.05
-0.09
0.16*
0.03
0.51
0.31***
0.19
-0.01
0.08
-0.03
0.02
.53
Table9b:VectorAutoregressive:-PoliticalUncertaintyIndexasDependent-bivariateVAR(3)withCreditRiskPremiumandPoliticaluncertainty.
Thevariablesareinlog-di¤erences.MonthlysampleperiodDecember3,2007toJanuary22,2013.t-Statsarenotreportedandrobuststandard
errors.Levelofsigni�cance:1***,5**and10*percent.
40

PolIdxt�1
PolIdxt�2
PolIdxt�3
DRPt�1
DRPt�2
DRPt�3
Stockt
VIXt
iTraxxt
PEDax
tTEDt
Goldt
cons
R2
AUT
0.52*
0.70**
0.42
0.05
0.05
-0.07
-1.13**
0.17
0.02
-0.15**
0.08
0.56
-0.01
.62
BEL
0.36
0.53**
0.15
0.04
-0.11
0.03
-0.92**
-0.16
0.45*
-0.26***
0.06
0.76
-0.01
.56
EST
0.33
0.34
0.08
-0.14
0.11
-0.01
-0.83
0.14
0.12
0.05
0.17**
0.29
-0.03
.64
FIN
-0.10
0.28
0.42**
0.14
-0.02
-0.11
-1.14***
0.07
0.07
-0.17***
0.10
0.29
0.00
.57
FRA
0.41
0.35
0.12
-0.11
0.04
-0.08
-1.10***
0.09
0.33
-0.28**
0.05
0.51
0.02
.58
GER
0.35
0.59
0.33
-0.01
-0.19
-0.04
-0.76
0.14
0.25
-0.25**
-0.01
0.44
0.00
.40
GRE
0.64
0.54
0.29
-0.36*
-0.09
0.00
-0.74
-0.43
0.79*
-0.23
0.03
0.11
0.13***
.44
IRL
0.07
0.15
0.00
-0.07
0.18
0.01
-0.69**
-0.12
0.13
-0.02
0.02
0.20
0.00
.33
ITA
0.42**
0.52***
0.26
-0.12
0.04
-0.20***
-0.76**
-0.13
0.52***
-0.18**
0.01
0.31
0.02
.64
LAT
0.15
0.23
0.09
0.15
-0.05
0.04
-0.69*
0.15
0.07
-0.05
0.06
-0.30
-0.02
.62
LTU
0.15
0.19
0.06
-0.06
0.13
-0.04
-0.81*
0.16
0.14
0.02
0.145*
0.08
-0.01
.61
NED
0.49
0.46
0.29
-0.10
0.01
-0.03
-0.63
0.05
0.54*
-0.08
-0.05
0.64
0.00
.49
NOR
0.51**
0.43*
-0.01
0.02
0.10
-0.10
-0.87*
0.15
0.19
-0.11
-0.02
0.56
-0.01
.59
POL
0.20
0.50**
0.02
-0.18
0.06
-0.08
-0.94**
0.08
0.45**
-0.12**
0.02
0.02
-0.01
.65
POR
0.33
0.04
-0.36
-0.01
-0.19
0.16
-0.80
-0.35*
0.59**
-0.40**
0.01
0.37
0.03
.47
ROU
0.17
0.64***
0.24
-0.09
-0.03
-0.11
-0.92*
0.17
0.04
0.02
0.15
0.09
-0.01
.63
ESP
0.43*
0.27
0.12
-0.13
-0.16
-0.13
-0.81*
-0.16
0.36*
-0.24*
-0.01
0.48
0.03
.51
SWE
0.58*
0.76**
0.49*
0.12
-0.17
-0.08
-1.18***
-0.07
0.24
-0.18*
0.05
0.09
-0.01
.59
GBR
0.23
0.31
0.616**
-0.10
-0.03
-0.11
-1.48**
-0.10
0.00
-0.07
0.10
0.28
0.01
.51
Table10a:VectorAutoregressive:-DefaultRiskasDependent-bivariateVAR(3)withDefaultRiskandPoliticaluncertainty.Thevariablesare
inlog-di¤erences.MonthlysampleperiodDecember3,2007toJanuary22,2013.t-Statsarenotreportedandrobuststandarderrors.Levelof
signi�cance:1***,5**and10*percent.
PolIdxt�1
PolIdxt�2
PolIdxt�3
DRPt�1
DRPt�2
DRPt�3
Stockt
VIXt
iTraxxt
PEDax
tTEDt
Goldt
cons
R2
AUT
-0.26**
0.10
-0.06
-0.06
0.11**
0.067*
0.56**
0.31***
0.30**
-0.074*
0.05
-0.19
0.02
.57
BEL
-0.29**
0.13
0.04
-0.03
0.02
0.06
0.47*
0.28***
0.26*
-0.05
0.05
-0.07
0.02
.51
EST
-0.32***
0.04
-0.08
0.05
0.05
0.12**
0.66**
0.29***
0.34**
-0.085*
0.04
-0.05
0.02
.53
FIN
-0.29**
0.03
-0.03
-0.05
0.153*
0.04
0.48*
0.32***
0.26**
-0.04
0.05
-0.15
0.02
.55
FRA
-0.23*
0.07
-0.08
-0.12**
0.14**
0.04
0.33
0.29***
0.29**
-0.04
0.03
-0.22
0.02
.59
GER
-0.32**
0.06
-0.04
0.03
0.03
0.085*
0.56**
0.29***
0.28**
-0.068*
0.04
0.00
0.02
.52
GRE
-0.27*
0.11
0.04
-0.03
0.05
-0.02
0.41
0.27***
0.22
-0.05
0.07
-0.17
0.02
.52
IRL
-0.29**
0.11
0.06
-0.15
0.18*
0.01
0.34
0.28***
0.20*
-0.05
0.06
-0.04
0.02
.53
ITA
-0.29**
0.08
-0.04
-0.09
0.15*
0.07
0.50**
0.31***
0.33**
-0.03
0.04
-0.18
0.02
.56
LAT
-0.34***
-0.02
-0.09
0.17*
0.02
0.21**
0.75**
0.30***
0.36**
-0.098***
0.06
-0.12
0.026*
.58
LTU
-0.32**
0.05
-0.05
0.05
0.04
0.11
0.62**
0.29***
0.32**
-0.07**
0.05
-0.06
0.02
.52
NED
-0.25*
0.10
-0.09
-0.03
0.08
0.11**
0.59**
0.31***
0.31**
-0.07
0.03
-0.02
0.02
.56
NOR
-0.28**
0.11
-0.03
-0.08
0.10
0.08
0.38
0.28***
0.24**
-0.06
0.06
-0.10
0.02
.54
POL
-0.34**
0.03
-0.07
0.03
0.07
0.09
0.58**
0.29***
0.31**
-0.074*
0.05
-0.05
0.02
.53
POR
-0.31***
0.11
0.02
-0.07
0.08
0.02
0.37
0.29***
0.23*
-0.03
0.05
-0.04
0.02
.52
ROU
-0.30**
0.08
-0.02
0.01
0.06
0.07
0.55**
0.29***
0.28**
-0.06
0.06
-0.05
0.02
.51
ESP
-0.28**
0.17
0.02
-0.13**
0.04
0.10**
0.36
0.23***
0.31**
-0.04
0.07
-0.13
0.02
.56
SWE
-0.31**
0.07
-0.07
0.00
0.09
0.075**
0.68**
0.33***
0.34**
-0.06
0.05
-0.16
0.02
.55
GBR
-0.26**
0.09
-0.04
-0.07
0.14
0.06
0.49
0.29***
0.29**
-0.03
0.05
-0.02
0.02
.56
Table10b:VectorAutoregressive:-PoliticalUncertaintyIndexasDependent-bivariateVAR(3)withDefaultRiskandPoliticaluncertainty.The
variablesareinlog-di¤erences.MonthlysampleperiodDecember3,2007toJanuary22,2013.t-Statsarenotreportedandrobuststandarderrors.
Levelofsigni�cance:1***,5**and10*percent.
41

Core Economies Peripheral Economies Eastern Economies(1a) (1b) (2a) (2b) (3a) (3b)
CRPCoret PolIdxt CRPPeripht PolIdxt CRPEastt PolIdxtCRPCoret�1 0.260*** -0.101CRPCoret�2 -0.101 0.171***CRPCoret�3 -0.0152 0.0532
CRPPeripht�1 -0.194** -0.119*CRPPeripht�2 0.0002 0.0627CRPPeripht�3 -0.0429 0.0692CRPEastt�1 -0.108 0.0860CRPEastt�2 -0.0681 0.0712CRPEastt�3 -0.0723 0.0915PolIdxt�1 -0.200 -0.357*** 0.352** -0.342*** 0.0692 -0.456***PolIdxt�2 0.0631 -0.0227 0.0349 0.0591 0.272** -0.0425PolIdxt�3 0.163 -0.112 -0.0986 -0.0320 0.194 -0.0974CRPCoret 0.627*** 0.136 0.436*** 0.0593
CRPPeripht 0.524*** 0.134* 0.0146 0.150CRPEastt 0.505*** 0.109 0.00852 0.112
Daxt -0.800* -0.570 1.601*** -0.155 -0.349 -0.438MSCIt 0.320 0.767*** -0.990*** 0.666** -0.340 0.950***V 2Xt 0.0869 -0.161 0.228 -0.144 -0.0193 -0.168
iT raxxt -0.266 0.483** 0.220 0.396** 0.132 0.365*PEDaxt -0.159** -0.00994 -0.0783 -0.00524 0.157** -0.0204V IXt -0.0640 0.432*** -0.348** 0.382*** 0.0876 0.457***
IGCDXt 0.190 -0.373* 0.101 -0.217 -0.176 -0.183TEDt 0.0144 0.0244 -0.00498 0.0295 0.0796 0.0300Goldt 0.222 -0.284 0.217 -0.173 0.0766 -0.135cons -0.00140 0.0183* 0.0221 0.0188 -0.0207* 0.0203*
N 58 58 58 58 58 58R2 0.865 0.645 0.776 0.585 0.774 0.578
Table 11: Vector Autoregressive approach on region level: bivariate VAR(3) with Credit Risk Premium andPolitical uncertainty. Variables: the policy-related uncertainty index (PolIdx), the domestic stock markets(Stock), the Eurostoxx50 and S&P500 implied volatility (V2X and VIX), the iTraxx Euro CDX and IG USCDX (iTraxx and IGCDX), the price-earning ratio of Eurostoxx50 and Dax Indices (PEdax and PEEuro50),the MSCI Global Equity Index (MSCI), the TED spread (TED) and the gold price (Gold). The variablesare in log-di¤erences. Core Economies are Austria, Finland, France, Germany, Netherlands, Norway, Swedenand UK; Peripheral Economies are Belgium, Greece, Ireland, Italy, Portugal and Spain; Eastern Economiesare Estonia, Latvia, Lithuania, Poland and Romania. Monthly sample period December 3, 2007 to January22, 2013. t-Stats are not reported and robust standard errors. Level of signi�cance: 1***, 5** and 10* percent.
42

Core Economies Peripheral Economies Eastern Economies(1a) (1b) (2a) (2b) (3a) (3b)
DRPCoret PolIdxt DRPPeripht PolIdxt DRPEastt PolIdxtDRPCoret�1 0.142 -0.0323DRPCoret�2 -0.188** 0.0968*DRPCoret�3 0.0282 0.0836*
DRPPeripht�1 -0.211** -0.178***DRPPeripht�2 -0.0644 0.0745DRPPeripht�3 -0.148** 0.0922*DRPEastt�1 -0.0666 0.0871DRPEastt�2 0.104 0.0457DRPEastt�3 -0.0515 0.109*PolIdxt�1 0.0407 -0.387*** 0.329** -0.349*** -0.0679 -0.448***PolIdxt�2 0.186 0.0483 0.147 0.124 0.0578 -0.0214PolIdxt�3 0.504*** -0.0943 -0.0664 -0.0801 -0.0150 -0.0759DRPCoret 0.380*** 0.0847 0.294*** -0.00158
DRPPeripht 0.600*** 0.135 0.178 0.198**DRPEastt 0.454*** 0.0381 0.254** 0.0617
Daxt -0.141 -0.452 -0.211 -0.563 -0.140 -0.388MSCIt 0.0562 0.817*** -0.439 0.578** -0.431 0.939***V 2Xt 0.274 -0.128 0.133 -0.156 -0.180 -0.143
iT raxxt -0.523 0.425** 0.689*** 0.600*** 0.00790 0.325PEDaxt -0.0725 -0.00714 -0.202*** -0.0164 0.131* -0.0231V IXt -0.278 0.395*** -0.368** 0.323** 0.357** 0.417***
IGCDXt 0.493 -0.217 -0.620** -0.376* -0.0213 -0.0927TEDt 0.0250 0.0313 -0.0565 0.0369 0.132** 0.0412Goldt 0.111 -0.159 0.433* -0.162 -0.193 -0.147cons 0.00135 0.0171 0.0229 0.0174 -0.0158 0.0198*
N 58 58 58 58 58 58R2 0.78 0.6 0.76 0.61 0.74 0.57
Table 12: Vector Autoregressive approach on region level: bivariate VAR(3) with Default Risk and Politicaluncertainty. Variables: the policy-related uncertainty index (PolIdx), the domestic stock markets (Stock),the Eurostoxx50 and S&P500 implied volatility (V2X and VIX), the iTraxx Euro CDX and IG US CDX(iTraxx and IGCDX), the price-earning ratio of Eurostoxx50 and Dax Indices (PEdax and PEEuro50), theMSCI Global Equity Index (MSCI), the TED spread (TED) and the gold price (Gold). The variables are inlog-di¤erences. Core Economies are Austria, Finland, France, Germany, Netherlands, Norway, Sweden andUK; Peripheral Economies are Belgium, Greece, Ireland, Italy, Portugal and Spain; Eastern Economies areEstonia, Latvia, Lithuania, Poland and Romania. Monthly sample period December 3, 2007 to January 22,2013. t-Stats are not reported and robust standard errors. Level of signi�cance: 1***, 5** and 10* per cent.
43
Related Documents