Political Incentives to Suppress Negative Financial Information: Evidence from China Joseph D. Piotroski T.J. Wong Tianyu Zhang Conference on Contemporary Issues of Firms and Institutions

Political Incentives to Suppress Negative Financial ...
Aug 20, 2015
Welcome message from author
This document is posted to help you gain knowledge. Please leave a comment to let me know what you think about it! Share it to your friends and learn new things together.
Transcript
Political Incentives to Suppress Negative Financial Information: Evidence from China
Joseph D. Piotroski
T.J. Wong
Tianyu Zhang
Conference on Contemporary Issues of Firms and Institutions

Financial Transparency in China
The “common consensus” is that Chinese firms suffer from poor corporate governance and weak corporate transparency.
For example, China ranked 2nd in terms of corporate opacity among a set of 40 developing economies (Gelos and Wei, 2005).
In terms of market-based measures of the information environment:
China ranked 2nd in terms of stock price synchronicity (Morck, Yeung and Yu, 2000)
Heightened degree of negative skewness in returns, consistent with the suppression of negative financial information / downside trading frictions.
In terms of financial reporting practices
Low levels of timely loss recognition (Ball, Robin and Wu, 2001).
Prevalence of propping activity among state-controlled firms (Jian and Wong, 2006)
Impact of Primitive Institutions on Financial Reporting Practices
Prior research shows that legal, political, financial, regulatory and cultural institutions exert strong pressures on economic behavior and outcomes.
Institutions associated with strong investor protections are associated with more favorable financial reporting practices
• Less earnings management (Leuz, Nanda and Wysocki, 2003)
• Greater corporate transparency (Bushman, Piotroski and Smith, 2004)
• Stronger timely loss recognition practices (Ball, Kothari and Robin, 2000)
• Greater earnings informativeness (Fan and Wong, 2002; DeFond Hung and Trezevant, 2004)
• Greater use of high quality auditor (Francis, Khurana and Pereira, 2003)
• Cross-country variation in financial reporting are driven by market demands and contracting-related forces.
However, other institutions in the economy can produce adverse incentives.
• One such potential institutional is the State’s control of economic assets.
Adverse Incentives Created by State Ownership of Firms
Economic policies of the State frequently reflect the desire of politicians to consolidate power and accumulate wealth (e.g., Lindbeck (1976); North (1990); Olson (1993))
• State controlled firms are not oriented towards maximizing firm value.• Politicians use their control to achieve political objectives or to maximize
their private benefits (e.g., Shleifer and Vishny, 1993; LaPorta et al., 2002; Rajan and Zingales, 2003).
• These objectives produce weak corporate governance practices and enormous inefficiencies among state firms (Shleifer and Vishny, 1997; OECD, 2005; Wurgler, 2000).
• Poor performance vs. non-state-owned firms; Inefficient investment behavior and asset management.
• Moreover, serious conflicts can arise between the State (as the controlling shareholder) and minority shareholders.
Research Question: Do political forces create adverse financial reporting incentives among publicly-traded state-controlled firms? And do these forces dominate traditional market demand and contracting-related incentives in certain settings?
Prior research: “Political Costs” and Financial Reporting Practices
Political forces are expected to shape the financial reporting incentives of non-state-controlled firms
• Watts and Zimmerman (1986): Accounting choices are influenced by the expected political costs of a given financial reporting outcome.
• Political costs include:• Heightened tax burdens (e.g., windfall profits tax).• Greater regulation.• Threat of greater government intervention into firm’s business activities.• Outright expropriation of productive assets.• And a host of other direct and indirect costs.
Prior cross-country research documents that political forces shape financial reporting practices among non-state-controlled firms.
• Bushman, Piotroski and Smith (2004); Bushman and Piotroski (2006); Leuz and Oberholzer (2007):
• Basic conclusions: As the likelihood of government intervention increases, firms have an incentive to reduce transparency and to tilt reported valuations to minimize these costs.

Prior research: “Political Costs” and Financial Reporting Practices
Minimal evidence on how political forces shape the financial reporting incentives and practices of state-controlled firms.
• Wang, Wong and Xia, 2006; Gul, 2006; Guedhami and Pittman, 2007: Examine the impact of political economy forces on audit choice and audit practices among newly privatized firms.
• Jain and Wong (2006) document the use of related party transactions that are designed to allow the listed firm to meet specific “bright line” profitability targets in the context of China.
In this paper, we examine the impact that political incentives have on the financial reporting practices of state-controlled entities.
Focus on one particular dimension: The incentive to release or suppress negative financial information in a timely manner.
Focus on one reporting environment: The People’s Republic of China
Motivation: Why China?
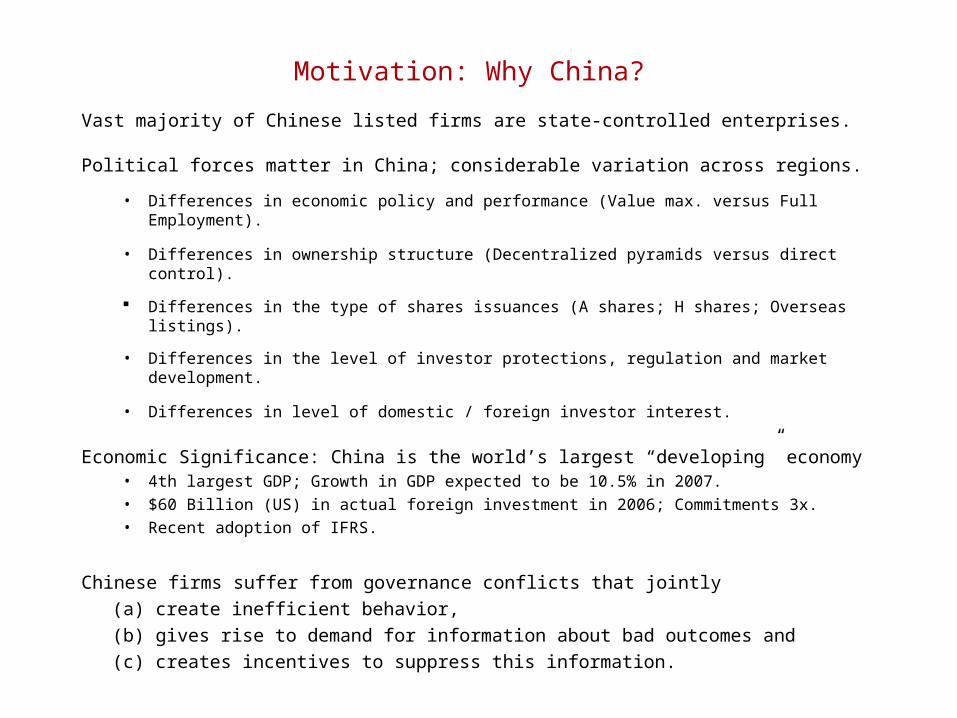
Vast majority of Chinese listed firms are state-controlled enterprises.
Political forces matter in China; considerable variation across regions.
• Differences in economic policy and performance (Value max. versus Full Employment).
• Differences in ownership structure (Decentralized pyramids versus direct control).
Differences in the type of shares issuances (A shares; H shares; Overseas listings).
• Differences in the level of investor protections, regulation and market development.
• Differences in level of domestic / foreign investor interest.
Economic Significance: China is the world’s largest “developing” economy• 4th largest GDP; Growth in GDP expected to be 10.5% in 2007.
• $60 Billion (US) in actual foreign investment in 2006; Commitments 3x.
• Recent adoption of IFRS.
Chinese firms suffer from governance conflicts that jointly
(a) create inefficient behavior,
(b) gives rise to demand for information about bad outcomes and
(c) creates incentives to suppress this information.
Incentives to Release Negative Financial Information in China
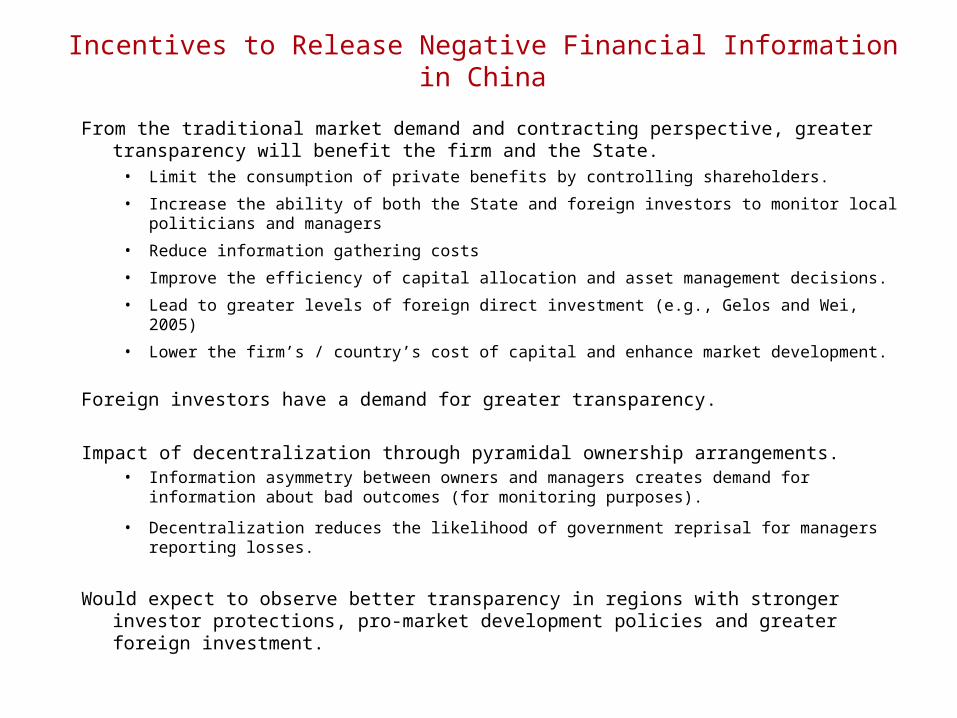
From the traditional market demand and contracting perspective, greater transparency will benefit the firm and the State.• Limit the consumption of private benefits by controlling shareholders.
• Increase the ability of both the State and foreign investors to monitor local politicians and managers
• Reduce information gathering costs
• Improve the efficiency of capital allocation and asset management decisions.
• Lead to greater levels of foreign direct investment (e.g., Gelos and Wei, 2005)
• Lower the firm’s / country’s cost of capital and enhance market development.
Foreign investors have a demand for greater transparency.
Impact of decentralization through pyramidal ownership arrangements. • Information asymmetry between owners and managers creates demand for information
about bad outcomes (for monitoring purposes).
• Decentralization reduces the likelihood of government reprisal for managers reporting losses.
Would expect to observe better transparency in regions with stronger investor protections, pro-market development policies and greater foreign investment.
Incentives to Suppress Negative Financial Information in China
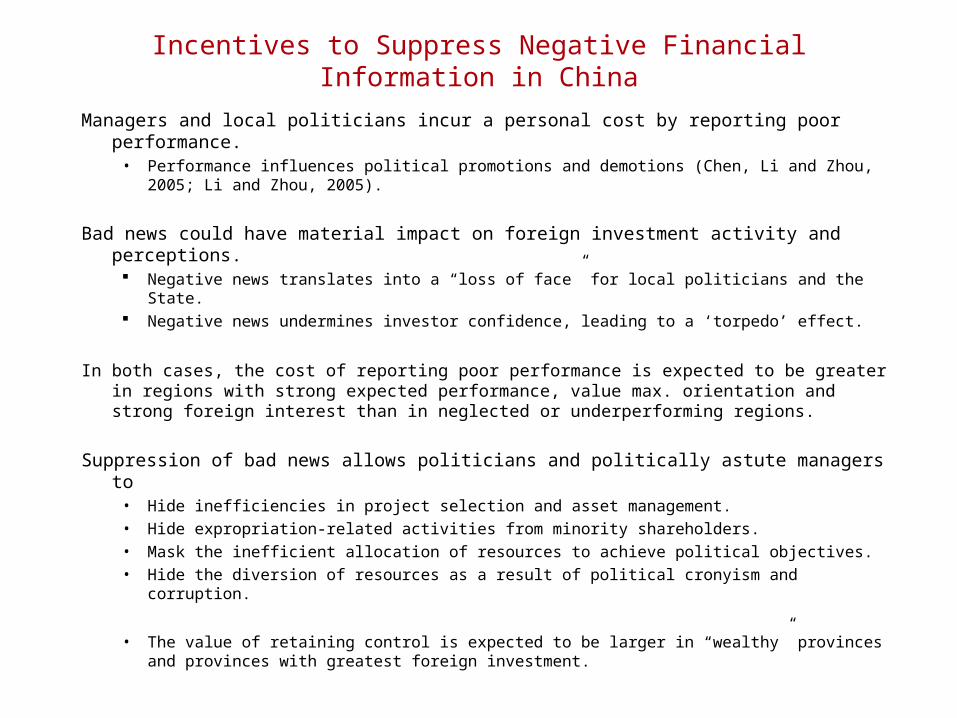
Managers and local politicians incur a personal cost by reporting poor performance.• Performance influences political promotions and demotions (Chen, Li and Zhou, 2005; Li
and Zhou, 2005).
Bad news could have material impact on foreign investment activity and perceptions. Negative news translates into a “loss of face” for local politicians and the State. Negative news undermines investor confidence, leading to a ‘torpedo’ effect.
In both cases, the cost of reporting poor performance is expected to be greater in regions with strong expected performance, value max. orientation and strong foreign interest than in neglected or underperforming regions.
Suppression of bad news allows politicians and politically astute managers to• Hide inefficiencies in project selection and asset management.
• Hide expropriation-related activities from minority shareholders.
• Mask the inefficient allocation of resources to achieve political objectives.
• Hide the diversion of resources as a result of political cronyism and corruption.
• The value of retaining control is expected to be larger in “wealthy” provinces and provinces with greatest foreign investment.
Strength of provincial-level legal and market-development institutions.
• Marketization index (Fan and Wang, 2001).
• Legal environment Index (Fan and Wang, 2001).
• Property rights protection index (Fan and Wang, 2001).
• Deregulation index (Demerger et al, 2002).
Provincial conditions and government policy incentives
• Unemployment rate in the region.
• Average return on equity for state-owned firms in the region.
• Average percentage of non-operating assets.
• R&D spending as a percentage of fiscal expenditures.
Incentives created by heightened foreign investment
• Provincial and Industry-level measures of foreign investment activity
• FDI / GDP each year.
• Foreign ownership (average percentage of foreign capital to total capital).
• Fixed asset investment: FDI / SOE
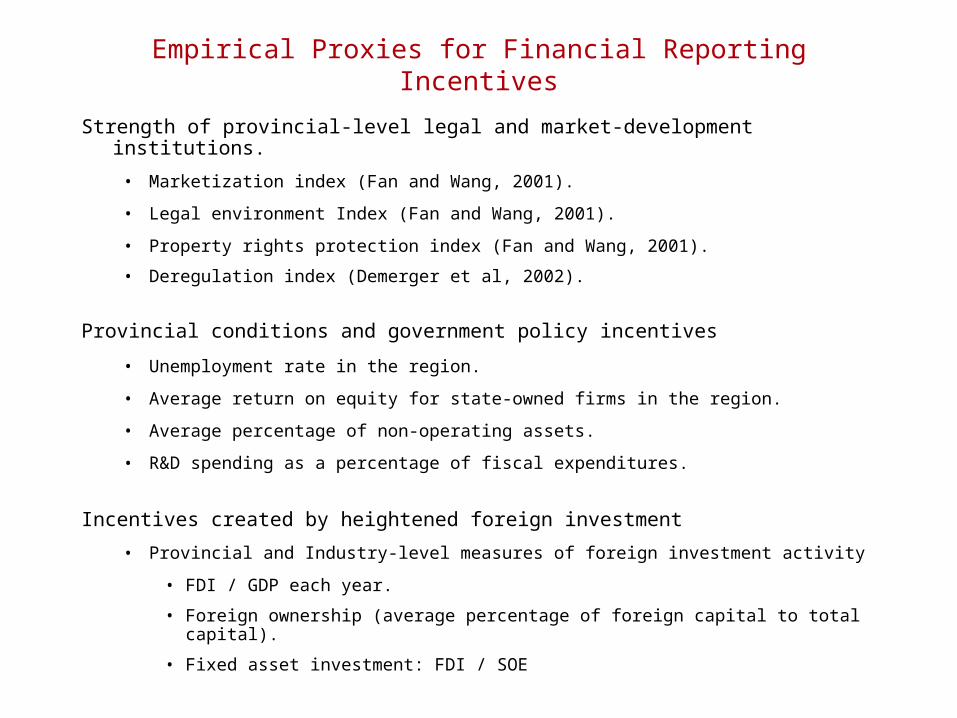
Empirical Proxies for Financial Reporting Incentives
Strength of provincial-level legal and market-development institutions.
• Marketization index (Fan and Wang, 2001).
• Legal environment Index (Fan and Wang, 2001).
• Property rights protection index (Fan and Wang, 2001).
• Deregulation index (Demerger et al, 2002).
Provincial conditions and government policy incentives
• Unemployment rate in the region.
• Average return on equity for state-owned firms in the region.
• Average percentage of non-operating assets.
• R&D spending as a percentage of fiscal expenditures.
Incentives created by heightened foreign investment
• Provincial and Industry-level measures of foreign investment activity
• FDI / GDP each year.
• Foreign ownership (average percentage of foreign capital to total capital).
• Fixed asset investment: FDI / SOE
Empirical Proxies for Financial Reporting Incentives
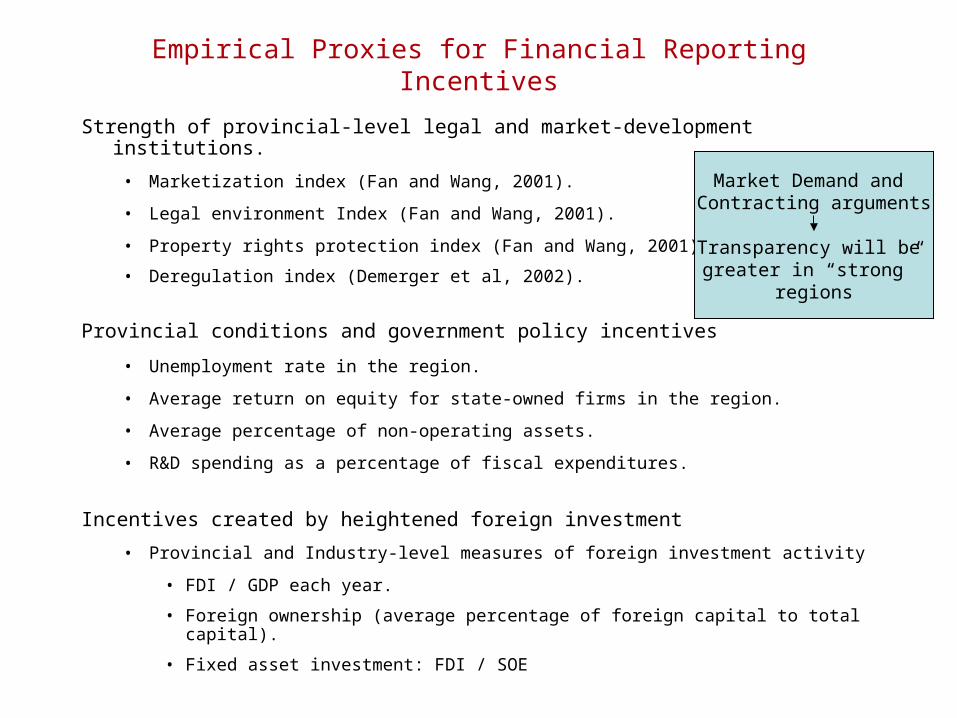
Market Demand and Contracting arguments
Transparency will be greater in “strong”
regions
Strength of provincial-level legal and market-development institutions.
• Marketization index (Fan and Wang, 2001).
• Legal environment Index (Fan and Wang, 2001).
• Property rights protection index (Fan and Wang, 2001).
• Deregulation index (Demerger et al, 2002).
Provincial conditions and government policy incentives
• Unemployment rate in the region.
• Average return on equity for state-owned firms in the region.
• Average percentage of non-operating assets.
• R&D spending as a percentage of fiscal expenditures.
Incentives created by heightened foreign investment
• Provincial and Industry-level measures of foreign investment activity
• FDI / GDP each year.
• Foreign ownership (average percentage of foreign capital to total capital).
• Fixed asset investment: FDI / SOE
Empirical Proxies for Financial Reporting Incentives
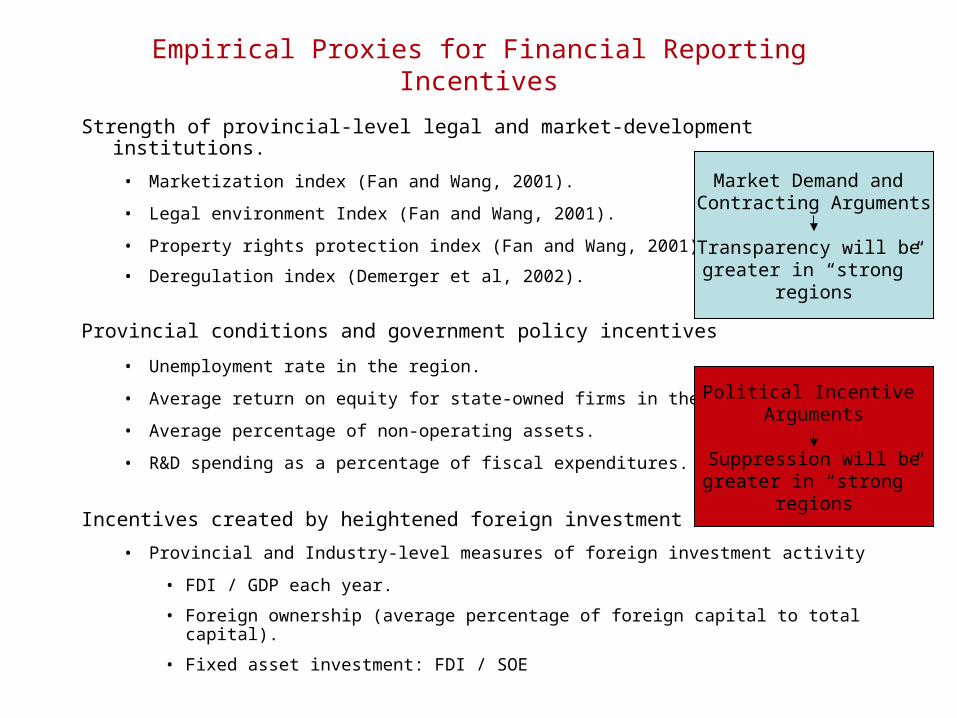
Market Demand and Contracting Arguments
Transparency will be greater in “strong”
regions
Political Incentive Arguments
Suppression will begreater in “strong”
regions
Anecdotal Evidence: Suppression of Bad News in China
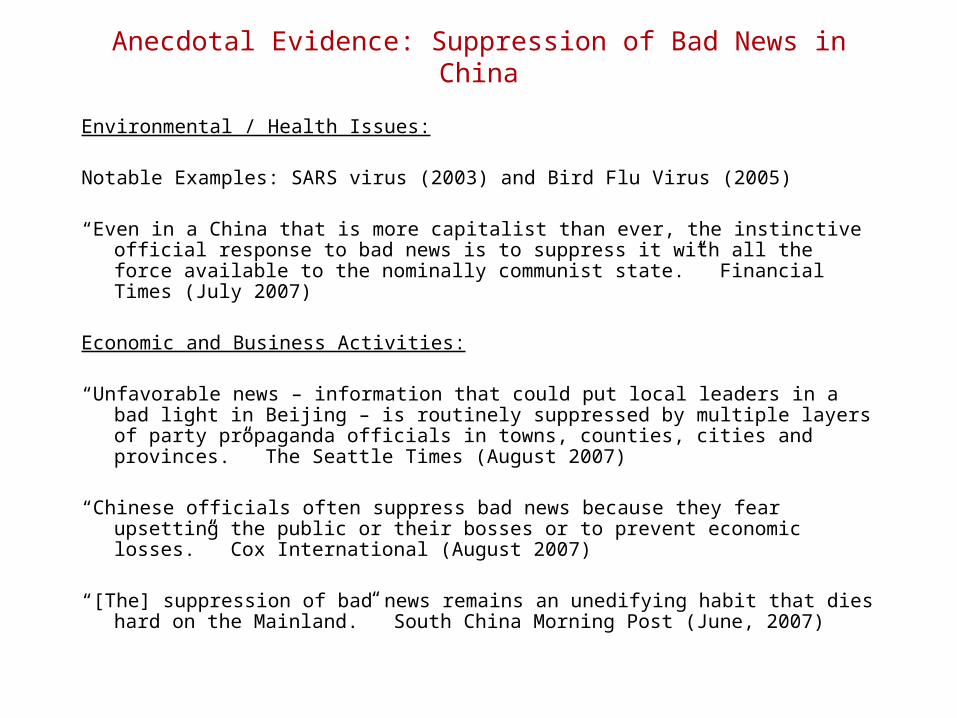
Environmental / Health Issues:
Notable Examples: SARS virus (2003) and Bird Flu Virus (2005)
“Even in a China that is more capitalist than ever, the instinctive official response to bad news is to suppress it with all the force available to the nominally communist state.” Financial Times (July 2007)
Economic and Business Activities:
“Unfavorable news – information that could put local leaders in a bad light in Beijing – is routinely suppressed by multiple layers of party propaganda officials in towns, counties, cities and provinces.” The Seattle Times (August 2007)
“Chinese officials often suppress bad news because they fear upsetting the public or their bosses or to prevent economic losses.” Cox International (August 2007)
“[The] suppression of bad news remains an unedifying habit that dies hard on the Mainland.” South China Morning Post (June, 2007)
Anecdotal Evidence: Suppression of Bad News in China
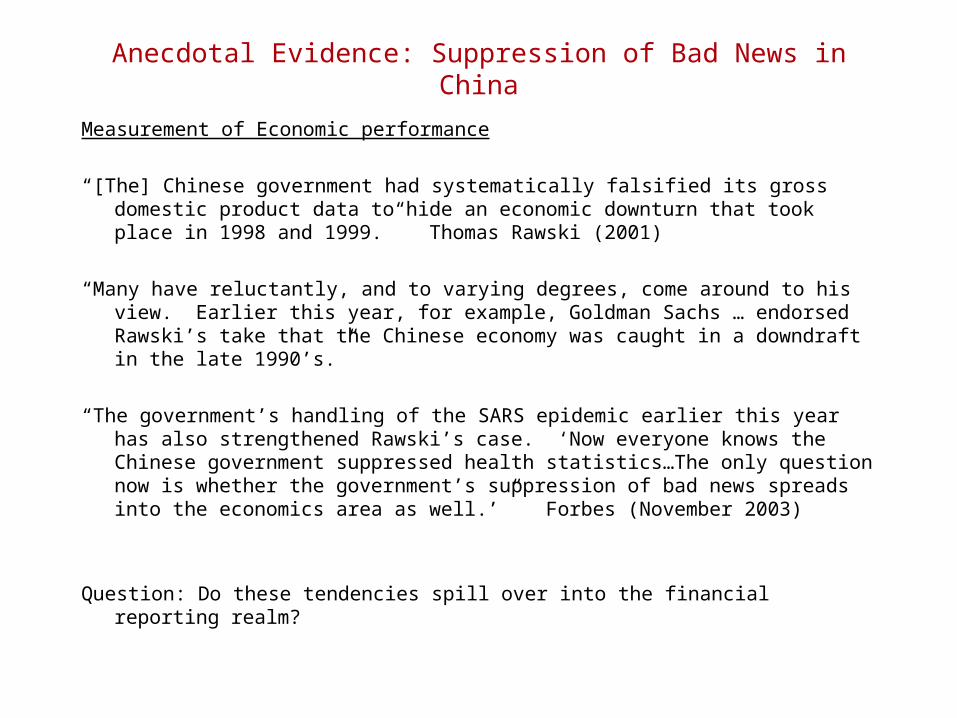
Measurement of Economic performance
“[The] Chinese government had systematically falsified its gross domestic product data to hide an economic downturn that took place in 1998 and 1999.” Thomas Rawski (2001)
“Many have reluctantly, and to varying degrees, come around to his view. Earlier this year, for example, Goldman Sachs … endorsed Rawski’s take that the Chinese economy was caught in a downdraft in the late 1990’s.”
“The government’s handling of the SARS epidemic earlier this year has also strengthened Rawski’s case. ‘Now everyone knows the Chinese government suppressed health statistics…The only question now is whether the government’s suppression of bad news spreads into the economics area as well.’” Forbes (November 2003)
Question: Do these tendencies spill over into the financial reporting realm?
Empirical Proxies for Suppression of Negative Financial Information: Stock price “crash” metrics
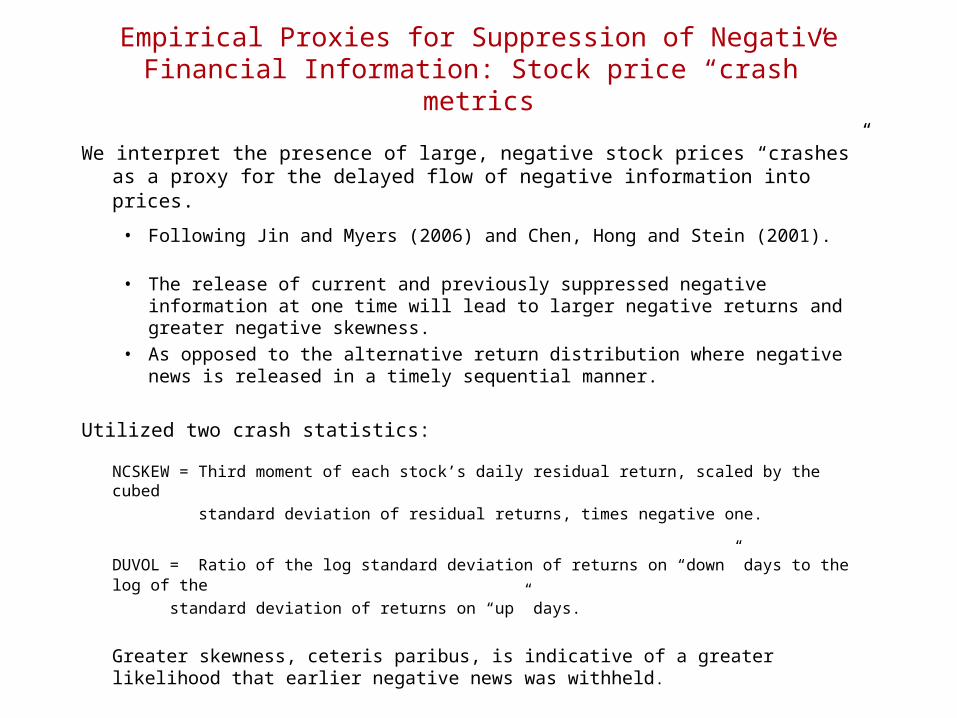
We interpret the presence of large, negative stock prices “crashes” as a proxy for the delayed flow of negative information into prices.
• Following Jin and Myers (2006) and Chen, Hong and Stein (2001).
• The release of current and previously suppressed negative information at one time will lead to larger negative returns and greater negative skewness.
• As opposed to the alternative return distribution where negative news is released in a timely sequential manner.
Utilized two crash statistics:
NCSKEW = Third moment of each stock’s daily residual return, scaled by the cubed
standard deviation of residual returns, times negative one.
DUVOL = Ratio of the log standard deviation of returns on “down” days to the log of the
standard deviation of returns on “up” days.
Greater skewness, ceteris paribus, is indicative of a greater likelihood that earlier negative news was withheld.
Empirical Proxies for Suppression of Negative Financial Information: Stock price “crash” metrics
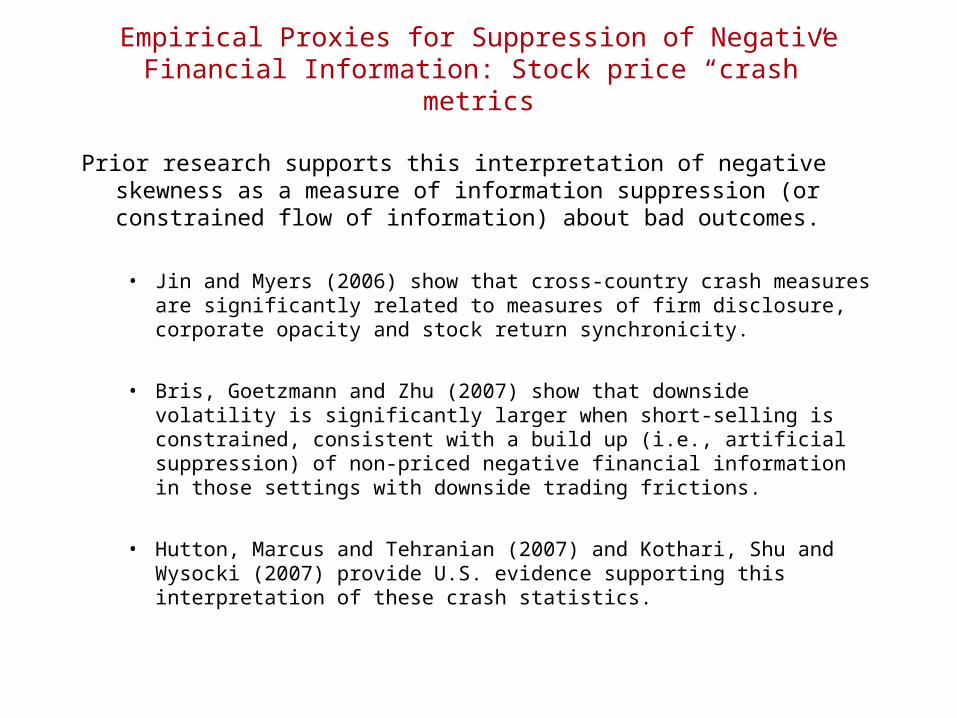
Prior research supports this interpretation of negative skewness as a measure of information suppression (or constrained flow of information) about bad outcomes.
• Jin and Myers (2006) show that cross-country crash measures are significantly related to measures of firm disclosure, corporate opacity and stock return synchronicity.
• Bris, Goetzmann and Zhu (2007) show that downside volatility is significantly larger when short-selling is constrained, consistent with a build up (i.e., artificial suppression) of non-priced negative financial information in those settings with downside trading frictions.
• Hutton, Marcus and Tehranian (2007) and Kothari, Shu and Wysocki (2007) provide U.S. evidence supporting this interpretation of these crash statistics.
Research Design: Stock price “crash” metrics
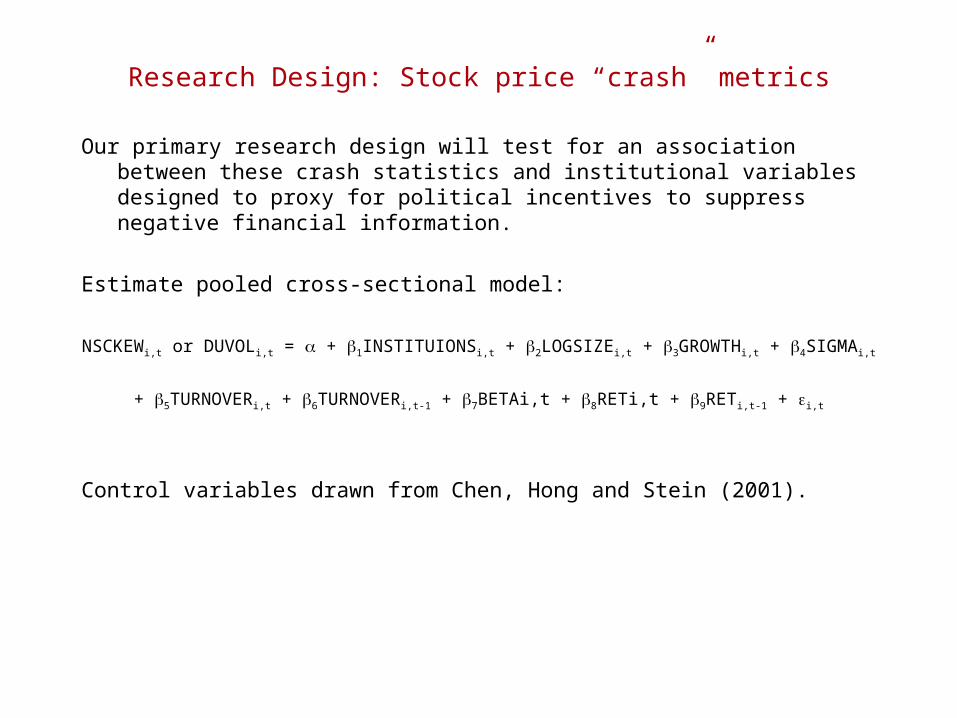
Our primary research design will test for an association between these crash statistics and institutional variables designed to proxy for political incentives to suppress negative financial information.
Estimate pooled cross-sectional model:
NSCKEWi,t or DUVOLi,t = + 1INSTITUIONSi,t + 2LOGSIZEi,t + 3GROWTHi,t + 4SIGMAi,t
+ 5TURNOVERi,t + 6TURNOVERi,t-1 + 7BETAi,t + 8RETi,t + 9RETi,t-1 + i,t
Control variables drawn from Chen, Hong and Stein (2001).
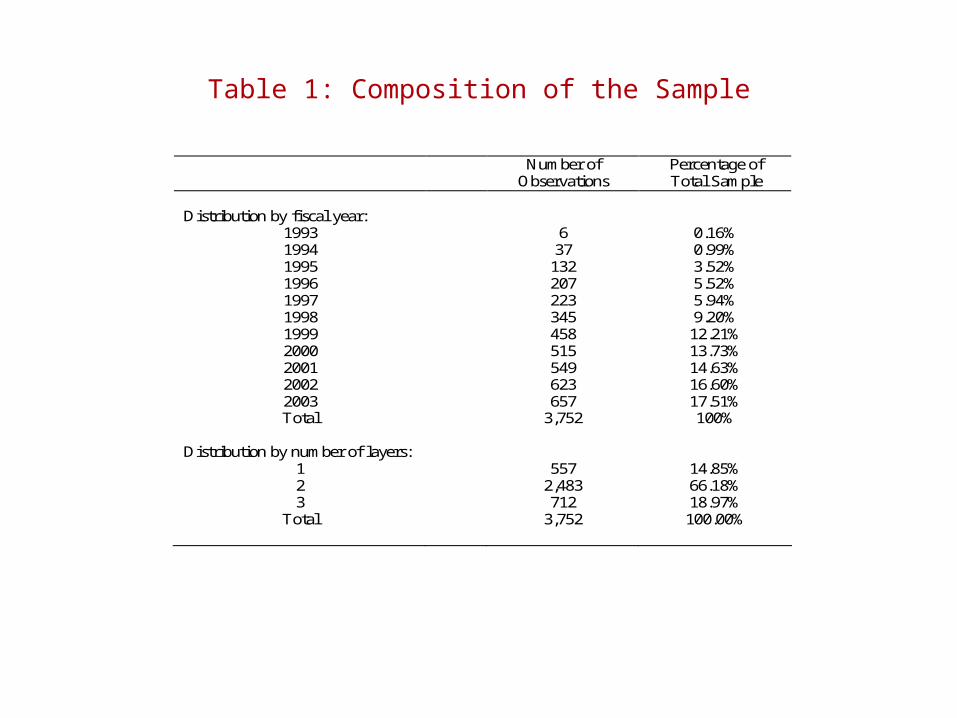
Table 1: Composition of the Sample
Number of
Observations Percentage of Total Sample
Distribution by fiscal year:
1993 6 0.16% 1994 37 0.99% 1995 132 3.52% 1996 207 5.52% 1997 223 5.94% 1998 345 9.20% 1999 458 12.21% 2000 515 13.73% 2001 549 14.63% 2002 623 16.60% 2003 657 17.51% Total 3,752 100%
Distribution by number of layers:
1 557 14.85% 2 2,483 66.18% 3 712 18.97%
Total 3,752 100.00%
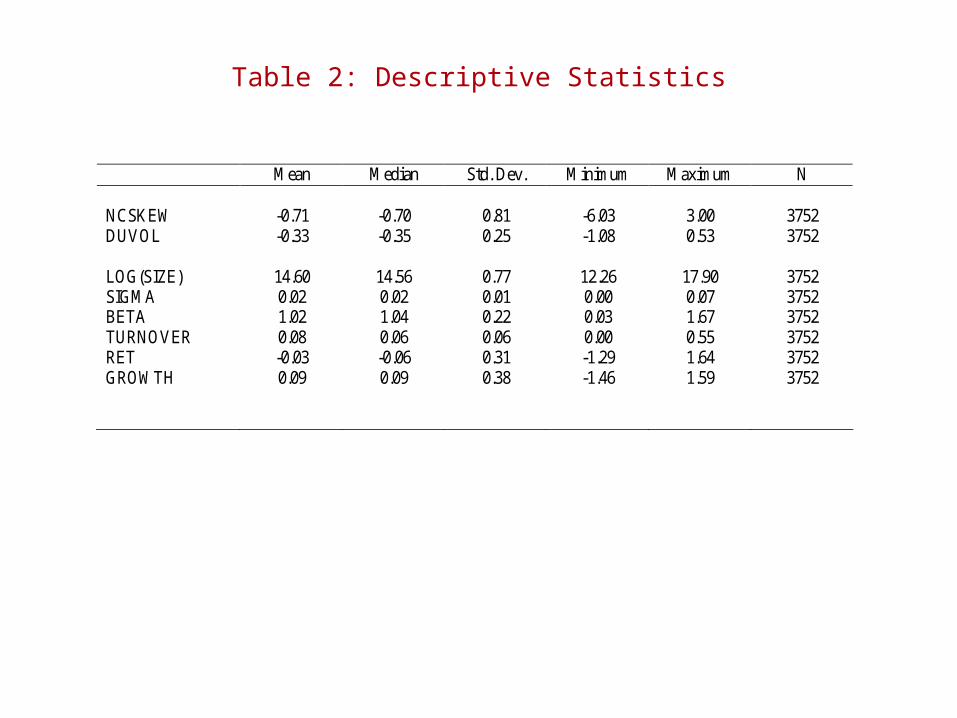
Table 2: Descriptive Statistics
Mean Median Std. Dev. Minimum Maximum N NCSKEW -0.71 -0.70 0.81 -6.03 3.00 3752 DUVOL -0.33 -0.35 0.25 -1.08 0.53 3752 LOG(SIZE) 14.60 14.56 0.77 12.26 17.90 3752 SIGMA 0.02 0.02 0.01 0.00 0.07 3752 BETA 1.02 1.04 0.22 0.03 1.67 3752 TURNOVER 0.08 0.06 0.06 0.00 0.55 3752 RET -0.03 -0.06 0.31 -1.29 1.64 3752 GROWTH 0.09 0.09 0.38 -1.46 1.59 3752
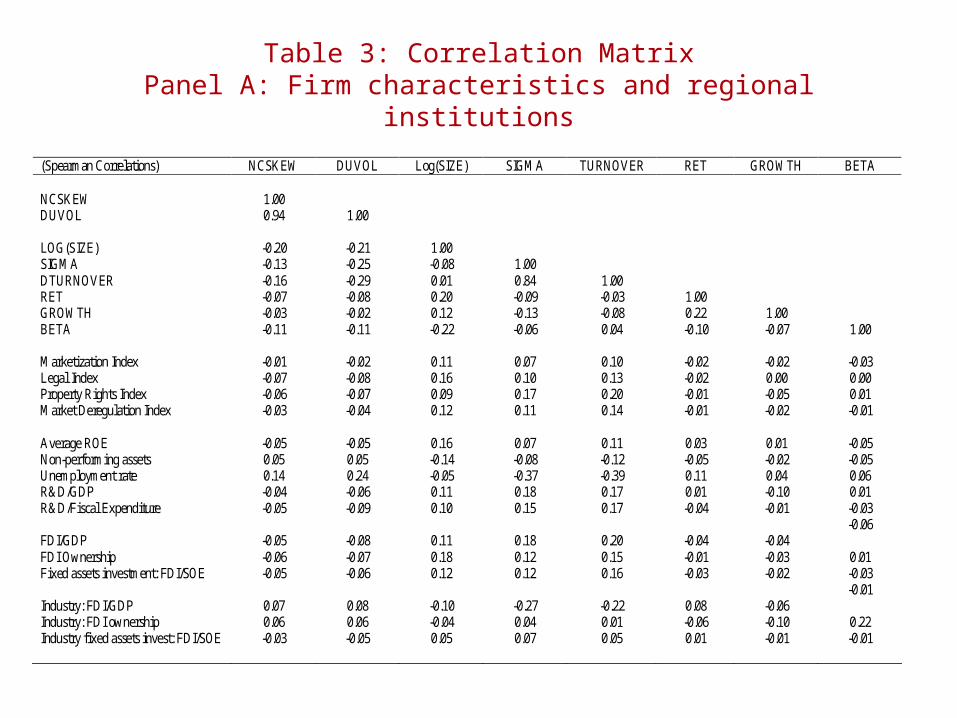
Table 3: Correlation MatrixPanel A: Firm characteristics and regional institutions
(Spearman Correlations) NCSKEW DUVOL Log(SIZE) SIGMA TURNOVER RET GROWTH BETA NCSKEW 1.00 DUVOL 0.94 1.00 LOG(SIZE) -0.20 -0.21 1.00 SIGMA -0.13 -0.25 -0.08 1.00 DTURNOVER -0.16 -0.29 0.01 0.84 1.00 RET -0.07 -0.08 0.20 -0.09 -0.03 1.00 GROWTH -0.03 -0.02 0.12 -0.13 -0.08 0.22 1.00 BETA -0.11 -0.11 -0.22 -0.06 0.04 -0.10 -0.07 1.00 Marketization Index -0.01 -0.02 0.11 0.07 0.10 -0.02 -0.02 -0.03 Legal Index -0.07 -0.08 0.16 0.10 0.13 -0.02 0.00 0.00 Property Rights Index -0.06 -0.07 0.09 0.17 0.20 -0.01 -0.05 0.01 Market Deregulation Index -0.03 -0.04 0.12 0.11 0.14 -0.01 -0.02 -0.01 Average ROE -0.05 -0.05 0.16 0.07 0.11 0.03 0.01 -0.05 Non-performing assets 0.05 0.05 -0.14 -0.08 -0.12 -0.05 -0.02 -0.05 Unemployment rate 0.14 0.24 -0.05 -0.37 -0.39 0.11 0.04 0.06 R&D/GDP -0.04 -0.06 0.11 0.18 0.17 0.01 -0.10 0.01 R&D/Fiscal Expenditure -0.05 -0.09 0.10 0.15 0.17 -0.04 -0.01 -0.03 -0.06 FDI/GDP -0.05 -0.08 0.11 0.18 0.20 -0.04 -0.04 FDI Ownership -0.06 -0.07 0.18 0.12 0.15 -0.01 -0.03 0.01 Fixed assets investment: FDI/SOE -0.05 -0.06 0.12 0.12 0.16 -0.03 -0.02 -0.03 -0.01 Industry: FDI/GDP 0.07 0.08 -0.10 -0.27 -0.22 0.08 -0.06 Industry: FDI ownership 0.06 0.06 -0.04 0.04 0.01 -0.06 -0.10 0.22 Industry fixed assets invest: FDI/SOE -0.03 -0.05 0.05 0.07 0.05 0.01 -0.01 -0.01
Market Index
Legal Index
Property Rights Index
Market Dereg. Index
Aver. ROE
Non- Performing
Assets
Unempl. Rate
R&D/
GDP
R&D/ Fiscal
Expend.
FDI /
GDP
FDI Owner.
Fixed Asset Invest
Industry FDI/GDP
Industry FDI
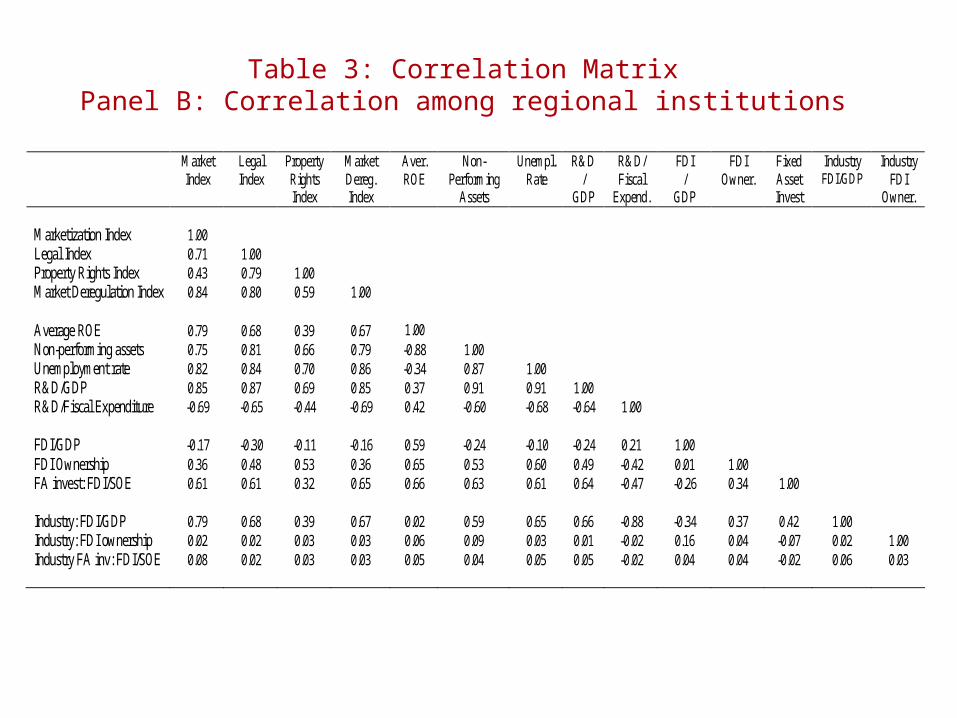
Owner. Marketization Index 1.00 Legal Index 0.71 1.00 Property Rights Index 0.43 0.79 1.00 Market Deregulation Index 0.84 0.80 0.59 1.00 Average ROE 0.79 0.68 0.39 0.67 1.00 Non-performing assets 0.75 0.81 0.66 0.79 -0.88 1.00 Unemployment rate 0.82 0.84 0.70 0.86 -0.34 0.87 1.00 R&D/GDP 0.85 0.87 0.69 0.85 0.37 0.91 0.91 1.00 R&D/Fiscal Expenditure -0.69 -0.65 -0.44 -0.69 0.42 -0.60 -0.68 -0.64 1.00 FDI/GDP -0.17 -0.30 -0.11 -0.16 0.59 -0.24 -0.10 -0.24 0.21 1.00 FDI Ownership 0.36 0.48 0.53 0.36 0.65 0.53 0.60 0.49 -0.42 0.01 1.00 FA invest: FDI/SOE 0.61 0.61 0.32 0.65 0.66 0.63 0.61 0.64 -0.47 -0.26 0.34 1.00 Industry: FDI/GDP 0.79 0.68 0.39 0.67 0.02 0.59 0.65 0.66 -0.88 -0.34 0.37 0.42 1.00 Industry: FDI ownership 0.02 0.02 0.03 0.03 0.06 0.09 0.03 0.01 -0.02 0.16 0.04 -0.07 0.02 1.00 Industry FA inv: FDI/SOE 0.08 0.02 0.03 0.03 0.05 0.04 0.05 0.05 -0.02 0.04 0.04 -0.02 0.06 0.03
Table 3: Correlation MatrixPanel B: Correlation among regional institutions
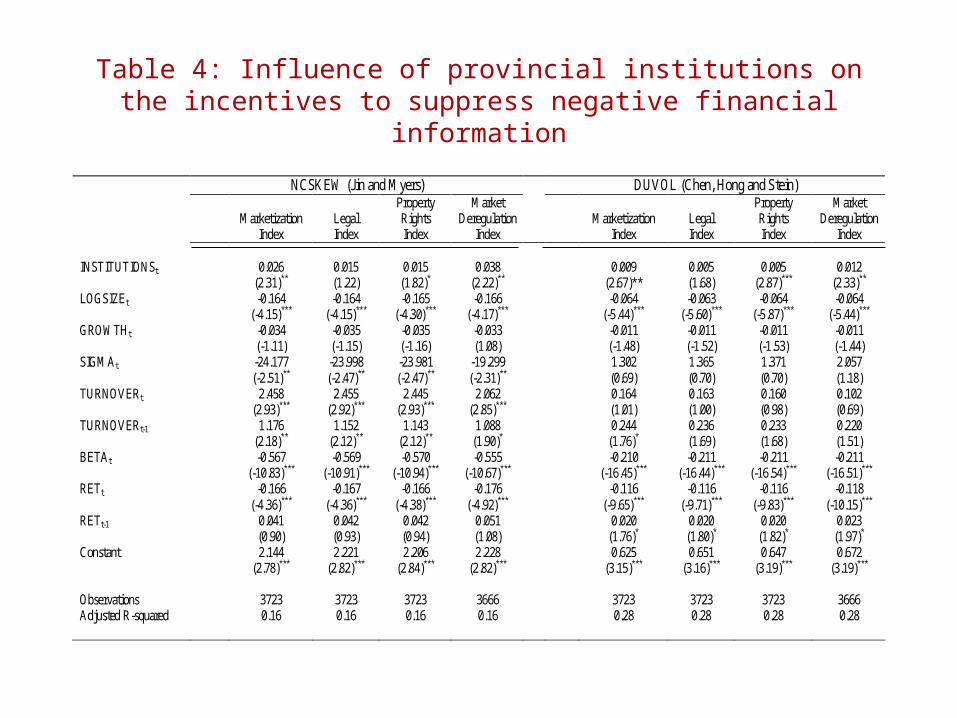
Table 4: Influence of provincial institutions on the incentives to suppress negative financial information
NCSKEW (Jin and Myers) DUVOL (Chen, Hong and Stein)
Marketization Index
Legal Index
Property Rights Index
Market Deregulation
Index
Marketization
Index
Legal Index
Property Rights Index
Market Deregulation
Index INSTITUTIONSt 0.026 0.015 0.015 0.038 0.009 0.005 0.005 0.012 (2.31)** (1.22) (1.82)* (2.22)** (2.67)** (1.68) (2.87)*** (2.33)** LOGSIZEt -0.164 -0.164 -0.165 -0.166 -0.064 -0.063 -0.064 -0.064 (-4.15)*** (-4.15)*** (-4.30)*** (-4.17)*** (-5.44)*** (-5.60)*** (-5.87)*** (-5.44)*** GROWTHt -0.034 -0.035 -0.035 -0.033 -0.011 -0.011 -0.011 -0.011 (-1.11) (-1.15) (-1.16) (1.08) (-1.48) (-1.52) (-1.53) (-1.44) SIGMAt -24.177 -23.998 -23.981 -19.299 1.302 1.365 1.371 2.057 (-2.51)** (-2.47)** (-2.47)** (-2.31)** (0.69) (0.70) (0.70) (1.18) TURNOVERt 2.458 2.455 2.445 2.062 0.164 0.163 0.160 0.102 (2.93)*** (2.92)*** (2.93)*** (2.85)*** (1.01) (1.00) (0.98) (0.69) TURNOVERt-1 1.176 1.152 1.143 1.088 0.244 0.236 0.233 0.220 (2.18)** (2.12)** (2.12)** (1.90)* (1.76)* (1.69) (1.68) (1.51) BETAt -0.567 -0.569 -0.570 -0.555 -0.210 -0.211 -0.211 -0.211 (-10.83)*** (-10.91)*** (-10.94)*** (-10.67)*** (-16.45)*** (-16.44)*** (-16.54)*** (-16.51)*** RETt -0.166 -0.167 -0.166 -0.176 -0.116 -0.116 -0.116 -0.118 (-4.36)*** (-4.36)*** (-4.38)*** (-4.92)*** (-9.65)*** (-9.71)*** (-9.83)*** (-10.15)*** RETt-1 0.041 0.042 0.042 0.051 0.020 0.020 0.020 0.023 (0.90) (0.93) (0.94) (1.08) (1.76)* (1.80)* (1.82)* (1.97)* Constant 2.144 2.221 2.206 2.228 0.625 0.651 0.647 0.672 (2.78)*** (2.82)*** (2.84)*** (2.82)*** (3.15)*** (3.16)*** (3.19)*** (3.19)*** Observations 3723 3723 3723 3666 3723 3723 3723 3666 Adjusted R-squared 0.16 0.16 0.16 0.16 0.28 0.28 0.28 0.28
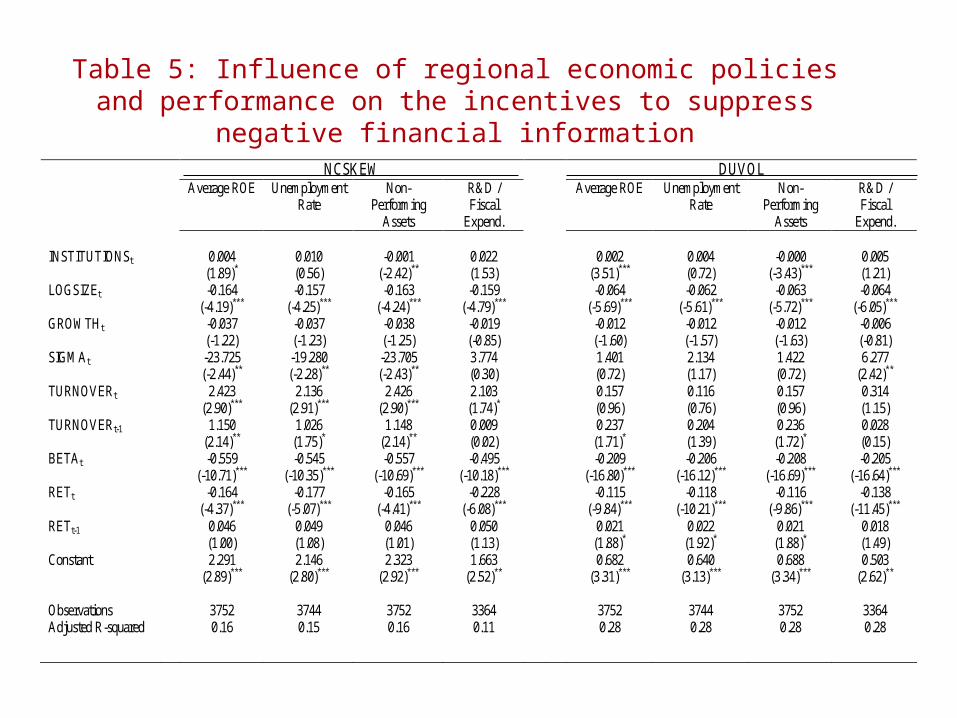
Table 5: Influence of regional economic policies and performance on the incentives to suppress negative financial information
NCSKEW DUVOL Average ROE Unemployment
Rate Non-
Performing Assets
R&D / Fiscal
Expend.
Average ROE Unemployment Rate
Non-Performing
Assets
R&D / Fiscal
Expend. INSTITUTIONSt 0.004 0.010 -0.001 0.022 0.002 0.004 -0.000 0.005 (1.89)* (0.56) (-2.42)** (1.53) (3.51)*** (0.72) (-3.43)*** (1.21) LOGSIZEt -0.164 -0.157 -0.163 -0.159 -0.064 -0.062 -0.063 -0.064 (-4.19)*** (-4.25)*** (-4.24)*** (-4.79)*** (-5.69)*** (-5.61)*** (-5.72)*** (-6.05)*** GROWTHt -0.037 -0.037 -0.038 -0.019 -0.012 -0.012 -0.012 -0.006 (-1.22) (-1.23) (-1.25) (-0.85) (-1.60) (-1.57) (-1.63) (-0.81) SIGMAt -23.725 -19.280 -23.705 3.774 1.401 2.134 1.422 6.277 (-2.44)** (-2.28)** (-2.43)** (0.30) (0.72) (1.17) (0.72) (2.42)** TURNOVERt 2.423 2.136 2.426 2.103 0.157 0.116 0.157 0.314 (2.90)*** (2.91)*** (2.90)*** (1.74)* (0.96) (0.76) (0.96) (1.15) TURNOVERt-1 1.150 1.026 1.148 0.009 0.237 0.204 0.236 0.028 (2.14)** (1.75)* (2.14)** (0.02) (1.71)* (1.39) (1.72)* (0.15) BETAt -0.559 -0.545 -0.557 -0.495 -0.209 -0.206 -0.208 -0.205 (-10.71)*** (-10.35)*** (-10.69)*** (-10.18)*** (-16.80)*** (-16.12)*** (-16.69)*** (-16.64)*** RETt -0.164 -0.177 -0.165 -0.228 -0.115 -0.118 -0.116 -0.138 (-4.37)*** (-5.07)*** (-4.41)*** (-6.08)*** (-9.84)*** (-10.21)*** (-9.86)*** (-11.45)*** RETt-1 0.046 0.049 0.046 0.050 0.021 0.022 0.021 0.018 (1.00) (1.08) (1.01) (1.13) (1.88)* (1.92)* (1.88)* (1.49) Constant 2.291 2.146 2.323 1.663 0.682 0.640 0.688 0.503 (2.89)*** (2.80)*** (2.92)*** (2.52)** (3.31)*** (3.13)*** (3.34)*** (2.62)** Observations 3752 3744 3752 3364 3752 3744 3752 3364 Adjusted R-squared 0.16 0.15 0.16 0.11 0.28 0.28 0.28 0.28

Table 6: Influence of provincial-level foreign investment on the incentive to suppress negative financial information
NCSKEW DUVOL
FDI / GDP
FDI Ownership
Fixed Asset Invest (FDI /
SOE)
FDI / GDP
FDI
Ownership
Fixed Asset Invest (FDI /
SOE) INSTITUTIONSt 0.815 0.265 0.156 0.270 0.112 0.052 (2.12)** (1.75)* (2.32)** (2.63)** (3.37)*** (2.95)*** LOGSIZEt -0.174 -0.169 -0.168 -0.066 -0.066 -0.065 (-5.07)*** (-4.16)*** (-4.23)*** (-6.05)*** (-5.80)*** (-5.64)*** GROWTHt -0.037 -0.035 -0.035 -0.010 -0.012 -0.012 (-1.54) (-1.18) (-1.17) (-1.42) (-1.60) (-1.55) SIGMAt -4.498 -24.055 -24.071 4.595 1.332 1.301 (-0.40) (-2.46)** (-2.51)** (1.98)* (0.68) (0.68) TURNOVERt 1.461 2.450 2.431 0.030 0.162 0.158 (1.50) (2.90)*** (2.92)*** (0.14) (0.97) (0.98) TURNOVERt-1 0.537 1.146 1.164 0.190 0.234 0.241 (1.27) (2.15)** (2.18)** (1.32) (1.72)* (1.75)* BETAt -0.521 -0.569 -0.568 -0.206 -0.211 -0.211 (-10.21)*** (-10.78)*** (-11.07)*** (-16.01)*** (-16.50)*** (-16.98)*** RETt -0.134 -0.163 -0.161 -0.107 -0.114 -0.114 (-4.69)*** (-4.30)*** (-4.23)*** (-11.34)*** (-9.81)*** (-9.76)*** RETt-1 0.046 0.043 0.047 0.017 0.021 0.022 (1.08) (0.96) (1.02) (1.44) (1.87)* (1.89)* Constant 1.411 2.322 2.322 0.459 0.694 0.687 (2.31)** (2.91)*** (2.94)*** (2.63)** (3.36)*** (3.33)*** Observations 3545 3723 3752 3545 3723 3752 Adjusted R-squared
0.14 0.16 0.16
0.29 0.28 0.28
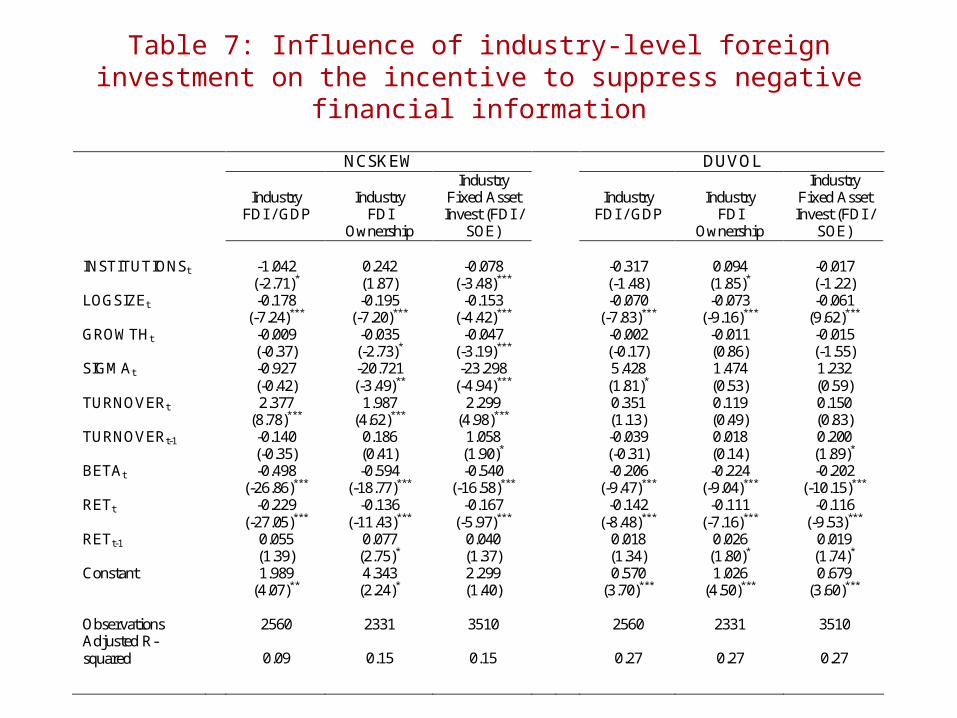
Table 7: Influence of industry-level foreign investment on the incentive to suppress negative financial information
NCSKEW DUVOL
Industry FDI / GDP
Industry
FDI Ownership
Industry Fixed Asset Invest (FDI /
SOE)
Industry
FDI / GDP
Industry
FDI Ownership
Industry Fixed Asset Invest (FDI /
SOE) INSTITUTIONSt -1.042 0.242 -0.078 -0.317 0.094 -0.017 (-2.71)* (1.87) (-3.48)*** (-1.48) (1.85)* (-1.22) LOGSIZEt -0.178 -0.195 -0.153 -0.070 -0.073 -0.061 (-7.24)*** (-7.20)*** (-4.42)*** (-7.83)*** (-9.16)*** (9.62)*** GROWTHt -0.009 -0.035 -0.047 -0.002 -0.011 -0.015 (-0.37) (-2.73)* (-3.19)*** (-0.17) (0.86) (-1.55) SIGMAt -0.927 -20.721 -23.298 5.428 1.474 1.232 (-0.42) (-3.49)** (-4.94)*** (1.81)* (0.53) (0.59) TURNOVERt 2.377 1.987 2.299 0.351 0.119 0.150 (8.78)*** (4.62)*** (4.98)*** (1.13) (0.49) (0.83) TURNOVERt-1 -0.140 0.186 1.058 -0.039 0.018 0.200 (-0.35) (0.41) (1.90)* (-0.31) (0.14) (1.89)* BETAt -0.498 -0.594 -0.540 -0.206 -0.224 -0.202 (-26.86)*** (-18.77)*** (-16.58)*** (-9.47)*** (-9.04)*** (-10.15)*** RETt -0.229 -0.136 -0.167 -0.142 -0.111 -0.116 (-27.05)*** (-11.43)*** (-5.97)*** (-8.48)*** (-7.16)*** (-9.53)*** RETt-1 0.055 0.077 0.040 0.018 0.026 0.019 (1.39) (2.75)* (1.37) (1.34) (1.80)* (1.74)* Constant 1.989 4.343 2.299 0.570 1.026 0.679 (4.07)** (2.24)* (1.40) (3.70)*** (4.50)*** (3.60)*** Observations 2560 2331 3510 2560 2331 3510 Adjusted R-squared
0.09 0.15 0.15
0.27 0.27 0.27
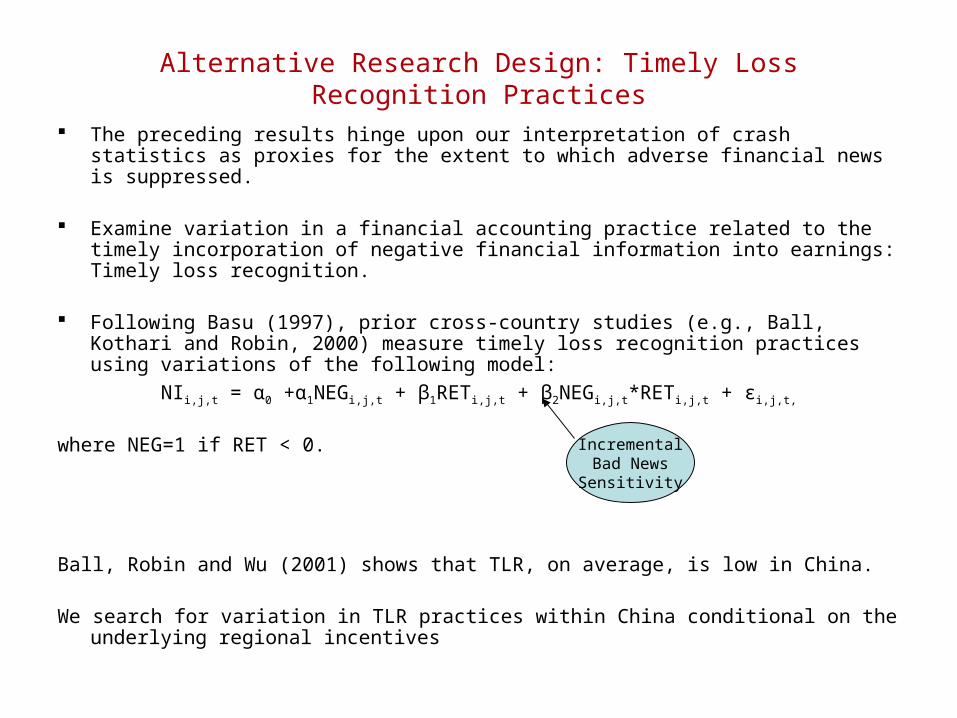
Alternative Research Design: Timely Loss Recognition Practices
The preceding results hinge upon our interpretation of crash statistics as proxies for the extent to which adverse financial news is suppressed.
Examine variation in a financial accounting practice related to the timely incorporation of negative financial information into earnings: Timely loss recognition.
Following Basu (1997), prior cross-country studies (e.g., Ball, Kothari and Robin, 2000) measure timely loss recognition practices using variations of the following model:
NIi,j,t = α0 +α1NEGi,j,t + β1RETi,j,t + β2NEGi,j,t*RETi,j,t + εi,j,t,
where NEG=1 if RET < 0.
Ball, Robin and Wu (2001) shows that TLR, on average, is low in China.
We search for variation in TLR practices within China conditional on the underlying regional incentives
IncrementalBad NewsSensitivity
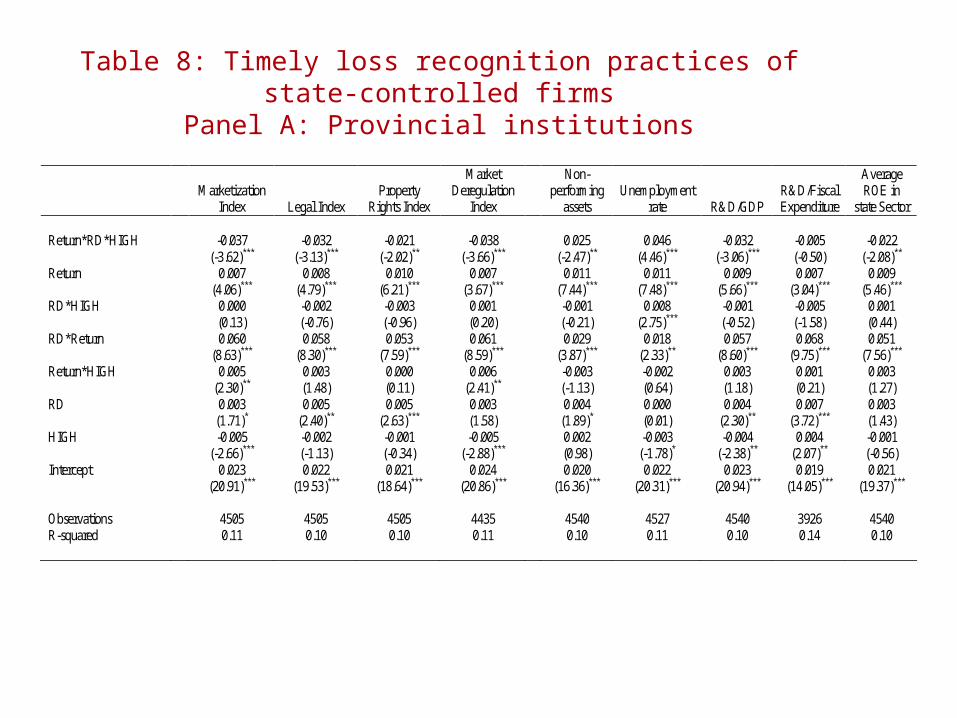
Table 8: Timely loss recognition practices of state-controlled firmsPanel A: Provincial institutions
Marketization Index Legal Index
Property Rights Index
Market Deregulation
Index
Non-performing
assets Unemployment
rate R&D/GDP R&D/Fiscal Expenditure
Average ROE in
state Sector Return*RD*HIGH -0.037 -0.032 -0.021 -0.038 0.025 0.046 -0.032 -0.005 -0.022 (-3.62)*** (-3.13)*** (-2.02)** (-3.66)*** (-2.47)** (4.46)*** (-3.06)*** (-0.50) (-2.08)** Return 0.007 0.008 0.010 0.007 0.011 0.011 0.009 0.007 0.009 (4.06)*** (4.79)*** (6.21)*** (3.67)*** (7.44)*** (7.48)*** (5.66)*** (3.04)*** (5.46)*** RD*HIGH 0.000 -0.002 -0.003 0.001 -0.001 0.008 -0.001 -0.005 0.001 (0.13) (-0.76) (-0.96) (0.20) (-0.21) (2.75)*** (-0.52) (-1.58) (0.44) RD*Return 0.060 0.058 0.053 0.061 0.029 0.018 0.057 0.068 0.051 (8.63)*** (8.30)*** (7.59)*** (8.59)*** (3.87)*** (2.33)** (8.60)*** (9.75)*** (7.56)*** Return*HIGH 0.005 0.003 0.000 0.006 -0.003 -0.002 0.003 0.001 0.003 (2.30)** (1.48) (0.11) (2.41)** (-1.13) (0.64) (1.18) (0.21) (1.27) RD 0.003 0.005 0.005 0.003 0.004 0.000 0.004 0.007 0.003 (1.71)* (2.40)** (2.63)*** (1.58) (1.89)* (0.01) (2.30)** (3.72)*** (1.43) HIGH -0.005 -0.002 -0.001 -0.005 0.002 -0.003 -0.004 0.004 -0.001 (-2.66)*** (-1.13) (-0.34) (-2.88)*** (0.98) (-1.78)* (-2.38)** (2.07)** (-0.56) Intercept 0.023 0.022 0.021 0.024 0.020 0.022 0.023 0.019 0.021 (20.91)*** (19.53)*** (18.64)*** (20.86)*** (16.36)*** (20.31)*** (20.94)*** (14.05)*** (19.37)*** Observations 4505 4505 4505 4435 4540 4527 4540 3926 4540 R-squared 0.11 0.10 0.10 0.11 0.10 0.11 0.10 0.14 0.10
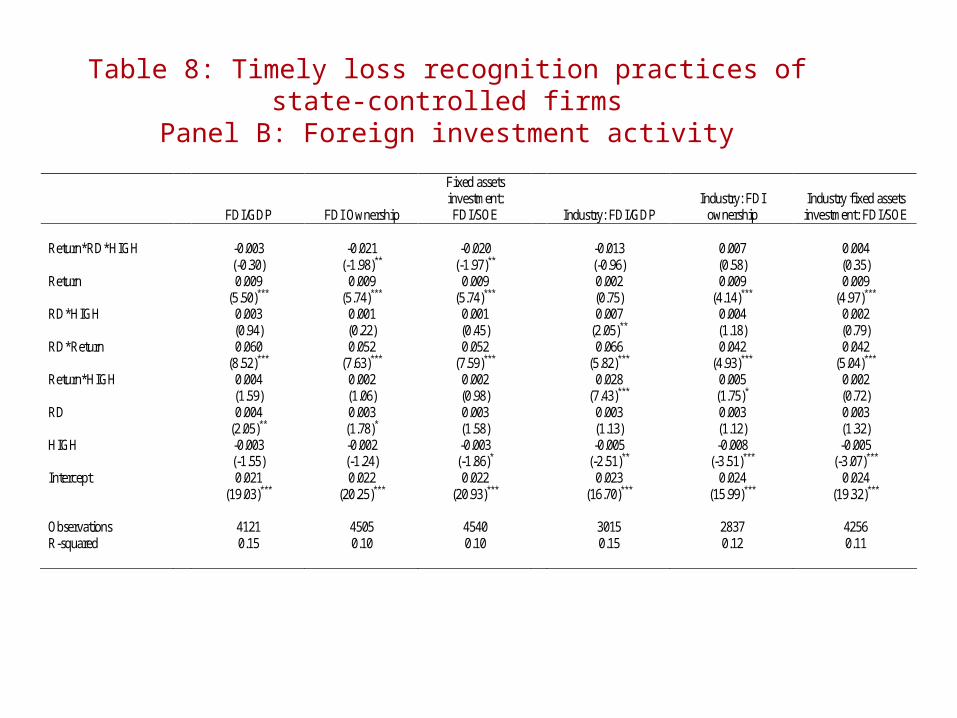
FDI/GDP FDI Ownership
Fixed assets investment: FDI/SOE
Industry: FDI/GDP Industry: FDI
ownership Industry fixed assets
investment: FDI/SOE Return*RD*HIGH -0.003 -0.021 -0.020 -0.013 0.007 0.004 (-0.30) (-1.98)** (-1.97)** (-0.96) (0.58) (0.35) Return 0.009 0.009 0.009 0.002 0.009 0.009 (5.50)*** (5.74)*** (5.74)*** (0.75) (4.14)*** (4.97)*** RD*HIGH 0.003 0.001 0.001 0.007 0.004 0.002 (0.94) (0.22) (0.45) (2.05)** (1.18) (0.79) RD*Return 0.060 0.052 0.052 0.066 0.042 0.042 (8.52)*** (7.63)*** (7.59)*** (5.82)*** (4.93)*** (5.04)*** Return*HIGH 0.004 0.002 0.002 0.028 0.005 0.002 (1.59) (1.06) (0.98) (7.43)*** (1.75)* (0.72) RD 0.004 0.003 0.003 0.003 0.003 0.003 (2.05)** (1.78)* (1.58) (1.13) (1.12) (1.32) HIGH -0.003 -0.002 -0.003 -0.005 -0.008 -0.005 (-1.55) (-1.24) (-1.86)* (-2.51)** (-3.51)*** (-3.07)*** Intercept 0.021 0.022 0.022 0.023 0.024 0.024 (19.03)*** (20.25)*** (20.93)*** (16.70)*** (15.99)*** (19.32)*** Observations 4121 4505 4540 3015 2837 4256 R-squared 0.15 0.10 0.10 0.15 0.12 0.11
Table 8: Timely loss recognition practices of state-controlled firmsPanel B: Foreign investment activity
Influence of decentralization on the reporting incentives of state-controlled firms
Pyramidal ownership structure in China is one mechanism by which the State credibly delegates decision rights to managers.
• Fan, Wong and Zhang (2007) - Pyramids improves labor and investment efficiency and total factor productivity.
• In our sample, nearly 85% of these publicly firms are controlled by the state through a multi-layer pyramid.
• To the extent that decentralization reduces the likelihood of government reprisal for poor performance, we would expect the incentive to suppress to be weaker among firms controlled through a pyramidal arrangement.
Preliminary Analysis: In terms of reporting incentives:
• We find no evidence that decentralization impacts the suppression or release of negative financial information using our crash statistics.
• We do find evidence that the pyramid structure increases the incentives for TLR.
Summary of Results and Conclusions
We find that the suppression of negative financial information, as proxied by both stock return crashes and weaker timely loss recognition practices, is stronger in those regions characterized by:
• Strong investor protections and pro-market regulation.
• Strong economic performance / value maximization policy orientation.
• High levels of foreign investment and ownership.
These patterns are consistent with managers and local politicians responding to political incentives when releasing information about state-controlled firms.
Thus, in those settings where market demand and contracting arguments would suggest transparency should be greatest, these alternative incentives appear to dominate.
Understanding the various financial reporting incentives of politicians and politically-astute managers is a first-order concern for investors in China


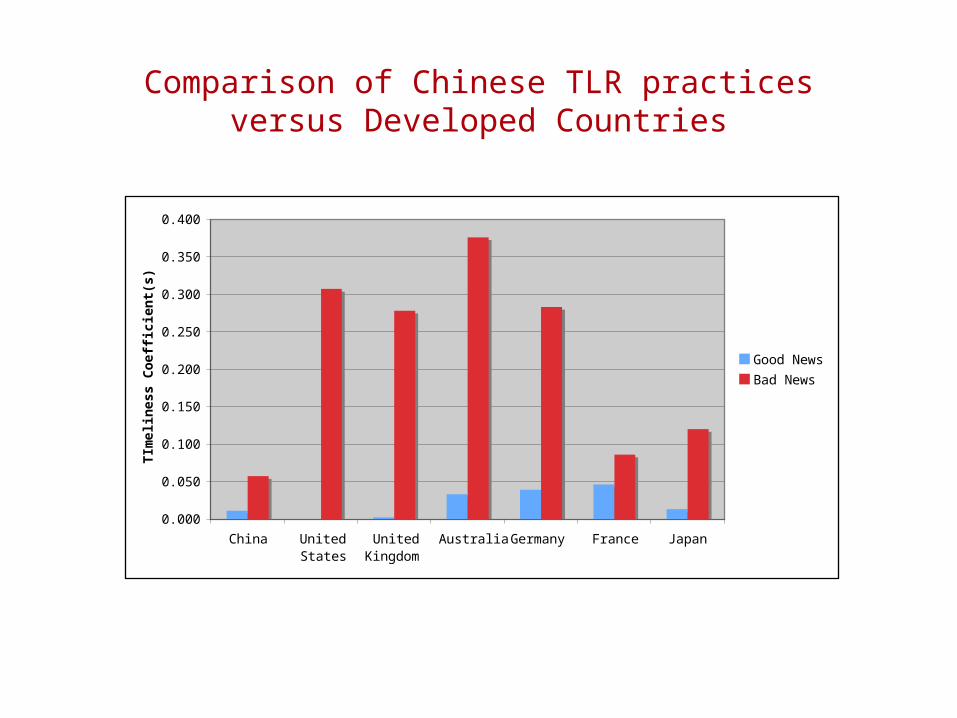
Comparison of Chinese TLR practices versus Developed Countries
0.000
0.050
0.100
0.150
0.200
0.250
0.300
0.350
0.400
China UnitedStates
UnitedKingdom
Australia Germany France Japan
TIm
eli
ness C
oeffi
cie
nt(
s)
Good News
Bad News
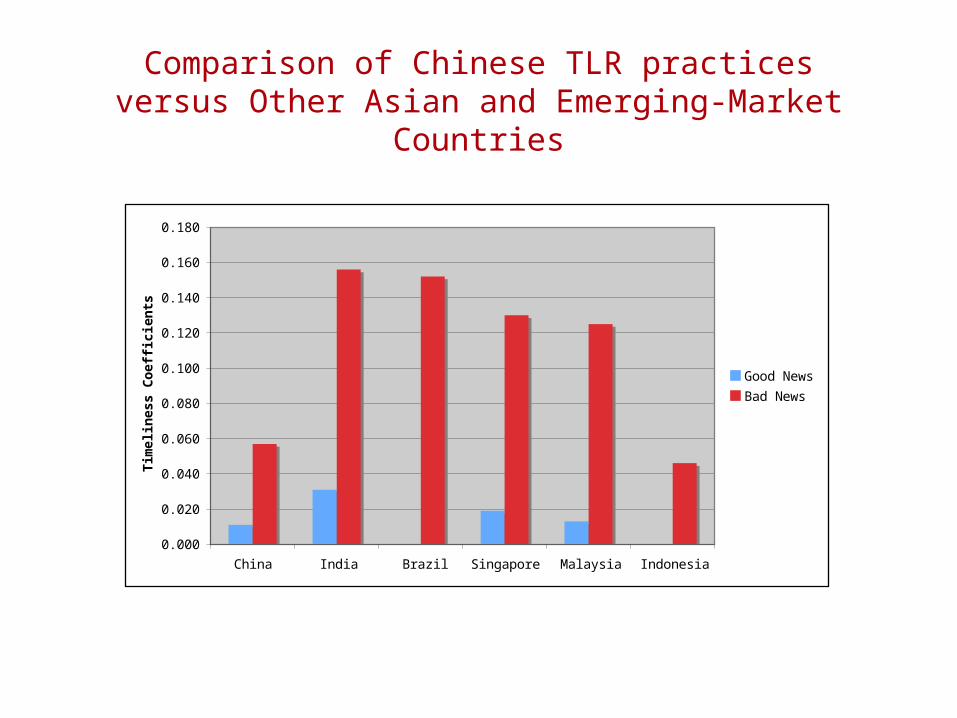
Comparison of Chinese TLR practices versus Other Asian and Emerging-Market Countries
0.000
0.020
0.040
0.060
0.080
0.100
0.120
0.140
0.160
0.180
China India Brazil Singapore Malaysia Indonesia
Tim
eli
ness
Coeffi
cien
ts
Good News
Bad News
Related Documents


![IP Event Dampening - Cisco...dampening [half-life-period reuse-threshold] Enablesinterfacedampening. [suppress-threshold max-suppress [restart-penalty]] Step4 •Enteringthedampening](https://static.cupdf.com/doc/110x72/612e12771ecc515869429546/ip-event-dampening-cisco-dampening-half-life-period-reuse-threshold-enablesinterfacedampening.jpg)