Thesis submitted in partial fulfilment of the requirements for the degree of DPhil in Politics in the Department of Politics and International Relations at the University of Oxford Political Corruption, Public Opinion, and Citizens' Behaviour By Oliver Cover, New College 78,540 words Submitted in Trinity Term, 2007 £.e.,aoc*- L-TS _- **/

Welcome message from author
This document is posted to help you gain knowledge. Please leave a comment to let me know what you think about it! Share it to your friends and learn new things together.
Transcript
Thesis submitted in partial fulfilment of the requirements for the degree
of DPhil in Politics in the Department of Politics and International
Relations at the University of Oxford
Political Corruption, Public Opinion, and Citizens' Behaviour
By Oliver Cover, New College
78,540 words
Submitted in Trinity Term, 2007 £.e.,aoc*- L-TS _- **/
Political Corruption, Public Opinion, and Citizens' Behaviour
Abstract
Political Corruption, Public Opinion, and Citizens' Behaviour
By Oliver Cover, New College
Thesis submitted in partial fulfilment of the requirements for the degree of DPhil in Politics in the Department of Politics and International Relations at the University of
Oxford
78,540 words
Submitted in Trinity Term, 2007
This thesis involves the examination, using sophisticated statistical techniques, of whether political corruption measured at the national level, and individual level perceived corruption, can help explain a) levels and forms of political participation, and b) directions of partisanship and vote choice. It proposes that corruption creates conditions of distrust and disaffection towards political institutions and actors that has behavioural and partisan consequences. It finds that perceived corruption has limited influence: dampening turnout, although having only weak effects on extra- institutional behaviour and on party support. Yet national level corruption is found to have highly salient contextual effects. It dampens turnout and induces higher levels of extra-institutional participation where corruption is particularly high, and particularly low, owed to citizen disillusionment in the former case, and elite responsiveness in the latter. Some nuanced theoretical explanations for the prowess of contextual effects over individual level effects, relating to the ability of contextual effects to entrench participatory forms, are offered. The same theme is analysed in regard to a British case study, and specialist data yields consistent results regarding perceived corruption. Important effects relating to perceptions of broader standards of public life determining party support in the UK are also found.
The thesis also addresses two other themes. By examining the nature of perceived corruption in the UK, it finds that citizens display significant attitudinal sophistication. They are well able to differentiate corruption from other impropriety, and develop their perceptions of corruption more from consideration of institutional performance than from engrained orientations produced by processes of socialisation. Second, the thesis provides discussion of the intellectual challenge of defining and measuring corruption, shedding light on the limits, as well as the potential, of applying quantitative techniques to such a complex field of study.
-11 -
Political Corruption, Public Opinion, and Citizens' Behaviour
Contents
Acknowledgements
Figures and Tables
Chapter 1
Chapter 2
Chapter 3
Chapter 4
Chapter 5
Chapter 6
Chapter 7
Chapter 8
Appendix
Bibliography
Introduction
Defining and Measuring Corruption
National Level Corruption and Citizens' Behaviour
Corruption, Perceived Corruption, and Citizens' Behaviour
The Nature and Determinants of Citizens' Perceptions of Corruption in British Politics
Perceived Corruption and British Citizens' Behaviour
Political Corruption, Perceived Corruption, and Political Support
Conclusion
IV
V
1
12
30
69
111
160
174
208
223
237
- in -
Political Corruption, Public Opinion, and Citizens' Behaviour
Acknowledgements
I'd first like to thank James Tilley and Mark Philp, my supervisors. James has offered strong suggestions and perceptive constructive criticism throughout the project. Mark has shown me the importance of patience and care in researching such a complex topic. I am very grateful to them both, and have very much enjoyed working with them. I'd also like to thank my students from the last two years, who have really kept me thinking. Those lively tutorials were intellectually engaging and good fun.
Thanks to Jane Roberts of the Oxford University Data Library for her help in finding data. I must also express my gratitude to the ESRC, who provided me with a 2+2 studentship and thus made study at Oxford possible (award number PTA-030-2003- 00197).
Last but not least, thanks to all my loved ones.
- iv -
Political Corruption, Public Opinion, and Citizens' Behaviour
List of Figures and Tables
Figures
3 A The Nonlinear Effect of Corruption on Demonstration Activity 66 4A The Potential For Corruption to have a Contextual Effect on 74
Participation4B The Corruption Index and Voting Probability 97 4C National Level Corruption and Extra-Institutional Behaviour 104 5 A Corruption Index Scores in Four Nations 112 7A Corruption, Perceived Corruption, and Political Support: 179
Endogeneity Paths7B Partisanship and Perceived'Other Misdemeanour Incidence' 189 A2a Scatterplot: Corruption Index and Graft Index 223 A2b Scatterplot: Corruption Index and Bribe Payers Index 223 A2c Scatterplot: Corruption Index and BEEPS Scores 224 A2d Scatterplot: Corruption Index and Relevant Public Integrity Index 224
ScoresA2e Scatterplot: Corruption Index and Bad Governance Index 225 A3 a Scatterplot: Corruption Index and Human Development Index 225 A4a Scatterplot: Corruption Index and Self-Reported Turnout 228 A4b Scatterplot: Corruption Index and Official Turnout 228 A4c Scatterplot: Corruption Index and Mean WVS Perceived Corruption 229
Scores A4d Scatterplot: Corruption Index and Mean CSES Perceived 229
Corruption Scores
Tables
2.1 Bivariate Correlations Between the CPI and Alternative Measures 26 of Corruption
3.1 Bivariate Correlations Pertaining to Corruption, Turnout and 50 Demonstrations
3.2 Results of OLSRegressions Estimating Turnout 603.3 Results of OLS Regressions Estimating Demonstration Activity 644.1 Results of Logistic Multilevel Regressions Estimating Turnout 934.2 Perceived Corruption and Predicted Probabilities of Voting 964.3 Results of Logistic Multilevel Regressions Estimating Extra-Institutional 99
Behaviours4.4 Perceived Corruption and Predicted Probabilities of Participating 107
in Extra-Institutional Behaviours5.1 The Perceived Importance of Avoiding Potentially 'Corrupt' 128
Behaviours5.2 The Perceived Incidence of Potentially 'Corrupt'Acts 1295.3 Citizens' Views on the Determinants ofMP 's Vote Choice 1305.4 Citizens' Views on the Acceptability of a Council Official's 132
Behaviour in regard to their Friend's Job Application5.5 Citizens' Views on the Importance of Avoiding Favouritism 13 35.6 Citizens' Views on the Prevalence of Favouritism 133
- v -
Political Corruption, Public Opinion, and Citizens' Behaviour
5.7 Rotated Factor Loadings: Expectations Concerning Ten Behaviours 136 (MPs and Government Ministers)
5.8 Rotated Factor Loadings: Expectations Concerning Ten Behaviours 136 (Senior Public Officials)
5.9 Rotated Factor Loadings: Perceived Incidence of Ten Behaviours 139 (MPs)
5.10 Rotated Factor Loadings: Perceived Incidence of Ten Behaviours 13 9 (Government Ministers)
5.11 Descriptive Statistics of the Scales Derived From Factor Analysis 1415.12 Results of Linear Regressions Estimating the 'Perceived Importance 148
of Corruption Avoidance' Scale5.13 Results of Linear Regressions Estimating the 'Perceived Corruption 151
Incidence' Scale6.1 Classifying the Participatory Activities Asked About in the BMRB 164
Dataset6.2 Mean and Variance of the Institutional Behaviour and Extra- 165
Institutional Behaviour Variables6.3 Logistic and Poisson Regressions to Predict Political Participation 168
in Britain6.4 Marginal Effects Associated With Poisson Regressions to Predict 169
Institutional and Extra-Institutional Participation 1. 1 Multinomial Logistic Model to Predict Partisanship in Britain; 186
Baseline Category: Labour Partisanship7.2 Results of Logistic Multilevel Regressions Estimating Vote Choice 2007.3 Levels of Perceived Corruption and Vote Choice Probabilities 202 A3.1 Countries in the Transparency International Corruption Perception 226
Index 1998A3.2 Countries Excluded from Chapter 3 Models 226 A3.3 Results ofOLS Regressions Estimating Turnout Excluding Countries 227
With Compulsory VotingA4.1 Countries in Wave 3 of the WVSfor which Data was Available 230 A4.2 Countries in the CSES Module 2 for which Data was Available 230 A4.3 Official and Self-Reported Levels of Turnout 231 A4.4 WVS Nations with Missing Data or Irregularities with Variables 232 A4.5 WVS Countries Included in Analysis 232 A7.1 Specification of Legislative Incumbents for Cross-National Analysis 233 A7.2 CSES Nations with Missing Data or Irregularities with Variables 236
- vi -

Political Corruption, Public Opinion, and Citizens' Behaviour
Chapter 1. Introduction
Corruption, Participation, and Political Support: The Key Themes
This thesis examines whether levels and perceptions of political corruption influence
rates of political participation, and the direction of citizens' political support, in
countries across the world. It proposes that where political corruption is high, citizens
participate in ways that reflect distrust in, and alienation from, institutions and
political actors, with important consequences for the political system more broadly.
Hence, this study examines how particular effects of political corruption may act as
hindrances to democratic consolidation and democratic quality. Although this is the
first systematic analysis of citizen participation as endogenous to political corruption
and perceived corruption, it is by no means the first time political corruption has been
analysed as an exogenous determinant of the quality of democracy and of economic
functioning, and of social cohesion.
Indeed, the most recent contributions are largely critical of corruption,
rejecting functionalist perspectives where corruption is seen as enabling the working
of an effective bureaucracy, and propose post-functionalist perspectives that recognise
corruption as wasteful and unfair (Gillespie and Okruhlik, 1996). For examples,
Johnston (1986a), analyses corruption's political consequences. Market corruption,
such as the black market, is often stable, he asserts, and it would in fact imbalance the
economy to suddenly remove it, implying that it is not a significant threat to a
political system. He argues that patronage, cronyism and nepotism can lead to
exclusion and inequality that can lead to conflict between winners and losers, however.
-1 -

Political Corruption, Public Opinion, and Citizens' Behaviour
He also identifies crisis corruption, which takes place during instability and may serve
to aggravate political and economic conditions.
Tanzi and Davoodi (2000) focus on corruption's economic effects, and argue
that small and medium sized firms suffer from rent-seeking and bribery, which
allocates talent and resources away from productive activity. Thus, "there is a positive
and significant association between the allocation of talent to unproductive activities
and corruption" (p. 22). Meanwhile Theobald (2000) analyses the difficulties inherent
in preserving stability and democratic principles concurrently during development.
State building, he suggests, requires dealing with instability, crime, corruption and
economic upheaval. Yet obtaining such control may require the violation of
democratic principles. Considering sequencing crucial, Theobald advocates state
building first and the installation of democracy second. To establish a strong and
healthy civil society, sufficient institutional development is required to mediate
between citizens and groups and lay the foundations for democratic procedure. Given
this, corruption, along with other destabilising forces, should encourage a firm, top-
down approach to democratisation.
This thesis aims to contribute to such post-functionalist perspectives of
corruption by arguing that political corruption, and citizens' perceptions of high levels
of political corruption, affects forms and levels of political participation in ways that
may be detrimental to the stability and cohesion of the political system. This is a
challenge. Undeniably a host of forces are at work in shaping citizens' participatory
characteristics: institutional and structural factors affecting the level of opportunities
available to citizens to participate are, of course, crucial. However the effect of public
opinion on politics and society should not be understated. Inglehart (1997, p. 49), for
example, states that his work on modernisation and post-modernisation rests on the
-2-
Political Corruption, Public Opinion, and Citizens' Behaviour
notion that "mass belief systems have important economic, political, and social
consequences," and his evidence suggests that this is indeed the case. Culture, politics,
and economics are found to be highly related, although difficult to disentangle.
Furthermore, the influential role of perceptions involving trust and alienation in
informing political participation have been established before. Putnam (1993), for
example, suggests that civic trust and norms of reciprocity help create conditions of
coordinated civic engagement. Furthermore, if perceptions affect citizens' political
behaviours, then they may have a bearing on the functioning and quality of
democracy more generally. Just as the attitudes one holds concerning money, such as
one's propensity to save or spend, may have a tangible effect on economic growth, so
too attitudes towards politics may have a salient effect on democracy.
So what effects on political participation may we anticipate political
corruption to have? We may assume that in democracy, one expects representatives
will behave in ways that ensure the majority's interests are protected, not just the
interests of particular agents who offer to buy favours. One may also hold competence,
honesty, and fairness to be important to democracy, which surely involves the
expectations that representatives, and also civil servants, behave scrupulously, legally,
truthfully, and in the public interest. The incidence of political corruption among
elected or unelected officials may undermine these principles and leave citizens
alienated, distrusting, and sceptical of democratic actors, institutions, or perhaps
democracy itself.
This might be construed as a process that is self-correcting. Some
commentators have found that the discrepancy between citizens' ideals and political
reality translates into pressure for change (Norris, 1999). However, if this pressure is
not sufficient to encourage meaningful change, it is possible that political corruption
-3-
Political Corruption, Public Opinion, and Citizens' Behaviour
and perceptions of its incidence may lead to behaviour which further undermines the
political system. If politicians or civil servants are perceived to be abusing their
position or resources, citizens may become cynical towards the political process and
institutions and fail to vote. If substantial political corruption highlights the
inadequacies of established political institutions generally, they may be seen as arenas
in which corruption may occur, or alternatively as bodies too weak or ineffective to
prevent corruption. This may encourage extra-institutional rather than institutionally-
based political participation. And extra-institutional participation, particularly if it is
anti-systemic, such as the illegal occupation of buildings or violent protest, may be
damaging for the political system. It may bring forth instability that nations with new
or poorly functioning democratic systems will find difficult to contain, and is likely to
further exacerbate deficiencies in democratic practice in established democracies.
It is notable that none of these activities have to link to political corruption or
perceived corruption directly (although, for example, expelling corrupt officials via
the ballot box or protesting against widespread corruption in politics are of course
plausible participatory activities). Protest, voting, and any other form of political
participation may be used in relation to any political issue, yet political corruption and
perceived corruption may create conditions in which some forms of participation may
be preferred to others. Corruption may increase distrust and scepticism of institutions,
and, consequently, when any issue motivates citizen action, this action neglects and
occurs outside of established rules, procedures or assemblies. Furthermore, if
politicians associated with parties or other partisan interests are perceived to be
corrupt, this may affect citizens' political support, not only their inclination to engage
in different forms of political behaviour. A corrupt incumbent government may
encourage support for opposition parties, particularly those mobilised to combat
-4-

Political Corruption, Public Opinion, and Citizens' Behaviour
corruption, which will ultimately affect vote choices and the make up of future
governments.
To analyse these broad claims, this thesis will deploy statistical analysis
involving national level data, and data from individual level surveys. We will test
hypothesised relationships between political corruption and perceived corruption, and
a) political participation, and b) partisanship and vote choice. Though in this
introductionary stage the reasoning has been general, more nuanced theoretical
expectations will be proposed in each chapter, and these will be rigorously tested
using appropriate methods. At the same time the methodological limitations of using
survey responses and data pertaining to a phenomenon as elusive as corruption will be
raised. Thus the thesis will demonstrate how quantitative analysis of a set of
behaviours that participants purposefully attempt to hide, and of which citizens
consequently have limited knowledge and plausibly divergent understandings,
involves many complications. It will thus consider how theoretical treatments of
political corruption may aid the application of political science to the topic -
specifically, how theory and definitional typologies may help in sophisticating the
operationalisation of variables, and help us to understand the limitations of pre
existing data.
Early Objections
At this early stage some theoretical objections to the key ideas and arguments may be
confronted. A first objection is that the blanket treatment of 'political corruption' is
theoretically naive. Hence in this thesis attention will be paid to the conceptual
difficulties inherent in defining and measuring political corruption, and its complexity
-5-

Political Corruption, Public Opinion, and Citizens' Behaviour
as a heterogeneous and (to some) a culturally relative and immeasurable phenomenon.
Different forms of corruption may have markedly varied effects on different forms of
political participation. The perception of high levels of electoral fraud may, for
example, encourage disdain for electoral institutions and thus act as a disincentive to
turnout. The perception of high levels of bribery may contribute to anger directed
towards politicians, the political system, or political institutions that expresses itself in
extra-institutionalised, even anti-systemic and violent participation. Consequently, it
will be important to contextualise quantitative analysis; to carefully specify how
measures of corruption are operationalised, and to question how far survey questions
really tap perceptions.
A second objection concerns causality. It may be that the nature of citizens'
participation itself affects levels of political corruption. Low levels of some forms of
participation may signal to elites that the public are uninterested in politics and may
encourage malpractice against the backdrop of an unresponsive citizenry: low turnout
and high perceived corruption may mutually reinforce each other. Therefore, in regard
to the empirical chapters of the thesis dealing with participation, it must be
acknowledged that we assume that, in regard to the relationship between a) corruption
and perceived corruption and b) participation, the stronger notion of causality is that
the former determines the latter, rather than vice-versa. With the available data it is
difficult to test this assumption empirically (and it is indeed likely that a degree of
mutual causality would be evident), but its strength may be argued to lie in the high
plausibility of the theoretical reasons why corruption affects participation. These
theoretical reasons are outlined in depth in the empirical chapters, and the strength of
these reasons, in the absence of other ways of precisely determining causality, should
dampen worries over endogeneity.
-6-
Political Corruption, Public Opinion, and Citizens' Behaviour
Determining causality is more problematic with regard to the relationship
between corruption (and particularly perceived corruption), and political support.
Voter X may perceive a government to be clean and decide to vote for them because
he thinks they will continue to keep corruption under control; but equally voter Y, a
highly partisan voter, may claim the government is clean simply because he supports
them. Either way, perceived corruption appears to associate with vote choice, but we
cannot deduce the causal arrow. Thus in the empirical chapter dealing with corruption
and political support, this endogeneity problem will be outlined and discussed in
depth. Nonetheless the causal direction we assumed earlier, that corruption affects
political support, will be argued to be highly plausible.
A third objection concerns the simple question of whether corruption can be
construed as a form of participation itself. Philp (2001, p. 366) suggests that:
"(a)lthough most democratic systems rely on rules designed for a government of
strangers, the viability of such governments depends heavily on a baseline of
motivation in political life which can only be generated by friendships, familial and
quasi-clientelist connections, old-boy networks and local and collegial connections."
In essence, corrupt transactions are a way of accessing politics and some citizens will
do so to ensure they get what they want: to forge a business deal, to obtain a job, to
encourage certain policies to be put in place. Nonetheless, there is no theoretical
reason why we should not examine the effect of one form of participation on another,
as participatory activities affect each other directly and indirectly all the time. The
vote choice of some citizens may produce governments that enact policies that are
abhorred by other citizens, who in turn respond by protesting. Being mobilised to sign
a petition may encourage one to develop a greater interest in politics that expresses
itself in far greater participatory activity over time. Furthermore, the proportion of
-7-
Political Corruption, Public Opinion, and Citizens' Behaviour
citizens in established democracies, especially in nations such as Britain (a key case
study in this work) that would engage in corrupt behaviours is likely to be limited,
certainly when compared to other forms of participation such as voting. As a result,
corrupt behaviour may be viewed as a very particular form of political participation,
as it is likely to be elitist and may sustain, and be a consequence of, inequality (You
and Khagram, 2004, for instance, find that inequality and corruption relate). However,
in other nations, widespread corrupt transactions may mean that citizens do not
associate it only with high level political elites, but with public officials at the
parochial level. In these circumstances it may nonetheless be assumed that citizens
recognise such behaviour is not formally correct, and that perceptions of the quality of
established political institutions are still likely to be affected.
Other Themes
This discussion has concerned the importance of the key research themes to be
addressed in the study: the impact of corruption and perceived corruption on a)
political participation, and b) political support and vote choice. However, to garner a
better understanding of perceived corruption itself, this thesis will also consider other
themes. Using specialist British data, in-depth analysis of the nature of perceptions of
corruption may be undertaken. In essence, do these perceptions differ in a pertinent
way to perceptions concerning other forms of impropriety in public life, such as
incompetence? This is important, since if a substantive difference between the types
of perceptions is not shown, we may simply be proxying far broader perceptions
pertaining to the quality of democracy when we talk of 'perceived corruption'.
Previous literature using 'perceived corruption' as a variable, and not controlling for
-8-
Political Corruption, Public Opinion, and Citizens ' Behaviour
other, related perceptions, may consequently be called into question. Furthermore, the
analysis of the determinants of perceived corruption, and of censoriousness
concerning perceived corruption, will enable the previous findings of other scholars to
be tested using rigorous statistical techniques. Specifically, previous work researching
the determinants of citizens' perceptions of corruption, both their censoriousness
towards it and the extent they believe it to occur, tends to prioritise socioeconomic
and demographic factors. Yet these works often fail to control extensively for
attitudinal factors. Perhaps such socioeconomic and demographic effects merely tap
alienation or 'distance' from the political system that attitudinal variables may tap
better. Or, perhaps these effects genuinely reflect distinct socioeconomic and
demographic faultlines relating to who wins and loses from corruption. The question
of how far this can be the case in nations reported generally to have very little
'objective' corruption (and hence few big winners and losers from corruption) such as
the UK remains, however.
The use of Britain as a case study also allows us to review the findings
concerning the key research theme using data from respondents in a nation generally
believed to experience low levels of corruption. If corruption is less salient than other
issues in Britain, is it possible that any findings derived from cross-national analysis
that suggest perceived corruption does help predict patterns in political participation
or political support will not be replicated in the British case? If they do not show up,
what is explanatory instead? Are any standards-related perceptions significant?
-9-
Political Corruption, Public Opinion, and Citizens ' Behaviour
The Structure of the Thesis
The thesis will commence with consideration of the phenomenon of corruption
(Chapter 2). Corruption's definition, and issues concerning its measurement, will be
subject to critical examination, and some tentative solutions will be proposed. In
particular, this chapter focuses on deriving a useful cross-national scale to proxy
corruption at the national level. There is discussion of the limitations of this and how
far a scale can relate to both theoretical definitions of corruption and other measures
of corruption and indices of'bad' governance.
We may then move on to cross-national analysis of one of the key themes of
the thesis: just how does corruption and perceived corruption affect political
participation? After setting out the theoretical expectations of empirical analysis, we
will first examine only data at the level of the nation (Chapter 3), to see if corruption
appears to have an effect on aggregate measures of political participation. The results
may then be used to shape expectations for a deeper question to be addressed in
Chapter 4: how might perceived corruption, at the level of the individual, relate to
citizens' behaviour, and does it have an effect that is congruent with any contextual
effects of political corruption found to be significant in Chapter 3? Might individual
level effects displace contextual effects, or may they exist concurrently? The use of
multilevel modelling, which enables the inclusion of both individual and national
level data to predict participatory levels, will be a highly useful tool at this stage.
Having established whether perceived corruption has a salient effect on
participation, we may then turn to the British case study to obtain a better
understanding of perceived corruption itself (Chapter 5). Are perceptions of
corruption in any way distinct from other opinions concerning standards in politics,
-10-
Political Corruption, Public Opinion, and Citizens' Behaviour
such as perceptions of competence, honesty, and open government? Are they a
product of socioeconomic and demographic factors, and perhaps related to social
cleavages and divisions, or are they better related to social and political attitudes?
The case study may then be used to test if the findings of cross-national
analysis of perceived corruption's effects on political participation hold in the British
case (Chapter 6), before its effect on political support and cross-nationally will be
examined (Chapter 7). To confirm and develop analysis of any link found between
perceived corruption and political support in the UK, some cross-national, multilevel
models will also be used in this final empirical chapter, to see once again how
contextual and individual level effects compare.
Finally, the main findings of the study, and their theoretical implications, will
be outlined clearly in the conclusion (Chapter 8), and the consequences for democracy
more broadly discussed. Recommendations for future research in light of the key
findings will also be stated.
-11 -
Political Corruption, Public Opinion, and Citizens' Behaviour
Chapter 2. Defining and Measuring 'Political Corruption'
Political corruption has undeniably received considerable academic interest. The
literature pertaining to the topic spans legal contributions (for example, Edwards,
1996; Lowenstein, 1985), theoretical treatments (for example, Girling, 1997), area and
comparative works (for example, Little and Posado-Carbo, 1996), and issues of
corruption control (for example, Larmour and Wolanin, 2001). In the introduction, we
considered some ways corruption was deemed a post-functionalist, damaging
phenomenon for democracy and the economy. In other works, the root causes of
corruption are traced and discussed (for example, Treisman, 2000).
Yet an overriding initial concern for any scholar of corruption is to pinpoint
exactly what he or she means by the term. And clearly for the purposes of this thesis,
in which the concept of political corruption is central, consideration of competing
definitions is crucial. Moreover in the practice of politics, defining corruption is vital
as this dictates the nature of its "investigation, prevention and prosecution" (Philp,
1997, p. 437). The definition of corruption is a major point of contention in the
literature, however, and numerous scholars have offered differing accounts of what
constitutes corrupt behaviour. Such definitions cluster in four types, which may now
be outlined. None are without their problems.
1. Definitions appealing to the correct or legal exercise of public office:
These types of definitions, espoused by scholars such as Nye (1967), suggest that
corruption marks behaviour that deviates from the formal duties of public office:
"Corruption is behaviour which deviates from the formal duties of a public role
because of private-regarding (personal, close family, private clique) pecuniary or
-12-

Political Corruption, Public Opinion, and Citizens' Behaviour
status gains; or violates rules against the exercise of certain types of private regarding
influence" (p. 419). To Nye, this embraces behaviour such as bribery, nepotism, and
misappropriation, and does not necessarily have to refer to 'immoral' or
'unacceptable' actions, which require stringent definition themselves. Yet this begs
the question of exactly what determines the duties of public office, if not a set of
ethical principles. Generally, proponents of this type of definition will fall back on
norms provided by the legal system, and it is by doing this that the definition's
problems may be exposed. It may be that the law does not adequately cover
behaviours that others would argue are corrupt or unethical, or that loopholes
undermine its ability to protect citizens from corrupt practice (Philp, 1997; Peters and
Welch, 1978; Sandholtz and Koetzle, 2000). Moreover, what are the norms that
underlie the legal system, and who should determine them (Philp, 1997)? Indeed, in
an extreme case, it may be that legal norms are the result of corrupt action. Hence
referring to legal standards as the criteria for what is and is not corrupt circumvents
the central problem of what these standards are based on. And, as these standards
differ in time and place, as Sandholtz and Koetzle (2000) recognise, does the
acceptance of this type of definition not undermine attempts to adequately compare
corruption across nations or over time?
2. Definitions appealing to the public interest:
Here, corruption is considered to be behaviour which contravenes the public interest
by benefiting bribe-payers, and providers of other corrupt rents, instead of the public
generally (see, for instance, Friedrich, 1966). Yet as many critics have recognised,
there is some slipperiness concerning the concept of 'public interest' (Peters and
Welch, 1978; Philp, 1997; Sandholtz and Koetzle, 2000). If it refers to the base
-13-
Political Corruption, Public Opinion, and Citizens' Behaviour
function of politics as indicated by Philp (1997): the installation of order to resolve
conflict and prevent war, then the definition tells us little more than that corrupt acts
are apolitical. It is also contestable as it begs the question of who should be charged
with acting in the public interest (Heidenheimer et al, 1989). Is this implicit to every
public office holder? Are judges, for example, representatives and defenders of the
law instead of the public interest, as it may be contestable to argue that they are one
and the same thing. And how do we tell if the providers of rewards to politicians do
not represent the public interest? If corruption is functional, as some analysts have
proposed, should it not be revered as a political phenomenon directly in the public
interest?
3. Definitions appealing to public opinion:
Definitions that appeal to public opinion see 'corruption' as best defined by the views
of members of a political system. Scholars such as Rundquist and Hansen (1976, cited
in Peters and Welch, 1978) have advocated such an approach, which avoids the issues
of defining what is required of holding public office, or of pinpointing what
constitutes the 'public interest'. Several problems are evident here though. First, who
exactly should provide the opinion informing us what is and is not corrupt? The
citizenry generally, or elites, or indeed politicians themselves? After all, it seems
likely that opinions will differ, between and among groups. Second, is this definition
not undermined by the notions that beliefs may not square with the way people
behave (Philp, 1997)? One's propensity to report a 'corrupt' behaviour may not neatly
relate to the degree of censoriousness with which one condemns it. Indeed, reporting
corruption will rely on one perceiving officials and procedures to be efficacious in
punishing corruption, as well as believing one to be safe from reprisals from reporting
-14-

Political Corruption, Public Opinion, and Citizens' Behaviour
it, and even resisting an incentive to blackmail corrupt individuals to stay silent. Third,
even if high degrees of agreement are notable among all citizens of what constitutes
corruption, it may be that legal norms or public conceptions of the 'public interest'
inform and shape conceptions of corruption, which blurs the uniqueness of this
definition (Philp, 1997; Peters and Welch, 1978).
4. Definitions appealing to market principles:
This type of definition describes corrupt behaviour as a form of personal utility
maximisation (usually financial) in public office, and can be contrasted to the
maximisation of the public's utility. Rose-Ackerman (1978) suggests that corruption
may be defined as illegal "third-party payments" to "agents that are not passed on to
their superiors" (p. 7). Such a definition, as Rose-Ackerman acknowledges, is highly
congruent with bribery, confirmed by the nature of the relationship by which she
conceives such an exchange may occur. The 'third person' is assumed to be able to
"benefit by the agent's action, (and) seeks to influence the agent's decision" (p. 6).
Yet a focus on bribery is problematic. What of patronage, nepotism, official theft, or
electoral fraud? More generally, the concept of utility maximisation here may be
brought into question. To Philp (1997), this form of definition contributes to an
understanding of the causes of corruption and incentives to impropriety, but fails to
actually define it. This is a pertinent point: one could simply interpret behaviour that
runs against the public interest or the norms of public office within a utility
maximisation framework, making this form of market-focused definition compatible
with other supposedly rival definitions.
We see, therefore, that there is no simple way of defining corruption. We can,
in more abstract terms, at least be consoled by the realisation that corruption seems to
-15-
Political Corruption, Public Opinion, and Citizens ' Behaviour
be implicitly understood as deviation from an ideal or preferred political arrangement,
or set of political behaviours. Philp (1997) recognises this point strongly, and attempts
to outline notions of a 'natural condition of polities' which dictates how corruption
may be better understood. Political relations, to Philp, are not purely communal
relations or market-based relations, despite sharing features with both. Central to them
are concepts of legitimacy, consent, public standards, and the 'sustainability' of
political rule. Corruption implies deviation from such concepts, although their own
contestable definitions problematize our inquiry further.
So too does drilling further into the puzzle by attempting to specify a
conception of what constitutes the 'political' and what comprises its beneficial effects.
Philp's discussion of four plausible 'ethical appeals' for political rule centre on the
capacity of politics to provide some form of resolution to societal conflict. In this vein,
corruption is damaging as it undermines the capacity of political rule to 'order'
conflict. It resembles an incompatibility between the key function of political rule,
and particularistic interests of political actors misusing political rule for their own
ends. We might be able to make sense, however, of the argument that corruption may
in some respects be functional, by, for instance, facilitating economic exchange, but
such arguments may only be taken so far. Corruption will still represent the
installation of two cultures, one official and the other unofficial, and may be more
directly damaging by a) forging power relations between corrupt actors where one has
more to lose than the other in their corrupt behaviour being disclosed, and b) acting as
a disincentive to a less corrupt political system as actors fear that in a reformed system
their previous impropriety may be punished (Philp, 1997).
Thus by implying deviation from ideal political arrangements, through the
particularistic behaviour of corrupt actors, we have an intuitive sense of corruption's
-16-
Political Corruption, Public Opinion, and Citizens' Behaviour
meaning in an abstract sense. In more practical terms, the four rival definitions are
useful to help validate, contextualise, and critique variables that pertain to perceived
corruption, or proxies of 'actual' levels of corruption. Not to do so would invite
analysis without an awareness of the heavily debated theoretical backdrop. Thus in
empirical work, care will be taken to reference relevant measures to definitional
problems. This links directly to the next theme for discussion, which considers the
issues involved in measuring and quantifying corruption, an important task given the
empirical basis of the research to be undertaken.
Cross-National Quantification and Index Choice
In this section, the measurement of corruption will be discussed, with a view to
justifying the use of a cross-national index in the empirical chapters that follow. It will
involve both theoretical reasoning and basic statistical analysis.
The first question to address is whether it is possible to measure corruption
sufficiently to allow cross-national comparison at all. Fundamental to this problem is
whether corruption should be considered a relative phenomenon, tied only to specific
countries or areas and the unique standards by which politics is conducted in each
place, or an objective phenomenon tied to a universal set of norms. The relativist-
universalist controversy is further complicated by the competing definitions of
corruption outlined earlier. How might one measure corruption for cross-national
analysis if one agrees with the legalistic or the 'public interest' perspective, for
instance, if what is legal, or what is in the public interest, differs by nation?
Nonetheless, in this thesis, cross-national comparison will be undertaken, and
this requires defending. One defence is that purely relativist accounts are equally
-17-
Political Corruption, Public Opinion, and Citizens ' Behaviour
problematic as purely 'objective' accounts. Scholars such as Heidenheimer et al
(1989) and Philp (1997) have recognised that committing to either perspective is
precarious. Objective accounts might be charged with Western 'imperialism', but
relativist accounts give corrupt public servants an excuse to engage in self-serving
malpractice by defending it in terms of cultural 'acceptability'. Moreover Xin and
Rudel (2004) point to commentary by Galtung (1998), who argues that there has been
a growth in an objective sense of corruption, that is now 'universally recognised', and
pertains to activities such as embezzlement, grand corruption and taking from political
party funds.
The second question to ask is whether it is actually necessary to use corruption
indices at all. Essentially, an index of corruption is an attempt to measure the extent of
corruption in nation using some reliable means (generally via perceptions of those
who might be expected to have specialist knowledge, such as businessmen and
country experts) such that each nation is given a score comparable to the scores given
to other nations. And essentially, if we are to analyse the effects of corruption in
cross-national context, the answer to our question is yes. Other possible means of
measuring corruption do not suffice. As Kalnins (2005) discusses, relying on formal
statistics of convictions relating to corrupt practice may simply reflect the
successfulness of corrupt practitioners' covertness; relying on audit data carries with it
an assumption there is no regulatory capture within the auditing process, a dubious
prospect in the most corrupt nations; while relying on a variable associated with
corruption is contentious - even if a variable moved with one type of corruption,
perhaps with another type it would not do so. As a basic example, nepotism in the
public sector may relate to the size of the civil service and the supply of jobs within it.
Assuming a constant probability of nepotism, a larger pool of civil service jobs would
-18-

Political Corruption, Public Opinion, and Citizens' Behaviour
lead to greater incidence of nepotism. Yet the size of the civil service is unlikely to
tell us much about levels of payments for parliamentary questions. Thus the use of
measures of corruption is appropriate, albeit with care and introspective caution. So
which indices are available?
The first measure, and perhaps the best known, is the Corruption Perceptions
Index (CPI) compiled by Transparency International (TI). 1 This yearly index involves
the aggregation of surveys from numerous sources that ask respondents to report their
perceptions of corruptions in identified nations via scaling systems. Following
standardisation, an 'average' level of corruption is calculated for each nation. The
sources of these perceptions are firms and professional analysts: the index uses
surveys by, among others, PriceWaterhouseCoopers and the World Economic Forum.
Xin and Rudel (2004) show that the TI CPI correlates well with perceptions of
citizens and expatriates, while Treisman (2000) suggests it is correlated across years,
and with other relevant indexes.
The CPI's use in recent corruption literature is extensive, perhaps most
significantly as a dependent variable, enabling analysts to determine what might cause
corrupt activity. Treisman (2000), for instance, uses the CPI to find that countries that
are more developed, and to a limited extent those exposed to greater trade, have lower
levels of corruption. 2 Furthermore, Treisman finds that nations with Protestant and
long-standing democratic traditions are also less corrupt. 3 This is also true of countries
1 Source: Transparency International (2005).2 Such results, the product of data analysis, might be viewed as 'cutting edge' research, and do well in displacing older arguments concerning corruption which were based on observation and case-study work rather than data analysis. In contrast to Treisman's finding that development dampens corruption, for instance, Huntington (1968) suggested that 'intense' modernisation sparked higher levels of corruption because the installation of universalistic, meritocratic norms made behaviour that was previously thought acceptable now thought of as corrupt; because new forms of wealth and power raise the potential for illicit exchanges to occur; and because the growth in government policy and regulation which is witnessed during modernisation increases the number of opportunities for political malpractice.3 This is perhaps a development of Rose-Ackerman's (1978) older argument concerning corruption, which emphasises the link between corruption and scruples. She argues that political actors' values
-19-
Political Corruption, Public Opinion, and Citizens ' Behaviour
that had installed a procedural justice system under British rule. Finally, corruption is
found to be lower in unitary states, in which stronger lines of command may limit
corruption. Sandholtz and Koetzle (2000), also predicting determinants of CPI scores,
confirm some of Tresiman's findings and find that nations with less wealth, greater
state intervention in the economy, less international economic integration, less
democracy, and less of a Protestant component in society, have greater corruption.
Xin and Rudel (2004) also examine macro-level factors which plausibly influence
political corruption, finding that regional effects, wealth, population, and size of the
public sector are determinants of CPI scores. Finally, You and Khagram (2004)
postulate the interesting thesis that inequality causes corruption, by creating a societal
backdrop in which the exploitation of lower social strata by the wealthy is deemed
legitimate. This is empirically indicated via regression analysis involving an
established measure of inequality, and both the CPI and the World Bank 'Control of
Corruption' variable.
Despite providing such highly interesting results (and mattering for our
purposes because they outline plausible variables to control for when including
corruption at the national level as an independent variable), the CPI is problematic.
Relying on business perceptions as a proxy for corruption in an objective sense is
risky: particular scandals and even greater transparency may exaggerate perceived
corruption, or successful covertness lead to its underestimation (Kalnins 2005;
Johnston, 2002). And, although the consistency over time exhibited by the CPI may
reflect important socio-political characteristics of nations, the very high correlation
coefficients exhibited between sets of CPIs from year-to-year may indicate that
have a direct effect on whether corruption is to be contained, such that "the personal moral beliefs of voters, politicians and bureaucrats play an essential role in a modern democracy" (p. 234). This is likely to be true, yet the specification of particular religious and political traditions which may link to such morality represents an advance.
-20-

Political Corruption, Public Opinion, and Citizens' Behaviour
sources are being too frequently re-used, hindering its responsiveness (Johnston,
2002). The CPI for year t is, however, calculated from data from years t, t-1, and t-2.
This '3-year rule', designed to dampen short-term fluctuations in scores caused by
particular incidents of corruption, partly explains the CPI's consistency over time, and
is defended by Transparency International on the grounds that levels of corruption are
steady. The rule therefore acts as a buffer against short term leaps in scores caused by
specific incidences of corruption affecting perceptions.
However, the comparability of CPI scores is another worry, as different
sources inform scores for different nations and these fluctuate according to the year of
the CPI. It also seems difficult to envisage a single number encompassing diversity
within the state vis-a-vis forms and levels of corruption. Work such as Alam (1995),
for example, has explicitly sought to explain variation in levels of corruption across
different public sector agencies.
One must also address questions of validity which are involved in using
external businessmen's perceptions, as they form the basis of many sources. 4
Although businessmen share assumptions and biases that might mean they predict
similar levels of corruption in a country, they may not share the values of the
countries they are queried over and they may even be involved in corruption
themselves (Sik, 1999, cited in Hungarian Gallup Institute, 1999). It seems likely that
the types of corruption they are likely to be interested in reporting are those involving
business contracts, principally bribery and financial misdemeanour. If this is the case,
what about nepotism, patronage, electoral fraud, extortion and official theft?
(Johnston, 2002). Moreover, can we tell whether perceptions of substantively corrupt
nations refer to the extent of corruption, or the seriousness, or both? (Johnston, 2002).
4 Citizens' perceptions also form a small portion of the sources used by the CPI, but this proportion is indeed small enough for us to conclude that CPI scores are overall national level data, rather than averages derived from individual level surveys.
-21 -
Political Corruption, Public Opinion, and Citizens' Behaviour
One must also be wary of the wider criticism levelled by Knack and Azfar (2000) -
that the CPI exhibits selection bias. They argue that the propositions that smaller
countries and those with greater trade openness are less corrupt are faulty. This is
because the CPI focuses on nations that businessmen might be interested in investing
in, and thus misses out smaller, poorly governed states. When models are run with
larger sample sizes and with different measures of corruption, some of the
relationships predicted using the CPI are not evident.
Such criticisms provide a good basis to believe that if the CPI is to be used in
analysis, it is productive to consider it alongside alternative measures of corruption.
Indeed, the use of several measures of corruption in the same study has been
attempted before. Persson et al (2003) and Knack and Azfar (2000), for example, use
the CPI and one of its composite indices - the 'Corruption in Government' score
given by the International Country Risk Guide (which consists of country expert
perceptions), and the World Bank's 'Control of Corruption' variable, while Persson et
al (2003) use the World Bank's 'Government Effectiveness' variable (both World
Bank indices are shaped using business and country expert perceptions, similar to the
CPI).
Such work gives us an indication of how we could go about integrating other
measures. Yet, given that we desire a reliable and valid index, which is independent,
appropriately weighted, and taps corruption specifically, some of the choices made by
these authors seem problematic. Using the International Country Risk Guide variable
alongside the CPI is inappropriate because it is itself a component measure of the CPI.
Scaling it with the CPI would be giving substantial weight to one particular source.
-22-
Political Corruption, Public Opinion, and Citizens' Behaviour
This same problem applies to other impressive indices such as the Opacity Index. 5
Furthermore, 'government effectiveness' involves public service performance broadly,
which consists of much more than the avoidance of corruption. Thus the key
alternative measure to consider first off is the 'Control of Corruption' variable (also
called the 'Graft Index'), included as a dimension in the World Bank's Governance
Indicators data. 6 This variable, although suffering from similar flaws to the CPI, and
indeed sharing many of the sources used to inform it, has the advantages of covering
more countries and of being accompanied by perception and non-perception oriented
variables pertaining to other aspects of governance (one of which being the
aforementioned 'Government Effectiveness' item). This variable also shares with the
CPI the advantage of having sufficient N to be used in quantitative models that
include a reasonable number of control variables.
A simple approach might be to simply scale the CPI and the Graft Index.
However, when one scales the 1998 CPI7 with the 1998 Graft Index,8 one obtains a
bivariate correlation statistic of 0.98 (N= 84). This indicates an extremely high level
of association between the two statistics, and this is unsurprising, given that many of
the sources which the two indices employ are shared (Knack and Azfar, 2000). 9
Essentially, the indices display the same results, although the differences between the
measures are that:
"(The 'control of corruption' variable) weights more heavily those indicators that tend to be most highly correlated with others...the
5 See PriceWaterhouseCoopers (2001). The Opacity Index aims to tap the degree to which there are restrictions on information that facilitates the functioning of effective markets, which might hide corrupt practice. Although the sources of these perceptions are again businessmen, the index is perhaps a sophistication of other businessmen-based indices by focusing on a particular mechanism by which corruption may operate rather than including responses to a broader set of corruption-focusedperceptions.6 See: World Bank (2001).7 Source: Transparency International (2005).8 Source: World Bank (2001).9 These authors find the same correlation statistic between the items using the 1999 CPI.
-23-
Political Corruption, Public Opinion, and Citizens' Behaviour
major difference between the indexes is country coverage...(it also) provide(s) ratings even where there are only one or two underlying data sources" (Knack and Azfar, 2000, p. 9).
So which measure should we choose? One argument may be to use the Graft Index
simply because its country coverage is greater. However, although the 'control of
corruption' variable covers a larger number of countries, this is because fewer sources
are required for a country to be included: indeed, just one is adequate, as Knack and
Azfar (2000) report. In contrast, at least three sources feed into each nation's CPI
score, which implies it is more reliable than the Graft Index (and as many of the Graft
Index sources are the same as the CPI's, there is little weight in arguing they are any
better). Furthermore, the increase in N resultant from using the Graft Index would not
be substantial. Nations that could be included are generally small, authoritarian, and
undeveloped, and other data (that informs control variables and dependent variables in
later chapters) for such nations is often lacking. Hence, this thesis will use the CPI. 10
Yet how does the CPI relate to other corruption indices which include only a
small number of countries? Testing it against these scales enhances our confidence
that it is robust. Several such scales exist, and are worth reviewing before we attempt
to predict them using the CPI. All of them, furthermore, have their own problems,
indicating the overall difficulty in measuring a phenomenon as complex as corruption.
1 I _^ i f\First, there are the Bribe Payers' Index, and BEEPS, which query
businessmen in detail upon the propensity for corrupt activity in given societies, and
integrate responses based on both experience and perceptions - although the two are
undeniably interlinked (Kalnins, 2005). Though tapping experience as well as
perceptions may increase the reliability of responses, this is undermined by the
10 The CPI is besides generally preferred to the Graft Index in existing academic work.11 See: Transparency International (2005).12 World Bank (2005).
-24-
Political Corruption, Public Opinion, and Citizens' Behaviour
potential for the 'winners' of corruption being less likely than the 'losers' to report
corrupt practice. Decreasing this probability by asking questions in a hypothetical or
distanced way raises the problems with perceptions once again (Kalnins, 2005).
Moving on, a recent survey that focuses exclusively on 'experts' in the field rather
than businessmen is the Center for Public Integrity's 'Public Integrity Index'. 13 This
index is compiled of numerous composite indices, the most relevant for our interests
being the 'Anti-Corruption Mechanisms and the Rule of Law' statistics, in which the
assessment of each state's capacity to avoid corruption are evaluated by selected
social scientists and journalists, and summed in an index. To ensure the scores are
valid and unbiased, they are subject to peer-review. Yet this index suffers from a
fallacy recognised by scholars such as Kalnins (2005): states' capability in installing
potential anti-corruption institutions may not be correlated with actual levels of
corruption. Indeed, the assessment of such a capability is highly theoretical, relying on
intricate institutional analysis. Corruption in the messier world of real politics may
evade institutional attempts to capture it, moreover the sheer complexity and diversity
of 'corrupt' behaviour may encourage analysts to adopt a simplistic or biased
interpretation of corruption, and peer review might not detect this.
Thus a survey of prominent corruption indices reveals that measuring and
quantifying such a complicated and evasive phenomenon is unsurprisingly very
difficult. The CPI is not alone in being problematic. Yet how well do these three
smaller indices relate to the CPI? If they are well-related, the likelihood that we are
validly tapping corruption may be argued to increase. The bivariate correlations
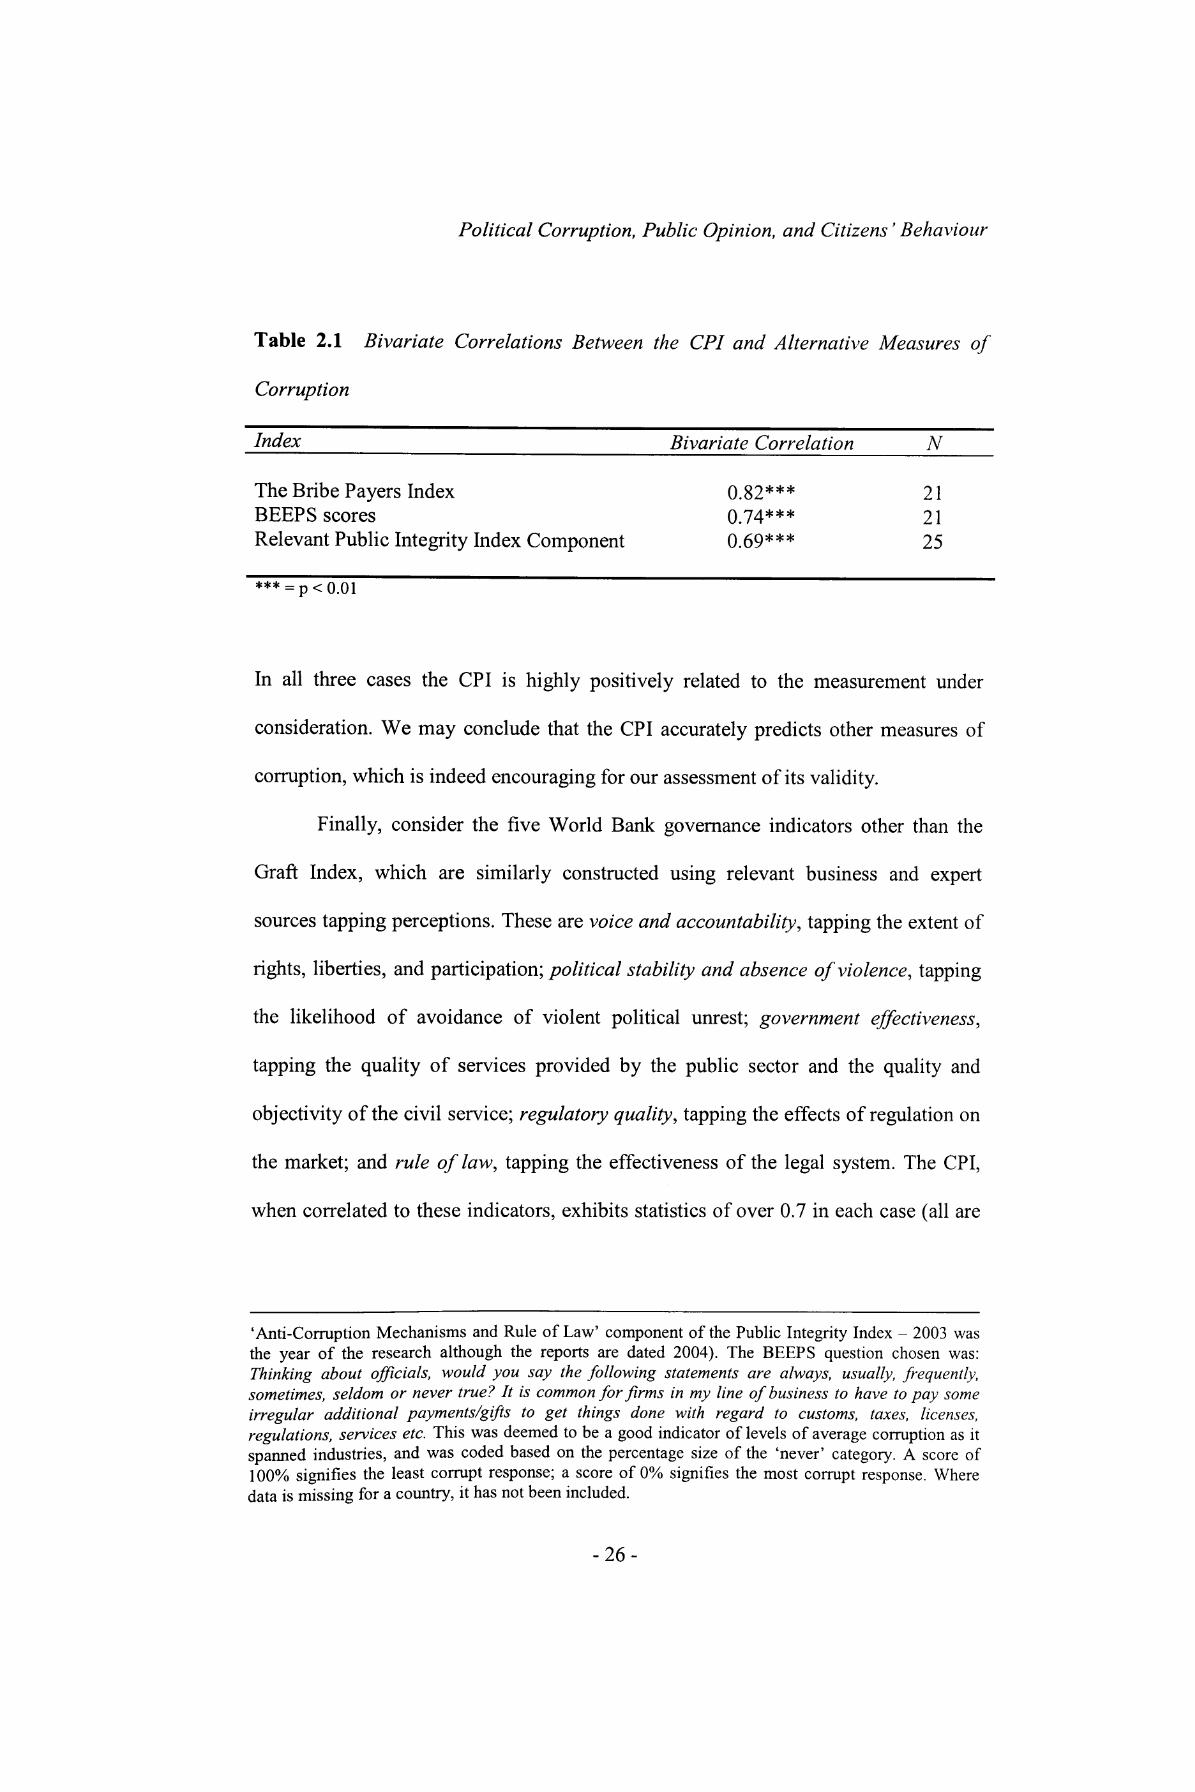
between them, and the CPI, are presented in Table 2.1. 14
13 Center for Public Integrity (No Date).14 The CPI scores pertain to the years in which the other corruption measures are calculated, and country selection for this analysis is based on the countries actually included in the indices being correlated. The years of the indices are: 2002 (the Bribe Payers Index); 2002 (BEEPS); 2003 (The
-25-
Political Corruption, Public Opinion, and Citizens' Behaviour
Table 2.1 Bivariate Correlations Between the CPI and Alternative Measures of
Corruption
Index Bivariate Correlation
The Bribe Payers IndexBEEPS scoresRelevant Public Integrity Index Component
0.82***0.74***0.69***
N
212125
*** _= p<0.01
In all three cases the CPI is highly positively related to the measurement under
consideration. We may conclude that the CPI accurately predicts other measures of
corruption, which is indeed encouraging for our assessment of its validity.
Finally, consider the five World Bank governance indicators other than the
Graft Index, which are similarly constructed using relevant business and expert
sources tapping perceptions. These are voice and accountability, tapping the extent of
rights, liberties, and participation; political stability and absence of violence, tapping
the likelihood of avoidance of violent political unrest; government effectiveness,
tapping the quality of services provided by the public sector and the quality and
objectivity of the civil service; regulatory quality, tapping the effects of regulation on
the market; and rule of law, tapping the effectiveness of the legal system. The CPI,
when correlated to these indicators, exhibits statistics of over 0.7 in each case (all are
'Anti-Corruption Mechanisms and Rule of Law' component of the Public Integrity Index - 2003 was the year of the research although the reports are dated 2004). The BEEPS question chosen was: Thinking about officials, would you say the following statements are always, usually, frequently, sometimes, seldom or never true? It is common for firms in my line of business to have to pay some irregular additional payments/gifts to get things done with regard to customs, taxes, licenses, regulations, services etc. This was deemed to be a good indicator of levels of average corruption as it spanned industries, and was coded based on the percentage size of the 'never' category. A score of 100% signifies the least corrupt response; a score of 0% signifies the most corrupt response. Where data is missing for a country, it has not been included.
-26-

Political Corruption, Public Opinion, and Citizens' Behaviour
also statistically significant at the 1% level). 15 Such high correlations show that
corruption and other aspects of bad governance are highly related, as we might expect.
The Corruption Index
In the CPI, we thus have a usable cross-national measure of corruption, which will
henceforth be simply termed the 'Corruption Index'. To aid simple interpretation as a
measure of levels of corruption, in this thesis it will be coded from 0-10 where higher
values indicate greater corruption (this inverts the original CPI coding). 16
We have, however, acknowledged some potential flaws and difficulties
involved with its use. We may now briefly integrate the two previous sections of this
chapter, and ask how established definitions of corruption, and the chosen index, are
linked. The answer is disappointing. Because of the breadth of the component surveys
which inform the index, and the compilation of responses to numerous questions, the
Corruption Index cannot be sensitive to the subtleties of the competing definitions
outlined earlier. Indeed, Transparency International describe the Corruption Index
very broadly, suggesting that the surveys used to inform it involve questions which
1 T
relate to 'the misuse of public power for private benefits'.
15 Using 1998 data, consistent with the statistics used to correlate the CPI and the Graft Index earlier, and with the data to be used in the next chapter.16 Scatterplots are provided in the appendix in Figures A2a to A2e which confirm the empirical analysis so far. Figures A2a to A2d show the strong relationship between the Corruption Index and other corruption indices discussed above. These plots use the same data used to construct the bivariate correlations, but note that other than the Graft Index, which has been coded equivalently to the Corruption Index, the other indices are coded so that higher scores indicate lower levels of corruption, hence the downward sloping relationship between the variables. Meanwhile, Figure A2e illustrates the strong relationship between the other five measures of governance provided by the World Bank. To maintain parsimony they have been scaled together and coded equivalently to the Corruption Index so we produce a 'bad governance' index that runs from 0-10. The Cronbach's Alpha obtained from the scale is 0.94, which indicates a very high level of reliability.17 Transparency International (2005).
-27-
Political Corruption, Public Opinion, and Citizens' Behaviour
From the theoretical standpoint of this thesis such a broad definition is
undesirable, because we cannot clearly draw out how different forms of corrupt
behaviour offer different incentives for participation or political support. Widespread
patronage, for example, might encourage participation and political support if citizens
aim for a stake in government. Bribery may act to alienate citizens and thus dampen
participation and support for parties seen as corrupt actors. Electoral fraud may act as
a specific incentive to avoid voting on the basis that one's vote may not be accurately
registered. The corrupt actor is also not specified, therefore we cannot draw
conclusions about how the corrupt practice of specific public servants affects citizens'
incentives. Indeed, corrupt practice by judges may theoretically act as an incentive for
reform-oriented voting; corruption by politicians may increase alienation and non-
voting.
Overall, however, we must be content with a pragmatic approach. We may
take heart that many of the sources do orientate around a key form of behaviour -
corrupt practice involving financial transfers to public officials in exchange for
benefits to firms or individuals, and conceive of the Corruption Index as a broad
indicator of corruption across types of public servants. Besides, in view of the
bivariate correlations calculated above, the Corruption Index appears to be tapping
something well-related to alternative measures of corruption, enhancing our
confidence that the Corruption Index is an adequate proxy for an objective
phenomenon that is almost impossible to measure.
Finally, it is necessary to revisit the criticism made by Knack and Azfar (2000),
that the CPI displays selection bias because it focuses on the countries that
businessmen perceive to be productive in terms of investment, and excludes small,
badly governed states. Such selection bias matters for Knack and Azfar, who attempt
-28-
Political Corruption, Public Opinion, and Citizens' Behaviour
to re-examine the link between corruption, country size and economic openness, but
given the tasks of this thesis, the problem is unlikely to matter. There is no obvious
reason why small, badly governed states as a group should have unique patterns of
participation. Bad governance may stimulate significant protest and voting against the
incumbent, but this may occur in large, badly governed states too. Nations of a
smaller size may have somewhat different patterns of participation and political
support - perhaps less regional party opposition to centralised parties than in larger
nations, for instance, but this may occur in small, well governed states too. Essentially,
the multidimensionality of influences on participatory activity in small, badly
governed states suggests that such activity is unlikely to be unique.
It has been argued, therefore, that the judicious strategy is to pursue analysis
using the Corruption Index (albeit with awareness of its flaws). On this basis, we may
proceed to the next chapter, in which analysis of corruption's effects on participation
will be undertaken at the level of the nation.
-29-

Political Corruption, Public Opinion, and Citizens' Behaviour
Chapter 3. National Level Corruption and Citizens' Behaviour
Explaining Political Participation
In this chapter we will undertake the first stage of the analysis of whether political
corruption affects citizens' wider political participation. This will involve examining
whether the Corruption Index, derived in the previous chapter, ties to levels of two
forms of political participation electoral turnout and demonstration activity where
the units of analysis are nations. To help predict whether corruption will have an
effect on these behaviours, we may review three general schools of thought which
presently explain political participation. This discussion, which aims to comprise a
heuristic and concise literature review of approaches towards the problem of
explaining political activity, helps contextualise the focus of this study and enables us
to gain a preliminary indication of how corruption might have an effect. It is also
necessary to examine these explanations to get a sense of the measurements we should
control for when modelling political participation, to ensure corruption has an
independent effect. These schools of thought are clustered as those that focus on a)
resources, b) political culture, and c) organisations, institutions, and rationality.
Resources:
A prominent set of explanations for political participation refers to socioeconomic
phenomena such as upbringing, class, religion, gender, and age, which affect
individuals' resources for political participation. To clarify these arguments, we might
separate such explanations into two categories: those referring to restrictions on
-30-

Political Corruption, Public Opinion, and Citizens' Behaviour
physical resources for participation (such as time and money), and those affecting
cognitive resources (such as understanding and awareness of the issues).
In terms of physical resources, those with greater financial means may be
expected to have greater propensity than the poor to engage in political activity which
requires expense (Verba et at, 1978). The middle classes, as opposed to working
classes, may be anticipated in these terms to participate more. Gender may also be
influential here. Traditionally, women were found to exhibit lower rates of
participation across a multitude of behaviours compared to men (Norris, 2002),
though some scholars find this difference is not significant (Ayala, 2000; Van Aelst
and Walgrave, 2001). Where such a gender gap has shown up, Schlozman et al (1994)
suggest men participate more than women in non-electoral participation in the USA
precisely because of women's disadvantage in terms of resources conducive to
political activity. They particularly emphasise the 'domestic political economy' where
"women have less money and less control over the money in their households than
men do" (p. 986), which is necessary for participation and for financial contributions
to political campaigns.
Regarding cognitive resources, those with greater understanding and
awareness of the political issues in hand may be more likely to participate than those
without. Thus Verba et aVs (1978) class bias may not just relate to the wealth of
citizens directly, but also to their use of resources in obtaining political knowledge,
and their schooling more generally, suggesting that education as well as class may be
important in prompting participation. Meanwhile other variables may affect citizens'
awareness of political issues and the information they are given on them, as well as
the sensitivity with which they react to political events and government policies.
Taking religion, McVeigh and Sikkink (2001) find that contentious tactics in social
-31 -
Political Corruption, Public Opinion, and Citizens' Behaviour
protest are more likely to be accepted by US protestants who are less tolerant of
deviation from Christian morality, believe humans are more inherently sinful, and feel
religion is under threat. Considering elections, Wilcox and Sigelman (2001) find that
religious groups in the USA in the 1990s mobilised citizens to turnout and vote in
particular ways, which shows that the potential power of interest groups to mobilise
support may be greater than that even of parties, because, "the message can be more
narrowly targeted" (p. 534).
Age may also affect the cognitive orientations of citizens, and has been shown
to affect levels of political participation. Tilley (2002), for example, analyses WVS
data and shows that: "as age increases, people are less likely to agree to political
activism, and this seems to be a trend regardless of country" (pp. 242-243). However,
from the observation of other studies we confront the interesting finding that when
considering electoral turnout instead of activism, age has the opposite effect. Older
people appear to vote in higher numbers than do the young (Norris, 2004; Norris,
2002). Tilley notes that the young are often proposed to be divided among the
politically apathetic and the politically active, a notion that is supported by these
opposing results. Thus by affecting physical and cognitive resources, variables
concerning gender, education, religion, and age appear to influence levels and forms
of political participation. Yet perhaps the key resource-based explanation is class and
social stratification, an aforementioned focus of Verba et aVs (1978) seminal study.
With this in mind, however, the predictive power of resource-based
explanations, when applied to modern political phenomena, appears to be limited. In
the last parliamentary elections in three advanced liberal democracies the following
statistics may be reported: the UK had a 61.4% turnout; Canada a 64.9% turnout; and
-32-
Political Corruption, Public Opinion, and Citizens' Behaviour
France a 60.3% turnout. 18 Not only do these rates seem low objectively, but when set
against earlier turnout rates in the same countries we see a clear downwards trend
since World War II. This is contrary to the expectations one might form from the
basis of resource-based explanations: in view of the long-term growth of living
standards, education levels and the middle classes, increased political activity should
be expected over time, not evidence of lower participation (Evans, 2003). Hence,
while resource-based explanations are useful, they are clearly incomplete.
Political Culture:
Political cultural explanations of citizens' behaviour associate participation with
individuals' orientations toward the political system, spanning feelings of political
trust, alienation, political efficacy and political cynicism. Let us take alienation first, a
concept scholars usually seek to operationalise as a variable tapping the extent to
which a citizen feels excluded by politics, along with the closely related concept of
political efficacy, which tends to refer to the extent that a citizen feels they wield
influence in the political system. Reef and Knoke (1999) identify several works which
are concerned with the effect of citizens' alienation from political processes or of
citizens' perceived political inefficacy. McDill and Ridley (1962), for example,
observe that failure to vote or be aware of the issue at stake is well correlated with
feelings of political powerlessness. Thompson and Horton (1960) show that political
alienation has a small but negative effect on levels of turnout, and Olsen (1969)
reports that levels of perceived political 'incapability' and 'discontent' are a good
predictor of voting patterns. Sometimes such studies include concepts of alienation
that touch on politicians' behaviour. Finifter (1970), for example, calculates that
18 Source of Data: Idea International (2006). The statistics reported are percentages calculated from votes over registered voters.
-33-

Political Corruption, Public Opinion, and Citizens' Behaviour
perceived political 'normlessness', defined as perceptions that politicians are not
obeying rules and norms in the political system, has a weak inverse correlation with
political participation, while perceived powerlessness has a strong inverse correlation.
Citrin and Muste (1999) identify authors who suggest that political 'cynicism',
derived particularly by perceptions concerning political 'trust', is a determinant of
political activity. On the one hand, Muller and Jukam (1977) find a correlation
between mistrust in government and aggressive political participation, although this
effect dissolves when political support is controlled for. 19 On the other hand, Parker
and Parker (1989, cited in Citrin and Muste, 1999) observe that their 'trust in
representative' variable is an important determinant of voter turnout. A broader form
of trust - social trust, or the propensity to believe the bulk of citizens or society is
trustworthy, may also affect political participation. Scholars such as Putnam (1995a)
and Stone (2001) have suggested that 'social capital', or productive sets of
relationships in society that enable co-ordination between individuals, links to greater
trust in society. It is reasonable that such co-ordination may translate into political
20participation.
Yet one of the most significant problems with political cultural analysis
involves the ambiguity of the concepts used. Whereas Parker and Parker construct
their scale of trust in government based on respondents' views on honesty and
keeping promises, representative capacity, and selflessness, Muller and Jukam
construct a scale based on how far politicians 'do the right thing', 'act as they should',
and speak the truth to the media. Such perceptions will surely involve each
19 Muller and Jukam (1977) define 'aggressive' behaviour as that which: "encompasses overt political actions which, if manifested by segments of society that are powerful or sizeable, can threaten the stability of the regime" (p. 1564). Their measure involves non-payment of tax or rent, wildcat strikes, occupying buildings, fighting with other participants or the police, and revolutionary activity.20 It is also conceivable, and under-acknowledged, that social capital may have negative effects. Trust and norms of reciprocity may form the basis of organisations such as the Mafia, terrorist groups, and, perhaps, networks of corrupt public officials and those who engage in illicit exchange with them.
-34-
Political Corruption, Public Opinion, and Citizens' Behaviour
individual's ideological stance: can a politician of the left enacting left-wing policies
ever do 'the right thing' from the perspective of a voter on the right? To advance this
theorising, it would be helpful to better define attitudinal explanations, and some
recent work has looked to do this. Inglehart (1997) shows that postmaterialist values
(which refers to the prioritisation of values related to democratic quality and civic
rights and liberties) tie to decreased party-oriented behaviour, as parties tend to
represent materialist interests, and increased unconventional behaviour, as those with
postmaterialist orientations tend to have been socialised in secure nations in which
there are time and resources for political education, an awareness of key issues, and
the means to participate in attempts to influence them.
Thus co-joining resource-based explanations of political participation are
political cultural, attitudinal factors. Controlling for such items in models of behaviour
which include individual level variables is therefore essential.
Organisations, Institutions, and Rationality:
Other explanations of participation emphasise the effects of institutional features of
the political system, or of social and political groups, on the individual citizen. Indeed,
individuals' participation in organisations is often shown to correlate well with their
levels of political participation. This may relate to the ability of groups to mobilise
political action. We have already outlined Wilcox and Sigelman's analysis tying
political activity to mobilisation by religious groups. Yet organisational membership
also links to ideas about political culture, especially the concept of 'social capital'. If
social capital is facilitated by 'social connectedness' (Putnam, 1995a) and 'networks
-35-

Political Corruption, Public Opinion, and Citizens' Behaviour
of social relations' (Stone, 2001), then organisations may act to promote co-ordinated
political participation.21
Institutional explanations of participation are linked most solidly to turnout.
Powell (1980) finds that voting laws and party competition are key explanations for
turnout in 30 democracies. Jackman and Miller (1995) report that institutional
determinants shape a 'reasonable explanation' of turnout in advanced democracies,
while cultural variables are less salient. Franklin (2004) suggests that socioeconomic
and cultural variables generally fail to increase the variance explained in models of
turnout, and instead emphasises the explanatory power of the nature of elections
themselves, which involves the immediate effects of competition and entrenched
institutional factors: "(t)urnout declines, if it does, because elections change their
character" (p. 147). Finally, Norris (2004) points to the importance of institutional
rules and procedures as prominent effects on levels of voting.
In the proceeding outline of independent variables, the specific incentives
offered by institutional structures will be discussed, yet for now it is adequate to
acknowledge the core of these explanations: the behaviour of rational individuals
responds to institutional signals. In this sense, these theories are linked to rational
choice assumptions and modelling of participation, initiated by Riker and Ordeshook
(1968), who developed the work of Anthony Downs. In such calculations, the costs
and benefits of voting (including utility gained from the satisfaction of exercising
one's electoral civic duty) are said to be crucial to citizens' decisions over whether to
21 However, mobilisation and organisations are themselves unable to function without adequate resources, and without strategic and institutional opportunities to enable political behaviour. Indeed, Delia Porta and Diani (1999) argue that social movements' characteristics are shaped by institutional influences on opportunities for action, along with determinants relating to social movements' allies and their opponents' behaviour. Tilly (1979) has suggested that disaffection with the status quo and desire for change are not enough to induce social movement activity, and that the internal organisation of groups, and the opportunities and 'repertoires' available to them are crucial to their functioning. Similarly, Freeman (1979) emphasises the importance of social movements' human and financial resources, and their need for adequate capacity and information to push for change.
-36-

Political Corruption, Public Opinion, and Citizens' Behaviour
vote or not. Of course, rational choice models are subject to considerable criticism.
Following data analysis employing frameworks given by rational choice models
which seek to explain participation, Whiteley (1995) challenges rational choice
assumptions after finding that "activists are motivated by expressive concerns and by
a sense of collective efficacy" (p. 227). He suggests that a deeper notion of rationality
is required, to avoid an overly narrow focus on individual decision-making and to
understand the rational basis of collective behaviour.
Thus, in reality, no branch of theorising aimed at explaining political
participation, whether based on resources, culture, institutions or organisations
appears to be complete. Indeed the complexity of participation means a complete
explanation is very unlikely to emerge. Yet these different types of explanation offer
helpful inroads into framing expectations concerning the potential impact of
corruption on behaviour, and having reviewed these explanations, we may also ensure
we try to tap variables core to them when modelling participation.
Categorising Participation and the Potential Impact of Corruption
An important point that can be taken from a review of work on participation is that
categorisations of political participations are often not discussed in depth; more often,
specific participatory activities are analysed. Turnout, for instance, is the focus of
Franklin (2004); protest activity is the focus of Kitschelt (1986). Other works
construct scales of participation which provide a continuous measurement of political
behaviour which include more than a single item. Schlozman, Burns, and Verba
(1994), for example, construct a scale which includes voting alongside other forms of
behaviour; while Tilley (2002) uses a scale of 'political action'.
-37-
Political Corruption, Public Opinion, and Citizens' Behaviour
Moreover, in the present literature there is considerable reliance on a
'conventional' - 'unconventional' dichotomy to help categorise political participation.
Evans (2003), for example, distinguishes between conventional political participation
and unconventional political participation, including voting and being a member of a
political party as conventional behaviour, while items such as protest and
demonstration participation and directly aggressive political behaviour are construed
to be unconventional political participation. Janda et al (2002) also emphasize the
division between conventional behaviour and unconventional behaviour, suggesting
that the former involves common, institutionalized means of participation which may
intend to support or influence the government, while the latter involves less common
acts that are usually defiant in their format, intended to challenge government policy
through more direct means. Meanwhile Brady (1999) splits participation into indirect
actions (such as political discussion), electoral activity, non-electoral conventional
behaviour, and non-electoral unconventional behaviour. Non-electoral conventional
behaviour includes items such as informal political contacts or organisational
membership; non-electoral unconventional behaviour includes petitioning,
demonstrations, boycotts, wildcat strikes, occupation or blocking transport routes, rent
and tax evasion and even vandalism, assassination and terrorism.
However, the conventional - unconventional dichotomy is contentious, as
indicated by the initial problem that scholars appear to include the same behaviour in
different categories. Whereas Brady (1999) excludes voting and party membership
from the 'conventional' and 'unconventional' labels, for example, Evans (2003)
incorporates both in the conventional category. This leads to a key question: what are
the appropriate criteria for differentiating between 'conventional' and
'unconventional' behaviour? Brady (1999), for example, appears to associate
-38-
Political Corruption, Public Opinion, and Citizens' Behaviour
unconventional participation with behaviour that is rarely undertaken, and may be
illegal or aggressive. Yet is it therefore consistent for Brady to include organisational
membership and serving on boards in the conventional category, given that partaking
in these behaviours may actually be quite rare, while petition-signing, which may be
more common, is classified as unconventional behaviour?22 Meanwhile, Janda et a/'s
(2002) conception of conventional behaviour as habitual and institutional, and
conception of unconventional behaviour as uncommon and system-challenging, is
simplistic. Voting for an anti-system party, for example, uses institutions but at the
same time challenges the system.
Instead of relying, therefore, on the flawed and ambiguous 'conventional' and
'unconventional' distinction, an alternative distinction may be postulated separating
behaviour in which citizens use or involve existing political institutions, and
behaviour which is extra-institutional. Although this distinction involves a complexity
relating to multidimensionality that will be discussed later, it will be argued that this
divide is more tangible than the vague conventional - unconventional dichotomy, and
is useful when considering the potential effects of political corruption on forms of
political behaviour.
To understand this distinction one must first consider the meaning of 'political
institutions'. Political institutions refer to forums, procedures and organisations that
have persisted over time, and form, collectively, a set of rules and processes to enable
politics in a nation to function. Institutions include, for example, electoral systems and
voting procedures, political parties, legislatures and constitutional courts. It is clear
that some behaviours occur within existing institutions: voting, for example, makes
use of the electoral system and electoral processes. Political party membership and
22 To be sure, Brady does acknowledge this problem.
-39-
Political Corruption, Public Opinion, and Citizens' Behaviour
activism involves a political institution directly. In contrast, other behaviours take
place independently of political institutions, such as demonstrations and boycotts.
These 'extra-institutional' behaviours differ from 'institutional' ones.
This distinction is useful. It is more tangible than the vaguer notions of
conventional and unconventional behaviours. Petition-signing or party membership,
which may be difficult to locate in conventional or unconventional categories when
the guiding criterion is the extent to which these activities occur, are clearly extra-
institutional and institutional behaviours respectively. Furthermore, the categories are
analytically complete: the 'universe' of behaviours is encompassed by a distinction
which is based on an X (institutional) or not-X (extra-institutional) classification.
The institutional - extra-institutional distinction is nonetheless not without
some complexity. Primarily, it may be subdivided. For example, participation may
also be classified in terms of whether it is enacted with the intention of fundamentally
challenging the political system in place. A political system is the collective grouping
of political institutions in a given polity, the regime in place, and the civil society in
operation. In a democracy, any political participation which has the intention of
removing the political system, such as an attempted coup, certainly differs from those
that take place with no intention of fundamentally challenging it, and this distinction
may for our purposes be important. Indeed, political corruption may create alienation
and mistrust that encourages anti-system behaviour and anti-system behaviour may
take both institutional and extra-institutional forms. It may represent protest or even
revolutionary activity, and this is clearly extra-institutional. However it may also take
the form of joining or voting for a party that is anti-system. Essentially, therefore, we
confront the interesting problem of multidimensionality complicating the institutional
- extra-institutional distinction.
-40-
Political Corruption, Public Opinion, and Citizens' Behaviour
However our distinction may be defended on the grounds that the number of
behaviours representing institutional, anti-system participation is likely to be heavily
outweighed by institutional pro-system participation. Indeed, a high prevalence of
support for anti-system parties would be likely to disrupt democracy and may create
anti-democratic conditions in which political participation would be suppressed.
Moreover, given that anti-system participation may be disorderly, it is probable much
of it would take place outside the framework of existing political institutions. So long
as we are aware of the issue of multidimensionality, so we may look for sub-
categories when we predict different behaviours, thus facilitating nuanced analysis.
Hence, how may we relate this categorisation of political participation to the
potential effects of political corruption? First, it would be a mistake to regard the
argument underlying this chapter as a belief that corruption has direct effects on
participatory outcomes. Rather, corruption is likely to have indirect effects on the
broader political system which feed into the participatory choices of the citizenry,
whereby the actual issues immediately motivating participation may be diverse, and
are indeed too numerous to be specified exhaustively. More specifically, we must first
assume that citizens are responsive and aware of political corruption, perhaps as
corrupt individuals are caught and punished, or through media reports or even
informal knowledge and rumours of corruption. We may then suggest that corruption
signals to the masses that institutions are either inadequate, that is, they are unable to
contain corrupt practice; or that institutions are inherently biased towards those that
profit from corruption when in office. It might even signal that institutions (such as
the police in highly corrupt nations) are themselves part of the corruption problem.
Culturally, corruption may undermine the relationship between those that are corrupt
and benefit from such malpractice, and the majority of the citizenry who are unlikely
-41 -
Political Corruption, Public Opinion, and Citizens' Behaviour
to benefit. It may undermine norms of trust between rulers who engage in corrupt
activity, and the ruled, and thus alienate citizens, creating a sense of inefficacy and
resentment towards holders of public office. A coherent and unitary political culture is
hence unlikely to be evident in areas that are particularly corrupt.
From this basis that corruption may result in citizens mistrusting established
political institutions and the political elite it is feasible that where corruption is
substantial a sense of inefficacy and apathy towards institutional participation in
politics is likely to result, in turn leading to dampened levels of activity such as
voting. That is, of course, unless citizens are willingly complicit in corrupt
transactions. However given that inequality appears to tie to corrupt practice (You and
Khagram, 2004), and that many citizens may resent participating in transactions in
which officials abuse their power, it will be assumed that willing compliance is
restricted, perhaps more evident among entrepreneurs who stand to gain significantly
from elite-level transactions. Instead, citizens might, for instance, question the point
of voting in legislative assembly elections if the legislative assembly appears not to be
able to contain corruption.
Regarding extra-institutional participation, our expectations must be a little
more complex. Although it is feasible that antipathy and disillusion with political
institutions will prompt more extra-institutional behaviour as levels of corruption
increase, it may not be the case that this association is linear. Instead, in highly clean
23 There is, admittedly, a theoretical basis from which to predict that turnout can be stimulated by high levels of corruption, but under specific conditions. Indeed, Gillespie and Okruhlik (1996) identify several contexts in which a corruption clean-up might occur. They identify a 'post-election' context, observed in the cases of Singapore, Mexico, India and the Philippines, in which new governments are motivated to stem corruption in the hope of obtaining support and consolidating themselves electorally. If this type of situation is common, perhaps in corrupt nations turnout may be positively motivated, if non-incumbent parties in corrupt nations are popularly believed to fulfil promises to clean-up. Nonetheless, it is assumed that such a context is rare. An opposition party must be credible in its promises to stem corruption, and perceived to be more scrupulous than the incumbent, which may be difficult in a political system in which corruption appears endemic - a widespread phenomenon rather than a fragmented one. In consequence, it is predicted that in a broad, cross-national context, the dampening effect of corruption on turnout will outweigh its capacity to incite it.
-42-
Political Corruption, Public Opinion, and Citizens' Behaviour
nations, the responsiveness and efficacy of public servants may mean that any form of
participation, including extra-institutional behaviour, is promoted. It may simply be
that passionate causes invite more direct means of participation which involve a body
of citizens expressing their demands together, causing citizens to choose extra-
institutional behaviour, such as attending demonstrations, ahead of institutional
behaviours such as lobbying politicians. Therefore two effects may be at work: first,
in highly corrupt nations, considerable extra-institutional participation as institutions
are deemed inefficient and inadequate; second, in highly clean nations, considerable
extra-institutional participation simply because public servants are highly responsive
and scrupulous and react well to citizen demands, whatever means are used to express
them. In consequence it is plausible that the lowest levels of extra-institutional
behaviour will in fact occur where levels of corruption are neither particularly high or
particularly low - where neither of these effects act to motivate citizen action.
To test these claims, two dependent variables at the national level electoral
turnout and demonstration activity will be used. These are ideal participatory
activities to consider: voting is a central institutional behaviour in democracy,
involving constitutionally entrenched electoral institutions and political parties, and
deriving an outcome leading to the composition of a nation's legislature and, in
parliamentary systems, its executive. Demonstration activity, meanwhile, embodies
motivated extra-institutional behaviour. It takes place outside of established
institutions: on the streets, for examples, or outside factories or parliaments, and it is a
form of participation that does not follow or accord to procedures laid down by a
country's constitution. On the basis that voting is institutional behaviour, and
demonstration activity is extra-institutional behaviour, and following the theoretical
reasoning above, we may therefore state the following hypotheses:
-43-
Political Corruption, Public Opinion, and Citizens' Behaviour
HI: Greater political corruption predicts lower electoral turnout.
H2: Demonstration activity will be highest where political corruption is particularly
low and particularly high, and lower among intermediate nations.
We may move on to ask how previous literature has attempted to address the themes
and hypotheses being discussed. But the literature is sparse. Delia Porta (2000) reports
that political corruption and scandals link to distrust in government, but that this
carries over into mixed effects on participation. The lack of a tidy finding is not
altogether surprising given that only three nations are under extensive analytical
scrutiny in her study. To make the claim that corruption and participation fail to have
a coherent link requires more widespread evidence than that which she presents. The
larger country N in this thesis will test this claim robustly.
Bravo-Ortega and Hojman (2002) find that turnout and political corruption are
inversely correlated. The scholars suggest people are put off voting because the
benefits of doing so are undermined by corrupt politicians. This has a 'feedback'
effect so that in a corrupt nation, non-corrupt, scrupulous individuals are disinclined
to run for office as low turnout signals public pessimism and disdain for elected
officials. The sensibilities of those unwilling to be corrupt simply make other career
options more attractive. What results, therefore, is a situation of mutual causality.
From rational decision-making perspectives both voters and politicians perpetuate
corrupt practice, and low turnouts are both a cause and consequence of this. The
model reports that turnout and corruption are thus jointly determined in equilibrium,
-44-
Political Corruption, Public Opinion, and Citizens' Behaviour
and that in corrupt nations "the wrong sort of people are always in power because they
would not be in power if they were not the wrong sort of people."24
Bravo-Ortega and Hojman's (2002) suggestion that corruption prompts low
turnout is comparable to the theoretical basis of this chapter, as it suggests corruption
prevents voters from fulfilling their political demands which, in turn, affects
institutional participation. They also suggest that low turnout prompts continued
corrupt practice, which essentially inverts the causal direction assumed in this chapter,
and may be true in some circumstances - indeed, electoral fraud may act as a clear
incentive for non-corrupt potential politicians not to bother standing in elections.
However, with other forms of corruption such as financial misdemeanour and bribery
(which, as we have seen, is the key sense of corruption involved in the Corruption
Index) this link is less clear, as reformist candidates may attract support.
Furthermore, there is a key difference to our methodology to that adopted by
Bravo-Ortega and Hojman (2002). Their variable tapping corruption is derived from
IV regression: the fitted values of the prediction of an older, now unavailable
o ^ccorruption index, where the instrument is a measurement of 'natural openness' of
the economy, a measure constructed by Wei (2000). At first this may seem a
confusing route to pursue: indeed they do not discuss the link between corruption and
openness of economies in depth, merely referring the reader to other works such as
Treisman (2000). It is true that Treisman finds a relationship between corruption and
economic openness, but he specifically indicates that this is weak: "Openness to
foreign trade apparently reduces corruption. But here, too, the effect is depressingly
small. To make a noticeable difference to a country's level of perceived corruption
would require a radical opening rather than a marginal shift" (p. 439). In Bravo-
24 Attributed to Jon Wynne-Tyson.25 They use the corruption index from the Political Risk Indicators Database by 'Iris', yet this index could not be retrieved.
-45-
Political Corruption, Public Opinion, and Citizens' Behaviour
Ortega and Hojman's defence, their use of Wei's natural measure of openness, which
takes into account 'national geographic and size variables', helps validate their
variable. Indeed Treisman draws attention to how the impact of openness on
corruption is liable to be influenced strongly by whether a nation is large or small. But
what is confusing is why Transparency International and Business International data,
which Wei (2000) himself uses to test how well his measure of openness fits with
corruption, is not used by Bravo-Ortega and Hojman themselves. This gap is
something the research in this chapter will fill.
Data
The data informing the regression analysis linking corruption and participation will be
specific to 1998. 26 This is not an arbitrary choice, and several reasons justify this
focus. First, in the following chapter involving multilevel modelling much of the
individual level data used concerns the period 1995-98, so it is consistent to centre
analysis on a time period in this bracket. Second, 1998 is preferable to 1997 or before
because of the development of corruption indices by this stage. Transparency
International's 1998 Corruption Perceptions Index (CPI), the indicator used to proxy
corruption, covered 85 countries (listed in Table A3.1 of the appendix), while in the
1997 CPI, only 52 countries were included, a consequence of an increased number of
sources being available from which to calculate a score, and a reduction in the
minimum number of such sources required for a country to be included: from four to
three. 27 Although subsequent CPIs cover more countries, many of the newly added
26 In the case of turnout, the national election in each country which is nearest to the year 1998 (on either side) will be analysed.27 Source: Transparency International (2005).
-46-
Political Corruption, Public Opinion, and Citizens' Behaviour
ones are nondemocratic or recently democratised, which often makes turnout data
unavailable. Third, much of the required national level data in the late 1990s, in
contrast to some of the data in later years, is readily available, and this is a pressing
concern given the importance of controlling for other plausible explanations for
political participation.28
We have two dependent variables. Turnout data is relatively easy to locate,
provided by Idea International (2006), an organisation that embarks on significant
amounts of research concerning levels of and trends in political participation over the
globe. However, a choice between two alternative measures is necessary - votes over
registered voters, or votes over voting age population, and the former measure has
been chosen for the research in this chapter. One reason for this is that from
observation of both sets of statistics, the votes over registered voters measure seems
more reliable. Indeed in some elections the votes over voting age population statistic
exceeds 100%, indicative of very considerable error.29 Franklin (2002; 2004) reports
that population data tends to be unreliable, criticises it for failing to take into account
individuals who are ineligible to vote, and chooses to use voters over registered voters
in his influential work on the determinants of turnout. Although Idea International
warns that electoral registers may be inaccurate or may not be used, given the
plausible inaccuracy of calculations of the voting age population, and the certainty
that by being registered, the citizens we are analysing are able to exercise the choice
to vote or not, the turnout measure involving registration will be preferred. 30 The
28 At the time of writing, national level data on demonstration activity is, for example, not available beyond the year 2000. Turnout scores for many countries also take time to compile, and a substantial lag in data availability is evident.29 For example, at the time of writing, Idea International (2006) reports that the Votes / Voting Age Population measure for Malawi's legislative election of 1999 is 105.9%, and for its presidential election of the same year, this statistic is 107.6%.30 Although some voters who are alienated by the system could choose not to register. This is a plausible problem, but in view of the numerous factors that may lead to non-registration other than alienation: apathy, insufficient awareness of politics, illiteracy, practical or administrative difficulty
-47-

Political Corruption, Public Opinion, and Citizens' Behaviour
turnout statistics pertain to the nearest legislative (lower house or unicameral
chamber) election to 1998 for each nation; the highest in the sample is that of
Singapore, at 95.9%, the lowest is that of the Ivory Coast, at 31.5%.
Data on extra-institutional participation at the national level is harder to find,
however data pertaining to demonstrations in each nation in 1998 has been obtained
from Jenkins and Taylor's World Handbook of Political and Social Indicators IV
project, an extensive dataset that seeks to code political and social actions for nations
across time. 'Actions' refer to activity reported by Reuters that can be logged within
one of the categories specified in the project. Other 'actions' include, for example,
reported comments, requests, complaints and threats by actors, alongside sanctions,
expulsions, seizures, the use of force and economic activity.
The operationalisation of 'demonstration activity' requires discussion. One
way to tap demonstration activity is simply to use the number of reported
demonstrations in each country being analysed. A second way might be to divide
numbers of demonstrations by each nation's population, to tap 'demonstrations per
person' and to ensure significant numbers of protests are not simply a consequence of
a large politicised society. Yet these measures are methodologically problematic. In
particular, Reuters is the source of information, which may produce a bias towards
news coverage of Western nations and inflate their scores.
Hence the chosen measure will be scores that report for each nation the
percentage of 'all actions' that are categorised as demonstrations, or as anti-
demonstration armed force mobilisation. 31 Of course, this raises questions too. The
(even corruption itself if it extends into the electoral process), unwillingness to be on national or regional list of voters for exogenous reasons (attempted avoidance of local taxation is one motive in the British case), it is assumed that this worry is of little importance.31 It is recognised that the second component of this variable, referring to armed force mobilisation, may inflate the measure of demonstration activity for very repressive states that are simply more inclined to mobilise armed forces to suppress citizens' protests. However, when authoritarianism is
-48-

Political Corruption, Public Opinion, and Citizens' Behaviour
statistics derived indicate only the relative propensity of citizens in each nation to
engage in demonstration activity, set against other actions. There may be a particular
concentration of certain actions in some states because of characteristics that act as
incentives for them: 'threats' and 'seizures', for example, are more conceivable in
states that have unstable political regimes. Nonetheless, there is a large spread of
actions in the dataset, meaning that high values for particular forms of action should
be diluted by the volume of actions reported. It is notable that no-one has considered
operationalising demonstration activity in this form before, despite it being the most
valid measure available. The percentage scale runs from 0 (exhibited by a few
nations) to 8.7 (Bolivia's score).
The strategy is thus to predict these two dependent variables with a host of
independent variables, which can now be defined. The key variable to be analysed in
this chapter is the Corruption Index, which has been extensively discussed in the
previous chapter. This variable, though clearly not an objective indicator of levels of
corruption across countries, is a justifiable proxy. As mentioned in Chapter 2, it will
be coded so that higher scores signal greater corruption.
At this stage we may undertake some basic data analysis to see how the key
independent variable and the two dependent variables relate. The following table of
bivariate correlations provides an initial indication: corruption and demonstrations are
positively related, and corruption and turnout are negatively related.
used to predict demonstration activity, it fails to be explanatory, suggesting that this concern is unproblematic.
-49-
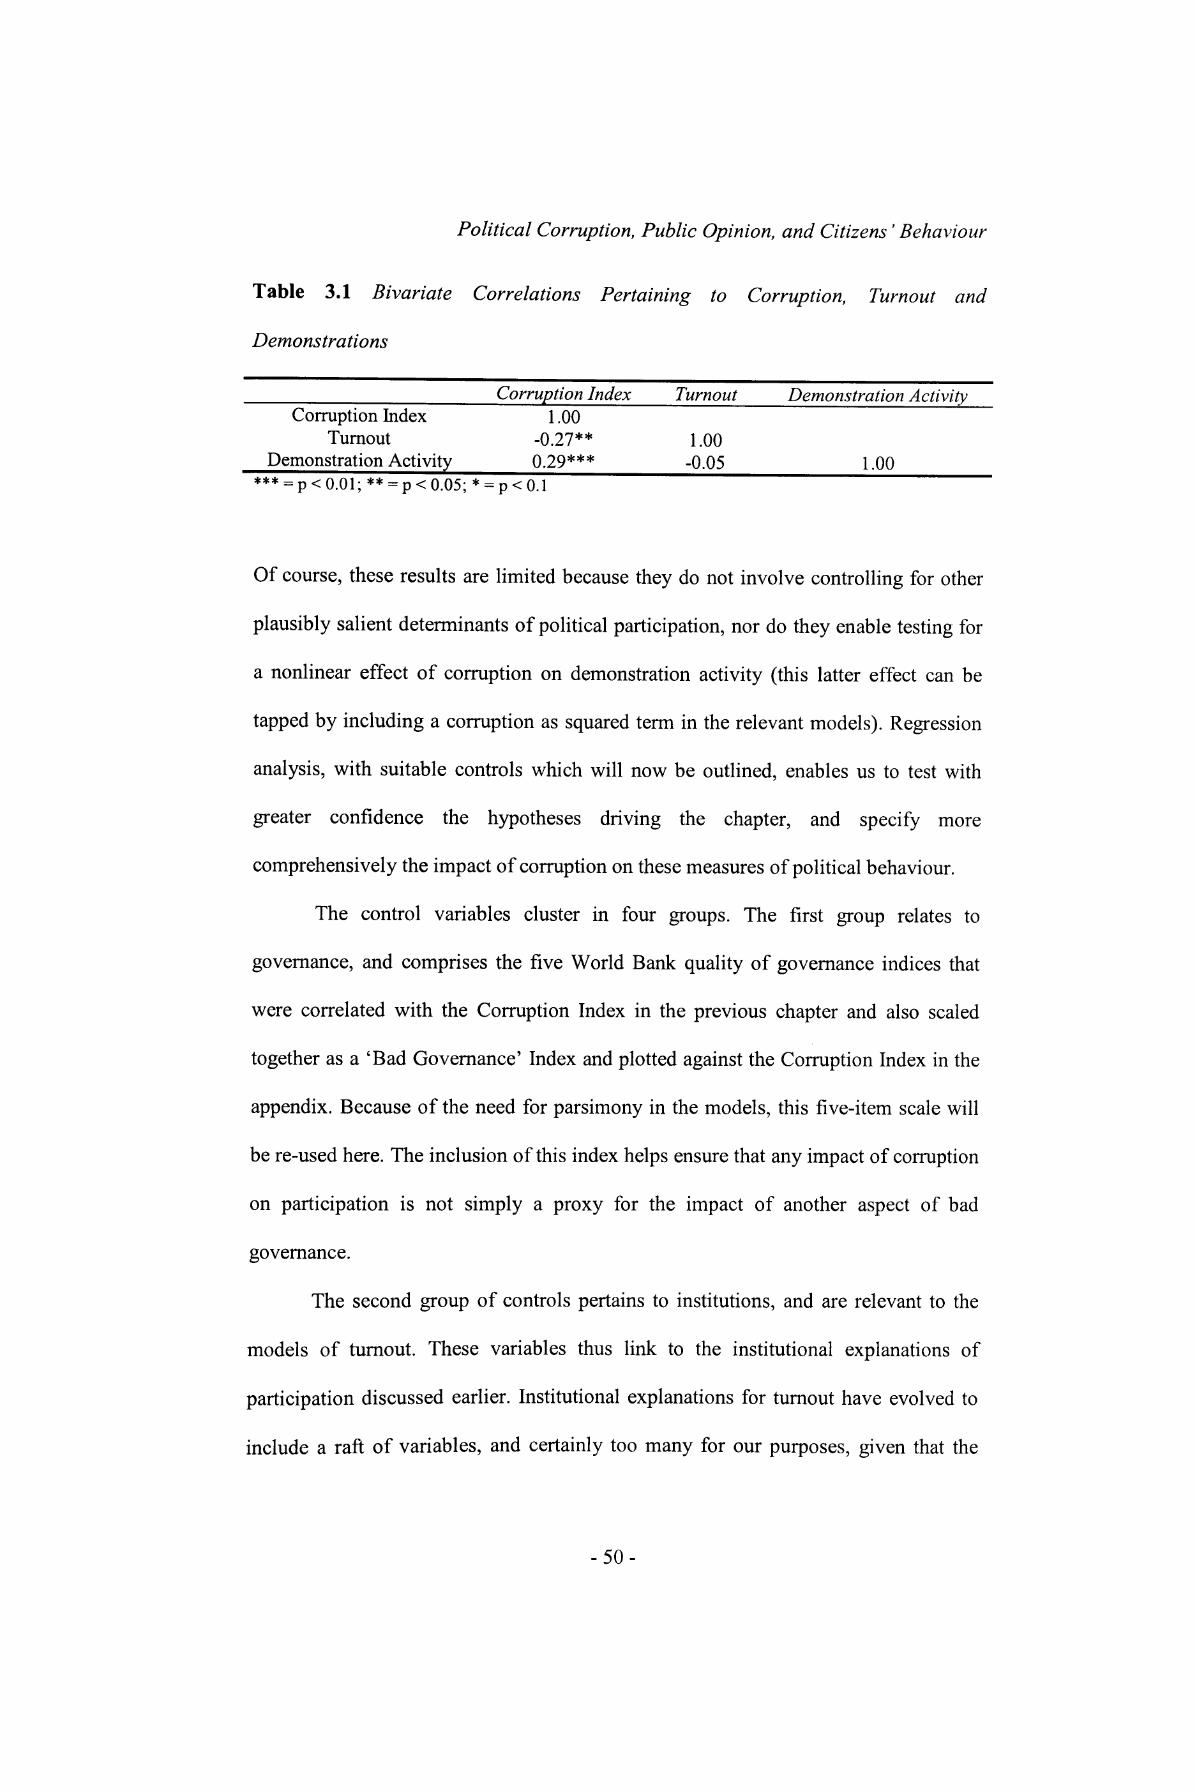
Political Corruption, Public Opinion, and Citizens' Behaviour
Table 3.1 Bivariate Correlations Pertaining to Corruption, Turnout and
Demonstrations
__________________Corruption Index___Turnout_____Demonstration Activity Corruption Index 1.00
Turnout -0.27** 1.00Demonstration Activity_____0.29***______-0.05__________1.00_______
*** = p < o.Ol; ** = p < 0.05; * - p < 0.1
Of course, these results are limited because they do not involve controlling for other
plausibly salient determinants of political participation, nor do they enable testing for
a nonlinear effect of corruption on demonstration activity (this latter effect can be
tapped by including a corruption as squared term in the relevant models). Regression
analysis, with suitable controls which will now be outlined, enables us to test with
greater confidence the hypotheses driving the chapter, and specify more
comprehensively the impact of corruption on these measures of political behaviour.
The control variables cluster in four groups. The first group relates to
governance, and comprises the five World Bank quality of governance indices that
were correlated with the Corruption Index in the previous chapter and also scaled
together as a 'Bad Governance' Index and plotted against the Corruption Index in the
appendix. Because of the need for parsimony in the models, this five-item scale will
be re-used here. The inclusion of this index helps ensure that any impact of corruption
on participation is not simply a proxy for the impact of another aspect of bad
governance.
The second group of controls pertains to institutions, and are relevant to the
models of turnout. These variables thus link to the institutional explanations of
participation discussed earlier. Institutional explanations for turnout have evolved to
include a raft of variables, and certainly too many for our purposes, given that the
-50-

Political Corruption, Public Opinion, and Citizens' Behaviour
sample of nations for which we have corruption data number only about 80. 32 Indeed,
as a result of this focus, it is also not possible to replicate others' models of turnout
and to simply add corruption in: corruption data is recent and limited, which restricts
sample size and acts as an incentive to keep models parsimonious. Consequently it is
our aim to integrate the most useful institutional explanations found in the literature
into the turnout model presented.
One variable which is uncontentious to include when considering voter turnout
is compulsory voting. Countries which enforce a law for compulsory voting are likely
to exhibit higher rates of turnout than countries that do not (Powell, 1980; Jackman
and Miller, 1995). Voters face a range of sanctions, according to the nation, which
include having to provide an explanation, paying a fine, or even being imprisoned.33 It
is therefore highly appropriate to control for the variable, and a dummy variable will
be included which taps whether the country enforced a nationwide law for
compulsory voting or not at the time of the particular election. 34
Also potentially pertinent to voters are indicators of the competitiveness of the
system and the degree to which he or she is likely to perceive their vote as efficacious.
Indeed it is likely that party competition acts as an incentive to vote. Franklin (2004),
for example, finds this is the case, and suggests that: "(h)igh margins of
victory...stand in the way of the individual vote having clear and immediate
32 This contrasts to, for example, Franklin (2004), who does not look at whether corruption is an explanatory variable. As corruption indices were unavailable before the mid-1990s, his dataset is thus able to be less restricted, and his national level models of turnout include elections from 1945-1999. This enables a vast array of institutional variables (some significant and some not) to be included: time since previous election; numerous measures of competition; party discipline; female franchise; executive power; lagged turnout; absentee and weekend voting laws; proportionality and the electoral system; district magnitude and electorate size; electoral decisiveness; party polarisation; coalition government; along with generational effects which interact with institutional factors. As Franklin's focus is to generalise explanation of turnout, this is all very well, but as we focus on the plausible effect of corruption, we must assume a more selective, parsimonious approach.33 Source of information and for data pertaining to this variable: Idea International (2006).34 Some states, such as Austria and Switzerland, only practice compulsory voting in particular regions, and will not be classed as having compulsory voting given that we are dealing with national elections. Furthermore, states which provide for such a law but do not enforce it will also be classed as not having compulsory voting.
-51 -
Political Corruption, Public Opinion, and Citizens' Behaviour
consequences" (p. 112). Indeed, the lack of competition between parties (and indeed
difference in policy positions among parties) has been cited as a reason for low
turnouts in recent Labour-dominated British elections (Clarke et al, 2004; Evans,
2003). On the other hand, it may be that a dominant party attracts 'bandwagon'
support, resulting in high levels of turnout even where party competition is weak.
Indeed, empirical work has shown contradictory effects of measures of competition.
Norris (2004) finds that multipartyism increases turnout, suggesting it expands choice
for voters, but also reports that turnout grows with vote share for the dominant party
(perhaps revealing a 'bandwagon' effect). 35 Meanwhile Jackman and Miller (1995)
report that multipartyism decreases turnout, suggesting that it can lead to coalition
formation, putting off voters by failing to procure a decisive result. Constraints on
model parsimony make the inclusion of more than one measure of party competition
unattractive, so a clear, single measure of party competition will be included: the
percentage of seats of the largest party in each nation's legislature in the year of each
specific election; that is, the percentage after the election, which should indicate the
level of competition between parties during the election campaign which might affect
voters' propensity to turnout. 36
Finally, it has been found elsewhere that more proportional electoral systems
help ensure higher electoral turnout (Norris, 2004; Jackman and Miller, 1995). In
proportional systems there is a guarantee that one's vote makes an impact, however
slight, because the chosen party benefits from all votes which push up its share of the
total ballot. This contrasts to majoritarian systems, particularly those which are
constituency-based, in which it may frequently be the case that a voter in a 'safe' seat
consistently dominated by a particular party may make no impact by voting for the
35 She also reports that turnout declines when such dominance gets very strong.36 Data downloaded from Norris (2004; original source: Vanhanen, 2000). Data for Russia unavailable, so its score was calculated manually from election result data.
-52-
Political Corruption, Public Opinion, and Citizens' Behaviour
non-dominant party. Yet some scholars dispute the salience of this effect. Franklin
(2004) suggests the effects of competition displace the effect of the electoral system,
whereas Powell's (1980) cross-national analysis finds that it is not electoral rules that
are explanatory, but rules relating to voter registration. However, it remains important
to control for the electoral system because it may also affect the level of corruption
present in each nation. Indeed Persson et al (2003) find that these phenomena are
linked. They argue that countries with larger district sizes and lower thresholds to
representation experience less corruption, possibly because 'barriers to entry' are
lower, giving citizens greater ability to remove corrupt officials from office.
Simultaneously, they suggest that in plurality systems with small districts, high levels
of competition act to encourage clean political practice as candidates attempt to woo
swing voters. Thus, the type of electoral system used by each nation in parliamentary
elections will be tapped when predicting turnout, along a three point scale ofO *7
proportionality.
The third group of controls involves socioeconomic factors. The base
proposition of such explanations is that among higher socioeconomic groups political
action is stimulated by greater understanding and knowledge of politics, supplemented
by the prospect that wealthier citizens have greater physical resources to deploy in
political action. Wealth may also correlate with levels of resources available to social
movements, a notion important to theorists who focus on resource mobilisation as a
key determinant of social movement activity (Tilly, 1979; Freeman, 1979). It is also
important to control for development due to its possible link to levels of corruption.
37 This employs the typology of electoral systems used in Morris (2004), where 1 = majoritarian and plurality systems, 2 = mixed systems, and 3 = proportional systems. The source of information about electoral systems was IDEA International (1997) Handbook of Electoral System Design, retrieved from IDEA International (2006). The only nation difficult to classify was Jordan, which possesses the Single Non-Transferable Vote System. As this system resembles neither a majoritarian / plurality nor a proportional system, it has been grouped with the mixed systems. This is still problematic, as SNTV is not a mixed system, but it does ensure it is not clustered with either 'purer' type of system.
-53-
Political Corruption, Public Opinion, and Citizens' Behaviour
Tanzi and Davoodi (2000), for example, suggest that corruption and development are
50 _negatively related. Two variables should suffice in indicating the degree of
development and wealth in a given nation, in terms of educational and material status:
literacy and logged GDP per capita respectively. 39 GDP has been logged as we might
expect participation to be particularly low in very poor nations, where voters have few
resources to invest in political activity, but to increase considerably as wealth
increases and to steady out at a certain threshold of wealth.
The size of each nation's public sector will also be controlled for due to its
potential impact on levels of corruption. One possibility is that a larger public sector
means there are more opportunities for public servants to engage in corrupt practice.
However, Xin and Rudel (2004) find that the larger the public sector, the lower the
level of corruption, perhaps, they suggest, because citizens in nations with large
public sectors are willing to meet tax demands only if their public officials are clean.
Bravo-Ortega and Hojman (2002) also include 'government size' (or, more clearly,
size of the public sector / welfare provision). They suggest that high turnout is likely
among societies with large public sectors as there is more at stake to citizens if parties
have different policies concerning welfare provision, though their variable is not
found to be statistically significant.
38 In fact, a scatterplot between the Corruption Index and the Human Development Index (1998 data, consistent with the rest of the analysis in the chapter) is shown in the appendix in Figure A3 a and reveals a degree of nonlinearity between the variables. The HDI scales life expectancy, literacy, and income and runs from 0 (highly under-developed nations) to 1 (highly developed nations). Low corruption scores are well associated with high levels of development, although as corruption levels increase, more variability in development is observed, although the overall trend is an inverse relationship, evidenced by the bivariate correlation between the variables of -0.67. Note that the HDI has not been selected as an independent variable in the models in this chapter itself because the potential importance of education and wealth on political participation are deemed to warrant their inclusion as independent factors.39 Literacy rates will be reported as percentage rates. Source: the CIA World Factbook 1999. Definitions of literacy do differ slightly by nation, yet this was the best data available and most definitions would derive similar statistics anyway. No measure was available for the Slovak Republic from this source, so the 2000-04 statistic given by Unicef (No Date) will be used. The source of GDP statistics is the CIA World Factbook 1999.
-54-
Political Corruption, Public Opinion, and Citizens' Behaviour
Size of government may also be useful to proxy equality in society. Indeed,
inequality may create societal conditions in which the wealthy may more legitimately
exploit the masses, perhaps through corrupt activity (You and Khagram, 2004).
Controlling for the distribution of wealth is therefore appropriate to ensure that any
effect of corruption on participatory activities does not simply proxy it. The
possibility of including a measure of income inequality directly was considered, but
was found to be problematic: the coverage of available data was limited and differing
surveys made cross-national measures incomparable.40 However, wage inequality is
clearly linked to inequality in society generally, and the former has been found to be
negatively associated with public sector employment, which appears to promote less
heterogeneity in wage rates (Pontusson et at, 2002; Rueda and Pontusson, 2000 -
although the latter article suggests this is the case specifically in social market
economies).41 To control for size of government, a scale concerning levels of state-run
enterprises and public sector investment will be included.42
Modelling demonstration activity at the national level is a form of analysis that
is very difficult to find in the literature on political participation, so it is necessary to
add further socioeconomic variables that may influence aggregate levels of
demonstration activity, and may also help us tap the effect of 'postmaterialism' at the
40 The United Nations Development Programme's (2005) Human Development Report 2005, acknowledges this problem, while You and Khagram (2004) are motivated to adopt techniques such as instrumental variable regression owed, in part, due to measurement error pertaining to their inequality variable.41 Unemployment and union density are also found to be linked to wage inequality, and these factors are also controlled for in the model of demonstration activity.42 Source: Gwartney, Lawson, and Samida (2000). Data retrieved from the Fraser Institute (2004). This has been inverted so the higher the score, the greater the size of government. The scale now runs from 0 (very few state operated enterprises and little public sector investment), to 10 (economy dominated by state operated enterprises and public sector investment), and pertains to the 1996-97 period. Data is missing for Belarus, which has been assigned a high score consistent with those the bulk of ex-Soviet republics receive.
-55-
Political Corruption, Public Opinion, and Citizens' Behaviour
national level. 43 Three such variables will be added: trade union density,
unemployment, and inflation. The role of organisational membership in mobilising
participation has been discussed in depth in literature concerning the political activity
of citizens (Ayala, 2000; Verba et al, 1995). Activity in trade unions, which are
important in industrialised societies as organisations likely to mobilise protest, can
therefore be tapped through the inclusion of a measure of trade union density. The
nations have been clustered into two groups, one pertaining to high and low union
density respectively, and the resultant dummy variable is added to the models.44
The two macroeconomic variables that will be included in the models of
demonstration activity are the percentage rate of inflation and the percentage of
unemployment in each nation. 45 It is expected that economic problems such as
inflation or unemployment may act as an incentive to demonstrate. Such
macroeconomic problems may also affect levels of resources available to social
movements that promote demonstration activity. There appears to be little theoretical
basis to include these three variables in the model of turnout, however, and to
maintain parsimony they will not be.
43 Broadly, the inclusion of variables such as union density, unemployment, and inflation, alongside variables tapping development such as literacy, GDP, and authoritarianism, will help us indirectly tap materialist concerns (which are likely to tie to less developed societies, or those with substantial economic problems) and postmaterialist concerns (which should be prominent in more developed societies, and in those with less substantial economic problems).44 Source of percentage rates of union membership: International Labour Organisation (2002). The year each statistic refers to differs by nation, yet they predominantly pertain to years in the early 1990s, with the bulk of the statistics pertaining to 1995. This period is assumed to be sufficiently near to 1998 for our purposes, given that trade union density which involves socioeconomic structure is unlikely to dramatically change over the course of a few years. That said, the choice to group the nations in two clusters (tapping whether the percentage of union membership within each nation's non-agricultural labour force is 50% or greater) is justified, as the fact data on union membership is obtained across different years for different nations means that a more specific variable may be unreliable. Data was unavailable for Latvia, but was found in the 2003 European Commission employment report, and pertains to the year 2000.45 Both inflation and unemployment are measured as percentage rates. Source: CIA World Factbook 1999, in which the bulk of scores pertain to 1998. Data concerning unemployment in this handbook was unavailable for the following countries, and the alternative sources are as follows: Pakistan - CIA World Factbook 2000; Ivory Coast - CIA World Factbook 2001 (accessed online from University of Missouri - St. Louis); India and Senegal - CIA World Factbook 2002 (accessed online from University of Missouri - St. Louis); Tanzania - Youth Development Network (2000/01 standard/ILO rate); Uganda - International Labour Organisation (2004).
-56-

Political Corruption, Public Opinion, and Citizens' Behaviour
The fourth, final cluster of controls relates to political cultural characteristics
of each nation, and comprises two variables. First, a measure of how authoritarian
each state is will be included in both sets of models, and is represented by each
nation's 1998 Polity IV score. 46 Polity IV data provides a measure of the level of
democracy in a given nation through the consideration of a number of institutional
variables such as the competitiveness of executive recruitment and the feasibility of
competitive political activity. Controlling for the level of democracy in each nation is
important because it may have a fundamental impact on levels of political
participation. Autocratic regimes may intimidate citizens from active participation and
suppress pluralist activity, reducing, for example, the opportunities available for social
movements to engage in participatory activity. (For arguments pertaining to the
importance of opportunities for social movement activity, see Delia Porta and Diani,
1999; Tilly, 1979.) Furthermore, it is important to control for authoritarianism to
ensure corruption does not proxy it. Less democratic regimes may have fewer
impartial checks and balances to contain corruption. Alternatively, corruption may be
highest in regimes in transition, which lack the relative institutional stability of
established democratic or autocratic systems (Montinola and Jackman, 2002).47
46 Source: Marshall and Jaggers (2002). Luxembourg and Iceland are not included in the Polity IV dataset, and thus require coding. In line with the other established Western democracies, both countries have been given the 'most democratic' score available. Note also that all scores have been transformed so that 0 = highly democratic, 10 = highly undemocratic.47 It was also considered to introduce a variable tapping length of democracy by nation, in case, for example, newly democratic nations are less likely to exhibit participatory cultures due to timidity of citizens used to an authoritarian past. Yet two problems deterred this avenue. First, it is difficult to operationalise such a variable. What determines whether a nation is an established democracy? If we are to use scores such as those in the Polity IV dataset, for how many years must a score signal a 'democratic' regime before we code the nation as an established democracy? Must we also control for speed of transition and consolidation, which may also affect participatory timidity or enthusiasm? Second, research elsewhere has shown that proximity to democratic transition has little impact on participation. Jackman and Miller (1995), analysing turnout, suggest that in South European nations there has been little substantive change in turnout over time, despite younger, perhaps more democratically-tuned cohorts, having replaced older generations since the inception of democracy (interestingly, in Portugal turnout levels were actually seen to decline). Jackman and Miller (p. 480) consequently conclude: "people adapt rather quickly to new political regimes and...this adaptation is influenced more by institutions in place than it is by cultural remnants of an authoritarian past."
-57-

Political Corruption, Public Opinion, and Citizens' Behaviour
Second, a variable will be added to the model of demonstration activity which
indicates whether the nation was involved in armed conflict in 1998. This variable is
included on the grounds that it is possible demonstrations and incidences of inter-state
or intra-state war or conflict will be positively associated. Armed conflict may spur
demonstration activity, if protestors dislike war on grounds of the severe hardship it
brings, or if perhaps in the case of liberal democracies involved in conflict overseas
such as in the recent case of the Iraq war protestors are mobilised by ethical
opposition to armed conflict. To assess this possibility, data from the Polity IV project
concerning 'armed societal conflict' will be included in the model to indicate if the
nation is involved in any of the following forms of conflict: 'inter-state warfare',
'revolutionary warfare', 'ethnic warfare', and 'genocide or politicide'. 48 To maintain
parsimony, and in view of few nations being coded as having any form of armed
conflict in 1998, instead of these categories of conflict being modelled separately, a
simple dummy tapping whether any form of societal conflict is present will be
included.
Analysis
Some nations have been omitted from the models due to the unavailability of data
(these nations and the missing variables are outlined in Table A3.2 in the appendix).
The model for turnout includes 80 nations, and the model concerning demonstrations
includes 79 nations, from the initial sample of 85 nations included in the 1998 CPI.
Recall that the cases to be analysed in the turnout model involve the national election
in each country nearest to the year 1998 (on either side), and that they pertain to
48 Iceland and Luxembourg are not included in the Polity IV dataset, but they may clearly be coded as 0 as neither experienced armed conflict of these forms in 1998.
-58-
Political Corruption, Public Opinion, and Citizens' Behaviour
legislative elections: to the lower house where there is more than one chamber, or
simply to the unicameral chamber where there is not.49 The restriction of analysis to
these forms of election is based on the assumption that the factors and issues at stake
in them are likely to be significantly different compared to higher legislature and
presidential elections. 50 In established literature (for instance, Jackman and Miller,
1995) such a restriction is also evident.
The results of the turnout models are shown in Table 3.2. Model 1 is a partial
model which omits corruption and bad governance the two key standards-related
variables to show an important effect involving logged GDP that will subsequently
be discussed; Model 2 is the full model, with these items added in.
49 If two elections for a particular nation are equally spaced from 1998, then the earlier election will be selected. Also note that in the case of Egypt the 1995 election has been preferred to the 2000 election, despite being further from 1998, as data pertaining to the latter is unavailable.50 This point links to a further factor: the question of how suitable it may be to control for whether each election involves polling for just the lower parliamentary chamber, or only part of it, or for higher chambers, or even the election of a president. An election might also involve the election of local representatives or representatives in supranational assemblies. Given the relatively small sample in hand controlling for such factors would significantly reduce the degrees of freedom in each model and will not be pursued.
-59-
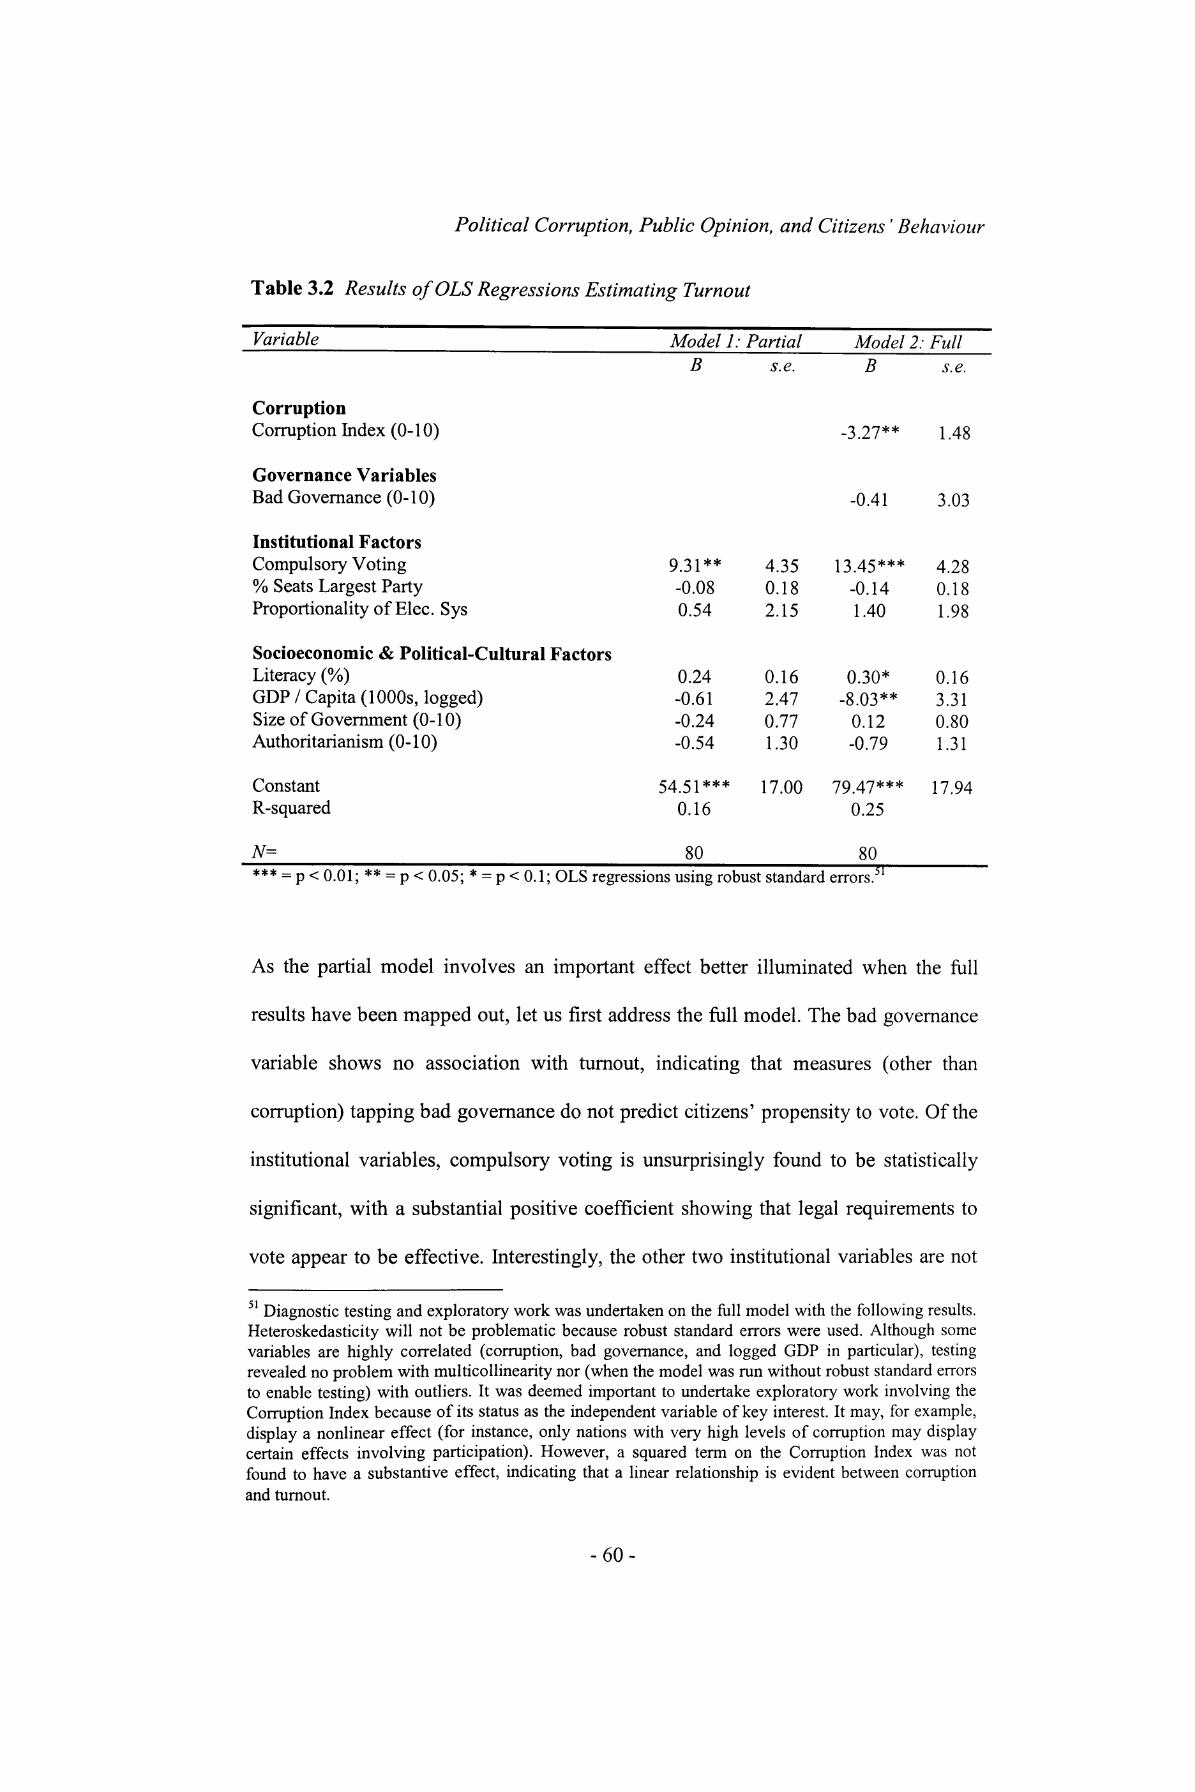
Political Corruption, Public Opinion, and Citizens' Behaviour
Table 3.2 Results of OLS Regressions Estimating Turnout
Variable Model 1: Partial Model 2: FullB s.e. B
CorruptionCorruption Index (0-10)
Governance VariablesBad Governance (0-10)
**-3.27
-0.41
*** = p < 0.01; ** = p < 0.05; * = p < 0.1; OLS regressions using robust standard errors. 51
s.e.
1.48
3.03
Institutional FactorsCompulsory Voting % Seats Largest Party Proportionality of Elec. Sys
Socioeconomic & Political-Cultural FactorsLiteracy (%) GDP / Capita (1000s, logged) Size of Government (0-10) Authoritarianism (0-10)
ConstantR-squared
N=
931** -0.08 0.54
0.24 -0.61 -0.24 -0.54
54 51***0.16
80
4.35 0.18 2.15
0.162.47 0.77 1.30
17.00
13 45*** -0.14 1.40
0.30* -8.03**
0.12 -0.79
79.47***0.25
80
4.28 0.18 1.98
0.16 3.31 0.80 1.31
17.94
As the partial model involves an important effect better illuminated when the full
results have been mapped out, let us first address the full model. The bad governance
variable shows no association with turnout, indicating that measures (other than
corruption) tapping bad governance do not predict citizens' propensity to vote. Of the
institutional variables, compulsory voting is unsurprisingly found to be statistically
significant, with a substantial positive coefficient showing that legal requirements to
vote appear to be effective. Interestingly, the other two institutional variables are not
51 Diagnostic testing and exploratory work was undertaken on the full model with the following results. Heteroskedasticity will not be problematic because robust standard errors were used. Although some variables are highly correlated (corruption, bad governance, and logged GDP in particular), testing revealed no problem with multicollinearity nor (when the model was run without robust standard errors to enable testing) with outliers. It was deemed important to undertake exploratory work involving the Corruption Index because of its status as the independent variable of key interest. It may, for example, display a nonlinear effect (for instance, only nations with very high levels of corruption may display certain effects involving participation). However, a squared term on the Corruption Index was not found to have a substantive effect, indicating that a linear relationship is evident between corruption and turnout.
-60-

Political Corruption, Public Opinion, and Citizens' Behaviour
statistically significant, although the signs on their coefficients are as expected. Lack
of competitiveness, indicated by the percentage of seats occupied by the largest party,
is negatively related to turnout; 52 electoral system proportionality is positively related.
Meanwhile literacy predicts higher turnout, as we would expect, but size of
government and authoritarianism are not found to be explanatory.
However for our purposes the most important results exhibited by the model
pertain to corruption, and also to logged GDP, as this variable links to corruption in an
interesting way. Two core conclusions can be drawn. First, corruption appears to have
a negative relationship with turnout (p-value = 0.03). The coefficient of about -3
indicates that in a hypothetical country with a corruption score of zero, a highly clean
nation, turnout would be predicted to be about 30% higher than a hypothetically
highly corrupt country with a score of ten, controlling for the other factors. This is an
important and strong result and directly confirms hypothesis HI.
Second, logged GDP per capita is found to be inversely related to turnout,
suggesting that turnout is inclined to be higher in poorer countries. Interestingly,
however, this runs against most of the established literature which ties socioeconomic
wealth to greater participation (for example, Verba et al, 1978). Exploratory work
shows that omitting corruption and bad governance, which correlates with GDP,
neutralises the statistically significant negative relationship between logged GDP and
turnout, as the partial Model 1 shows. These results are important because they show
that without controlling for corruption and bad governance we derive a misspecified
model. We see that including corruption and bad governance is important, as it draws
out that what really inclines richer countries to have higher rates of turnout: it is their
propensity to be well governed and non-corrupt, not their rates of wealth.
52 The statistical insignificance of this variable might be explained by the dampening effect of less competition being countered by higher turnout in 'critical' landslide elections, thus weakening its explanatory power.
-61 -

Political Corruption, Public Opinion, and Citizens' Behaviour
Finally, regarding the models of turnout, to ensure the results were not heavily
impacted by the strong impact of compulsory voting, the full turnout model was re
run twice, first excluding nations that enforce compulsory voting, even where this
enforcement is weak; second excluding nations that strictly enforce compulsory
voting. 53 By excluding these sets of countries we are able to observe the effect of
corruption on turnout where variation among nations' levels of voting is not affected
by a strong institutional incentive for citizens to vote, and therefore where variation in
turnout is observed as functions of the remaining factors. The resulting models,
presented in Table A3.3 of the appendix, illustrate that corruption remains an
important determinant of turnout even though its statistical significance weakens
slightly (the p-value for corruption in the model excluding nations that enforce
compulsory voting, even weakly, is about 0.05; and is about 0.1 in the model
excluding nations that strictly enforce compulsory voting). The magnitude of the
effect of the Corruption Index does not change significantly, with the coefficient
hovering at around -3, and the effects of the control variables are consistent with the
results of the full model in Table 3.2.
Let us turn now to modelling demonstrations. From initial exploratory work, it
was found that when all of the independent variables were included, only the
Corruption Index and its squared term (included to tap the nonlinear effect
hypothesised) were statistically significant, and multicollinearity between corruption
and bad governance was evident. 54 Interestingly, on removing the Corruption Index
and its squared term, only bad governance related to demonstration activity, with the
two variables exhibiting a positive relationship, suggesting corruption drowns out its
53 The categorisation of countries with compulsory voting into those with weak and strong enforcement is made by Idea International (2006), and their categorisation is deployed here.54 When a full model was run without the squared term on corruption, no variable was statistically significant at all. This gives a clear indication that the effect of corruption on demonstrations is indeed nonlinear. Due to the lack of explanatory power of variables in this model, it has not been presented.
-62-
Political Corruption, Public Opinion, and Citizens' Behaviour
effect. To derive a more informative and robust model, some non-explanatory
variables were removed. This parsimonious model resulted in the R-squared dropping
only slightly: from 0.23 to a still respectable 0.20, suggesting that the original model
was telling us little more anyway. Note too that the effect of corruption in both the
original and the parsimonious model is essentially the same, thus the validity of the
results involving corruption that we can draw from the parsimonious model is not
undermined. The variables removed to form the parsimonious model were: logged
GDP, size of government, inflation, authoritarianism, and armed conflict. It is curious
that at the national level these variables are not significant, yet given the fact that no
work has been found which attempts to model national level demonstration activity,
our expectations that they were had to be tentative. The omission of these variables
enabled the inclusion of a further case: Namibia, which was initially excluded for
lacking data on its size of government. These two models, a full model and the
parsimonious, preferred model, are outlined in Table 3.3.
-63-
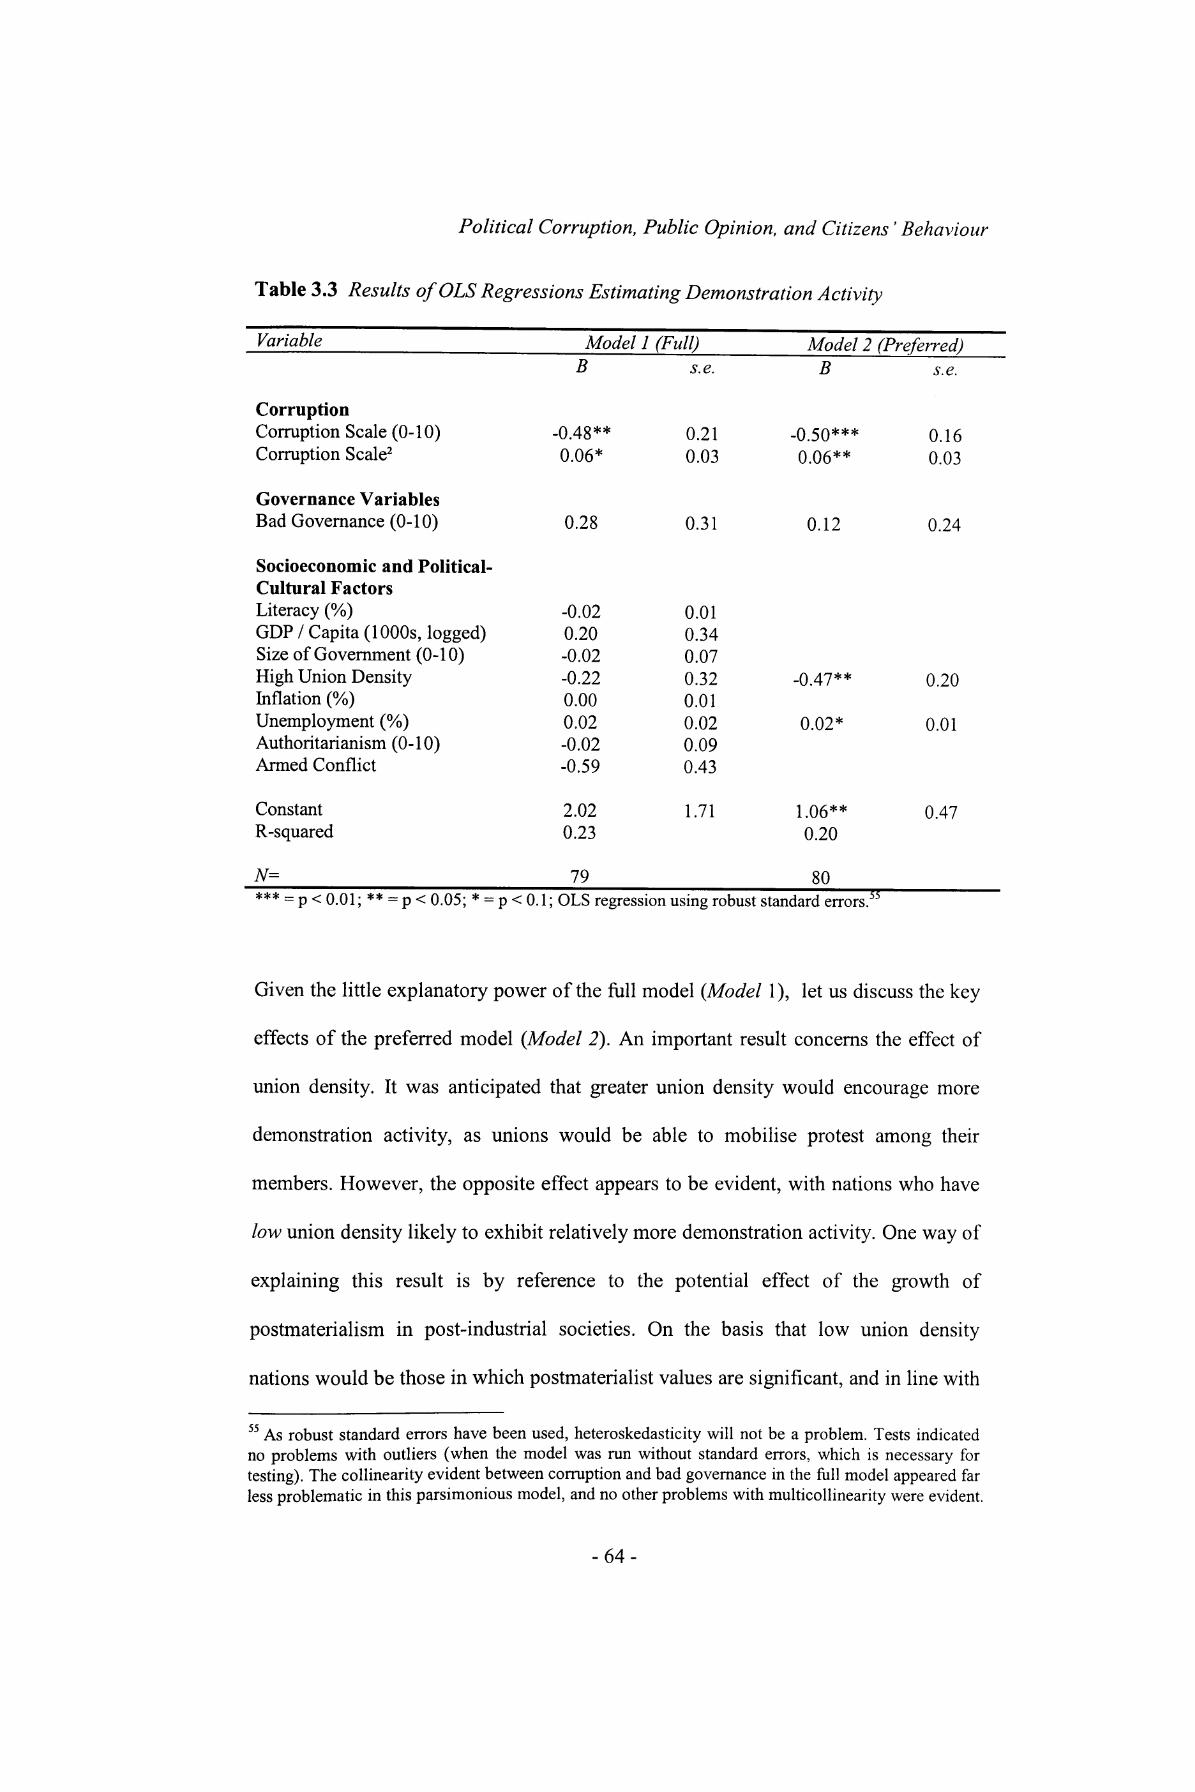
Political Corruption, Public Opinion, and Citizens' Behaviour
Table 3.3 Results ofOLS Regressions Estimating Demonstration Activity
Variable Model 1 (Full) Model 2 (Preferred)
CorruptionCorruption Scale (0-10) Corruption Scale2
Governance VariablesBad Governance (0-10)
B
-0.48**
0.06*
0.28
s.e.
0.210.03
0.31
B
-0.50*** 0.06**
0.12
s.e.
0.160.03
0.24
Socioeconomic and Political-Cultural FactorsLiteracy (%)GDP / Capita (1000s, logged)Size of Government (0-10)High Union DensityInflation (%)Unemployment (%)Authoritarianism (0-10)Armed Conflict
ConstantR-squared
N=
-0.020.20-0.02-0.220.000.02-0.02-0.59
2.020.23
79
0.010.340.070.320.010.020.090.43
1.71
-0.47**
0.02*
1.06**0.20
80
0.20
0.01
0.47
*** = p < 0.01; ** = p < 0.05; * = p < 0.1; OLS regression using robust standard errors. 55
Given the little explanatory power of the full model (Model 1), let us discuss the key
effects of the preferred model (Model 2). An important result concerns the effect of
union density. It was anticipated that greater union density would encourage more
demonstration activity, as unions would be able to mobilise protest among their
members. However, the opposite effect appears to be evident, with nations who have
low union density likely to exhibit relatively more demonstration activity. One way of
explaining this result is by reference to the potential effect of the growth of
postmaterialism in post-industrial societies. On the basis that low union density
nations would be those in which postmaterialist values are significant, and in line with
55 As robust standard errors have been used, heteroskedasticity will not be a problem. Tests indicated no problems with outliers (when the model was run without standard errors, which is necessary for testing). The collinearity evident between corruption and bad governance in the full model appeared far less problematic in this parsimonious model, and no other problems with multicollinearity were evident.
-64-
Political Corruption, Public Opinion, and Citizens' Behaviour
Inglehart (1997), greater demonstration activity in such nations may simply reflect the
presence of higher numbers of postmaterialists who enjoy greater political and
societal stability enabling greater political involvement. However, the effect of
materialist orientations is also evident: unemployment is positively tied to
demonstration activity, suggesting that the urge to protest may also be related to
economic hardship. It is alternatively plausible that low union density and high
unemployment may reflect wage inequality in society (Pontusson et al, 2002; Rueda
and Ponstusson, 2000), and that this may also induce demonstration activity among
the worse off.
Yet for our purposes the most interesting results concern corruption and its
squared term, which are both statistically significant. The signs on the coefficients
imply that countries with very low or very high levels of corruption appear to have
substantially more demonstration activity than those with little or moderate levels of
corruption, deriving a J-curve effect that supports hypothesis H2. 56 This result is
easiest to appreciate when it is presented graphically, and this is done so in Figure
3A: 57
56 To ensure this result was accurate, further exploratory work was undertaken. The Corruption Index was receded into categorical variables, and, when regressed on demonstration activity, the signs on the composite dummies' coefficients indicated that they had equivalent effects to those displayed by the Corruption Index (as a continuous variable), and its polynomial.57 The effects of the continuous independent variables other than corruption and its squared term were taken into account in the graph by multiplying their mean values by their estimated coefficients in Model 2, and adjusting the intercept by the aggregated effect. For simplicity, the union density dummy was set to 0.
-65-
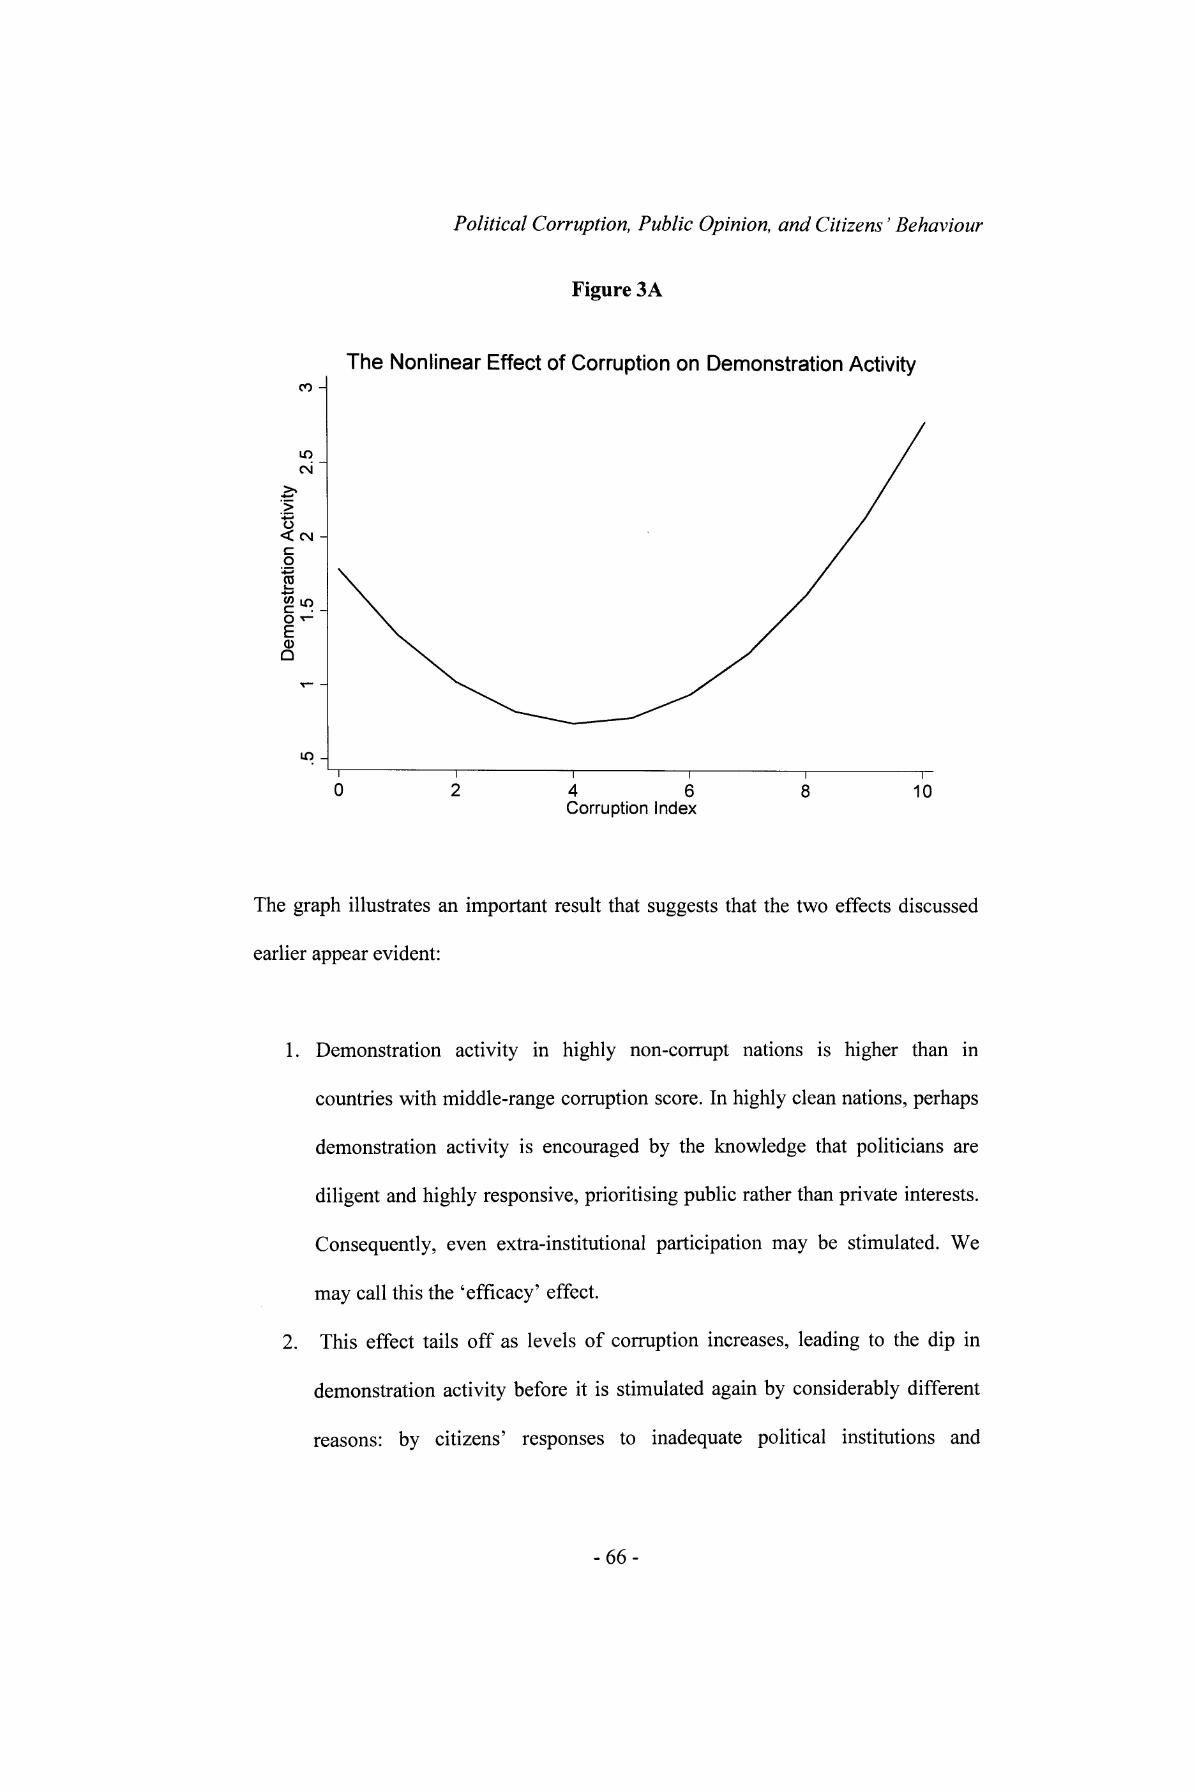
Political Corruption, Public Opinion, and Citizens' Behaviour
Figure 3A
co -
c\
o< CM
O
O
(D Q
UO -
The Nonlinear Effect of Corruption on Demonstration Activity
T~
20 4 6 Corruption Index
~r
8 10
The graph illustrates an important result that suggests that the two effects discussed
earlier appear evident:
1. Demonstration activity in highly non-corrupt nations is higher than in
countries with middle-range corruption score. In highly clean nations, perhaps
demonstration activity is encouraged by the knowledge that politicians are
diligent and highly responsive, prioritising public rather than private interests.
Consequently, even extra-institutional participation may be stimulated. We
may call this the 'efficacy' effect.
2. This effect tails off as levels of corruption increases, leading to the dip in
demonstration activity before it is stimulated again by considerably different
reasons : by citizens' responses to inadequate political institutions and
-66-
Political Corruption, Public Opinion, and Citizens' Behaviour
associated negative cultural perceptions, an effect that gets increasingly strong
as levels of corruption increase. We may call this the 'disillusionment' effect.
Countries with moderate levels of corruption may not possess the first or second
effects, leading to lower levels of demonstration activity relative to highly corrupt and
highly clean nations.
Summary
This chapter sought to test two hypotheses - that political corruption would have a
negative relationship with electoral turnout, and predict greater demonstration activity
in particularly clean and particularly corrupt nations. These hypotheses were derived
from theoretical reasoning which emphasised corruption's potential role as a signal,
undermining citizens' faith in political institutions and creating cultural orientations
involving mistrust and inefficacy. From this basis, it was predicted that corruption
would act as a disincentive for institutional forms of political participation such as
electoral turnout and, in corrupt nations, an incentive for extra-institutional forms of
political participation such as demonstration activity. Yet it was also predicted that in
particularly clean nations, extra-institutional participation would be prompted anyway,
due to public servants being particularly responsive to any form of participation,
motivating all forms of citizen behaviour. These twin expectations regarding the
impact of corruption on demonstration activity brought forth the prospect that their
relationship would be nonlinear.
Turning to findings, basic data analysis and subsequent regression analysis has
suggested that hypothesis HI, predicting that corruption and turnout will be inversely
-67-
Political Corruption, Public Opinion, and Citizens' Behaviour
correlated, is supported. The Corruption Index successfully predicts turnout, and has a
negative relationship with it. This fits with our theoretical reasoning that corruption
undermines perceptions of institutional quality, creating detrimental cultural
orientations that lead to the neglect of institutional participation.
The more complex hypothesis H2 is also supported. Corruption exhibits a
nonlinear relationship with demonstration activity, such that demonstrations occur
more in highly clean nations and highly corrupt nations in contrast to countries in the
middle. The significant rise in demonstration activity as corruption grows distinctly
high suggests that this may be owed to increasingly negative cultural orientations and
perceptions towards institutions (the 'disillusionment' effect). Yet in highly clean
nations, greater elite responsiveness to all forms of participation, whether institutional
or extra-institutional, may be evident, also motivating demonstration activity, but
relating to a very different form of incentive (the 'efficacy' effect).
Thus this chapter has been useful in providing initial inroads into our thinking
on how corruption and participation relate. In the next chapter, we may analyse the
link deeper by asking how well individual level perceptions of corruption, as well as
national level corruption, predict participation. It must be remembered that the models
presented in this chapter are limited by their focus on national level data. Although
inferences have been made that concern individual level decision-making, this
represents ecological reasoning and must therefore remain tentative. In the next
chapter the integration of both national and individual level factors using survey data
allows us to analyse both the effects of both corruption and perceived corruption on
political participation.
-68-
Political Corruption, Public Opinion, and Citizens' Behaviour
Chapter 4. Corruption, Perceived Corruption, and Citizens'
Behaviour
Introduction and Hypotheses
The previous chapter examined the effect of national level corruption on two forms of
political behaviour: demonstration activity and electoral turnout. It confirmed
hypotheses that corruption was positively associated with the latter, and had a
nonlinear effect on the former, such that extra-institutional participation was high
when corruption was very high and very low, but lower at intermediate levels. It was
postulated that this was related to the impact of corruption on perceptions of
institutional quality in given political systems, and on political-cultural orientations
involving trust, alienation, and efficacy, which influenced the decision-making
calculus of a citizen considering engaging in political participation. Consequently,
when stimulated to participate because of an issue, a citizen is argued to be influenced
by levels of corruption in politics and will behave in certain ways accordingly. Yet we
cannot be certain about citizens' motivations without further analysis, testing the
effects of individual level perceived corruption on participatory activity.
Hence this chapter expands this analysis of the participatory effects of
corruption by using multilevel modelling techniques to analyse the impact on political
behaviour of both national level corruption and individual level perceptions of
corruption together. Using individual level perceptions of corruption as an
independent variable means that the inferences we make from models of political
behaviour do not suffer from the ecological fallacy (that is, the tendency to
-69-
Political Corruption, Public Opinion, and Citizens' Behaviour
extrapolate conclusions pertaining to individuals' behaviour from results of models
using national level indicators of political participation). In the previous chapter, the
models concerning turnout and demonstration activity were useful in indicating
coherent relationships between forms of political behaviour and corruption at the
national level, yet the conclusions drawn from them that relate to individuals'
decision-making have to be tentative. By using data on perceived corruption from
survey respondents we avoid this problem.
Moreover, it is interesting to explore how the individual level and national
level corruption measures relate vis-a-vis effects on political behaviour. Do they carry
the same effects? Thus far we have discussed the effects of national level corruption
generally, assuming that corruption promotes orientations regarding the
trustworthiness and efficacy of politicians and institutions, although more nuanced
expectations may be offered at this stage which can divide between the individual
level effects of perceived corruption, and the contextual effects of corruption at the
national level.
Regarding individual level corruption first, few established works appear to
use individual level perceived corruption as an independent explanatory variable for
participation at all, and they are geographically specific: Davis et al (2004) examine
Chile, Costa Rica, and Mexico, while McCann and Dominguez (1998) focus only on
Mexico. McCann and Dominguez (1998) hypothesise that lower turnout is likely to
result from higher perceived electoral fraud. They suggest that citizens rationally
weigh the costs and benefits of turning out, and that: "the practice of electoral fraud
implies that voters would believe there is little benefit to them from voting; they may
also believe that they would suffer intimidation or worse if they attempt to vote for the
opposition" (p. 484). Their model of electoral turnout reports that perceived electoral
-70-
Political Corruption, Public Opinion, and Citizens' Behaviour
fraud has a strong inverse relationship with turnout. This assertion is also supported
by Davis et al (2004), who find that turnout and perceived corruption are negatively
related. Davis et al also examine whether perceived corruption appears to tie to other
forms of political behaviour. They divide between 'conventional' participation,
defined as legal forms of action such as petition signing and attending a demonstration,
and 'unconventional' participation, defined as illegal forms of protest. However they
find no relationship between perceived corruption and these types of behaviour. In
consequence, they believe perceived corruption contributes to political detachment.
It is notable, however, that Davis et a/'s work initially operates from the
theoretical assumption that turnout is influenced by the ability of actors to invoke
perceptions of corruption to their electoral advantage. They suggest that opposition
parties are effective 'vehicles' for dealing with corruption because they are able to
make corruption a pertinent electoral issue to mobilise support. They steer away from
Aldrich's notion which McCann and Dominguez cite - that an individual's decision to
participate involves a rational assessment of the potential costs and benefits of doing
so. Yet from their data analysis it is found that perceived corruption does not affect
opposition voting, but does motivate non-voting. Taken together, the results of these
works imply that perceived corruption is highly likely to dampen turnout.
The congruence of the results relating to turnout appears compatible with the
reasoning used to explain the turnout result in the previous chapter: that corruption
implies poor institutional quality that translates into decreased institutional
participation. Meanwhile Davis et aVs finding that extra-institutional participation is
not affected by perceived corruption is perhaps surprising given our theoretical
expectations that disaffection created by perceiving substantial corruption may
motivate extra-institutional activity.
-71 -
Political Corruption, Public Opinion, and Citizens' Behaviour
Thus our hypotheses concerning perceived corruption may be driven by the
expectation that it is likely to be negatively related to institutional participation (again,
turnout is used in this chapter to examine this). This expectation is prompted by the
findings of McCann and Dominguez (1998) and Davis et al (2004). Meanwhile, no
established findings indicate that perceived corruption will have an effect on extra-
institutional behaviour, however the cross-national data at our disposal means that we
can test this possibility more thoroughly. In line with the theoretical expectations and
findings regarding the national level corruption in the previous chapter, it might be
expected that perceived corruption, when high, creates disdain for institutions and
politicians that results in extra-institutional behaviour being employed. We may also
expect that very low perceived corruption encourages extra-institutional participation
because politicians are deemed responsive, and participation efficacious. Hence:
HI: Individual level perceived corruption will predict lower propensity to vote.
H2: Extra-institutional behaviour will be occur more where individual level perceived
corruption is particularly high and particularly low, and less where perceived
corruption is at intermediate levels.
Yet what of the effects of national level corruption? In the previous chapter it was
assumed that national level corruption proxied citizens' orientations and we talked of
distrust and inefficacy affecting the turnout calculus in general terms. Yet perhaps the
contextual effect of corruption is more nuanced. Perhaps corruption has the capacity
to influence citizens' behaviour whether or not they personally happen to perceive
low, medium or high levels of corruption. Participation in a nation by those that
-72-
Political Corruption, Public Opinion, and Citizens' Behaviour
perceive particular levels of corruption congruent with the national level score (or by
those that perceive certain levels of responsiveness of politicians that corruption mayfQ
proxy) may embed norms and paths such that the forms of participation across those
with differing perceived corruption are similar, whatever their reasons for
participating.
Such reasoning links to previous work on political participation, and even non-
academic works on individuals' behaviour. Gladwell (2000), for example, writing for
a populist audience, elaborates how 'social epidemics' can be triggered from just a
few citizens initiating a certain form of behaviour. Meanwhile Granovetter (1978),
recognises that once a certain 'threshold' of individuals has decided to undertake an
action, the number of participants can essentially snowball, at least until things get out
of hand and participants drop out. Tarrow (1994) suggests that participants in an
activity will grow after a critical mass of citizens display that the behaviour generates
a beneficial response. The argument here is related, but somewhat different: it is a
mistake to assume that this theory only tells us that levels of participation snowball
exponentially as some individuals participate and others join them. The theory goes
beyond this notion by suggesting first that rather than focusing on particular
incidences of behaviour (such as a peaceful demonstration snowballing into a riot)
certain levels of participation among citizens institutionalise particular means of
behaving. Thus these trends may stimulate a series of participatory acts. Indeed, once
norms and paths of participation are set, citizens face costs in attempting to modify
these norms, including motivating others to join them in participating in unfamiliar
ways, and these alternative means may have questionable efficacy if public servants
58 It is fair to say that corrupt politicians are likely to appear less responsive to citizens than are clean politicians. Even if their corrupt practice is covert, the fact that they are not prioritising the interests of the public may be recognised and interpreted in more general terms as a lack of interest or elite efficacy, even if, in reality, their true priority profiting from illicit exchange and particularism is well-hidden.
-73-
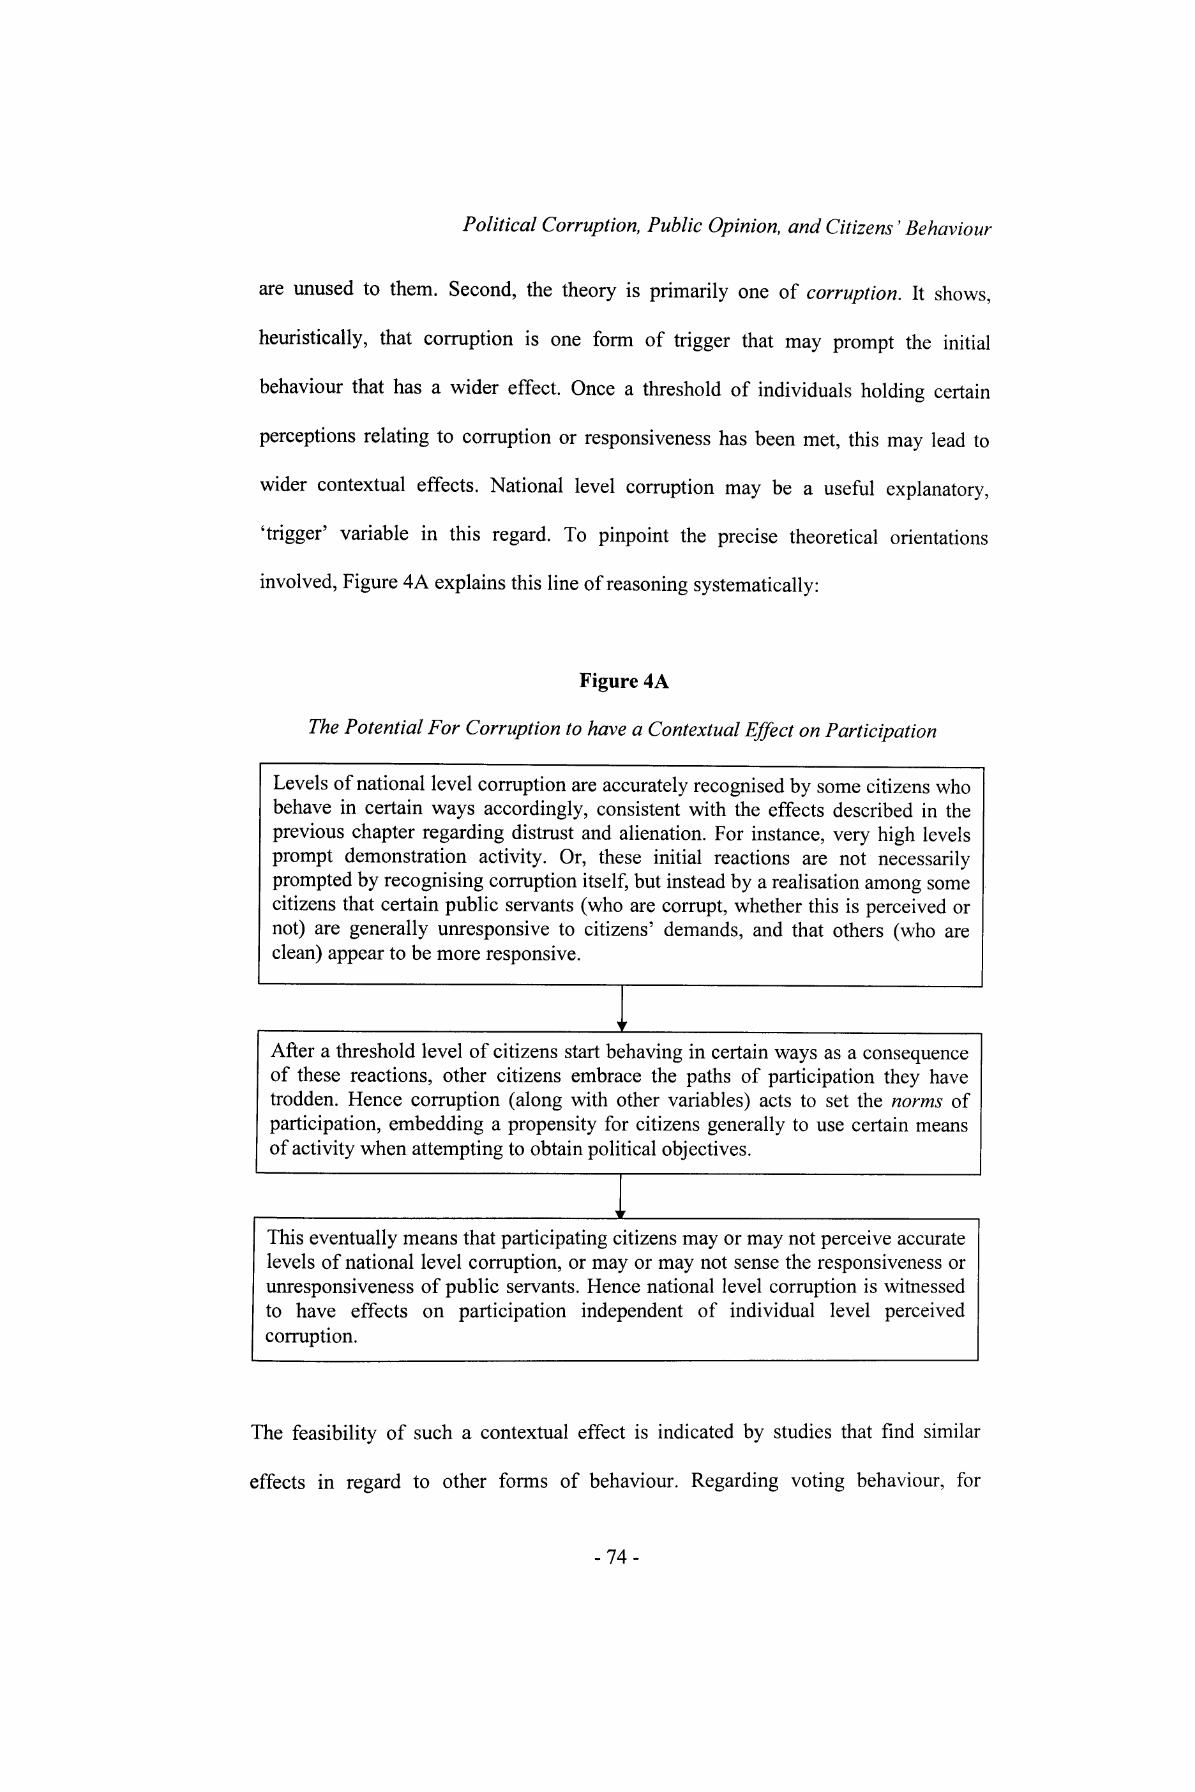
Political Corruption, Public Opinion, and Citizens' Behaviour
are unused to them. Second, the theory is primarily one of corruption. It shows,
heuristically, that corruption is one form of trigger that may prompt the initial
behaviour that has a wider effect. Once a threshold of individuals holding certain
perceptions relating to corruption or responsiveness has been met, this may lead to
wider contextual effects. National level corruption may be a useful explanatory,
'trigger' variable in this regard. To pinpoint the precise theoretical orientations
involved, Figure 4A explains this line of reasoning systematically:
Figure 4A
The Potential For Corruption to have a Contextual Effect on Participation
Levels of national level corruption are accurately recognised by some citizens who behave in certain ways accordingly, consistent with the effects described in the previous chapter regarding distrust and alienation. For instance, very high levels prompt demonstration activity. Or, these initial reactions are not necessarily prompted by recognising corruption itself, but instead by a realisation among some citizens that certain public servants (who are corrupt, whether this is perceived or not) are generally unresponsive to citizens' demands, and that others (who are clean) appear to be more responsive.
After a threshold level of citizens start behaving in certain ways as a consequence of these reactions, other citizens embrace the paths of participation they have trodden. Hence corruption (along with other variables) acts to set the norms of participation, embedding a propensity for citizens generally to use certain means of activity when attempting to obtain political objectives.
This eventually means that participating citizens may or may not perceive accurate levels of national level corruption, or may or may not sense the responsiveness or unresponsiveness of public servants. Hence national level corruption is witnessed to have effects on participation independent of individual level perceived corruption.
The feasibility of such a contextual effect is indicated by studies that find similar
effects in regard to other forms of behaviour. Regarding voting behaviour, for
-74-

Political Corruption, Public Opinion, and Citizens' Behaviour
example, it has been found that independent of an individual's social class, the class
make-up of their locality appears to influence their vote choice (Andersen and Heath,
2002; Andersen et al, 2006; Fisher, 2000a). Individuals appear to be influenced by
those they interact with. Furthermore, contextual effects of campaign spending have
also been shown to affect individual's vote choice, even when controlling for
individual level characteristics (Andersen et al, 2006).
Meanwhile, Ibrahim (1998) discusses how democratisation overseas has had
an important contextual effect on the civil society and particularly the middle classes
of Arab regimes, in their demanding greater liberalisation. In economics, Kobrin
(1985) has pointed to the importance of a 'domino' effect in regard to trends in
international oil nationalisation in the 20th Century; while Karlson (1986) shows how
innovation in the US steel industry has been strongly influenced by initial and
competing innovative developments. 59 Thus contextual effects appear to influence
firms' and governments' behaviour, not just individuals', and even in analyses quite
removed from these fields of study have comparable contextual effects been found.
The Boston school music movement's development in the 19th Century through
schools, for example, has been analysed as a consequence of a 'snowball' effect, and
in terms of some schools aspiring to the status of schools that had established the
movement well (Jorgensen, 1983).
Given the theoretical basis of Figure 4A, and the extraction of works
displaying similar arguments regarding contextual effects on behaviour, we may thus
state hypotheses about how national level corruption might affect participation. The
59 Often these effects are called 'demonstration effects', as they operate on the basis that the behaviour of some agents demonstrates, directly or indirectly, how others may behave. We will avoid using this term, however, as it risks being confused with demonstration activity, one of the forms of participation analysed.
-75-
Political Corruption, Public Opinion, and Citizens' Behaviour
nature of the effects will be assumed to be consistent with the findings of the previous
chapter:
H3: National level corruption will predict lower propensity for citizens to vote.
H4: National level corruption will exhibit a nonlinear relationship with extra-
institutional behaviour such that high and low levels of corruption predict increased
propensity to participate compared to intermediate levels of corruption.
Data
To evaluate the effects of perceived and national level corruption on a spread of
participatory activities, an ideal dataset would offer a good measure of perceived
corruption alongside variables pertaining to numerous forms of political participation.
The closest two datasets to this ideal, which both explicitly tap individual level
perceptions of political corruption and measures of forms of political behaviour, are
wave 3 of the Worlds Values Survey (WVS) (1995-98),60 and the Comparative Study
of Electoral Systems (CSES) Module 2 (2001-2006). 61 Wave 3 of the WVS covers
many nations, surveying 70,000 people. A list of the 48 countries for which data is
available is provided in Table A4.1 in the appendix.62
60 Source: Inglehart et al, 2000. Unfortunately, the other waves of the WVS failed to include a question to tap perceived corruption.61 Extracted from the Comparative Study of Electoral Systems (2006). The specific edition to be used is the April 10, 2006 'advance' release. Module 1 of the CSES is not used because it lacks an individual level question on perceived corruption.62 Five regions Andalusia, Basque, Galicia, Tambov, and Valencia were also included in the dataset, yet have been excluded from analysis from the outset because the focus is cross-national and 'macro' data is generally unavailable for subnational units. West and East Germany, and Serbia and Montenegro were four independent units in the WVS, yet 'macro' data in the 1990s is almost always
-76-
Political Corruption, Public Opinion, and Citizens' Behaviour
The other dataset, CSES Module 2, comprises individual level election
surveys from across nations, along with numerous variables at the district and national
levels, and, like the WVS wave 3, it contains variables concerning perceived
corruption and political participation. CSES data will only be used to examine turnout,
which cannot be undertaken using the WVS. The decision to use the WVS more
extensively in this chapter has been made because the non-turnout political
participation variables in the CSES are not substantively any better than those
included in the WVS (indeed the focus of the CSES is largely on electoral matters),
while the number of countries covered is smaller. A list of the 30 countries surveyed
as part of the CSES for which data is available is provided in Table A4.2 in the
appendix.63
Turning now to dependent variables, recall that we are interested in two forms
of participation: institutional and extra-institutional. As in the previous chapter,
turnout represents the former, but we can expand the range of extra-institutional
behaviours available beyond just demonstration activity due to the coverage of the
WVS. In regard to institutional participation, therefore, turnout remains the key
variable. In the CSES dataset, the item pertaining to whether the respondent cast a
vote in the 'current election' will be used. 64 We should remember, however, that there
only available for Germany, and Serbia and Montenegro, as integrated units. These units have thus been combined and each pair is treated as an individual country.63 For the German 2002 election, two surveys, one conducted on the telephone, the other via post, have been included. These surveys were simply combined to form a unitary German sample. Furthermore, the Portuguese sample consists of surveys pertaining to two elections: 2002 and 2005.64 As the CSES comprises numerous election surveys, the operationalisation of this variable was somewhat idiosyncratic. Often it formed a simple response to the question of whether the respondent cast a vote in the presidential or legislative election being analysed, yet on occasion it was derived from related variables, such as vote choice. (Another variable picked up on whether the respondent voted in another component or stage of the election, and for many countries it was irrelevant. Indeed 80% of respondents have 'missing' responses. It will thus be ignored.) It is clear, therefore that the variable is not ideal: it pertains to both parliamentary and presidential elections and is sometimes derived from a separate variable. However, checks for inconsistency were undertaken by the CSES, and the component surveys attempted to phrase questions to avoid individuals claiming they voted when they did not. The variable is thus deemed adequate to measure turnout at the individual level. It has been coded simply, with 0 signifying non-voting, and 1 signifying that the respondent voted. Inconsistent
-77-
Political Corruption, Public Opinion, and Citizens' Behaviour
are difficulties with self-reported turnout such as that provided by the CSES. Previous
research has suggested that turnout measured by the proportion of survey respondents
who report that they voted tends to be rather higher than 'official' turnout figures.
Swaddle and Heath (1989), for example, report that the difference between official
turnout figures in the 1987 British election and self-reported turnout in the 1987
British General Election Study is 11%. Through surveying respondents for whom
there is official data on turnout, it is found that misreporting accounts for some of this
difference. Such misreporting may be owed to individuals feeling ashamed to admit to
not voting, or simply due to respondents forgetting whether or not they turned out.
Furthermore, analysis of non-respondents suggested that some of the official - self-
reported difference may also be explained by 'response bias' - or the greater
inclination of those willing to complete a survey to also have greater inclination to
vote. Redundancy in the electoral register and house movers (who are often under-
represented in surveys and tend to vote less than non-movers) were also proposed as
contributory explanations in the difference exhibited.
Using the CSES data, we can compare the proportion of respondents by
country with the official turnout statistics reported by Idea International, and this is
tabulated in the appendix in Table A4.3. We see a mean difference across countries of
13.3%, which is comparable to the gaps reported in other surveys. In the 1983 British
election the difference between official and self-reported statistics has been shown to
be 10%, in the 1976 American presidential election it has been shown to be 11%
(Swaddle and Heath, 1989). A possible explanation for why our number is slightly
higher may relate to the fact that we are looking at a survey which includes some less-
responses, refusals, and don't knows have been dropped. Respondents with missing data for this variable, and indeed any of the other dependent and independent variables to be defined, will be dropped from the relevant models. Dropping respondents has been preferred to the imputation of scores first because these techniques are contentious, second because by not imputing data the models are more conservative, which gives us additional confidence that the effects reported are robust.
-78-
Political Corruption, Public Opinion, and Citizens' Behaviour
developed nations, and it may be that in these countries the unwillingness to admit to
not fulfilling a perceived civic obligation may be particularly strong, yet this is not
borne out by the data on the official - self-reported differences in individual countries
- although there is a very considerable gap in Mexico, comparable differences are
seen in Canada and Switzerland. It is difficult to remedy the problems of misreporting,
response bias, and the like, however it is prudent to be aware of them.
Some initial analysis of the relationships between self-reported turnout scores
from the CSES and the Corruption Index is shown in a scatterplot in Figure A4a in the
appendix. It is comparable to the equivalent scatterplot showing the relationship
between official turnout and corruption (Figure A4b, which uses the data from the last
chapter). The linear predictions of the lines of best fit suggest turnout and corruption
are negatively related, although there is considerable variation, with nations located
above and below the lines.
In regard to extra-institutional participation, we extend the analysis of Chapter
3 to consider demonstration activity along with other items. The WVS asks the
following question:
Now I'd like you to look at this card. I'm going to read out some different forms of
political action that people can take, and I'd like you to tell me, for each one, whether
you have actually done any of these things, whether you might do it or would never,
under any circumstances, do it?
a) Have Done
b) Might Do
c) Would Never Do
d) Don't Know
-79-

Political Corruption, Public Opinion, and Citizens' Behaviour
The five actions are: signing a petition, joining in boycotts, attending lawful
demonstrations, joining unofficial strikes, and occupying buildings or factories.^ Of
these five behaviours, it appears suitable to model the first four, but not occupying
buildings or factories, as so few respondents, less than 2%, have actually engaged in
this activity, and only 11% suggest they 'might' do it. Furthermore some nations
appear to display particularly low propensities for citizen involvement in the
occupation of buildings: no-one in the Taiwanese sample reports having done so, for
instance, and only three individuals in the Japanese sample report that they have.
We model the four items as dichotomous dependent variables, allowing us to
compare directly the results of this chapter to those pertaining to demonstrations in the
previous chapter. Furthermore, we will take the objective approach of dividing
between those that have and those that have not done the activity, rather than
worrying over those who 'might' do the activity, which is vague and difficult to
quantify. The items are coded so that 0 indicates the respondent has not done the
activity, and 1 indicates that they have.
Moving on to independent variables, the individual level focus of this study
involves testing whether perceived corruption affects individuals' propensities to
engage in several forms of political behaviour. The key independent variable for the
WVS models asks:
65 It is worth briefly considering whether it is valid to describe strikes as 'political' participation. Indeed, striking in an effort to force a private firm to boost wages might be construed as a 'private' form of protest, and we must leave open the theoretical question of how far respondents themselves construe strike activity to be 'political'. Nonetheless, a number of factors lend credence to considering strike activity with other, political, behaviours. Strike activity may involve workers in the public sector, and wage levels of government employees are undeniably political. Furthermore, the potential disruption to society and to the economy generally by strike activity, even if it is geared to private employers, can make it a 'public' phenomenon (it is, after all, 'unofficial' strikes that are tapped). Lastly, the government may be involved in preventing or settling industrial disputes, acting as an arbiter or regulator after a dispute has arisen, or installing mechanisms such as a minimum wage in an attempt to avert strike activity in the first place.
-80-
Political Corruption, Public Opinion, and Citizens' Behaviour
How widespread do you think bribe taking and corruption is in this country?
a) Almost no public officials are engaged in it
b) A few public officials are engaged in it
c) Most public officials are engaged in it
d) Almost all public officials are engaged in it
e)DK
For the CSES models, the key variable asks:
How widespread do you think corruption such as bribe taking is amongst politicians
in [country]:
a) Very widespread
b) Quite widespread
c) Not very widespread
d) It hardly happens at all
e)DK
These questions form the key individual level independent variable and deserve
discussion. 66 From one standpoint it is clear that it is not theoretically nuanced. We
6 Analysing perceived corruption variables extensively was not attempted in related research. Both Davis et al (2004) and McCann and Dominguez (1998) tend to use variables biased towards perceptions of particular forms of corruption (which is understandable given their goals), but there is a clear lack of theoretical input into the nature of such variables. Davis et al compose a three item scale comprising perceptions of whether corruption is a believed to be a pertinent obstacle to democracy, whether elections are fraudulent, and relating to the proportion of officials in government deemed to be corrupt. McCann and Dominguez look at perceptions of the extent of corruption and expected electoral fraud. Such selections would have been improved by framing variables more clearly within definitional and conceptual frameworks, and emphasising inherent problems with attempting to conduct analysis involving citizens' perceptions of such opaque phenomena. Much more analysis of perceived corruption itself is undertaken in the next chapter, focusing on Britain.
-81-
Political Corruption, Public Opinion, and Citizens' Behaviour
might question the use of the words 'few', 'most', 'quite', 'very', and so on, to
quantify proportions of public servants or the degree to which corruption is
'widespread'. Such terms might be differently and subjectively interpreted. Moreover,
the term 'corruption' is mentioned in each question, and this word, as we have already
discussed, creates difficulties. As we saw in Chapter 2, academics and analysts
fundamentally disagree on the meaning of corruption. Definitions appeal to the role of
public office (Nye, 1967), to the public interest (Friedrich, 1966), to public opinion
(Rundquist and Hansen, 1976, cited in Peters and Welch, 1978), and to market
principles (Rose-Ackerman, 1978). It is conceivable that citizens may knowingly or
unknowingly use any one of these ideas as their guide to what is meant by the term
'corruption'. This is complicated further by the fact we are using cross-national data,
so subjective definitions idiosyncratic to different nations may be influential. The
other problematic term, included in the WVS question, is 'public officials', as this
encompasses a very broad set of individuals. While some citizens may think of elite
politicians, others may think of judges, local officials, or even the police. 'Politicians'
in the CSES question specifies individuals more closely, but it is uncertain as to
which level citizens may conceive of politicians. Is it local or central politicians being
assessed? Are ministers of key concern, or are politicians more broadly being
considered?
In regard to the type of behaviour under consideration, bribe taking is
mentioned specifically in the questions, and this may guide citizens' responses,
moving the focus away from wider corrupt practices towards perceptions of financial
misdemeanour in particular. Furthermore, scholars have found that citizens deem
behaviour involving financial exchange from which public officials profit to be
regarded as more corrupt than other plausibly 'corrupt' behaviour (Peters and Welch,
-82-

Political Corruption, Public Opinion, and Citizens' Behaviour
1978; Kalnins, 2005). It is reasonable to predict that citizens will think of behaviour
they deem most corrupt when they are asked about 'corruption', and given that bribe-
taking joins the word 'corruption' in the questions, we may conclude that perceptions
of financial misdemeanor are likely to be key.
Yet despite the possibility that the simplicity of the questions leaves them
broad and open to interpretation, it is important to recognise that this simplicity may
also be beneficial. The surveys are cross-national, and posing simple questions like
these may fill the need to facilitate items that, after undergoing translation and checks
for consistent meaning, are at least roughly equivalent across countries. This lends
itself to what is essentially the same notion uncovered when we considered the
difficulties of obtaining a national level measure of corruption: empirical efforts must
tolerate, to some extent, a tentative approach due to the limitations of the data
available.
We may now discuss the operationalisation of these questions. First, as it is
hypothesized that perceived corruption has nonlinear trends on participation, and due
to the ordinal nature of such an important variable, it will be treated as categorical.
Second, observation of the distributions of both variables shows that proportionally
very few individuals are placed in the category believing there to be the least amount
of corruption in politics. Consequently, it is sensible to create a 'low' perceived
corruption category combining: a) in the case of the WVS, those who perceive
'almost no' or 'a few' public officials to be corrupt; and b) in the case of the CSES,
those who believe corruption 'hardly happens' or is 'not very widespread'. This 'low'
-83-
Political Corruption, Public Opinion, and Citizens' Behaviour
category can be used as baseline for two other categories: medium perceived
corruption, and high perceived corruption.67
At this point, we may consider how responses to the questions relate to
'national level' corruption, as proxied by the Corruption Index scores. To do this, for
both datasets we may assign 1 to low perceived corruption, 2 to medium perceived
corruption, and 3 to high perceived corruption. The bivariate correlation between the
mean scores of each nation's perceived corruption variable in the WVS,68 and each
nation's Corruption Index score,69 is 0.8. The bivariate correlation, using the means of
each nation's CSES perceived corruption score and each nation's Corruption Index
70score is greater than 0.85. The scatterplots between the Corruption Index and these
perceived corruption scores are shown in Figures A4c and A4d in the appendix, and
indicate graphically that national level corruption scores are highly associated with
individual level perceived corruption. High levels of national level corruption are
likely to result in citizen awareness of such malpractice, whether they engage in
corrupt exchange themselves, hear rumours and stories of corrupt practice from others,
or are aware of court trials involving and punishing corrupt individuals (although, of
67 The medium category consists of those who perceive 'most' public officials to be corrupt (WVS), or those who perceive corruption to be 'quite widespread' (CSES). The high category consists of those who perceive 'almost all' public officials to be corrupt (WVS), or perceive corruption to be 'very widespread' (CSES). In regard to don't know responses, these may often be interpreted as intermediate or apathetic responses, but concerning a variable directly tapping corruption, an elusive phenomenon, it is quite likely a don't know response signals just that: a lack of knowledge or interest. It is not useful to include respondents who do not have clear opinions about how corrupt their public servants are in regressions with a central focus on the estimation of how such perceptions affect behaviour, thus they will be excluded from analysis.68 The following nations in the WVS do not have data pertaining to perceived corruption and have thus been excluded: China, Ghana, Japan, and Pakistan.69 The Corruption Index scores are Transparency International CPI scores, coded so that 10 represents very high levels of corruption and 0 very low levels. In regard to the WVS data, each statistic is from the 1998 CPI, or the nearest year subsequent to it with data available. This ensures that in the bulk of cases the year in which each nation was surveyed is present as one of the years TI collected data (the '3-year' rule means 1996, 1997, and 1998 were used, and this wave of the WVS spans 1995-1998). Where the years do not coincide, this is not problematic because CPI statistics are inclined to stay very stable. Finally, Puerto Rico, though having a statistic pertaining to average individual level perceived corruption, does not have a national level corruption score and has thus been excluded.70 As this data pertains to 2001-2006, the Corruption Index scores relate to 2004, the later 'median' year.
-84-
Political Corruption, Public Opinion, and Citizens' Behaviour
course, levels of prosecutions involving incidences of corruption may not correlate
with actual levels of corruption in a nation). Although national level and perceived
corruption correlate well, it remains important to include them separately in models to
facilitate testing of the hypotheses that both perceived corruption and national level
corruption as a contextual effect influence participation.
Let us now turn to control variables to be included in the models. Firstly,
numerous individual level socioeconomic controls will be included. Three factors
concern gender, age, and religiosity, items said to affect political behaviour discussed
in the previous chapter. 71 Three more controls concern core sociological measures:
education, class, and income. These are important controls, given the importance
scholars place on components dividing those in different social strata. Education can
be tapped equivalently in both the WVS and CSES models. 72 However, the differing
quality of the income and class variables in the two datasets means that only one of
each can be included in each case. In the case of the WVS, the income variable is
problematic: several nations do not include this variable or have poor data, reducing
the number of nations that would be available for analysis. Class can be tapped more
71 A dummy to tap gender will be created from the appropriate WVS and CSES gender variables. A categorical variable in which the respondents will be divided into three age groups: 16-34, 35-54, and 55+, will be included to tap age. Finally, in the WVS models religiosity will be included in the model using a simple dummy which pertains to the frequency with which citizens attend religious services. Those who attend services at least once a month will be deemed religious, and those who attend services less frequently will not. Religiosity will not, however, be included in the CSES models due to missing data. Equivalently receding the relevant CSES question to tap religious attendance would lead to four nations dropping out of the models. The other measure of religiosity included in the CSES dataset, which taps strength of religious feeling, is even more problematic: due to missing data, ten nations would have to be excluded.72 Although, however, much of the data pertaining to educational status in the WVS wave 3 is problematic. Therefore a simple measure will be included, a dummy dividing between those who have completed secondary school and those that have not. In the case of Croatia these responses appear flawed, so the dummy will be created from the variable tapping the age at which the respondent completed their schooling. It will be assumed in this case that those whose formal education ended at the age of 17 or over completed a secondary school education (this is not an arbitrary choice: age 17 is the CSES cut-off point for completing secondary school). The CSES education variable will be recoded to be congruent with this.
-85-

Political Corruption, Public Opinion, and Citizens' Behaviour
easily.73 Yet in the case of the CSES, the available variables make the construction of
an adequate class schema very difficult. The key 'socioeconomic status' variable has
only four broad categories, and it has many missing respondents. 74 The CSES income
variable has fewer missing responses, and will be recoded and used in the models
involving this dataset. 75
It is also necessary to control for organisational and attitudinal items. Thus one
factor is organisational membership. As discussed previously, organisations can
mobilise citizens, encouraging political behaviour to further their goals, while they
may also train citizens in 'civic skills' used in political participation and increase
'social capital' which may encourage collective action. The WVS asks about
respondents' membership of organisations in the many areas, including religion,
labour movements and the environment. Yet when a variable is created to count the
number of memberships each respondent possesses, it results in missing data which is
detrimental to our national level TV: many respondents fail to have responses for all the
categories, and, because they are not comparable to those that do, would have to be
excluded. Therefore, a key organisational membership labour unions will be
tapped specifically, dividing between those that are members and those that are not.
An equivalent variable can be created from the CSES dataset.
An important attitudinal control concerns citizens' interest in politics. This has
been shown to tie to political participation, with the more interested more likely to
73 It will be included as a recede of several variables, which enables the construction of a categorical variable placing the chief wage-earner of the respondent's household within a simplified version of the Erikson-Goldthorpe class schema used by Nieuwbeerta and De Graaf (1999). The categories to be included are: the service class; the routine nonmanual class; the petty bourgeoisie; skilled manual workers and farmers; non-skilled manual workers and agricultural labourers; armed forces / security personnel; and those who have never worked. The reference category will be the service class.74 It might be assumed that missing respondents are not the key wage earner in the house, but such respondents generally having missing data for their spouses' socioeconomic status too. Using the class variable would lead to three nations being excluded from the models due to missing data.75 Don't knows and refusals have been excluded, leaving five income categories, labelled lowest (reference), low, middle, high, and highest.
-86-

Political Corruption, Public Opinion, and Citizens' Behaviour
engage in political behaviour (Whiteley et al, 2001). Furthermore, perceived
corruption may vary according to the interest of the respondent in politics, and the
degree to which the behaviour of public servants matters to them. The WVS has a
variable tapping self-reported interest in politics which may be used, 76 although
unfortunately the CSES does not have an equivalent variable.
Another important variable concerns satisfaction with government. 77 Greater
dissatisfaction with the incumbent government's policy performance has been shown
to decrease turnout in the context of an ineffective opposition (Whiteley et al, 2001),
though an effective opposition might presumably gain increased support. Furthermore,
it is likely that those who are dissatisfied with the government's performance are more
likely to perceive corruption than are those who are satisfied with the government;
conversely, perceiving corruption may increase dissatisfaction. Thus it is appropriate
to control for the effect of this variable in case it proxies perceived corruption. 78
It will be included as a four-point continuous variable running from not at all interested to very interested, and is a recede of WVS question which is now outlined, along with the value attached to each response in square brackets: How interested would you say you are in politics? Very interested [4], somewhat interested [3], not very interested [2], not at all interested [I], or don't know, which presumably signals a lack of interest, and will be coded as 'not very interested' responses.77 Satisfaction in government will be included via a four-point continuous variable running from very dissatisfied to very satisfied. In the WVS models, this will be based on responses to the question asking: How satisfied are you with the way the people now in national office are handling the country's affairs? Would you say you are very satisfied [4], fairly satisfied [3], fairly dissatisfied [2], or very dissatisfied [1]? Don't know responses are likely to indicate a degree of satisfaction, otherwise it is probable respondents would be motivated to record a dissatisfied response, thus they will be marked as 'fairly satisfied' responses. In the CSES models, it will be based on responses to the question asking: Now thinking about the performance of the government in [capital]/president in general, how good or bad a job do you think the government/president in [capital] has done over the past [number of years between the previous and the present election OR change in govt.J years. Has it/he/she done a very good job? [4] A good job? [3] A bad job? [2] A very bad job? [I] Don't know responses are likely to indicate perception that the government has done quite a good job, otherwise they would presumably be motivated to record a more critical response, therefore they will be clustered with individuals who responded that the government had done a 'good job'. (Values assigned to the responses are in square brackets.)78 It is unfair to assume, however, that perceived corruption is just a proxy of dissatisfaction in government. Using CSES data, we find that the correlation between satisfaction in government and perceived corruption is only about -0.25.
-87-

Political Corruption, Public Opinion, and Citizens' Behaviour
Finally, there are two further variables included only in the WVS which will
be useful as controls. First, general levels of trust. 79 Perceived corruption might be a
reflection of citizens' general levels of trust instead of an independent assessment of
the behaviour of public servants (Davis et al, 2004). Furthermore, it may be that
greater trust encourages 'social capital' to facilitate co-ordination among citizens and,
Of\
potentially, participation. Second, individuals' placements on a categorical variable
pertaining to degrees of postmaterialism. 81 Postmaterialist orientations refer to
concerns over 'quality of life' and 'self-expression', ahead of traditional economic,
materialist orientations (Inglehart, 1997). Postmaterialism is argued to tie to greater
'active' participation such as petition signing, boycotts and demonstrations. Perhaps
because the CSES dataset is focused largely on attitudes towards electoral matters,
rather than social attitudes more generally, it does not include equivalent items to tap
social trust and postmaterialism, which is unfortunate.
Using multilevel modelling techniques means that we incorporate variables at
the national level as well as the individual level. Yet given the relatively small
national N it is important to include only a few pertinent national level indicators. One
way to help this selection is to observe what was explanatory in the models of the
7 Trust will be included via the inclusion of a dummy variable relating to citizens responses to the following WVS question: Generally speaking, would you say that most people can be trusted or that you can't be too careful in dealing with people? Don't know responses, which presumably indicate that citizens harbour doubts about peoples' trustworthiness, will be coded as responses indicating distrust.80 Trust, co-joined with organisational membership, ensures 'social capital' is tapped indirectly. We might, indeed, be forgiven in not worrying about failing to tap it directly, given the ambiguous nature of the concept.81 We have the advantage of two postmaterialism variables already having been created in the WVS dataset, one relating to four key postmaterialist / materialist items to derive a three-item variable; the second relating to twelve items to derive a five-item variable. Although, ceteris paribus, the more detailed variable would be preferred, the disadvantage in its use is the fact that it contains many more missing values. For simplicity, therefore, and to maintain as many responses as possible, the more parsimonious variable will be included. To derive it, respondents are questioned on how relatively important the following four issues are: maintaining order in the nation, giving people more say in important government decisions, fighting rising prices, and protecting freedom of speech, where the first and third items reflect materialist orientations, and the second and fourth items reflect postmaterialist ones. The responses are converted into a three-item variable differentiating materialist orientations, mixed orientations, and postmaterialist orientations. The variable to be included will be categorical, with materialist orientations set as the reference category.
Political Corruption, Public Opinion, and Citizens' Behaviour
previous chapter. In the turnout models, corruption, compulsory voting and logged
GDP per capita were significant at the 5% level; in the demonstration activity models,
corruption, corruption squared, and union density were significant at the 5% level.
In all models corruption82 , which is of key interest, will be included, along
with logged GDP per capita, 83 which is a crucial indicator. Recall from the more
extensive discussions in the previous chapter that it is important to control for wealth
due to its negative relationship with corruption, and its potential impact on
participation. Furthermore, the authoritarianism variable will be included despite its
lack of statistical significance in the previous chapter, because it remains a key
political measure which is positively associated with corruption and may affect the
capacity for meaningful participation in politics. 84 A disincentive to subversive
participation in the form of repressive government reaction is possible in more
authoritarian regimes. Finally, compulsory voting will be included for the models of
turnout. 85
Many of the other variables used in the previous chapter will not be used, as
individual level variables effectively measure them. Education and union membership,
82 Corruption will be tapped through the inclusion of the Corruption Index scores constructed earlier in the chapter to calculate the bivariate correlations between the Corruption Index and the means of the two individual level perceived corruption variables.83 Source: CIA World Factbook 1999 for the WVS models; the CIA World Factbook 2005 (retrieved online from the University of Missouri - St. Louis) for the CSES models.84 Source: Marshall and Jaggers (2002). Scores pertain to the year of each nation's election, although average scores have been used in the one case (Portugal) when two elections are analysed. Some nations in the CSES dataset were surveyed after 2003, which is the limit of the Polity IV data, thus they were given their 2003 score. This is not problematic, as there is no reason to believe that during the one or two years between the Polity score and the survey, there was a significant regime change to have substantively modified the scores of any of these nations: Australia, Canada, Britain, Japan, the Philippines, Portugal, South Korea, Spain, and the USA. Hong Kong, however, was problematic: it does not have Polity score, and it was surveyed in 2004. As an official region of China, it was therefore assigned China's 2003 score (which had been consistent for over twenty years). Iceland also does not have a Polity score, but was assigned the 'top' democratic score as it was in the previous chapter. Furthermore, the scores were coded in an identical manner to the same variable in the previous chapter.85 This is tapped in a variable included in the CSES dataset itself. It has been receded to create a dummy dividing between states in which a) compulsory voting is not in place, or it is, but it is not enforced; and b) compulsory voting is in place, and is at least weakly enforced.
-89-
Political Corruption, Public Opinion, and Citizens' Behaviour
for example, are already included, and may replace literacy and union density at the
o /:
national level.
Analysis
As already discussed, the models to be considered will include both individual and
national level variables. 87 This enables us to evaluate whether perceived corruption
and contextual, national level corruption have independent effects on political
participation. It is also methodologically desirable to use models with a multilevel
structure when dealing with surveys across units such as nations because we estimate
more reliable standard errors and avoid complications involving intra-nation
correlation that we would be likely to confront in pooled models.
The specification of the multilevel models may now be outlined formally,
following the equations in Snijders and Bosker (1999). First, yy may be specified as
the dependent variable at the individual level, but because of the nature of the
variables we are attempting to predict they are all binary and thus require logistic
Pregression the specification of yy is somewhat complex, and represents log l-p
86 However, it should be acknowledged that had our degrees of freedom been greater, it would be preferable to include these variables anyway. A contextual variable such as union density may have an effect on participation independent from an individual level measure of union membership, just as we have hypothesised independent effects for perceived and contextual corruption. A highly unionised society, for example, may involve the creation of 'access points' around decision-makers that may act as an incentive for all individuals to increase participatory activity, whether these individuals are union members or not. But due to the need for model parsimony, and the fact these variables are anyway of secondary interest to our key variables involving corruption, they will not be included.87 It was necessary to exclude nations with inadequate data. The distribution of responses to individual and national level factors was examined by country, to see if irregularities existed which threatened to bias results. In the case of the WVS, nine countries had such irregularities and had to be excluded; in the main part these countries had missing values for particular variables. Table A4.4 in the appendix outlines the countries and variables in question, and their exclusion has left 39 nations available, listed in Table A4.5 of the appendix. The CSES dataset was less problematic in this way, and only one nation Belgium was excluded, as it had missing values for income, leaving 29 nations available for analysis.
-90-
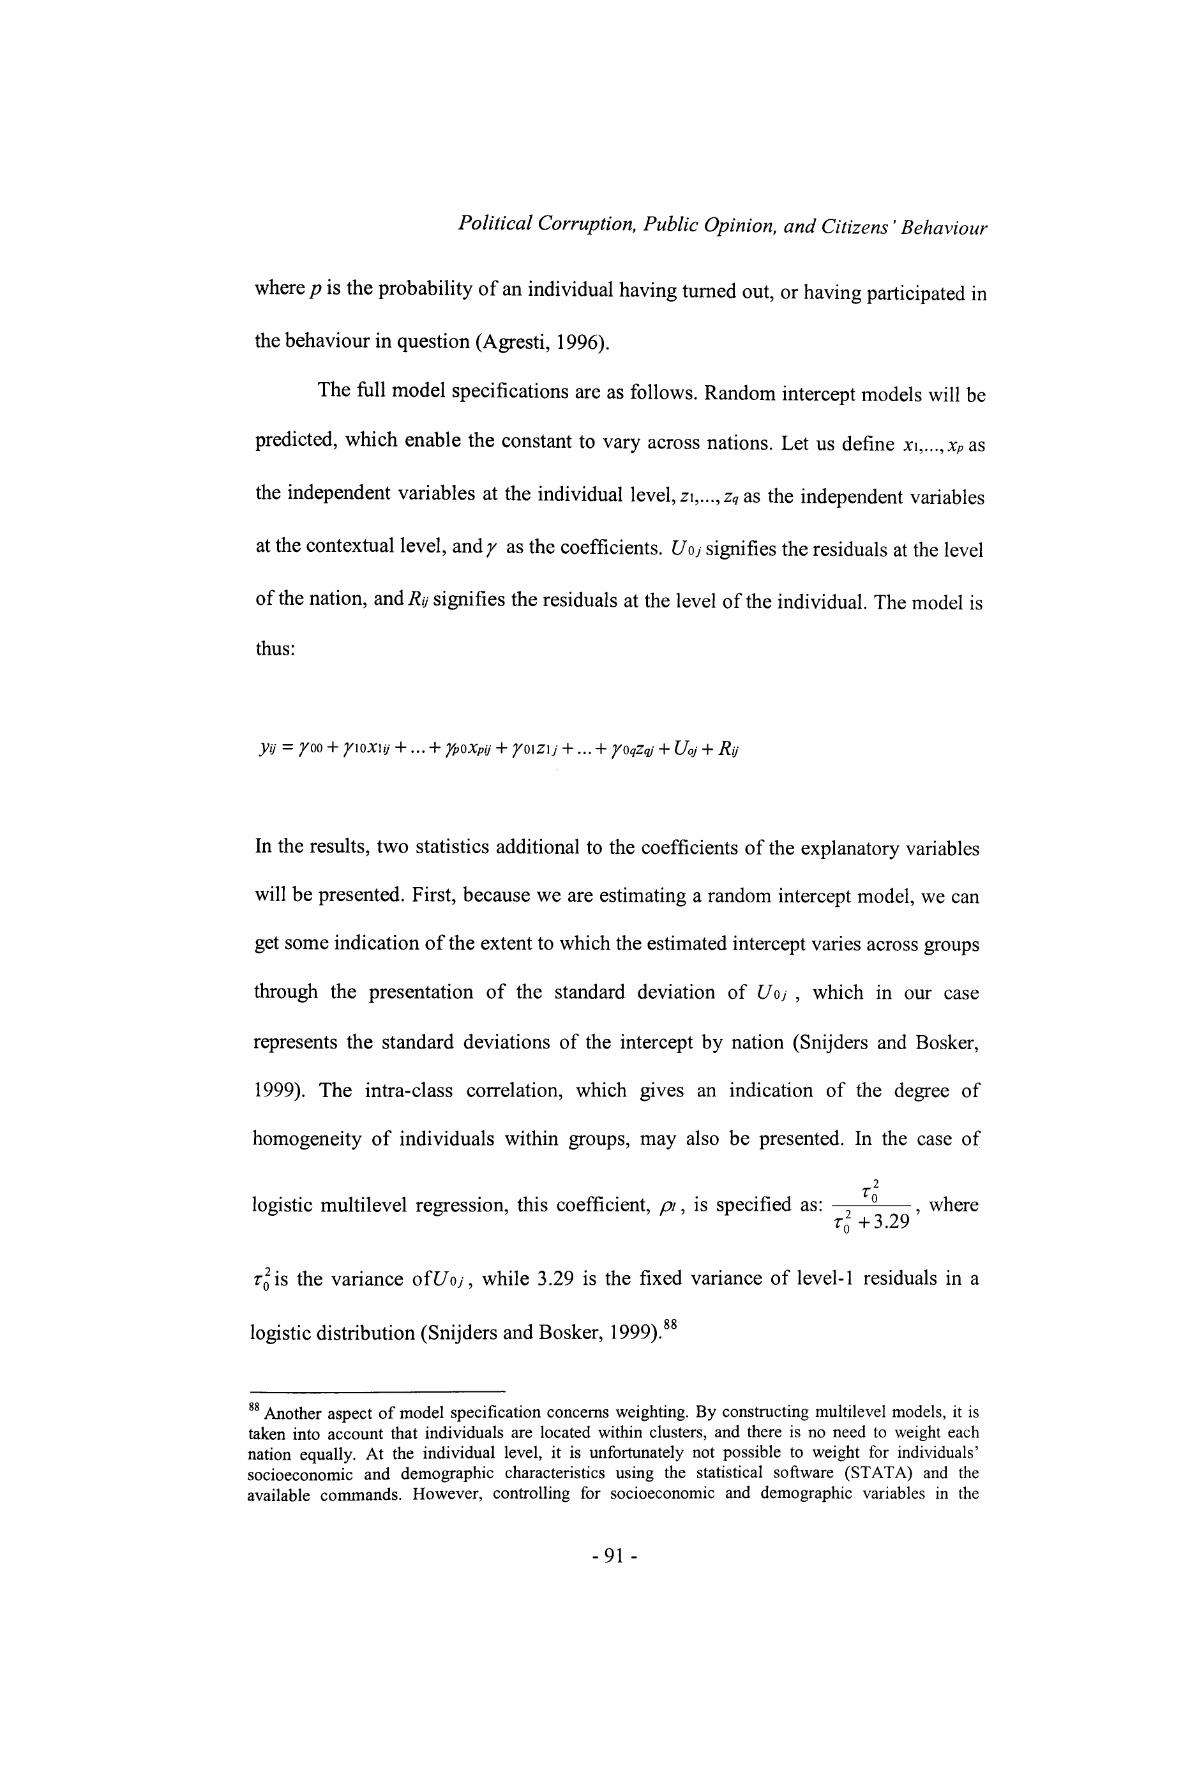
Political Corruption, Public Opinion, and Citizens' Behaviour
where p is the probability of an individual having turned out, or having participated in
the behaviour in question (Agresti, 1996).
The full model specifications are as follows. Random intercept models will be
predicted, which enable the constant to vary across nations. Let us define x\,...,xp as
the independent variables at the individual level, z\,...,zq as the independent variables
at the contextual level, and/ as the coefficients. Uoj signifies the residuals at the level
of the nation, and/?// signifies the residuals at the level of the individual. The model is
thus:
yy = 700 + y\ox\ij +... + yp oxpij + ymzij + ... + yoqZq/ + Uoj +
In the results, two statistics additional to the coefficients of the explanatory variables
will be presented. First, because we are estimating a random intercept model, we can
get some indication of the extent to which the estimated intercept varies across groups
through the presentation of the standard deviation of Uoj , which in our case
represents the standard deviations of the intercept by nation (Snijders and Bosker,
1999). The intra-class correlation, which gives an indication of the degree of
homogeneity of individuals within groups, may also be presented. In the case of
r 2logistic multilevel regression, this coefficient, pi, is specified as: - , where
TQ +3.29
r02 is the variance ofC/oy, while 3.29 is the fixed variance of level-1 residuals in a
logistic distribution (Snijders and Bosker, 1999). 88
88 Another aspect of model specification concerns weighting. By constructing multilevel models, it is taken into account that individuals are located within clusters, and there is no need to weight each nation equally. At the individual level, it is unfortunately not possible to weight for individuals' socioeconomic and demographic characteristics using the statistical software (STATA) and the available commands. However, controlling for socioeconomic and demographic variables in the
-91 -

Political Corruption, Public Opinion, and Citizens' Behaviour
Before the models are presented, note that a squared term on the national level
corruption variable was added to the models of the four extra-institutional behaviours,
in line with the hypotheses that such behaviours may have nonlinear relationships
with the Corruption Index. Finally, note that available diagnostic tests were
undertaken on the models, and no substantive problems were observed. 89
a) Turnout
Two models will be predicted. First, the national level Corruption Index will be
included without the perceived corruption variable, along with the controls (Model 7).
This model will give us an idea of how the Corruption Index associates with
propensity to turnout independent of individuals' perceived corruption. Second, the
full model will be presented which will comprise both corruption-related variables,
and all the control variables (Model 2). The results are presented in Table 4.1.
models, which in our case we extensively do, goes some way in preventing bias caused by the over and under-representation of different groups. Indeed, if one were to include as controls all the variables used to calculate a weight, then the results produced would be equivalent to a weighted model. 89 Diagnostic tests are useful in multilevel modelling to ensure that the key assumptions underlying the models are met. In these cases, the assumptions are a) that level 2 residuals are independent of level-1 predictors and vice-versa, and b) that level-2 residuals are normally distributed. Although some diagnostics to test these assumptions were unavailable, it was found that in the full model of each participatory activity the level 1 errors were not correlated with level 2 variables.
-92-
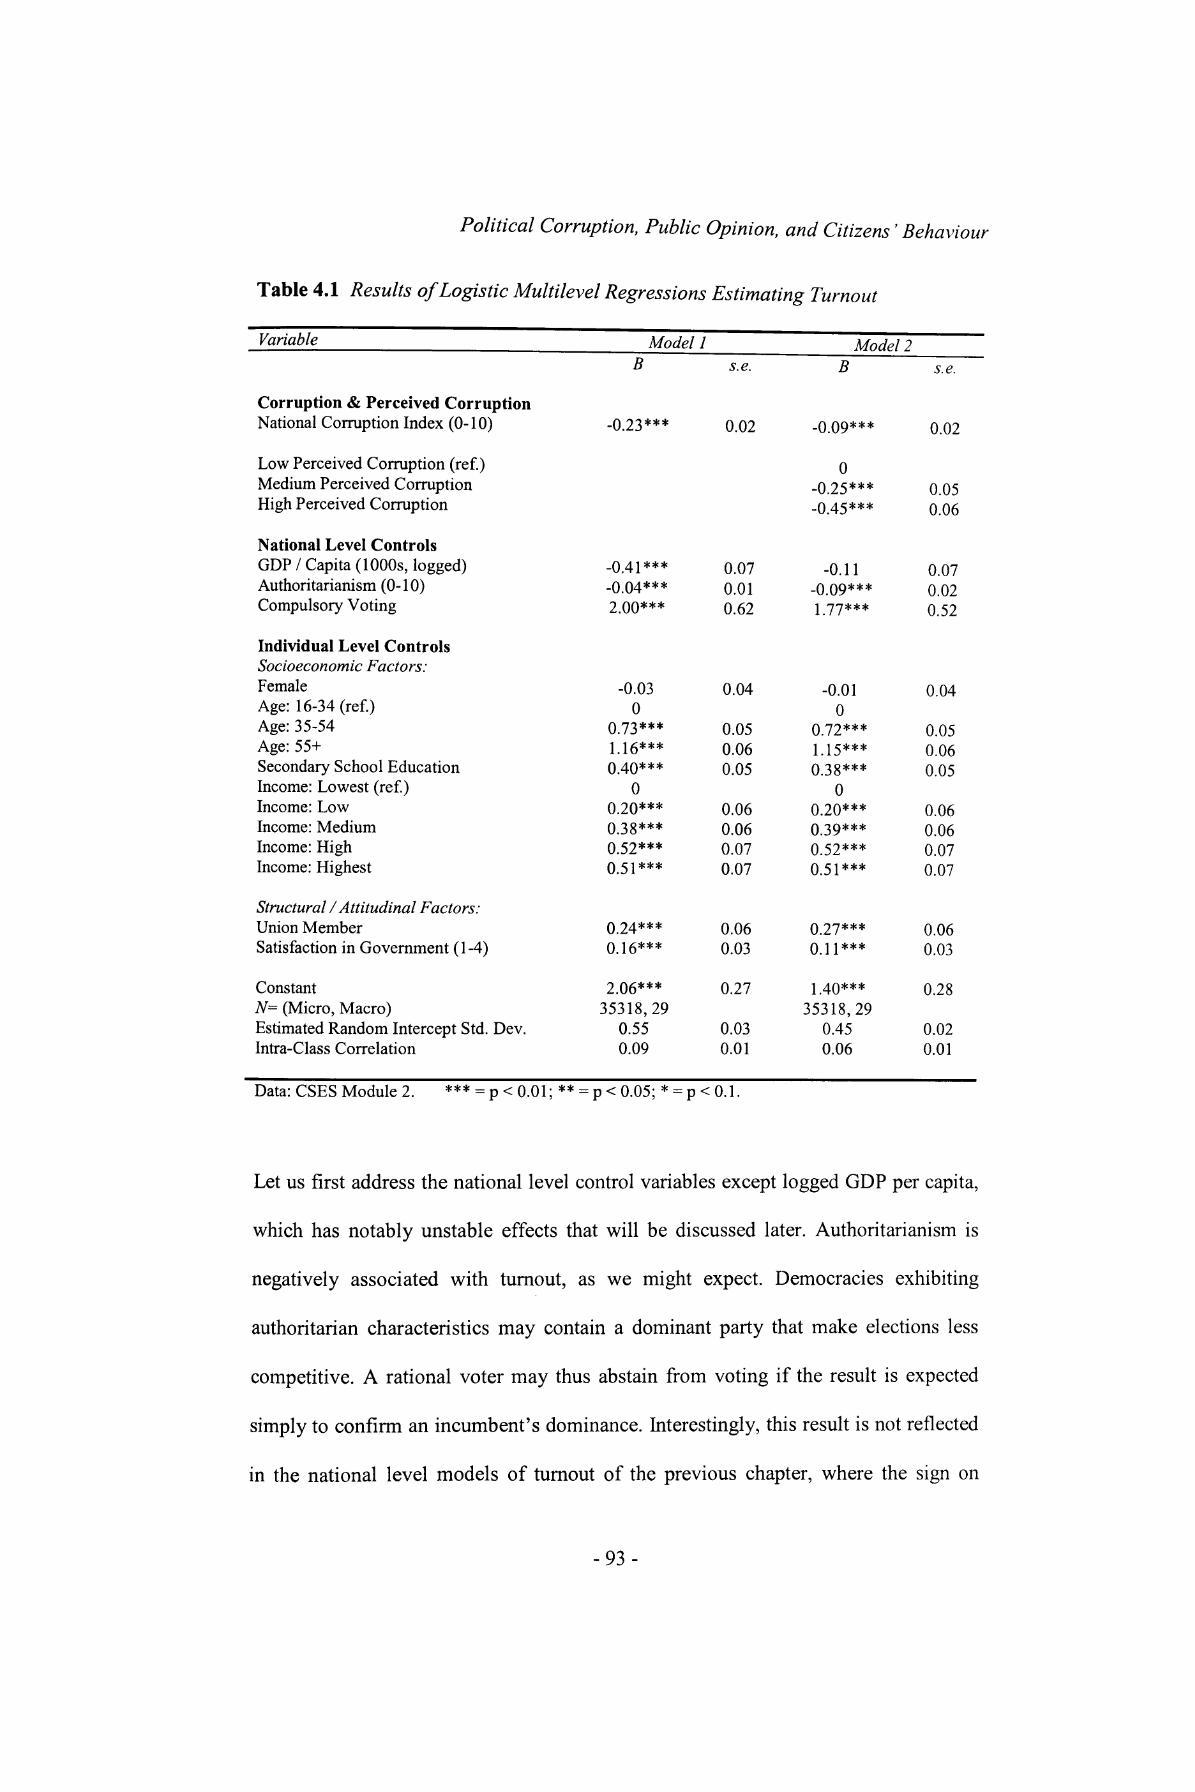
Political Corruption, Public Opinion, and Citizens' Behaviour
Table 4.1 Results of Logistic Multilevel Regressions Estimating Turnout
Variable
Corruption & Perceived CorruptionNational Corruption Index (0-10)
Low Perceived Corruption (ref.)Medium Perceived CorruptionHigh Perceived Corruption
National Level ControlsGDP / Capita (1000s, logged)Authoritarianism (0-10)Compulsory Voting
Individual Level ControlsSocioeconomic Factors:FemaleAge: 16-34 (ref.)Age: 35-54Age: 55+Secondary School EducationIncome: Lowest (ref.)Income: LowIncome: MediumIncome: HighIncome: Highest
Structural / Attitudinal Factors:Union MemberSatisfaction in Government (1-4)
ConstantN= (Micro, Macro)Estimated Random Intercept Std. Dev.Intra-Class Correlation
Model 1B
-0.23***
-0 41***-0.04***2.00***
-0.030
0.73***1.16***0.40***
00.20***0.38***0.52***0.51***
Q 24***0.16***
206***35318,29
0.550.09
s.e.
0.02
0.070.010.62
0.04
0.050.060.05
0.060.060.070.07
0.060.03
0.27
0.030.01
Model 2B
-0.09***
0-0.25***-0.45***
-0.11-0.09***
1 77***
-0.010
0.72***j 15***0.38***
00.20***0.39***0.52***0.51***
0.27***0 \ i***
1 40***35318,29
0.450.06
s.e.
0.02
0.050.06
0.070.020.52
0.04
0.050.060.05
0.060.060.070.07
0.060.03
0.28
0.020.01
Data: CSES Module 2. *** = p < 0.01; ** = p < 0.05; * = p < 0.1.
Let us first address the national level control variables except logged GDP per capita,
which has notably unstable effects that will be discussed later. Authoritarianism is
negatively associated with turnout, as we might expect. Democracies exhibiting
authoritarian characteristics may contain a dominant party that make elections less
competitive. A rational voter may thus abstain from voting if the result is expected
simply to confirm an incumbent's dominance. Interestingly, this result is not reflected
in the national level models of turnout of the previous chapter, where the sign on
-93-
Political Corruption, Public Opinion, and Citizens' Behaviour
authoritarianism is correct, but it is not statistically significant. This anomaly is
lessened, however, when one considers that the effect is small here, and also quite
unstable: it grows significantly from Model 1 to Model 2. Moreover, as the CSES
covers fewer countries than the models in the previous chapter, and given that these
countries are generally very not authoritarian, this result reflects lower turnout in the
handful of countries that are more authoritarian. The models in the previous chapter
are not sensitive to a cluster of a few nations in this way which shows a limitation of
our relatively low N. Meanwhile, compulsory voting is highly positively related to
turnout, as we expected, and is congruent with the macro level models predicted in the
last chapter. Institutionalised disincentives to non-voting clearly affect the calculus of
a voter and encourage electoral participation.
Turning to the individual level controls, we see that the results are largely
unsurprising. Older people, the better educated, higher earners, union members, and
those who are satisfied with government are more likely to vote. The generational
effect of older individuals being more inclined to turnout (although not necessarily to
participate in other ways) is documented elsewhere (Norris, 2004; Norris, 2002). The
socioeconomic effects of income and education are consistent with Verba et al (1978).
Perhaps the only surprising effect is that those satisfied with the incumbent
government are more likely to vote. On the one hand it might be anticipated that it
would be dissatisfaction that would prompt voters to turn out, as dissatisfied voters
would be likely to support opposition parties. On the other hand, satisfaction in
government may translate to the incentive to turnout to keep the incumbent in power.
The aggregate effect of these incentives, it seems, is that greater satisfaction, not
dissatisfaction, prompts electoral participation.
-94-
Political Corruption, Public Opinion, and Citizens' Behaviour
Yet for our purposes the two corruption variables are of more interest.
Consistent with hypothesis HI, we see in Model 2 that perceived corruption predicts
lower levels of turnout. Furthermore, hypothesis H3, which predicts that national level
corruption also promotes lower turnout, is also supported, despite the coefficient on
the Corruption Index weakening somewhat when perceived corruption is added.
Therefore, consistent with both relevant hypotheses, corruption has a contextual and
an individual level effect.
Recall that in regard to individual level perceived corruption, the effect is
intuitive. Perceiving greater corruption decreases trust in political institutions,
including electoral institutions, and heightens mistrust of elected officials, which
results in diminished electoral participation. Greater perceived corruption implies an
decreased sense of efficacy associated with voting that has a direct effect on the
individual being examined. The contextual effect, meanwhile, may be argued to rest
on the notion that national characteristics such as corruption induce particular
participatory trends among citizens of a particular nation, that lead to aggregate
effects on items such as turnout. As hypothesised, whether one perceives high levels
of corruption or not, the tendency among citizens to vote or not (which is affected by
corruption at the national level) will still influence an individual citizens' voting
calculus, and thus lead to decreased electoral participation where corruption is high.
The strength of these effects is tricky to determine from logistic regression,
which derives coefficients that are difficult to interpret, so if we make some
assumptions for a hypothetical individual,90 we may consequently derive the predicted
90 These assumptions are: that they live in a nation with no compulsory voting and mean scores for the Corruption Index, logged GDP per capita, and authoritarianism; that they have a mean score for satisfaction in government; and that they are male, aged 16-34, have a secondary school education, are in the medium income bracket, and are not a union member.
-95-
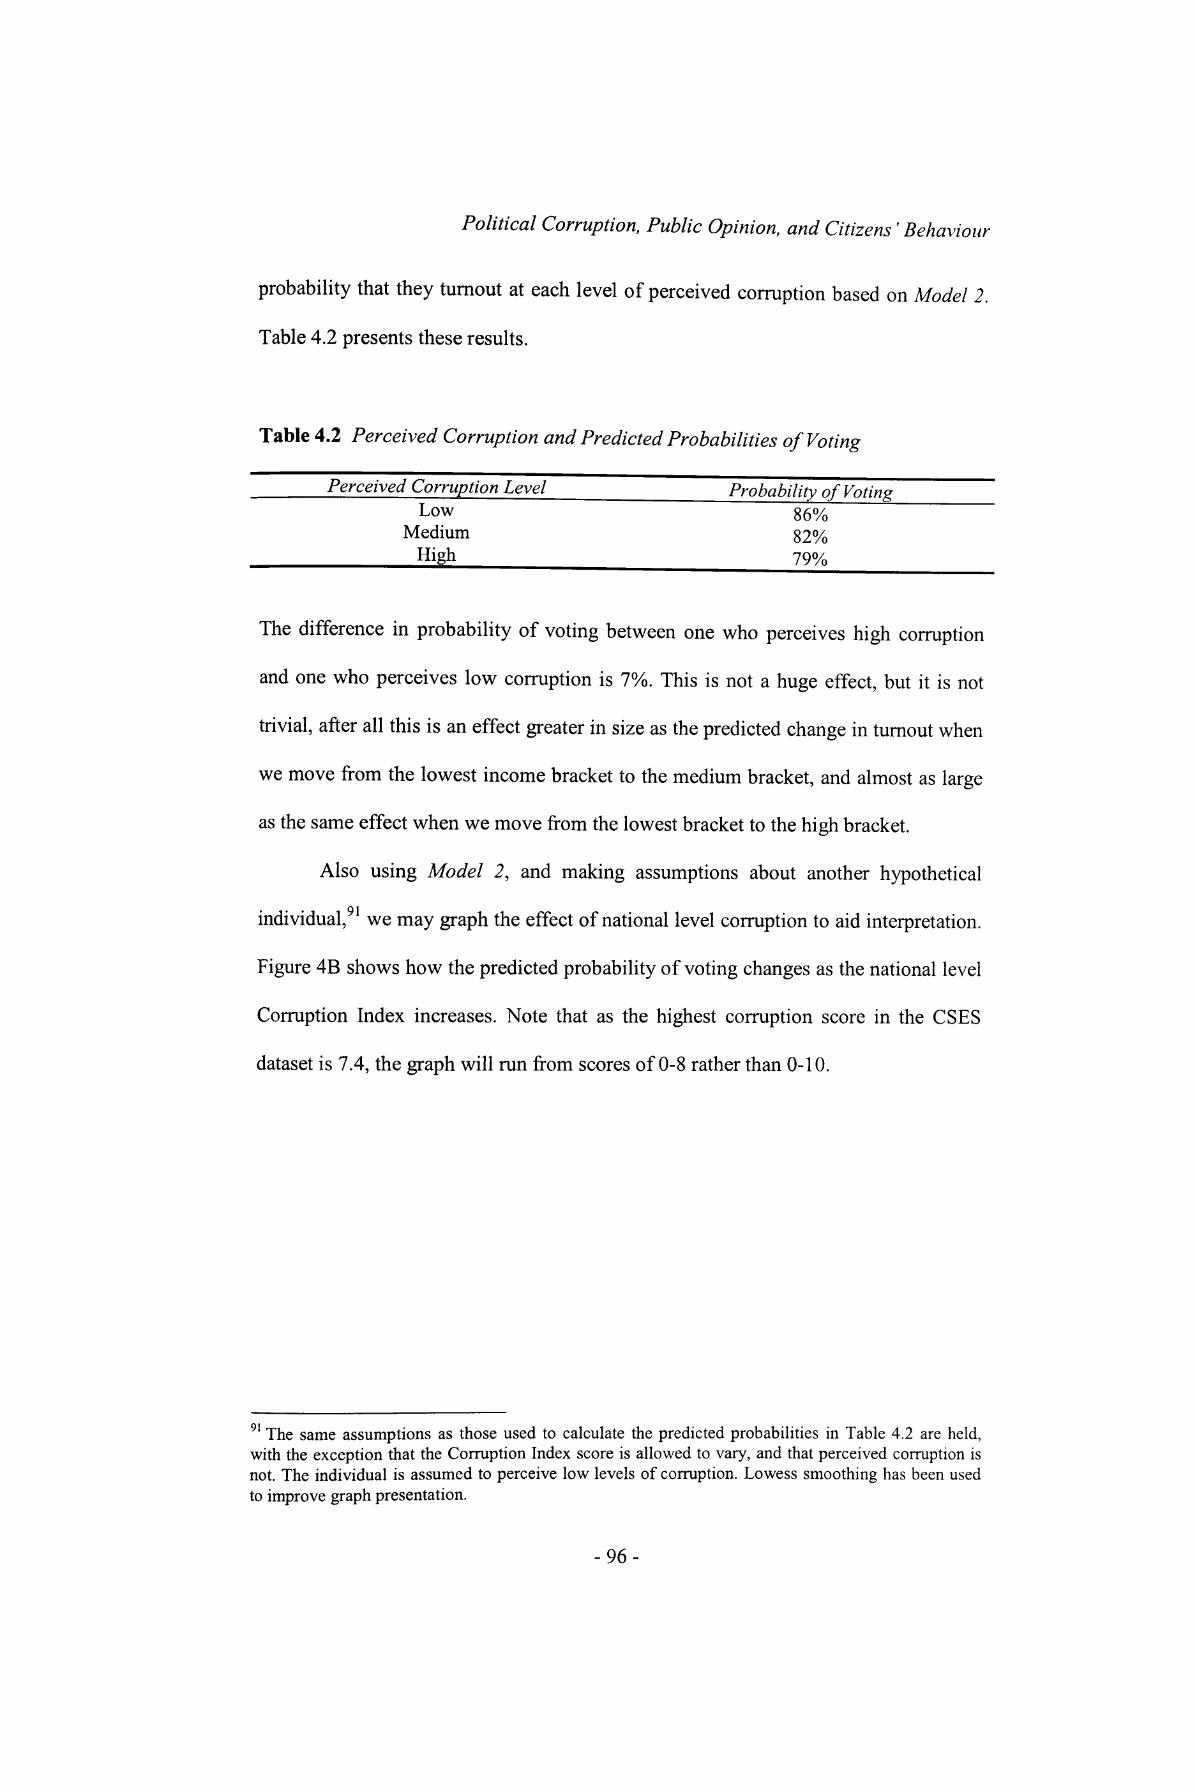
Political Corruption, Public Opinion, and Citizens' Behaviour
probability that they turnout at each level of perceived corruption based on Model 2.
Table 4.2 presents these results.
Table 4.2 Perceived Corruption and Predicted Probabilities of Voting
_____Perceived Corruption Level______________Probability of VotingLow 86%
Medium 82%________High 79%
The difference in probability of voting between one who perceives high corruption
and one who perceives low corruption is 7%. This is not a huge effect, but it is not
trivial, after all this is an effect greater in size as the predicted change in turnout when
we move from the lowest income bracket to the medium bracket, and almost as large
as the same effect when we move from the lowest bracket to the high bracket.
Also using Model 2, and making assumptions about another hypothetical
individual,91 we may graph the effect of national level corruption to aid interpretation.
Figure 4B shows how the predicted probability of voting changes as the national level
Corruption Index increases. Note that as the highest corruption score in the CSES
dataset is 7.4, the graph will run from scores of 0-8 rather than 0-10.
91 The same assumptions as those used to calculate the predicted probabilities in Table 4.2 are held, with the exception that the Corruption Index score is allowed to vary, and that perceived corruption is not. The individual is assumed to perceive low levels of corruption. Lowess smoothing has been used to improve graph presentation.
-96-
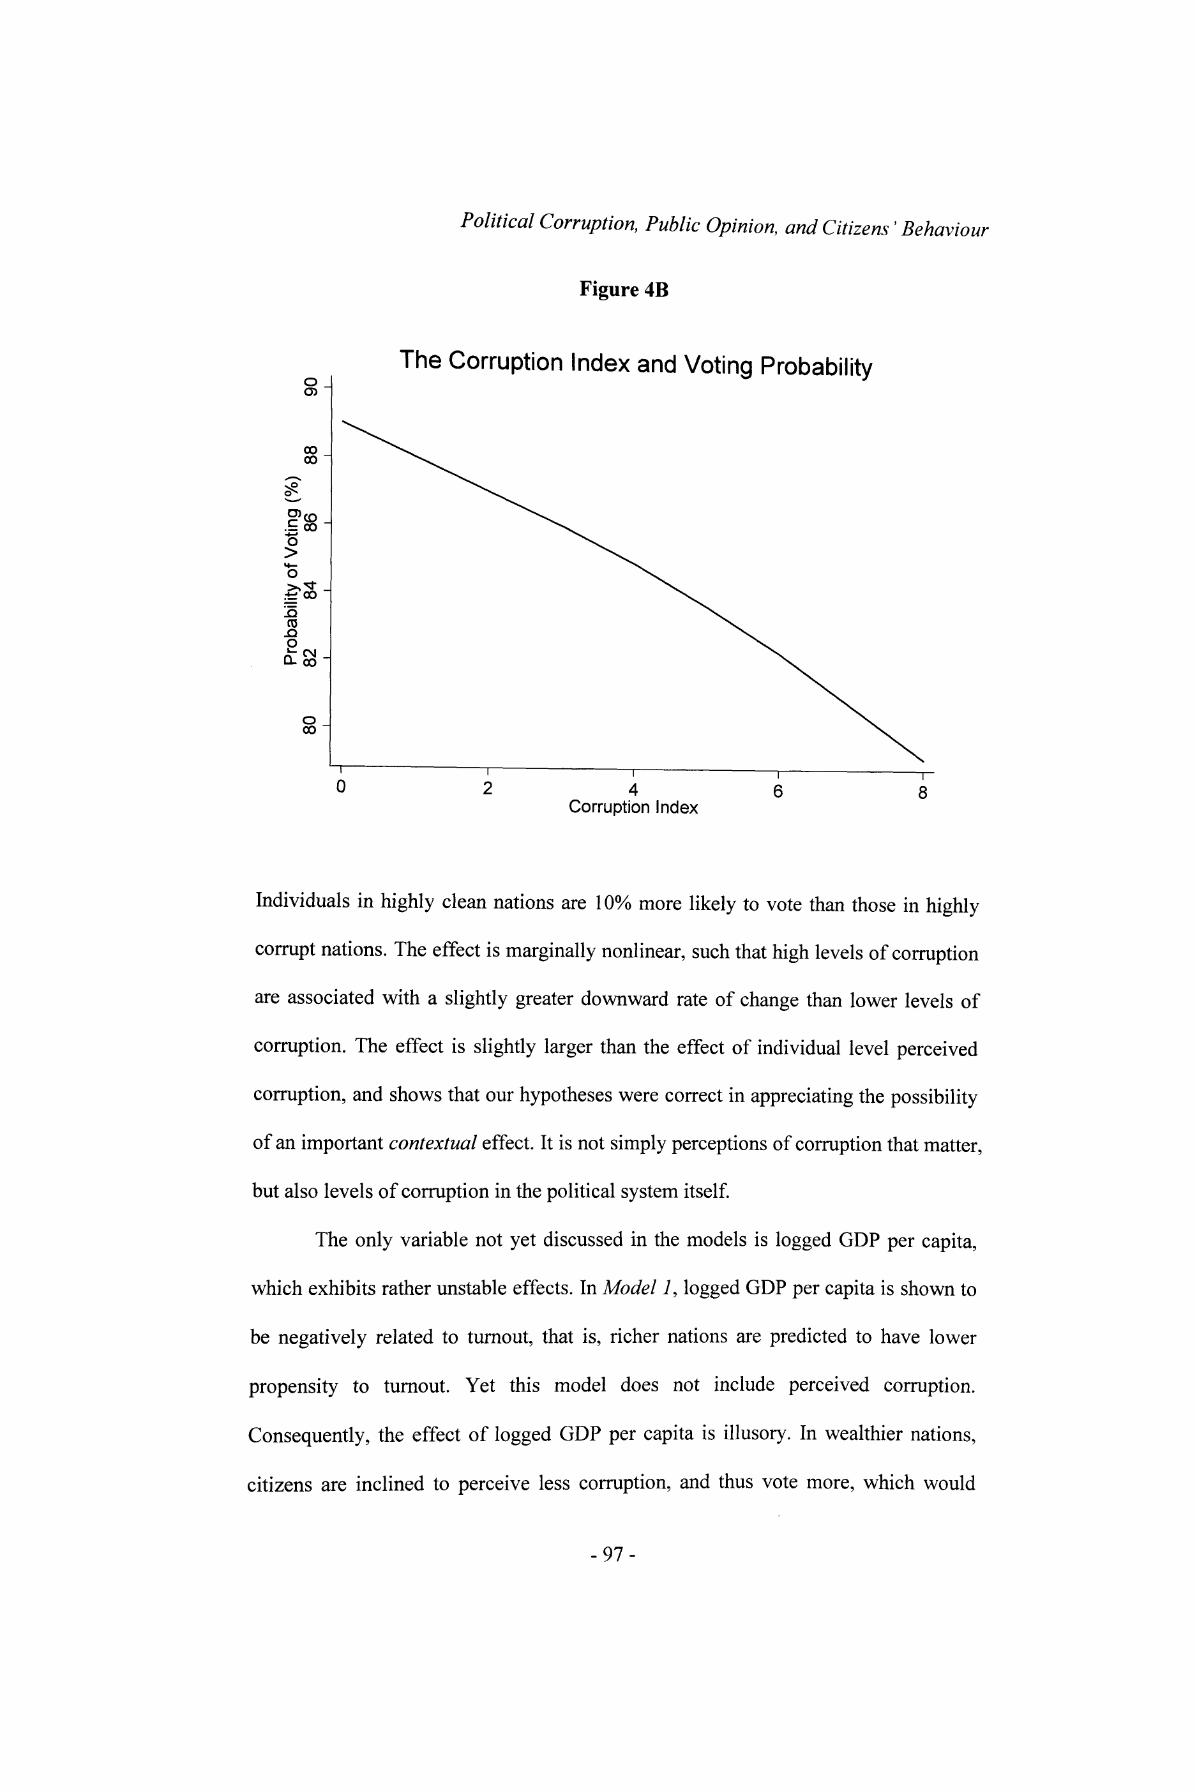
Political Corruption, Public Opinion, and Citizens' Behaviour
Figure 4B
oO)
CO CO
O) CO _rM—o*5CD .Q
O 00
~r 0
The Corruption Index and Voting Probability
~r 2
Corruption Index
~r 8
Individuals in highly clean nations are 10% more likely to vote than those in highly
corrupt nations. The effect is marginally nonlinear, such that high levels of corruption
are associated with a slightly greater downward rate of change than lower levels of
corruption. The effect is slightly larger than the effect of individual level perceived
corruption, and shows that our hypotheses were correct in appreciating the possibility
of an important contextual effect. It is not simply perceptions of corruption that matter,
but also levels of corruption in the political system itself.
The only variable not yet discussed in the models is logged GDP per capita,
which exhibits rather unstable effects. In Model 1, logged GDP per capita is shown to
be negatively related to turnout, that is, richer nations are predicted to have lower
propensity to turnout. Yet this model does not include perceived corruption.
Consequently, the effect of logged GDP per capita is illusory. In wealthier nations,
citizens are inclined to perceive less corruption, and thus vote more, which would
-97-

Political Corruption, Public Opinion, and Citizens' Behaviour
cancel this predicted relationship. Indeed, the inclusion of both perceived corruption
and national level corruption in Model 2 shows that higher levels of both perceived
corruption and national level corruption predict lower propensity to turnout, while
logged GDP per capita is not statistically significant. Its negative sign is, however,
consistent with the results of the previous chapter regarding turnout, and it may be
that the inclusion of greater national level cases would make it statistically significant
and hence directly equivalent to those results.
b) Extra-Institutional Behaviour
We now predict models of the four extra-institutional behaviours: petition-signing,
boycotts, demonstration activity and strike participation. Once again, two models for
each behaviour will be predicted, the first omitting the individual level perceived
corruption variable to examine the independent effect of the national level Corruption
Index, the second including all the variables. Consequently, eight models in total are
predicted, and are shown in Table 4.3.
-98-
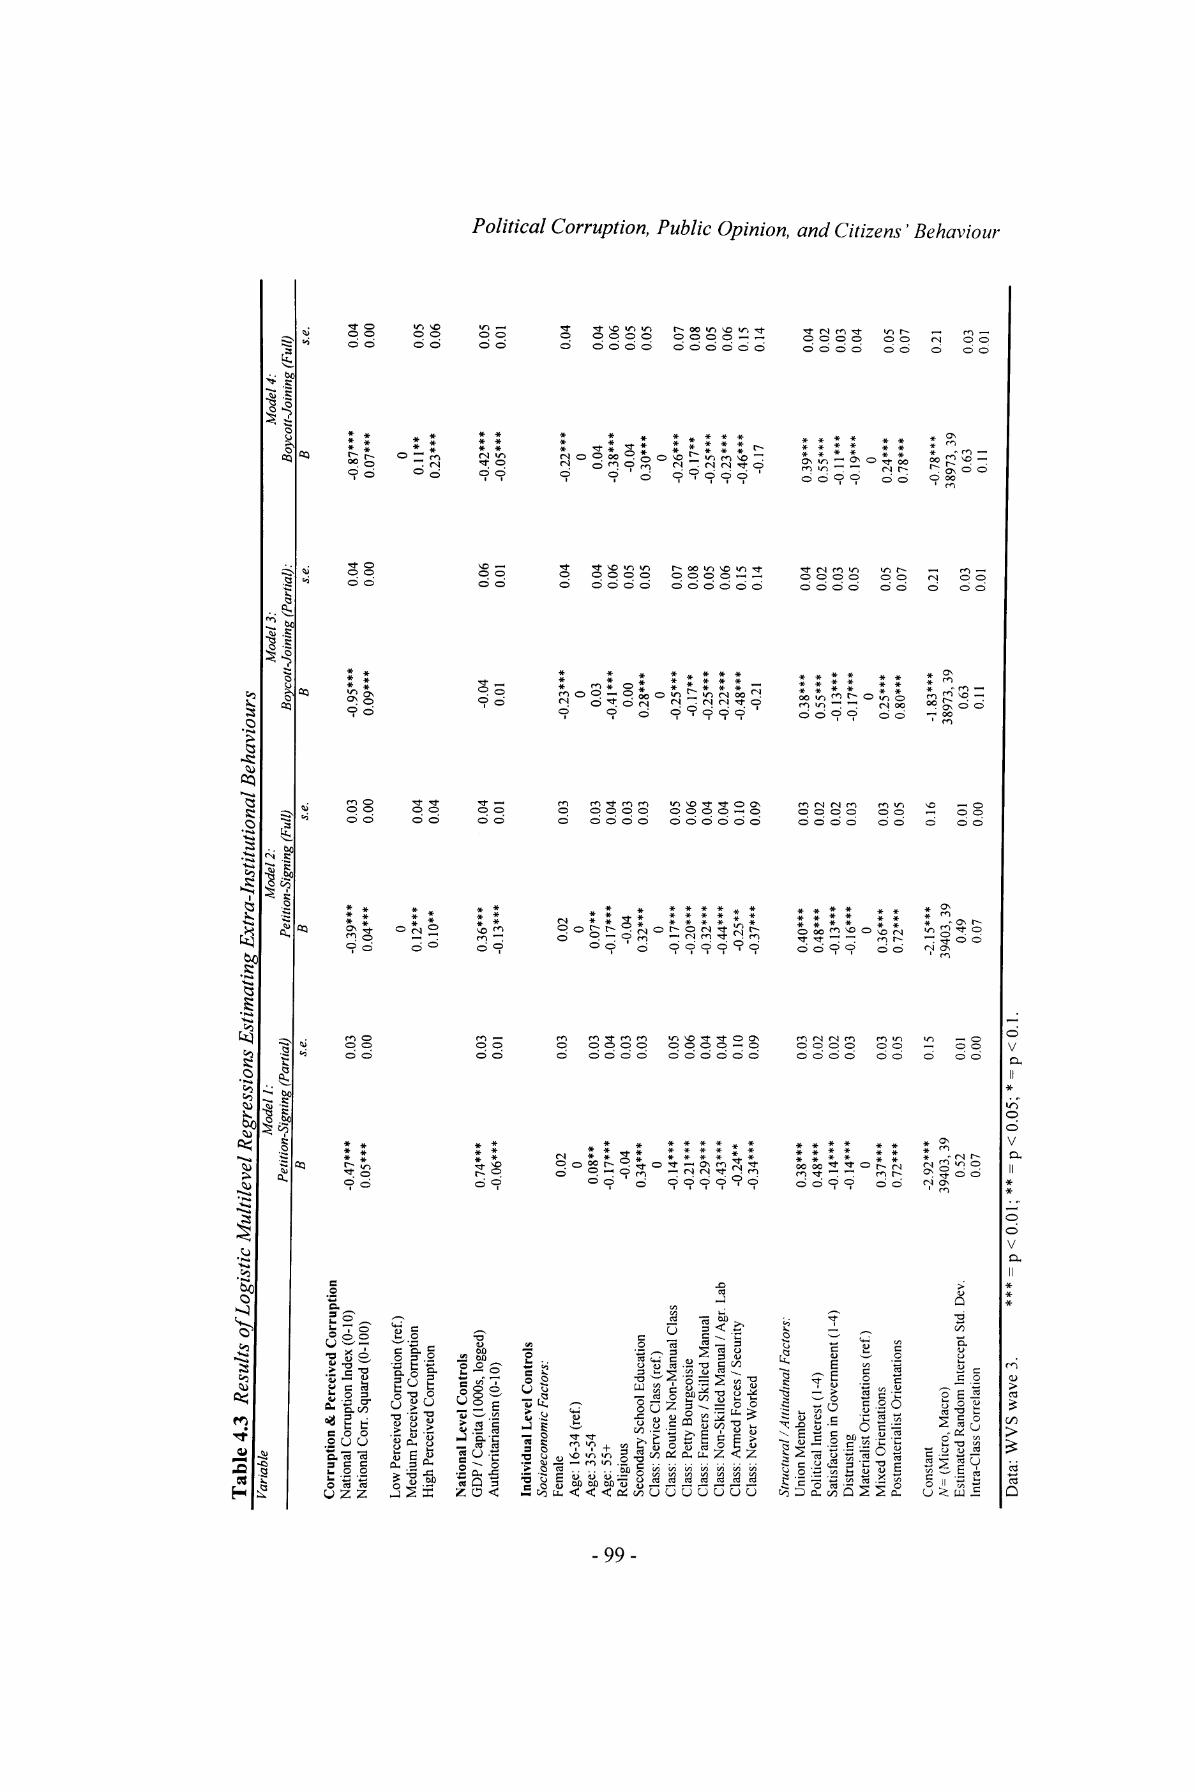
Tab
le 4
.3 R
esul
ts o
f Log
isti
c M
ulti
leve
l Reg
ress
ions
Est
imat
ing
Ext
ra-I
nstit
utio
nal B
ehav
iour
s
I vo
Var
iabl
e
Cor
rupt
ion
& P
erce
ived
Cor
rupt
ion
Nat
iona
l Cor
rupt
ion
Inde
x (0
-10)
Nat
iona
l Cor
r. Sq
uare
d (0
-100
)
Low
Per
ceiv
ed C
orru
ptio
n (r
ef.)
Med
ium
Per
ceiv
ed C
orru
ptio
nH
igh
Perc
eive
d C
orru
ptio
n
Nat
iona
l Le
vel
Con
trol
sG
DP
/ Cap
ita (1
000s
, log
ged)
Aut
hori
tari
anis
m (
0-10
)
Indi
vidu
al L
evel
Con
trol
sSo
cioe
cono
mic
Fac
tors
:Fe
mal
eA
ge:
16-3
4 (r
ef.)
Age
: 35
-54
Age
: 55
+R
elig
ious
Seco
ndar
y Sc
hool
Edu
catio
nC
lass
: Se
rvic
e C
lass
(re
f.)C
lass
: R
outin
e N
on-M
anua
l C
lass
Cla
ss:
Petty
Bou
rgeo
isie
Cla
ss:
Farm
ers
/ Ski
lled
Man
ual
Cla
ss: N
on-S
kille
d M
anua
l / A
gr.
Lab
Cla
ss:
Arm
ed F
orce
s / S
ecur
ityC
lass
: Nev
er W
orke
d
Stru
ctur
al / A
ttitu
dina
l Fac
tors
:U
nion
Mem
ber
Polit
ical
Int
eres
t (1-
4)Sa
tisfa
ctio
n in
Gov
ernm
ent
(1-4
)D
istr
ustin
gM
ater
ialis
t Ori
enta
tions
(re
f.)M
ixed
Ori
enta
tions
Post
mat
eria
list O
rien
tatio
ns
Con
stan
tN
= (
Mic
ro,
Mac
ro)
Est
imat
ed R
ando
m I
nter
cept
Std
. D
ev.
Intr
a-C
lass
Cor
rela
tion
Mod
el 1
: P
etiti
on-S
igni
ng (
Par
tial)
B
-0.4
7***
0.05
***
0.74
***
-0.0
6***
0.02 0
0.08
**-0
.17*
**-0
.04
0.34
***
0-0
.14*
**-0
.21*
**-0
.29*
**-0
.43*
**-0
.24*
*-0
.34*
**
0.38
***
0.48
***
-0.1
4***
-0.1
4***
00.
37**
*0.
72**
*
-2.9
2***
3940
3, 3
90.
520.
07
s.e.
0.03
0.00
0.03
0.01
0.03
0.03
0.04
0.03
0.03
0.05
0.06
0.04
0.04
0.10
0.09
0.03
0.02
0.02
0.03
0.03
0.05
0.15
0.01
0.00
Mod
el 2
: P
etiti
on-S
igni
ng (
Ful
l)B
-0.3
9***
0.04
***
00.
12**
*0.
10**
0.36
***
-0.1
3***
0.02 0
0.07
**-0
.17*
**-0
.04
0.32
***
0.0
.17*
**-0
.20*
**-0
.32*
**.0
.44*
**-0
.25*
*-0
.37*
**
0.40
***
0.48
***
-0.1
3***
-0.1
6***
00.
36**
*07
2***
-2.1
5***
3940
3, 3
90.
490.
07
s.e.
0.03
0.00
0.04
0.04
0.04
0.01
0.03
0.03
0.04
0.03
0.03
0.05
0.06
0.04
0.04
0.10
0.09
0.03
0.02
0.02
0.03
0.03
0.05
0.16
0.01
0.00
Mod
el 3
: B
oyco
tt-Jo
inin
g (P
artia
l):
B
-0.9
5***
0.09
***
-0.0
40.
01
-0.2
3***
00.
03-0
.41*
**0.
000.
28**
*0
-0.2
5***
-0.1
7**
-0.2
5***
-0.2
2***
-0.4
8***
-0.2
1
0.38
***
0.55
***
-0.1
3***
-0.1
7***
00.
25**
*0.
80**
*
-1.8
3***
3897
3, 3
90.
630.
11
s.e.
0.04
0.00
0.06
0.01
0.04
0.04
0.06
0.05
0.05
0.07
0.08
0.05
0.06
0.15
0.14
0.04
0.02
0.03
0.05
0.05
0.07
0.21
0.03
0.01
Mod
el 4
: B
oyco
tt-Jo
inin
g (F
ull)
B
-0.8
7***
0.07
***
00.
11**
0.23
***
-0.4
2***
-0.0
5***
-0.2
2***
00.
04-0
.38*
**-0
.04
0.30
***
0-0
.26*
**-0
.17*
*-0
.25*
**-0
.23*
**-0
.46*
**-0
.17
0.39
***
0.55
***
-0.1
1***
.0.1
9***
00.
24**
*0.
78**
*
-0.7
8***
3897
3,39
0.63
0.11
s.e.
0.04
0.00
0.05
0.06
0.05
0.01
0.04
0.04
0.06
0.05
0.05
0.07
0.08
0.05
0.06
0.15
0.14
0.04
0.02
0.03
0.04
0.05
0.07
0.21
0.03
0.01
I a ***. o a O to
'K
Dat
a: W
VS
wav
e 3.
***
= = p<
0.01
; **
= p
<0.
05;
* =
p<0.
1.
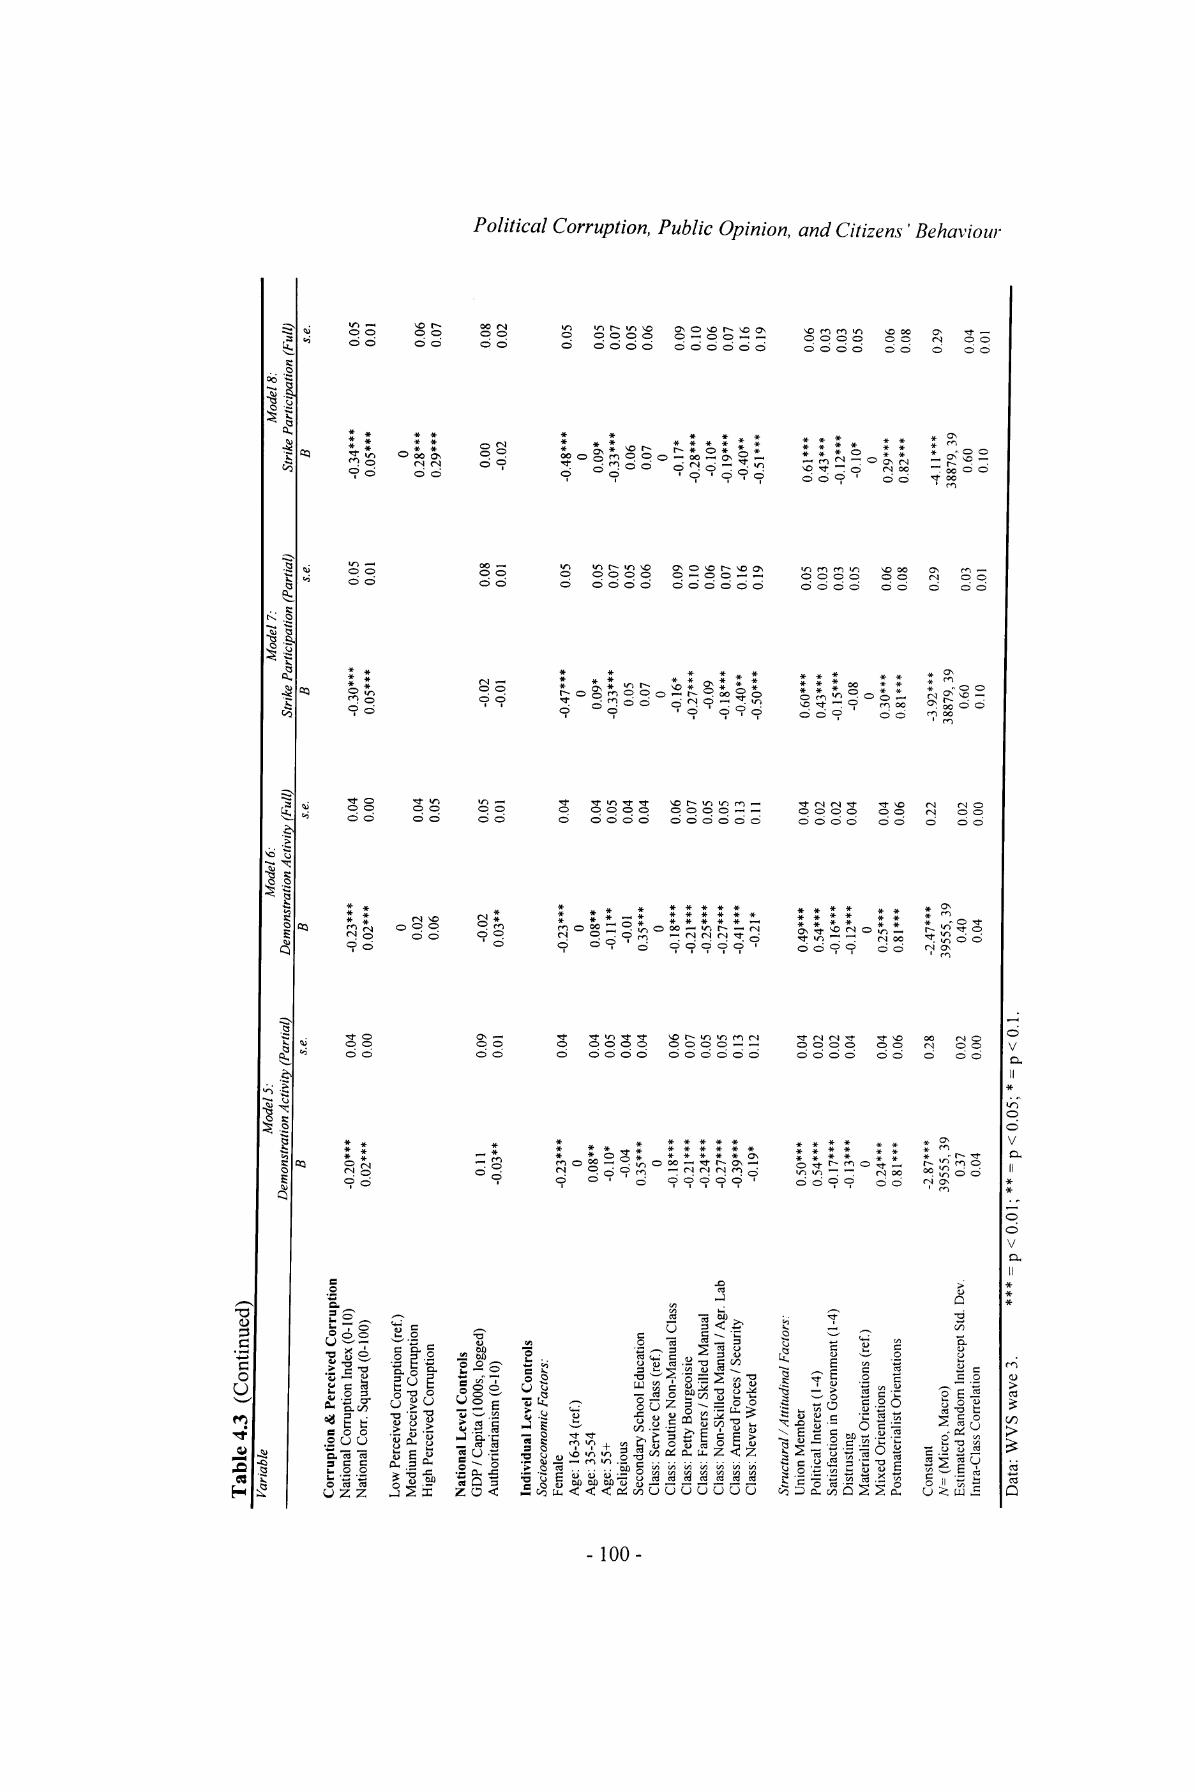
Tab
le 4
.3 (
Con
tinue
d)
o
o
Var
iabl
e M
odel
5:
Dem
onst
ratio
n A
ctiv
ity (
Par
tial)
Cor
rupt
ion
& P
erce
ived
Cor
rupt
ion
Nat
iona
l Cor
rupt
ion
Inde
x (0
-10)
Nat
iona
l Cor
r. Sq
uare
d (0
-100
)
Low
Per
ceiv
ed C
orru
ptio
n (r
ef.)
Med
ium
Per
ceiv
ed C
orru
ptio
nH
igh
Perc
eive
d C
orru
ptio
n
Nat
iona
l Le
vel C
ontr
ols
GD
P / C
apita
(10
00s,
log
ged)
Aut
hori
tari
anis
m (
0-10
)
Indi
vidu
al L
evel
Con
trol
sSo
cioe
cono
mic
Fac
tors
:Fe
mal
eA
ge:
16-3
4 (r
ef.)
Age
: 35
-54
Age
: 55
+R
elig
ious
Seco
ndar
y Sc
hool
Edu
catio
nC
lass
: Se
rvic
e C
lass
(re
f.)C
lass
: R
outin
e N
on-M
anua
l Cla
ssC
lass
: Pe
tty B
ourg
eois
ieC
lass
: Fa
rmer
s / S
kille
d M
anua
lC
lass
: N
on-S
kille
d M
anua
l / A
gr.
Lab
Cla
ss:
Arm
ed F
orce
s / S
ecur
ityC
lass
: N
ever
Wor
ked
Stru
ctur
al / A
ttitu
dina
l Fac
tors
:U
nion
Mem
ber
Polit
ical
Int
eres
t (1-
4)Sa
tisfa
ctio
n in
Gov
ernm
ent (
1-4)
Dis
trus
ting
Mat
eria
list O
rien
tatio
ns (
ref.)
Mix
ed O
rien
tatio
nsPo
stm
ater
ialis
t Ori
enta
tions
Con
stan
tN
= (
Mic
ro,
Mac
ro)
Est
imat
ed R
ando
m I
nter
cept
Std
. D
ev.
Intr
a-C
lass
Cor
rela
tion
B
-0.2
0***
0.02
***
0.11
-0.0
3**
-0.2
3***
00.
08**
-0.1
0*-0
.04
0.35
***
0-0
.18*
**-0
.21*
**-0
.24*
**-0
.27*
**-0
.39*
**-0
.19*
0.50
***
0.54
***
-0.1
7***
.0.1
3***
00.
24**
*0.
81**
*
-2.8
7***
3955
5,39
0.37
0.04
s.e.
0.04
0.00
0.09
0.01
0.04
0.04
0.05
0.04
0.04
0.06
0.07
0.05
0.05
0.13
0.12
0.04
0.02
0.02
0.04
0.04
0.06
0.28
0.02
0.00
Mod
el 6
: D
emon
stra
tion
Act
ivity
(F
ull)
B
-0.2
3***
0.02
***
00.
020.
06
-0.0
20.
03**
.0.2
3***
00.
08**
-0.1
1**
-0.0
10.
35**
*0
-0.1
8***
-0.2
1***
-0.2
5***
-0.2
7***
-0.4
1***
-0.2
1*
0.49
***
0.54
***
-0.1
6***
-0.1
2***
00.
25**
*0.
81**
*
-2.4
7***
3955
5,39
0.40
0.04
s.e.
0.04
0.00
0.04
0.05
0.05
0.01
0.04
0.04
0.05
0.04
0.04
0.06
0.07
0.05
0.05
0.13
0.11
0.04
0.02
0.02
0.04
0.04
0.06
0.22
0.02
0.00
Mod
el 7
: St
rike
Par
ticip
atio
n (P
artia
l)B
-0.3
0***
0.05
***
-0.0
2-0
.01
-0.4
7***
00.
09*
-0.3
3***
0.05
0.07 0
-0.1
6*-0
.27*
**-0
.09
-0.1
8***
-0.4
0**
-0.5
0***
0.60
***
0.43
***
.0.1
5***
-0.0
80
0.30
***
0.81
***
-3.9
2***
3887
9, 3
90.
600.
10
s.e.
0.05
0.01
0.08
0.01
0.05
0.05
0.07
0.05
0.06
0.09
0.10
0.06
0.07
0.16
0.19
0.05
0.03
0.03
0.05
0.06
0.08
0.29
0.03
0.01
Mod
el 8
: St
rike
Par
ticip
atio
n (F
ull)
B
-0.3
4***
0.05
***
00.
28**
*0.
29**
*
0.00
-0.0
2
-0.4
8***
00.
09*
-0.3
3***
0.06
0.07 0
-0.1
7*-0
.28*
**-0
.10*
-0.1
9***
-0.4
0**
-0.5
1***
0.61
***
0.43
***
-0.1
2***
-0.1
0* 00.
29**
*0.
82**
*
-4.1
1***
3887
9, 3
90.
600.
10
s.e.
0.05
0.01
0.06
0.07
0.08
0.02
0.05
0.05
0.07
0.05
0.06
0.09
0.10
0.06
0.07
0.16
0.19
0.06
0.03
0.03
0.05
0.06
0.08
0.29
0.04
0.01
•§ •§> **»*
.
3 S'
O 3 0} to TO
3"
Ci
nt o'
s:D
ata:
WV
S w
ave
3.**
*=
p<
0.0
1;*
* =
p<
0.0
5;*
=

Political Corruption, Public Opinion, and Citizens' Behaviour
Let us discuss the controls first. The national level variables show rather disparate
effects. As both authoritarianism and GDP per capita relate to individual level
perceived corruption (although the correlations are weak, about 0.2 and -0.3
respectively, if perceived corruption is coded as a continuous variable), the partial
models for each behaviour (Models 1, 3, 5, 7) may be considered mis-specified, as
individual level perceived corruption is not controlled for. The effects of the
individual level controls appear robust between the partial and full models, but the
effects of the national level controls are not, therefore the full models should be
regarded as more reliable indicators of contextual effects than the partial models, in
which authoritarianism and logged GDP per capita may be proxying perceived
corruption's effects.92
What do the full models tell us about the effect of wealth and
authoritarianism? Logged GDP per capita appears to have a positive effect on
petition-signing, a negative effect on boycott-joining, but no substantive impact on
demonstration activity or strike participation. Petition-signing tends to occur in richer
nations, perhaps because greater resources are available for marketing and obtaining
support for political causes. However boycotts tend to occur more in poorer nations.
We might speculate that this is because much boycott activity may relate to nationalist
economics, that is, the desire to ensure goods are domestically produced. In poorer
states such sentiment may be higher, as the need for domestic industry to flourish may
encourage citizens to shun internationally produced goods. Meanwhile, the more
92 Due to restrictions of the software used, it was not possible to test directly for problems with mulicollinearity, however to gauge if authoritarianism and logged GDP per capita were adversely influencing the key results, the full models were run excluding them. In all cases the effects of the Corruption Index and individual level perceived corruption remain highly equivalent (as indeed do the effects of the controls in these models), which suggests that the inclusion of authoritarianism and logged GDP per capita is not problematic.
-101 -
Political Corruption, Public Opinion, and Citizens' Behaviour
vigorous political activities, demonstrations and strikes, appear to occur
independently of national level wealth.
Authoritarianism appears to deter petition-signing and boycotts, yet is very
weakly positively associated with demonstration activity. This is contrary to the
notion that authoritarian regimes may suppress such activity, and suggests instead
citizens in authoritarian states are willing to actively voice grievances. Such
behaviour may, indeed, reflect political conflict in more authoritarian regimes.
Alternatively, it may be political rallies in support of authoritarian regimes, and
demonstrations voicing antipathy towards foreign powers, that is being predicted by
this variable. Finally, strike activity appears unrelated to authoritariamsm.
The individual level controls show an interesting spread of effects. Males are
more likely to have engaged in all extra-institutional behaviours except petition-
signing, which may indicate that females are disadvantaged by having fewer resources
to enable participation (Norris, 2002; Schlozman et al, 1994). Age generally shows an
interesting nonlinear pattern. Those in the 'middle' age category are more likely to
have participated in extra-institutional activity compared to the youngest category,
while those in the oldest category are least likely to have engaged in such
participation. The last effect is consistent with existing literature on political activism
including Tilley (2002), but the former effect is likely to relate to a generational
explanation: we are predicting who has engaged in such activity, and those in their
middle years have simply had greater time to participate in such ways (and were
young in the 1980s, during the growth of New Social Movements). There are also
clear class and education-related effects consistent with Verba et al (1978). Those in
lower social strata are generally less likely to have participated in these behaviours
-102-

Political Corruption, Public Opinion, and Citizens' Behaviour
than those in higher social strata, while possessing a secondary school education also
has a positive effect.
The structural and attitudinal variables produce unsurprising effects. Union
members are more likely to have participated in extra-institutional behaviours, as are
those with greater interest in politics and those who are dissatisfied with the
government. Those with postmaterialist orientations also have a greater propensity to
have engaged in such activities, which we would expect (Inglehart, 1997). Finally, the
socially trusting are more likely to have participated, perhaps capturing increased
social capital and a shared sense of social efficacy among participators.
Yet clearly the most important variables given our focus are those pertaining
to corruption. Recall that hypothesis H4 predicted that the Corruption Index would
exhibit a nonlinear effect on extra-institutional participation, such that higher activity
is likely to be reported in nations that are either highly corrupt or non-corrupt, but not
in those with intermediate levels of corruption. In all the models, the coefficients
pertaining to the Corruption Index and its polynomial term indicate that this
hypothesis is supported.
To gain a fuller appreciation of these results, using Models 2, 4, 6 and 8, a
graph may be presented in which a hypothetical individual's probability of having
engaged in the four extra-institutional behaviours is computed as national level
corruption increases. In addition to a set of assumptions about this individual,93 the
Corruption Index and its polynomial are allowed to move through their full ranges.
Figure 4C results. 94
93 These assumptions are that: the individual perceives low levels of corruption, is male, aged 16-34, is not religious, has a secondary school education, is service class, is not a union member, is trusting and has materialist orientations. He is also assumed to have mean scores for the political interest and satisfaction in government variables, and to live in a nation with mean logged GDP per capita and authoritarianism scores.94 To enhance presentation, the statistical program was instructed to use Lowess smoothing.
-103-
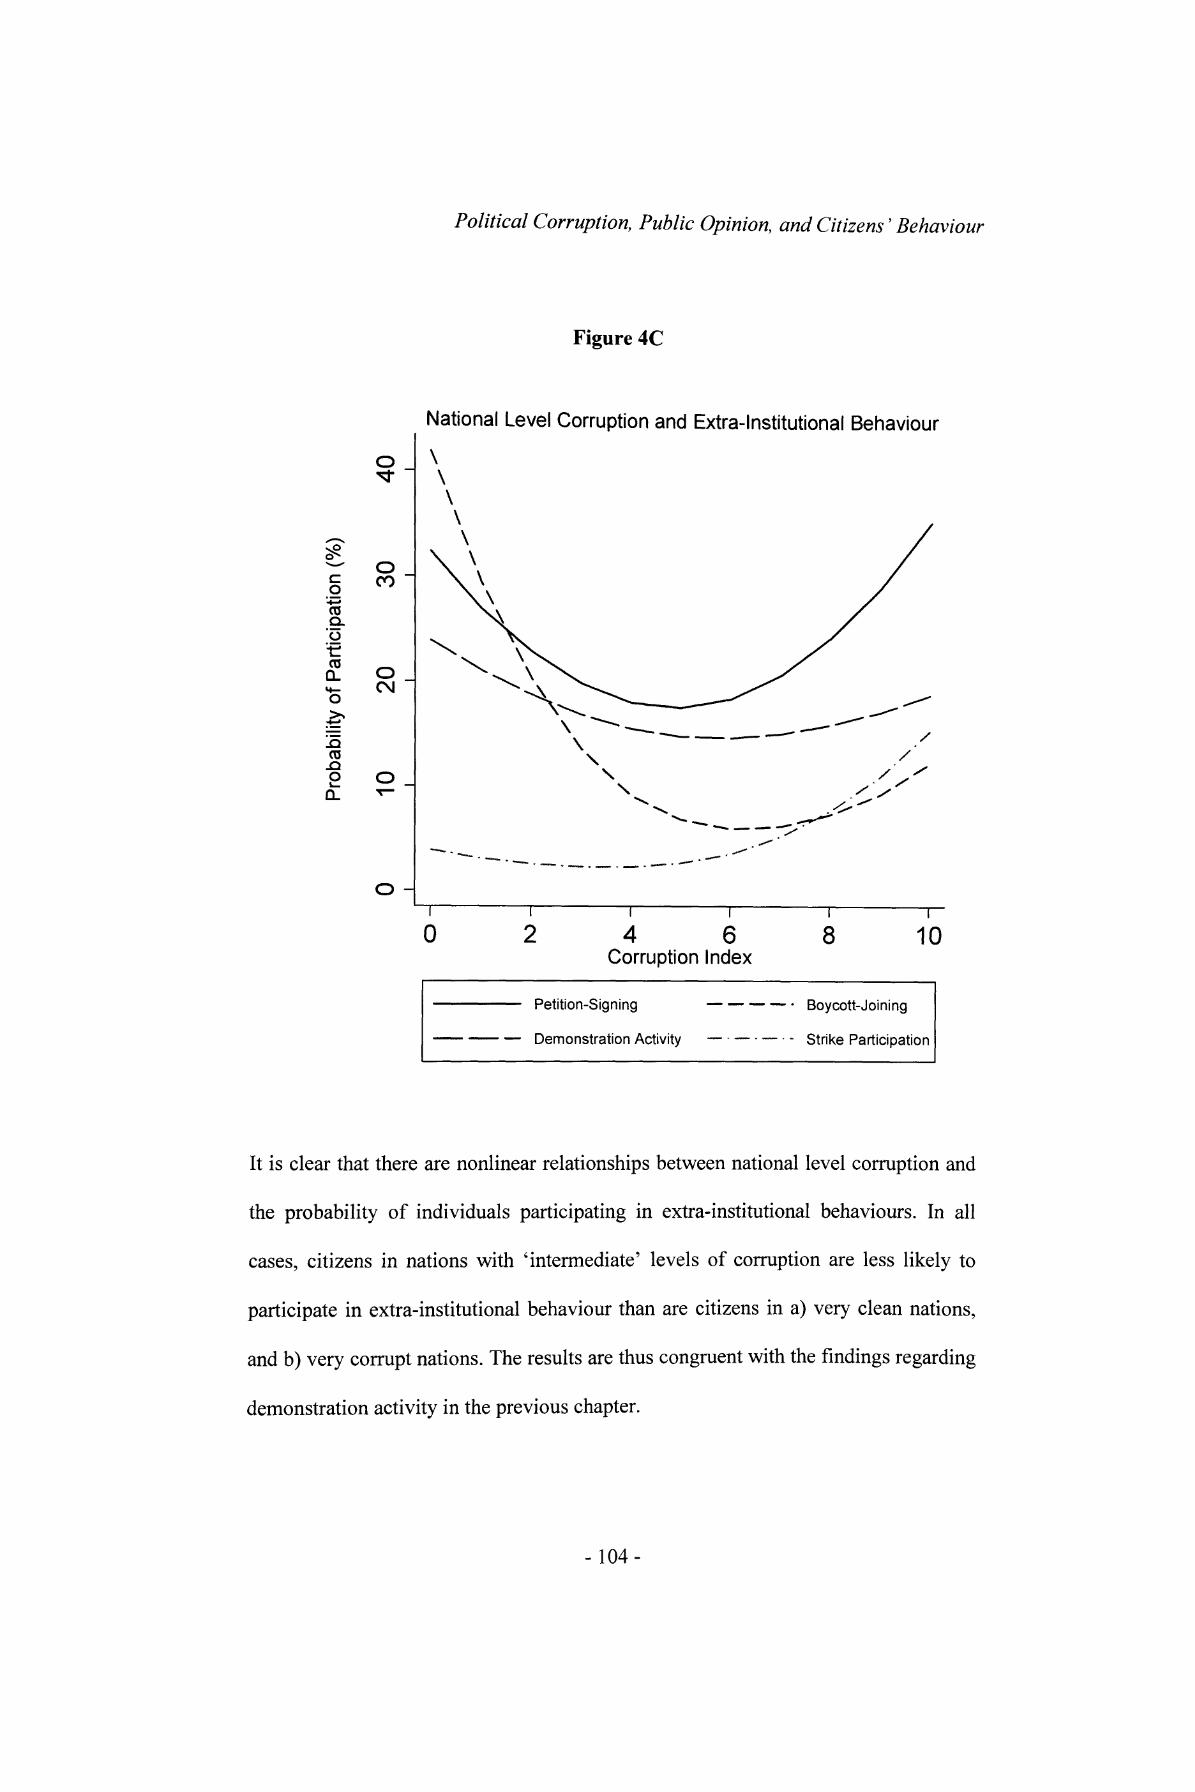
Political Corruption, Public Opinion, and Citizens' Behaviour
Figure 4C
c o"on o.'o
03 Q_
(0.a o
O CO
O CM
O -
National Level Corruption and Extra-Institutional Behaviour
\
0 4 6Corruption Index
8 10
Petition-Signing
Demonstration Activity
— — • Boycott-Joining
.. — .. strike Participation
It is clear that there are nonlinear relationships between national level corruption and
the probability of individuals participating in extra-institutional behaviours. In all
cases, citizens in nations with 'intermediate' levels of corruption are less likely to
participate in extra-institutional behaviour than are citizens in a) very clean nations,
and b) very corrupt nations. The results are thus congruent with the findings regarding
demonstration activity in the previous chapter.
-104-
Political Corruption, Public Opinion, and Citizens' Behaviour
In nations with very low levels of corruption, institutions and politicians are
likely to be diligent and responsive. It is likely that public officials prioritise the
public interest ahead of selfish private interest that would encourage corrupt
behaviour. Therefore, all forms of participation are inclined to be higher, as public
servants are deemed to be highly responsive to all forms of citizen participation,
whether this participation is institutional or not. In tandem with the analysis of the
previous chapter, we might see this as an 'efficacy' effect. In very corrupt nations, in
response to institutional inadequacy and the failure of politicians to place the public
interest ahead of their self-serving, corrupt interests, extra-institutional behaviour is
stimulated. Institutional forms of participation are deemed redundant, reflecting their
inadequacy at preventing corrupt transactions, thus extra-institutional mechanisms are
the means by which citizens resort to express their demands. Congruent with the
previous chapter, we might see this as a 'disillusionment' effect. In nations with
moderate levels of corruption, the limited impact of the efficacy and disillusionment
effects makes extra-institutional behaviour less likely. 95
Moreover, these effects are contextual. Recall the theoretical basis outlined at
the beginning of the chapter. The effect of national level corruption is to contribute to
trends (stimulated by the efficacy effect or the disillusionment effect) among the
citizenry, which means that certain levels and forms of political participation are
95 It is, admittedly, possible that these effects relate to the way in which the data informing the Corruption Index is collected. The efficacy and disillusionment effects may relate to businessmen and country analysts perceiving such effects themselves - perhaps being informed by levels of participation to reach these conclusions, and tying these perceptions to low and high levels of corrupt activity respectively. It is difficult to circumvent this notion, which suggests we might be relying on businessmen's perceptions of characteristics of political systems more than we would like. This problem is potentially applicable to the models in the previous chapter, and the other models in this chapter, too, if analysts' perceptions of corruption are tied to wider beliefs about the health of political systems, of which participation may form a part. Yet, once again, given the impossibility of obtaining a truly objective measure of corruption we should acknowledge this problem while remembering that analysis has to be undertaken with the best of the limited measures available. Besides, it is possible that a) this problem is not evident - it is, after all, not possible to measure it; or b) these perceptions of the efficacy and disillusionment effects are correct. Informed country analysts may, in particular, recognise accurately the nature of politics in different nations, and their reflections linking corruption to other characteristics of political systems may be valid.
-105-

Political Corruption, Public Opinion, and Citizens' Behaviour
moulded into established means of expressing demands. As corruption, or, perhaps,
associated levels of unresponsiveness, is perceived by some citizens, and they
participate in certain ways, this prompts others who observe and imitate their
behaviour (particularly if it is efficacious) to behave in similar ways when they have
demands, independent of how much corruption they perceive. Socialisation is actively
carried out such that citizens and politicians become used to entrenched ways of
expressing political demands, which are then employed when salient issues prompt
citizen activity. Thus, independent of individual level perceived corruption, corruption
at the national level remains salient, affecting the nature of citizens' participation
even when citizens perceive levels of corruption that are different from what is
implied by their nation's Corruption Index score.
Moving on, it is interesting that the magnitudes of the efficacy and
disillusionment effects differ according to type of behaviour. In the cases of petition-
signing and demonstration activity, the efficacy effect and the disillusionment effect
are fairly equal: the graphs are approximately U-shaped, not skewed to either side.
Yet in the case of boycotts, the efficacy effect is substantially greater; while in the
case of strike activity, the disillusionment effect is greater. These differences might be
explained by the nature of the two behaviours. Boycott-joining is relatively placid: in
fact it is by definition not doing something - that is, not buying particular products.
Strike activity is vigorous participation, not placid at all. Consequently, the subversive
nature of strike activity lends itself more to a disillusionment effect which stems in
part from citizens' anger with political institutions and public servants. The far less
subversive nature of boycott-joining lends itself more to an efficacy effect which
involves instead increased responsiveness of public servants to citizen demands.
-106-

Political Corruption, Public Opinion, and Citizens' Behaviour
Let us now consider the magnitude of the effects regarding individual level
perceived corruption. If we make assumptions about a hypothetical individual, the
perceived corruption coefficients in Models 2, 4, and 8 (Model 6 shows that perceived
corruption is a poor predictor of demonstration activity) can be converted into
predicted probabilities to gauge their effects more simply. The results are presented in
Table 4.4.
Table 4.4 Perceived Corruption and Predicted Probabilities of Participating in
Extra-Institutional Behaviours
Perceived Corruption LevelLow
Medium High
Probability of Petition-Signing
20% 22% 22%
Probability of Boy co tt-Jo in ing
8% 8% 9%
Probability of Strike Participation
4% 5% 5%
Although statistically significant when 'low' perceived corruption is the baseline
statistic, we see that the effects of perceived corruption on extra-institutional
participation are extremely weak. Compared to the significant effect of national level
corruption on the predicted probabilities of extra-institutional behaviour (seen in
Figure 4C), perceived corruption is far less explanatory. Nonetheless, we overall see
from these very small effects that higher perceived corruption is tied to increased
inclination to participate in each behaviour, which is an individual level finding
congruent with the disillusionment effect described above in regard to the contextual
effects. Yet perceived corruption fails to explain demonstration activity, and is simply
overshadowed by the contextual effects of the Corruption Index across the models.
Thus while hypothesis H4 is supported strongly, hypothesis H2, which predicted
nonlinear relationships between perceived corruption at the individual level and extra-
institutional behaviours, is not.
-107-
Political Corruption, Public Opinion, and Citizens' Behaviour
Summary
In this chapter, variables tapping both national level corruption and individual level
perceived corruption were used to test four key hypotheses concerning their effects on
different forms of extra-institutional and institutional behaviour. Hypothesis HI,
which suggested that increased perceived corruption would deter propensity to vote,
was supported. Turnout and perceived corruption were inversely related, as
anticipated, and perceived corruption failed to displace national level corruption,
which itself, in line with hypothesis H3, had an equivalent effect, suggesting that
corruption has both a contextual and an individual level effect on voting.
Moving on, it was predicted that national level corruption would display
nonlinear relationships with extra-institutional behaviours comparable to a key result
of the previous chapter, where particularly high and low levels of corruption gave rise
to increased demonstration activity. On the basis that in clean nations increased
efficacy promoted participation generally, and in corrupt ones disillusionment with
political institutions and public officials would motivate extra-institutional behaviour,
this hypothesis (H4) was robustly tested using multilevel models to predict four
particular activities. The association in each case was nonlinear, thus supporting H4,
and indicative that once again, important contextual effects are in play.
The curves calculated in Figure 4C showed that boycott joining was
particularly high in clean nations, yet that unofficial strike participation was
particularly high in corrupt nations. This is interesting, as it implies that the effects of
corruption on extra-institutional behaviour are not unitary. Instead, subversive extra-
institutional behaviour such as unofficial strike participation appears to be motivated
-108-
Political Corruption, Public Opinion, and Citizens' Behaviour
more by the disillusionment effect of corruption induced by poor institutional quality.
Less subversive behaviour, such as boycotts, appears to be promoted by an increased
sense of efficacy likely to be evident where corruption levels are low. In essence, this
result challenges the institutional - extra-institutional division which has been argued
to be an improvement to the conventional - unconventional dichotomy. It shows that
political participation is inherently multidimensional: it can be subversive or placid; in
or out of institutions, and this point acts to temper the reliance we can have of any
simple categorisation of citizens' behaviour.
Hypothesis H2, which predicted that individuals' perceived corruption would
predict greater propensity to engage in extra-institutional behaviour where such
perceptions where particularly high and particularly low, was not supported.
Perceived corruption was found only to very weakly promote some of these
behaviours, but in other cases (demonstration activity) it failed to have a significant
effect at all. In one sense, therefore, we confirm Davis et a/'s (2004) finding that
perceived corruption contributes to a sense of political detachment. Yet by
highlighting the importance of the contextual effects of national level corruption, we
simultaneously sophisticate this result through indicating the presence of complex
non-linear relationships not found by Davis et al (2004) or any other piece of existing
literature.
Hence this chapter has taught us a considerable amount. We learn that
corruption and turnout have inverse relationships at both the individual and national
levels, findings which develop established literature that points to the existence of
such an effect at only one or other level (Bravo-Ortega and Hojman, 2002; Davis et al,
2004; McCann and Dominguez, 1998). Furthermore, regarding extra-institutional
behaviour, the models of this chapter have uncovered contextual effects of corruption
-109-

Political Corruption, Public Opinion, and Citizens' Behaviour
on participation that were previously unrecognised in the literature. Such results
emerge from the use of sophisticated statistical methods, and help display the
powerful capabilities of multilevel modelling.
-110-

Political Corruption, Public Opinion, and Citizens' Behaviour
Chapter 5. The Nature and Determinants of Citizens'
Perceptions of Corruption in British Politics
Introduction: Justifying the British Case Study
Thus far we have talked of perceived corruption at the individual level as a concept
that is difficult to measure in survey research. The questions we have used in previous
chapters have failed to embrace the nuances of definitions of corruption outlined in
Chapter 2. Despite this limitation, we have pressed on with analysis of how perceived
corruption may affect participation and found some interesting results. It affects some
behaviour considerably, such as turnout, yet it has less explanatory power when
determining levels of extra-institutional behaviour. As part of this analysis, we have
controlled for variables that perceived corruption might proxy, such as satisfaction in
government. Yet in this chapter, we will use specialist British data to look in much
more depth at whether perceived corruption and a related concept censoriousness of
corruption, or the degree to which corrupt activity is condemned might proxy more
nuanced perceptions of politics concerning items such as competence, trust, and
openness in government. As well as analysing the nature of perceived corruption
more deeply, we will also evaluate some of the claims in the literature concerning
perceived corruption as a dependent variable, as well as analysing the extent to which
citizens in the UK are censorious of corruption, and whether they think it is
widespread.
As this chapter (and the next) are concerned with Britain as a case study, we
should justify this choice in some depth. Indeed, many surveys of corruption at the
-111 -
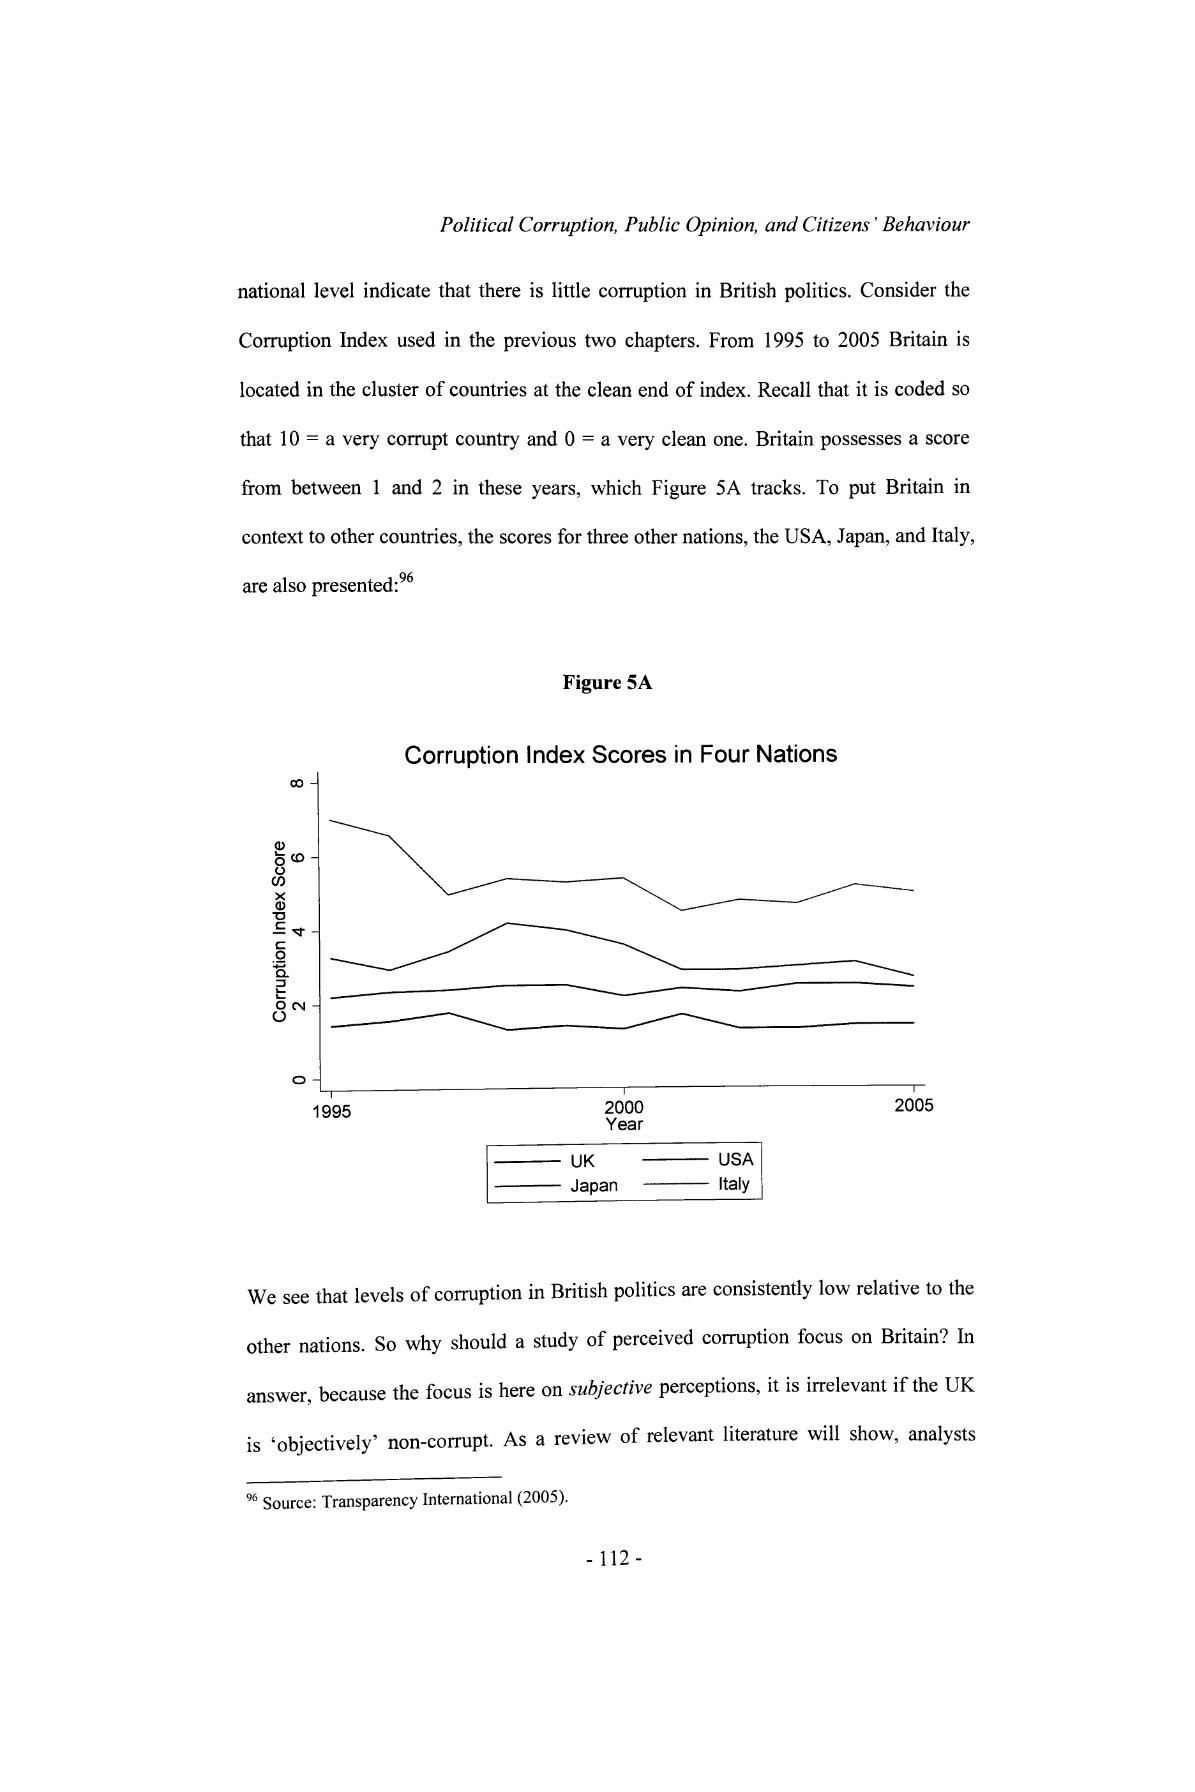
Political Corruption, Public Opinion, and Citizens' Behaviour
national level indicate that there is little corruption in British politics. Consider the
Corruption Index used in the previous two chapters. From 1995 to 2005 Britain is
located in the cluster of countries at the clean end of index. Recall that it is coded so
that 10 = a very corrupt country and 0 = a very clean one. Britain possesses a score
from between 1 and 2 in these years, which Figure 5A tracks. To put Britain in
context to other countries, the scores for three other nations, the USA, Japan, and Italy,
are also presented:96
Figure 5A
CO -
.o o
C/3XCD
T3.£<« o
O CN O
o -
Corruption Index Scores in Four Nations
1995 2000 Year
2005
UK Japan
USA Italy
We see that levels of corruption in British politics are consistently low relative to the
other nations. So why should a study of perceived corruption focus on Britain? In
answer, because the focus is here on subjective perceptions, it is irrelevant if the UK
is 'objectively' non-corrupt. As a review of relevant literature will show, analysts
96 Source: Transparency International (2005).
-112-
Political Corruption, Public Opinion, and Citizens' Behaviour
have found the determinants of perceptions of corruption salient and interesting in
other nations such as the USA and Canada, which are also 'objectively' clean when
their Corruption Index scores are compared to those of developing democracies. Such
perceptions are different among citizens, often according to socioeconomic and
demographic faultlines, suggesting that individuals' perceptions do not simply reflect
the amount of 'objective' corruption in each nation. Furthermore, the limited body of
research on perceptions of corruption and standards more broadly in the UK that does
exist reveals substantial concern over these issues, which makes explaining the
discrepancy between cross-national indicators of low corruption, and individual
concern over substantial corruption, interesting. Dunleavy et al (2001), for example,
present the results of a poll conducted in 2000 which queries the extent to which
numerous phenomena are deemed problematic. Over 49% of respondents said each of
the following are a 'major problem' (although whether they are 'corrupt' is another
matter): the use of spin doctors, ministers' appointment to agencies of financial
donors, the granting of honours to financial donors, nepotism, and financial sleaze.
Also, the evidence suggests that there is very little tolerance for MPs lobbying for
money, acting in their private interests, or taking cash for questions.
Mortimore (1995) finds that in the context of very limited trust in and respect
for politicians, British citizens exhibit considerable censoriousness concerning
corruption, and many believe that corruption is a feature of British politics. This
perception is strong enough for nearly half the sample to suggest sleaze would
influence their vote choice, and there is significant support for stringent regulation.
Surprisingly, many think that Britain is as corrupt as many foreign countries:
There is a stereotype of 'middle England' as being full of jingoistic Colonel Blimps who, however much they may grumble nostalgically
-113-

Political Corruption, Public Opinion, and Citizens' Behaviour
about declining standards, are still convinced that the British system is the best in the world and that corruption begins at Calais. Not so. (Mortimore, 1995, p. 581).
Though such studies are useful, they are largely based on single, vague questions. The
nature of such data is thus questionable - in brief polls there is unlikely to be
sufficient time for briefing respondents with what 'corruption' or 'sleaze' will be
construed to mean, or for asking them (perhaps in open-ended questions) for their
own definitions. These problems can be overcome, to some extent, by the use of a
new and more comprehensive dataset which will be analysed in depth here. This
dataset, the Survey of Public Attitudes towards Conduct in Public Life 2003-2004
(BMRB, 2005) was produced for the Committee on Standards in Public Life and has
not yet been subject to rigorous academic analysis. 97
The appropriateness of studying perceived corruption in the UK is also
justified by consideration of some concrete examples of high profile, standards-
related incidences that have been prominent in recent years. Their consideration
shows, furthermore, the difficulty involved in offering an opinion on the extent to
97 The BMRB's report for the Committee on Standards in Public Life (2004, p. 18) claims to be "the first systematic examination of the expectations and perceptions of the general public in relation to the standards of conduct of senior elected and appointed public office-holders in Britain." It indicates that British citizens have high expectations concerning public officials' conduct, and that although citizens perceive levels of explicit corrupt practice to be low, there is a belief that politicians cover up their mistakes and that favouritism is apparent in recruitment practices. The dataset commissioned for the survey offers us an opportunity to examine citizens' perceptions in greater depth. In contrast to this data, analysis of related perceptions in the UK has thus far been limited to polls that tap broader attitudes to 'sleaze', and are generally far less systematic or comprehensive in their approach. For instance, a recent YouGov survey for the Telegraph (YouGov, 2004) is let down by the use of questions that essentially state a negative statement, such as: "The Conservatives these days give the impression of being very sleazy and disreputable", and then asking respondents to comment on them. Questions phrased this way may generate biased results inclined to be pessimistic due to the nature of the initial statement offered. Moreover the vagueness of the terms included in questions the 'impression' parties give; being 'disreputable and sleazy'; whether the 'minority' or 'majority' of politicians accept gifts or bribes is stark, and highlights further crudeness. The response categories, furthermore, are highly inadequate. Indeed, respondents are unable to suggest that they believe none or very few politicians engage in the misdemeanour they are queried about. Moreover, an overarching problem concerns the methodology of the questionnaire: as it is an online poll the respondents are essentially self-selecting, and this, even when incentives are offered, may lead to bias. In view of such flaws in one of the better polls relating to the topic, statistical analysis of the more rigorous BMRB dataset will be advantageous.
-114-
Political Corruption, Public Opinion, and Citizens' Behaviour
which British politics is corrupt. Only on occasion are incidences of corruption clear.
In 1994, for instance, two Parliamentary Private Secretaries, Graham Riddick and
David Treddinnick, were suspended for allegedly being involved in facilitating cash-
for-questions, and far more prominently and in the same year, accusations surfaced
that the Corporate Affairs Minister, Neil Hamilton, and junior minister for Northern
Ireland, Tim Smith, had accepted money both directly and via lan Greer's lobbying
firm for asking questions for Mohamed Al Fayed (Doig, 2003). Smith's confession
and resignation, and Hamilton's being pushed out of office, raised the issue of
standards and the prospect that high profile politicians in the UK were willing to
exchange political favours for money. 98 Cash-for-questions contravened
parliamentary rules and resembles 'corruption' under the 'public office', 'public
interest', and 'market principle' definitions outlined in Chapter 2. Another example
concerns the Poulson affair, in which an architecture firm offered favours to
councillors and obtained contracts. Such a lack of open competition, and the exchange
of influence for material incentives, makes such activity 'corrupt', and indeed
prompted calls for reform to ensure more open interest declaration (Doig, 2003).
It appears more ambiguous whether other incidents represented 'corruption' or
not. In 1996, for example, the Scott Report criticised the government for not
adequately informing parliament of new rules concerning arms trading, after
confusion arose over whether an arms manufacturer had parliamentary permission to
export arms to Iraq during the 1980s. In view of the definitions of corruption
discussed in Chapter 2, this might be regarded as 'corrupt' activity - perhaps if one
ties this trading as something outside the 'public interest', however it might also have
represented government incompetence. Moreover, the Major government of the 1990s
98 The Standards and Privileges Committee cast some doubt, nevertheless, on the finding in the report by the Commissioner for Parliamentary Standards, which concluded that Hamilton directly accepted substantial amounts of money from Mohamed Al Fayed.
-115-
Political Corruption, Public Opinion, and Citizens' Behaviour
was ridden with allegations of 'sleaze', which covered a broad spread of forms of
misconduct. The convictions of Jeffrey Archer and of Jonathan Aitken for perjury and
the government's support of the Pergau Dam project in Malaysia in the early 1990s
(which preceded Malaysian orders for British arms), may all be construed as
'misconduct', for example - but whether they represent 'corruption' is less certain.
This ambiguity has also surrounded issues occurring more recently during
Labour's tenure. The issue of party funding and donors has come to prominence
during Blair's leadership, raising the possibility that favouritism might be shown to
high-profile party donors. Such controversy has been heightened further by the recent
'peerages for loans' row, which has involved Labour and opposition parties being
accused of selling Lordships. Equally, individual ministers have been called into
question over 'sleaze'. In 1998 Peter Mandelson and Geoffrey Robinson resigned as
ministers after Mandelson was found to have not registered a loan from Robinson.
Although not 'corrupt' under the prominent definitions of the term, this marked
substantive evasion of regulation by a prominent politician. Mandelson was also
implicated in a scandal prompting his second resignation in 2001, when he failed to
explain his part in the fast-tracking of Srichand Hinduja's passport application,
although he was later cleared. In addition, David Blunkett was forced to resign as
Home Secretary following allegations he was influential in fast tracking a visa
application for the nanny of the woman with whom he was having an affair, and for
misusing rail privileges. This was followed by a second resignation as Secretary of
State for Work and Pensions after he failed to declare directorship and share
ownership in a firm bidding for contracts related to his department. Furthermore,
Tessa Jowell was indirectly linked to the corrupt activity alleged to have involved her
-116-
Political Corruption, Public Opinion, and Citizens' Behaviour
husband and the former Italian Prime Minister, Silvio Berlusconi." Such problems
have also been apparent among ministers in the new devolved assemblies in the UK.
In the Scottish case, Henry McLeish resigned as first minister in 2001 after it surfaced
that he had not declared income gained from renting out parts of his publicly funded
constituency offices when an MP; Jack McConnell, his successor, has also been
accused of financial impropriety (Peele, 2004).
What emerges, therefore, is justification for our British focus based on the
significant concern surrounding standards issues indicated by polls on the topic, the
prominence of standards-related incidents, and the added intellectual pull of the
difficulty in conceptualising them. Having contextualised our case study choice, the
next two sections will outline the specific questions we look to answer, and state some
concrete hypotheses for testing. Two key themes, mentioned at the outset of thus
chapter, will drive analysis: first the exploration of how far corruption perceptions
differ from other, related perceptions; second, analysis of the determinants of a)
censoriousness of corruption among British citizens, and b) perceived corruption
incidence.
Theme I: Perceived Corruption as Distinct From Related Perceptions
The above overview of incidences in which standards of propriety have been called
into question show that some examples square more easily with definitions of
corruption discussed earlier in the thesis (especially the Cash for Questions affair),
whereas others are less easy to categorise. Yet our concern in this chapter is to
examine citizens' perceptions, and a key area of analysis queries how perceptions of
99 Tony Blair, however, found that Jowell had not contravened the Ministerial Code relating to standards in ministerial office.
-117-
Political Corruption, Public Opinion, and Citizens' Behaviour
corruption are similar or different to perceptions of other misconduct such as
dishonesty, incompetence, and lack of openness. Yet the present literature on
perceptions of corruption does not focus on this question, despite offering some other
useful insights. Johnston (1986b) for example, queries US citizens over whether a set
of twenty hypothetical behaviours are corrupt, and reports that 'formally' corrupt acts
are viewed as more corrupt that 'informally' corrupt acts; that public officials' corrupt
behaviour is viewed with greater censoriousness than private citizens' corrupt
behaviour (which is congruent with Johnston and Wood, 1985, who analyse the UK);
and that the larger the 'stakes' and the more prominent the corrupt actor, the more
corrupt the act. Johnston and Wood (1985) also find that favour-giving and nepotism
are behaviours less harshly perceived than bribery in the British case. Moving on,
Peters and Welch (1978), examining the perceptions US public officials hold
concerning different forms of political malpractice, find that influence peddling, such
as getting a friend into law school, is not regarded as significantly corrupt; conflict of
interest situations, such as a secretary of defence holding stock in a firm which has a
government defence contract, are regarded as more corrupt; and that behaviour that is
clearly illegal or involves direct financial gain is most corrupt.
Meanwhile, regarding non-Western cases, Fric (2001), analysing Central and
Eastern European nations, shows that condemnation of bribery is not widespread:
there is often agreement with the notion that bribery is necessary to tackle shortages
and for state machinery to function, although this differs by nation, with Eastern
European citizens more likely than Central European citizens to agree with such ideas.
Kalnins (2005) suggests that polls in Latvia indicate that the activities respondents
deem most corrupt are those involving illegal payments to public officials, while gifts
and dishonesty in the private sector are considered much more leniently.
-118-

Political Corruption, Public Opinion, and Citizens' Behaviour
It is perhaps unsurprising that Western citizens are generally more censorious
of corruption than are non-Western citizens. This is congruent with the model
provided by Heidenheimer (1970), which predicts that in civic culture based systems
such as those in the West, routine corruption (such as the acceptance of gifts,
nepotism and profiting from conflicts of interest) and aggravated corruption (such as
public servants expecting gifts and organised crime paying off politicians) both
represent 'black' corruption - activity prompting strong censoriousness among the
elite and the majority of citizens that inclines them to demand punishment of the
perpetrators. This contrasts to other, more traditional political systems, in which
greater leniency is likely to be evident.
Yet the focus of such existing work has left open a gap in research. Too little
has been written on the comparison of perceptions of corruption to other, related
perceptions, particularly forms of distrust, closed government, incompetence, and
other standards-related concepts. Indeed, what if perceptions of corruption simply tap
perceived misconduct or dishonesty more generally? On the one hand, on the basis of
the literature reviewed, such conceptual blurring appears doubtful. Clear nuances in
citizens' perceptions appear evident, which heightens the prospect that opinions
concerning corruption will be substantively different to perceptions of other
standards-related items. On the other hand, the standards-related cases cited above in
the case of the UK raise the dilemma that citizens may legitimately have difficulty
differentiating between acts that are corrupt and those that are, for instance,
incompetent, dishonest, or just not good practice. Nonetheless, the hypothesis to be
developed will be congruent with the findings of previous literature, which points to a
certain sophistication among citizens when considering corruption:
-119-
Political Corruption, Public Opinion, and Citizens' Behaviour
HI: Perceptions concerning behaviours that can justifiably be defined as 'corrupt'
will be substantively different from perceptions of other types of misdemeanour in
public life.
We may thus move on to discuss the second key task of this chapter, explaining why
citizens differ in their censoriousness of corruption, and in their perceptions of how
widespread corruption is in British politics.
Theme II: Determinants of Corruption Censoriousness and Perceived
Corruption Incidence
Previous literature has shown that some people think corruption is a more important
issue, and a more widespread phenomenon, than others. Questioning what determines
such different perceptions in the contemporary British case is interesting, given that
other scholars have found clear socioeconomic and attitudinal dividing lines in other
nations, and in Britain in earlier time periods. However, hypothesis development for
this portion of the thesis is difficult, and our approach must be carefully justified.
An initial point to make is that some variables seem to offer consistent
relationships with orientations towards corruption. Indeed, it is curious that one
variable often seen to exhibit a relationship with censoriousness is gender: women
condemn corrupt acts more than men. Female public officials in the US, for example,
score higher than men in a composite scale of censoriousness which takes into
account a number of hypothetical acts deemed corrupt and the degree to which each is
considered 'corrupt' (Welch and Peters, 1977; see also Gorta and Forrell, 1994).
Different explanations have been offered. Welch and Peters (1977) suggest that
-120-

Political Corruption, Public Opinion, and Citizens' Behaviour
women in office tend to come from a 'reformist' angle that inclines them to increased
censoriousness. Seligson (2002) raises the ideas that women are discriminated against
in the political system, and have a greater chance of observing corrupt practice.
It is unfortunate, however, that it is overall difficult to draw up clear
hypotheses from previous work regarding socioeconomic and demographic predictors
of perceptions of corruption, as findings pertaining to other variables are often
contradictory. Gorta and Forell (1994), for instance, draw attention to controversies in
the direction of two potential determinants of perceptions of corruption. Greater age
has been associated with both greater tolerance of corruption and optimism
concerning its incidence (Gardiner, 1970), but, contradictorily, with greater
censoriousness and pessimism (Davis et al, 2004; Gibbons, 1985). So too greater
education and socioeconomic status has been linked to more censoriousness and
pessimism (Gardiner, 1970; Davis et at, 2004; McCann and Dominguez, 1998), but
also with greater tolerance (Welch and Peters, 1977). It is problematic too that few of
these studies comprehensively cite why such socioeconomic predictors have the
effects they do.
The effects of numerous attitudinal variables that appear to explain
censoriousness and perceptions of actual levels of corruption in politics are, perhaps,
less liable to be contradictory. Greater censoriousness is evident among those who
place themselves as ideological liberals, who may be reformers and less accepting of
the self-interest involved in corrupt behaviour (Welch and Peters, 1977). It is evident
too among those who perceive there to be significant levels of corruption in actual
political life, perhaps because perceptions of such incidence ties to awareness of its
detrimental effects, in turn motivating less tolerance (Welch and Peters, 1977).
Censoriousness is also higher among the politically alienated (Gibbons, 1985).
-121-

Political Corruption, Public Opinion, and Citizens' Behaviour
Perceptions of actual levels of corruption in Latin America have, perhaps
unsurprisingly, been shown to be higher among the less socially trusting, and
among for the most part the economically pessimistic (Davis et al, 2004).
Experience might also act as an influence on attitudes: increased censoriousness of
corrupt behaviour is evident among politicians with limited experience in political
office, who are presumably unaware of the plausibly murky reality of political life
(Welch and Peters, 1977; Mancusco, 1993).
However, the problem remains that it is difficult to form expectations from the
literature hitherto considered. A wealth of variables is found to be explanatory;
contradictory findings concerning potential socioeconomic and demographic
determinants are presented; and the work reviewed predominantly deals with nations
other than the UK. Admittedly, Johnston and Wood (1985) do examine the British
case from twenty years ago, and provide some interesting insights. They find that men
are more censorious of behaviours involving the exchange of money or resources, and
that women are harsher over favouritism, and it is suggested that these divisions may
be owed to individuals' differing perceptions of the extent to which they win or lose
from the particular behaviours, which cluster by gender. Another of their findings,
that higher classes are more censorious of favour-giving and bribery than are lower
classes, is cautiously explained equivalently: those in higher social strata may more
readily perceive themselves as losers from such behaviour. This identification of
'winners' and 'losers' from corruption deriving clusters of individuals holding
coherent perceptions gives us one possible basis for analysis. Indeed, in previous
literature, the tying of socioeconomic variables to corruption censoriousness and
perceived corruption incidence may also relate to the substantial amount of corruption
in these nations creating sets of 'winners' and 'losers' in these societies that may
-122-
Political Corruption, Public Opinion, and Citizens' Behaviour
cluster in socioeconomic and demographic divisions. Those who lose out from
corruption the most, such as women or the poor, may consequently perceive
exaggerated amounts of corruption or be more censorious of it.
However, because in contemporary Britain the incidence of corruption is,
according to the Corruption Index, relatively limited compared to corruption in the
USA and Latin American nations analysed in previous literature, and because social
divisions in the UK may have less salience due to a) the softening of 1980s free-
marketeering, and b) less absolute poverty in the UK compared to developing nations,
the feasibility of clusters of 'winners' and 'losers' from corrupt practice holding
coherent perceptions is lessened.
We may hence consider the broader question of which, out of a) attitudinal or b)
socioeconomic and demographic variables as groups, are more likely to be
explanatory. Indeed, it is notable that many of the previous studies fail to
comprehensively control for a range of political attitudes, which, when included in
modelling, may displace socioeconomic differences. It may be, for example, that the
poor are shown to be more pessimistic concerning corruption in politics because this
characteristic simply proxies political distrust and social distrust.
The importance of testing whether socioeconomic or attitudinal explanations are
key to explaining perceptions of corruption is heightened too because it ties to broader
theories of political trust. It is fair to assume that perceived corruption incidence is
comparable to political trust, as a) trust in politicians broadly, and b) trust in their
propensity to engage in clean political practice, will surely relate. In regard to theories
of political trust, Mishler and Rose (2001), suggest that the literature is split loosely
into two schools of thought that attempt to explain trust in political institutions.
-123-
Political Corruption, Public Opinion, and Citizens' Behaviour
The first, 'cultural' school involves trust as a product of individual socialisation,
shaping a relatively coherent national culture of trust or mistrust. This, in turn, 'spills
over' into civic co-operation, which 'spills up' into representative institutions capable
of accommodating civic organisations (Mishler and Rose, 2001, citing Putnam, 1993,
1995b). As socialisation in particular cultures is likely to be similar, it is perhaps to be
expected that a cultural approach would play down the idea of variation in levels of
trust among citizens of the same nation. Yet Mishler and Rose (2001) suggest that this
is not the case:
A finer-grained analysis of political trust emerges from micro-level cultural theories that emphasize that socialization into a culturally homogenous society nonetheless allows substantial variation among individuals based on gender, family background, education, and so forth. (Mishler and Rose, 2001, p. 35).
Unfortunately, Mishler and Rose (2001) fail to specify which of the categories
women or men; the elderly or the young; the poor or the rich, and so on are likely to
be more or less trusting. Their own research shows that socioeconomic and
demographic variables are overall not substantively explanatory.
The other interpretation of trust specified by Mishler and Rose (2001)
comprises an 'institutional' school which views trust as a function of the performance
of institutions. After institutions are put in place, citizens are said to evaluate their
performance, although this assessment may be affected by individuals' circumstances
and values. In the case of recently democratised states:
Individuals who highly value freedom can be expected to trust newly democratic institutions despite economic hardships, whereas those who give priority to economic growth may react more negatively in similar circumstances. (Mishler and Rose, 2001).
-124-
Political Corruption, Public Opinion, and Citizens' Behaviour
Thus the determinants of political trust are likely to be attitudinal and, to a lesser
extent, socioeconomic, as values and socioeconomic status may influence individuals'
evaluation of institutional performance. Mishler and Pollack find, indeed, that
attitudinal variables, spanning perceptions of institutions' political and economic
performance (including perceptions of corruption), are highly explanatory. The failure
of socioeconomic and demographic variables to be important gives weight to the
notion that citizens' evaluations are crucial, and is far less damning for the
'institutional' school than for the 'cultural' school, as the latter is reliant on
socioeconomic and demographic factors linking to levels of trust directly.
It is predicted, therefore, that because of a) the limited salience of
socioeconomic divisions, b) the wealth of attitudinal variables available, and c) due to
the findings of work on political trust, the results of models predicting British
citizens' perceptions will show that perceived corruption incidence is unlikely to
reflect socioeconomic cleavages, and is more likely to relate to differences in
orientations towards politics and society more generally. It is forecast too that the
same reasoning can be applied to corruption censoriousness, which after all proxies a
sensitivity to corruption which may either be learnt via socialisation, or generated in
reaction to institutional performance. In sum, therefore, although levels of corruption
are objectively 'constant', individuals' reflections on corruption and its seriousness
will relate less to exogenous socioeconomic and demographic cleavages, and more to
information derived from assessment of institutional quality, and the 'quality' of
politics in Britain more broadly, encapsulated by attitudinal factors. Thus:
-125-

Political Corruption, Public Opinion, and Citizens' Behaviour
H2: Attitudinal factors will have greater explanatory power than socioeconomic and
demographic characteristics of respondents in models of their corruption
censoriousness.
H3: Attitudinal factors will have greater explanatory power than socioeconomic and
demographic characteristics of respondents in models of their perceptions of the
extent of corruption in politics.
The means of testing these hypotheses, and the hypothesis developed in the previous
section, will involve the following process. Initially, the nature of British citizens'
perceptions of corruption will be outlined in descriptive form. This gives us a basic
indication of the nature of citizens' expectations concerning the avoidance of
corruption and how far these expectations are being met. We will then turn to factor
analysis, in an attempt to see how distinct perceptions of corruption are to other,
related perceptions. Then we will attempt to construct two scales: one pertaining to
how important the avoidance of corruption is to citizens (effectively, their
censoriousness), and another pertaining to perceived incidence of corruption. The
determinants of the scales may then be predicted using regression models which
include socioeconomic and demographic variables and attitudinal factors.
Descriptive Analysis
In this section of the chapter, the hypotheses stated above will therefore not be tested
directly. Instead, the aim of this analysis is to provide some background to the nature
of the data to be used to do so subsequently. First, let us examine perceptions
-126-
Political Corruption, Public Opinion, and Citizens' Behaviour
concerning a) the misuse of power for private gain, and b) bribery. The former
variable is a base definition of corruption commonly found in the literature. It is very
broad - indeed what 'misuse' means is contestable. Proponents of the 'public office'
definition of corruption would differ in their interpretation to proponents of the public
interest definition. Nonetheless the notion gives citizens an easily identifiable
conception of corruption, even if it is a superficial interpretation and even if it invites
interpretation of 'misuse' of power. Bribery is a more concrete and tangible
phenomenon, a subset of corruption more broadly. As one would basically understand
it, bribery the exchange of favours (such as government job contracts) for money
may be understood as 'corruption' when the main definitions of corruption (outlined
in Chapter 2) are considered. It marks: a) a violation of the rules of public office in the
UK; b) a violation of the public interest, as it represents behaviour favouring
particular interests; c) a violation of what public opinion considers legitimate
behaviour (revealed in the statistics below); and d) a form of illegitimate 'utility
maximisation' on behalf of the public official, which corresponds to definitions of
corruption drawing on market principles.
The 'importance' to citizens of public officials not engaging in these acts may
be argued to be a good indication of their censoriousness: believing the avoidance of
an action is very important surely implies high censoriousness. An initial set of
responses covers perceptions of the importance of two types of public servant
avoiding these misdemeanours: a) MPs and government ministers as a combined
group, and b) senior public servants. 101 Table 5.1 records citizens' responses. 102
100 It is understandable, therefore, why perceptions of it comprise an important part of prominent national level indices of corruption, including the Corruption Index.101 Senior public servants are described in the questionnaire in the following way: I mean people with senior management jobs in government departments, local councils or other public bodies, who make important decisions about the service they work in. For example, the head of a council's housing
-127 -
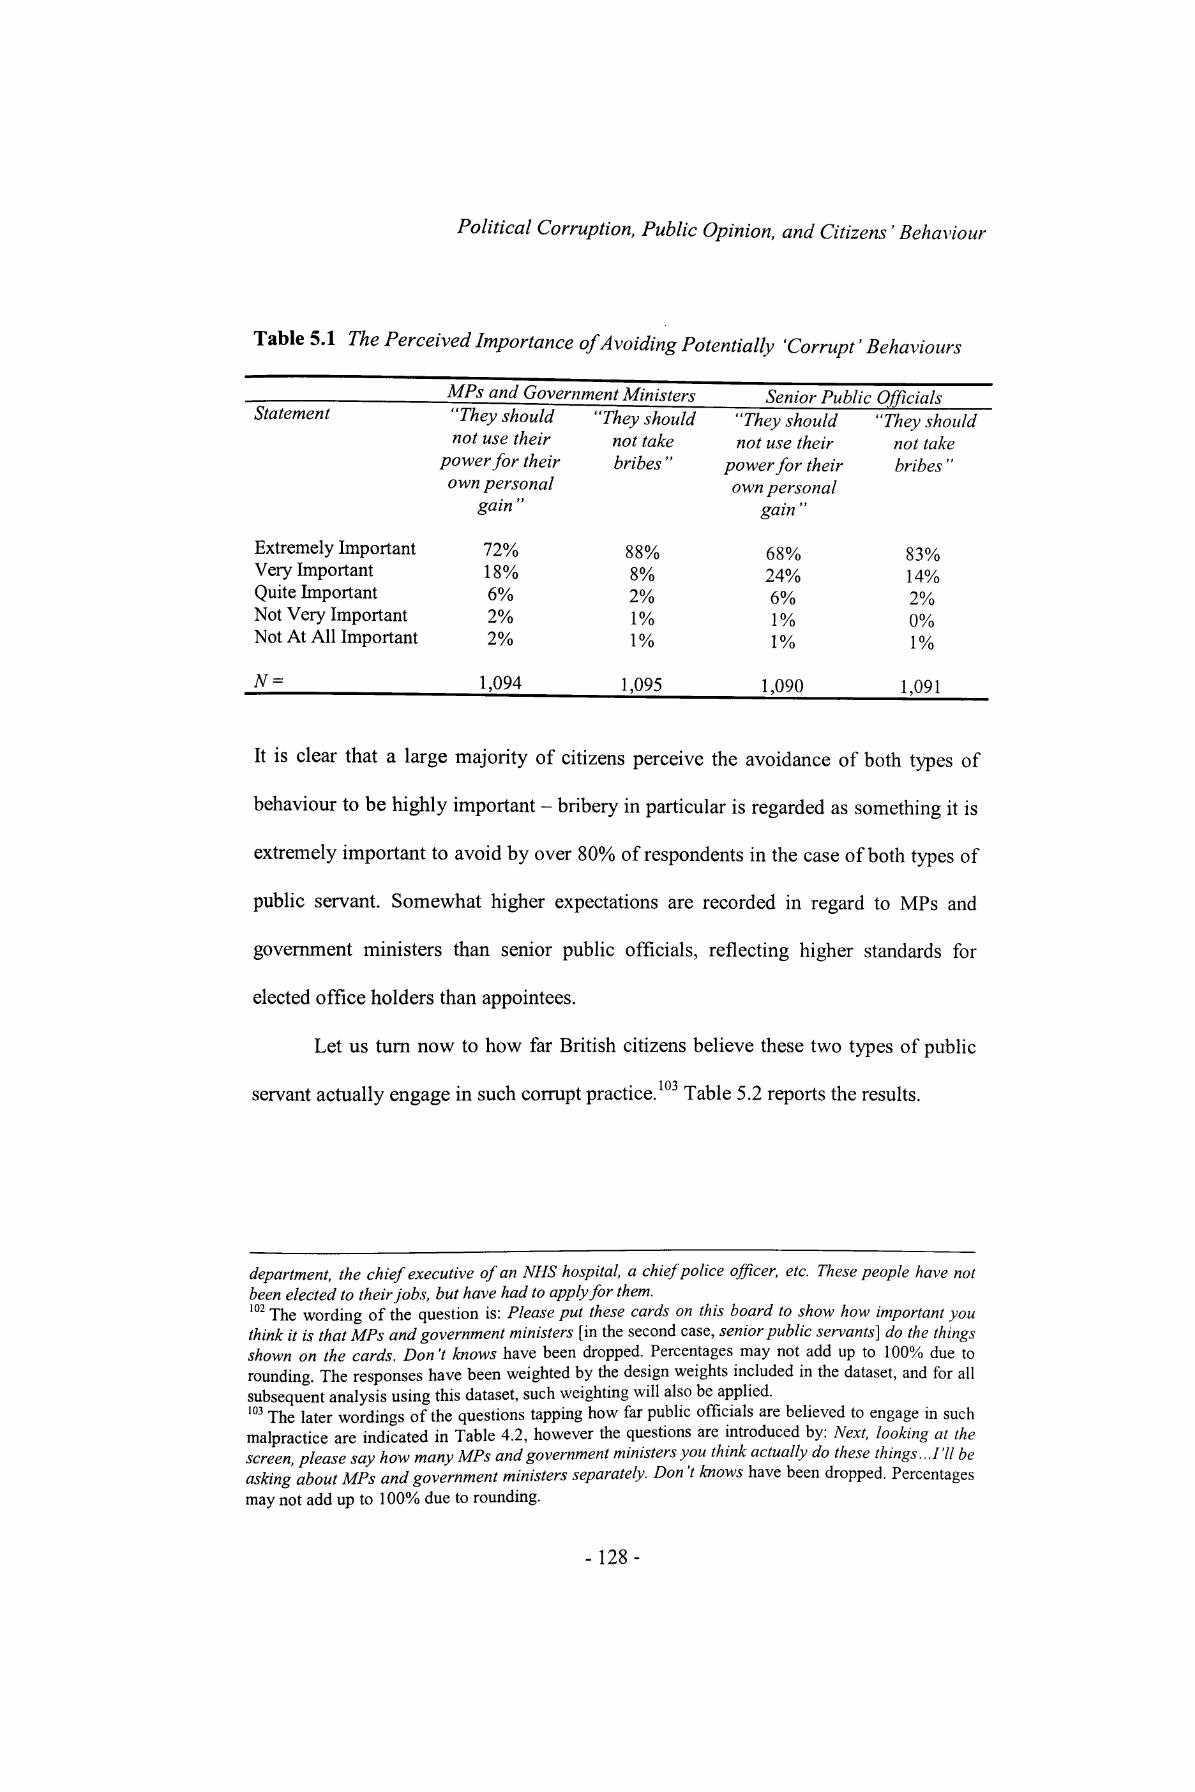
Political Corruption, Public Opinion, and Citizens' Behaviour
Table 5.1 The Perceived Importance of Avoiding Potentially 'Corrupt' Behaviours
MPs and Government Ministers Senior Public OfficialsStatement "They should
not use theirpower for theirown personal
gain "
"They should not take bribes "
"They shouldnot use their
power for theirown personal
gain "
"They should not take bribes "
Extremely ImportantVery ImportantQuite ImportantNot Very ImportantNot At All Important
N =
72%18%6%2%2%
1,094
88%8%2%1%1%
1,095
68%24%6%1%1%
1,090
83%14%2%0%1%
1,091
It is clear that a large majority of citizens perceive the avoidance of both types of
behaviour to be highly important - bribery in particular is regarded as something it is
extremely important to avoid by over 80% of respondents in the case of both types of
public servant. Somewhat higher expectations are recorded in regard to MPs and
government ministers than senior public officials, reflecting higher standards for
elected office holders than appointees.
Let us turn now to how far British citizens believe these two types of public
servant actually engage in such corrupt practice. 103 Table 5.2 reports the results.
department, the chief executive of an NHS hospital, a chief police officer, etc. These people have not been elected to their jobs, but have had to apply for them.102 The wording of the question is: Please put these cards on this board to show how important you think it is that MPs and government ministers [in the second case, senior public servants] do the things shown on the cards. Don't knows have been dropped. Percentages may not add up to 100% due to rounding. The responses have been weighted by the design weights included in the dataset, and for all subsequent analysis using this dataset, such weighting will also be applied.103 The later wordings of the questions tapping how far public officials are believed to engage in such malpractice are indicated in Table 4.2, however the questions are introduced by: Next, looking at the screen, please say how many MPs and government ministers you think actually do these things...I'll be asking about MPs and government ministers separately. Don't knows have been dropped. Percentages may not add up to 100% due to rounding.
-128-
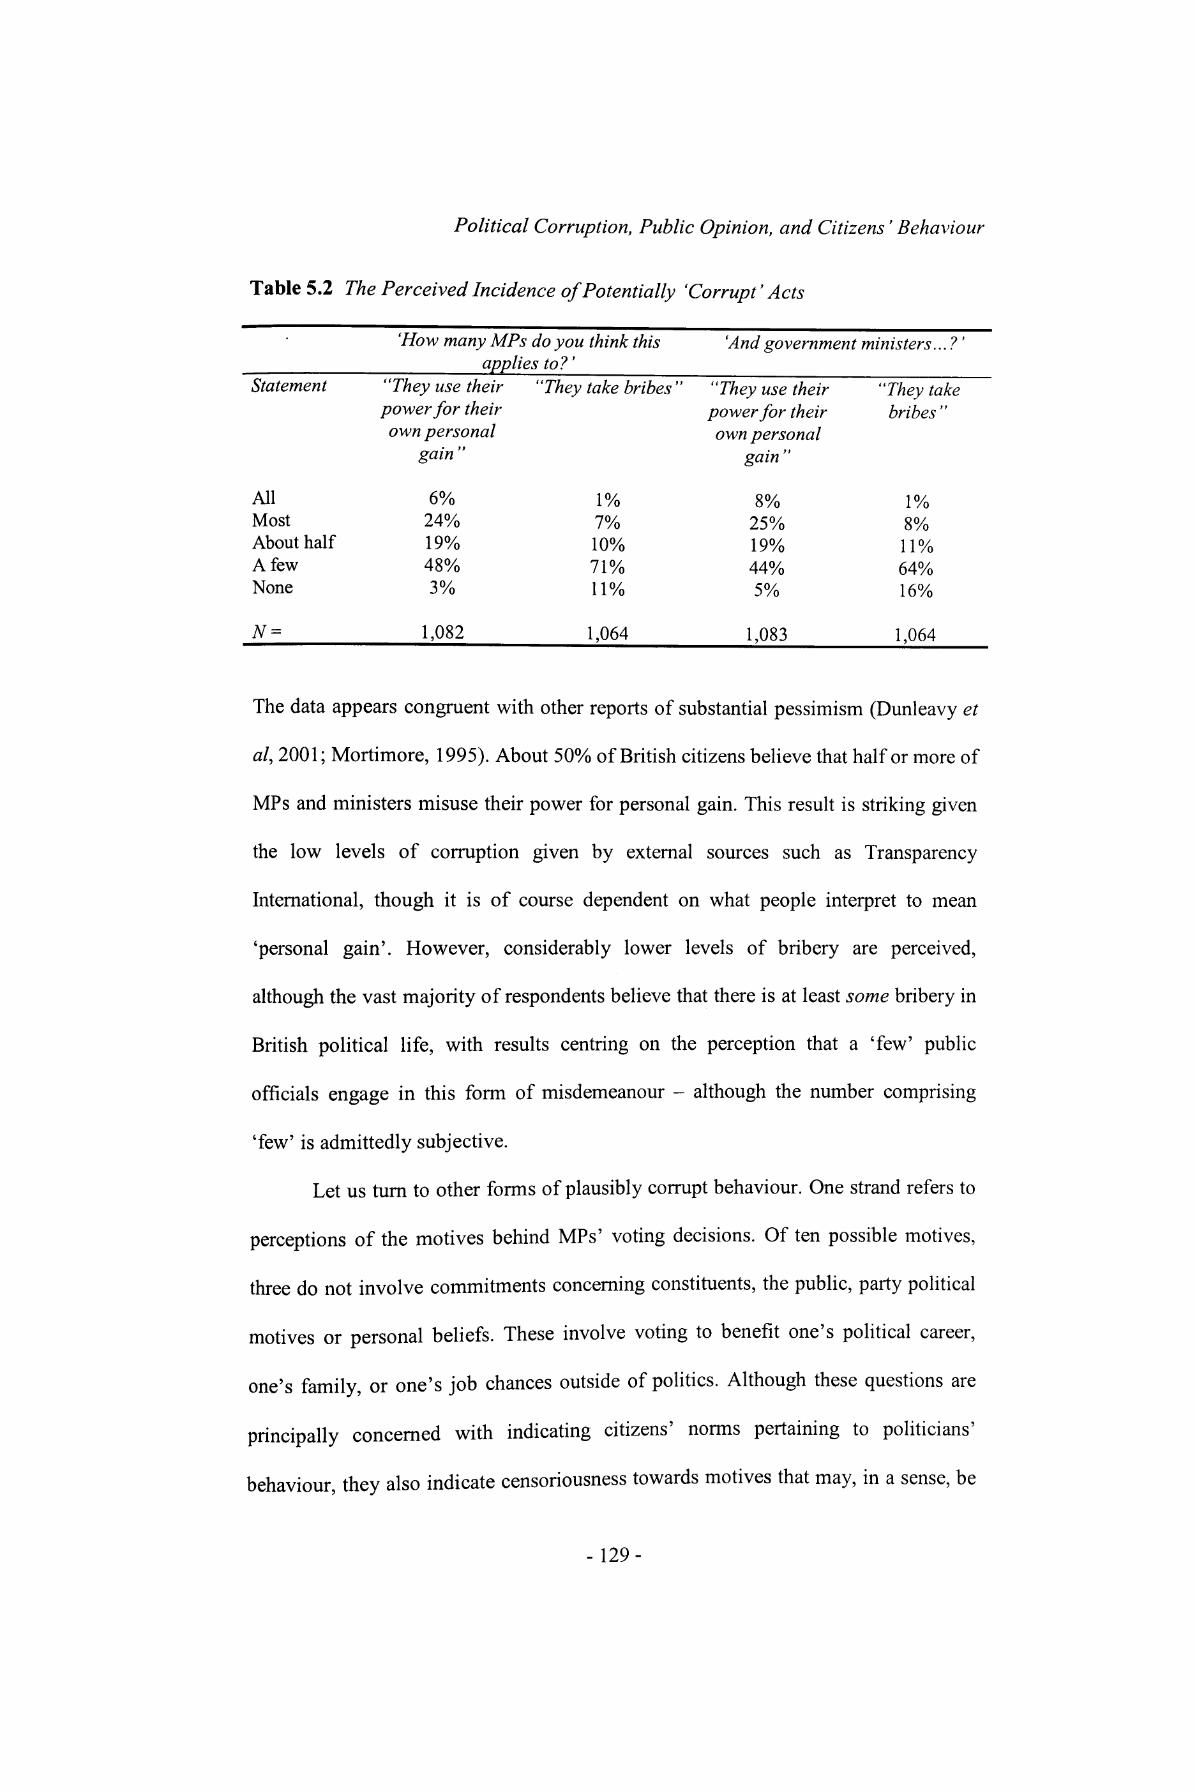
Political Corruption, Public Opinion, and Citizens' Behaviour
Table 5.2 The Perceived Incidence of Potentially 'Corrupt'Acts
Statement
AllMostAbout halfA fewNone
N =
'How many MPs do you applies to?'
"They use their "Theypower for theirown personal
gain "
6%24%19%48%3%
1,082
think this
take bribes "
1%7%10%71%11%
1,064
'An d government
"They use theirpower for theirown personal
gain "
8%25%19%44%5%
1,083
ministers...?'
"They takebribes "
1%8%11%64%16%
1,064
The data appears congruent with other reports of substantial pessimism (Dunleavy et
al, 2001; Mortimore, 1995). About 50% of British citizens believe that half or more of
MPs and ministers misuse their power for personal gain. This result is striking given
the low levels of corruption given by external sources such as Transparency
International, though it is of course dependent on what people interpret to mean
'personal gain'. However, considerably lower levels of bribery are perceived,
although the vast majority of respondents believe that there is at least some bribery in
British political life, with results centring on the perception that a 'few' public
officials engage in this form of misdemeanour - although the number comprising
'few' is admittedly subjective.
Let us turn to other forms of plausibly corrupt behaviour. One strand refers to
perceptions of the motives behind MPs' voting decisions. Of ten possible motives,
three do not involve commitments concerning constituents, the public, party political
motives or personal beliefs. These involve voting to benefit one's political career,
one's family, or one's job chances outside of politics. Although these questions are
principally concerned with indicating citizens' norms pertaining to politicians'
behaviour, they also indicate censoriousness towards motives that may, in a sense, be
-129-
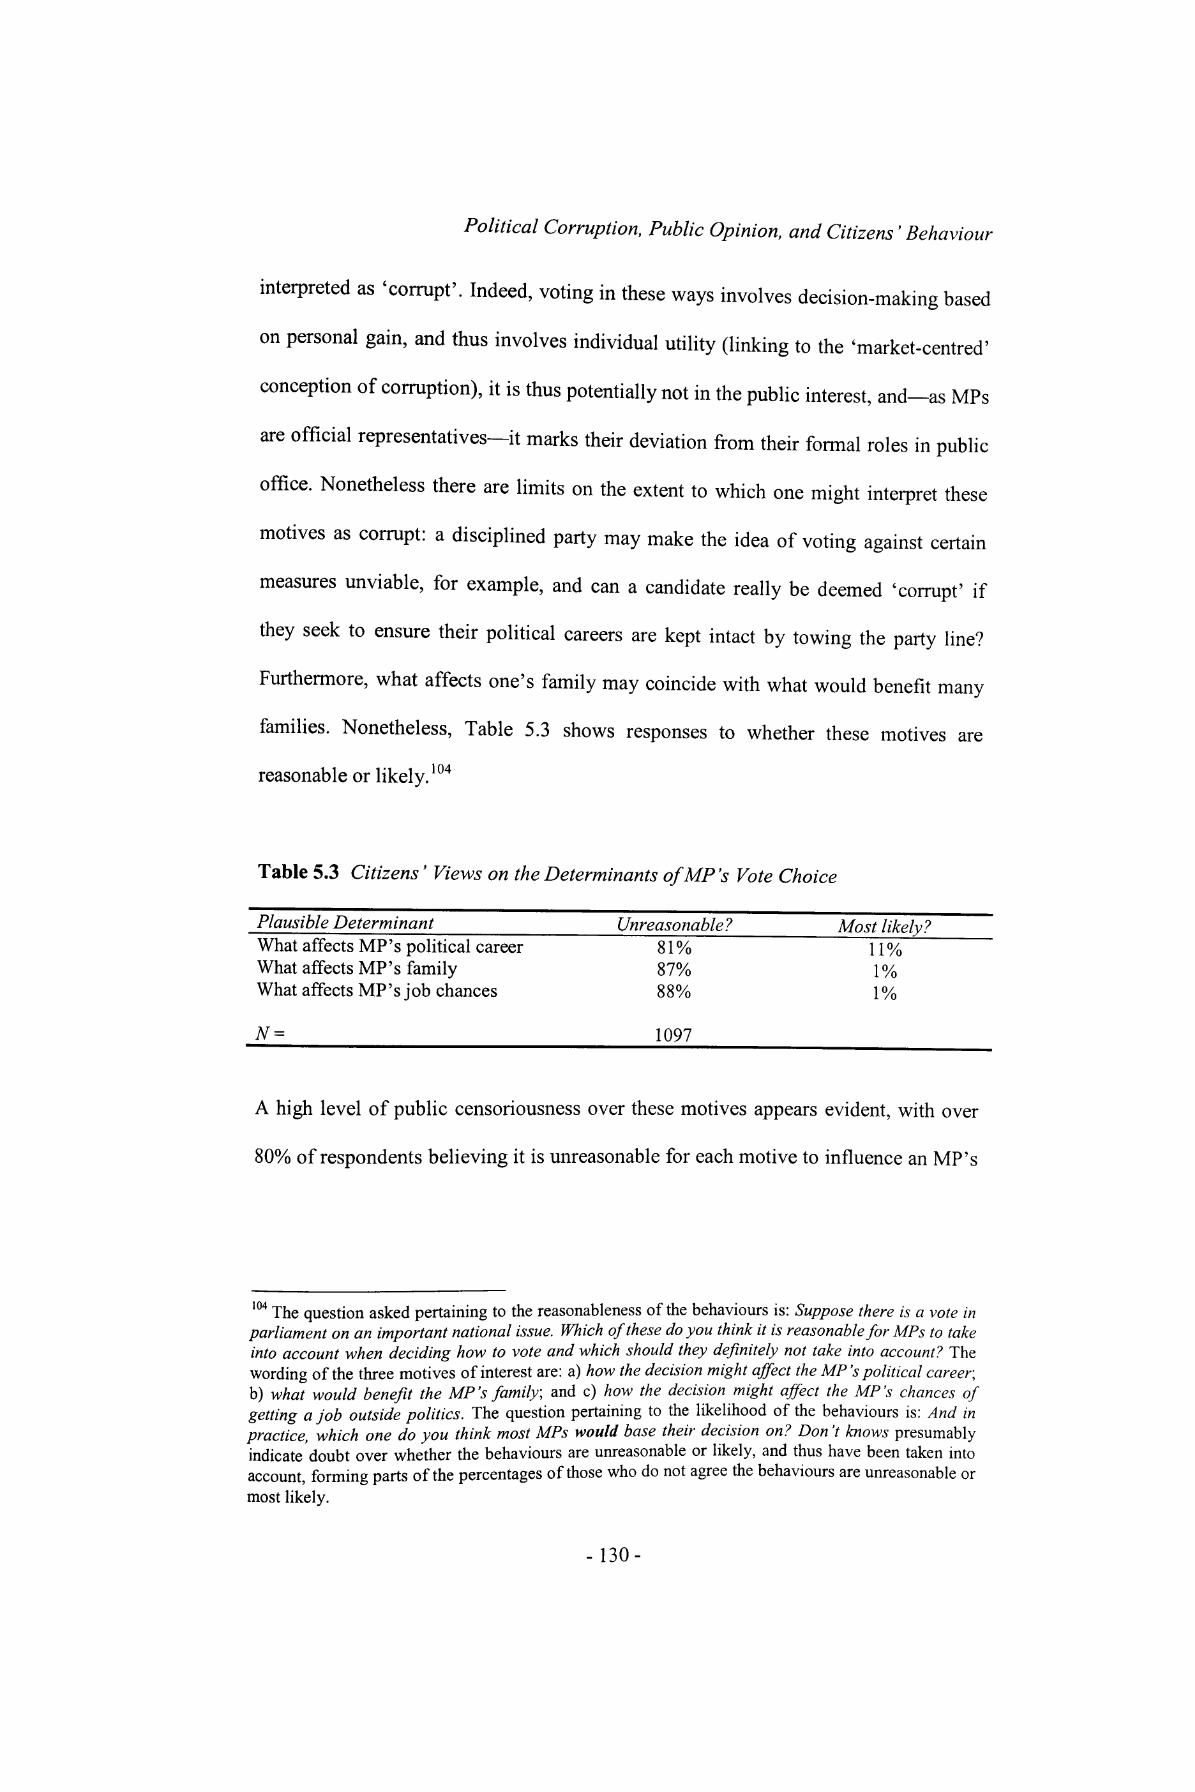
Political Corruption, Public Opinion, and Citizens' Behaviour
interpreted as 'corrupt'. Indeed, voting in these ways involves decision-making based
on personal gain, and thus involves individual utility (linking to the 'market-centred'
conception of corruption), it is thus potentially not in the public interest, and as MPs
are official representatives it marks their deviation from their formal roles in public
office. Nonetheless there are limits on the extent to which one might interpret these
motives as corrupt: a disciplined party may make the idea of voting against certain
measures unviable, for example, and can a candidate really be deemed 'corrupt' if
they seek to ensure their political careers are kept intact by towing the party line?
Furthermore, what affects one's family may coincide with what would benefit many
families. Nonetheless, Table 5.3 shows responses to whether these motives are
reasonable or likely. 104
Table 5.3 Citizens' Views on the Determinants ofMP 's Vote Choice
Plausible DeterminantWhat affects MP's political career What affects MP's family What affects MP's job chances
N =
Unreasonable ?81% 87% 88%
1097
Most likely?11% 1% 1%
A high level of public censoriousness over these motives appears evident, with over
80% of respondents believing it is unreasonable for each motive to influence an MP's
104 The question asked pertaining to the reasonableness of the behaviours is: Suppose there is a vote in parliament on an important national issue. Which of these do you think it is reasonable for MPs to take into account when deciding how to vote and which should they definitely not take into account? The wording of the three motives of interest are: a) how the decision might affect the MP's political career- b) what would benefit the MP's family- and c) how the decision might affect the MP's chances of eettinz a job outside politics. The question pertaining to the likelihood of the behaviours is: And in practice which one do you think most MPs would base their decision on? Don't knows presumably indicate'doubt over whether the behaviours are unreasonable or likely and thus have been taken into account, forming parts of the percentages of those who do not agree the behaviours are unreasonable or most likely.
-130-

Political Corruption, Public Opinion, and Citizens' Behaviour
voting decision. 105 Perceptions of actual levels of these motives being influential are
also presented, and indicate a certain degree of optimism. The suggestion that MPs
might vote according to the interests of their families or their job prospects is rejected
by all but a few respondents, although 11% of respondents believe that MPs' concerns
over their political careers is likely to be the most influential factor. To get a better
picture, however, it is disappointing not to have some indication of how far the public
believes such factors are at least partially contributory to MP's voting decisions,
rather than querying what the most likely motive is.
Let us finally observe responses to questions concerning favouritism.
Favouritism, or 'cronyism', in the context of political corruption, can refer to practice
whereby public sector employers, or those influential in the recruitment process to
public office, prioritise certain applicants (usually friends) for jobs. Whether
favouritism of this form is or is not 'political corruption' is a difficult question (this
may depend on whether it is done for money, or on a partisan or non-partisan basis),
but its link to two definitions of political corruption is clear. Non-meritocratic
selection processes for public jobs are surely not in the public interest, nor would they
comply with formal rules that require open recruitment. The link between favouritism
and the market-centred definition of corruption is perhaps more tenuous, as the
individual utility gained by recruiting a friend, say, is less obvious than that obtained
by the payoff from a bribe. Nonetheless, it is important to examine perceptions of
favouritism and, later, to see how well they tie to perceptions of other, more tangibly
'corrupt' behaviours.
105 Also unsurprising is that responses to a further question indicated that barely any respondents believed that any of these items should be the 'most important' consideration.
-131-

Political Corruption, Public Opinion, and Citizens' Behaviour
Table 5.4 shows that British citizens are highly condemning of two
hypothetical behaviours involving favouritism. 106
Table 5.4 Citizens' Views on the Acceptability of a Council Official's Behaviour in
regard to their Friend's Job Application
Behaviour ______________________________Unacceptable?_________ Give friend publicly unavailable information 90% Put in a good word 65% Pressure the interviewing committee 96%
N =____________________________________1097___________
Nearly all respondents suggest that a council official advantaging a friend applying
for a job by pressurising the interviewers is unacceptable, and nine-tenths of the
sample suggests giving the friend publicly unavailable information is unacceptable.
Only when the favouritism is less direct, such as putting in a good word for the friend,
are respondents more divided, with only 65% suggesting this form of behaviour is
unacceptable.
Moving on, Table 5.5 records responses to the idea of favouritism more
generally. 107
106 The wording for the question is: Suppose a vacancy has been advertised for a senior job in the local council. A council official, who is not involved in deciding who gets the job, thinks a friend would be good for the job. Which of these things do you think it would be acceptable for the council official to do and which would definitely not be acceptable. Two statements then refer to encouraging the friend to apply, and helping them prepare / helping them find publicly available information; but the three that are more morally dubious are those focused on: give the friend information that is not publicly available and would help them prepare for the interview; put in a good word for the friend with the person doing the interviewing for the job; and try to put pressure on the interviewing committee to appoint the friend. This wording had been simplified for presentational reasons in Table 5.4. Don't knows presumably indicate doubt over whether the behaviours are unacceptable, and thus form parts of the percentages of those who do not agree the behaviours are unacceptable. It is notable too that although the term 'favouritism' has been used in this thesis, neither it, nor the term 'cronyism' were used during the process of data collection.107 The statement citizens are asked to consider, and the possible responses, are shown in the table. The wording for the question posed before the statement is offered is: In your opinion, how important are the thinzs on these cards when government departments and other public services are recruiting people for jobs? Don't knows have been dropped. The percentages do not add up to 100% due to
rounding.
-132-
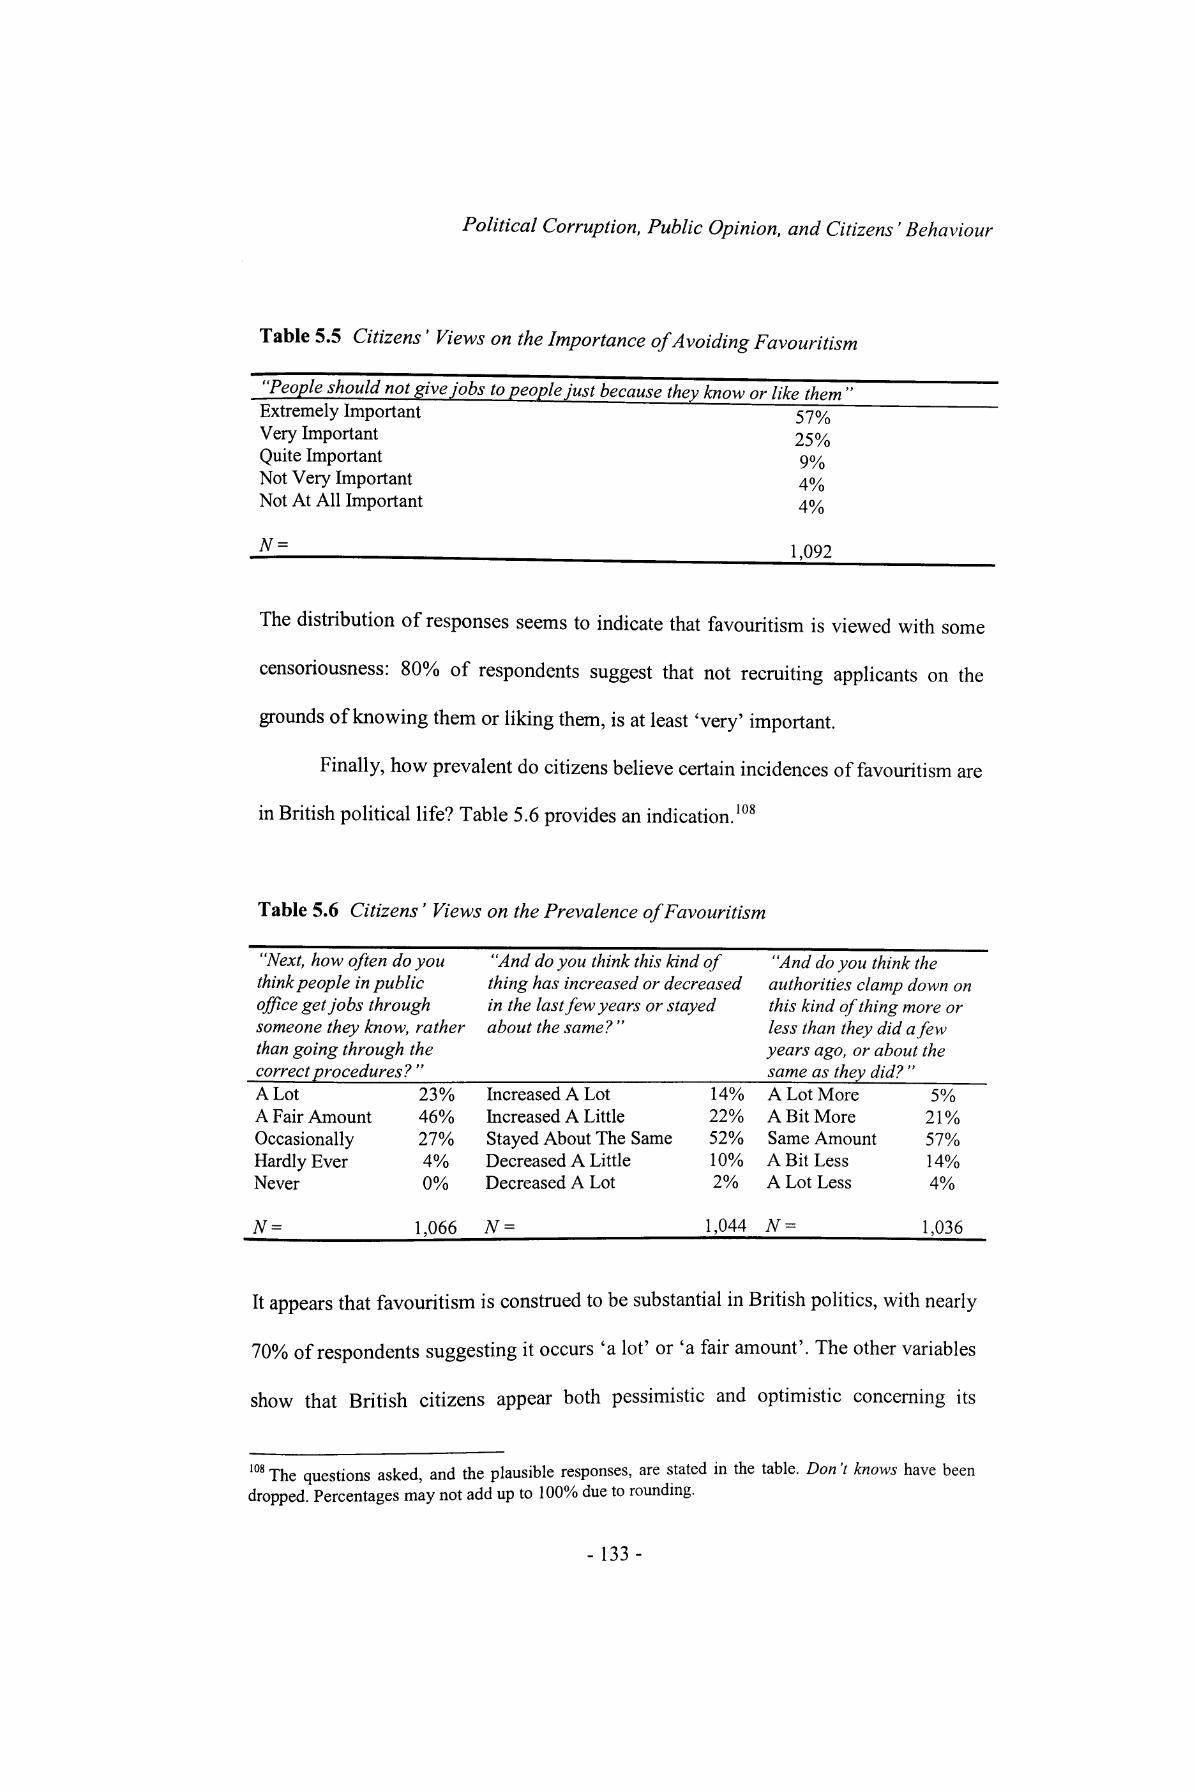
Political Corruption, Public Opinion, and Citizens' Behaviour
Table 5.5 Citizens' Views on the Importance of Avoiding Favouritism
"People should not give jobs to people just because they know or like them "Extremely ImportantVery ImportantQuite ImportantNot Very ImportantNot At All Important
N =
57% 25% 9% 4% 4%
1,092
The distribution of responses seems to indicate that favouritism is viewed with some
censoriousness: 80% of respondents suggest that not recruiting applicants on the
grounds of knowing them or liking them, is at least 'very' important.
Finally, how prevalent do citizens believe certain incidences of favouritism are
in British political life? Table 5.6 provides an indication. 108
Table 5.6 Citizens' Views on the Prevalence of Favouritism
"Next, how often do you think people in public office get jobs through someone they know, rather than going through the correct procedures? "
"And do you think this kind of thing has increased or decreased in the last few years or stayed about the same? "
"And do you think the authorities clamp down on this kind of thing more or less than they did a few years ago, or about the same as they did? "
A LotA Fair AmountOccasionallyHardly EverNever
N =
23%46%27%4%0%
1,066
Increased A LotIncreased A LittleStayed About The SameDecreased A LittleDecreased A Lot
N =
14%22%52%10%2%
1,044
A Lot MoreA Bit MoreSame AmountA Bit LessA Lot Less
TV-
5%21%57%14%4%
1,036
It appears that favouritism is construed to be substantial in British politics, with nearly
70% of respondents suggesting it occurs 'a lot' or 'a fair amount'. The other variables
show that British citizens appear both pessimistic and optimistic concerning its
108 The questions asked, and the plausible responses, are stated in the table. Don't knows have been dropped. Percentages may not add up to 100% due to roundmg.
-133-
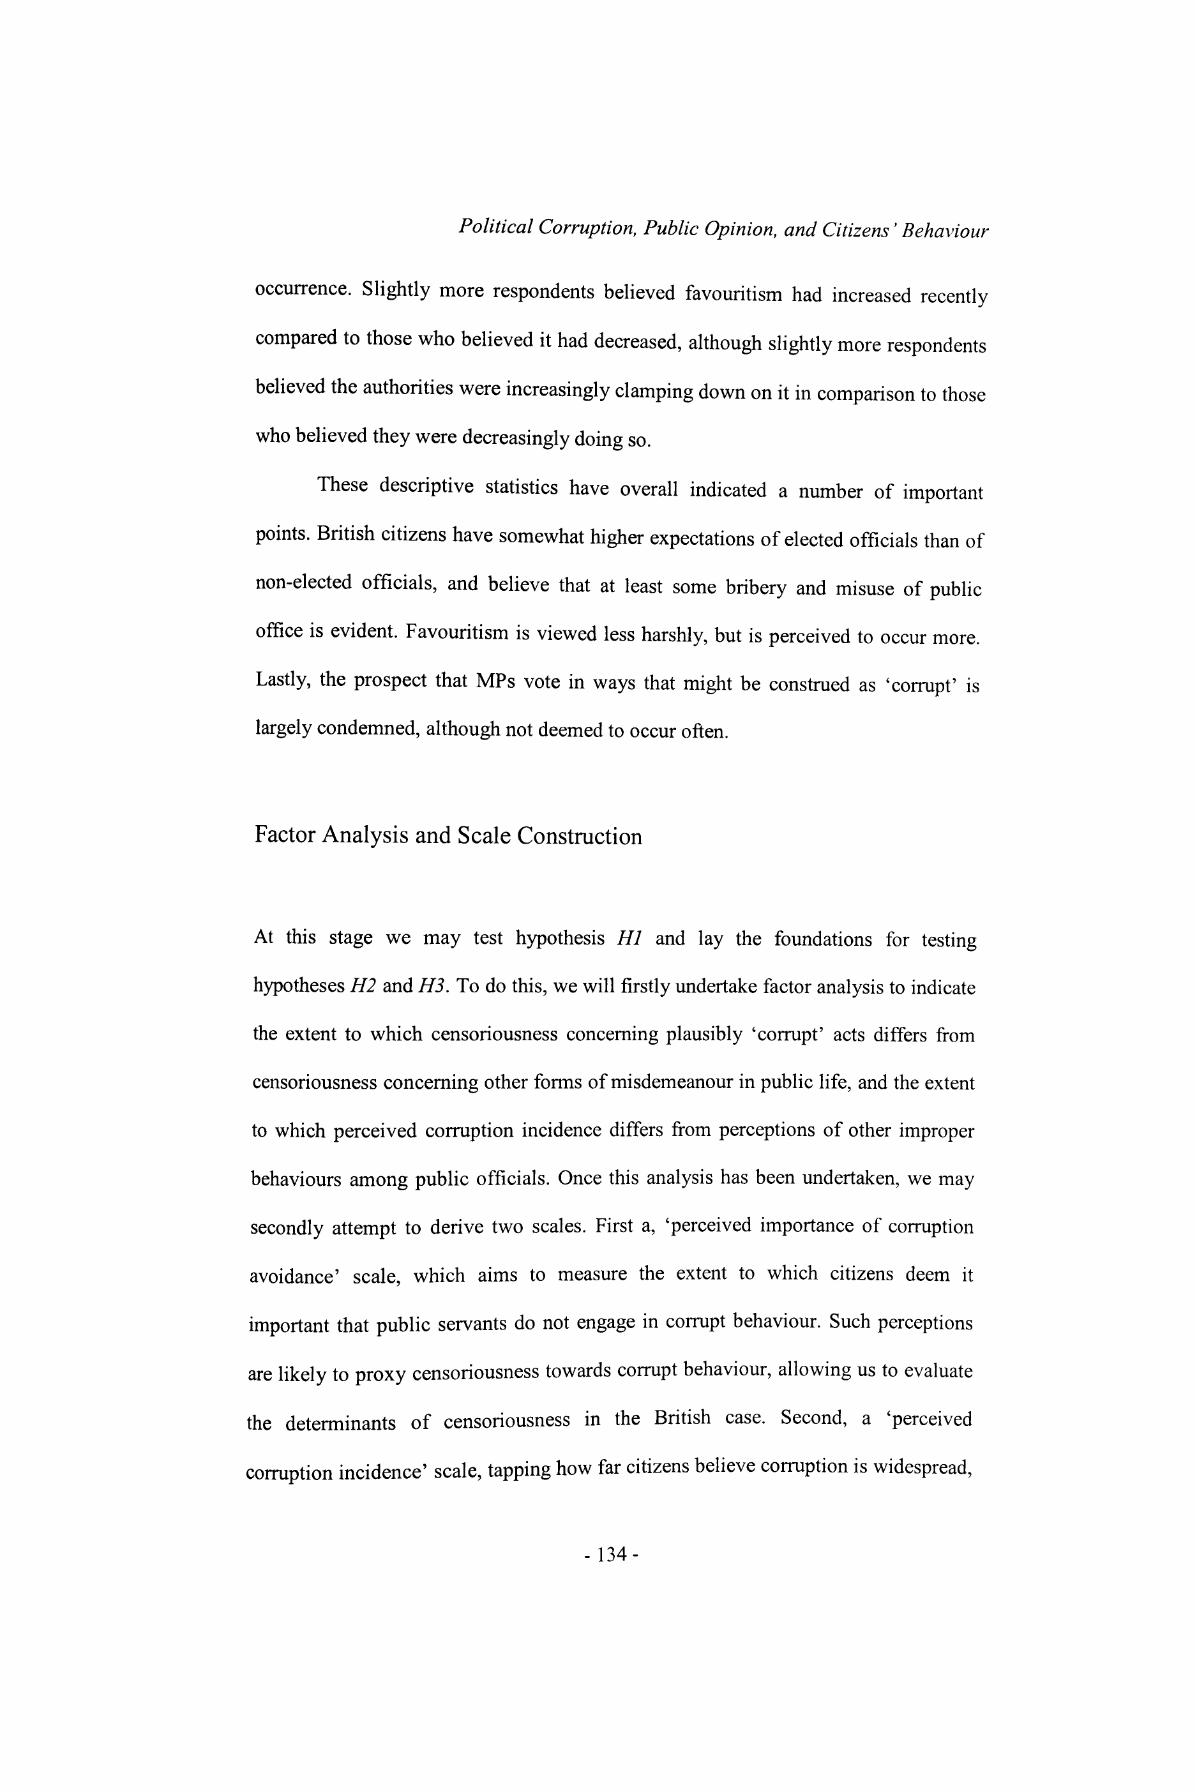
Political Corruption, Public Opinion, and Citizens' Behaviour
occurrence. Slightly more respondents believed favouritism had increased recently
compared to those who believed it had decreased, although slightly more respondents
believed the authorities were increasingly clamping down on it in comparison to those
who believed they were decreasingly doing so.
These descriptive statistics have overall indicated a number of important
points. British citizens have somewhat higher expectations of elected officials than of
non-elected officials, and believe that at least some bribery and misuse of public
office is evident. Favouritism is viewed less harshly, but is perceived to occur more.
Lastly, the prospect that MPs vote in ways that might be construed as 'corrupt' is
largely condemned, although not deemed to occur often.
Factor Analysis and Scale Construction
At this stage we may test hypothesis HI and lay the foundations for testing
hypotheses H2 and H3. To do this, we will firstly undertake factor analysis to indicate
the extent to which censoriousness concerning plausibly 'corrupt' acts differs from
censoriousness concerning other forms of misdemeanour in public life, and the extent
to which perceived corruption incidence differs from perceptions of other improper
behaviours among public officials. Once this analysis has been undertaken, we may
secondly attempt to derive two scales. First a, 'perceived importance of corruption
avoidance' scale, which aims to measure the extent to which citizens deem it
important that public servants do not engage in corrupt behaviour. Such perceptions
are likely to proxy censoriousness towards corrupt behaviour, allowing us to evaluate
the determinants of censoriousness in the British case. Second, a 'perceived
corruption incidence' scale, tapping how far citizens believe corruption is widespread,
-134-
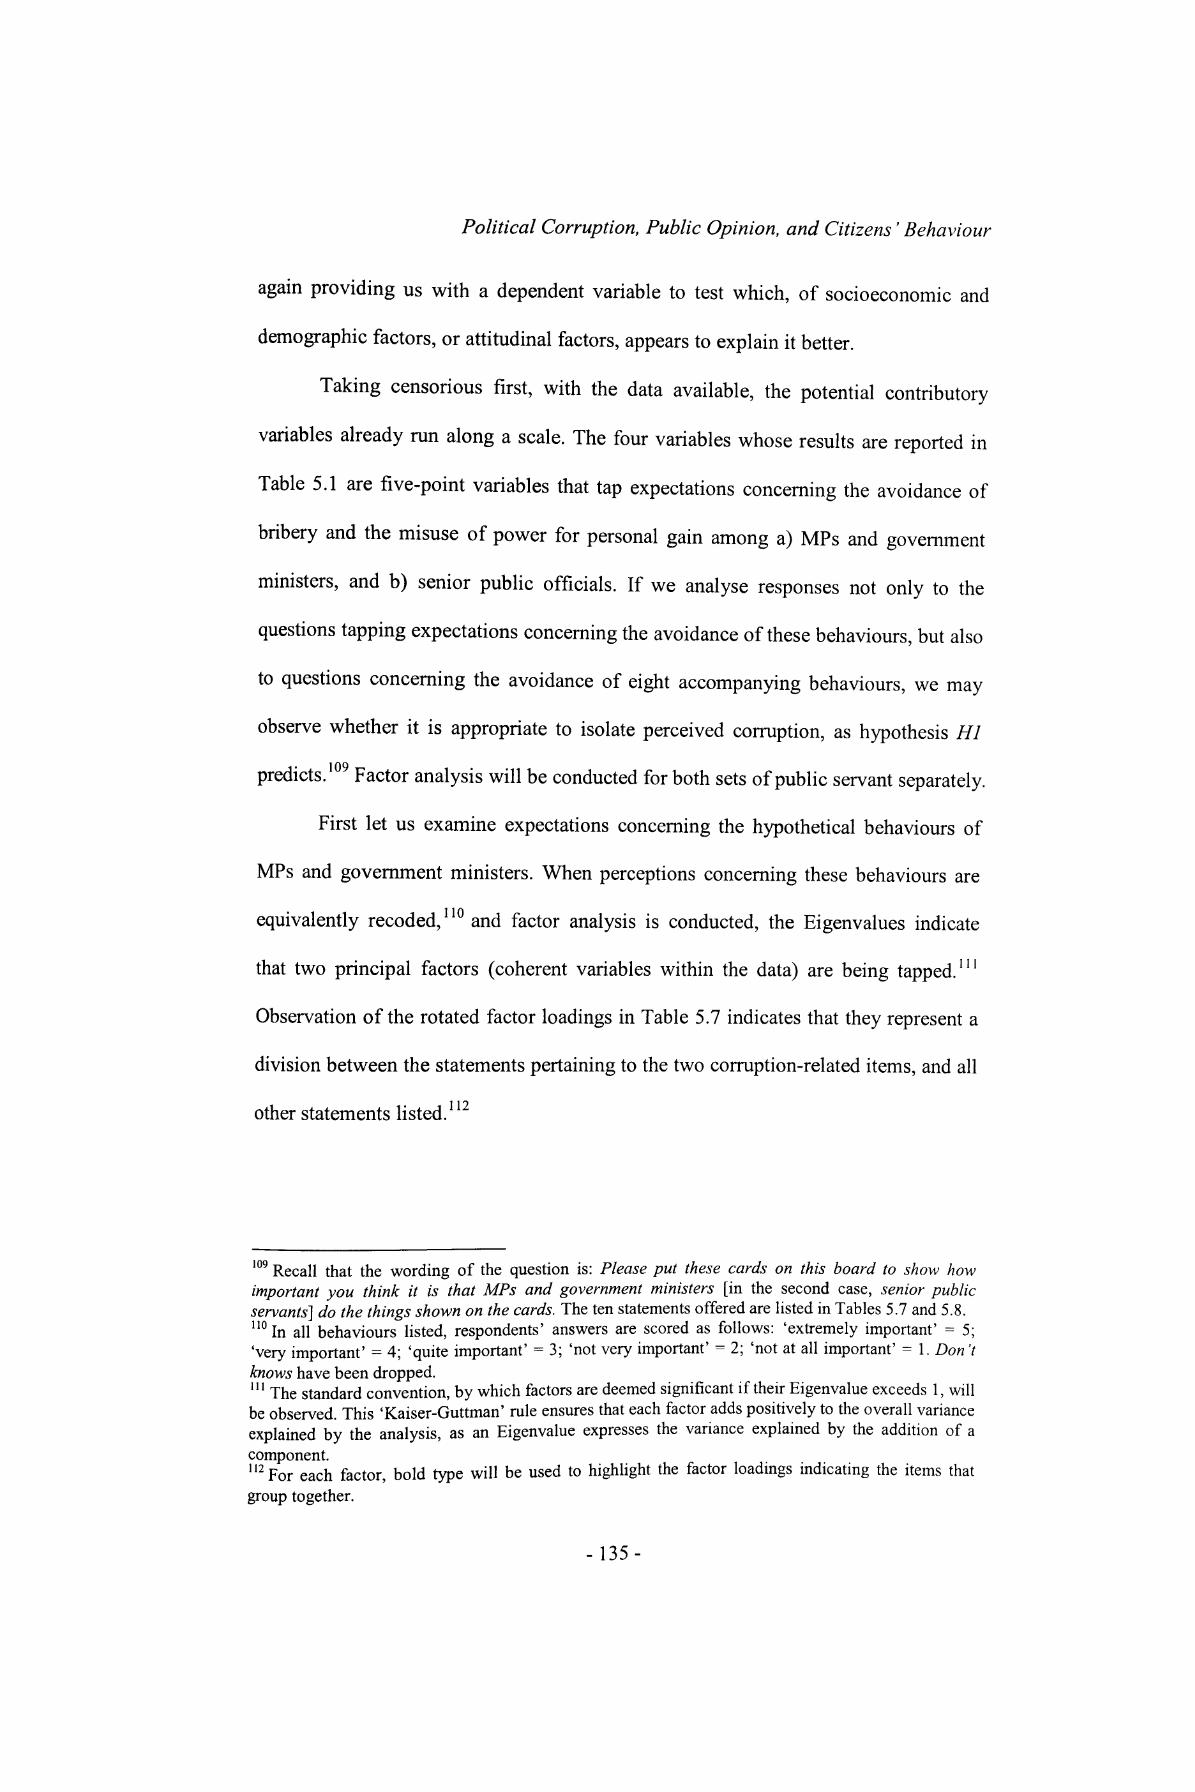
Political Corruption, Public Opinion, and Citizens' Behaviour
again providing us with a dependent variable to test which, of socioeconomic and
demographic factors, or attitudinal factors, appears to explain it better.
Taking censorious first, with the data available, the potential contributory
variables already run along a scale. The four variables whose results are reported in
Table 5.1 are five-point variables that tap expectations concerning the avoidance of
bribery and the misuse of power for personal gain among a) MPs and government
ministers, and b) senior public officials. If we analyse responses not only to the
questions tapping expectations concerning the avoidance of these behaviours, but also
to questions concerning the avoidance of eight accompanying behaviours, we may
observe whether it is appropriate to isolate perceived corruption, as hypothesis HI
predicts. 109 Factor analysis will be conducted for both sets of public servant separately.
First let us examine expectations concerning the hypothetical behaviours of
MPs and government ministers. When perceptions concerning these behaviours are
equivalently receded, 110 and factor analysis is conducted, the Eigenvalues indicate
that two principal factors (coherent variables within the data) are being tapped. 111
Observation of the rotated factor loadings in Table 5.7 indicates that they represent a
division between the statements pertaining to the two corruption-related items, and all
1 1 *7other statements listed.
109 Recall that the wording of the question is: Please put these cards on this board to show how important you think it is that MPs and government ministers [in the second case, senior public servants] do the things shown on the cards. The ten statements offered are listed in Tables 5.7 and 5.8.110 In all behaviours listed, respondents' answers are scored as follows: 'extremely important' = 5; 'very important' = 4; 'quite important' = 3; 'not very important' = 2; 'not at all important' = 1. Don'tknows have been dropped.111 The standard convention, by which factors are deemed significant if their Eigenvalue exceeds 1, will be observed This 'Kaiser-Guttman' rule ensures that each factor adds positively to the overall variance explained by the analysis, as an Eigenvalue expresses the variance explained by the addition of a
;h factor, bold type will be used to highlight the factor loadings indicating the items that group together.
-135-
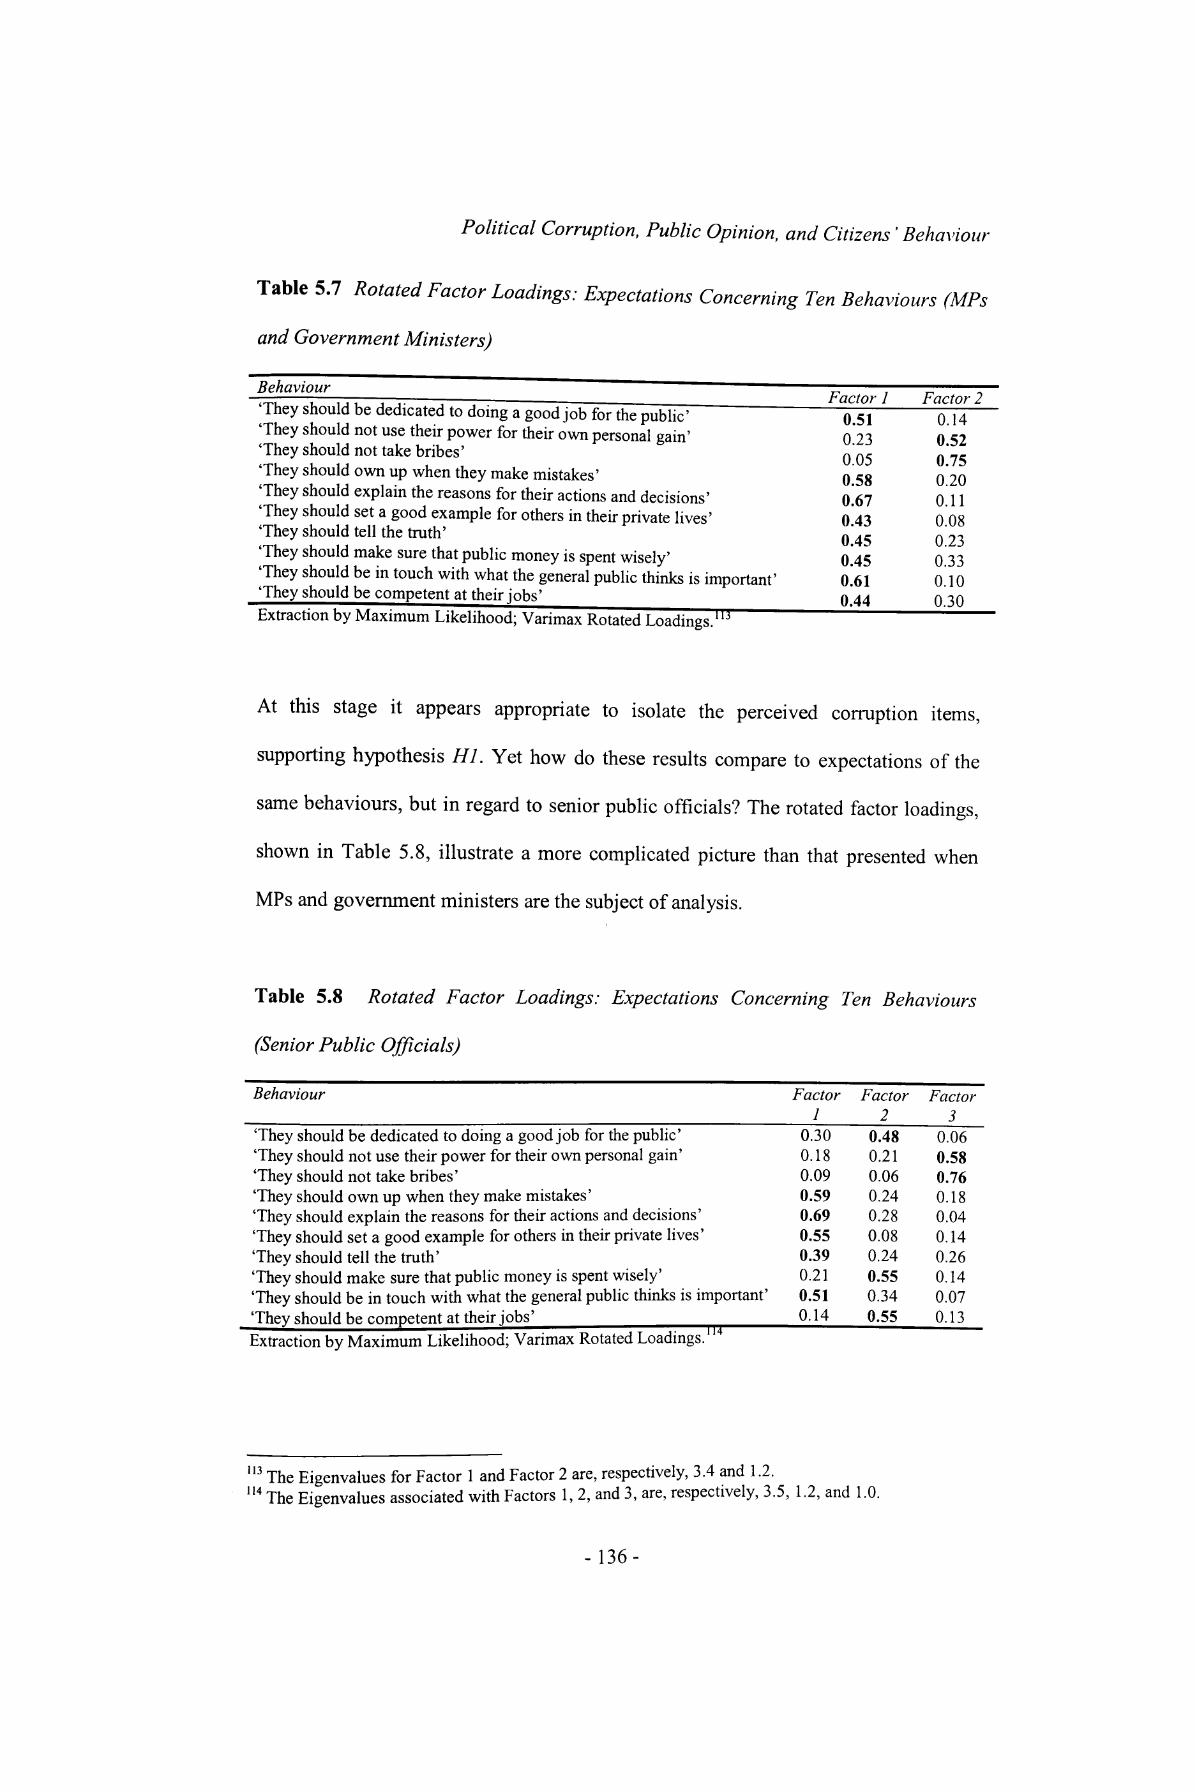
Political Corruption, Public Opinion, and Citizens' Behaviour
Table 5.7 Rotated Factor Loadings: Expectations Concerning Ten Behaviours (MPs
and Government Ministers)
Behaviour__________________________________Factor I Factor 2They should be dedicated to doing a good job for the public' 0.51 0.14'They should not use their power for their own personal gain' 0.23 0.52They should not take bribes' 0 05 0 75They should own up when they make mistakes' 0.58 0.20They should explain the reasons for their actions and decisions' 0.67 0.11They should set a good example for others in their private lives' 0.43 0.08They should tell the truth' 0.45 0.23They should make sure that public money is spent wisely' 0.45 0.33They should be in touch with what the general public thinks is important' 0.61 0.10They should be competent at their jobs' _____________ 0.44 0.30 Extraction by Maximum Likelihood; Varimax Rotated Loadings. 113
At this stage it appears appropriate to isolate the perceived corruption items,
supporting hypothesis HI. Yet how do these results compare to expectations of the
same behaviours, but in regard to senior public officials? The rotated factor loadings,
shown in Table 5.8, illustrate a more complicated picture than that presented when
MPs and government ministers are the subject of analysis.
Table 5.8 Rotated Factor Loadings: Expectations Concerning Ten Behaviours
(Senior Public Officials)
Behaviour
They should be dedicated to doing a good job for the public'They should not use their power for their own personal gain'They should not take bribes'They should own up when they make mistakes'They should explain the reasons for their actions and decisions'They should set a good example for others in their private lives'They should tell the truth'They should make sure that public money is spent wisely'They should be in touch with what the general public thinks is important'They should be competent at their jobs'Extraction by Maximum Likelihood; Varimax Rotated Loadings.
Factor 1
0.300.180.090.590.690.550.390.210.510.14
Factor2
0.480.210.060.240.280.080.240.550.340.55
Factor 3
0.060.580.760.180.040.140.260.140.070.13
113 The Eigenvalues for Factor 1 and Factor 2 are, respectively, 3.4 and 1-2.114 The Eigenvalues associated with Factors 1, 2, and 3, are, respectively, 3.5, 1.2, and 1.0.
-136-

Political Corruption, Public Opinion, and Citizens' Behaviour
Three factors are evident. The first appears to tap honesty, proximity to the public,
and private ethics; the second pertains to competence; the third isolates the two
corruption-related items. The factor loadings of the two corrupt behaviours in factor 3
are considerably higher than all of the remaining items, suggesting that it is once
again justifiable to isolate perceptions of corruption. For simplicity, the first two
factors may be combined as a general indicator of expectations concerning non-
corrupt behaviours, as this makes the data for both types of public servant equivalent,
with items dividing between expectations concerning corrupt and non-corrupt
behaviours. 115
To obtain a general perceived corruption scale, it is theoretically useful to
combine responses vis-a-vis both sets of public servant. Thus, a 'perceived
importance of corruption avoidance' scale is obtained by scaling for the two types of
public servant the two items pertaining to bribery and the misuse of power for
personal gain, deriving, in total, a four-item scale which exhibits a Cronbach's Alpha
of 0.64. 116 We may also group together the other sixteen items (eight items pertaining
to each type of public servants) to derive a more general 'perceived importance of
115 Nonetheless it is interesting to query why more nuanced findings are revealed here. If we observe Table 2 in the BMRB report (BMRB, 2004, p. 28), we see that senior public officials are generally trusted more than MPs and ministers. Perhaps the coherence of Factor 1, which is comprised of three components which broadly relate to honesty (owning up when having made mistakes, explaining reasons for behaviour, and telling the truth), is explained by citizens' increased trust in such public officials, making expectations concerning their honesty coherently distinct from perceptions concerning competence and corruption. As MPs and ministers are trusted less, perhaps the coherence of expectations relating to honesty is less distinct, explaining the less nuanced findings in Table 5.7. This possibility is weakened, however, by the importance of items relating to proximity to the public and private ethics in Factor 1 in Table 5.8. Their contribution makes incorrect the description of Factor 1 as a latent variable only tapping honesty.116 The scale's values run from 5 = very important (and hence proxies high censoriousness), to 1 = not at all important (and hence proxies low censoriousness). It was hoped the scale could tap a broader conception of corruption by including the variable tapping citizens' perceived importance of the avoidance of favouritism (the five-point variable whose results are presented in Table 5.5). However, when it was equivalently receded and used to comprise a five-item scale, the Cronbach's Alpha reduced to 0.6, so it will not be used for this purpose. This indicates that citizens hold different expectations over the avoidance of favouritism than they do for the avoidance of bribery and the misuse of power for personal gain. Comparing Tables 5.1 and 5.5 suggests citizens are less censorious
of favouritism.
-137-
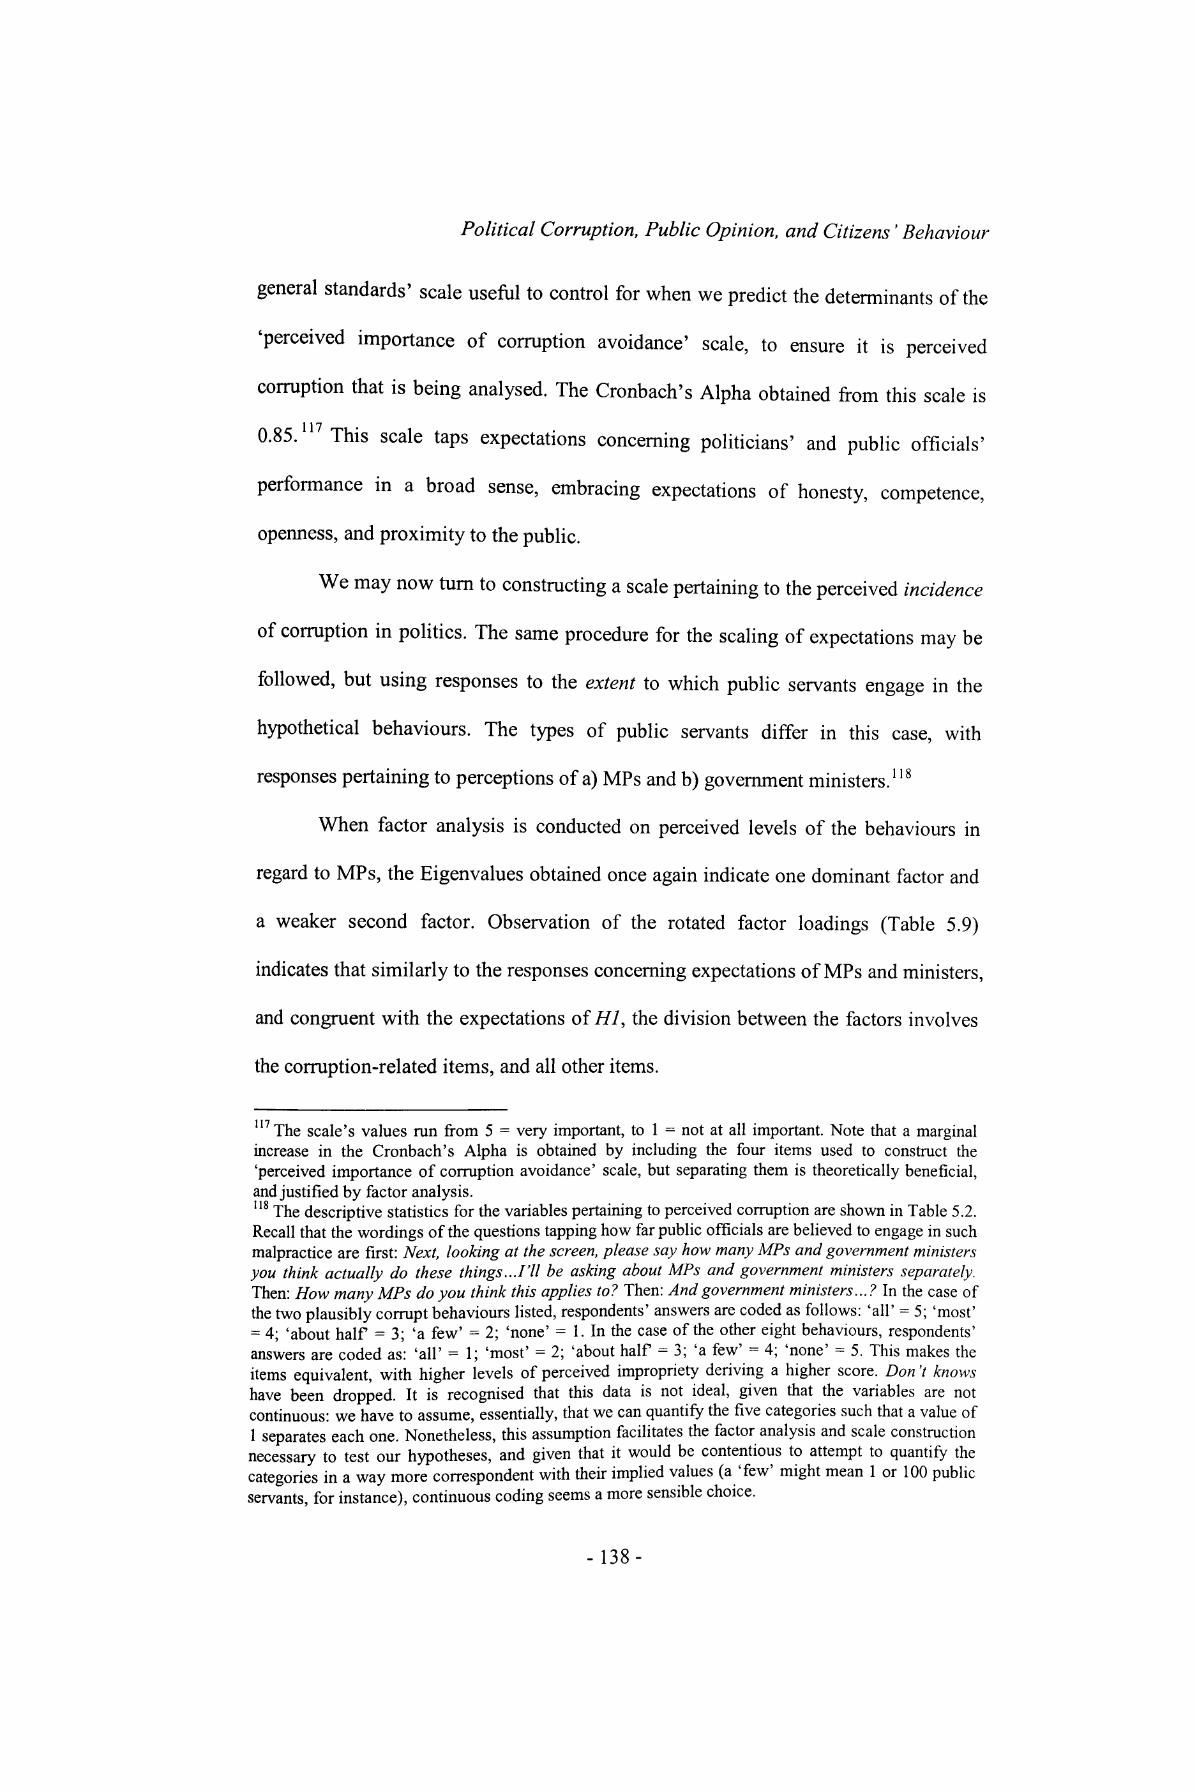
Political Corruption, Public Opinion, and Citizens' Behaviour
general standards' scale useful to control for when we predict the determinants of the
'perceived importance of corruption avoidance' scale, to ensure it is perceived
corruption that is being analysed. The Cronbach's Alpha obtained from this scale is
0.85. This scale taps expectations concerning politicians' and public officials'
performance in a broad sense, embracing expectations of honesty, competence,
openness, and proximity to the public.
We may now turn to constructing a scale pertaining to the perceived incidence
of corruption in politics. The same procedure for the scaling of expectations may be
followed, but using responses to the extent to which public servants engage in the
hypothetical behaviours. The types of public servants differ in this case, with
responses pertaining to perceptions of a) MPs and b) government ministers. 118
When factor analysis is conducted on perceived levels of the behaviours in
regard to MPs, the Eigenvalues obtained once again indicate one dominant factor and
a weaker second factor. Observation of the rotated factor loadings (Table 5.9)
indicates that similarly to the responses concerning expectations of MPs and ministers,
and congruent with the expectations of HI, the division between the factors involves
the corruption-related items, and all other items.
117 The scale's values run from 5 = very important, to 1 = not at all important. Note that a marginal increase in the Cronbach's Alpha is obtained by including the four items used to construct the 'perceived importance of corruption avoidance' scale, but separating them is theoretically beneficial, and justified by factor analysis.118 The descriptive statistics for the variables pertaining to perceived corruption are shown in Table 5.2. Recall that the wordings of the questions tapping how far public officials are believed to engage in such malpractice are first: Next, looking at the screen, please say how many MPs and government ministers you think actually do these things...I'll be asking about MPs and government ministers separately. Then: How many MPs do you think this applies to? Then: And government ministers...? In the case of the two plausibly corrupt behaviours listed, respondents' answers are coded as follows: 'all' = 5; 'most' = 4- 'about half = 3' 'a few' = 2; 'none' = 1. In the case of the other eight behaviours, respondents' answers are coded as: 'all' = 1; 'most' = 2; 'about half = 3; 'a few' = 4; 'none' = 5. This makes the items equivalent, with higher levels of perceived impropriety deriving a higher score. Don't knows have been dropped. It is recognised that this data is not ideal, given that the variables are not continuous: we have to assume, essentially, that we can quantify the five categories such that a value of 1 separates each one. Nonetheless, this assumption facilitates the factor analysis and scale construction necessary to test our hypotheses, and given that it would be contentious to attempt to quantify the categories in a way more correspondent with their implied values (a 'few' might mean 1 or 100 public servants, for instance), continuous coding seems a more sensible choice.
-138-

Political Corruption, Public Opinion, and Citizens' Behaviour
Table 5.9 Rotated Factor Loadings: Perceived Incidence of Ten Behaviours (MPs)
BehaviourThey are dedicated to doing a good job for the public'They use their power for their own personal gain'They take bribes'They own up when they make mistakes'They explain the reasons for their actions and decisions'They set a good example for others in their private lives'They tell the truth'They make sure that public money is spent wisely'They are in touch with what the general public thinks is important'They are competent at their jobs'
Factor 10.700.240.100.540.530.520.670.680.650.64
Factor 20.200.480.790.150.150.230.320.120.150.14
Extraction by Maximum Likelihood; Varimax Rotated Loadings.
Let us now follow the same procedure but in regard to perceptions of government
ministers. The Eigenvalues obtained from factor analysis again show that one
dominant factor and a weaker second factor are indicated, and the rotated factor
loadings reveal too that the division between the factors involves the items that are
corruption-related and those that are not. See Table 5.10.
Table 5.10 Rotated Factor Loadings: Perceived Incidence of Ten Behaviours
(Government Ministers)
BehaviourThey are dedicated to doing a good job for the public'They use their power for their own personal gain'They take bribes'They own up when they make mistakes'They explain the reasons for their actions and decisions'They set a good example for others in their private lives'They tell the truth'They make sure that public money is spent wisely'They are in touch with what the general public thinks is important'They are competent at their jobs'Extraction by Maximum Likelihood; Varimax Rotated Loadings. 1ZU
Factor 10.710.240.120.570.560.540.670.690.660.64
Factor 20.260.500.780.130.130.250.270.200.150.16
119 The Eigenvalues associated with Factor 1 and Factor 2 are, respectively, 4.2 and 1.2.120 Here Factor 1's and Factor 2's Eigenvalues are 4.4 and 1.1 respectively.
-139-
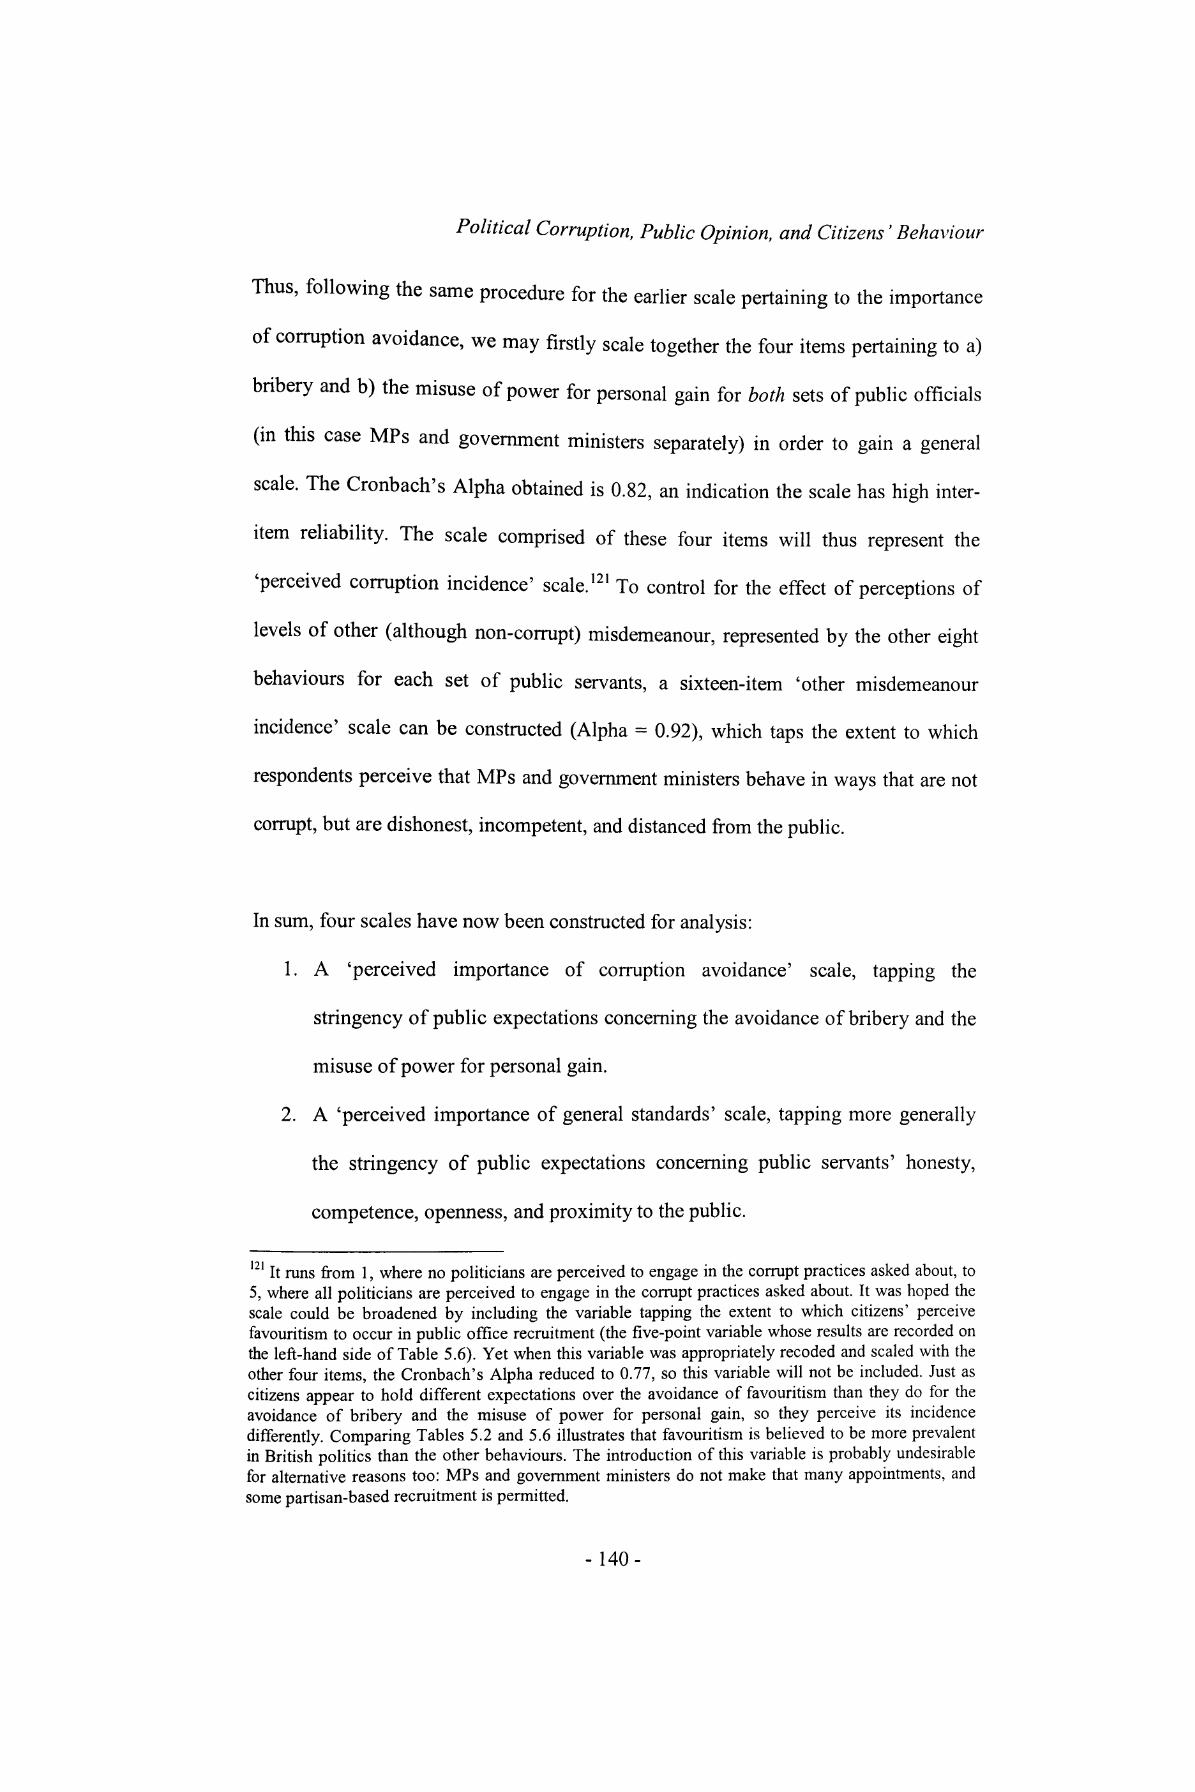
Political Corruption, Public Opinion, and Citizens' Behaviour
Thus, following the same procedure for the earlier scale pertaining to the importance
of corruption avoidance, we may firstly scale together the four items pertaining to a)
bribery and b) the misuse of power for personal gain for both sets of public officials
(in this case MPs and government ministers separately) in order to gain a general
scale. The Cronbach's Alpha obtained is 0.82, an indication the scale has high inter-
item reliability. The scale comprised of these four items will thus represent the
'perceived corruption incidence' scale. 121 To control for the effect of perceptions of
levels of other (although non-corrupt) misdemeanour, represented by the other eight
behaviours for each set of public servants, a sixteen-item 'other misdemeanour
incidence' scale can be constructed (Alpha = 0.92), which taps the extent to which
respondents perceive that MPs and government ministers behave in ways that are not
corrupt, but are dishonest, incompetent, and distanced from the public.
In sum, four scales have now been constructed for analysis:
1. A 'perceived importance of corruption avoidance' scale, tapping the
stringency of public expectations concerning the avoidance of bribery and the
misuse of power for personal gain.
2. A 'perceived importance of general standards' scale, tapping more generally
the stringency of public expectations concerning public servants' honesty,
competence, openness, and proximity to the public.
121 It runs from 1, where no politicians are perceived to engage in the corrupt practices asked about, to 5, where all politicians are perceived to engage in the corrupt practices asked about. It was hoped the scale could be broadened by including the variable tapping the extent to which citizens' perceive favouritism to occur in public office recruitment (the five-point variable whose results are recorded on the left-hand side of Table 5.6). Yet when this variable was appropriately receded and scaled with the other four items, the Cronbach's Alpha reduced to 0.77, so this variable will not be included. Just as citizens appear to hold different expectations over the avoidance of favouritism than they do for the avoidance of bribery and the misuse of power for personal gain, so they perceive its incidence differently. Comparing Tables 5.2 and 5.6 illustrates that favouritism is believed to be more prevalent in British politics than the other behaviours. The introduction of this variable is probably undesirable for alternative reasons too: MPs and government ministers do not make that many appointments, and some partisan-based recruitment is permitted.
-140-

Political Corruption, Public Opinion, and Citizens' Behaviour
3. A 'perceived corruption incidence' scale, tapping the degree to which the
misuse of power for personal gain and bribery is perceived to be prevalent
among politicians.
4. An 'other misdemeanour incidence' scale, tapping the degree to which
politicians are perceived to behave in ways that are dishonest, incompetent,
and distanced from the public.
While these scales will be useful for our next task - predicting the determinants of
perceptions of corruption, this section is also useful in addressing hypothesis HI. It
was predicted that perceptions of corrupt acts would substantively differ from
perceptions concerning other forms of misdemeanour in public life. Factor analysis
has shown empirically that the corrupt acts do group separately from the other acts
under consideration, indicating that HI is supported. Observation of the descriptive
statistics of the derived scales in Table 5.11 indicates why this is the case.
Table 5.11 Descriptive Statistics of the Scales Derived From Factor Analysis
Variable________________________________Mean____S.D.___N= Perceived Importance of Corruption Avoidance Scale 4.68 0.49 1096 Perceived Importance of General Standards Scale 4.40 0.41 1097 Perceived Corruption Incidence 2.50 0.75 1091 Other Misdemeanour Incidence 3.10 0.65 1097
From observation of the mean values it appears that British citizens are a) more
censorious of the corrupt acts than they are the other misdemeanours (and, from the
standard deviation, there is limited variation in this high level of censoriousness), and
b) perceive corruption to occur less than other forms of misdemeanour in public life
(although citizens vary slightly more in these beliefs).
-141 -
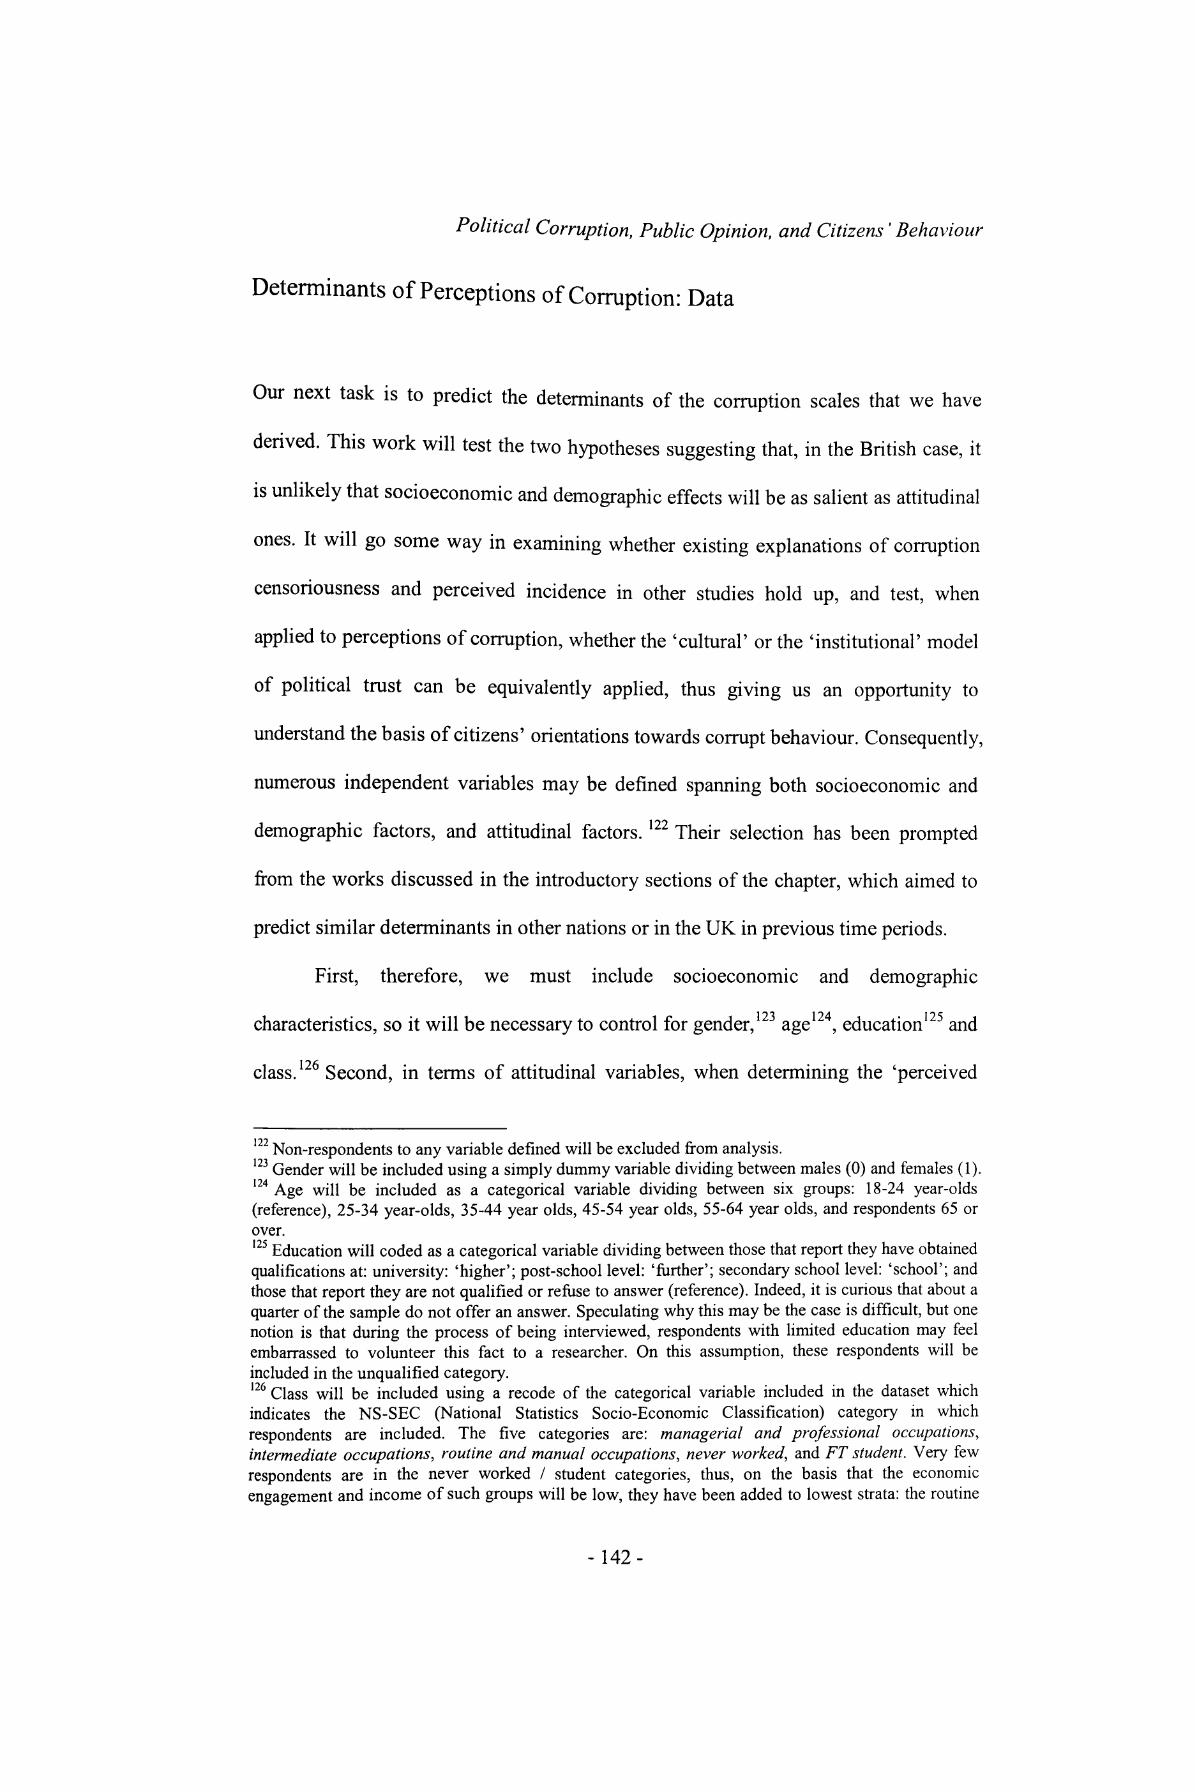
Political Corruption, Public Opinion, and Citizens' Behaviour
Determinants of Perceptions of Corruption: Data
Our next task is to predict the determinants of the corruption scales that we have
derived. This work will test the two hypotheses suggesting that, in the British case, it
is unlikely that socioeconomic and demographic effects will be as salient as attitudinal
ones. It will go some way in examining whether existing explanations of corruption
censoriousness and perceived incidence in other studies hold up, and test, when
applied to perceptions of corruption, whether the 'cultural' or the 'institutional' model
of political trust can be equivalently applied, thus giving us an opportunity to
understand the basis of citizens' orientations towards corrupt behaviour. Consequently,
numerous independent variables may be defined spanning both socioeconomic and
demographic factors, and attitudinal factors. 122 Their selection has been prompted
from the works discussed in the introductory sections of the chapter, which aimed to
predict similar determinants in other nations or in the UK in previous time periods.
First, therefore, we must include socioeconomic and demographic
characteristics, so it will be necessary to control for gender, 123 age 124 , education 125 and
class. 126 Second, in terms of attitudinal variables, when determining the 'perceived
122 Non-respondents to any variable defined will be excluded from analysis.123 Gender will be included using a simply dummy variable dividing between males (0) and females (1).124 Age will be included as a categorical variable dividing between six groups: 18-24 year-olds (reference), 25-34 year-olds, 35-44 year olds, 45-54 year olds, 55-64 year olds, and respondents 65 or over.125 Education will coded as a categorical variable dividing between those that report they have obtained qualifications at: university: 'higher'; post-school level: 'further'; secondary school level: 'school'; and those that report they are not qualified or refuse to answer (reference). Indeed, it is curious that about a quarter of the sample do not offer an answer. Speculating why this may be the case is difficult, but one notion is that during the process of being interviewed, respondents with limited education may feel embarrassed to volunteer this fact to a researcher. On this assumption, these respondents will be included in the unqualified category.126 Class will be included using a recede of the categorical variable included in the dataset which indicates the NS-SEC (National Statistics Socio-Economic Classification) category in which respondents are included. The five categories are: managerial and professional occupations, intermediate occupations, routine and manual occupations, never worked, and FT student. Very few respondents are in the never worked / student categories, thus, on the basis that the economic engagement and income of such groups will be low, they have been added to lowest strata: the routine
- 142-
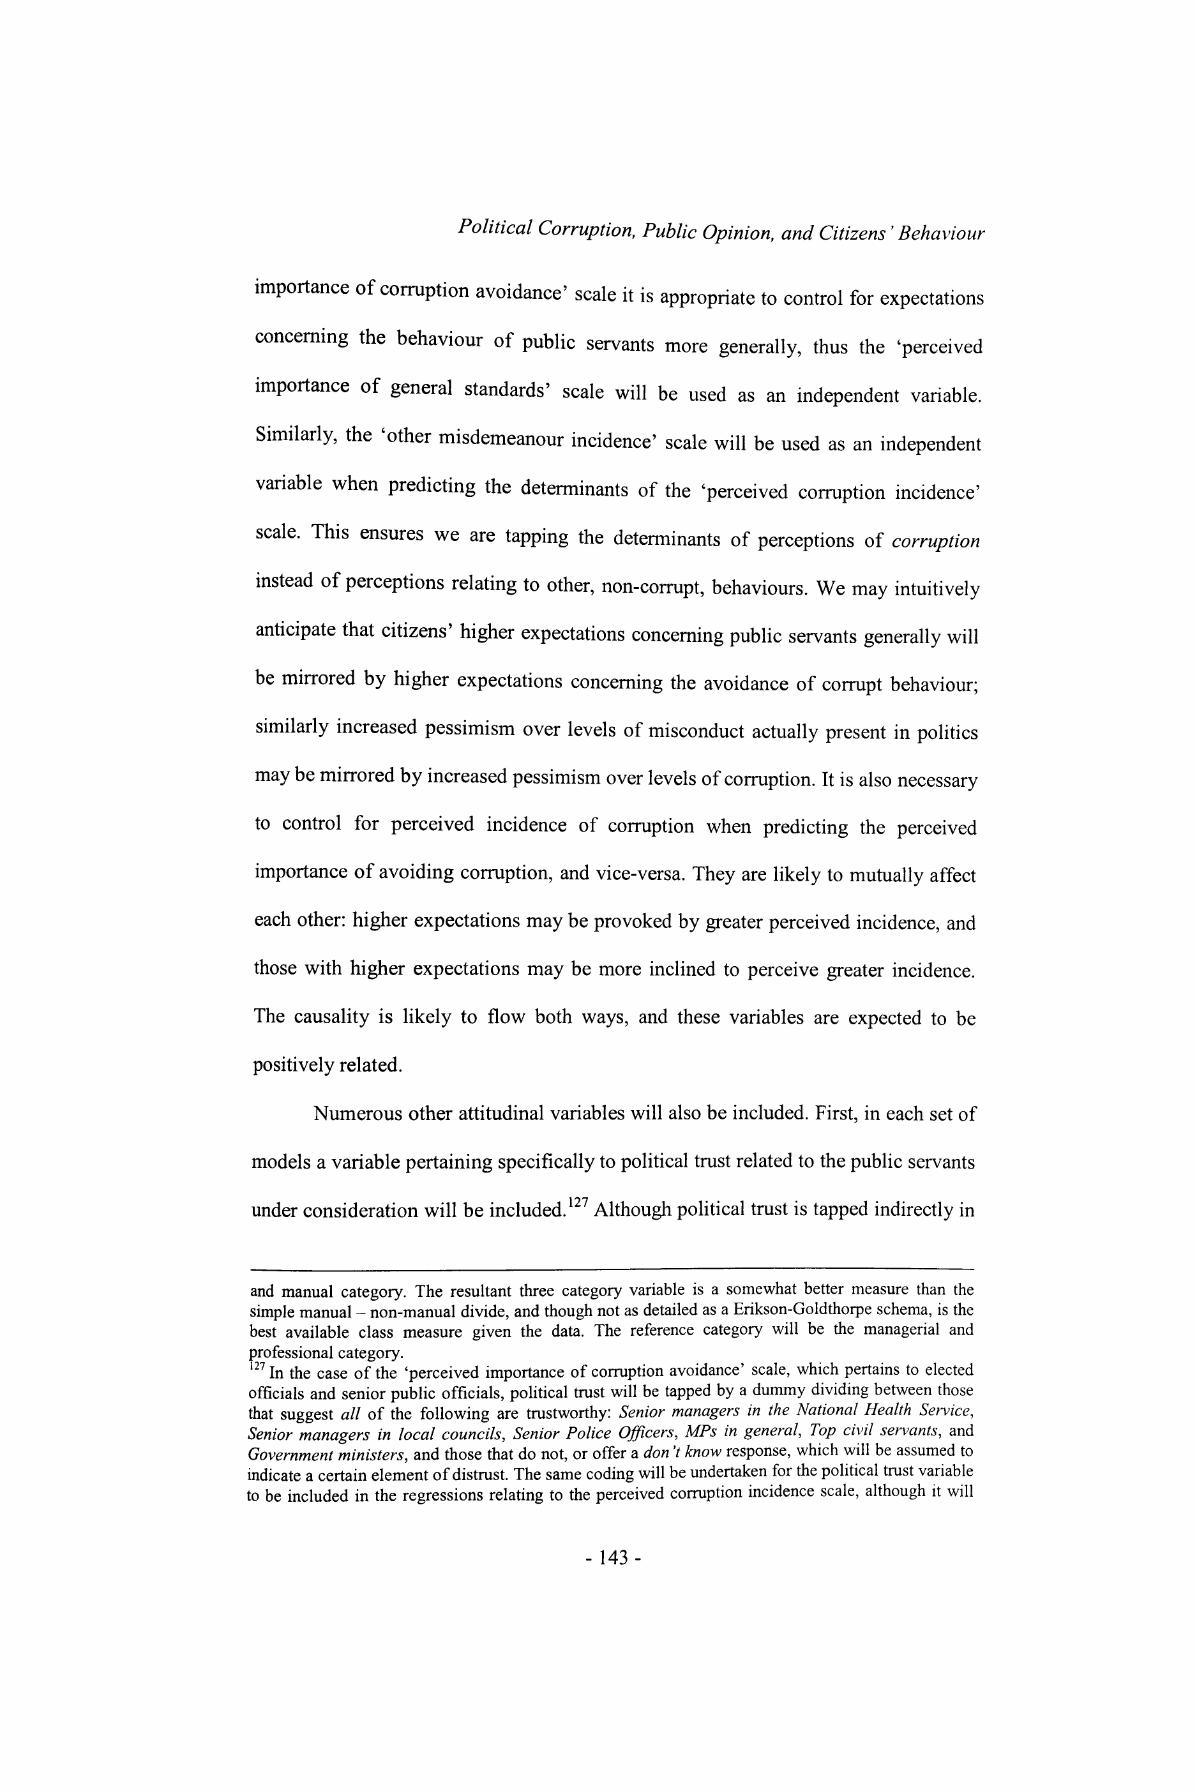
Political Corruption, Public Opinion, and Citizens' Behaviour
importance of corruption avoidance' scale it is appropriate to control for expectations
concerning the behaviour of public servants more generally, thus the 'perceived
importance of general standards' scale will be used as an independent variable.
Similarly, the 'other misdemeanour incidence' scale will be used as an independent
variable when predicting the determinants of the 'perceived corruption incidence'
scale. This ensures we are tapping the determinants of perceptions of corruption
instead of perceptions relating to other, non-corrupt, behaviours. We may intuitively
anticipate that citizens' higher expectations concerning public servants generally will
be mirrored by higher expectations concerning the avoidance of corrupt behaviour;
similarly increased pessimism over levels of misconduct actually present in politics
may be mirrored by increased pessimism over levels of corruption. It is also necessary
to control for perceived incidence of corruption when predicting the perceived
importance of avoiding corruption, and vice-versa. They are likely to mutually affect
each other: higher expectations may be provoked by greater perceived incidence, and
those with higher expectations may be more inclined to perceive greater incidence.
The causality is likely to flow both ways, and these variables are expected to be
positively related.
Numerous other attitudinal variables will also be included. First, in each set of
models a variable pertaining specifically to political trust related to the public servants
under consideration will be included. 127 Although political trust is tapped indirectly in
and manual category. The resultant three category variable is a somewhat better measure than the simple manual - non-manual divide, and though not as detailed as a Erikson-Goldthorpe schema, is the best available class measure given the data. The reference category will be the managerial and professional category.127 In the case of the 'perceived importance of corruption avoidance' scale, which pertains to elected officials and senior public officials, political trust will be tapped by a dummy dividing between those that suggest all of the following are trustworthy: Senior managers in the National Health Service, Senior managers in local councils, Senior Police Officers, MPs in general, Top civil servants, and Government ministers, and those that do not, or offer a don't know response, which will be assumed to indicate a certain element of distrust. The same coding will be undertaken for the political trust variable to be included in the regressions relating to the perceived corruption incidence scale, although it will
-143-

Political Corruption, Public Opinion, and Citizens' Behaviour
the 'other misdemeanour incidence' scale, it is useful to tap it directly, as it is
expected to be a strong predictor of lower levels of perceived corruption incidence,
and it may prompt higher expectations of politicians. Two further items to be included,
found to be significant in previous literature, are social trust 128 and political
alienation. Furthermore, because political knowledge has been found to link to both
increased censoriousness and pessimism over the incidence of corruption (Gibbons,
1985; McCann and Dominguez, 1998), a variable tapping the effect of self-reported
knowledge of the topics in hand may be included, scaled with two other items tapping
political interest and strength of feeling concerning the topics in hand. 130
It may be expected that citizens' attitudes concerning the likelihood that
corrupt politicians will be caught and punished will also affect perceptions:
only involve the two types of public servants queried about: MPs in general, and Government ministers. The specific question they are asked is: These cards show different types of people. Please put them on this board to shove which you would generally trust to tell the truth and which you wouldn 't. 128 Social trust will be included by a recede of responses to the question: Generally speaking, would you say that most people can be trusted, or that you can't be too careful dealing with people? The response: most people can be trusted will be coded as 1; the response: you can't be too careful dealing with people will be coded as 0. Don't knows have been dropped.
Alienation will be included using a scale comprised of the responses to two items. Faced with an initial statement: I'm now going to read out a number of things that other people have said to us and I'd like to know how much you agree or disagree with them. Please take your answers from this card. So first... [instruction to rotate items here], respondents are then given the propositions: I can influence decisions affecting my local area and I can influence decisions affecting this country, with the plausible responses: agree strongly [1], agree [2], neither agree nor disagree [3], disagree [4], disagree strongly [5]. (The coding assigned to the variables is provided in the square brackets.) The responses to the two items exhibit a bivariate correlation of 0.56, and the scale comprised of them which will form the alienation variable exhibits a Cronbach's Alpha of 0.72. Don't knows were dropped. Note that the attempted introduction of a third item, comprised of responses to the statement: Sometimes politics and government seem so complicated that a person like me cannot really understand what's going on, which has the same plausible responses (though for scaling they were receded inversely so 5 signalled strong agreement, 1 strong disagreement, etc.) was unsuccessful: the Cronbach's Alpha derived from scaling the three items was only 0.48.130 Self-reported political knowledge will be tapped by a recode of the question asking: Before today how much did you know about the sorts of things we've been talking about? The responses, and the codes assigned to them, are: a lot [5], a reasonable amount [3.67], a little [2.33], nothing at all [1]. Interest in politics will be tapped by a recode of the question asking: First of all, how much interest do you generally have in what is going on in current affairs? The responses, and the codes assigned to them, are: a great deal [5], quite a lot [4], some [3], not very much [2], none at all [1]. Strength of feeling concerning the issues in hand will be tapped by a recode of a question asking: And how strongly do you feel about the things that we've been talking about? The responses, and the codes assigned to them, are: very strongly [5], quite strongly [3.67], not very strongly [2.33], not strongly at all [1]. In all cases, don't knows were dropped. The Cronbach's Alpha obtained from scaling the three items was 0.71.
-144-
Political Corruption, Public Opinion, and Citizens' Behaviour
expectations are likely to be influenced by the stringency with which formal political
authorities seek to treat misdemeanour, while greater perceived stringency may link to
lower levels of perceived corruption incidence. Two variables to tap these effect will
be included in both models, one addressing authorities' propensity to catch
perpetrators, another tapping their propensity to punish them after perpetrators have
been caught. 131
Finally, it is interesting to include a variable tapping whether the respondent is
a regular national tabloid or broadsheet reader, or reads no national newspapers. 132 It
is predicted that those who read tabloid newspapers are more inclined to be
censorious and pessimistic over corruption, given the sensationalist way such
newspapers report politics. It is alternatively possible that those who read either type
of paper may be more pessimistic and censorious than those who read neither, as
these respondents are likely to be more in touch with reports of misdemeanour in
public life. Lastly, a dummy will be included which taps whether respondents report
that one of the salient influences on their opinions is television. It is anticipated that
131 Confidence in political misdemeanour being tackled by the authorities will be tapped by recedes of the following questions: a) And how confident do you feel that the authorities will generally uncover wrongdoing by people in public office? And b) And when people in public office are caught doing wrong, how confident do you feel that the authorities will punish them? In both cases the plausible responses, and the codes assigned to them, are: very confident [4], fairly confident [3], not very confident [2], not at all confident [1]. Don't knows have been dropped.132 A categorical variable has been created for this purpose. In regard to the category tapping tabloid readership, respondents have been included if, to the question: Do you read any of these daily newspapers regularly? By that I mean two or more issues a week, they record positive responses to any of these papers: Daily Express, Daily Mail, Daily Mirror, Daily Sport, The Daily Star, The Sun, Daily Record, and/or, to the question: And, do you read any of these Sunday newspapers regularly? By that I mean two or more issues a month on average, they record positive responses to any of these papers: Mail on Sunday, News of the World, The People, Sunday Express, Sunday Mirror, Sunday Post, Sunday Sport. In regard to the category tapping broadsheet readership, the same procedure has been followed, with those who read the following daily and Sunday newspapers included: Daily Telegraph, Financial Times, The Guardian, The Independent, The Times, The Scotsman, The Independent on Sunday, The Observer, Sunday Telegraph, Sunday Times. The base category will be those who do not state that they read any of the above papers; while those who state they read both types of paper have been included in the broadsheet category, as they have access to the better quality journalism in these papers. Note finally that the traditional understanding of the difference between tabloids and broadsheets has been assumed. This has been complicated in the UK by the re-sizing of broadsheet newspapers.
-145-

Political Corruption, Public Opinion, and Citizens' Behaviour
the more vivid and potentially sensationalist way news is reported on television may
also encourage increased censoriousness and pessimism. 133
Before the models are presented, it is briefly appropriate to discuss why
variables tapping political participation and political support will not be included in
the models. For a start, as outlined in the introduction to the thesis, it has been
emphasised that political participation and political support may be important
consequences of perceptions of corruption, rather than determinants. Admittedly,
arguments could be made proposing that the causality runs the other way, particularly
in regard to political support, and we will flesh out and address this latter possibility
in greater depth in Chapter 7, when models specific to political support are predicted.
Yet briefly, one might propose participation may encourage deeper engagement with
politics and more informed perceptions of corruption; support of the incumbent party
may motivate less censoriousness and a more optimistic appraisal of actual levels of
corruption, and non-support may motivate the opposite. So to test for these
possibilities, variables tapping a) participation and b) political support were added to
the final models presented, but were not found to have substantive effects and have
not been included. 134
133 The question this dummy uses is: And thinking about the opinions you've given, which, if any, of these they are based on? (Plus a What else? follow up.) If respondents indicate a positive response to What you see on news programmes on television, they have a value of 1; if they do not, they have avalue of 0.134 The variables added into four exploratory models (two pertaining to each full model presented in Table 5.12 and Table 5.13 below) concerned a) two dummy variables tapping partisanship for the two main British political parties: Labour and the Conservatives (note that the question deriving partisanship is outlined in the two chapters that follow), and b) two scales of extra-institutional and institutional behaviour along with a variable tapping turnout in the 2001 general election (note that these participation variables are outlined fully in the next chapter).
-146-

Political Corruption, Public Opinion, and Citizens' Behaviour
Analysis
The method of examining the determinants of the derived scales will be multivariate
OLS linear regression. The results of models using the defined independent variables
to predict the 'perceived importance of corruption avoidance' scale are presented in
Table 5.12. It comprises three regressions. First, only the socioeconomic and
demographic characteristics are introduced; second, the attitudinal variables are
added; third, and lastly, the full model, including the media-related controls, is
presented.
-147-
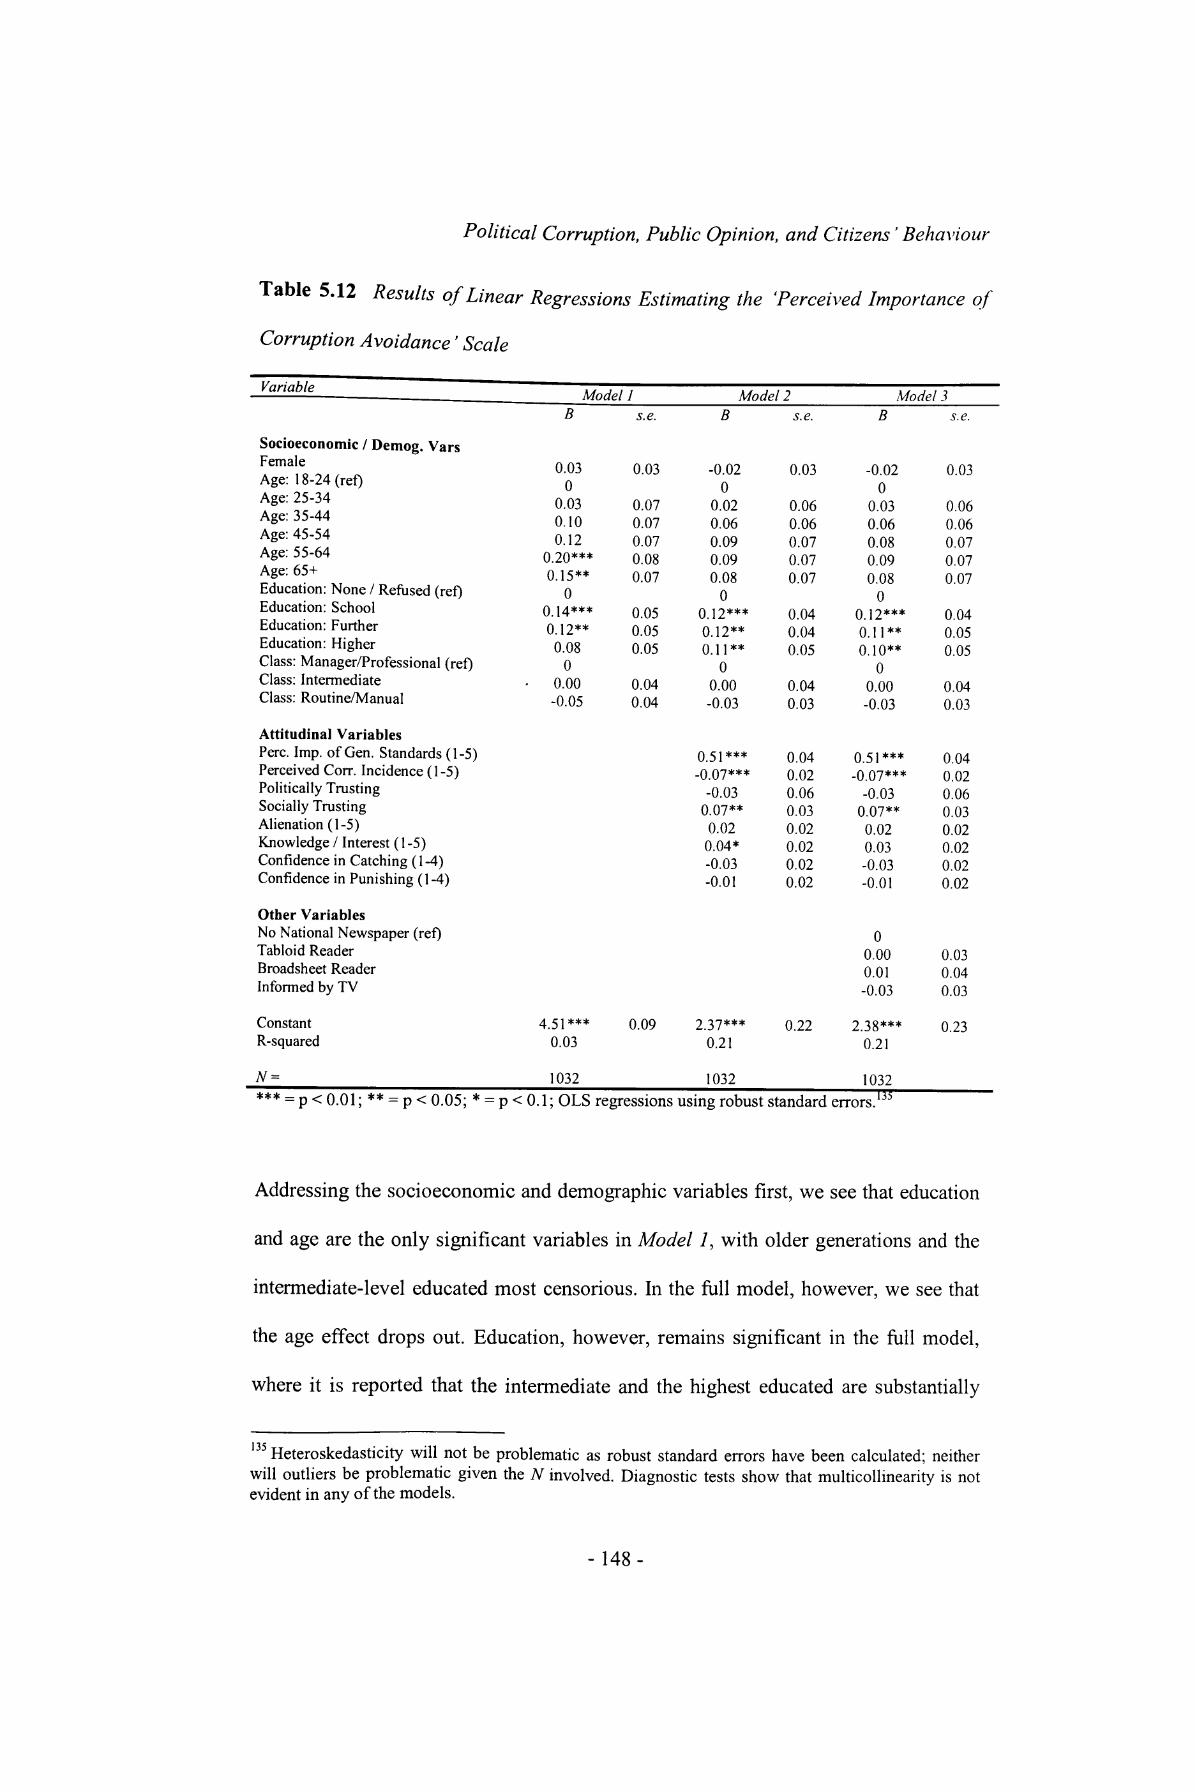
Political Corruption, Public Opinion, and Citizens' Behaviour
Table 5.12 Results of Linear Regressions Estimating the 'Perceived Importance of
Corruption Avoidance' Scale
Variable Model 1 Model 2 Model 3B s.e. B s.e. B s.e.
Socioeconomic / Demog. VarsFemaleAge: 18-24(ref)Age: 25-34Age: 35-44Age: 45-54Age: 55-64Age: 65+Education: None / Refused (ref)Education: SchoolEducation: FurtherEducation: HigherClass: Manager/Professional (ref)Class: IntermediateClass: Routine/Manual
Attitudinal VariablesPerc. Imp. of Gen. Standards (1-5)Perceived Corr. Incidence (1-5)Politically TrustingSocially TrustingAlienation (1-5)Knowledge / Interest (1-5)Confidence in Catching (1-4)Confidence in Punishing (1-4)
Other VariablesNo National Newspaper (ref)Tabloid ReaderBroadsheet ReaderInformed by TV
ConstantR-squared
N =
*** = p < 0.01 ; ** = p < 0.05; * = {
0.030
0.030.100.12
0.20***0.15**
00.14***0.12**0.08
0- 0.00
-0.05
4.51***
0.03
1032X0.1;OLS
0.03
0.070.070.070.080.07
0.050.050.05
0.040.04
0.09
regressions
-0.020
0.020.060.090.090.08
00.12***0.12**0.11**
00.00-0.03
0.51***-0.07***
-0.030.07**
0.020.04*-0.03-0.01
2.37***0.21
1032
0.03
0.060.060.070.070.07
0.040.040.05
0.040.03
0.040.020.060.030.020.020.020.02
0.22
using robust standard
-0.020
0.030.060.080.090.08
00.12***0.11**0.10**
00.00-0.03
0.51***-0.07***
-0.030.07**
0.020.03-0.03-0.01
00.000.01-0.03
2.38***0.21
1032errors. 13'
0.03
0.060.060.070.070.07
0.040.050.05
0.040.03
0.040.020.060.030.020.020.020.02
0.030.040.03
0.23
Addressing the socioeconomic and demographic variables first, we see that education
and age are the only significant variables in Model 7, with older generations and the
intermediate-level educated most censorious. In the full model, however, we see that
the age effect drops out. Education, however, remains significant in the full model,
where it is reported that the intermediate and the highest educated are substantially
135 Heteroskedasticity will not be problematic as robust standard errors have been calculated; neither will outliers be problematic given the TV involved. Diagnostic tests show that multicollinearity is not evident in any of the models.
-148-

Political Corruption, Public Opinion, and Citizens' Behaviour
more censorious of corruption than are the uneducated, possibly because the educated
are better aware of the damaging effects of corrupt practice and the illicit nature of
such behaviour.
Attitudinal variables are shown to go some way in explaining corruption
censoriousness. Indeed, the R-squared increases from 0.03 to 0.21 between Model 1
and Model 2, where we see that first, the perceived importance of general standards is
highly explanatory. Unsurprisingly, those with higher expectations concerning general
standards are more likely to hold high expectations vis-a-vis the avoidance of
corruption. However, contrary to the expectation stated earlier, those that perceive
higher levels of corruption in actual political life are likely to believe that corruption
avoidance is less important. This indicates, perhaps, that respondents who perceive
high levels of corruption in actual political life acclimatise to what they perceive to be
a corrupt environment, and their expectations may lower accordingly. Social trust is
found to have a positive relationship with corruption censoriousness, which may tie to
the notion that among socially trusting citizens, expectations concerning all people in
all jobs are likely to be higher, as people are deemed to be fundamentally honest.
Finally, knowledge / interest in the topics in hand are found to be weakly explanatory
in Model 2, with the more knowledgeable and interested inclined to be more
censorious of corrupt practices. This effect drops out, however, in the final model,
where correlates of knowledge and interest, such as higher age, education, and class,
are controlled for.
The media-related variables appear to have very little explanatory power. This
is perhaps surprising, as it was anticipated that sensationalist reporting, particularly by
tabloid newspapers and television broadcasts, would stimulate considerable
censoriousness of corrupt behaviour, but this does not appear to be the case.
-149-

Political Corruption, Public Opinion, and Citizens' Behaviour
Individuals' levels of censoriousness appear to be independent from the media from
which they receive information about politics, and better related to norms associated
with other attitudes towards politics, and to their level of education.
So how do these results relate to the hypotheses developed earlier? Hypothesis
H2 predicted that socioeconomic and demographic variables would be poor predictors
of censoriousness of corruption, while attitudinal variables would be more
explanatory. To some degree, this hypothesis is supported. Only one socioeconomic
variable, education (categorical), is explanatory in the full model, while three
attitudinal variables are shown to be statistically significant predictors. Nonetheless, it
is notable that rather few variables are overall explanatory. Political distrust and
alienation, for instance, might be expected to lead to political detachment that
dampens expectations of politicians, but this was not found to be the case. Neither
does media sensationalism appear to play a role. Instead, it may be that the norms
feeding into corruption censoriousness are highly individual, not easily explained by
measures of socioeconomic and demographic status or by broader political attitudes.
Furthermore, there is rather little variation in censoriousness among British citizens,
as Table 5.11 shows, which is likely to make it difficult to draw out explanatory
factors.
At this stage we may turn to predicting the determinants of perceptions of
actual levels of corruption in the UK. Table 5.13 outlines the results of linear
regressions. Like the models presented in Table 5.12, Models 1, 2 and 3 will introduce
the socioeconomic / demographic, attitudinal, and media-related variables in stages.
-150-

Political Corruption, Public Opinion, and Citizens' Behaviour
Table 5.13 Results of Linear Regressions Estimating the 'Perceived Corruption
Incidence' Scale
Socioeconomic / Demog. VarsFemaleAge: 18-24(ref)Age: 25-34Age: 35-44Age: 45-54Age: 55-64Age: 65+Education: None / Refused (ref)Education: SchoolEducation: FurtherEducation: HigherClass: Manager/Professional (ref)Class: IntermediateClass: Routine/Manual
Attitudinal VariablesOther Misdemeanour Incid. (1-5)Perc. Imp. of Corr. Avoidance (1-5)Politically TrustingSocially TrustingAlienation (1-5)Knowledge / Interest (1-5)Confidence in Catching (1-4)Confidence in Punishing (1-4)
Other VariablesNo National Newspaper (ref)Tabloid ReaderBroadsheet ReaderInformed by TV
ConstantR-squared
N =
Model 1
0.07 0.050
-0.02 0.11-0.05 0.11-0.17 0.11-0.02 0.12
-0.20* 0.120
-0.14* 0.08-0.08 0.09-0.11 0.09
00.02 0.070.11 0.07
2.59*** 0.130.03
1032
ModelB
0.060
-0.07-0.10
-0.21**-0.09
-0.22**0
-0.06-0.05-0.02
0-0.030.05
0.36***-0.13***-0.14**
-0.05-0.030.02-0.04
-0.13***
2.61***0.22
1032
2
s.e.
0.05
0.100.100.100.100.11
0.070.080.08
0.060.06
0.060.040.060.050.030.040.040.04
0.37
ModelB
0.060
-0.08-0.10
-0.22**-0.11
-0.24**0
-0.06-0.040.00
0-0.030.05
0.37***-0.13***-0.12**
-0.04-0.030.02-0.05
-0.13***
00.17***
0.100.04
2.47***0.23
1032
3s.e.
0.05
0.100.100.100.100.11
0.070.080.08
0.060.06
0.060.040.060.050.030.040.040.03
0.050.060.05
0.37
*** _= p < 0.01; ** = p < 0.05; * = p < 0.1; OLS regressions using robust standard errors.
Model 1 reveals that socioeconomic and demographic characteristics, when regressed
alone against perceived corruption incidence, have little explanatory power. Although
two categories in the education and age variables are statistically significant, this is
only at the 10% level and this does not appear indicative of an overall pattern.
Interestingly, however, age appears more significant in the final regression, when two
136 Again, neither heteroskedasticity, nor outliers, nor multicollinearity, are troublesome in these models.
-151 -
Political Corruption, Public Opinion, and Citizens' Behaviour
of the three eldest age categories are shown to perceive less corruption than do the
other age categories. Older people are perhaps less quick to believe their politicians
are corrupt, which in the British case (where, objectively, corruption is likely to be
limited in extent) may link to older citizens being more politically engaged and
patient in their assessment of public servants. This finding nonetheless seems
anomalous in being revealed in the final model but not the partial one. Yet from
exploratory work, the reason for this seemingly peculiar result is revealed. The same
statistically significant effects of age show up when only one attitudinal variable, the
perceived 'other misdemeanour incidence' scale, is added to Model 1. Consider at this
point that descriptive statistics show that older individuals tend to perceive less
corruption, but more 'other misdemeanour' than younger groups. Consequently, in the
under-specified Model 1, the inverse relationship between the older age groups and
perceived corruption is not drawn out because greater age proxies higher perceived
'other misdemeanour', which is highly positively related to perceived corruption. As
age effectively proxies this effect, it cancels out its own negative effect. Hence, when
'other misdemeanour incidence' is controlled for, the age effects are drawn out. 137
Moving on, the attitudinal variables display several statistically significant
effects that are consistent across Model 2 and Model 3. Perceiving misdemeanour in
public life generally is associated with higher perceived corruption, which we
expected. We also find that less censoriousness ties to higher perceived incidence.
This may indicate that those who expect less of their politicians are rather resigned to
the idea of corruption in politics, and this pessimism may carry over into higher
perceived corruption incidence. Political trust is negatively related to perceived
137 Why the 55-64 age group does not predict less corruption as the other older age groups do remains uncertain, however. Perhaps the insecurities of retirement incline individuals in this age bracket to become suspicious of politicians: indeed, this group also has a lower mean score on the political trust variables too.
-152-
Political Corruption, Public Opinion, and Citizens' Behaviour
corruption incidence, as we expected. Unsurprisingly too, those who lack confidence
in the authorities punishing public servants who commit malpractice tend to perceive
higher levels of corruption, a finding that is congruent with a national level finding
mentioned in Chapter 2, that rule of law correlates well with lower levels of
corruption.
Turning to the media-related variables, tabloid readers are, as anticipated,
inclined to perceive higher levels of corruption than those that do not read tabloids, a
reflection, perhaps, of the sensationalist way politics is reported in such newspapers
and the ostentatiously cynical way politicians linked to malpractice might be
1 •> o
presented. However, this is a relatively small effect, and neither broadsheet
readership, nor citing television as a key influence on responses, has an equivalent
effect.
So how should we consider these results more broadly? Recall first that
hypothesis H3 predicts that socioeconomic and demographic factors are less
explanatory of perceived corruption incidence than are attitudinal factors. This
expectation is based on several grounds. Previous studies have shown contradictory
findings concerning socioeconomic factors; social divisions in the UK are less
prominent than in other nations, and hence may not proxy groups of 'winners' and
'losers' from corruption or mark faultlines across which perceptions of corruption
differ; and the testing of theories of a related attitude, political trust, suggest that it is
rational assessment of institutions, rather than socialisation grounded in
socioeconomic roots, that is explanatory.
138 Yet, as the Survey of Public Attitudes towards Conduct in Public Life report indicates, it is interesting that tabloid journalists themselves are deemed highly untrustworthy by many respondents - even by tabloid readers, yet it is simultaneously found that tabloid newspapers are highly influential in determining these readers' perspectives (BMRB, 2004, p. 27).
-153-

Political Corruption, Public Opinion, and Citizens' Behaviour
Our results seem to support hypothesis H3. The only pertinent effect of a
socioeconomic or demographic factor involves age, and this is drawn out only when
other misdemeanour incidence is controlled for. Gender, education, and class do not
appear to have robust explanatory power. In contrast, attitudinal effects are found to
be more explanatory. Perceiving other misdemeanour by public servants, expecting
less of them (probably due to this proxying resignation to the incidence of corruption),
distrusting them, and believing that in the event of their being caught for wrongdoing
they are unlikely to be punished, are all good predictors of high levels of perceived
corruption among British citizens.
Summary of Findings and Discussion
The central aim of the chapter has been to test three hypotheses pertaining to the
nature of citizens' perceptions of the censoriousness and extent of corruption in
Britain. We sought to see how far perceptions of corruption differed from perceptions
of other forms of impropriety, and to determine whether it is socioeconomic and
demographic or attitudinal explanations that better determine two key orientations:
corruption censoriousness, and the degree to which corruption is perceived to occur in
reality in British politics.
Let us tie together the key findings of this chapter. First, to lay the basis for
further analysis, we analysed descriptive statistics concerning perceptions of
corruption, finding that citizens have significant expectations concerning the
avoidance of bribery, and to a slightly lesser extent the avoidance of the misuse of
power for private gain, and to a lesser extent again, the avoidance of favouritism. We
revealed that citizens are somewhat more stringent in their expectations concerning
-154-
Political Corruption, Public Opinion, and Citizens' Behaviour
elected officials than unelected officials. In regard to perceptions of the actual
incidence of corruption, bribery is perceived to occur infrequently, though the
majority of citizens believe at least 'a few' politicians engage in it. The misuse of
power for private gain is reckoned to occur more frequently, and favouritism more
frequently still.
To more directly test the hypotheses under consideration, we then used factor
analysis, finding that the key items pertaining to 'corrupt' acts, in contrast to those
relating to other misdemeanour including dishonesty, lack of openness,
unscrupulous behaviour in private life, and incompetence consistently represented
an independent factor, giving weight to the notion that citizens think about corruption
differently than they do other forms of impropriety in public life. Scaling the relevant
variables and observing their mean scores suggest that this difference in orientations
is owed to two key beliefs: first that the avoidance of corrupt acts is more important
than the avoidance of other misdemeanour, in essence that corruption is viewed more
censoriously; second that corrupt acts are perceived to be less prevalent in British
public life than are other forms of misdemeanour.
The prediction of the determinants of scales of censoriousness towards
corruption and of levels of perceived corruption incidence has indicated that these
items are poorly explained by socioeconomic and demographic characteristics of
respondents in contemporary Britain. This, it may be argued, is explained by
corruption's limited impact in the UK. Corruption benefits some, while others lose out,
and the divide between winners and losers may well congregate within socioeconomic
divides. In terms of financial corruption, for example, the elite high powered
businessmen and politicians are likely to be those who 'win' from corruption. It
follows that in Britain, low 'objective' levels of corruption means its impact on
-155-
Political Corruption, Public Opinion, and Citizens' Behaviour
equality among citizens is mild, which may in turn make social divisions poor
predictors of corruption censoriousness and perceived levels of corruption. This
argument may also help explain the contradictory effects of some socioeconomic
divisions found in countries with greater corruption. In some cases poorer citizens
may be censorious as they lose out from corruption among the elite, for example, but
in other cases scrupulous, legitimately rich citizens may be more censorious as they
may operate in elite circles and understand the impropriety of others' corrupt
behaviour better. In the case of the UK, however, attitudinal variables are shown to be
better predictors of perceptions concerning corruption, along with tabloid newspaper
readership in the case of perceived corruption incidence.
Some of this work links to, and shed lights on, a wider literature. In the
introductory sections of this chapter, work on political trust by Mishler and Rose
(2001) was cited, and was argued to present a useful synopsis of two competing
explanations for how orientations concerning trust in public servants emerge. The first,
a 'cultural' school, suggests political trust is a product of processes of socialisation,
which can vary according to socioeconomic and demographic differences. The second,
an 'institutional' school, suggests that political trust is a function of citizens rationally
evaluating the performance of political institutions.
It seems reasonable that both corruption censoriousness and perceived
corruption incidence are orientations equivalent to political trust, at least in terms of
how they might originate. We may learn that corruption is bad or something to be
tolerated, and something that is limited or very widespread, from processes of
socialisation; or we might develop these orientations based on the evaluation of the
performance of politicians and the political institutions in place. Hence a 'cultural'
interpretation of how individuals develop different perspectives on corruption would
-156-
Political Corruption, Public Opinion, and Citizens' Behaviour
emphasise heavily the importance of socialisation, which in turn links to
socioeconomic and demographic variables. For instance, socialisation in past
generations amidst a political climate in which corruption was widespread may induce
individuals of a certain age to consistently report higher 'perceived corruption
incidence' when compared to individuals of other ages. Socialisation in poor families,
meanwhile, who might have lost out from economic policies, may lead individuals to
have misgivings over politicians which might lead to much greater censoriousness.
Meanwhile, an 'institutional' interpretation would reject these claims, and suggest that
perceived corruption incidence is likely to tie more strongly to attitudinal variables -
particularly rational evaluation of institutional performance.
Hence the findings that socioeconomic variables were largely non-significant,
and that attitudinal variables better explained corruption censoriousness and perceived
corruption incidence, suggests that an 'institutional' approach to perceived corruption
fits better than a 'cultural' approach. It is reasonable to propose such attitudes reflect
rational evaluation of institutions, and that these attitudes affect levels of corruption
perceived in British public life. Indeed, if you believe that institutions fail adequately
to punish wrongdoers, it is perfectly reasonable to believe levels of corruption are
considerable, as politicians and public servants have less incentive not to engage in
corrupt practice. This result is shown in Table 5.13. However this overall conclusion
should be made with a certain degree of caution: although attitudinal factors seemed
to better explain orientations of corruption than did socioeconomic variables, the
strongest explanatory variable in each case related to scales of similar attitudes, but
directed towards other forms of impropriety. Furthermore, not all the attitudinal
variables are explanatory, and the R-squared exhibited by the models shows there is
considerable variation among the attitudes that our defined variables cannot predict.
-157-
Political Corruption, Public Opinion, and Citizens' Behaviour
A further point is that the finding that tabloid readership has a small effect on
perceived corruption incidence illustrates that media influence on perceptions of
institutional performance is also salient, which may or may not be deemed 'rational'.
It is rational if we conceive of citizens as responding reasonably to the information
they are given via such media. It is not rational if we go further and suggest that it
would be reasonable for citizens to be wary of the sensationalist way impropriety in
public life may be reported by tabloid newspapers. Yet whether rational or not, the
same theme applies: citizens are responding to information; they are not simply
relying on orientations learnt during socialisation processes.
Yet this conclusion overall fits with the previously ventured explanation that
the limited impact of corruption on specific social divisions contributes to the lack of
explanatory power of socioeconomic and demographic variables. With increased
impact of corruption on social divisions, it is possible that socialisation could become
more important, as a divided society in which some groups are particularly affected
by corruption would result in more pronounced and distinct sub-cultural groups with
unique processes of socialisation. This could be reflected by different socioeconomic
and demographic strata exhibiting significantly different perceptions of corruption,
but this was not, from our analysis, the case.
What emerges instead, therefore, is a picture of considerable citizen
sophistication. British citizens seem well able to disentangle corruption from other
forms of impropriety, in terms of both their perceptions on the seriousness of corrupt
behaviour, and on the extent to which corruption exists in reality. They also appear to
base these orientations more on evaluation of institutions and elite actors, rather than
prejudices derived from socialisation. This is heartening, as it implies that politicians
are not immune from well-informed citizen orientations concerning their
-158-
Political Corruption, Public Opinion, and Citizens' Behaviour
unscrupulous behaviour. We can now raise the question, then, of how far such
perceptions, operationalised following factor analysis and scale construction in a more
sophisticated manner than the equivalent perceived corruption items in cross-national
analysis, explain participation in the British case.
-159-
Political Corruption, Public Opinion, and Citizens' Behaviour
Chapter 6. Perceived Corruption and British Citizens'
Behaviour
Introduction
In this short chapter we will test whether perceived corruption has an effect on
political participation in the UK. In the cross-national analysis of Chapter 4, it was
found that perceived corruption, measured via single item survey questions, had very
little explanatory power on items of participation other than turnout, and even with
turnout the contextual effect of national level corruption had an equivalently strong
effect. A contextual effect was also found in regard to extra-institutional behaviours,
and displayed important nonlinear effects. Yet testing whether perceived corruption in
the British case is able to explain political participation is important because of the
nuances of the specialist BMRB data at our disposal. First, the perceived corruption
variable we are using has undergone rigorous analysis in the previous chapter; found
to be a coherent factor when set against other forms of misdemeanour. Second, the
specialist data available in the British case enables us to control for other standards-
related variables. Thus this case study chapter will be of substantive use in testing the
robustness of the results found in cross-national analysis, and allows us to analyse a
more nuanced dataset.
In general, perceived corruption has not been considered as important in
promoting or dampening participation in Great Britain. Rather, party identification
has been found to be salient in promoting turnout, and partisanship has been argued to
interact with marginality to prompt voting in the UK (Evans, 2003). Meanwhile the
-160-

Political Corruption, Public Opinion, and Citizens' Behaviour
perceived salience of the election (such as its competitiveness), perceptions of parties'
past and anticipated future performances, and campaign-related factors have been
found to link to the turnout calculus (Clarke et al, 2004; Pattie and Johnston, 1998). In
regard to participation outside of the electoral arena in Britain, party centrism has
been proposed as a motive. If parties have highly similar policies, citizens may seek to
find constituencies for issues as parties fail to adopt a strong or distinct line (Evans,
2003). It is important, however, that the inability of socioeconomic and institutional
factors to fully explain recent decreases in general election turnout in Britain is also
acknowledged (Evans, 2003; Pattie and Johnston, 1998; Clarke et al, 2004). With
regard to standards-related variables, opinion seems mixed. Although Peele (2004)
suggests the detrimental effect of 'sleaze and corruption' may have contributed to
political distrust that has decreased political participation over time, Curtice and
Jowell (1995) and Evans (2003) argue that political distrust, of which 'sleaze' is a
component, has a very limited impact on political participation.
Although in this chapter we seek to use nuanced data to sophisticate our
understanding of the effects of perceived corruption, it is prudent to use the findings
of the cross-national analysis as a basis to form our initial expectations. As the models
to be presented here are country-specific, and, consequently, will not make use of
national level indicators, results involving the Corruption Index are clearly not
relevant but results involving perceived corruption at the individual level are. Chapter
4 showed that perceived corruption stimulated a lower propensity to vote, congruent
with the argument that perceiving greater corruption undermined faith in political
institutions and prompted less willingness to engage in electoral participation.
However perceived corruption had little substantive impact on propensity to engage
extra-institutional behaviour.
m
-161-

Political Corruption, Public Opinion, and Citizens' Behaviour
As the data available enables us to predict the determinants of institutional
behaviour generally alongside turnout, and in line with the theoretical basis
established in Chapter 3, whereby institutional behaviour was argued to be dampened
by perceiving considerable levels of corruption, we may hypothesise that precisely
this effect will be drawn out in these case study models. Unfortunately, no equivalent
general variable tapping institutional participation was available for use in the cross-
national chapters. We can also assume that congruent with the cross-national analysis,
perceived corruption will not be a good determinant of extra-institutional behaviour.
Thus the following hypotheses may be tested:
HI: Greater perceived corruption mil predict lower turnout.
H2: Greater perceived corruption will predict lower institutional behaviour.
H3: Greater perceived corruption will have little effect on propensity to engage in
extra-institutional political participation.
Data and Methods
In terms of data, we will deploy the BMRB dataset used in Chapter 5. It is once again
important to state the advantages of the BMRB dataset. It is the first comprehensive
dataset to cover the themes of interest in this case study, and its wealth of variables
pertaining to political participation and political support makes its use justifiable. It is
also preferable to use the BMRB dataset rather than just the British sample in the
CSES module 2 dataset used to predict turnout in Chapter 4. From the BMRB dataset
-162-
Political Corruption, Public Opinion, and Citizens' Behaviour
we have drawn out a more nuanced perceived corruption variable alongside other
standards related variables that can be used as controls. Although the CSES module 2
dataset, like the WVS wave 3, has been highly useful in cross-national modelling, its
perceived corruption variable is cruder than the scales we have developed from the
BMRB data in previous chapters. Ultimately this choice of data indicates a trade-off
in data choice that has been evident through this thesis. There has been a necessary
reliance on cruder perceived corruption variables when undertaking large-scale cross-
national analysis from which we can draw broader generalisations. Yet we have the
ability to use more nuanced perceived corruption variables and controls in the smaller
domain of the British case study.
Thus it is necessary to define variables in the BMRB dataset that pertain to
turnout, institutional participation, and extra-institutional participation. Fortunately,
the survey includes a spread of questions which enable the inclusion of these forms of
political participation. Turnout is tapped simply, when respondents are asked:
Did you vote at the last general election in 2001?
Turnout can thus be modelled as a binary dependent variable using logistic regression.
Other behaviours can be tapped from other options following up the question
of what respondents had done over the previous 12 months. In Table 6.1, these items
are listed, along with the classification they have been given and a brief explanation
139for why they have been classified this way.
139 The exact wording of the activities has been abbreviated, but their essential meaning remains the same.
-163-

Political Corruption, Public Opinion, and Citizens' Behaviour
Table 6.1 Classifying the Participatory Activities Asked About in the BMRB Dataset
Behaviour Institutional Explanation or Extra- Institutional?
Contacted local councillor
Contacted MP / devolved assembly representative
Contacted public official in council
Contacted public official in central or devolved government
Attended public meeting
Contacted representative in London assembly
Contacted public official in London assembly
Taken part in protest / demonstration
Signed petition
Joined boycott
Institutional
Institutional
Institutional
Institutional
Institutional
Institutional
Extra- Institutional
Extra- Institutional
Extra- Institutional
Involves contact with individual who works for a political institution
Involves contact with individual who works for a political institution
Involves contact with individual who works for a political institution
Involves contact with individual who works for a political institution
Likely to involve contact with elected representatives or take place in 'official' surroundings 14°
Institutional Involves contact with individual who works for a political institution
Involves contact with individual who works for a political institution
Activity does not take place within arena of a political institution
Activity does not take place within arena of a political institution
Activity does not take place within arena of a political institution
Of these behaviours, we may omit the items pertaining specifically to contacting
representatives in the London, as this is likely not to be applicable to the respondents
living outside London (and, indeed, very few respondents offer positive responses).
We thus define five applicable institutional behaviours, and three extra-institutional
140 Classifying 'public meetings' is difficult due to the vagueness of the term. It might refer to meetings chaired or organised by elected officials in the confines of, for example, a town hall, which is an institutional form of participation. However, respondents might interpret the term 'public meetings' more broadly, and include less official meetings organised by individuals not connected to any political institution. It will, however, be classified as an institutional form of participation due to the likelihood of elected officials at least being in attendance to hear citizens' opinions and objections.
-164-
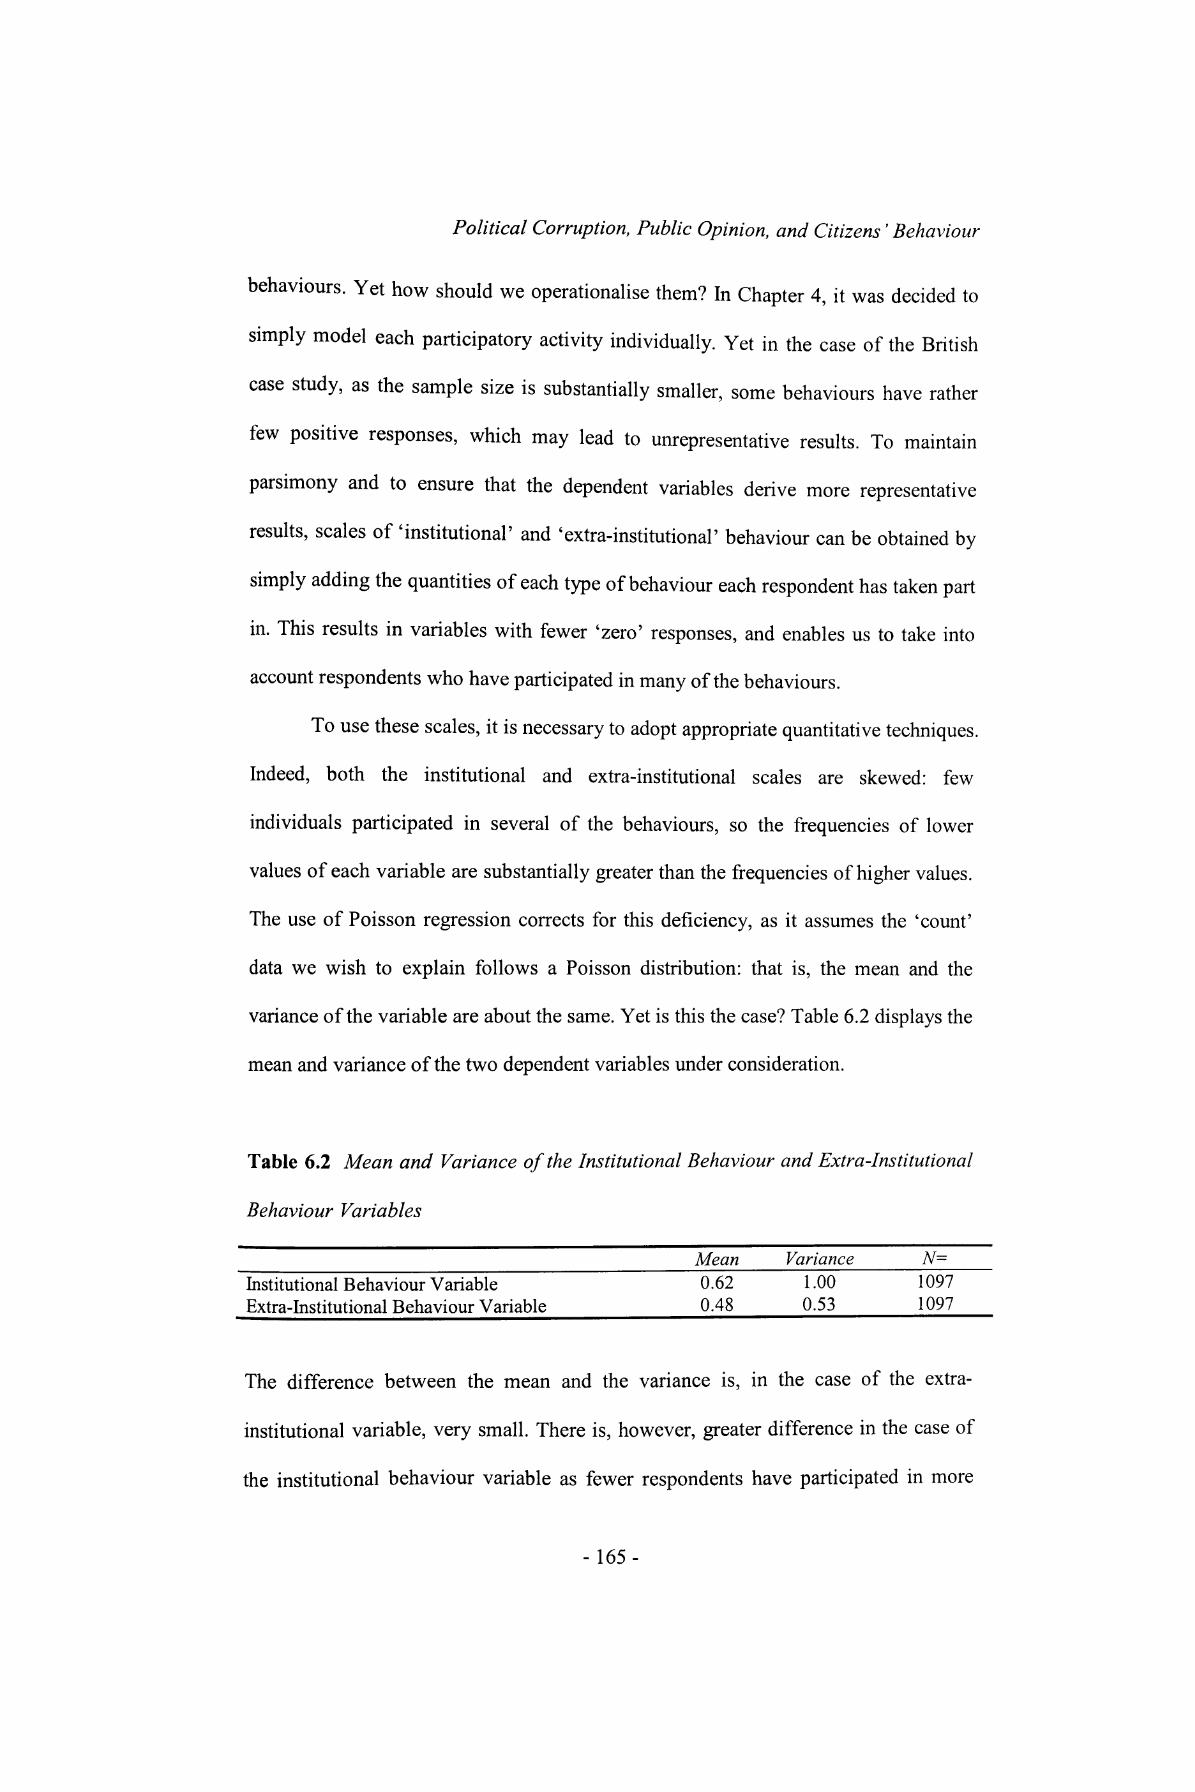
Political Corruption, Public Opinion, and Citizens' Behaviour
behaviours. Yet how should we operationalise them? In Chapter 4, it was decided to
simply model each participatory activity individually. Yet in the case of the British
case study, as the sample size is substantially smaller, some behaviours have rather
few positive responses, which may lead to unrepresentative results. To maintain
parsimony and to ensure that the dependent variables derive more representative
results, scales of 'institutional' and 'extra-institutional' behaviour can be obtained by
simply adding the quantities of each type of behaviour each respondent has taken part
in. This results in variables with fewer 'zero' responses, and enables us to take into
account respondents who have participated in many of the behaviours.
To use these scales, it is necessary to adopt appropriate quantitative techniques.
Indeed, both the institutional and extra-institutional scales are skewed: few
individuals participated in several of the behaviours, so the frequencies of lower
values of each variable are substantially greater than the frequencies of higher values.
The use of Poisson regression corrects for this deficiency, as it assumes the 'count'
data we wish to explain follows a Poisson distribution: that is, the mean and the
variance of the variable are about the same. Yet is this the case? Table 6.2 displays the
mean and variance of the two dependent variables under consideration.
Table 6.2 Mean and Variance of the Institutional Behaviour and Extra-Institutional
Behaviour Variables
Mean___Variance_____N=Institutional Behaviour Variable 0.62 1.00 1097 Extra-Institutional Behaviour Variable___________0-48_____0-53______1°97
The difference between the mean and the variance is, in the case of the extra-
institutional variable, very small. There is, however, greater difference in the case of
the institutional behaviour variable as fewer respondents have participated in more
-165-
Political Corruption, Public Opinion, and Citizens' Behaviour
than one activity, yet it will be deemed sufficient for analysis using Poisson regression.
The Poisson regression equation is:
log// = /7o + p\X\ + ^2X2
Where Xi are the independent variables, /?/are the coefficients, eis the error term,
and ju represents the expected value of the 'count' variable displaying a Poisson
distribution (Agresti, 1996).
The most important independent variable to be included in the models is the
'perceived corruption incidence' scale. 141 To ensure that this variable specifically taps
perceived corruption and not other perceived inadequacy in government, the 'other
misdemeanour incidence' scale will also be included, along with the 'perceived
importance of corruption avoidance' scale - or censoriousness, as this controls for the
extent to which each individual believes corruption is a detrimental phenomenon; in
other words, how much corruption matters to them.
The demographic and socioeconomic control variables to be included in the
models will be gender, age, education, and class. As socioeconomic and demographic
variables are not the key variables under analysis (as they were in the case of the last
chapter) they have been simplified to make the models more parsimonious and
congruent with the models of political participation included in Chapter 4. 142
141 This variable and all the other variables mentioned are, unless otherwise stated, the variables derived in Chapter 5 and used in the models predicting censoriousness towards corruption and perceived incidence of corruption in the UK.142 More specifically, the gender and class variables have been coded exactly as they were in Chapter 5, however age has been simplified into a three category rather than a six category variable, and now divides between ages 18-34 (reference), 35-54, and 55+. Education has also been receded to make it equivalent to the education variable included in the models of political participation in Chapter 4, dividing simply between those that have received a secondary school education (i.e. those with at least some O-Level or GCSE grades), and those that have not.
-166-
Political Corruption, Public Opinion, and Citizens' Behaviour
Justification for these variables' inclusion in models of political participation has
already been outlined in previous chapters and will not be repeated here.
The remaining variables to be included in the models will be knowledge /
interest in the issues in hand, which would presumably motivate greater political
activity. Citizens that are better informed and interested in standards issues are likely
to be more politically engaged. Furthermore, social trust will be included to satisfy the
notion increased social capital (of which social trust is a component) stimulates civic
activity and political participation. Lastly, satisfaction in government, an important
variable in the models of political participation in Chapter 4, is unfortunately not
available for inclusion in these case study models. To proxy this, however, support for
the party in office (Labour) will be controlled for. This will simply consist of a binary
variable dividing between those that indicate Labour (1) and those that do not (0),
when asked the following question:
Do you generally think of yourself as a little closer to one of the political parties than
the others?
Satisfaction in government is more likely among Labour supporters than among non-
supporters. Indeed, using CSES Module 2 data pertaining to the 2005 British General
Election, we see that over 90% of Labour voters believe the government has done a
very good or good job. Among non-Labour voters, this figure falls to about 40%.
-167-

Political Corruption, Public Opinion, and Citizens' Behaviour
Analysis
We may now estimate the logistic model pertaining to turnout and the two Poisson
regressions, which pertain to the institutional and extra-institutional variables we have
defined. The results are presented in Table 6.3.
Table 6.3 Logistic and Poisson Regressions to Predict Political Participation in
Britain
Variable Model 1: Turnout (Logistic)
Model 2: Inst. Behaviour (0-5) (Poisson)
Model 4:Extra-Inst. Behaviour
(0-3) (Poisson)B s.e. B s.e. B s.e.
Standards-Related VariablesPerceived Corruption (1-5)Perc. Imp. of Corr. Avoidance (1-5)Other Misdemeanour Inc. (1-5)
Socioeconomic / Demog. VarsFemaleAge: 18-34(ref.)Age: 35-54Age: 55+Secondary School EducationClass: Manager/Professional (ref.)Class: IntermediateClass: Routine/Manual
-0.03-0.06-0.16
0.43**0
1.18***1.85***
0.240
-0.15-0.41*
0.120.170.15
0.18
0.200.250.22
0.250.22
0.04 0.05 -0.04
0.060
0.46*** 0.53*** 0.53***
0-0.21
-0.33**
0.070.120.08
0.10
0.150.160.15
0.130.13
0.12** 0.08 0.06
0.43***0
0.03-0.18
0.52***0
-0.18 -0.43***
0.060.120.08
0.09
0.110.130.17
0.120.12
Other VariablesSocially TrustingKnowledge / Interest (1-5)Labour Party Supporter
ConstantR-Squared
N=
0.170.50***0.82***
-1.270.15
1017
0.190.130.24
1.00
-0.080.71***-0.30**
-3.81***-
1055
0.110.070.12
0.70
-0.130.53***-0.20*
-3.82***-
1055
0.100.070.12
0.59
*** = p < o.Ol; ** = p < 0.05; * = p < 0.1; uses robust standard errors.
143 It was considered that an additional variable may also be explanatory in these models: an interaction term pertaining to perceived corruption and the perceived importance of corruption avoidance, on the basis that those who perceive extensive corruption and are also highly censorious of it may exhibit particularly strong propensities to act in certain ways. Yet when this variable was added individually to the models predicted, it failed to have a substantive effect in each case. In terms of diagnostic tests, the considerable N makes outliers unproblematic. Due to the specification of the models, it was not possible to test for multicollinearity directly; however exploratory work (finding pairs of variables that were closely correlated and experimentally omitting one of them to see if their effects changed) revealed that it is not problematic. Finally, note that the models were predicted using the design weight included in the dataset.
-168-

Political Corruption, Public Opinion, and Citizens ' Behaviour
The two Poisson regressions are particularly difficult to interpret. In Poisson
regression, a coefficient shows the impact of a one unit change in the independent
variable on the log of the expected value of the 'count' variable displaying a Poisson
distribution. As this is difficult to intuitively grasp, we may also predict the marginal
effects associated with each independent variable. These effects pertain to the
predicted increase in the number of political behaviours associated with a) a one-unit
increase in a continuous variable at their mean; or b) in the case of a binary
independent variable, the score moving from 0 to 1. They are shown in Table 6.4.
Table 6.4 Marginal Effects Associated With Poisson Regressions to Predict
Institutional and Extra-Institutional Participation
Variable
Standards-Related VariablesPerceived Corruption (1-5)Perc. Importance of Corr. Avoidance (1-5)Other Misdemeanour Incidence (1-5)
Socioeconomic / Demographic VariablesFemaleAge: 18-34(ref.)Age: 35-54Age: 55+Secondary School EducationClass: Manager/Professional (ref.)Class: IntermediateClass: Routine/Manual
Other VariablesSocially TrustingKnowledge / Interest (1-5)Labour Party Supporter
Initial Number of Predicted Behaviours
Model 5: Institutional Behaviour
dy/dx
0.020.02-0.02
0.030
0.24***0.28***0.23***
0-0.10*
-0.16***
-0.040.34***-0.13***
0.49
s.e.
0.030.060.04
0.05
0.080.090.06
0.050.06
0.050.040.05
Model 6: Extra-Institutional
Behaviourdy/dx
0.05**
0.030.03
0.18***
00.01-0.070.19
0-0.07
-0 17***
-0.050.22***-0.08*
0.41
s.e.
0.030.050.03
0.04
0.050.050.05
0.040.05
0.040.030.04
= p<0.01; ** = p<0.05; * =
-169-

Political Corruption, Public Opinion, and Citizens' Behaviour
Turning to control variables first, we find, interestingly, that females are more
inclined to engage in extra-institutional participation. This runs against a good deal of
the established literature (Norris, 2002) and implies that British women are more
politically mobilised when it comes to activity out of institutionalised settings.
Meanwhile, age is strongly correlated with increased propensity to turnout (congruent
with Norris, 2004, and Norris, 2002) and increased propensity to engage in
institutional behaviour; however there is no age effect significant in explaining extra-
institutional behaviour. Class has some effect. In line with Verba et al (1978) we
might expect those in lower social strata to be substantially less inclined to participate
compared to those in higher strata. This effect is observed to a certain extent, because
in each model the routine / manual class is less likely, when compared to the manager
/ professional class, to participate at a level that is statistically significant. However
this effect is significant at only the 10% level in the case of turnout, and, surprisingly,
there is no statistically significant difference between the manager / professional class
and the intermediate class in their relative propensities to partake in any of the
behaviours.
Social trust exhibits very little effect, which is contrary to the argument that
trust encourages greater social capital and thus civic activism. Meanwhile knowledge
and interest in the topics in hand is, unsurprisingly, highly related to participation
across the models. Finally, Labour Party support predicts higher turnout, as citizens
presumably have an incentive to register their partisanship. Labour members also tend
to have lower scores in the institutional and extra-institutional participation scales, an
indication perhaps, that satisfaction with the incumbent government acts to dampen
impetus to engage in political activism. This is, indeed, encouraging for the
-170-
Political Corruption, Public Opinion, and Citizens' Behaviour
specification of the models, given that Labour Party support is used here as a proxy
for satisfaction in government.
Yet our key focus is on the standards-related variables, and particularly
perceived corruption. We see first that turnout and institutional participation are
unrelated to the perceived corruption scale, results that find hypotheses HI and H2 to
be unsupported. This is contrary to the expectations derived from Chapters 3 and 4,
whereby antipathy towards political elites and institutions were deemed to be likely to
reduce incentives to participate in behaviour involving electoral and other political
institutions. So why, in the British case, and using the BMRB data, is this effect not
evident?
One possibility is that in Britain, the 'objectively' limited amount of political
corruption means that even if corruption is perceived to be substantial, this is not
necessarily a perception that lends itself towards disdain for political institutions, and
thus fails to discourage behaviour that involves them. Rather, individuals perceiving
significant corruption in the UK may base this belief on a few 'bad apples' engaging
in corrupt activity. It might not be a consequence of institutional inadequacy or
failure. 144
Moreover, as the over-riding conclusion of Chapter 4 concerned the
importance of context over perceptions (which had just as large an effect as
perceptions in the case of turnout, and far larger effects than perceptions in the case of
extra-institutional behaviours) we might see this result as supporting the basic
144 It may be, however, that this is something that could have changed over time, or may change in the future. One might speculate that the Conservative government of the 1990s, implicated by many incidences of sleaze, might have motivated citizens to see corruption (or misdemeanour at the very least) as entrenched. On this basis, it would be helpful in years ahead to use subsequent datasets which tap standards perceptions to examine their potential to explain citizens' institutional participation against the backdrop of different governments.
-171-
Political Corruption, Public Opinion, and Citizens' Behaviour
principle that perceived corruption does not centrally matter for participation, but
contextual comparison does. 145
Turning back to the results in Tables 6.3 and 6.4, perceived corruption does
appear to affect extra-institutional political participation, a finding which initially
challenges hypothesis H3. Table 6.4 tells us that, holding other factors constant, if the
perceived corruption scale increases by one at its mean, then we may predict an
individual to participate in 0.05 'more' of an extra-institutional behaviour. Thus if this
marginal effect is assumed to hold across the perceived corruption variable as a whole,
then moving from very low perceived corruption (1) to very high (5) derives an
increase in the predicted number of extra-institutional behaviours the individual
participates in, equivalent to 0.2 of a behaviour overall. But as with the cross-national
analysis, though we see that the perceived corruption variable is statistically
significant in explaining extra-institutional behaviour, the strength of the effect is
actually very weak. As we move from the highest to the lowest possible perceived
corruption scores, we gain only 'one-fifth' of a behaviour, which, though necessarily
abstract, is clearly not a very considerable increase. This is congruent with the cross-
national findings in Chapter 4 and supports hypothesis H3. 146
145 Nonetheless the difference between these results, and the cross-national findings creates two worries. First, because of the more nuanced specification of the BMRB-based models and the inclusion of perceived 'other misdemeanour' and censoriousness, it may be suggested that in Chapter 4, the significance of perceived corruption in predicting lower turnout across nations using CSES data is spurious, and may simply represent perceptions of standards more broadly. Yet we also see in the model of turnout using BMRB data in Table 6.3 that 'other misdemeanour' is also insignificant, and exploratory work shows it remains so when we omit a) perceived corruption; b) censoriousness; and c) both perceived corruption and censoriousness. Therefore this worry seems unfounded. The second worry is that that the null result with the BMRB data may relate to the fact we control for censoriousness, whereas in the CSES-based model of turnout, which shows perceived corruption to be significant, we do not, and thus needed to control for censoriousness in cross-national work. But again, from exploratory work, when we omit censoriousness from the BMRB-based model of turnout (and indeed other misdemeanour both individually and with censoriousness also omitted) perceived corruption fails to be statistically significant in each case.146 It was considered that in line with the theoretical expectations postulated but not found to be correct in Chapter 4, perceived corruption and extra-institutional behaviour might actually have a nonlinear effect, and this was tested by including perceived corruption as a squared term, yet it, and the unsquared term, failed to be explanatory.
-172-
Political Corruption, Public Opinion, and Citizens' Behaviour
Hence, overall, the cross-national results of Chapter 4 which related to the
effects of perceived corruption are reflected in the case-study of the UK, despite our
ability to use more nuanced data, enabling controls for corruption censoriousness and
for other perceived misdemeanour. The most directly comparable results concern
extra-institutional behaviour. Perceived corruption predicts such participation at
statistically significant levels, but its impact is actually very weak. And although
perceived corruption is not explanatory in the British case in regard to turnout and
institutional participation, whereas in the cross-national model of turnout it was, this
serves to add to the central argument of Chapter 4 that it is overall contextual
corruption, rather than perceived corruption, that helps explains citizens' political
participation. The statistical insignificance of perceived corruption regarding turnout
and institutional behaviour in the British case may also relate to the idea citizens
associate corruption not with systemic, institutional features of the political system,
but with 'bad apples' among public servants.
We may now move on to see how perceived corruption and national level
corruption affect another important dependent variable, political support, drawing in
analysis of both British and cross-national data.
-173-

Political Corruption, Public Opinion, and Citizens ' Behaviour
Chapter 7. Political Corruption, Perceived Corruption, and
Political Support
Explaining Political Support
Much of the empirical work undertaken in this thesis has involved analysing levels of
political participation. But it is also important to question whether perceived
corruption can link to directions of political support. If perceived corruption causes
citizens to not support or to vote against the incumbent government, then we raise an
interesting question. Is this because perceptions of corruption orientate primarily
towards distrust of the incumbent government, not political institutions more
generally? Our previous work has shown that perceived corruption ties to trends in
institutional and extra-institutional participation, yet perhaps the incumbent
government may also be affected, electorally, by perceptions of corruption.
Partisanship, or attachment to a particular party, may also be influenced by the extent
to which they or rival parties are deemed to be corrupt.
It is also possible that political corruption at the national level is associated
with trends in political support and vote choice. Political corruption as a contextual
effect may result from some individuals accurately perceiving corruption and
attracting bandwagon support towards clean parties; or it may result from a general
societal inclination to vote for opposition parties who advocate corruption-related
reform, and perhaps reform in a broader sense (securing the rule of law, for example),
independent of individuals' perceptions. To examine these suggestions we will look to
the British case study first, and then turn to the analysis of potential effects of both
-174-
Political Corruption, Public Opinion, and Citizens' Behaviour
perceived corruption and the national level Corruption Index together in explaining
vote choice.
Interestingly, very few studies have actually integrated standards related
variables into models of political support. The possibility that corruption scandals
may affect the 2006 US elections has been considered (see McCann and Redlawsk,
2006), although few firm conclusions about whether this would be the case were
actually offered, and it remains to be seen if such perceptions did so. But of the few
studies to integrate perceived corruption into analysis of political support, McCann
and Dominguez (1998) show that when a spread of plausible determinants of
opposition support in Mexico are controlled for, perceptions of electoral fraud and
political corruption are significant at the 6% level, while the perceived probability of
the governing party winning, and expectations concerning economic management and
government responsiveness and competence appear to be more important. This
limited effect is attributed to the limited perceived importance of corruption and
electoral fraud relative to other issues. McCann and Dominguez (1998) thus suggest
that among those perceiving higher levels of corruption, voter abstention instead of
opposition voting is observed. Davis et al (2004) who focus on Chile, Costa Rica, and
Mexico, find congruent results: perceived corruption predicts abstention from voting
rather than increased opposition voting. This effect is strongest in Mexico, where
there is little party competition and citizens might be expected to withdraw from
voting rather than vote for the opposition.
Thus some previous research indicates that it is possible that standards
perceptions are unimportant in party choice. Nevertheless one study does show results
which indicate that they may have an effect. Miller et al (1986) recognise the role
corruption might have in shaping the direction of voting in US presidential elections.
-175-

Political Corruption, Public Opinion, and Citizens ' Behaviour
They find that a number of coherent dimensions appear to shape evaluations of US
presidential candidates. These are: competence, or political ability; reliability, which
refers to the strength and dependableness of candidates; charisma, which refers to the
capacity of each individual to interact with others; a personal dimension, embracing
perceptions of a candidate's appearance and background; and finally, and most
important for our purposes, an integrity factor. The integrity factor is made up of
perceptions of corruption along with perceptions of candidates' honesty. They
subsequently look at how well these dimensions predict candidate rating and the vote,
and find that, although competence appears to be the dimension of the greatest
importance, integrity has a significantly positive relationship with the tendency to
support a given candidate. This effect is slightly stronger among Democratic
candidate evaluations in contrast to Republican candidate evaluations, and is more
important for highly educated voters. Thus Miller et al is an interesting point of
departure for research.
The development of the literature on political support more generally also
provides impetus for the research in this chapter, as it contributes to interpretations of
vote choice and partisanship that highlight the importance of salient political issues as
guides to citizens' preferences. Older literature has emphasised the importance of
socioeconomic variables feeding into partisanship and attachment to political parties
which in turn affects vote choice (Campbell et al, 1960; Butler and Stokes, 1969). Yet
a key problem with this approach lies in the difficulty it has in accounting for change
in patterns of political support over time. If we expect stable attachments to political
parties, it is difficult to explain political phenomena such as partisan dealignment and
the transformation of party systems. Moreover, set against the wider context of
fundamental economic change and increased social mobility, alongside generational
-176-

Political Corruption, Public Opinion, and Citizens' Behaviour
change, it may be that partisanship and 'traditional' social cleavages are less
explanatory in determining vote choice in advanced democracies.
Although this prospect will depend on the age and level of maturity of the
political system, and of levels and the nature of education its citizens receive, it is an
important notion. Perhaps perceptions towards candidates and issues explain vote
choice better than party loyalty. Indeed, public awareness of issues has been found to
be significantly high. Franklin and Wlezien (1997) find that responsiveness to change
in European policy is 'striking' when the issue of Europe is prominent. In the British
case, Franklin (1992) finds a marked increase in the salience of issues between 1964
and 1974 amid the declining power of class in determining left voting. Clarke et al
(2004) analyse surveys of voters and propose a 'valence' model of vote choice that
prioritises the perceived competence of parties in office. Rejecting the centrality of
socioeconomic variables: "By 2001, class effects on voting were negligible" (p. 316)
Clarke et al (2004) find that perceptions of party leaders and to some extent
partisanship, along with perceptions of parties' abilities to handle political problems
and the economy are key, and join forces with the effects of campaigning and tactical
considerations to derive vote choice. 147 Thus issues appear to matter, feeding into
perceptions of the potential competence of parties in government. It is curious,
147 Their position on class is supported by other works such as Nieuwbeerta and De Graaf (1999), who find that in nations in which class voting was salient after 1945, it has markedly declined through the late twentieth century. In Britain, which was shown to have substantial class voting in comparative context, numerous indicators of class voting show a general decline across the post-war period. Nonetheless such analysis is not without controversy. Evans (1999) suggests that Nieuwbeerta and De Graaf s analysis is flawed by inadequate coverage of many of the countries analysed over time. Furthermore, many of the case studies in Evans et al (1999) problematise Nieuwbeerta and De Graaf s thesis by pointing to complex patterns of fluctuation and continuity across nations, rather than general class dealignment. Goldthorpe (1999), for example, analyses the British case and asserts that "the degree of stability present in the level and pattern of class voting has indeed been one of the dominant features of the class-party relationship in British electoral politics" (pp. 80-81). It is perhaps questionable how far this is characteristic across states, but it is important given emphasis scholars have placed on Britain being congruent with class dealignment trends. Also, the thesis that parties now succeed by strategic marketing within competitive party systems (see, for example, Kitschelt, 1994, in reference to European social democratic parties) is argued not to be incompatible with the revisionist case: it may be the case that parties market to class interests (Evans, 1999).
-177-
Political Corruption, Public Opinion, and Citizens' Behaviour
nonetheless, that of the issues analysed by Butler and Stokes (1969), Franklin (1992),
and Clarke et al (2004), none specifically involve standards or propriety in
government.
Fisher (2000b) draws attention to Butler and Stokes' division between
'position' issues, those in which parties maintain a line which is plausibly challenged
by competing positions, and 'valence' issues, where only one position plausibly exists
(the type of issues Clarke et al find significant), and proceeds to suggest the
Conservatives' defeat in 1997 may be related to valence issues including party
cohesion, economic management, and, interestingly for our purposes, sleaze. This
notion begs the research question underlying the analysis that follows: could variables
pertaining to corruption associate with directions of political support? In view of the
very limited amount of existing work undertaken on the issue, the work presented
here will be exploratory in nature and will not involve testing concrete hypotheses
stated at this early stage. Before we undertake such analysis, however, it is first
important to consider issues of causality.
Endogeneity Problems
Key objections to the work we are attempting to achieve come in the form of
questioning causality between perceptions of standards, and indeed corruption itself,
and supporting or voting for an incumbent government or the opposition. These
objections can be expressed succinctly diagrammatically, and this is done in Figure
7A.
-178-

Political Corruption, Public Opinion, and Citizens' Behaviour
Figure 7 A
Corruption, Perceived Corruption, and Political Support: Endogeneity Paths
Perceived Corruption
Actual Corruption
Partisanship / Vote Choice
To understand the endogeneity problems, let us look at the four possible relationships
between the two corruption-related variables, and partisanship / vote choice. 148 Note
that along with the labelled links key to the discussion of endogeneity issues, a link
between political corruption and perceived corruption has been added to indicate
awareness that actual levels of political corruption are likely to influence perceptions
of such levels, due to media exposure of prominent cases and the possibility of
corruption bring visible to citizens. Yet for our purposes, links A, B, C, and D are
central to discussion.
148 Partisanship and vote choice are treated as equivalent in this diagram. To some extent, this is a fair assumption - partisanship would imply vote choice. However the inverse, vote choice implying partisanship, is not necessarily true. Individuals may vote impulsively, according to short term factors; or they may vote tactically. Although recognising these nuances is important, it does not really affect the theoretical reasoning being undertaken. Whether an individual is a partisan or just a voter for a party in a particular election, the nature of the link between a) corruption and perceived corruption, and b) this evidence of support, may be called into question along similar lines.
-179-
Political Corruption, Public Opinion, and Citizens' Behaviour
A: It is possible that perceiving considerable levels of corruption may encourage
citizens to be suspicious of the incumbent, either as a corrupt actor itself, or as an
agent that ineffectively prevents other actors being corrupt. Consequently, perceiving
more corruption may discourage incumbent support, and perhaps increase the
likelihood of opposition party support.
B: If an individual supports Party X rather than Party Y, then the incumbency of Party
X may encourage the individual to perceive less corruption than if Party Y were in
power. Partisanship may breed an inclination to exaggerate the perceived probity (and
the strength in preventing others' corruption) of a government one supports, and an
inclination to exaggerate the perceived corruption undertaken or ineffectively
prevented by a government one is politically distanced from.
C: Political corruption may have a contextual effect on political support. First, it
might stimulate certain citizens who accurately recognise certain actors to be corrupt
to stop supporting these officials, and to support clean candidates or parties instead.
This may encourage a 'bandwagon' shift in support, if citizens inform others of the
considerable benefits of the party now supported (which may go beyond simply not
being corrupt). This bandwagon shift in support may also relate to an increased ability
of the party to advertise its features when it initially obtains increased support. The
existence of 'bandwagon' effects is not simply a speculative notion - see evidence in
Nadeau et al (1993) and Skalaban (1988). Second, a contextual effect may emerge if
corruption contributes to prompting certain parties to promise reformist agendas,
which may be quite broad in scope. Considerable corruption in a given nation,
whether individual citizens perceive it or not, may be indicative of poor institutional
-180-
Political Corruption, Public Opinion, and Citizens' Behaviour
quality or insufficient institutionalising of the rule of law, motivating certain parties to
promote reform. These agendas may be welcomed by citizens generally, deriving
support for the party even from citizens who may see corruption as less of a problem
than other issues.
D: Once political support and vote choice has translated into political outcomes -
namely the election of one party or coalition over another, then it is reasonable to
believe that this will influence levels of corruption. Some governments may simply be
more corrupt and ineffective at preventing others from being corrupt than other
governments. This is, however, complicated by the idea that some degree of 'path
dependence' in terms of levels of corruption in politics may be observed. If corruption
is entrenched, the 'elbow room' of new governments to reform may be restricted.
Thus one must assume that at least some degree of autonomy to reform exists.
Given these problems, it is necessary to defend the causal directions prioritised in this
chapter. Corruption and perceived corruption are considered possible explanations for
partisanship and vote choice. In essence, we are assuming relationships A and C are
key and are downplaying the importance of relationships B and D. Yet is this
justified?
It is evident that citizens are becoming more critical of government institutions.
Rather than simply displaying subservience to particular parties, recent research has
shown that citizens in advanced democracies appear to be far less supportive of
regime performance and government institutions than they do democratic and regime
principles (Norris, 1999). Such 'critical citizens' do not, consequently, blindly support
regimes whatever their performance, nor unquestioningly trust established political
-181-

Political Corruption, Public Opinion, and Citizens' Behaviour
institutions. Rather, they respond critically to perceived insufficiencies in regime
performance and government institutions, such that reformist ambitions may be
prompted in stronger democracies, and democratic consolidation might be challenged
in weaker ones. This notion is strengthened when we consider evidence that
partisanship has decreased in strength and salience across advanced democracies over
time (Wattenberg, 1994; Dalton, 2006).
If we are to assume that partisanship and vote choice does feed into perceived
corruption and wider institutional perceptions, we might expect not to find citizens
that are so critical as those indicated by Norris (1999). By definition, in democracies
the party or coalition supported by the majority or at least the plurality of voters is
likely to form the government. Consequently, criticism of institutions is likely to be
limited if constrained only to opposition voters. The notion that a considerable force
of 'critical citizens' exists implies a more autonomous body of citizens than that we
might expect if partisanship were to act as the key signal driving orientations towards
predictors of institutional quality including corruption, which devalues causal link B.
Furthermore, realising citizens' sensitivity to institutional inadequacy, it is probable
that across a polity, parties will seek to promise standards of probity comparable to its
rivals, downplaying considerable variation in levels of corruption that may be derived
if we are to assume causal link D is important. This may, admittedly, have the knock-
on effect that increased homogeneity of corruption across parties diminishes its
salience in terms of partisanship or vote choice.
We cannot prove that causal links B and D are entirely unimportant. Indeed,
the intuitions given to explain their possible effects seem highly plausible and
defensible. Yet we can argue that there is more likelihood that causal links A and C
are more important in contemporary democracies. Bodies of critical and autonomous
-182-
Political Corruption, Public Opinion, and Citizens' Behaviour
citizens who are less affected by party identification and partisanship than they were,
may well be influenced by their own perceptions of corruption, and the contextual
effects of corruption, when supporting a particular party or deciding who to vote for.
They are less likely to be swayed in their corruption perceptions by party loyalty or
party disdain.
British Analysis
In the British case study, the dependent variable is partisanship, and is derived from
the same question used to tap Labour party support in the models of political
participation in the previous chapter:
Do you generally think of yourself as a little closer to one of the political parties than
the others?
An affirmative response is then met by the request to specify the party. The variable
will take the form of a categorical variable which divides between a) Labour
partisans; b) opposition partisans; and c) non-partisans. Note that opposition partisans
will be specified as those professing support for the other parties offered as options in
the BMRB dataset. 149 Using a categorical variable in this way enables us to predict
how both opposition support and non-party support relative to incumbent support is
affected as perceived corruption and the control variables vary. Just over 20% of the
149 These are: the Conservatives, the Liberal Democrats, the Scottish National Party, Plaid Cymru, the Green Party, or other. It was considered to extend this categorical variable such that each party was included separately, to measure effects relating to support of the incumbent relative to each other party individually as perceived corruption grew. Yet this route was not attempted due to the few individuals supporting each opposition party when considered separately, therefore supporters of these parties will be combined as an 'opposition collective'.
-183-
Political Corruption, Public Opinion, and Citizens ' Behaviour
sample are Labour partisans, a similar proportion are opposition partisans, and 55%
are non-partisans.
Turning to independent variables, the perceived corruption variable is of
course the key predictor of interest, and the 'perceived importance of corruption
avoidance' scale controls for the extent to which citizens are concerned about
corruption in public life. It has also been found elsewhere that censoriousness itself
links to political support. Johnston (1991), for instance, reports a limited link between
censoriousness toward private wrongdoing and support for the 1987 incumbent
Conservative government. This is interesting, Johnston suggests, as it implies that the
less tolerant British turn towards a leader seen as moral, and the incumbent party of
the time, suggesting that wrongdoing is perceived to link to dishonest individuals
instead of the wider political system. However, Johnston and Wood (1985) find that
censoriousness over a hypothetical council official (not themselves identified with a
particular political party) accepting 'expensive entertainment' from a private sector
service-provider is stronger among Labour voters. The inclusion of the 'Other
Misdemeanour Incidence' scale both ensures that perceived corruption is being
directly controlled for, and that it does not simply tap perceptions relating to other
inadequate behaviour (such as incompetence and dishonesty) among public officials.
As models in Chapter 5 suggested, it was these two attitudinal variables:
censoriousness and other misdemeanour, that were the strongest predictors of
perceived corruption, thus controlling for them to ensure any effect of perceived
corruption is not just a proxy of these other predictors is highly necessary.
Although the findings of Chapter 5 suggest that social structural variables are
unlikely to proxy perceived corruption in the UK, their inclusion is necessary as they
may still be salient predictors of partisanship. Partisanship may relate to gender, for
-184-
Political Corruption, Public Opinion, and Citizens' Behaviour
instance, if Labour are perceived to offer favourable policies to particular genders
relative to other parties. Age may also link to partisanship if, similarly to gender,
Labour's policies and performance on issues salient to particular age brackets are
influential. Age may also explain non-partisanship, as increased partisanship may be
observed among older people brought up at a time when partisanship was more
prevalent. Such partisanship may, alternatively, tie to increased political engagement
among older individuals compared to a disinterested or apathetic youth. Education
may also encourage political engagement, while class is important as a control
variable. Traditionally, we would anticipate Labour partisanship to be more prominent
among working class citizens.
Social trust may also be explanatory if it promotes civic engagement that leads
to partisanship. It may also link to ideology. Socialism, for example, is commonly
understood to be grounded in a positive conception of human nature and trust in
people such that a more egalitarian society may prevail. Finally, knowledge and
interest in politics and in standards-related issues is likely to be highly related to
propensity to express partisanship, as a certain level of knowledge and interest in
political issues is surely a pre-requisite for such a propensity. 150
We may thus predict a multinomial logistic model of a) opposition
partisanship (Equation 1} and b) non-partisanship (Equation 2) relative to Labour
partisanship. Before we do so, we should be clear what logistic multinomial models
show. In this thesis we have already used standard logistic models. In logistic
multinomial regression we aim to predict the determinants of a categorical dependent
variable using equations calculating the log odds of the propensity to be in a
particular category relative to a baseline category. In our case, we look to predict the
150 These independent variables will all be operationalised as they were in the models of political participation presented in Chapter 6.
-185-

Political Corruption, Public Opinion, and Citizens' Behaviour
log odds of being an opposition partisan relative to a Labour partisan in the first
instance, and a non-partisan relative to a Labour partisan in the second instance. It is
appropriate to use Labour partisanship as the baseline category, as we may observe
clearly any movement towards or away from opposition partisanship and non-
partisanship as perceived corruption and the other variables move. The results are
presented in Table 7.1.
Table 7.1 Multinomial Logistic Model to Predict Partisanship in Britain; Baseline
Category: Labour Partisanship
Variable Equation 1:Opposition Party
Support
Equation 2: Non-Party Support
Standards-Related VariablesPerceived Corruption (1-5)Perc. Imp. of Corr. Avoidance (1-5)Other Misdemeanour Inc. (1-5)
Socioeconomic / Demog. VarsFemaleAge: 18-34(ref.)Age: 35-54Age: 55+Secondary School EducationClass: Manager/Professional (ref.)Class: IntermediateClass: Routine/Manual
Other VariablesSocially TrustingKnowledge / Interest (1-5)
ConstantR-Squared
N=*** = p < 0.01 ; ** = P < 0.05; * = p < 0. 1 ;
B
-0.100.25
0.56***
0.250
-0.390.000.31
00.23
-0.62**
-0.230.22
-3.28***
uses robust standard
s.e.
0.140.200.17
0.21
0.300.320.28
0.290.26
0.220.16
1.170.09
1055errors. 151
B
0.060.23
Q 4^***
0.150
-0.87***-1.06***
-0.150
0.25-0.38*
-0 57***-0.60***
1.48
s.e.
0.130.160.16
0.18
0.240.260.23
00.270.21
0.190.14
0.98
151 An interaction term between the perceived corruption variable and the censoriousness variable (the perceived importance of corruption avoidance item) was added speculatively to the multinomial model to test for any effect on partisanship of perceived corruption that was exacerbated by the degree to which corruption was deemed to matter. Yet it failed to have a substantive effect, and is not included.
-186-

Political Corruption, Public Opinion, and Citizens' Behaviour
Let us address the control variables first. Gender appears to have no impact on
partisanship, although age shows significant effects. Older citizens, when compared to
younger citizens, show a distinctly greater propensity to express Labour partisanship
in comparison to non-partisanship, although not in comparison to opposition
partisanship. Older individuals are thus generally more likely to express partisanship
than younger individuals. Meanwhile, education appears not to explain incumbent
party support relative to opposition support and non-party support. Class has some
effect, as those in the routine and manual class are more likely to be Labour partisans
in comparison to being opposition party partisans, and in comparison to being non-
partisans. However, the effects should not be exaggerated too much. They are
relatively weak and no difference is evident between the highest and the intermediate
class in either Equation 1 or Equation 2.
Meanwhile, social trust appears to explain partisanship generally. There is a
statistically significant difference in trust between Labour partisans compared to non-
partisans, and this effect drops out when Labour partisans and opposition partisans are
compared. Knowledge and interest are unsurprisingly tied to propensity to be a
partisan generally. Having a certain level of interest and familiarity with politics and
the issues discussed in the survey may be a pre-requisite for the expression of partisan
alignment. Or, reversing the causality, it may be the partisans tend to pay more
attention to politics, making it more likely that they have greater knowledge and
interest.
Our key focus, once again, is however on the standards-related variables. It is
most striking that neither perceived corruption nor censoriousness towards corruption
Meanwhile, the substantial N means outliers are unproblematic, and multicollinearity was again indirectly tested for, as with the models of political participation, but did not seem to be problematic. Lastly, design weights were added to ensure the sample analysed was representative.
-187-

Political Corruption, Public Opinion, and Citizens ' Behaviour
has any effect on partisanship. Instead, perceptions of 'other misdemeanour' are
explanatory. Perceiving substantial other, non-corrupt, misdemeanour, such as
incompetence, not telling the truth, lack of open government or 'distanced'
government, and public servants setting a bad example in their private lives, has an
effect. High perceived other misdemeanour means a lower propensity to be a Labour
partisan relative to both opposition partisanship and non-partisanship.
To grasp the effect of 'other misdemeanour' more concretely, we may graph
the predicted probability of expressing a) opposition partisanship, and b) non-
partisanship, relative to Labour partisanship as the 'other misdemeanour incidence'
scale increases, using the equations predicted in Table 7.1, and by making
assumptions about a hypothetical individual. 152 The results are shown in Figure 7B.
152 These assumptions are: that the individual is male, aged 18-34, is secondary school educated, is in the managerial and professional class, and is socially distrusting. They are also assumed to have mean scores for the perceived corruption variable, the 'Perceived Importance of Corruption Avoidance' variable, and the knowledge / interest variable.
-188-
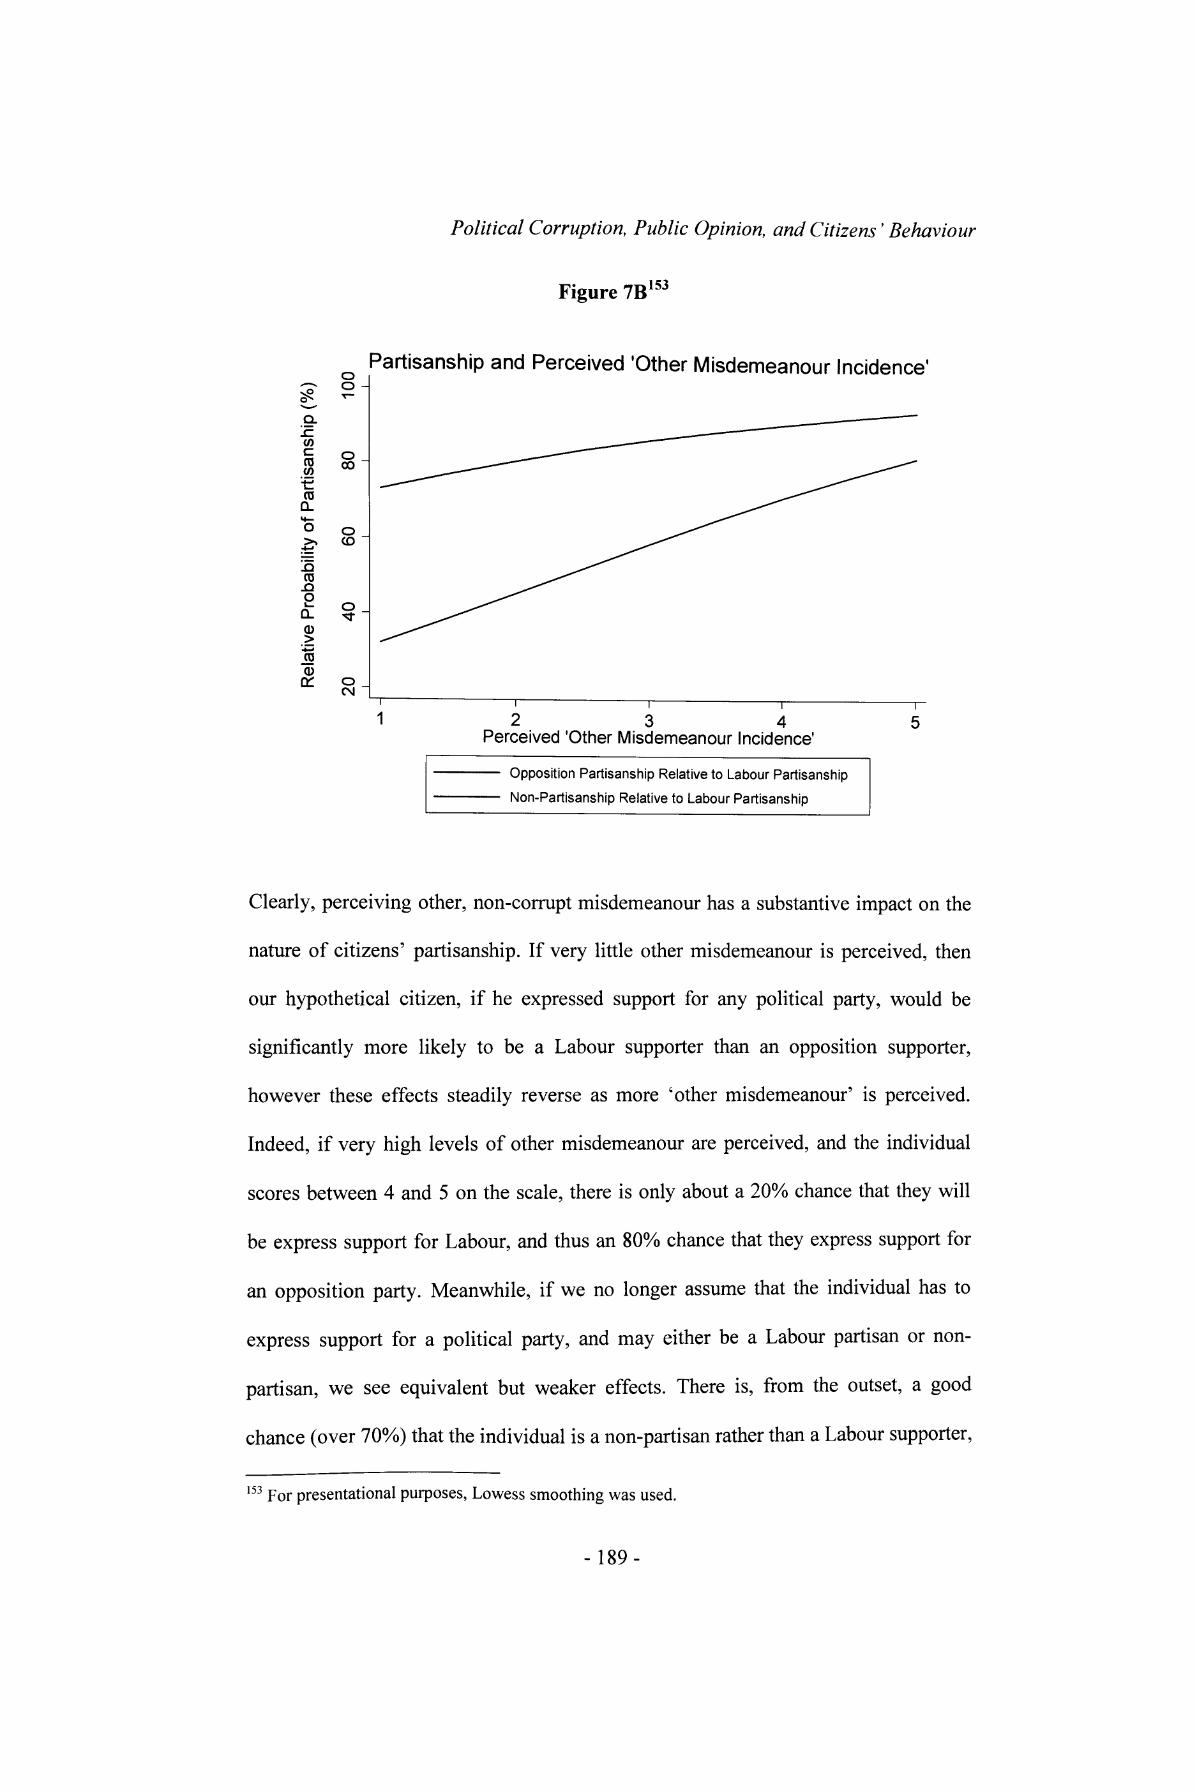
Political Corruption, Public Opinion, and Citizens' Behaviour
Figure 7B 153
V)cCO
Partisanship and Perceived 'Other Misdemeanour Incidence 1O -
O CO
CO CLM—
o o>> CO
.CO .Q O
IJSCD
* 3 ——I—————————I————————I——234
Perceived 'Other Misdemeanour Incidence'
Opposition Partisanship Relative to Labour Partisanship Non-Partisanship Relative to Labour Partisanship
Clearly, perceiving other, non-corrupt misdemeanour has a substantive impact on the
nature of citizens' partisanship. If very little other misdemeanour is perceived, then
our hypothetical citizen, if he expressed support for any political party, would be
significantly more likely to be a Labour supporter than an opposition supporter,
however these effects steadily reverse as more 'other misdemeanour' is perceived.
Indeed, if very high levels of other misdemeanour are perceived, and the individual
scores between 4 and 5 on the scale, there is only about a 20% chance that they will
be express support for Labour, and thus an 80% chance that they express support for
an opposition party. Meanwhile, if we no longer assume that the individual has to
express support for a political party, and may either be a Labour partisan or non-
partisan, we see equivalent but weaker effects. There is, from the outset, a good
chance (over 70%) that the individual is a non-partisan rather than a Labour supporter,
153 For presentational purposes, Lowess smoothing was used.
-189-
Political Corruption, Public Opinion, and Citizens' Behaviour
which is to be expected given the relatively low levels of party support expressed by
respondents in the survey. Yet as more 'other misdemeanour' is perceived, we see
that their chances of being a non-partisan reach over 90%. In sum, broad perceptions
of misdemeanour, although not perceived corruption incidence, leads to a fall in
governing party partisanship.
Thus what can we draw out overall from our British analysis of perceived
corruption, participation, and political support, given the findings of this and the
previous chapter? It appears that perceived corruption is very limited in its influence.
Regarding participation, it appears to have statistically insignificant or weak effects,
while in this chapter we find that is has no effect on partisanship. Thus corruption
might be regarded as restricted to a few 'bad apples' rather than one associated with
the incumbent government en masse. Rather, partisanship is closely predicted by
perceptions of 'other misdemeanour' in British politics. This is comprised of
perceptions concerning dishonesty, closed government, and incompetence:
misdemeanour that may be more broadly associated with groups or blocs vying for
power. Our analysis suggests that perceiving such items predicts reduced propensity
to indicate incumbent (Labour) partisanship relative to opposition partisanship and
non-partisanship. Such negative aspects of politics, therefore, may be blamed on the
incumbent government (or, if we query the causality, identified as characteristic of the
incumbent government) in a way that 'corrupt' behaviours are not. To sum up the
argument of the thesis so far, then, it appears that national level corruption is
important centrally as a contextual effect on participation, yet that perceived
corruption at the individual level is limited in its explanatory power on both
participation and partisanship. Yet can cross-national analysis of corruption,
-190-

Political Corruption, Public Opinion, and Citizens' Behaviour
perceived corruption, and their potential effects on vote choice, modify this
conclusion?
Cross-National Analysis
In this section, we will return to cross-national analysis and examine whether the
Corruption Index and perceived corruption can explain political support. More
specifically, we will test whether corruption and perceived corruption appear to
determine a) the propensity to vote in legislative elections for opposition parties
relative to the incumbent; b) the propensity to abstain from voting relative to voting
for the incumbent. We have already predicted turnout in the cross-national context,
which is, of course, highly comparable to what we are doing in b), yet here we ask a
more focused question: how do rates of abstention compare specifically to votes for
the government in power as perceived corruption and national level corruption move?
Predicting these two dependent variables expands to the cross-national context the
same work in substance as the British analysis in this chapter. To do this, we will
again deploy the CSES Module 2 dataset.
In cross-national analysis, defining the 'incumbent' is complex. We will be
analysing votes for the unicameral chamber, or the lower chamber of the legislative
assembly, except in the cases of Japan, where the 2004 election survey pertained to
the upper house, or House of Councillors, and Taiwan, when the 2001 survey
pertained to the Legislative Yuan, also the upper house. Therefore the incumbent
party or bloc must be drawn from those parties and blocs contesting the election, but
quite what to specify as the 'incumbent' is sometimes problematic. In parliamentary
systems in which the prime minister and cabinet is drawn from the party or coalition
-191 -

Political Corruption, Public Opinion, and Citizens' Behaviour
that dominates the legislature, it is clear who the incumbent government is. Yet a
party that dominates the legislature is not always the incumbent government, if by
government we might refer to, for instance, a president and his cabinet from another
party and with a different agenda. In the 2006 legislative elections in the USA, for
example, the Democrats gained control of Congress and the Senate, but can hardly be
described as the 'government' when a Republican president is in place.
We therefore concentrate here on legislative elections. Research in the
previous chapters suggested citizens were likely to respond to corruption and
perceived corruption by behaving in ways likely to reflect antipathy for institutions
caused by corrupt behaviour. Therefore, it is reasonable to assume that corruption and
perceptions of corruption may induce antipathy for the party or parties that dominate
the legislature, perhaps the most important institution in a polity. Besides, we can still
conceive of the dominant party as having a prominent role in government even when
the president is from another party, as they remain the principal law-making agent and
agenda-setter in a presidential regime (Tsebelis, 2002). The 'incumbent' will thus be
defined as a) in parliamentary systems, the party or coalition who forms the executive
just previous to the election being analysed; b) in presidential systems, the governing
party or governing coalition or bloc just previous to the election being analysed. 154
Table A7.1 in the appendix indicates which parties have been considered the
incumbent in each nation. In regard to the CSES data being used, the dependent
variables will a) divide between those supporting the legislative incumbent (the
reference category) and those voting for opposition parties (opposition parties are
necessarily specified as all those included in the CSES dataset but not listed in Table
A7.1 in the appendix), and b) divide between those supporting the legislative
154 The sources of this information are the relevant CIA World Factbooks, accessed from the UMSL (2002) website, supplemented by further information from the relevant 'Political Data Yearbooks' included in volumes of the European Journal of Political Research.
-192-
Political Corruption, Public Opinion, and Citizens' Behaviour
incumbent (the reference category) and those who did not vote. These variables are
obtained via recedes of the relevant variable to derive two binary (0/1) variables
suitable for two logistic multilevel regressions. 155 This variable taps vote choice in the
lower chamber, but is appropriately different according to the nature of each nation's
electoral system. In systems involving preference voting, such as Ireland, it measures
first preference votes; in mixed systems such as Germany and New Zealand, it
measures party list votes; in majoritarian systems such as the UK it simply taps the
party voted for.
Turning to independent variables, the key variable is once again perceived
corruption, which will comprise the perceived corruption variable defined in Chapter
4, operationalised once again as a three category variable reporting coefficients for
respondents who perceive low (reference), medium, and high levels of corruption.
Including this item as a categorical variable enables us to detect nonlinear effects. For
instance, if there were a particularly strong inclination to vote for the incumbent
among those who perceive low corruption which is not shared by both the medium
and high perceived corruption groups then this would not represent a neat linear trend.
We are analysing vote choice cross-nationally, so the nature of individual
level independent variables will be considerably different from the control variables
included in the British case study. As we are analysing data from across nations, in
which the governments are heterogeneous in terms of their ideological make-up, we
need not control for class and other socioeconomic factors which are necessary for a
model of political support or vote choice when only one nation is under consideration.
155 Limitations of the available software make logistic multilevel multinomial regression unavailable. However this is not a concern, given that Alvarez and Nagler (1998) show that multinomial logit offers no substantive advantage compared to binomial logit. Hobolt et al (forthcoming) indicate that there is little substantive difference in results when they run their models using these two methods. Thus two logistic regression models can be used instead, which essentially carries out the same work, but not in one combined model. The different sample sizes for the two models will hence be reported in each case, as opposed to an overall sample size.
-193-

Political Corruption, Public Opinion, and Citizens' Behaviour
We are not looking to explain left or right voting across nations, and the dependent
variables are not coded in ways that distinguish between left and right parties; they
simply measure the incumbent and the opposition. Our focus may legitimately centre,
therefore, on a) individual level perceptions of the government, and b) national level
characteristics of the polity. 156
Addressing the individual level variables first, two variables relate to
perceptions of the previous government's 'performance'. Presumably, greater
dissatisfaction with the government would be likely to express itself in less inclination
to support the legislative incumbent and more inclination to support the opposition or
157not to vote. However we must be aware that there may be an endogeneity problem
here. We are assuming that performance will affect political support, but it may be
that the evaluation of such performance is influenced strongly by partisanship itself.
Evans and Andersen (2006), for example, challenge those who stress economic
perceptions in determining political support (see, for example, Lewis-Beck and
Stegmaier, 2000), and suggest that economic perceptions in the UK may be
endogenous to party support. Yet the fact that these are control variables makes this
endogeneity problem less significant. Furthermore, we earlier noted the growth of
'critical citizens' less likely to be partisans, and such citizens may critically evaluate
156 Socioeconomic and demographic characteristics may, however, link to the relative propensity of non-voting relative to incumbent voting, as they have been seen to affect turnout. This notion is developed and explained in the footnote presented along with the models, but it is sufficient at this point to consider these characteristics of secondary importance.157 Again, however, this raises the question of the extent to which these variables are relevant if the legislative incumbent is not perceived to be the 'government'. Although this is a problem, it should not be too worrisome: in parliamentary systems the government is the legislative incumbent and in many presidential systems the legislature will support the president, particularly when the legislature and president are elected simultaneously. Moreover, perceiving the president to be doing a poor job may also indicate dissatisfaction with the legislative incumbent, even when they are in opposition to the president. This may be precisely because the partisan division between the legislature and the president creates difficulties with deadlock and paralysis which hampers effective political functioning (Lijphart, 1992).
-194-

Political Corruption, Public Opinion, and Citizens' Behaviour
government performance, and not simply assume it to be good or bad because a
particular party or bloc is in power.
The first 'government performance' variable simply tracks the extent to which
respondents think the government is generally doing a good job, which was included
as the 'satisfaction in government' variable in Chapter 4, and will be specified the
same way. 158 A second variable will also be added, however, which taps the degree to
which each respondent is satisfied, or perceives the government is performing well, in
regard to the political issue they regard as most important. One variable in the CSES
Module 2 offers, for each country, a set of issues which pertain to a comprehensive
set of broader political concerns: for instance education, health, immigration and
foreign policy (in some nations an 'other' category was also offered), and respondents
are asked to pick the particular issue they deem most important. 159 The follow up
variable queries the extent to which the respondent believes the government has
tackled this issue, and will be receded equivalently to the general satisfaction variable
and included in the models which follow. 160
The final independent variables at the individual level concern perceived
efficacy of a) those in power, and b) voting. Believing that those in power can 'make
a difference' is likely to influence the extent to which citizens disaffected from the
158 It thus runs from 1-4, with higher scores pertaining to greater perceived performance / greater satisfaction.159 The specific question asked is: What do you think has been the most important issue facing [country} over the last [number of years that the last government was in office] years?160 The specific wording and the codes assigned to the four responses are: And thinking about that issue, how good or bad a job do you think the government /president in [capital] has done over the past [number of years between the previous and present election OR change in govt.J years. Has it / he / she done a very good job? [4] A good job? [3] A bad job? [2] A very bad job? [1]. As with the general government satisfaction variable, don't knows will be interpreted as an indication the individual is largely satisfied with the government's performance, as they would be motivated to indicate displeasure if they did not think this was the case. They have therefore been clustered with the respondents reporting that the government has done a 'good job' in regard to the issue.
-195-
Political Corruption, Public Opinion, and Citizens' Behaviour
current government believe voting against it is likely to have a productive outcome. 161
Perceived efficacy of voting itself is also likely to affect the propensity for dissatisfied
citizens to express their antipathy for the incumbent government by voting for the
opposition. If they believe that people's votes make a salient difference, then they are
presumably more likely to vote against the incumbent when dissatisfied. 162
Turning now to national level variables, 163 clearly the Corruption Index will be
included, as it is of principal interest. 164 In line with theoretical reasoning outlined
above when discussing potential problems with endogeneity, it might be expected that
in highly corrupt nations, a contextual effect is evident whereby there are broad trends
to oust corrupt incumbents and instil reformist governments instead. Meanwhile, the
authoritarianism index will also be included, on the premise that in authoritarian
regimes, the incumbent may be able to coerce or otherwise influence respondents into
voting for them in ways that incumbents in freer nations would not. 165
This 'perceived efficacy of those in power' variable is comprised of a recede to a question which asks: Some people say it makes a difference who is in power. Others say that it doesn 't make a difference who is in power. Using the scale on this card, (where ONE means that it makes a difference who is in power and FIVE means that it doesn't make a difference who is in power), where would you place yourself? (The CSES notes show that some variants on this question were used in some nations, but they are highly equivalent.) The coding will be reversed, so that higher scores imply greater perceived efficacy, and each don't know response will be scored as a 3, on the assumption that those who claim not to know think power-holders are neither highly efficacious or highly inefficacious, as such strong perceptions would presumably be readily reported.162 This 'perceived efficacy of voting' variable is a recede of a question asking: Some people say that no matter who people vote for, it won't make any difference to what happens. Others say that who people vote for can make a difference to what happens. Using the scale on this card, (where ONE means that voting won't make a difference to what happens and FIVE means that voting can make a difference, where would you place yourself. (Again, CSES documentation indicates that some nations had different, yet highly equivalent questions which formed this variable.) The 1-5 coding remains the same, yet don't knows will be given scores of 3, following the same logic as that expressed in the previous footnote.163 It is worth pointing out a result relating to the individual level controls that arose from exploratory work. The addition into the full cross-national turnout model in Chapter 4 of the three individual level controls that were previously not included (this was the case with all but the general 'satisfaction in government' variable) leads to a model with results consistent with the one presented there. These variables were not included at that stage because the variables in the CSES model were kept consistent with the variables used in the WVS-based participation models, although it is recognised they may affect turnout, particularly the 'perceived efficacy of voting' variable.164 Its specification is the same for that in Chapter 4: the 2004 scores for each nation.165 The specification of the authoritarianism variable is also the same as that in Chapter 4, and scores pertain to the year of each nation's election.
-196-

Political Corruption, Public Opinion, and Citizens ' Behaviour
It was necessary, due to the few degrees of freedom available, to undertake
some preliminary exploratory modelling to observe which other national level
variables were appropriate to include. In regard to economic variables, rather than
tapping GDP, which was useful at informing trends in levels of political participation,
the national level economic variables of key interest are the percentage rate of
unemployment at the year of the election, the percentage rate of inflation at the year
of the election, and the percentage rate of GDP real growth at the year of the
election. 166 It appeared likely that detrimental economic effects (high inflation, high
unemployment, poor growth, or indeed a mixture of the three) may predict voting
against the incumbent, if they are blamed for poor economic conditions. However the
inclusion of these variables in initial models revealed stark results: barely any national
level variable had a statistically significant effect.
Nonetheless, in explaining this null result, other research has shown that the
effects of economic predictors on government support are far from clear-cut. Carlsen
(2000), who analyses such links across both time and across nations, finds that
unemployment and inflation have different effects according to the left-right
positioning of governments, and that even these effects can differ cross-nationally.
The insignificance of the economic variables is also consistent with Marsh and Tilley
(forthcoming), Powell and Whitten (1993), and Hellwig (2001), who discuss how
more nuanced, contextual circumstances particularly those lessening the ability to
hold a government responsible, such as federalism, economic openness, and
government duration affect whether economic problems influence political support.
As it is unfeasible to control for a wealth of contextual variables given our small
166 The sources for this economic data were the relevant CIA World Factbooks, which were again accessed from the UMSL (2002) website. If the statistic for the particular year was unavailable, the statistic for the year previously was used.
-197-
Political Corruption, Public Opinion, and Citizens' Behaviour
national N, it was decided to exclude the economic factors from the final models
predicted.
To be consistent with the British models above, it was also decided initially to
include 'bad governance', in case there was a contextual effect of poor standards in
public office more generally on vote choice. Yet the inclusion of bad governance in
these models, which have very limited macro N, was troublesome due to its
collinearity with corruption. When included individually, the variables had similar
effects (although the effect of corruption was in fact stronger than that of bad
governance), but when included together, the variables exhibited unstable effects. We
may thus conclude that the effect of corruption on vote choice is mirrored to a certain
extent by the contextual effect of poor standards generally. As including both
variables leads to a poorly specified model, and that corruption is the key variable of
interest, we will drop bad governance from the final models. Its effect is weaker than
that of the Corruption Index, but we must be aware when considering the results that
the impact of national level corruption and the contextual effect of poor standards
I £_*!
more generally are congruent.
With regard to the model specifications, the structure of the models will be the
same as that employed in the model of turnout using CSES data in Chapter 4 (where
the technical definition is provided). We will predict logistic multilevel regressions
which allow the intercept to vary.
Turning to case inclusion, we should first note that there are 31 elections in the
CSES dataset, despite there being only 30 nations. This is because surveys pertaining
167 It was also considered to include compulsory voting in the model of non-voting relative to incumbent voting, however it failed to have a statistically significant effect in initial modelling. As the sample for this model only involves non-voters and incumbent voters, rather than non-voters and voters broadly, the impact of this variable is negligible. In view of its inclusion not being explanatory, and given that it does not influence the other results, it has simply been excluded from the final models presented.
- 198-
Political Corruption, Public Opinion, and Citizens ' Behaviour
to Portugal's 2002 and 2005 election are included. In Chapter 4 this was not
problematic, as the two Portuguese surveys were combined to derive one 'macro'1 f\Si
case. It is pertinent that the macro 'cases' in the models that follow are not nations,
as was the case with the multilevel models in Chapter 4, but are instead elections. It is
therefore not possible to combine the Portuguese samples in this analysis because the
dependent variables relating to each election are not the same: different parties make
up the incumbent in each case, as Table A7.1 shows. It is also methodologically
problematic to include both elections independently, as we effectively weight
Portuguese respondents 'up' by including them in two macro cases, even if these
cases do relate to different elections. Consequently, only the 2005 Portuguese election
will be included in the models presented.
There are also five countries that have problems or salient missing values
which preclude their use in the regressions which follow, thus not allowing us to
analyse all 30 elections but leaving us with 25. The omitted nations are listed in the
Appendix, in Table A7.2. The results of the two multilevel models predicting a)
opposition voting over incumbent voting, and b) non-voting over incumbent voting,
are outlined in Table 7.2.
168 The reason 29 CSES nations were included in Chapter 4's models, rather than 30, was due to Belgium being excluded as it lacked data for the income variable.
-199-
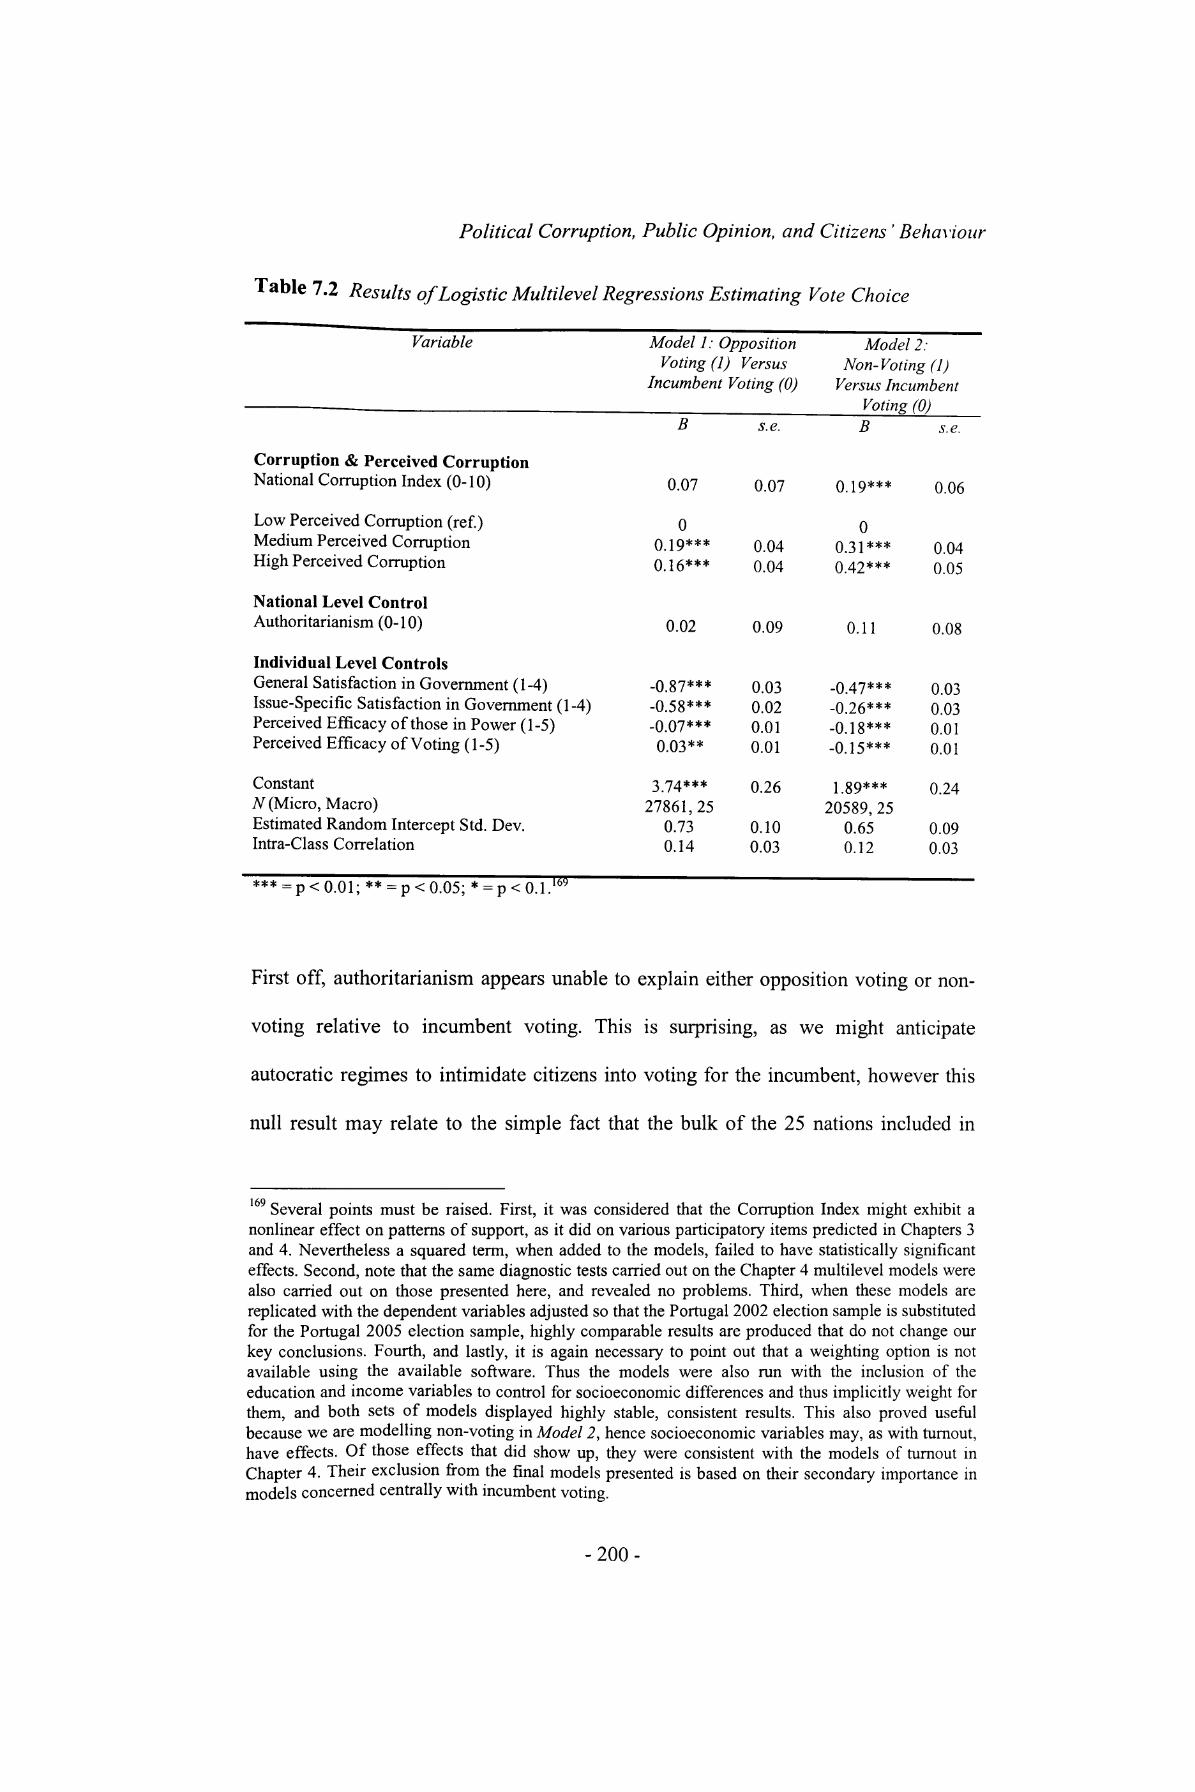
Political Corruption, Public Opinion, and Citizens ' Behaviour
1 able 7.2 Results of Logistic Multilevel Regressions Estimating Vote Choice
Variable Model 1: OppositionVoting (1) Versus
Incumbent Voting (0)
Model 2:Non- Voting (I)
Versus IncumbentVoting (0)
Corruption & Perceived CorruptionNational Corruption Index (0-10)
Low Perceived Corruption (ref.) Medium Perceived Corruption High Perceived Corruption
National Level ControlAumoritarianism (0-10)
B
0.07
00.19*** 0.16***
0.02
s.e.
0.07
0.040.04
0.09
B
0.19***
00.31*** 0.42***
0.11
s.e.
0.06
0.040.05
0.08
Individual Level ControlsGeneral Satisfaction in Government (1-4)Issue-Specific Satisfaction in Government (1-4)Perceived Efficacy of those in Power (1-5)Perceived Efficacy of Voting (1-5)
ConstantN (Micro, Macro)Estimated Random Intercept Std. Dev.Intra-Class Correlation
-0.87***-0.58***-0.07***0.03**
3 74***27861,25
0.730.14
0.030.020.010.01
0.26
0.100.03
-0.47***-0.26***-0.18***-0.15***
1.89***20589, 25
0.650.12
0.030.030.010.01
0.24
0.090.03
*** 169
First off, authoritarianism appears unable to explain either opposition voting or non-
voting relative to incumbent voting. This is surprising, as we might anticipate
autocratic regimes to intimidate citizens into voting for the incumbent, however this
null result may relate to the simple fact that the bulk of the 25 nations included in
169 Several points must be raised. First, it was considered that the Corruption Index might exhibit a nonlinear effect on patterns of support, as it did on various participatory items predicted in Chapters 3 and 4. Nevertheless a squared term, when added to the models, failed to have statistically significant effects. Second, note that the same diagnostic tests carried out on the Chapter 4 multilevel models were also carried out on those presented here, and revealed no problems. Third, when these models are replicated with the dependent variables adjusted so that the Portugal 2002 election sample is substituted for the Portugal 2005 election sample, highly comparable results are produced that do not change our key conclusions. Fourth, and lastly, it is again necessary to point out that a weighting option is not available using the available software. Thus the models were also run with the inclusion of the education and income variables to control for socioeconomic differences and thus implicitly weight for them, and both sets of models displayed highly stable, consistent results. This also proved useful because we are modelling non-voting in Model 2, hence socioeconomic variables may, as with turnout, have effects. Of those effects that did show up, they were consistent with the models of turnout in Chapter 4. Their exclusion from the final models presented is based on their secondary importance in models concerned centrally with incumbent voting.
-200-
Political Corruption, Public Opinion, and Citizens' Behaviour
analysis are highly democratic. Thus little variation in authoritarianism among states
may have led to the failure of the variable to be explanatory in either model.
Regarding the individual level controls in Model 1 and Model 2, both general
and issue-specific satisfaction exhibit effects that might be expected: greater
satisfaction encourages incumbent support and discourages opposition party support
and non-voting. Meanwhile, the efficacy variables display an interesting spread of
effects. Model 1 shows that if you perceive those in power to be efficacious, you are
slightly more inclined to vote for the incumbent than you are for opposition parties.
Perhaps this perception itself arises from an effectual incumbent, which motivates
support. Meanwhile the same model shows the reverse regarding voting
efficaciousness, although this effect is weak. Believing your vote matters encourages
opposition party support relative to incumbent voting. Voting for the former, as they
are not in power, presumably requires adequate belief that your vote can help ensure
regime change. Model 2, meanwhile, displays intuitive effects regarding efficacy.
Perceiving both voting (as a political action), and politicians (as political agents), to
be efficacious prompts one to vote for the incumbent ahead of not turning out at all.
Perceiving inefficaciousness discourages voting, as we might expect.
Our key results, of course, concern national level corruption and individual
level perceived corruption. The first point of interest is that in Model 1, corruption as
a national level, contextual effect, is shown not to explain voting for the opposition
ahead of the incumbent. Where corruption is substantial in politics, it appears that
opposition parties are failing to transmit a credible message to citizens that they will
be reformist and ensure corruption clean-up. It might also be the case, therefore, that
corruption is perceived to be engrained in institutions, rather than in particular parties
(recognising that parties themselves are a form of political institution). This point
-201 -
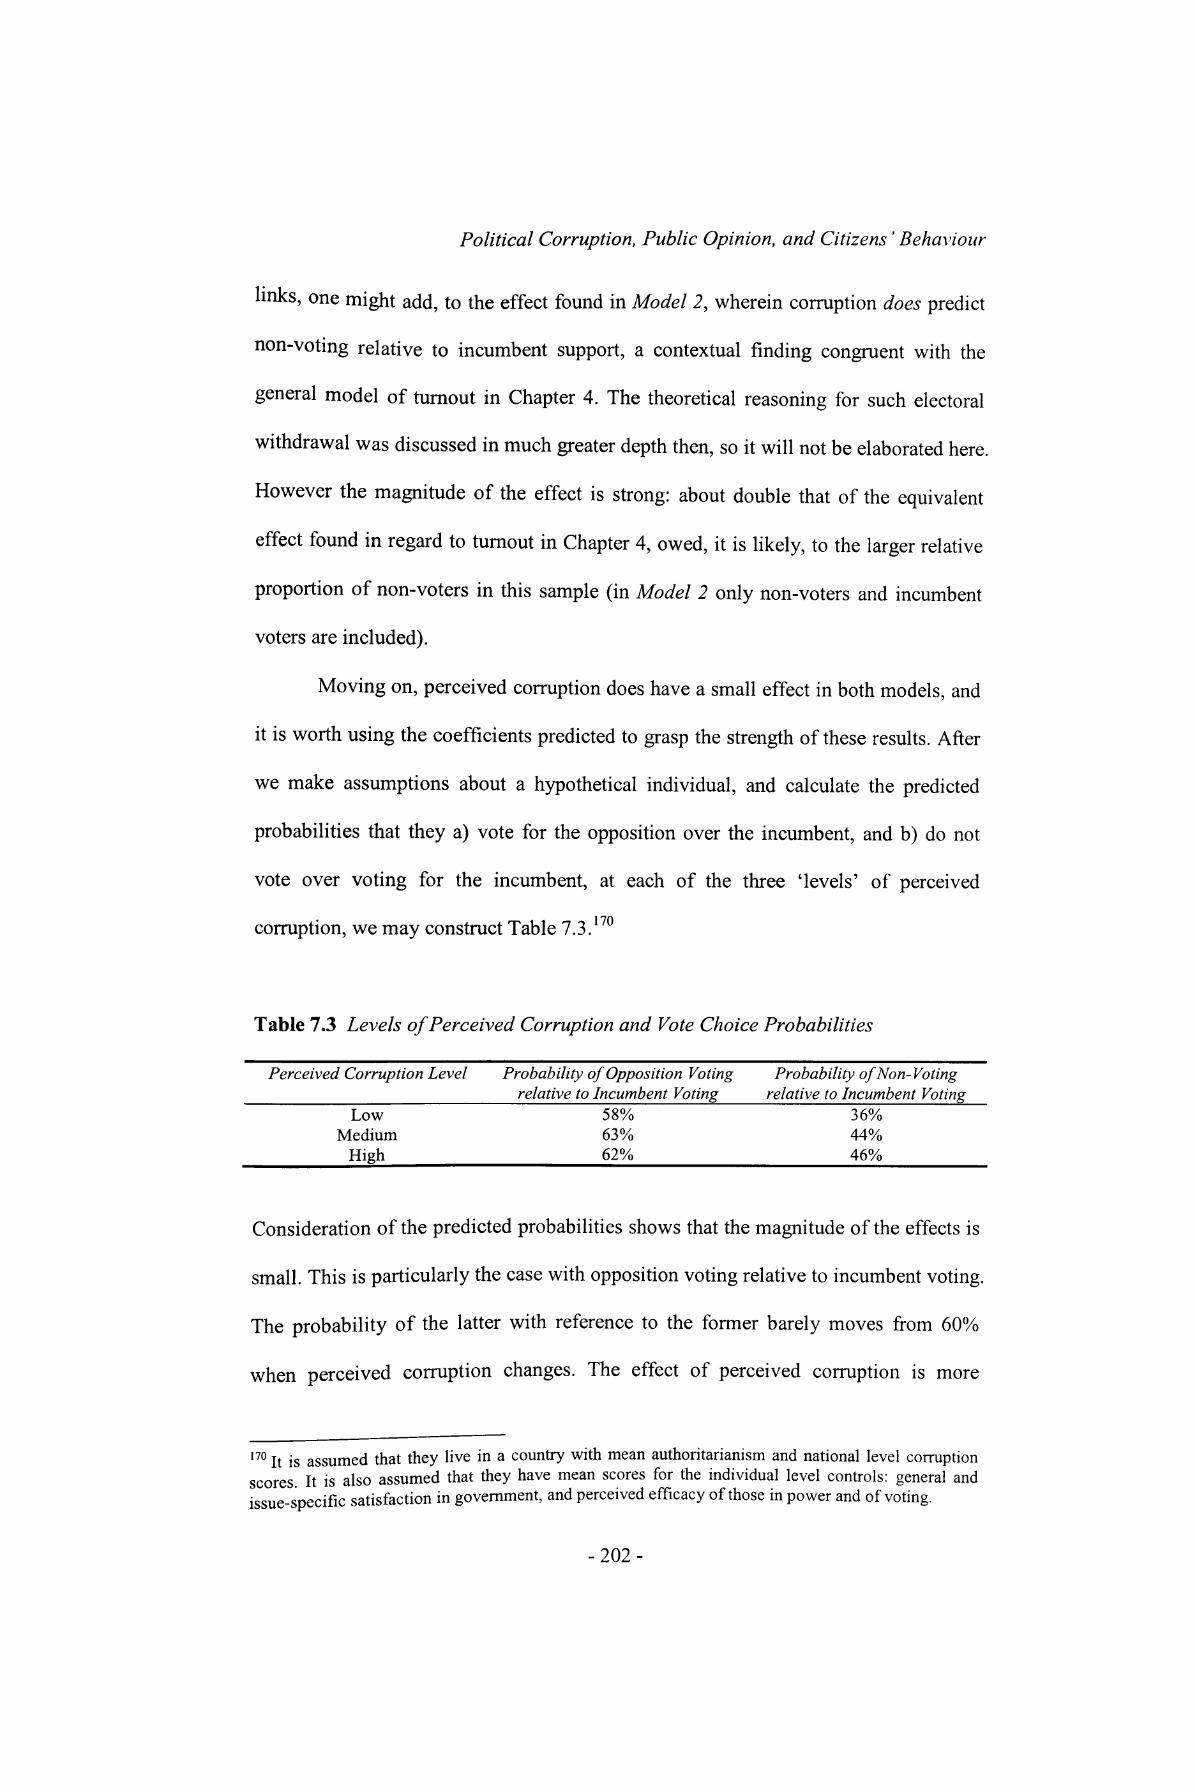
Political Corruption, Public Opinion, and Citizens' Behaviour
links, one might add, to the effect found in Model 2, wherein corruption does predict
non-voting relative to incumbent support, a contextual finding congruent with the
general model of turnout in Chapter 4. The theoretical reasoning for such electoral
withdrawal was discussed in much greater depth then, so it will not be elaborated here.
However the magnitude of the effect is strong: about double that of the equivalent
effect found in regard to turnout in Chapter 4, owed, it is likely, to the larger relative
proportion of non-voters in this sample (in Model 2 only non-voters and incumbent
voters are included).
Moving on, perceived corruption does have a small effect in both models, and
it is worth using the coefficients predicted to grasp the strength of these results. After
we make assumptions about a hypothetical individual, and calculate the predicted
probabilities that they a) vote for the opposition over the incumbent, and b) do not
vote over voting for the incumbent, at each of the three 'levels' of perceived
corruption, we may construct Table 7.3. 170
Table 7.3 Levels of Perceived Corruption and Vote Choice Probabilities
Perceived Corruption Level Probability of Opposition Voting Probability of Non-Voting ______________________relative to Incumbent Voting____relative to Incumbent Voting
Low 58% 36% Medium 63% 44%
High_________________62%_________________46%_______
Consideration of the predicted probabilities shows that the magnitude of the effects is
small. This is particularly the case with opposition voting relative to incumbent voting.
The probability of the latter with reference to the former barely moves from 60%
when perceived corruption changes. The effect of perceived corruption is more
170 It 's assumed that they live in a country with mean authoritarianism and national level corruption It is also assumed that they have mean scores for the individual level controls: general and
L^e-specific satisfaction in government, and perceived efficacy of those in power and of voting.
-202-

Political Corruption, Public Opinion, and Citizens' Behaviour
pronounced in regard to abstention relative to incumbent voting, and displays an
effect which is congruent with the findings of the general model of turnout in Chapter
4. Those perceiving high levels of corruption are 10% more likely to abstain if they
perceive high levels of corruption compared to perceiving low levels of corruption,
but when set against the contextual effect of the Corruption Index, we can see that this
effect is relatively small. As the magnitude of contextual corruption is double the size
of that shown in Chapter 4, we may expect abstention to grow by 20% or more as the
Corruption Index moves from the clean to corrupt countries included in the CSES
dataset.
The limited magnitude of the perceived corruption effects may mean that it is
the large number of individual level N, and hence small standard errors, that brings
forth the statistical significance of the effects. A more conservative model would be
unlikely to do so, as might a model including a broader range of perceptions
concerning the government, perhaps indicating that the cross-national analysis is in
fact consistent with the British analysis in regard to the effect of perceived corruption
on political support: it is rather weak. Far more pertinent is the contextual effect of
national level corruption, which, though not explaining incumbent relative to
opposition voting well, is once again highly salient in determining propensity to vote
at all. We may conclude that greater national level corruption prompts disengagement
from politics and leads to non-voting, rather than waves of voting for other parties.
The theoretical reasoning for such a contextual effect, outlined in depth in Chapter 4,
appears to be well-supported.
-203-
Political Corruption, Public Opinion, and Citizens ' Behaviour
Summary of Results and Discussion
Let us first summarise the results of this chapter. The British case study showed that
perceived corruption does not appear to affect trends in political support. Instead, we
found that perceptions of standards more broadly, encompassing items pertaining to
competence, honesty and openness, were much better at explaining opposition
partisanship. Hence, assuming the causal direction justified at the outset of the chapter,
British citizens appear to hold the incumbent government responsible for maintaining
these broader standards but not, it would seem, for corruption. This is perhaps to be
expected, given the lack of a party systemically associated with corrupt transactions in
the UK (and, perhaps, the low 'objective' level of corruption in the UK). Moreover,
the close proximity of incidents including the Iraq War to the timing of the survey
may have brought more forcefully into the public mind the notion that the government
should be honest when explaining policy choices, and competent in evaluating
information that informs these choices. This is backed up by the finding that when
respondents were questioned which events influenced their responses to the survey,
the three most frequently mentioned events were the Iraq War (mentioned by 60%),
the Hutton Inquiry (by 42%), and the Dossier on Iraqi arms (by 23%), all of which
pertained to incidences of alleged government dishonesty, or incompetence, or both
(BMRB, 2004, p. 25).
The cross-national study essentially confirmed the results concerning
perceived corruption that showed up in the British analysis. Although the effects of
perceived corruption are statistically significant, and loosely suggest that perceiving
corruption encourages opposition voting and abstention ahead of incumbent voting,
these effects are weak, and may tie more to the large individual level TV than to a more
-204-

Political Corruption, Public Opinion, and Citizens' Behaviour
substantive finding. The most important finding of the cross-national analysis re-
emphasised the contextual effect of the Corruption Index regarding non-voting. It was
interesting, however, that corruption at the national level appears not to affect
opposition voting relative to incumbent voting. These findings show that the effect of
corruption appears to involve institutions rather than particular political actors or
parties. Indeed, the propensity for individuals to withdraw from electoral politics in
highly corrupt nations ahead of voting for the opposition implies that institutions may
be associated with corrupt practice, encouraging electoral withdrawal (albeit shown
through a contextual effect). Or, more broadly, it may be that opposition parties do
not present credible, reformist mandates that citizens perceive to be indicative that
corruption clean-up or reform more generally will occur if that opposition party is
voted in. While British citizens may perceive corruption to be a product of a few 'bad
apples' rather than a particular party, citizens across countries may similarly believe
corruption to be a product not of a coherent set of political actors, but of the
institutional context to politics. Institutions may fail to prevent corrupt practice, or
they may be undermined by corrupt practice within them, or which involves them
directly. Electoral fraud, for instance, is essentially the corruption of an institution.
More generally, the findings of this chapter add to our understanding of vote
choice and partisanship because the effect of standards variables has remained largely
unconsidered. No literature looks at the possibility of a contextual effect of political
corruption on political support, making the cross-national findings important. With
reference to other, specific works in the existing literature which look at perceived
corruption and political support, we confirm the findings of both McCann and
Dominguez (1998) and Davis et al (2004) that perceived corruption has limited
explanatory power in predicting opposition support. Furthermore, we confirm their
-205-
Political Corruption, Public Opinion, and Citizens' Behaviour
finding that increased perceived corruption tends to prompt greater non-voting than it
does opposition voting, although the magnitude of this result is small. Furthermore,
the contextual effect indicating that non-voting relative to incumbent voting is
strongly influenced by the Corruption Index (the theoretical basis for this effect is
outlined in depth in Chapter 4) bears witness to the argument that citizen withdrawal
from electoral politics is a clear consequence of corruption, not increased propensity
to vote for opposition parties. The wider implications of this are normatively unhappy.
As Davis et al (2004, p. 701) suggest:
...perceptions of corruption can reinforce the existing distribution of political power by effectively removing from the political arena citizens who may have reason to challenge the system. A deepening of democracy would imply the obverse... 171
Finally, we may also shed light on Miller et a/'s (1986) finding that an integrity factor
is explanatory in shaping evaluations and support for US presidential candidates. As
this factor is comprised of broad perceptions that include perspectives on candidates'
corruptness and on their honesty, it is unsurprising that it is explanatory. The
perceived 'other misdemeanour incidence' variable included in the British analysis
was, after all, highly statistically significant and suggested standards in general do
matter. And as the focus of presidential candidate evaluations concerns individuals
rather than parties or blocs, perceiving one of them to be corrupt may have a very
strong effect on one's likelihood to back them. Unlike with a party or bloc, we cannot
claim corruption is simply a function of a few 'bad apples' (as we have suggested
may be a common perception, and indeed a correct one, in the UK) when we have
only one apple under consideration. Thus further research into these themes may do
171 However in our case, we might prefer the term 'electoral arena' to 'political arena', and emphasise the import of contextual corruption rather than perceptions.
-206-

Political Corruption, Public Opinion, and Citizens' Behaviour
well to focus on presidential elections or electoral districts in which specific
candidates are being elected, to analyse if the association between perceiving a
candidate to be corrupt and lower support for them is significant. It seems, intuitively,
probable that this would be the case.
-207-

Political Corruption, Public Opinion, and Citizens' Behaviour
Chapters. Conclusion
The conclusion to this thesis will restate why the research undertaken has been
pursued: why it matters, what it has told us, and what further research themes we
might propose to follow up the findings. It will analyse its contributions into
theoretical understanding of political corruption, political participation, and political
support, and reflect on what these contributions mean for both corrupt and clean
nations in reality. It will consider the findings in context to the over-riding objective
of seeking democracy that is healthy: that is, which is participatory and clean, in
which citizens are well aware of the elusive but potentially damaging behaviours we
cluster under the term 'corruption', and respond in ways that are potentially effective,
prompting corruption reform and clean-up rather than the perpetuation of corrupt
practice. The chapter will also explore what we have leamt about the methodological
capabilities and limitations of the tracks of empirical analysis chosen, and what future
research might aim to do in light of both the enlightening aspects of the research
avenues pursued, and the limitations and frustrations involved.
The Aims of the Thesis Revisited
Recall that it is helpful to frame the work of this thesis as a contribution to the post-
functionalist school of thought concerning political corruption. Scholars such as
Gillespie and Okruhlik, (1996), Tanzi and Davoodi (2000), You and Khagram, (2004)
and Davis et al (2004), among many others, have rejected the premise that corruption
is in some way helpful to the economy or to the political system (by, for example
facilitating deals, however illicit). They have instead offered accounts suggesting
-208-
Political Corruption, Public Opinion, and Citizens' Behaviour
corruption is wasteful to the economy, detrimental to the consolidation and
strengthening of democracy, and contributory to citizen withdrawal from political
arenas.
The aim of this thesis was to extend this body of evidence that corruption is
harmful by looking at a particular set of subfields: the impact of national level
corruption and individual level perceived corruption on a variety of forms of political
participation among the citizenry, and on citizens' partisanship and vote choice. It was
considered that corruption and perceived corruption may act to diminish confidence in
the institutions of democracy and lead citizens to re-evaluate their decision to
participate. Whereas the effect of perceived corruption on such calculations is tangible
(for instance, if I believe electoral institution X is corrupt, I do not see the point in
voting and hence will not), it was noted that the contextual, national level of
corruption may also have an impact, and it is important that it is understood why this
is the case. It implies that regardless of what a citizen thinks about corruption, their
behaviour or direction of political support may independently be affected by the
aggregate level of corruption in politics. In earlier chapters it was elaborated as to
why this may be the case. Essentially, if a nation is corrupt, then some citizens may
recognise this or other signals that tie to corruption, perhaps a lack of elite
responsiveness, and may react by participating in certain ways. This 'core' of citizens
may initiate others to participate as if they held similar beliefs. If the core neglect
institutional participation and prefer extra-institutional mechanisms by which to
express their political demands, then well-trodden paths by which such demands are
expressed may be pursued by others outside of this 'critical mass'. Similarly, anger at
government perceived to be corrupt or unresponsive may incline voting for the
opposition, and this shift in support may induce a 'bandwagon' effect. An opposition
a
-209-
Political Corruption, Public Opinion, and Citizens' Behaviour
party may gain greater financial resources by which to campaign after an initial
increase in support, their agenda may become better publicised, the feasibility of their
winning may increase, encouraging votes from other citizens who may or may not
believe the incumbent is corrupt but dislikes them nonetheless. So perceived
corruption alone is not the only predictor by which our analysis should depend.
Modelling should integrate the contextual effect of national level corruption in cross-
national analysis, and for this reason analysis involving a national level measure of
corruption was undertaken.
The importance of either national level corruption or perceived corruption at
the individual level having an effect on political participation and political support is
clear. If high levels of contextual corruption or perceived corruption induce
subversive extra-institutional participation, or diminish confidence in established
democratic institutions and hence lower levels of institutional participation, we may
fear for the legitimacy of governments and their regimes. In consolidated democracies
this may, beneficially, give rise to demands for reform. Or, detrimentally, apathy
towards politics prompted by the perception that politicians are corrupt may mean
citizens believe there is little point in using institutional avenues to change their
behaviour. In developing democracies, threatening the legitimacy of precarious
democratic regimes carries with it a danger of undermining a new regime which has
yet to have a well-grounded democratic 'safety valve' to cope with such disaffection.
The thesis therefore required adequate measures or proxies of contextual
corruption and perceived corruption, yet this was troubled by methodological
difficulties. As we have shown, existing measures of national level corruption suffer
from difficulties prompting the need for robust testing of their reliability and validity.
Furthermore survey questions tapping perceived corruption at the individual level are
-210-

Political Corruption, Public Opinion, and Citizens' Behaviour
often grossly inadequate: vague, and built on the assumption that the average citizen
finds the term 'corruption' unproblematic. Given the plethora of academic definitions
of corruption, it is difficult to assume that the layman will fare any better in deducing
a definition of corruption that will be shared by his contemporaries.
Thus another task of the thesis was to use specialist British data to determine
how perceptions of corruption differ from perceptions of related forms of 'bad'
government - incompetence, dishonesty, closed dealings and the like. And given that
these items and corruption are unlikely (quite validly) to be perceived by the layman
as mutually exclusive, regardless of the strict criteria academics might set for what
constitutes 'corruption', it is interesting to query how far corruption perceptions differ
from perceptions of related detrimental characteristics of governments and institutions.
Moreover, given that research has already been undertaken in some nations on the
characteristics of citizens that make them more or less censorious of corruption, and
also more or less inclined to believe that there is considerable corrupt activity in
reality, it seemed prudent to undertake the same form of analysis using the British
case study. This area, in the British context, is simply under-researched.
Key Findings, Their Wider Implications, and Future Avenues for
Research
It is of heuristic value to break down our discussion of findings into four smaller,
digestible research themes that were covered in this thesis. Their ordering will
roughly follow the order in which they were considered in the preceding chapters.
First, did we find or develop an adequate measure of national level corruption and
perceived corruption, and how did any retrieved items associate with other, related
-211 -
Political Corruption, Public Opinion, and Citizens ' Behaviour
measures? Second, did perceived corruption and corruption as a contextual effect
impact political participation? Third, once we found an operational measure of
perceived corruption in the British case, what determined it? What, in the UK, made
citizens think about political corruption in different ways? Fourth, did perceived
corruption and corruption as a contextual effect impact partisanship and vote choice?
Let us take these themes in turn.
1. Measuring national level corruption and individual level perceived corruption:
Have we found an unproblematic measure of national level corruption that pinpoints
exactly how much and what type of corruption each nation under analysis endures?
Alas the answer is unsurprisingly no. The elusive nature of corruption makes this task
impossible. But we have made inroads into the form of careful analysis that should be
undertaken to establish a measure of corruption that has value for quantitative analysis.
This work may help strengthen the case that scholars cannot blindly rely on one or
other index of corruption without careful checks regarding the two criteria of
reliability and validity.
In regard to the former criterion, reliability, the choice of the Transparency
International CPI as the key national level measure of corruption was partly justified
by correlating it with competing scales of corruption. These competing scales were
constructed using similar and different methodologies, embracing external and
internal perceptions of political phenomena. The high degree of correlation between
the indices suggested that it was appropriate to proceed with empirical analysis using
the CPI, but with awareness that we rely heavily on the perceptions of businessmen,
who may not be analysing their own nation. It was acknowledged that this may lead to
bias if such perceptions are guided only by the feasibility of corruption harming
-212-
Political Corruption, Public Opinion, and Citizens' Behaviour
investment, as this may prevent consideration of other forms of behaviour that, when
referenced to the academic definitions of corruption, may still be considered corrupt.
This point links to the second criterion validity. The CPI conceives of
corruption as a broad phenomenon, and informant surveys include questions that are
couched in simple terms gauging the extent to which unspecified forms of
'corruption' or 'bribery' occur. It cannot inform us of levels of corruption among
different types of public officials, nor pinpoint levels of particular types of corruption,
nor identify how serious the corruption might be. This is, as it has been argued,
indicative of the trade off between theoretical precision and the viability of empirical
analysis that is involved in academic work of this kind. It is near impossible to solve,
but important to recognise. We must aim for operational variables rather than
theoretical completeness, no matter how desirable attaining both of these things may
be. We can assert only that future research should a) consider more directly how
measures of corruption fit with theoretical definitions of corruption, as their
consideration is crucial to understanding how the validity of such measures may be
compromised; and b) take heed of the pertinent criticisms of established indices by
scholars such as Kalnins (2005), Johnston (2002), Sik (1999, cited in Hungarian
Gallup Institute, 1999), and Knack and Azfar (2000). Only when couched carefully
can we have confidence in knowing exactly what we are doing when we include a
corruption index in statistical models.
Another objective of the thesis was to analyse perceived corruption in Britain
in a relative sense. That is, how perceived corruption was positioned relative to other,
potentially related perceptions. We saw, using factor analysis, that two survey items
that fit with academic conceptions of corruption were distinct from a cluster of other
items. This distinction was sufficient for the corruption-related items to form an
-213-
Political Corruption, Public Opinion, and Citizens ' Behaviour
independent factor valid for use in empirical analysis. We also saw, overall, that
British citizens believed there to be less corruption in public life compared to other
forms of misdemeanour, and were more censorious of corrupt behaviour than of other
misdemeanour.
The wider implication of this is heartening. It suggests that the 'critical
citizens' identified by Norris et al (1999) are more critical and discerning than we
might have thought. Corruption is considered different from and distinct to lie-telling,
incompetence, and having closed government. More broadly, we might suggest that
future research takes advantage of the nuances of citizen perceptions. If corruption is
perceived differently from other, related perceptions, then it may be helpful to break
down clusters of questions driving conflated constructs such as confidence or trust in
government, and analyse how perceptions of different forms of misdemeanour inform
them.
2. Does perceived corruption and corruption as a contextual effect impact political
participation?
Some rich results were obtained in the empirical chapters questioning how contextual
corruption and perceived corruption affect political participation. It was found that
when regressed against both national level and individual level measures of
participation, turnout displayed an inverse correlation with national level corruption
and, to a weaker extent, perceived corruption. However, this association was weak
enough not to show at all in the British model, and no association was found between
perceived corruption and a general measure of institutional behaviour either. The
turnout results indicated that disaffection caused by corruption, principally in terms of
the contextual effect of the form outlined earlier, led citizens to abstain from voting.
-214-
Political Corruption, Public Opinion, and Citizens' Behaviour
In terms of extra-institutional behaviour, national level corruption displayed a
nonlinear effect. Levels of extra-institutional participation were found to be higher
among a) nations that were highly clean, perhaps prompted by the notion that
responsive politicians would react to any form of participation (the 'efficacy' effect);
and b) among nations that were highly corrupt, perhaps stimulated by citizen
grievances and distrust in institutions (the 'disillusionment' effect). These contextual
effects were not washed out with the inclusion of perceived corruption; they existed
independently. Individual level perceived corruption, meanwhile, was found to have
some effects on extra-institutional behaviour. Cross-national models showed that
greater perceived corruption predicted more extra-institutional participation, but that
this result was very weak. A comparable result was found in the British case.
These findings have a considerable impact because they greatly expand our
understanding of how corruption and participation relate. And, as multilevel
modelling proved so useful in integrating national level corruption into models of
participation alongside individual level variables, it is proposed broadly that future
research into political attitudes or behaviour considers the potentially important
effects of contextual variables.
Yet what do these findings tell us about democracy and democratic prospects
more widely? This question is best answered by recognising first that the impact of
corruption may vary according to the nature of the regime under analysis. To think
about this further, we might introduce Johnston's (2005) typology of four corrupt
regimes, which gives us scope to break down the possible consequences in depth. In
the first of Johnston's types, 'influence market' regimes, in which institutions are
generally strong but politicians can act to mediate corrupt exchanges, the impact of
corruption is to diminish trust and legitimacy. These regimes are likely to have low
-215-

Political Corruption, Public Opinion, and Citizens ' Behaviour
Corruption Index scores. The participatory consequences of instances of corruption in
such regimes may further exacerbate the drop in trust and legitimacy Johnston notes.
If corruption lowers turnout, this hardly bodes well as an indicator of a regime having
high levels of legitimacy. Consequently, in terms of a spectrum of democracy, it is
hard to see how such detrimental effects on trust and legitimacy can help such
regimes progress from 'liberal' democracies to 'advanced' democracies, as Schedler
(1998) conceives of them. Indeed, Schedler's conception of the distinction between
the two is vague, although our findings may shed light on them. While liberal
democracies are those in which there are: "civil and political rights plus fair,
competitive, and inclusive elections" (p. 92), Schedler suggests advanced
democracies: "presumptively possess some positive traits over and above the minimal
defining criteria of liberal democracy" (p. 93). We might postulate that Western
regimes liable to have 'influence market' corruption may not meet such an 'advanced'
democratic status if this corruption hinders institutional participation such as turnout
in the ways we have predicted. This also sets a more definite requirement for what is
required to obtain 'advanced' democratic status. Further research which similarly
takes on Schedler's implied question of exactly which 'positive traits' progress liberal
democracy would be welcomed.
Johnston's second conception of a corrupt regime is one in which there are
'elite cartels' with less powerful institutions and elites that compete unfairly for power
and resources, hindering competition and development. Although there is substantial
corruption in such regimes, the rule of law appears not to be entirely absent. Instead,
we see such regimes are uneven playing fields, although institutions are in place such
that some degree of competition for resources may take place. Hence, we might
impute that such fairly corrupt nations would have mid-level Corruption Index scores.
-216-
Political Corruption, Public Opinion, and Citizens' Behaviour
Consequently, relative to cleaner nations, such states are liable to have lower voter
turnouts. They are also likely to have limited extra-institutional participation relative
to other states that have both more and less corruption, if we take into account the
nonlinear effects found to exist between national level corruption and extra-
institutional behaviour. All this implies low political engagement, so to strengthen
democracy surely requires breaking elites' holds on public servants and a stronger
participatory citizenry may help do this. This is undoubtedly difficult, and this is
prescriptive, but this analysis gives us some indication of how democratic
consolidation may be further hindered by corruption's impact on participation.
The third and fourth types of corrupt regimes outlined by Johnston we may
conflate as those regimes likely to have high Corruption Index scores; they are also
likely to be more authoritarian, or in the early stages of democratic transition or
consolidation. They comprise 'oligarch and clan corruption', wherein oligarchs have
considerable illegitimate power amid few checks and balances, and may behave
unpredictably; and 'official mogul' regimes in which, under very weak institutions,
corruption is rife and civil society and liberalisation are under threat. Our cross-
national models predict that such regimes will experience very low turnout, and
considerable extra-institutional behaviour. Under these conditions, we can anticipate
that democratic institutions are unlikely to develop legitimacy: they have little from
the outset and citizens failing to use them as part of their participatory activity will
only perpetuate this. We might also anticipate instability and unpredictability. Just as
outcomes at the elite level come about from illicit exchange rather than transparent
politics, citizens' behaviour may be similarly unpredictable if it takes place outside
institutional arenas. These behavioural consequences may therefore be significant if
they contribute to the failure of democratic institutions to put in place procedures and
-217-
Political Corruption, Public Opinion, and Citizens ' Behaviour
nghts fundamental to democracy, and if they serve to increase societal instability.
Under these conditions, the challenges for democratising regimes will be very
demanding.
3. The determinants of perceived corruption in the UK:
There were two key perceptions whose determinants we sought to predict in the
British case study. The first related to censoriousness of corruption, or the degree to
which respondents do not tolerate it. The second related to the extent to which there is
deemed to be corruption among British public officials. The findings were interesting:
in the face of literature which suggests that socioeconomic and demographic factors
have considerable influence on citizens corruption perceptions, in the British case
these factors were largely insignificant. They were better explained by related
attitudinal factors. Socioeconomic and demographic divides failed to incline citizens
to be particularly censorious of corruption, nor incline them to perceive particularly
high quantities of it.
In regard to the established literature, this result is not worrying. Analysis of
the body of research into similar perceptions, across different nations, reveals that
socioeconomic and demographic factors tend to have contradictory effects that differ
among studies (see Gorta and Forell, 1994). Thus there is no consensus about how our
variables should have predicted perceptions of corruption. Furthermore, it is striking
that the previous work summarised by Gorta and Forell (1994) fails to control
comprehensively for political attitudes in the way we did. Thus the previous literature
appears rather inadequate. It is suggested that any future research intending to probe
the determinants of perceptions of corruption should include a range of attitudinal
variables. Without them, we are uncertain if socioeconomic and demographic factors
-218-
Political Corruption, Public Opinion, and Citizens' Behaviour
are really explanatory, or whether they just proxy coherent attitudes among particular
groups.
Indeed, our results indicate the primacy of attitudinal factors in explaining
corruption censorious and perceived corruption in real politics. The finding that
socioeconomic and demographic items were less explanatory might be ascribed to
relatively little social division in British society failing to prompt, say, lower echelons
(who may lose out from corruption more) being any more censorious or perceiving
more corruption than higher echelons. But it may also tell us something wider in
regard to theories of political trust. Mishler and Roses's (2001) distinction between a)
the cultural approach to political trust, in which socialisation prompts different levels
of trust according to socioeconomic and demographic backgrounds, and b) the
institutional approach to political trust, which sees trust as a function of citizens'
responses to institutional performance, was argued to be helpful as ways of thinking
about perceptions of corruption when we apply the reasoning equivalently. Our results
lend themselves to an institutional approach. It is attitudes towards politics, partly in
reaction to institutional performance, that determine corruption censoriousness and
perceived corruption incidence; it is not perceptions that arise from socioeconomic
and demographic groups experiencing similar processes of socialisation. However, it
is important that we are cautious not to exaggerate the explanatory power of
attitudinal variables. The strongest predictor of both dependent variables was in each
case a scale comprised of attitudes towards other standards-related issues, even
though factor analysis disentangled these from the corruption-related items.
Furthermore, not all the attitudinal variables displayed statistically significant effects.
Nevertheless, by lending themselves to an institutional approach, the results
are congruent with Mishler and Rose's own findings regarding political trust. And as
-219-
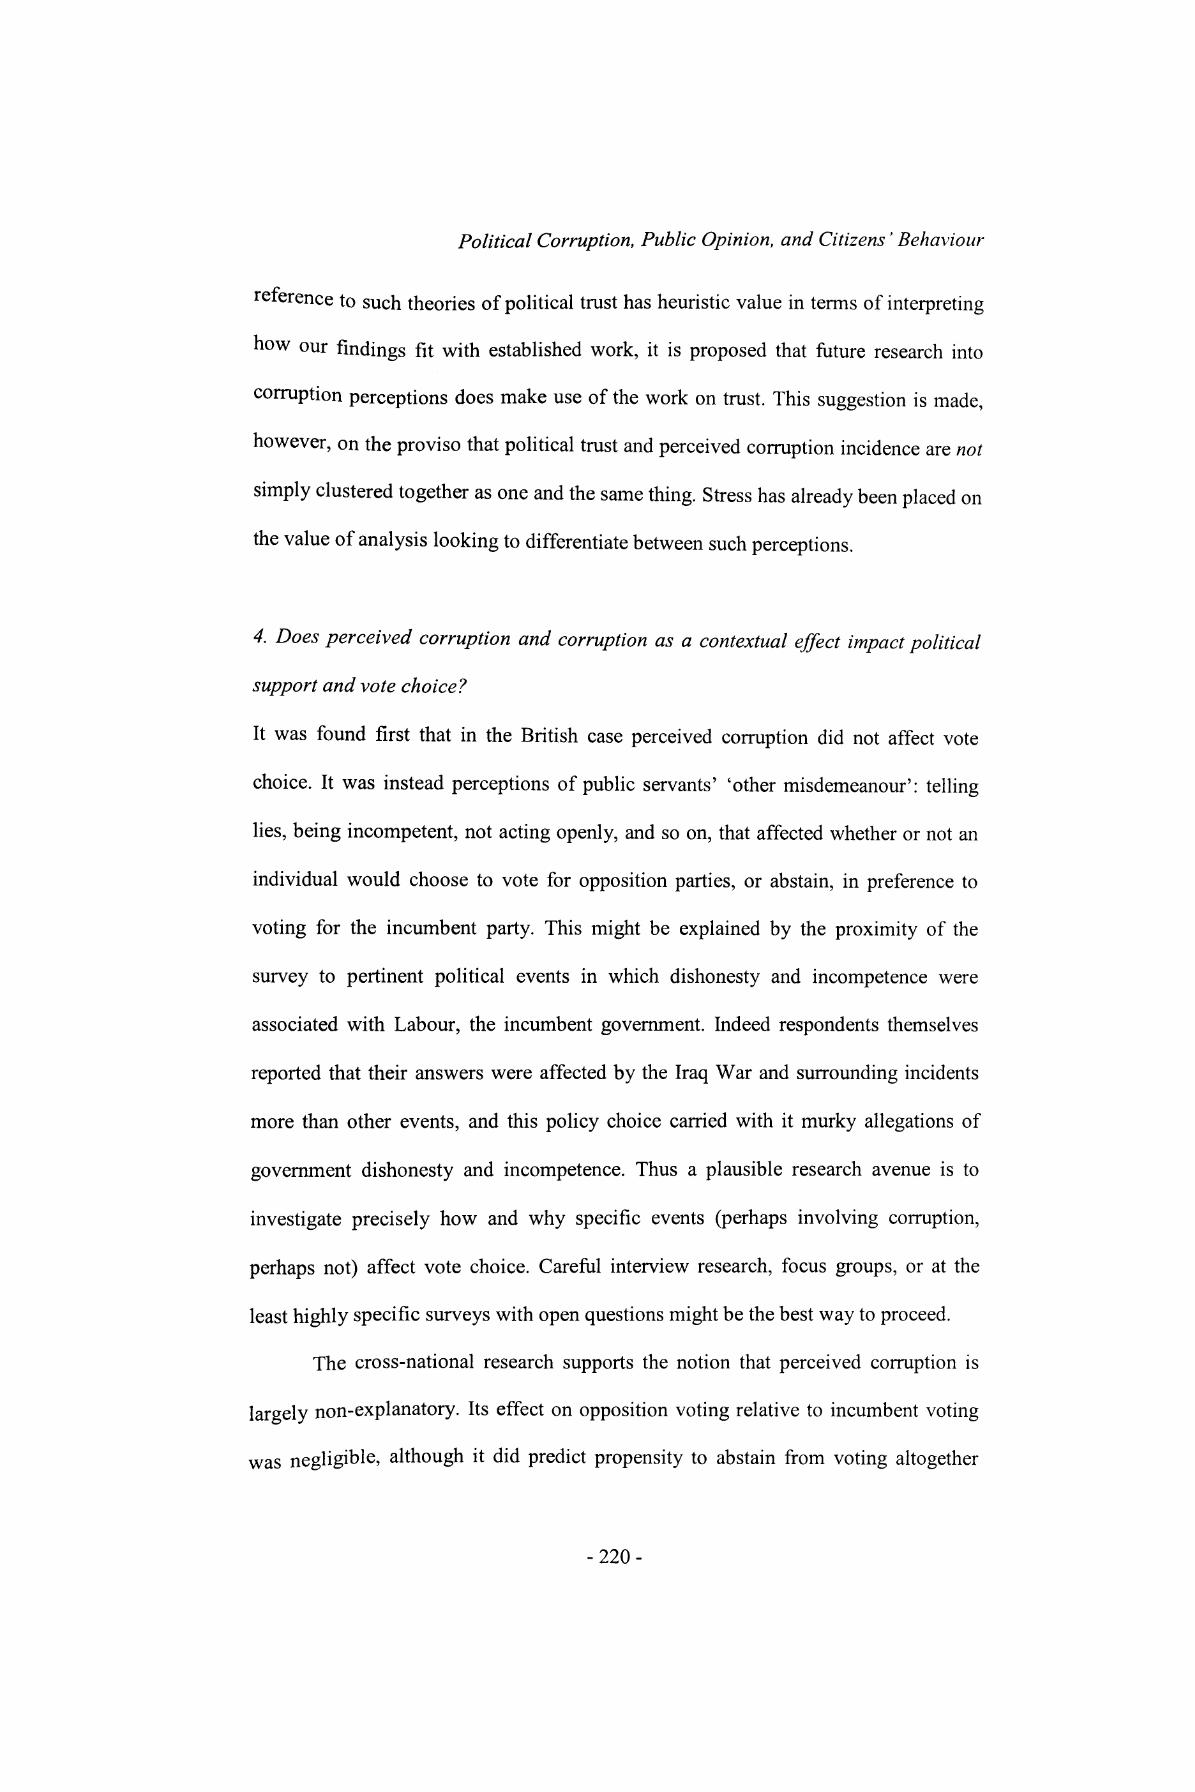
Political Corruption, Public Opinion, and Citizens' Behaviour
reference to such theories of political trust has heuristic value in terms of interpreting
how our findings fit with established work, it is proposed that future research into
corruption perceptions does make use of the work on trust. This suggestion is made,
however, on the proviso that political trust and perceived corruption incidence are not
simply clustered together as one and the same thing. Stress has already been placed on
the value of analysis looking to differentiate between such perceptions.
4. Does perceived corruption and corruption as a contextual effect impact political
support and vote choice?
It was found first that in the British case perceived corruption did not affect vote
choice. It was instead perceptions of public servants' 'other misdemeanour': telling
lies, being incompetent, not acting openly, and so on, that affected whether or not an
individual would choose to vote for opposition parties, or abstain, in preference to
voting for the incumbent party. This might be explained by the proximity of the
survey to pertinent political events in which dishonesty and incompetence were
associated with Labour, the incumbent government. Indeed respondents themselves
reported that their answers were affected by the Iraq War and surrounding incidents
more than other events, and this policy choice carried with it murky allegations of
government dishonesty and incompetence. Thus a plausible research avenue is to
investigate precisely how and why specific events (perhaps involving corruption,
perhaps not) affect vote choice. Careful interview research, focus groups, or at the
least highly specific surveys with open questions might be the best way to proceed.
The cross-national research supports the notion that perceived corruption is
largely non-explanatory. Its effect on opposition voting relative to incumbent voting
was negligible, although it did predict propensity to abstain from voting altogether
-220-

Political Corruption, Public Opinion, and Citizens ' Behaviour
relative to voting for the incumbent, congruent with the earlier, general model of
turnout. Yet we see a stronger contextual effect of corruption congruent with work on
participation. Non-voting relative to incumbent voting is predicted by increased
corruption in politics, when measured at the national level. This is again compatible
with the same finding relating to turnout more broadly. As it is a contextual effect, it
appears that abstention is a 'path' shaped by some individuals' unwillingness to vote
based on their perception of considerable levels of corruption or elite non-
responsiveness, and once this path is well-trodden, others are inclined not to vote too.
Essentially, it becomes a norm not to vote, and this effect shows through not just
when modelling turnout generally, but when modelling non-voting against incumbent
voting more specifically.
It is interesting that a contextual effect of this form is not noticed when we
model propensity to vote for opposition parties against the incumbent. Hence
corruption is presumably related more to institutions than it is particular political
parties. The effect concerns withdrawal from electoral politics rather than increased
propensity to vote for other, potentially reformist, parties. To address this problem, we
can make only prescriptive suggestions based on the set of research themes analysed:
that the opposition party states credibly that it recognises any problem of corruption
or elite non-responsiveness - including corruption seemingly entrenched in political
institutions; that it differentiates it from other phenomena to raise awareness of how
censorious voters should be; and that it seeks to capture support from those who
would otherwise withdraw from electoral institutions or participate more readily in
extra-institutional participation. With these strategies in place, the opposition party is
in a better position to gain support, and with any electoral benefit comes, we would
hope, a benefit for the country generally, as a credible commitment to corruption
-221 -
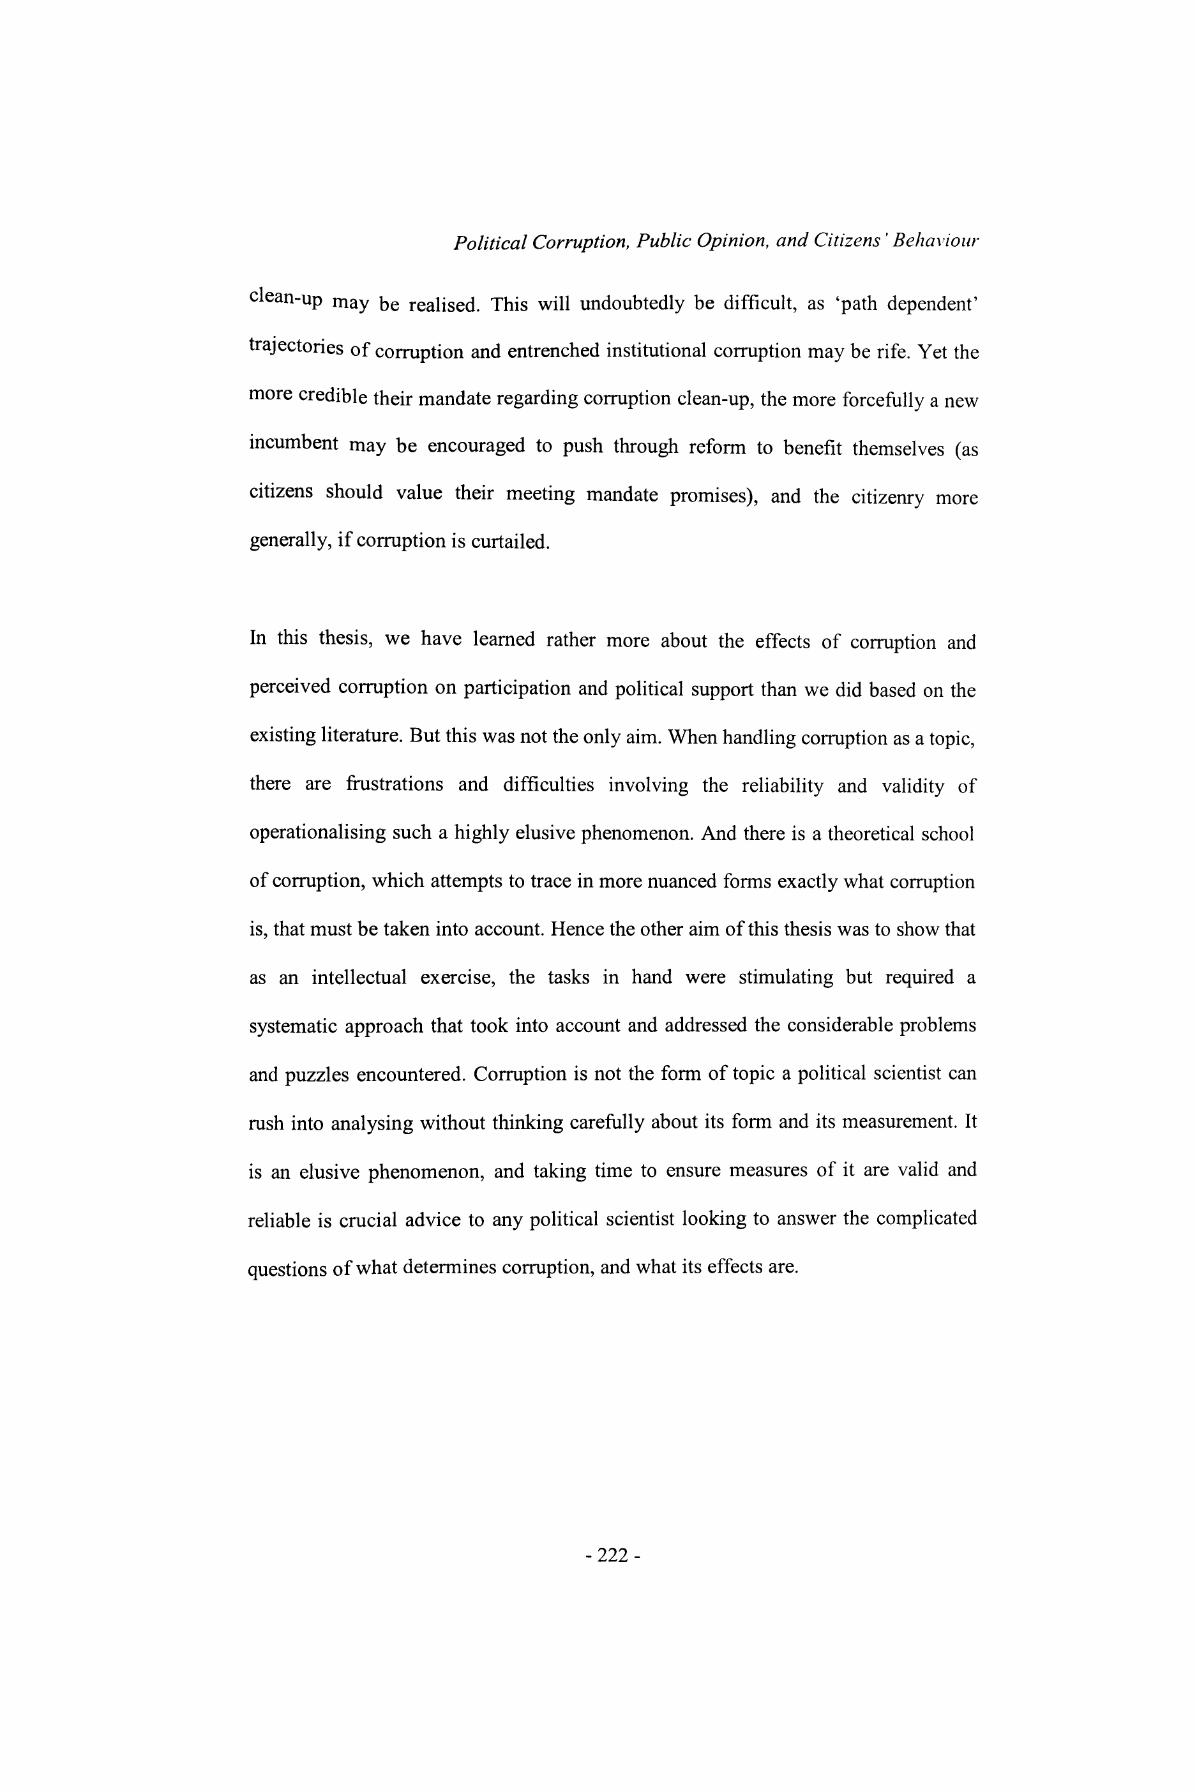
Political Corruption, Public Opinion, and Citizens ' Behaviour
clean-up may be realised. This will undoubtedly be difficult, as 'path dependent'
trajectories of corruption and entrenched institutional corruption may be rife. Yet the
more credible their mandate regarding corruption clean-up, the more forcefully a new
incumbent may be encouraged to push through reform to benefit themselves (as
citizens should value their meeting mandate promises), and the citizenry more
generally, if corruption is curtailed.
In this thesis, we have learned rather more about the effects of corruption and
perceived corruption on participation and political support than we did based on the
existing literature. But this was not the only aim. When handling corruption as a topic,
there are frustrations and difficulties involving the reliability and validity of
operationalising such a highly elusive phenomenon. And there is a theoretical school
of corruption, which attempts to trace in more nuanced forms exactly what corruption
is, that must be taken into account. Hence the other aim of this thesis was to show that
as an intellectual exercise, the tasks in hand were stimulating but required a
systematic approach that took into account and addressed the considerable problems
and puzzles encountered. Corruption is not the form of topic a political scientist can
rush into analysing without thinking carefully about its form and its measurement. It
is an elusive phenomenon, and taking time to ensure measures of it are valid and
reliable is crucial advice to any political scientist looking to answer the complicated
questions of what determines corruption, and what its effects are.
-222-
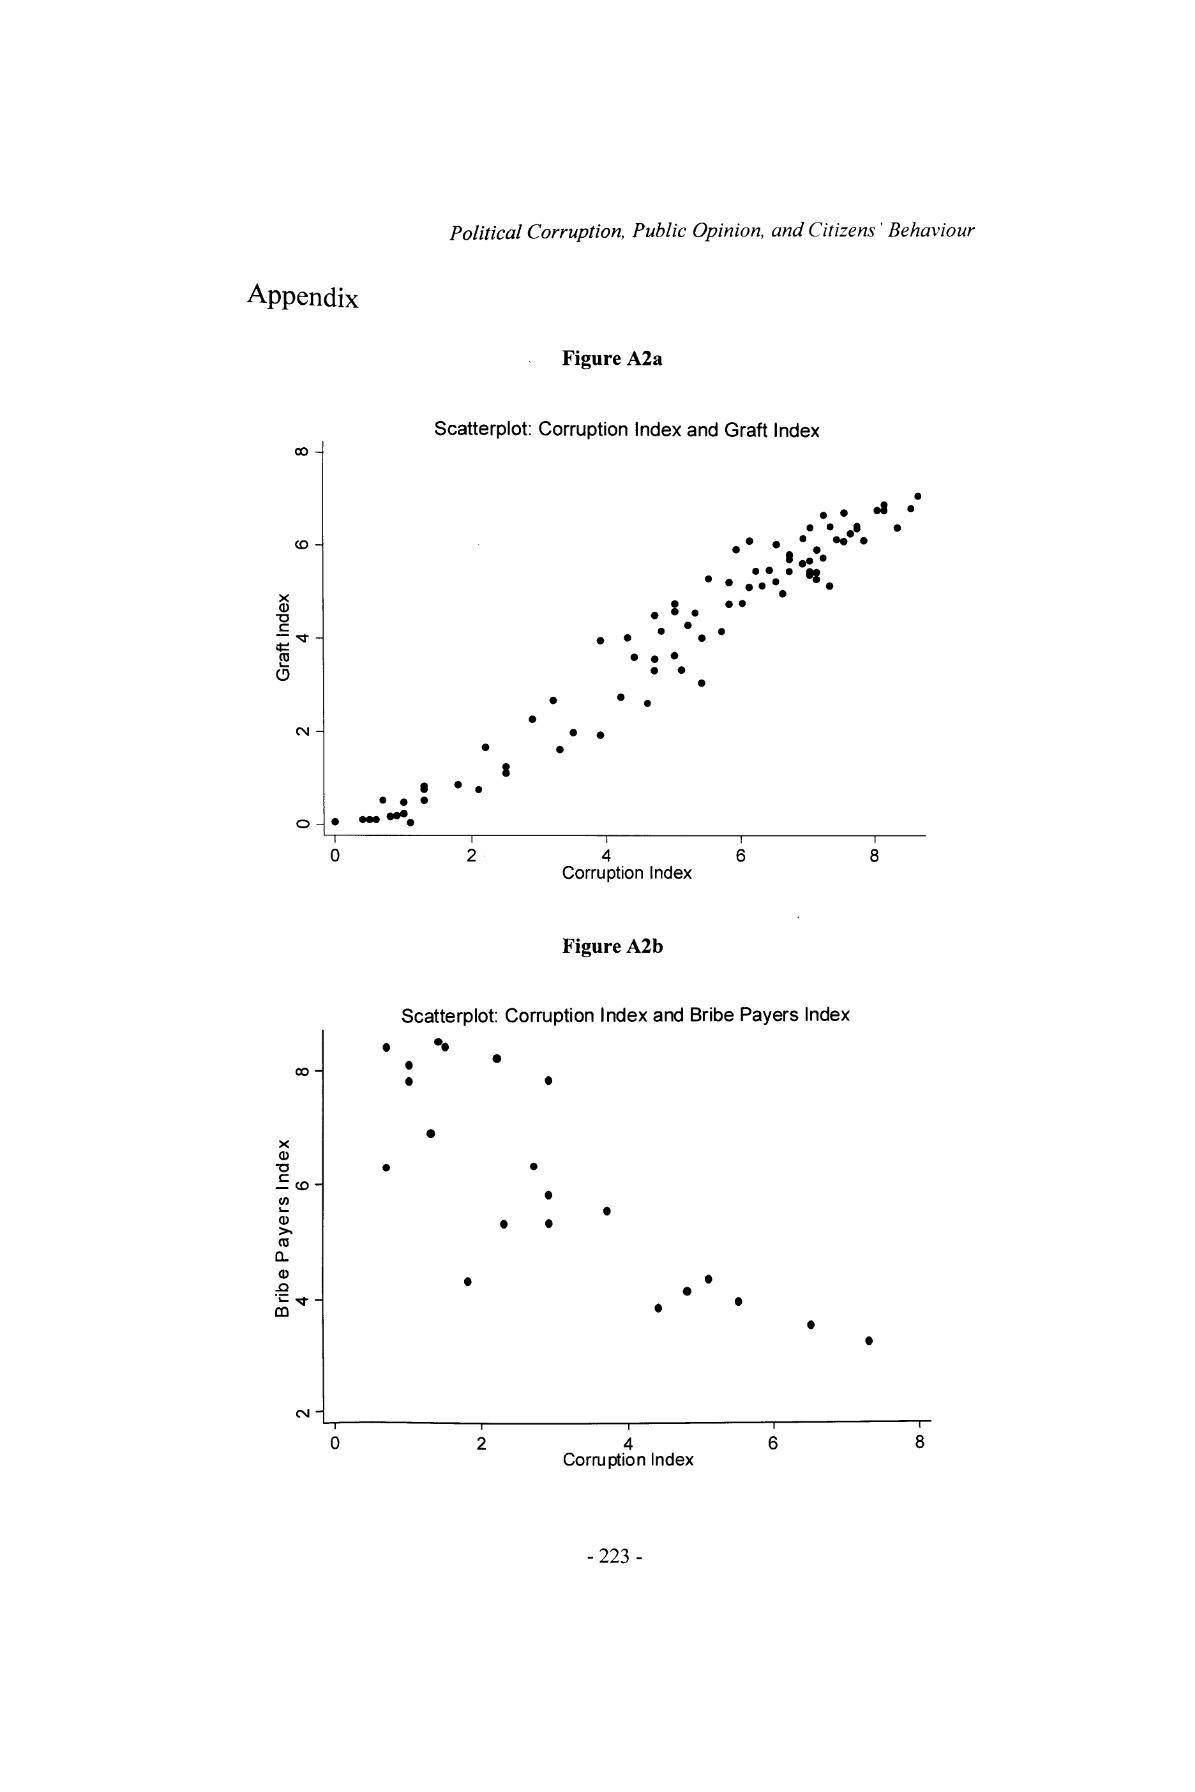
Appendix
CO -
CD -
Political Corruption, Public Opinion, and Citizens' Behaviour
Figure A2a
Scatterplot: Corruption Index and Graft Index
X<D : • • •
CO
CN -
• • •
O -—r
20Corruption Index
~r
8
00 -
Figure A2b
Scatterplot: Corruption Index and Bribe Payers Index
X0
TJ
(0i_0)>> ccQ.0) .Q'*-CD
••
CM --r
0T- 2
Corruption Index8
-223-
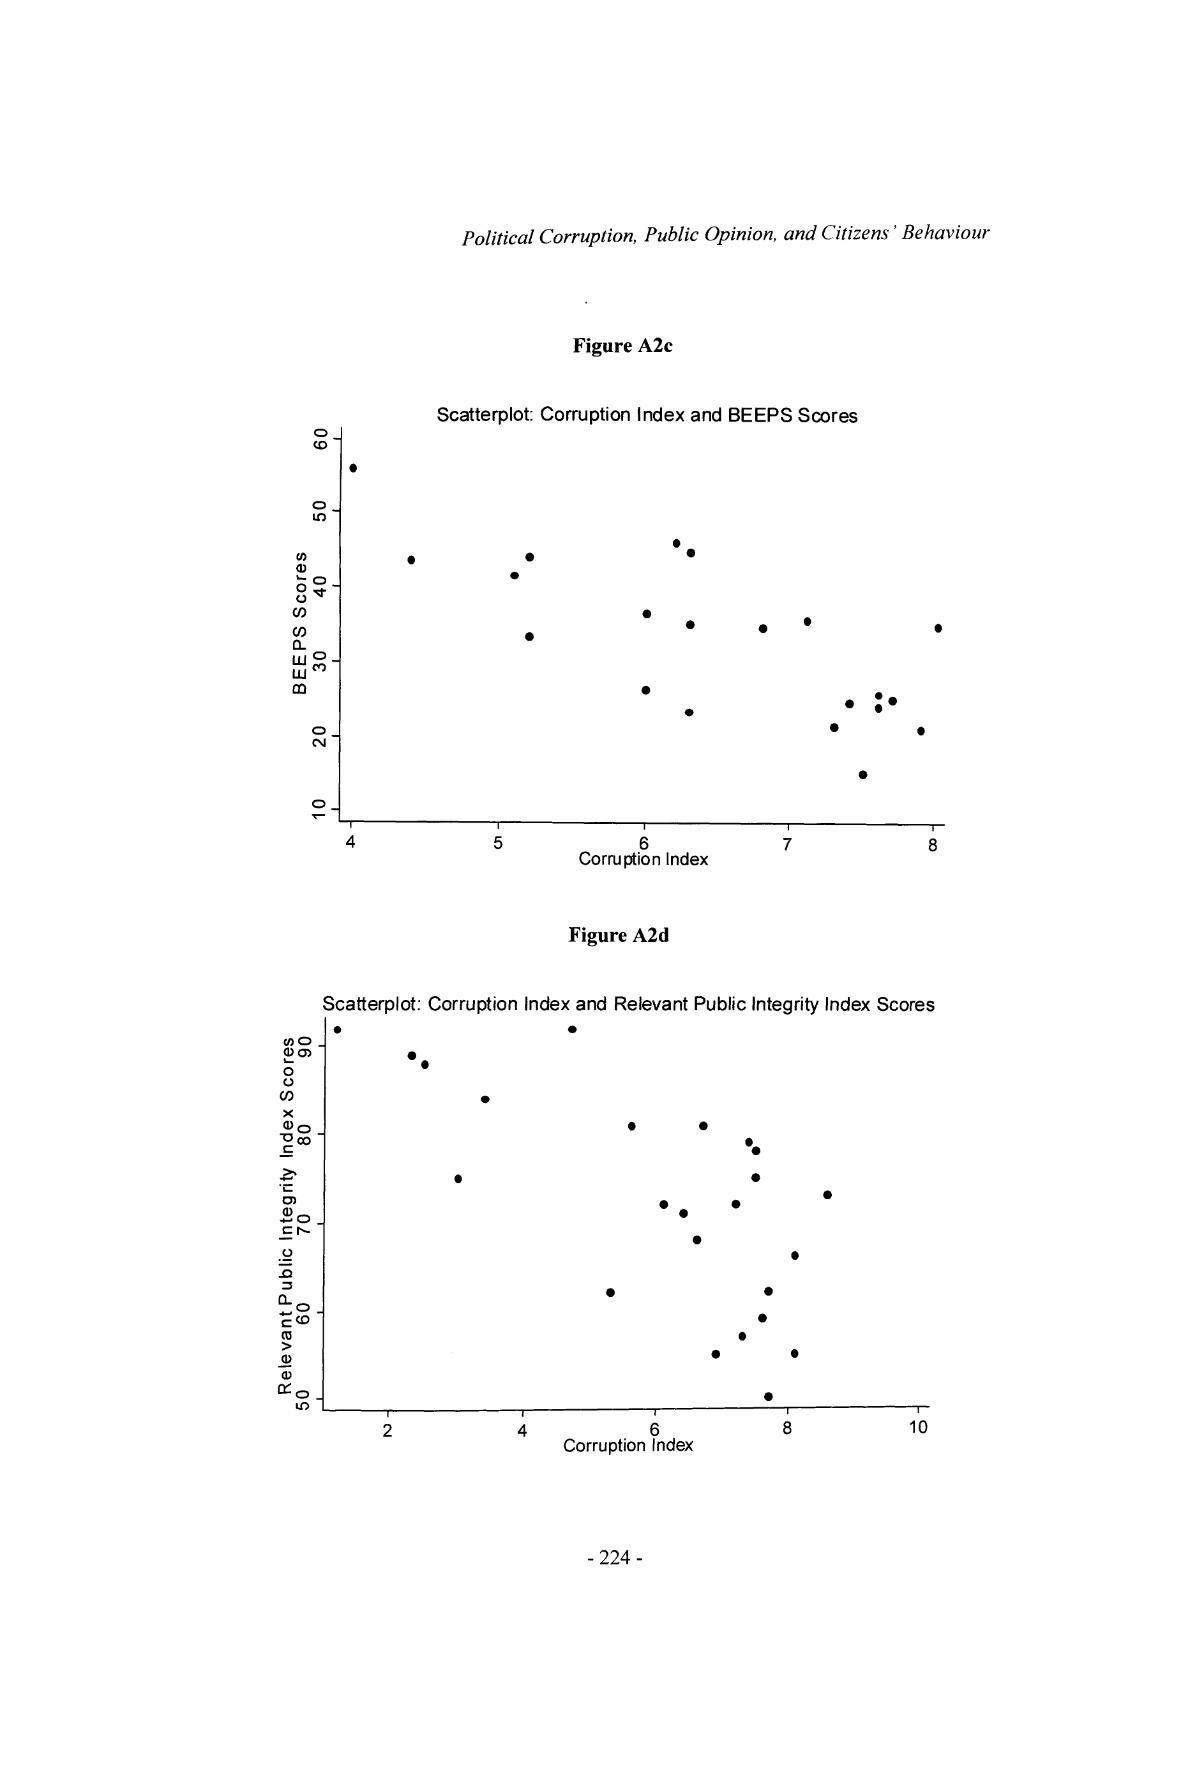
Political Corruption, Public Opinion, and Citizens' Behaviour
Figure A2c
oCO
o
(A
o
CO
CO0_
UJco
CO
oCM
o _
Scatterplot: Corruption Index and BEEPS Scores
T
5Corruption Index
—r
7 8
Figure A2d
Scatterplot: Corruption Index and Relevant Public Integrity Index Scores
cooO<35
O O
CO
XIs£»- i_D)
O
.Q
C CD (0
IO T-
2Corruption Index
8 10
-224-
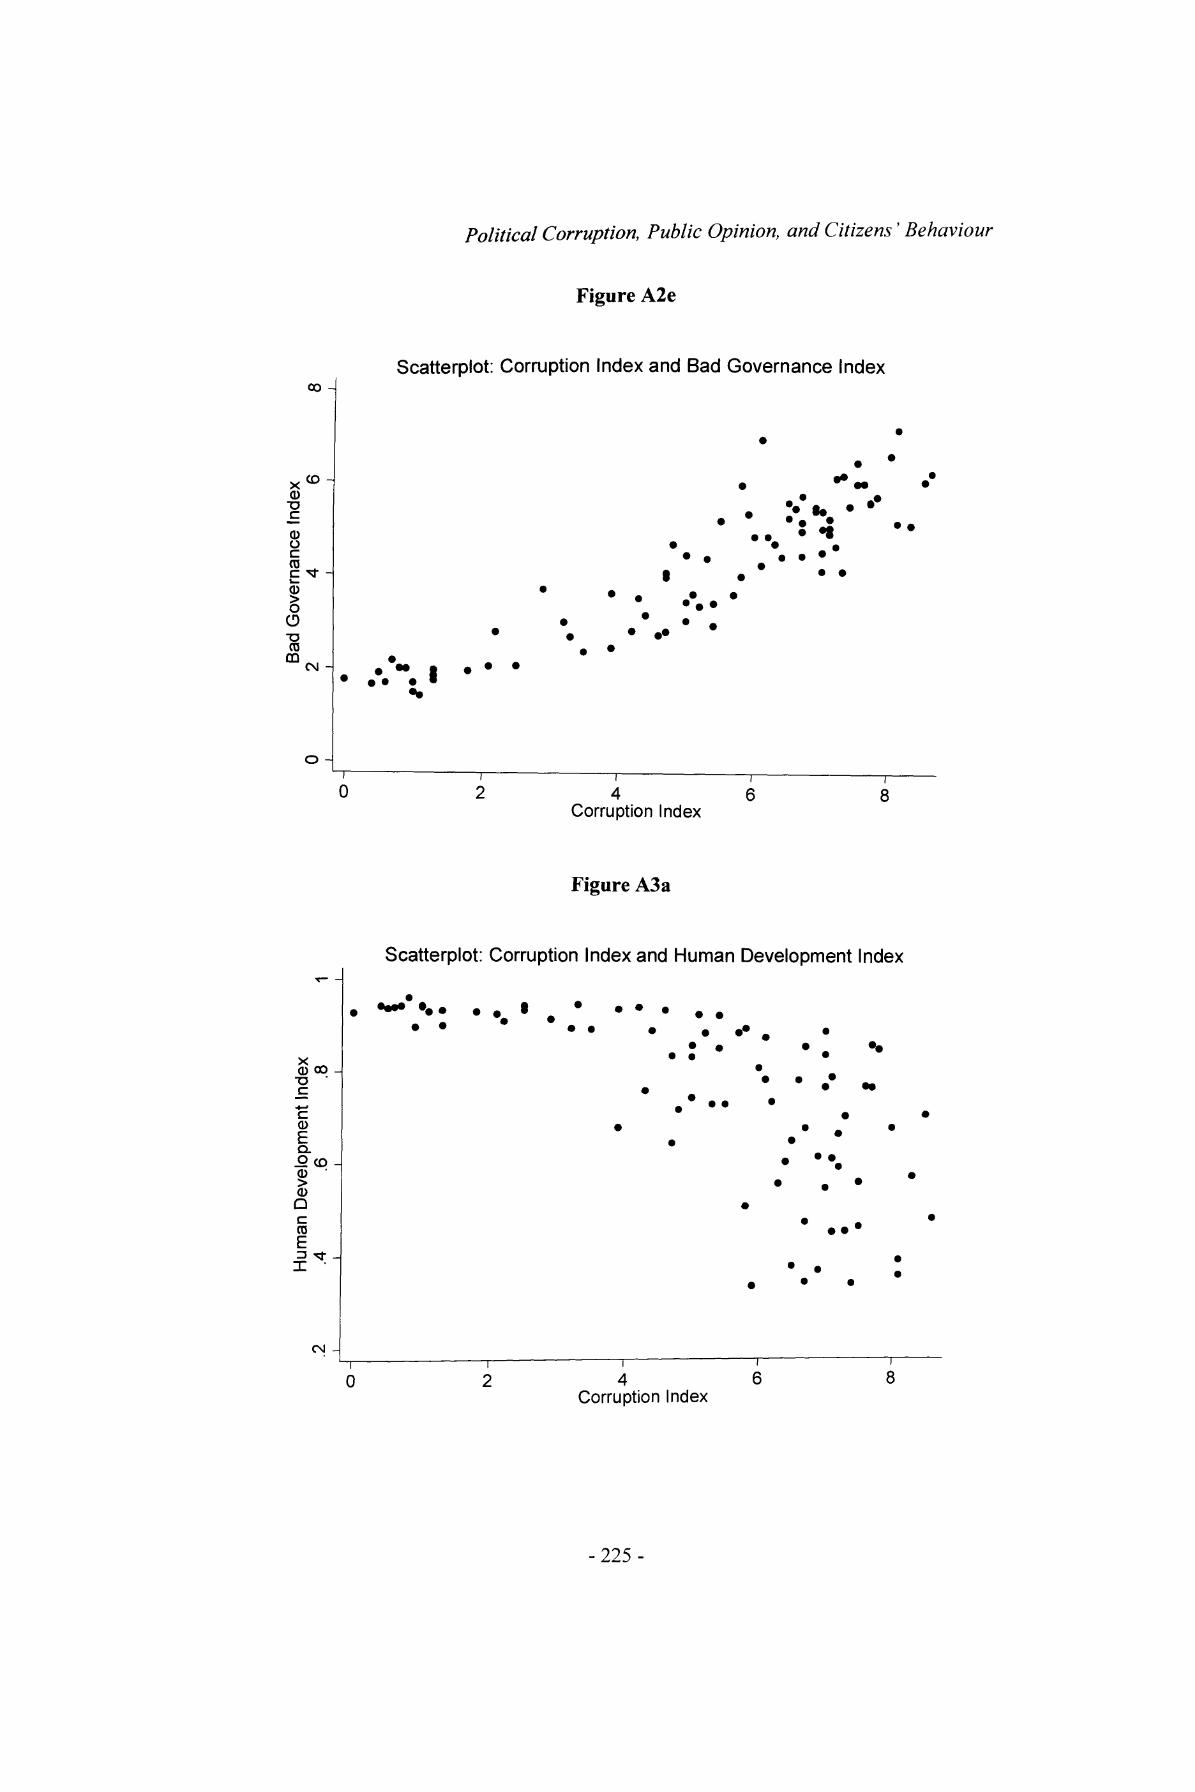
Political Corruption, Public Opinion, and Citizens' Behaviour
Figure A2e
Scatterplot: Corruption Index and Bad Governance Indexoo -4
X CD 0)
<D OcCOE o>o O •o(0
o -
• •*• .
• • • • •
I • * • «•• • • • • •• *
~. I * **•
i i i i———————————r02468
Corruption Index
Figure A3a
Scatterplot: Corruption Index and Human Development Index
000-o '_c•^—>
0
Q. £ CD'
c ro^ -^r
•• • • •
•• •
• • •
————————————————————————————i T- 02468
Corruption Index
-225-

Political Corruption, Public Opinion, and Citizens ' Behaviour
lable A3.1 Countries in the Transparency International Corruption Perception
Index 1998
ArgentinaAustraliaAustriaBelarusBelgiumBoliviaBotswanaBrazilBulgariaCameroonCanadaChileChinaColombiaCosta RicaCzech RepublicDenmarkEcuadorEgyptEl SalvadorEstoniaFinland
FranceGermanyGhanaGreeceGuatemalaHondurasHong KongHungaryIcelandIndiaIndonesiaIrelandIsraelItalyIvory CoastJamaicaJapanJordanKenyaLatviaLuxembourg
MalawiMalaysiaMauritiusMexicoMoroccoNamibiaNetherlandsNew ZealandNicaraguaNigeriaNorwayPakistanParaguayPeruPhilippinesPolandPortugalRomaniaRussiaSenegalSingapore
Slovak RepublicSouth AfricaSouth KoreaSpainSwedenSwitzerlandTaiwanTanzaniaThailandTunisiaTurkeyUgandaUkraineUnited KingdomUnited StatesUruguayVenezuelaVietnamYugoslaviaZambiaZimbabwe
Table A3.2 Countries Excluded from Chapter 3 Models
Country Variables for Which Data is Missing Excluded From Models Concerning_______
China
Hong Kong
Jamaica Malawi Namibia
Vietnam
Yugoslavia
Turnout, Compulsory Voting, Electoral System Proportionality, % Seats Largest Party Turnout, Compulsory Voting, Electoral System Proportionality, % Seats Largest Party, Demonstration Activity, Authoritarianism, Armed Conflict Union DensityUnion Density, Unemployment Size of Government
Turnout, Compulsory Voting, Electoral System Proportionality, % Seats Largest Party, Size of Government, Union Density All variables except: Corruption Index, Demonstration Activity, Authoritarianism, Armed Conflict
Turnout
Turnout and Demonstration Activity
Demonstration Activity Demonstration Activity Turnout and Demonstration Activity Turnout and Demonstration Activity
Turnout and Demonstration Activity
-226-
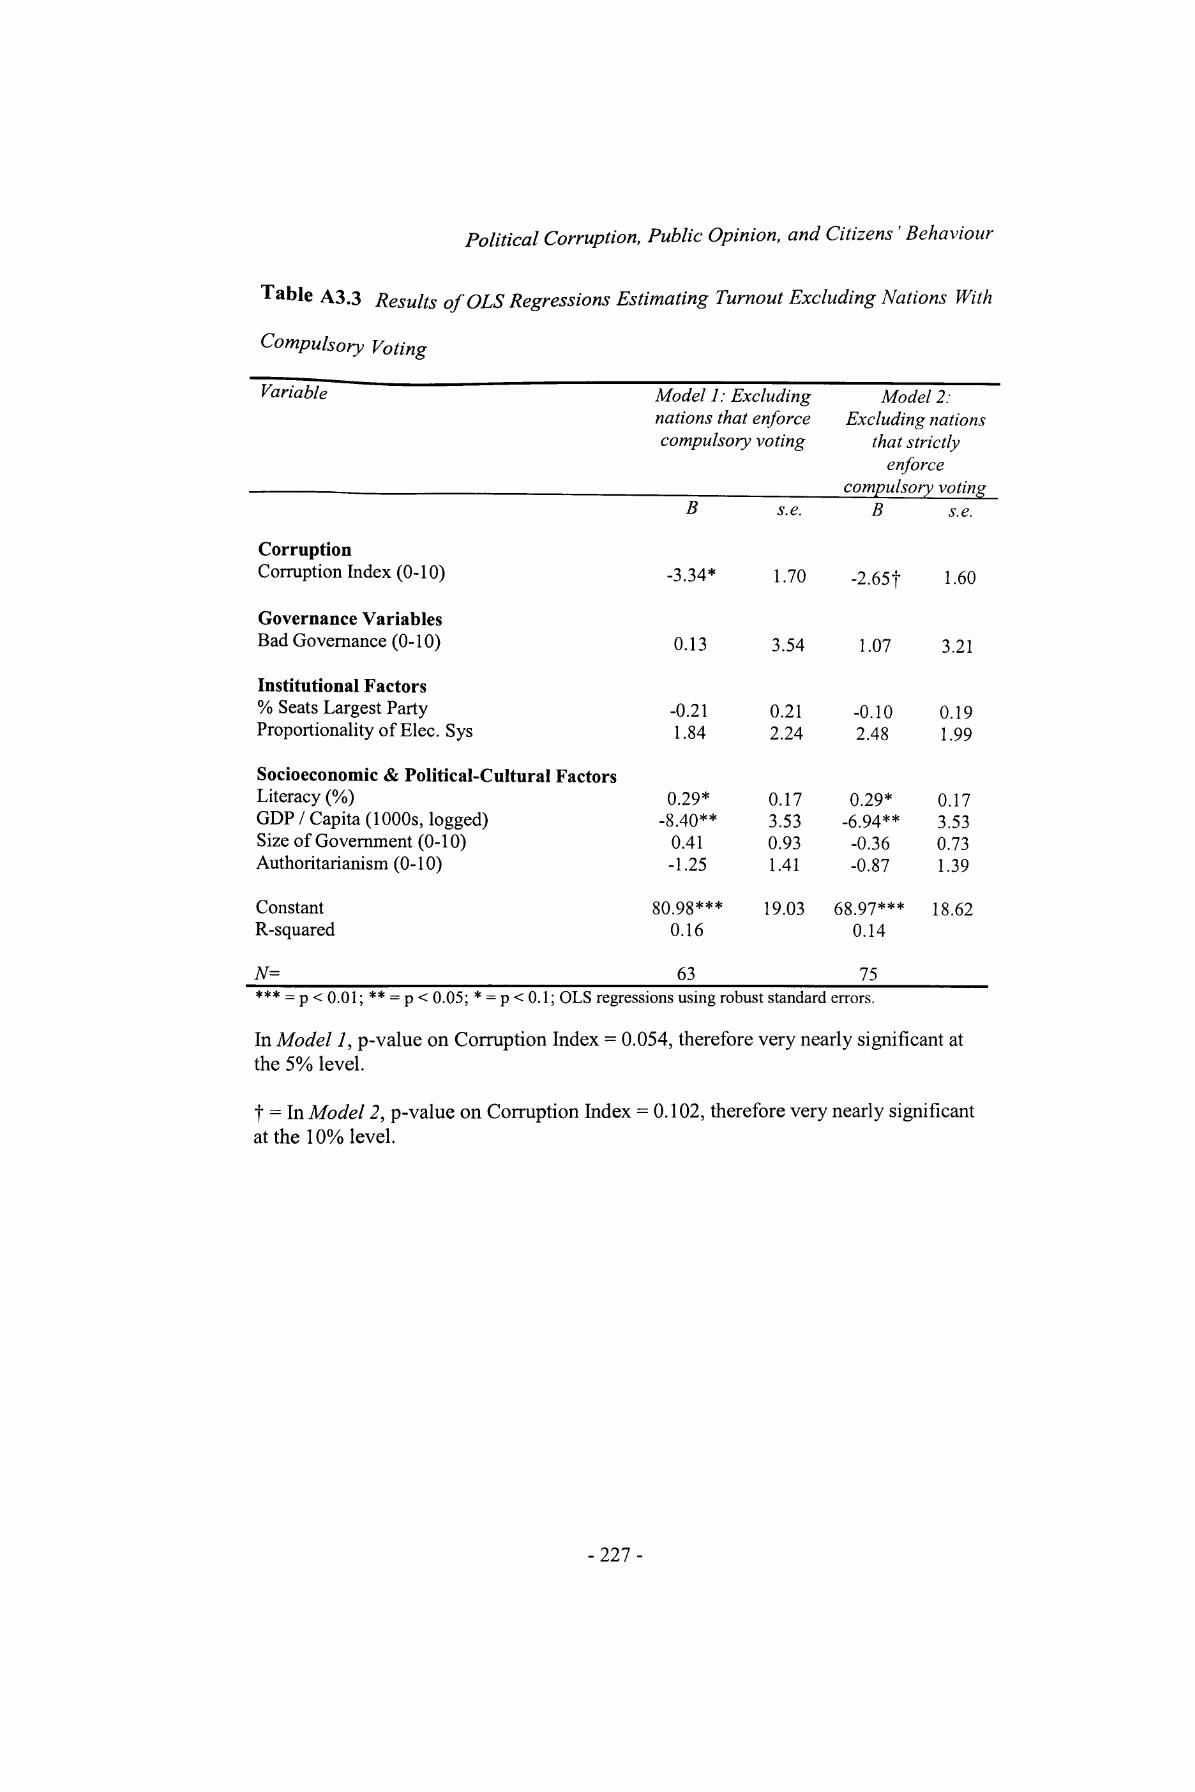
Political Corruption, Public Opinion, and Citizens' Behaviour
Table A3.3 Results of OLS Regressions Estimating Turnout Excluding Nations With
Compulsory Voting
Variable Model 1: Excludingnations that enforcecompulsory voting
Model 2:Excluding nations
that strictlyenforce
compulsory voting
CorruptionCorruption Index (0-10)
Governance VariablesBad Governance (0-10)
B
-3.34>
0.13
s.e.
1.70
3.54
B
-2.65f
1.07
s.e.
1.60
3.21
Institutional Factors% Seats Largest Party Proportionality of Elec. Sys
Socioeconomic & Political-Cultural FactorsLiteracy (%) GDP / Capita (1000s, logged) Size of Government (0-10) Authoritarianism (0-10)
ConstantR-squared
N=
-0.21 1.84
0.29* -8.40**
0.41 -1.25
80.98***0.16
63
0.21 2.24
0.17 3.53 0.93 1.41
19.03
-0.102.48
0.29* -6.94**
-0.36 -0.87
68.97***0.14
75
0.19 1.99
0.17 3.53 0.73 1.39
18.62
*** = p < 0.01; ** = p < 0.05; * = p < 0.1; OLS regressions using robust standard errors.
In Model 1, p-value on Corruption Index = 0.054, therefore very nearly significant at the 5% level.
t = In Model 2, p-value on Corruption Index = 0.102, therefore very nearly significant at the 10% level.
-227-
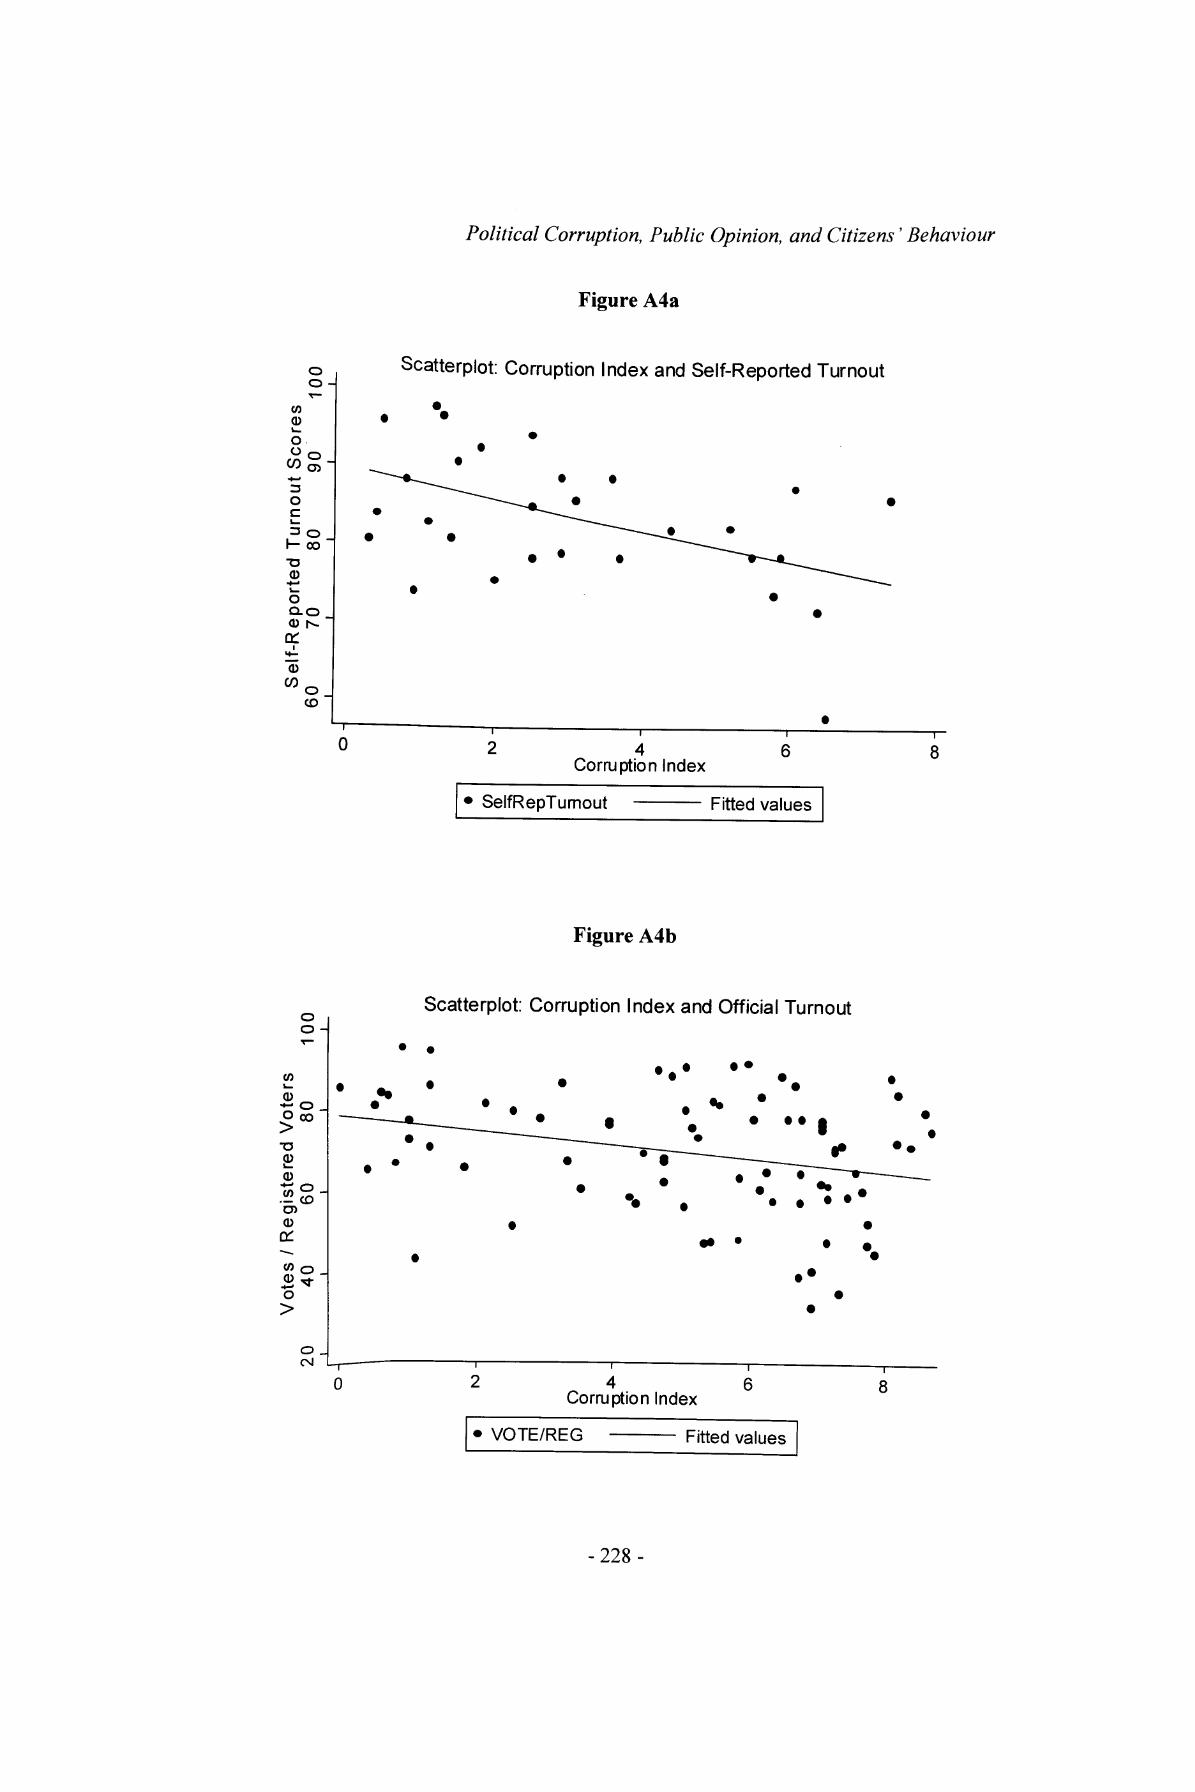
Political Corruption, Public Opinion, and Citizens' Behaviour
Figure A4a
o o
CO0i_
«§Ocl_= o I- co•oCD-I-Jl_o0.0 <D |^a:CD
COO CD
Scatterplot: Corruption Index and Self-Reported Turnout
0 2i 4
Corruption Index
i 6
SelfRepTumout Fitted values
8
Figure A4b
o o
(0
O CO
T3 0)
CD
O)0o:
o J
o _|
Scatterplot: Corruption Index and Official Turnout
0 2
•
1
4Corruption
VOTE/REG
Index
— Fitted
6 8
values
-228-
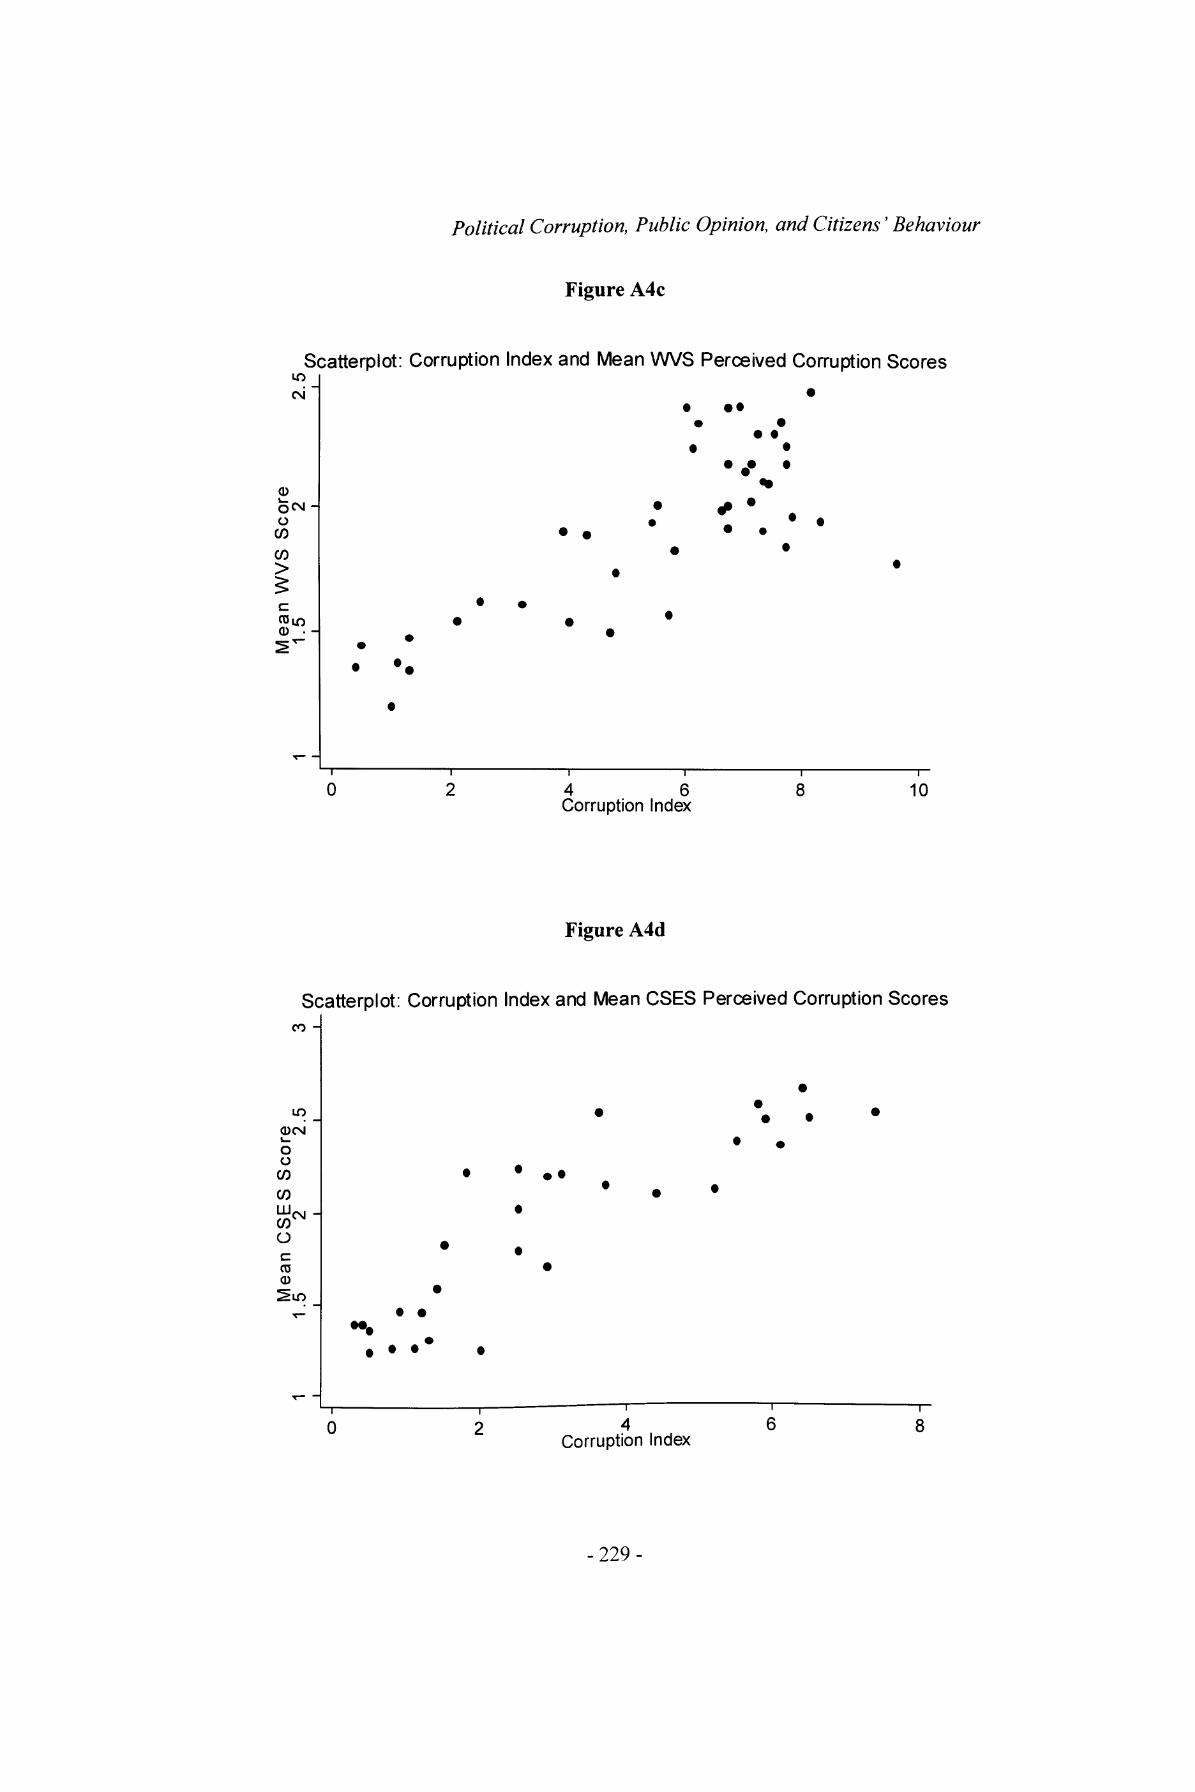
Political Corruption, Public Opinion, and Citizens' Behaviour
Figure A4c
Scatterplot: Corruption Index and Mean WVS Perceived Corruption Scores10
c\i
CD
O CO
CO
cOSo • H
• • t •.
~i—————————i—————————i—————————i—————————i—————————i—
0 2 4 6 8 10Corruption Index
Figure A4d
Scatterplot: Corruption Index and Mean CSES Perceived Corruption ScoresCO -
LO
(DCNi_O O
CO
COWCM COOcCO 0)
-i————————————i———————— i i r02468
Corruption Index
-229-

Political Corruption, Public Opinion, and Citizens' Behaviour
Table A4.1 Countries in Wave 3 of the WVSfor which Data was Available
ArgentinaArmeniaAustralia
AzerbaijanBangladesh
BelarusBosniaBrazilBritain
BulgariaChileChina
ColombiaCroatia
Dom. RepublicEstoniaFinlandGeorgia
GermanyGhanaIndiaJapanLatvia
Lithuania
MacedoniaMexico
MoldovaNigeriaNorwayPakistan
PeruPhilippines
PolandPuerto Rico
RussiaSerbia and Montenegro
SloveniaSouth AfricaSouth Korea
SpainSweden
SwitzerlandTaiwanTurkeyUkraineUruguay
USAVenezuela
Table A4.2 Countries in the CSES Module 2 for which Data was Available
AustraliaBelgiumBrazilBritain
BulgariaCanada
Czech Republic Denmark
FinlandFrance
GermanyHong Kong
HungaryIcelandIrelandIsrael
JapanMexico
NetherlandsNew Zealand
NorwayPhilippines
Poland
PortugalSouth Korea
SpainSweden
SwitzerlandTaiwan
United States
-230-
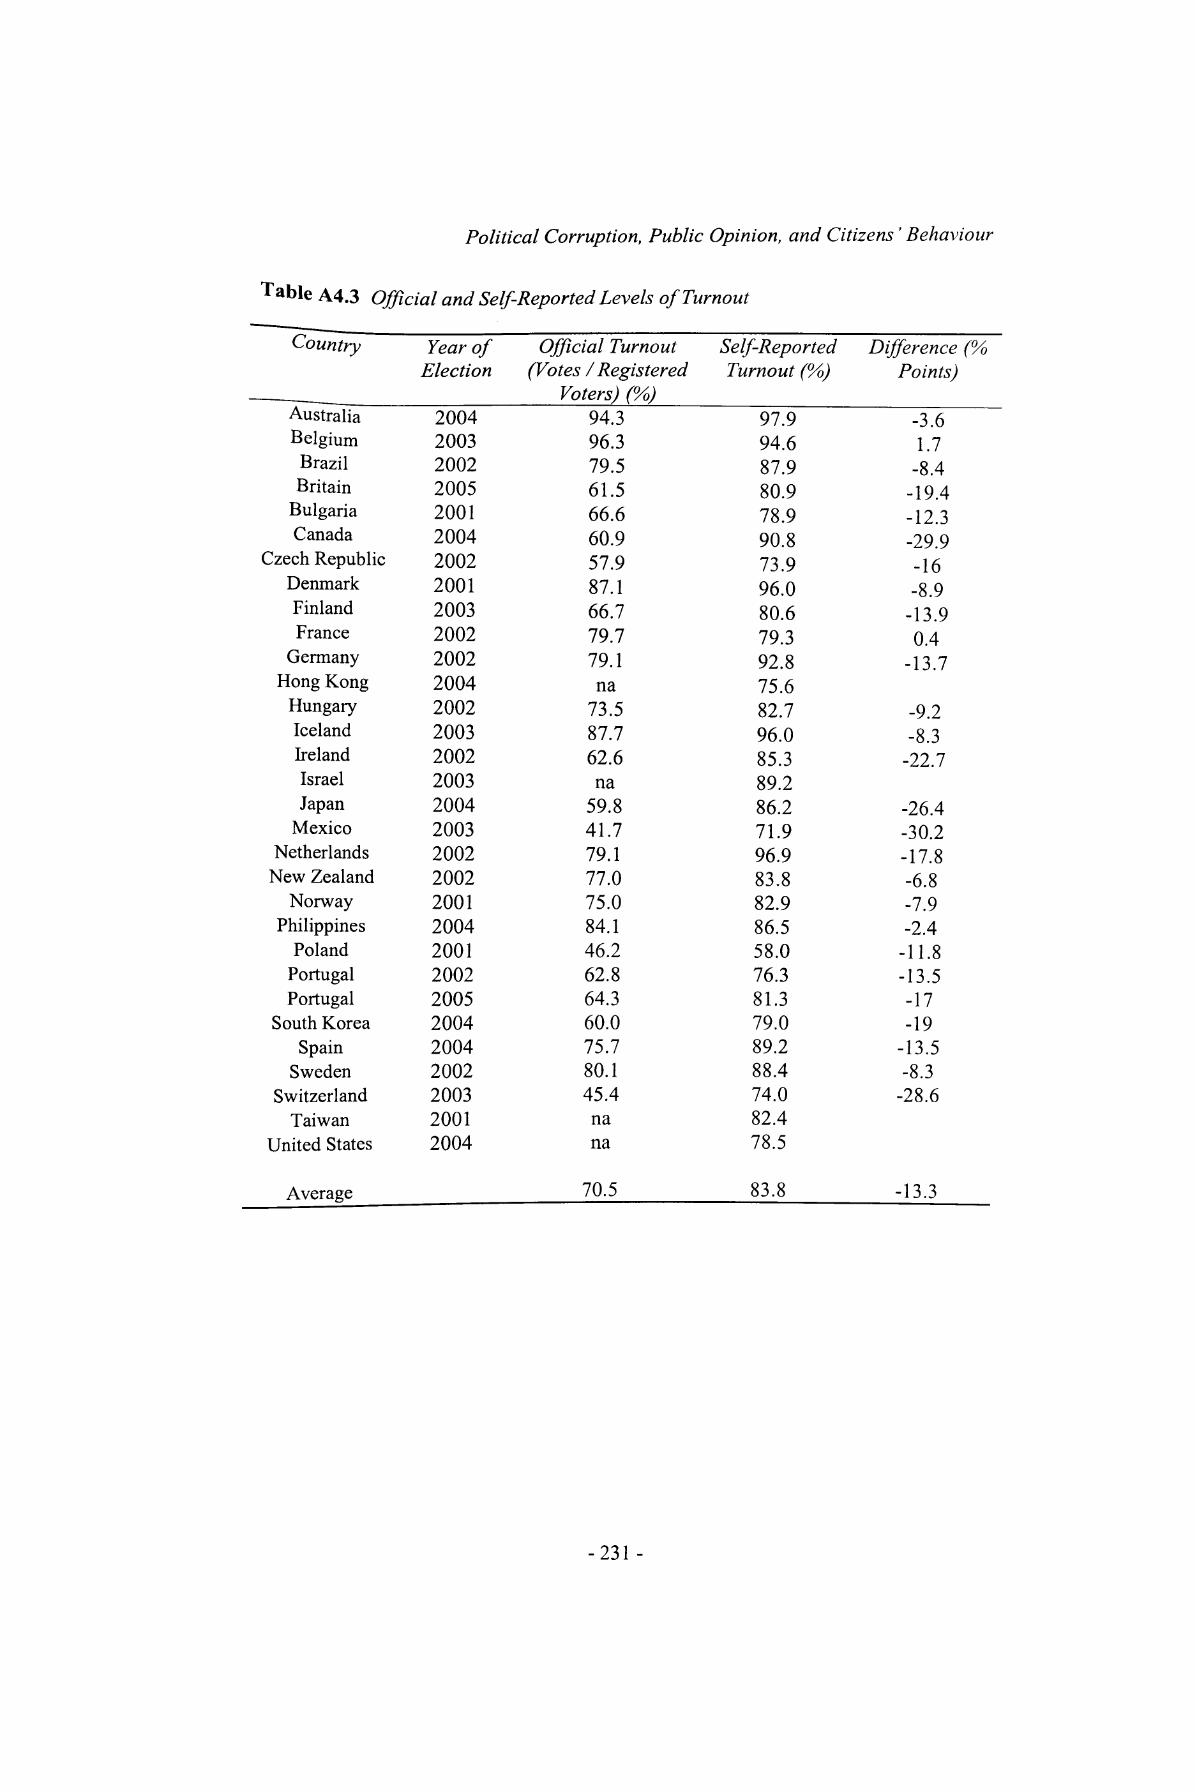
Political Corruption, Public Opinion, and Citizens' Behaviour
Table A4.3 Official and Self-Reported Levels of Turnout
Country
AustraliaBelgiumBrazilBritain
BulgariaCanada
Czech RepublicDenmarkFinlandFrance
GermanyHong Kong
HungaryIcelandIrelandIsraelJapan
MexicoNetherlands
New ZealandNorway
PhilippinesPoland
PortugalPortugal
South KoreaSpain
SwedenSwitzerland
TaiwanUnited States
Average
Year of Official Turnout Election (Votes / Registered
Voters) (%)2004200320022005200120042002200120032002200220042002200320022003200420032002200220012004200120022005200420042002200320012004
94.396.379.561.566.660.957.987.166.779.779.1na
73.587.762.6na
59.841.779.177.075.084.146.262.864.360.075.780.145.4nana
70.5
Self-Reported Turnout (%)
97.994.687.980.978.990.873.996.080.679.392.875.682.796.085.389.286.271.996.983.882.986.558.076.381.379.089.288.474.082.478.5
83.8
Difference (% Points)
-3.61.7
-8.4-19.4-12.3-29.9-16-8.9
-13.90.4
-13.7
-9.2-8.3
-22.7
-26.4-30.2-17.8-6.8-7.9-2.4
-11.8-13.5-17-19
-13.5-8.3
-28.6
-13.3
-231 -
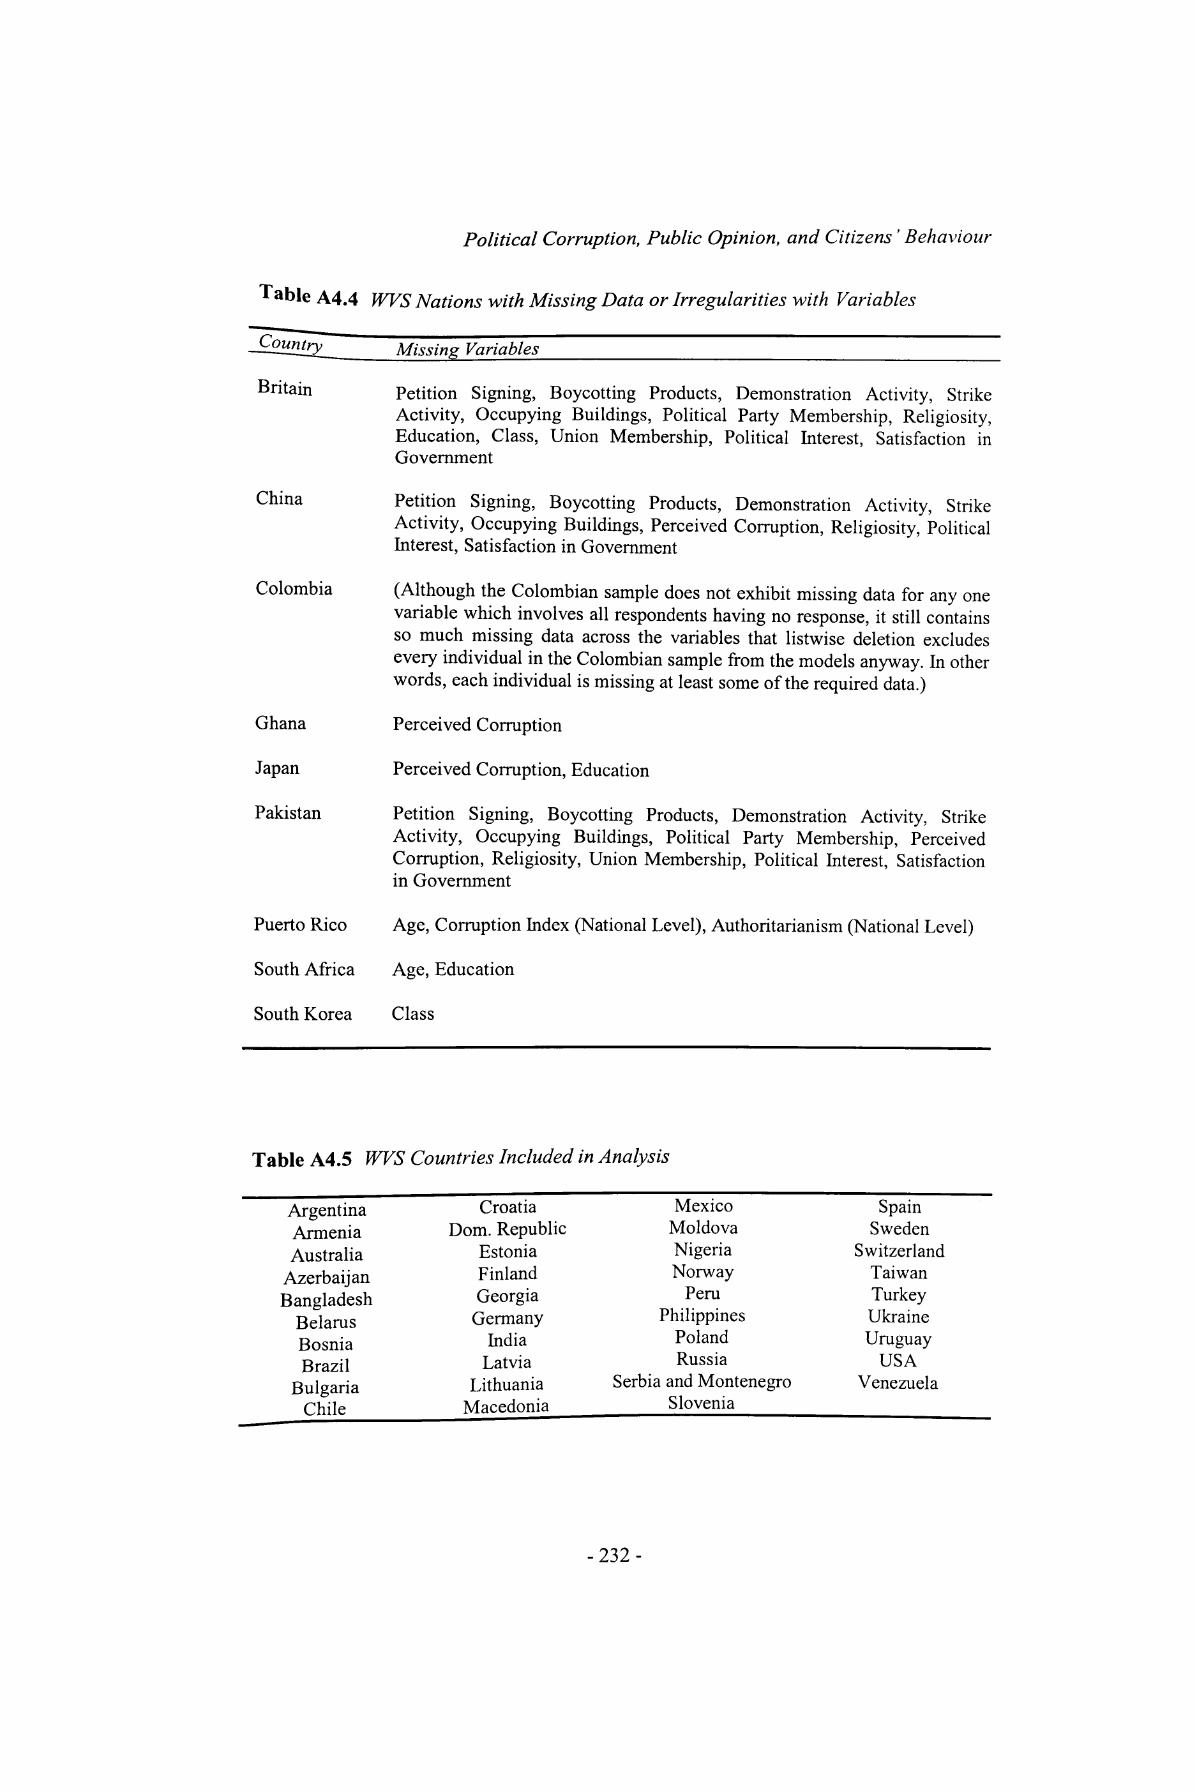
Political Corruption, Public Opinion, and Citizens' Behaviour
Table A4.4 WVS Nations with Missing Data or Irregularities with Variables
Country Missing Variables
Britain Petition Signing, Boycotting Products, Demonstration Activity, Strike Activity, Occupying Buildings, Political Party Membership, Religiosity, Education, Class, Union Membership, Political Interest, Satisfaction in Government
China Petition Signing, Boycotting Products, Demonstration Activity, Strike Activity, Occupying Buildings, Perceived Corruption, Religiosity, Political Interest, Satisfaction in Government
Colombia (Although the Colombian sample does not exhibit missing data for any one variable which involves all respondents having no response, it still contains so much missing data across the variables that listwise deletion excludes every individual in the Colombian sample from the models anyway. In other words, each individual is missing at least some of the required data.)
Ghana Perceived Corruption
Japan Perceived Corruption, Education
Pakistan Petition Signing, Boycotting Products, Demonstration Activity, Strike Activity, Occupying Buildings, Political Party Membership, Perceived Corruption, Religiosity, Union Membership, Political Interest, Satisfaction in Government
Puerto Rico Age, Corruption Index (National Level), Authoritarianism (National Level)
South Africa Age, Education
South Korea Class
Table A4.5 WVS Countries Included in Analysis
ArgentinaArmeniaAustralia
Azerbaijan Bangladesh
BelarusBosniaBrazil
BulgariaChile
CroatiaDom. Republic
EstoniaFinland Georgia Germany
IndiaLatvia
LithuaniaMacedonia
MexicoMoldovaNigeriaNorway
Peru Philippines
PolandRussia
Serbia and MontenegroSlovenia
SpainSweden
SwitzerlandTaiwan Turkey UkraineUruguay
USAVenezuela
-232-

Political Corruption, Public Opinion, and Citizens' Behaviour
Table A7.1 Specification of Legislative Incumbents for Cross-National Analysis
Country Year of Election
System Previous Incumbent Explanation
Australia
Belgium
Brazil
Bulgaria
Canada
Czech Republic
Denmark
Finland
France
Germany
2004 Parliamentary Coalition: Liberal Party of GovernmentAustralia and National Party coalition of Australia
2003 Parliamentary
2002
2001
2002
2001
2003
2002
2002
Presidential
Coalition: VLD, SP (later SPA-SPIRIT), Agalev Groen!, PS, Ecolo, PRL (later MR)
Coalition: Brazilian Social Democratic Party, Party of the Liberal Front, Party of the Brazilian Democratic Movement, Brazilian progressive Party, Brazilian Labour Party, PSD
Presidential United Democratic Forces
2004 Parliamentary Liberal Party of Canada
Presidential
Parliamentary
Presidential
Presidential
Presidential
Czech Social Democrat Party
Bloc: Social Democrats, Social Liberal Party, Socialist People's Party, Red-Green Unity List
Coalition: Social Democratic Party of Finland, National Coalition Party, Left Alliance, Swedish People's Party in Finland, Green League
Coalition: Socialist Party, Greens, Left Radical Party, Republican and Civic Movement, French Communist Party
Coalition: Social Democratic Party and Alliance 90 / Greens
Government coalition
Government coalition
Government coalition
Party in government
Party in government
Pro-government bloc
Government coalition
Government coalition
Government coalition
-233-

Great 2005 Britain
Hong Kong 2004
Political Corruption, Public Opinion, and Citizens' Behaviour
Parliamentary Labour Party
Administrative Bloc: Democratic Alliance Region of for the Betterment of Hong
China Kong, Liberal Party, Hong Kong Progressive Alliance, New Century Forum
Hungary 2002 Presidential
Iceland
Ireland
Israel
Japan
Korea (South)
Mexico
Coalition: Fidesz - Hungarian Civic Party, Hungarian Democratic Forum, Independent Small Holders Party
Coalition: Independence Party and Progressive Party
Coalition: Fianna Fail and the Progressive Democrats
Coalition: Likud, Labor, Shas, Israel Baaliya, Yahadut Hatora - Agudat Israel - Degel Tora
2004 Parliamentary Liberal Democratic Party
2004 Presidential Grand National Party
2003 Presidential National Action Party
2003
2002
2003
Presidential
Presidential
Presidential
Netherlands 2002 Parliamentary Coalition: Labour Party, People's Party for Freedom and Democracy, Democrats 66
New 2002 Parliamentary Coalition: Labour andZealand Alliance
Norway 2001 Parliamentary Labour Party
Party in government
Pro-Beijing Bloc 172
Government coalition
Government coalition
Government coalition
Government coalition
Party in government
Party in government
Party in government 173
Government coalition
Government coalition
Party in government
172 Hong Kong is problematic in that although the Democratic Party (a pro-democracy party) had the greatest amount of elected seats in its legislature, Hong Kong's Chief Executive was the pro-Beijing Tung Chee-Hwa. Thus it is not appropriate to categorise the Democratic Party as the incumbent at the time of the election: the pro-Beijing bloc effectively were, given that Hong Kong was (and continues to be) a Chinese 'administrative region', and that the executive was subjugated by pro-Beijing actors.173 Note that in the previous election, the National Action Party joined the Mexican Green Ecological Party in the 'Alliance for Change' coalition and their candidate won the presidency. However, the coalition split between elections, meaning that only the National Action Party will be considered as the Mexican incumbent at the time of the 2003 election.
-234-
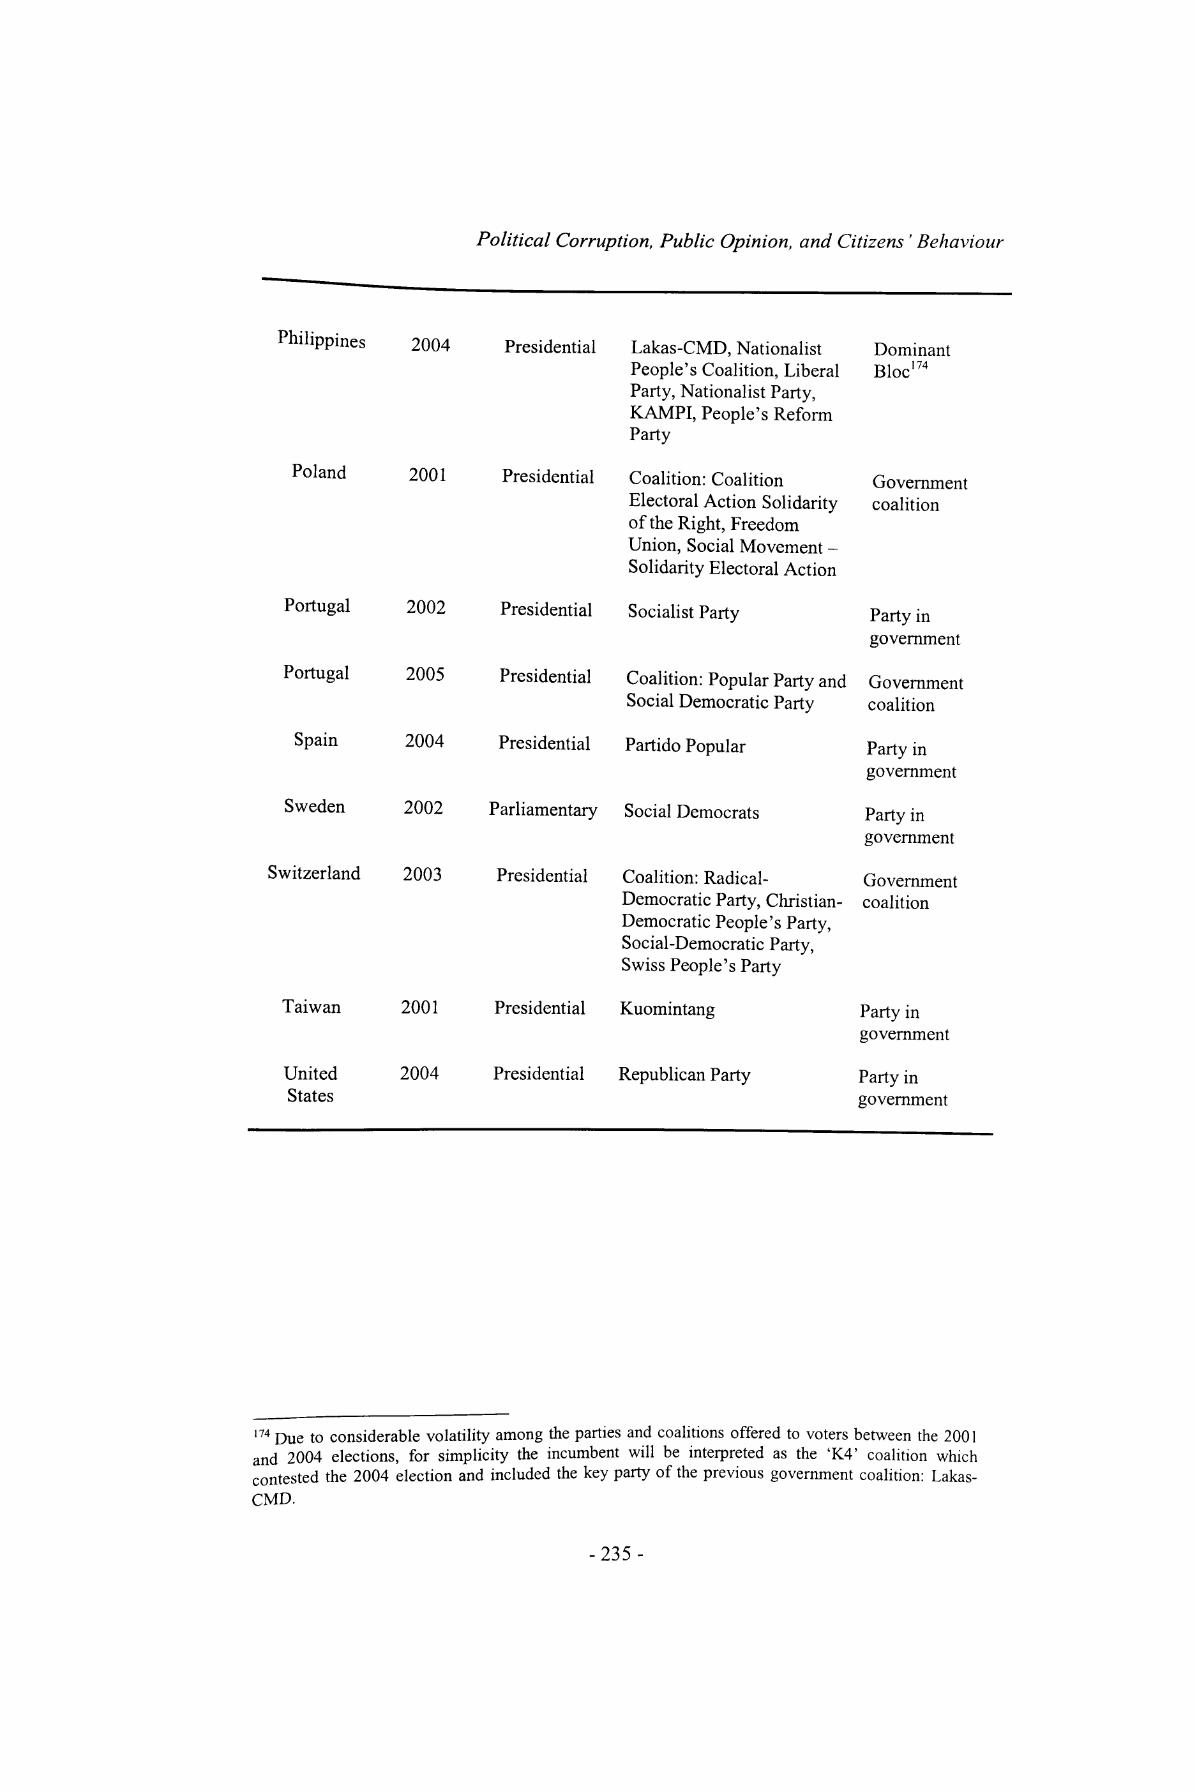
Political Corruption, Public Opinion, and Citizens ' Behaviour
Philippines 2004 Presidential
Poland 2001 Presidential
Lakas-CMD, Nationalist People's Coalition, Liberal Party, Nationalist Party, KAMPI, People's Reform Party
Coalition: Coalition Electoral Action Solidarity of the Right, Freedom Union, Social Movement - Solidarity Electoral Action
DominantBloc 174
Government coalition
Portugal
Portugal
Spain
Sweden
Switzerland
2002
2005
2004
Presidential Socialist Party Party in government
Presidential Coalition: Popular Party and Government Social Democratic Party coalition
Presidential Partido Popular
2002 Parliamentary Social Democrats
2003 Presidential Coalition: Radical- Democratic Party, Christian- Democratic People's Party, Social-Democratic Party, Swiss People's Party
Party in government
Party in government
Government coalition
Taiwan 2001
United 2004 States
Presidential Kuomintang
Presidential Republican Party
Party in government
Party in government
174 Due to considerable volatility among the parties and coalitions offered to voters between the 2001 and 2004 elections, for simplicity the incumbent will be interpreted as the 'K4' coalition which contested the 2004 election and included the key party of the previous government coalition: Lakas- CMD.
-235-
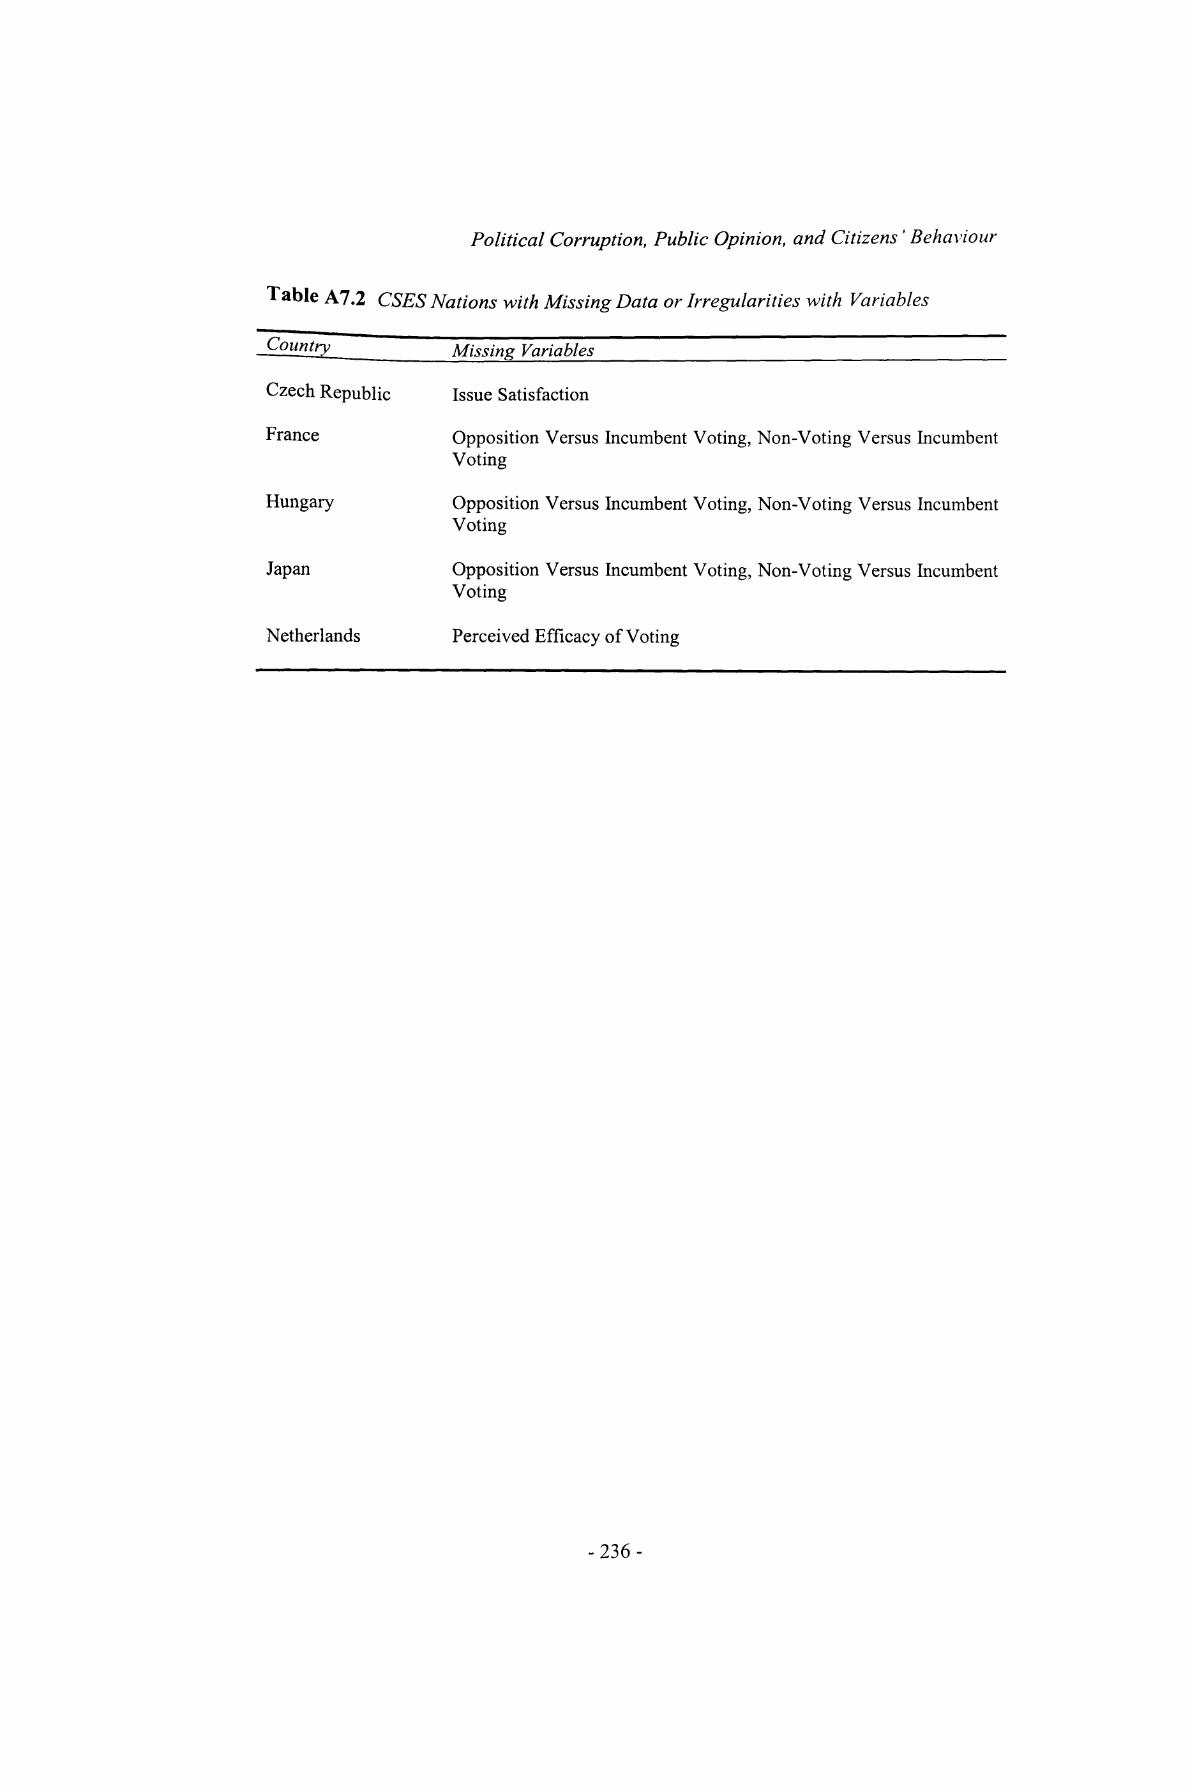
Political Corruption, Public Opinion, and Citizens ' Behaviour
Table A7.2 CSES Nations with Missing Data or Irregularities with Variables
Missing Variables
Czech Republic
France
Hungary
Japan
Netherlands
Issue Satisfaction
Opposition Versus Incumbent Voting, Non-Voting Versus Incumbent Voting
Opposition Versus Incumbent Voting, Non-Voting Versus Incumbent Voting
Opposition Versus Incumbent Voting, Non-Voting Versus Incumbent Voting
Perceived Efficacy of Voting
-236-

Political Corruption, Public Opinion, and Citizens' Behaviour
Bibliography
a) Books, Chapters and Articles
Abramson, P.R. and Inglehart, R. (1995) Value Change in Global Perspective, Ann Arbor: University of Michigan Press.
Agresti, A. (1996) An Introduction to Categorical Data Analysis, New York: Wiley.
Alam, M.S. (1995) 'A Theory of Limits on Corruption and some Applications', Kyklos, 48, 419-435.
Alvarez, R.M. and Nagler, J. (1998) 'When Politics and Models Collide: Estimating Models of Multiparty Elections', American Journal of Political Science, 42, 55-96.
Andersen, R. and Heath, A. (2002) 'Class Matters: The Persisting Effects of Contextual Social Class on Individual Voting Behavior in Britain, 1964-97', European Sociological Review, 18,125-138.
Andersen, R., Yang, M., and Heath, A. (2006) 'Class Politics and Political Context in Britain, 1964-1997: Have Voters Become More Individualized?', European Sociological Review, 22, 215-228.
Ayala, L.J. (2000) 'Trained for Democracy: The Differing Effects of Voluntary and Involuntary Organizations on Political Participation', Political Research Quarterly, 53,99-115.
Baston, L. (2000) Sleaze: The State of Britain, Basingstoke: Channel 4 Books.
BMRB International. BMRB Social Research. (2004) Survey of Public Attitudes towards Conduct in Public Life [report prepared for the Committee on Standards in Public Life].
Brady, H.E. [1999] 'Political Participation', in Robinson, J.P., Shaver, P.R. and Wrigh'tsman, L.S. (1999) Measures of Political Attitudes, London: Academic Press, 737-801.
Bravo-Ortega, C. and Hojman, D. [2002] 'Political Animals and Civic Participation', in Bravo-Oret'ega, C. (2003) Essays on Asymmetric Information, Thesis submitted for the degree of PhD at the University of California at Berkeley.
Butler, D. and Stokes, D. (1969) Political Change in Britain: Forces Shaping Electoral Choice, London: Macmillan.
Campbell, A., Converse, P.E., Miller, W.E., and Stokes, D.E. (1960) The American Voter, New York: Wiley.
F (2000) 'Unemployment, Inflation, and Government Popularity - are there Partisan Effects?', Electoral Studies, 19, 141-150.
-237-
Political Corruption, Public Opinion, and Citizens ' Behaviour
Central Intelligence Agency, (1999) World Factbook 1999, Washington: CIA.
Central Intelligence Agency, (2000) World Factbook 2000, Washington: CIA.
Citrin, J. and Muste, C. [1999], 'Trust in Government', in Robinson, J.P., Shaver, P.R., and Wrightsman, L.S. (1999) Measures of Political Attitudes, London: Academic Press, 465-533.
Clarke, H.D., Sanders, D., Stewart, M.C., and Whiteley, P. (2004) Political Choice in Britain, Oxford: Oxford University Press.
Curtice, J. and Jowell, R. [1995], 'The Sceptical Electorate', in Jowell, R., Curtice, J., Park, A., Brook, L., and Ahrendt, D. (1995) British Social Attitudes: The 12th Report, Aldershot: Dartmouth, 141-172.
Dalton, R.J. (2006) Citizen Politics: Public Opinion and Political Parties in Advanced Industrial Democracies (Fourth Edition), Washington DC: CQ Press.
Davis, C.L., Camp, R.A., and Coleman, K.M. (2004) 'The Influence of Party Systems on Citizens' Perceptions of Corruption and Electoral Response in Latin America', Comparative Political Studies, 37, 677-703.
Delia Porta, D. and Diani, M. (1999) Social Movements: An Introduction, Maiden, MA: Blackwell.
Delia Porta, D. [2000] 'Social Capital, Beliefs in Government, and Political Corruption', in Pharr, SJ. and Putnam, R.D. (eds.) (2000) Disaffected Democracies: What's Troubling the Trilateral Countries?, Princeton: Princeton University Press, 202-228.
Doig, A. (1984) Corruption and Misconduct in Contemporary British Politics, Harmondsworth: Penguin.
Doig, A. (2003) 'Political Corruption in the United Kingdom', in Bull, M.J. and Newell, J.L. (2003) Corruption in Contemporary Politics, Basingstoke: Palgrave Macmillan, 178-190.
Dunleavy, P., Margetts, H., Smith, T., and Weir, S. (2001) Voices of the People: Popular Attitudes to Democratic Renewal in Britain, London: Politico's.
Edwards, P.S. (1996) 'Defining Political Corruption: The Supreme Court's Role', BYU Journal of Public Law, 10, 1-26.
F G fed ) (1999) The End of Class Politics? Class Voting in Comparative Perspective, Oxford: Oxford University Press.
ns G [1999] 'Class and Vote: Disrupting the Orthodoxy', in Evans, G. (ed.) (1999) The End of Class Politics? Class Voting in Comparative Perspective, Oxford: Oxford University Press, 323-334.
-238-

Political Corruption, Public Opinion, and Citizens ' Behaviour
Evans, G. [2003] 'Political Culture and Voting Participation', in Dunleavy, P., Gamble, A., Heffernan, R., and Peele, G. (2003) Developments in British Politics 7, Basingstoke: Palgrave Macmillan, 82-99.
Evans, G. and Andersen, R. (2006) 'The Political Conditioning of Economic Perceptions', Journal of Politics, 68, 194-207.
Finifter, A.W. (1970) 'Dimensions of Political Alienation', American Political Science Review, 64, 389-410.
Fisher, S. (2000a) 'Class Contextual Effects on the Conservative Vote in 1983', British Journal of Political Science, 30, 347-382.
Fisher, S.D. (2000b) 'Party Preference Structure in England, 1987-97' in Cowley, P., Denver, D., Russell, A. and Harrison, L. (eds.) (2000) British Elections and Parties Review, Volume JO, London: Frank Cass, 64-84.
Franklin, M. [1992] 'Britain', in Franklin, M., Mackie, T., Valen, H. et al (1992) Electoral Change: Responses to Evolving Social and Attitudinal Structures in Western Countries, Cambridge: Cambridge University Press, 101-122.
Franklin, M.N. and Wlezien, C. (1997) 'The Responsive Public: Issue Salience, Policy Change, and Preferences for European Unification', Journal of Theoretical Politics, 9, 347-363.
Franklin, M.N. [2002] 'The Dynamics of Electoral Participation', in LeDuc, L., Niemi, R.G., and Norris, P. (2002), Comparing Democracies 2: New Challenges in the Study of Elections and Voting, London: Sage, 148-168.
Franklin, M.N. (2004) Voter Turnout and the Dynamics of Electoral Competition in Established Democracies Since 1945, Cambridge: Cambridge University Press.
Freeman, J. [1979] 'Resource Mobilization and Strategy: A Model for Analyzing Social Movement Organization Actions' in Zald, M.N. and McCarthy, J.D. (eds.) (1979) The Dynamics of Social Movements: Resource Mobilization, Social Control, and Tactics, Cambridge, MA: Winthrop, 167-189.
Fric P. (2001) 'Corruption Climate: Results of an International Research Project on Corruption in 11 Central and Eastern European Countries', GfK Prague.
Friedrich, C.J. (1966) 'Political Pathology', Political Quarterly, 37, 70-85.
Galtung F [1998] 'Criteria for Sustainable Corruption Control', in Robinson, M. (ed.) (1998) Corruption and Development, London: Frank Cass, 105-128.
Gardiner, J.A. (1970) The Politics of Corruption: Organized Crime in an American City, New York: Russell Sage Foundation.
-239-
Political Corruption, Public Opinion, and Citizens ' Behaviour
Gibbons, K.M. [1985] 'Variations in Attitudes toward Corruption in Canada', in Heidenheimer, A.J., Johnston, M, and LeVine, V.T. (eds.) (1989) Political Corruption: A Handbook, New Brunswick, NJ: Transaction, 763-780.
Gillespie, K. and Okruhlik, G. (1996) 'The Political Dimensions of Corruption Cleanups: A Framework for Analysis', Comparative Politics, 24, 77-95.
Girling, J. (1997) Corruption, Capitalism and Democracy, London: Routledge.
Gladwell, M. (2000) The Tipping Point: How Little Things Can Make a Big Difference, London: Abacus.
Goldthorpe, J.H. [1999] 'Modelling the Pattern of Class Voting in British Elections, 1964-1992' in Evans, G. (ed.) (1999) The End of Class Politics? Class Voting in Comparative Perspective, Oxford: Oxford University Press, 59-82.
Gorta, A. and Forell, S. (1994) Unravelling Corruption: A Public Sector Perspective, Independent Commission Against Corruption, Research Report Number One.
Granovetter, M. (1978) 'Threshold Models of Collective Behaviour' American Journal of Sociology, 83, 1420-1443.
Gwarmey, J., Lawson, R., and Samida, D. (2000) Economic Freedom of the World: 2000 Annual Report, Vancouver: The Fraser Institute.
Heidenheimer, A.J. [1970] 'Perspectives on the Perception of Corruption', in Heidenheimer, A.J., Johnston, M., and LeVine, V.T. (eds.) (1989) Political Corruption: A Handbook, New Brunswick, NJ: Transaction, 149-163.
Heidenheimer, A.J., Johnston, M., and LeVine, V.T. [1989] 'Terms, Concepts, and Definitions: An Introduction', in Heidenheimer, A.J., Johnston, M., and LeVine, V.T. (eds.) (1989) Political Corruption: A Handbook, New Brunswick, NJ: Transaction, 3- 14.
Hellwig, T.T. (2001) 'Interdependence, Government Constraints, and Economic Voting', Journal of Politics, 63, 1141-1162.
Hobolt, S.B., Spoon, J., and Tilley, J. (forthcoming, 2008) 'A Vote Against Europe? Explaining Defection at the 1999 and 2004 European Parliament Elections', Under Review at the British Journal of Political Science.
H d C 0991) 'A Public Management for All Seasons?', Public Administration, 69, 3-19.
. .Qn §p [1968] 'Modernization and Corruption', in Heidenheimer, A.J., I taston M., and LeVine, V.T. (eds.) (1989) Political Corruption: A Handbook, New B°runswick, NJ: Transaction, 377-388.
S E (1998) 'The Troubled Triangle: Populism, Islam and Civil Society in hVab World', International Political Science Review, 19, 373-385.
-240-
Political Corruption, Public Opinion, and Citizens ' Behaviour
nglehart, R. (1997) Modernization and Postmodernization: Cultural, Economic and Political Change in 43 Societies, Princeton: Princeton University Press.
Inglehart, R., Basanez, M, and Moreno, A. (1998) Human Values and Beliefs: A Cross-Cultural Sourcebook, Ann Arbor: University of Michigan Press.
Jackman, R.W. and Miller, R.A. (1995) 'Voter Turnout in the Industrial Democracies During the 1980s' Comparative Political Studies, 27, 467-492.
Janda, K., Berry, J.M., and Goldman, J. (2002) The Challenge of Democracy: Government in America 7th Edition, Boston: Houghton Mifflin.
Johnston, M. and Wood, D. [1985] 'Right and Wrong in Public and Private Life', in Jowell, R. and Witherspoon, S. (1985) British Social Attitudes: the 1985 Report, Aldershot: Gower, 121-147.
Johnston, M. [1986a] 'The Political Consequences of Corruption: A Reassessment', in Heidenheimer, A.J., Johnston, M., and LeVine, V.T. (eds.) (1989) Political Corruption: A Handbook, New Brunswick, NJ: Transaction, 985-1006.
Johnston, M. [1986b] 'Right and Wrong in American Politics: Popular Conceptions of Corruption', in Heidenheimer, A.J., Johnston, M., and LeVine, V.T. (eds.) (1989) Political Corruption: A Handbook, New Brunswick, NJ: Transaction, 743-761.
Johnston, M. (1991) 'Right and Wrong in British Politics: "Fits of Morality" in Comparative Perspective', Polity, XXIV, 1-25.
Johnston, M. (2002) 'Measuring the New Corruption Rankings: Implications for Analysis and Reform', in Heidenheimer, A.J. and Johnston, M. (eds.) (2002) Political Corruption: Concepts and Contexts, Third Edition, New Brunswick: Transaction, 865-884.
Johnston, M. (2005) Syndromes of Corruption: Wealth, Power, and Democracy, Cambridge: Cambridge University Press.
Joireman, S.F. (2001) 'Inherited Legal Systems and Effective Rule of Law: Africa and the Colonial Legacy', Journal of Modern African Studies, 39, 571-596.
Jorgensen, E.R. (1983) 'Engineering Change in Music Education: A Model of the Political Process Underlying the Boston School Music Movement', Journal of Research in Music Education, 31, 67-75.
K 1 ins V (2005) Assessing Trends in Corruption and Impact oj'Anti-Corruption M n ' es Anti-Corruption Network for Transition Economies 6th General Meeting: Discussion Paper.
K D (ed.) (2004) Freedom of the Press: A Global Survey of Media ^dependence,'Lanham: Rowman and Littlefield.
-241 -
Political Corruption, Public Opinion, and Citizens' Behaviour
Karlson, S.H. (1986) 'Adoption of Competing Inventions by United States Steel Producers', Review of Economics and Statistics, 68, 415-422.
Kitschelt, H. (1994) The Transformation of European Social Democracy, Cambridge: Cambridge University Press.
Knack, S. and Azfar, O. (2000) 'Are Larger Countries Really More Corrupt?', World Bank Policy Research Working Paper No. 2470.
Kobrin, S.J. (1985), 'Diffusion as an Explanation of Oil Nationalization or the Domino Effect Rides Again', Journal of Conflict Resolution, 29, 3-32.
Laakso, M. and Taagepera, R. (1979) '"Effective" Number of Parties: A Measure With Application to West Europe', Comparative Political Studies, 12, 3-27.
Larmour, P. and Wolanin, N. (eds.) (2001) Corruption and Anti-Corruption, Canberra: Asia Pacific Press.
Lewis-Beck, M.S., and Stegmaier, M. (2000) 'Economic Determinants of Electoral Outcomes', Annual Review of Political Science, 3, 183-219.
Lijphart, A. [2002] 'Introduction', in Lijphart, A (2002) Parliamentary Versus Presidential Government, Oxford: Oxford University Press, 1-27.
Little, W. and Posado-Carbo, E. (eds.) (1996) Political Corruption in Europe and Latin America, Basingstoke: Macmillan.
Lowenstein, D.H. [1985] 'Legal Efforts to Define Bribery', in Heidenheimer, A.J., Johnston, M., and LeVine, V.T. (eds.) (1989) Political Corruption: A Handbook, New Brunswick, NJ: Transaction, 29-38.
Mancusco, M. (1993) 'The Ethical Attitudes of British MPs: A Typology', Parliamentary Affairs, 46, 179-191.
Marsh, M. and Tilley, J. (forthcoming, 2008) The Attribution of Credit and Blame to Governments and Its Impact on Vote Choice', Under Review at the British Journal of Political Science.
Mayhew (1986) Placing Parties in American Politics: Organization, Electoral Settings, and Government Activity in the Twentieth Century, Princeton: Princeton University Press.
McCann J A and Dominguez, J.I. (1998) 'Mexicans React to Electoral Fraud and Political Corruption: An Assessment of Public Opinion and Voting Behaviour', Electoral Studies, 17,483-503.
McCann, J.A. and Redlawsk, D.P. (2006) 'As Voters Head to the Polls, Will They Perceive a "Culture of Corruption?'", PS: Political Science and Politics, 37, 797-802.
-242-
Political Corruption, Public Opinion, and Citizens' Behaviour
McDill, E.L. and Ridley, J.C. (1962) 'Status, Anomia, Political Alienation, and Political Participation', American Journal of Sociology, 68, 205-213.
McVeigh, R. and Sikkink, D. (2001) 'God, Politics, and Protest: Religious Beliefs and the Legitimation of Contentious Tactics', Social Forces, 79, 1425-1458.
Miller, A.H., Wattenberg, M.P., and Malanchuk, O. (1986) 'Schematic Assessments of Presidential Candidates', American Political Science Review, 80, 521-540.
Miller, W.L., Gradeland, A.B., and Koshechkina, T.Y. (2001) A Culture of Corruption: Coping with Government in Post-communist Europe, Budapest: Central European University Press.
Mishler, W. and Rose, R. (2001) 'What are the Origins of Political Trust?', Comparative Political Studies, 34, 30-62.
Montinola, G.R. and Jackman, R.W. (2002) 'Sources of Corruption: A Cross National Study', British Journal of Political Science, 32, 147-170.
Mortimore, R. (1995) 'Public Perceptions of Sleaze in Britain', Parliamentary Affairs, 48, 579-589.
Muller, E.N. and Jukam, T.O. (1977) 'On the Meaning of Political Support', American Political Science Review, 71, 1561-1595.
Nadeau, R., Cloutier, E., and Guay, J.H. (1993) 'New Evidence of a Bandwagon Effect in the Opinion Formation Process', International Political Science Review, 14, 203-213.
Nieuwbeerta, P. and De Graaf, N.D. [1999] Traditional Class Voting in Twenty Postwar Societies', in Evans, G. (ed.) (1999) The End of Class Politics? Class Voting in Comparative Perspective, Oxford: Oxford University Press, 23-56.
Norris, P. (1997) Electoral Change in Britain Since 1945, Oxford: Blackwell.
Norris, P. (ed.) (1999) Critical Citizens: Global Support for Democratic Government, Oxford: Oxford University Press.
Norris, P. (2002) Democratic Phoenix: Reinventing Political Activism, Cambridge: Cambridge University Press.
Norris, P. (2004) Electoral Engineering: Voting Rules and Political Behaviour, Cambridge: Cambridge University Press.
Nye, J.S. (1967) 'Corruption and Political Development: A Cost-Benefit Analysis' American Political Science Review, 61,417-427.
Olsen, M.E. (1969) 'Two Categories of Political Alienation', Social Forces, 47, 288- 299.
-243-

Political Corruption, Public Opinion, and Citizens' Behaviour
Pattie, C. and Johnston, R. (1998) 'Voter Turnout at the British General Election of 1992: Rational Choice,'Social Standing or Political Efficacy', European Journal of Political Research, 33,'263-283.
Peele, G. (2004) Governing the UK: British Politics in the 21st Century (Fourth Edition), Oxford: Blackwell.
Persson, T., Tabellini, G., and Trebbi, F. (2003) 'Electoral Rules and Corruption', Journal of the European Economic Association, 1, 958-989.
Peters, J.G. and Welch, S. [1978] 'Gradients of Corruption in Perceptions of American Public Life' in Heidenheimer, A.J., Johnston, M., and LeVine, V.T. (eds.) (1989) Political Corruption: A Handbook, New Brunswick, NJ: Transaction, 723-741.
Philp, M. (1997) 'Defining Political Corruption', Political Studies, 45, 436-462.
Philp, M. (2001) 'Access, Accountability and Authority: Corruption and the Democratic Process', Crime, Law & Social Change, 36, 357-377.
Pontusson, J., Rueda, D. and Way, C.R. (2002) 'Comparative Political Economy of Wage Distribution: the Role of Partisanship and Labour Market Institutions', British Journal of Political Science, 32, 281-308.
Powell, G.B, Jr. [1980] 'Voting Turnout in Thirty Democracies: Partisan, Legal, and Socio-Economic Influences' in Rose, R. (ed.) (1980) Electoral Participation, London: Sage, 5-34.
Powell, G.B, Jr. and Whitten, G.D. (1993) 'A Cross-National Analysis of Economic Voting: Taking Account of the Political Context', American Journal of Political Science, 37, 391-414.
PriceWaterhouseCoopers (2001) The Opacity Index, [Report].
Putnam, R.D. (1993) Making Democracy Work: Civic traditions in Modern Italy, Princeton: Princeton University Press.
Putnam, R.D. (1995a) 'Bowling Alone: America's Declining Social Capital', Journal of Democracy, 6, 65-78.
Putnam, R.D. (1995b) 'Tuning In, Tuning Out: The Strange Disappearance of Social Capital in America', Political Science and Politics, 28, 664-683.
Reef M J and Knoke, D. [1999] 'Political Alienation and Efficacy', in Robinson, J.P., Shaver, P.R., and Wrightsman, L.S. (1999) Measures of Political Attitudes, London: Academic Press, 413-464.
Riker, W.H. and Ordeshook, P.C. (1968) 'A Theory of the Calculus of Voting', American Political Science Review, 62, 25-42.
-244-
Political Corruption, Public Opinion, and Citizens' Behaviour
Rose-Ackerman, S. (1978) Corruption: A Study in Political Economy, New York: Academic Press.
Rueda, D. and Pontusson, J. (2000) 'Wage Inequality and Varieties of Capitalism', World Politics, 52, 350-383.
Sandholtz, W. and Koetzle, W. (2000) 'Accounting for Corruption: Economic Structure, Democracy, and Trade', International Studies Quarterly, 44, 31-50.
Schedler, A. (1998) 'What is Democratic Consolidation?' Journal of Democracy 9 91-107. '
Schlozman, K.L., Burns, N., and Verba, S. (1994) 'Gender and the Pathways to Participation: The Role of Resources', Journal of Politics, 56, 963-990.
Seligson, M.A. (2002) 'The Impact of Corruption on Regime Legitimacy: A Comparative Study of Four Latin American Countries', Journal of Politics 64 408- 433.
Skalaban, A. (1988) 'Do Polls Affect Elections? Some 1980 Evidence', Political Behaviour, 10, 136-149.
Snijders, T. and Bosker, R. (1999) Multilevel Analysis: An Introduction to Basic and Advanced Multilevel Modelling, London: Sage.
Stone, W, (2001) 'Measuring Social Capital: Towards a Theoretically Informed Measurement Framework for Researching Social Capital in Family and Community Life', Australian Institute of Family Studies Research Paper no. 24.
Swaddle, K. And Heath, A. (1989) 'Official and Reported Turnout in the British General Election of 1987', British Journal of Political Science, 19, 537-551.
Tanzi, V. and Davoodi, H.R. (2000) 'Corruption, Growth, and Public Finances', IMF Working Paper WP/00/182, Washington: IMF.
Tarrow, S. (1994) Power in Movement: Social Movements, Collective Action and Politics, Cambridge: Cambridge University Press.
Theobald, R. [2000] 'Conclusion: Prospects for Reform in a Globalised Economy', in Doig, A. and Theobald, R. (eds.) (2000) Corruption and Democratisation, London: Frank Cass, 149-159.
Thompson, W.E. and Horton, J.E. (1960) 'Political Alienation as a Force in Political Action', Social Forces, 38, 190-195.
Tilley J (2002) 'Is Youth a Better Predictor of Sociopolitical Values than is Nationality?', Annals of the American Academy of Political and Social Science, 580, 226-256.
-245-
Political Corruption, Public Opinion, and Citizens ' Behaviour
C. [1979] 'Repertoires of Contention in America and Britain, 1750-1830' in M.N. and McCarthy, J.D. (eds.) (1979) The Dynamics of Social Movements:
Resource Mobilization Social Control, and Tactics, Cambridge, MA: Winthrop, 126- 155.
Treisman, D. (2000) 'The Causes of Corruption: A Cross National Study', Journal of Public Economics, 76, 399-457.
Tsebelis, G. (2002) Veto Players: How Political Institutions Work, Princeton: Princeton University Press.
Van Aelst, P. and Walgrave, S. (2001) 'Who is that (Wo)man in the Street? From the Normalisation of Protest to the Normalisation of the Protestor', European Journal of Political Research, 39, 461-486.
Vanhanen, T. (2000) 'A New Dataset for Measuring Democracy, 1810-1998' Journal of Peace Research, 37, 251-265.
Verba, S., Nie, N., and Kirn, J. (1978) Participation and Political Equality: A Seven Nation Comparison, Cambridge: Cambridge University Press.
Verba, S., Schlozman, K.L., and Brady, H.E. (1995) Voice and Equality: Civic Voluntarism in American Politics, Cambridge, MA: Harvard University Press.
Wattenberg, M.P. (1994) The Decline of American Political Parties 1952-1992, Cambridge, MA: Harvard University Press.
Wei, SJ. (2000) 'Natural Openness and Good Government', NBER Working Paper 7765 (June).
Welch, S. and Peters, J.G. (1977) 'Attitudes of US State Legislators toward Political Corruption: Some Preliminary Findings' Legislative Studies Quarterly, 2, 445-463.
Whiteley, P.P. (1995) 'Rational Choice and Political Participation: Evaluating the Debate', Political Research Quarterly, 48, 21 1-233.
Whiteley, P., Clarke, H., Sanders, D. and Stewart, M. (2001) 'Turnout', Parliamentary Affairs, 54, 775-788.
Wilcox, C. and Sigelman, L. (2001) 'Political Mobilization in the Pews: Religious Contacting and Electoral Turnout', Social Science Quarterly, 82, 524-535.
Wonnacott, T.H. and Wonnacott, R.J. (1990) Introductionary Statistics, Fifth Edition, New York: Wiley.
Xin, X., and Rudel, T.K. (2004) 'The Context for Political Corruption: A Cross National Analysis', Social Science Quarterly, 85, 294-309.
You, J. and Khagram, S. (2004) 'Inequality and Corruption', KSG Faculty Working Paper RWP 04-001.
-246-
Political Corruption, Public Opinion, and Citizens' Behaviour
b) Electronic and Web-based Resources
BMRB International. BMRB Social Research (2005) Survey of Public Attitudes towards Conduct in Public Life, 2003-2004 [Computer File]. Colchester, Essex: UK Data Archive [distributor], SN: 5073.
Center on Democratic Performance, Department of Political Science, Binghamton University (No Date) Election Results Archive, http://cdp.binghamton.edu/era/ (accessed 12 February 2006).
Centre for Comparative European Survey Data (No date), British Social Attitudes, http://www.britsocat.com/MainMenu.aspx (accessed 24 August 2005).
Center for Public Integrity (No Date) Global Integrity: Information on Corruption and Governance for Global Citizens, http://www.globalintegritv.org/ (accessed 19 September 2006).
Committee on Standards in Public Life (1994-2005) The Seven Principles of Public Life, http://www.public-standards.gov.uk/ (accessed 5 November 2005).
Comparative Study of Electoral Systems (2006) CSES Module 2 Fourth Advance Release [dataset], www.cses.org (accessed 18 October 2006).
European Commission (2003) Employment in Europe 2003: Recent Trends andProspects,http://europa.eu.int/comm/emplovment social/news/2QQ3/oct/eie2Q03 en.html(accessed 17 February 2006).
Fraser Institute (2004) Economic Freedom Network, http://www.freetheworld.com (accessed 10 February 2006).
Hungarian Gallup Institute (1999) Basic Methodological Aspects of Corruption Measurement: Lessons Learned from the Literature and the Pilot Study, http://www.unodc.org/pdf/crime/corruption hungarv rapid assess.pdf (accessed 25October 2005).
Idea International (2006) http://www.idea.int/index.cfm (accessed 3 February 2006).
Inglehart, R. et al (2000) World Values Surveys and European Values Surveys, 1981- 1984 1990-1993, and 1995-1997 [Computer file], ICPSR version, Ann Arbor, MI: Institute for Social Research [producer], Ann Arbor, MI: Inter-university Consortium for Political and Social Research [distributor].
Inglehart, R. (1999-2003) World Values Survey, http://wvs.isr.umich.edu/index.shtml (accessed 3 April 2006).
International Labour Organisation (2002) World Labour Report 1997-98: Industrial Relations, Democracy and Social Stability,
-247-

Political Corruption, Public Opinion, and Citizens ' Behaviour
.org/public/english/dialogue/ifpdial/publ/wlr97/ (accessed 10 February
International Labour Organisation, (2004) An Information Base on Equal Employment Opportunities for Women and Men,http://www.ilo.org/public/english/employment/gems/eeo/ (accessed 10 February 2006).
Jenkins, J.C. and Taylor, C.L. (No Date) World Handbook of Political and Social Indicators IV, http://www.sociology.ohio-state.edu/jci/research.htm (accessed 4 February 2006).
Norris, P. (2004) Pippa Norris Home, JFK School of Government, Harvard University, www.pippanorris.com (accessed 15 February 2006).
Marshall, M.G. and Jaggers, K. (2002) Polity IVProject, Integrated Network for Societal Conflict Research (INSCR) Program; Center for International Development and Conflict Management (CIDCM); University of Maryland, College Park 20742, http://www.cidcm.umd.edu/inscr/polity (accessed 21 February 2006).
Transparency International (2005) http://www.transparency.org/surveys/index.html (accessed 13 January 2006).
Unicef (No Date) At a Glance: Slovakia,http://www.unicef.org/infobycountry/slovakia statistics.html (accessed 22 February 2006).
United Nations Development Programme, (1999) Human Development Report, http://gd.tuwien.ac.at/soc/undp/ (accessed 13 December 2007).
United Nations Development Programme, (2005) Human Development Report 2005, http://hdr.undp.org/reports/global/20Q5/ (accessed 22 February 2006).
University of Missouri — St. Louis, (2002) Government Documents, http://www.umsl.edu/services/govdocs/ (accessed 10 December 2005).
Virtual Research Associates (1998-2003) Integrated Data for Events Analysis, http://www^ranetcom/idea/ (accessed 4 February 2006).
World Bank (2001) http://www.worldbank.org/wbi/governance/govdata/ (accessed 13
January 2006).
World Bank (2005) The BEEPS Interactive Dataset,ht //iufojvorldlian^ orp/povernance/beeps/ (accessed 13 January 2006).
,7 004) YouGov /Daily Telegraph Survey Results, ^.^SS^ml^^^ 1̂^^^^ * 0 * QZlABdf (accessed 4 December
2005).
-248-

Political Corruption, Public Opinion, and Citizens' Behaviour
Youth Development Network (2003) Tanzania - Final Country Report, http://www.vdn.orp.za/modules.php?name-VStuff&file=index&func-ShowStuff&SID=1 2 (accessed 10 February 2006).
-249-
Related Documents