American Sociological Review, 2002, Vol. 67 (December:777–803) 777 Democratic Contraction? Political Consequences of Felon Disenfranchisement in the United States Universal suffrage is a cornerstone of democratic governance. As levels of criminal punishment have risen in the United States, however, an ever-larger number of citi- zens have lost the right to vote. The authors ask whether felon disenfranchisement constitutes a meaningful reversal of the extension of voting rights by considering its political impact. Data from legal sources, election studies, and inmate surveys are examined to consider two counterfactual conditions: (1) whether removing disenfran- chisement restrictions alters the outcomes of past U.S. Senate and presidential elec- tions, and (2) whether applying contemporary rates of disenfranchisement to prior elections affects their outcomes. Because felons are drawn disproportionately from the ranks of racial minorities and the poor, disenfranchisement laws tend to take more votes from Democratic than from Republican candidates. Analysis shows that felon disenfranchisement played a decisive role in U.S. Senate elections in recent years. Moreover, at least one Republican presidential victory would have been reversed if former felons had been allowed to vote, and at least one Democratic presidential victory would have been jeopardized had contemporary rates of disenfranchisement prevailed during that time. and uneven process (Bowles and Gintis 1986:43–44, 56; Collier 1999; Rokkan 1970: 31–36; Rueschemeyer, Stephens, and Stephens 1992; Therborn 1977). As Dahl (1998) puts it, “In all democracies and re- publics throughout twenty-five centuries the rights to engage fully in political life were limited to a minority of adults” (p. 89). Po- litical and economic elites often resisted the extension of voting rights to subordinate he right to vote is a cornerstone of democratic governance and a funda- mental element of citizenship in democratic societies—one that “makes all other politi- cal rights significant” (Piven and Cloward 2000:2). Although the timing and sequenc- ing of the establishment of formal voting rights has varied from country to country, it has almost always been a slow, contested, T Direct all correspondence to Christopher Uggen, Department of Sociology, University of Minnesota, 267 19 th Avenue South #909, Minne- apolis, MN 55455 ([email protected]. edu). Earlier versions of this paper were pre- sented at the annual meeting of the American So- ciological Association in Washington, D.C., Au- gust 2000 and the American Society of Criminol- ogy in San Francisco, November 2000. This re- search was supported by grants from the National Science Foundation (#9819015) and the Indi- vidual Project Fellowship Program of the Open Society Institute. The Youth Development Study Christopher Uggen University of Minnesota Jeff Manza Northwestern University was supported by the National Institute of Child Health and Human Development (HD44138) and the National Institute of Mental Health (MH42843). We thank Clem Brooks, Jack Gold- stone, John Hagan, Paul Hirschfield, Alexander Keyssar, Ryan King, Marc Mauer, John McCarthy, John Markoff, Jeylan Mortimer, Katherine Pettus, Joachim Savelsberg, and Sara Wakefield for helpful suggestions or materials, and Melissa Thompson, Angela Behrens, Janna Cheney, Kendra Schiffman, Marcus Britton, and Jinha Kim for research assistance.

Welcome message from author
This document is posted to help you gain knowledge. Please leave a comment to let me know what you think about it! Share it to your friends and learn new things together.
Transcript
FELON DISENFRANCHISEMENTFELON DISENFRANCHISEMENTFELON DISENFRANCHISEMENTFELON DISENFRANCHISEMENTFELON DISENFRANCHISEMENT 777777777777777
American Sociological Review, 2002, Vol. 67 (December:777–803) 777
Democratic Contraction?
Political Consequences of
Felon Disenfranchisement in
the United States
Universal suffrage is a cornerstone of democratic governance. As levels of criminal
punishment have risen in the United States, however, an ever-larger number of citi-zens have lost the right to vote. The authors ask whether felon disenfranchisementconstitutes a meaningful reversal of the extension of voting rights by considering itspolitical impact. Data from legal sources, election studies, and inmate surveys areexamined to consider two counterfactual conditions: (1) whether removing disenfran-chisement restrictions alters the outcomes of past U.S. Senate and presidential elec-
tions, and (2) whether applying contemporary rates of disenfranchisement to priorelections affects their outcomes. Because felons are drawn disproportionately fromthe ranks of racial minorities and the poor, disenfranchisement laws tend to take morevotes from Democratic than from Republican candidates. Analysis shows that felondisenfranchisement played a decisive role in U.S. Senate elections in recent years.Moreover, at least one Republican presidential victory would have been reversed if
former felons had been allowed to vote, and at least one Democratic presidentialvictory would have been jeopardized had contemporary rates of disenfranchisementprevailed during that time.
and uneven process (Bowles and Gintis1986:43–44, 56; Collier 1999; Rokkan 1970:31–36; Rueschemeyer, Stephens, andStephens 1992; Therborn 1977). As Dahl(1998) puts it, “In all democracies and re-publics throughout twenty-five centuries therights to engage fully in political life werelimited to a minority of adults” (p. 89). Po-litical and economic elites often resisted theextension of voting rights to subordinate
he right to vote is a cornerstoneof democratic governance and a funda-
mental element of citizenship in democraticsocieties—one that “makes all other politi-cal rights significant” (Piven and Cloward2000:2). Although the timing and sequenc-ing of the establishment of formal votingrights has varied from country to country, ithas almost always been a slow, contested,
T
Direct all correspondence to ChristopherUggen, Department of Sociology, University ofMinnesota, 267 19th Avenue South #909, Minne-apolis, MN 55455 ([email protected]). Earlier versions of this paper were pre-sented at the annual meeting of the American So-ciological Association in Washington, D.C., Au-gust 2000 and the American Society of Criminol-ogy in San Francisco, November 2000. This re-search was supported by grants from the NationalScience Foundation (#9819015) and the Indi-vidual Project Fellowship Program of the OpenSociety Institute. The Youth Development Study
Christopher Uggen
University of MinnesotaJeff Manza
Northwestern University
was supported by the National Institute of ChildHealth and Human Development (HD44138) andthe National Institute of Mental Health(MH42843). We thank Clem Brooks, Jack Gold-stone, John Hagan, Paul Hirschfield, AlexanderKeyssar, Ryan King, Marc Mauer, JohnMcCarthy, John Markoff, Jeylan Mortimer,Katherine Pettus, Joachim Savelsberg, and SaraWakefield for helpful suggestions or materials,and Melissa Thompson, Angela Behrens, JannaCheney, Kendra Schiffman, Marcus Britton, andJinha Kim for research assistance.
778778778778778 AMERICAN SOCIOLOGICAL REVIEWAMERICAN SOCIOLOGICAL REVIEWAMERICAN SOCIOLOGICAL REVIEWAMERICAN SOCIOLOGICAL REVIEWAMERICAN SOCIOLOGICAL REVIEW
groups, including women, youth, the non-propertied, workers, poor people, racial andethnic groups, and others (Keyssar 2000;Markoff 1996:45–64; Wiebe 1995).
Yet over the course of the nineteenth andtwentieth centuries, restrictions on the fran-chise within countries claiming democraticgovernance have gradually eroded, and uni-versal suffrage has come to be taken forgranted as a key component of democracy inboth theory and practice (Dahl 1998:90).One recent survey reports that by 1994, fully96 percent of nation-states claimed to for-mally enfranchise adult men and womencitizens alike (Ramirez, Soysal, andShanahan 1997:735).1 To proclaim demo-cratic governance today means, at a mini-mum, universal suffrage for all citizens.
We consider a rare and potentially signifi-cant counter-example to the universalizationof the franchise in democratic societies: re-strictions on the voting rights of felons andex-felons. Felon disenfranchisement consti-tutes a growing impediment to universal po-litical participation in the United States be-cause of the unusually severe state votingrestrictions imposed upon felons and therapid rise in criminal punishment since the1970s. While a number of other countries(including the United Kingdom, Russia, andmany of the post-Soviet republics) deny vot-ing rights to prison inmates, the UnitedStates is unique in restricting the rights ofnonincarcerated felons (who, as we showbelow, make up approximately three-quar-ters of the disenfranchised population). Inmany European countries, including Ireland,Spain, Sweden, Denmark, and Greece, aswell as Australia and South Africa, inmatesretain the legal right to vote even while inprison (Australian Electoral Commission2001; Ewald 2002; Fellner and Mauer1998).2 In a number of other countries, vot-ing restrictions are contingent on the length
or type of sentence imposed (among thesecountries are Austria, Belgium, Italy, andNorway in Europe, and Canada, Australia,and New Zealand elsewhere). Amongpostindustrial democracies, the UnitedStates is virtually the only nation to perma-nently disenfranchise ex-felons as a class inmany jurisdictions, and the only country tolimit the rights of individuals convicted ofoffenses other than very rare treason or elec-tion-related crimes. Finland and NewZealand disenfranchise some ex-felons forspecific election offenses, but only for a lim-ited time (Fellner and Mauer 1998). Ger-many allows, by judicial discretion, the dis-enfranchisement of those convicted of elec-tion offenses and treason for a maximum offive years beyond their sentence (Demleitner2000). The United States stands alone in thedemocratic world in imposing restrictions onthe voting rights of a very large group ofnonincarcerated felons.
As many recent analysts have documented(Donziger 1996; Lynch 1995; Savelsberg1994; Sutton 2000), the United States is alsoexceptional for the rate at which it issuesfelony convictions (and thus removes theright to vote). For example, the incarcerationrate in the United States in 2000 was 686 per100,000 population, compared with rates of105 in Canada, 95 in Germany, and only 45in Japan (Mauer 1997a; U.S. Department ofJustice [henceforward USDOJ] 2002;Walmsley 2002), and similar disparities canalso be found for nonincarcerated felons.
Whether felon disenfranchisement in theUnited States actually constitutes a threat todemocracy, however, is not a simple ques-tion. Modern democratic governance entailsa set of macro-political institutions that reg-ister citizens’ preferences through (amongother things) regular competitive elections(Bollen 1979; Dahl 1998; Przeworski 1991,chap. 1). For democratic governance to bethreatened, disenfranchisement must reachlevels sufficient to change election out-comes. Raw counts of the size of the disen-
1 To be sure, many of these countries have in-complete or “façade” democracies without fullycompetitive elections (Markoff 1996, chap. 5).Even within the most democratic countries, bar-riers to participation inevitably persist (e.g., reg-istration requirements, barriers faced by disabledvoters, difficulties accessing polling places, es-pecially when elections are held on workingdays). Every country excludes noncitizen immi-grants from voting in national elections.
2 We thank Joe Levinson at the Prison ReformTrust, and Femke van der Meulen at the Interna-tional Centre for Prison Studies, both in London,for making the results of their international sur-vey of felon voting rights in Europe availableto us.
FELON DISENFRANCHISEMENTFELON DISENFRANCHISEMENTFELON DISENFRANCHISEMENTFELON DISENFRANCHISEMENTFELON DISENFRANCHISEMENT 779779779779779
franchised felon population are inconclu-sive: However much the loss of voting rightsmatters for affected individuals, there maybe no effect on political outcomes andhence, no substantive macro-level impact.Group-level analyses face the same limita-tions. Some analysts have focused on thedisproportionate racial impact of felon dis-enfranchisement (Harvey 1994; Shapiro1993) and on the widely reported statisticalestimate that approximately one in seven Af-rican American men are currently disenfran-chised (Fellner and Mauer 1998). While un-questionably important for many reasons,the disproportionate racial impact of felondisenfranchisement cannot by itself addressthe implications for American democracy asa whole. Given these considerations, we de-velop an appropriate, macro-level test. Wesuggest that determining whether felon dis-enfranchisement has had an impact onAmerican democracy requires examining theextent to which it has directly altered actualelectoral outcomes.
Because felon voting rules are state-spe-cific, the handful of earlier studies of the po-litical consequences of felon disenfranchise-ment estimated the average impact of disen-franchisement on election turnout ratesacross the states (Hirschfield 2001; Miles2000). In the analyses developed here, bycontrast, we advance an alternative, counter-factual approach. We examine specific elec-tions and test whether the inclusion of felonvoters at predicted rates of turnout and partypreference would have been sufficient tochange actual election outcomes. We usedata on voter turnout from the Current Popu-lation Survey’s Voter Supplement Module,and data on voting intention from the Na-tional Election Study, to estimate the likelyvoting behavior of the disenfranchised felonpopulation. We utilize information on feloncharacteristics from censuses and surveys ofprison inmates to estimate the size and so-cial distribution of the felon population.Combining these data sources, we are ableto estimate the net votes lost by Democraticcandidates in closely contested U.S. Senateand presidential elections, and to assess theoverall impact of felon disenfranchisementon the American political landscape. Finally,we use unique longitudinal data on criminalbackground and political behavior to test the
reasonableness of the assumptions we makein our voting analyses, drawing on newlyavailable data from the 2000 wave of theYouth Development Study (Mortimer forth-coming).
We present our paper in five parts. First,we develop the theoretical and historicalbackground of our topic, situating our em-pirical analyses in the literatures on demo-cratic theory and American criminal justice.Second, we describe the logic of our investi-gation. Third, we address data sources andmethodological issues, presenting our esti-mates of the size of the disenfranchised felonpopulation in each state. Fourth, we offer twosets of results: estimates of the likely turnoutand vote choice of felons if they had the rightto vote, and confirmatory analyses from theYouth Development Study. Last, we discusssome of the implications of our results.
THEORETICAL AND HISTORICAL
BACKGROUND
Models of Universal Suffrage and
American Democracy
The current state of democracy in Americais frequently characterized as troubled. Lowturnout rates (Piven and Cloward 2000;Putnam 2000), high levels of public apathy(Eliasoph 1998), poor information and citi-zen ignorance (Delli Carpini and Keeter1996), declining trust in the political system(Brooks and Cheng 2001; Nye, Zelikow, andKing 1997), a “crisis” of the party system(Burnham 1982) characterized by rising in-dependent partisanship, candidate-centeredpolitics, and voter dealignment (Wattenberg1991, 1994) are among the symptoms mostfrequently identified in the recent literature.Yet, virtually no attention has been paid toissues surrounding the right to vote.3
A lack of attention to voting rights re-flects the predominant scholarly consensusthat suffrage has been a settled issue sincethe passage and enforcement of the VotingRights Act of 1965. Observing the early ex-
3 A partial exception to this claim has resultedfrom the aftermath of the 2000 presidential elec-tion and the controversies growing out of theFlorida vote (e.g., National Commission on Fed-eral Election Reform 2001).
780780780780780 AMERICAN SOCIOLOGICAL REVIEWAMERICAN SOCIOLOGICAL REVIEWAMERICAN SOCIOLOGICAL REVIEWAMERICAN SOCIOLOGICAL REVIEWAMERICAN SOCIOLOGICAL REVIEW
tension of the franchise to nonpropertiedwhite men in the United States in the 1830s,Tocqueville ([1835] 1969) famously as-serted, “When a nation begins to modify theelective qualification one can be sure thatsooner or later it will abolish it altogether.That is one of the most invariable rules ofsocial behavior” (p. 59). To be sure, demo-cratic governance has been overturned inmany countries over the course of the past150 years, in some cases more than once(Markoff 1996).4 Such societal-wide demo-cratic reversals have typically entailed theelimination of democratic institutions andfree elections as part of larger shifts to au-thoritarian forms of governance. In suchcases, the right to vote in meaningful elec-tions is either completely eliminated or ren-dered irrelevant; selective disenfranchise-ment of particular groups, however, israrely the source of the turn away from de-mocracy. Democratic theory suggests thatsuffrage rights are exceptionally sticky:Once the vote is extended to a particularsegment of the population, it is rarely re-moved as long as the polity as a whole re-mains democratic.
The history of suffrage rights in the UnitedStates has appeared to many observers tohave more or less followed a Tocquevillianmodel, even if unevenly. Although thestruggle to extend the franchise to all con-tinued for some 130 years after Tocquevillewrote, the history of suffrage has been gen-erally viewed as a steady march toward uni-versalism (Flanigan and Zingale 2002:31–34; Verba, Nie, and Kim 1978:5; Williamson1960). As keen an observer of the limitationsof American democracy as Schattschneider(1960) could assert that “one of the easiestvictories of the democratic cause in Ameri-can history has been the extension of the suf-frage. . . . The struggle for the ballot was al-most bloodless, almost completely peaceful,and astonishingly easy” (p. 100). The domi-nant assumption in the literature today is that
“at least since the voting rights reforms ofthe 1960s, political rights have been univer-salized in the United States. With relativelyinsignificant exceptions, all adult citizenshave the full complement of political rights”(Verba, Scholzman, and Brady 1995:11).
Recent critical historical accounts havechallenged unilinear models of democraticextension, emphasizing the uneven develop-ment of suffrage over the course of Ameri-can history (Keyssar 2000; Rogers 1992;Shklar 1991; Wiebe 1995). This more recentscholarship describes the halting, and attimes reversible, processes through whichuniversal suffrage finally came to be adoptedin the United States. Examinations of stateand local variation in the timing and exten-sion of the franchise reveal this pattern mostclearly. The possibility that growing felondisenfranchisement may constitute a chal-lenge to the legitimacy of democratic elec-tions, however, has not generally been con-sidered (for one notable exception, seeKeyssar 2000:308).
The widespread consensus around theview that universal suffrage has been at-tained seems to be driven by a simple butplausible assumption: There is no reason tothink that disenfranchisement has any sub-stantive impact on political outcomes, as itaffects only a small group of individuals;hence, while it may be an interesting legalor philosophical question, it does not by it-self pose an empirical threat to democraticgovernance. Yet there are reasons to believethat felon disenfranchisement has not had aneutral impact on the American political sys-tem.
Racial minorities (Kennedy 1997; Mauer1999; Tonry 1995) and the poor (USDOJ1993, 2000b; Wilson and Abrahamse 1992;Wolfgang, Thornberry, and Figlio 1987) aresignificantly overrepresented in the U.S.criminal justice system. We estimate that 1.8million of the 4.7 million felons and ex-fel-ons currently barred from voting are AfricanAmericans (see Appendix Tables A and B).Because African Americans are overwhelm-ingly Democratic Party voters (Dawson1994; Huckfeldt and Kohfeld 1989; Tate1993), felon disenfranchisement erodes theDemocratic voting base by reducing thenumber of eligible African Americans vot-ers. Moreover, the white felon population is
4 Among the most important of these anti-democratic waves were the rise of fascist govern-ments in Europe between the two world wars andthe uneven development of democratic gover-nance in Asia and Central and South America af-ter World War II (for a global overview, seeRueschemeyer et al. 1992).
FELON DISENFRANCHISEMENTFELON DISENFRANCHISEMENTFELON DISENFRANCHISEMENTFELON DISENFRANCHISEMENTFELON DISENFRANCHISEMENT 781781781781781
principally composed of poor or working-class offenders (USDOJ 1993, 2000b) whoare also likely to vote Democratic (althoughnot nearly to the same extent as AfricanAmericans) (Form 1995; Hout, Brooks, andManza 1995). According to a nationally rep-resentative survey of state prison inmates,less than one-third of all state prisoners hadcompleted high school, and fewer than halfreported an annual income of $10,000 in theyear prior to incarceration (USDOJ 1993:3,2000b). In the southern states, where disen-franchisement laws tend to be most restric-tive, education and income levels are evenlower (tables available on request from au-thors). For all of these reasons, then, the pos-sibility at least exists that felon disenfran-chisement affects the outcomes of demo-cratic elections by taking net votes from theDemocratic Party.
Criminal Justice and Felon
Disenfranchisement
The possibility that felon disenfranchise-ment could be influencing recent electoraloutcomes is largely tied to changes in thecriminal justice regime over the past threedecades. For a 50-year period, from the1920s to the early 1970s, United States in-carceration rates fluctuated within a narrowband of approximately 110 prisoners per100,000 people. The policy consensus ac-companying this stability was undergirdedby a model of “penological modernism” inwhich the rehabilitation of offenders was theprimary goal of incarceration (Rothman1980). Structural elements of the criminaljustice system, including probation, parole,and indeterminate sentencing, were designedto reform offenders and reintegrate them intotheir communities. The model began tobreak down in the 1960s, however, as Re-publican presidential candidates BarryGoldwater (in 1964), and Richard Nixon (in1968), and other conservative and moderatepoliticians (such as Nelson Rockefeller inNew York) successfully promoted more pu-nitive criminal justice policies (Beckett1997; Jacobs and Helms 1996; Savelsberg1994). By the mid-1970s, a rising chorus ofconservative scholars, policy analysts, andpoliticians were advocating punitive strate-gies of deterrence and incapacitation, dis-
missing the rehabilitative model as “ananachronism” (Martinson 1974:50; Wilson1975). These trends continued in the 1980sand 1990s, with the Reagan, Bush, andClinton administrations aggressively focus-ing the nation’s attention on problems asso-ciated with drug use and the incarceration ofdrug offenders (Beckett and Sasson 2000).
The success of the conservative crimepolicy agenda over the past three decadeshas had a remarkable impact, producing anenormous increase in felony convictions andincarceration, and a corresponding increasein rates of felon disenfranchisement. Since1970, the number of state and federal pris-oners has grown by over 600 percent, fromfewer than 200,000 to almost 1.4 million(USDOJ 1973:350, 2001a:1). Other correc-tional populations have also grown by rateand number, with the number of felony pro-bationers and parolees quadrupling from1976 to 2000 (USDOJ 1979, 2001b). Whenjail inmates are added to state and federalprisoners, approximately 2 million Ameri-cans are currently incarcerated, with an ad-ditional 4.5 million supervised in the com-munity on probation or parole (USDOJ2000a), and some 9.5 million ex-offendersin the general population (Uggen, Manza,and Thompson 2000).
Not all of these felons and ex-felons aredisenfranchised, as ballot restrictions for fel-ons are specific to each state. Restrictionswere first adopted by some states in the post-Revolutionary era, and by the eve of theCivil War some two dozen states had stat-utes barring felons from voting or had felondisenfranchisement provisions in their stateconstitutions (Behrens, Uggen, and Manza2002; Keyssar 2000:62–63). In the post-Re-construction South, such laws were extendedto encompass even minor offenses (Keyssar2000:162), as part of a larger strategy to dis-enfranchise African Americans—a strategythat also included devices such as literacytests, poll taxes, and grandfather clauses (seeKousser 1974). In general, some type of re-striction on felons’ voting rights graduallycame to be adopted by almost every state,and at present 48 of the 50 states bar fel-ons—in most cases including those on pro-bation or parole—from voting. At least 10of those states also bar ex-felons from vot-ing, 2 other states permanently disenfran-
782782782782782 AMERICAN SOCIOLOGICAL REVIEWAMERICAN SOCIOLOGICAL REVIEWAMERICAN SOCIOLOGICAL REVIEWAMERICAN SOCIOLOGICAL REVIEWAMERICAN SOCIOLOGICAL REVIEW
chise recidivists, and 1 state requires a post-release waiting period.5
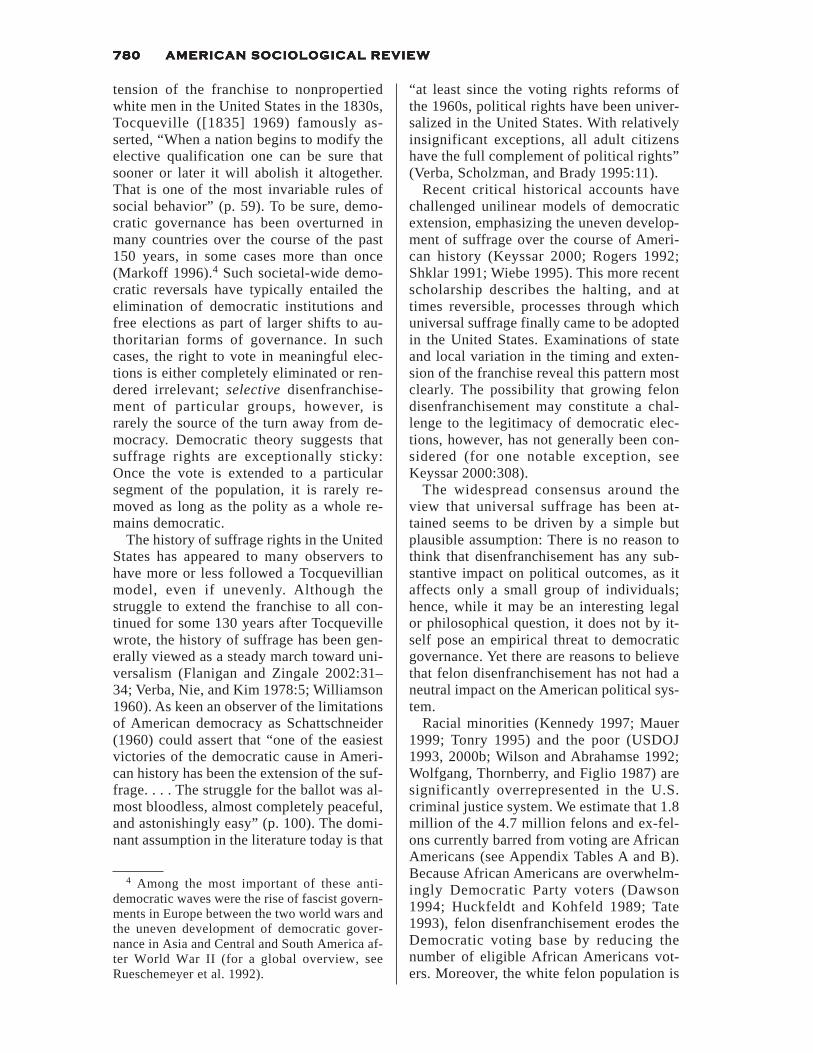
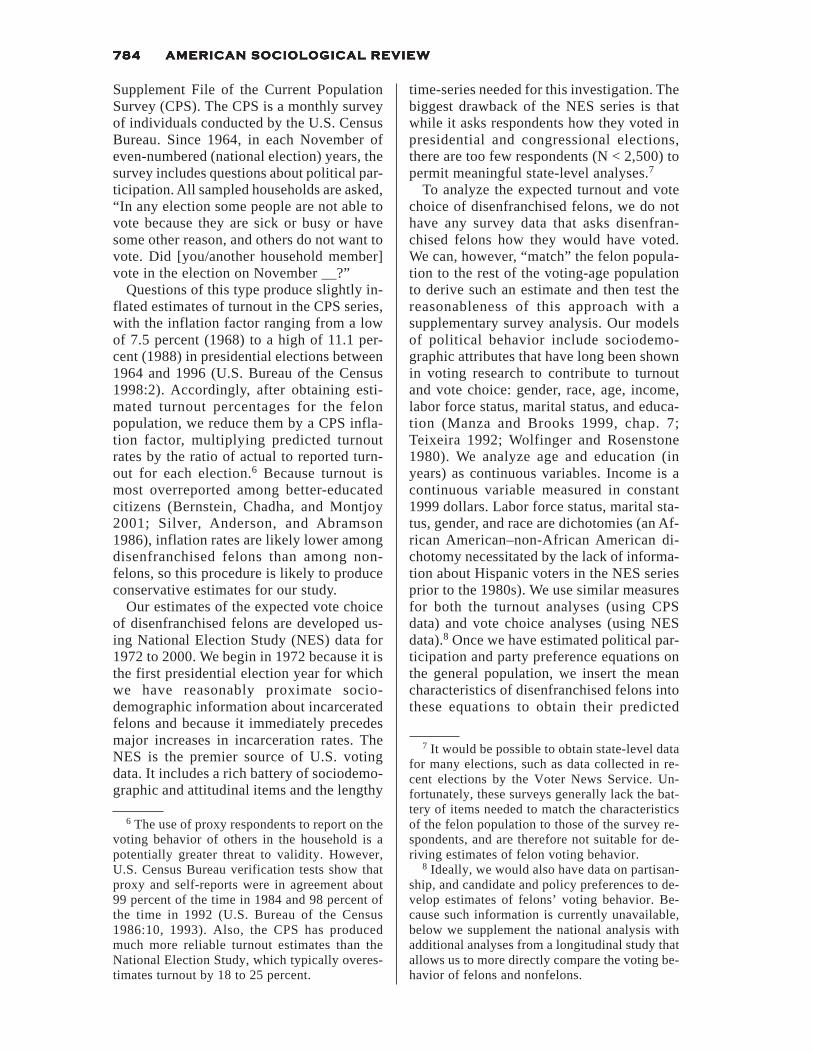
Overall, the combination of an increasingnumber of convictions, state laws that pre-vent most felons from voting, and the steadycumulative growth of the disenfranchised ex-felon population in those states that perma-nently restrict their voting rights has pro-duced a significant overall growth in the dis-enfranchised population. Our estimates sug-gest that the total disenfranchised populationhas risen from less than 1 percent of the elec-torate in 1976 to 2.3 percent of the electorate
in 2000. Figure 1 shows the steady growth ofthe percentage of the voting age populationdisenfranchised over this period. The slightdips in the mid-1970s and late-1990s reflectcertain states liberalizing their restrictions onex-felons (see Behrens et al. 2002; Manzaand Uggen forthcoming).
PRIOR RESEARCH AND
STRATEGY OF ANALYSIS
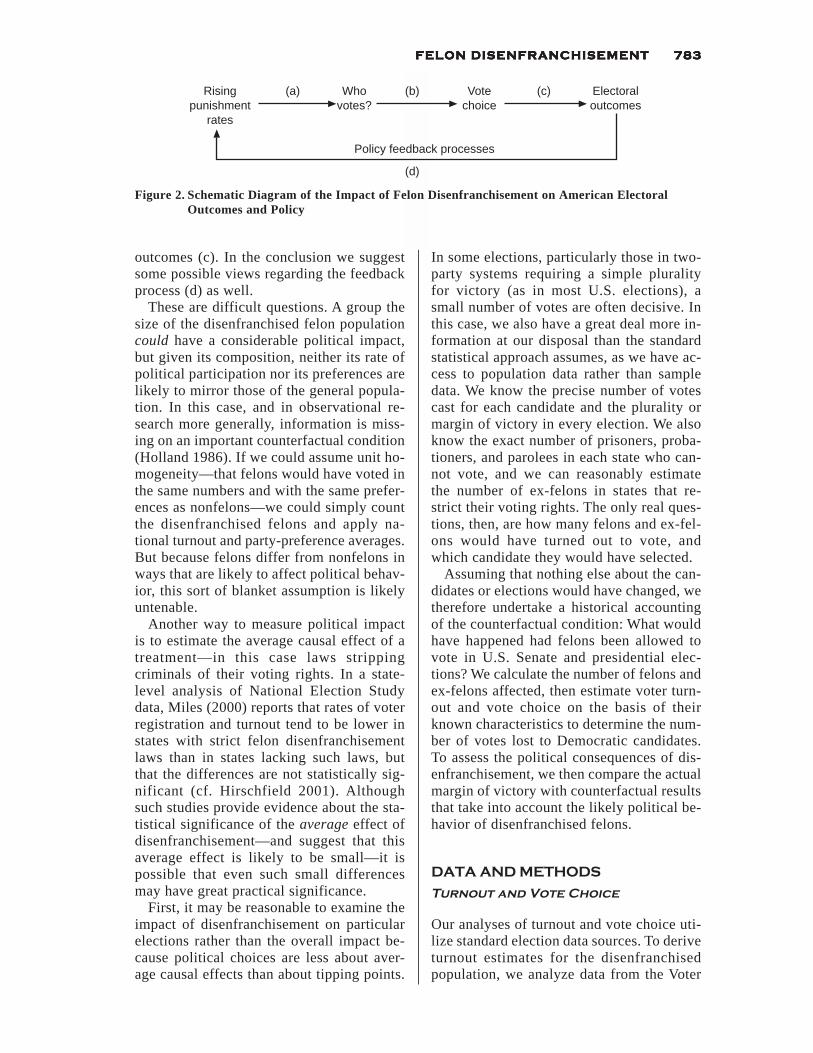
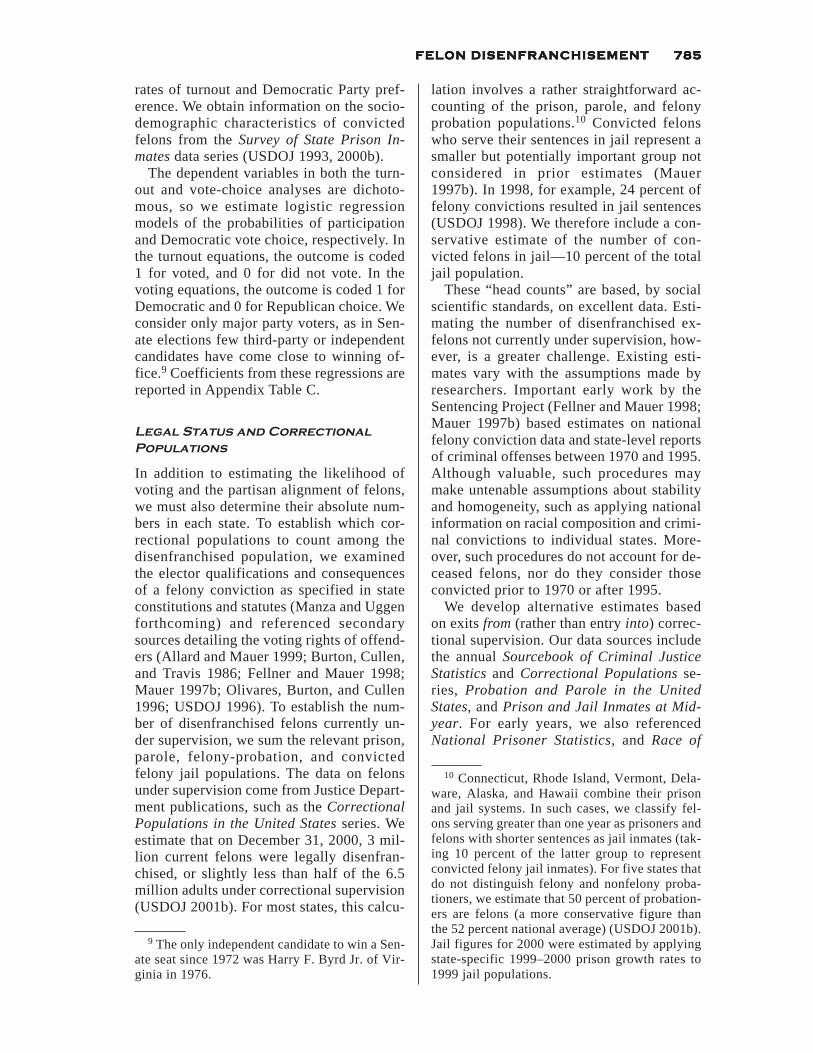
Our primary research question is whetherfelon disenfranchisement has had meaning-ful political consequences in past elections.In other words, would election outcomeshave differed if the disenfranchised hadbeen allowed to vote? To fully answer thiscounterfactual question, we must determinehow many felons would have turned out tovote, how they would have voted, andwhether those choices would have changedthe electoral outcomes. If so, a closely re-lated consideration is whether disenfran-chisement has affected public policythrough feedback processes tied to theseelectoral outcomes. Figure 2 provides aschematic representation of the questions wepose. Our burden is to estimate who votes(a), their vote choice (b), and the electoral
0
.5
1.0
1.5
2.0
2.5
1974 1976 1978 1980 1982 1984 1986 1988 1990 1992 1994 1996 1998 2000
Fel
on
s as
a P
erce
nta
ge
of
the
U.S
.Vo
tin
g-A
ge
Po
pu
lati
on
Year
Figure 1. Felon Disenfranchisement as a Percentage of the U.S. Voting-Age Population, 1974 to 2000
Note: Estimates are based on life tables constructed from U.S. Department of Justice and U.S. CensusBureau publications (U.S. Bureau of the Census 1948–2000; USDOJ 1948–2001). All sources are describedon pages 785–86.
5 At present, Vermont and Maine are the onlystates that allow incarcerated felons to vote. Ref-erenda eliminated voting rights for Utah andMassachusetts inmates in 1998 and 2000, respec-tively. Alabama, Florida, Iowa, Kentucky, Mis-sissippi, Nevada, Tennessee (for those convictedprior to 1986), Virginia, Washington (for thoseconvicted prior to 1984), and Wyoming perma-nently disenfranchise felons unless reinstated bya clemency procedure. Arizona and Marylandpermanently disenfranchise certain recidivists(those with two or more felony convictions), andDelaware requires a five-year waiting period.New Mexico rescinded permanent ex-felon dis-enfranchisement in 2001, and Maryland nar-rowed its voting ban on ex-felons in 2002.
FELON DISENFRANCHISEMENTFELON DISENFRANCHISEMENTFELON DISENFRANCHISEMENTFELON DISENFRANCHISEMENTFELON DISENFRANCHISEMENT 783783783783783
outcomes (c). In the conclusion we suggestsome possible views regarding the feedbackprocess (d) as well.
These are difficult questions. A group thesize of the disenfranchised felon populationcould have a considerable political impact,but given its composition, neither its rate ofpolitical participation nor its preferences arelikely to mirror those of the general popula-tion. In this case, and in observational re-search more generally, information is miss-ing on an important counterfactual condition(Holland 1986). If we could assume unit ho-mogeneity—that felons would have voted inthe same numbers and with the same prefer-ences as nonfelons—we could simply countthe disenfranchised felons and apply na-tional turnout and party-preference averages.But because felons differ from nonfelons inways that are likely to affect political behav-ior, this sort of blanket assumption is likelyuntenable.
Another way to measure political impactis to estimate the average causal effect of atreatment—in this case laws strippingcriminals of their voting rights. In a state-level analysis of National Election Studydata, Miles (2000) reports that rates of voterregistration and turnout tend to be lower instates with strict felon disenfranchisementlaws than in states lacking such laws, butthat the differences are not statistically sig-nificant (cf. Hirschfield 2001). Althoughsuch studies provide evidence about the sta-tistical significance of the average effect ofdisenfranchisement—and suggest that thisaverage effect is likely to be small—it ispossible that even such small differencesmay have great practical significance.
First, it may be reasonable to examine theimpact of disenfranchisement on particularelections rather than the overall impact be-cause political choices are less about aver-age causal effects than about tipping points.
In some elections, particularly those in two-party systems requiring a simple pluralityfor victory (as in most U.S. elections), asmall number of votes are often decisive. Inthis case, we also have a great deal more in-formation at our disposal than the standardstatistical approach assumes, as we have ac-cess to population data rather than sampledata. We know the precise number of votescast for each candidate and the plurality ormargin of victory in every election. We alsoknow the exact number of prisoners, proba-tioners, and parolees in each state who can-not vote, and we can reasonably estimatethe number of ex-felons in states that re-strict their voting rights. The only real ques-tions, then, are how many felons and ex-fel-ons would have turned out to vote, andwhich candidate they would have selected.
Assuming that nothing else about the can-didates or elections would have changed, wetherefore undertake a historical accountingof the counterfactual condition: What wouldhave happened had felons been allowed tovote in U.S. Senate and presidential elec-tions? We calculate the number of felons andex-felons affected, then estimate voter turn-out and vote choice on the basis of theirknown characteristics to determine the num-ber of votes lost to Democratic candidates.To assess the political consequences of dis-enfranchisement, we then compare the actualmargin of victory with counterfactual resultsthat take into account the likely political be-havior of disenfranchised felons.
DATA AND METHODS
Turnout and Vote Choice
Our analyses of turnout and vote choice uti-lize standard election data sources. To deriveturnout estimates for the disenfranchisedpopulation, we analyze data from the Voter
Rising (a) Who (b) Vote (c) Electoralpunishment votes? choice outcomes
rates
Policy feedback processes
(d)
Figure 2. Schematic Diagram of the Impact of Felon Disenfranchisement on American ElectoralOutcomes and Policy
784784784784784 AMERICAN SOCIOLOGICAL REVIEWAMERICAN SOCIOLOGICAL REVIEWAMERICAN SOCIOLOGICAL REVIEWAMERICAN SOCIOLOGICAL REVIEWAMERICAN SOCIOLOGICAL REVIEW
Supplement File of the Current PopulationSurvey (CPS). The CPS is a monthly surveyof individuals conducted by the U.S. CensusBureau. Since 1964, in each November ofeven-numbered (national election) years, thesurvey includes questions about political par-ticipation. All sampled households are asked,“In any election some people are not able tovote because they are sick or busy or havesome other reason, and others do not want tovote. Did [you/another household member]vote in the election on November __?”
Questions of this type produce slightly in-flated estimates of turnout in the CPS series,with the inflation factor ranging from a lowof 7.5 percent (1968) to a high of 11.1 per-cent (1988) in presidential elections between1964 and 1996 (U.S. Bureau of the Census1998:2). Accordingly, after obtaining esti-mated turnout percentages for the felonpopulation, we reduce them by a CPS infla-tion factor, multiplying predicted turnoutrates by the ratio of actual to reported turn-out for each election.6 Because turnout ismost overreported among better-educatedcitizens (Bernstein, Chadha, and Montjoy2001; Silver, Anderson, and Abramson1986), inflation rates are likely lower amongdisenfranchised felons than among non-felons, so this procedure is likely to produceconservative estimates for our study.
Our estimates of the expected vote choiceof disenfranchised felons are developed us-ing National Election Study (NES) data for1972 to 2000. We begin in 1972 because it isthe first presidential election year for whichwe have reasonably proximate socio-demographic information about incarceratedfelons and because it immediately precedesmajor increases in incarceration rates. TheNES is the premier source of U.S. votingdata. It includes a rich battery of sociodemo-graphic and attitudinal items and the lengthy
time-series needed for this investigation. Thebiggest drawback of the NES series is thatwhile it asks respondents how they voted inpresidential and congressional elections,there are too few respondents (N < 2,500) topermit meaningful state-level analyses.7
To analyze the expected turnout and votechoice of disenfranchised felons, we do nothave any survey data that asks disenfran-chised felons how they would have voted.We can, however, “match” the felon popula-tion to the rest of the voting-age populationto derive such an estimate and then test thereasonableness of this approach with asupplementary survey analysis. Our modelsof political behavior include sociodemo-graphic attributes that have long been shownin voting research to contribute to turnoutand vote choice: gender, race, age, income,labor force status, marital status, and educa-tion (Manza and Brooks 1999, chap. 7;Teixeira 1992; Wolfinger and Rosenstone1980). We analyze age and education (inyears) as continuous variables. Income is acontinuous variable measured in constant1999 dollars. Labor force status, marital sta-tus, gender, and race are dichotomies (an Af-rican American–non-African American di-chotomy necessitated by the lack of informa-tion about Hispanic voters in the NES seriesprior to the 1980s). We use similar measuresfor both the turnout analyses (using CPSdata) and vote choice analyses (using NESdata).8 Once we have estimated political par-ticipation and party preference equations onthe general population, we insert the meancharacteristics of disenfranchised felons intothese equations to obtain their predicted
7 It would be possible to obtain state-level datafor many elections, such as data collected in re-cent elections by the Voter News Service. Un-fortunately, these surveys generally lack the bat-tery of items needed to match the characteristicsof the felon population to those of the survey re-spondents, and are therefore not suitable for de-riving estimates of felon voting behavior.
8 Ideally, we would also have data on partisan-ship, and candidate and policy preferences to de-velop estimates of felons’ voting behavior. Be-cause such information is currently unavailable,below we supplement the national analysis withadditional analyses from a longitudinal study thatallows us to more directly compare the voting be-havior of felons and nonfelons.
6 The use of proxy respondents to report on thevoting behavior of others in the household is apotentially greater threat to validity. However,U.S. Census Bureau verification tests show thatproxy and self-reports were in agreement about99 percent of the time in 1984 and 98 percent ofthe time in 1992 (U.S. Bureau of the Census1986:10, 1993). Also, the CPS has producedmuch more reliable turnout estimates than theNational Election Study, which typically overes-timates turnout by 18 to 25 percent.
FELON DISENFRANCHISEMENTFELON DISENFRANCHISEMENTFELON DISENFRANCHISEMENTFELON DISENFRANCHISEMENTFELON DISENFRANCHISEMENT 785785785785785
rates of turnout and Democratic Party pref-erence. We obtain information on the socio-demographic characteristics of convictedfelons from the Survey of State Prison In-mates data series (USDOJ 1993, 2000b).
The dependent variables in both the turn-out and vote-choice analyses are dichoto-mous, so we estimate logistic regressionmodels of the probabilities of participationand Democratic vote choice, respectively. Inthe turnout equations, the outcome is coded1 for voted, and 0 for did not vote. In thevoting equations, the outcome is coded 1 forDemocratic and 0 for Republican choice. Weconsider only major party voters, as in Sen-ate elections few third-party or independentcandidates have come close to winning of-fice.9 Coefficients from these regressions arereported in Appendix Table C.
Legal Status and Correctional
Populations
In addition to estimating the likelihood ofvoting and the partisan alignment of felons,we must also determine their absolute num-bers in each state. To establish which cor-rectional populations to count among thedisenfranchised population, we examinedthe elector qualifications and consequencesof a felony conviction as specified in stateconstitutions and statutes (Manza and Uggenforthcoming) and referenced secondarysources detailing the voting rights of offend-ers (Allard and Mauer 1999; Burton, Cullen,and Travis 1986; Fellner and Mauer 1998;Mauer 1997b; Olivares, Burton, and Cullen1996; USDOJ 1996). To establish the num-ber of disenfranchised felons currently un-der supervision, we sum the relevant prison,parole, felony-probation, and convictedfelony jail populations. The data on felonsunder supervision come from Justice Depart-ment publications, such as the CorrectionalPopulations in the United States series. Weestimate that on December 31, 2000, 3 mil-lion current felons were legally disenfran-chised, or slightly less than half of the 6.5million adults under correctional supervision(USDOJ 2001b). For most states, this calcu-
lation involves a rather straightforward ac-counting of the prison, parole, and felonyprobation populations.10 Convicted felonswho serve their sentences in jail represent asmaller but potentially important group notconsidered in prior estimates (Mauer1997b). In 1998, for example, 24 percent offelony convictions resulted in jail sentences(USDOJ 1998). We therefore include a con-servative estimate of the number of con-victed felons in jail—10 percent of the totaljail population.
These “head counts” are based, by socialscientific standards, on excellent data. Esti-mating the number of disenfranchised ex-felons not currently under supervision, how-ever, is a greater challenge. Existing esti-mates vary with the assumptions made byresearchers. Important early work by theSentencing Project (Fellner and Mauer 1998;Mauer 1997b) based estimates on nationalfelony conviction data and state-level reportsof criminal offenses between 1970 and 1995.Although valuable, such procedures maymake untenable assumptions about stabilityand homogeneity, such as applying nationalinformation on racial composition and crimi-nal convictions to individual states. More-over, such procedures do not account for de-ceased felons, nor do they consider thoseconvicted prior to 1970 or after 1995.
We develop alternative estimates basedon exits from (rather than entry into) correc-tional supervision. Our data sources includethe annual Sourcebook of Criminal JusticeStatistics and Correctional Populations se-ries, Probation and Parole in the UnitedStates, and Prison and Jail Inmates at Mid-year. For early years, we also referencedNational Prisoner Statistics, and Race of
9 The only independent candidate to win a Sen-ate seat since 1972 was Harry F. Byrd Jr. of Vir-ginia in 1976.
10 Connecticut, Rhode Island, Vermont, Dela-ware, Alaska, and Hawaii combine their prisonand jail systems. In such cases, we classify fel-ons serving greater than one year as prisoners andfelons with shorter sentences as jail inmates (tak-ing 10 percent of the latter group to representconvicted felony jail inmates). For five states thatdo not distinguish felony and nonfelony proba-tioners, we estimate that 50 percent of probation-ers are felons (a more conservative figure thanthe 52 percent national average) (USDOJ 2001b).Jail figures for 2000 were estimated by applyingstate-specific 1999–2000 prison growth rates to1999 jail populations.
786786786786786 AMERICAN SOCIOLOGICAL REVIEWAMERICAN SOCIOLOGICAL REVIEWAMERICAN SOCIOLOGICAL REVIEWAMERICAN SOCIOLOGICAL REVIEWAMERICAN SOCIOLOGICAL REVIEW
Prisoners Admitted to State and Federal In-stitutions, 1926–1986 (all of these areUSDOJ publications). We determine themedian age of released prisoners based onannual data from the National CorrectionsReporting Program (USDOJ 1983–1996).We use recidivism data from national prob-ability samples of prison releasees (USDOJ1989) and probationers (USDOJ 1992) toestablish the number who reoffend. We thencompile life tables for the period 1948–2000 to determine the number of releasedfelons lost to recidivism (and therefore al-ready included in our annual head counts)and to mortality each year (e.g., seeBonczar and Beck 1997). Each cohort ofdisenfranchised releasees is thus succes-sively reduced each year and joined by anew cohort of releasees. This allows us tocompute the number of ex-felons no longerunder correctional supervision for statesthat disenfranchise ex-felons.
Our recidivism estimates are based onUSDOJ studies of prisoners (1989) and pro-bationers (1992). The prisoner and paroleerecidivism rate is 18.6 percent at one year,32.8 percent at two years, and 41.4 percentat three years. For probationers and jail in-mates, the corresponding three-year failurerate is 36 percent. To extend the analysis tosubsequent years, we computed a trend linebased on the ratio of increases in Hoffmanand Stone-Meierhoefer’s (1980) study offederal prisoners. By year 10, we estimate a59.4 percent recidivism rate among formerprisoners and parolees, which increases to65.7 percent by year 52 (the maximum dura-tion in the analysis). Because these rates ex-ceed those of most long-term recidivismstudies, they should yield conservative esti-mates of the disenfranchised ex-felon votingbase. We calculate mortality based on theexpected number of deaths for AfricanAmerican males (the group with the highestmortality rates) at the median age of releasefor each state, multiplied by a constant fac-tor of 1.46 to match the high death rates ob-served in the Justice Department’s recidi-vism study (USDOJ 1989). Age-specific andyear-specific mortality data were obtainedfrom the Statistical Abstract series “Expec-tation of Life and Expected Deaths, by Race,Sex, and Age” (U.S. Bureau of the Census1948–2000).
These ex-felon estimates also account forthe fact that some states restore the civilrights of many releasees or only disenfran-chise certain ex-felons. Florida, for example,has restored voting rights to over 160,000disenfranchised felons since the 1960s anddoes not impose felony adjudication forsome probationers who successfully com-plete their sentences.
THE POLITICAL IMPACT OF
FELON DISENFRANCHISEMENT
Turnout and Party Preference
Table 1 shows the estimated national partici-pation rates and voting preferences for dis-enfranchised felons by year since 1972.These estimates are based on the voting be-havior of those matching felons in terms ofgender, race, age, income, labor force status,marital status, and education, adjusted foroverreporting of voting in the CPS. In short,they provide evidence regarding the likelybehavior of hypothetical felon and ex-felonvoters. Our estimates of felon turnout rangefrom a low of 20.5 percent (for the 1974Congressional elections) to a high of 39 per-cent (for the 1992 presidential election). Onaverage, we predict that about 35 percent ofdisenfranchised felons would have turnedout to vote in presidential elections, and thatabout 24 percent would have participated inSenate elections during nonpresidential elec-tion years. Although these numbers are wellbelow the corresponding rates among non-felons, they suggest that a non-trivial pro-portion of disenfranchised felons were likelyto have voted if permitted to do so.
According to our analysis of party choicein Table 1, our hypothetical felon votersshowed strong Democratic preferences inboth presidential and senatorial elections. Inrecent presidential elections, even compara-tively unpopular Democratic candidates,such as George McGovern in 1972, wouldhave garnered almost 70 percent of the felonvote. These Democratic preferences are lesspronounced and somewhat less stable insenatorial elections. Nevertheless, the surveydata suggest that Democratic candidateswould have received about 7 of every 10votes cast by the felons and ex-felons in 14of the last 15 U.S. Senate election years. By
Related Documents