UNIVERSITY OF WARMIA AND MAZURY IN OLSZTYN Polish Journal of Natural Sciences 33 (3/2018) PUBLISHER UWM OLSZTYN 2018

Welcome message from author
This document is posted to help you gain knowledge. Please leave a comment to let me know what you think about it! Share it to your friends and learn new things together.
Transcript

1
UNIVERSITY OF WARMIA AND MAZURY IN OLSZTYN
PolishJournal
of Natural Sciences
33(3/2018)
PUBLISHER UWM OLSZTYN 2018

EDITORIAL BOARDMałgorzata Woźniak (Editor-in-chief), Anna Źróbek-Sokolnik (Biology),
Mirosław Wyszkowski (Agriculture), Katarzyna Majewska (Food Science), Małgorzata Jankun-Woźnicka (Fishery), Józef Szarek (Veterinary Science),
Julita Dunalska (Environmental Protection), Andrzej Gugołek (Animal Breeding and Husbandry) Vaclav Matoušek (Animal Science, Czech Republic), Juraj Mlynek
(Animal Behavior, Slovak Republik), Grażyna Furgała-Selezniow (Humans and Environment)
Executive editor Agnieszka Orłowska-Rachwał
The Polish Journal of Natural Sciences is indexed and abstracted in Biological Abstracts and Biosis Previews
The print edition is the primary version of the Journal
The Journal is also available in electronic form on the websites http://www.uwm.edu.pl/polish-journal/ (home page) http://wydawnictwo.uwm.edu.pl (subpage Czytelnia)
PL ISSN 1643-9953
© Copyright by Wydawnictwo Uniwersytetu Warmińsko-Mazurskiego Olsztyn 2018
PUBLISHER UWM OLSZTYN
Address ul. Jana Heweliusza14
10-718 Olsztyn-Kortowo, Poland tel.: +48 89 523-36-61fax: +48 89 523-34-38
e-mail: [email protected]
Ark. wyd. 12,9, ark. druk. 10,5, nakład 90 egz.Druk – Zakład Poligraficzny UWM w Olsztynie
zam. nr 431

TABLE OF CONTENTS
Animal Breeding and Husbandry
M. Brzozowski – The Conditions of Housing Young Mink with Their Mothers As a Crucial Contributing Factor Influencing the Results of Reproductive Efficiency in Relation to the Requirements of The Fur Animal Welfare Assessment Protocol . . . . . . . . . . . . . . . . . . . . . . . . . . . . . . . . . . . . . . . . . . . . . . . . . . . . . . . . . . . . . . . . . . . . . .
Biology
L. PurnaMasari, r. kasMeri, M.H.F. aMin, a. soegianto – Morphometric Characteristics of Alien Crayfish Cherax Quadricarinatus from Maninjau Lake (West Sumatra, Indonesia) . . . . . . . . . . . . . . . . . . . . . . . . . . . . . . . . . . . . . . . . . . . . . . . . . . . . . . . . . . . . .
Food and Nutrition Sciences
A. BAnAś, A. Korus, M. taBaszewska – Antioxidant Properties of Low-Sugar Strawberry Jam Enriched with Plant Raw Materials . . . . . . . . . . . . . . . . . . . . . . . . . . . . . . .M. WroniAK, A. ręKAs, D. DereWiAKA – A Comparison of Nutritional Value of Cold-Pressed Rapeseed Oils Obtained from Seeds Grown under Conventional and Ecological Conditions . . . . . . . . . . . . . . . . . . . . . . . . . . . . . . . . . . . . . . . . . . . . . . . . . . . . . . . . . . . . . . .
Environmental Protection
A.H. olADele, o. Digun-AWeto, A. Jenyo-oni – The Relationship between Iron, Lead and Cobalt Content in Water, Sediments, Nile Tilapia and African River Prawn of Lake Asejire, Nigeria . . . . . . . . . . . . . . . . . . . . . . . . . . . . . . . . . . . . . . . . . . . . . . . . . . . . . . . . .A. WysocKA-czuBAszeK, P. BAnAszuK, r. czuBAszeK – Methane and Nitrous Oxide Emissions from Agriculture in the Podlaskie Voivodeship in Years 1999–2015 . . . . . . . . . . . . . . . . . . . . . . . . . . . . . . . . . . . . . . . . . . . . . . . . . . . . . . . . . . . . . . . . . . . . . . . . . . . . . . . . .
Humans and Environment
t. BrzezińsKA-WóJciK – Use of Biotic Resources of Roztocze in Tourism Offers in the Context of the Theoretical Concept of Tourism Area Product . . . . . . . . . . . . . . . . . . . . . . . . . . . . . . . . . . . . . . . . . . . . . . . . . . . . . . . . . . . . . . . . . . . . . . . . . . . . . . . . . . . .
355
369
385
401
417
433
455

Veterinary Medicine
D. gulDA, M. liK – The Use of Manual Therapy in Canine Discipline – Agility . . . . .J. KArAźnieWicz, i. sołtyszeWsKi, t. MAleWsKi, J. szAreK, M. FelsMAnn, W. gruDzień, A. DziKoWsKi – Review of Procedures Concerning Animals Involved in Traffic Accidents – Including Own Investigations . . . . . . . . . . . . . . . . . . . . .
SPIS TREŚCI
Chów i hodowla zwierząt
M. Brzozowski – Warunki odchowu młodych norek przy samicach jako istotny czynnik wpływający na wyniki rozrodu, w odniesieniu do wymagań protokołu oceny dobrostanu zwierząt futerkowych . . . . . . . . . . . . . . . . . . . . . . . . . . . . . . . . . . . . . . . . . . . . . . .
Biologia
L. PurnaMasari, r. kasMeri, M.H.F. aMin, a. soegianto – Morfometryczna charakterystyka obcego gatunku raka Cherax quadricarinatus z jeziora Maninjau (Sumatra Zachodnia, Indonezja) . . . . . . . . . . . . . . . . . . . . . . . . . . . . . . . . . . . . . . . . . .
Nauka o żywności i żywieniu
A. BAnAś, A. Korus, M. tABAszeWsKA – Właściwości przeciwutleniające niskosłodzonych dżemów truskawkowych wzbogaconych w surowce roślinne .......M. WroniAK, A. ręKAs, D. DereWiAKA – Porównanie wartości żywieniowej oleju rzepakowego tłoczonego na zimno otrzymanego z nasion z upraw konwencjonalnych i ekologicznych . . . . . . . . . . . . . . . . . . . . . . . . . . . . . . . . . . . . . . . . . . . . . . . . . . . . .
Ochrona środowiska
A.H. olADele, o. Digun-AWeto, A. Jenyo-oni – Zależność między zawartością żelaza, ołowiu i kobaltu w wodzie, osadach oraz w tilapii nilowej i afrykańskiej krewetce rzecznej z jeziora Asejire (Nigeria) . . . . . . . . . . . . . . . . . . . . . . . . . . . . . . . . . . . . . . . . . . . . . . .A. WysocKA-czuBAszeK, P. BAnAszuK, r. czuBAszeK – Emisja metanu i podtlenku azotu z rolnictwa w województwie podlaskim w latach 1999–2015....
487
503
355
369
385
401
417
433
Człowiek i środowisko
t. BrzezińsKA-WóJciK – Wykorzystanie zasobów przyrody ożywionej Roztocza w ofertach turystycznych w kontekście teoretycznej koncepcji obszarowego produktu turystycznego . . . . . . . . . . . . . . . . . . . . . . . . . . . . . . . . . . . . . . . . . . . . . . . . . . . . . . . . . . . . . . . . . .
Medycyna weterynaryjna
D. gulDA, M. liK – Zastosowanie terapii manualnych w dyscyplinie kynologicznej – Agility . . . . . . . . . . . . . . . . . . . . . . . . . . . . . . . . . . . . . . . . . . . . . . . . . . . . . . . . . . . . . . . . . . . . . . . . . . . . . . . . . . . .J. KArAźnieWicz, i. sołtyszeWsKi, t. MAleWsKi, J. szAreK, M. FelsMAnn, W. gruDzień, A. DziKoWsKi – Przegląd procedur postępowania ze zwierzętami uczestniczącymi w wypadkach drogowych (z włączeniem badań własnych) . . . . . .
455
487
503


POLISH JOURNAL OF NATURAL SCIENCES Abbrev.: Pol. J. Natur. Sc., Vol 33(3): 355–367, Y. 2018
THE CONDITIONS OF HOUSING YOUNG MINK WITH THEIR MOTHERS AS A CRUCIAL CONTRIBUTING
FACTOR INFLUENCING THE RESULTS OF REPRODUCTIVE EFFICIENCY IN RELATION
TO THE REQUIREMENTS OF THE FUR ANIMAL WELFARE ASSESSMENT PROTOCOL
Marian Brzozowski Animal Breeding and Production Department
Warsaw University of Life Sciences WULS-SGGW, Warsaw, Poland
K e y w o r d s: mink welfare, nest box quality, feeding mink prior to weaning.
A b s t r a c t
The aim of this paper is to juxtapose, on the one hand, the results of research held with a view to providing young mink with the best possible conditions in the period of being housed with their mothers (the nest box quality and the food and water provision conditions), and, on the other – the requirements set before fur farms in the scope of providing the animals with the best possible welfare standards contained in European recommendations (Welfare Quality®… 2018, weLFur 2015). The analyzed research refers to the protective properties of the material lining the nest, as well as the availability of water and feed for young mink at the earliest stage of their life. The juxtaposition of the actions of farm managers and researchers with European requirements points to their congruence, which in the end result provides the animals with growing welfare conditions.
Address: Marian Brzozowski, Warsaw University of Life Sciences WULS-SGGW, ul. Ciszew- skiego 8, 02-786 Warszawa, Poland, phone: +48 (22) 593 65 41, e-mail: [email protected]

Marian Brzozowski356
WARUNKI ODCHOWU MŁODYCH NOREK PRZY SAMICACH JAKO ISTOTNY CZYNNIK WPŁYWAJĄCY NA WYNIKI ROZRODU,
W ODNIESIENIU DO WYMAGAŃ PROTOKOŁU OCENY DOBROSTANU ZWIERZĄT FUTERKOWYCH
Marian Brzozowski
Katedra Szczegółowej Hodowli ZwierzątSzkoła Główna Gospodarstwa Wiejskiego w Warszawie, Polska
S ł o w a k l u c z o w e: dobrostan norek, jakość gniazda, żywienie norek do odsadzenia.
A b s t r a k t
W publikacji zestawiono wyniki badań przeprowadzonych w celu zapewnienia młodym nor-kom jak najlepszych warunków w okresie odchowu przy samicach (jakość gniazd oraz warunki żywienia i pojenia) z wymaganiami stawianymi fermom zwierząt futerkowych w zakresie zapew-nienia zwierzętom jak najwyższego poziomu dobrostanu, a zawartych w europejskich rekomenda-cjach (Welfare Quality®… 2018, weLFur 2015). Analizowane badania dotyczą właściwości ochronnych materiału wyściełającego gniazdo, a także dostępności wody i pokarmu dla szczeniąt norek w jak najwcześniejszym okresie ich życia. Zestawienie ze sobą działań hodowców i naukow-ców oraz wymagań europejskich wskazuje na ich zbieżność mającą na celu zapewnienie zwierzę-tom coraz lepszych warunków, w jakich są utrzymywane.
Introduction
Issues pertaining to raising the welfare conditions of livestock animals are a crucial subject area of discussions held in different EU Member Sta-tes. In effect of such discussions, as well as actions held in consequence thereof, the European Union had funded a research project titled “Welfare Quality®: Science and society improving animal welfare in the food quality chain,” with a view to developing the principles of improving the welfare of livestock animals (BLokHuis 2008, BLokHuis et al. 2012). The aim of the project, which has been held in 2004–2009, was to integrate know-ledge from the field of livestock animal welfare within the food quality chain. The project has been coordinated by INRA (Institut National de la Recherche Agronomique, France) and encompassed the basic species of livestock animals, that is, pigs, poultry, and cattle (Brzozowski 2017). The results of the projects have become a touchstone for the introduction of legal regulations with a view to improving livestock animal welfare con-ditions in EU Member States. The interest of Western societies in impro-

The Conditions of Housing Young Mink with Their Mothers... 357
ving the welfare conditions of livestock animals is confirmed by the Special Eurobarometer Report “Attitudes of Europeans towards Animal Welfare” (Special Eurobarometer Report 2016). The vast majority of consumers who participated in the Eurobarometer survey have declared that they are not opposed to pay more for food items produced with a view to providing livestock with a high level of welfare conditions.
Cognizant of such a created view on reality, the fur industry decided to actively participate in the discussion and prove to the public opinion that the term animal welfare is a priority they support as well. For the indu-stry, this is an issue of reaching out to the society with a message of the actual state of breeding fur animals. The fact that most farms provide appropriate conditions for their animals is attested to by the high price of fur skins on the auction markets, as it is impossible to obtain high quality skins in the fur trade without providing the animals with the opti-mal welfare conditions (Brzozowski 2017).
The abovementioned EU project with a view to providing livestock ani-mals with the best possible welfare conditions is congruent with the speci-fic actions undertaken by farm managers and scientists alike, with respect to raising the conditions of breeding animals. Such issues also include the matter of nest box quality and food provision conditions for young mink.
The aim of this paper is to juxtapose, on the one hand, the results of research held with a view to providing young mink with the best possible conditions in the period of being housed with their mothers (the nest box quality and the food and water provision conditions), and, on the other – the requirements set before fur farms in the scope of providing the ani-mals with the best possible welfare standards contained in European rules, regulations, and recommendations.The conditions of housing young mink with their mothers from the point of view of animal needs, two issues are the most crucial in the period of housing young mink with their mothers: proper housing (nest box) and proper food and water provision conditions.
Proper nest box
Multiple species of mammals instinctively build a den or nest prior to giving birth. This group of animals is collectively referred to as “altricial species,” which points to the fact that in order to properly nurture their young, especially in the first period after birth, the animals require a properly prepared and protected den or nest.

Marian Brzozowski358
The group of “altricial species” also comprises carnivorous fur animals, including mink. The breeding of mink is seasonal and delivery takes place in the end of April and in the beginning of May. In this period, the ambient temperature is variable, with warm and cold days occurring interchange-ably, with temperatures dropping even below 0oC. In effect, in the first weeks of life, the offspring are completely dependent on the mother not just due to suckling, but also because the offspring are incapable of thermoregulation. For this reason, the mother also provides her offspring with heat and protects them from exposure to cold. According to Danish studies, the thermal comfort zone in a mink nest in the first years of life falls within the range of 25–30oC (tausson et al. 2006). In the postnatal period, the offspring have severely limited energy reserves: a mere 1% of the body mass at birth is fat, which in the case of a mink birth mass of about 10 g translates to a mere 0.1 g of fat tissue. A long and thin body shape results in an unfavorable ratio of volume to surface area, or, in other words, considerable heat loss. Furthermore, nestlings have severely limi-ted locomotive skills and, once they find themselves outside the nest, are unable to return. The highest mortality rate for nestlings pertains to the first days of life, and one of the main reasons behind nestling mortality immediately after birth is hypothermia (cAstellA and MaLMkvist 2008). The American mink has an effective adaptive mechanism with a view to conserving the nestlings’ limited energy reserves. Reduction in body tem-perature causes the young mink to enter into a hypothermal state resem-bling torpor, in which the pace of metabolism and the level of activity are reduced. Upon raising the body temperature, the kits are able to return to their normal metabolic state and activity level. It turns out that a strategy focused on entering a reduced state of metabolism in mink is more effec-tive in terms of the survivability of a larger number of offspring than an attempt at thermoregulation (MaLMkvist and HouBak 2000). In the wild, the female must leave the nest in order to find food. During this time, her offspring remain alone in the nest. The nestlings’ crowded presence in a heat-insulated nest prevents heat loss. In the case of farm mink food intake is not a factor which would require the female to abandon the nest for long enough to endanger the well-being of the offspring, but extreme weather conditions in connection with the inadequate construction of the nest box may lead to hypothermia in single nestlings or entire litters. In the case of mink, the development of a thermoregulatory mechanism manifesting itself in heightened metabolic activity during exposure to low temperatures appears after about 6 weeks (tausson et al. 2006). In order to provide optimal conditions for the delivery and rearing of young mink, the animals are provided with properly constructed and protected cages,

The Conditions of Housing Young Mink with Their Mothers... 359
which are further fitted with nest boxes in which the female prepares her nest. The lack of a nest or an improperly prepared nest are a severe risk with respect to the survivability of nestlings. Furthermore, as Danish stu-dies by MaLMkvist and PaLMe (2008) indicate, ridding the females of the possibility of building nests leads to build-up of additional stress in the perinatal period. In the aforementioned study, the researchers divided the female mink into two groups, of which one was provided with bedding material for the nest box and the other was not. The researchers determi-ned that the lack of bedding material raises the level of cortisol (the stress hormone) in female mink.
The standard nest-building material substrate used in mink breeding is barley straw. At the same time, a number of studies have evaluated the usability of other materials which could be used to this effect. In a study MaLMkvist and PaLMe (2008) have compared the quality of nests and reproductive efficiency in females which had access to either plastic bed-ding material, barley straw, or concurrent access to both products. The highest marks were awarded to nests created with the use of both mate-rials: plastic and straw, but the obtained results were statistically insigni-ficant (MaLMkvist and PaLMe 2008). Similar results were obtained in a study from 2012, which compared nests made of straw with the addition of rabbit wool (lunD and MaLMkvist 2012), or a 2016 study, which com-pared nests made of straw with the addition of sheep wool (MaLMkvist et al. 2016). In another experiment by lester-sAenz et al. (2014), aspen sawdust was compared with straw. The researchers came to the conclusion that while sawdust nests rated higher on a 5-point scale and provided bet-ter comfort to the nestlings, this in itself did not translate into reducing nestling mortality rates. In turn, in her study śliWińsKA (2017) compared three bedding materials: barley straw mixed with thermally processed wheat straw; thermally processed and dedusted pinewood shavings mixed with thermally processed wheat straw; as well as thermally processed and dedusted pinewood shavings alone. Nests from barley straw were evaluated as being lower in quality (less heat-insulating) in comparison with nests made from other materials, but this in itself also did not re- sult in differences in reproductive efficiency. The study also observed that two-year-old females have a higher reproductive efficiency regardless of the type of bedding material.

Marian Brzozowski360
The feeding and watering of young mink prior to weaning
Aside from the minks’ genetic makeup, feeding is the most crucial fac-tor influencing their reproductive efficiency. Mink are typical carnivores, however, in farmed mink the gastrointestinal function and nitrogen meta-bolism has changed compare to wild ones: farmed animals make better use of nutrients (gugołeK et al. 2013, gugołeK et al. 2015). Feeding should be consistent with changing nutritional requirements in subsequent deve-lopmental periods. Mink feed components should be characterized by proper sanitary conditions, and the feed itself should be provided in a timely manner and in the right quantity (Zalecenia żywieniowe… 2011). Table 1 presents the general principles of the nutritional quality of mink feed in subsequent production (breeding and feeding) periods.
Table 1The nutritional requirements in mink in subsequent production periods
(Zalecenia żywieniowe… 2011)
Subsequent production (breeding and feeding) periods
Percentage of metabolic energy from [%]proteins fats carbohydrates
From December to matingFrom mating to July 15From July 16 to September 15From September 15 to pelting*
45–5540–4533–4028–35
30–4038–4545–5542–50
12–2012–2012–2015–20
* – depending on the coloration from November 15 to December 15
In order to achieve high reproductive efficiency, it is crucial to properly feed the foundation stock throughout the entire year, with the highest importance assigned to the period beginning in December, when the only animals remaining on the farm are those selected for mating. This period (from December to mating) is further divided into three distinct sub-pe-riods: preparation for mating, when animals should have restrictive diets, the mating period proper, and the following gestation period, when fema-les should be fed without limit (Zalecenia żywieniowe… 2011).
The period of restrictive feeding is intended to instill the proper mating conditions in mink. For this process to be successful, it should be performed in the long term, individualized, and tailored to the climate conditions in a given year. It is also crucial it ends before the onset of mating. One should also remember to provide the necessary higher quantity of vitamins, as well as macro- and microelements in reduced-vo-lume doses (słAWoń 1987, rouvinen-WAtt 2003).
In the gestation period, females should be provided feed with a view to the optimal development of the fetuses – rich in nutrients – primarily pro-

The Conditions of Housing Young Mink with Their Mothers... 361
tein, vitamins, minerals, and allowing the organism to build up stores of nutrients for the lactation period. In the case of mink, nutritional demand in the first half of the gestation period is close to normal demand, as the nutritional needs prior to the implantation of the embryos are mini-mal. In the second half of the gestation period the nutritional needs are higher due to the development of the fetuses. In the first half of the gesta-tion period there should be a slight rise in the body mass of the pregnant female, which in the second half of the gestation period should rise to about 10–15% in relation to initial mass at the onset of gestation. In accor-dance with this principle, it is advised to raise the general energy value of the feed by about 10% (Zalecenia żywieniowe… 2011).
It has been demonstrated that most premature mortality of mink kits, apart from mortality resulting from the behavioral disorders of the mother, is caused by bacterial infections, which may be tied to the “wet nest” syn-drome (wet kits, greasy kits) and result in significant premature mortality in kits. The incidence rate is variable and depending on the year and the farm is as high as 30%, with a death rate of 1–2 kits per litter. This syn-drome is not, strictly speaking, a disease, but rather, a disease symptom, which may, apart from diet, have multiple other causes. It is present in kits and manifests by stickiness and a certain greasiness of their hair coating, as well as diarrhoea. The first stages of diarrhoea are not by and large infectious, but in effect the kits become weaker and their condition worsens. In turn, this weakened state often leads to further infections of the gastrointestinal tract and the diarrhoea becomes infectious itself. While the initial causes of this syndrome are diverse, they nonetheless always remain the result of interactions between three factors: diet, imba-lanced intestinal microflora, and low resistance to infectious agents in kits. The main area of contact between the young animal and pathogens, which is crucial in the development of the proper functioning of the orga-nism’s immune system, is the gastrointestinal tract. Feeding mistakes are the main factor which may influence the dysfunction of the gastrointesti-nal tract. This, in turn, leads to a drop in the natural resistance to bacte-rial infections (clAusen and Dietz 2000, clAusen and Dietz 2004, rouvinen-WAtt 2003). Health improvement can be also obtained by using probiotic and prebiotic preparations, as it was demonstrated in polar fox, another carnivorous animal (Lorek et al. 2001, gugołeK et al. 2004).
The requirement for nutrients, vitamins, minerals, and energy is much higher in the case of lactating females than during gestation itself, particularly in female mink with large litters. However, the mink feed component ratio and its nutritional and energy values should be changed gradually over time, as to prevent disorders in feed intake. When selecting

Marian Brzozowski362
the feed components for dosages in the lactation period, as well as in the preceding period, one should take into account their freshness, high biolo-gical value, and proper microbiological state. Young mink grow very fast and the mass of the litter in the fourth week of lactation begins to equal the body mass of the female (Hansen and Berg 1997). As is apparent from studies by waMBerg and tauson (1998), the average daily mink kit milk intake is over 11 g in the first week and up to 28 g in the fourth week of life, which means that daily milk production by a female with a litter of ten kits may approach 300 g (Table 2 ). The above values point to the necessity of properly feeding the females, so that they will be able to meet such demands.
Table 2Milk intake in mink kits in subsequent weeks of lactation
(after waMBerg and tauson 1998)
DetailsLactation [week]
1 2 3 4Number of kit per litter 7–9 7–8 7–9 7–8
Female body mass weight [g] 1095 1154 1077 1131
Mass of all kits in the litter [g] 151 274 595 807
Daily milk intake by a single kit [g] 11.1 18.0 27.0 27.7
Daily milk intake by the entire litter [g] 78–100 126–144 189–243 194–222
Another factor of fundamental significance rests in watering the fema-les and providing them with continuous access to water during lactation, when the females are burdened with considerable water retention issues. It has been evaluated that up to 15% of the water in the mother’s body is transferred with the milk to the organisms of the kits (tauson et al. 1998).
One of the most critical points in the development and rearing of young mink is the termination of lactation and transfer to eating solid feed. As documented by relevant scholarship in the matter (MoLLer 1991, Brink et al. 2004, aHLstroM 2010), the nestlings begin to take in solid feed when they are about 4 weeks old (after 30 days since birth). Since then on, they start to gain weight intensively: while after 30 days they weigh about 300 g, only three weeks later their mass amounts to 600 g (clAussen et al. 1992). The transfer to solid feed is also tied to higher water intake. Studies (Brink et al. 2004) show that 30-to-40-day-old nestlings still prefer to remain in the nest. This is tied to the fact that their locomotive skills still remain undeveloped. Access to drinking water available in drinking nipples on the opposite side of the cage is very difficult. In effect, farm managers are faced with the problem of combating water deficiency in kits.

The Conditions of Housing Young Mink with Their Mothers... 363
A good source thereof is the mother’s milk, moisture contained in the feed, and the female’s saliva. When searching for water, the kits lick the snouts of their mothers and attempt to suckle the mother during the entire nur-sing period in the nest. This, in turn, burdens the females and leads to a drop in their body mass (De ronD 2008). One solution to this problem is to insert additional water sources near the exit of the nest box itself. Literature contains information on other solutions. In his research, as a source of water for nestlings steFFensen (2007) used a watering thro-ugh in the form of a bowl placed in the cage near the exit from nest boxes. This solution allowed the kits to begin to drink water 3 days earlier than the kits in the control group, which resulted in more efficient growth in the experimental group. However, this system proved to be hard to imple-ment on a large scale due to its labor intensity and hardships in keeping the water throughs clean. De ronD and Kleyn vAn Willigen (2009, 2011, 2012) have performed a series of studies on watering mink kits. In the first instance, they used bottles with attached drinking nipples placed directly in nest boxes, which allowed them to determine the volume of water drank by kits between the 30th and the 50th day of rearing (De ronD and Kleyn vAn Willigen 2009). In the second instance, they installed typical nipple drinkers in the cages, which were connected to the farm’s water supply. One negative aspect of such a solution was the risk of dampening the nest boxes, which could lead to a drop in the environ-mental conditions in the nests (De ronD and Kleyn vAn Willigen 2011). In the last instance, the authors of the studies placed watering troughs near the exits to the nest boxes (De ronD and Kleyn vAn Willigen 2012). This system turned out to be the most beneficial and practicable to imple-ment in farms.
Requirements pertaining to proper mink rearing conditions in the nesting period according to the WelFur Protocol (weLFur 2015).
In order to familiarize the public with knowledge on the conditions of breeding fur animals, as well as to demonstrate that such conditions satisfy the needs thereof, in 2009 EFBA (The European Fur Breeders Association) initiated the performance of a project named WelFur, similar in its premises to the Welfare Quality®… (2018). At present the initiative is continued by Fur Europe, an organization comprising EFBA and IFF (The International Fur Federation).
The WelFur project rests on three principles (weLFur 2015):– WelFur is a reliable and feasible system for animal welfare assess-
ment based on scientifically proven measurements;– WelFur is designed to create transparency around the animal wel-
fare standards;

Marian Brzozowski364
– WelFur works as a strategic tools for the individual fur farmer to identify and improve any areas on the fur farm where the welfare stan-dards can potentially be improved;
The initial WelFur protocols, which were formulated in 2009–2010, have been tested in 2011 and 2012 in fur farms in Denmark, Finland, the Netherlands, Norway, and Sweden. The performed verification of the test has demonstrated that evaluation on a single farm can be completed within a single day (it takes about 5–7 hours to complete). It was also assessed that the adopted criteria and their level are sensitive enough to show differences between farms (weLFur 2015).
One of the key indicators defining the welfare level of farm mink within the WelFur protocol is the assessment of rearing conditions when the young mink are housed with their mothers.
The criteria of assessing the conditions of rearing on the basis of the WelFur protocol are presented in Table 3.
Table 3Criteria and indicators for the conditions of rearing for American mink in the WelFur protocol
(weLFur 2015)
Welfare criterion Indicator
Comfort around nesting access to nest box
Thermal comfort protection from environmental conditionsmaterial to build nest boxes and nests
Ease of movement space available for moving (surface area and height)
Until weaning, the young mink remain in the cage with their mother. The WelFur protocol evaluates the minks’ ease of access to the nest box, as well as the possibility of the gestating female to line the nest box with bedding material (weLFur 2015). The size of the cages and nest boxes is assessed in reference to standards set forth in the Council of Europe Recommendations during the 37th meeting of the Standing Committee of the European Convention on the Protection of Animals Kept for Farming Purposes in Strasbourg in 1999 (Mononen et al. 2012). The quality of resting is defined as the evaluation of the construction of nest boxes (whole/destroyed) and the degree of the dampness and cleanliness of the bedding material. In the case of thermal comfort the measurements were selected in a way which guarantees the welfare of the animals by the farm manager in exceptional weather conditions by e.g. reducing the cooling influence of wind, increasing ventilation or cooling on hot days, as well as providing good thermal insulation for nests (Mononen et al. 2012). Pro-tection from adverse external conditions is evaluated with respect to the

The Conditions of Housing Young Mink with Their Mothers... 365
location of the farm (the terrain layout, the proximity of trees) and the fence, the degree of the insulation of the sheds (open/neighboring/closed), the construction of roofs, and protection from heating (covering, paint). Farms at risk of exposure to temperatures exceeding 30oC are required to implement cooling systems such as sprinklers (weLFur 2015). Part of the cage intended for the nest may be constructed from wood, plywood, chip--board, or plastic. Bedding material may be hay, straw (cut or intact), or other straw-like material, shredded paper, wood, or other soft shavings, wool, and similar materials. The product for building nests must be sup-plied in the right amount, which enables the mother to cover the entire floor and build a complete nest with a view to efficiently protecting the kits from drought and temperature loss in the nest. The material provided to the animals should have insulating qualities and be moisture-absorbent. For most of the year, the nest box functions as a sleeping and resting area. The requirements underline the exceptional significance of the nest in the perinatal period. Pregnant females have a behavioral need to prepare a nest for their offspring, which is one of the main factors conditioning their survival in the first weeks of life (weLFur 2015).
The appearance and quality of the nest is assessed on the basis of three measurements presented in Table 4.
Table 4Measurements for the assessment of the quality of the nest within the WelFur protocol
(weLFur 2015)
Thermal insulation properties of the nest Access to bedding material External insulation
of the sheds
0* – high insulation of the walls of the nest box (mate-rials: wood, plywood, chip-bo-ard with wire netting)
0 – access to a large amount of bedding material allowing for the construction of an enclosed nest
0 – coverage of nest box ro-ofing plates with insulation material
1* – moderate insulation of the nest box (materials: woo, plywood, chip-board without wire netting/plastic with wire netting)
1 – access to an amount of bedding material allowing for the coverage of the entire floor area
1 – no coverage of nest box roofing plates
2* – low insulation of the nest box (plastic without ad-ded netting)
2 – access to an insufficient amount of bedding material to cover the entire floor area
–
* – „0” is the best score, while „2” – the worst score
In the course of a WelFur assessment randomly selected cages are evaluated, following which an average score is calculated to evaluate the quality of the nests on a farm, taking into account the percentage of nests with a given score in relation to the total number of nests.

Marian Brzozowski366
The description provided above contains just the portion of the welfare evaluation protocol that directly pertains to the topic of the article at hand, that is, the possibility of raising the reproductive efficiency of nestlings housed with their mothers by improving breeding practices used on mink farms. By the same token, other matters associated with mink breeding are evaluated. The general result of farm assessment is primarily a crucial information for the farm manager, as it provides information on the con-dition of the farm, which is admittedly evaluated from the perspective of animal welfare, but which nonetheless generally encompasses all aspects of managing a farm. In effect, the results of the assessment are a valuable information for the farm manager as to what should be changed and how in order to achieve better outcomes (Brzozowski 2017).
In conclusion, it can be said that juxtaposing the actions of researchers and farm managers with a view to guaranteeing the best possible degree of efficiency of breeding in accordance with the principles of the WelFur protocol, intended to provide animals with the best possible level of wel-fare on farms, which in the end result provides the animals with growing welfare conditions.
Translated by Marian BrzozowskiAccepted for print 3.07.2018
ReferencesaHLstroM a. 2010. Mink and foxes requirement for water. NJF workshop. Malmo, Sweden.BloKHuis H.J. 2008. International cooperation in animal welfare: the Welfare Quality® project.
Acta Veterinaria Scandinavica, 50(suppl. 1), pp. S10.BLokHuis H., veissier i., MieLe M. Jones B. 2010. The Welfare Quality® project and beyond:
safeguarding farm animal well-being. Acta Agriculturae Scandinavica, Section A – Animal Sciences, 60(3): 129–140.
BrinK A.l., JePPesen l.l., Heller K.e. 2004. Behaviour in suckling mink kits under farm conditions: effect of accessibility of drinking water. Applied Animal Behaviour Science, 89: 131–137.
Brzozowski M. 2017. Europejskie projekty mające poprawić poziom dobrostanu mięsożernych zwierząt futerkowych i królików. Wiadomości Zootechniczne, 3: 50–55.
cAstellA A., MAlMKvist J. 2008. The effect of heat incubators on chilled mink kits. Applied Ani-mal Behaviour Sci., 113: 265–269.
clAusen t.n., olesen c.r., HAnsen o., WAMBerg s. 1992. Nursing sickness in lactating mink. Epidemiological and pathological observations. Can. J. Vet. Res., 56: 53–56.
clAusen t.n., Dietz H. 2000. Mastitis in lactating mink female (Mustela vison S.) and the deve-lopment of “greasy kits”. Acta Vet. Scand., 3: 243–247.
clAusen t.n., Dietz H. 2004. Wet kits in mink, a review. Scientifur, 28(3): 87–90.De ronD J. 2008. Water intake female affects growth kits. De Pelsdierenhouder, 7: 144–145.De ronD J., Kleyn vAn Willigen F. 2009. Drinking water in nest box when kits start eating farm
food support kits and dam. NJF 427, Vaasa, Finland, 1 pp.De ronD J., Kleyn vAn Willigen F. 2011. Kit performance and behavior between 30 and 50 days
of age when easy access to drinking water. NJF 450, Knvista, Sveden, 10 pp.

The Conditions of Housing Young Mink with Their Mothers... 367
De ronD J. Kleyn vAn Willigen F. 2012. High need for drinking water in young mink kits be-tween 30 and 50 days of age. Scientifur, 36: 342–349.
gugołeK A., loreK M.o., rotKieWicz z., rotKieWicz t. 2004. Effects of probiotic bacteria on the performance of arctic foxes, pathomorphology and microflora of their alimentary tracts. Czech J. Anim. Sci., 49(6): 265–270.
gugołeK A., zAleWsKi D., strycHAlsKi J., KonstAntynoWicz M. 2013. Food transit time, nutrient digestibility and nitrogen retention in farmed and feral American mink (Neovison vison) – a comparative analysis. J. Anim. Physiol. Anim. Nutr., 97(6): 1030–1035.
gugołeK A., zAleWsKi D., strycHAlsKi J., KonstAntynoWicz M. 2015. Nutrient digestibility and colonic fermentation processes in species of the families Mustelidae and Canidae fed the same diet. J. Exp. Zool. A Ecol. Genet. Physiol., 323(9): 637–644.
Hansen B. k., Berg P. 1997. Mink kit growth performance in the sucking period. Acta Agricult. Scand., Sec. A – Anim. Sci., 47(4): 240–246.
lester-sAenz A.H., cAMPBell D.l.M., linK J.e., BursiAn s.J. 2014. Evaluation of chopped straw and aspen shavings as suitable bedding material for fur–farmed American mink (Neovi-son vison). Proceedings of the XIIth ISAE North-American Regional Meeting, pp.14.
loreK M.o., gugołeK A., HArtMAn A. 2001. Nutrient digestibility and nitrogen retention in arctic foxes fed a diet containing cultures of probiotic bacteria. Czech J. Anim. Sci., 46(11): 485–488.
lunD v.H., MAlMKvist J. 2012. Influence of nest box environment on tits survival. Scientifur, 36: 78–83.
MAlMKvist J., HouBAK B. 2000. Measuring maternal care in mink: kit retrieval test. Scientifur, 24(4): 159–161.
MAlMKvist J., PAlMe r. 2008. Periparturient nest building. Implications for parturition, kit survival, maternal stress and behaviour in farmed mink. Applied Animal Behaviour Sci., 114: 270–283.
MAlMKvist J., sHou t.M., Moller s.H., HAnsen s.W. 2016. Mink behaviour, reproduction and welfare is influenced be nest box material and access to additional drinking nipples in the ma-ternity unit. Scientifur, 40: 351–354.
MoLLer s. 1991. Drinking behaviour of mink in relation to watering system and water temperatu-re. NJF-seminar 192, Uppsala, Sweden, pp. 11.
Mononen J., Møller s.H., HAnsen s.W., HovlAnD A.l., Koistinen t., liDFors l., MAlMKvist J., vinKe c.M., AHolA l. 2012. The development of on-farm welfare assessment protocols for foxes and mink: the WelFur project. Animal Welfare, 21: 363–371.
rouvinen-WAtt K. 2003. Nursing sickness in the mink – a metabolic mystery or a familiar foe? Canad. J. Vet. Res., 67: 161–168.
Special Eurobarometer Report 442. 2016. Attitudes of Europeans towards Animal Welfare website, https://data.europa.eu/euodp/data/dataset/S2096_84_4_442_ENG, access: 5.10.2017.
steFFensen l.K., HAnsen s.W., JePPesen s.W. 2007. Introducing an open water surface as an al-ternative to the traditional valve drinker for ranch mink in lactation period. Scientifur, 31: 7–18.
śliWińsKA D. 2017. Wpływ materiału wyścielającego na wyniki rozrodu norki amerykańskiej. MA Thesis, SGGW.
słAWoń J. 1987. Żywienie lisów i norek. PWRiL, Warszawa.tAuson A.H., sorensen H.J., WAMBerg s., cHWAliBog. A. 1998. Energy metabolism, nutrient
oxidation and water turnover in lactating mink (Mustela vison). J. Nutr., 128: 2615–2617.tAusson A.H., cHWAliBog A., tygesen M.P. 2006. Late development of homeothermy in mink kits
– a strategy for maximum survival rate. Journal of Animal Physiology and Animal Nutrition, 90(1–2): 38–45.
waMBerg s., tauson a.H. 1998. Direct measurements of daily milk intake in sucking mink (Mustela vison) Kits. J. Nutr., 128: 2620–2622.
Welfare Quality® Protocol Assesment. 2018. http://www.welfarequalitynetwork.net/en-us/reports/assessment-protocols/, access: 7.05.2018.
weLFur 2015. Welfare assessment protocol for mink. Fur Europe. Zalecenia żywieniowe i wartość pokarmowa pasz. Zwierzęta Futerkowe. 2011. Ed. A. Gugołek.
Polska Akademia Nauk, Instytut Fizjologii i Żywienia Zwierząt, Jabłonna.

POLISH JOURNAL OF NATURAL SCIENCES Abbrev.: Pol. J. Natur. Sc., Vol 33(3): 369–383, Y. 2018
MORPHOMETRIC CHARACTERISTICS OF ALIEN CRAYFISH CHERAX QUADRICARINATUS
FROM MANINJAU LAKE (WEST SUMATRA, INDONESIA)
Lora Purnamasari1, Ria Kasmeri1, Muhammad Hilman Fu’adil Amin2, Agoes Soegianto2
1 Study Program of Biology Education, STKIP PGRI Sumatera Barat (College of Teacher Training and Education),
Padang, West Sumatra, Indonesia 2 Department of Biology
Airlangga University in Surabaya, East Java, Indonesia
K e y w o r d s: redclaw, growth, sexual dimorphism, sex ratio.
A b s t r a c t
The objectives of this study were to determine the length – weight relationships (LWRs), carapace-length relationships, sexual dimorphism and condition factors (K) of Cherax quadricarinatus from Maninjau Lake, West Sumatra Indonesia. The sex ratio (male: female) was found close to 1:1 in Bayur and Sigiran at period of February 2017 respectively, and 1.51:1 in Bayur on October 2017. The LWRs for males and females crayfish were W = 0.053L2.56 and
W = 0.058L2.54 (Bayur, Feb 2017), W = 0.029L2.86 and W = 0.100L2.31 (Sigiran, February 2017) and W = 0.078L2.51 and 0.071L2.49 (Bayur, October 2017). There was no significant difference between length and weight of males and females from all stations at all periods. Similarly, carapace length and carapace width of males and females of crayfish were not significantly different from all sampling locations at all periods. However, at the same carapace length, male crayfish had longer chelae than female at all locations.
Address: Agoes Soegianto, Airlangga University in Surabaya, Kampus C, Jl. Mulyorejo, Surabaya, East Java, Indonesia, phone: 62 31 593 6501, e-mail: [email protected]

Lora Purnamasari et al.370
MORFOMETRYCZNA CHARAKTERYSTYKA OBCEGO GATUNKU RAKA CHERAX QUADRICARINATUS Z JEZIORA MANINJAU
(SUMATRA ZACHODNIA, INDONEZJA)
Lora Purnamasari1, Ria Kasmeri1, Muhammad Hilman Fu’adil Amin2, Agoes Soegianto2
1 Program studiów w zakresie edukacji biologicznej, STKIP PGRI Sumatera Barat (Kolegium Nauczycielskie), Padang, Sumatra Zachodnia, Indonezja
2 Katedra BiologiiUniwersytet Airlangga, Surabaja, Wschodnia Jawa, Indonezja
S ł o w a k l u c z o w e: rak czerwonoszczypcowy, wzrost, dymorfizm płciowy, stosunek płci.
A b s t r a k t
Celem badania było ustalenie zależności między: długością a ciężarem (LWR), karapaksem a długością oraz dymorfizmem płciowym i kondycją (K) u Cherax quadricarinatus z jeziora Ma-ninjau w Sumatrze Zachodnioindyjskiej. Stosunek płci (samiec: samica) zbliżony do 1: 1 obserwo-wano w Bayur i Sigiran w lutym 2017 r. oraz 1,51: 1 w Bayur w październiku 2017 r. LWR dla samców i samic raków wynosiły: W = 0,053L2,56 i W = 0,058L2,54 (Bayur, luty 2017), W = 0,029L2.86 i W = 0,100L2,31 (Sigiran, luty 2017) i W = 0,078L2,51 i 0,071L2,49 (Bayur, paź-dziernik 2017). We wszystkich okresach nie było istotnej różnicy między długością i masą sam-ców i samic ze wszystkich stanowisk. Podobnie długość pancerza i szerokość karapaksu u samców i samic raków nie różniły się znacząco we wszystkich miejscach pobierania próbek we wszystkich okresach. W każdej lokalizacji jednak raki płci męskiej, mające taką samą długość pancerza co samice, były dłuższe niż samice.
Introduction
The Australian redclaw crayfish (Cherax quadricarinatus, von Mar-tens 1868) is native to the northern Australia and southeastern Papua New Guinea and inhabits a diversity of freshwater habitats including still ponds, small creeks, isolated rock pools, lakes and fast flowing rivers (lAWrence and Jones 2002, cougHrAn and lecKie 2007). Redclaw cray-fish is tolerant of a wide range of temperature, low dissolved oxygen con-centrations, have a simple reproductive cycle and fast growth rates (cougHrAn and lecKie 2007, AHyong and yeo 2007). Due to its advanta-ges, redclaw crayfish is currently one of the most important commercially farmed freshwater crayfish in the world (BortoLini et al. 2007). This spe-cies has been successfully cultured in some tropical and subtropical coun-tries: New Caledonia, Africa, China, Taiwan, Japan, Malaysia, Israel,

Morphometric Characteristics of Alien Crayfish Cherax Quadricarinatus... 371
Italy, United States, Mexico, the Caribbean, Puerto Rico, Ecuador, and Argentina (AHyong and yeo 2007).
The redclaw crayfish is a highly invasive species, when it escapes from captivity. Wild populations of redclaw crayfish have been reported from Jamaica, Mexico, Puerto Rico, Singapore, and South Africa (AHyong and yeo 2007), Slovenia (JAKlic and vrezec 2011), and Israel (snovsKy and gaLiL 2011).
The redclaw crayfish was introduced to Indonesia in the early 2003 and then become an economically important species with high market (eDgerton 2005). Increasing demand for redclaw for food and ornamental purpose led to an increase in the cultivation of this species by semi-intensive farms and small aquaculture farmers. Unfortunately, the interest in this crayfish by small aquaculture farmers led to a poorly planned and inadequ-ately managed transfer of crayfish to other ponds. The poor management of the ponds favored the escape of redclaw crayfish into rivers, water chan-nels and lakes. Recently, this crayfish had established feral population in Cilala and Lido Lakes, West Java (Patoka et al. 2016), and in Rawape-ning Lake, Central Java, Indonesia (kurniawan and saPutra 2016).
There is no exact information when this crayfish was introduced into Lake Maninjau, Sumatera Island Indonesia. However DinA et al. (2013) have conducted the preliminary study of the occurrence of freshwater crayfish in Maninjau Lake, and it was identified belong the species of Che-rax quadricarinatus, with 1.8–7.5 cm total length. Recently (during our pre-survey), according to local fishermen from Maninjau Lake, West Sumatra, Indonesia who traditionally caught the native prawns and fish, redclaw crayfish were trapped sporadically in the past few years. There-fore, we conducted the study to evaluate some aspects of the biology of redclaw crayfish and to examine differences in the biometric parameters of this population.
Materials and Methods
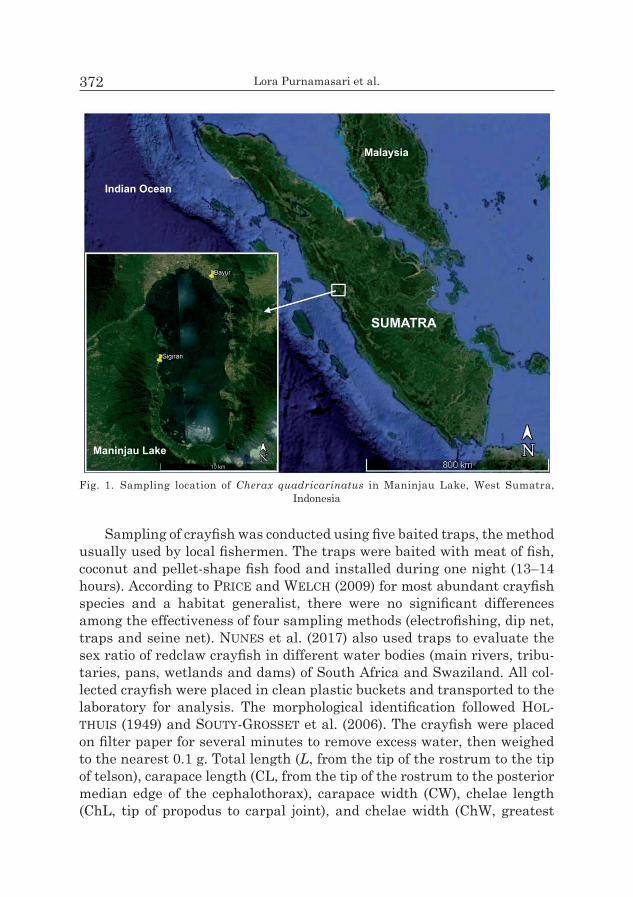
Males and females of redclaw crayfish were taken from Maninjau Lake, located at West Sumatra Indonesia (Figure 1). Specimens were col-lected in February and October 2017 from two sampling loca- tions: Bayur (0°15’53.27”S, 100°12’44.19”E) and Sigiran (0°20’15.24”S, 100° 9’54.09”E). Sigiran represents the west coast of the lake characteri-zed by a large rocky substrate with depths ranged from 1 to 3 m. Bayur represents the east coast with small rocky and sandy substrate and depths between 1 and 3 m.
Lora Purnamasari et al.372
Sampling of crayfish was conducted using five baited traps, the method usually used by local fishermen. The traps were baited with meat of fish, coconut and pellet-shape fish food and installed during one night (13–14 hours). According to Price and WelcH (2009) for most abundant crayfish species and a habitat generalist, there were no significant differences among the effectiveness of four sampling methods (electrofishing, dip net, traps and seine net). nunes et al. (2017) also used traps to evaluate the sex ratio of redclaw crayfish in different water bodies (main rivers, tribu-taries, pans, wetlands and dams) of South Africa and Swaziland. All col-lected crayfish were placed in clean plastic buckets and transported to the laboratory for analysis. The morphological identification followed HoL-tHuis (1949) and souty-grosset et al. (2006). The crayfish were placed on filter paper for several minutes to remove excess water, then weighed to the nearest 0.1 g. Total length (L, from the tip of the rostrum to the tip of telson), carapace length (CL, from the tip of the rostrum to the posterior median edge of the cephalothorax), carapace width (CW), chelae length (ChL, tip of propodus to carpal joint), and chelae width (ChW, greatest
Fig. 1. Sampling location of Cherax quadricarinatus in Maninjau Lake, West Sumatra, Indonesia

Morphometric Characteristics of Alien Crayfish Cherax Quadricarinatus... 373
palm width) were measured to the nearest 0.1 cm. Only individuals with the complete chelipeds, full complement of walking legs and no visible body deformations were used to determine the length – weight relation-ships. Individuals were separated by sex, and ovigerous female crayfish were noted, but were not included in morphometric analysis.
To evaluate differences in the sex ration, a chi-squared [χ2] test was used for the entire sample. The length-weight relationships (LWRs) were calculated using the equation W = aLb, where W is the total weight of the crayfish [g], L is the total length [cm], a is the intercept, and b is the slope (ricKer 1975). The parameters a and b were estimated by linear regres-sion of the transformed equation: log W = log a + b log L. The determina-tion coefficient (r2) was used as an indicator of the quality of the linear regression. The slope (b) is used to describe the growth type of crayfish: for b = 3 growth is isometric, for b < 3 is negatively allometric and for b > 3 is positively allometric (Zar 1999). The relationships between between CL and ChL for each sex were also determined using regression analysis. Analysis of covariance (ANCOVA) was used to compare the L-W regres-sions between males and females for significant difference. Difference between L, W, ChL, ChW, CL and CW values of females and males was tested using the student’s t-test (ZAR, 1999).
The Fulton’s condition factor (K) was calculated using the equation K = 100(W L-3) (RicKer 1975), where W is the total weight of the crayfish [g] and L is the total length [cm]. K values of crayfish were determined separately according to the total length of female and male individuals. Difference between K values of females and males was tested using the student’s t-test (zar 1999).
During the collection of crayfish, water quality parameters of habitat such as temperature, pH, and dissolved oxygen were 27.5–28oC, 7.2–7.4, and 2.95–4.90 mg L-1 for Bayur, and 28–30o C, 7.4–7.6, and 5.95–6.6 mg L-1 for Sigiran.
Results
Sex ratio, length – weight relationship and condition factor
The characteristic of crayfish samples is presented in Table 1 . The sex ratio (male: female) was found to be 1:1.06 and 1:1.15 in Bayur and Sigiran (p > 0.05) at period of Feb 2017 respectively, and 1.51:1 in Bayur (p < 0.05) at Oct 2017. The LWRs for males and females crayfish were described as follows: W = 0.053L2.56 and W = 0.058L2.54 (Bayur, Feb 2017), W = 0.029L2.86

Lora Purnamasari et al.374
Table 1 Redclaw crayfish sample characteristic and sex ratio
Time LocationNumber of crayfish
Number of crayfish with incomplete
chelipedOvigerous
femaleTotal
numbermale female male female
Feb 2017Bayur 17 18 0 2 0 35Sigiran 13 15 0 1 2 28
Oct 2017Bayur 55 83 10 13 0 138Sigiran 2 0 1 0 0 2
Fig. 2. Length-weight relationships of male and female of redclaw crayfish from Maninjau Lake, West Sumatra Indonesia (crosses = male, black circles = female)

Morphometric Characteristics of Alien Crayfish Cherax Quadricarinatus... 375
Tabl
e 2
Tota
l len
gths
wei
ght,
grow
th p
aram
eter
and
con
ditio
n fa
ctor
(K) o
f red
claw
cra
yfish
fr
om M
anin
jau
Lake
, Wes
t Sum
atra
Ind
ones
ia
Tim
eLo
catio
nSe
xN
Tota
l len
gth
[cm
]W
eigh
t [g]
Gro
wth
par
amet
er
Gro
wth
ty
peK
mea
n ±
SDm
inm
axm
ean
± SD
min
max
ab
r2m
ean
± SD
Feb
2017
Bayu
rM
179.
73 ±
1.4
68.
213
.119
.16
± 93
39.
7139
.26
0.05
32.
560.
68-A
2.00
± 0
.48
F16
9.68
± 1
.47
8.2
12.9
19.6
6 ±
8.32
10.5
534
.18
0.05
82.
540.
81-A
2.10
± 0
.42
Sigi
ran
M13
9.72
± 1
.52
8.2
13.0
20.8
3 ±
10.0
29.
7039
.30
0.02
92.
860.
83-A
2.15
± 0
.40
F12
9.76
± 1
.56
8.2
13.0
20.2
8 ±
8.39
11.9
234
.20
0.10
02.
310.
79-A
2.14
± 0
.46
Oct
201
7Ba
yur
M45
9.96
± 1
.24
7.7
12.3
25.7
2 ±
8.83
14.2
454
.16
0.07
82.
510.
89-A
2.54
± 0
.32*
F70
9.99
± 1
.47
7.3
14.5
22.8
8 ±
9.60
9.27
55.7
60.
071
2.49
0.84
-A2.
23 ±
0.3
6N
ote:
M =
mal
e, F
= fe
mal
e, N
= n
umbe
r of
cra
yfish
, SD
= s
tand
ard
of d
evia
tion,
K =
con
ditio
n fa
ctor
, a =
inte
rcep
t, b
= sl
ope,
r2
= de
term
ina-
tion
coef
ficie
nt, -
A =
nega
tive
allo
met
ric
grow
th, *
= in
dica
tes
sign
ifica
nt d
iffer
ence
(p <
0.0
5).

Lora Purnamasari et al.376
Tabl
e 3
Chel
ae le
ngth
, che
lae
wid
th, c
hela
e le
ngth
– w
idth
rel
atio
n of
red
claw
cra
yfish
from
Man
inja
u La
ke, W
est S
umat
ra I
ndon
esia
Tim
eLo
catio
nSe
xN
Chel
ae le
ngth
[cm
]Ch
elae
wid
th [c
m]
Cara
pace
leng
th [c
m]
Cara
pace
wid
th [c
m]
mea
n ±
SDm
inm
axm
ean
± SD
min
max
mea
n ±
SDm
inm
axm
ean
± SD
min
max
Feb
2017
Bayu
rM
173.
44 ±
0.7
1*2.
14.
91.
06 ±
0.2
7*0.
71.
54.
66 ±
0.6
13.
85.
82.
01 ±
0.3
11.
52.
5
F16
3.00
± 0
.89
2.2
3.7
0.89
± 0
.19
0.6
1.2
4.48
± 0
.63
3.8
5.9
2.01
± 0
.35
1.6
2.7
Sigi
ran
M13
3.49
± 0
.68*
2.6
4.9
1.12
± 0
.25*
0.7
1.5
4.67
± 0
.61
3.8
5.8
2.17
± 0
.71
1.5
2.5
F12
3.00
± 0
.37
2.6
3.6
0.90
± 0
.19
0.6
1.2
4.50
± 0
.61
3.8
5.9
2.04
± 0
.35
1.6
2.4
Oct
201
7Ba
yur
M45
3.65
± 0
.57*
2.6
5.2
0.60
± 0
.14
0.3
0.9
4.78
± 0
.56
2.6
5.2
1.98
± 0
.29
0.3
0.9
F70
3.18
± 0
.59
2.2
5.2
0.62
± 0
.43
0.3
2.5
4.62
± 0
.68
2.2
5.2
1.89
± 0
.32
0.3
2.5
Not
e: M
= m
ale,
F =
fem
ale,
N =
num
ber
of c
rayfi
sh, S
D =
sta
ndar
d of
dev
iatio
n, *
= in
dica
tes
sign
ifica
nt d
iffer
ence
(p <
0.0
5)

Morphometric Characteristics of Alien Crayfish Cherax Quadricarinatus... 377
and W = 0.1L2.31 (Sigiran, Feb 2017) and W = 0.078L2.51 and 0.071L2.49
(Bayur, Oct 2017) – Figure 2. Due to the small sample of crayfish, the LWR of crayfish from Sigiran (Oct 2017) was not calculated. Males and females crayfish at all locations exhibited negative allometric growth (b < 3). The length – weight relationship was not significantly different between males and females (ANCOVA; p > 0.05) at Bayur and Sigiran (Feb 2017), and significantly different at Bayur (Oct 2017). The condition factor (K) for males and females were 2.00 and 2.10 (Bayur), 2.15 and 2.14 (Sigiran) at Feb 2017, and 2.54 and 2.23 (Bayur) at Oct 2017 (Table 2). The K value of male was higher than that of female at Bayur (Oct 2017) (p < 0.05).
Sexual dimorphism
There was no significant difference between length and weight of males and females of crayfish from all stations at all periods (p > 0.05) – Table 2. Similarly, carapace length and carapace width of males and fema-les of crayfish were not significantly different from all stations at all periods (p > 0.05) – Table 3. Males had longer and wider chelae than those of females at Bayur and Sigiran (Feb 2017), however the only chelae length of male crayfish was longer than female during Oct 2017 at Bayur (p < 0.05) – Table 3. Based on the CL – ChL relationship, at the same cara-pace length, male crayfish had longer chelae than female at all locations (Table 4).
Table 4 Carapace – chelae length relationship of redclaw crayfish from Maninjau Lake,
West Sumatra Indonesia
Time LocationSex N
Parameter of CL-ChL relationship
a b r2
Feb 2017
BayurM 17 -0.24 0.78 0.462
F 16 0.68 0.52 0.498
SigiranM 13 -057 0.87 0.619
F 12 1.39 0.36 0.361
Oct 2017 BayurM 45 0.07 0.75 0.536
F 70 0.50 0.58 0.460
Note: M = male, F = female, N = number of crayfish, SD = standard of deviation, a = intercept, b = slope, r2 = determination coefficient

Lora Purnamasari et al.378
Discussion
The sex ratio (females:males) of redclaw crayfish form Bayur and Sigiran (Feb 2017) confirm the sex ratio of most natural crayfish popula-tions which is close to 1:1 (aBraHaMsson 1971, KirJAvAinen and west-Man 1999). In contrast, during Oct 2017 at Bayur the number of females exceeded the males (1.51:1, females: males). Similar finding has been observed by westMan and Pursiainen (1982) for crayfish Astacus astacus from western Finland. The sex ratio of the trapped A. astacus was 32% males and 68% females. The uneven sex ratio (number of females > males) may result from the increased activity of the females that had molted after the hatching of the juveniles (westMan and Pursiainen 1982). Our results are different with the findings of other researches carried out for some other crayfish species, such as Orconectes limosus (AleKHnovicH et al. 1999), Austropotamobius pallipes (FenouiL and cHAix 1985, gHe-rArDi et al. 1997, grAnDJeAn et al. 2000), Astacus leptodactylus (Deniz Bok et al. 2010), and Pacifastacus leniusculus (KirJAvAinen and west-Man 1999, cAPurro et al. 2007) which found that the higher catches of males than females. As the invasive crayfish in the Czech Republic, the sex ratio of O. limosus was almost equal in rivers and isolated waters; while males were more numerous in brooks (Duris et al. 2006). The authors agree that it could be caused by the fact that the males of crayfish were more active than the females, therefore the males are more frequen-tly trapped than the females. Concerning the occurrence of ovigerous females (12.4–12.9 cm length size) during this study indicating that bre-eding populations are established in this lake. The success in reproduction could be supported by the optimum water temperature (27.5–30oC), suffi-cient supply of dissolved oxygen (2.95–6.6 mg L-1) in the water and the availability of suitable shelters (rocky substrates) in Maninjau Lake. Redclaw crayfish… (2002) reported that the optimum water temperature for growth and reproduction for redclaw is between 23 and 31oC. Mortalities may occur if water temperatures below 10oC or above 35oC for an extend period (see review Jaklic and Vrezec 2011). Although this species is very tolerant of low oxygen concentrations, down to 0.5 mg L-1 (nystroM 2002), however the adult and sexually mature individuals were found in habitat with the dissolved oxygen level between 2.8 and 7.2 mg L-1 and the temperature range from 21 to 31oC and (JAKlic and vrezec 2011).
In our study, the LWRs of males and females redclaw from all loca-tions and all periods demonstrated negative allometric growth (b < 3.0). Our results showed a noticeable difference with the findings of austin (1995) and roDriguez et al. (2002) who reported the positive allometric

Morphometric Characteristics of Alien Crayfish Cherax Quadricarinatus... 379
and isometric growths of redclaw crayfish, respectively. This different result could be affected by the limitation of our samples, because during sampling only adult crayfish (7.3–14.5 cm) was actively entering into the traps. To examine the whole crayfish population, a supplemented sam-pling method for small crayfish should be conducted in the future study. The electric fishing proved to be a very practical and useful method for obtaining representative samples of the whole crayfish population (west-Man et al. 1979). westMan and Pursiainen (1982) demonstrated that the crayfish densities obtained by electric fishing differed considerably not only between different water bodies but also between different areas within the same water.
The comparison with LWR of other crayfish species showed that our results demonstrated the similar growth type with Procambarus alleni (HoBBs et al. 1989) and C. snowden (WeyA et al. 2017). Other studies sho-wed positive allometric growth (b > 3.0) for P. zonangulus (roMaire et al. 1977), C. destructor (austin 1995), P. alleni (AcostA and Perry 2000), invasive crayfish O. limosus (Duris et al. 2006), P. acutus acutus (MazLuM et al. 2007), A. leptodactylus (Deniz BoK et al. 2010), and isometric growth (b = 3.0) for A. leptodactylus (AyDin et al. 2015), and P. fallax (HoBBs et al. 1989). These differences may be a reflection of a number of factors such as population structure, food abundance, water level fluctuations, water tem-perature, water quality and photoperiod (ACOSTA and Perry 2000, Huner and roMaire 1979, cHien and avauLt 1983). linDqvist and LaHti (1983) suggested that the variation of length – weight relationships among cray-fish species was also affected by sex, sexual stage, and ecological conditions.
Sexual dimorphism is common in freshwater crayfish species (linD- qvist and LaHti 1983, MazLuM et al. 2007, HolDicH 2001, wang et al. 2011). Our study determined that total length, weight, carapace length and carapace width of males were not significantly different than those of females. However ANCOVA test confirmed that at the same length the male crayfish were heavier than the female. The most obvious sexual dimorphism in crayfish is largely due to the disproportionately rapid gro-wth of chelae in males compared with females. Differences between male and female chelae lengths have been well documented in the crayfish (Deniz BoK et al. 2010, wang et al. 2011, siMon and stewart 2014). In the present study, males’ redclaw had longer and wider chelae than fema-les. Moreover, according to the analysis of CL – ChL relationship, males had longer chelae than females at the same carapace length. With longer chelae, male crayfish has a distinct advantage in activities related to sexual reproduction (stein 1976) and to competition for food, shelter, and space (nakata and gosHiMa 2003, MazLuM and eversoLe 2005). The

Lora Purnamasari et al.380
variation in chelae size is commonly found in freshwater crayfish, and is always related to sex and size (wetzeL 2002, siMon and stewart 2014). In crustaceans, chelae’s length and width are important factors in aggres-sive behavior and play a significant role in determining competitive outco-mes (nakata and gosHiMa 2003, MazLuM and eversoLe 2005).
The values of condition factor (K) ranged from 2.10 to 2.23 for males and 2.00 to 2.54 for females respectively. Crayfish lived in Bayur had the highest value of K. According to WeyA et al. (2017), the crayfish in this habitat has attained a better condition (K > 1). Compared to other fin-dings, we noted that most crayfish showed higher values of condition fac-tor (K > 1) such as A. torrentium (3.3) (streissL and HoDl 2002), P. acutus (1.6) (MazLuM et al. 2007), P. clarkii (2.3) (wetzeL 2002), O. rustucus (1.5) (AnDerson and siMon 2015), O. virilis (5.8) (siMon and stewart 2014), and A. leptodactylus (2.6) (AyDin et al. 2015). The difference of K values of crayfish among species and locations could be a reflection of a number of factors, including population density, sex, sexual stage, food abundance, photoperiod, water level fluctuations, and water quality (linDqvist and LaHti 1983, AcostA and Perry 2000). Crayfish inhabiting habitat without any anthropogenic influence upon their habitat and with a variety of suita-ble shelters has higher values of K (AnDerson and siMon 2015, vorBur-ger and riBi 1999, Maguire and KloBucAr 2011). In our study seems that Bayur which characterized by rocky and sandy substrate provides a more suitable environment and better food supply for crayfish than Sigiran which characterized by rocky substrate. Similarly WeyA et al. (2017) reported that crayfish living in a habitat which provides the more suitable environment and higher supply of food have higher values of K.
Conclusions
The present study provides baseline information on the length – weight relationships, carapace – chelae lengths relationships, sexual dimorphism and condition factors of redclaw crayfish from Maninjau Lake, West Sumatra, Indonesia, which will be beneficial for further reference especially for the management of the crayfish as non-native animal.
Acknowledgements
We are grateful to the local fishermen for their help in collecting the crayfish samples.
Accepted for print 7.06.2018.

Morphometric Characteristics of Alien Crayfish Cherax Quadricarinatus... 381
ReferencesaBraHaMsson S.A.A. 1971. Density, growth and reproduction in populations of Astacus astacus
and Pacifastacus leniusculus in an isolated pond. Oikos, 22: 373–380.AcostA C.A., Perry S.A. 2000. Differential growth of crayfish Procambarus alleni in relation to
hydrological conditions in marl prairie wetlands of Everglades National Park, USA. Aquatic Ecology, 34: 389−395.
AHyong S.T., yeo D.C.J. 2007. Feral populations of the Australian red-claw crayfish (Cherax quadricarinatus von Martens) in water supply catchments of Singapore. Biological Invasions, 9: 943–946.
AleKHnovicH A.V., aBLov S.E., kuLesH V.F., Pareiko O.A. 1999. The American spiny-cheek crayfish, Orconectes limosus in the fauna of Belarus. In: Crayfish in Europe as alien species. How to make the best of a bad situation? Eds. F. gHerArDi, D.M. HolDicH. Rotterdam, Bro-okfield: A.A. Balkema, pp. 237–242.
AnDerson W.E., siMon T.P. 2015. Length-weight relationship, body morphometrics, and condition based on sexual stage in the rusty crayfish, Orconectes rusticus Girard, 1852 (Decapoda, Cam-baridae) with Emphasis on Management Implications. Fisheries and Aquaculture Journal, 6: 3.
austin C.M. 1995. Length-weight relationships of cultured species of Australian freshwater crayfish of the genus Cherax. Freshwater Crayfish, 10: 410–418.
AyDin H., HArlioglu M.M., Deniz t. 2015. An investigation on the population parameters of freshwater crayfish (Astacus leptodactylus Esch., 1823) in Lake Iznik (Bursa). Turkish Journal of Zoology, 39: 660–668.
BortoLini J.L., AlvArez F., roDriguez-AlMArAz g. 2007. On the presence of the Australian redclaw crayfish, Cherax quadricarinatus, in Mexico. Biological Invasions, 9: 615–620 DOI: 10.1007/s10530-006-9054-0.
cAPurro M., gAlli l., Mori M., sAlviDio s., Arillo A. 2007. The signal crayfish, Pacifastacus le-niusculus (Dana, 1852) [Crustacea: Decapoda: Astacidae], in the Brugneto Lake (Liguria, NW Italy). The beginning of the invasion of the River Po watershed? Aquatic Invasions, 2: 17–24.
cHien Y.H., avauLt J.W. Jr. 1983. Effects of flooding dates and disposals of rice straw on cray-fish, Procambarus clarkii (Girard), culture in rice fields. Aquaculture, 31: 339–359.
cougHrAn J., lecKie s. 2007. Invasion of a New South Wales stream by the Tropical Cray-fish, Cherax quadricarinatus (von Martens). In: Pest or guest: the zoology of overabundance. Eds. D. lunney, P. eBy, P. HutcHings, s. Burgin, Mosman, NSW, Royal Zoological Society of New South Wales, pp. 40–46.
Deniz BoK t., HArlioglu M.M., DevAl M.C. 2010. A study on the morphometric characteristics of Astacus leptodactylus inhabiting the Thrace region of Turkey. Knowledge and Management of Aquatic Ecosystems, 397: 05, Doi: 10.1051/kmae/2010021.
DinA r., WoWor D., HAMDAniA A. 2013. Fresh water crayfish (Cherax quadricarinatus), new alien species in Maninjau Lake, West Sumatera. Limnotek, 20(2): 159–168.
Ďuriš z., DrozD P., HorKá i., KozáK P., PolicAr t. 2006. Biometry and demography of the inva-sive crayfish Orconectes limosus in the Czech Republic. Bulletin Français de la Pêche et de la Pisciculture, 380–381: 1215–1228
eDgerton B.F. 2005. Freshwater crayfish production for poverty alleviation. World Aquaculture, 36: 48–64.
Fenouil e., cHAix J.C. 1985. Biological cycle and behavior of a population of Austropotamobius pallipes. Ecologia Mediterranea, 11: 3–24.
gHerArDi F., villAnelli F., DArDi P. 1997. Behavioural ecology of the white-clawed crayfish, Austropotamobius pallipes, in a Tuscan stream: preliminary results. Freshwater Crayfish, 11: 182–193.
grAnDJeAn F., cornuAult B., ArcHAMBAult s., BrAnDMArD M., otreBsKy g. 2000. Life history and population biology of the white-clawed crayfish, Austropotamobius pallipes, in a brook from the Poitou-Charentes Region (France). Bulletin Français de la Pêche et de la Pisciculture, 356: 55–70.
Lora Purnamasari et al.382
HoBBs H.H. JR., JAss J.P., Huner J.V. 1989. A review of global crayfish introductions with particular emphasis on two North American species (Decapoda, Cambaridae). Crustaceana, 56: 229–316.
HolDicH D.M. 2001. Biology of freshwater crayfish. Oxford England, Wiley-Blackwell Publishing, 512 pp.
HoLtHuis L.B. 1949. Decapoda Macrura, with a revision of the New Guinea Parastacidae. Zoo-logical results of the Dutch New Guinea. Expedition 1939, No. 3. Nova Guinea, 5: 289–328.
Huner J.V., roMaire R.P. 1979. Size at maturity as a means of comparing populations of Procam-barus clarkii (Girard) (Crustacea, Decapoda) from different habitats. Freshwater Crayfish, 4: 53–64.
JAKlič M., vrezec A. 2011.The first tropical alien crayfish species in European waters: the redc-law Cherax quadricarinatus (von Martens, 1868) (Decapoda, Parastacidae). Crustaceana, 84(5–6): 651–665. DOI: 10.1163/001121611X577936.
KirJAvAinen J., WestMAn K. 1999. Natural history and development of the introduced signal crayfish, Pacifastacus leniusculus, in a small, isolated Finnish lake, from 1968 to 1993. Aqu-atic Living Resources, 12: 387–401.
kurniawan w., saPutra S.W. 2016. Some aspects biological of freshwater crayfish (Cherax qu-adricarinatus) captured with trap in Rawa Pening Waters, Semarang Regency. Diponegoro Journal of Maquares, 5(1): 24–31.
lAWrence c., Jones c. 2002. Chapter 17. Cherax. In: Biology of freshwater crayfish. Ed. D.M. Hol- DicH, London, Blackwell.
linDqvist O.V., LaHti e. 1983. On the sexual dimorphism and condition index in the crayfish, Astacus astacus L., in Finland. Freshwater Crayfish, 5: 3–11.
LougHMan Z.J., siMon T.P. 2011. Zoogeography, taxonomy, and conservation of West Virginia’s Ohio River floodplain crayfishes (Decapoda, Cambaridae). Zookeys, 74: 1–78.
MAguire i., KloBucAr g. 2011. Size structure, maturity size, growth and condition index of stone crayfish (Austropotamobius torrentium) in North-West Croatia. Knowledge and Management of Aquatic Ecosystems, 401: 12. DOI: 10.1051/kmae/2011026.
Mazlum Y., Eversole A.G. 2005. Growth and survival of Procambarus acutus acutus (Girard, 1852) and P. clarkii (Girard, 1852) in competitive settings. Aquaculture Research, 36: 537–545.
MAzluM y., FAtiH M., eversole A. 2007. Morphometric relationship of length weight and chelea length-width of eastern white river crayfish (Procambarus actus actus, Girard, 1852), under culture conditions. Journal of Applied Ichthyology, 23: 616–620.
nakata k., gosHiMa s. 2003. Competition for shelter of preferred sizes between the native crayfish species Cambaroides japonicus and the alien crayfish species Pacifastacus leniusculus in Ja-pan in relation to prior residence, sex difference, and body size. Journal of Crustacean Biology, 23: 897–907.
nystroM P. 2002. Ecology. In: Biology of freshwater crayfish. Ed. D.M. HolDicH. Blackwell Scien-ce, Oxford, pp. 190–235.
nunes A.L., zengeyA A.T., HoFFMan A.C., MeAsey G.J., weiL O.L.F. 2017. Distribution and es-tablishment of the alien Australian redclaw crayfish, Cherax quadricarinatus, in South Africa and Swaziland. PeerJ 19;5: e3135; DOI 10.7717/peerj.3135.
PAtoKA J., WArDiAtno y., yonvitner, KuříKová P., Petrty M., KAlous l. 2016. Cherax quadricarinatus (von Martens) has invaded Indonesian territory west of the Wallace Line: evidences from Java. Knowledge and Management of Aquatic Ecosystems, 417: 39. DOI: 10.1051/kmae/2016026.
Price J.E., WelcH S.M. 2009. Semi-quantitative methods for crayfish sampling: sex, size, and habitat bias. Journal of Crustacean Biology, 29: 208–216.
Redclaw crayfish information package. 2002. Ed. C.M. Jones. Department of Primary Industries, Northern Fisheries and Aquaculture Centre, Cairns, Queensland.
ricKer W.E. 1975. Computation and interpretation of biological statistics of fish populations. Bulletin of Fisheries Research Board of Canada, 191: 1–382.
Morphometric Characteristics of Alien Crayfish Cherax Quadricarinatus... 383
roDriguez A., ArreDonDo C.J.L., Ponce F.J.T., rouse P.D.B. 2002. Growth characteristics of the Australian redclaw crayfish. Cherax quadricarinatus, cultured in an indoor recircula-ting system. Journal of Applied Aquaculture, 12(3): 59–64.
roMaire R.P., Forester J.S., avauLt J.W. Jr. 1977. Length-weight relationships of two commer-cially important crayfishes of the genus Procambarus. Freshwater Crayfish, 3: 463–470.
siMon T.P., stewart C.R. 2014. Growth, length-weight relationships, and condition associated with gender and sexual stage in the invasive northern crayfish, Orconectes virilis Hagen, 1870 (Decapoda, Cambaridae). Proceedings of Indiana Academy of Science, 123(2): 1–8.
snovsKy g., gAlil B.S. 2011. The Australian redclaw cray fish Cherax quadricarinatus (von Martens, 1868) (Crustacea: Decapoda: Parastactidae) in the Sea of Galilee, Israel. Aquatic Invasions, 6: S29–S31. DOI: 10.3391/ai.2011.6.S1.007.
souty-grosset c., HolDicH D.M., noëL P.Y., reynolDs J., HAFFner P. 2006. Atlas of crayfish in Europe. Paris, France, Muséum National d’Histoire Naturelle, 187 pp.
stein R.A. 1976. Sexual dimorphism in crayfish chelae: functional significance linked to reproduc-tive activities. Canadian Journal of Zoology, 54: 220–227.
streissl F., HoDl W. 2002. Growth, morphometrics, size at maturity, sexual dimorphism and condition index of Austropotamobius torrentium Schrank. Hydrobiologia, 477: 201–208.
vorBurger c., riBi g. 1999. Pacifastacus leniusculus and Austropotamobius torrentium prefer different substrates. Freshwater Crayfish, 10: 696−704.
WAng q., yAng W., zHou g., zHu y., sAn H. 2011. Length-weight and chelae length-width rela-tionships of the crayfish Procambarus clarkii under culture conditions. Journal of Freshwater Ecology, 26: 287–294.
westMan k., Pursiainen M. 1982. Size and structure of crayfish (Astacus astacus) populations on different habitats in Finland. In: Lakes and Water Management Proceedings of the 30 Years Jubilee. Eds. v. iiMavirta, R.I. Jones, P.E. Persson. Symposium of the Finnish Limnologi-cal Society, held in Helsinki, Finland, 22–23 September 1980. Reprinted from Hydrobiologia, 86(1/2), 67–80.
westMan k., suMari o., Pursiainen M. 1979. Electric fishing in sampling crayfish. Freshwater Crayfish, 4: 251–256.
wetzeL J.E. 2002. Form alternation of adult female crayfishes of the genus Orconectes (Decapoda: Cambaridae). American Midland Naturalist, 147: 326–337.
WeyA J.M., ruMBiak N.S., HAriyAnto s., irAWAn B., soegiAnto A. 2017. Length-weight rela-tionship and condition factor of crayfish from South Sorong and Jayawijaya, Papua, Indone-sia. Croatian Journal of Fisheries, 75: 18–24. DOI: 10.1515/cjf-2017-0004.
zar J.H. 1999. Biostatistical Analysis. 4th ed. Englewood Cliffs, NJ: Prentice-Hall.

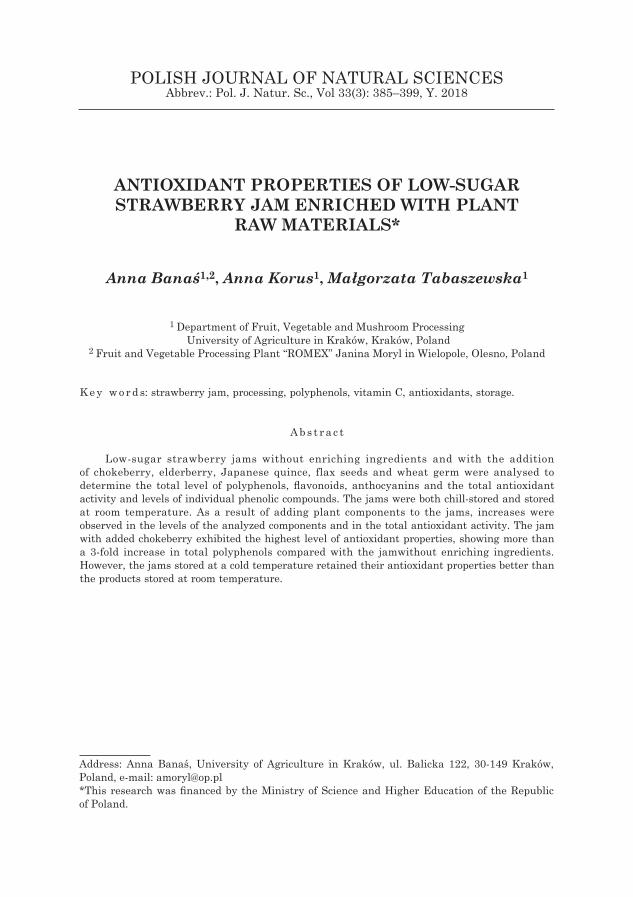
POLISH JOURNAL OF NATURAL SCIENCES Abbrev.: Pol. J. Natur. Sc., Vol 33(3): 385–399, Y. 2018
ANTIOXIDANT PROPERTIES OF LOW-SUGAR STRAWBERRY JAM ENRICHED WITH PLANT
RAW MATERIALS*
Anna Banaś1,2, Anna Korus1, Małgorzata Tabaszewska1
1 Department of Fruit, Vegetable and Mushroom Processing University of Agriculture in Kraków, Kraków, Poland
2 Fruit and Vegetable Processing Plant “ROMEX” Janina Moryl in Wielopole, Olesno, Poland
K e y w o r d s: strawberry jam, processing, polyphenols, vitamin C, antioxidants, storage.
A b s t r a c t
Low-sugar strawberry jams without enriching ingredients and with the addition of chokeberry, elderberry, Japanese quince, flax seeds and wheat germ were analysed to determine the total level of polyphenols, flavonoids, anthocyanins and the total antioxidant activity and levels of individual phenolic compounds. The jams were both chill-stored and stored at room temperature. As a result of adding plant components to the jams, increases were observed in the levels of the analyzed components and in the total antioxidant activity. The jam with added chokeberry exhibited the highest level of antioxidant properties, showing more than a 3-fold increase in total polyphenols compared with the jamwithout enriching ingredients. However, the jams stored at a cold temperature retained their antioxidant properties better than the products stored at room temperature.
Address: Anna Banaś, University of Agriculture in Kraków, ul. Balicka 122, 30-149 Kraków, Poland, e-mail: [email protected]*This research was financed by the Ministry of Science and Higher Education of the Republic of Poland.

Anna Banaś et al.386
WŁAŚCIWOŚCI PRZECIWUTLENIAJĄCE NISKOSŁODZONYCH DŻEMÓW TRUSKAWKOWYCH WZBOGACONYCH W SUROWCE
ROŚLINNE
Anna Banaś1,2, Anna Korus1, Małgorzata Tabaszewska1
1 Katedra Technologii Owoców, Warzyw i Grzybów Uniwersytet Rolniczy w Krakowie, Kraków, Poland
2 Zakład Przetwórstwa Owocowo-Warzywnego „ROMEX” Janina Moryl w Wielopolu,Olesno, Polska
S ł o w a k l u c z o w e: dżem truskawkowy, przetwórstwo, polifenole, witamina C, przeciwutleniacze, przechowywanie.
A b s t r a k t
W niskosłodzonych dżemach truskawkowych bez dodatków wzbogacających oraz z dodat-kiem aronii czarnoowocowej, czarnego bzu, pigwowca japońskiego, nasion lnu i zarodków pszen-nych oznaczono poziom polifenoli ogółem, flawonoidów ogółem, antocyjanów ogółem, ogólną ak-tywność przeciwutleniającą oraz przeprowadzono identyfikację ilościową polifenoli. Dżemy składowano w temperaturze chłodniczej i pokojowej. W wyniku dodania składników roślinnych do dżemów zaobserwowano wzrosty poziomów analizowanych składników i całkowitej aktywności antyoksydacyjnej. Dodatek do dżemów składników roślinnych wpłynął na wzrost poziomu anali-zowanych składników i ogólną aktywność przeciwutleniającą. Najwyższymi właściwościami prze-ciwutleniającymi charakteryzował się dżem z 15% dodatkiem owoców aronii, w którym zawartość polifenoli ogółem wzrosła ponad 3-krotnie w porównaniu z dżemem bez dodatków. Dżemy składo-wane w temperaturze chłodniczej lepiej zachowały swoje właściwości przeciwutleniające w porów-naniu z produktami składowanymi w temperaturze pokojowej.
Introduction
Fresh fruit is an excellent source of antioxidants such as anthocy-anins, flavonoids, phenolic acids, tannins, carotenoids and vitamins (Du toit et al. 2001). Antioxidants occurring in fruit play an important role in the human organism by quenching free radicals, which contribute to a number of disorders including cardiovascular diseases, cancer, diabetes, neurological diseases, atherosclerosis, accelerated ageing, and other disor-ders (zHeng and wang 2001). This is due to the fact that in an excited state free radicals have a substantial amount of energy and exhibit a high degree of reactivity with other organic compounds, particularly proteins, unsaturated fatty acids, and nucleic acids. Despite the fact that the human body has its own system to protect against free radicals, this system is not

Antioxidant Properties of Low-Sugar Strawberry Jam Enriched... 387
sufficient, particularly in industrialized regions. It is therefore necessary to supply the body with additional external antioxidants, for example, through the increased consumption of fruit and vegetables (Liu and ng 2000, wang 2006). However, in view of the seasonal availability of fresh fruit, it must be processed in order to be available throughout the year. Fruits are most often processed into frozen foods, juices, jams, marmalades, compotes, dried products, jellies, and candied fruits.
Contemporary consumers expect that food will not only meet basic ele-mentary functions, i.e., the body’s energy needs, but will also supply the body with proper quantities of nutrients which have an adequate level of quality, and at the same time they expect food to maintain its sensory attractiveness (WilDMAn 2001). Therefore, more and more frequently tra-ditional fruit products are enriched with pro-health components of natural origin, which enhance immunity, prevent seasonal diseases (such as hay fever and the common cold), prevent cancer and cardiac diseases, but also improve metabolism.
Strawberries (Fragaria x ananassa Duch.) are one of the most popular berry species (aMaro et al. 2012). Strawberries contain a number of bioac-tive compounds, for example, polyphenols (HannuM 2004). However, in addition to being seasonally available, strawberries are easily perishable and are particularly sensitive to transportation (Peano et al. 2014). The-refore, one way to extend their shelf-life is to preserve them in the form of jams – whole or chopped fruits suspended in jelly. Jams are produced by mixing fruit and sugar with a gelling agent and an organic acid. Jams may be classified as single- or multi-fruit, as well as by their sugar content: high- or low-sugar. Such products retain the flavour, fragrance and colour of the fruit from which they were made; therefore, they are willingly purchased by consumers, particularly the low-sugar ones with a lower energy value.
The aim of this research was to evaluate the effect of adding plant materials with pro-health properties (black chokeberry, elderberry, Japa-nese quince, flax seeds and wheat germ), to low-sugar strawberry jams. The jams were stored at a cold temperature (10°C) and at room tempera-ture (20°C) for 6 and 12 months.
Material and Methods
Material
The material investigated consisted of low-sugar strawberry jam pre-pared from the Senga Sengana cv. of strawberry (Fragaria × ananassa Duch.) without enriching ingredients, and jams containing enriching
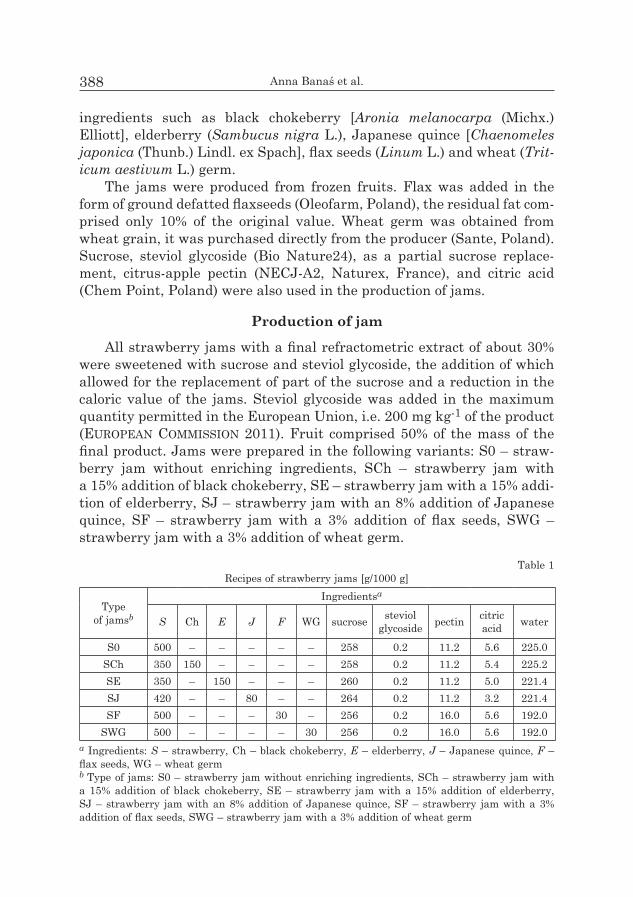
Anna Banaś et al.388
ingredients such as black chokeberry [Aronia melanocarpa (Michx.) Elliott], elderberry (Sambucus nigra L.), Japanese quince [Chaenomeles japonica (Thunb.) Lindl. ex Spach], flax seeds (Linum L.) and wheat (Trit-icum aestivum L.) germ.
The jams were produced from frozen fruits. Flax was added in the form of ground defatted flaxseeds (Oleofarm, Poland), the residual fat com-prised only 10% of the original value. Wheat germ was obtained from wheat grain, it was purchased directly from the producer (Sante, Poland). Sucrose, steviol glycoside (Bio Nature24), as a partial sucrose replace-ment, citrus-apple pectin (NECJ-A2, Naturex, France), and citric acid (Chem Point, Poland) were also used in the production of jams.
Production of jam
All strawberry jams with a final refractometric extract of about 30% were sweetened with sucrose and steviol glycoside, the addition of which allowed for the replacement of part of the sucrose and a reduction in the caloric value of the jams. Steviol glycoside was added in the maximum quantity permitted in the European Union, i.e. 200 mg kg-1 of the product (euroPeAn coMMission 2011). Fruit comprised 50% of the mass of the final product. Jams were prepared in the following variants: S0 – straw-berry jam without enriching ingredients, SCh – strawberry jam with a 15% addition of black chokeberry, SE – strawberry jam with a 15% addi-tion of elderberry, SJ – strawberry jam with an 8% addition of Japanese quince, SF – strawberry jam with a 3% addition of flax seeds, SWG – strawberry jam with a 3% addition of wheat germ.
Table 1Recipes of strawberry jams [g/1000 g]
Type of jamsb
Ingredientsa
S Ch E J F WG sucrose steviol glycoside pectin citric
acid water
S0 500 – – – – – 258 0.2 11.2 5.6 225.0SCh 350 150 – – – – 258 0.2 11.2 5.4 225.2SE 350 – 150 – – – 260 0.2 11.2 5.0 221.4SJ 420 – – 80 – – 264 0.2 11.2 3.2 221.4SF 500 – – – 30 – 256 0.2 16.0 5.6 192.0
SWG 500 – – – – 30 256 0.2 16.0 5.6 192.0a Ingredients: S – strawberry, Ch – black chokeberry, E – elderberry, J – Japanese quince, F – flax seeds, WG – wheat germb Type of jams: S0 – strawberry jam without enriching ingredients, SCh – strawberry jam with a 15% addition of black chokeberry, SE – strawberry jam with a 15% addition of elderberry, SJ – strawberry jam with an 8% addition of Japanese quince, SF – strawberry jam with a 3% addition of flax seeds, SWG – strawberry jam with a 3% addition of wheat germ
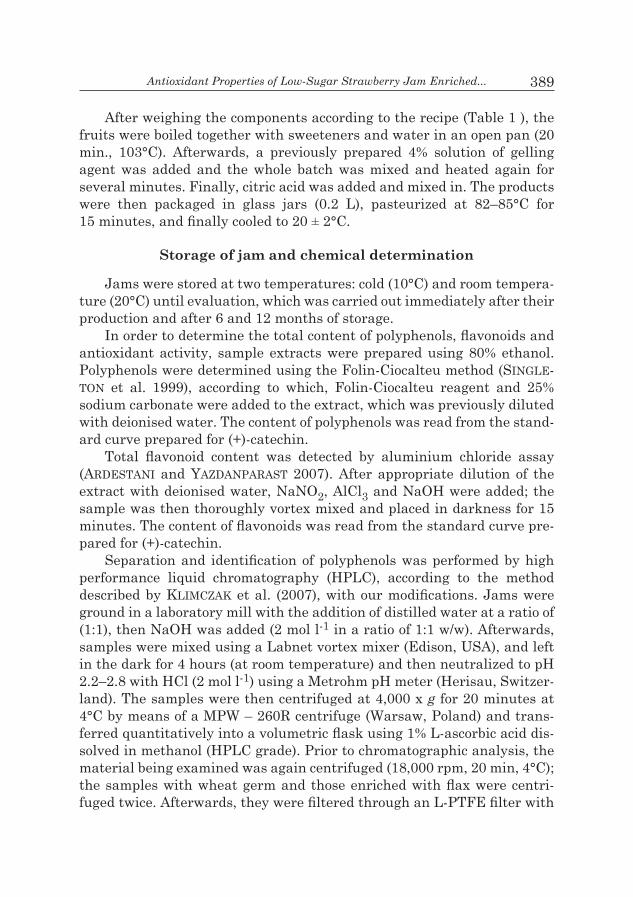
Antioxidant Properties of Low-Sugar Strawberry Jam Enriched... 389
After weighing the components according to the recipe (Table 1 ), the fruits were boiled together with sweeteners and water in an open pan (20 min., 103°C). Afterwards, a previously prepared 4% solution of gelling agent was added and the whole batch was mixed and heated again for several minutes. Finally, citric acid was added and mixed in. The products were then packaged in glass jars (0.2 L), pasteurized at 82–85°C for 15 minutes, and finally cooled to 20 ± 2°C.
Storage of jam and chemical determination
Jams were stored at two temperatures: cold (10°C) and room tempera-ture (20°C) until evaluation, which was carried out immediately after their production and after 6 and 12 months of storage.
In order to determine the total content of polyphenols, flavonoids and antioxidant activity, sample extracts were prepared using 80% ethanol. Polyphenols were determined using the Folin-Ciocalteu method (singLe-ton et al. 1999), according to which, Folin-Ciocalteu reagent and 25% sodium carbonate were added to the extract, which was previously diluted with deionised water. The content of polyphenols was read from the stand-ard curve prepared for (+)-catechin.
Total flavonoid content was detected by aluminium chloride assay (ArDestAni and yAzDAnPArAst 2007). After appropriate dilution of the extract with deionised water, NaNO2, AlCl3 and NaOH were added; the sample was then thoroughly vortex mixed and placed in darkness for 15 minutes. The content of flavonoids was read from the standard curve pre-pared for (+)-catechin.
Separation and identification of polyphenols was performed by high performance liquid chromatography (HPLC), according to the method described by KliMczAK et al. (2007), with our modifications. Jams were ground in a laboratory mill with the addition of distilled water at a ratio of (1:1), then NaOH was added (2 mol l-1 in a ratio of 1:1 w/w). Afterwards, samples were mixed using a Labnet vortex mixer (Edison, USA), and left in the dark for 4 hours (at room temperature) and then neutralized to pH 2.2–2.8 with HCl (2 mol l-1) using a Metrohm pH meter (Herisau, Switzer-land). The samples were then centrifuged at 4,000 x g for 20 minutes at 4°C by means of a MPW – 260R centrifuge (Warsaw, Poland) and trans-ferred quantitatively into a volumetric flask using 1% L-ascorbic acid dis-solved in methanol (HPLC grade). Prior to chromatographic analysis, the material being examined was again centrifuged (18,000 rpm, 20 min, 4°C); the samples with wheat germ and those enriched with flax were centri-fuged twice. Afterwards, they were filtered through an L-PTFE filter with

Anna Banaś et al.390
a pore diameter of 22 µm. Before chromatographic analysis, the samples were stored at 4°C.
Chromatographic analysis was performed using a Dionex Ultimate 3000 HPLC set equipped with a Thermo Scientific DAD detector (Germe-ring, Germany). A column (XBridgeTMC18 250 x 4.6 mm; 3.5 µm) with a pre-column (XBridgeTM C18, 20 x 4.6 mm; 3.5 µm (Waters, Wexford, Ireland)) was employed for the analysis. The mobile phase consisted of two eluents: A – a 2% aqueous solution of acetic acid, and B – 100% acetoni-trile. The flow rate was 0.8 ml min-1. The analysis was carried out for 80 min. using the following gradient: eluent A – 15 min., 14%; 20 min., 18%; 30 min., 25%; 55 min., 55%; and 62 min., 100%; until the end of the analysis.
The total anthocyanins and degradation index were determined by means of the spectroscopic method (giusti and WrolstAD 2001). Anthocy-anin content, expressed as cyanidin-3-glucoside equivalent, was calcula-ted from the absorbance measured and the coefficient of sample dilution.
Vitamin C content, as the sum of ascorbic and dehydroascorbic acid, was determined using a spectrophotometrical method (Fruits, vegetables… ISO/6557-2, 1984). The quantitative reduction of 2,6 dichlorophenolindo-phenol dyestuff by the ascorbic acid was flowed by extraction of the excess dyestuff using xylene, and the excess was measured spectrophotometri-cally at 500 nm and compared with the vitamin C reference standard.
Antioxidant activity was determined by means of three spectrophoto-metric methods: as scavenging activity against DPPH (1.1-diphenyl-2-pi-crylhydrazyl) free radical (Pekkarinen et al. 1999); applying ABTS (2,2′-azinobis(3-ethylbenzthiazoline-6-sulfonate) cation radical (re et al. 1999); and by the ferric reducing antioxidant power (FRAP) method (Ben-zie and strain 1996). For the aforementioned methods, absorbance was measured at 516 nm, 734 nm, and 595 nm respectively.
A Hitachi U-2900 double beam spectrophotometer (Hitachi Europe Ltd) was used to analyse total polyphenols, flavonoids, anthocyanins, vita-min C and antioxidant activity.
Statistical analysis
All analyses were carried out in four experimental replications.The results were subjected to a two-factor analysis of variance (first factor – type of jam; second factor – storage) on the basis of the Snedecor F and Student’s t tests. The least significant difference (LSD) was calculated at the probability level of P < 0.05. The Statistica 12.0 (StatSoft; Poland) pro-gram was used.

Antioxidant Properties of Low-Sugar Strawberry Jam Enriched... 391
Results and Discussion
Effect of adding enriching ingredients on antioxidant properties
The strawberry jams contained on average of 75.8–239.4 mg total polyphenols per 100 g of fresh matter (Table 2 ). Among the applied enrich-ing plant ingredients, only black chokeberry, elderberry and Japanese quince had a significant effect (P < 0.05) on the total polyphenols in the jams. When compared with the strawberry jam without enriching ingredi-ents, the addition of black chokeberry caused an increase in the level of polyphenols by an average of 213%, elderberry by 75%, and Japanese quince by 40%. In the strawberry jams investigated, total flavonoids accounted for on average 35–55% of total polyphenols (Table 2). The straw-berry jam without enriching ingredients was characterized by low average amounts of total flavonoids (27.4 mg/100 g). Similar levels in strawberry jams were also reported by levAJ et al. (2012). However, a combination of strawberries and other fruits with significant polyphenol content allowed for products with a high nutritive value to be obtained. Of the examined jams, the jam with black chokeberry had the highest amounts of flavonoids (111.6 mg/100 g), as was the case with total polyphenols. The jams enriched with elderberry and Japanese quince, had an average flavo-noid content of 58.1 mg of per 100 g, and may also be regarded as a good source of these nutrients.
Numerous authors, therefore, highlight the beneficial effect of enrich-ing products with plant components with high antioxidant activity. WoJDyło et al. (2008) demonstrated a significant increase in polyphenol content after the 10% addition of black chokeberry to strawberry jam, while nAWirsKA-olszAńsKA et al. (2010) revealed that due to enriching pumpkin jams with Japanese quince, products may be obtained with a high content of polyphenols and strong antioxidant activity. The benefi-cial effect of adding black chokeberry, strawberry and raspberry to Cornel-ian cherry puree on the level of polyphenols was also mentioned by KucHArsKA et al. (2010). On the other hand, korus et al. (2015) showed that enriching bilberry jams with the addition of herbs resulted not only in higher polyphenol content in these products, but also in better retention of polyphenols during storage.

Anna Banaś et al.392
Table 2Total polyphenols, flavonoids, anthocyanins and degradation index in strawberry jams during
storage
Analysedparametera
Type of
jamsb
Storage time (months) at 10oC and 20oCMean
0 6temp. 10oC
6temp. 20oC
12temp. 10oC
12temp. 20oC
Total polyphenols[mg/100 g]
S0 83.3 ± 5.5 79.2 ± 3.4 75.0 ± 4.0 75.6 ± 6.4 69.1 ± 4.2 76.4SCh 288.7± 5.8 241.1 ± 4.7 218.2 ± 6.0 236.4 ± 5.0 212.6 ± 5.2 239.4SE 160.1 ± 4.8 137.4 ± 5.0 122.9 ± 4.8 131.0 ± 5.7 118.5 ± 4.8 134.0SJ 121.8 ± 5.0 114.4 ± 7.6 98.2 ± 5.7 110.0 ± 4.3 90.7 ± 4.5 107.0SF 91.4 ± 4.1 82.7 ± 7.0 78.1 ± 5.9 77.5 ± 5.2 72.8 ± 5.3 80.5
SWG 88.5 ± 6.3 79.7 ± 5.5 70.3 ± 5.0 74.3 ± 3.4 66.3 ± 3.2 75.8mean 139.0 122.4 110.5 117.5 105.0
LSD P < 0.05c I – 4.82, II – 4.40, I x II – 10.78
Totalflavonoids[mg/100 g]
S0 38.8 ± 1.7 28.3 ± 1.7 23.3 ± 1.9 25.8 ± 2.1 21.0 ± 0.3 27.4SCh 162.7 ± 3.3 111.4 ± 3.6 90.2 ± 2.7 106.9 ± 3.2 86.8 ± 2.7 111.6SE 95.8 ± 4.6 67.6 ± 2.8 50.3 ± 4.6 48.6 ± 2.6 36.4 ± 1.7 59.8SJ 66.6 ± 4.8 51.5 ± 3.0 40.4± 4.3 62.1 ± 3.7 61.6 ± 2.8 56.4SF 42.1 ± 2.4 27.3 ± 4.5 23.5 ± 1.6 24.7 ± 0.9 22.2 ± 1.8 28.0
SWG 39.9 ± 1.9 27.4 ± 2.6 23.2 ± 1.0 25.2 ± 4.0 21.0 ± 2.3 27.3mean 74.3 52.3 41.8 48.9 41.5
LSD P < 0.05 I – 4.04, II – 3.69, I x II – 9.03
Total anthocyanins
[mg/100 g]
S0 19.3 ± 1.3 16.0 ± 2.5 12.7 ± 0.7 9.6 ± 0.4 7.2 ± 1.0 13.0SCh 89.1 ± 5.1 75.2 ± 5.3 68.1 ± 5.2 61.4 ± 5.5 46.5 ± 4.3 68.0SE 65.7 ± 3.3 58.8 ± 3.0 52.5 ± 2.0 42.8 ± 2.0 34.2 ± 1.4 50.8SJ 15.4 ± 0.8 11.3 ± 2.1 10.5 ± 1.4 10.4 ± 0.7 7.0 ± 1.0 10.9SF 18.2 ± 1.9 14.4 ± 2.1 13.9 ± 1.5 10.8 ± 0.8 7.4 ± 1.0 12.9
SWG 18.7 ± 1.5 16.5 ± 1.9 14.1 ± 2.2 11.8 ± 0.8 7.7 ± 0.8 13.8mean 37.7 32.0 28.6 24.5 18.3
LSD P < 0.05 I – 1.88, II – 1.71, I x II – 4.20
Degradation index
S0 1.40 ± 0.22 1.45 ± 0.13 1.62 ± 0.08 1.61 ± 0.11 1.67 ± 0.10 1.55SCh 1.25 ± 0.05 1.35 ± 0.05 1.48 ± 0.06 1.38 ± 0.05 1.57 ± 0.16 1.40SE 1.35 ± 0.08 1.36 ± 0.13 1.46 ± 0.20 1.48 ± 0.12 1.56 ± 0.11 1.44SJ 1.25 ± 0.09 1.38 ± 0.21 1.54 ± 0.26 1.45 ± 0.10 1.61 ± 0.26 1.45SF 1.32 ± 0.14 1.37 ± 0.09 1.48 ± 0.14 1.53 ± 0.23 1.63 ± 0.27 1.47
SWG 1.31 ± 0.11 1.38 ± 0.09 1.54 ± 0.23 1.54 ± 0.24 1.58 ± 0.03 1.47mean 1.31 1.38 1.52 1.50 1.60
LSD P < 0.05 I – n.s.d, II – 0.096, I x II – n.sa Values are presented as mean value ± SD (n = 4) and expressed of fresh matterb Type of jams: S0 – strawberry jam without enriching ingredients, SCh – strawberry jam with a 15% addition of black chokeberry, SE – strawberry jam with a 15% addition of elderberry, SJ – strawberry jam with an 8% addition of Japanese quince, SF – strawberry jam with a 3% addition of flax seeds, SWG – strawberry jam with a 3% addition of wheat germc LSD P < 0.05 for: type of jams (I), storage (II), interaction (I x II)d n.s. – not significant
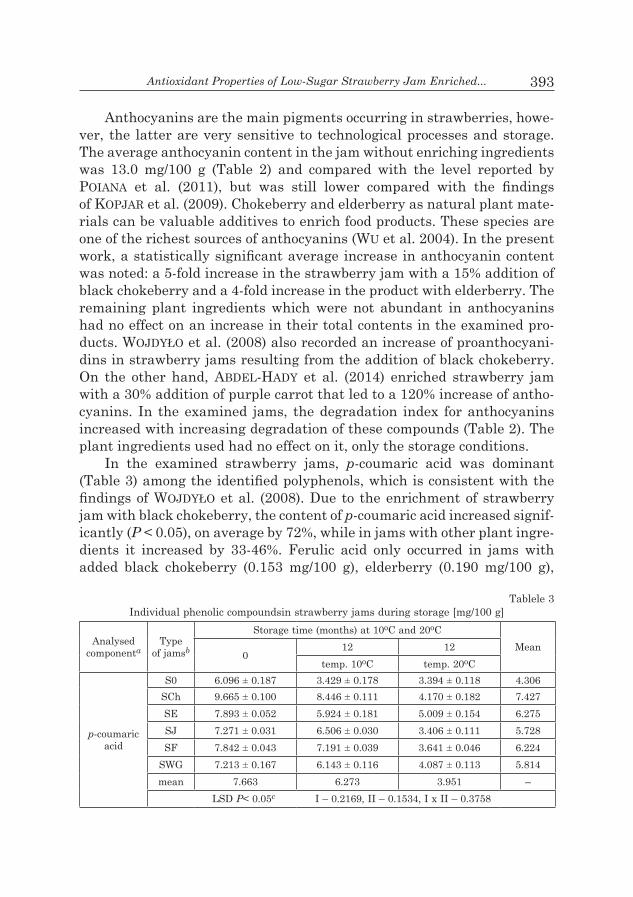
Antioxidant Properties of Low-Sugar Strawberry Jam Enriched... 393
Anthocyanins are the main pigments occurring in strawberries, howe-ver, the latter are very sensitive to technological processes and storage. The average anthocyanin content in the jam without enriching ingredients was 13.0 mg/100 g (Table 2) and compared with the level reported by Poiana et al. (2011), but was still lower compared with the findings of KoPJAr et al. (2009). Chokeberry and elderberry as natural plant mate-rials can be valuable additives to enrich food products. These species are one of the richest sources of anthocyanins (wu et al. 2004). In the present work, a statistically significant average increase in anthocyanin content was noted: a 5-fold increase in the strawberry jam with a 15% addition of black chokeberry and a 4-fold increase in the product with elderberry. The remaining plant ingredients which were not abundant in anthocyanins had no effect on an increase in their total contents in the examined pro-ducts. WoJDyło et al. (2008) also recorded an increase of proanthocyani-dins in strawberry jams resulting from the addition of black chokeberry. On the other hand, ABDel-HADy et al. (2014) enriched strawberry jam with a 30% addition of purple carrot that led to a 120% increase of antho-cyanins. In the examined jams, the degradation index for anthocyanins increased with increasing degradation of these compounds (Table 2). The plant ingredients used had no effect on it, only the storage conditions.
In the examined strawberry jams, p-coumaric acid was dominant (Table 3) among the identified polyphenols, which is consistent with the findings of WoJDyło et al. (2008). Due to the enrichment of strawberry jam with black chokeberry, the content of p-coumaric acid increased signif-icantly (P < 0.05), on average by 72%, while in jams with other plant ingre-dients it increased by 33-46%. Ferulic acid only occurred in jams with added black chokeberry (0.153 mg/100 g), elderberry (0.190 mg/100 g),
Tablele 3 Individual phenolic compoundsin strawberry jams during storage [mg/100 g]
Analysedcomponenta
Type of jamsb
Storage time (months) at 10oC and 20oCMean
012 12
temp. 10oC temp. 20oC
p-coumaricacid
S0 6.096 ± 0.187 3.429 ± 0.178 3.394 ± 0.118 4.306SCh 9.665 ± 0.100 8.446 ± 0.111 4.170 ± 0.182 7.427SE 7.893 ± 0.052 5.924 ± 0.181 5.009 ± 0.154 6.275SJ 7.271 ± 0.031 6.506 ± 0.030 3.406 ± 0.111 5.728SF 7.842 ± 0.043 7.191 ± 0.039 3.641 ± 0.046 6.224
SWG 7.213 ± 0.167 6.143 ± 0.116 4.087 ± 0.113 5.814mean 7.663 6.273 3.951 –
LSD P< 0.05c I – 0.2169, II – 0.1534, I x II – 0.3758

Anna Banaś et al.394
Ferulic acid
S0 ndd nd nd ndSCh 0.220 ± 0.007 0.168 ± 0.025 0.071 ± 0.002 0.153SE 0.211 ± 0.007 0.204 ± 0.001 0.156 ± 0.013 0.190SJ nd nd nd ndSF 0.934 ± 0.042 0.705 ± 0.030 0.541 ± 0.020 0.727
SWG 0.853 ± 0.004 0.544 ± 0.021 0.338 ± 0.008 0.579mean 0.370 0.270 0.184
LSD P < 0.05 I – 0.0238, II – 0.0168, I x II – 0.0412
Ellagic acid
S0 1.222 ± 0.051 1.112 ± 0.029 0.841 ± 0.198 1.058SCh 0.853 ± 0.040 0.764 ± 0.044 0.555 ± 0.026 0.724SE 1.312 ± 0.021 1.244 ± 0.054 1.022 ± 0.027 1.193SJ 1.157 ± 0.028 1.073 ± 0.025 0.813 ± 0.011 1.014SF 1.104 ± 0.039 0.884 ± 0.050 0.597 ± 0.090 0.861
SWG 1.226 ± 0.027 1.080 ± 0.014 0.880 ± 0.004 1.062mean 1.146 1.026 0.785
LSD P < 0.05 I – 0.0669, II – 0.0473, I x II – n.s.e
Quercetin
S0 0.021 ± 0.001 0.011 ± 0.002 0.008 ± 0.002 0.014SCh 0.038 ± 0.003 0.028 ± 0.002 0.014 ± 0.002 0.027SE 0.034 ± 0.002 0.021 ± 0.001 0.017 ± 0.002 0.024SJ 0.028 ± 0.001 0.018 ± 0.001 0.010 ± 0.001 0.019SF nd nd nd nd
SWG nd nd nd ndmean 0.020 0.013 0.008
LSD P < 0.05 I – 0.0007, II – 0.0005, I x II – 0.0013
(+)-catechin
S0 1.267 ± 0.012 0.883 ± 0.038 0.463 ± 0.084 0.871SCh 1.044 ± 0.016 0.818 ± 0.016 0.650 ± 0.010 0.837SE 4.756 ± 0.042 1.705 ± 0.092 0.941 ± 0.045 2.467SJ 2.904 ± 0.055 2.354 ± 0.023 1.763 ± 0.022 2.341SF 2.809 ± 0.056 1.615 ± 0.033 0.981 ± 0.035 1.802
SWG 2.146 ± 0.003 1.822 ± 0.042 0.932 ± 0.019 1.633mean 2.488 1.533 0.955
LSD P < 0.05 I – 0.0779, II – 0.0551, I x II – 0.1350a Values are presented as mean value ± SD (n = 4) and expressed of fresh matter b Type of jams: S0 – strawberry jam without enriching ingredients, SCh – strawberry jam with a 15% addition of black chokeberry, SE – strawberry jam with a 15% addition of elderberry, SJ – strawberry jam with an 8% addition of Japanese quince, SF – strawberry jam with a 3% addition of flax seeds, SWG – strawberry jam with a 3% addition of wheat germ c LSD P < 0.05 for: type of jams (I), storage (II), interaction (I x II)dnd– not detected, en.s. – not significant wheat germ (0.727 mg/100 g), and flax (0.579 mg/100 g). In turn, ellagic acid predominated significantly (P < 0.05) in the jams enriched with elder-berry and Japanese quince, whereas (+)-catechin was present in the jams with flax seeds and wheat germ.

Antioxidant Properties of Low-Sugar Strawberry Jam Enriched... 395
Table 4Vitamin C and antioxidant activity (ABTS, DPPH and FRAP) in strawberry jams during storage
Analysedparametera
Type of
jamsb
Storage time (months) at 10oC and 20oCMean
0 6temp. 10oC
6temp. 20oC
12temp. 10oC
12temp. 20oC
Vitamin C [mg/100 g]
S0 13.4 ± 0.9 11.5 ± 0.5 10.8 ± 0.6 9.9 ± 1.1 8.5 ± 0.8 10.9SCh 13.3 ± 0.7 12.2 ± 0.6 11.9 ± 0.4 10.8 ± 0.7 9.4 ± 1.2 11.5SE 15.4 ± 1.0 13.6 ± 0.4 13.3 ± 0.6 12.2 ± 0.6 11.7 ± 0.5 13.3SJ 14.3 ± 0.7 12.8 ± 0.2 12.1 ± 0.4 11.5 ± 0.8 10.3 ± 0.6 12.2SF 12.4 ± 0.7 11.3 ± 0.7 10.4 ± 0.8 9.9 ± 0.9 8.3 ± 0.9 10.5
SWG 12.2 ± 0.6 11.2 ± 0.7 10.3 ± 0.7 9.2 ± 0.8 8.5 ± 0.9 10.3mean 13.5 12.1 11.5 10.6 9.5 –
LSD P < 0.05c I – 0.46, II – 0.42, I x II – n.sd
ABTS[µM Tx/1 g]
S0 38.9 ± 1.5 34.7 ± 2.0 30.8 ± 1.9 31.2 ± 2.2 27.6 ± 1.9 32.6SCh 127.1 ± 2.0 115.6 ± 1.9 102.7 ± 1.5 111.0 ± 1.4 95.8 ± 1.6 110.5SE 106.6 ± 1.4 98.1 ± 2.1 89.3 ± 2.9 92.5 ± 2.2 83.3 ± 2.7 94.0SJ 84.2 ± 1.2 76.1 ± 1.2 72.8 ± 1.8 71.6 ± 1.4 68.1 ± 1.9 74.5SF 45.0 ± 1.0 39.8 ± 1.6 35.3 ± 2.1 36.1 ± 1.7 31.3 ± 1.7 37.5
SWG 42.1 ± 2.2 37.6 ± 1.3 33.1 ± 1.5 35.2 ± 1.1 30.0 ± 1.7 35.6mean 74.0 67.0 60.7 62.9 56.0 –
LSD P < 0.05 I – 3.94, II – 3.60, I x II – n.s.
DPPH[µM Tx/1 g]
S0 37.7 ± 1.2 34.8 ± 1.9 31.4 ± 1.9 30.6 ± 1.3 25.0 ± 1.4 31.9SCh 53.8 ± 1.9 48.3 ± 3.0 43.9 ± 1.0 43.6 ± 1.4 38.8 ± 0.8 45.7SE 46.3 ± 1.3 41.5 ± 1.3 35.9 ± 2.1 37.9 ± 1.2 30.2 ± 0.7 38.3SJ 43.3 ± 1.5 41.0 ± 1.7 37.5 ± 1.6 39.0 ± 1.1 32.8 ± 1.0 38.7SF 41.7 ± 1.6 38.8 ± 1.3 35.9 ± 1.6 33.5 ± 1.4 30.2 ± 1.6 36.0
SWG 39.0 ± 1.5 35.1 ± 1.8 33.5 ± 1.9 32.8 ± 1.6 29.5 ± 1.4 34.0mean 43.6 39.9 36.3 36.2 31.1 –
LSD P < 0.05 I – 2.33, II – 2.13, I x II – n.s.
FRAP [µM Fe2+/1 g]
S0 35.3 ± 1.3 34.6 ± 1.9 30.4 ± 2.2 31.1 ± 1.0 29.3 ± 0.6 32.1SCh 73.1 ± 1.6 67.2 ± 1.4 57.1 ± 1.3 61.6 ± 1.1 51.8 ± 1.1 62.2SE 55.0 ± 1.9 51.6 ± 1.4 47.3 ± 1.3 47.6 ± 1.5 42.2 ± 1.9 48.8SJ 44.6 ± 1.3 41.9 ± 1.9 36.7 ± 1.9 37.4 ± 1.9 33.1 ± 1.5 38.7SF 40.9 ± 1.9 36.4 ± 1.8 33.2 ± 1.1 33.8 ± 1.0 30.5 ± 0.7 35.0
SWG 38.3 ± 1.9 34.6 ± 1.6 31.0 ± 3.3 30.8 ± 1.3 29.0 ± 0.7 32.7mean 47.9 44.4 39.3 40.4 36.0 –
LSD P < 0.05 I – 2.06, II – 1.88, I x II – n.s.a Values are presented as mean value ± SD (n = 4) and expressed of fresh matterb Type of jams: S0 – strawberry jam without enriching ingredients, SCh – strawberry jam with a 15% addition of black chokeberry, SE – strawberry jam with a 15% addition of elderberry, SJ – strawberry jam with an 8% addition of Japanese quince, SF – strawberry jam with a 3% addition of flax seeds, SWG – strawberry jam with a 3% addition of wheat germc LSD P < 0.05 for: type ofjams (I), storage (II), interaction (I x II)

Anna Banaś et al.396
As PineLLi et al. (2015) reported, the content of p-coumaric acid and quercentin in strawberry jams corresponded to the results obtained in this work; however, the levels of ferulic acid (0.370 mg/100 g), ellagic acid (2.751 mg/100 g), and (+)-catechin (0.472 mg/100 g) were different.
Strawberry jams contained small amounts of vitamin C – on average, 10.9 mg/100 g (Table 4). However, the addition of black chokeberry, Japa-nese quince, and elderberry significantly influenced (P < 0.05) its level: by 6%, 12% and 22% respectively. The vitamin C content in the jams with flax seeds and wheat germ was comparable with that determined in the straw-berry jam without enriching ingredients.
In view of the results above, the combination of strawberries with other plant compounds rich in bioactive constituents seems to be justified. When compared with the jam without enriching ingredients, the rema-ining ones showed higher antioxidant activity, on average by 9–239% (ABTS), 7–43% (DPPH), and 2–94% (FRAP) – Table 4. The additive which elevated the total antioxidant activity to the greatest extent was black chokeberry, while wheat germ elevated it to the least extent.
Influence of storage conditions on antioxidant properties
The storage conditions of the jam had a significant effect (P < 0.05) on all the analyzed constituents and total antioxidant activity. The average content of total polyphenols in the examined products after 6 and 12 months of storage decreased by 16% and 20% respectively, while losses in flavonoids were higher and were 37% and 39% (Table 2). However, it has been found that storing jams at lower temperatures results in better reten-tion of the constituents examined (P < 0.05). After a year of storage, signif-icant losses (P < 0.05) were noted in the content of the identified polyphe-nols (Table 3). The average losses of these compounds in the jams stored at 10°C ranged from 10% (ellagic acid) to 38% ((+)-catechin). In contrast, the average losses observed at 20 °C were significantly higher and amounted to 48% (p-cumaric acid) and 62% ((+)-catechin). Similar or greater reduc-tions in the level of polyphenols in strawberry jams were reported by WoJDyło et al. (2008). The authors highlight that (+)-catechin content may either increase or decrease during storage due to the fact that this com-pound is released from complex compounds during the first storage period, so that its content increases and then decreases during prolonged storage.
The average losses in total anthocyanin content in chill-stored jams after 6 and 12 months were 15% and 35% respectively. In turn, for jams stored at 20°C, losses after 6- and 12-months of storage were 24% and 51% respectively (Table 2). Poiana et al. (2011) also observed losses in antho-

Antioxidant Properties of Low-Sugar Strawberry Jam Enriched... 397
cyanins during storage of strawberry jam. In addition, WicKlunD et al. (2005) and Patras et al. (2011) found that the retention of anthocyanins in the jams stored at 4°C was better, which is consistent with the results of KoPJAr et al. (2009) who noted a smaller decrease in anthocyanins in strawberry jams stored at 4°C for six weeks (21%), compared with those kept at room temperature (51%).
What should be emphasized here is the fact that the jams with added fruit and those enriched with wheat germ and flax seeds retained their total content of anthocyanins better than the jam without added plant ingredients. This agrees with the findings of ABDel-HADy et al. (2014), who observed better retention of total anthocyanins in the strawberry jams enriched with puree of purple carrot compared with those without added plant ingredients.
Average losses of vitamin C in strawberry jams after 6 and 12 months of storage were respectively 10% and 21% in the jam kept at 10°C, and 15% and 30% for those kept at 20°C (Table 4). The studies of Poiana et al. (2011) proved that losses of vitamin C in the strawberry jam were much more higher (33%) after only 3 months of storage at room temperature. The lower storage temperature had a significant effect (P < 0.05) on the better retention of vitamin C in the products investigated.
According to numerous authors, storage conditions of jams are one of the factors that affect their nutritive value, including radical scavenging activity (Patras et al. 2011). In the jams examined, the level of antioxi-dant activity decreased compared with the non-stored products, on aver-age by 14% (ABTS), 13% (DPPH) and 13% (FRAP) after 6-months of stor-age and by 20%, 23% and 20% respectively after 12 months of storage (Table 4). Many authors also noted a reduction in the level of activity in the stored jams (Poiana et al. 2011, Patras et al. 2011). Moreover, jams stored at 10°C always had higher levels (P < 0.05) of antioxidant activity compared with those stored at 20°C. In turn, the biggest declines in activ-ity were recorded in the jams without added plant ingredients, which were stored at both temperatures, this relates well to the results obtained by WoJDyło et al. (2008).
Conclusions
At present, consumers pay much more attention to the composition of food products. They particularly expect a natural product with low calo-ric value to have beneficial effects on human health. Enrichment of the daily diet with pro-health components of natural origin can contribute to

Anna Banaś et al.398
the improvement of quality of life. Such components as black chokeberry, elderberry, Japanese quince, flax seeds and wheat germ can be valuable additives, increasing the nutritive value of products, as shown by the results reported in this paper. The addition of these components with heal-th-promoting properties to jams had a significant effect on the total antioxi-dant activity when compared with jam without these ingredients. Such products may therefore be a good source of antioxidants in the diet. In addition, enrichment with these products generally led to better retention of antioxidants during storage. With regard to such jams, however, we would recommend chill-storage. This is due to the lower losses of bioactive components compared with storage at room temperature, which was con-firmed by our findings.
Translated by BożenA FireK (UR Kraków), native speaker (Skrivanek – Office Translation)Accepted for print 6.07.2018
ReferencesABDel-HADy M.M., MAMilA M.A., aFaF M.a. 2014. Color stability of strawberry jam fortified by
purple carrot puree. Egypt. J. Agric. Res., 92(1): 323–336.AMAro l.F., soAres M.t., PinHo c., AlMeiDA i.F., FerreirA v.o., PinHo o. 2012. Influence
of Cultivar and storage conditions in anthocyanin content and radical-scavenging activity of strawberry jams. Int. J. Biol. Food. Vet. Agric. Eng., 6(9): 656–660.
ArDestAni A., yAzDAnPArAst r. 2007. Antioxidant and free radical scavenging potential of Achil-leasantolina extracts. Food Chem., 104: 21–29.
Benzie i.F., strAin J.J. 1996. The ferric reducing ability of plasma (FRAP) as a measure of “an-tioxidant power”: the FRAP assay. Anal. Biochem., 239: 70–76.
euroPeAn coMMission 2011. Commission Regulation (EU) No 1131/2011 of 11 November 2011 amending Annex II to Regulation (EC) No 1333/2008 of the European Parliament and of the Council with regard to steviol glycosides. Official Journal of the European Union L 295., 54: 205–2016.
Du toit r., volsteeDt y., APostoliDes z. 2001. Comparison of the antioxidant content of fruits, vegetables and teas measured as vitamin C equivalents. Toxicology, 166: 63–69.
Fruits, vegetables and derived products. Determination of ascorbic acid content. Part 2. Routine methods. Geneve 20, Switzerland: International Organization for Standardization. iso/6557-2. 1984.
giusti M.M., WrolstAD r.e. 2001. Characterization and measurement of anthocyanins by UV-vi-sible spectroscopy. Curr. Protoc. Food Anal. Chem., F1.2.1–F1.2.13.
HannuM s.M. 2004. Potential impact of strawberries on human health: a review of the science. Crit. Rev. Food Sci., 44: 1–17.
KliMczAK i., MAłecKA M., szlAcHtA M., gliszczyńsKA-śWigło A. 2007. Effect of storage on the content of polyphenols, vitamin C and the antioxidant activity of orange juices. J. Food Comp. Anal., 20: 313–322.
KoPJAr M., PiližotA v., neDićtiBAn n., šuBArić D., BABić J., AčKAr Đ., sAJDl M. 2009. Strawberry jams: Influence of different pectins on colour and textural properties. Czech J. Food Sci., 27: 20–28.
Korus A., JAWorsKA g., BernAś e., JuszczAK l. 2015. Characteristics of physico-chemical properties of bilberry (Vaccinium myrtillus L.) jams with added herbs. J. Food Sci. Technol., 52(5): 2815–2823.

Antioxidant Properties of Low-Sugar Strawberry Jam Enriched... 399
KucHArsKA A.z., KoWAlczyK K., nAWirsKA-olszAńsKA A., soKół-łętoWsKA A. 2010. Effect of chokeberry, strawberry, and raspberry added to cornelian cherry purée on its physical and chemical composition. ZNTJ, 4: 95–106.
levAJ B., BursAć-KovAčević D., BituH M., DrAgović-uzelAc v. 2012. Influence of jam pro-cessing upon the contents of phenolics and antioxidant capacity in strawberry fruit (Fragaria ananassa × Duch.). Croat. J. Food Technol. Biotechnol. Nutr., 7: 18–22.
Liu F., ng t.B. 2000. Antioxidative and free radical scavenging activities of selected medicinal herbs. Life Sci., 66: 725–735.
nAWirsKA-olszAńsKA A., KucHArsKA Az., soKół-łętoWsKA A., BiesiADA A. 2010. Quality as-sessment of pumpkin jams enriched with japanese quince, cornelian cherry and strawberries. ZNTJ, 1: 40–48.
Patras a., Brunton n.P., tiwari B.K., ButLer F. 2011. Stability and degradation kinetics of bioactive compounds and colour in strawberry jam during storage. Food Bioprocess. Tech., 4: 1245–1252.
PeAno c., giuggioli n.r., girgenti v. 2014. Effect of different packaging materials on pos-tharvest quality of Cv. Envie2 strawberry. Int. Food Res. J., 21: 1165–1170.
Pekkarinen s.s., Heinonen i.M., HoPia a.i. 1999. Flavonoids quercetin, myricetin, kaemferol and (+) catechin and antioxidants in methyl linoleate. J. Sci. Food Agric., 79: 499–506.
Pinelli l.D.o., Moretti c.l., cHiArello M., Melo l. 2015. Influence of strawberry jam color and phenolic compounds on acceptance during storage. Rev. Ceres., 62(3): 233–240.
PoiAnA M.A., MoigrADeAn D., DogAru D., MAteescu c., rABA D., iosiFgergen i. 2011. Proces-sing and storage impact on the antioxidant properties and color quality of some low sugar fruit jams. Rom. Biotech. Lett., 16(5): 6504–6512.
re r., Pellegrini n., Proteggente A., PAnnAlA A., yAng M., rice-evAns c. 1999. Antioxidant activity applying an improved ABTS radical cation decolorization assay. Free Radical. Bio. Med., 26: 1231–1237.
singleton v.l., ortHoFer r., lAMuelA-rAventós rM. 1999. Analysis of total phenols and other oxidation substrates and antioxidants by means of Folin-Ciocalteu reagent. Methods in Enzy-mol., 299: 152–178.
WAng s.y. 2006. Effect of pre-harvest conditions on antioxidant capacity in fruits. Acta Hortic., 712: 299–305.
WicKlunD t., rosenFelD H.J., MArtinsen B.K., sunDFør M.W., leA P., Bruun t., BloMHoFF r., HaFFner k. 2005. Antioxidant capacity and colour of strawberry jam as influenced by cultivar and storage conditions. LWT – Food Sci. Technol., 38: 387–391.
WilDMAn r.e.c. 2001. Handbook of nutraceuticals and functional foods. Nutraceuticals: a brief review of historical and teleological aspects. Boca Raton, Florida, USA, CRC Press Taylor & Francis Group.
WoJDyło A., oszMiAńsKi J., BoBer i. 2008. The effect of addition of chokeberry, flowering quince fruits and rhubarb juice to strawberry jams on their polyphenol content, antioxidant activity and colour. Eur. Food Res. Technol., 227: 1043–1051.
Wu x.l., gu l.W., Priori r.l., McKAy s. 2004. Characterization of anthocyanins and proantho-cyanidins in some cultivars of Ribes, Aronia and Sambucus and their antioxidant capacity. J. Agric. Food Chem., 52: 7846–7856.
zHeng W., WAng s.y. 2001. Antioxidant activity and phenolic compounds in selected herbs. J. Agric. Food Chem., 49: 5165–5170.


A COMPARISON OF NUTRITIONAL VALUE OF COLD-PRESSED RAPESEED OILS OBTAINED FROM SEEDS GROWN UNDER CONVENTIONAL
AND ECOLOGICAL CONDITIONS
Małgorzata Wroniak1, Agnieszka Rękas1, Dorota Derewiaka2
1 Department of Food Technology 2 Department of Biotechnology, Microbiology and Food Evaluation
Warsaw University of Life Sciences (WULS-SGGW), Warsaw, Poland
K e y w o r d s: rapeseed, cold-press, conventional agriculture, ecological agriculture, fatty acids, tocopherols, phytosterols.
A b s t r a c t
The fatty acid composition, tocopherols, carotenoids and phytosterol contents of the cold-pressed oils of rapeseeds originated from conventionally produced crops (industrial mixes and seeds of pure cultivars) and ecologically cultivated crops were investigated. The main fatty acids were oleic (60.07–64.44%), followed by linoleic (17.69–20.70%), and α-linolenic (8.07–9.95%). The oils contained γ- and α-tocopherol (29.89–37.37 mg/100 g and 19.33–33.45 mg/100 g, respectively), while the average content of total tocopherols was 58.89 mg/100 g. The concentration of total phytosterols ranged from 420.9 to 651.6 mg/100 g. The dominant phytosterols were β-sitosterol (229.6–316.3 mg/100 g), campesterol (144.2–247.3 mg/100 g), and brassicasterol (42.7–71.4 mg/100 g). The amount of total carotenoids varied from 8.89 to 19.53 mg/kg. Hierarchical cluster analysis (HCA) showed no clear differentiation of oils relying on rapeseeds cultivation method. Differences in the nutritional value between oils resulted more likely from genetic background of rapeseed varieties than cultivation method.
Address: Małgorzata Wroniak, ul. Nowoursynowska 159c, 02-776 Warsaw, Poland, phone: +48 (22) 593 75 26, e-mail: [email protected]
POLISH JOURNAL OF NATURAL SCIENCES Abbrev.: Pol. J. Natur. Sc., Vol 33(3): 401–416, Y. 2018

Małgorzata Wroniak et al. A Comparison of Nutritional Value of Cold-Pressed Rapeseed Oils...402 403
PORÓWNANIE WARTOŚCI ŻYWIENIOWEJ OLEJU RZEPAKOWEGO TŁOCZONEGO NA ZIMNO OTRZYMANEGO Z NASION Z UPRAW
KONWENCJONALNYCH I EKOLOGICZNYCH
Małgorzata Wroniak1, Agnieszka Rękas1, Dorota Derewiaka2
1 Katedra Technologii Żywności 2 Katedra Biotechnologii, Mikrobiologii i Oceny Żywności
Szkoła Główna Gospodarstwa Wiejskiego w Warszawie (SGGW), Polska
S ł o w a k l u c z o w e: rzepak, tłoczenie na zimno, uprawy konwencjonalne, uprawy ekologiczne, kwasy tłuszczowe, tokoferole, sterole.
A b s t r a k t
Celem pracy było zbadanie różnic między olejami tłoczonymi na zimno otrzymanymi z na-sion rzepaku z upraw konwencjonalnych (mieszanek przemysłowych i nasion czystych odmian) i ekologicznych. Analizowane oleje porównano pod względem składu kwasów tłuszczowych oraz zawartości tokoferoli, fitosteroli i karotenoidów. Dominującymi kwasami tłuszczowymi były kwas oleinowy (60,07–64,44%), kwas linolowy (17,69–20,70%) i α-linolenowy (8,07–9,95%). Oznaczony-mi tokoferolami były γ- i α-tokoferol (odpowiednio 29,89–37,37 mg/100 g i 19,33–33,45 mg/100 g), a średnia zawartość tokoferoli ogółem wynosiła 58,89 mg/100 g. Dominującymi fitosterolami były β-sitosterol (229,6–316,3 mg/100 g), kampesterol (144,2–247,3 mg/100 g) i brassikasterol (42,7–71,4 mg/100 g). Zawartość karotenoidów ogółem wynosiła od 8,89 do 19,53 mg/kg. Na pod-stawie wyników uzyskanych z zastosowaniem hierarchicznej analizy skupień (HCA) nie stwier-dzono statystycznie istotnych różnic w wartości żywieniowej między olejami rzepakowymi tłoczo-nymi na zimno z nasion pochodzących z upraw ekologicznych i konwencjonalnych. Głównym czynnikiem różnicującym oleje pod względem wartości żywieniowej była różnorodność genetyczna odmian rzepaku, a nie metoda uprawy rzepaku.
Introduction
Consumer concern regarding possible adverse health effects of foods produced using intensive farming methods has led to considerable interest in the health benefits of organically-produced crops. The major factors affecting the nutrient content of field crops, fruits and vegetables com-prise: genetic background, environmental factors, such as climate con-ditions and planting location, soil factors, management practices and pos-tharvest handling and storage (vLaHakis and HazeBroek 2000). Tillage practices may affect physiological parameters, related to the effects of fatty acid production in the oilseeds. For example, different patterns of nutrient up take under different tillage practices may affect the co-en-zyme functioning of micronutrients and hence oil production in the plant

Małgorzata Wroniak et al. A Comparison of Nutritional Value of Cold-Pressed Rapeseed Oils...402 403
(HocHing 2001). Moreover, climate conditions, mainly temperature, signi-ficantly influences the concentration of the oil in canola seeds (PritcHArD et al. 2000). The amount of oil content in sunflower seeds is also influenced by the duration of flowering period (FLageLLa et al. 2002). JoHnston et al. (2002) reported that the soil moisture influences oil concentration in oil seeds.
Among factors influencing the nutrient content of the crops, manage-ment practices are a matter of major concern, primarily due to groundwa-ter pollution by agricultural chemicals. As a result, there is a growing interest in shifting from high- to low-chemical input systems through alternative practices including integrated pest management or conserva-tion tillage (oMiDi et al. 2010). More radicalstep comprise switching crop production from conventional to ecological or organic farming.
Terms like “ecological” and “organic” have been protected since 1991 by the EU and may only be used for food items produced and certified in compliance with EU Regulation 834/2007 (European Commission 2007). Organic agriculture is defined as “a holistic production management sys-tem which promotes and enhances agro-ecosystem health, including biodi-versity, biological cycles, and soil biological activity. It emphasizes the use of management practices in preference to the use of off-farm inputs, taking into account that regional conditions require locally adapted systems. This is accomplished by using, where possible, agronomic, biological, and mechanical methods, as opposed to using synthetic materials, to fulfil any specific function within the system.” (FAO/WHO Codex Alimentarius Commission 1999). In turn, ecological farming, also known as sustainable agriculture, has been defined as “an integrated system of plant and animal production that will last over the long time, satisfy human food needs, enhance natural resources, use efficiently of non-renewable resources, sustain economic viability of farms and enhance the quality of life for far-mers and society as a whole. It is the practice of farming using principles which respect ecology and save natural resources” (Fao/wHo). Hence, it can be stated that ecological farming relies on organic practices, but it’s not strictly organic (MAgDoFF 2007).
Over the past few years, the relationship between agricultural practi-ces and the nutritional quality of food was widely discussed (wortHing-ton 1998, Bourn and Prescott 2002, wiLLiaMs 2002, györéné et al. 2006, DAngour et al. 2009). Systematic reviews on this topic, however, are inconsistent and misleading. By some authors there is a little or no diffe-rence in nutrition value of organic vs. conventional foods (DAngour et al. 2009, BrAnDt et al. 2011), while the others found that organic and non-or-ganic foods are compositionally different (PADDocK 2014).

Małgorzata Wroniak et al. A Comparison of Nutritional Value of Cold-Pressed Rapeseed Oils...404 405
There is no data in the literature about the effects of rapeseed cultiva-tion method on the nutritional value of the resulting cold-pressed oil. Thus, the purpose of this study was to compare the nutritional value of cold-pres-sed rapeseed oil obtained from seeds grown under ecological and conven-tional conditions.
Material and Methods
Materials
Seeds of double improved rapeseed from conventional and ecological farming were collected from different regions of Poland. Seeds of individ-ual rapeseed cultivars, namely: Starter, Monolit, Bojan, and Bogart (No. 1–4) were provided by the by the Plant Breeding Strzelce Ltd. Co. – IHAR Group, Poland. Industrial mixes of conventionally cultivated rape-seed crops, collected from grain elevators from various regions of Poland, i.e. Lubelskie, Mazowieckie, Śląskie, Opolskie and Wielkopolskie Prov-inces (No. 5–12). Certified ecological rapeseeds originated from individual farmers from Lubelskie Provinces (No. 13–15). All seeds came from the collections from 2013 and 2014.
Oil extraction by cold-pressing
Portions of particular batches of seeds were cold-pressed in a screw--press with a nozzle diameter of 8 mm (Farmer 10, Farmet, Czech Repu-blic). The temperature inside the press was 60 ± 10°C, and the temperature of the outflowing oil was 39 ± 1°C. After pressing oil was collected, subjec-ted to natural decantation and analysed within one week since pressing.
Chemicals and solvents
Analytical standards of γ- and α-tocopherols, a high purity standard of 5α-cholestane, HPLC-grade n-hexane, methanol, acetonitrile (ACN), methyl tert-butyl ether (MtBE), pyridine, and Sylon BTZ were purchased from Sigma-Aldrich (St. Louis, MO, USA).
Fatty acid composition
Fatty acid methyl esters (FAME) were prepared following AOCS (Offi-cial Method Ce 1k-07… 1993). The diluted FAME (1 µl of the sample) were separated on a GC–MS system (Agilent 6890N GC; Agilent Technologies,

Małgorzata Wroniak et al. A Comparison of Nutritional Value of Cold-Pressed Rapeseed Oils...404 405
Santa Clara, CA, USA) equipped with a BPX 70 capillary column (60 m length, 0.22 mm i.d., 0.25 μm film thickness) and flame-ionisation detector (FID). Helium was used as a carrier gas at a flow rate of 1.5 ml min-1. A split/splitless injector was operated at a temperature of 230°C with a split rate set to 100:1, and the detector was set at 250°C. The GC’s oven temperature was programmed as follows: 80°C hold for 2 min, ramped to 230°C at a rate of 2.5°C min-1, hold for 5 min. Fatty acids were identified by comparing their retention times with authentic standards, and the results were reported as weight percentages.
Determination of tocopherols
A sample of 0.2 g of oil was dissolved in 5 ml of ACN/MtBE mixture (4:6 by vol.). The mixture was filtered through a micro syringe filter (titan PTFE 0.2 µm). Then, 5 µl of the sample was injected into a VP Shimadzu HPLC system coupled with DAD detector (SPD-M10AVP, Shimadzu, Japan) and FLD detector (RF-10AXL, Shimadzu, Japan), reversed phase octadecyl silica Gemini C 18 column (150 mm × 2 mm × 3 μm) (Phenomenex Torrance, CA, USA) and suitable guard column. The isocratic mobile phase was a mixture of ACN and MtBE (4:6 v/v) at a flow rate of 0.15 ml min-1, and the column oven temperature was 35°C. Tocopherols were detected by standard UV spectrum analysis (190–370 nm). Quantification of tocophe-rols was conducted using data from the FLD detector with excitation/emis-sion wavelengths of 290/330 nm, respectively. The range of calibration curves for α-tocopherol 0.0–3.0 µg, R2 = 0.9926, for γ-tocopherol 0.0–2.0 µg, R2=0.9930. All samples were analysed in triplicate and the tocopherol/oil ratio was expressed in mg/100 g.
Determination of phytosterols
Phytosterols were determined following procedures described by the AOCS (Official Method Ch 6–91 1993). In brief, a 50-mg oil sample was saponified with 1 M methanolic KOH at room temperature for 18 h. Then, 700 μl of unsaponified fraction was transferred into 1.5 ml vial and the solvent was evaporated to dryness under nitrogen. Dry residues were dis-solved in 200 μl pyridine and silylated with 800 μl of Sylon BTZ. Derivati-ves of the sterols were separated on a GCMS-QP2010S (Shimadzu, Japan) equipped with a DB‐5MS capillary column (30 m × 0,25 mm × 0,25 µm; Phenomenex Torrance, CA, USA). A 1 μl of the sample was injected into a GC– MS system (setup: He carrier gas at 0.9 ml min-1 constant flow rate, split/splitless injector at 230°C in the splitless mode, GC–MS interface temperature 240°C, ion source temperature 220°C). Oven temperature:

Małgorzata Wroniak et al. A Comparison of Nutritional Value of Cold-Pressed Rapeseed Oils...406 407
50°C hold for 2 min, ramped to 230°C at 15°C min-1, ramped to 310°C at 3°C min-1, hold for 10 min. All sterols were quantified using a 5α-chole-stane as an internal standard.
Determination of total carotenoids
Total carotenoid pigments, expressed as β-carotene, were assayed spectrophotometrically for oil samples diluted in cyclohexane at 445 nm (BSI 1977).
Statistical analysis
All experiments were carried out in triplicate. Variables were compa-red by one-way ANOVA, when the variables fulfilled parametric con-ditions, or by the Kruskal-Wallis test when these were non-parametric, using Statgraphics 4.1 software (Statpoint Technologies Inc., Warrenton, VA, USA). Significant differences between means were determined thro-ugh Duncan’s Multiple Range Tests. P values less than 0.05 were conside-red as statistically significant. Additionally, data were subjected to hierar-chical cluster analysis (HCA) applying XLSTAT software (Addinsoft, Paris, France; version 2014.6.04).
Results
Fatty acid composition of oils
Fatty acids composition is the most important parameter for quality evaluation of edible oils. The FAs composition of all oils analysed (Table 1) was within Codex Alimentarius limits specified for rapeseed/canola oil. All tested samples contained similar FA compositions which included palmitic acid (C16:0), palmitoleic acid (C16:1), stearic acid (C18:0), oleic acid (C18:1), linoleic acid (C18:2), α-linoleic acid (C18:3), eicosanoic acid (C20:0), eicosenoic acid (C20:1), heneicosanoic acid (C20:2), docosanoic acid (C22:0), erucicacid (C22:1), tetracosanoic acid (C24:0), and tetracosenoic acid (C24:1). In total, the respective concentration of the SFAs, MUFAs and PUFAs ranged from 6.2% to 7.32%, from 61.87% to 66.37%, and from 25.88% to 30.64%, respectively. Predominant FAs in tested rapeseed oil samples were oleic acid (60.07–64.44%), followed by linoleic acid (17.69–20.70%) and α-linolenic acid (8.07–9.95%). A typical trait of rape-seed oil is the presence of erucic acid, its content in the analysed samples ranged from 0.02 to 0.72%, which is consistent with current requirements.

Małgorzata Wroniak et al. A Comparison of Nutritional Value of Cold-Pressed Rapeseed Oils...406 407Ta
ble
1Fa
tty
acid
s co
mpo
sitio
n [%
] of c
old-
pres
sed
rape
seed
oils
Oil
Fatt
y ac
id [%
]n6
/n3
16:0
16:1
18:0
18:1
18:2
18:3
20:0
20:1
20:2
22:0
22:1
24:0
24:1
Seed
s of
indi
vidu
al c
ultiv
ars
14.
440.
24
1.60
60
.07
20.3
1 9.
60
0.57
1.
58
0.10
0.
34
0.52
0.
13
0.17
2.
1 2
4.36
0.
24
1.63
60
.35
20.7
0 9.
85
0.55
1.
25
0.09
0.
32
0.03
0.
10
0.14
2.
1 3
4.34
0.
22
1.89
60
.86
19.2
8 9.
94
0.58
1.
52
0.10
0.
37
0.32
0.
11
0.14
1.
9 4
4.20
0.
22
1.69
61
.44
18.9
4 9.
56
0.58
1.
58
0.09
0.
35
0.72
0.
14
0.17
2.
0 x
4.34
B0.
23 A
1.70
A60
.68
A19
.81
B9.
74 B
0.57
A1.
48 A
0.10
A0.
35 A
0.40
A0.
12 A
0.16
A2.
03 A
Indu
stri
al m
ixes
of s
eeds
from
con
vent
iona
l cro
ps5
4.44
0.
23
1.69
61
.78
19.4
5 8.
68
0.59
1.
53
0.09
0.
33
0.57
0.
12
0.15
2.
2 6
4.09
0.
23
1.68
63
.21
18.3
2 8.
70
0.57
1.
60
0.08
0.
29
0.66
0.
12
0.13
2.
1 7
4.18
0.
23
1.75
63
.04
18.5
6 9.
07
0.58
1.
35
0.08
0.
29
0.26
0.
12
0.12
2.
0 8
4.20
0.
22
1.66
62
.37
18.8
1 9.
66
0.60
1.
37
0.09
0.
34
0.09
0.
14
0.15
1.
9 9
4.17
0.
23
1.54
63
.00
18.5
0 9.
05
0.54
1.
51
0.09
0.
29
0.50
0.
10
0.12
2.
0 10
3.82
0.
22
2.13
64
.44
17.6
9 8.
11
0.73
1.
48
0.08
0.
41
0.23
0.
23
0.17
2.
2 11
4.01
0.
22
1.77
61
.46
19.3
6 9.
95
0.62
1.
42
0.09
0.
33
0.16
0.
15
0.15
1.
9 12
4.36
0.
24
1.57
63
.58
18.1
5 9.
27
0.54
1.
27
0.08
0.
30
0.12
0.
12
0.13
2.
0 x
4.16
AB
0.23
A1.
72 A
62.8
6 B
18.6
1 A
9.06
AB
0.60
A1.
44 A
0.09
A0.
32 A
0.32
A0.
14 A
0.14
A
2.04
ACe
rtifi
ed e
colo
gica
l see
ds13
4.67
0.
24
1.53
62
.46
19.5
0 9.
02
0.52
1.
15
0.07
0.
28
0.02
0.
13
0.10
2.
2 14
3.65
0.
17
1.89
63
.69
19.0
7 8.
07
0.63
1.
43
0.09
0.
33
0.32
0.
18
0.16
2.
4 15
3.52
0.
23
1.72
62
.94
19.1
5 8.
89
0.56
1.
53
0.06
0.
26
0.65
0.
14
0.13
2.
2 x
3.95
A0.
21 A
1.
71 A
63.0
3 B
19.2
4 AB
8.66
A0.
57 A
1.37
A0.
07 A
0.29
A0.
33 A
0.15
A
0.13
A
2.27
BM
ean
valu
es d
enot
ed b
y th
e sa
me
lett
er in
the
colu
mns
do
not c
onst
itute
sta
tistic
ally
sig
nific
ant d
iffer
ence
s at
p <
0.0
5.

Małgorzata Wroniak et al. A Comparison of Nutritional Value of Cold-Pressed Rapeseed Oils...408 409
Statistical analysis revealed differences between oils in terms of fatty acid composition. As can be seen from Table 1, oils pressed from ecological certified seeds and industrial mixes of seeds contained similar share of oleic acid (61.46–64.44% range) and linoleic and α-linoleic acids (17.69–19.50% range; 8.07–9.95% range, respectively). In turn, oils deri-ved from individual cultivars (No 1–4) contained the lowest share of oleic acid (60.07–61.44% range) and, on average, the highest of linoleic and α-linoleic acid (approx. 19.81% and 9.74%, respectively).
The content of tocopherols in oils
As can be seen from Table 2, analysed oils were characterized by highly diversified contents of individual and total tocopherols. The concentra- tion of total tocopherols ranged from 51.73 to 70.30 mg/100 g. γ-Toco- pherol homologue was the predominant tocopherol (30.30–37.37 mg/100 g), followed by α-tocopherol homologue (19.33–33.34 mg/100 g). In our study the ratio of γ to α-tocopherol varied from 52.42–64.50% to 35.50–47.58%.
Table 2 Tocopherols concentration [mg/100 g] in the analysed cold-pressed rapeseed oils
Oil sourceTocopherol contents [mg/100 g]
γ-T α-T total
Seeds of individual cultivars
1 37.37 ± 0.70e 24.86 ± 0.17b 62.23 ± 0.53h
2 35.75 ± 0.49c 27.96 ± 0.08d 63.71 ± 0.41h
3 33.86 ± 0.61b 21.15 ± 0.67b 55.01 ± 0.06d
4 36.75 ± 1.01d 27.37 ± 1.74d 64.12 ± 0.73i
x 35.93 ± 0.9 A 25.33 ±1.44 A 61.26 1.97 A
Industrial mixes of seeds from conventional crops
5 37.34 ± 0.74e 32.34 ± 0.89e 69.68 ± 1.63j
6 31.94 ± 1.75a 19.79 ± 1.83a 51.73 ± 0.08a
7 33.88 ± 1.41b 19.33 ± 0.68a 53.21 ± 0.73c
8 31.51 ± 0.55a 26.92 ± 0.52c 58.43 ± 1.07f
9 30.90 ± 1.75a 21.61 ± 0.10b 52.51 ± 1.85b
10 36.65 ± 0.35d 20.17 ± 0.29a 56.82 ± 0.06e
11 36.08 ± 1.12d 24.57 ± 0.58b 60.65 ± 1.70g
12 32.88 ± 0.98b 24.93 ± 0.80b 57.81 ± 1.77f
x 33.90 ±0.6 A 23.71 ±1.02 A 57.60 ±1.39 A

Małgorzata Wroniak et al. A Comparison of Nutritional Value of Cold-Pressed Rapeseed Oils...408 409
Certified ecological seeds
13 30.30 ± 0.12a 23.68 ± 1.29b 53.99 ± 1.18c
14 36.33 ± 0.10d 24.25 ± 0.65b 60.58 ± 0.55g
15 36.85 ± 0.79d 33.45 ± 0.15e 70.30 ± 0.63j
x 34.50 ±1.0 A 27.13 ±1.67 A 61.62 ±2.27 AMean values denoted by the same letter in the columns do not constitute statistically significant differe nces at p < 0.05; (n = 2×3).
The results showed a wide variability in the content and distribution of tocopherols in the analysed groups of oils. Within group of oils pressed from individual rapeseed cultivars the lowest γ- and α-tocopherol homo-logue concentration of 33.86 and 21.15 mg/100 g was in sample No. 3 (cv. Bojan). Oil sample No. 4 (cv. Bogart) contained the highest concentra-tion of γ-tocopherol (27.37 mg/100 g), while the highest α-tocopherol con-tent of 37.37 mg/100 g was detected in oil sample No. 1 (cv. Starter). The concentration of γ-tocopherol homologue within group of oils pressed from industrial mixes of rapeseeds ranged from 30.90 to 37.34 mg/100 g, while α-tocopherol was within range of 19.33–24.93 mg/100 g. The concentration of γ-tocopherol in oils produced from ecological certified seeds ranged from 30.30 to 36.85 mg/100 g, whereas the content of α-tocopherol varied from 23.68 to even 33.45 mg/100 g.
The content of phytosterols in oils
The amount of total phytosterols identified in the analysed oils was diversified and fitted within wide ranges from 420.9 to 651.3 mg/100 g (Table 3). The composition of individual phytosterols was predominated by β-sitosterol (219.8–316.3 mg/100 g) and campesterol (129.0–247.3 mg/100), whereas substantially lower content was determined for brassicasterol (42.7–77.9 mg/100 g), and other sterols, namely Δ5-avenasterol, stigmas-terol and cholesterol.
Within the group of oils pressed from individual rapeseed cultivars the total content of phytosterols was in the rage of 504.5–651.3 mg/100 g. The amount of total phytosterols in oils obtained from industrial mixes of seeds ranged from 480.5 to 581.9 mg/100 g. The lowest content of total phytoste-rols within the group of oils from ecological seeds was 420.9 mg/100 g, while the highest – 602.7 mg/100 g.

Małgorzata Wroniak et al. A Comparison of Nutritional Value of Cold-Pressed Rapeseed Oils...410 411Ta
ble
3 Ph
ytos
tero
ls c
once
ntra
tion
(mg/
100g
) in
the
anal
ysed
col
d-pr
esse
d ra
pese
ed o
ils
Oil
sour
cePh
ytos
tero
l con
tent
s [m
g/10
0 g]
chol
este
rol
bras
sica
ster
olca
mpe
ster
olst
igm
aste
rol
β-si
tost
erol
Δ5-a
vena
ster
olto
tal
Seed
s of
indi
vidu
al c
ultiv
ars
12.
1 ±
0.01
b71
.4 ±
0.0
5h24
4.3
± 1.
52k
2.3
± 0.
02f
316.
3 ±
1.03
i15
.2 ±
0.0
5g65
1.3
± 2.
01k
22.
6 ±
0.01
b61
.9 ±
0.0
4f24
7.3
± 2.
01l
1.7
± 0.
01c
302.
5 ±
1.08
h15
.3 ±
0.0
2g63
1.3
± 4.
52j
31.
8 ±
0.01
a77
.0 ±
0.0
1i17
5.3
± 0.
94c
2.6
± 0.
03g
293.
8 ±
5.62
g14
.6 ±
0.0
4f56
7.4
± 5.
11g
42.
3 ±
0.03
b65
.0 ±
1.0
3g19
3.4
± 1.
11e
1.9
± 0.
01d
229.
6 ±
5.21
b12
.8 ±
0.0
4d50
4.5
± 4.
61c
x2.
2 ±0
.2 A
69.3
±2.
7 A
214.
9±10
.2 B
2.1
±0.1
A28
5.5
±9.2
A14
.5 ±
1.0
A58
8.5
±18.
6 B
CIn
dust
rial
mix
es o
f see
ds fr
om c
onve
ntio
nal c
rops
53.
8 ±
0.01
c66
.1 ±
2.0
5g21
0.8
± 1.
03g
2.2
± 0.
02e
282.
9 ±
6.71
f12
.8 ±
1.0
3d57
8.5
± 4.
58h
61.
6 ±
0.01
a42
.7 ±
0.0
9a22
1.1
± 2.
40i
1.8
± 0.
02d
283.
4 ±
4.43
f9.
5 ±
0.01
a56
0.1
± 7.
15g
72.
0 ±
0.01
b59
.7 ±
0.0
7e20
3.4
± 5.
93f
1.5
± 0.
01b
266.
4 ±
8.73
d16
.8 ±
1.0
0h54
9.4
± 6.
11f
81.
8 ±
0.01
b57
.0 ±
1.3
0d19
5.2
± 5.
72e
1.7
± 0.
01c
278.
6 ±
5.30
e13
.1 ±
0.0
3e54
7.1
± 2.
35f
91.
6 ±
0.02
a62
.3 ±
2.0
1f21
8.1
± 9.
02h
1.3
± 0.
01a
286.
6 ±
1.35
f12
.1 ±
0.0
6d58
1.9
± 2.
13h
101.
5 ±
0.01
a52
.7 ±
0.0
9c14
4.2
± 2.
11b
1.9
± 0.
01d
269.
4 ±
4.23
d11
.2 ±
0.0
5c48
0.5
± 6.
10b
112.
0 ±
0.01
b60
.8 ±
0.0
5e18
4.3
± 4.
50d
1.8
± 0.
01d
273.
6 ±
5.19
e12
.3 ±
0.0
8d53
4.5
± 1.
33e
122.
2 ±
0.01
b48
.4 ±
0.0
5b21
9.5
± 0.
72h
1.6
± 0.
01b
288.
4 ±
2.00
f20
.8 ±
0.0
1i58
0.9
± 2.
23h
x2.
1 ±0
.1 A
56.2
±1.
9 B
199.
5±7.
2 AB
1.7
±0.1
A27
8.6
±6.5
A13
.5 ±
0.7
A55
1.6
±13.
1 AB
Cert
ified
eco
logi
cal s
eeds
132.
5 ±
0.02
b77
.9 ±
0.0
8i19
6.5
± 2.
81e
1.6
± 0.
01b
307.
4 ±
4.39
h16
.9 ±
0.0
1h60
2.7
± 8.
15i
142.
0 ±
0.01
b57
.1 ±
1.4
2d12
9.3
± 4.
28a
2.6
± 0.
01g
219.
8 ±
8.11
a10
.5 ±
0.0
6b42
0.9
± 4.
30a
152.
0 ±
0.01
b66
.8 ±
0.3
2g19
2.4
± 2.
10e
1.7
± 0.
02c
235.
7 ±
3.53
c13
.9 ±
0.0
4e51
2.6
± 5.
90d
x2.
1 ±0
.2 A
67.3
±3.
1 A
172.
6±11
.7 A
2.0
±0.1
A25
4.3
±10.
7 A
13.8
±1.
1 A
512.
1 ±2
1.5
AM
ean
valu
es d
enot
ed b
y th
e sa
me
lett
er in
the
colu
mns
do
not c
onst
itute
sta
tistic
ally
sig
nific
ant d
iffer
ence
s at
p <
0.0
5; (n
= 2
×3).

Małgorzata Wroniak et al. A Comparison of Nutritional Value of Cold-Pressed Rapeseed Oils...410 411
The content of β-sitosterol within the group of oils pressed from indivi-dual seeds, industrial mixes of seeds and ecological seeds was in the range of 229.6–316.3 mg/100 g, 266.4–288.4 mg/100 g, and 307.4–219.8 mg/100 g, respectively. The respective variation in the amount of campesterol ran-ged from 175.3 to 247.3 mg/100 g, from 144.2 to 219.5 mg/100 g, and from 129.3 to 196.5 mg/100 g. The average content of brassicasterol was 56.2 mg/100 g for oils obtained from individual rapeseed cultivars, and 67–68 mg/100 g for the other two groups of oils.
The content of total carotenoids in oils
Analysis of total carotenoids, in addition to tocopherols and phytoster-ols content, also highlighted differences between analysed oils. The amount of total carotenoids varied from 8.89 to 19.53 mg/kg (Figure 1). Within the group of oils pressed from individual rapeseed cultivars the amount of total carotenoids was in the range of 10.61–16.78 mg/kg. The content of total carotenoids on oils obtained from mixes of industrial seeds ranged from 8.89 to 15.01 mg/kg. The highest content of total carotenoids was determined in oils pressed from ecological seeds, where the average con-tent of carotenoids was 16.4 mg/kg.
Multivariate statistical analysis
To investigate the effect of seeds origin (conventional and ecological cultivation) on the chemical composition of the obtained cold-pressed oils the data were subjected to hierarchical cluster analysis (HCA). Although
Fig. 1. Total carotenoids content [mg/kg] of cold-pressed rapeseed oils produced from conventional-ly and ecologically grown seeds. Sample codes: cold-pressed rapeseed oils produced from – indivi-dual seeds cultivars (1–4); industrial seeds from conventional crops (5–12); certified ecological
seeds (13–15).

Małgorzata Wroniak et al. A Comparison of Nutritional Value of Cold-Pressed Rapeseed Oils...412 413
dendrogram formed using the complete linkage clustering with Euclidean distances showed differences between individual oil samples, no correla-tion between seeds origin and chemical composition (fatty acid composi-tion, the content of tocopherols, phytosterols, and carotenoids) of the oils tested was found. Figure 2 shows the resulted dendrogram, where 2 dis-tinct clusters can be identified. Cluster 1 contains both cold-pressed oils derived from rapeseed cv. Bogart (No. 4), mix of industrial seeds (No. 10),
and certified ecological seeds (No. 14, 15). Second cluster contains two sub-clusters: first consisting of most of the oils produced from industrial mix of seeds (No. 5–9, 11–12), while second joins oil samples obtained from rapeseed cv. Starter (No. 1) and Monolit (No. 2).
Discussion
The predominating MUFA in the analysed rapeseed oil samples was oleic acid, the content of which is lower only compared to olive oil (74–78%), but remarkably higher compared to other typical edible oils. A high con-tent of this fatty acid is also acknowledged as a highly desirable trait owing to its positive anti-atherosclerotic effect (DuBois et al. 2007). PUFA was predominated by α-linoleic acid, that belongs to the most valuable group
Fig. 2. Hierarchical cluster analysis (HCA) dendrogram of oils produced from ecologically and co-nventionally grown seeds of rape, grouped using the complete linkage clustering (the farthest ne-ighbour clustering) with Euclidean distances. Sample codes: cold-pressed rapeseed oils produced from – individual seeds cultivars (1–4); industrial seeds from conventional crops (5–12); certified
ecological seeds (13–15)
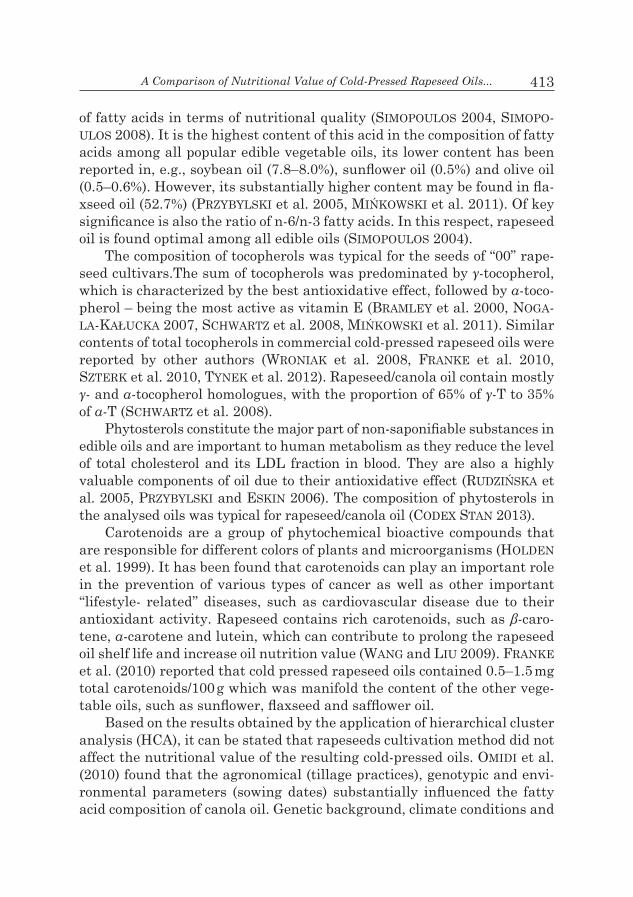
Małgorzata Wroniak et al. A Comparison of Nutritional Value of Cold-Pressed Rapeseed Oils...412 413
of fatty acids in terms of nutritional quality (siMoPouLos 2004, siMoPo-uLos 2008). It is the highest content of this acid in the composition of fatty acids among all popular edible vegetable oils, its lower content has been reported in, e.g., soybean oil (7.8–8.0%), sunflower oil (0.5%) and olive oil (0.5–0.6%). However, its substantially higher content may be found in fla-xseed oil (52.7%) (PrzyBylsKi et al. 2005, MińKoWsKi et al. 2011). Of key significance is also the ratio of n-6/n-3 fatty acids. In this respect, rapeseed oil is found optimal among all edible oils (siMoPouLos 2004).
The composition of tocopherols was typical for the seeds of “00” rape-seed cultivars.The sum of tocopherols was predominated by γ-tocopherol, which is characterized by the best antioxidative effect, followed by α-toco-pherol – being the most active as vitamin E (BrAMley et al. 2000, noga-lA-KAłucKA 2007, scHWArtz et al. 2008, MińKoWsKi et al. 2011). Similar contents of total tocopherols in commercial cold-pressed rapeseed oils were reported by other authors (wroniak et al. 2008, Franke et al. 2010, szterk et al. 2010, tyneK et al. 2012). Rapeseed/canola oil contain mostly γ- and α-tocopherol homologues, with the proportion of 65% of γ-T to 35% of α-T (scHWArtz et al. 2008).
Phytosterols constitute the major part of non-saponifiable substances in edible oils and are important to human metabolism as they reduce the level of total cholesterol and its LDL fraction in blood. They are also a highly valuable components of oil due to their antioxidative effect (ruDzińsKA et al. 2005, PrzyBylsKi and eskin 2006). The composition of phytosterols in the analysed oils was typical for rapeseed/canola oil (coDex stAn 2013).
Carotenoids are a group of phytochemical bioactive compounds that are responsible for different colors of plants and microorganisms (HolDen et al. 1999). It has been found that carotenoids can play an important role in the prevention of various types of cancer as well as other important ‘‘lifestyle- related’’ diseases, such as cardiovascular disease due to their antioxidant activity. Rapeseed contains rich carotenoids, such as β-caro-tene, α-carotene and lutein, which can contribute to prolong the rapeseed oil shelf life and increase oil nutrition value (wang and Liu 2009). Franke et al. (2010) reported that cold pressed rapeseed oils contained 0.5–1.5 mg total carotenoids/100 g which was manifold the content of the other vege-table oils, such as sunflower, flaxseed and safflower oil.
Based on the results obtained by the application of hierarchical cluster analysis (HCA), it can be stated that rapeseeds cultivation method did not affect the nutritional value of the resulting cold-pressed oils. oMiDi et al. (2010) found that the agronomical (tillage practices), genotypic and envi-ronmental parameters (sowing dates) substantially influenced the fatty acid composition of canola oil. Genetic background, climate conditions and

Małgorzata Wroniak et al. A Comparison of Nutritional Value of Cold-Pressed Rapeseed Oils...414 415
planting location were found to affect phytosterols content and composi-tion in rapeseed, sunflower and soybean oils in the study conducted by vLaHakis and HazeBroek (2000). Thus, differences in the nutritional value between analysed oils resulted more likely from combined effect of rapeseed genotypes and cultivation conditions than from rapeseeds cul-tivation method.
A limited number of studies have compared the nutrient compositions of ecologically- and conventionally-produced crops. Aconsiderable number of studies is focused on the relationship between organic and conventional food production systems and the nutritional value of food products. For individual nutrients, existing studies show that organic fertilization prac-tices produce crops with higher levels of ascorbic acid, lower levels of nitrate, and improved protein quality, compared with conventionally grown crops (wortHington 19980. györéné et al. (2006) found that organic crops contained a significantly higher amount of certain antioxi-dants (vitamin C, polyphenols and flavonoids) and minerals, as well as have higher dry matter content than conventional ones. However, DAn-gour et al. (2009), on the basis of systematic review of 162 studies (137 crops and 25 livestock products), with only 55 studies of satisfactory quality selected for further analysis, stated that there is no evidence of a difference in nutrient quality between organically and conventionally produced foodstuffs. Moreover, the authors assumed that slight differen-ces in nutrient content detected are biologically plausible and mostly relate to differences in production methods.
Although a theoretical rationale exists for possible effects of herbicides or pesticides on nutrient content, few studies have examined the effects of these contaminants on the quality of cold-pressed vegetable oils (JAnKoW-ski et al. 1998, yAgüe et al. 2005, roszko et al. 2012). Thus, the evaluation of the residual content of contaminants, such as polycyclic aromatic hydro-carbons (PAHs), polychlorinated biphenyls (PCBs), heavy metals and most importantly pesticides is of great importance in order to assess the effect of rapeseed cultivation method on the quality differences between cold-pres-sed oils produced from ecologically and conventionally grown seeds.
Conclusions
Cold-pressed rapeseed oils were of high quality, the fatty acid compo-sition and the concentration of tocopherols and phytosterols were within Codex Alimentarius limits. Although some differences were found between rapeseed oils pressed from conventional and ecological seeds, results obta-

Małgorzata Wroniak et al. A Comparison of Nutritional Value of Cold-Pressed Rapeseed Oils...414 415
ined by applying hierarchical cluster analysis (HCA) showed no consistent difference between the overall nutritional value of the analysed oils. Genetic diversity of rapeseed varieties used in the study, in addition to environmental parameters, was the major factor differentiating the oils in terms of nutritional value. In conclusion, results obtained in this study does not support the tenet that ecological cold-pressed rapeseed oils are of a higher nutritional quality than their conventional counterparts.
Translated by AgnieszKA ręKAsAccepted for print 25.04.2018
ReferencesAOCS. 1993. Method Ce 1k-07 and Method Ch 6–91. In: Official Methods Recommended Practices
of the American Oil Chemistry Society. Ed. D. Firestone, 4th ed. AOCS Press, Champaign, pp. 6–91.
Bourn D., Prescott J. 2002. A comparison of the nutritional value, sensory qualities, and food safety of organically and conventionally produced foods. Crit. Rev. Food Sci. Nutr., 42: 1–34.
BrAMley P.M., elMADFA i., KAFAtos A., Kelly F.J., MAnios y., roxBorougH H.e., scHucH W., sHeeHy P.J.A., WAgner K.H. 2000. Review vitamin E. J. Sci. Food Agric., 80: 913–938.
BrAnDt K., leiFert c., sAnDerson r., seAl c.J. 2011. Agroecosystem management and nutritio-nal quality of plant foods. The case of organic fruits and vegetables. Critical Rev. Plant Sci., 30:1–2, 177–197.
coDex stAn. 2013. Codex standard for named vegetable oil. FAO/WHO, Rome (CODEX STAN 210-1999).
coDex stAn. 1999. Committee on Agriculture. Organic Agriculture. FAO/WHO, Rome (coAg/99/9 rev.1.).
DAngour A.D., DoDHiA s.K., HAyter A., Allen e., locK K., uAuy r. 2009. Nutritional quality of organic foods: a systematic review. Am. J. Clin. Nutr., 90: 680–685.
DuBois v., Breton s., linDer M., FAnni J., PArMentier M. 2007. Fatty acid profiles of 80 vege-table oils with regard to their nutritional potential. Eur. J. Lipid Sci. Technol., 109: 710–732.
European Council Regulation (EC) No. 834/2007 of 28 June 2007 on organic production and labelling of organic products and Repealing Regulation (EEC) No 2092/9. euroPeAn coMis-sion.
FlAgellA z., rottunno t., tArAntion e., Di cAterinA r., De cAro A. 2002. Changes in seed yield and oil fatty acid composition of high oleic sunflower (Helianthus annuus L.) hybrids in relation to the sowing date and the water regime. Eur. J. Agron., 17: 221–230.
FrAnKe s., FröHlicH K., Werner s., BöHM v., scHöne F. 2010. Analysis of carotenoids and vitamin E in selected oilseeds, press cakes and oils. Eur. J. Lipid Sci. Technol., 112: 1122–1129.
györéné K.g., vArgA A., lugAsi A. 2006. A comparison of chemical composition and nutritional value of organically and conventionally grown plant derived foods. Orv. Hetil., 147: 2081–2090.
HocHing P.J. 2001. Effect of sowing time on nitrate and total nitrogen con-centrations in field-grown canola (Brassica napus L.), and implications for plant analysis. J. Plant Nutr., 24: 43–59.
HolDen J.M., elDriDge A.l., BeecHer g.r.1999. Carotenoid content of U.S. food: An update of the database. J. Food Comp. Anal., 12(3):169–196.
JAnKoWsKi P., KArPińsKi r., cozel A., Krygier K., cieślAK B., BArtniKoWsKA e., oBieDzińsKi M.w.1998. Comparison of the content of selected contaminants in cold pressed vegetable oils and refined oils. Oilseed Crops, 19: 279–292.

Małgorzata Wroniak et al. A Comparison of Nutritional Value of Cold-Pressed Rapeseed Oils...416 OR
JoHnston A.M., tAnAKA D.l., Miller P.r., BrAnDt s.A., nielsen D.c., lAnFonD g.P., rive-lAnD n.r. 2002. Oilseed crops for semiarid cropping systems in the Northern Great Plains. Agron. J., 94: 231–240.
MAgDoFF F. 2007. Ecological agriculture: principles, practices, and constraints. Renewable Agric. Food Sys., 22, 109–117.
Methods of analysis of fats and fatty oils. Other methods. Determination of carotene in vegetable oils. BSI 684-2.20.1977. British Standards Institution, London.
MińKoWsKi K., grześKieWicz s., JerzeWsKA M. 2011. Ocena wartości odżywczej olejów roślin-nych o dużej zawartości kwasów linolenowych na podstawie składu kwasów tłuszczowych, tokoferoli i steroli. Żywność. Nauka. Technologia. Jakość, 75: 124–135.
nogAlA-KAłucKA M. 2007. Tokochromanole – biosynteza, struktura i właściwości fizykochemicz-ne. In: Przeciwutleniacze w żywności. Aspekty zdrowotne, technologiczne, molekularne i anali-tyczne. Ed. W. Grajek. WNT, Warszawa, pp. 177–184.
oMiDi H., tAHMAseBi z., BADi H.A.n., torABi H., MirAnsAri M. 2010. Fatty acid composition of canola (Brassica napus L.), as affected by agronomical, genotypic and environmental para- meters. C.R. Biologies, 333: 248–254.
PADDocK c. 2014. Organic and non-organic foods are compositionally different. Medical News Today. Information of Diet and Health Based on Scientific Evidence. http://www.medicalnew-stoday.com/articles/279564.php, access: 20.04.2018.
PricHArD F.M., eAgles H.A., norton r.M., sAlisBury s.A., nicolAs M. 2000. Environmental effects on seed composition of Victorian canola. Aust. J. Exp. Agric., 40: 679–685.
PrzyBylsKi r., esKin n.A.M. 2006. Minor components and the stability of vegetable oils, IN-FORM, 17: 187–189.
roszKo M., szterK A., szyMczyK K., WAszKieWicz-roBAK B. 2012. PAHs, PCBs, PBDEs and pesticides in cold-pressed vegetable oils. J. Am. Oil Chem. Soc., 89: 389–400.
ruDzińsKA M., ucHMAn W., WąsoWicz e. 2005. Plant sterols in food technology. Acta Sci. Pol. Technol. Aliment., 4: 147–156.
scHWArtz H., ollilAinen v., Piironen v., lAMPi A. 2008.Tocopherol, tocotrienol and plant sterol contents of vegetable oils and industrial fats. J. Food Comp. Anal., 21: 152–161.
siMoPouLos a.P. 2004. Omega-6/omega-3 essential fatty acid ratio and chronic diseases. Food Rev. Int., 20: 77–90.
siMoPouLos a.P. 2008. The importance of the omega-6/omega-3 fatty acid ratio in cardiovascular disease and other chronic diseases. Exp. Biol. Med., 233: 674–688.
wang L., Liu Y. 2009. Optimization of solvent extraction conditions for total carotenoids in rape-seed using response surface methodology. Nat. Sci., 1: 23–29.
szterK A., roszKo M., sosińsKA e., DereWiAKA D., leWicKi P.P. 2010. Chemical composition and oxidative stability of selected plant oils. J. Am. Oil Chem. Soc., 87: 637–645.
tyneK M., PAWłoWicz r., groMADzKA J., tylingo r.,WArDecKi W., KArlovits g. 2012. Virgin rapeseed oils obtained from different rape varieties by cold pressed method – their characteris-tics, properties and differences. Eur. J. Lipid Sci. Technol., 114: 357–366.
wiLLiaMs C.M. 2002. Nutritional quality of organic food: shades of grey or shades of green? Proc. Nutr. Soc., 61: 19–24.
wortHington v. 1998. Effect of agricultural methods on nutritional quality: a comparison of organic with conventional crops. Altern. Ther. Health Med., 4 :58–69.
WroniAK M., Krygier K., KAczMArczyK M. 2008. Comparison of the quality of cold pressed and virgin rapeseed oils with industrially obtained oils. Pol. J. Food Nutr. Sci., 58: 85–89.
vlAHAKis c., HAzeBroeK J. 2000. Phytosterol accumulation in canola, sunflower, and soybean oils: effects of genetics, planting location, and temperature. J. Am. Oil. Chem. Soc., 77:49–53.
yAgüe c., BAyArri s., concHello P., lázAro r., Pérez-Arquillué c., HerrerA A., Arino A. 2005. Determination of pesticides and PCBs in virgin olive oil by multicolumn solid-phase extraction clean-up followed by GC-NPD/ECD and confirmation by ion-trap GC-MS. J. Agr. Food Chem., 53: 5105–5109.

POLISH JOURNAL OF NATURAL SCIENCES Abbrev.: Pol. J. Natur. Sc., Vol 33(3): 417–432, Y. 2018
THE RELATIONSHIP BETWEEN IRON, LEAD AND COBALT CONTENT IN WATER, SEDIMENTS,
NILE TILAPIA AND AFRICAN RIVER PRAWN OF LAKE ASEJIRE, NIGERIA
Ademuyiwa Hafiz Oladele1, Oghenetejiri Digun-Aweto2, Adetola Jenyo-Oni3
1 Department of Fisheries and Aquaculture Federal University Dutsinma in Dutsinma, Nigeria
2 Tourism Research in Economics, Environs and Society (TREES) North-West University in Potchefstroom, South Africa
3 Department of Aquaculture and Fisheries Management University of Ibadan in Ibadan, Nigeria
K e y w o r d s: Lake Asejire, water pollution, aquatic organisms, metal interrelationship.
A b s t r a c t
This study evaluated interrelationships between iron, lead and cobalt content in African river prawn, Nile tilapia, sediment and water from Lake Asejire. In the six-month study, the metals were measured in samples collected monthly from three locations sited up-, mid- and downstream. Of all the sample types, iron and cobalt had the highest and lowest concentration, respectively. The relatively low concentration of iron and lead, in addition to non-detectable cobalt, in water samples shows that the lake water is free of iron, lead and cobalt pollution. The metals were also found at low levels in sediment, tilapia and prawn samples. The sediment serves as metal reservoir, since it contains greater metal concentration than water and the two aquatic organisms. The significant correlative relationship between iron and lead content in the water and sediment may be attributed to the role of sediment in releasing metals into the water column. Differences in the metal intake, requirement, and excretory mechanisms may be responsible for the negative correlation between the iron content of tilapia and river prawn. The fact that both organisms share the same sources of cobalt and lead, among other metals, may have contributed to the unitary correlation observed between cobalt and lead content in the organisms.
Based on the findings of this study, the African river prawn, Nile tilapia, sediment and water of Lake Asejire can be considered free from iron, lead and cobalt pollution. Periodic metal content assessment is important to allow for adequate monitoring of the lake’s pollution status.
Address: Ademuyiwa Hafiz Oladele, Federal University Dutsinma, Dutsinma, Katsina State, Ni-geria, phone: +234 806 351 1972, e-mail: [email protected]

Ademuyiwa Hafiz Oladele et al.418
ZALEŻNOŚĆ MIĘDZY ZAWARTOŚCIĄ ŻELAZA, OŁOWIU I KOBALTU W WODZIE, OSADACH ORAZ W TILAPII NILOWEJ I AFRYKAŃSKIEJ KREWETCE RZECZNEJ
Z JEZIORA ASEJIRE (NIGERIA)
Ademuyiwa Hafiz Oladele1, Oghenetejiri Digun-Aweto2, Adetola Jenyo-Oni3
1 Wydział Rybołówstwa i Akwakultury Uniwersytet Federalny Dutsinma, Dutsinma, Nigeria
2 TREES (Turystyka – badania w ekonomii, środowisku i w społeczeństwie) Północno-Zachodni Uniwersytet, Potchefstroom, Republika Południowej Afryki
3 Katedra Akwakultury i Zarządzania Rybołówstwem Uniwersytet Ibadan, Ibadan, Nigeria
S ł o w a k l u c z o w e: jezioro Asejire, zanieczyszczenia wody, organizmy wodne, współzależność metali.
A b s t r a k t
Badania dotyczyły zależności między zawartością żelaza, ołowiu i kobaltu w afrykańskiej krewetce rzecznej, tilapii nilowej oraz w wodzie i osadach jeziora Asejire. Stężenia metali mierzo-no przez sześć miesięcy (pomiar raz w miesiącu) na stanowiskach usytuowanych w górnej, środ-kowej i dolnej części jeziora. Spośród wszystkich badanych metali, żelazo i kobalt miały odpo-wiednio najwyższe i najniższe stężenia. Stosunkowo niskie stężenia żelaza i ołowiu oraz niewykrywalny poziom kobaltu świadczy o tym, że woda nie jest zanieczyszczona tymi pierwiast-kami. Niskie stężenia metali stwierdzono również w osadach, tilapii i krewetkach. Nieco większe stężenia metali w osadach niż w wodzie i organizmach wodnych świadczą o tym, że pełnią one rolę kumulującą. Istotna korelacja między stężeniem żelaza i ołowiu w wodzie i osadach dennych wskazuje na możliwość uwalniania metali z osadów do wody. Różnice w poborze metali, zapotrze-bowaniu i mechanizmach wydalniczych mogą być odpowiedzialne za ujemną korelację między zawartością żelaza w tilapii i krewetkach. Fakt, że oba organizmy dzielą te same źródła kobaltu i ołowiu, mógł przyczynić się do istotnej korelacji między zawartością w nich kobaltu i ołowiu.
Na podstawie wyników badań można stwierdzić, że afrykańska krewetka rzeczna i tilapia nilowa, a także osady i wody jeziora Asejire są wolne od zanieczyszczeń żelaza, ołowiu i kobaltu. Okresowa ocena zawartości metali jest ważna, aby umożliwić odpowiednie monitorowanie stanu zanieczyszczenia jeziora.
Introduction
The exploitation of aquatic environments for various fish and non-fish resources has benefited human existence immensely. Aquatic resources play several roles in ensuring the sustainable livelihood of human commu-nities, but the desire of man to live near water bodies and in coastal areas has made water bodies more vulnerable to pollution (olADele and Digun-

The Relationship between Iron, Lead and Cobalt Content in Water... 419
-AWeto 2017). Furthermore, anthropogenic activities that are linked to increases in population, agricultural growth, and industrial development have contributed to the pollution of water bodies worldwide (isLaM et al. 2014, kennisH 2017).
Reports from the Great Lakes Commission in 2003 reveal that until approximately 50 years ago, most pollution was not seen in our oceans, since waste materials were mainly metals and glass, which sink, and paper and cloth, which decay (olADele 2011). Global industrial develop-ment has led to the production of more persistent waste materials. Due to inadequate waste management systems, which are common in developing countries, the deposition of waste materials has risen to harmful levels in terrestrial and aquatic environments. Owing to the vast size and capacity of marine waters to absorb wastes, the impact of pollution is lower than what is manifested in freshwater bodies. Increase in pollution levels as well as over-exploitation of water for domestic consumption and agricultu-ral and industrial use have significantly reduced the assimilative capa-cities and self-cleaning abilities of many rivers and lakes (olADele and Jenyo-oni 2015).
In Nigeria, it is of great concern that over 80% of the nation’s indu-stries discharge their solid, liquid and gaseous wastes and effluents into the aquatic environments without pre-treatment, whereas only 18% of them undertake fundamental recycling processes before disposal (oLowu et al. 2010). The upsurge in urban population and the production of house-hold products have resulted in increased production of household waste materials (siMonyAn and Fasina 2013) and, subsequently, added to Nige-ria’s problem of waste disposal. Also, surface run-off and erosion from che-mically treated agricultural farms find their way into water bodies (MaL-LaMPati et al. 2007). Some of the constituents of the wastes and effluents discharged in aquatic environments include heavy metals, nutrient ele-ments, synthetic chemicals, organic compounds, and sewages, whose pre-sence poses significant threats to living organisms in aquatic environ-ments (BukoLa et al. 2015, oyeBoDe 2015, AyAngBenro and BaBaLoLa 2017).
Lake Asejire is one of the human-made lakes in South-Western Nige-ria, constructed to supply potable water to surrounding communities. In addition to this primary purpose, Lake Asejire houses dominant popula-tions of tilapia and Chrysichthys species (ogunleye 1982, iPinMototi 2013). These and other aquatic organisms are fished by fishermen to meet dietary and economic needs. Edible aquatic organisms are essential links in the food chain, aiding in the transfer and accumulation of metals from polluted water bodies to humans, mainly through consumption of water

Ademuyiwa Hafiz Oladele et al.420
and water resources from such water bodies. For this reason, these orga-nisms serve as a transport route for metals from polluted water bodies to humans. The importance of river sediment in serving as harbour and nat-ural buffer for pollutant materials in water bodies has been reported in several studies (JAFFA et al. 1998, ADeyeMo et al. 2008, oLowu et al. 2010, wang et al. 2014, singovszka et al. 2017, kong et al. 2018). The presence of residential buildings, industrial establishments, and agricultural farms within the vicinity of the lake predisposes the water body to wastes from these sources.
According to oguzie and oKosoDo (2008), heavy metals are common constituents of domestic, industrial and agricultural wastes. Exposure to low concentrations of heavy metals such as iron, lead, cobalt, mercury, zinc, and copper over a long period of time has resulted in the development of several acute and chronic diseases in humans (oguzie and okHagBuzo 2010). Before the emergence of toxicology as a field of science, the diagno-sis of acute lead poisoning has been carried out by Greek and Roman phy-sicians for several decades. Acute exposure to lead can result in headache, sleeplessness, loss of appetite, abdominal pain, fatigue, hallucinations, hypertension and renal dysfunction (JAisHAnKAr et al. 2014). Similarly, lead has been reported to interfere with the proper functioning of several essential elements such as iron, zinc, calcium, and copper. Lead has been implicated in inhibiting red blood cell-enzyme systems, displacing calcium in bones, inactivating cysteine containing enzymes, liver and kidney damage, nervous system dysfunction, infertility, abortions, and fetal and neonatal deaths (BaLa et al. 2008, Mor et al. 2009, DuttA et al. 2013).
Although iron and cobalt are essential elements, they become toxic in high concentrations. Iron accumulation beyond the nutritional threshold has been implicated in human health problems such as cellular damage, mutation and malignant transformation, which leads to an array of dise-ases (grAzuleviciene et al. 2009). Some of the effects of cobalt accumula-tion in humans include reproductive maladies such as infertility, men-strual and lactation problems, altered sexual behaviour, the altered onset of puberty, altered pregnancy periods, and altered menopause problems (senguPta et al. 2014).
The occurrence of iron (Fe), lead (Pb) and cobalt (Co), among other metals, in industrial, agricultural and domestic wastes and their toxicity and bioaccumulation potential in aquatic biota prime them for significant consideration in aquatic toxicology. Therefore, the primary objective of the study was to investigate the existing relationships in the concentrations of iron, lead and cobalt in four (4) sample types such as African river prawn, Nile tilapia, sediment and water of Lake Asejire.

The Relationship between Iron, Lead and Cobalt Content in Water... 421
Materials and Methods
Lake Asejire is located in the Egbeda local government area of Oyo State in the south-western part of Nigeria. It is sited along the Ibadan-Ife expressway, about 33.8 km distance from Ibadan. The lake has an approx-imate gross storage of 7,403 million litres (egBorge 1977), which are reg-ulated through dam gates. It lies at 04°07’ East and 07°21’ North at an altitude of 137 metres above sea level, covering a length of 19.5 km (AyoADe et al. 2007). Although Lake Asejire can be described as tilapia and Chrysi-chthys fisheries due to the dominant population of these two fish species, about 25 fish species have been identified in the lake (ogunleye 1982, iPinMoroti 2013).
To determine the concentration of iron, lead and cobalt in Lake Ase-jire, samples of water, sediments, Nile tilapia (Oreochromis niloticus) and African river prawn (Macrobrachium vollenhovenii) were collected over a period of six months (January to June, 2017) from three locations sited on the lake, as described by Jenyo-oni and olADele (2016). Along the watercourse, sampling locations were sited with regard to the proximity
Fig. 1. Map of Asejire Lake showing the sampling stations
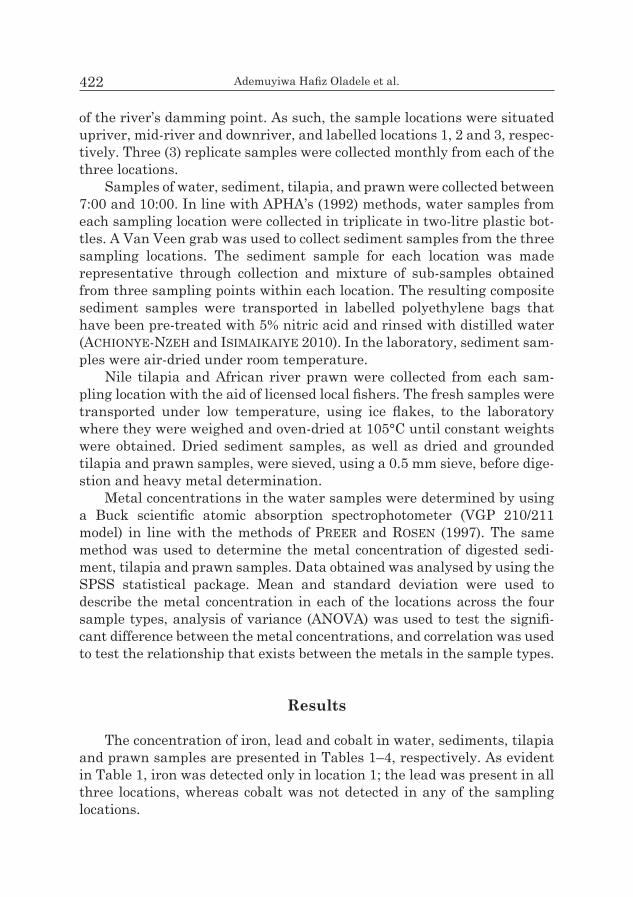
Ademuyiwa Hafiz Oladele et al.422
of the river’s damming point. As such, the sample locations were situated upriver, mid-river and downriver, and labelled locations 1, 2 and 3, respec-tively. Three (3) replicate samples were collected monthly from each of the three locations.
Samples of water, sediment, tilapia, and prawn were collected between 7:00 and 10:00. In line with APHA’s (1992) methods, water samples from each sampling location were collected in triplicate in two-litre plastic bot-tles. A Van Veen grab was used to collect sediment samples from the three sampling locations. The sediment sample for each location was made representative through collection and mixture of sub-samples obtained from three sampling points within each location. The resulting composite sediment samples were transported in labelled polyethylene bags that have been pre-treated with 5% nitric acid and rinsed with distilled water (AcHionye-nzeH and isiMAiKAiye 2010). In the laboratory, sediment sam-ples were air-dried under room temperature.
Nile tilapia and African river prawn were collected from each sam-pling location with the aid of licensed local fishers. The fresh samples were transported under low temperature, using ice flakes, to the laboratory where they were weighed and oven-dried at 105°C until constant weights were obtained. Dried sediment samples, as well as dried and grounded tilapia and prawn samples, were sieved, using a 0.5 mm sieve, before dige-stion and heavy metal determination.
Metal concentrations in the water samples were determined by using a Buck scientific atomic absorption spectrophotometer (VGP 210/211 model) in line with the methods of Preer and rosen (1997). The same method was used to determine the metal concentration of digested sedi-ment, tilapia and prawn samples. Data obtained was analysed by using the SPSS statistical package. Mean and standard deviation were used to describe the metal concentration in each of the locations across the four sample types, analysis of variance (ANOVA) was used to test the signifi-cant difference between the metal concentrations, and correlation was used to test the relationship that exists between the metals in the sample types.
Results
The concentration of iron, lead and cobalt in water, sediments, tilapia and prawn samples are presented in Tables 1–4, respectively. As evident in Table 1, iron was detected only in location 1; the lead was present in all three locations, whereas cobalt was not detected in any of the sampling locations.

The Relationship between Iron, Lead and Cobalt Content in Water... 423
Table 1 Iron, lead and cobalt concentration [mg l-1] in water samples
Location Iron Lead Cobalt
Location 1 0.020 ± 0.044 0.032 ± 0.072 Nd
Location 2 Nd 0.046 ± 0.103 Nd
Location 3 Nd 0.064 ± 0.088 Nd
– – 0.047 ± 0.016 –Nd = not detected
Metal concentration in sediment samples showed some level of varia-tion across the locations, with iron having the highest concentration (2.392 ± 0.017 mg kg-1) and cobalt the lowest (0.027 ± 0.001 mg kg-1), as is evident in Table 2. No significant difference (P < 0.05) was observed among con-centrations recorded for each of the metals across the three (3) sampling locations. Despite the high iron concentration in sediment samples, lead and cobalt concentrations were less than 0.1 mg kg-1. It is obvious from Tables 1 and two that sediment samples had higher metal concentrations than water samples.
Table 2 Iron, lead and cobalt concentration [mg kg-1] in sediment samples
Location Iron Lead Cobalt
Location 1 2.374 ± 0.107 0.072 ± 0.018 0.026 ± 0.006
Location 2 2.400 ± 0.076 0.074 ± 0.017 0.026 ± 0.013
Location 3 2.402 ± 0.081 0.076 ± 0.022 0.028 ± 0.016
– 2.392 ± 0.017 0.074 ± 0.002 0.027 ± 0.001
Similarly, all the metals were present in detectable concentrations in the tilapia samples (Table 3). In these tilapia samples, the iron concentra-tion was also the highest (7.431 ± 0.162 mg kg-1), followed by lead (0.053 ± 0.002 mg kg-1), whereas cobalt had the lowest concentration (0.006 ± 0.001 mg kg-1). No significant difference (P < 0.05) was observed within each metal across the three locations. It is important to note that although iron concentration in the tilapia samples (7.431 ± 0.162 mg kg-1) was higher than the concentration in sediments (2.392 ± 0.017 mg kg-1), the lead and cobalt concentrations in tilapia samples (0.053 ± 0.002 mg kg-1 and 0.006 ± 0.001 mg kg-1) were lower than in sediment samples (0.074 ± 0.002 mg kg-1
and 0.027 ± 0.001 mg kg-1, respectively).

Ademuyiwa Hafiz Oladele et al.424
Table 3Iron, lead and cobalt concentration [mg kg-1] in Nile tilapia samples
Location Iron Lead Cobalt
Location 1 7.408 ± 1.192 0.052 ± 0.011 0.004 ± 0.005
Location 2 7.604 ± 1.285 0.052 ± 0.004 0.006 ± 0.009
Location 3 7.282 ± 1.083 0.056 ± 0.013 0.006 ± 0.009
– 7.431 ± 0.162 0.053 ± 0.002 0.006 ± 0.001
Table 4Iron, lead and cobalt concentration [mg kg-1] in African river prawn samples
Location Iron Lead Cobalt
Location 1 1.614 ± 0.091 0.098 ± 0.008 0.004 ± 0.005
Location 2 1.578 ± 0.079 0.098 ± 0.026 0.006 ± 0.006
Location 3 1.638 ± 0.168 0.114 ± 0.017 0.006 ± 0.009
– 1.610 ± 0.030 0.104 ± 0.009 0.005 ± 0.001
Metal concentration in the prawn samples displayed a similar pattern to the concentration in tilapia samples, with iron having the highest con-centration (1.610 ± 0.030 mg kg-1), followed by lead (0.104 ± 0.009 mg kg-1), and cobalt having the lowest concentration (0.005 ± 0.001 mg kg-1) – Table 4. There was no significant difference between the concentrations of the different metals observed across the locations. Samples of tilapia had higher iron and cobalt concentrations (7.431 ± 0.162 mg kg-1and 0.006 ± 0.001 mg kg-1) than African river prawn (1.610 ± 0.030 mg kg-1 and 0.005 ± 0.001 mg kg-1, respectively), although lead concentration was lower in the tilapia samples (0.053 ± 0.002 mg kg-1) than in the prawn samples (0.104 ± 0.009 mg kg-1).
The correlation coefficients of the metals within and across the sample types are presented in Tables 5 to 11. In these tables, the metal concentra-tion in each sample type was represented by the chemical symbol of the metals with suffices such as -W, -S, -NT and –ARP, which are used as the abbreviations for water, sediment, Nile tilapia, and African river prawn, respectively. The correlation coefficients of the metals in each of the sam-ple types are presented in Tables 5–8.
In Table 5, the correlation coefficients of the relationship between iron and cobalt, as well as lead and cobalt, could not be computed due to non--detection of these metals in water samples. However, iron and lead con-centrations were strongly negatively correlated (-0.828). The concentra-tion of iron and lead in water samples are represented in Table 5 with Fe-W and Pb-W, respectively.

The Relationship between Iron, Lead and Cobalt Content in Water... 425
Table 5Correlation coefficients of iron and lead in water samples
Specification – Fe-W Pb-W
Pb-WPearson correlation -0.828 1
sig. (2-tailed) 0.379 –
Table 6Correlation coefficients of iron, lead and cobalt in sediment samples
Specification – Fe-S Pb-S Co-S
Fe-SPearson correlation 1 – –
sig. (2-tailed) – – –
Pb-SPearson correlation 0.896 1 –
sig. (2-tailed) 0.293 – –
Co-SPearson correlation 0.554 0.866 1
sig. (2-tailed) 0.626 0.333 –
Similarly, iron, lead and cobalt concentration in sediment samples are represented in Table 6 by Fe-S, Pb-S and Co-S, respectively. Iron content in sediment samples had positive correlations with lead and cobalt (0.896 and 0.554, respectively), whereas lead and cobalt were also positively cor-related (0.866). Similarly, as evident in Table 7, metal concentrations in Nile tilapia had both positive and negative correlation coefficients. Altho-ugh iron had a negative correlation with lead and cobalt (-0.924 and -0.132, respectively), the relationship between lead and cobalt was a positive cor-relation (0.500).
Table 7Correlation coefficients of iron, lead and cobalt in Nile tilapia samples
Specification – Fe-NT Pb-NT Co-NT
Fe-NTPearson correlation 1 – –
sig. (2-tailed) – – –
Pb-NTPearson correlation -0.924 1 –
sig. (2-tailed) 0.249 – –
Co-NTPearson correlation -0.132 0.500 1
sig. (2-tailed) 0.916 0.667 –

Ademuyiwa Hafiz Oladele et al.426
Table 8Correlation coefficients of iron, lead and cobalt in African river prawn samples
Specification – Fe-ARP Pb-ARP Co-ARP
Fe-ARPPearson correlation 1 – –
sig. (2-tailed) – – –
Pb-ARPPearson correlation 0.803 1 –
sig. (2-tailed) 0.407 – –
Co-ARPPearson correlation -0.115 0.500 1
sig. (2-tailed) 0.927 0.667 –
The type of association that exists among the metals in African river prawn is not similar to what was observed in Nile tilapia (Table 8). Iron was positively related to lead (0.803) but negatively related to cobalt (-0.115). Similar to the relationship between lead and cobalt in Nile tila-pia, the relationship between lead and cobalt was positively correlated (0.500) with the same magnitude. It is noteworthy that lead and cobalt shared the same correlation coefficient (0.500) in both Nile tilapia and African river prawn.
The association between the metal content across the four (4) sample types is presented in Tables 9–11. Table 9 reveals the correla- tion coefficients of iron across the sample types. The iron content in wa- ter and sediments is strongly negatively related (-0.998), whereas the iron concentration in water and the concentration in Nile tilapia and Afri-can river prawn were positively related (0.132 and 0.115, respectively).
Table 9Correlation coefficients of iron (Fe) in samples of water, sediment, Nile tilapia and African river
prawn from Lake Asejire
Specification – Fe-W Fe-S Fe-NT Fe-ARP
Fe-WPearson correlation 1 – – –
sig. (2-tailed) – – – –
Fe-SPearson correlation -0.998* 1 – –
sig. (2-tailed) 0.041 – – –
Fe-NTPearson correlation 0.132 -0.195 1 –
sig. (2-tailed) 0.916 0.875 – –
Fe-ARPPearson correlation 0.115 -0.051 -0.970 1
sig. (2-tailed) 0.927 0.968 0.157 –*. Correlation is significant at the 0.05 level (2-tailed).

The Relationship between Iron, Lead and Cobalt Content in Water... 427
Unlike water, the iron content of sediment is negatively associated with tilapia (-0.195) and African river prawn (-0.051). Similarly, iron content in the two aquatic organisms is negatively related (-0.970). Of all these rela-tionships, the relationship between iron concentration in water and in sediments is significant at a 5% confidence level.
Table 10 shows the correlation coefficients of lead across the sample types. The relationships between lead content and all the sample types were positive, although with different levels of strength. It is worth men-tioning that the correlation between lead concentration in water and in sediment (0.997) is significant at a 5% confidence level, whereas the rela-tionship between lead concentrations in the two aquatic organisms is uni-tary (1.000), which is significant at a 1% confidence level.
Table 10Correlation coefficients of lead (Pb) in samples of water, sediment, Nile tilapia and African river
prawn from Lake Asejire
Specification – Pb-W Pb-S Pb-NT Pb-ARP
Pb-WPearson correlation 1 – – –
sig. (2-tailed) – – – –
Pb-SPearson correlation 0.997* 1 – –
sig. (2-tailed) 0.046 – – –
Pb-NTPearson correlation 0.900 0.866 1 –
sig. (2-tailed) 0.287 0.333 – –
Pb-ARPPearson correlation 0.900 0.866 1.000** 1
sig. (2-tailed) 0.287 0.333 0.000 – *. Correlation is significant at the 0.05 level (2-tailed).**. Correlation is significant at the 0.01 level (2-tailed).
As evident in Table 11, correlation coefficients of cobalt in water were not computable due to non-detection of this metal in water samples. Howe-ver, positive relationships were observed in the cobalt content in sediment, Nile tilapia, and African river prawn. Notable is the fact that the correla-tion coefficient of cobalt concentration in sediment and each of the two aquatic organisms is 0.500, whereas the correlation between cobalt con-tent in the two aquatic organisms is unitary (1.000), which is significant at a 1% confidence level.
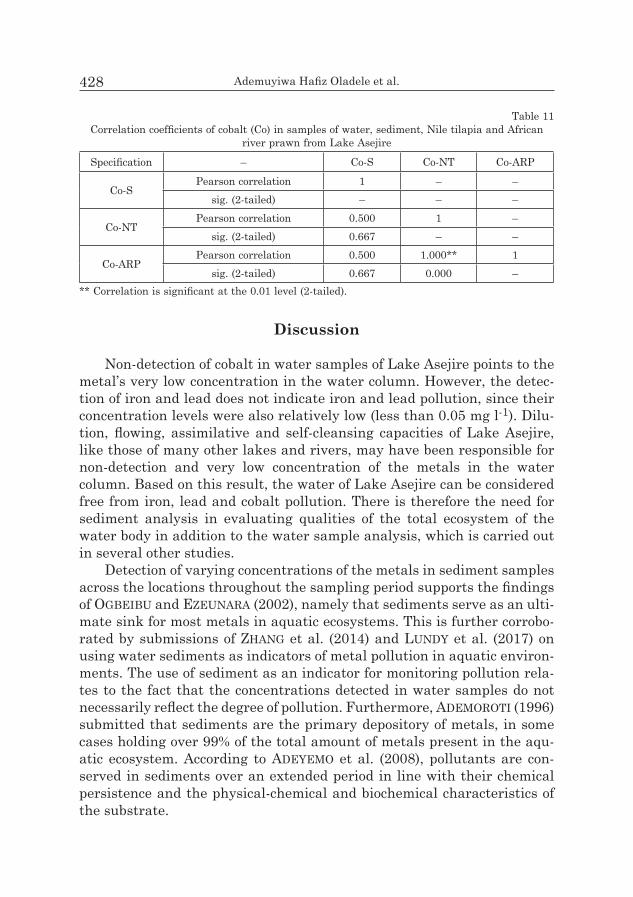
Ademuyiwa Hafiz Oladele et al.428
Table 11Correlation coefficients of cobalt (Co) in samples of water, sediment, Nile tilapia and African
river prawn from Lake Asejire
Specification – Co-S Co-NT Co-ARP
Co-SPearson correlation 1 – –
sig. (2-tailed) – – –
Co-NTPearson correlation 0.500 1 –
sig. (2-tailed) 0.667 – –
Co-ARPPearson correlation 0.500 1.000** 1
sig. (2-tailed) 0.667 0.000 –** Correlation is significant at the 0.01 level (2-tailed).
Discussion
Non-detection of cobalt in water samples of Lake Asejire points to the metal’s very low concentration in the water column. However, the detec-tion of iron and lead does not indicate iron and lead pollution, since their concentration levels were also relatively low (less than 0.05 mg l-1). Dilu-tion, flowing, assimilative and self-cleansing capacities of Lake Asejire, like those of many other lakes and rivers, may have been responsible for non-detection and very low concentration of the metals in the water column. Based on this result, the water of Lake Asejire can be considered free from iron, lead and cobalt pollution. There is therefore the need for sediment analysis in evaluating qualities of the total ecosystem of the water body in addition to the water sample analysis, which is carried out in several other studies.
Detection of varying concentrations of the metals in sediment samples across the locations throughout the sampling period supports the findings of ogBeiBu and ezeunara (2002), namely that sediments serve as an ulti-mate sink for most metals in aquatic ecosystems. This is further corrobo-rated by submissions of zHang et al. (2014) and lunDy et al. (2017) on using water sediments as indicators of metal pollution in aquatic environ-ments. The use of sediment as an indicator for monitoring pollution rela-tes to the fact that the concentrations detected in water samples do not necessarily reflect the degree of pollution. Furthermore, ADeMoroti (1996) submitted that sediments are the primary depository of metals, in some cases holding over 99% of the total amount of metals present in the aqu-atic ecosystem. According to ADeyeMo et al. (2008), pollutants are con-served in sediments over an extended period in line with their chemical persistence and the physical-chemical and biochemical characteristics of the substrate.

The Relationship between Iron, Lead and Cobalt Content in Water... 429
Similarly, all the metals were found in Nile tilapia and African river prawn samples; however, the metal content was lower when compared with the concentrations recorded in the sediment. The finding agrees with the findings of ADeMoroti (1996), stating that metal concentrations in aquatic biota are lower than those in sediments, since nearly all metal contents in aquatic environments reside in water sediment. High iron con-centration recorded in the aquatic organisms may be ascribed to iron uti-lisation, as iron is an essential micronutrient required by many proteins and enzymes for normal functioning of the organisms’ body systems (giL et al. 1997).
The ferruginous nature of tropical soils may also have contributed to the presence of iron content in water, sediment and aquatic organisms sampled from the lake. oLowu et al. (2010) reported that the high iron concentration in most Nigerian soils is a result of their formation-formed basement rock minerals, which are rich in iron oxides. Also, low levels of other metals in the flesh of the aquatic organisms may be accredited to the cobalt trace requirement and non-dietary nature of lead in the organisms’ bodies (oBasoHan 2008). The difference in metal concentrations observed in tilapia and prawn samples may be attributed to the anatomic differen-ces that exist between the two aquatic organisms (gLenn et al. 2009).
The strong and significant correlation in iron and lead concentrations between water and sediment supports the submissions of lunDy et al. (2017), claiming that metal content in the water column is influenced by the releasable metal concentration in the sediments. Continuous uptake of iron and its use as an essential dietary element may have accounted for the inverse relationship that exists between iron concentrations in water and sediment samples.
Despite non-detection of cobalt in the water column, which indicates an extremely low concentration, the detection of the metal in both the tila-pia and prawn of the lake may have resulted from persistent exposure to minute concentrations of the metal in the water body. This finding corrob-orates the reports of singovszka et al. (2017), which reveal that long-term pollution of sediments could lead to metal accumulation in aquatic organ-isms and humans utilising the overlying water for life activities, even if the emission rate of the pollutant is low and pollutant concentrations are present in levels lower than water quality standards.
The correlative negativity in the iron content of Nile tilapia and Afri-can river prawn may be due to the differences that exist between the two organisms in their iron intake and dietary requirements, as well as their removal (excretory) mechanisms. This is in accordance with the reports of gLenn et al. (2009), who indicated that bioaccumulation of metals in

Ademuyiwa Hafiz Oladele et al.430
aquatic organisms is species dependent in addition to being a function of the organism’s homeostatic mechanisms.
The unitary correlative relationship between cobalt concentrations in the two aquatic organisms may be partly ascribed to its requirement as an essential dietary element; however, this not true of lead. The fact that both organisms share the same sources of cobalt and lead, among other metals, may have contributed to the unitary relationship observed. Beyond anthro-pogenic activities, natural sources such as rock minerals, processes of soil formation and volcanic eruption are main routes of metal introduction to aquatic environments (singovszka et al. 2017).
Conclusion
The concentration of iron, lead and cobalt in African river prawn, Nile tilapia, sediment and the water of Lake Asejire is relatively low, and accor-ding to this finding, the lake can be considered free from iron, lead and cobalt pollution. However, the finding does not entirely preclude discharge of pollutants from natural and human-made sources. Erosion from surro-unding chemically treated agricultural farms and deposition of domestic wastes, especially during the rainy season, are likely point pollution sour-ces that may have contributed to the metal content of the lake. The role of underlying soil and rock types cannot be overlooked, since soil formation processes can also lead to the release of metal and mineral elements.
The detection of these metals in African river prawn, Nile tilapia, sedi-ment and water calls for adequate attention and pollution control. Per-sistent presence and accumulation of pollutants may lead to a build-up of metals in the lake’s ecosystem. Cases of food poisoning may result from the utilisation of untreated water and consumption of metal-polluted reso-urces from the lake. Continuous efforts to safeguard the lake from the deliberate deposition of domestic, agricultural and industrial wastes are crucial, owing to the importance of the lake in providing potable water and safe aquatic food organisms for human consumption. At the moment, periodic assessment of metal content of the lake, among other pollution indices, is recommended in order to allow for adequate monitoring of the pollution status of the lake and its resources. Further studies on other metals are necessary to reveal the pollution status of Lake Asejire with respect to those metals.
Accepted for print 3.07.2018
The Relationship between Iron, Lead and Cobalt Content in Water... 431
References
AcHionye-nzeH c.g., isiMAiKAiye A. 2010. Fauna and flora composition and water quality of a reservoir in Ilorin, Nigeria. International Journal of Lakes and Rivers, 3(1): 7–15.
ADeMoroti C.M.A. 1996. Environmental chemistry and toxicology. Ibadan, Nigeria Foludex Press Ltd. ADeyeMo o.K., ADeDoKun o.A., yusuF r.K., ADeleye.A. 2008. Seasonal changes in phy-sico-chemical parameters and nutrient load of river sediments in Ibadan City, Nigeria. Global NEST Journal, 10(3): 326–336.
aPHa 1992. Standard methods for the examination of water and wastewater. 18th Edition. Ameri-can Public Health Association, Washington DC, USA.
AyAngBenro A.s., BABAlolA O.O. 2017. A New strategy for heavy metal polluted environments. A review of microbial biosorbents. International Journal of Environmental Research and Pu-blic Health, 14(1): 94–100, http://dx.doi.org/10.3390/ijerph14010094.
AyoADe A., FAgADe s. ADeBisi A. 2007. Diet and dietary habits of the fish Schilbe mystus (Silu-riformes: Schilbeidae) in two artificial lakes in Southwestern Nigeria. Rev. Biol. Trop. (Int. J. Trop. Biol.), 56(4): 1847–1848.
BaLa M., sHeHu r.a., LawaL M. 2008. Determination of the level of some heavy metals in water collected from two pollution-prone irrigation areas around Kano Metropolis. Bayero Journal of Pure and Applied Sciences, 1(1): 36–38.
BuKolA D., zAiD A., olAleKAne i., FAlilu A. 2015. Consequences of anthropogenic activities on fish and the aquatic environment. Poultry, Fisheries and Wildlife Sciences, 3(2): 1–12, http://dx.doi.org/10.4172/2375-446X.1000138.
DuttA s., JosHi K.r., senguPtA P. 2013. Unilateral and bilateral cryptorchidism and its effect on the testicular morphology, histology, accessory sex organs and sperm count in Laboratory Mice. Journal of Human Reproductive Science, 6(2): 106–110.
egBorge A.B.M. 1977. The hydrobiology and plankton of Lake Asejire. PhD Thesis, University of Ibadan, Ibadan, Nigeria.
gil s.M., guBAlA M.A., lAnDertss c., lAsorsA D.H., cresceliuM B.e., curtis l.r. 1997. He-avy metals accumulation in sediment and freshwater fish in U.S Arctic Lakes. Environmental Toxicology and Chemical, 16: 733–741.
glenn s.s., Kristine J.M., tessA P.A., elenA r., JoseFinA D., ArnolD H., gliceriA r. 2009. Assessing heavy metals in the waters, fish and macroinvertebrates in Manila Bay, Philippines. Journal of Applied Sciences in Environmental Sanitation, 4(3): 187–195.
grAzuleviciene r., nADisAusKiene r., BuinAusKiene J., grAzulevicius T. 2009. Effects of elevated levels of manganese and iron in drinking water on birth outcomes. Polish Journal of Environmental Studies, 18(5): 819–825.
iPinMoroti M.O. 2013. Ichthyofauna diversity of Lake Asejire. Ecological implications. Interna-tional Journal of Fisheries and Aquaculture, 5(10): 248–252.
islAM M.s., AHMeD M.K., rAKnuzzAMAn M., HABiBullAH-Al-MAMuM M., KunDu G.K. 2014. He-avy metals in the industrial sludge and their ecological risk. A case study for a developing country. Journal of Geochemical Exploration, 172: 41–49.
JAFFA M., AsHrAF M., rAsoAl M. 1998. Heavy metals contents in some selected local freshwater fish and relevant water. Pakistan Journal of Scientific and Industrial Research, 31: 189–193.
JAisHAnKAr M., tseten t., AnBAlAgAnn., MAtHeW B.B., BeeregoWDA K.N. 2014. Toxicity, mechanism and health effects of some heavy metals. Interdisciplinary Toxicology, 7(2): 60–72.
Jenyo-oni A., olADele A.H. 2016. Heavy metals assessment in water, sediments and selected aquatic organisms in Lake Asejire, Nigeria. European Scientific Journal, 12(24): 339–351.
kennisH M. J. 2017. Estuaries. Anthropogenic impacts. Encyclopaedia of Coastal Science, pp. 1–9.Kong P., cHeng x., sun r., cHen L. 2018. The synergic characteristics of surface water pollution
and sediment pollution with heavy metals in the Haihe River Basin, Northern China. Water, 10(73): 1–17. Doi: 10.3390/w10010073, www.mdpi.com/journal/water, access: 5.03.2018.

Ademuyiwa Hafiz Oladele et al.432
lunDy l., Alves l., revitt M., WilDeBoer D. 2017. Metal water-sediment interactions and im-pacts on an urban ecosystem. International Journal of Environmental Research and Public Health, 14, 722: 1–12. Doi: 10.3390/ijerph14070722.
MAllAMPAti s.r., BHAvesH M., sunil D., MAnisH J., leenA K., venKAtrAMA K.s.s., sHAiK B., gADDer r., PrAsHAnt B. 2007. Bioaccumulation of heavy metals in some commercial fishes and crabs of the gulf of Cambay, India. Current Science Journal, 92(11): 1489–1491.
Mor F., Kurşun ö., erDoğAn n. 2009. Effects of heavy metals residues on human health. Uludag University Journal of Faculty of Veterinary Medicine, 28(1): 59–65.
oBasoHan E.E. 2008. Bioaccumulation of chromium, copper, manganese, nickel and lead in a freshwater cichlid. Hemichromis Fasciatus from Ogba River in Benin City, Nigeria. African Journal of General Agriculture, 4(3): 141–152.
ogBeiBu a.e., ezeunara P.U. 2002. Impact of brewery effluents on the Ikpoba River, using the fish communities as bio-indicators. Journal of Aquatic Resources, 17: 35–44.
ogunleye I.K. 1982. The structure and performance of fishermen at Asejire Dam, Oyo State, Ni-geria. BSc Thesis, University of Ibadan, Ibadan, Nigeria.
oguzie F.a., okHangBuzo G.A. 2010. Concentrations of heavy metals in effluent discharges down-stream of Ikpoba River in Benin City, Nigeria. African Journal of Biotechnology, 9(3): 319–325.
oguzie F.A., oKosoDo C. 2008. Contribution of heavy metals in waste dumpsites from selected markets to the heavy metals load of Ikpoba River in Benin City, Nigeria. Journal of Field and Aquatic Studies, 4: 51–56.
olADele A.H. 2011. Heavy metals assessment in water, sediments and selected aquatic organisms in Lake Asejire, Oyo State, Nigeria. MSc Thesis, University of Ibadan, Ibadan, Nigeria.
olADele A.H., Digun-AWeto O. 2017. Strength, weakness, oppourtunity and threat analysis of aquatic tourism in Nigeria. Journal of Environmental Management and Tourism, 6(22): 1259–1267. DOI: https://doi.org/10.14505//jemt.v8.6(22).13.
olADele A.H., Jenyo-oni A. 2015. Bioaccumulation of metals in selected aquatic organisms in Lake Asejire, Nigeria. Pacific Journal of Science and Technology, 16(2): 309–315.
oloWu r.A., AyeJuyo o.o., ADeWuyi g.o., ADeJro i.A., Denloye A.A.B., BABAtunDe A.o., ogunDAJo A.L. 2010. Determination of heavy metals in fish tissues, water and sediment from Epe and Badagry Lagoons, Lagos, Nigeria. E-Journal of Chemistry, 7(1): 215–221.
oyeBoDe O.J. 2015. Effective management of wastewater for environment, health and wealth in Nigeria. International Journal of Scientific and Engineering Research, 6(7): 1028–1059.
Preer J.r., rosen W.G. 1997. Lead and cadmium content of urban garden vegetables. Trace Substances and Environmental Health, 11: 399–405.
senguPtA P., BAnerJee r., nAtH s., DAs s., BAnerJee s. 2014. Metals and female reproductive toxicity. Human and Experimental Toxicology, 1–19. DOI: 10.1177/0960327114559611.
siMonyAn K.J., FAsinA O. 2013. Biomass resources and bioenergy potentials in Nigeria. African Journal of Agricultural Research, 8(40): 4975–4989.
singovszKA e., BAlintovA M., DeMcAK s., PAvliKovA P. 2017. Metal pollution indices of bottom sediment and surface water affected by acid mine drainage. Metals, 7(284): 1–11. Doi:10.3390/met7080284, www.mdpi.com/journal/metals.
WAng z.g., luo y.z., zHAng M.H., xiA J. 2014. Quantitative evaluation of sustainable develop-ment and eco-environmental carrying capacity in water-deficient regions. A Case study in the Haihe River Basin. China. Journal of Integrated Agriculture, 13: 195–206.
zHAng c., yu z.g., zeng g.M., JiAng M., yAng z.z., cui F., zHu M.y., sHen l.q., Hu L. 2014. Effects of sediment geochemical properties on heavy metal bioavailability. Environ. Int., 73: 270–281.

POLISH JOURNAL OF NATURAL SCIENCES Abbrev.: Pol. J. Natur. Sc., Vol 33(3): 433–453, Y. 2018
METHANE AND NITROUS OXIDE EMISSIONS FROM AGRICULTURE IN THE PODLASKIE
VOIVODESHIP IN YEARS 1999–2015*
Agnieszka Wysocka-Czubaszek, Piotr Banaszuk, Robert Czubaszek
Department of Agri-Food Engineering and Environmental Management Białystok University of Technology in Białystok, Poland
K e y w o r d s: methane, nitrous oxide, the Podlaskie Voivodeship, agriculture, GHG mitigation.
A b s t r a c t
Podlaskie as an agricultural region is expected to face environmental problems, mainly climate-related GHG emissions resulting from intensification of animal production. The aim of this study was to evaluate the methane and nitrous oxide emissions from agriculture in this region in years 1999–2015. The GHG emissions were calculated using methodology by the National Centre for Emissions Management (NCEM). The methane emissions attributed to agriculture in the Podlaskie increased from 59.2 Gg in 1999 to 84.0 Gg in 2015 which was in opposition to the trend for Poland. N2O emissions in 1999 amounted to 3.05 Gg and increased to 4.14 Gg in 2015.
This growing trend is primarily related to the increasing number of livestock, specifically ruminant animals and increasing N2O emissions from soils and manure management. In changing food market, farmers will probably be forced to find new niches, which will be profitable but less troublesome for the environment, including GHG emissions.
Address: Agnieszka Wysocka-Czubaszek, Białystok University of Technology, ul. Wiejska 45A, 15-351 Białystok, Poland, phone: +48 797 995 952, e-mail: [email protected] * This work was financially supported by Ministry of Science and Higher Education as a part of the project S/WBiIŚ/01/17.

Agnieszka Wysocka-Czubaszek et al.434
EMISJA METANU I PODTLENKU AZOTU Z ROLNICTWA W WOJEWÓDZTWIE PODLASKIM W LATACH 1999–2015
Agnieszka Wysocka-Czubaszek, Piotr Banaszuk, Robert Czubaszek
Katedra Inżynierii Rolno-Spożywczej i Kształtowania Środowiska Politechnika Białostocka w Białymstoku, Polska
S ł o w a k l u c z o w e: metan, podtlenek azotu, województwo podlaskie, rolnictwo, ograniczanie emisji.
A b s t r a k t
Województwo podlaskie jest regionem rolniczym, a intensyfikacja produkcji mleczarskiej i mięsnej prowadzi do zwiększania obciążenia środowiska m.in. przez emisję gazów cieplarnia-nych. Celem badań była ocena emisji metanu i podtlenku azotu z rolnictwa w województwie podla-skim w latach 1999–2015. Emisję gazów cieplarnianych obliczono za pomocą metodyki wykorzy-stywanej w krajowym raporcie gazów cieplarnianych. Emisja metanu z rolnictwa w województwie podlaskim wzrosła z 59,2 Gg w 1999 r. do 84,0 Gg w 2015 r., a emisja podtlenku azotu zwiększyła się z 3,05 Gg w 1999 do 4,14 Gg w 2015 r.
Wzrost emisji gazów cieplarnianych związany jest ze zwiększeniem się liczby zwierząt go-spodarskich oraz ze zwiększeniem się emisji podtlenku azotu z gleby i nawozów organicznych. Obecnie należy przeciwdziałać emisji gazów cieplarnianych z rolnictwa, stąd też rolnicy będą zmuszeni do poszukiwania nowych nisz na rynku zbytu, które nadal będą przynosić dochód, a jednocześnie będą umożliwiały zmniejszenie emisji gazów cieplarnianych.
Introduction
Modern agriculture on its way to meet the rising demand for food is challenging many environmental problems such as greenhouse gases (GHG) emissions, losses of biodiversity, pollution of soils and groundwa-ter, acidification and eutrophication. Agriculture is a primary source of non-CO2 GHG emissions and releases more than 80% of global anthro-pogenic nitrous oxide (IserMann 1994) and more than 40% of total anthro-pogenic methane (Turner et al. 2015). Production of food consumed by an individual citizen in Europe leads to the flux of 2,965 kg of CO2-eq. with the predominant role of agriculture (EC-JRC 2015). The vast majority of N2O emissions originate from cultivated soils due to the application of organic and synthetic fertilizers. Methane is mainly emitted by livestock, specifi-cally by ruminant animals and during manure management. Dairy and meat (beef, pork and poultry) farming is considered to be the primary sec-tor responsible for GHG emissions (NotArnicolA et al. 2017, EC-JRC 2015) whereas crop production is liable for soil eutrophication, acidifica-

Methane and Nitrous Oxide Emissions... 435
tion and high rates of N2O discharges. According to ROER et al. (2013), the N2O from forage production and direct CH4 emissions from animals con-tribute mostly to the environmental burdens in both milk and meat pro-duction. The conventional pork production in EU-27 contributes signifi-cantly to increased land occupancy, eutrophication and global warming (nguyen et al. 2012). The amount of energy necessary for poultry produc-tion and related global warming effect are similar or only slightly lower than those linked to the production of pork (De Vries and De Boer 2010).
In the European Union agriculture is responsible for ca. 10% of total GHG emissions (EUROSTAT 2016a). Globally increasing food demand may result in 77% rise of GHG flux as a consequence of growing livestock population, deforestation, fertilizers usage and mechanization (BAJzelJ et al. 2014), which indicates a critical role of agriculture in the future climate policy. Poland with the fifth largest area of agricultural land in the EU-28 is the third cereal producer, fourth pork and the biggest poultry meat pro-ducer (EUROSTAT 2016b) responsible for 7% of GHG emissions from the EU agriculture (EUROSTAT 2016c). Although the GHG emissions from Polish agriculture decreased between years 1988 and 2014 (NCEM 2016), the trend in the GHG emissions in years 1999-2014 was rather stable and in some regions of the country the methane and nitrous oxide emissions has increased in this period (WysocKA-czuBAszeK et al. 2018).
The Podlaskie Voivodeship is an agricultural region with high dairy and meat production, which is considered as a successful, attractive and promising, hence growing sector (nowak 2016). As a result of this ten-dency, the voivodeship is expected to face severe environmental problems, mainly climate-related emissions of methane and nitrous oxide.
The aim of the study was to evaluate the methane and nitrous oxide emissions from agriculture in the Podlaskie Voivodeship in years 1999–2015.
Methods
Study area
The Podlaskie Voivodeship is located in the NE Poland, has the area of 20,187 km2 and 1,187,587 inhabitants with a population density of 59 per- sons per 1 km2 (LDB 2017). The region is characterized by rather complex topography, changing from a hilly landscape in the north to the vast old--glacial plains cut with the paludified river valleys in the central and southern part of the territory. The climate is rather harsh, with short vegetation period lasting from 190 to 200 days, warm summers and cold

Agnieszka Wysocka-Czubaszek et al.436
winters. The long-term mean annual sum of precipitation ranges from 573 mm in the southern part of the region to 626 mm in the north. The average air temperature is 6.1°C in the north and 7.0°C in the south of the region (górniAK 2000). More than 60% of the voivodeship is under agricul-tural use, while almost 31% is covered by forest. Around 32% of the terri-tory is under conservation management (SO 2015a). The number of farms exceeds 79,000 (SO 2015b). The main crops are cereals cultivated on the 70.4% of the cropland. Among livestock, dairy cattle (46.8%), young cattle of 1–2 years old (22.4%) and calves less than one-year-old (23.8%) domi-nate the cattle population in the region with non-breeding pigs as the main non-cattle livestock (SO 2016).
Calculation of greenhouse gases (GHG) emissions
The GHG emissions for years 1999–2015 in the Podlaskie Voivodeship were calculated using the methodology by the National Centre for Emis-sions Management (NCEM) for the national inventory for United Nations Framework Convention on Climate Change and Kyoto Protocol. According to the National Inventory Report 2016 (NCEM 2016), the main sources of GHG emissions in agriculture sector are: enteric fermentation from ruminant animals (CH4), manure management (CH4 and N2O), agricultu-ral soils (CH4 and N2O) and burning of agricultural residues (CO2, CH4, N2O). In this paper only the first three sources were taken into considera-tion, because the burning of agricultural residues is of a minor importance, being responsible only for 0.1% of N2O emissions and 0.2% of CH4 emis-sions (NCEM 2016). Methane emissions from enteric fermentation of goats, horses, sheep and swine were calculated according to Tier 1 method given by the Intergovernmental Panel on Climate Change (IPCC). The emission factors (EFs) were taken from IPCC Guidelines for National Greenhouse Gas Inventories (IPCC 2006). The CH4 emissions from enteric fermentation of cattle were calculated according to the Tier 2 method with emission factors estimated for Poland (NCEM 2016) calculated based on specific gross energy intake values. The cattle population data was collec-ted in livestock categories and the specific EFs, calculated for each cattle category on a basis of specific gross energy intake values, were taken from the National Inventory Report (NCEM 2016). The specific gross energy intake for each cattle category was calculated using the values from natio-nal statistics (e.g. pregnancy, milk production, percent of fat in the milk) and from IPCC Guidelines (IPCC 2006). Methane emissions from manure management of cattle and swine were estimated with Tier 2 method and from manure management of horses, goats, sheep, and poultry with Tier 1

Methane and Nitrous Oxide Emissions... 437
method. The emission factors for horses, goats, sheep and poultry were taken from IPCC (2006), the EFs for cattle and swine were taken from the National Inventory Report (NCEM 2016). These EFs were calculated based on average daily volatile excreted solids, maximum CH4 production capacity for manure produced by animal and fraction of livestock category manure in the animal waste management systems. All those parameters were taken from national statistics and Polish publications (NCEM 2016). Nitrous oxide emissions from manure management were calculated accor-ding to IPCC (2006) with emission factors based on the amount of nitrogen in animal manure taken from national inventory (NCEM 2016). Indirect N2O emissions from manure management consist of nitrogen volatiliza-tion and nitrogen leaching and were calculated according to IPCC (2006).
Emission from cropland is the sum of direct and indirect fluxes. Direct emissions are due to N inputs from application of synthetic N fertilizers, animal manure, composts, sewage sludge and other N amendments; above and below-ground crop residues, including N-fixing crops returned to soils; mineralization of N due to land use or management change; management or drainage of organic soils; urine and dung deposited by grazing animals on pastures, range and paddocks. Indirect emissions comprise the sum of emissions from atmospheric nitrogen deposition on soils together with leaching and runoff of N that is applied to or deposited in soils (IPCC 2006). All emissions were calculated according to IPCC guidelines (IPCC 2006). EFs were also taken from this publication except the annual amo-unt of N in crop residues, which was calculated according to Corrigenda for 2006 IPCC Guidelines (IPCC 2015) with N content in the above-ground residues, ratio of above-ground residue dry matter to harvested yield and fraction of total above-ground crop biomass removed from the field taken from NCEM (2016). The loss of C stocks from organic soils and mineral soils under cultivation were not calculated because of the virtual lack of data.
The specific for voivodeship data on animals number, crops, synthetic N fertilization, sewage sludge used as fertilizer needed to complete inven-tory was taken from The Central Statistical Office of Poland from follo-wing publications and databases: (i) production of agricultural and horti-cultural crops in years 1999–2016; (ii) statistical yearbook of the regions – Poland in years 1999–2016; (iii) Local Data Bank (LDB).

Agnieszka Wysocka-Czubaszek et al.438
Results and Discussion
Total GHG emissions from agriculture
Agriculture in Poland is responsible for 8% of national GHG emissions (NCEM 2016), which is similar to the estimates for Europe, where agricul-tural flux amounts to 9.9% (EUROSTAT 2016a). Although the share of agri- culture in domestic GHG emissions is rather small, Poland is responsible for 7% of GHG emissions from agriculture in EU-28 (Figure 1), following France (18.1%), Germany (15.2%), United Kingdom (10.2%), Spain (8.6%) and Italy (7%; EUROSTAT 2016b).
In recent decades the GHG emissions from agriculture in Poland decreased from 25,379 Gg CO2-eq. in 1999 to 23,949 Gg of CO2-eq. in 2002 and next peaked at 26,798 Gg CO2-eq. in 2008. After the decline in 2010 the GHG emissions rose to 26,322 Gg CO2-eq. in 2014, and subsequently drop-ped to 25,103 Gg CO2-eq. in 2015. In the Podlaskie Voivodeship the GHG emissions attributed to agriculture grew from 2,189 Gg CO2-eq. in 1999 to 3,220 Gg CO2-eq. in 2009 and stabilized with a slight decrease to 2,937 Gg CO2-eq. in 2011 (Figure 2). The emissions from the Podlaskie Voivodeship accounted for ca. 10% in 1999 to 16% in 2015 of the total GHG emissions from agriculture in Poland and were related to a high ruminant livestock production. The overall trend observed in the Podlaskie Voivodeship was in opposition to the trajectory of GHG flux from agriculture in the EU-28, which in years 1990–2012 fell by 23.8% (EUROSTAT 2016a). Similar high
Fig. 1. The share of GHG emissions from agriculture by EU-28 countries

Methane and Nitrous Oxide Emissions... 439
contribution of agricultural emissions to the total GHG emissions was observed in other agricultural regions of Europe. In the North East Sco-tland agriculture is responsible for 23% of the total GHG emissions (FeLi-ciAno et al. 2013). In Ireland in 2012 agriculture accounted for 30.7% share of total greenhouse gas emissions and this was the highest contribution from agriculture among any of the EU Member States (EUROSTAT 2016b).
In Italy, four most fertile and exploited agricultural regions (Lombardy, Piedmont, Emilia-Romagna and Veneto) are responsible for 55% of total agricultural emissions in this country (soLazzo et al. 2016).
Methane emissions from enteric fermentation and manure management in the Podlaskie Voivodeship
The methane emissions attributed to agriculture in the Podlaskie Voivodeship increased quite rapidly from 59.2 Gg in 1999 to 86.7 Gg in 2009 and then oscillated around 80 Gg in the following years (Figure 3). The overall increasing trend was in opposition to the trend for Poland, where the CH4 emissions declined from 597.7 Gg in 1999 to 524.1 Gg in 2015. The largest source of methane in the Podlaskie Voivodeship was enteric fermen-tation of ruminant livestock (Figure 4). Its share in the overall CH4 flux
Fig. 2. The GHG emissions from agriculture in the Podlaskie Voivodeship and Poland in 1999–2015

Agnieszka Wysocka-Czubaszek et al.440
was 89.9% in 1999 and increased to almost 95% in 2015. In 2014 in Poland 88.4% of methane originated from enteric fermentation (NCEM 2016).
Fig. 3. Methane emissions from agriculture in the Podlaskie Voivodeship and in Poland in 1999–2015
Fig. 4. Methane emissions from enteric fermentation and manure management in the Podlaskie Voivodeship in 1999–2015

Methane and Nitrous Oxide Emissions... 441
The increase in methane emissions from enteric fermentation was due to the growth of livestock population in recent decades. In the Podlaskie Voivodeship the cattle livestock has doubled since 1960, with the highest growth rate between 2005 and 2009 (Figure 5). Since 2009 dairy cattle livestock remained stable but others, mainly calves under one year and young cattle of 1–2 years, grew rapidly. This tendency was similar to the general trend for Poland, where since 2008 dairy cows have been slightly outnumbered by the other cattle categories. The decline in dairy cattle in Poland was caused by low procurement prices for milk, high penalties for exceeding milk quotas and a shortage of forage in regions affected by drought.
In the Podlaskie Voivodeship, from 1999 the number of pigs slightly decreased as a result of collapsing market prices. The rapid decline in swine population observed since 2006 (Figure 5) was attributed to a high fodder (cereal) prices, and decreasing procurement prices, affected by the import of pork from Germany, the Netherlands, Denmark, and Belgium. This trend stopped in 2009 due to improvement of the market. However, the scarcity of cereals in 2010 caused the increase of fodder prices in the two following years (trAJer and kossakowska 2013) and further decline in pig number. Even though the procurement prices of swine livestock have raised recently, the number of pigs in the Podlaskie Voivodeship has not increased mainly due to a risk of African Swine Fever (GVI 2016).
Fig. 5. Changes in cattle and swine population between 1999 and 2015 Source: LDB (2015)
Agnieszka Wysocka-Czubaszek et al.442
The sheep population fluctuated along a decreasing trend; a similar tendency was observed for horse population. Nowadays horses are mainly bred for recreation, medical purposes and meat (kruszewski 2011). The number of goats was rather stable, with little increase in years 2005–2010.
The CH4 emissions from animal wastes decreased slightly from 5.9 Gg in 1999 to 4.3 Gg in 2015. The decline of methane emissions was attribu-ted to the reduction in the number of swine feedstock. The general trend was not affected by an increase in the number of broilers from 248,958 in 1999 to 7,021,285 in 2015.
The increasing trend for CH4 emissions is typical for those countries and regions, where growing cattle livestock population is observed, because GHG emissions, especially CH4 emissions are mainly related to the rumi-nant number, particularly cattle number (O’Mara 2011). In European countries, cattle are the source of 40–70% of the CH4 emissions which is much higher than methane emissions from other agricultural sources (FreiBauer 2003, wang et al. 2011). In China the population of livestock almost tripled in period of 1980–2013 what resulted in CH4 emissions increase, especially in the 2000s (Yu et al. 2018). The growing number of cattle in the Podlaskie Voivodeship accompanying by increasing CH4 emis-sions is in the opposite trend to most European countries, where the dec-line in livestock population results in decrease of CH4 emissions (FeLi-ciAno et al. 2013, FreiBauer 2003).
Nitrous oxide emissions from agriculture in the Podlaskie Voivodeship
Nitrous oxide emissions from agriculture in the Podlaskie Voivodeship in 1999 amounted to 3.05 Gg and subsequently increased to 4.14 Gg in 2015 (Figure 6). Almost 70% of N2O emissions originated from manure management, application of mineral and organic fertilizers, urine and dung left by animals on pastures, sewage sludge used as fertilizer, and decomposition of crop residues. Mineral fertilizers and crop residues gene-rated 20–26% and 16–28% of total nitrous oxide emissions, respectively. Manure management and application were responsible for 21–24% of total nitrous oxide emissions. The indirect emissions resulted from N volatiliza-tion and leaching from manure management (34%) and the transforma-tion of atmospheric N depositions and leaching together with runoff from soils (66%).
Nitrous oxide emissions from application of synthetic N fertilizers increased from 0.77 Gg in 1999 to 0.85 Gg in 2015 with the peak around 2013 and 2014 (1.09 Gg and 1.07 Gg, respectively) due to growing fertilizer
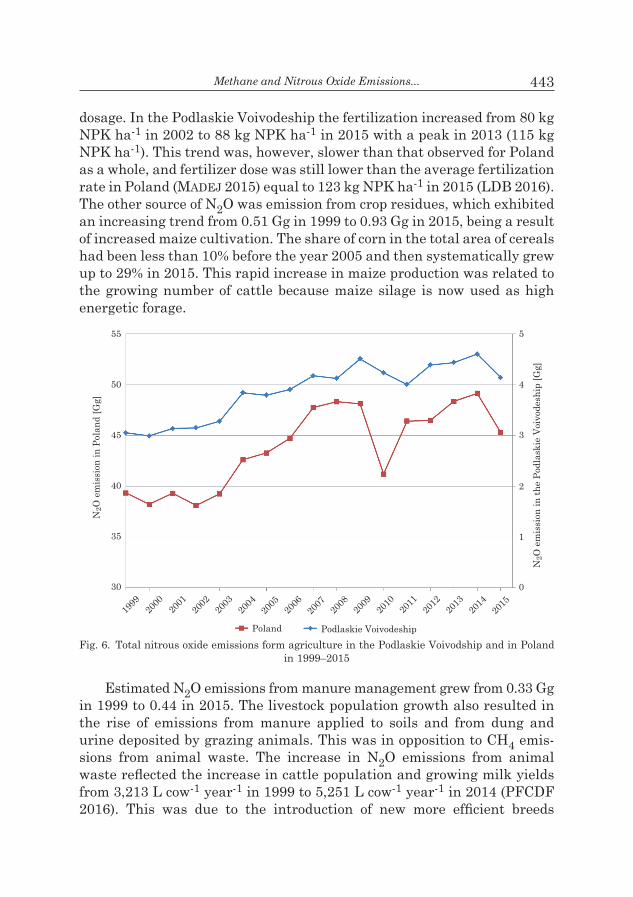
Methane and Nitrous Oxide Emissions... 443
dosage. In the Podlaskie Voivodeship the fertilization increased from 80 kg NPK ha-1 in 2002 to 88 kg NPK ha-1 in 2015 with a peak in 2013 (115 kg NPK ha-1). This trend was, however, slower than that observed for Poland as a whole, and fertilizer dose was still lower than the average fertilization rate in Poland (MADeJ 2015) equal to 123 kg NPK ha-1 in 2015 (LDB 2016). The other source of N2O was emission from crop residues, which exhibited an increasing trend from 0.51 Gg in 1999 to 0.93 Gg in 2015, being a result of increased maize cultivation. The share of corn in the total area of cereals had been less than 10% before the year 2005 and then systematically grew up to 29% in 2015. This rapid increase in maize production was related to the growing number of cattle because maize silage is now used as high energetic forage.
Estimated N2O emissions from manure management grew from 0.33 Gg in 1999 to 0.44 in 2015. The livestock population growth also resulted in the rise of emissions from manure applied to soils and from dung and urine deposited by grazing animals. This was in opposition to CH4 emis-sions from animal waste. The increase in N2O emissions from animal waste reflected the increase in cattle population and growing milk yields from 3,213 L cow-1 year-1 in 1999 to 5,251 L cow-1 year-1 in 2014 (PFCDF 2016). This was due to the introduction of new more efficient breeds
Fig. 6. Total nitrous oxide emissions form agriculture in the Podlaskie Voivodship and in Poland in 1999–2015

Agnieszka Wysocka-Czubaszek et al.444
of cows combined with improved animal diet. Despite the progressive inten-sification and the shift from small herds housed in straw yards to herds of over 40 cows housed more and more often in slurry-based buildings, most of the herds is still between 10 and 20 cows, which are housed in the deep--straw system (litWińczuK and groDzKi 2014). A deep-bedded pack sys-tem was reported to have relatively low N2O losses, which are lower than 1–4% (CHADWicK et al. 2011). The N2O emissions from sludge used as fertilizer in the Podlaskie Voivodeship were negligible.
A growing trend was observed in the indirect sources of N2O emissions from manure and soil. The estimated emissions due to N volatilization from manure management rose from 0.25 Gg N2O in 1999 to 0.33 Gg in 2015 while emissions due to leaching from manure management grew from 0.05 Gg in 1999 to 0.07 Gg in 2015. The atmospheric deposition resul-ted in an emissions of 0.23 Gg in 1999 and 0.32 Gg in 2015. Leaching was a more important source responsible in 1999 and 2015 for 0.35 Gg and 0.46 Gg of N2O emissions, respectively.
The highest anthropogenic N2O emissions are related to cultivated agricultural soils due to application of nitrogen fertilizers, mainly in mine-ral form, however the climate and soil characteristics also influence the nitrous oxide emissions (FreiBauer 2003, BeLL et al. 2015). However, in regions with high animal production, as in case of the Podlaskie Voivode-ship, the contribution of animal derived N2O emissions may be also very significant. In UK, crops contribute 42% to total N2O emissions, while cat-tle 25% (Wang et al. 2011), which is similar to the contributions calculated for the Podlaskie Voivodeship. The increasing trend in N2O emissions from synthetic N fertilizers is somehow balanced with growing use of manure as fertilizer, however both fertilizers contribute in nitrous emissions.
GHG emissions from agriculture in the Podlaskie Voivodeship compared to Poland
The presented data indicates that area related to GHG emissions tend to be much higher in agricultural regions than an average for the whole country. In 2015 the Podlaskie Voivodeship emitted 16% of agricultural CH4 and together with the Mazowieckie (18.5%) and Wielkopolskie Voivodeships (16%) was responsible for more than half of CH4 flux. However, the emis-sions related to the area of agricultural land give a different picture. The Podlaskie Voivodeship with its 7,939 kg CH4 100 ha-1 a.l. dominated in Poland and outran the Mazowieckie Voivodeship (5,058 kg CH4 100 ha-1 a.l.) and the Wielkopolskie Voivodeship (4,860 kg CH4 100 ha-1 a.l.), which was obviously related to the largest number of cattle per 100 ha a.l. This impli-
Methane and Nitrous Oxide Emissions... 445
cates very good usage of natural conditions in the Podlaskie Voivodeship but also indicates the threat of growing environmental burden from agri-culture.
In dairy production the emission per 1 L of produced milk is an impor-tant indicator. In the Podlaskie Voivodeship this parameter decreased from 33.9 kg CH4 L-1 to 21.8 kg CH4 L-1 and is similar to the value obta-ined for the Wielkopolskie Voivodeship (20.5 kg CH4 L-1 in 2015) and the Mazowieckie Voivodeship (22.2 kg CH4 L-1 in 2015), where dairy produc-tion is one of main sectors of agricultural production. The intensification of dairy cattle production such as increasing cattle stocking rate, milk yields and cow fertility reduces the emissions (gerssen-gonDelAcH et al. 2017).
The Podlaskie Voivodeship contributed only to 9% of total N2O emis-sions from Polish agriculture. The flux of N2O per 100 ha a.l. in 2015 equ-aled to 391 kg N2O. The nitrogen fertilizers and crop residues were respon-sible for more than 40% of the emissions, followed by manure management (11%) and organic fertilizers (13%). Agriculture in the Podlaskie Voivode-ship is based mainly on the emission-intensive milk and meat production with some crop cultivation. In 2015 the region harvested only 6% of total Polish cereals, while the Wielkopolskie and Mazowieckie Voivodeships produced 13.3% and 12.8%, respectively. However, last year the Podlaskie Voivodeship was a significant maize producer (10% of total yield), altho-ugh its share only halved that of the Wielkopolskie Voivodeship (21%). To the high emissions of the nitrous oxide in the Podlaskie Voivodeship con-tributed large livestock number per 100 ha while low consumption of fer-tilizers slightly decreased the N2O flux.
The results indicate that in regions where agriculture is the basic eco-nomic factor the GHG emissions contribute much more to total emissions than it is assessed for the whole country. It is worth noting that agricultu-ral sector in Poland is still in transformation phase. In the Podlaskie Voivodeship changes in this sector are pronounced in enlargement of farms, shifting from crop production to milk and meat production which is the most suitable direction of agriculture according to the natural con-ditions, replacement of old equipment, decline in agriculture area per per-son etc. (MADeJ 2015). However, still there is a need for some improve-ments such as higher liming, as well as phosphorus and potassium fertili-zers rates. Increasing cattle population will cause greater demand for feed which may raise the share of maize in crop structure. Maize production in turn will increase the demand for N fertilizers which may contribute to higher N2O emissions. On the other hand the increasing amounts of manure may be problematic when its production is overly abundant in regions with intensive livestock production (garnett 2009).

Agnieszka Wysocka-Czubaszek et al.446
GHG mitigation options for agriculture in the Podlaskie Voivodeship
To alleviate the threat of climate change, the Podlaskie Voivodeship needs to introduce measures aiming at significant GHG reduction from agriculture, which should not affect the farmers’ income. The list of possi-ble mitigation practices includes improvements in cropland, livestock and manure management, bioenergy production, restoration of degraded land etc. Implementation of those measures can be constrained by physical, political, social, biological, economic, institutional, educational and mar-ket barriers (sMitH 2012). In the case of methane reduction from livestock the most common solution is the intensification of milk production thro-ugh increasing herds, and milk yield (gressen-gonDelAcH et al. 2017) or the decreasing of methane production during rumination through the diet. Higher milk production per cow may increase the demand for forage and hence the area of crops (nAyAK et al. 2015) or can lead to intensified meat production from the pure beef system which is characterized by very high GHG emissions (FlyJsö et al. 2012). The increasing milk production may be also politically unpopular because it will favour regions and countries where GHG emissions per 1 kg milk are already low through the density of cows and high yield per cow (McAllister et al. 2011). However, the GHG decrease from cows can be obtained not only through milk yield increase or reduced protein diet but also through the combination of those two with longevity to 7 lactations per cow instead of current 3–4 lactations (AuDsley and wiLkinson 2014). BAcenetti et al. (2016) reported that increasing only milking procedure from 2 to 3 per day may increase the annual milk yield without changing the diet.
Beef production has the highest global warming potential, thus miti-gation strategies in this sector are of main consideration. The study of Buratti et al. (2017) showed that carbon footprint of conventional beef production is lower than of organic production due to lower enteric fermen-tation caused by better digestibility of forage and manure management. As BeAucHeMin et al. (2011) reported, the dietary modifications such improved forage quality, supplementation, change of forage and improved animal husbandry based on increased reproductive performance and lon-gevity of breeding stock could save up to 20% of total GHG emissions.
On the other hand, there is a growing concern not only about the impact of food production, especially of animal-based products on the environment but also the welfare of farm animals becomes a public con-cern in many countries (DeeMer and LoBao et al. 2011) and some treat-ments performed on farm animals can be seen even as an ethical problem
Methane and Nitrous Oxide Emissions... 447
(Lagerkvist et al. 2006). The welfare of farm animals has become a sub-ject of public debates and consumers more and more willingly select the products on which the information of farming method is effectively labeled (naPoLitano et al. 2010, Bennett and BAlney 2002).
In the Podlaskie Voivodeship, even though the density of cows is the highest in the country and milk production is one of the highest, the annual yield from cow (5,673 L per cow, CSO 2017) is lower than those in 3 other voivodeships with dairy production being the main sector, and much lower than EU-28 average (6,898 L per cow, EUROSTAT 2016d). This means that intensification may not be the only solution for farmers. Increasing public awareness of farm animal welfare and growing niche market for food produced with respect to animal rights create the option for milk production without the intensification of the dairy sector but maintaining income on the current level and reducing the GHG emissions from livestock.
Another important issue is mitigation of GHG emissions from manure management, which is related to animal diet (Del PrADo et al. 2010, coloMBini et al. 2015, Montenegro et al. 2016) and technical options (DAlgAArD et al. 2011). Easily digestible forage with reduced nitrogen input results in lower N2O and NH3 emissions from stored manure (Mis-seLBrook et al. 2013, Hansen et al. 2014). The positive effect can be also obtained by the addition of NO3 or other supplements such as Cysteamine hydrochloride to cattle diet (sun et al. 2017), however care should be taken with new diet supplements. Supplementing cattle feedlot with distillers’ grains plus solubles which are the by-product of ethanol production decre-ases the CH4 emissions form cattle manure while substantially increasing N amount in excreta results in intensification of N2O emissions (Hüner-Berg et al. 2014). Many studies on feedlot supplementation with a whole range of substances give now contradictory results, so there is a need for research before application of these supplements in practice.
According to Polish legislation, slurry should be kept in covered and impermeable tanks, while manure is obligatorily stored on the imperme-able plate with leachate stored in the tank. However, the uncovered manure is a source of GHG emissions, which can be reduced by covering the manure heaps (Hansen et al. 2006). The in-house daily flushing of cattle manure thereby transferring the warm slurry to outdoor cooler container may reduce ca. 49% of CH4 emissions form an in-house stored slurry with some increase from slurry kept outside. The cooling of slurry channels in pig houses combined with the use of excess heat from cooling units may result in 31% reduction of methane emissions (soMMer et al. 2004), however in practice cooling below 15oC may not be cost-effective

Agnieszka Wysocka-Czubaszek et al.448
(DAlgAArD et al. 2011). Another option is to use slurry and manure for energy generation through anaerobic digestion (MAssé et al. 2011). In the Podlaskie Voivodeship with large livestock population, there is a poten-tial for building the biogas plants. However, investment costs, insecure future of this energy production sector and low level of education are the main constrains which slow down the development of agricultural biogas sector.
Several mitigation measures can be implemented to subdue the nitro-gen flux from soils, namely decreasing the application of synthetic N ferti-lizers, nitrification inhibitors in fertilizers, extending the application of organic fertilizers, improving the timing of fertilization, catch crops and intermediate crops, precision farming (Moran et al. 2011). The precision agriculture is based on the application of all inputs to the soil according to observed intra-field variations (FeliciAno et al. 2013) and includes satel-lite technologies, mobile devices, weather modeling, sensors for gathering data on soil water availability, soil compaction, soil fertility, leaf tempera-ture, leaf area index, plant water status, local climate data etc.
Some of those measures like the timing of fertilization or application of organic fertilizers or avoiding the excess of nitrogen fertilizers are or should be well known by Polish farmers because they are part of the Good Agricultural Practices Code. However, many of mitigation practices entail the additional cost, which raises the question about farmers willingness to pay and regulatory or subventions that will help to overcome this pro-blem.
It must be stated that focusing on one target such as GHG without considering the whole spectrum of relationships between agricultural food production and environment may create in future new challenges of which we are not aware now. Some mistakes have already been made. Biogas plants based not on agricultural waste but dedicated crops like maize cau-sed the competition for land for forage and energy crops.
Uncertainty and limitation
The IPCC method was designed for national scale inventories of GHG emissions. That is why it does not take into consideration neither the geo-graphic and climatic variations nor the management practices which may vary as a function of climate and soil types as well as farming ideologies and economic factors (HiLLier et al. 2011). Thus this method may not be sufficient option for small scale inventories like community or farm level. However, on the regional/voivodeship scale the Tier1 and Tier 2 methods may be sufficient to assess the regional differences in GHG emissions,

Methane and Nitrous Oxide Emissions... 449
even though these methods do not relay on geographic variations. Even though, the IPCC method, especially Tier 1 is fraught with uncertainties. The EFs can be a source of uncertainty, especially those taken directly from IPCC. The direct measurements of soil N2O emissions after applica-tion of various organic fertilizers revealed the influence of manure type and time of application on EFs and their large deviation from IPCC default EFs (BeLL et al. 2016). According to cHADWicK et al. (1999) the N2O emis-sions from livestock production in UK may be estimated with ±50% error. The changes in livestock population in one year, production per head and average life span in one year contribute to the values of EFs and are not considered in IPCC emission factors (yu et al. 2018). However, at regional scale, the results based on the aircraft Eddy Covariance, Relaxed Eddy Accumulation and wavelet covariance techniques agreed with calculation based on Tier 2 method (DesJArDins et al. 2018). It is worth noting that most of emission factors were taken not from IPCC, but from Polish inven-tories and thus they are more reliable in Polish conditions and give smal-ler uncertainties in results. The variability of results is mainly explained by the livestock type and number and crop structure, which on the regio-nal/voivodeship level can be easily obtained from statistical office. Howe-ver it must be emphasized that data for 2015 year are uncertain because only available data were for June 2015 and did not cover the whole year. In case of horses and goats population the data were the same for 2014 and 2015 and that is why the data for 2015 may be underestimated.
Conclusions
1. In last decades intensification and “industrialization” of agriculture induced the increased methane and nitrous oxide emissions in the Podla-skie Voivodeship. Recent transformation of low-intensity agriculture into commercially oriented and competitive economic activity entails the environmental burdens such as increased GHG emissions.
2. The overall growing trend in GHG emissions from agriculture is primarily related to increasing number of livestock, specifically ruminant animals and nitrous oxide emissions from soils and manure management. The expanding number of cattle causes the enlargement of fodder produc-tion, mainly the maize crops. This, in turn, entails higher usage of N ferti-lizers, which in consequence enhances the nitrous oxide emissions.
3. The Podlaskie Voivodeship should introduce measures to reduce GHG emissions from agriculture. However, the mitigation options must not affect farmer’s income while reducing the various environmental bur-

Agnieszka Wysocka-Czubaszek et al.450
dens. In changing food market, farmers are likely to be forced to find new niches, which will be profitable but less troublesome for the environment, including GHG emissions and will take animal welfare into consideration.
Translated by AgnieszKA WysocKA-czuBAszeKAccepted for print 10.05.2018
ReferencesAuDsley e., WilKinson M. 2014. What is the potential for reducing national greenhouse gas emis-
sions from crop and livestock production systems? J. Clean. Prod., 73: 263–268.BAcenetti J., BAvA l., zucAli M., lovArelli D., sAnDrucci A., tAMBurini A., FiAlA M. 2016.
Anaerobic digestion and milking frequency as mitigation strategies of the environmental bur-den in the milk production system. Sci. Total Environ., 539: 450–459.
BAJzelJ B., ricHArDs K.S., AllWooD J.M., sMitH P., Dennis J.S., curMi e., gilligAn C.A. 2014. Importance of food-demand management for climate mitigation. Nat. Clim. Change, 4: 924–929.
BeAucHeMin K.A., JAnzen H.H., LittLe S.M., McAllister T.A., Mcginn S.M. 2011. Mitigation of greenhouse gas emissions from beef production in western Canada – Evaluation using farm--based life cycle assessment. Anim. Feed Sci. Tech., 166–167: 663–677.
BeLL M.J., Hinton n., cloA J.M., toPP C.F.E., rees R.M., cArDenAs l., scott t., WeBster c., asHton R.W., wHitMore A.P., wiLLiaMs J.R., BAlsHAW H., PAine F., goulDing K.W.T., cHADWicK D.R. 2015. Nitrous oxide emissions from fertilised UK arable soils. Fluxes, emission factors and mitigation. Agr. Ecosyst. Environ., 212: 134–147.
BeLL M.J., Hinton N.J., cloy J.M., toPP C.F.E., rees R.M., wiLLiaMs J.R., MisseLBrook T.H., cHADWicK D.R. 2016. How do emission rates and emission factors for nitrous oxide and am-monia vary with manure type and time of application in a Scottish farmland? Geoderma, 264: 81–93.
Bennett r., BlAney r. 2002. Social consensus, moral intensity and willingness to pay to address a farm animal welfare issue. J. Econ. Psychol., 23: 501–520.
BurAtti c., FAntozzi F., BArBAnerA M., lAscAro e., cHiorri M., ceccHini l. 2017. Carbon footprint of conventional and organic beef production systems. An Italian case study. Sci. Total Environ., 576: 129–137.
cHADWicK D.R., sneatH R.W., PHiLLiPs V.R., Pain B.F. 1999. A UK inventory of nitrous oxide emissions from farmed livestock. Atmos. Environ., 33(20): 3345–3354.
cHADWicK D., soMMer s., tHorMAn r., FAngueiro D., cArDenAs l., AMon B., MisselBrooK t. 2011. Manure management. Implications for greenhouse gas emissions. Anim. Feed Sci. Tech., 166–167: 514–531.
coloMBini s., zucAli M., rAPetti l., crovetto G.M., sAnDrucci A., BAvA l. 2015. Substitution of corn silage with sorghum silages in lactating cow diets. In vivo methane emission and global warming potential of milk production. Agr. Syst., 136: 106–113.
CSO 2017. Means of production in agriculture in the 2015/2016 farming year. Central Statistical Office, Warsaw.
DAlgAArD t., olesen J.E., Petersen s.O., Petersen B.M., Jørgensen u., Kristensen t., Hut-cHings n.J., gylDenKærne s., HerMAnsen J.E. 2011. Developments in greenhouse gas emis-sions and net energy use in Danish agriculture – How to achieve substantial CO2 reductions? Environ. Pollut., 159: 3193–3203.
De vries M., De Boer i.J.M. 2010. Comparing environmental impacts for livestock products: A review of life cycle assessments. Livest. Sci., 128: 1–11.
DeeMer D.R, LoBao L.M. 2011. Public concern with farm-animal welfare. Religion, politics, and human disadvantage in the food sector. Rural Sociol., 76(2): 167–196.

Methane and Nitrous Oxide Emissions... 451
Del PrADo A., cHADWicK D., cArDenAs l., MisselBrooK t., scHoleFielD D., Merino P. 2010. Exploring systems responses to mitigation of GHG in UK dairy farms. Agr. Ecosyst. Environ., 136: 318–332.
DesJArDins r.L., WortH D.E., PAttey e., vAnDerzAAg A., srinivAsAn r., MAuDerc M., WortHy D., sWeeney c., Metzger s. 2018. The challenge of reconciling bottom-up agricultural methane emissions inventories with top-down measurements. Agr. Forest Meteorol., 248: 48–59.
EC-JRC 2015. Energy use in the EU Food Sector. State of play and opportunities for improvement. JRC Science and Policy Report. European Commission, Joint Research Centre, Institute for Energy and Transport and Institute for Environment and Sustainability, Publications Office of the European Union, Luxembourg.
EUROSTAT 2016a. Greenhouse gas emission statistics. Eurostat Statistics Explained. http://ec.europa.eu/eurostat/statistics-explained/index.php/Greenhouse_gas_emission_ Statistics, access: 14.11.2017.
EUROSTAT 2016b. Agriculture – greenhouse gas emission statistics. Eurostat Statistics Expla-ined. http://ec.europa.eu/eurostat/statistics-explained/index.php/Agriculture_-_greenhouse_gas_emission_statistics#Agriculture.27s_contribution, access: 14.11.2017.
EUROSTAT 2016c. Greenhouse gas emissions by source sector. http://ec.europa.eu/eurostat/web/environment/air-emissions-inventories/database, access: 14.11.2017.
EUROSTAT 2016d. Milk and milk production. Eurostat Statistics Explained. http://ec.europa.eu/eurostat/statistics-explained/index.php/Milk_and_milk_product_ statistics, access: 14.11.2017.
FeliciAno D., Hunter c., slee B., sMitH P. 2013. Selecting land-based mitigation practices to reduce GHG emissions from the rural land use sector. A case study of North East Scotland. J. Environ. Manage., 120: 93–104.
FlysJö A., ceDerBerg c., HenriKsson c., leDgArD s. 2012. The interaction between milk and beef production and emissions from land use change – critical considerations in life cycle as-sessment and carbon footprint studies of milk. J. Clean. Prod., 28: 134–142.
FreiBauer a. 2003. Regionalised inventory of biogenic greenhouse gas emissions from European agriculture. Europ. J. Agronomy, 19: 135–160.
garnett t. 2009. Livestock-related greenhouse gas emissions: impact and options for policy ma-kers. Environ. Sci. Policy, 12: 491–503.
gerssen-gonDelAcH s.J., lAuWeriJssen r.B.G., HAvlíK P., Herrero M., vAlin H., FAAiJ A.P.C., WicKe B. 2017. Intensification pathways for beef and dairy cattle production systems. Impacts on GHG emissions, land occupation and land use change. Agr. Ecosyst. Environ., 240: 135–147.
górniAK A. 2000. Klimat województwa podlaskiego. Białystok, IMGW.GVI 2017. Komunikat Głównego Lekarza Weterynarii o ogniskach afrykańskiego pomoru świń
(ASF) u świń. General Veterinary Inspectorate, https:// www.wetgiw.gov.pl/main/komuni-katy/Komunikat-Glownego-Lekarza-Weterynarii-o-ogniskach-afrykanskiego-pomoru-swin--ASF-u-swin/idn:634, access: 15.12.2017.
Hansen M.N., Henriksen k., soMMer s.G. 2006. Observations of production and emission of greenhouse gases and ammonia during storage of solids separated from pig slurry: effects of covering. Atmos. Environ., 40: 4172–4182.
Hansen M.J., nørgAArD J.V., ADAMsen A.P.S., PouLsen H.D. 2014. Effect of reduced crude pro-tein on ammonia, methane, and chemical odorants emitted from pig houses. Livest. Sci., 169: 118–124.
Hillier J., WAlter c., MAlin D., gArciA-suArez t., MilA-i-cAnAls c., sMitH P. 2011. A farm--focused calculator for emissions from crop and livestock production. Environ. Model. Softwa-re, 26: 1070–1078.
HünerBerg M., little s.M., BeAucHeMin K.A., Mcginn s.M., o’connor D., oKine e.K., Har-stAD o.M., KröBel r., McAllister t.A. 2014. Feeding high concentrations of corn dried di-stillers’ grains decreases methane, but increases nitrous oxide emissions from beef cattle pro-duction. Agr. Syst., 127: 19–27.
IPCC 2006. IPCC Guidelines for National Greenhouse Gas Inventories. Intergovernmental Panel on Climate Change, http://www.ipcc-nggip.iges.or.jp/public/2006gl/, access: 15.10.2017.

Agnieszka Wysocka-Czubaszek et al.452
IPCC 2015. 9th Corrigenda for the 2006 IPCC Guidelines. Intergovernmental Panel on Climate Change, http://www.ipcc-nggip.iges.or.jp/public/2006gl/corrigenda9.html, access: 5.10.2017.
iserMann k. 1994. Agriculture’s share in the emission of trace gases affecting the climate and some cause-oriented proposals for sufficiently reducing this share. Environ. Pollut., 83: 95–111.
kruszewski t. 2011. Pogłowie koni w Polsce i w województwie podlaskim. In: Analiza kierunków rozwoju i aktualna sytuacja w rolnictwie województwa podlaskiego. Podlaski Ośrodek Doradz-twa Rolniczego w Szepietowie, pp. 68–69.
lAgerKvist c.J., cArlsson F. visKe D. 2006. Swedish consumer preferences for animal welfare and biotech. A choice experiment. AgBioForum, 9(1): 51–58.
LDB 2015. Livestock population. Local Data Bank. Central Statistical Office, Warsaw, https://bdl.stat.gov.pl/BDL/ dane/podgrup/tablica, access: 27.10.2017.
LDB 2016. Consumption of mineral fertilizers per 1 ha of agricultural land according to the new definition. Local Data Bank. Central Statistical Office, Warsaw, https://bdl.stat.gov.pl/BDL/ dane/podgrup/tablica, access: 27.10.2017.
LDB 2017. Population by residence (quarterly data). Local Data Bank. Central Statistical Office, Warsaw, https://bdl.stat.gov.pl/BDL/dane/podgrup/tablica, access: 22.01.2018.
litWińczuK z., groDzKi H. 2014. Stan hodowli i chowu bydła w Polsce oraz czynniki warunkują-ce rozwój tego sektora. Przegląd Hodowlany, 6: 1–5.
MADeJ A. 2015. Rolnictwo województwa podlaskiego po 10 latach w Unii Europejskiej na tle Pol-ski. Zagad. Ekon. Roln., 2(343): 94–111.
MAssé D.I., taLBot g., giLBert Y. 2011. On farm biogas production. A method to reduce GHG emissions and develop more sustainable livestock operations. Anim. Feed Sci. Tech., 166–167: 436–445.
McAllister t.A., BeAucHeMin K.A., Mcginn s.M., HAo x., roBinson P.H. 2011. Greenhouse gases in animal agriculture. Finding a balance between food production and emissions. Anim. Feed Sci. Tech., 166–167: 1–6.
MisselBrooK t., Del PrADo A., cHADWicK D. 2013. Opportunities for reducing environmental emissions from forage-based dairy farms. Agr. Food Sci., 22: 93–107.
Montenegro J., BArrAntes e., Dilorenzo n. 2016. Methane emissions by beef cattle consuming hay of varying quality in the dry forest ecosystem of Costa Rica. Livest. Sci., 193: 45–50.
Moran D., Macleod M., Wall E., Eory V., Mcvittie A., Barnes A., Rees R., Topp C.F.E., Moxey A. 2011. Marginal abatement cost curves for UK Agricultural Greenhouse Gas Emissions. J. Agr. Econ., 62(1): 93–118.
naPoLitano F., giroLaMi a., BragHieri a. 2010. Consumer liking and willingness to pay for high welfare animal-based products. Trends Food Sci. Tech., 21: 537–543.
nAyAK D., sAetnAn e., cHeng K., WAng W., KosloWsKi F., cHeng Y.F., zHu W.Y., wang J.K., Liu J.X., MorAn D., yAn x., cArDenAs l., neWBolD J., PAn g., lu y., sMitH P. 2015. Ma-nagement opportunities to mitigate greenhouse gas emissions from Chinese agriculture. Agr. Ecosyst. Environ., 209: 108–124.
NCEM 2016. Poland’s national inventory report 2016. Greenhouse gas inventory for 1988–2014. Institute of Environmental protection – National Research Institute, The National Centre for Emissions Management. Warsaw.
nguyen T.L.T, HerMAnsen J.e., Mogensen l. 2012. Environmental costs of meat production: the case of typical EU pork production. J. Clean. Prod., 28: 168–176.
notArnicolA B., tAssielli g., renzulli P.A., cAstellAni v., sAlA s. 2017. Environmental impacts of food consumption in Europe. J. Clean. Prod., 140: 753–765.
nowak M.M. 2016. Baza surowcowa przemysłu mleczarskiego w ujęciu regionalnym. Rocz. Nauk. Stow. Ekon. Roln. Agrobiz., 18(5): 189–194.
o’Mara F.P. 2011. The significance of livestock as a contributor to global greenhouse gas emissions today and in the near future. Anim. Feed Sci. Tech., 166–167: 7– 15.
PFCDF 2016. Evaluation and breeding of dairy cattle, data for 2015. Polish Federation of Cattle Breeders and Dairy Farmers, http://www.pfhb.pl/uploads/ckeditor/ attachments/208/wyniki_ oceny_2016_prev_p.pdf, access: 18.12.2017.

Methane and Nitrous Oxide Emissions... 453
roer A.N., JoHAnsen A., BAKKen A.K., DAugstAD K., Fystro g., strøMMAn A.H. 2013. Environ-mental impacts of combined milk and meat production in Norway according to a life cycle assessment with expanded system boundaries. Livest. Sci., 155: 384–396.
sMitH P. 2012. Agricultural greenhouse gas mitigation potential globally, in Europe and in the UK: what have we learnt in the last 20 years. Glob. Change Biol., 18: 35–43.
so 2015a. Environmental protection and forestry of Podlaskie Voivodeship in 2014. Statistical Information and Elaborations, Year XI. Statistical Office in Białystok, Białystok.
so 2015b. Agriculture in Podlaskie Voivodeship. Statistical Information and Elaborations, Year XI. Statistical Office in Białystok, Białystok.
so 2016. Agriculture in Podlaskie Voivodeship. Statistical Information and Elaborations, Year XII. Statistical Office in Białystok, Białystok.
solAzzo r., DonAti M., toMAsi l., ArFini A. 2016. How effective is greening policy in reducing GHG emissions from agriculture? Evidence from Italy. Sci. Total Environ., 573: 1115–1124.
soMMer S.G., Petersen s.O., Møller H.B. 2004. Algorithms for calculating methane and nitro-us oxide emissions from manure management. Nutr. Cycl. Agroecosys., 69: 143–154.
sun Y.K., yAn X.G., Ban Z.B., yAng H.M., HegArty R.S., zHao Y.M. 2017. The effect of cysteami-ne hydrochloride and nitrate supplementation on in-vitro and in-vivo methane production and productivity of cattle. Anim. Feed Sci. Tech., 232: 49–56.
trAJer M., KossAKoWsKA J. 2013. Tendencje zmian w pogłowiu trzody chlewnej w Polsce. In-foPOLSUS. Ogólnopolski Biuletyn dla Hodowców i Producentów Trzody Chlewnej, 16: 7–11.
turner A.J., JAcoB D.J., WecH, K.J., Maasakkers J.D., lunDgren e., AnDreWs A.E., Bi- rAuD S.C., BoescH H., BoWMAn K.W., DeutscHer N.M., DuBey M.K., griFFitH D.W.T., HAse F., Kuze A., notHolt J., oHyAMA H., PArKer r., PAyne V.H., sussMAnn r., sWeeney c., velAzco V.A., warneke t., wennBerg P.O., WuncH D. 2015. Estimating global and North American methane emissions with high spatial resolution using GOSAT satellite data. Atmos. Chem. Phys., 15: 7049–7069.
WAng J., cArDenAs L.M., MisseLBrook T.H., gilHesPy s. 2011. Development and application of a detailed inventory framework for estimating nitrous oxide and methane emissions from agriculture. Atmos. Environ., 45: 1454–1463.
WysocKA-czuBAszeK A., czuBAszeK r., roJ-roJeWsKi s., BAnAszuK P. 2018. Methane and ni-trous oxide emissions from agriculture on a regional scale. J. Ecol. Eng., 19(3): 206–217.
yu J., PengA s., cHAng J., ciAis P., DuMAs P., lin x., PiAo s. 2018. Inventory of methane emis-sions from livestock in China from 1980 to 2013. Atmos. Environ., 184: 69–76.


POLISH JOURNAL OF NATURAL SCIENCES Abbrev.: Pol. J. Natur. Sc., Vol 33(3): 455–485, Y. 2018
USE OF BIOTIC RESOURCES OF ROZTOCZE IN TOURISM OFFERS IN THE CONTEXT
OF THE THEORETICAL CONCEPT OF TOURISM AREA PRODUCT*
Teresa Brzezińska-Wójcik
Department of Regional Geography and TourismMaria Curie-Skłodowska University in Lublin, Poland
K e y w o r d s: biotic natural resources, tourism offer, tourism area product, Roztocze region.
A b s t r a c t
The paper presents investigations of the relationships between biotic resources and available tourism offers associated with these assets. In this context, the need for creation of an area product in Roztocze has been highlighted. The goals were achieved using the stocktaking and query methods.
The study results indicate that the biotic assets are not fully represented in the most frequently promoted products, i.e. trails, objects, and events. The distribution of unexploited biotic assets and the diagnosis of the required levels and features of an area product imply that such a product in the Roztocze region should be established based on the resources of the Roztoczański National Park, landscape parks, and the existing brand Roztocze – witalność z natury.
Address: Teresa Brzezińska-Wójcik, Maria Curie-Skłodowska University in Lublin, al. Kraśnicka 2d, 20-718 Lublin, phone: +48 (81) 537 68 51, e-mail: [email protected]* This research was supported financially by Faculty of Earth Sciences and Spatial Management, Maria Curie-Skłodowska University in Lublin, Poland.

Teresa Brzezińska-Wójcik456
WYKORZYSTANIE ZASOBÓW PRZYRODY OŻYWIONEJ ROZTOCZA W OFERTACH TURYSTYCZNYCH W KONTEKŚCIE
TEORETYCZNEJ KONCEPCJI OBSZAROWEGO PRODUKTU TURYSTYCZNEGO
Teresa Brzezińska-Wójcik
Zakład Geografii Regionalnej i TuryzmuUniwersytet Marii Curie-Skłodowskiej
S ł o w a k l u c z o w e: zasoby przyrody ożywionej, oferta turystyczna, obszarowy produkt turystyczny, Roztocze.
A b s t r a k t
Zaprezentowano wyniki badań nad zależnością między zasobami przyrody ożywionej a ist-niejącymi ofertami turystycznymi z nimi związanymi. W tym kontekście wskazano na potrzebę kreowania na Roztoczu produktu obszarowego. Założone cele zrealizowano, stosując metody in-wentaryzacji i kwerendy.
Uzyskane wyniki wskazują, że walory przyrody ożywionej nie są jeszcze w pełni uwzględnio-ne w najczęściej promowanych produktach – szlakach, obiektach i wydarzeniach. Rozmieszczenie niewykorzystanych walorów przyrody ożywionej oraz diagnoza w zakresie wymaganych pozio-mów i cech produktu obszarowego wskazują, że produkt taki na Roztoczu powinien być budowa-ny w nawiązaniu do zasobów Roztoczańskiego Parku Narodowego, parków krajobrazowych oraz istniejącej marki Roztocze – witalność z natury.
Introduction
A tourism area product should be formed of different individual mate-rial (object) and non-material (service) products as well as complex organ-isationally and spatially integrated products (object, festivity, event, and trail) created by various entities functioning in a touristic area (rocH-MińsKA and stasiak 2004). All these products should match the accepted idea and philosophy of the entire area and complement and enrich each other (stasiak 2005). Resources of the natural environment are important in this respect. In many regions, tourism based on such assets contributes to economic growth and induces positive changes in social awareness on a regional scale (e.g. Berry and lADKin 1997, BucKley et al. 2008, MoL-lArD and voLLet 2015).
The need to develop an integrated tourist product based on natural resources has been highlighted by e.g. DoWling (1993), BosteDt and Mattsson (1995), niezgoDA (2000), skowronek et al. (2015), and Pana-

Use of Biotic Resources of Roztocze in Tourism Offers in The Context... 457
siuk (2015). Such assets facilitate creation of an attractive product offer-ing recreation with varied degrees of specialisation (e.g. goDFrey 1998, FreDMAn et al. 2012). However, a majority of entities operating in a par-ticular area are often engaged in individual tourism activities (niezgoDA 2000), which results in availability of similar offers, i.e. most frequently – trails. Therefore, some questions arise: to what extent are the biotic assets of Roztocze used in the product offer – following the definition proposed by DoWling (1993), MiDDleton (1996) or KAczMAreK et al. (2010) and what should be done to exploit them fully? Furthermore, can the diversified biotic resources and long-lasting tourists’ interest in Roztocze (śWiecA et al. 2015) be the basis for complementation of the concept of the tourism area offer (BrzezińsKA-WóJciK 2017), which will relieve the tourist traffic and disperse tourists to areas that have been poorly visited so far?
The aim of this study is: 1) to present the degree of the exploitation of biotic assets of the Polish part of the Roztocze region in the current tour-ism offer, 2) to assess how offers related to biotic assets meet the principles of the theoretical concept of an integrated nature tourism product in this region.
Material and Method
Biotic resources
The study was carried out using indirect and direct sources of data. The first stage consisted in collection, classification, and analysis of biotic assets of Roztocze in functional terms. Secondary resource materials (relevant literature; publication Tourism offers – Lublin Region 2016/17 compiled by the Lublin Regional Tourist Organization (LRTO) for pro-motion of tourist products available in the Province during tourism fairs; a list of products submitted to a competition for the Best Tourism Product of Lublin Province organised annually by LRTO; websites of Local Tourist Organizations – LTO Roztocze (representing communes: Tomaszów Lubel-ski, Bełżec, Jarczów, Krynice, Lubycza Królewska, Susiec, Tarnawatka, Narol in Roztocze, and Cieszanów, Tyszowce – outside Roztocze) and LTO Zamość i Roztocze (communes: Frampol, Janów Lubelski, Sułów, Szcze-brzeszyn, Józefów, Krasnobród, Zwierzyniec, Zamość in Roztocze, and Nie-lisz and Obsza – outside Roztocze), Local Action Groups – LAG Leśny Krąg (communes: Batorz, Chrzanów, Dzwola, Godziszów, Janów Lubelski, Modliborzyce), LAG Nasze Roztocze (communes: Adamów, Józefów, Kra-snobród, Zamość, Zwierzyniec), LAG Roztocze Tomaszowskie (communes:

Teresa Brzezińska-Wójcik458
Bełżec, Krynice, Lubycza Królewska, Susiec, Tarnawatka, Tomaszów Lubelski), Rybacka (Fishing) LAG Roztocze (communes: Adamów, Bełżec, Krasnobród, Tomaszów Lubelski, Lubycza Królewska, Narol), local gover-nment institutions, and individual entities; issued promotional materials; strategic documents) were used in the query method. The results of field stocktaking (raw data) carried out in 2015–2017 were included in the rese-arch procedure. Next, the method of description combined with other methods (including screening, historical analysis, and analysis of develop-ment opportunities, cartography) was employed to explore the ways of inc-lusion of the biotic assets in the currently available tourism products, and the need for creation of the regional tourism product based on hitherto unexploited resources was highlighted.
The natural Roztocze region extends from Kraśnik to Lviv. Its total length is approximately 180 km (110 km in Poland) and its width ranges from several to over twenty kilometres. Given its varied natural traits, the region has been divided into four subregions (BurAczyńsKi 1995): Rozto-cze Gorajskie, Roztocze Szczebrzeszyńskie, Roztocze Tomaszowskie, and Roztocze Rawskie.
Assessment of the natural resources of Roztocze in the context of deve-lopment of various forms of tourism was presented by BrzezińsKA-WóJciK (2012), BrzezińsKA-WóJciK and śWiecA (2014), and śWiecA et al. (2015). The tourism offer based on various tourism assets was discussed by Brze-zińsKA-WóJciK et al. (2017), and analysis of abiotic resources in the cur-rent tourism offer in functional terms within the concept of an area pro-duct was provided in a study conducted by BrzezińsKA-WóJciK (2017). Yet, there is no synthetic study of the range and use of biotic assets in the available tourism offer in functional terms that would complement the concept of the area product.
According to the classification of natural assets in functional terms proposed by liJeWsKi et al. (2002), the Polish part of Roztocze has a relatively large number of sightseeing, leisure, and specialist assets. They are related to the phytosphere (species composition of plant commu-nities with their availability and suitability for recreation), zoosphere (animal world with birds in particular), and hydrosphere (fish).
Sightseeing assets of biotic resources
Besides plant communities, the major natural sightseeing assets include monuments of nature, nature reserves, ecological areas, and pecu-liarities of avifauna.

Use of Biotic Resources of Roztocze in Tourism Offers in The Context... 459
Small-leaved lindens are the most common natural monuments (Tables 1–2) in Roztocze: there are 190 of these trees in Roztocze Tomaszowskie (e.g. in the former manor park in Bełżec, Kosobudy, Majdan Nepryski, Tarnawatka, and Adamów), 40 in Roztocze Rawskie (in Narol-Wieś), 39 in Roztocze Gorajskie (in Turobin, Radecznica, Batorz, and Wólka Batorska), and 12 in Roztocze Szczebrzeszyńskie (in Szczebrzeszyn).
Table 1 List of flora peculiarities – monument trees and tree groups in the communes
of Roztocze Gorajskie and Roztocze Szczebrzeszyńskie
Subregions Communes
Com
mon
bee
ch
Pedu
ncul
ate
oak
Com
mon
pea
r
Com
mon
ash
Whi
te c
hest
nut
Syca
mor
e
Map
le
Smal
l-lea
ved
linde
n
Broa
d-le
aved
lind
en
Crim
ean
linde
n
Euro
pean
larc
h
Wey
mou
th p
ine
Scot
s el
m
Fiel
d el
m
Euro
pean
whi
te e
lm
Whi
te w
illow
Roztocze Gorajskie
Batorz 4 2 10 1 1 1 1Chrzanów 1Dzwola 1 2 1Frampol town and commune 2 2
Godziszów 1 1GorajJanów Lubelski town and commune
2 1 2 3 5
Modliborzyce town and commune
1 1 1 1 1 2 1 1
Radecznica 9 1 1 8Szastarka 1 2 1 2Turobin 15
Roztocze Szcze-
brzeszyńskie
Biłgoraj 1SułówSzczebrzeszyn town and commune
5 2 2 1 9 2 4 2
Tereszpol 1 1 1 1 3 3Total in Roztocze 25 54 3 28 66 11 45 281 14 2 2 1 3 4 7 1
Source: own study based on: Rejestr pomników… 2013, Pomniki przyrody… 2017, Zespół Parków… 2017
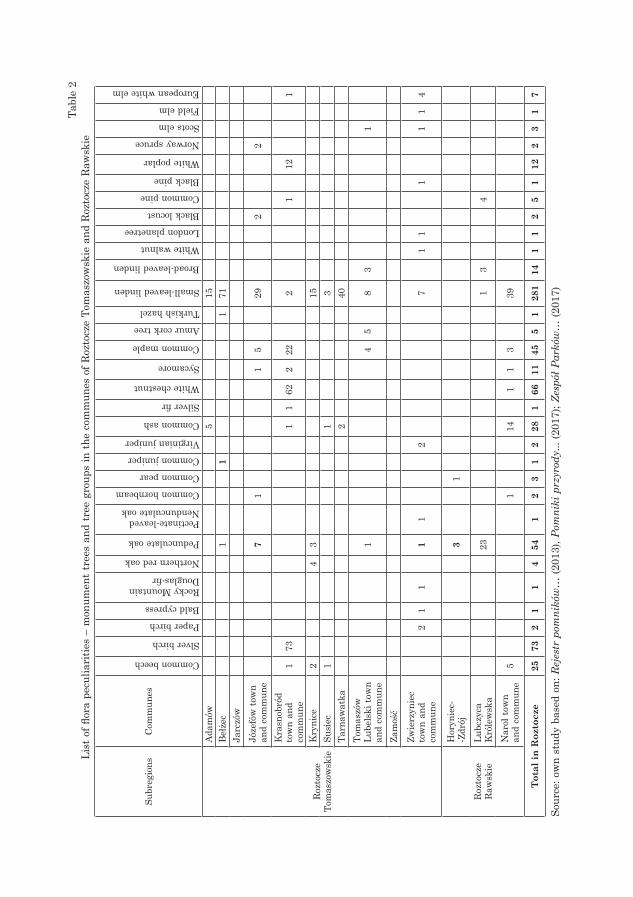
Tabl
e 2
Lis
t of fl
ora
pecu
liari
ties
– m
onum
ent t
rees
and
tree
gro
ups
in th
e co
mm
unes
of R
ozto
cze
Tom
aszo
wsk
ie a
nd R
ozto
cze
Raw
skie
Subr
egio
nsCo
mm
unes
Common beech
Slver birch
Paper birch
Bald cypress
Rocky MountainDouglas-fir
Northern red oak
Pedunculate oak
Pectinate-leaved Nendunculate oak
Common hornbeam
Common pear
Common juniper
Virginian juniper
Common ash
Silver fir
White chestnut
Sycamore
Common maple
Amur cork tree
Turkish hazel
Small-leaved linden
Broad-leaved linden
White walnut
London planetree
Black locust
Common pine
Black pine
White poplar
Norway spruce
Scots elm
Field elm
European white elm
Rozt
ocze
To
mas
zow
skie
Adam
ów5
15Be
łżec
11
171
Jarc
zów
Józe
fów
tow
n an
d co
mm
une
71
15
292
2
Kra
snob
ród
tow
n an
d co
mm
une
173
11
622
222
112
1
Kry
nice
24
315
Susi
ec1
13
Tarn
awat
ka2
40To
mas
zów
Lu
bels
ki to
wn
and
com
mun
e1
45
83
1
Zam
ość
Zwie
rzyn
iec
tow
n an
d co
mm
une
21
11
12
71
11
11
4
Rozt
ocze
Raw
skie
Hor
ynie
c--Z
drój
31
Lubc
zyca
Kró
lew
ska
231
34
Nar
ol to
wn
and
com
mun
e5
114
11
339
Tota
l in
Roz
tocz
e25
732
11
454
12
31
228
166
1145
51
281
141
12
51
122
31
7
Sour
ce: o
wn
stud
y ba
sed
on: R
ejestr pom
ników
… (2
013)
, Pom
niki przyrody.
.. (2
017)
; Zespół P
arków
… (2
017)

Use of Biotic Resources of Roztocze in Tourism Offers in The Context... 461
The second most common monuments are pedunculate oaks with their greatest number (14) in Roztocze Szczebrzeszyńskie (in particular in Górecko Kościelne and Szczebrzeszyn) and in Roztocze Rawskie (espe-cially in Siedliska). Many common beeches can be found in Roztocze Goraj-skie (16, the greatest number in Radecznica and Batorz) and in Roztocze Rawskie (all in Huta Złomy – Złomy Ruskie). The other groups are formed by maples, broad-leaved lindens, common ashes, Crimean lindens and European larches, field elms, European white elms, and common pears, silver birches, white chestnuts, white poplars, Amur cork trees, and com-mon pines (Tables 1–2).
The localities of the common snowdrop and twinflower in Turzynieckie Doły in Roztocze Szczebrzeszyńskie are potentially important from the point of view of the landscape tourism offer (Rejestr pomników przyrody… 2013; Regionalna Dyrekcja… 2017, Pomniki przyrody… 2017, Zespół Par-ków Krajobrazowych… 2017 ).
Forest communities represent the most numerous group of nature reserves (Table 3 ), e.g. “Zarośle” (Tomaszów Lubelski commune), “Debry” in Adamów commune, “Święty Roch” (Krasnobród commune) in Roztocze Tomaszowskie; “Minokąt” in Kadłubiska (Narol commune) and “Jalinka” in Siedliska (Lubycza Królewska commune) in Roztocze Rawskie.
Table 3 List of nature reserves and ecological areas in Roztocze
Subregions Communes
Nature reserves Ecological areas
flori
stic
peat
land
fore
stst
eppe
land
scap
ela
kes
pond
sm
arsh
espe
atla
nds
mea
dow
sfo
rest
str
ees
and
shru
bsxe
roth
erm
icco
mm
uniti
esla
ndsc
ape
Roztocze Gorajskie
BatorzChrzanów
Dzwola 1Frampol town and
communeGodziszów
GorajJanów Lubelski
town and commune 1 1
Modliborzyce town and commune 1 3 1 1
RadecznicaSzastarkaTurobin

Teresa Brzezińska-Wójcik462
Roztocze Szczebrzeszyńskie
BiłgorajSułow
Szczebrzeszyn town and commune 1
Tereszpol
Roztocze Tomaszowskie
Adamów 1Bełżec
Jarczów 1 1Józefów town and
commune 2
Krasnobród town and commune 1 1
KryniceSusiec 1 1
Tarnawatka 1 1Tomaszów Lubelski town and commune 1 1
ZamośćZwierzyniec town
and commune 1
Roztocze Rawskie
Horyniec-Zdrój 1 1 6 1Lubycza Królewska 1 1 1
Narol town and commune 1 2 2 1 3 12 1
Total in Roztocze 2 4 7 1 3 2 4 13 2 1 13 1 4 1Source: own study based on: Rejestr rezerwatów przyrody w województwie lubelskim. 2017; Re-jestr rezerwatów przyrody w województwie podkarpackim. 2017; Rejestr użytków ekologicznych w województwie lubelskim. 2011; Rejestr użytków ekologicznych w województwie podkarpackim. 2017 bold type – assets included in the offer
The second most numerous communities are floristic reserves, e.g. “Skrzypny Ostrów” (Tarnawatka commune) in Roztocze Tomaszowskie, “Sołokija” in Dziewięcierz (Horyniec-Zdrój commune) in Roztocze Rawskie; landscape reserves – “Szum” and “Czartowe Pole” (Józefów commune), “Nad Tanwią” (Susiec commune) in Roztocze Tomaszowskie, and peatland reserves such as “Nowiny” (Susiec commune) in Roztocze Tomaszowskie and “Źródła Tanwi” (Narol commune) in Roztocze Rawskie. There are sin-gle steppe reserves, e.g. “Machnowska Góra” in Roztocze Rawskie (Rejestr rezerwatów przyrody w województwie lubelskim. 2012, Rejestr rezerwatów przyrody w województwie podkarpackim. 2017).
The most numerous ecological areas are represented by marshes – “Bagna” and “Czerwone Bagno” in Lipie, “Spalone Bagno” in Łówcza and water reservoirs – “Suche Jezioro” in Lipie and “Staw” in Kadłubiska – in

Use of Biotic Resources of Roztocze in Tourism Offers in The Context... 463
Roztocze Rawskie. The second most numerous areas are forests – e.g. “Goraje”, “Kobyle Jezioro” in Huta Złomy, “Świerzbiączka” in Kadłubiska, “Sigiełka” in Huta Różaniecka, and “Wroni Dół” in Lipie – all areas are located in Roztocze Rawskie. The localities of xerothermic vegetation in Majdan Górny in Roztocze Tomaszowskie and in Korhynie and Żurawce in Roztocze Rawskie are unique due to their plant composition. Great impor-tance for tourism and recreation can be ascribed to aquatic ecological areas, e.g. “Belfond” in Hutki-Namule and “Stawy” in Tarnawatka in Roz-tocze Tomaszowskie as well as “Suche Jezioro” in Lipie and “Staw” in Kadłubiska in Roztocze Rawskie (Table 3).
Natural forests are associated with peculiarities of avifauna. These include the black stork, Accipitriformes (honey buzzard, white-tailed eagle, black kite, lesser-spotted eagle), owls (European eagle-owl, Eura-sian pygmy owl), woodpeckers (grey-headed, middle-spotted, white-backed), stock dove, and Passeriformes (firecrest, spotted flycatcher). Wet-land and aquatic communities offer habitats for e.g. the mallard, little grebe, western marsh harrier, and great crested grebe. The lark, yellow-hammer, and common whitethroat inhabit open habitats, i.e. cultivated land, whereas the white stork, collared dove, common swift, white wagtail, and barn swallow live in urbanised areas (stAcHyrA et al. 2015). Lasy Janowskie forests located in the southern part of Roztocze Gorajskie are one of the last refugia of the western capercaillie. The common kingfisher is another rare species inhabiting the area (Prognoza… 2012).
Historical parks, museums, and nature collections were touristic natural and man-made assets inventoried in the Polish part of Roz-tocze.
The touristic attractiveness of the historical parks is ensured by the original tree and shrub species composition on the one hand and the artis-tic value of their arrangement on the other hand. The most numerous remains of manor parks (Table 4 ) are found in Roztocze Gorajskie – in Kąty, Radzięcin, Abramów, Goraj-Zagrody, Modliborzyce, and Wierzchowi- ska and in Roztocze Tomaszowskie – in Górecko Stare, Tarnawatka, Bełżec, Łaszczówka, Podlesina, and Ciotusza. There is a geometrical park in Łówcza in Roztocze Rawskie.
Another group is composed of remains of landscape parks (Table 4). In Roztocze Gorajskie, they are located in Stawce, Wola Studzieńska, and Brzozówka; there are also greenery complexes in Tarnawa Duża and on the Bernardine cloister hill in Radecznica. Remains of landscape parks can be found in Rogóźno, Krasnobród-Podzamek at the former Leszczyń-ski’s Palace, Krynice, and Kryniczki in Roztocze Tomaszowskie and in Sie-dliska and Narol in Roztocze Rawskie.
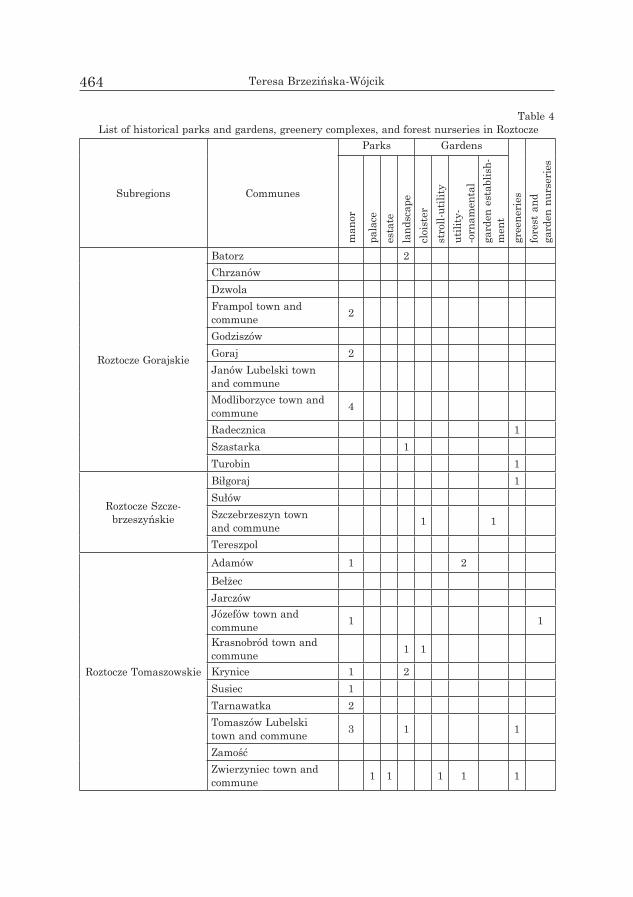
Teresa Brzezińska-Wójcik464
Table 4 List of historical parks and gardens, greenery complexes, and forest nurseries in Roztocze
Subregions Communes
Parks Gardens
gree
neri
esfo
rest
and
gard
en n
urse
ries
man
or
pala
cees
tate
land
scap
ecl
oist
erst
roll-
utili
tyut
ility
--o
rnam
enta
lga
rden
est
ablis
h-m
ent
Roztocze Gorajskie
Batorz 2ChrzanówDzwolaFrampol town and commune 2
GodziszówGoraj 2Janów Lubelski town and communeModliborzyce town and commune 4
Radecznica 1Szastarka 1Turobin 1
Roztocze Szcze-brzeszyńskie
Biłgoraj 1SułówSzczebrzeszyn townand commune 1 1
Tereszpol
Roztocze Tomaszowskie
Adamów 1 2BełżecJarczówJózefów town and commune 1 1
Krasnobród town and commune 1 1
Krynice 1 2Susiec 1Tarnawatka 2Tomaszów Lubelski town and commune 3 1 1
ZamośćZwierzyniec town and commune 1 1 1 1 1

Use of Biotic Resources of Roztocze in Tourism Offers in The Context... 465
Roztocze RawskieHoryniec-Zdrój 1Lubycza Królewska 1 1Narol town and commune 1 1
Total in Roztocze 18 2 1 9 2 2 3 1 7 1
Source: own study based on: FiJAłKoWsKi and kseniak (1982), rolsKA-BorucH (2002), Rejestr pomników przyrody w województwie lubelskim. 2012
The historical parks of Roztocze Tomaszowskie exhibit the highest diversity of spatial design (Table 4). A large group is composed of objects belonging to the Zamoyski Estate in Zwierzyniec. They comprise the Park Ordynacji [Estate Park] (palace park, greenery on the islet and at the water axis), Park Plenipotenta [Plenipotentiary Park], and Ogrody Oficja-listów [Officials’ Gardens], the former Estate forest and garden nurseries in Florianka. The residential park established as an Ecological Park in the Wieprz river valley is an important resting place for residents of Zwierzy-niec and tourists. There is also a characteristic cloister greenery complex, cloister gardens, and a path leading to the “chapel-on-water” in Krasnob-ród-Podklasztor. A separate group is formed by the utility-ornamental gardens in Adamów and Szewnia Dolna.
In the Szczebrzeszyn subregion, there are remains of only two histori-cal parks – a cloister garden and a garden establishment in Szczebrzeszyn. In Roztocze Rawskie, the spa park is the only remnant of the palace park in Horyniec-Zdrój. Besides, there is interesting greenery on the Orthodox Church hill in Hrebenne (Table 4).
The widest range of biotic collections is displayed in Roztocze Toma-szowskie, i.e. in the Ośrodek Edukacyjno-Muzealny Roztoczańskiego Parku Narodowego [Educational and Museum Centre of the Roztoczański Natio-nal Park] in Zwierzyniec, Izba Leśna we Floriance [Forest Chamber in Florianka], Izba Przyrodnicza [Nature Chamber] at the headquarters of Józefów Forest Inspectorate, Muzeum Wsi Krasnobrodzkiej i Geologicz-no-Garncarskie [Museum of Krasnobród Village and Museum of Geology, and Pottery] in Krasnobród, Eko-museum “Olejarnia Staropolska na Roz-toczu” [Eco-museum “Old-Polish Oil Mill in Roztocze”] in Zadnoga (Lokalna Organizacja Turystyczna “Roztocze”. 2017).
In terms of tourism, natural sightseeing assets with a character and significance unaffected by human interference are equally interesting. This group is represented by the Roztoczański National Park and landscape parks – “Lasy Janowskie”, Szczebrzeszyński, Krasno-brodzki, Puszcza Solska, and Południoworoztoczański Landscape Park (Figure 1).

Teresa Brzezińska-Wójcik466
Fig.
1.
Fore
st c
over
with
in c
omm
une
boun
dari
es a
nd la
rge-
spac
e pr
otec
ted
area
s in
Roz
tocz
e

Use of Biotic Resources of Roztocze in Tourism Offers in The Context... 467
The Roztoczański National Park is located in the central part of Roz-tocze Tomaszowskie and the eastern part of Roztocze Szczebrzeszyńskie. It is dominated by forests, which occupy 95.5% of the total area. Pine stands dominate (55.8% of the forest area) with admixtures of fir (19.4%), beech (17.4%), and oak (3.1%). The stands are mainly composed of suboce-anic fresh pine forest, upland fir forest, Carpathian beech forest, and sub-continental hornbeam-oak forest (tittenBrun 2013). The pine forest is characterised by the presence of the greatest number of avian species, e.g. the coal tit, goldcrest, and firescrest. Pine stands are habitats to many tree pipits, mistle thrushes, redstarts, and crested tits. Beech stands are asso-ciated with woodpeckers, flycatchers, and owls. The chaffinch lives in all the forest stands. The wetland communities (primarily “Echo” ponds) offer habitats for coots, mallards, and peewits. Since 1982, the Polish Primitive Horse, a descendant of the Tarpan horse, has been bred as an important peculiarity of the Park (KAProń et al. 2013). The entire area of the Park is inhabited by bats (stAcHyrA et al. 2013). In the Wieprz and Topornica valleys, there are surface water reservoirs, i.e. “Echo”, “Kościelny”, and “Topornica” ponds (Bartoszewski and MicHAlczyK 2013). The catfish, pike, tench, and Crucian carp can be caught in the “Echo” ponds (sta-cHyrA et al. 2013). The European bullhead, roach, and burbot are the most abundant fish species (DAnilKieWicz 1994).
The “Lasy Janowskie” Landscape Park situated in the southern part of Roztocze Gorajskie comprises an old pine forest with a fir admixture. There are also characteristic marsh and peatbog communities with aqu-atic and rush vegetation. It is a habitat of many birds, e.g. the osprey, greater spotted eagle, lesser spotted eagle, white-tailed eagle, black stork, and crane. The Park offers excellent living conditions in forest refugia for the elk (Zespół Lubelskich Parków… 2017).
The Szczebrzeszyński Landscape Park covers exceptionally pictu-resque fragments of Roztocze Gorajskie and Roztocze Szczebrzeszyńskie. The Carpathian beech forest covering the gorge slopes and the fir forest at their bottom are its most valuable forest communities. The sunlit hill slo-pes are covered by xerothermic communities. In the southern part of the Park in the Roztocze escarpment zone, there is an interesting raised bog on the Bagno Tałandy Marsh (with e.g. the round-leaved sundew) covered by dwarf pines and downy birches. The avifauna of the Park includes e.g. the hawk, sparrowhawk, raven, bullfinch, and black woodpecker. The wet meadows are inhabited by the redshank, black-tailed godwit, and common snipe (Zespół Lubelskich Parków… 2017).
The fresh pine forest is the major community in the Krasnobrodzki Landscape Park in Roztocze Tomaszowskie. It is accompanied by fir forest

Teresa Brzezińska-Wójcik468
and Carpathian beech forest. There are also alder forests, hornbeam-oak forests, peat bogs, and xerothermic communities. Nests of the lesser spot-ted eagle, black stork, and grey wagtail can be found in this area. Mam-malian predators are represented by the badger, stoat, raccoon dog, pine and beech marten, weasel, and polecat (Zespół Lubelskich Parków… 2017).
The Puszcza Solska Landscape Park located in the south-western escarpment zone of Roztocze Tomaszowskie is dominated by fresh pine forest with some admixture of beech and fir. Protected plants are repre-sented by the bear garlic, clubmosses, sundews, and orchids. The most valuable avian species include e.g. the honey buzzard, white-tailed eagle, hawk, sparrowhawk, common buzzard, lesser spotted eagle, hazel grouse, western capercaillie, black grouse, crane, and grey-headed, green, and black woodpecker. The grebe deserves attention as an aquatic-marsh spe-cies. Mammals are represented by e.g. the weasel, stoat, European ham-ster, European beaver, and elk (Zespół Lubelskich Parków… 2017)
The Południoworoztoczański Landscape Park covers the entire Polish part of Roztocze Rawskie. The ridges and slopes of the hills are covered by Carpathian beech forest communities. The undergrowth contains rare montane species, e.g. the bear garlic. Secondary pine forests are the other community present in this area. Representatives of avifauna in both com-munities include e.g. the lesser spotted eagle, Ural owl, black stork, quail, and hoopoe. Large mammals are represented by the elk (Zespół Lubelskich Parków… 2017).
Forest ungulates, i.e. the deer, roe deer, and wild boar, live in all the Parks. Mammalian predators, i.e. the wolf and lynx, are characteristic for the Puszcza Solska and Południoworoztoczański Landscape Parks (Zespół Lubelskich Parków… 2017).
Recreational assets associated with biotic resources
Almost the entire Roztocze region within the Polish borders is regar-ded as a natural or near-natural landscape area (liJeWsKi et al. 2002). These qualities are supported by the features of the phytosphere constitu-ting recreational and scenic assets.
The forest cover in the individual subregions ranges from approxima-tely 20% in Roztocze Gorajskie and Roztocze Szczebrzeszyńskie (the lowest cover area – below 15.0% – in Sułów, Szastarka, and Chrzanów commu-nes) to over 60% in Roztocze Tomaszowskie and Roztocze Rawskie (the greatest area – over 55.1% – in Zwierzyniec commune) – Figure 1.

Use of Biotic Resources of Roztocze in Tourism Offers in The Context... 469
The spatial and qualitative traits of the communities formed by horn-beam-oak, beech, and mixed pine-oak forests with a substantial beech admixture as well as pine forests should be emphasised (Lorens et al. 2015). In terms of recreation, hornbeam-oak forests contribute to enhance-ment of organism immunity, have stimulatory and antiseptic activity, regulate blood circulation and arterial pressure (by constriction of peri-pheral vessels), exhibit very good filtration and detoxification properties, reduce wind velocity, suppress noise, and absorb heavy metals (copper, strontium, manganese), which are harmful to the organism. Beech forests are most efficient in capturing dust; they also absorb heavy metals and enhance organism immunity. However, they are not recommended to indi-viduals with hypertension. Nevertheless, they are one of the most valuable communities in terms of scenic quality. Mixed forests exert universal biotherapeutic and psychoregulatory effects. They produce oxygen, inclu-ding ozone (especially in the morning), ionize air, secrete phytoaerosols, exhibit high detoxification capacity, secrete bactericidal and bacteriostatic compounds, and release only inconsiderable amounts of pollen allergens. Pine forests provide substantial quantities of radiant energy to the forest bottom, high airflow, high ozone content in the recreational zone (espe-cially in the morning), and high levels of phytoaerosols. They exhibit remarkable biotherapeutic and psychoregulatory potential and have an alleviating effect on the nervous system. However, they are not recommen-ded to the elderly with hypotension and hypothyroidism (KrzyMoWsKA--KostroWicKA 1999).
Forest communities are associated with terrestrial fungi. The greatest number of species grows in beech and fir forest communities (sAłAtA 1972). Some popular species can be found near certain trees, e.g. birch boletes under birches and aspen trees, slippery jacks under young pines, boletes under beeches and oaks, and saffron milk caps under firs or spru-ces (MułenKo et al. 2015).
The optimum recreation periods in Roztocze are related to the biotic assets. The length of the summer recreational period ranges from 140 days in Roztocze Tomaszowskie and Roztocze Rawskie to 150 days in Roztocze Gorajskie, whereas the winter recreational period lasts from 70–80 days to 60 days, respectively (WyrzyKoWsKi 1984).
Specialist assets associated with biotic resources
As regards the suitability of the biotic values of Roztocze for special tourism forms described above, the assets related to hunting, fishing, and horse riding are of great importance.

Teresa Brzezińska-Wójcik470
The hunting assets are associated with the forest communities and water resources in the entire region. They can be found within six Forest Districts (Nadleśnictwo Zwierzyniec. 2017).
The hunting grounds in Roztocze Gorajskie are managed by Janów Lubelski and Biłgoraj Inspectorates (area in the southern escarpment zone of Roztocze – approx. 0.6% of the district area). The forests offer excel-lent hunting areas inhabited by fallow deer and martens. Beavers and otters can also be encountered in the Janów Lubelski Inspectorate District (Nadleśnictwo Janów Lubelski. 2017, Nadleśnictwo Biłgoraj. 2017 ).
The hunting assets in Roztocze Szczebrzeszyńskie and in the northern part of Roztocze Tomaszowskie are managed by the Zwierzyniec Inspecto-rate (Nadleśnictwo Zwierzyniec. 2017).
In Roztocze Tomaszowskie, hunting is managed by the Tomaszów and Józefów Inspectorates besides the Zwierzyniec Inspectorate. This area is inhabited by raccoon dogs (http://www.ejozefow.pl/index.php; http://www.tomaszow.lublin.lasy.gov.pl/lowiectwo).
Two Inspectorates, i.e. Narol and Lubaczów, run the hunting policy in Roztocze Rawskie (http://www.lubaczow.krosno.lasy.gov.pl).
Within all Inspectorate Districts, there are many game representati-ves, i.e. the deer, roe deer, wild boar and elk, small game – the fox and hare, and birds – the pheasant and partridge.
Some rivers, e.g. the Wieprz, Tanew, and Biała Łada, as well as natu-ral and artificial water bodies are famous for their fishing assets. In general, the rivers in Roztocze are dominated by the river trout, pike, roach, sunbleak, gudgeon, and stone loach (DAnilKieWicz 1994). Additio-nally, other species live in the rivers of each subregion. The grayling can be found in the upper course of the Biała Łada River in Roztocze Goraj-skie and the river trout is present only in the southern escarpment zone of Roztocze near Kąty village (recHulicz et al. 2009). In Roztocze Toma-szowskie, burbots and weather loaches can be caught in fragments with high banks and meanders of the Wieprz River. The Ukrainian brook lam-prey is relatively common in the Szum and Świerszcz Rivers in the Rozto-czański National Park (stAcHyrA et al. 2015). Additionally, the dace and spirlin are the most common species living in the Szum River in the southern escarpment zone of Roztocze. Besides the river trout, the dace occurs with the greatest abundance and yields the highest biomass in the Sopot River. Other species, e.g. the pike, occur infrequently. Besides the river trout, the grayling, perch, and European bullhead are the most com-mon fish species in the Tanew River in Roztocze Rawskie (recHulicz et al. 2009).

Use of Biotic Resources of Roztocze in Tourism Offers in The Context... 471
Fishing, in particular in Roztocze Tomaszowskie, is facilitated by the presence of artificial water reservoirs (ponds) established for carp farming. These include e.g. the pond complexes in Hutki, Tarnawatka as well as Echo ponds in the Wieprz River catchment and in Hrebenne and Bełżec in the Sołokija catchment. Currently, the productivity of carp ponds is being increased by introduction of herbivorous fish – the grass carp as well as the silver and bighead carp. These species are accompanied by the tench, Crucian carp, and common rudd (stAcHyrA et al. 2015). Predatory fish such as pikes and catfish can be caught in the church pond in Zwierzyniec (Rybacka Lokalna… 2017).
The forest communities and water resources in the entire region are also associated with equestrian tourism assets. They are supported by the relatively long tradition (since the 18th century) of horse breeding. Reserve and stable breeding of the Polish Primitive Horse, a direct descen-dant of the wild Tarpan horse, has been restored in Zwierzyniec and Flo-rianka in the Roztoczański National Park (KAProń et al. 2013). The refu-gium of the Biłgoraj Horse is located near Janów Lubelski (Turystyka aktywna w regionie… 2004). A common feature of Polish Primitive Horses and Biłgoraj Horses is their suitability for equestrian tourism and recre-ation (WyżniKieWicz-nAWrAcAłA 2002). Since the 90s of the 20th century, the number of horses of various breeds kept in private stud farms and equestrian centres has been growing dynamically (BrzezińsKA-WóJciK and Baranowska 2012). In 2010, 4% of farms in Roztocze were involved in horse rearing (FLaga et al. 2015), in particular in communes visited by tourists – primarily in Roztocze Tomaszowskie (Krasnobród, Susiec, and Zwierzyniec) and Roztocze Szczebrzeszyńskie (Szczebrzeszyn).
Use of biotic assets in the current tourism offer
The analysis of the offers presented in publications submitted to the LRTO competitions and promoted on the homepages of local tourist orga-nisations (LTO), local action groups (LAG), local government institutions, and business entities indicates that the greatest number of biotic assets are included in the offers promoting Roztocze Tomaszowskie, and the lowest number is presented in the case of the other Roztocze subregions (Tables 5–7).

Tabl
e 5
Bio
tic a
sset
s in
the
tour
ism
offe
r in
Roz
tocz
e G
oraj
skie
and
Roz
tocz
e Sz
czeb
rzes
zyńs
kie
Subr
egio
nsCo
mm
une
Biot
ic a
sset
s in
the
tour
ism
offe
rN
ame
of th
e of
fer
Type
of
the
offe
rEn
titie
s pr
omot
ing
the
offe
rs
Rozt
ocze
G
oraj
skie
Janó
w L
ubel
ski
tow
n an
d co
mm
une
“Las
y Ja
now
skie
” La
ndsc
ape
Park
Z bagiennym Bractwem
do Leśnego
Skarbca
[Trip to th
e Forest Treasury with
the
Marsh Brotherhood]
trai
l –
prod
uct
LTO
Zam
ość
i R
oztocze
Wyprawy do Leśnego Skarbca
[Trips to th
e Forest Treasury]
Bagienne Bractwo Obserwato-
rów Terenow
ych
[Mar
sh B
roth
erho
od o
f Observers
]Perły Leśnego Skarbca
[Pearls of th
e Forest Treasury]
Park Rekreacji [Recreation Pa
rk]
„ZOOM NAT
URY”
obje
ct
– pr
oduc
t
Janó
w L
ubel
ski (
prom
otio
n in
th
e In
tern
et: p
hras
e “n
azw
a gm
iny
+ tu
ryst
yka”
[nam
e of
th
e co
mm
une
+ to
uris
m])
Leśny Kom
pleks Prom
ocyjny “L
asy
Janowskie” [
“Las
y Ja
now
skie
” For
est
Prom
otional C
omplex
]
Eco
logi
cal E
duca
tion
Center of th
e Janów
Lubelski Forest D
istrict
“Bie
guś”
tra
il
trai
l –
prod
uct
Janó
w L
ubel
ski F
ores
t D
istr
ict
Rozt
ocze
Szc
zebr
ze-
szyń
skie
Szcz
ebrz
eszy
n to
wn
and
com
mun
e
Cetn
ar F
ores
t
Szlak Row
erow
y Czarna Perła [Black
Pearl C
yclin
g Trail]
LTO
Roztocze
in “N
atur
a”
book
mar
k
Ścieżka przez las Cetnar
[Path through
Cet
nar
fore
st] i
n K
awęc
zyne
k
Zapraszamy do Szczebrzeszy-
na…
(pro
mot
iona
l mat
eria
ls
issue
d by
the
loca
l gov
ernm
ent)
fish
– ri
ver
trou
t
Tow
arzy
skie
Zaw
ody
“Pst
rągo
we
Mis
trzo
stw
a K
oła
PZW
Roz
tocz
e
w Z
amoś
ciu”
na
rzec
e W
iepr
z [T
rout
Fi
shin
g co
mpe
titio
n on
the
Wie
prz
Rive
r]
even
t –
prod
uct
–
Expl
anat
ion:
LRT
O, L
TO, a
nd L
AG a
bbre
viat
ions
– in
the
text
Sour
ce: o
wn
stud
y ba
sed
on: T
urystyka aktyw
na. (
2017
); Lokalna Organizacja Turystyczna… (2
017)
; Lokalna Grupa Działania… (2
017)
; Ośrodek
Edukacji E
kologicznej…
(201
7), B
agienne Bractwo…
(201
7), R
ybacka Lokalna
… (2
017)
, Zapraszam
y do Szczebrzeszyna.
(n.d
)

Tabl
e 6
Biot
ic a
sset
s in
the
tour
ism
offe
r in
Roz
tocz
e To
mas
zow
skie
Com
mun
eBi
otic
ass
ets
in th
e to
uris
m o
ffer
Nam
e of
the
offe
rTy
pe o
f the
of
fer
Entit
ies
prom
otin
g th
e of
fer
Adam
ów
Ost
rich
Far
m in
Sz
ewni
a G
órna
Atrakcje obszaru [A
ttrac
tions
of t
he a
rea]
obje
ct –
pro
duct
LAG
Nasze Roztocze
fore
st co
mpl
exes
czar
na „T
rasa
Nor
dic
Wal
king
” [Black Nordic Walking Trail]
aro
und
Jacnia
trai
l – p
rodu
ct“D
ebry
” res
erve
Ścieżka Debry
[Debry Trail]
nea
r Bo
ndyr
zCzas na Roztocze…
(pro
mot
iona
l m
ater
ials
issu
ed b
y th
e lo
cal
gove
rnm
ent)
fish
– ri
ver t
rout
O
środ
ek
Hod
owli
Ryb
Łoso
siow
atyc
h „P
strą
g Ro
ztoc
zańs
ki”
w
Bon
dyrz
u [S
alm
on B
reed
ing
Cent
er „R
oztoczański T
rout
” in
Bond
yrz]
obje
ct-s
ervi
ce –
pr
oduc
tRy
back
a [F
ishi
ng] L
AG Roztocze
Bełż
ec
fish
– ca
rp, g
rass
carp
, te
nch,
pik
e, ca
tfish
, za
nder
, per
ch, C
ruci
an
carp
Gos
poda
rstw
o ry
back
ie B
ełże
c [F
ish
Farm
Beł
żec]
com
mon
juni
peru
sCentralny Szlak
Row
erow
y Roztocza
[Central Cyclin
g Route of
Roztocze]
trai
l – p
rodu
ct
LTO Roztocze i
n “N
atur
a”
book
mar
k
Józe
fów
to
wn
and
com
mun
e
“Cza
rtow
e Po
le” r
eser
ve
Green Velo – młodzieżowy rajd row
erow
y [Green Velo – youth bike
rally
]LR
TO, c
atal
ogue
Oferty
turystyczne – Region Lu
belski,
2016/17
Magiczne Roztocze Ak
tywnie
[Magical Roztocze Actively]
Lubelskie – Kultura i Natura
[Lubelskie Region – Culture and
Nature]
Szlak „Krawędziow
y” [E
scarpm
ent T
rail]
LAG
Nasze Roztocze
Ścieżka przyrodn
iczo-dydaktyczna „
Czar
tow
e Po
le”
[“Cza
rtow
e Po
le”
nature-edu
cational trail]
„Przyroda Roztocza”
[Nature of Roztocze]
area
– p
rodu
ct
Szlak „Szumów
” [Szum
y Trail]
trai
l – p
rodu
ctLT
O Roztocze i
n “N
atur
a”
book
mar
k
“Szu
m” r
eser
veLu
belskie – Kultura i Natura
[Lubelskie Region – Culture and
Nature]
area
– p
rodu
ctLR
TO, k
atal
og Oferty turystyczne –
Region Lu
belski, 2016/17
Szlak „Krawędziow
y” [E
scarpm
ent T
rail]
trai
l – p
rodu
ct
LGD
Nasze Roztocze
pedu
ncul
ate
oak
Ścieżka
dend
rologiczna
w
e Fl
oria
nce
[Dendrological Trail
in
Flor
iank
a]Tu
rystyka aktywna …
201
4 (p
rom
otio
nal m
ater
ials
issu
ed b
y th
e lo
cal g
over
nmen
t)

Józe
fów
to
wn
and
com
mun
e
pedu
ncul
ate
oak
alle
y in
G
órec
ko K
ości
elne
Green Velo – młodzieżowy rajd row
erow
y [Green Velo – youth bike
rally
]
trai
l – p
rodu
ct
LRTO
, cat
alog
ue Oferty
turystyczne – Region Lu
belski,
2016/17
Spotkanie z Naturą
[Encounter with
Nature]
cent
rum
hod
owli
koni
ka
pols
kieg
o w
e Fl
oria
nce
[Polish Prim
itive Horse
stud
farm
in Florianka
]
Green Velo – młodzieżowy rajd row
erow
y [Green Velo – youth bike
rally
]Tr
asa
row
erow
a do
Flo
rian
ki [C
yclin
g Tr
ail t
o Fl
oria
nka]
LAG
Nasze Roztocze
„Ciekawe miejsca” [
Inte
rest
ing
site
s]ob
ject
– p
rodu
ct
Row
erem
po Roztoczu
[Cyclin
g around
Roztocze]
trai
l – p
rodu
ct
LTO
Zam
ość i R
oztocze
fish
– ri
ver t
rout
and
co
mm
on d
ace
in th
e So
pot R
iver
Wędkarstwo na Roztoczu
[Fishing in
Roztocze]
obje
ct –
pro
duct
fir fo
rest
Ścieżka
przyrodn
icza przez
bór
jodłow
y i
zaczarow
any
las
w n
adle
śnic
twie
Józ
efów
[Nature trail across the fir forest and
en
chan
ted
fore
st in
Józ
efów
Foe
rst D
istr
ict]
trai
l – p
rodu
ct
Turystyka aktywna …
201
4 (p
rom
otio
nal m
ater
ials
issu
ed b
y th
e lo
cal g
over
nmen
t)
Sols
ka P
rim
eval
For
est
red
“Nor
dic
Wal
king
” tra
ilLA
G Nasze Roztocze
Kra
snob
ród
tow
n an
d co
mm
une
St. “
Roch
” res
erve
ścieżka przyrodn
icza po rezerw
acie „
Św. R
ocha
” [Nature trail across
“Saint Roch” reserve
]
Przez rezerw
at św. R
och
[Across Sa
int. Roch reserve]
LTO
Zam
ość i R
oztocze
Lubelskie – Kultura i Natura
[Lubelskie Region – Culture and
Nature]
area
– p
rodu
ctLR
TO, c
atal
ogue
Oferty
turystyczne – Region Lu
belski,
2016/17
mus
hroo
ms
– sa
ffron
m
ilk ca
p ra
jd „R
ydz
na p
atel
ni” [
“Saf
fron
milk
cap
on
the
fryi
ng p
an” r
ally
]ev
ent –
pro
duct
Kra
snob
ród
(pro
mot
ion
in th
e In
tern
et: p
hras
e”„n
azw
a gm
iny
+ tu
ryst
yka”
) [ n
ame
of th
e co
mm
une
+ to
uris
m]
“Bel
font
” eco
logi
cal a
rea
Uży
tek
Ekol
ogic
zny
„Bel
font
” [“B
elfo
nt” e
colo
gica
l are
a]ob
ject
– p
rodu
ct
Ścieżka
Kaczórki-u
roczysko Belfont-Kaczorki
[Kaczórki-B
elfont–
Kac
zork
i tra
il]tr
ail –
pro
duct
Krasnobród – serce Roztocza…
b.
r.w
. (pr
omot
iona
l mat
eria
ls
issu
ed b
y th
e lo
cal g
over
nmen
t)

Susi
ec“N
ad T
anw
ią” r
eser
ve
Krasnobród – wypoczynek w sercu Roztocza
[rec
reat
ion
in t
he h
eart
of Roztocze]
area
– p
rodu
ct
LRTO
, cat
alog
ue Oferty
turystyczne – Region Lu
belski,
2016/17
Roztoczański S
zlak UNESC
O [R
oztocze UNESC
O Trail]
trai
l – p
rodu
ct
Magiczne Roztocze Ak
tywnie
[Magical Roztocze Actively]
Green Velo – młodzieżowy rajd row
erow
y [Green Velo – youth bike
rally
]Szlak „Szumów
” [Szum
y Trail]
LTO Roztocze i
n “N
atur
a”
book
mar
kTa
rnaw
atka
bird
s of
aqu
atic
re
serv
oirs
śc
ieżk
a ed
ukac
yjna
Ptaki zbiornika Tarnawatka – Ekościeżka
[Bir
ds
of Tarnawatka reservoir - Ecotrail]
Zam
ość
“Tar
ka” s
tud
farm
ziel
ona
„Tra
sa N
ordi
c Wal
king” krawędzią lasów RPN
wokół stadniny
koni
„Tar
ka” [
gree
n “N
ordi
c Wal
king
Tra
il” along th
e edge of the RPN
fo
rest
s ar
ound
the
“Tar
ka” stud farm
]
LAG
Nasze Roztocze
Atrakcje obszaru [A
ttrac
tions
of t
he a
rea]
obje
ct –
pro
duct
Zwie
rzyn
iec
tow
n an
d co
mm
une
Ośr
odek
Edu
kacy
jno-
-Muz
ealn
y RP
N
[Edu
catio
nal a
nd
Mus
eum
Cen
tre
of th
e Ro
ztoc
zańs
ki N
atio
nal
Park
]
Tras
a ro
wer
owa
do F
lori
anki
[Cyc
ling
Trai
l to
Flor
iank
a]
trai
l – p
rodu
ct
Rozt
ocza
ński
Nat
iona
l Pa
rk
Green Velo – młodzieżowy rajd row
erow
y [Green Velo – youth bike
rally
]LR
TO, c
atal
ogue
Oferty
turystyczne – Region Lu
belski,
2016/17
Roztocze Tour – row
erem
po Roztoczu
[Cyclin
g around
Roztocze]
Konno po Roztoczu
[Roztocze horse riding
]LT
O Zam
ość i R
oztocze
Ułański Szlak Konny [U
łański horse trail]
LAG
Nasze Roztocze
„Prz
yrod
a Ro
ztoc
za” [Nature of Roztocze]
area
– p
rodu
ctLu
belskie – Kultura i Natura
[Lubelskie Region – Culture and
Nature]
LRTO
, cat
alog
ue Oferty
turystyczne – Region Lu
belski,
2016/17
Buko
wa
Gór
a re
serv
eKrasnobród – wypoczynek w sercu Roztocza
[rec
reat
ion
in t
he h
eart
of Roztocze]
Ścieżka dydaktyczna na Bukow
ą Górę
[Bukow
a Góra didactic path]
trai
l – p
rodu
ctLA
G Nasze Roztocze
fish
– pi
ke, c
atfis
h in
K
ości
elny
pon
d Za
wod
y Zw
ierzyńczyk
[Zw
ierzyńczyk
com
petit
ion]
even
t – p
rodu
ctRy
back
a LA
G Roztocze
fish
– pi
ke, r
oach
, su
nble
ak, g
udge
on,
ston
e lo
ach,
catfi
shWędkarstwo na Roztoczu
[Fishing in
Roztocze]
obje
ct –
pro
duct
LTO
Zam
ość i R
oztocze
Sour
ce: O
wn
stud
y ba
sed
on: T
urystyka aktyw
na...
(20
17); Lokalna Organizacja Turystyczne
... (
2017
); Rybacka Lokalna Grupa Działania
... (
2017
); Czas na Roz-
tocze…
(b.r.
w.);
Krasnobród – serce Roztocza…
(b.r.
w.);
Turystyka aktyw
na… (2
014)
Ex
plan
atio
n of
the
LRTO
, LTO
, and
LAG
abb
revi
atio
ns –
in th
e te
xt
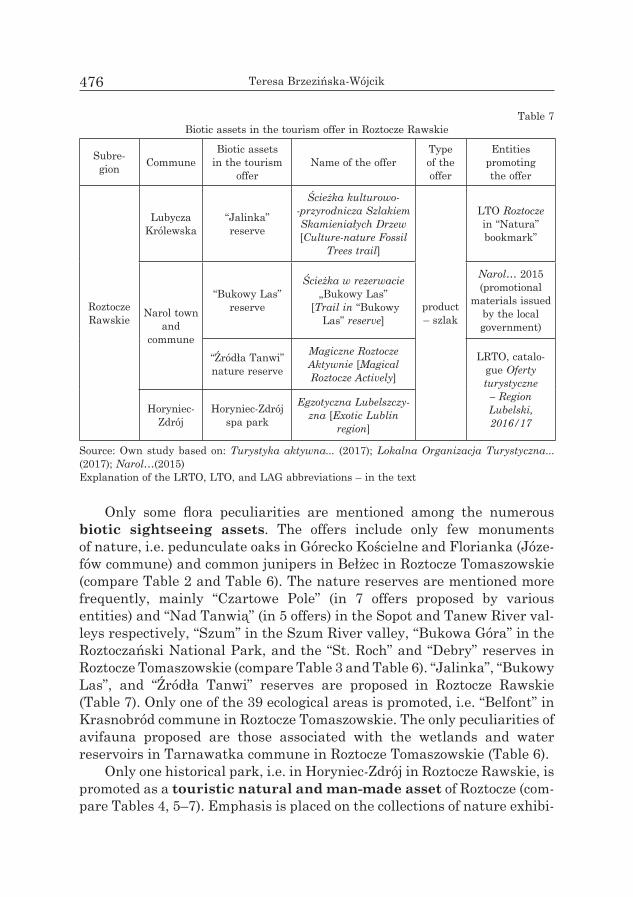
Teresa Brzezińska-Wójcik476
Table 7Biotic assets in the tourism offer in Roztocze Rawskie
Subre-gion Commune
Biotic assets in the tourism
offerName of the offer
Type of the offer
Entities promotingthe offer
Roztocze Rawskie
Lubycza Królewska
“Jalinka” reserve
Ścieżka kulturowo--przyrodnicza Szlakiem Skamieniałych Drzew[Culture-nature Fossil
Trees trail]
product – szlak
LTO Roztoczein “Natura” bookmark”
Narol town and
commune
“Bukowy Las” reserve
Ścieżka w rezerwacie „Bukowy Las”
[Trail in “Bukowy Las” reserve]
Narol… 2015 (promotional
materials issued by the local government)
“Źródła Tanwi” nature reserve
Magiczne Roztocze Aktywnie [Magical Roztocze Actively]
LRTO, catalo-gue Oferty turystyczne – Region Lubelski, 2016/17
Horyniec-Zdrój
Horyniec-Zdrój spa park
Egzotyczna Lubelszczy-zna [Exotic Lublin
region]
Source: Own study based on: Turystyka aktywna... (2017); Lokalna Organizacja Turystyczna... (2017); Narol…(2015) Explanation of the LRTO, LTO, and LAG abbreviations – in the text
Only some flora peculiarities are mentioned among the numerous biotic sightseeing assets. The offers include only few monuments of nature, i.e. pedunculate oaks in Górecko Kościelne and Florianka (Józe-fów commune) and common junipers in Bełżec in Roztocze Tomaszowskie (compare Table 2 and Table 6). The nature reserves are mentioned more frequently, mainly “Czartowe Pole” (in 7 offers proposed by various entities) and “Nad Tanwią” (in 5 offers) in the Sopot and Tanew River val-leys respectively, “Szum” in the Szum River valley, “Bukowa Góra” in the Roztoczański National Park, and the “St. Roch” and “Debry” reserves in Roztocze Tomaszowskie (compare Table 3 and Table 6). “Jalinka”, “Bukowy Las”, and “Źródła Tanwi” reserves are proposed in Roztocze Rawskie (Table 7). Only one of the 39 ecological areas is promoted, i.e. “Belfont” in Krasnobród commune in Roztocze Tomaszowskie. The only peculiarities of avifauna proposed are those associated with the wetlands and water reservoirs in Tarnawatka commune in Roztocze Tomaszowskie (Table 6).
Only one historical park, i.e. in Horyniec-Zdrój in Roztocze Rawskie, is promoted as a touristic natural and man-made asset of Roztocze (com-pare Tables 4, 5–7). Emphasis is placed on the collections of nature exhibi-

Use of Biotic Resources of Roztocze in Tourism Offers in The Context... 477
ted in the Ośrodek Edukacyjno-Muzealny Roztoczańskiego Parku Narodo-wego [Educational and Museum Centre of the Roztoczański National Park] in Zwierzyniec, Roztocze Tomaszowskie and the year-round offer of the Ośrodek Edukacji Ekologicznej [Ecological Education Centre], e.g. “Bie-guś” trail in Roztocze Gorajskie (Tables 5–6).
One of the natural sightseeing assets with a character and signi-ficance unaffected by human interference proposed most frequently (6 offers) is the Roztoczański National Park (Table 6). The biotic assets of the “Lasy Janowskie” Landscape Park mainly include trail-products: Wyprawy do Leśnego Skarbca [Trips to the Forest Treasury], Perły Leśnego Skarbca [Pearls of the Forest Treasury] (e.g. Bobry – Architekci krajobrazu [Beavers – Landscape Architects]), as well as mushroom picking, nature classes, and nature schools organised by Bagienne Bractwo Obserwatorów Terenowych [Brotherhood of Marsh Observers] – Table 5.
The tourism offers from Roztocze propose only some recreational assets of nature. These include Cetnar forest in Roztocze Szczebrzeszyń-skie and the forest complexes in Adamów and Jozefów communes in Roz-tocze Tomaszowskie. The saffron milk cap is the only terrestrial mushroom mentioned in the offer of Krasnobród commune in Roztocze Tomaszowskie (compare Figure 1 and Tables 5–6).
The group of specialist assets comprises the fishing and equestrian tourism offers. The fishing farms in Szczebrzeszyn and Tomaszów subre-gions offer mainly the carp, grass carp, tench, pike, catfish, zander, perch, Crucian carp, silver carp, and trout. Event-products encourage river trout fishing in the Wieprz River as well as pike and catfish fishing in the “Kościelny” pond in Zwierzyniec (Tables 5–6). Biotic assets that are offered most frequently (in 6 different tourism offers) include the Polish horse breeding centre in Florianka and the “Tarka” stud farm in Roztocze Toma-szowskie, which is proposed less frequently (Table 6).
The tourism offers promoted by the analysed associations, local gover-nments, and independent tourism organisers in the Polish part of Roztocze present the biggest number of trail-products. They include Lubelskie – Kultura i Natura [Lubelskie Region – Culture and Nature], Green Velo – młodzieżowy rajd rowerowy [Green Velo – youth bike rally], Magiczne Roz-tocze Aktywnie [Magical Roztocze Actively], Szlak Szumów [Szumy Trail], Centralny Szlak Rowerowy Roztocza [Central Cycling Route of Roztocze], and Spotkanie z Naturą [Encounter with Nature] – Tables 5–7.
The forest communities and water resources of Roztocze are the basis of the hunting area offer proposed by six Forest Inspectorates in areas leased by hunting associations. The Biuro Turystyki Myśliwskiej “Roz-tocze” [“Roztocze” Hunting Tourism Office] is responsible for organisation

Teresa Brzezińska-Wójcik478
of this type of tourism activities (Nadleśnictwo Zwierzyniec. 2017). The diver-sity of the offer is achieved by inclusion of educational playschemes – “Idziemy do lasu” [“We go to the forest”], “Znajdź skarby przyrody” [„Find the treas-ures of nature”], “Gdzie mieszkam?” [“Where I live?”], “Połącz w pary” [“Com-bine in pairs”] , “Skąd ten liść?” [“Where does this leaf come from?”], “Rośliny leśne” [“Forest plants”], “Traf do kosza” [“Get to the basket”], “Leśnik gosp-odarzem lasu” [“Forester, the host of the forest”], “Zgaś pożar!” [“Extinguish the fire!”], “Las kształtuje klimat” [“Forest shapes the climate”] available at http://www.lublin.lasy.gov.pl/lowiectwo#.WYD1W7hpxko (Łowiectwo 2017)
The analysis of the internet websites of individual business entities shows trail-products, e.g. Szlakiem siana po Roztoczu, Szlak konny „Stępa” in Roztocze Gorajskie and “Świąteczna Kraina” Roztocze Eco-museum (BrzezińsKA-WóJciK and Baranowska 2012, Spanie na sianie… 2017, Roztoczańskie ekomuzeum… 2017).
It is worth emphasising that only some object-products related to the nature resources are recognised on a transregional scale, e.g. the artificial lake in Horyniec-Zdrój – approx. 12% and 11% of indications (respectively taBor 2009, ryDzeWsKi 2012), “Sołokija” reserve (ryDzeWsKi 2012), the Roztoczański National Park and Szlak Szumów (kuLa 2010, BeKier-JA-worska and BocHeneK 2014).
The results of the analysis of lists of products submitted to the LRTO competition and those proposed by other tourism organisations, local action groups, local governments, and business entities indicate a relati-vely rich offer based on biotic resources. It mainly comprises trail-products and object-products with the main emphasis on the Roztoczański National Park, nature reserves, forest communities, and surface water resources. It should be underlined that the local governments of Bełżec, Krasnobród, and Tomaszów Lubelski communes are the most active entities in pro-motion of biotic assets in the tourism offer. Nevertheless, both the assets and offers are characterised by high repetitiveness.
Offers related to biotic resources in the theoretical concept of an integrated nature tourism product
The tourism function in the physicogeographical region of is a resul-tant of many individual tourism products; however, it is unevenly develo-ped (BrzezińsKA-WóJciK et al. 2017) and does not fully exploit the biotic resources of Roztocze. Therefore, it is reasonable to prepare a tourism area product that would be a sum of individual tourism products and all goods and services forming a coherent entity.

Use of Biotic Resources of Roztocze in Tourism Offers in The Context... 479
As suggested by KAczMAreK et al. 2010, the design of an area-product should take into account its components and characteristic traits. These elements are grouped into four levels: heritage (natural and cultural assets), infrastructure (accommodation, catering, and para-tourism faci-lities), organisation and management (structures, activities), and added value (idea, name, logo, image, stereotypes – symbolic elements existing in the psychological sphere) (aLtkorn 1999).
Two of the required product levels are fully satisfied in Roztocze, i.e. the heritage (described by e.g. skowronek and śWiecA 2016, Brzeziń-sKA-WóJciK et al. 2017, BrzezińsKA-WóJciK 2017) and infrastructure (characterised by śWiecA et al. 2015). The other two elements, organisa-tion and management as well as added value require completion and/or systematisation. In the field of area organisation and management, in par-ticular in the sphere of single tourism offers, there is noticeable activity of local governments and local tourism organisations in Roztocze. Yet, there are no joint initiatives targeted at creation of a coherent tourism offer for the entire region. In terms of added value, a good starting point for cre-ation of an area product based on biotic assets is the proposal of the Rozto-cze – Witalność z natury brand prepared by LTO Roztocze. Assuming that the brand will be an indicator of the area product, each participant of the partnership network should be obliged to introduce the logo in its indivi-dual product, sell Roztocze souvenirs with the logo, and use relevant brand colour codes. In this way, each participant in the partnership network will promote the other partners, objects, and places. In turn, the tourist at any location will recognise the same form of identification, which will remind him of the product on a scale beyond that of a single offer.
Another important issue involves the characteristic features of the tourism area product. Two of the features mentioned by KAczMAreK et al. (2010), i.e. consumption and psychosocial factors, are hardly predictable in the phase of product design. Three of the other traits can be identified in Roztocze, i.e. a potential area product: spatial determination of the pro-duct (a resultant of the characteristics of the geographical environment as well as historical and cultural heritage), multi-production (many creators of simple products), non-homogenous prices, and diverse standards. Another two features, i.e. complementarity and synergy in the creation of a joint product, still require joint work from potential creators of the tourism area product in Roztocze. In terms of another trait, i.e. the com-plementarity of the product, there are a large number of components ava-ilable (simple products) but there are no interrelations among them. The cooperation between many entities in Roztocze (internal – administration, local government, local and regional tourist organisations, firms, and resi-

Teresa Brzezińska-Wójcik480
dents; external – investors and tourists) aimed at creation of a joint pro-duct seems rather poor. The weakest feature assessed in the analysed region is the complementarity of the product, whose components should complement one another and create a common set of benefits for the tourist. The two latter features should be analysed in combination, as they are interdependent.
In general, local government institutions are responsible for the offer of the tourism area product. Their object-directed activities should be tar-geted at creation of a tourism offer, while the subject-oriented actions sho-uld involve cooperation between subjects engaged in creation of the offer (Panasiuk 2008). In this respect, the local government institutions in Roz-tocze are increasingly undertaking actions aimed at preparation and pro-motion of tourism offers. However, the results of the study demonstrate that the current offer insufficiently exploits the diversity of the biotic assets. The analysis of the relationship: biotic assets-tourism offer reveals poor individualisation of these products. The most numerous offers in the trail-products (e.g. Centralny Szlak Rowerowy Roztocza) are nature reserves (most frequently mentioned: “Czartowe Pole”, “Nad Tanwią”, “Szum”, “St. Roch”) and objects (oak alley in Górecko Kościelne, Izba Leśna we Floriance). Numerous fishing sites are proposed as independent objec-t-products and the Roztoczański National Park and hunting grounds serve as area-products. However, it should be underlined that fishing and hun-ting areas are targeted at strictly defined groups of tourists. The region has no comprehensive well-designed tourist web portal that would focus on each product.
It might be agreed that a resourceful leader should be involved in cre-ation of an area product, as suggested by KAcHnieWsKA (2014/2015). Accordingly, it would be advisable to establish an institution managing the product and promoting the region on a national and international scale. In the current situation, a question arises: Who could be the leader in Roztocze? At present, there is competition between LTO Roztocze and LTO Zamość i Roztocze representing different Roztocze (and not only) communes and between LOG Nasze Roztocze and LOG Roztocze Toma-szowskie.
The tourism area product of Roztocze exploiting biotic assets should comply with the notion of sustainable development based on local tra-ditions of the use of local resources. Currently, only some offers (e.g. the Roztoczański National Park) comprise all components of a tourism area product. They are a good starting point for creation of the area offer of the region. In this regard, there is a need for a more efficient use of assets pro-vided by nature monuments (the current offers include only the peduncu-

Use of Biotic Resources of Roztocze in Tourism Offers in The Context... 481
late oaks in Górecko Kościelne and common junipers in Bełżec), ecological areas (only “Belfond” is presented in the offers), avifauna peculiarities (the offers include only the educational trail Ptaki zbiornika Tarnawatka and the “ornithological” watchtower in the nature-educational trail Siwa Dolina im. Naczelnika Państwa Józefa Piłsudskiego), historical parks (besides the spa park in Horyniec-Zdrój, the other parks are used by resi-dents for recreation and rest), and landscape parks. Additionally, the offers should exploit more intensively the health-enhancing potential of all the forest communities and their educational values associated with the world of animals, and birds in particular. This issue is especially impor-tant, since the entire region is part of the designed Transboundary Bios-phere Reserve.
The tourism area product of Roztocze should be more focused on the needs of children and families with children. Besides the agrotourism offer, there is no product dedicated to children.
In this regard, production of souvenirs based on local resources as well as gastronomy based on local products and traditions should be conside-red. At present, very few object-products bringing back visitors’ memories of Roztocze as a touristic region are available. It is crucial that material souvenirs bearing product or brand colour codes and the website address could function as a portable carrier of impressions and promotion. Simi-larly, there are no nomenclature identifiers in gastronomy menus. The tourist remembers easily and for a long time such identifiers by visual-ta-ste associations, which results in “experiencing” the tourism product. Here, individualism in consumption must be taken into account.
Therefore, passions, knowledge, skills, and experience of the inhabi-tants of the region should become the subject of the offer and the biotic assets should be the reason for tourist traffic rather than only a basis for creation of the offer.
Conclusions
The study results allow a conclusion that the biotic assets that are mentioned most frequently in the offers from the analysed area include nature reserves, e.g. “Czartowe Pole” and “Nad Tanwią”, “Szum” and “St. Roch”, and the oak alley in Górecko Kościelne, as well as Izba Leśna we Floriance, and the Polish Primitive Horse stud farm.
The results of the study indicate that trail-products (cycling, hiking, walking educational) based on biotic assets or combined with cultural assets are the most frequent offers in the analysed area. In this group,

Teresa Brzezińska-Wójcik482
Centralny Szlak Rowerowy Roztocza, the educational trail “Na Bukową Górę”, Trasa rowerowa do Florianki, and Trasa rowerowa Ziemi Józe-fowskiej are proposed to tourists most often. The area-product offers usu-ally comprise the Roztoczański National Park. Festivities and events such as the Festiwal Kaszy „Gryczaki” are equally popular. The offers are some-times highly similar and repetitive. This is a result of the separateness of the touristic activities carried out a majority of the business entities in Roztocze. Consequently, tourists are concentrated either in very small areas or in certain linear systems.
A good starting point for creation of an area product based on a more intensive exploitation of biotic assets is the fact that two of the four pro-duct requirements, i.e. heritage and infrastructure, are fully satisfied. In contrast, the other two elements, i.e. organisation and management, still require a lot of work. In terms of added value, a good starting point for creation of an area product is the proposal of a Roztocze – Witalność z natury brand based on the concept of the “Roztocze” Transboundary Bio-sphere Reserve.
The characteristic traits of the tourism area product present in Rozto-cze include spatial determination, multi-production, non-homogenous pri-ces, and diverse standards of the product. Two traits – complementarity and synergy in the creation of a joint product still require a lot of work from creators of the tourism product, likewise in the case of complementa-rity of the product, whose components should complement each other, cre-ate a set of benefits for the tourist, and promote various forms of tourism.
Translated by AnnA zońAccepted for print 9.07.2018
Acknowledgements
The author is grateful to the anonymous reviewers for their criticism and valuable comments on the manuscript. I would also like to thank Mrs. Anna Zoń, M.A., who has improved my English.
ReferencesaLtkorn J. 1999. Strategia marki, seria: Marketing bez tajemnic. PWE, Warszawa.Bagienne Bractwo Obserwatorów Terenowych, http://www.obserwatorzy.pl/glowna.htm, access:
26.06.2017.BArtoszeWsKi s., MicHAlczyK Z. 2013. Stosunki wodne. In: Roztoczański Park Narodowy – przy-
roda i człowiek. Eds. R. Reszel, T. Grądziel. Wyd. Roztoczański Park Narodowy, Zwierzyniec, pp. 53–60.

Use of Biotic Resources of Roztocze in Tourism Offers in The Context... 483
BeKier-JAWorsKA e., BocHeneK M. 2014. Produkty markowe kuchni regionalnej w promocji tu-rystyki na Roztoczu. Polish Journal of Sport and Tourism, 21: 263–272.
Berry s., lADKin A. 1997. Sustainable tourism: a regional perspective. Tourism Management, 18: 433–440.
BosteDt g., MAttsson L. 1995. The value of forests for tourism in Sweden. Annals of Tourism Research, 22: 671–680.
BrzezińsKA-WóJciK T. 2012. Produkty geoturystyczne w województwie lubelskim jako przykład działań innowacyjnych, poszerzających dotychczasową ofertę turystyczną regionu. In: Wpływ sektora B+R na wzrost konkurencyjności polskiej gospodarki poprzez rozwój innowacji, t. 1. Eds. D. Jegorow, A. Niedużak. Wyd. CIVIS, Chełm, pp. 127–148.
BrzezińsKA-WóJciK T. 2017. Zasoby przyrody nieożywionej Roztocza jako podstawa kreowania obszarowego produktu turystycznego. Zeszyty Naukowe Wyższej Szkoły Turystyki i Języków Obcych w Warszawie, Seria Turystyka i Rekreacja, 20(2): 5–22.
BrzezińsKA-WóJciK T., Baranowska M. 2012. The state of development of equestrian tourism in the Lublin Region in the context of environmental conditions. Polish Journal of Sport and Tourism, 19(4): 256–262.
BrzezińsKA-WóJciK t., śWiecA A. 2014. The current state and perspectives of development of tourism products in Roztocze in the context of environmental and educational tourism. Eco-nomic Problems of Tourism, 4(28): 379–399.
BrzezińsKA-WóJciK t., sKoWroneK e., śWiecA A. 2017. Nature and culture heritage in the tourist offer of the border region of Roztocze. Scientific Review of Physical Culture, 7(2): 128–142.
BucKley r., roBinson J., cArMoDy J., King N. 2008. Monitoring for management of conservation and recreation in Australian protected areas. Biodiversity and Conservation, 17: 3589–3606.
BurAczyńsKi J. 1995. Regiony geomorfologiczne Roztocza. Ann. UMCS, B, 48: 59–73. Czas na Roztocze. Agroturystyka. b.r.w. Stowarzyszenie Kwaterodawców Miasta i Gminy Zwie-
rzyniec. DAnilKieWicz Z. 1994. Ryby (Pisces) rzek Roztocza. Fragmenta Faunistica, 37: 367–388.DoWling R. 1993. An environmentally based planning model for regional tourism development.
Journal of Sustainable Tourism, 1: 17–37.FiJAłKoWsKi D., KseniAK M. 1982. Parki wiejskie Lubelszczyzny. PWN, Warszawa. FLaga M., vlAcH M., vAnDA i., vistAK O. 2015. Uwarunkowania i cechy produkcji rolnej. In:
Roztocze – przyroda i człowiek. Eds. T. Grabowski, M. Harasimiuk, B.M. Kaszewski, Y. Krav-chuk, B. Lorens, Z. Michalczyk, O. Shabliy. Wyd. Roztoczański Park Narodowy, Zwierzyniec, pp. 355–370.
FreDMAn P., WAll-reinius s., grunDén A. 2012. The nature of nature in nature-based tourism. Scandinavian Journal of Hospitality and Tourism, 12(4): 289–309.
goDFrey K.B. 1998. Attitudes towards sustainable tourism in the UK: a view from local govern-ment. Tourism Management, 19: 213–224.
Józefów. Urząd Miejski, http://www.ejozefow.pl/index.php, access: 26.06.2017.KAcHnieWsKA M. 2014/2015. Model tworzenia sieciowego produktu turystycznego. Mazowiecka
Regionalna Organizacja Turystyczna, Warszawa.KAczMAreK J., stAsiAK A., WłoDArczyK B. 2010. Produkt turystyczny. PWE, Warszawa.KAProń M., stAcHursKA A., słoMiAny J. 2013. Potomek tarpana – konik polski. In: Roztoczański
Park Narodowy – przyroda i człowiek. Eds. R. Reszel, T. Grądziel. Wyd. Roztoczański Park Narodowy, Zwierzyniec, pp. 181–192.
Krasnobród – serce Roztocza. Przewodnik turystyczny. n.d. Wyd. Urząd Miejski w Krasnobrodzie. KrzyMoWsKA-KostroWicKA A. 1999. Geoekologia turystyki i wypoczynku. PWN, Warszawa.kuLa S. 2012. Percepcja i wykorzystanie walorów turystycznych Roztocza przez osoby odwiedza-
jące region. In: Wpływ sektora B+R na wzrost polskiej konkurencyjności polskiej gospodarki poprzez rozwój innowacji, t. 1. Eds. D. Jegorow, A. Nieduża. Wyd. CIVIS, Chełm, pp. 55–65.
liJeWsKi t., MiKułoWsKi B., WyrzyKoWsKi J. 2002. Geografia turystyki Polski. PWE, Warszawa.Lokalna Grupa Działania “Nasze Roztocze”, http://www.lgdnaszeroztocze.pl/, access: 20.07.2017.

Teresa Brzezińska-Wójcik484
Lokalna Organizacja Turystyczna ”Roztocze”, http://www.roztoczewita.pl/roztocze-wita/zabytki/muzea-i-wystawy-2, access: 17.05.2017.
Lokalna Organizacja Turystyczna ”Zamość i Roztocze”, http://roztocze.org/pl/news/aktualnosci.html, access: 15.05.2017
lorens B., soroKA M., cWener A., Wrzesień M. 2015. Świat roślin – zbiorowiska roślinne. In: Roztocze – przyroda i człowiek. Eds. T. Grabowski, M. Harasimiuk, B.M. Kaszewski, Y. Krav-chuk, B. Lorens, Z. Michalczyk, O. Shabliy. Wyd. Roztoczański Park Narodowy, Zwierzyniec, pp. 145–151.
Łowiectwo. Regionalna Dyrekcja Lasów Państwowych w Lublinie, http://www.lublin.lasy.gov.pl/lowiectwo#.WYD1W7hpxko, access: 29.08.2017.
MiDDleton V.T.C. 1996. Marketing w turystyce. Polska Agencja Promocji Turystyki, Warszawa. MollArD A., vollet D. 2015. What contribution do environmental amenities make to territorial
development? In: Tourism, recreation and regional development. Perspectives from France and abroad. Eds. J.C. Dissart, J. Dehez, J.B. Marsat. Ashgate, Burlington, pp. 189–209.
MułenKo W., HeLMuta V., KozłoWsKA M., BAziuK-DuBei I. 2015. Grzyby i śluzowce. In: Roz-tocze – przyroda i człowiek. Eds. T. Grabowski, M. Harasimiuk, B.M. Kaszewski, Y. Krav-chuk, B. Lorens, Z. Michalczyk, O. Shabliy. Wyd. Roztoczański Park Narodowy, Zwierzyniec, pp. 161–170.
Nadleśnictwo Biłgoraj, http://www.bilgoraj.lublin.lasy.gov.pl/lowiectwo, access: 26.06.2017.Nadleśnictwo Janów Lubelski, http://www.janowlubelski.lublin.lasy.gov.pl/lowiectwo, access:
26.06.2017. Nadleśnictwo Lubaczów, http://www.lubaczow.krosno.lasy.gov.pl, access: 26.06.2017.Nadleśnictwo Tomaszów, http://www.tomaszow.lublin.lasy.gov.pl/lowiectwo, access: 26.06.2017.Nadleśnictwo Zwierzyniec, www.zwierzyniec.lublin.lasy.gov.pl/, access: 26.06.2017.Narol. Rowerem po Roztoczu. Mapa turystyczna. 2015. Wyd. Turystyczne Paweł Wład, Rzeszów.niezgoDA A. 2000. Marketing obszarów turystycznych. Problemy Turystyki, 1–2: 13–24. Oferty turystyczne. Region Lubelski, 2016/17. Wyd. LROT, Lublin.Ośrodek Edukacji Ekologicznej „Lasy Janowskie”, http://lasyjanowskie.com/, access: 26.06.2017.Panasiuk A. 2008. Gospodarka turystyczna. Wyd. Nauk. PWN, Warszawa. Panasiuk A. 2015. Struktura oferty turystycznej na obszarach przyrodniczo cennych. Ekonomia
i Środowisko, 54(3): 182–191.Pomniki przyrody. Nadleśnictwo Narol, http://www.narol.krosno.lasy.gov.pl/pomniki-przyrody,
access: 28.07.2017.Turystyka aktywna, Lokalna Organizacja Turystyczna ”Zamość i Roztocze”, http://roztocze.org/pl/
page/25/turystyka-aktywna.html, access: 15.05.2017.Prognoza oddziaływania na środowisko. 2012. Starostwo Powiatowe w Janowie Lubelskim, Ja-
nów Lubelski. recHulicz J., girsztoWtt z., PrzyBylsKi M. 2009. Ichtiofauna Rzeki Tanew i jej dopływów.
Roczniki Naukowe Polskiego Związku Wędkarskiego, 22: 119–139.Regionalna Dyrekcja Ochrony Środowiska w Rzeszowie, http://rzeszow.rdos.gov.pl, access:
28.07.2017.Rejestr pomników przyrody w województwie lubelskim, http://lublin.rdos.gov.pl/images/stories/
rejestry/lubelskie_pomniki_przyrody_06_06_2013. pdf, access: 31.07.2017. Rejestr rezerwatów przyrody w województwie lubelskim, http://lublin.rdos.gov.pl/images/stories/
rejestry/rezerwaty_przyrody_aktualizacja_04_06_2012.pdf, access: 31.07.2017.Rejestr rezerwatów przyrody w województwie podkarpackim, http://rzeszow.rdos.gov.pl/in-
dex.php?option=com_content&view=category&layout=blog&id=63&Itemid=110, access: 31.07.2017.
Rejestr użytków ekologicznych w województwie lubelskim, http://lublin.rdos.gov.pl/images/stories/rejestry/lubelskie_uzytki_ekol_2011_09_12.pdf, access: 28.07.2017.
Rejestr użytków ekologicznych w województwie podkarpackim, http://rzeszow.rdos.gov.pl/index.php?option=com_content&view=article&id=779&Itemid=116, access: 28.07.2017.
rocHMińsKA A., stAsiAK A. 2004. Strategie rozwoju turystyki. Turystyka i Hotelarstwo, 6: 9–43.

Use of Biotic Resources of Roztocze in Tourism Offers in The Context... 485
rolsKA-BorucH I. 2002. Z przeszłości kulturowej Lubelszczyzny. Inwentarz topograficzno-rzeczo-wy zabytków województwa lubelskiego. Wyd. Archidiecezji Lubelskiej „Gaudium”, Lublin.
Roztoczańskie ekomuzeum „Świąteczna Kraina”, https://pl-pl.facebook.com/ekomuzeum/, access: 29.08.2017.
Rybacka Lokalna Grupa Działania, http://www.rlgdroztocze.org/, access: 18.07.2017. ryDzeWsKi P. 2012. Perspektywy rozwoju gospodarczego oraz aktywność zawodowa mieszkań-
ców gminy Horyniec-Zdrój. Raport z badań. Wyższa Szkoła Przedsiębiorczości i Administracji w Lublinie, Lublin.
sAłAtA B. 1972. Badania nad udziałem grzybów wyższych w lasach bukowych i jodłowych na Roztoczu Środkowym. Acta Mycologica, 8(1): 69–139.
sKoWroneK e., śWiecA A. 2016. Cultural heritage of Roztocze in the context of tourism pro-duct development opportunities. In: Cultural tourism as a branded tourism product of cities, towns and regions. Cultural tourism products in Poland. Eds. J. Wyrzykowski, J. Marak, M. Drozdowska. “Tourism Role in the regional Economy”. University of Business in Wroclaw, Wroclaw, 7: 227–239.
sKoWroneK e., BrzezińsKA-WóJciK t., HArAsiMiuK M., rutKoWsKi t., szeląg K., śWiecA A., czerniec W. 2015. Projekt zintegrowanego produktu turystycznego „Szlak zdrowia i urody – spotkanie z naturą” w świetle geograficznych uwarunkowań Obszaru Funkcjonalnego Powiśle Lubelskie. Europa Regionum, 23: 119–136.
Spanie na sianie – Roztocze, http://www.prorock-pl.com/spanienasianie/index.php?m=09, access: 15.08.2017.
stAcHyrA P., MArczAKoWsKi P., tcHórzeWsKi M. 2013. Rys historyczny oraz zasoby faunistyczne Parku. In: Roztoczański Park Narodowy – przyroda i człowiek. Eds. R. Reszel, T. Grądziel. Wyd. Roztoczański Park Narodowy, Zwierzyniec, pp. 129–177.
stAcHyrA P., orBAn i., KoleJKo M. 2015. Kręgowce. In: Roztocze – przyroda i człowiek. Eds. T. Gra- bowski, M. Harasimiuk, B.M. Kaszewski, Y. Kravchuk, B. Lorens, Z. Michalczyk, O. Shabliy. Wyd. Roztoczański Park Narodowy, Zwierzyniec, pp. 197–225.
stasiak A. 2005. Strategie rozwoju produktu turystycznego obszaru. In: Polityka turystyczna. Ed. A. Panasiuk. Uniwersytet Szczeciński, Szczecin-Kopenhaga, pp. 335–340.
śWiecA A., BrzezińsKA-WóJciK t., sKoWroneK e., KruKoWsKA r., tucKi A., grABoWsKi t., MAlsKA M., zinKo J., BrusAK v., PAnDiAK i., sHevcHuK O. 2015. Turystyka na Roztoczu. In: Roztocze – przyroda i człowiek. Eds. T. Grabowski, M. Harasimiuk, B.M. Kaszewski, Y. Krav-chuk, B. Lorens, Z. Michalczyk, O. Shabliy. Wyd. Roztoczański Park Narodowy, Zwierzyniec, pp. 391–427.
taBor K. 2009. Turystyka uzdrowiskowa na przykładzie Horyńca Zdroju. In: Potencjał turystycz-ny regionów. Ed. A. Balińska. Wyd. FAPA, Warszawa, pp. 109–117.
tittenBrun A. 2013. Skład gatunkowy i struktura lasów Roztoczańskiego Parku Narodowego. Wyd. Roztoczański Park Narodowy, Zwierzyniec.
Turystyka aktywna. Lokalna Organizacja Turystyczna „Zamość i Roztocze”, http.//roztocze.org/pl/page/25/turystyka-aktywna.html, access: 15.05.2017.
Turystyka aktywna w regionie lubelskim. 2004. Wyd. Urząd Marszałkowski Województwa Lubel-skiego, Lublin.
Turystyka aktywna. Józefów i Roztocze Środkowe. 2014. Wyd. Pietrzak, Lublin. Województwo lubelskie. Podregiony, powiaty, gminy. Urząd Statystyczny w Lublinie, Lublin, 2017.Województwo podkarpackie. Podregiony, powiaty, gminy. 2017. Urząd Statystyczny w Rzeszowie,
Rzeszów. WyrzyKoWsKi J. 1984. Optymalne okresy użytkowania turystycznego walorów wypoczynkowych
środowiska przyrodniczego Polski. Acta Universitatis Wratislaviensis, 656, Studia Geograficz-ne, 44: 50–74.
WyżniKieWicz-nAWrAcAłA A. 2002. Jeździectwo w rozwoju motorycznym i psychospołecznym osób niepełnosprawnych. Wyd. AWFiS, Gdańsk.
Zapraszamy do Szczebrzeszyna. n.d. Urząd Miasta i Gminy Szczebrzeszyn.Zespół Lubelskich Parków Krajobrazowych, http://www.parki.lubelskie.pl/, access: 28.07.2017.Zespół Parków Krajobrazowych w Przemyślu, http://zpkprzemysl.pl, access: 28.07.2017.


POLISH JOURNAL OF NATURAL SCIENCES Abbrev.: Pol. J. Natur. Sc., Vol 33(3): 487–501, Y. 2018
THE USE OF MANUAL THERAPY IN CANINE DISCIPLINE – AGILITY
Dominika Gulda1, Monika Lik2 1 Department of Sheep, Goat and Fur Bearing Animal Breeding
2 Department of Zoology and LandscapingUniversity of Science and Technology in Bydgoszcz, Poland
K e y w o r d s: canine sports, animal physiotherapy, manual therapy, rehabilitation.
A b s t r a c t
Agility competition is a discipline of canine sports in which dogs complete the obstacle course in specific order racing against the clock. The aim of this study was to estimate the impact of applied manual therapy techniques on the movement parameters of dogs. The movement of the dogs was characterised on the basis of 5 parameters, i.e.: walk, trot, gallop, flexibility and mobility and was assessed with the use of quality point scale. The study covered the assessment of movement parameters of 36 dogs, in canine discipline – agility, during two sporting seasons. The animals were assessed in categories: Small, Medium, Large. Assessment of parameters was carried out before the beginning of sporting dog competition and again after the end of three-month season of competitions. In the following year there were animal physiotherapy manual treatments implemented. Treatments included passive and active exercises, so called mobilizations, massages, thermal therapy, vibration training and sensomotoric exercises. In Small, Medium and Large category the highest average point values were attributed to walk feature, whereas the lowest values were attributed to trot. Dogs whose height at the withers was up to 35 cm were characterized by proper traction of movement in gait, correct dynamics of take-off while jumping and were given high marks for completing slalom obstacle. The lowest average value for flexibility feature was recorded for dogs in Large category.
Manual therapy techniques applied systematically reinforce dog’s anatomical structures of skeletal system, reduce muscle tension and increase the intensity of metabolism.
Address: Dominika Gulda, ul. Mazowiecka 28, University of Science and Technology in Bydgoszcz, 85-084 Bydgoszcz, Poland, phone: +48 (52) 37 49 445, e-mail: [email protected]

Dominika Gulda, Monika Lik488
ZASTOSOWANIE TERAPII MANUALNYCH W DYSCYPLINIE KYNOLOGICZNEJ – AGILITY
Dominika Gulda1, Monika Lik2 1 Zakład Hodowli Owiec, Kóz i Zwierząt Futerkowych
2 Zakład Zoologii i Kształtowania KrajobrazuUniwersytet Technologiczno-Przyrodniczy w Bydgoszczy, Bydgoszcz, Polska
S ł o w a k l u c z o w e: sporty kynologiczne, fizjoterapia zwierząt, terapie manualne, rehabilitacja.
A b s t r a k t
Agility stanowi dyscyplinę psich sportów, w których psy pokonują tor przeszkód w ściśle określonym czasie.
Celem pracy było oszacowanie wpływu stosowanych technik terapii manualnej na parame-try ruchu psów. Ruch psów charakteryzowano na podstawie 5 parametrów, tj. stępu, kłusu, galo-pu, elastyczności i mobilności, oraz oceniono za pomocą jakościowej skali punktowej. Badanie obejmowało ocenę parametrów ruchu 36 psów biorących udział w agility w ciągu dwóch sezonów sportowych. Zwierzęta oceniano w kategoriach: Small, Medium, Large. Ocenę parametrów prze-prowadzono przed rozpoczęciem trzymiesięcznego sezonu zawodów i po jego zakończeniu. W na-stępnym roku wprowadzono zabiegi manualnego leczenia fizjoterapeutycznego. Obejmowały ćwi-czenia bierne i czynne, zwane mobilizacjami, masaże, terapie termiczne, ćwiczenia wibracyjne i ćwiczenia sensomotoryczne. W kategorii Small, Medium i Large najwyższe średnie wartości punktu przypisano do funkcji chód, podczas gdy najniższe wartości przypisywano do kłusu. Psy, których wysokość w kłębie wynosiła do 35 cm, charakteryzowały się właściwą trakcją ruchu cho-du, poprawną dynamiką startu podczas skoków i zostały wysoko ocenione do ukończenia prze-szkody na slalomie. Najniższą średnią wartość funkcji elastyczności zarejestrowano dla psów z kategorii Large.
Zastosowanie w rehabilitacji technik manualnych systematycznie wzmacnia strukturę anato-miczną układu kostnego psa, zmniejsza napięcie mięśniowe i zwiększa intensywność metabolizmu.
Introduction
The use of manual therapy is aimed at reaching and maintaining such a level of dog’s physical condition so as to enable the dog to take part in sport competitions without the risk of injury. Manual and kinetic thera-peutic techniques applied in animal (veterinary) physiotherapy include the following: active and passive mobilization of muscles and tendons, the-rapeutic massage, including stretching, lymphatic drainage and thermal therapy – direct (contact) thermal impact.
Precise defining of kinesiotherapy programme and incorporating man-ual therapy into regular training is the element which positively affects the well-being of working animals as well as brings down the costs of
The Use of Manual Therapy in Canine Discipline – Agility 489
injury treatment. The achievement of the proper fitness state for sport activities by the animal requires preparing its body for cycles of unilateral physiological load. The aim of animal physiotherapy treatment is mini-mizing the neuromuscular dysfunctions, and, in turn, preventing the pathological lesions within the dog’s locomotor apparatus. This effect is obtained through active movement of soft tissues, relaxation of antagonist muscles, post-isometric relaxation of muscles (lAnDruM et al. 2008, PFau et al. 2011, siniscAlcHi et al. 2014). The underlying purpose of active mobilization (kinesiotherapy) is the stimulation of blood circulation, and, consequently, stimulation of metabolism, the increase of temperature in the active area, preparing the motor structures for dynamic reactions.
Agility competition is a discipline of canine sports in which dogs com-plete the obstacle course in specific order racing against the clock. The obstacles are of various types, which requires the dog to engage all struc-tures of locomotor apparatus (BaLtzer et al. 2012, Pastore et al. 2011, cullen et al. 2017). Injuries or a lowered sport performance means lack of participation in competitions and generates costs involved in treatment, rehabilitation and recovery allowing the dog’s return to training schedule.
The aim of this study was to estimate the impact of applied manual therapy techniques on the movement parameters of working dogs in canine discipline – agility.
Material and Methods
The study covered 36 sporting dogs taking part in competitions of international range, in the canine discipline – agility in the sporting season of 2013 and again, in 2014. According to the rules of agility competition the study group was divided into 3 categories, 12 dogs in each one (Agility Regulations: Federation Cynologique Internationale, 2013).
1. Small category – dogs of under 35 cm at the withers represented in the study by:
– 7 Cavalier King Charles Spaniel dogs,– 5 Fox terrier dogs.2. Medium category – dogs from 35 cm to 43 cm at the withers, the
following dogs were assessed:– 10 Border Collie dogs,– 2 Shetland Sheepdogs.3. Large category – dogs of over 43 cm at the withers, which comprised of:– 9 Belgian Sheepdogs,– 3 Beauceron dogs.

Dominika Gulda, Monika Lik490
The sporting season lasted 3 months and each of the dogs being evalu-ated within its duration took part in 10 agility competitions.
The movement of the dogs was characterised on the basis of 5 parame-ters, i.e.: walk, trot, gallop, flexibility and mobility and was assessed with the use of own quality 6 points scale described in Table 1.
Table 1 Quality scale (in points) of assessed movement parameters of dogs used in own investigations
Feature Description Points Characteristics of gait parameters
Walk
gait the slowest four-point gait, cycle:
1. Right shoulder limb.2. Left pelvic limb.
3. Left shoulder limb.4. Right pelvic limb.
1noticeable lameness, dog stumbles or does not
load one of the limbs, possible occurrence of spasticity
2
movement with noticeable disrupted align-ment of limbs while stepping forward,
insufficient load on one of the limbs, gait with so called toe support
3proper movement, but without visible
dynamics, frequent stumbling, all limbs properly loaded
4 dynamic movement, limbs properly loaded, occasional stumbling
5proper movement, dynamic, without stum-bling, limbs loaded properly, proper step
forward of comparable length for each limb
6proper, dynamic movement, noticeable
involvement, equal length of step forward for all limbs
Trot
two-point gait, symmet-rical with visible
rhythm, diagonal limbs move at the same time
cycle:1. Right shoulder limb and left pelvic limb are
on the ground, left shoulder limb and right
pelvic limb are in the air.
2. Left shoulder limb and right pelvic limb
remain on the ground, while right foreleg and
left hindleg are in the air
1noticeable lameness, dog stumbles or does not
load one of the limbs, possible occurrence of spasticity
2
movement with noticeable disrupted align-ment of limbs while stepping forward,
insufficient load on one of the limbs, gait with so called toe support
3proper movement, but without visible
dynamics, frequent stumbling, all limbs properly loaded
4 dynamic movement, limbs properly loaded, occasional stumbling
5proper movement, dynamic, without stum-bling, limbs loaded properly, proper step
forward of comparable length for each limb
6proper, dynamic movement, noticeable
involvement, equal length of step forward for all limbs

The Use of Manual Therapy in Canine Discipline – Agility 491
Gallop
non-symmetrical three-point gait, so called ‘leap’ gait.
cycle:1. Left shoulder limb and right pelvic limb
2. Right shoulder limb and left pelvic limb.3. Flight stage; the
moment when all limbs are not touching the
ground.
1noticeable lameness, dog stumbles or does not
load one of the limbs, possible occurrence of spasticity
2
movement with noticeable disrupted align-ment of limbs while stepping forward,
insufficient load on one of the limbs, gait with so called toe support
3proper movement, but without visible
dynamics, frequent stumbling, all limbs properly loaded
4 dynamic movement, limbs properly loaded, occasional stumbling
5proper movement, dynamic, without stum-bling, limbs loaded properly, proper step
forward of comparable length for each limb
6proper, dynamic movement, noticeable
involvement, equal length of step forward for all limbs
Flexibility
feature defined as the dog’s ability to smoothly
change directions, so called manoeuvrability,
alternately assuming S-shaped position,
especially while going through slalom obstacles
1
noticeable lameness; dog is moving overbent, with so called ‘cat back’ , lack of level for back line from the withers to sacral bones, animal
does not complete slalom in any gait
2back line with slight but noticeable protru-
sions, stiff gait at any pace, elements of slalom rarely completed
3proper back line, dog misses single poles
while going through a slalom, shortened step forward, no dynamics in taking turns
4proper back line, dog completes slalom
without missing poles, proper step forward, lack of dynamics
5 proper back line, proper step forward, proper dynamics of movement
6
proper back line, proper step forward, proper dynamics of movement, increased range of
movement in limb joints, visible while going through slalom and assuming S-shaped
position – double bend

Dominika Gulda, Monika Lik492
Mobility
feature defined as the ability to jump; assess-
ment covers the cycle of: 1. Take-off stage.
2. Bascule (characteristic curve of dog’s body
during the flight over obstacle)
3. Landing.4. Rebound.
1 dog refuses to go through a vertical
2
dog goes through a vertical with a fault – knocks the bar, take-off is clearly incorrect, lack of bascule, landing with a stumble, lack
of rebound
3
dog goes through a vertical; take-off with a fault – no distance kept in front of the
obstacle, bascule visibly with too much neck work, stumbling at landing, rebound with
support
4dog goes through a vertical, visible effort at take-off, flat bascule, occasional stumbling
occurs at landing
5dog correctly completes a vertical, dynamic take-off, proper bascule, landing without
stumbling, rebound stage with minor faults
6dog correctly completes a vertical, all stages
of movement are performed clearly and flawlessly
The same dogs were assessed twice at the start, creating control group KS (start) and the end of sporting season, creating KF group (finish).
In the second year of research the assessed dogs were included into a supportive manual therapy treatment carried out before training (Table 2) and after training (Table 3 ). Within 6 months the exercises consisting of mobilization, increase of muscle strength, improvement in coordination and proprioception were done.
Table 2Author’s supportive programme introduced before dog’s training
Sequence of treatments Treatment Description Duration/number
of repetitions
1 thermal therapy
improvement of blood circulation, diminished pain, swelling and
limb muscle contractions, reduced inflammation
5 minutes
2mobilizing massage
with elements of stretching
reduction of muscle tension in pathological area, removal
of adhesions
10 minutes + 5 minutes
3 sensomotoric exercises
sensomotoric disc – increase of muscle strength and blood
circulation in limbs affected by injury; improved functioning of proprioception organs and
flexibility of limb muscles
10 repetitions
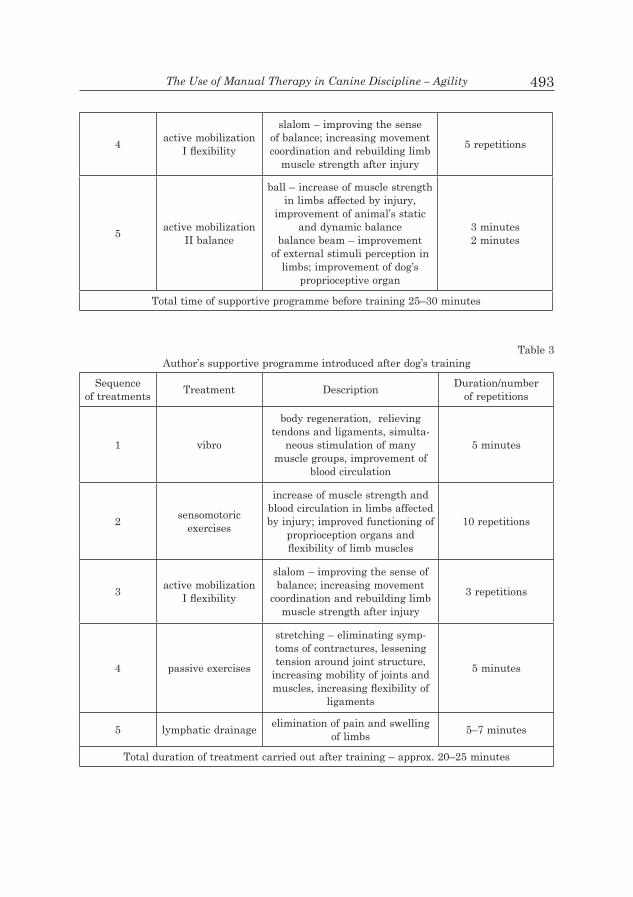
The Use of Manual Therapy in Canine Discipline – Agility 493
4 active mobilization I flexibility
slalom – improving the sense of balance; increasing movement coordination and rebuilding limb
muscle strength after injury
5 repetitions
5 active mobilization II balance
ball – increase of muscle strength in limbs affected by injury,
improvement of animal’s static and dynamic balance
balance beam – improvement of external stimuli perception in
limbs; improvement of dog’s proprioceptive organ
3 minutes2 minutes
Total time of supportive programme before training 25–30 minutes
Table 3 Author’s supportive programme introduced after dog’s training
Sequence of treatments Treatment Description Duration/number
of repetitions
1 vibro
body regeneration, relieving tendons and ligaments, simulta-
neous stimulation of many muscle groups, improvement of
blood circulation
5 minutes
2 sensomotoric exercises
increase of muscle strength and blood circulation in limbs affected by injury; improved functioning of
proprioception organs and flexibility of limb muscles
10 repetitions
3 active mobilization I flexibility
slalom – improving the sense of balance; increasing movement
coordination and rebuilding limb muscle strength after injury
3 repetitions
4 passive exercises
stretching – eliminating symp-toms of contractures, lessening tension around joint structure,
increasing mobility of joints and muscles, increasing flexibility of
ligaments
5 minutes
5 lymphatic drainage elimination of pain and swelling of limbs 5–7 minutes
Total duration of treatment carried out after training – approx. 20–25 minutes
Dominika Gulda, Monika Lik494
Treatment was introduced 3 months before the start of sporting season. The parameters of dogs’ movement were assessed twice according to own programs: at the start of the sporting season, creating TS group, and the end of sporting season, creating TF group.
Statistical characteristics of the assessed movement parameters was made within the scope of research groups (KS, KF, TS, TF), for the entire research population and for Small, Medium, Large categories. Statistical differences between research groups for average values of features: walk, trot, gallop, flexibility and mobility were demonstrated with the use of Mann Whitney test. The calculations were made with the use of statistics package Statistica 12 Pl.
Results
The study covered the assessment of movement parameters of 36 dogs, in canine discipline – agility, during two sporting seasons. The animals were assessed in 3 categories: Small, Medium, Large and as the entire population.
During the first sporting season the point values were given to the following features: walk, trot, gallop, flexibility, mobility according to the assumed quality scale (Table 1). Assessment of parameters was carried out before the beginning of sporting dog competition (group of dogs defined as KS) and again after the end of three-month season of competitions (group of dogs defined as KF).
In the following year for the same dogs there were animal physiothe-rapy manual treatments implemented before training/participating in competition (Table 2) and after finished training/end of competitions (Table 3). Treatments included passive and active exercises, so called mobilizations, massages (with lymphatic drainage and stretching), ther-mal therapy, vibration training (vibro) and sensomotoric exercises. During the second sporting season dogs were also assessed twice – a quarter after the commencement of supportive treatment and simultaneously three months before participation in competitions (group of dogs referred to as TS) and after the end of sporting season (group of dogs referred to as TF).
In Small, Medium and Large category the highest average point values in all groups (KS-TF) were attributed to walk feature, whereas the lowest values were attributed to trot (Table 4–6).
Dogs whose height at the withers was up to 35 cm (Small category) were characterized by proper traction of movement in gait, correct dyna-mics of take-off while jumping and were given high marks for completing

The Use of Manual Therapy in Canine Discipline – Agility 495
slalom obstacle. During slalom dogs change directions, alternately assu-ming S-shaped position. Maintaining proper back line, expressiveness of movement and length of step forward were described and assessed as the parameter of flexibility. For this feature in Small and Medium categories, in TS, TF and KS groups, average point values were between 5.1 and 5.5. For KF group the average point value for flexibility parameter was 4.4, in Small category and 4.2 for Medium category (Table 4, Table 5).
Table 4 Average point values of particular movement parameters of assessed dogs in Small category
FeatureSmall
KS KF TS TF
Walk 5.6 4.8 5.5 5.5
Trot 5.2 4.1 4.8 4.9
Gallop 5.0 4.5 4.8 4.8
Flexibility 5.5 4.4 5.1 5.1
Mobility 5.8 4.1 5.0 5.0Significance: KS – control group before the start of the competition; KF – control group after the finish of the competition; TS – group which received manual therapy programme before the start; TF – group which received manual therapy programme after the end of sporting season
Table 5Average point values of particular movement parameters of assessed dogs in Medium category
FeatureMedium
KS KF TS TFWalk 5.8 4.6 5.2 5.4
Trot 5.5 4.4 5.0 5.0
Gallop 5.2 4.7 4.9 5.2
Flexibility 5.5 4.2 5.1 5.4
Mobility 5.4 4.2 4.8 5.2
Significance: KS – control group before the start of the competition; KF – control group after the finish of the competition; TS – group which received manual therapy programme before the start; TF – group which received manual therapy programme after the end of sporting season
The lowest average value for flexibility feature was recorded for dogs in Large category in KF group: 3.9 points (Table 6). The location of centre of gravity in relation to the ground of large dogs (above 43 cm at the withers) makes it difficult for the animal to take dynamic turns without loss of gait pace or balance.

Dominika Gulda, Monika Lik496
Table 6 Average point values of particular movement parameters of assessed dogs in Large category
FeatureLarge
KS KF TS TF
Walk 5.5 4.3 5.0 4.8
Trot 5.0 3.8 4.7 4.5
Gallop 5.0 4.2 4.9 4.9
Flexibility 5.2 3.9 5.0 5.0
Mobility 5.7 4.0 5.5 4.9
Significance: KS – control group before the start of the competition; KF – control group after the finish of the competition; TS – group which received manual therapy programme before the start; TF – group which received manual therapy programme after the end of sporting season
The average values of movement parameters assessment in control group after the end of sporting season (KF) were lower in comparison with control group assessed before the participation in competition (KS) and with both groups with implemented programme of manual therapy treat-ment (Table 4–6).
In the researched population the highest values of average scores were attributed for such movement parameters as: walk and flexibility whereas the lowest for trot feature. Comparable values for assessed parameters were observed in groups TS and TF involved in manual therapy programmes. The amplitude of average values of features for the dogs assessed before the beginning and after the end of sporting season in the group not involved in physiotherapy treatments was statistically significant (Figure 1 – Table 7).
Fig.1. Average point values of assessed movement parameters in research groups for the entire population

The Use of Manual Therapy in Canine Discipline – Agility 497
Table 7 Statistical differences between research groups for the assessed movement parameters
Feature Statistical differences
Walk KS – TF **KF – TS, TF *
Trot KS – KF **KF – TS, TF **
Gallop KS – KF *KS, KF – TS, TF **
Flexibility KS – KF **KF – TS, TF *
Mobility
KS – KF **KS – TS **KS – TF *
KF – TS, TF **
*statistical difference significant for p ≤0.05, **statistical difference significant for p ≤ 0.01Significance: KS – control group before the start of the competition; KF – control group after the finish of the competition; TS – group which received manual therapy programme before the start; TF – group which received manual therapy programme after the end of sporting season
Between KS and KF group highly significant statistical differences were observed (at p ≤0.01) between average values of scores for walk, trot, flexibility and mobility whereas significant statistical differences (at p ≤ 0.05) were noted for gallop feature. Highly significant statistical differen-ces for features such as trot, gallop and mobility were noticed between KF and TS, TF (Table 7).
For KS and KF groups, both in categories and in population, there was a fall within the range of average point values for all features. The result is a consequence of body fatigue and the limited period of tissue regenera-tion during sporting season.
In groups covered by supportive programme with manual therapy tre-atment no differences between average values for assessed features were observed. Despite the strain on anatomical structures of locomotor appa-ratus due to intensive work performed by the dogs during sporting season the animals did not display changes related to fatigue or injury in their manner of movement.
Discussion
Preparing the dog for participation in sport competition is time-con-suming and requires financial resources. Building proper fitness state for
Dominika Gulda, Monika Lik498
sport activities and participation in sport rivalry on international level is preceded by training of endurance, coordination and manoeuvrability (McMilliAn et al. 2006, sAunDers et al. 2005, BircH et al. 2015, cullen et al. 2017 ).
The quality of movement of the dog – agility contestant – is directly defined by efficiency (ergonomics) of particular gait, dynamic jumps and manoeuvrability (flexibility) (Dyson et al. 2000, gulDA et al. 2013).
Walk as the alternating four-point gait enables the dog to balance its bodyweight on all limbs without the necessity of long-term straining of any of them because of displacement of the centre of gravity.
Trot, as the two-point gait causes abrupt shifting of centre of gravity with simultaneous involvement of alternate limbs. Another gait, faster in terms of pace, is gallop, during which the dog additionally mobilizes motoric structures (muscles) to dynamic bouncing and shifting weight to front body parts (golDner et al. 2015). Load is received by resilient struc-tures like cartilages and bursae (gregersen and cArrier 2004, McMil-Lian et al. 2006).
Assessment of gait is a description of characteristic traction of move-ment and tolerance of loads. It is related to a particular dog breed. Accord-ing to MiLLis et al. (2007) dogs of small breeds move in a dynamic manner, are manoeuvrable and flexible (arHant et al. 2010, MiLLis et al. 2004). In the course of conducted research dogs assessed in Small category (up to 35 cm) obtained the highest scores in features walk and ‘flexibility’ and the lowest scores in trot (Table 4). Breeds with short limbs have increased step frequency, while having a shortened step forward. It diminishes their trot effectiveness.
In research the mobilization exercises were introduced in the support-ive programme before training (Table 2), incorporating elements of stretch-ing as well as active exercises. These preventive exercises were aimed at the improvement of static and dynamic balance of animals, coordination and flexibility of movement as well as increasing muscle strength while relieving points of tension (DeMierre et al. 2005, gAynor 2007, gulDA et al. 2013).
According to many authors mobilization of muscles covers PROM exercises, so called passive exercises within the scope of movement – exer-cises are based on increased mobility within joints through traction move-ments taking into account the length and flexibility of soft tissues (BircH and leśniAK 2013, cArr 2014).
Active mobilization of animal muscles is a general name denoting a number of exercises activating structures of locomotor system. Move-ment of limbs is dynamic with the participation of animal’s muscles. Dur-

The Use of Manual Therapy in Canine Discipline – Agility 499
ing mobilization the dog makes a move, contracts and relaxes skeletal muscles (Biewener and DAley 2007, coAtes 2013, Doyle 2004).
As opposed to active mobilization, passive exercises are done without the participation of dog’s muscle contractions (WoJciecHoWsKi et al. 2004). Training is conducted with the use of external forces with dog’s pas-sive attitude.
Among supportive exercises conducted after training (Table 2) there were: active mobilization, represented by flexibility practice with slalom obstacle and passive exercises where stretching techniques were used to reduce increased tension of tendons and muscles.
Lower average point values in group involved in supportive pro-gramme before the participation in the competition as compared to the research group in which manual therapy was not carried out results from so called physiological rebound. Dog’s body as a response to stimulation of anatomical structures (sensomotoric exercises) and their directional load (unilateral active and passive mobilization) needs time for regeneration processes and physiological mobilization.
Positive impact on ligament and tendon flexibility and the elimination of muscle spasticity reduces the frequency of mechanical injuries occur-rence during training and competition, e.g.: ligament rapture, sprains or dislocations (DeMierre et al. 2005, McgoWAn et al. 2007). The applica-tion of therapeutic massage (muscle mobilization techniques, stretching) and thermal therapy before the start of training improves micro-circula-tion, warms up muscles and prepares the body for intensive effort. Passive exercises of anatomical structures and lymphatic drainage implemented after training or directly after strenuous exercises diminish congestive oedema.
Summing up, the introduction of manual techniques of animal physio-therapy for dogs taking part in canine sports serves a supportive and pre-ventive role. Treatments applied systematically before and after training reinforce dog’s anatomical structures of skeletal system, reduce muscle tension and increase the intensity of metabolism.
In the authors’ opinion, working dogs participating in canine disci-pline agility require the application of treatment making use of various manual therapeutic techniques in order to stabilize the physical condition and capability of the participating dog. In dogs involved in supportive pro-gramme all parameters of the quality of movement were assessed at a comparable level, at the beginning and at the end of sporting season. In that group there was no indication of negative impact of intensive work, fatigue, injuries or lowered physiological capability. This phenomenon is a consequence of dynamics of metabolic changes. In dogs of small breeds

Dominika Gulda, Monika Lik500
the rate of regeneration of biological structures is much faster than in large or giant breeds.
Taking into account the principles of animal welfare, it should be noted that larger dogs have greater joint overload associated with their body weight during agility training. The animal must perform more work on the mobilization to jump, which entails a cascade of physiological pro-cesses such as increased oxygen demand, intense heart and skeletal musc-les, etc. At the landing the animal mobilizes responsible for coordination of neurological structures, muscles, with the base, ligaments and tendons stabilizing the animal in motion (BircH et al. 2015).
All applicable international, national and/or institutional guidelines for the care and use of animals were followed.
Translated by ENGART KAtArzynA szruBAAccepted for print 19.09.2017
References
Agility regulations. 2013. Federation Cynologique Internationale, pp. 1–9.ArHAnt c., BuBnA-littitz H., BArtels A., FutscHiK A., troxler J. 2010. Behaviour of smaller
and larger dogs. Effects of training methods, inconsistency of owner behaviour and level of engagement in activities with the dog. Appl. Anim. Behav. Sci., 123: 131–142.
BAltzer W.i., FirsHMAn A.M., stAng B., WArnocK J.J., gorMAn e., McKenzie e.c. 2012. The effect of agility exercise on eicosanoid excretion, oxidant status, and plasma lactate in dogs. BMC Vet. Rec., 8: 249–260.
BieWener A.A., DAley M., A. 2007. Unsteady locomotion: integrating muscle function with whole body dynamics and neuromuscular control. J. Exp. Biol., 210: 2949–2960.
BircH e., leśniAK K. 2013. Effect of fence height on joint angles of agility dogs. Vet. J., 198: 99–102.
BircH e., BoyD J., Doyle g., Pullen A. 2015. The effect of altered distances between obstacles on the jump kinematics and apparent joint angulation of large agility dogs. Vet. J., 204: 174–178.
cArr n. 2014. Dogs in the leisure experience. University of Otago.coAtes J.c. 2013. Manual therapy. In: Canine sports medicine and rehabilitation. Eds. M.Ch. Zink,
J.B. Dyke. Wiley &Sons, pp. 100–114.cullen K.i., DicKey J.P., BroWn s.H.M., nyKAMP s.g., leAH r.B., tHoMAson J.J., Moens n.M.M.
2017. The magnitude of muscular activation of four canine forelimb muscles in dogs perfor-ming two agility-specific tasks. BMC Vet. Rec., 13: 68–81.
DeMierre s., JAggy A., KAtHMAnn i. 2005. Rehabilitation in neurology of small animals. Mag. Wet., 11: 5–8.
Doyle n.D. 2004. Rehabilitation of fractures in small animals. Maximize outcomes, minimize complications. Clin. Tech. Small Anim. Pract., 19: 180–191.
Dyson r., grAyPlon J., HeMMings B., sMitH M. 2000. Effects of massage on physiological resto-ration, perceived recovery and repeated sports performance. Br. J. Sports Med., 34: 109–115.
gAynor J.s. 2007. To exercise or not: principles of canine rehabilitation. Dogwise Publishing, Colorado Springs.
golDner B., FucHs A., nolte i., scHilling n. 2015. Kinematic adaptations to tripedal loco-motion in dogs. Vet. J., 204: 192–200.
The Use of Manual Therapy in Canine Discipline – Agility 501
gregersen c.s., cArrier D.r. 2004. Gear ratios at the limb joint of jumping dogs. J. Biomech., 37: 1011–1018.
gulDA D., DreWKA M., MonKieWicz M. 2013. The use of goniometry in equestrain and cynological sports. JCEA, 14: 1364–1373.
lAnDruM e.l., Kelln c.B., PArente W.r., ingersoll c.D., Hertel J. 2008. Immediate effects of anterior-to-posterior talocrural joint mobilization after prolonged ankle immobilization: a preliminary study. J. Man. Manip. Ther., 16: 100–105.
McgoWAn c., goFF l., stuBBs n. 2007. Animal physiotherapy. Research, treatment and rehabi-litation of animals. Blackwell Publishing, Warszawa.
McMilliAn D.J., Moore J.H., HAlter B.s., tAylor D.c. 2006. Dynamic vs. static-stretching warm up: the effect on Power and agility performance. J. Strength Cond. Res., 20: 492–499.
Millis D.l., levine D., tAylor r.A. 2004. Canine rehabilitation & physical therapy. Elsevier Urban & Partner, pp. 197–207.
PAstore c., Pirrone F., BAlzArotti F., FAustini M., PierAntoni l., AlBertini M. 2011. Eval-uation of physiological and behavioural stress-dependent parameters inagility dogs. J. Vet. Behav., 6: 188–194.
PFAu t., gerlAnD De rivAz A., BrigHton s., Weller r. 2011. Kinetics of jump landing in agility dogs. Vet. J., 190: 278–283.
sAunDers D.g., WAlKer J.r., levine D. 2005. Joint mobilization. Vet. Clin. North Am. Small Anim. Pract., 35: 1287–1316.
siniscAlcHi M., Bertino D., quArAntA A. 2014. Laterality and performance of agility-trained dogs. Routledge, 19(2): 219–234.
WoJciecHoWsKi M., sternA J., lecHoWsKi r. 2004. The use of physical therapy in the treatment of dogs’ orthopedic diseases. Życie Wet., 4: 216–220.


POLISH JOURNAL OF NATURAL SCIENCES Abbrev.: Pol. J. Natur. Sc., Vol 33(3): 503–516, Y. 2018
REVIEW OF PROCEDURES CONCERNING ANIMALS INVOLVED IN TRAFFIC ACCIDENTS – INCLUDING
OWN INVESTIGATIONS
Justyna Karaźniewicz1, Ireneusz Sołtyszewski2, Tadeusz Malewski3, Józef Szarek4,
Mariusz Felsmann5, Wojciech Grudzień6, Andrzej Dzikowski4*
1 Department of Criminal Procedure2 Department of Criminalistics and Forensic MedicineUniversity of Warmia and Mazury in Olsztyn, Poland
3 Museum and Institute of Zoology Polish Academy of Sciences in Warsaw, Poland
4Department of Pathophysiology, Forensic Veterinary Medicine and Administration
University of Warmia and Mazury in Olsztyn, Poland5 Centre for Veterinary Sciences
Nicolaus Copernicus University in Toruń, Poland6 Private Veterinary Praxis GRUDWET in Ruże near Zbójno, Poland
K e y w o r d s: procedures for dealing with animals after car accidents, road accidents, animal protection, Polish law, veterinary forensic medicine, species determination.
A b s t r a c t
There is a systematic increase in the number of traffic accidents involving both domestic and free-living animals. It was found that the largest number of animals dies in May and at the turn of October and November. It is estimated that only every fourth driver reports collision in Poland. In some cases, wounded animals are slaughtered and their meat is used for consumption. In connection with road accidents involving animals, it is crucial for the law-enforcement authorities to determine the actual state of affairs in order to assess the proper course of the collision.
The paper presents comprehensive legal and veterinary aspects of the discussed issues. The own analysis was made according to the number of the road incidents in Poland with the participation of animals.
Address: Andrzej Dzikowski, University of Warmia and Mazury in Olsztyn, ul. Oczapowskiego 13, 10-719 Olsztyn, Poland, phone: +48 (89) 523 37 07, e-mail: [email protected]

Justyna Karaźniewicz et al.504
PRZEGLĄD PROCEDUR POSTĘPOWANIA ZE ZWIERZĘTAMI UCZESTNICZĄCYMI W WYPADKACH DROGOWYCH
(Z WŁĄCZENIEM BADAŃ WŁASNYCH)
Justyna Karaźniewicz1, Ireneusz Sołtyszewski2, Tadeusz Malewski3, Izabella Babińska4, Józef Szarek4, Mariusz Felsmann5, Wojciech Grudzień6,
Andrzej Dzikowski4* 1 Katedra Procesu Karnego
2 Katedra Kryminalistyki i Medycyny Sądowej Uniwersytet Warmińsko-Mazurski w Olsztynie, Polska
3 Muzeum i Instytut Zoologii Polska Akademia Nauk w Warszawie, Polska
4 Katedra Patofizjologii, Weterynarii Sądowej i Administracji Uniwersytet Warmińsko-Mazurski w Olsztynie, Polska
5 Centrum Weterynarii Uniwersytet Mikołaja Kopernika w Toruniu, Polska
6 Gabinet weterynaryjny GRUDWET, Ruże koło Zbójna, Polska
S ł o w a k l u c z o w e: procedury postępowania ze zwierzętami po wypadkach samochodowych, wypadki drogowe, ochrona zwierząt, prawo polskie, weterynaria sądowa, oznaczanie gatunków.
A b s t r a k t
Obserwuje się systematyczny wzrost wypadków komunikacyjnych z udziałem zwierząt za-równo domowych, jak i wolno żyjących. Stwierdzono, że największa liczba zwierząt ginie w maju i na przełomie października i listopada. W Polsce szacuje się, że tylko co czwarty kierowca zgła-sza fakt kolizji policji. W niektórych przypadkach ranne zwierzęta są dobijane, a ich mięso jest wykorzystywane do celów konsumpcyjnych. W związku z wypadkami drogowymi z udziałem zwierząt kluczowe znaczenie dla organów ścigania ma ustalenie stanu faktycznego w celu oceny przebiegu zdarzenia.
W pracy przedstawiono w sposób kompleksowy prawne i weterynaryjne aspekty omawianej problematyki. Dokonano również własnej analizy liczby wypadków drogowych w Polsce z udzia-łem zwierząt.
Introduction
There is a systematic increase in the number of traffic accidents involving both domestic and free-living animals being observed. It has been shown that the number of accidents concerning animals is related to the season of the year (PAWelec 2011). Most of such accidents occur in May. This can be explained by the seasonal changes in animal shelters. The second peak of accidents number takes place in October and Novem-

Review of Procedures Concerning Animals Involved in Traffic Accidents... 505
ber, because then migration of animals to wintering grounds begins (FeL-sMann et al. 2012). During this period of the year, males are particularly vulnerable to death under the wheels of the vehicles. This is caused by their migration and territorial expansion in search of females. It has been shown that up to 75% of road events occurring in Poland involve elks. 50% of wild boars, deer and foxes and 40% of deer and hares are also killed by cars in autumn (Listos et al. 2015).
In Poland, according to the art. 33 sect. 3 of the Act on the Protection of Animals (PolisH JournAl oF lAWs 2017/1840), the driver of a motor vehicle that hit an animal (domestic or free-living) is obliged to provide it with an appropriate assistance or notify the emergency services. A driver who could have performed such activities and did not perform them, can be punished with a custody or a fine. Unfortunately, not every driver reports such a collision to the police. Also situations when wounded ani-mals are slayed and used for consumption are noted.
Phenomenon of road accidents involving animals
Road incidents involving animals are not rare on Polish roads. The scale of this phenomenon is not completely known, primarily due to the fact that the statistics compiled by the Police Headquarters cover only the disclosed events (information of which has reached the Police authorities). On the other hand, it is estimated that only every fourth driver reports such an event, despite the notification obligation. Furthermore, a detailed and proper analysis and assessment of the events’ structure is hindered by the fact that the official statistics include all events involving animals, both domestic and wild.
There is no doubt, however, that the number of road accidents in which animals take part grows up year by year. Over the last 11 years, this num-ber has increased by over 10,000 annually (from 14,648 in 2007 to 24,770 in 2017). The data collected by the Police Headquarters show that during the last 11 years (2007–2017) there were 214,040 traffic incidents involving the at least one animal clashed. Of these events, 1,912 were traffic accidents in which 91 animals were killed, and 2,362 animals were injured. The rema-ining 212,128 events are classified as the road collisions. The dynamics and structure of events in the last decade are presented in the Table 1.

Justyna Karaźniewicz et al.506
Table 1Number of the road incidents in Poland with the participation of animals, and their effects in
2007–2017, investigation according to the Police Headquarters’ data
YearNumber of incidents Number of animals
road collisions traffic accidents total killed wounded
2007 14,643 128 14,648 5 166
2008 16,835 157 16,992 6 208
2009 17,403 177 17,580 7 218
2010 17,561 151 17,712 11 177
2011 17,515 164 17,679 3 208
2012 18,689 168 18,857 5 207
2013 19,338 180 19,518 12 222
2014 20,182 195 20,377 8 250
2015 22,170 213 22,383 10 262
2016 23,218 183 23,401 14 214
2017 24,574 196 24,770 10 230
Total 212,128 1,912 214,040 91 2,362
Procedures related to road accidents involving animals
A road incident involving an animal necessitates the involvement of various entities and public judiciary authorities. Their actions provide medical assistance to people participating in the incident, as well as a veterinary assistance to animals suffering. It is also necessary to secure the place (to preserve other dangerous situations) and to restore cleanli-ness and order within the lane. Responsible in this regard are: the driver of a motor vehicle, the police and other entities appointed to care for woun-ded animals, as well as services dealing with the removal of dead animals from the road (gaBerLe 2010, oFFiciAl JournAl oF tHe PolisH Police HeADquArters 2017/64, PAWelec 2011).
The driver who has hit the animal is obliged, if it is possible and safe for him, to provide the injured creature with appropriate assistance, or to notify one of the public emergency services which, within the scope of their tasks, have to take action. The Polish legislation indicates a wide catalog of these entities, including: veterinary surgeons, members of the Polish Hunting Association, members of social organizations protecting animals, police officers, railway security guards, municipal guards, border guards,

Review of Procedures Concerning Animals Involved in Traffic Accidents... 507
foresters, National Park’s inspectors, State hunting guards, hunting guards, and state fishery guards (PolisH JournAl oF lAWs 2017/1840).
There is no doubt that the police is the authority notified in the most of cases. The tasks of a police officer include securing a place in order to avoid another dangerous events, as well as carrying out the necessary pro-cedural steps consisting in protecting forensic traces against their loss, destruction or distortion (PAWelec 2011, witkowska 2013). Activities related to visual inspection include the vehicles involved. It is particularly important in a situation in of an event which caused injuries or death not only to animals, but also to persons (drivers or passengers) or even to a death of a person. Such a situation is called a road accident, which from the point of view of Polish Criminal Code is a crime.
According to the art. 177 of the Polish Criminal Code (PolisH Jour-naL oF Laws 2017/2204), the criminal liability shall be borne by the per-son who, by a violation of safety rules in traffic, causes an accident, in which another person suffered injuries or health disorder lasting over 7 days. Criminal liability in this case occurs even when the violation of traffic-safety rules was unintentional. The perpetrator of the accident shall be liable to imprisonment of up to 3 years, and if a death or serious injury of a person occurred as a result of the event – imprisonment for a period of time from 6 months to 8 years.
Detailed inspection and determination of the cause of the accident, and the mode of participation of an animal in such an event is therefore crucial. It should be treated from the point of view of further activities, related to conducting of criminal. It also determines the scope of possible criminal responsibility.
It should be noted that – depending on: the impact force, the vehicle’s speed and weight, as well as on animal’s weight – the result may be a wounding the animal, which still would be able to escape. Without proper inspection and traces’ protection, neither determining the cause of the accident, nor identifying the animal (eg. reading data from a microchip in relation to dogs, ferrets or cats) would be possible.
The duties of a police officer at the place of an event involving animals include calling other rescue and technical services, whose task is to help the injured people and animals, and to clean up the road (oFFiciAl Jour-nAl oF tHe PolisH Police HeADquArters 2017/64).
Provisions of the Road Traffic Act (PolisH JournAl oF lAWs 2017/1260, 1926 and 2018/79, 106, 138, 317) provide an obligation for a police officer to inform an entity responsible for keeping the road, in order to remove an obstacle. Duties related to maintaining order on the road belong to the road administrator. This applies not only to situations in which an event

Justyna Karaźniewicz et al.508
results in the animal’s death, but also those resulting in the animal’s injury, in which this creature is still being on the road or within the lane, due to its injuries (PolisH JournAl oF lAWs 2017/2222). In such a situation, it is necessary to ensure that the cadaver is removed from the road, or that the injured animal is transported to provide the veterinary assistance.
Health state of an animal
In order to determine next procedural stages dealing with the animal--related incidents, the condition of the animal is crucial. In case of a woun-ded animal, it is necessary to decide whether its treatment is possible, or if an euthanasia is necessary (DAvies 1989, KiełBoWicz 2004, locKWooD 2000, ziMMerMan 1986). The necessity of the immediate euthanasia means an objective fact that the animal can continue to live only suffering and enduring pain, in adverse prognosis. Moral responsibility is then to shorten the suffering of the animal (PolisH JournAl oF lAWs 2017/1840). Such a condition should be ascertained, if possible, by a veterinary surgeon. When the situation on the road enforces a quick action, in order to end the animal’s pain, the necessity of euthanasia may be also stated by other entities, including: members of the Polish Hunting Association, members of social organizations protecting animals, police officers, railway security guards, municipal guards, border guards, foresters, National Park’s inspec-tors, State hunting guards, hunting guards, and state fishery guards.
The fact which of the authorized entities shall make such a decision is dependent on various factors, including: the animal’s health state and its behavior (eg. aggression that poses a direct threat to human life or health and safety on the road). Regardless of the acting organ, the euthanasia shall be done in a proper way, involving minimum physical and mental suffering. This is done by an anesthetic application (by a veterinary sur-geon) or by shooting an animal (by a person authorized to use a firearm – in most cases a police officer) (Benetato et al. 2011, DAvies 1989, elWooD 2011, ForBes 2004, locKWooD 2000, neWBery and Munro 2011, PoLisH JournAl oF lAWs 2017 / 1840, ziMMerMan 1986).
If there is no need to immediate decision on animal’s life (by shooting), the veterinary surgeon is summoned. After an inspection of the wounded animal, he decides whether to proceed the treatment, or to withdraw from the treatment and conduct the euthanasia (Benetato et al. 2011, DAvies 1989, neWBery and Munro 2011).
In Poland, the municipalities have a legal obligation to develop, accept and implement a Homeless-Animal Care Program and prevent the home-
Review of Procedures Concerning Animals Involved in Traffic Accidents... 509
lessness of animals in their area. This applies also to animals injured in road accidents (PAWelec 2011). As a part of the implementation of the tasks resulting from the Program, the commune is obliged to provide 24-hour veterinary care (in case of road accidents involving animals and other situations involving the public need of a veterinary treatment). In the contract concluded with the veterinarian, the procedures for dealing with the event of a road accident in which the animal was injured are con-cretized.
Being notified on the need to travel to a traffic accident, the veterina-rian shall immediately proceed to the place of the accident. He is obliged to diagnose, supply the animal and – if the legitimacy of its treatment is recognized – to transport it to an ambulatory or a clinic to carry out the necessary health and life-saving procedures (oFFiciAl JournAl oF tHe PolisH Police HeADquArters 2017/64).
However, with regard to the treatment of wild animals, it is often necessary to transport them to a specialized wild animal rehabilitation center, where treatment and rehabilitation of free-living creatures are conducted, in order to restore them to the natural environment (PoLisH JournAl oF lAWs 2018/142). Such health centers are created and mainta-ined on the basis of the permission of the General Director for the Protec-tion of Environment. This permission defines, among others, a list of ani-mal species that can be treated and rehabilitated in the mentioned center.
Cleaning the road
If an animal died as a result of a road accident (directly or as a result of a wounded animal’s euthanasia), it is necessary to remove a cadaver from the road. From the legal point of view, one is dealing with corpses of animals – this term is defined as dead animals or killed for purposes other than human consumption (PolisH JournAl oF lAWs 2017/1855). The administrator of the road is responsible for handling the animal’s cadavers. The Public Roads Act (PolisH JournAl oF lAWs 2017/2222) sta-tes that the manager of national roads is the General Director of National Roads and Motorways; provincial – voivodship’s board; powiat – powiat’s management; municipalities – commune head (wójt, mayor, or city-mayor). These entities have the obligation to lead the lane to the state of safety for its users, and in which the road order is ensured. Detailed regulations regarding the tasks of the voivodship, powiat, commune or General Directorate of National Roads and Motorways specify the respon-sibilities of managers in this regard.

Justyna Karaźniewicz et al.510
Duties related to the removal of the effects of a road incident involving an animal are within the scope of the own tasks of the municipalities. They include, i.a., matters of maintaining cleanliness and order (PoLisH JournAl oF lAWs 2017/1875). The commune is therefore obliged to ensure cleanliness and order in its area, and to create conditions necessary for their maintenance. The catalog of tasks of the commune includes the need to ensure the collection, transport and disposal of animal corpses (of home-less and wild animals) and their parts, as well as co-operation with the companies operating in this field (PolisH JournAl oF lAWs 2017/1289).
Due to the fact that depending on the road category, there are various entities responsible for performance of these tasks, it is possible to conc-lude agreements between managers of particular types of roads. For prac-tical reasons, the management of public roads can be transferred between the administrators, indicating in the agreement the scope of such entrust-ment and rules for making mutual financial settlements.
The road’s administrator is obliged to ensure that the animal corpse is transported to appropriate installations and devices intended for its dispo-sal. Entrepreneurs planning to conduct activities of this kind are required to apply for a permit to the competent authority (in the case of municipa-lities – to the wójt, mayor or city-mayor, in the case of a powiat – to the starosta, and in the case of the voivodship – to the voivodship’s marshal).
Procedures for handling the bio-hazard waste, such as animal corpse, are specified in the Regulation No. 1069/2009 (oFFiciAl JournAl oF tHe eu 2009/300.1). In practice, the activity of cadavar collecting transporting and disposing of them is carried out by the existing network of private enterprises and business establishments. Road managers conclude relevant agreements under which they entrust to such enterprises tasks related to the removal of animal corpse bodies and its disposal by incine-ration.
Veterinary forensic medicine court experts
There is a need to detect the causes of a traffic accident in a detailed way, namely its course, consequences and the role of its individual partici-pants, including animals. This is crucial when making a proper legal quali-fication of an event (collision, traffic accident) and defining the basis and scope of liability, not only punitive, but also in the form of compensation.
Making such arrangements by bodies conducting criminal proceedings requires special knowledge – above average, based on the scientific fin-dings. Therefore, it is often necessary to appoint an expert, not only experts

Review of Procedures Concerning Animals Involved in Traffic Accidents... 511
for reconstruction of an accident, or vehicle-technique experts, but also veterinary medicine experts (Harris 1998, Listos et al. 2016, szarek 2005).
The reasons for appointment of an expert are set out in the art. 193 of the Polish Criminal Procedure Code (PolisH JournAl oF lAWs 2017/1904, 2405 and 2018/5, 106, 138, 201), which indicates that the trial body is obli-ged to consult an expert in any situation where it requires special know-ledge. This expert should help in stating the circumstances relevant to the resolution of the case. Special information include such factual or practical knowledge that goes beyond an average skills or knowledge. Therefore, it is not the knowledge available to any adult person with appropriate life expe-rience and education (gaBerLe 2010, szarek and PrzeźDziecKA 2000).
An expert appointment enforces by a decision (issued by the body con-ducting the proceedings) on admitting an evidence from an expert opinion. It may indicate either an individual expert, or a scientific institute, or a specialist institution (employing proficient specialists). The facilitation for the trial body is the running of judicial expert lists by the regional courts. This list is divided according to particular branches of science, and include data on the specialization of specific experts.
However, it is not only a permanent court expert who is required to be an expert witness, but also any person who has adequate special know-ledge and will be appointed in such a capacity by a procedural body (so-cal-led ad hoc expert).
In relation to veterinary experts, who assess road accidents involving animals, the procedural bodies appoint mostly permanent court experts. In the decision on the admission of evidence from an expert opinion, the authority indicates, i.a., the subject matter and scope of expertise. If neces-sary, it also issues specific questions and the date of delivery of the opinion and its form (written or oral). An expert is made available to access the case’s files.
The expert’s basic duty is to prepare an opinion in the scope, time and form determined by the legal authority. He is obliged to perform his duties with all diligence and impartiality. A properly prepared opinion, meeting all the procedural requirements of the evidence, should be full (exhaustive scope indicated by the authority), clear and internally consistent. Experts can be confronted if they have submitted various opinions in criminal pro-ceedings, which are contradictory in essential elements – in order to cla-rify these contradictions.
The evidential importance of an expert opinion in criminal proceeding is evidenced by the fact that submitting a false opinion is a crime, punisha-ble by imprisonment from one to 10 years.

Justyna Karaźniewicz et al.512
Veterinary forensic research
For comprehensive examinations, whole animal corpses or their frag-ments are delivered, such as: head, limbs, ribs, spine sections or fragments of muscles without bone elements. It is relevant in scope of the decision on the expert’s opinion, to determine the species of the animal and the cause and time of death (HArris 1998, lynn et al. 1994, ottinger et al. 2012, Porter 1971, Proctor 2009). This is the data of key importance. It is also important to show whether, based on the attached materials as well as the materials obtained from the post-mortem section, it can be determined whether the death occurred in a dependent manner or independent of human activity (ottinger et al. 2012, szarek 2005).
To provide assistance and relevant knowledge, it is generally neces-sary to appoint a team of experts from various fields of forensic sciences (Benetato et al. 2011, Harris 1998, szarek 2005). Their task will be to perform external examinations of the evidence, necropsy and laboratory tests. It should be emphasized that the necropsy is supplemented with X-ray and CT scans (BuszeWicz and DyleWsKA 2016, listos et al. 2016,). In turn, as part of laboratory tests, identification and histopathological examinations are performer (Listos et al. 2016, Mceven 2012).
Animal corpse necropsy
The purpose of inspecting the evidence is to determine: the species, breed, sex, color, as well as the age of the individual (Listos 2016, loc-KWooD 2000, szarek 2005). Specific signs are indiced. In this process, eg., haematomae or ecchymoses in skin and subcutaneous tissue, blood and clots in the nasal cavity, fractures within the teeth, craniofacial bones, limbs and ribs can be found. An important role in determining the causes of death is radiological examination of X-ray or CT. After an external exa-mination, the corpse is opened. It is required to open at least three major body cavities, i.e. skull, abdominal cavity and chest. In the case of animals suffering from traffic accidents, special techniques are used to examine soft tissues and bones of the spine and limbs. After that, internal organs are to be examined. A characteristic image of the changes accompanying a strong injury are, among others: haematomae, bloody infiltration of tissues (mainly skin, subcutaneous tissue and muscles), and bone frac-tures. If internal examination did not allow to determine the cause of death, additional tests, eg., histopathological examinations are to be carried out (ottinger et al. 2012, BankroFt and gaMBLe 2008).

Review of Procedures Concerning Animals Involved in Traffic Accidents... 513
Determination of animal species
Specification in the case of delivery of a complete animal corpse for examination is not a problem. Species identification is carried out on the basis of morphological characteristics such as external appearance and characteristic construction features (Listos et al. 2016, Porter 1971, sza-rek and PrzeźDziecKA 2000). Identification of a wild boar (Sus scrofa) is possible on the basis of bristles covering both the head and distal parts of limbs. In addition, wild boars have black cloven hoofs, while in domestic pigs they are white (MAyer 2009). In the case of animal corpse fragments examination, the determination of the species is based primarily on anato-mical structure differences and the appearance of bones, e.g., in the hume-rus of wild boars there is the supratrochlear foramen (MAyer 2009).
If the macroscopic examination is impossible, laboratory testing is necessary. The first group of tests consists of immunoassays based on the specific reaction of species-specific antigens with appropriate antibodies, eg., in precipitation. A serum directed against a protein of a particular species causes a reaction that results in a precipitate of the antigen-anti-body complex. The precipitation reaction is conducted in an agar gel (Marek et al. 1964). The disadvantage of this method is the possibility of cross-reactivity or positive reaction of antibodies against antigens from closely related species, eg., wild boars and pigs.
In turn, the ELISA (enzyme-linked immunosorbent assay) enables the protein detection in the biological material using species-specific polyclonal or monoclonal antibodies conjugated with a suitable enzyme (lequin 2005).
For an identification of animal species also molecular techniques are used. RAPD (random amplification of polymorphic DNA), AFLP (amplified fragment-length polymorphism), and RFLP (restriction fragment-length polymorphism) (lynn et al. 1994) are rarely used, due to their low repro-ducibility and interpretation problems.
The development of molecular biology has created new possibilities in terms of both species and individual identification. Used is the fragment of the gene coding the first subunit of cytochrome oxidase (COI, coxI) of 648 bp in the genome of the mitochondrial genome (DNA barcoding) (tava-res and Baker 2008). This fragment is sufficiently short for sequencing, while it is characterized by low intraspecies variability and a large inter-species variation (yAng et al. 2014). The received and processed data is placed in a special open-access BOLD database (www.boldsystems.org) (ratnasingHaM and HeBert 2007). It is confirmed that 98% of currently classified speciei can be distinguished using this method (Beng et al. 2016).

Justyna Karaźniewicz et al.514
Conclusions
The road incidents involving animals does often cause serious con-sequences like emergence of danger on the road, significant material damage to the vehicle, and above all – emergence of the life or health of the driver and other road users (eg. passengers, by-passers). It is also dange-rous to animals.
The procedures for dealing with animals involved in road traffic accidents are presented in the present work. They regard both to the human management of injured animals, and the comprehensive assistance of veterinary surgeons as experts in establishing the factual state of an event. The legal provisions, that are constantly evolving, help in this respect, taking into account the wider and more effective protection of ani-mals against suffering inflicted by men.Translated by Andrzej Dzikowski
Accepted for print 10.05.2018
ReferencesBAncroFt J.D., gAMBle M. 2008. Theory and practice of histological techniques. Philadelphia,
Churchill Livingstone, Elsevier.BenetAto M.A., reisMAn r., MccoBB e. 2011. The veterinarian’s role in animal cruelty cases.
J. Am. Vet. Med. Assoc., 238: 31–34.Beng K., toMlinson K., sHen x., surget-groB y., HugHes A., corlett r., sliK J. 2016.
The utility of DNA metabarcoding for studying the response of arthropod diversity and compo-sition to land-use change in the tropics. Sci. Rep., 6: 24965.
BuszeWicz g., DyleWsKA M. 2016. Radiological and forensic veterinary analysis of gunshot cases in eastern Poland. Med. Weter., 72: 453–457.
DAvies e. 1989. The veterinary surgeon as a law enforcement officer. Vet. Rec., 124: 101–102.elWooD r.W. 2011. Pain and suffering in invertebrates? ILAR Journal, 52(2): 175–184.FelsMAnn M.z., szAreK J., FelsMAnn M., BABińsKA i. 2012. Factors affecting temporary cavity
generation during gunshot wound formation in animals: new aspects in the light of flow me-chanics; a review. Vet. Med.-Czech, 57: 569–574.
ForBes n. 2004. An exacting science: the veterinary surgeon as expert witness. In Practice, 26: 503–506.
gaBerLe a. 2010. Dowody w sądowym procesie karnym. Teoria i praktyka. Oficyna, Warszawa. HArris J.M. 1998. The role of the practicing veterinarian as an expert witness. Seminars in Avian
and Exotic Pet Medicine, 7: 176–181.KiełBoWicz z. 2004. Pomoc doraźna i leczenie pourazowych keratopatii u małych zwierząt.
Magazyn Weterynaryjny, 13(87): 29–31.lequin r. 2005. Enzyme Immunoassay (EIA)/Enzyme-Linked Immunosorbent Assay (ELISA).
Clin. Chem., 51: 2415–2418.listos P., gryzińsKA M., KoWAlczyK M. 2015. Analysis of cases of forensic veterinary opinions
produced in a research and teaching unit. J. Forensic Leg. Med., 36: 84–89.listos P., gryzińsKA M., KoWAlczyK M. 2016. Badanie pośmiertne w aspekcie weterynarii sądo-
wej. Życie Wet., 91: 106–109.

Review of Procedures Concerning Animals Involved in Traffic Accidents... 515
listos P., KoMstA r., łoPuszyńsKi W., gryzińsKA M., teresińsKi g., cHAgoWsKi W., Busze-Wicz g., DyleWsKA M. 2016. Radiological and forensic veterinary analysis of gunshot cases in eastern Poland. Med. Weter., 72, 453–457.
locKWooD r. 2000. Animal cruelty and human violence: the veterinarian’s role in making the connection – the American experience. Can. Vet. J., 41: 876–878.
lynn r., AlForD c., cAsKey t. 1994. DNA analysis in forensics, disease and animal/plant iden-tification. Curr. Op. Biotechn., 5(1): 29–33.
MAreK z., JAegerMAnn K., turoWsKA B. 1964. Determination of the species’s protein content by means of precipitation in an electric field in an agar gel (electroimmunoprecipitation). Folia Med. Cracov., 6: 83–91.
MAyer J. 2009. Biology of wild pigs: wild pig physical characteristics. In: Wild pigs: biology, damage, control techniques and management. Eds. J.J. MAyer, i.l. BrisBin. Savannah River National Laboratory, Aiken, USA, pp. 31–50.
Mceven B.J. 2012. Trends in domestic animal medico-legal pathology cases submitted to a veteri-nary diagnostic laboratory 1998–2010. J. Forensic Sci., 57: 1231–1233.
neWBery s., Munro r. 2011. Forensic veterinary medicine: 1. Investigation involving live ani-mals. In Practice, 33: 220–227.
oFFiciAl JournAl oF tHe eu 2009/300.1. Regulation (EC) No. 1069/2009 of the European Par-liament and of the Council of October 21st, 2009 laying down health rules as regards animal by-products and derived products not intended for human consumption and repealing Regula-tion (EC) No 1774 / 2002 (Animal by-products Regulation).
oFFiciAl JournAl oF tHe PolisH Police HeADquArters 2017/64. Regulation No. 30 of the Poli-ce Commander-in-Chief of September 22nd, 2017, on the Road Duties.
ottinger t., gAvier-WiDen D., segerstAD c.H., rasMusson B. 2012. Development of veterinary forensic pathology from crime scene to court. J. Comp. Pathol., 146: 61.
PAWelec K.J. 2011. Dowody w sprawach przestępstw i wykroczeń drogowych. LexisNexis, War-szawa.
PolisH JournAl oF lAWs 2017/1260, 1926 and 2018/79, 106, 138, 317. Act of June 20th, 1997 on the Road Traffic.
PolisH JournAl oF lAWs 2017/1289. Act of September 13rd, 1996 on the Maintaining of Cleanli-ness and Order in Municipalities.
PolisH JournAl oF lAWs 2017/1840. Act of August 21st, 1997 on the Protection of Animals.PolisH JournAl oF lAWs 2017/1855. Act of March 11th, 2004 on the Protection of Animal Health
and Animal Infectious Diseases Combat.PolisH JournAl oF lAWs 2017/1875. Act of March 8th, 1990 on Municipial Self-Government. PolisH JournAl oF lAWs 2017/1904, 2405 and 2018/5, 106, 138, 201. Act of June 6th, 1997.
The Criminal Procedure Code.PolisH JournAl oF lAWs 2017/2204. Act of June 6th, 1997, The Criminal Code.PolisH JournAl oF lAWs 2017/2222. Act of March 21st, 1985 on the Public Roads.PolisH JournAl oF lAWs 2018/142. Act of April 16th, 2004 on the Environmental Protection. Porter a.r.w. 1971. The veterinary surgeon as a witness. Vet. Rec., 89: 505–509.Proctor K.W., KelcH W.J., neW J.c. Jr. 2009. Estimating the time of death in domestic canines.
J. Forensic Sci., 54: 1433–1437.ratnasingHaM s., HeBert P. 2007. BOLD: the barcode of life data system. Mol. Ecol. Not.,
7: 355–367. szAreK J. 2005 Lekarz weterynarii jako biegły. Wydawnictwo Uniwersytetu Warmińsko-Mazur-
skiego, Olsztyn, Poland.szAreK J., PrzeźDziecKA D. 2000. Lekarz weterynarii jako biegły sądowy. Magazyn Weteryna-
ryjny, 9: 50–51.tavares e., Baker a. 2008. Single mitochondrial gene barcodes reliably identify sister-species
in diverse clades of birds. BMC Evol. Biol., 8(1): 1.witkowska k. 2013. Oględziny. Aspekty procesowe i kryminalistyczne. Wolters Kluwer, War-
szawa.

Justyna Karaźniewicz et al.516
ziMMerMan M. 1986. Physiological mechanisms of pain and its treatment. Klinische Anaesthesi-ol. Intensivether., 32: 1–19.
yAng l., tAn z., WAng D., xue l., guAn M., HuAng t., li r. 2014. Species identification through mitochondrial rRNA genetic analysis. Sci. Rep., 4: 4089.
Related Documents