PKO BP & WSE Polish Capital Day London, 9‐10 th April 2013 Mr. Bartłomiej Drywa, IR Director

Welcome message from author
This document is posted to help you gain knowledge. Please leave a comment to let me know what you think about it! Share it to your friends and learn new things together.
Transcript

PKO BP & WSE
Polish Capital DayLondon, 9‐10th April 2013
Mr. Bartłomiej Drywa, IR Director

Safe Harbour Statement
This presentation includes 'forward‐looking statements' All statements other than statements of historical factsThis presentation includes forward looking statements . All statements other than statements of historical factsincluded in this presentation, including, without limitation, those regarding our financial position, businessstrategy, plans and objectives of management for future operations (including development plans and objectivesrelating to our products and services) are forward‐looking statements. Such forward‐looking statements involveknown and unknown risks, uncertainties and other important factors that could cause the actual results,performance or achievements to be materially different from future results, performance or achievementsexpressed or implied by such forward‐looking statements. Such forward‐looking statements are basedon numerous assumptions regarding our present and future business strategies and the environment in whichon numerous assumptions regarding our present and future business strategies and the environment in whichwe will operate in the future. These forward‐looking statements speak only as at the date of this presentation.We expressly disclaim any obligation or undertaking to disseminate any updates or revisions to any forward‐looking statements contained herein to reflect any change in our expectations with regard thereto or any changeg y g p g y gin events, conditions or circumstances on which any such statement is based. We caution you that forward‐looking statements are not guarantees of future performance and that our actual financial position, businessstrategy, plans and objectives of management for future operations may differ materially from those made in orsuggested by the forward‐looking statements contained in this presentation. In addition, even if our financialposition, business strategy, plans and objectives of management for future operations are consistent with theforward‐looking statements contained in this presentation, those results or developments may notbe indicative of results or developments in future periods We do not undertake any obligation to review or tobe indicative of results or developments in future periods. We do not undertake any obligation to review or toconfirm or to release publicly any revisions to any forward‐looking statements to reflect events that occur orcircumstances that arise after the date of this presentation.

Th L di M di G1 The Leading Media Group in Polandin Poland

Leading Polish multimedia platform
Largest pay‐TV operator Leading broadcaster
3.6 mlillion subscribers 20 channels under Polsat brand
Fastest growing LTE providerLeading online video platform
up to 150 Mb/s
4
50% coverage of Polish population2.3 mlillion real users

Constantly growing its business
Pay‐TV subscribers ARPU Audience share
million subscribers EoY PLN
y
% share (all 16‐49, all day)
3.443.57
+0.8 m +11% maintained
20.3%19.3%
20.5%
35.3 35.9
39.3
2.73
2008 2010 2012 2008 2010 20122008 2010 2012
5
Note: (1) “ARPU” relates to average net revenue per subscriber to whom we rendered services calculated as a sum of net revenue generated by our subscribers from our pay digital television services in the reporting period divided by the average number of subscribers to whom we rendered services in this reporting period.
(2) In line with the provisions of IAS 18, starting from the year 2012 the Group recognizes lower revenues from penalties for breaching contracts by the clients due to change of accounting estimates regarding recognition and recoverability of these revenues. This change of estimates does not materially influence the Group’s operating results. It causes, however, a slight decrease in ARPU, though not perturbing its stable upward trend.

Strong and resilient business profile
Revenues EBITDA Operating cash flow
bn PLN bn PLN m PLN
p g
tripled 2.5x+PLN 1.7bn
2.8 1.0 781
1.5
1.10.3
0.4 316
0.2
2008 2010 2012 2008 2010 2012 2008 2010 2012(1) (1) (1)
6Note: (1) Financial results for 2012 include results of TV Polsat Group which were consolidated in 2011 since 20 April 2011 Source: Consolidated financial statements for year ended 31 December 2018, 2010, 2012 and internal analysis

2 Group Strategy

Our vision
We create and provide the most attractive content
… using the best and latest technologies to deliver high quality multi‐play services with most attractive content…. q y p ythe highest levels of customer satisfaction
Strengthening our leadership in entertainment in PolandStrengthening our leadership in entertainment in Poland.
8

Our strategic goals
Building value of our customer base
Building channels value
Eff ti l i tEffectively managing costs
9

Headroom for growth
Thanks to complete portfolio of our products (pay TV, Internet, telephony,
)
The addressable market
Today The future14.5
12.5
online video, online music) we can target a bigger addressable market and respond to the requirements of our
9
customers in the future
illion)
11
3.5 2.9
(m
2.9
H h ld i P TV U f H h ld H h ld L ARPUHouseholds in Poland
Pay‐TV Users of connected mobile devices
Households with 2 or
more TV sets
Households without pay‐
TV
Low ARPU segment
1
2
10Source: Operators reports, GUS, PIKE, IDC, UKE, Report „Diagnoza Społeczna 2011”, Company’s estimatesNote: (1) Users of connected mobile devices defined as number of users of smartphones, tablets and laptops
(2) Low ARPU segment ‐ below PLN 20
The multi‐play potential
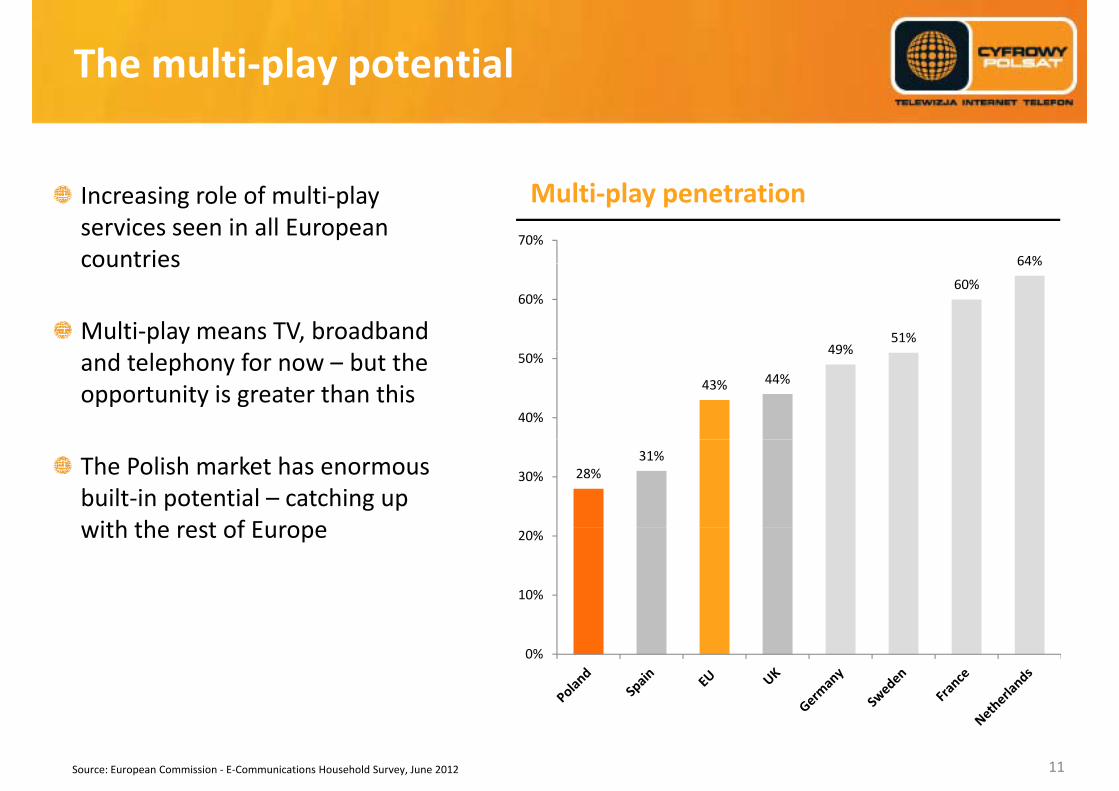
Increasing role of multi‐play services seen in all European countries
Multi‐play penetration
64%70%
countries
Multi‐play means TV, broadband 49%
51%
60%
64%
60%
and telephony for now – but the opportunity is greater than this 43% 44%
49%
40%
50%
The Polish market has enormous built‐in potential – catching up with the rest of Europe
28%31%
30%
with the rest of Europe
10%
20%
0%
Source: European Commission ‐ E‐Communications Household Survey, June 2012 11

Maximising loyalty
Ensuring customer satisfaction with― An attractive product mix
Maintaining best‐in‐class churn
14‐15%16% (3)
An attractive product mix― Excellent customer care
Implementing effective retention12%
14%
Implementing effective retention programs
8.6%(1)
10.2%(2)
8%
10%
Increasing numbers of multi‐play customers 6%
8%
2%
4%
0%cp sky c+n
Note: (1) Cyfrowy Polsat, 2012 (2) BSkyB, Annual Review 2012, refers to total average customers (RGU) (3) Press interviews of CEO of nc+, March 2013
12
Improving ARPU
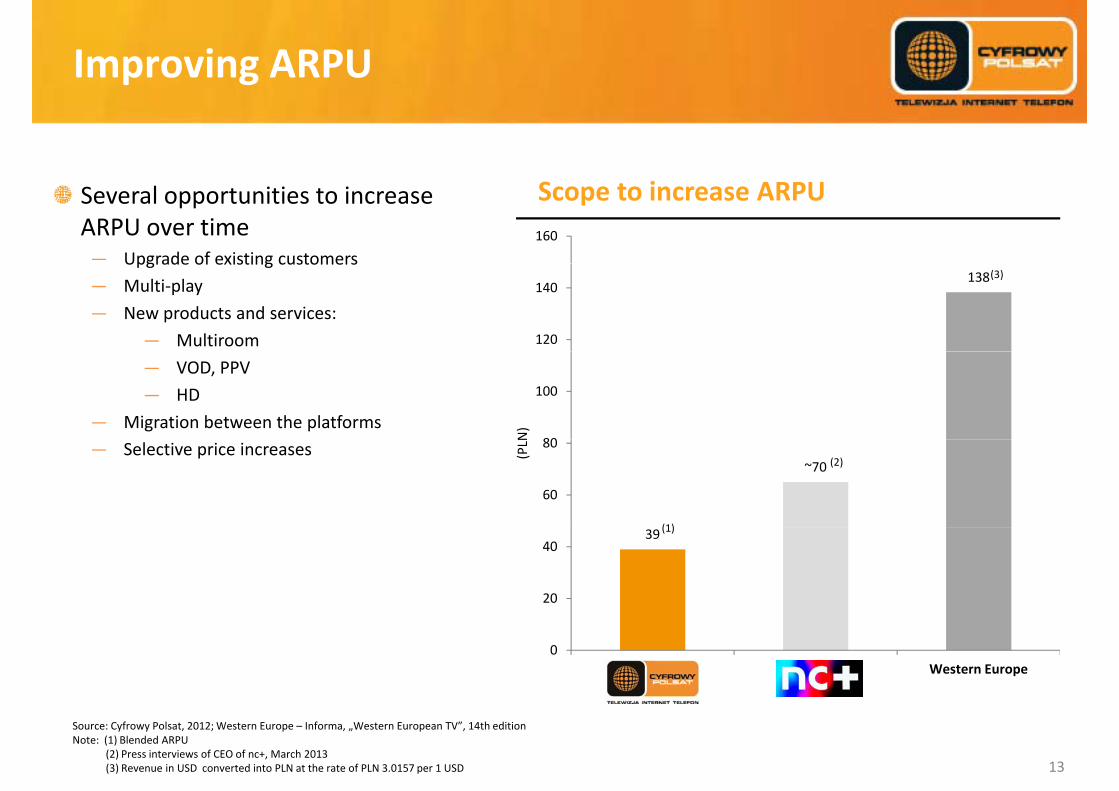
Several opportunities to increase ARPU over time― Upgrade of existing customers
Scope to increase ARPU 160
Upgrade of existing customers― Multi‐play― New products and services:
― Multiroom
138
120
140(3)
― VOD, PPV― HD
― Migration between the platforms80
100
N)
― Selective price increases~70
60
80
(PLN
(1)
(2)
39
20
40(1)
0Cyfrowy Polsat Poland Western Europe
Source: Cyfrowy Polsat, 2012;Western Europe – Informa, „Western European TV”, 14th editionNote: (1) Blended ARPU
(2) Press interviews of CEO of nc+, March 2013(3) Revenue in USD converted into PLN at the rate of PLN 3.0157 per 1 USD 13

Maintaining audience share
Stable audience share supported by growing portfolio of thematic channels
Leading audience share 25%
channels
Maintaining share through 20%
― Distribution in all important market segments: DTT and pay TV
― Effective investments in programming
16 5% 15 7%
15%
ce share
18.5% 17.4% 16.0%
16.5% 15.7%
10%% aud
ienc
4 4% 4.8%
5%
1.9% 2.6% 3.2%4.4% 4.8%
0%2008 2009 2010 2011 2012
Polsat ‐ thematic channels Polsat ‐main channel
Source: Nielsen Audience Measurement, all 16‐49, all day, 2008 – 20112 14

Maximizing the growth potential
Attractive portfolio of the channels, with a strong reach across the marketacross the market
Our policy is to perform at least in line with the advertising market
Re‐run channelWomens’ lifestyle
channel Movie channelSports channel News channel
in line with the advertising market
Improving profile of the viewer
Kids’ channelBusiness channelMovie channel
HDFood channelSports channel
HD
constantly builds the growing value of our channels
Sports news channel
General entertainmentcommercial channelPremium sports
channel History channel
Mens’ lifestyle channel
Crime & investigation channel
Premium sports channel HD Nature channel Mens’ channel
15

Effectively managing costs
– Leveraging the large scale of our content deals
– Control over local content productionProgramming
Control over local content production
– Satellite transpondersp
– In‐house IT solutions
– STB’s production
Technology
– Centralization of financial functions within the combined group
– Cash poolingFinance– Natural hedging
– Ongoing optimizing of the group structures and procedureBack‐office
16

3 Financial review

Very good financial results of the Group
in PLN m 2012(1) YoY change
Revenue 2,783 17%The increase in revenue and EBITDA mainly due to the consolidation of TV
l d h h f
Costs(2) 1,751 6%
Polsat Group and the organic growth of the retail business segment
Strong EBITDA margin due to the
EBITDA(3) 1,032 40%
Strong EBITDA margin due to the effective cost policy and realized synergy effects
EBITDA margin 37.2% 6.1pp The net profit under the impact of the finance costs related to financing of the acquisition of TV Polsat and the positive
Net profit 598 >100%q p
effect of the valuation of Senior Notes denominated in EUR
18
Source: Consolidated financial statements for year ended 31 December 2012 and internal analysis Note: (1) Financial results for 2012 include results of TV Polsat Group which were consolidated in 2011 since 20 April 2011
(2) Costs do not include depreciation, amortization and impairment (3) EBITDA includes one‐off related to lower costs resulting from the agreement between TV Polsat and OZZPA (collective copyright management organizations) of PLN 25.4 million

Results of the Retail business segment(1)
in PLN m 2012 YoY change
The growth in revenue from retail sales thanks to the steadily increasing ARPU
Revenue 1,808 9%t a s to t e stead y c eas g Uand higher revenue from telecommunication services Costs (2) 1,176 0%
Costs under control despite the negative impact of foreign exchange rates YoYEBITDA 632 31%
Significant impact of dividend from TV Polsat on the net profit and lower costsof financing resulting from theprepayment of the Senior Facility Loan
EBITDA margin 35.0% 5.7pp
prepayment of the Senior Facility LoanNet profit 592 >100%
19
Source: Consolidated financial statements for year ended 31 December 2012 and internal analysisNote: (1) Consolidation of this segment includes: Cyfrowy Polsat S.A., Cyfrowy Polsat Trade Marks, Cyfrowy Polsat Finance, INFO‐TV‐FM (from 30 January 2012),
the companies running ipla service (from 2 April2012) (2) Costs do not include depreciation, amortization and impairment
Results of the Broadcasting andtelevision production segment(1)television production segment(1)
in PLN m 2012 YoY change
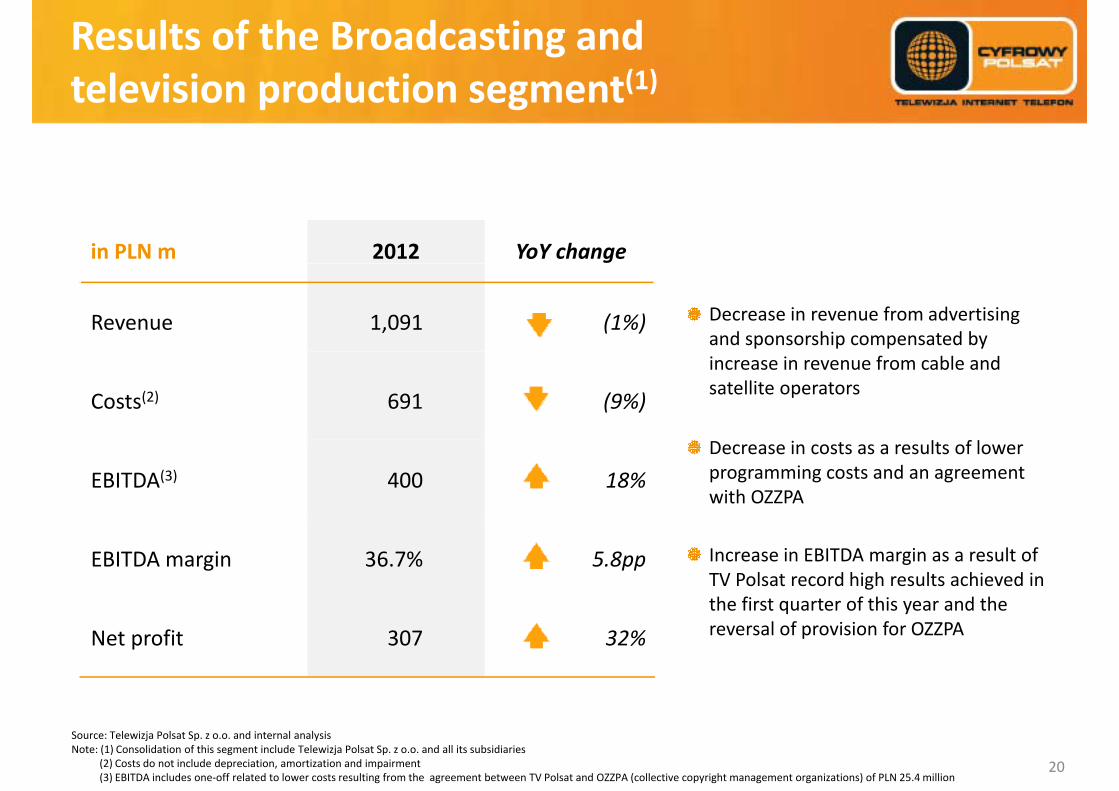
Decrease in revenue from advertising and sponsorship compensated by
Revenue 1,091 (1%)
increase in revenue from cable andsatellite operators
Costs(2) 691 (9%)
Decrease in costs as a results of lower programming costs and an agreement with OZZPA
EBITDA(3) 400 18%
Increase in EBITDA margin as a result of TV Polsat record high results achieved in the first quarter of this year and the
EBITDA margin 36.7% 5.8pp
reversal of provision for OZZPA Net profit 307 32%
20
Source: Telewizja Polsat Sp. z o.o. and internal analysisNote: (1) Consolidation of this segment include Telewizja Polsat Sp. z o.o. and all its subsidiaries
(2) Costs do not include depreciation, amortization and impairment(3) EBITDA includes one‐off related to lower costs resulting from the agreement between TV Polsat and OZZPA (collective copyright management organizations) of PLN 25.4 million

Cash flow
Net cash flow, cash position and debt – 2012
1 200
781
‐453
600
900
(PLN
m)
‐200
‐91‐46 1300
278 270
0Cash flow from
operating Repayment of loans and
Repayment of interest (incl.
CAPEX Acquisition of subsidiary, net of
Other flows(1)Cash and cash equivalents at
Cash and cash equivalents at
activities borrowings (principal
repayments)
from Cash pool) cash acquired the beginning of the period
the end of the period
21Source: Consolidated financial statements for year ended 31 December 2012 and internal analysisNote: (1) Excluding expenditures on set‐top‐boxes and modems leased to subscribers
Financial indebtedness
in PLN m Dec. 31, 2012 Maturity
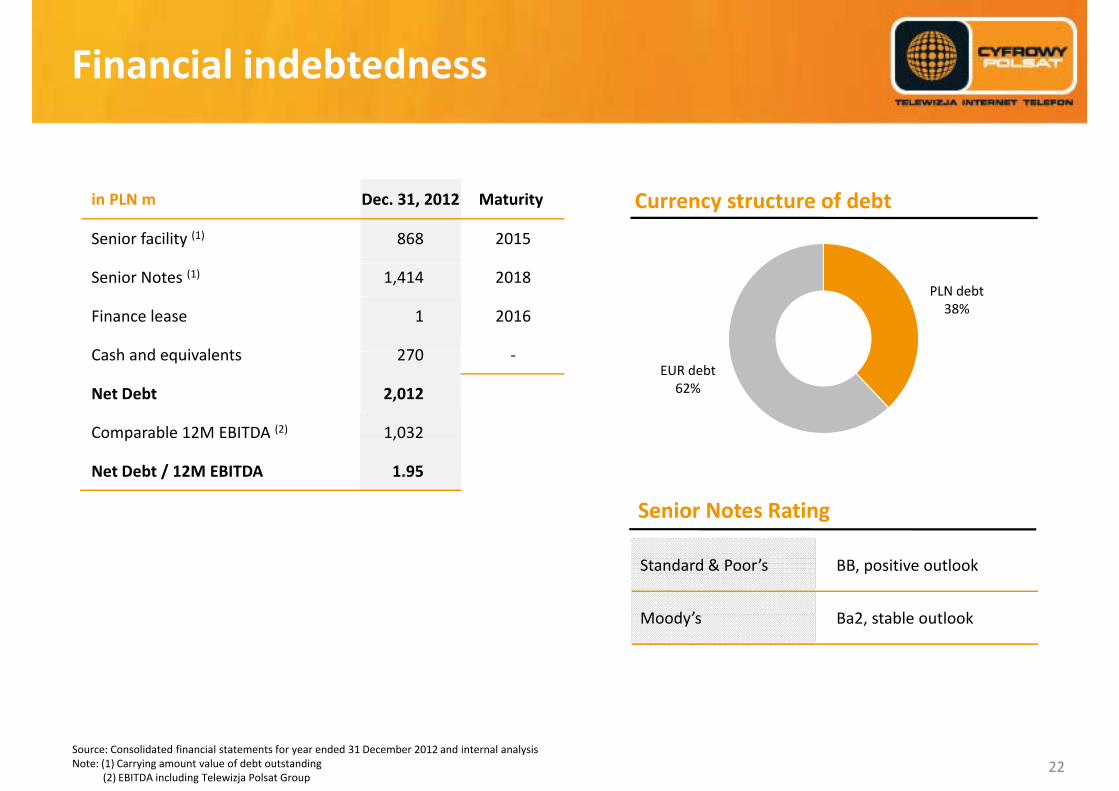
Senior facility (1) 868 2015
Currency structure of debt
PLN debt38%
Senior Notes (1) 1,414 2018
Finance lease 1 2016
C h d i l t 270EUR debt
62%
Cash and equivalents 270 ‐
Net Debt 2,012
Comparable 12M EBITDA (2) 1,032p ,
Net Debt / 12M EBITDA 1.95
Senior Notes Rating
Standard & Poor’s BB, positive outlook
M d ’ B 2 t bl tl kMoody’s Ba2, stable outlook
Source: Consolidated financial statements for year ended 31 December 2012 and internal analysisNote: (1) Carrying amount value of debt outstanding
(2) EBITDA including Telewizja Polsat Group 22

Outlook for 2013
External factors Our goals― Implementation of DTT
― Ad market under pressure of external macroeconomic factors
Operational targets ― Maintaining the stable level of the
subscriber base (excluding
g
external macroeconomic factors
― Increasing popularity of mobile devices
― Growing role of new media
subscribers migrating to Multiroom)
― Further ARPU growth,― Dynamic growth of broadband Growing role of new media
users number
― Increase the penetration of our subscriber base with multiplay
― Maintaining the stable level of audience share above 20% on the fragmented market
― Further fragmentation of TV market
Our guidance
― Further and effective competition on the advertising market
Finance targets
Further fragmentation of TV market
― Decline of TV ad market by 4‐6%
― Further growth of mobile Internet market Finance targets
― Continued revenue growth
― Maintaining strong margins
D bt l l b l 2 t
market
― Further increase of value of pay‐TV market based on ARPU increase
23
― Debt level below 2x net debt/EBITDA

4 Recent transactions

Restructuring process of Polsat GroupMain objectivesMain objectives
Concentration on the group’s core activities in the field of services for retail customers and broadcasting and TV gproduction
Disposal of RSTV S.A., provider of signal transmission servicesp , p g
Acquisition of Polskie Media S.A., broadcaster of TV4 and TV6channelschannels
25

Disposal of RSTV S.A.
Polsat Group entered into a conditional agreement for the disposal of RSTV S.A.to Emitel Sp. z o.o. for the amount of PLN 45.5m
Main objective ‐ focus on the Polsat Group’s core activities :
– No additional savings for Telewizja Polsat relating to the ownership of the g j g pcompany providing transmission services
– Strategy of development in DTT is capex consuming and difficult to implement
– Lack of future synergies for the Group
Precedent conditions :
R i i t f b k hi h ti t th l t (SFA)– Receiving consents from banks which are parties to the loan agreement (SFA)
– Release of all security (on shares and assets of the Company) related to the loan agreement and bond issue g
– Court registration of the division of the company
Pursuant to the loan agreement, all proceeds from the disposal will be used for prepayment of the term loan
26

Disposal of RSTV S.A.Positive impact on Group’s resultsPositive impact on Group s results
RSTV’s revenues structure in 2012 was:
– Polsat Group – ca. 60%
– Other radio and TV broadcasters – ca. 40%
EBITDA generated on external partners in 2012 amounted to ca PLN 4 5 millionEBITDA generated on external partners in 2012 amounted to ca. PLN 4.5 million
The transaction has a positive impact on the cash flow:
L i l l f th l d th l d bt i t i th f t– Lower nominal value of the loan and thus lower debt service costs in the future
– No additional capex and opex required for the future development on the diametrically changing markety g g
27

Acquisition of shares in Polskie Media S.A.
Telewizja Polsat entered into a conditional agreement for the acquisition of 100% of shares in Polskie Media S.A., a broadcaster of TV4 and TV6 channels
The entity’s value amounts to PLN 99 million and shall be paid with own funds
A i d d t i i f KPMG Ad i d f th M t B dAn independent opinion of KPMG Advisory, prepared for the Management Board of Cyfrowy Polsat, confirms that price terms of the planned transaction are fair from the point of view of Cyfrowy Polsat
Acquisition of TV4 and TV6 channels is part of the group’s strategy to strengthen its market position by increasing audience share in the target group
Precedent conditions:
– approval by the President of the Office of Competition and Consumer Protectionapproval by the President of the Office of Competition and Consumer Protection
– acquisition of the registered shares from the company’s current minority shareholder
Transaction is expected to be finalized in July 201328
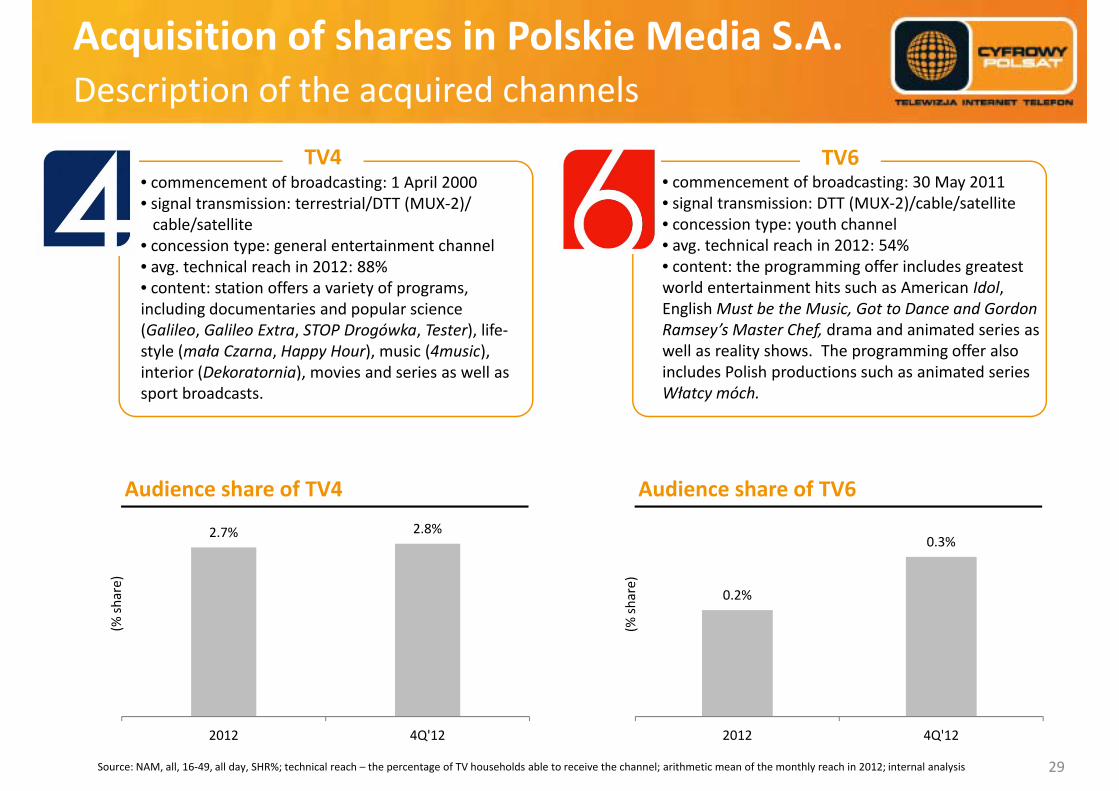
Acquisition of shares in Polskie Media S.A.Description of the acquired channelsDescription of the acquired channels
f b dTV4 TV6
• commencement of broadcasting: 1 April 2000• signal transmission: terrestrial/DTT (MUX‐2)/ cable/satellite
• concession type: general entertainment channelt h i l h i 2012 88%
• commencement of broadcasting: 30 May 2011• signal transmission: DTT (MUX‐2)/cable/satellite• concession type: youth channel• avg. technical reach in 2012: 54%• content the pro rammin offer incl des reatest• avg. technical reach in 2012: 88%
• content: station offers a variety of programs, including documentaries and popular science (Galileo, Galileo Extra, STOP Drogówka, Tester), life‐style (mała Czarna Happy Hour) music (4music)
• content: the programming offer includes greatest world entertainment hits such as American Idol, English Must be the Music, Got to Dance and Gordon Ramsey’s Master Chef, drama and animated series as well as reality shows The programming offer alsostyle (mała Czarna, Happy Hour), music (4music),
interior (Dekoratornia), movies and series as well assport broadcasts.
well as reality shows. The programming offer also includes Polish productions such as animated series Włatcy móch.
2 8%
Audience share of TV4 Audience share of TV6
2.7% 2.8%
share)
0.2%
0.3%
share)
(%
(%
2012 4Q'12
Source: NAM, all, 16‐49, all day, SHR%; technical reach – the percentage of TV households able to receive the channel; arithmetic mean of the monthly reach in 2012; internal analysis
2012 4Q'12
29
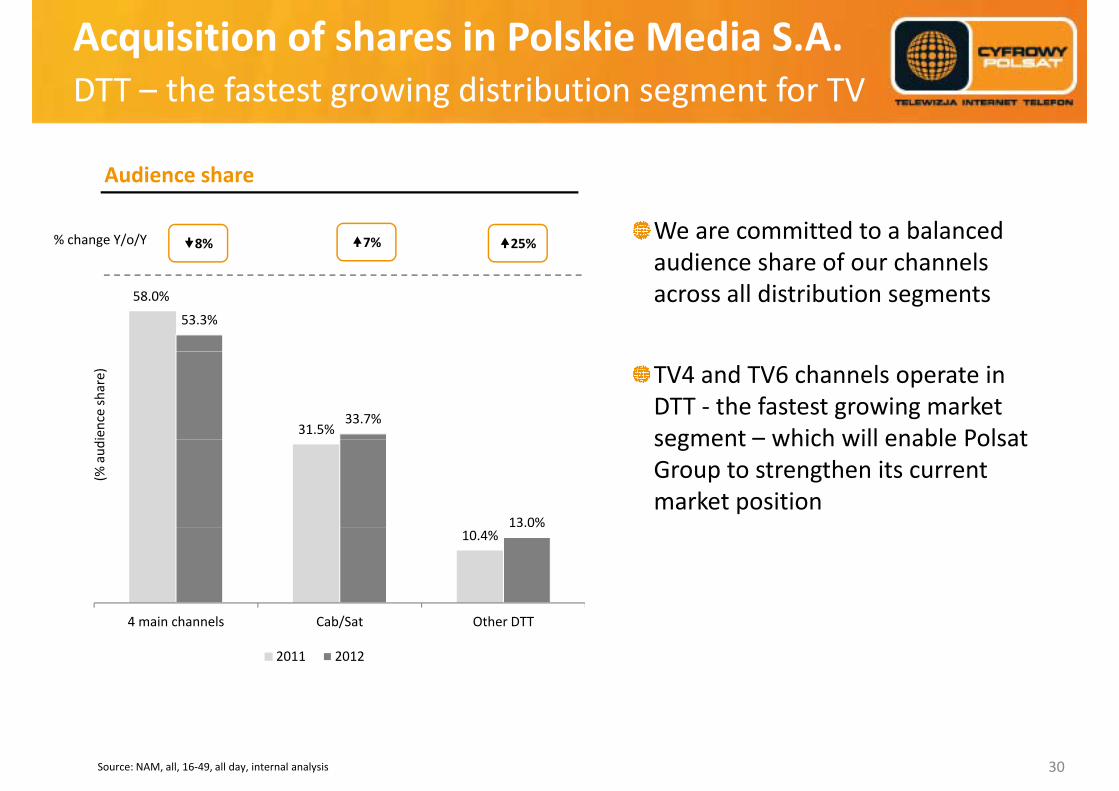
Acquisition of shares in Polskie Media S.A.DTT the fastest growing distribution segment for TVDTT – the fastest growing distribution segment for TV
Audience shareAudience share
We are committed to a balanced audience share of our channels
% change Y/o/Y 8% 25%7%
58.0%
53.3%
audience share of our channels across all distribution segments
31.5%33.7%
ienceshare) TV4 and TV6 channels operate in
DTT ‐ the fastest growing market segment – which will enable Polsat
13.0%
(% aud
i segment – which will enable Polsat Group to strengthen its current market position
10.4%%
4 main channels Cab/Sat Other DTT
2011 2012
Source: NAM, all, 16‐49, all day, internal analysis 30

Acquisition of shares in Polskie Media S.A.Strengthening Telewizja Polsat’s market positionStrengthening Telewizja Polsat s market position
DTT Cab/Sat
N f h l N f h lNo. of channels
TV Polsat Group DTT market
4 20
No. of channels
TV Polsat Group Cab/Sat market
22 ca. 200(1)
Share of Polsat Group in 2012
Audience Ad market
23.5% 25.3%
Source: NAM, all, 16‐49, all day, SHR%; Starlink, advertising spots and sponsoring; TV Polsat; internal analysisNote (1) Company estimates
31

Acquisition of shares in Polskie Media S.A.Attractive valuationAttractive valuation
PLN million 2010 2011 2012
Disposal of the minority stake of Polskie Media by TVN SA results in a valuation of ca. PLN 118m(1)
According to our estimations the 2013F EV/EBITDA
Financial results of Polskie Media
Revenue 68 71 76
EBITDA 12 9 7
According to our estimations the 2013F EV/EBITDA multiple is significantly lower than multiples of comparable transactions, including Telewizja Polsatacquisition EBITDA 12 9 7
Net profit/(loss) 3 (2) (4)
acquisition
Growing advertising revenues as a result of increased technical reach and launch of a new h l ( )channel (TV6)
Higher signal transmission costs till July 2013 resulting from simulcast transmission costsresulting from simulcast transmission costs (analogue and DTT)
We identified number of synergies with Polsat h h ll l h f b lGroup, which will positively impact the profitability
of TV4 and TV6
Polskie Media currently services a PLN 20m debt
Source: Polskie Media, Data according to Polish Accounting Standards; Data for 2012 based on unaudited financial statementsNote: (1) Report of TVN SA Capital Group for the year ended 31 December 2011
Polskie Media currently services a PLN 20m debt
32

Acquisition of shares in Polskie Media S.A.Transaction summaryTransaction summary
St t i t t t th iti i th f t d t l i i k tStrategic step to strengthen our position in the fragmented television market
Attractive valuation
Opportunity to increase advertising revenue on the basis of growing audience share and to increase profitability by eliminating doubled signal p y y g gtransmission costs (analogue and DTT)
Potential synergies – Programming
o Stronger negotiating power
o Efficient management of content library
o More flexibility in scheduling of FTA channels
– TechnicalTechnical
– Advertising, marketing, cross‐promotion
– Back‐office
33

5 Appendix

5a Retail business segment

No. 1 in pay‐TV market
Poland’s pay‐TV market leader with 3.6m subscribers
% share in the total number of paying subscribers at the EOY
C f P l tCyfrowy Polsat32%
CATV operators2
41%
2012
Other DTH operators1
25%IPTV3
2%
Note: (1) Based on own estimates and data published by operators (Annual reports of TVN S.A. Group and TP S.A. Group for 2012) (2) Based on own estimates and data published by PIKE(3) Based on own estimates and data published by operators (Annual reports of Telekomunikacja Polska S.A. Group and Netia S.A. for 2012)
36

Stable subscriber base with low churn rate and growing ARPUrate and growing ARPU
Pay‐TV subscribers base 10.6
9.5 9.5 9.79.0
Churn (12 months)(1)
767 805
9.09.8
9.09.2
9.1 8.6
7.07.4
8.1
6.9 7.1
Family Package
Blended
Mini Package
(%)
3,552 3,566
767 805
)
31‐Dec‐11 31‐Mar‐12 30‐Jun‐12 30‐Sep‐12 31‐Dec‐12
45.2 45.4(3) 45.9 47.1 48.22,785 2,761
(ths.)
ARPU(2)
13.9 13.5(3) 13.2 13.4 13.4
Family Package
Mini Package 31 December 2011 31 December 2012
(PLN
)
Q4'11 Q1'12 Q2'12 Q3'12 Q4'12Family Package Mini Package
Note: (1) We define “churn rate” as the ratio of the number of contracts terminated during a twelve month period to the average number of contracts during such twelve month period The number of terminated
37
Note: (1) We define churn rate as the ratio of the number of contracts terminated during a twelve‐month period to the average number of contracts during such twelve‐month period. The number of terminated contracts is net of churning subscribers entering into a new contract with us no later than the end of the same twelve‐month period as well as of subscribers who used to have more than one agreement and terminated one of them to replace it with the commitment to use Multiroom service.(2) “ARPU” relates to average net revenue per subscriber to whom we rendered services calculated as a sum of net revenue generated by our subscribers from our pay digital television services in the reporting period divided by the average number of subscribers to whom we rendered services in this reporting period. (3) In line with the provisions of IAS 18, starting from the year 2012 the Group recognizes lower revenues from penalties for breaching contracts by the clients due to change of accounting estimates regarding recognition and recoverability of these revenues. This change of estimates does not materially influence the Group’s operating results. It causes, however, a slight decrease in ARPU, though not perturbing its stable upward trend.

Products supporting growth in revenues from retail business segmentfrom retail business segment
Internet service users Mobile telephony service users(1)
142,651 144,887150,199
Internet service users Mobile telephony service users
73,190(ths.)
(ths.)
31 December 2011 31 December 201231 December 2011 31 December 2012
427,200
Multiroom service users
31%
Set‐top‐box base structure
(ths.)
69%
51%31%
HD SD
(% share)
107,186
31 December 2011 31 December 2012
49%69%
31 December 2011 31 December 201231 December 2011 31 December 2012
Note: (1) users of our MVNO service and our clients who bought Polkomtel’s mobile telephony service within cross promotion
31 December 2011 31 December 2012
38

Growing online video segment
I l l b i d t 2 3
Users of online video platforms
Ipla real users number increased to 2.3 m
1 m downloaded apps for Android and more than 0 5m for iOS and Windows Phone
2.6 2.6
2.3
n)
than 0.5m for iOS and Windows Phone
Almost 50% of total traffic is generated by mobile devices and SmartTV users(1)
of RU in m
illionmobile devices and SmartTV users(1)
No. of ipla’s video library increased to 40 ths.
1.2
(no. o
Increase to 2,149 titles, incl. 1,546 feature movies
Change in ipla’s revenue structure in Q4’12 and 2012: 85% advertising and 15% subscription/VOD
Onet Group ‐vod.pl
WP Group ‐wp.tv
Ipla Group TVN Group ‐tvnplayer.pl
p /
Positive EBITDA in Q4’12: PLN 0.7m (Oct.: 0m, Nov.: 0.6m, Dec.: 0.1m)
Source: Megapanel PBI/Gemius, RU – Real Users, monthly average Nov.‐Dec. 2012 (no comparable data for the earlier period due to survey methodology changes), ipla Group – combined users of application and website ipla.tv
Note: (1) December 2012, users currently excluded in the Megapanel PBI/Gemius monitoring 39

Internet access offer
HSPA+ LTE
February 2013
• HSPA/HSPA+: 93% population
Coverage The first commercial LTE provider in Poland
• HSPA/HSPA+: 93% population
• LTE: 50% population
150 ths clients as of Dec.’12
Next years
• HSPA/HSPA+: 99% population Two business models:
– bundled service scheme for new
Roll‐out plan
• LTE: 66% population – bundled service scheme for new
and existing subscribers
– stand alone offer
Wid f d iWide range of devices
Tablets
Laptop (Acer Aspire E1)
(Samsung Galaxy Tab 8.9 LTE, Manta MID and Ferguson S3)
HSPA+/LTE modems (Huawei E3276, Huawei E398, ZTE MF821)
40
Routers (Edimax LT‐6408n, ZTE MF60)
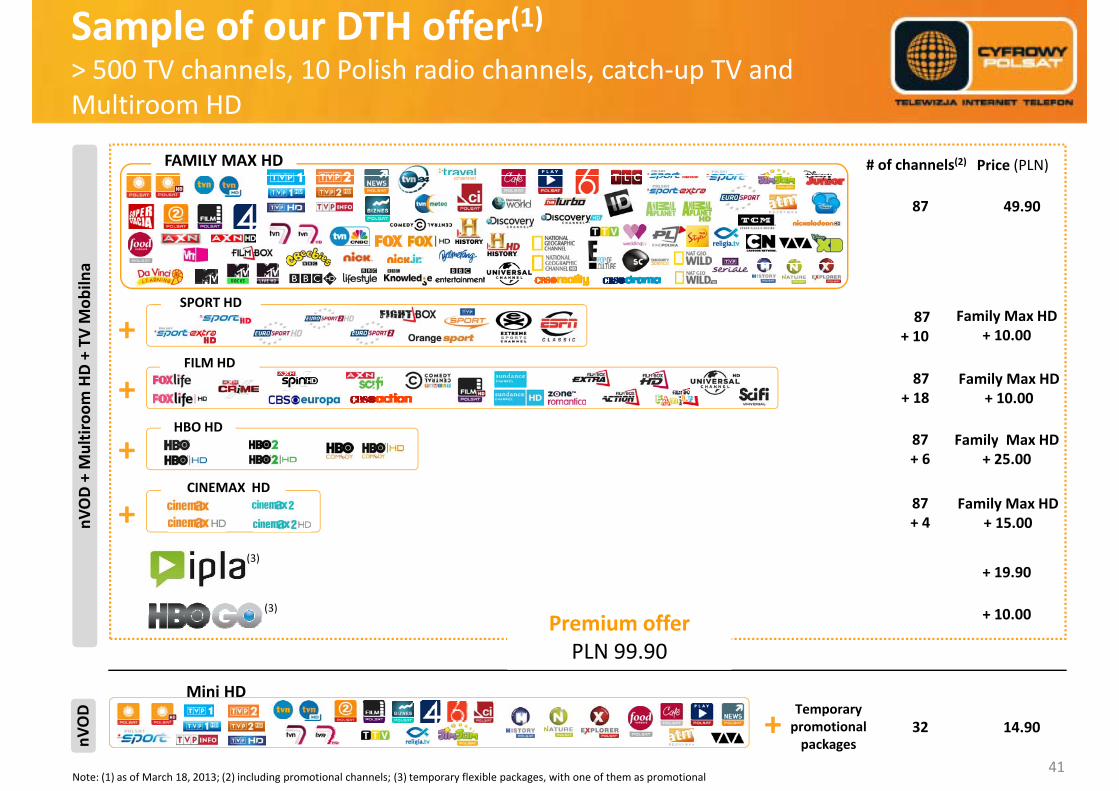
Sample of our DTH offer(1)> 500 TV channels, 10 Polish radio channels, catch‐up TV and
Price (PLN)
Multiroom HD
# of channels(2)FAMILY MAX HD
49.9087
TV M
obiln
a
+ Family Max HD+ 10.00
87+ 10
SPORT HD
tiroom
HD +
+ Family Max HD+ 10.00
87+ 18
Family Max HD87HBO HD
FILM HD
nVOD+ Mult
+ Family Max HD+ 15.00
87+ 4
CINEMAX HD
+ Family Max HD+ 25.00
87+ 6
n
i ff
15.00 4
+ 19.90
+ 10 00
(3)
(3)
Mini HD
Premium offerPLN 99.90
+ 10.00
41
14.9032
Note: (1) as of March 18, 2013; (2) including promotional channels; (3) temporary flexible packages, with one of them as promotional
+Temporary promotional packagesnV
OD

B d ti d t d ti5b Broadcasting and tv production segmentsegment
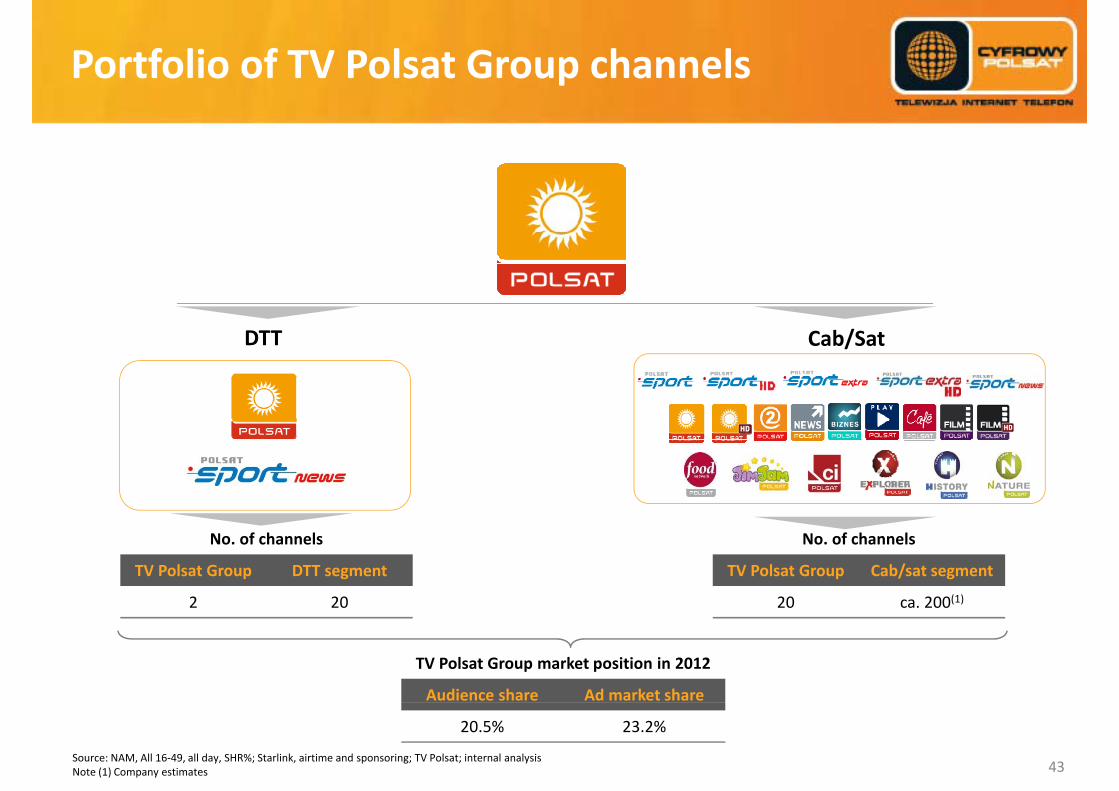
Portfolio of TV Polsat Group channels
DTT Cab/Sat
No. of channels
TV Polsat Group DTT segment
2 20
No. of channels
TV Polsat Group Cab/sat segment
20 ca. 200(1)
TV Polsat Group market position in 2012
Audience share Ad market share
20.5% 23.2%
Source: NAM, All 16‐49, all day, SHR%; Starlink, airtime and sponsoring; TV Polsat; internal analysis Note (1) Company estimates 43

Audience share
YoY % change
Stable audience share
1% 0% +36%7% +3%YoY % change ‐1% 0% +36%‐7% +3%
20 8%22.0%
29.4%
22.7%20 5%
21.9%
27.2%
23.3%
20.8% 20.5%
2011
2012
5.2%7.1%
(1)Polsat Group TVN Group TVP Group Other DTT Other cab‐sat
44Note: (1) ATM Rozrywka, ESKA TV, Polo TV, TV Puls, Puls2, TV4, TV6Source: NAM, All 16‐49, all day, SHR%; internal analysis
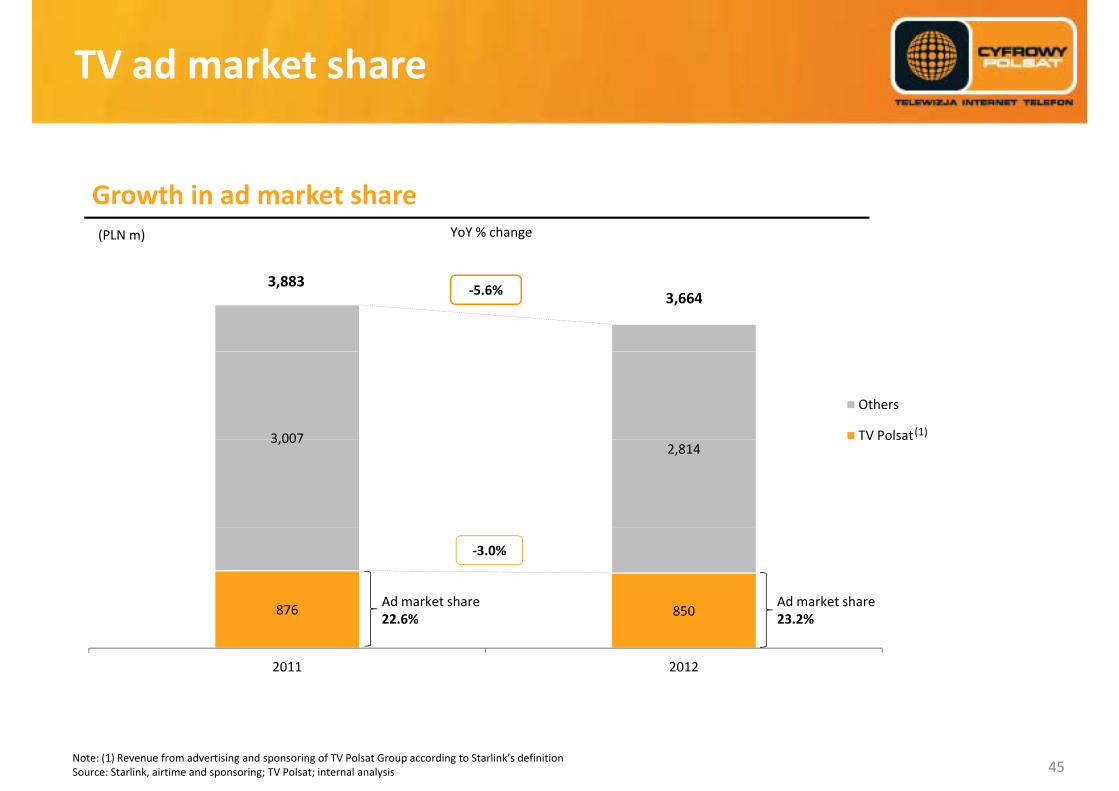
TV ad market share
YoY % change(PLN m)
Growth in ad market share
3,8833,664‐5.6%
3 007
Others
TV Polsat(1)3,0072,814
TV Polsat
876 850
‐3.0%
Ad market share22 6%
Ad market share23 2%850
2011 2012
22.6% 23.2%
Note: (1) Revenue from advertising and sponsoring of TV Polsat Group according to Starlink’s definitionSource: Starlink, airtime and sponsoring; TV Polsat; internal analysis 45

Polish market overview
3.9% 4.3%6%
Rebound in ad spend Stable share for TV (1)
6 5% 6 %
1.5% 1.5% 1.7% 1.8% 1.9%100%
3.3%
1.5%
1.6%2.4% 1.8%
2.6%
2%
4%
17 8% 16 2% 14.1% 11.7% 10.0%
7.9% 7.5% 7.4% 7.2% 7.1%
6.5% 6.7% 7.0% 7.4% 7.5%
80%
90%
.5%
‐1.7%
‐2%
0%
2009 2010 2011 2012F 2013F 2014F13.8% 15.7% 17.9% 20.3% 22.1%
17.8% 16.2%
60%
70%
are)
% change)
‐6.3%
‐5.7%‐6%
‐4%
40%
50%
(% sha
(YoY
%
6.3%
‐10%
‐8%
52.5% 52.3% 51.9% 51.6% 51.5%
20%
30% TV advertising
‐11.3%
‐14%
‐12%
TV ad market GDP (1)0%
10%
2010 2011 2012F 2013F 2014F
Source: Eurostat, Zenith Optimedia, “Advertising Expenditure Forecasts, December 2012”Note: (1) Zenith Optimedia estimates 46
Television Internet PressOutdoor Radio Cinema

5c Additional financial slides

Revenue and EBITDA – growth drivers
+17% +40%
EBITDARevenue(1)
YoY change YoY change
161 2
295.0‐43.9
2 500
3 000
147 0
1 200+412 m +297 m
2 365 9
2,778.21,032.2
YoY change YoY change
69%
161.2
64%2 000
2 500
m)
150.0
147.0
61%
900
m)
2,365.9
735.2
69%
1 000
1 500
(PLN
m
39%
66%
300
600
(PLN
m
31%36%
0
500 34%
0
300
31.1%
37.2%
Revenue 2011
Retail business segment
Broadcasting and television production segment
Consolidation adjustments
Revenue 2012
EBITDA 2011
Retail business segment
Broadcasting and television production segment
EBITDA 2012
Retail business segmentBroadcasting and television production segmentEBITDA marginBroadcasting and television production segment
Source: Consolidated financial statements for year ended 31 December 2012 and internal analysisNote: (1) Revenue does not include „Other operating income” 48
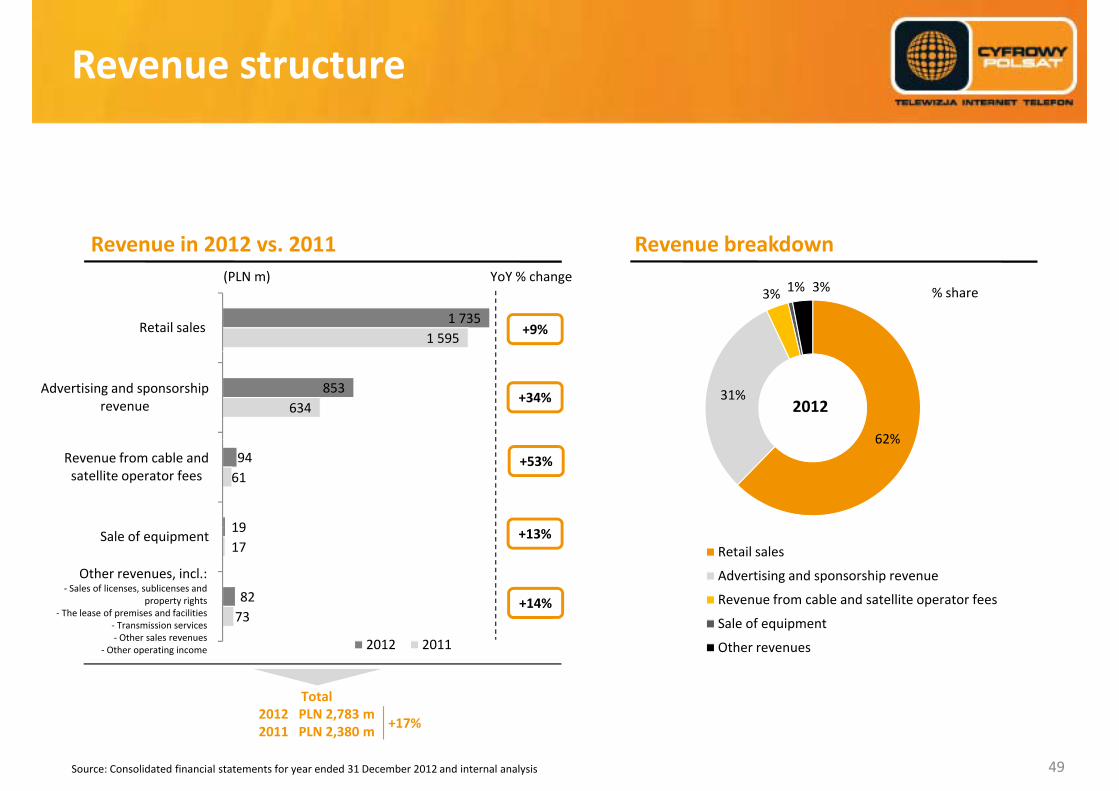
Revenue structure
Revenue in 2012 vs. 2011 Revenue breakdown
1 7351 595
Retail sales
3% 1% 3%
+9%
(PLN m)% share
YoY % change
853634
Advertising and sponsorship revenue
62%
31%+34% 2012
94
19
61Revenue from cable and satellite operator fees
62%
+53%
19
82
17
73
Sale of equipmentRetail sales
Advertising and sponsorship revenue
Revenue from cable and satellite operator fees+14%
+13%
Other revenues, incl.:‐ Sales of licenses, sublicenses and
property rights‐ The lease of premises and facilities 73
2012 2011
Sale of equipment
Other revenues
Total
The lease of premises and facilities‐ Transmission services‐ Other sales revenues
‐ Other operating income
49
2012 PLN 2,783 m2011 PLN 2,380 m
+17%
Source: Consolidated financial statements for year ended 31 December 2012 and internal analysis

Cost structure
Operating costs in 2012 vs. 2011 Operating costs breakdown
415
351
360
Cost of internal and external TV d ti d ti ti f t
Programming costs18%
5 5%
14%‐13%
+30%
% shareYoY % change(PLN m)
312
271
243
313
351
Depreciation, amortization and
Distribution, marketing, customer relation management and retention
costs
production and amortization of sport rights
18%
9%
7.5%
5.5%
2012
+39%
+30%
0%
115
149
175
150
178
Broadcasting and signal transmission
Salaries and employee‐related costs
impairment16%12%
Programming costs
+20%
+39%
+31%
290
93
115
287
112Amortization of purchased film licenses
costs Cost of internal and external TV production and amortization of sport rightsDistribution, marketing, customer relation management and retention costsDepreciation amortization and impairment
+31%
‐2%
+20%
‐ Broadcasting and signal transmission costs‐ Cost of equipment sold
‐ Cost of debt collection services and bad debt allowance
Other costs, incl.:
290
2012 2011
Depreciation, amortization and impairment
Salaries and employee‐related costs
Broadcasting and signal transmission costs Total
and receivables written off ‐ Cost of settlements with mobile network operators and
interconnection charges‐ Other costs
‐ Other operating costs
50
Amortization of purchased film licenses
Other costs
2012 PLN 1,994 m2011 PLN 1,820 m
+10%
Source: Consolidated financial statements for year ended 31 December 2012 and internal analysis

5d Corporate governance

Performance of Cyfrowy Polsat shares in 2012in 2012
(i d d 100 l i i D b 31 2011)
140%Acquisition of shares in entities running ipla platformMarch 12
Recommendation fordistribution of profit for2011 / Aprli 18
Upgrade of ratings by S&P and Moody’sJune 14 / July 23
Prepayment of a part of the Term LoanAugust 29
Memorandum of Understanding withMobyland concerning the agreement forData Transfer Services /September 28
(indexed; 100 = closing price on December 31, 2011)
120%
130%
22%(1)
26%(1)
March 12 2011 / Aprli 18 June 14 / July 23 August 29 Data Transfer Services /September 28
110%
8%(1)
100%
80%
90%
Publication of results for 2011
Publication of results for 1Q12
Publication of results for 1H12
Publication of results for 3Q12
70%Dec-11 Jan-12 Feb-12 Mar-12 Apr-12 May-12 Jun-12 Jul-12 Aug-12 Sep-12 Oct-12 Nov-12
results for 2011 March 12
results for 1Q12May 15
results for 1H12August 30
results for 3Q12November 14
Nota: (1) change: Dec. 28, 2012 vs. Dec. 30, 2011
Cyfrowy Polsat WIG WIG-MEDIA
52

Performance of Cyfrowy Polsat shares since the announcement of TV Polsat acquisitionthe announcement of TV Polsat acquisition
Cyfrowy Polsat (PLN) TVN (PLN) TPSA (PLN) CME (CZK)
54020
Conditional purchase agreement of shares in TV Polsat / Nov. 15, 2010
Market cap reaches PLN 6bn Jan. 17‐29, 2013
Introduction into trading of H series
shares/ May 30, 2011
Acquisition of shares in entities running ipla
platform / Mar. 12, 2012
480
540
18
20
PLN 16.6 PLN 17.2
PLN 18.2
360
420
14
16
PLN 14.9
CZK 443.0
(Oct. 1, 2010)
30012
Pric
e(C
ZK)
Pric
e(P
LN)
( , )
180
240
8
10P
PLN 9.7
PLN 7 2
60
120
4
6CZK 97.5
PLN 7.2
(Mar 8 2013)
53
604Oct-10 Dec-10 Feb-11 Apr-11 Jun-11 Aug-11 Oct-11 Dec-11 Feb-12 Apr-12 Jun-12 Aug-12 Oct-12 Dec-12 Feb-13
Cyfrowy Polsat22%(1)
PLN 16.4PLN 13.5Note: (1) change: Dec. 28, 2012 vs. Dec. 30, 2011
(Mar. 8, 2013)
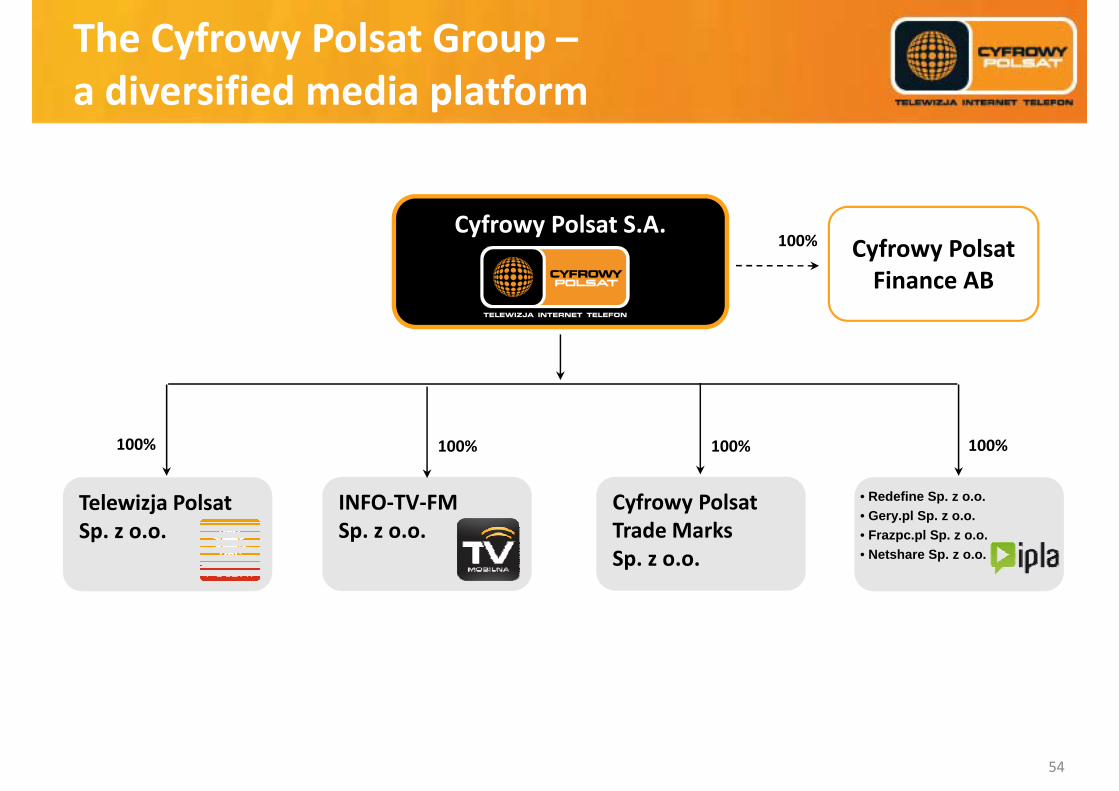
The Cyfrowy Polsat Group –a diversified media platforma diversified media platform
Cyfrowy Polsat S.A.Cyfrowy Polsat 100%
Finance AB
100%100% 100%
Telewizja Polsat Sp z o o
• Redefine Sp. z o.o. • Gery.pl Sp. z o.o.
100%
Cyfrowy Polsat Trade Marks
INFO‐TV‐FMSp z o o
100%
Sp. z o.o. • Frazpc.pl Sp. z o.o.• Netshare Sp. z o.o.
Trade Marks Sp. z o.o.
Sp. z o.o.
54

Shareholding structure
ShareholderNumber of
shares% of shares
Number of votes
% of votes
l d 1 i lPola Investments Ltd.1, incl.:
‐ privileged registered shares
‐ bearer shares
154 204 296
152 504 876
1 699 420
44.27%
43.78%
0 49%
306 709 172*
305 009 752*
1 699 420
58.11%*
57.79%*
0.32%bearer shares 1 699 420 0.49% 1 699 420 0.32%
Sensor Overseas Ltd.2, ncl.: 25 341 272 7.27% 50 382 647 9.55%
‐ privileged registered shares
‐ bearer shares
25 041 375
299 897
7.19%
0.09%
50 082 750
299 897
9.49%
0.06%
Others 168 807 268 48.46% 170 678 518 32.34%
Total 348 352 836 100 00% 527 770 337 100 00%Total 348 352 836 100.00% 527 770 337 100.00%
1. Pola Investments Ltd. is controlled by the family foundation (trust) TiVi Foundation.2. Sensor Overseas Ltd. is controlled by Mr. Heronim Ruta.*On February 12, 2013, the Company was informed that on February 7, 2013, Pola Investments Ltd. ("Pola") received from Sensor Overseas Limited the proxy to exercise voting rights from 20,791,375 privileged registered shares of the Company, constituting 5.97% of the Company's share capital and representing 41,582,750 votes at the general meeting of the Company, which is 7.88% of the total number of votes (the "Proxy"). After receiving of the Proxy,
55
of the Company, constituting 5.97% of the Company s share capital and representing 41,582,750 votes at the general meeting of the Company, which is 7.88% of the total number of votes (the Proxy ). After receiving of the Proxy, Pola holds and is entitled to exercise voting rights from 174,995,671 shares of the Company, that constitute 50.24% of the Company's share capital and represents 348,291,922 votes at the general meeting of the Company, which is 65.99% of the total number of votes in the Company. The abovementioned package includes: a) 173,296,251 privileged registered shares constituting 49.75% of the Company's share capital and representing 346,592,502 votes at the general meeting of the Company, which constitutes 65.67% of the total number of votes in the Company, andb) 1,699,420 bearer shares constituting 0.49% of the Company's share capital and representing 1,699,420 votes at the general meeting of the Company, which constitutes 0.32% of the total number of votes in the Company.

Contact us
Bartłomiej DrywaInvestor Relations DirectorPhone +48 (22) 356 6004Fax. +48 (22) 356 6003Email: [email protected]
Or visit our website: www.cyfrowypolsat.pl/inwestor
56
Related Documents