Early Childhood and Family Policy Series N° 12 - 2005 Policy Review Report: Early Childhood Care and Education In Kazakhstan The Section for Early Childhood and Inclusive Education Division of Basic Education UNESCO Education Sector

Welcome message from author
This document is posted to help you gain knowledge. Please leave a comment to let me know what you think about it! Share it to your friends and learn new things together.
Transcript

Early Childhood and Family Policy Series
N° 12 - 2005
Policy Review Report:
Early Childhood Care and Education
In Kazakhstan
The Section for Early Childhood and Inclusive Education Division of Basic Education UNESCO Education Sector
The author is responsible for the choice and presentation of the facts contained in this
document and for the opinions expressed therein, which are not necessarily those of UNESCO
and do not commit the Organization. Contributions to this series are welcomed and should be addressed for review to Early Childhood and Family Policy series, at the address given below. Additional copies of this monograph can be obtained from: Early Childhood and Inclusive Education Section ED/BAS/EIE, UNESCO 7 Place de Fontenoy 75352 Paris 07 SP, FRANCE http://portal.unesco.org/education/en/ev.php-URL_ID=2905&URL_DO=DO_TOPIC&URL_SECTION=-465.html (ED-2005/WS/20)
UNESCO/OECD Early Childhood Policy Review Project
Policy Review Report: Early Childhood Care and Education in Kazakhstan
Presented by
The Section for Early Childhood and Inclusive Education Division of Basic Education, Education Sector
UNESCO, Paris
May 2005
Approved by
The Ministry of Education and Science Government of the Republic of Kazakhstan
May 2005

1
ACKNOWLEDGEMENTS The review of the early childhood care and education policy in Kazakhstan and the preparation of this Report could not have been realised without the generous assistance and participation of many stakeholders, specialists, colleagues, parents and children. Their spirit of cooperation and enthusiasm for sharing their experience, insights and information helped to make the review an exceptionally rich and rewarding exercise. Firstly, I would like to express my gratitude to Ms. Kulyash N. Shamshidinova, Vice Minister of Education and Science of the Republic of Kazakhstan and National EFA Coordinator, for sharing her vision of early childhood care and education in the country and firmly supporting the review. I would also like to thank Ms. Sveltana B. Ispussinova, Director of the Secondary Education Department of the Ministry of Education and Science of Kazakhstan, for her kind assistance and confidence in the usefulness of the review. My special thanks go to Ms. Gaukhar A. Saimassaeva, Chief Specialist of Preschool Education, the Division of Preschool and Basic Education, the Secondary Education Department of the Ministry of Education and Science, for taking the lead in planning a comprehensive programme of visits for the Review Team, arranging meetings with members of the Government and various stakeholders at the central and local levels, and providing a wealth of valuable data, statistics and documentation. Also, I wish to acknowledge the following individuals, who together form the Country Task Force, in jointly preparing the Background Report: Ms. Shamshidinova, Ms. Ispussinova, Ms. Saimassaeva and Ms. Zhazira G. Nurmakhametova of the Ministry of Education and Science; Ms. Maira M. Amirkhanova of the Agency for Statistics; and Ms. Nina L. Tataurova and Ms. Irina A. Tirskaya and other specialists from the Semipalatinsk Pedagogical Institute. I wish to extend my heartfelt appreciation to the officials of Almaty, Astana, Karaganda and Kostanai provincial and city administrations and education departments for their kind cooperation in planning the visits and meetings, sharing their plans, hopes and concerns, and guiding the Review Team. Also, I am very grateful to the staff, teachers, parents and children of the various early childhood services, in-service training institutes and pedagogical university and colleges visited for their warm welcome and hospitality. This Report benefited immensely from their sincere opinions and observations. Special appreciation is reserved for Ms. Anjum Haque, head of the UNESCO Office in Almaty, for successfully planning the Project in Kazakhstan. Ms. Irena Melinokova, Education Specialist, Ms. Aigul Khalafova, Education Specialist, and Mr. Bakhtiyar Ospanbaev, Education Assistant of the Office also deserve special acknowledgement for their invaluable cooperation and assistance with the day-to-day implementation of the Project with the Ministry of Education and Science, including making necessary logistical arrangements for the Review Visit. The review would not have been possible without the efforts of the four Review Team members whom I was honoured to join: Ms. Gaukhar A. Saimassaeva, Ms. Nina L. Tataurova, Ms. Judith Harwin, and Mr. Jan van Ravens. Their inputs formed the backbone of this Report. Particularly, I would like to acknowledge Ms. Harwin for undertaking the difficult task of coordinating the members’ inputs and assisting with the preparation of the first draft of this Report. Finally, I wish to extend my thanks to Ms. Yoshie Kaga of UNESCO Paris, who helped with the Project’s daily implementation, facilitated logistical arrangements during the visit, and assisted with the preparation of the Report. I am particularly indebted to her for her valuable contribution to the preparation of Chapters 1 and 2 and the Annexes. She has also kindly extended her help with the editing of the final text. Soo-Hyang Choi Chief, Section for Early Childhood and Inclusive Education Division of Basic Education, Education Sector UNESCO, Paris

2
TABLE OF CONTENTS List of Tables and Figures ………………………………………………………………………………. 3 Glossary …………………………………………………………………………………………………. 4 Technical Notes …………………………………………………………………………………………. 5 EXECUTIVE SUMMARY ……………………………………………………………………………. 7 1. INTRODUCTION ……………………………………………………………………………. 8 1.1. About the Project ……………………………………………………………………………… 8 1.2. Review Visit in Kazakhstan……………………………………………………………………. 8 1.3. The Review Report ……………………………………………………………………………. 9 2. COUNTRY PROFILE ……………………………………………………………………….. 10
2.1. Socio-Economic Profile ……………………………………………………………………….. 10 2.2. Educational Profile …………………………………………………………………………….. 11 2.3. Early Childhood Profile ……………………………………………………………………….. 12
3. REVIEW RESULTS …………………………………………………………………………. 15
3.1. Access ……................................................................................................................................ 15 3.2. Quality ………………………………………………………………………………………… 26 3.3. Resources ……………………………………..……………………………………………….. 32
4. CONCLUDING REMARKS ……………………………………………………………….. 38 References ………………………………………………………………………………………………. 41 Annex 1: Schedule of Review Visit …………………………………………………………………….. 42 Annex 2: Review Team …………………………………………………………………………………. 43 Annex 3: Comparative Data on Kazakhstan…..…………………………………………….…............... 44 Demography ……………………………………………………………………………... 44 Economy …………………………………………………………………………………. 45 Women’s development ……………………….……………………………………….…. 47 Child development and health environment ……………………………………………... 50 Education ……………………………………………………………………………….... 51

3
List of Tables and Figures Table 1: Early childhood service structure in Kazakhstan……………………………….….……..………... 13 Figure 1: EFA Development Index ranks of selected countries, 2001………………………………….……. 12 Figure 2: Enrolment rate of children ages 0+-7+ years in POs and ages 5+-6+ years in pre-primary education,
1999-2004 …...…………..…………………………………………………………………………. 15 Figure 3: Enrolment rate of children ages 0+-7+ years in POs by Oblasts, 2000 and 2004 ...………………... 16 Figure 4: Enrolment rate of children ages 1+-6+ years in POs in urban and rural areas by Oblasts, 2004 …... 16 Figure 5: Distribution of Mini Preschool Centres by urban/rural areas, 2003-2004 ………………..……….. 17 Figure 6: Enrolment rate of children ages 0+-7+ years in POs by urban/rural areas, 2000-2004 …………….. 17 Figure 7: Enrolment rate of rural children ages 5+-6+ years in PPE Class, 2001-2004 ……………......…….. 17 Figure 8: Distribution of POs by urban/rural areas, 2000-2004 ……………………………………………... 18 Figure 9: Rural POs, as a % of the total POs under MOES and as a % of the total POs under other
ministries and enterprises, 2000-2004 ……………………………………………………………... 18 Figure 10: Enrolment rate of children ages 1+-6+ in POs in L-5/H-5 Oblasts, 2004 ………………...………... 19 Figure 11: Percentage of population with income below the subsistence minimum level in L-5/H-5 Oblasts,
2001 ………………………………………………………………………………………………... 19 Figure 12: Distribution of women with many children and on welfare subsidies by L-5, H-5 and other
Oblasts, 2003 …………………………………………………………………………..…………... 19 Figure 13: 0+-7+ population, POs and PO teachers in L-5/H-5 Oblasts, as a % of the totals, 2004 …………... 20 Figure 14: Enrolment rate of children ages 3+ to 6+ years in POs, PPE and PE in L-5/H-5 Oblasts, 2003 …… 20 Figure 15: Enrolment of children ages 5+-7+ in pre-primary and primary education in L-5 and H-5 Oblasts,
2003 …………………………………………………………………………….…………………. 21 Figure 16: Schools with PPE Class and POs with PPE Group in L-5/H-5 Oblasts, as a % of totals,
2003……………………………………………………………………………………....………… 21 Figure 17: Distribution of population ages 0+-7+ and of POs by urban/rural areas, 2003 …………...……….. 22 Figure 18: Urban/rural distribution of small-size POs, 2003 ……………………..….………………………... 22 Figure 19: Enrolment of children ages 4+-6+ years in preschool education in urban/rural areas, 2003 ……… 23 Figure 20: Enrolment rates of children ages 5+-6+ in PPE Groups and PPE Classes in urban/rural areas,
2001-2003 ………………………………………………………………………………………….. 23 Figure 21: Enrolment rate of children ages 5+-7+ years in pre-primary and primary education in urban/rural
areas, 2003 …………..……………………………………………………………………………... 24 Figure 22: Enrolment rate of children ages 1+-4+ years in POs in urban/rural areas, 2003 ………...…………. 24 Figure 23: Distribution of PO teachers with higher education degrees in preschool education by L-5, H-5
and other Oblasts, 2003 ………………………………………………………..……….………….. 28 Figure 24: Child/teacher (3+-5+ years) ratios in selected countries, 2001-2002 ...….…………………..……... 29 Figure 25: Distribution of rehabilitated POs by urban/rural areas, 2003 ………..…………………..………… 29 Figure 26: Distribution of POs with standard buildings by urban/rural areas, 2003 ..………………………… 29 Figure 27: Distribution of permanent and seasonal POs by urban/rural areas, 2003 ...……………..………… 30 Figure 28: Kazakh POs without hot water, without sewage, as a % of total Kazakh POs, 2003 ..…………… 30 Figure 29: Kazakh children in POs without hot water, without sewage, as a % of Kazakh total, 2003 ……… 30 Figure 30: PPP Gross National Income, per capita ($), 2002 …..……………………………………………... 32 Figure 31: Public expenditure on education, as a % of GDP, 2001-2002 ……………………………..……… 33 Figure 32: Public expenditure on pre-primary educational institutions/administration, as a percentage of
GDP, 2001 ………..…………..……………………………………………………………………. 33 Figure 33: Distribution of resources for POs by source, 1999 and 2003 ………………..……..………..…….. 34 Figure 34: Comparison of monthly salaries of preschool teachers and other teachers, 1999-2003, KZT ….… 34 Figure 35: Distribution of POs by state, public and private owned, 2000-2003 ..…………………..………… 35 Figure 36: Per-child expenditure in preschool education, L-5 and H-5 Oblasts, 2003 ..……………………… 36
4
Glossary ADB Asian Development Bank CIS Commonwealth of Independent States ECCE Early Childhood Care and Education EDI EFA Development Index EFA Education for All KG Kindergarten MOES Ministry of Education and Science (of the Republic of Kazakhstan) MOH Ministry of Health (of the Republic of Kazakhstan) MLSP Ministry of Labour and Social Protection NER Net Enrolment Ratio NGO Non-Governmental Organisation OECD Organisation for Economic Cooperation and Development PE Primary Education PPE Class Pre-primary Class PPE Group Pre-primary Group PO Preschool Organisation RK Republic of Kazakhstan UNESCO United Nations Educational, Scientific, and Cultural Organisation UNICEF United Nations Children’s Fund

5
Technical Notes Age Children’s ages are expressed as follows: Children up to their first
birthday are referred to as 0+-year-olds; after their first birthday and before their second birthday they are 1+-year-olds. Thus, 3+-year-olds have had their third birthday, and so on.
Akim
Head of Akimat (see below).
Akimat
It refers to local executive government (municipality) in charge of developing and implementing the local budget. Akimats have education, health and financial departments, among others.
Early childhood care and education In this report, the term early childhood care and education is used to refer to the discipline that concerns the care, development and learning of young children of ages 0+-8 years.
Early childhood services In this report, the term early childhood services refers to all types of formal, non-formal and informal early childhood care and/or education services catering for children from 0+ to 8 years old and/or their parents.
Enrolment rate
Unless specified otherwise, enrolment rate refers to gross enrolment rate.
Kazakh Tenge Kazakh Tenge, Tenge, or KZT, is the national currency of Kazakhstan. According to the exchange rate of the National Bank of the Republic of Kazakhstan, US$1 equalled 129 Tenge in January 2005.
L-5/H-5 Oblasts
For the purpose of comparison, the five Oblasts (i.e. Almatinskaya, Zhambylskaya, Kyzylordinskaya, North Kazakhstan and South Kazakhstan) with the lowest enrolment ratios of 0+-7+ years were grouped as low-5 or L-5 Oblasts; the five Oblasts (i.e. Atyrauskaya, Karagandinskaya, Pavlodarskaya, Almaty City and Astana City) with the highest enrolment ratios of 0+-7+ years as high-5 or H-5 Oblasts.
Mini Preschool Centre
Mini Preschool Centre is a type of preschool service set up in the premises of general secondary schools, Kindergartens, or teacher's home. It is a flexible and less costly service compared to traditional POs (see below), serving children ages 3+-5+/6+ for shorter hours (e.g. 2 hours) in a mixed-age setting.
6
Oblast
The term is translated as “region”. Kazakhstan consists of 14 Oblasts and two Cities (i.e. Astana and Almaty Cities). In this report, the names of Oblasts are expressed as they are called in Kazakhstan. The following is a complete list of Oblasts, expressed in English in brackets: Akmolinskaya (Almola Oblast), Aktyubinskaya (Aktobe Oblast), Almatinskaya (Almaty Oblast), Atyrauskaya (Atyrau Oblast), East Kazakh (East Kazakhstan Oblast), Zhambylskaya (Zhambyl Oblast), West Kazakh (West Kazakhstan Oblast), Karagandinskaya (Karaganda Oblast), Kyzylordinskaya (Kzyl Orda Oblast), Kostanaiskaya (Kostanai Oblast), Mangystauskaya (Mangystau Oblast), Pavlodarskaya (Pavlodar Oblast), North Kazakh (North Kazakhstan Oblast), South Kazakh (South Kazakhstan Oblast).
Pre-primary Class Pre-primary Classes (PPE Classes) are free of charge and provide 32-week pre-primary education to children of age 5+/6+ who have not benefited from any form of early childhood service before. They are set up in general secondary schools.
Pre-primary Group
Pre-primary Groups (PPE Groups) are another form of free pre-primary education set up in Kindergartens. They are attended by 5+/6+-year-olds as part of their continuing participation in the Kindergartens. PPE Groups are senior classes of Kindergartens, offering pre-primary education.
Preschool education The term preschool education is used in Kazakhstan to refer to the first stage of education for children ages 1+-6+(7+) years. It is also called preschool education and training. Services providing preschool education are attentive to children’s learning as well as physical and psychological health and protection.
Preschool Organisation
Preschool Organisation (PO) is a generic term used in Kazakhstan to refer to early childhood care and education services catering to children of age 1+-6+(7+). POs include Nurseries, Kindergartens, Kindergarten-School Complexes, Nursery-Kindergartens, Mini Preschool Centres and PPE Class (see Table 1 in page 13).
Rayon
The term is translated as “district”. Kazakhstan’s 14 Oblasts are divided into 160 Rayons, 39 Oblast Cities, 45 District Towns and 7862 Villages.
Reference countries
Countries chosen to compare with Kazakhstan in various indicators (see Annex 3).
2010 Plan It refers to the State Programme for Education Development of the Republic of Kazakhstan for 2005-2010, the national strategic document for education development.

7
EXECUTIVE SUMMARY Access Enrolment in preschool organisations has increased over the last few years, standing at 20.7% among 1+-6+-year-olds and 66% among 5+/6+-year-olds in 2004. But inequity persists, with enrolment rates ranging from 5.4% to 40.6% across Oblasts (regions). Rural enrolment averages 5.6% as opposed to 32.9% in urban areas. Children in disadvantaged areas (i.e., poor Oblasts and rural areas) tend to start preschool education late, at the pre-primary level. Their pre-primary education is likely to be delivered through Pre-primary Classes, short crash courses at the pre-primary level, while their counterparts in advantaged areas (i.e., rich Oblasts and urban areas) benefit from an early start and an evolutionary progression in pre-primary education through Pre-primary Groups. The Government’s current efforts to reinforce the Pre-primary Classes with activities that can promote child’s holistic development need further support. Quality Great attention has been paid to quality, especially to the integration of care and education with holistic development. The inclusion of children with special needs is evident. Yet, enrolment in preschool education among children with special needs is still low. Children with other difficulties than speech impairment are less likely to receive care. The linkage between social-sector services and the education sector needs further strengthening. Qualified teachers are more likely to be found in advantaged regions. Strategies to supply teachers for the expansion of services envisaged by the 2010 Plan are not evident. Preschool organisations in disadvantaged areas tend to have inferior physical infrastructure. An inter-sectoral forum may be needed to foster cooperation among different Government sectors and to promote more integrated provision of early childhood services. To supply the needed workforce, efforts should be made for more efficient use of existing personnel, while incentives need to be devised to attract new qualified workforce. Resources Investment in preschool education is declining, while parents are paying more fees. Increased parental contributions are one of the factors causing inequitable access to preschool education. The current investment strategy centred on quality state Kindergartens needs review, as it can conflict with the need for an expedited expansion of access. Three options are suggested to address the quality vs. equity quandary. The current strategy could be continued while alternative services are developed for the poor and disadvantaged. But this could perpetuate the different paths of early learning for rich and poor. The second option would be to allow children from both rich and poor families to access quality state Kindergartens, but with means-tested fees. The third option would be to lower the current standards of state Kindergartens, especially those related to non-core activities, and make state Kindergartens more affordable to all. Concluding remarks Efforts to reach the ideal of preschool education for all must begin with improving access for children from poor and disadvantaged families. The Government may wish to pay more attention to making the distribution of services more equitable. One of the policy quandaries the Government must face is how to balance concern for quality with the need to expand access. Planners may not lose sight of the ultimate purpose of preschool education – the child’s holistic development. To maximise efficiency and effectiveness, the Ministry of Education and Science needs to strengthen partnerships with other sectors of the Government.

8
1. INTRODUCTION 1.1. About the Project 1.1.1. Context: The world community that assembled in Dakar, Senegal, in 2000 for the 10th anniversary of Education for All (EFA) reaffirmed its commitment to early childhood care and education and set its development as the first of the six Dakar Goals for EFA. Yet, in most developing countries, early childhood care and education has not been part of public policy, and governments have limited capacity for developing policies and systems for it. Particularly lacking is knowledge of policy options and strategies for promoting the child’s holistic development with limited resources. 1.1.2. In this context, UNESCO launched, as part of its 2004-05 planning, the UNESCO/OECD Early Childhood Policy Review Project (the Project, hereafter). The purpose is to provide selected countries with an opportunity to review their early childhood policies and identify concrete options and strategies for improvement. Four countries were selected on the basis of their expressed interest – Brazil, Indonesia, Kazakhstan and Kenya. The present review was conducted as part of Kazakhstan’s participation in the Project, which is being implemented in collaboration with OECD. 1.1.3. Activity: Each country review involves the preparation of a Background Report containing baseline information on the country’s situation in early childhood care and education, a Review Visit conducted by a Review Team, and a Review Report containing specific policy recommendations. The Review Report is to be presented to national authorities and stakeholders for discussion and follow-up. The concerned UNESCO Field Office also organises satellite activities for capacity building or for wider dissemination of the review results. At the global level, the results of the four countries’ review processes will be published as a Synthesis Report and an Executive Summary, which will serve as policy reference materials for early childhood education planning in other countries. 1.1.4. Implementation structure: The overall planning and coordination of the Project is the responsibility of the Project Secretariat set up at the UNESCO Headquarters. For implementation at the national level, a Country Task Force was set up in the education ministry, which signed a memorandum of understanding with UNESCO. The Country Task Force, joined and assisted by the concerned UNESCO Field Office, is responsible for preparing the Background Report, and it represents the national authority to which the Review Report is submitted.1 1.1.5. Review framework: The Project concerns five categories of policy issues: access, quality, resource, government coordination and data/research development. But assuming that these policy issues will manifest themselves differently in individual countries, consideration is also given to country-specific issues; and highlights of the review vary depending on the country’s specific situation and needs. Reviewed services include formal, non-formal and informal early childhood services catering for children from birth to the age of entry into primary school. Services for parents are also included. 1.2. Review Visit in Kazakhstan 1.2.1. Preparation: Prior to the Review Visit, the Country Task Force set up in the Ministry of Education and Science (MOES) prepared the Background Report of Kazakhstan2 and submitted it to
1 For details, see the Implementation Guidelines for the UNESCO/OECD Early Childhood Policy Review Project, of which a copy can be obtained from UNESCO-Headquarters ([email protected]). 2 The full title of the Background Report prepared for the review in Kazakhstan is Background Report of Kazakhstan for the UNESCO/OECD Early Childhood Policy Review Project: The Status of Preschool Education in the Republic of Kazakhstan (2004), and will be referred to as “Background Report of Kazakhstan” throughout this Report. A copy of the Report may be obtained from UNESCO ([email protected]).
9
UNESCO. In selecting the visit sites, differences in socio-economic strata, regional balance, age groups, ethnicity/religion and policy implications were taken into account. 1.2.2. Schedule: The Review Visit took place from 4 to 10 October 2004 in Astana City, Almaty City, Kostanai Oblast (region) and Karaganda Oblast. Sites included public and private Kindergartens, Nursery-Kindergartens, Kindergarten-School Complexes, school and women’s gymnasiums, in-service training institutes, pedagogical colleges and university.3 1.2.3. The Review Team also met with various government authorities responsible for the planning and implementation of early childhood policies in Kazakhstan, such as representatives of the MOES and Oblast/City government authorities. Meetings were also held with other national stakeholders such as academics, teachers and other professionals, NGOs and parents. 1.2.4. Review Team: The Review Team consisted of two national and three international experts from different areas of specialisation: Gaukhar A. Saimassaeva (Chief Specialist of Preschool Education, Secondary Education Department, MOES, Kazakhstan), Nina L. Tataurova (Specialist, Semipalatinsk Pedagogical Institute, Kazakhstan), Judith Harwin (Professor, Brunel University, U.K.), Jan Van Ravens (UNESCO, Paris), and Soo-Hyang Choi (UNESCO, Paris). The team was accompanied and assisted by Yoshie Kaga (UNESCO, Paris) and Bakhtiyar Ospanbayev (UNESCO, Almaty).4 1.3. The Review Report 1.3.1. The Review Report was prepared on the basis of the observation notes submitted by the members of the Review Team and the information provided in the Background Report. Efforts were made to highlight key issues that deserve the government’s immediate attention, rather than inventorying all the observations. Detailed analyses were made for some of the critical issues for which relevant data are available. Recommendations centre on global policy and specific key tasks that need to be undertaken with priority. 1.3.2. The following assumptions guided the review process and the formulation of the recommendations. First, the ultimate purpose of early childhood care and education is the child’s holistic development. The child’s preparation for formal schooling is viewed as an integral part of holistic development, not as an isolated objective. Second, Government policy on early childhood should be affirmatively pro-poor, addressing the issue of inequity as a priority. Third, early childhood care and education lays the foundation for lifelong learning, and the transitions from home to early childhood services and from early childhood services to schools must be smooth. 1.3.3. In Kazakhstan, the MOES is the main ministry responsible for early childhood. Yet, there are social and health sectors involved in activities that concern the care and education of young children. In this review, the activities of the non-education ministries have not been covered as much as they should have been. Recommendations have thus been skewed towards the education sector. Also, given the vast land size of the country, not having been able to visit many Oblasts has also been a constraint in developing a more comprehensive picture of the country’s preschool education system.
3 See Annex 1 for details. 4 See Annex 2 for details.

10
2. COUNTRY PROFILE5 2.1. Socio-Economic Profile 2.1.1. Demography: Kazakhstan, the world’s ninth largest country, has a population of 15 million, 25% of whom are under 15. Its population size has been very stable in the last 20 years; a mere 0.3% increase is projected for 2002-15. Its fertility rate has also been declining, and stood at 1.8 births per woman in 2002.6 2.1.2. Ethnicity: Kazakhstan is home to more than 100 ethnic groups. Kazakhs are the main ethnic group, comprising 56% of the total population, while Russians are the second largest ethnic group (28%). The other major groups are Ukrainians (3.3%), Uzbeks (2.6%), Germans (1.8%) and Tatars (1.6%).7 Kazakh, spoken by more than 52% of the population, is the State language. However, Russian, spoken by two thirds of the population, is used in everyday business and has an official status under the Constitution.8 2.1.3. Religion: Islam and Russian Orthodox are the two main religions practised by 47% and 44% of the population respectively.9 2.1.4. Economy:10 With a PPP gross national income per capita of US$5,630 in 2002, Kazakhstan ranks as a middle-income country. Its GDP growth of 9.8% in 2001-2002 is relatively high among the reference countries,11 whose growth rates range from -0.5% in Kyrgyzstan to 14.9% in Turkmenistan. In Kazakhstan, the services sector is the largest contributor to GDP (53%), which is similar to most of the reference countries except Kyrgyzstan and Turkmenistan. With a GINI index of 31.3 in 2001, the country does not have glaring disparities in income distribution. Moreover, less than 2% of the population fall below the poverty line of US$1 a day, and only 8.5% are living below the US$2 per day threshold. 2.1.5. Women and child development: In Kazakhstan, female participation in the labour force among women ages 15-64 showed a slight decline from 71% in 1980 to 70% in 2002. However, it is one of the highest rates among the reference countries, except Belarus, the Czech Republic and Russia, and is superior to the lower-middle-income countries’ average of 67% and the global average of 61%.12 The education of girls and women is not a problem in Kazakhstan: the literacy rate among the adult female population is nearly 100%. Nevertheless, Kazakhstan’s Gender-related Development Index ranks lower among the reference countries except Turkmenistan and Uzbekistan. 2.1.6. The proportion of female-headed households is higher in Kazakhstan (33%) compared with the reference countries as well as the project countries (i.e. Brazil, Kenya and Indonesia). Ninety-one percent of pregnant women in Kazakhstan receive prenatal care, a rate lower than the reference countries. However, skilled health staff attend almost all births in the country. Yet Kazakhstan’s maternal mortality ratio is 210 per 100,000, which is relatively high compared with the reference countries or lower middle-income countries. The under-5 mortality rate in Kazakhstan is higher than the world average and all the reference countries.13
5 See Annex 3 for a more detailed profile in comparison with other countries. 6 See Table 1 in Annex 3. 7 Kazakhstan Achievements, Issues and Prospects. A Perspective by the United Nations. (2003). Almaty: Pilot TC, Lic. 8 See http://www.kazakhembus.com/countryprofile.html for a country profile of the Republic of Kazakhstan. Embassy of Kazakhstan to the USA & Canada. 9 Ibid. 10 See Tables 2 and 3 in Annex 3. 11 These are countries selected from the region to provide Kazakhstan with a frame of reference or benchmarking. They are Belarus, Czech Republic, Hungary, Kyrgyzstan, Poland, Russia, Turkmenistan and Uzbekistan. 12 See Tables 4, 5 and 6 in Annex 3. 13 See Tables 6 and 7 in Annex 3.

11
2.2. Educational Profile 2.2.1. Education system: In Kazakhstan, the formal educational system consists of four levels: preschool education (6 years from 1+ to 5+/6+ years old), general secondary education (11 years from Grades 1-11), secondary vocational education (1-4 years) and tertiary education (4-7 years). Secondary education comprises primary education (Grades 1-4), basic (lower) secondary education (Grades 5-9), and upper secondary education (Grades 10-11). 2.2.2. One year of pre-primary education for 5+ or 6+-years-olds and secondary education are free and compulsory. Secondary education has three tracks: General secondary schools, primary vocational schools and secondary vocational schools. 2.2.3. In 1997, the Kazakhstan 2030 Strategic Programme Priorities adopted education as a priority area. The Education Law was adopted in 1999, and four Presidential Decrees and a series of Government Resolutions have since been adopted to implement the law. All aspects of education, from preschool to higher education, are viewed from the perspective of lifelong learning. Kazakhstan places priority on improving educational services in rural areas. 2.2.4. Literacy: The youth and adult literacy rates in Kazakhstan, for both males and females, are almost 100%, much higher than the world average.14 2.2.5. Participation in education: Net enrolment ratios in primary education (Grades 1-4) and in basic and upper secondary education (Grades 5-11) were 89.5% and 84.1% respectively in 2001. 15 According to the statistics of the MOES, gross enrolment ratios in primary and secondary in 2004 were 99.9%. Kazakhstan’s gross enrolment ratio in preschool education was 20.7% for children ages 1+-6+ in 2004; however, for children ages 5+ and 6+, the ratio was much higher at 66% in 2004, according to the MOES statistics. In pre-primary, primary and secondary education, Kazakhstan has relatively low percentages of private enrolment compared with the global rate and the project countries.16 2.2.6. Educational financing: Kazakhstan’s expenditure on education equals 4.4% of GDP, which is higher than the world average and close to the average for upper-middle income countries. However, Belarus, Hungary and Poland spend proportionately more at 6.0%, 4.9% and 5.0%, respectively.17 As for preschool education, spending in Kazakhstan amounted to 3.0% of the total education expenditure in 2003.18 2.2.7. The state is the primary provider of education, while the private sector still plays an insignificant role. Although private education is increasing steadily, the sector accounted for only 12.8% of preschool educational establishments in 2004, taking in only 8.7% of all preschool children. 2.2.8. Achievement of EFA goals: Kazakhstan’s EFA Development Index (EDI) – the arithmetical mean value of the net enrolment rate in primary education, the adult literacy rate, the gender equality index and the survival rate to Grade 5 – is 0.95619 (2001), for the 39th highest ranking among 127 countries (Figure 1). The scores of the four individual constituents of Kazakhstan’s EDI are as follows: 67 for net enrolment rate (NER) in primary education, an adult literacy rate of 22, a Gender Equality Index of 10, and a survival rate to Grade 5 of 52. The weakest constituents are the NER in primary education and survival rate to Grade 5, both of which are linked directly to the provision of early childhood care and education.
14 See Table 8 in Annex 3. 15 See Table 9 in Annex 3. 16 See Table 10 in Annex 3. 17 See Table 11 in Annex 3. 18 MOES statistics. 19 The EDI value falls between 0 and 1. The closer a country’s EDI is to 1, the nearer it is to achieving EFA overall.
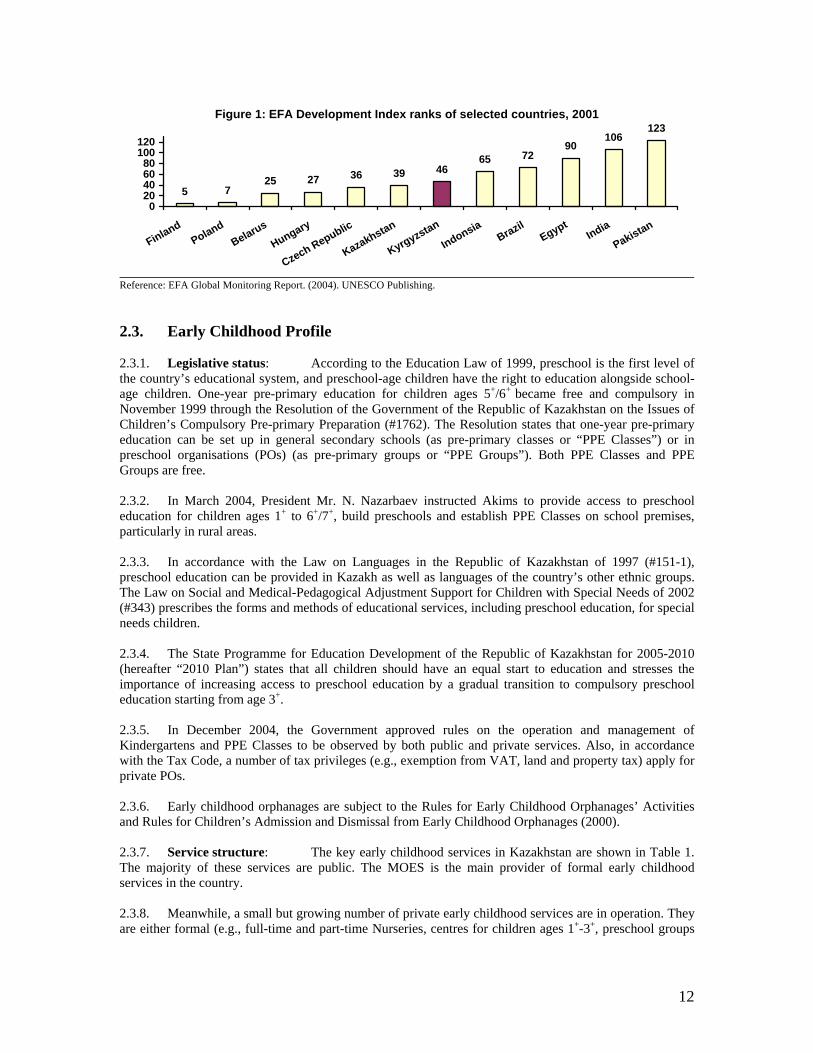
12
Figure 1: EFA Development Index ranks of selected countries, 2001
5 725 27 36 39 46
65 7290
106123
020406080
100120
FinlandPoland
Belarus
Hungary
Czech Republic
Kazakhstan
Kyrgyzstan
IndonsiaBrazil
EgyptIndia
Pakistan
Reference: EFA Global Monitoring Report. (2004). UNESCO Publishing. 2.3. Early Childhood Profile 2.3.1. Legislative status: According to the Education Law of 1999, preschool is the first level of the country’s educational system, and preschool-age children have the right to education alongside school-age children. One-year pre-primary education for children ages 5+/6+ became free and compulsory in November 1999 through the Resolution of the Government of the Republic of Kazakhstan on the Issues of Children’s Compulsory Pre-primary Preparation (#1762). The Resolution states that one-year pre-primary education can be set up in general secondary schools (as pre-primary classes or “PPE Classes”) or in preschool organisations (POs) (as pre-primary groups or “PPE Groups”). Both PPE Classes and PPE Groups are free. 2.3.2. In March 2004, President Mr. N. Nazarbaev instructed Akims to provide access to preschool education for children ages 1+ to 6+/7+, build preschools and establish PPE Classes on school premises, particularly in rural areas. 2.3.3. In accordance with the Law on Languages in the Republic of Kazakhstan of 1997 (#151-1), preschool education can be provided in Kazakh as well as languages of the country’s other ethnic groups. The Law on Social and Medical-Pedagogical Adjustment Support for Children with Special Needs of 2002 (#343) prescribes the forms and methods of educational services, including preschool education, for special needs children. 2.3.4. The State Programme for Education Development of the Republic of Kazakhstan for 2005-2010 (hereafter “2010 Plan”) states that all children should have an equal start to education and stresses the importance of increasing access to preschool education by a gradual transition to compulsory preschool education starting from age 3+. 2.3.5. In December 2004, the Government approved rules on the operation and management of Kindergartens and PPE Classes to be observed by both public and private services. Also, in accordance with the Tax Code, a number of tax privileges (e.g., exemption from VAT, land and property tax) apply for private POs. 2.3.6. Early childhood orphanages are subject to the Rules for Early Childhood Orphanages’ Activities and Rules for Children’s Admission and Dismissal from Early Childhood Orphanages (2000). 2.3.7. Service structure: The key early childhood services in Kazakhstan are shown in Table 1. The majority of these services are public. The MOES is the main provider of formal early childhood services in the country. 2.3.8. Meanwhile, a small but growing number of private early childhood services are in operation. They are either formal (e.g., full-time and part-time Nurseries, centres for children ages 1+-3+, preschool groups

13
for children ages 1+-6+/7+ in Kindergarten-Schools) or informal (e.g., babysitters, nanny services). The MOES monitors the former but does not finance them. Table 1: Early childhood service structure in Kazakhstan
Preschool Network
Preschool Organisations (POs) Under MOES and Oblast education departments
Nursery 1+-3+ years
Kindergarten (KG) 3+-5+/6+ years
Pre-primary Education 5+/6+ years
Orphanages Under MOH and Oblast health
departments
Nursery 1+-3+ (10 hours per day)
KG 3+-5+/6+ (10 hours per day) Nursery-KG 1+-5+/6+ (10 hours per day) KG-School Complex 1+-10+ (10 hours per day) Mini Preschool Centres20 (Mini KG, Home KG are forms of Mini Preschool Centres) 3+-5+/6+
• Shorter hours (2 hours per day) and flexible
• Can be mixed age group • Setting can be in KG,
secondary school, home (e.g., teacher’s apartment)
Kinderdorf (children’s village, serving young children in orphanages) 4+-7+ (24 hours per day)
PPE Classes in secondary school 5+/6+ (4 hours per day; attendance for one year) PPE Groups in KG 5+/6+ (10 hours per day; attendance for one year)
Early Childhood Orphanages0+-3+ (24 hours per day)
2.3.9. Teachers’ qualifications: The two routes to becoming a qualified preschool teacher are either five years of pre-service training in a pedagogical institute or university, or two or three years of pre-service training in a pedagogical college. Graduates from the former can work in any preschool or tier of secondary school, while those from the latter can work only in preschools or at primary level (i.e. Grades 1-4). 2.3.10. Ministerial auspices: Under the Education Law, the MOES is responsible for policy development and provision of preschool education. It also regulates and inspects private POs, including services provided by NGOs. At the central level, one preschool education specialist in the Secondary Education Department provides all administrative, policy and technical assistance on preschool education matters to the government, regional authorities and other stakeholders. 2.3.11. The Ministry of Labour and Social Protection is in charge of the rehabilitation of children with disabilities under the Law on Social Protection of Invalids. It also finances and administers support programmes for low-income families under the Law on State Targeted Social Support of 2001. The Ministry of Health develops a policy of basic health services to be provided to children and their mothers,
20 The curriculum for Mini Preschool Centres differs from KGs’ because the latter have longer opening hours and are organised by single-age groups.
14
undertakes initiatives for early detection of risk groups in cooperation with Oblast education departments, and manages the system of early childhood orphanages.21 2.3.12. Coordination Mechanisms: No coordination mechanism for early childhood exists at the national level. However, a preschool education support plan “We Go to Kindergarten”, currently under consideration, 22 addresses this gap and recommends the establishment of an Interagency Council for Preschool Education and Training, with representatives from the concerned ministries, sectors and local bodies as well as civil society (including parents and people with disabilities). The functions of this council may include development of national policies, legislation, financial strategies and analysis and coordination of all activities related to preschool education at the state level. 2.3.13. At the local level (i.e., Oblast, City, and Rayon or district), Interagency Committees are suggested to be set up under the leadership of the Deputy Akim, who looks after social issues. The Committee will consist of representatives from education, social protection, finance, health care, sports, internal affairs organisations and departments, civil society, associations of invalids, people with special needs and parents. It will coordinate all types and forms of preschool education at the local level and evaluate regional interagency cooperation. In line with the Plan 2010, all Oblast and Rayon education offices will be provided with preschool education specialists to ensure effective coordination and pedagogical support. 2.3.14. Decentralisation Policy: Implementation of the Decentralisation Policy began in 2003, and consists of several stages. The policy involves a partial transfer of state functions, including provision of services for preschoolers, to local authorities in Oblasts, Rayons, Towns and Villages. Funding to implement the delegated responsibilities is to come partly from the local tax revenues as well as transfers from the national budget. 2.3.15. Funding: Preschool education has two sources of public funding, national and local (the budgets of Oblasts and Rayons), the latter making up the most of its funding. The training and a part of the re-training of preschool teaching staff are funded by the national budget. While the central government determines spending priorities, the national budget is decentralised to the Oblast and Rayon levels; the amount the Oblasts and Rayons receive varies according to the local situation (e.g., number of preschool-age children, level of income tax revenue). Budget disputes between national and local governments are moderated by the National Budget Commission, which also approves the Government’s expenditure priorities. Parental contributions are another important financing source. 2.3.16. EFA objective for early childhood care and education: The main objective is to expand access to preschool education, especially among the poor. Strategies to reach the objective include identifying cost-effective service models and developing partnerships with the private sector. 2.3.17. One important numerical target is to increase the coverage of preschool education to 75% by 2010, adding 2% every year. To meet this target, 21,500 places need to be set up in PPE Classes and PPE Groups, and 86 POs should be built to create 12,000 places between 2008 and 2010;23 in rural areas, 380 PPE Classes need to be set up within existing schools.24 2.3.18. Another numerical target is to provide preschool education to 30% of the children living below the poverty line (i.e. 31,000 children) between 2005 and 2007. To meet this target, 31,000 places need to be
21 However, the MOES is responsible for inspecting and monitoring the preschool education component provided in early childhood orphanages, which follow the curriculum used in mainstream preschool establishments. 22 The plan is expected to be adopted by the Government in the fourth quarter of 2006. 23 A preliminary estimate shows that creation of these places will cost KZT 7 billion (KZT 4.8 billion for construction, 1.8 billion KZT for equipment and 0.39 billion KZT for maintenance). 24 A preliminary estimate shows that the cost will be KZT 1.5 billion (KZT 1.2 billion for equipment and KZT 0.3 billion for maintenance).

15
created in POs and Mini Preschool Centres and 11,000 places in 78 new Kindergartens.25 In rural areas, 800 Mini Preschool Centres have to be built in school buildings to cater for 20,000 target children.26 3. REVIEW RESULTS 3.1. Access 3.1.1. Progress: Preschool education in Kazakhstan reached a peak in 1991, when the enrolment rate of children up to age 7+ in POs was 47% and that of 6+-year-olds was 74%, with a total of 8,743 POs operating in the country. 3.1.2. With a transition process that started in 1991, however, many Kindergartens were closed, along with the cooperatives to which they were attached. By 1999 the preschool network declined by about 80%. The enrolment rates of 0+-7+ years in POs dropped to 10%, with only 1,158 POs operating in the country. 3.1.3. But as the economy began to improve in 1999, the Government began taking major initiatives to revamp the system. Under the 1999 Education Law, preschool education was recognised as part of the education system, allowing the MOES and local authorities to include preschool education in its educational planning and budget. 3.1.4. More important, with the 1999 Government Resolution on the Issues of Compulsory Pre-Primary Preparation, the Government universalised one-year free compulsory pre-primary education for 5+- and 6+-year-olds. A new Preschool Education Law is being drafted, and the Government is planning to extend the universal provision to all children over 3+ years by 2010. 3.1.5. The policy derives from strong political will. In 2004, President Nazarbayev announced in his annual address that restoring the preschool education system was one of the country’s educational priorities, and he urged local governments to take the necessary steps. 3.1.6. Thanks to the Government’s commitment and valid policy planning, the country’s preschool network is being restored. As shown in Figure 2, the enrolment rates of children ages 0+-7+ in POs grew by 103% from 10.2% in 1999 to 20.7% in 2004. For 5+- and 6+-year-olds, enrolment in pre-primary education in 2004 rose to 66%, a 230% increase from 1999.
Figure 2: Enrolment rate of children ages 0+- 7+ years* in POs and ages 5+- 6+
years in pre-primary education,** 1999-2004
19 20.7
63 66
18.6151210
20
626256
020406080
1999 2000 2001 2002 2003 2004
0+-7+yrs in POs
5+-6+ yrs in PPE
Reference: MOES Statistics (ДΒиО-8, 2000; ДΒиО-6, 2001, 2002; ДΒ-1, ДΒ-10, ДΒиО-1, ДΒиО-8, 1999, 2003, 2004). * 2003 and 2004 data are for 1+-6+-year-olds; ** Participation in primary schools not included. 3.1.7. All Oblasts have shown progress (Figure 3), but regional gaps in preschool enrolment remain significant. In Astana City, the enrolment rate of children ages 1+–6+ years stood at 40.6% in 2004, whereas in Almatinskaya it was only 5.4%.
25 A preliminary estimate shows that creation of these places requires a total of KZT 66 billion (KZT 4.5 billion for construction, KZT 1.7 billion for equipment and KZT 360 million for maintenance). 26 A preliminary estimate shows that this will cost KZT 3.1 billion including the costs of equipment (KZT 2.5 billion) and maintenance (KZT 600 million).

16
Figure 3: Enrolment rate of children ages 0+- 7+ years in POs by Oblasts, 2000 and 2004*
4
1410
58
13197
4
28
6
17
96
12
26
14
35.1
28.2
15.521.3
31.6
21.919.9
10
35.7
16
24.8
13.15.4
20.7
40.6
23.2
40.2
05
1015202530354045
Akmolinskaya
Aktyubinskaya
Almatin
skaya
Atyrauskaya
E-Kaza
kh
Zhambylskaya
W-K
azakh
Karagandinskaya
Kyzylord
inskaya
Kostanaiskaya
Mangistauskaya
Pavlodarskaya
N-Kaza
kh
S-Kaza
kh
Almaty C
ity
Astana City
National
2000
2004
Reference: MOES Statistics (ДΒиО-1, 2000; ДΒ-1, 2004). * 2004 data are for 1+-6+-year-olds. 3.1.8. Within Oblasts, an equally significant urban/rural gap appears (Figure 4): The average urban enrolment rate stands at 32.9%, as opposed to 5.6% in rural areas in 2004.
Figure 4: Enrolment rate of children ages 1+- 6+ years in POs in urban and rural areas by Oblasts, 2004
32.9
12.3
35.525.5
36.6
59.1
28.3
41.5
17
41.347.8
27.434.539.7
26.433.2 40.6
1.3
11.68.5
8.5
5.62.95.97.83.26.1310.5
8.14.9
21.2
010203040506070
Akmolin
aska
ya
Aktyu
binsk
aya
Almat
insk
aya
Atyra
uskay
a
E-Kaz
akh
Zhambyls
kaya
W-K
azak
h
Karag
andin
skay
a
Kyzylo
rdin
skay
a
Kostan
aiska
ya
Mangist
ausk
aya
Pavlo
darsk
aya
N-Kaz
akh
S-Kaz
akh
Almat
y City
Astan
a City
Natio
nal
UrbanRural
Reference: MOES Statistics (ДΒ-1, 2004). 3.1.9. Various measures have been developed to address these regional gaps. Disadvantaged areas have been prioritised for government support and subsidies. When the Step-by-Step programme27 was first introduced, Kindergartens in poor areas were given priority. South Kazakhstan, showing the second lowest enrolment rate (10% in 2004) and faced with problems concerning migrant children, for instance, has been identified as a priority Oblast for government support. It is planning to expand POs by 100%, far beyond the national target of 34%. 3.1.10. As for the urban/rural gap, the government strategy has been to introduce alternative cost-effective service models such as the Mini Preschool Centres. More and more of these have been set up over the last four years. For example, the number of Mini Preschool Centres has increased from 106 in 2003 to 117 in 2004, and the proportion of them in rural areas rose from 48% in 2003 to 57% in 2004 (Figure 5).
27 Introduced in 1992, the Step-by-Step programme is run by the International Step-by-Step Association, and aims at promoting children’s personality development, parental and community involvement and inclusive education for children with special needs in early childhood services.

17
Figure 5: Distribution of Mini Preschool Centres by urban/rural areas, 2003-2004
43
52
57
48
0% 10% 20% 30% 40% 50% 60% 70% 80% 90% 100%
2003
2004
Urban
Rural
Reference: MOES Statistics (ДΒ-51, 2003, 2004). 3.1.11. Although enrolment in rural areas is still much lower than in urban areas, the increase of enrolment rate for children ages 0+-7+ in rural areas was 180% over the last five years, compared with 94% in urban areas (Figure 6).
Figure 6: Enrolment rate of children ages 0+- 7+ years in POs by urban/rural areas, 2000-2004
17
26
30
32
32.95.6
4.5
4.8
3
2
0 5 10 15 20 25 30 35
2000
2001
2002
2003
2004
Urban
Rural
Reference: MOES Statistics (ДΒиО-1, 2000, 2001, 2002; ДΒ-1, 2003). 3.1.12. The half-day PPE Classes were devised to target rural children who did not go to Kindergartens and did not have the opportunity to prepare for formal schooling. The enrolment rate of rural children in PPE Classes grew steadily from 48.4% in 2001 to 56.7% in 2004 (Figure 7).
Figure 7: Enrolment rate of rural children ages 5+ - 6+ years in PPE Class, 2001-2004
56.754.648.4
4045505560
2001 2002 2004
Reference: MOES Statistics (ДΒиО-41, 2001, 2004; ДΒиО-10, 2002). 3.1.13. Higher enrolment in preschool education in rural areas is attributed to the increased number of POs. The percentage of POs in rural areas grew by 20%, from 22% in 2000 to 26.5% in 2004, whereas the urban share shrank by about 6% from 78% in 2000 to 73.4% in 2004 (Figure 8).

18
Figure 8: Distribution of POs by urban/rural areas, 2000-2004
78
73.4
22
26.5
0% 10% 20% 30% 40% 50% 60% 70% 80% 90% 100%
2000
2004
Urban
Rural
Reference: MOES Statistics (ДΒиО-1, 2000 and 2004). 3.1.14. The MOES has stressed efforts to prioritise rural areas. Figure 9 shows that rural POs as a percentage of total POs under the auspices of the MOES grew steadily over the last four years, from 20% in 2000 to 27.1% in 2004. But this has not been the case with POs under the auspices of other ministries and enterprises: the percentage of their rural POs actually declined during the same period, from 22% to 17.1%.
Figure 9: Rural POs, as a % of the total POs under MOES and as a % of the total POs under other ministries and enterprises, 2000-2004
20 222328
25 2725
16
27.1
17.1
0
10
20
30
MOES Other Ministries & Enterprises
2000
2001
2002
2003
2004
Reference: MOES Statistics (ДΒиО-16, 2000, 2001, 2002; ДΒ-17, 2003; ДΒиО-17, 2000, 2001, 2002; ДΒ-18, 2003 and 2004). 3.1.15. Inequities among Oblasts: Despite an impressive recovery from the transition period, and especially the Government’s efforts to close regional gaps, inequitable access to preschool education across different Oblasts remains a cause for concern. 3.1.16. For the purpose of comparison, the five Oblasts with the lowest enrolment rates of children ages 1+ to 6+ in POs (2004) – Almatinskaya, Zhambylskaya, Kyzylordinskaya, North Kazakhstan and South Kazakhstan – are grouped as the L-5 Oblasts, and the five with the highest enrolment rates – Atyrauskaya, Karagandinskaya, Pavlodarskaya, Almaty City and Astana City – are the H-5 Oblasts. The average enrolment rate of children ages 1+-6+ in L-5 Oblasts is 12%, as opposed to 36.6% in H-5 Oblasts (2004) (Figure 10).

19
Figure 10: Enrolment rate of children ages 1+- 6+ in POs in L-5/H-5 Oblasts, 2004
40.640.235.7 36.631.6
1210
1615.5
5.4
35.1
13.120.7
01020304050
Almat
insk
aya
Zhambyls
kaya
Kyzylo
rdin
skay
a
N-Kaz
akh
S-Kaz
akh
L-5 M
ean
Atyra
uskay
a
Karag
andin
skay
a
Pavlo
darsk
aya
Almat
y City
Astan
a City
H-5 M
ean
national
Reference: MOES Statistics (ДΒ-1, 2004).
3.1.17. The L-5 Oblasts are poorer than the H-5 Oblasts. Without North Kazakhstan, the mean poverty level of the L-5 Oblasts, measured in terms of the percentage of population with incomes below subsistence level stood at 41% as opposed to 12% in the H-5 Oblasts without Atyrauskaya in 2001 (Figure 11).
Figure 11: Percentage of population with income below the subsistence minimum level in L-5/H-5 Oblasts, 2001
3948
39
10
38 41
2316
6 20102030405060
Almat
insk
aya
Zhambyls
kaya
Kyzylo
rdin
skay
a
N-Kaz
akh
S-Kaz
akh
Atyra
uskay
a
Karag
andin
skay
a
Pavlo
darsk
aya
Almat
y City
Astan
a City
Reference: Kazakhstan: Achievements, Issues and Prospects. A Perspective by the UN. (2003). United Nations. 3.1.18. The L-5 Oblasts are home to 66% of Kazakhstan’s women with four or more under-age children who are receiving welfare subsidies, a clear indicator of poverty (Figure 12). By comparison, only 13% of such mothers live in the H-5 Oblasts.
Figure 12: Distribution of women with many children and on welfare subsidies by L-5, H-5 and other Oblasts, 2003
Other Oblasts21%
L-5 Oblasts66%
H-5 Oblasts13%
Reference: Women and Men of Kazakhstan: Gender Statistics. (2004). Agency of Statistics, Republic of Kazakhstan. 3.1.19. The L-5 and H-5 Oblasts reflect a mismatch of supply and demand when it comes to preschool education (Figure 13). L-5 Oblasts have 47.6% of the child population under 7+, but their share of POs and

20
PO teachers is only 26% and 23.8%, respectively, of the total. On the other hand, the H-5 Oblasts, which have 23.9% of the child cohort, are home to 40.9% of POs and 50% of the country’s PO teachers.
Figure 13: 0+- 7+ population, POs and PO teachers in L-5/H-5 Oblasts, as a % of the totals, 2004
47.6
23.926
40.9
23.8
50
0102030405060
L-5 Oblasts H-5 Oblasts
Population
POs
PO teachers
Reference: MOES Statistics (ДΒ-1, - 2, - 13, 2004). 3.1.20. The enrolment gap between L-5 and H-5 Oblasts is far more pronounced with younger children. One-fourth of three-year-olds in the H-5 Oblasts are enrolled in POs, while the figure for the L-5 Oblasts is only 7% (Figure 14). The gap closes gradually with the age of the child. The fact that the enrolment of 6+-year-olds in primary education is somewhat higher in the L-5 Oblasts suggests a sudden injection of children into primary education.
Figure 14: Enrolment rate of children ages 3+ to 6+ years in POs, PPE and PE in L-5/H-5 Oblasts, 2003
7 8
3648
3425 30
68 64
32
0
20
40
60
80
3+ yrs in POs 4+ yrs in POs 5+ yrs in PPE 6+ yrs in PPE 6+ yrs in PE
L-5 Oblasts
H-5 Oblasts
Reference: MOES Statistics (ДΒ-10, 2003). 3.1.21. Meanwhile, L-5 Oblasts show a soaring 350% more five-year-olds enrolled (36%) than four-year-olds (8%) (Figure 14). The difference in the H-5 Oblasts is only 127%, between 30% and 68%. The implication is that children in the L-5 Oblasts get a “jump-start” at the age of 5+ into free pre-primary education. 3.1.22. Moreover, children in the L-5 Oblasts are more likely to attend half-day PPE Classes set up in secondary schools than all-day PPE Groups set up in Kindergartens (Figure 15). For them, the 32-week crash PPE Classes are more or less their first and last encounter with preschool education. Their participation in preschool education starts late and finishes early, making their progression in preschool education abrupt and short. They are also slightly more likely to be enrolled in primary schools at the age of 6+ – 34% as opposed to 32% of H-5 Oblasts.

21
Figure 15: Enrolment of children ages 5+- 7+ in pre-primary and primary education in L-5 and H-5 Oblasts, 2003
9
423424
34 32
99 99
020406080
100120
L-5 Oblasts H-5 Oblasts
5/6+ yrs in PPE Group
5/6+ yrs in PPE Class
6+ yrs in PE
7+ yrs in PE
Reference: MOES Statistics (ДΒ-10, 2003). 3.1.23. Meanwhile, in the H-5 Oblasts, preschool education not only starts early but also tends to be continuous. Unlike their counterparts in the L-5 Oblasts, children in the H-5 Oblasts are likely to continue their pre-primary education in the Kindergarten setting through all-day PPE Groups. Their progression in preschool education is thus evolutionary in character. 3.1.24. Mirroring these differing patterns of progression in preschool education in the two groups of Oblasts, 42% of schools are with PPE Classes in L-5 Oblasts, as opposed to 16% in H-5 Oblasts (Figure 16). On the other hand, 44% of POs with PPE Groups are found in H-5 Oblasts, as opposed to 18% in L-5 Oblasts.
Figure 16: Schools with PPE Class and POs with PPE Group in L-5/H-5 Oblasts, as a % of totals, 2003
42
1816
44
01020304050
Schools with PPE Class POs with PPE Group
L-5 Oblasts
H-5 Oblasts
Reference: MOES Statistics (ДΒ-43, 2003). 3.1.25. Inequity between urban and rural areas: As with the regional gap among Oblasts, the gap between urban and rural areas is also qualitative as well as quantitative. 3.1.26. First, mirroring the regional difference among Oblasts (Figure 13) is a mismatch of supply and demand for preschool education in urban and rural areas. In terms of population ages 0+-7+, rural areas have a slightly larger population (51%), but their share of POs is only one-third of that enjoyed by urban areas (Figure 17).
22
Figure 17: Distribution of population ages 0+- 7+ and of POs by urban/rural areas, 2003
49 5175
25
0
50
100
Urban Rural
0+-7+ population
POs
Reference: MOES Statistics (ДΒ-10, ДВиO-11, 2003). 3.1.27. Second, although more small-size POs are found in rural areas,28 they tend to be more compact than their urban counterparts. As shown in Figure 18, 48% of small-size POs in urban areas have three groups; only 18% have just one group. In rural areas, only 20% of small-size POs have three groups, while 46% have only one group.
Figure 18: Urban/rural distribution of small-size POs, 2003
1846
34
3448
20
0%20%40%60%80%
100%
Urban Rural
3 groups
2 groups
1 group
Reference: MOES Statistics (ДΒ-34, 2003). 3.1.28. The availability of more groups can translate not only into more classes, but also into less mixing of age groups. It may be worthwhile to examine if there is any quality difference between rural and urban small-size POs. 3.1.29. Most important, mirroring the regional difference between L-5 and H-5 Oblasts (Figures 14 and 15) is a major and striking difference between urban and rural areas in the way in which children progress through different stages of preschool education. 3.1.30. First, there is a huge urban/rural gap with regard to 4+-year-olds’ participation in POs (Figure 19). Urban children are six times more likely to be enrolled in POs at the age of 4+ than their rural counterparts.
28 “Small-size” POs have 1-3 groups of children while normal POs have 6-8 groups of children. The former came into being after the fees for POs were raised and some parents were no longer able to afford sending their children to POs. The enrolments in POs were thereby decreased, obliging them to have fewer groups of children than in normal POs.
23
Figure 19: Enrolment of children ages 4+- 6+ years in preschool education in urban/rural areas, 2003
28
4
39
414
3333
2
26
52
0102030405060
Urban children Rural children
4+ yr in PO
5+ yr in PPE Group
5+ yr in PPE Class
6+ yr in PPE Group
6+ yr in PPE Class
Reference: MOES Statistics (ДΒ-10, 11, 2003). 3.1.31. However, rural children show a sharp increase in enrolment at the age of 5+ for pre-primary education (Figure 19), especially in PPE Classes. As with children in L-5 Oblasts, this signifies a jump-start for pre-primary education among rural children. Significantly, rural children’s participation in pre-primary education is mostly through PPE Classes, rather than PPE Groups. 3.1.32. Meanwhile in urban areas, pre-primary education is more likely to be delivered through all-day PPE Groups set up in Kindergartens (Figure 19). The regional gap in PPE Groups widens at 6+ years, with 33% of urban 6+-year-olds in PPE Groups, as opposed to only 2% of their rural counterparts. In fact, urban and rural areas do not differ significantly in their overall enrolment rate of 6+-year-olds in pre-primary education, at 59% and 54% respectively. The major difference lies in the type of pre-primary education their children receive – PPE Classes in rural areas versus PPE Groups in urban areas. 3.1.33. The predominance of PPE Groups in urban areas and that of PPE Classes in rural areas has been accentuated for the last three years (Figure 20). From 2001 to 2003, urban pre-primary children’s participation in PPE Groups increased from 32% to 36%, while that in PPE Classes declined from 28% to 20%. In rural areas, the enrolment rate in PPE Groups declined, though marginally, from 4% to 3%, while that in PPE Classes increased significantly from 38% to 43%.
Figure 20: Enrolment rates of children ages 5+- 6+ in PPE Groups and PPE Classes in urban/rural areas, 2001-2003
32 28
4
3834
19
3
4236
20
3
43
01020304050
Urban PPE Group Urban PPE Class Rural PPE Group Rural PPE Class
2001
2002
2003
Reference: MOES Statistics (ДΒиО-10, 11, 2001; ДΒиО-10, 2002; ДΒ-10, ДΒиО-11, 2003). 3.1.34. Again as with the regional differences among Oblasts (Figure 14), the urban/rural gap in enrolment rates disappears as children approach formal schooling (Figure 21).

24
Figure 21: Enrolment rate of children ages 5+- 7+ years in pre-primary and primary education in urban/rural areas, 2003
53 59
29
1
98
3854
35
2
97
020406080
100
5+ yr in PPE 6+ yr in PPE 6+ yr in PE 7+ yr in PPE 7+ yr in PE
Urban
Rural
Reference: MOES Statistics (ДΒиО-11, 2003). 3.1.35. The regional convergence at the pre-primary and primary education stages is striking in view of the wide rural/urban gap that exists at 4+ years and under (Figure 22). The urban/rural difference among younger children is of great importance, as it sets divergent paths for urban and rural children in their subsequent pursuit of pre-primary education.
Figure 22: Enrolment rate of children ages 1+- 4+ years in POs in urban/rural areas, 2003
1
14
2428
0 2 4 4
0
10
20
30
1+ yr 2+ yr 3+ yr 4+ yr
Urban
Rural
Reference: MOES Statistics (ДΒ-10, ДΒиО-11, 2003). 3.1.36. Recommendations: Research has shown that early childhood care and education benefits disadvantaged children far more than children of well-to-do families, who have a head start at home, leaving relatively less room for benefits to be reaped from attending early childhood services. Poor children, on the other hand, tend to lack an optimal learning and development environment at home to begin with. What they receive and experience in early childhood services, if they have access to them, is often crucial input into their early development and learning. The potential for early childhood services to make a difference is greater for children from disadvantaged backgrounds. Accordingly, the return on investment in early childhood is maximised through an affirmatively pro-poor policy. 3.1.37. Two measures would help make Kazakhstan’s policy on preschool education more pro-poor and increase the educational, social and economic benefits of investing in preschool education. 3.1.38. First, the implementation strategy for the universal provision of one year of pre-primary education needs review. Under the policy, all 5+/6+-year-olds are entitled to one year of free pre-primary education. But the regions are not equally capable of implementing this policy. In disadvantaged areas, the preschool network is far less developed, the demand for preschool education is lower29 and resources are less readily available. 29 Despite the lower enrolment rate in L-5 Oblasts, H-5 Oblasts have a larger share (36%) of the total number of children on a waiting list than L-5 Oblasts (30%). Research is needed into the reasons why children are not attending kindergartens, especially in disadvantaged areas. A high fee is certainly an obstacle for many, but mothers’ availability at home is often a major factor behind children staying at home. Expressing demand for preschool education is important because it motivates stakeholders to carry out the necessary actions. In this regard, one problem with disadvantaged areas is the low expression of demand for preschool education. Expressing the demand more explicitly and convincingly will help mobilise local stakeholders.

25
3.1.39. As a result, advantaged areas are advancing far ahead of disadvantaged areas, reaping the benefits of the policy. In Astana, some PPE Classes are attended by upper-middle-class children who did not go to Kindergarten either because they had nannies or private tutors at home or because their mothers did not have to work and stayed home. Given the higher set-up cost of PPE Groups30 and their prevalence in advantaged areas, a large portion of resources for pre-primary education may be inadvertently being invested in advantaged areas. 3.1.40. The provision of one year of free pre-primary education must first and foremost be universalised among the disadvantaged; this should be a firm policy. Once access is universalised, further assistance could be extended to the advantaged. But until then, government subsidies for pre-primary education must be distributed with affirmative discrimination, strictly favouring the disadvantaged. The same implementation strategy should be applied if the entitlement is extended to children over three, as called for in a proposed new preschool education law. 3.1.41. More important, the distribution of normal Kindergartens must be subject to a more affirmative pro-poor policy. Under the 2010 Plan, the Government foresees 164 new Kindergartens, the core service to the country’s preschool education; but 52% of them will be in urban areas, which already have 75% of the country’s POs. Meanwhile, rural areas are to obtain 800 Mini Preschool Centres, plus 12% more PPE Classes. Though new Kindergartens are to be built at 227 secondary schools in rural areas, one can see that the expansion of preschool education in rural areas is planned mainly through alternative services. 3.1.42. Alternative services, especially PPE Classes, help bridge the gap between rural and urban children in their preparation for formal schooling. But they do not help correct the more fundamental difference between urban and rural children – namely that disadvantaged children have inequitable access to a seamless learning path from earlier years and a seamless transition from early childhood to formal schooling. Rural children still lag far behind their urban counterparts in accessing normal Kindergartens in the earlier years. 3.1.43. The normal Kindergarten is not necessarily the model for rural children. The point is that normal Kindergartens, which cost more than alternative services, tend to be the service model for the rich and enjoy support from the state,31 while the poor settle for inexpensive alternative services that result in discontinuous progression and widen regional gaps in access to preschool education that promotes the child’s holistic development. 3.1.44. Services for the poor should be affordable, but not as a trade-off with quality. If a normal Kindergarten is necessary to ensure the child’s evolutionary progression in preschool education, it should be made available, first and foremost, to the poor. This does not mean abolishing alternative services currently advocated in poor areas. On the contrary, they should be reinforced so that they become more “normal” or complete. The policy for a PPE Class should be to make it an all-day programme where disadvantaged children can make up for their lost time in holistic development while preparing themselves for formal schooling. 3.1.45. This recommendation does not hinge on the availability of resources, as in principle it is a question of distributing existing resources, no matter how large or small. If more resources are required, they should be provided by the state, as increasing fees for parents in disadvantaged areas will make the services unaffordable. Most important, the required resources must be recovered from the investment that is inadvertently channelled to the advantaged. Various financial options are available to achieve this balance (see section on Resources). 3.1.46. Eventually, the passage of a new preschool education law and universalising the provision of preschool education to children over three – assuming the earmarked resources (KZT 27 billion) are forthcoming – will certainly facilitate the Government’s effort to bridge the regional access gaps. It will
30 Five times higher than that of PPE Classes. 31 Eighty-five percent of the country’s 1,156 POs are state-owned; 75% of these state-owned POs are in urban areas.

26
help expand access for younger disadvantaged children, which will in turn help make their progression in preschool education more continuous and evolutionary. But its implementation must, again, follow the pro-poor principle – the Government policy must prioritise disadvantaged areas. 3.1.47. Summary: Overall enrolment has grown and efforts are being made to reduce regional gaps. Inequity, however, persists. Children in disadvantaged areas (i.e., the L-5 Oblasts and rural areas) tend to start preschool education late, at the pre-primary level. Their pre-primary education is likely to be delivered through PPE Classes, or short crash courses, while their counterparts in advantaged areas (i.e., the H-5 Oblasts and urban areas) benefit from an early start and an evolutionary progression in preschool education through PPE Groups. The policy of providing inexpensive alternative services to poor children should be reviewed, as these services are inferior to normal Kindergartens in terms of ensuring the child’s evolutionary progression in early childhood. 3.2. Quality 3.2.1. Progress: Research has demonstrated the importance of quality in early childhood services in order to successfully promote child development and education. Conversely, high quality childcare, particularly for children from disadvantaged backgrounds, promotes motivation, social confidence, good cognitive and linguistic development and school readiness. Quality of provision, as well as access, is therefore a crucial issue. 3.2.2. Quality has been the central concern in the provision of preschool education in Kazakhstan. There is a great emphasis on the integration of care and education and on the child’s holistic development. This can be seen in the prevalence of physical activities in Kindergarten, for example. Standard public Kindergartens have indoor physical exercise rooms; many of them even have swimming pools. Children with access to public sector Kindergartens benefit from low child/adult ratios, a well-qualified workforce and a wide-ranging programme of education and care with a wealth of opportunities for extra-curricular development, rarely available in many other countries. 3.2.3. The curriculum has been substantially revised and modernised along the principle of fostering the child’s holistic development, with a fresh focus on individual and emotional well-being as well as cognitive development. New child-friendly textbooks have been produced dealing with all aspects of the curriculum. Reflecting the input of the Step-by-Step programme, which has contributed greatly to the improvement of the quality of preschool education in Kazakhstan, increasing emphasis is placed on parental involvement, which is now recognised as an essential buttress helping to maximise the benefits of pre-schooling. 3.2.4. Special attention is paid to children with special needs. Sanatoria are the main institutional mechanism providing care for these children. Now the Government is taking a further step by trying to integrate children with special needs into normal POs. If this policy is implemented, Kazakhstan would become one of the few countries to embrace the broadest concept of inclusive education promoted by international agencies. The provision of free preschool education to children with special needs is a clear indicator of the Government’s commitment to the care and education of this disadvantaged group. Preschool data are being collected on children with special needs; their early care and education needs are monitored and reflected duly in the policy planning of preschool education. 3.2.5. The Government’s effort to improve the quality of preschool education will culminate in the planned establishment of a National Centre for Preschool Education. This flagship development has the potential to provide effective leadership in the field, as well as enhancing the prestige of preschool education and care. While engaged in research and development, the centre will also be closely linked to practice. Thus it will address the need for evidence-based practice as an underpinning for policy, service and curriculum development. It will contribute important data and insights to help fill gaps in knowledge concerning trends in preschool and their impact. 3.2.6. Challenges: Despite the great emphasis on providing quality preschool education, some gaps remain. These concern inclusion, staffing, physical infrastructure and parental involvement.

27
3.2.6.1. Inclusion: The OECD lists inclusion as an issue of quality as well as access. This is because the effective delivery of education to children in disadvantaged situations can be assured only when their particular learning needs are recognised and appropriate resources – specialised staff, physical environment and teaching methods – are deployed. Kazakhstan has made much progress in this regard, yet gaps persist. 3.2.6.2. The percentage of children age 0+-7+ years with special needs rose from 3.2% in 1999 to 4.5% in 2003. Their participation rate in POs remains relatively low at 30%. Even if they do attend a PO, they are most likely to be cared for in a specialized unit. Their integration in normal POs is relatively rare. Of the total 1,195 ordinary POs (2004), 45 are specialised and 229 POs had special needs groups.32 3.2.6.3. The following factors seem to hamper Government efforts to cater for the special needs of children with disabilities and integrate them into ordinary POs.
Buildings without the necessary aids and adaptations (e.g., ramps); No specialised transports for children with special needs; A shortage of wheelchairs to increase the mobility of children with physical impairments; A shortage of trainers and staff trained in inclusive education; A lack of attention to inclusive education in mainstream professional education and training and
in-service training; and Professional and public attitudes unfavourable to social inclusion – children with disabilities
remain stigmatised and their needs tend to be understood mainly from a medical point of view. 3.2.6.4. Orphans and other categories of children without parental care are catered for in facilities and institutions that are under the auspices of the health sector. In those facilities, they receive not only care but also education following the same educational curriculum for mainstream Kindergartens. Education authorities inspect these facilities to ensure that they meet the same quality standards as other education facilities. 3.2.6.5. However, it is important to ask whether children who have no special needs other than a lack of parental care should be deprived of access to mainstream POs. Arguably these children have particularly strong needs to mix with local children and families in the community. At present they remain one of the least integrated groups in the society. With rising rates of infant institutionalisation in Kazakhstan from a low of 123.1 per 100,000 in 1991 to 285.4 in 2001 (UNICEF 2003),33 the pool of children who stand to benefit from integrated provision is fairly substantial.34 3.2.6.6. With the collapse of industry, in some towns parental unemployment has risen, along with other related problems such as alcoholism and drug abuse among parents. NGOs and other social assistance facilities provide services to care for these parents and their children, but without forging significant partnerships with the education sector. Although data were not available on these providers, a visit to one such service highlighted the need for closer cooperation between the education and social sectors. Care staff (social workers) provided a very supportive environment for children from families affected by poverty, parental substance abuse and prostitution; but none of the staff were preschool teachers and the children had no access to the national educational preschool programme. Considerable caution should be used when extrapolating from one example, but if the case is representative, it suggests that an inter-agency planning strategy could help ensure equal focus on care and education in provision outside the education sector. 3.2.6.7. Staffing: Research shows a link between a well-qualified workforce and good outcomes for children. The current workforce profile in Kazakhstan is impressive: 39% of staff have higher
32 MOES Statistics (ДΒ-37 and ДΒ-38, 2004). 33 UNICEF (2003). Social Monitor 2003. Innocenti Research Centre. 34 Domestic – and, increasingly, international -- adoption has provided new permanent homes for only a small number of these children.

28
education degrees (of which 14% have preschool specialist education), and 53% have college diplomas (of whom 41% have preschool specialist education). 3.2.6.8. However, the gap in access to preschool education between the richest and poorest Oblast groups discussed earlier is compounded by inequitable access to qualified teachers. Seventy-seven percent of the country’s highly trained PO teachers (i.e., with higher education degrees in preschool education) are working in H-5 Oblasts, as opposed to 16% in L-5 Oblasts (Figure 23).
Figure 23: Distribution of PO teachers with higher education degrees in preschool education by L-5, H-5 and other Oblasts, 2003
H-5 Oblasts77%
Other Oblasts7% L-5 Oblasts
16%
Reference: MOES Statistics (ДΒ-13, 2003).
3.2.6.9. The Government has highlighted the need to improve programme content in the curriculum in pedagogical colleges and institutes, and it has identified some priorities. One area that needs further attention is providing opportunities to study preschool education policies and practices from a comparative perspective, across different countries, so students can gain a clear understanding of the advantages and disadvantages of Kazakhstan’s current policy, system and practices. 3.2.6.10. Another is to seek ways to coordinate and/or integrate training programmes on special needs and “normal” preschool preparation, since current administrative divisions tend to perpetuate fragmentation and separation in practice. Inclusive education in the broadest sense of the word as discussed earlier needs to receive greater priority in both basic and in-service training. 3.2.6.11. The most pressing issue is how to safeguard teaching quality in light of the large increases in the numbers and possible needs of children poised to enter the preschool education system between 2005-2010. Compared with other aspects of the 2010 Plan, the strategy for supplying well-trained staff in time for the expansion is sketchy, and apparently management data are not being collected on turnover in the next five years. 3.2.6.12. The Review Team was told that approximately 40% of the current preschool workforce is due to retire within the 2005-2010 period, and that recruitment into the profession is sluggish. Recruitment of professionals with higher-level qualifications will be slowed by the time required to complete degree-level training programmes. While distance-learning programmes have very sensibly been introduced to speed up the supply of staff, it is not clear whether they provide opportunities for supervised practice during training. 3.2.6.13. Most important, preschool teachers currently earn only 37% as much as other workers mainly because they are required to work only 24 hours a week as opposed to the standard 40 hours. The short work week reflects the Government’s thoughtful acknowledgement that preschool teachers cannot function effectively, given the nature of their job, with longer working hours. However, the concomitant pay scales could adversely affect recruitment and retention.

29
3.2.6.14. Finally, there is a need to examine the current child/teacher ratio in Kazakhstan. In 2001-2002, the ratio stood at 5:1,35 the lowest among the selected countries presented in Figure 24. Most more developed countries cannot boast of a better ratio, except a few. There may be scope for adjustment in the child/teacher ratio in POs in Kazakhstan, without prejudicing quality, as research suggests there is no “absolute” gold standard.
Figure 24: Child/teacher (3+- 5+ years) ratios in selected countries, 2001-2002
510 10
1519 19 19
22 22 22 23
30
05
101520253035
Kazakhstan
Sweden
SlovakiaSpain
Germany
Brazil
KyrgystanMexico US
R of Korea
MalaysiaJapan
Reference: Global Education Digest. (2004). UIS. 3.2.6.15. Physical infrastructure: The Government has made great efforts to rehabilitate dilapidated buildings housing POs. These efforts have been particularly concentrated in rural areas, where about 62% of the country’s 29 rehabilitated POs are located (Figure 25).
Figure 25: Distribution of rehabilitated POs by urban/rural areas, 2003
Urban38%
Rural62%
Reference: MOES Statistics (ДΒ-26, 2003). 3.2.6.16. In part because rehabilitation efforts have been concentrated in rural areas, the majority of POs with standard buildings (77%) are now found in rural areas (Figure 26).
Figure 26: Distribution of POs with standard buildings by urban/rural areas, 2003
Urban23%
Rural77%
Reference: MOES Statistics (ДΒ-22, 2003).
35 The 2004 MOES data shows that the ratio has gone up to 1: 10, which is still one of the lowest child/teacher ratios in the world.

30
3.2.6.17. But much remains to be done. Despite the concentration of rehabilitation efforts in rural areas, the majority of empty POs (84%) are still found in rural areas, suggesting a low recovery rate. Moreover, 78% of permanent POs are located in urban areas, while 88% of seasonal POs are found in rural areas (Figure 27). POs in rural areas are in a more precarious state.
Figure 27: Distribution of permanent and seasonal POs by urban/rural areas, 2003
22 88
78 12
0%
50%
100%
Permanent Seasonal
Urban
Rural
Reference: MOES Statistics (ДΒ-12, 2003). 3.2.6.18. Also, according to the MOES statistics, about 35% of POs (2003) do not have hot water; and these POs are attended by about 19% of total children going to POs. Even more worrisome, the Kazakh POs seem to be over-represented among facilities with poor conditions. For instance, 65% of Kazakh POs have no hot water, as opposed to the national level of 35%. Likewise, 51% of Kazakh POs had no sewage, as opposed to 19% at the national level (Figure 28).
Figure 28: Kazakh POs without hot water, without sewage, as a % of total Kazakh POs, 2003
19
6551
35
020406080
No hot water No sewage
National
Kazakh POs
Reference: MOES Statistics (ДΒ-19, 2002-3; ДΒ-20, 2003). 3.2.6.19. In 2003-2004, 28% and 45% of Kazakh children were in POs without sewage and without hot water, respectively, while at the national level the respective figures are 7% and 19% (Figure 29).
Figure 29: Kazakh children in POs without hot water, without sewage, as a % of Kazakh total, 2003
197
4528
0
20
40
60
No hot water No sewage
National
Kazakh POs
Reference: MOES Statistics (ДΒ-19, 2002-2003; ДΒ-20, 2003). 3.2.6.20. Involvement of parents: Recognition of the importance of working with parents has been formally written into the latest standards of 2004, and staff are required to foster links between the

31
parent, home and child. This is a clear quality indicator with concrete tasks that acknowledge both the need to inform parents of progress and to help them reinforce learning in the home environment. Satisfaction surveys have also been introduced, but it is not clear how the results of the surveys contribute to the development of services or whether they represent vulnerable families as well as the more articulate and better off. More fundamentally, there does not appear to be an overall strategy for involving parents more broadly in service development. 3.2.7. Recommendations: 3.2.7.1. Integrated policy and cross-sectoral cooperation: The inclusion of all children including those in disadvantaged situations requires a comprehensive plan and system involving not only the MOES but also other Government sectors, notably health and social welfare. The implementation of the 2010 Plan itself involves the same three key public sectors – education, health and social welfare. 3.2.7.2. But at present no mechanism appears to exist for integrating the planning, service development, and monitoring activities of the three Government sectors in order to deliver more integrated early childhood services to all children in Kazakhstan. Such a mechanism will be crucial to prevent fragmentation and duplication. 3.2.7.3. Thus, as foreseen in the 2010 Plan, an Inter-Agency Council for Preschool Education and Training could be established to develop and implement a common policy and programme framework across different Government sectors. Partnership is essential, but for such a mechanism to function efficiently and effectively, it requires strategic leadership. The MOES seems ideally placed to fulfil this role, but only with the support of extra staff resources. With only one staff member currently responsible for preschool education, the MOES could not possibly play the role of a central locus for integrated Government policies and programmes for early childhood. 3.2.7.4. Once established, the Council could monitor implementation of the 2010 Plan. Each sector should first agree on common goals against which to evaluate impacts, and meet regularly to review progress and address problems and issues. Information should be shared across all relevant ministries as a basis for monitoring and development. Special working groups could report to the Council, for example, on issues such as student training, recruitment and functioning. The forum should develop subsidiary mechanisms at the local level. Parents should be clearly represented in the forum so that services will respond to parental needs for childcare in a manner that will be reflected at both practice and policy levels. 3.2.7.5. More efforts are needed to deliver an integrated set of care and education services offering support to parents, especially those in difficult situations. POs could help parents improve their parenting skills and knowledge. If such services could be offered to parents with children below the age of three, it could help reduce abandonment and institutionalisation of children with disabilities. 3.2.7.6. Provision of a qualified workforce: Successful implementation of the 2010 Plan will depend on the existence of a workforce of sufficient size and quality. Although this is a daunting goal, the Government can consider a number of measures for tackling the challenge. 3.2.7.7. First, the Government should maximise the benefits of existing personnel. One option would be to increase preschool teachers’ working hours. At 24 hours, the present workweek of preschool teachers in Kazakhstan is longer than that of other teachers in the country, but it is certainly shorter than in many other countries, where workweeks are more likely to be around 38 hours. 3.2.7.8. In fact, the argument that preschool teachers should work longer hours is not new; it has been raised within the Government but has been dismissed at the policy level. Although the reasons for this resistance are unknown, extending the workweek would certainly ease pressure on the Government to expand the workforce by making increased use of existing staff. A longer day would also serve as justification for increasing their salaries, which in turn could serve as an incentive for new recruits. Higher salaries could also attract male candidates who might otherwise be deterred from a career in preschool education.

32
3.2.7.9. Increasing the child/teacher ratio in POs is certainly another way of making the most of existing human resources. Research shows that there is no absolute gold standard for child/teacher ratios. A range of other factors comes into play such as total group size, child characteristics, quality of personnel, etc. In Kazakhstan there seems to be some scope for modest adjustments to child/teacher ratios from age three without compromising quality, given that group sizes tend to be fairly small, with well-qualified staff. 3.2.7.10. Still another possible way forward would be to introduce a new category of personnel, the teaching assistant, whose role would be primarily to support the teacher. But unlike Nyanyas (assistant carers), teaching assistants would have some level of educational training in early childhood care and education. Possible responsibilities would include providing extra support to “slow learners”, working with individual children on a one-to-one basis so as to attend to their particular needs. They can also help teachers with general classroom management. Retired preschool staff or similar categories of unemployed but qualified workers could easily assume such supporting responsibilities after taking short courses. 3.2.7.11. There are limits to the prospects of improving the efficiency of existing personnel. Clearly, a new corps of personnel is needed. But the Government should note that new qualified personnel will not be attracted to the profession without a substantive increase in salaries for preschool teachers. Stipends for students enrolled in preschool education programmes could help. But any incentive requires extra public expenditure, which implies the necessity of increasing public investment in preschool education. 3.2.7.12. Summary: Great attention has been paid to quality, especially with regard to integration and holistic development. The national curriculum for preschool education has been revised in this direction. The inclusion of children with special needs is evident. However, enrolment in preschool education among children with special needs is still low. Social sector services have weak links with the education sector. Qualified teachers are more likely to be found in advantaged regions. Strategies for increasing the supply of teachers to accompany the expansion of services envisaged by the 2010 Plan are not evident. Child/teacher ratios are relatively low. POs in disadvantaged regions tend to have inferior physical infrastructures. An inter-sectoral council may be needed to foster cooperation among different Government sectors and to promote more integrated provision of early childhood services. To supply the needed workforce, efforts should be made to foster more efficient use of existing personnel, while incentives need to be devised to attract new qualified workforce. 3.3. Resources 3.3.1. Current level of investment: With its PPP gross national income per capita of US$5,630 (2002), Kazakhstan is situated between lower-middle (US$5,290) and upper-middle income countries (US$9,550) (Figure 30).36
36 Kazakhstan’s GDP growth rate at 9.8% in 2001-2002 is almost double the average for lower-middle income countries (4.9%). It is also the highest in the region with the exception of Turkmenistan, which recorded 14.9%.

33
Figure 30: PPP Gross National Income, per capita ($), 2002
1560 21104780 5290 5500 5630 7820 8080 9550 10450
13070
28480
05000
1000015000200002500030000
Kyrygystan
Low income
Turkmenistan
L-middle income*
Belarus
KazakhstanWorld
Russia
U-middle income**
Poland
Hungary
High income
Reference: World Development Indicators. (2004). World Bank. * Lower-middle income countries / ** Upper-middle income countries 3.3.2. Expenditure on education in Kazakhstan as a percentage of GDP in 2001-2002 (4.4%) compared favourably with reference countries (Figure 31), with the exception of Belarus, which spends 6% of its GDP PPP (US$5,500) on education.
Figure 31: Public expenditure on education, as a % of GDP, 2001-2002
3.1 3.14 4.1 4.4 4.4 4.9
65.2
6
01234567
Low incomeRussia
L-middle income*
World
Kazakhstan
U-middle income**
HungaryPoland
High income
Belarus
Reference: World Development Indicators. (2004). World Bank. * Lower-middle income countries / ** Upper-middle income countries 3.3.3. According to the data of the MOES, Kazakhstan spent 0.1% of its GDP in preschool education in 2001. As the age group concerned for this figure is not clear, caution must be taken in comparing it with the figures of the other countries (Figure 32) which refer specifically to pre-primary education or ISCED-0 for children over three years.
Figure 32: Public expenditure on pre-primary educational institutions/administration, as a % of GDP, 2001
0.7 0.7 0.6 0.6 0.5 0.5 0.4 0.4 0.4 0.4 0.3 0.2 0.1 0.1 0.1 0.1
00.20.40.60.8
Norway
Hungary
France
Denm
ark
Sweden
Mexic
o US
Germ
any
Poland
Czech
Armen
ia
Kyrgyz
stan
Kazak
hstan
*
Japan
Malay
sia
Rep o
f Kore
a
Reference: Global Education Digest. (2004). UIS. *MOES Statistics (2004).
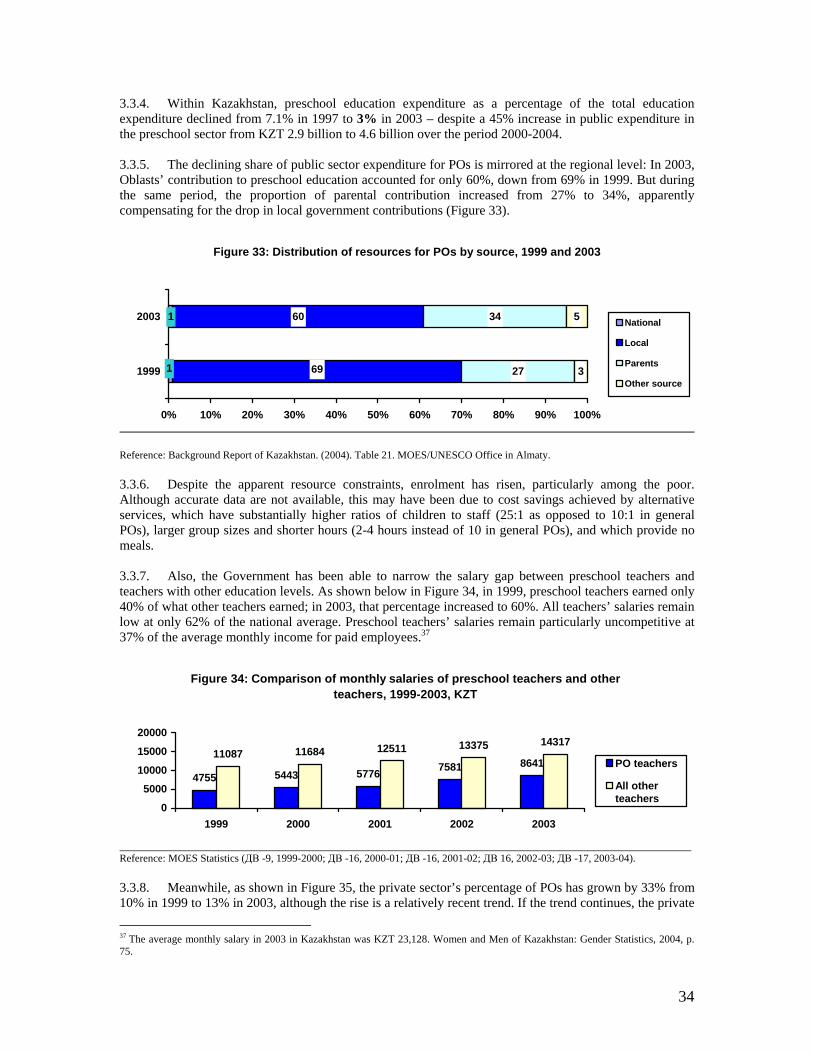
34
3.3.4. Within Kazakhstan, preschool education expenditure as a percentage of the total education expenditure declined from 7.1% in 1997 to 3% in 2003 – despite a 45% increase in public expenditure in the preschool sector from KZT 2.9 billion to 4.6 billion over the period 2000-2004. 3.3.5. The declining share of public sector expenditure for POs is mirrored at the regional level: In 2003, Oblasts’ contribution to preschool education accounted for only 60%, down from 69% in 1999. But during the same period, the proportion of parental contribution increased from 27% to 34%, apparently compensating for the drop in local government contributions (Figure 33).
Figure 33: Distribution of resources for POs by source, 1999 and 2003
1 60
27
34
3
5
1 69
0% 10% 20% 30% 40% 50% 60% 70% 80% 90% 100%
1999
2003National
Local
Parents
Other source
Reference: Background Report of Kazakhstan. (2004). Table 21. MOES/UNESCO Office in Almaty. 3.3.6. Despite the apparent resource constraints, enrolment has risen, particularly among the poor. Although accurate data are not available, this may have been due to cost savings achieved by alternative services, which have substantially higher ratios of children to staff (25:1 as opposed to 10:1 in general POs), larger group sizes and shorter hours (2-4 hours instead of 10 in general POs), and which provide no meals. 3.3.7. Also, the Government has been able to narrow the salary gap between preschool teachers and teachers with other education levels. As shown below in Figure 34, in 1999, preschool teachers earned only 40% of what other teachers earned; in 2003, that percentage increased to 60%. All teachers’ salaries remain low at only 62% of the national average. Preschool teachers’ salaries remain particularly uncompetitive at 37% of the average monthly income for paid employees.37
Figure 34: Comparison of monthly salaries of preschool teachers and other teachers, 1999-2003, KZT
4755 5443 57767581 8641
11087 11684 12511 13375 14317
0
5000
10000
15000
20000
1999 2000 2001 2002 2003
PO teachers
All otherteachers
Reference: MOES Statistics (ДΒ -9, 1999-2000; ДΒ -16, 2000-01; ДΒ -16, 2001-02; ДΒ 16, 2002-03; ДΒ -17, 2003-04). 3.3.8. Meanwhile, as shown in Figure 35, the private sector’s percentage of POs has grown by 33% from 10% in 1999 to 13% in 2003, although the rise is a relatively recent trend. If the trend continues, the private
37 The average monthly salary in 2003 in Kazakhstan was KZT 23,128. Women and Men of Kazakhstan: Gender Statistics, 2004, p. 75.

35
sector will be an important partner to the MOES, especially in urban areas, where its services are most likely to thrive.
Figure 35: Distribution of POs by state, public and private owned, 2000-2003
79
81
83
11
10
4
10
10
10
13
77 13
0% 20% 40% 60% 80% 100%
2000
2001
2002
2003
StatePublicPrivate
Reference: MOES Statistics (ДΒиО-16, 17, 18, 2000, 2001, 2002; ДΒиО-17, 18, 19, 2003). 3.3.9. Widened inequalities: Despite Government efforts, the gap between the rich and poor in terms of access to quality education has widened. A principal contributor to the increased malaise has been a rise in parental contributions. As seen in Figure 33, parental contributions surged from 27% to 34% of total expenditure on preschool education between 1999 and 2003, adversely affecting poor families. 3.3.10. In 2003, parents paid between KZT 1,000 and 6,800 for a place in a state Kindergarten. Given a monthly salary at the time of KZT 23,128,38 that amounted to an average of KZT 3,500 or about 15% of income. Clearly, parents on social assistance with a monthly income of KZT 1,98539 could not afford a state Kindergarten place, let alone more than one. The expense was all the more out of reach for a growing number of single parents. 3.3.11. On the other hand, parental contributions to state Kindergartens would appear to be good value for money compared with paying fees to private Kindergartens, ranging from KZT 13,500 to 40,800 (US$100-US$300) covering tuition, meals and partial payments towards utilities. By contrast, the maximum parent fee paid to a state Kindergarten is around KZT 10,000 (US$73), with the actual payment averaging around KZT 5,000 (US$36).40 This sum covers the costs of extracurricular activities such as foreign language tuition, choreography and gymnastics. With the best state Kindergartens offering such an extensive array of services in attractive environments, there may be little incentive for parents to turn to the private sector. This may help explain why, despite the introduction of tax breaks to stimulate the growth of the private sector, private provision of preschool education in Kazakhstan remains small at only 13% of the total41 (see Figure 35). 3.3.12. At the local level, the decentralisation policy did not seem to help remove inequities. Figure 36 reveals little difference between H-5 and L-5 Oblasts in terms of per-child expenditure in preschool education. What this means for L-5 Oblasts is that they provide a limited number of children services whose quality is similar to that of services attended by children in the H-5 Oblasts. Unless individual Oblasts are allowed to develop their own quality standards, the trade-off between quality and access in disadvantaged Oblasts will continue, hindering poor children’s access to services of basic quality.
38 Reference: Men and Women of Kazakhstan. (2004). Agency of the Republic of Kazakhstan on Statistics. 39 Ibid. 40 Conversion calculated at KZT 136 to US$1 (July 2004). 41 From 2000-2002, the proportion of private POs remained at 10%.

36
Figure 36: Per-child expenditure in preschool education, L-5 and H-5 Oblasts, 2003
37 3923
37 36 3449
33 33 33 39 38
0102030405060
Almatinskaya
Zhambylskaya
Kyzlordinskaya
N-Kazakh
S-Kazakh
L-5 average
Atyrauskaya
Karagindskaya
Pavlodarskaya
Almaty city
Astana city
H-5 average
Reference: Background Report of Kazakhstan. (2004). MOES/UNESCO Office in Almaty. 3.3.13. Shrinking expenditures at the Oblast level have had another effect on quality, that of inhibiting refurbishment of dilapidated buildings and reducing opportunities to invest in new toys, equipment and textbooks. As a result, the Government has failed to maximise investment in new textbooks, disproportionately reducing the potential benefits to poorer areas and children. Despite earmarked Government funds of KZT 350 million, only 10-20% of the children in three of the five L-5 Oblasts received new textbooks. Similarly with only 30% of staff enjoying access to in-service training in the last four years, few educators have become familiar with the new materials. 3.3.14. Recommendations: Kazakhstan has high ambitions for reviving preschool education, and its great strength is professionalism. The pedagogical knowledge base is strong, and the sharing of innovations and good practice among universities, training institutions and people on the ground can serve as an example for many other countries. While the Government has rightly prioritised the universalisation of pre-primary education as a first milestone, the ideal of Kindergarten for all, which was once a reality for most parents, now seems difficult to regain, at least in the near future. At the present rate, access to POs will widen only slowly; and it may be long before it reaches all those in need. 3.3.14.1. Current strategy: The Government’s present investment strategy could be characterised as a mainstream policy, flanked by special, but fringe, measures for the rich and poor. The mainstream is the re-expansion of the preschool network centred on Kindergartens. Although alternative services have been introduced, Kindergartens are still the main form of preschool education, and they are to be expanded by and large in their traditional set-up – well-resourced, run by a sufficient number of well-trained teachers, providing a rich array of “non-core” (e.g., choreography, sports, etc.) as well as core activities. The Review Team found most state-run Kindergartens to be in this ideal situation. 3.3.14.2. Maintaining such a high-quality Kindergarten, however, is costly. Although the Government is trying to raise the necessary funds, access to Kindergartens is projected to expand only slowly; and as seen earlier, poor children’s access to normal quality Kindergartens is still highly restricted. They are alternatively introduced to low-cost services, which as discussed earlier do not help remove the quality gap between the rich and poor in the preschool education progression. To accelerate the expansion, additional means would be required; yet, the increase in the budget for POs has reached its political limits. Increased parental fees clearly attest to this reality. Yet, Kindergartens charging KZT 3,500 per month exclude the poor, even if places do become available. 3.3.14.3. The Government may explore three options for handling the quandary of quality versus access. 3.3.14.4. The first option, which represents the least radical break with the present strategy, is to strengthen support for the poor while continuing with the current mainstream policy to develop quality state-run Kindergartens. The poor deserve strengthened policy attention, as (1) they benefit most from

37
preschool education, as demonstrated by a plethora of literature,42 and (2) at the present rate of expansion of state Kindergartens, and at the present level of fees for them, it will be a long time before the poor will have access to Kindergartens and benefit from them. 3.3.14.5. Two pro-poor measures can be developed. One is to reinforce the policy of reducing or waiving fees by granting this support to larger groups of poor children. Obviously this is a costly measure. A less costly, thus more feasible, measure would be to support innovative services outside the formal system. Some services run by social workers or NGOs currently provide, with limited resources, a minimum level of early childhood care and education services to children; supporting them could be a good starting point. 3.3.14.6. One may argue that these services are not educational services, meeting no educational standards. But this is precisely the point: Since a number of essential elements of a more regular Kindergarten are already in place in those social services, only a relatively small additional input would be enough to substantially strengthen the educational façade of such services. With an investment of qualified teachers, for instance, they could benefit poor children enormously. They might still not meet the high standards of Kindergartens, but that should not be an issue, as the formal system has not yet reached these children anyway. 3.3.14.7. A disadvantage of the first option is that the poor and the rich will access different services –alternative services for the poor -- while the rich will attend normal Kindergartens. This can be seen as beneficial and to some extent necessary, only if people have a real choice. But the poor’s access to alternative services would not be a real choice but a forced one. A strategy is thus needed to guarantee access to normal Kindergartens of equal quality for all. This constitutes the second option. 3.3.14.8. The objective can be pursued by means-tested fees that are dependent on parental income. How exactly to calibrate this system, that is, how much should be asked from which income groups, can be established only after detailed research on household income and expenditure. Such an exercise may reveal that, through the extra contribution of high-income groups, the fees can indeed be lowered for low-income groups, and the latter can benefit from the same services attended by the former. Some elements of a means-tested fee system are already in place in Kazakhstan in that fees of normal Kindergartens are reduced or waived for poor groups. In a more solid system of means-tested fees, however, the practice would be structurally embedded. In such a system, parents who need assistance may not have to ask for it or to fear stigmatisation. They would see such support as a right, not a favour. 3.3.14.9. Kazakhstan’s strength as a society lies in the peaceful co-existence of its diverse population groups. Its social cohesion may be in jeopardy if its youngest citizens’ paths to learning are separated along their socio-economic backgrounds from early years on. Kindergartens inculcate in the minds of the young national values and identity. This valuable learning should not be available only for the few privileged, as with the feeling of exclusion among the poor, social cohesion cannot be achieved. This should be the rationale of the second option, which argues for universal and equal provision of preschool education for all.43 3.3.14.10. The third and last option is to prepare a minimum package of Kindergartens, without non-core activities (e.g., swimming, requiring the construction of a swimming pool), and make it available to all. This will lower the unit costs of Kindergartens and make it more affordable to more people. Parents who are able and willing to “buy” additional non-core services can do so through the market at their own
42 International research shows that disadvantaged children who have attended preschool are more likely to have better educational results and better employment prospects; they are also more likely to be healthy thanks to health monitoring, and they are less likely to be truant, delinquent or to become pregnant as teenagers. These outcomes clearly benefit the child, but they also produce benefits for the family and wider community and reduce the need for expenditure on welfare, health and youth justice services. Preschool experience also increases labour market participation and reduces welfare dependency. 43 The effects of means-tested fees can also be achieved by simply abolishing fees altogether, compensating through a tax increase (since taxes are usually progressive). Admittedly, tax increases are difficult to pursue as well. Political acceptance could be won by actually calling it the “kindergarten tax”, emphasising the undeniably beneficial long-term outcomes of targeting preschool children: social cohesion and conflict prevention.
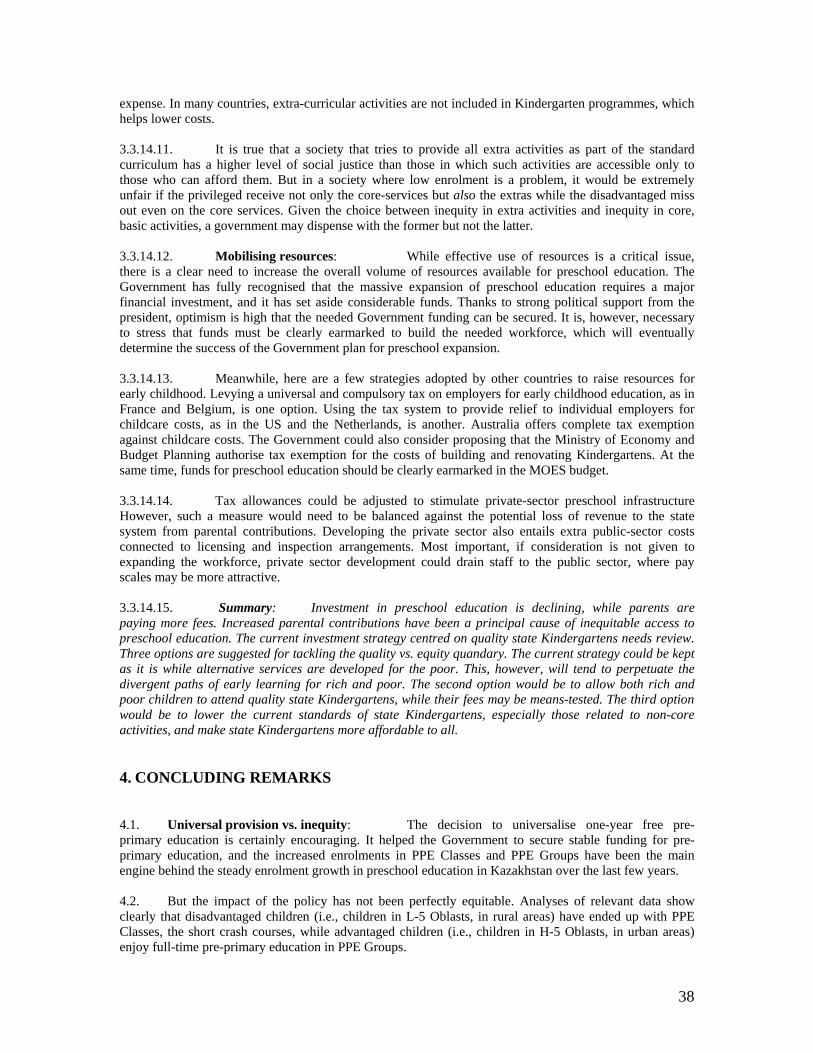
38
expense. In many countries, extra-curricular activities are not included in Kindergarten programmes, which helps lower costs. 3.3.14.11. It is true that a society that tries to provide all extra activities as part of the standard curriculum has a higher level of social justice than those in which such activities are accessible only to those who can afford them. But in a society where low enrolment is a problem, it would be extremely unfair if the privileged receive not only the core-services but also the extras while the disadvantaged miss out even on the core services. Given the choice between inequity in extra activities and inequity in core, basic activities, a government may dispense with the former but not the latter. 3.3.14.12. Mobilising resources: While effective use of resources is a critical issue, there is a clear need to increase the overall volume of resources available for preschool education. The Government has fully recognised that the massive expansion of preschool education requires a major financial investment, and it has set aside considerable funds. Thanks to strong political support from the president, optimism is high that the needed Government funding can be secured. It is, however, necessary to stress that funds must be clearly earmarked to build the needed workforce, which will eventually determine the success of the Government plan for preschool expansion. 3.3.14.13. Meanwhile, here are a few strategies adopted by other countries to raise resources for early childhood. Levying a universal and compulsory tax on employers for early childhood education, as in France and Belgium, is one option. Using the tax system to provide relief to individual employers for childcare costs, as in the US and the Netherlands, is another. Australia offers complete tax exemption against childcare costs. The Government could also consider proposing that the Ministry of Economy and Budget Planning authorise tax exemption for the costs of building and renovating Kindergartens. At the same time, funds for preschool education should be clearly earmarked in the MOES budget. 3.3.14.14. Tax allowances could be adjusted to stimulate private-sector preschool infrastructure However, such a measure would need to be balanced against the potential loss of revenue to the state system from parental contributions. Developing the private sector also entails extra public-sector costs connected to licensing and inspection arrangements. Most important, if consideration is not given to expanding the workforce, private sector development could drain staff to the public sector, where pay scales may be more attractive. 3.3.14.15. Summary: Investment in preschool education is declining, while parents are paying more fees. Increased parental contributions have been a principal cause of inequitable access to preschool education. The current investment strategy centred on quality state Kindergartens needs review. Three options are suggested for tackling the quality vs. equity quandary. The current strategy could be kept as it is while alternative services are developed for the poor. This, however, will tend to perpetuate the divergent paths of early learning for rich and poor. The second option would be to allow both rich and poor children to attend quality state Kindergartens, while their fees may be means-tested. The third option would be to lower the current standards of state Kindergartens, especially those related to non-core activities, and make state Kindergartens more affordable to all. 4. CONCLUDING REMARKS 4.1. Universal provision vs. inequity: The decision to universalise one-year free pre-primary education is certainly encouraging. It helped the Government to secure stable funding for pre-primary education, and the increased enrolments in PPE Classes and PPE Groups have been the main engine behind the steady enrolment growth in preschool education in Kazakhstan over the last few years. 4.2. But the impact of the policy has not been perfectly equitable. Analyses of relevant data show clearly that disadvantaged children (i.e., children in L-5 Oblasts, in rural areas) have ended up with PPE Classes, the short crash courses, while advantaged children (i.e., children in H-5 Oblasts, in urban areas) enjoy full-time pre-primary education in PPE Groups.
39
4.3. A more equitable implementation of the policy would give priority to disadvantaged children so that they, too, could benefit from PPE Groups, or a more full-fledged pre-primary education that would help them not only prepare for formal schooling but also compensate for their lost holistic development during earlier years. The Government has been already making efforts in this regard, such as providing a play-time for children in PPE Classes. Such an effort needs more support and will be an effective measure of pro-poor implementation of the universal principle. 4.4. Pro-poor policy is needed not only for social justice, but also for increased investment returns. As a plethora of studies have demonstrated, the benefits of investment in early childhood services are far greater among disadvantaged children. Investment in poor children is needed not only to ensure social justice and cohesion, but also to maximise the returns of Government investment in preschool education. 4.5. Pro-poor policy: Nothing could be more incorrect and unjust than saying that the Government does not have a policy for poor children. It does care about the plight of children in disadvantaged circumstances, and it has devised specific measures to assist them. It has identified specific disadvantaged groups (e.g., children of teachers, doctors, parents with disabilities, and children with disabilities, etc.) and waived their preschool education fees, for example. There are also specific social assistance programmes designed for poor families. 4.6. It is, however, valid to ask whether the distribution of preschool services itself has been affirmatively pro-poor. The answer seems to be “No”, as the analyses have demonstrated. The Government strategy, to date, has been to address the problem at the level of recipients. Waiving preschool fees for poor children is a good example. Providing poor families with various cash benefits so that they can buy necessary services has been another way of addressing the problem at this level. 4.7. Perhaps it is time for the Government to consider whether the problem of inequity could be addressed more effectively by intervening not only on the demand side, but also on the supply side. One way of addressing the problem from the supply side is to make the services affordable in the first place so that they can be accessed not only by the rich but also by the poor, without subsidies. This equitable distribution must first and foremost concern the mainstream services that matter most to the child’s holistic development, the ultimate goal of early childhood care and education services. 4.8. Mediation at the supply side is politically more difficult to engineer, because it necessarily involves concessions from the present beneficiaries – the rich. Access currently available to the rich may have to be restricted somehow in order to make it equally available to the poor. The pro-poor implementation of the universal pre-primary education suggested above is a form of this concession – until the poor are reached, the rich may not exercise their entitlement right. But given the serious gap in the distribution of both human and institutional resources for preschool education in the country, the Government may need a more affirmative pro-poor policy. 4.9. Quality vs. access: Another policy quandary facing Kazakhstan is its emphasis on ensuring quality over the need to expand access. The quality of preschool education in Kazakhstan is relatively high – there is a solid training system, a long tradition of pedagogy as both discipline and practice, high standards for infrastructure, and so on. Given that early childhood services is effective only when they are of good quality, the Government’s concern with quality is well justified. 4.10. But the problem is that with the emphasis on quality, it may be a long time before all target children are reached. Moreover, since part of the cost of providing quality services is now being recovered from parents, it is practically impossible to expect poor families to have access to these services, even if they are expanded and available. 4.11. The issue, thus, again boils down to the question of how to make a quality service equitably available to all children; and this is a question that the Government, which to date has mainly been concerned with quality, may now wish to ask itself. A few options were presented in the preceding section

40
to guide the thinking process, but the decision is, after all, for the Government to make, taking into consideration its own needs and priorities. 4.12. Purpose of preschool education: The Government as well as service providers themselves are fully aware of the shortcomings of strict pre-primary education devoted to teaching young children learning skills for formal schooling. This is one reason why some PPE Classes are trying, if possible, to provide their young pupils with time to play as well as “study”. But such consideration for holistic development is not widespread in PPE Classes, which in most cases are operated mainly as preparatory classes for formal schooling. 4.13. Importantly, school authorities believe that graduates of PPE Classes are better equipped to perform in schools. This may be true and not surprising given that PPE Classes are teaching specific learning skills needed immediately for the child to function properly in Grade 1. In this sense, PPE Classes may not be disadvantaged after all, compared with PPE Groups, at least from a short-term perspective. 4.14. The real benefits of early childhood care and education, however, do not lie in the child’s preparation for formal schooling alone. Children’s ability to undertake formal schooling is, in fact, only an outcome, though an important one, of their overall holistic development, which must cover the gamut of emotional, social, physical, communicative, linguistic and cognitive skills. If a service does not help the child with this overall holistic development, and focuses only on preparation for formal schooling, it caters for primary education, not early childhood education. 4.15. For this reason, the disadvantaged child’s abrupt entry into preschool education only at the age of 5+ or 6+ for pre-primary education is a matter of concern. The real disadvantage of poor children in PPE Classes is their lost opportunity for overall development in a gradual and evolutionary manner. The impact of this missed opportunity is not easy to measure, at least on a short-term scale. A comparative study on the school performance of children from PPE Groups and PPE Classes could provide good insight for the debate on their relative impact on children’s overall development. 4.16. Leadership vs. partnership: One of the most impressive aspects of Kazakhstan’s preschool education system is its rigorous administration. The MOES, the lead sector for preschool education, has a clear vision, necessary plans and legislation and, most important, resources. Whatever is planned is most likely to be implemented, unlike in many other countries where plans for early childhood care and education tend to be more hopes and dreams than realities-to-be. 4.17. The rigorous system can maximise its effectiveness if it is more properly partnered with other sectors, particularly the social sector. Various early childhood services provided by the social sector tend to be belittled as social services as opposed to early childhood services. This perception may need to be changed. Early childhood services can come in various forms and formats. Their providers can be diversified and should be diversified, if expansion of access is to be accelerated. 4.18. The diversification of services and service providers, however, requires a central quality control system. This should be the task of the MOES, which should start by mapping the services that are being provided by other sectors. Then efforts can be made to harmonise the standards being applied to different services. Once common quality standards are identified and enforced, diverse partners can provide services without compromising quality. Such partnerships will help make early childhood services truly integrated, catering for the needs not only of children but also their families.

41
REFERENCES Background report of Kazakhstan for the UNESCO/OECD Early Childhood Policy Review Project: Status of preschool education in the Republic of Kazakhstan. (2004). Ministry of Education and Science/UNESCO Cluster Office in Almaty. Country profile of the Republic of Kazakhstan. http://www.kazakhembus.com/countryprofile.html. Embassy of Kazakhstan to the USA & Canada. Education For All National Plan of Action of the Republic of Kazakhstan. (2003). Astana: Ministry of Education and Science, Republic of Kazakhstan. EFA global monitoring report. (2004). Paris: UNESCO Publishing. Global education digest: Comparing education statistics across the world. (2004). Montreal: UNESCO Institute of Statistics. Government programme for the development of education in the Republic of Kazakhstan up to the year 2010. (2004). Astana: The Government of the Republic of Kazakhstan. Human development report. (2004). New York: UNDP. Preschool indicators and statistics for 2003/2004. (2004). Astana: Ministry of Education and Science, Republic of Kazakhstan. UNICEF. (2003). Social monitor 2003. Florence: UNICEF Innocenti Research Centre. United Nations. (2003). Kazakhstan: Achievements, issues and prospects. A perspective by the United Nations. Almaty: Pilot TC., Llc. Women and men of Kazakhstan: Gender statistics. (2004). Astana: Agency of the Republic of Kazakhstan on Statistics. World development indicators. (2004). Washington, D.C.: The World Bank.

42
ANNEX 1: SCHEDULE OF REVIEW VISIT
Date Time Programme
AM Arrival in Almaty
3 Oct. 2004
PM Meeting of the Review Team at UNESCO Cluster Office in Almaty of the Review Team to discuss the draft Background Report of Kazakhstan
AM Visit to: National In-service Teacher Training Institute Visit to Almaty City Education Department
4 Oct. 2004
PM Visit to: NGO “Education Centre Step-by-Step” Children’s Support Centre Pedagogical College Travel to Astana by air
AM Meetings at the Ministry of Education and Science with: Ms. K. Shamshidinova, Vice-Minister, National EFA Coordinator Ms. S. Ispussinova, Director for Secondary Education Department
5 Oct. 2004
PM Visit to Astana In-service Training Institute
AM Visit to: Pre-primary class in #38 School Early Childhood Orphanage
6 Oct. 2004
PM Visit to Kindergarten “Skazka” Travel to Kostanai by air Meeting with Kostanani Oblast Education Department personnel
AM Meeting with Kostanai Oblast Administration Visit to: Kostanai In-service Training Institute Pedagogical College Nursery-Kindergarten # 27
7 Oct. 2004
PM Visit to: Kindergarten Rosinka School Gymnasium # 3 Private Kindergarten
AM Travel to Karaganda by air
8 Oct. 2004
PM Meeting with City mayor Visit to: Children’s Palace Karaganda State University Sanatorium Kindergarten Kindergarten-School Complex
AM Visit to: “Korablic” Kindergarten Women Gymnasium
9 Oct. 2004
PM Travel to Astana by road
AM Final meeting of the MOES Final meeting with Review Mission Team
10 Oct. 2004
PM Travel to Almaty by air

43
ANNEX 2: REVIEW TEAM Ms. Judith Harwin Professor Department of Social Work Brunel University Twickenham Campus 300 St. Margaret's Road Twickenham, Middlesex TW1 1PT [email protected] Ms. Gaukhar A. Saimassaeva Chief Specialist of Preschool Education Division of Preschool and Basic Education, Department of Secondary Education Ministry of Education and Science Room 518 60, Republic Ave. Astana 473000 Republic of Kazakhstan [email protected] Ms. Nina L. Tataurova Dean of the Educational Psychology Faculty Semipalatinsk City State Pedagogical Institute 159, Shugaeva str., building #2 Almaty Republic of Kazakhstan [email protected] Mr. Jan van Ravens Senior Policy Analyst UNESCO 7, place de Fontenoy 75352 Paris 07 SP France [email protected] Ms. Soo-Hyang Choi Chief, Section for Early Childhood and Inclusive Education Division of Basic Education, Education Sector UNESCO 7, place de Fontenoy 75352 Paris 07 SP France [email protected] Assistant: Ms. Yoshie Kaga Assistant Programme Specialist, Section for Early Childhood and Inclusive Education Division of Basic Education, Education Sector UNESCO 7, place de Fontenoy 75352 Paris 07 SP France [email protected]

44
ANNEX 3: COMPARATIVE DATA ON KAZAKHSTAN 1. Demography Table 1: Size, growth, distribution and composition of the population
Rural population Average annual population
growth rate (%)
Fertility rate (births / woman)
Urban population (% of total)
% of total
average annual
% growth
Total population,
2002 (millions)
1980-2002
2002-2015
1980 2002 2002 2015 2002 1980-2002
% of population ages 0-14,
2002
Kazakhstan 15 0.0 0.3 2.9 1.8 55.8 58.2 44 -0.2 25.3
Project 44 Brazil
174
1.6
1.1
3.9
2.1
82.4
88.4
18
-1.2
27.9 Indonesia 212 1.6 1.1 4.3 2.3 44.5 57.8 57 0.2 29.8 Kenya 31 2.9 1.4 7.8 4.2 38.2 51.8 65 1.7 42.6
Reference45 Belarus 10 0.1 -0.5 2.0 1.3 70.5 75.2 30 -1.5 17.4 Czech Rep. 10 0.0 -0.2 2.1 1.2 74.2 75.7 25 -0.0 15.8 Hungary 10 -0.2 -0.4 1.9 1.3 64.7 70.0 35 -1.2 16.5 Kyrgyzstan 5 1.5 1.1 4.1 2.4 34.0 35.4 66 1.7 32.5 Poland 39 0.4 0.0 2.3 1.3 61.8 64.0 37 -0.2 18.2 Russia 144 0.2 -0.5 1.9 1.3 73.3 74.3 27 -0.3 16.9 Turkmenistan 5 2.3 1.3 4.9 2.7 45.1 50.0 55 2.5 34.7 Uzbekistan 25 2.1 1.3 4.8 2.3 36.8 37.0 63 2.4 35.4
Global46 Low income
2,495
2.1
1.5
5.5
3.5
31.2
37.5
69
1.6
36.5 Lower middle income 2,408 1.3 0.8 3.1 2.1 51 0.2 26.1 Upper middle income 329 1.5 1.1 3.6 2.4
52.8 61.0
25 0.1 28.9 High income 966 0.7 0.3 1.9 1.7 77.8 80.9 22 -0.3 18.3 World 6,199 1.5 1.0 3.7 2.6 47.8 53.5 52 0.8 29.2
Reference: World Development Indicators. (2004). The World Bank. / Human Development Report. (2004). UNDP. With a population of 15 million people, Kazakhstan is the least populous of the four countries participating in the UNESCO/OECD Early Childhood Policy Review Project. Although its population has grown, the growth rate projected for 2002-2015 is only 0.3%, similar to the average of high-income countries. Its fertility rate has dropped by 38% from 2.9 in 1980 to 1.8 in 2002, the decrease percentage being higher than in many of the reference countries. The population ages 0-14 account for about 25% of the total, lower than lower-middle-income countries’ average of 26%. The urban population in Kazakhstan is slowly expanding. It is projected to grow by 4% from 56% in 2001 to 58% in 2015. This is the slowest growth rate among the project countries but ranks middle among the reference countries, and equal to the average rate of high-income countries. Kazakhstan’s demographic profile is not expanding at any particularly alarming pace.
44 Countries participating in the UNESCO/OECD Early Childhood Policy Review Project. 45 Countries selected from the region to provide Kazakhstan with a frame of reference or benchmarking. 46 According to the World Development Indicators, low-income countries are those with a GNI per capita of $735 or less in 2002; lower-middle-income countries of between $735 and $2,935; upper-middle-income countries of between $2,935 and $9,076; and high-income countries of $9,76 or more. According to this categorisation, Kazakhstan, whose GNI per capita in 2002 is $1,520, is one of the lower-middle-income countries.

45
2. Economy Table 2: Size and structure of the economy
Structure of GDP, 2002 PPP gross national income, per capita ($), 2002
GDP % growth, 2001-02
Agriculture % of GDP
Industry % of GDP
Services % of GDP
Kazakhstan 5,630 9.8 9 39 53
Project Brazil
7,450
1.5
6
21
73 Indonesia 3,070 3.7 17 44 38 Kenya 1,010 1.0 16 19 65
Reference Belarus 5,500 4.7 11 37 52 Czech Rep. 14,920 2.0 4 40 57 Hungary 13,070 3.3 4 31 65 Kyrgyzstan 1,560 - 0.5 39 26 35 Poland 10,450 1.4 3 30 66 Russia 8,080 4.3 6 34 60 Turkmenistan 4,780 14.9 29 51 20 Uzbekistan 1,640 4.2 35 22 44
Global Low income 2,110 4.0 24 30 46 Lower middle income 5,290 4.9 10 34 56 Upper middle income 9,550 - 1.2 6 34 60 High income 28,480 1.6 2 27 71 World 7,820 1.9 4 29 68
Reference: World Development Indicators. (2004). The World Bank.
In terms of PPP gross national income per capita, Kazakhstan ($5,630) falls between lower-middle-income ($5,290) and upper-middle-income ($9,550) countries. Its GDP grew by 9.8% in 2001-2002. This is a relatively high growth rate in the region, whose rates range from - 0.5% of Kyrgyzstan to 4.7% of Belarus; only Turkmenistan has a higher GDP growth rate of 14.9%. In terms of GDP structure, Kazakhstan is similar to the reference countries except Kyrgyzstan, Turkmenistan and Uzbekistan: The services sector is the largest contributor (53%) to the total GDP.

46
Table 3: Income distribution and poverty
% share of income or consumption
Int’l poverty line
Lowest 10%
Highest 10%
GINI index47, (survey year)
Survey year
Population below $1 a
day, %
Poverty gap at $1 a day,
%
Population below $2 a
day, %
Poverty gap at $2 a day, %
Kazakhstan 3.4 24.2 31.3
(2001) 2001 <2 <0.5 8.5 1.4
Project Brazil 0.5 46.7
59.1 (1998) 2001 8.2 2.1 22.4 8.8
Indonesia 3.6 28.5 34.3
(2002) 2002 7.5 0.9 52.4 15.7
Kenya 2.3 36.1 44.5
(1997) 1997 23 6.0 58.6 24.1
Reference Belarus 3.5 24.1
30.4 (2000) 2000 <2 <0.5 <2 0.1
Czech Rep. 4.3 22.4
25.4 (1996)
1996 <2 <0.5 <2 <0.5
Hungary 2.6 22.8
24.4 (1999)
1998 <2 <0.5 7.3 1.7
Kyrgyzstan 3.9 23.3
29.0 (2001)
2001 <2 <0.5 27.2 5.9
Poland 2.9 27.4
31.6 (1999)
1999 <2 <0.5 <2 <0.5
Russia 1.8 36.0
45.6 (2000)
2000 6.1 1.2 23.8 8.0
Turkmenistan 2.6 31.7
40.8 (1998)
1998 12.1 2.6 44.0 15.4
Uzbekistan 3.6 22.0
26.8 (2000)
2000 21.8 5.4 77.5 28.9
Reference: World Development Indicators. (2004). The World Bank. Compared with Brazil, whose GINI index reached nearly 60 in 1998, Kazakhstan is not a country with a particularly glaring disparity in income distribution and consumption. Its GINI index in 2001 stood at 31.3, lowest among the project countries but ranks middle among the reference countries. Kazakhstan’s richest 10% share or consume about 24% of the national income, while in Poland, Turkmenistan and Russia, the figure stands, respectively, at around 27%, 32% and 36%. The lowest 10% in Kazakhstan share or consume about 3% of national income, while in Hungary, Poland, Russia and Turkmenistan, the figures are below 3%. Less than 2% of Kazakhstan’s population falls below the international poverty line of $1 a day. Even setting the poverty line at $2 a day, only 8.5% of its population is concerned, while among the reference countries, proportionally more people are affected in Russia and most of Kazakhstan’s neighboring countries in Central Asia. Kazakhstan shows a poverty gap at $2 a day of 1.4%, which is one of the lowest among the reference countries after Belarus, the Czech Republic and Poland.
47 GINI Index “measures the extent to which the distribution of income among individuals or households within an economy deviates from a perfectly equal distribution” (World Development Indicators, 2004, p. 63).
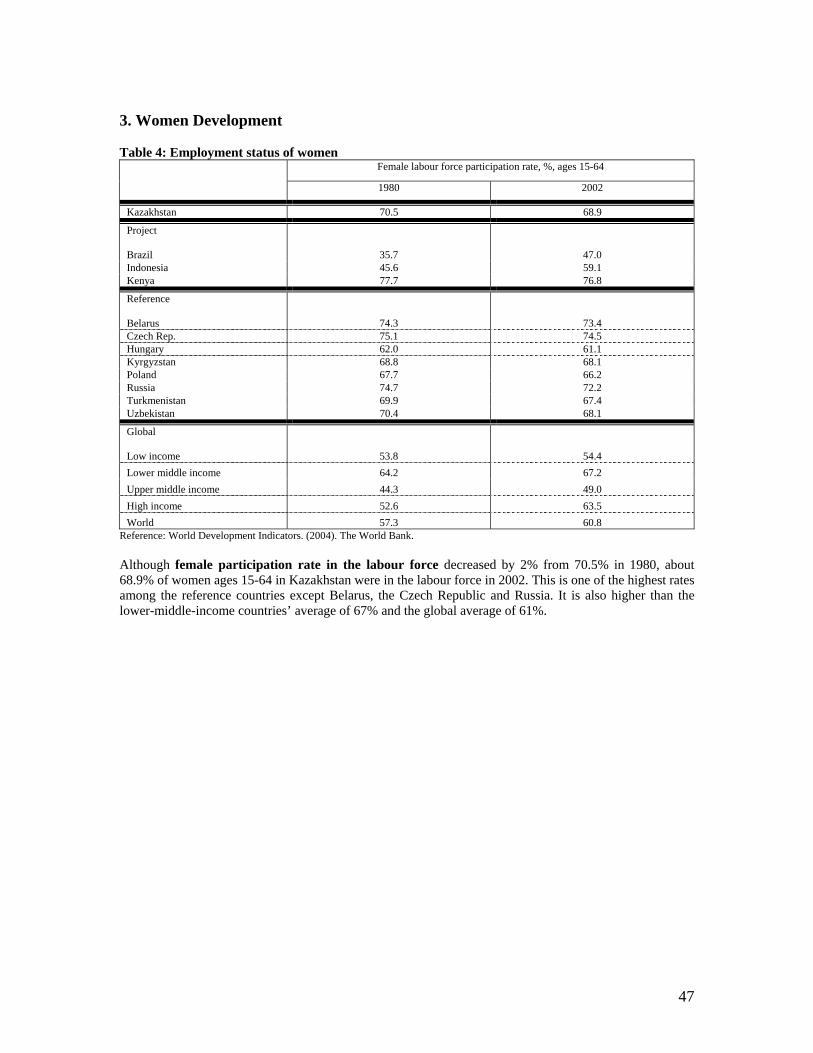
47
3. Women Development Table 4: Employment status of women
Female labour force participation rate, %, ages 15-64
1980 2002
Kazakhstan 70.5 68.9
Project Brazil
35.7
47.0 Indonesia 45.6 59.1 Kenya 77.7 76.8
Reference Belarus 74.3 73.4 Czech Rep. 75.1 74.5 Hungary 62.0 61.1 Kyrgyzstan 68.8 68.1 Poland 67.7 66.2 Russia 74.7 72.2 Turkmenistan 69.9 67.4 Uzbekistan 70.4 68.1
Global Low income
53.8
54.4
Lower middle income 64.2 67.2
Upper middle income 44.3 49.0
High income 52.6 63.5
World 57.3 60.8 Reference: World Development Indicators. (2004). The World Bank.
Although female participation rate in the labour force decreased by 2% from 70.5% in 1980, about 68.9% of women ages 15-64 in Kazakhstan were in the labour force in 2002. This is one of the highest rates among the reference countries except Belarus, the Czech Republic and Russia. It is also higher than the lower-middle-income countries’ average of 67% and the global average of 61%.
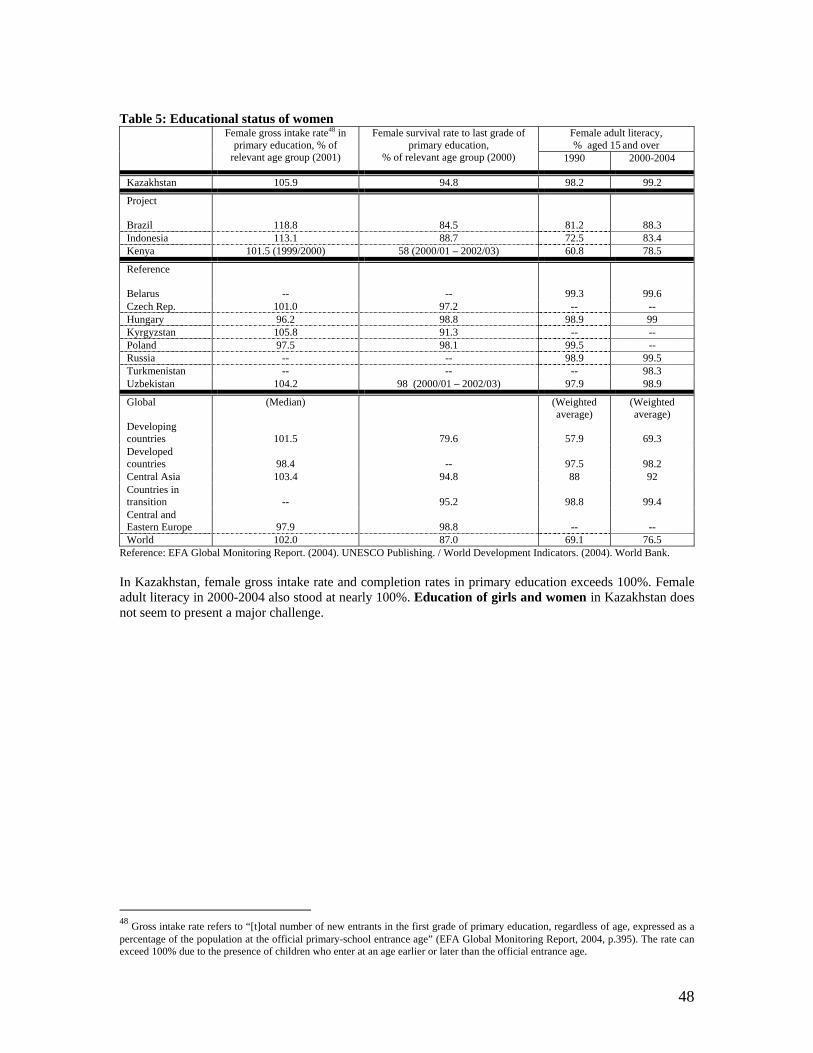
48
Table 5: Educational status of women
Female adult literacy, % aged 15 and over
Female gross intake rate48 in primary education, % of
relevant age group (2001)
Female survival rate to last grade of primary education,
% of relevant age group (2000) 1990 2000-2004
Kazakhstan 105.9 94.8 98.2 99.2
Project Brazil
118.8
84.5
81.2
88.3 Indonesia 113.1 88.7 72.5 83.4 Kenya 101.5 (1999/2000) 58 (2000/01 – 2002/03) 60.8 78.5
Reference Belarus -- -- 99.3 99.6 Czech Rep. 101.0 97.2 -- -- Hungary 96.2 98.8 98.9 99 Kyrgyzstan 105.8 91.3 -- -- Poland 97.5 98.1 99.5 -- Russia -- -- 98.9 99.5 Turkmenistan -- -- -- 98.3 Uzbekistan 104.2 98 (2000/01 – 2002/03) 97.9 98.9
Global Developing countries
(Median)
101.5
79.6
(Weighted average)
57.9
(Weighted average)
69.3
Developed countries
98.4
--
97.5
98.2
Central Asia 103.4 94.8 88 92 Countries in transition
--
95.2
98.8
99.4
Central and Eastern Europe
97.9
98.8
--
--
World 102.0 87.0 69.1 76.5 Reference: EFA Global Monitoring Report. (2004). UNESCO Publishing. / World Development Indicators. (2004). World Bank. In Kazakhstan, female gross intake rate and completion rates in primary education exceeds 100%. Female adult literacy in 2000-2004 also stood at nearly 100%. Education of girls and women in Kazakhstan does not seem to present a major challenge.
48 Gross intake rate refers to “[t]otal number of new entrants in the first grade of primary education, regardless of age, expressed as a percentage of the population at the official primary-school entrance age” (EFA Global Monitoring Report, 2004, p.395). The rate can exceed 100% due to the presence of children who enter at an age earlier or later than the official entrance age.

49
Table 6: Gender parity, vulnerability and reproductive health status of women
GDI rank49 Female headed households, % of total,
(year)
Adolescent fertility rate,
birth per 1,000 women, ages 15-
19, 2002
Pregnant women
receiving prenatal care, %
of total 1995-2002
Birth attended by
skilled health staff % of total, 1995-2002
Maternal mortality ratio,
per 100,000 live births, modelled estimates 2000
Kazakhstan 63 33 (1999) 35 91 99 210
Project Brazil
60
20 (1996)
68
86
88
260 Indonesia 90 12 (1997) 52 89 64 230 Kenya 114 31 (1998) 100 76 44 1,000
Reference Belarus 51 -- 21 100 100 35 Czech Rep. 32 -- 23 99 99 9 Hungary 35 -- 21 -- -- 16 Kyrgyzstan -- 26 (1997) 29 97 98 110 Poland 34 -- 15 -- 99 13 Russia 49 -- 46 -- 99 67 Turkmenistan 67 26 (2000) 16 98 97 31 Uzbekistan 85 22 (1996) 37 97 96 24
Global Low income
--
98
--
41
657 Lower middle income
--
33
--
78
112
Upper middle income
--
54
--
92
67
High income --
24
--
99
13
World
Norway: 1 Estonia: 33 Mexico: 50
Morocco: 100 Pakistan: 120
Niger: 144
-- 63 -- 60 403 Reference: World Development Indicators. (2004). World Bank. / Human Development Report. (2004). UNDP. Despite its female population’s active participation in education and the labour force, the Gender-related Development Index (GDI) of Kazakhstan ranks relatively low in the region at 63 out of 144;50 among the eight reference countries, only Turkmenistan (67) and Uzbekistan (85) lag behind Kazakhstan. Meanwhile, female-headed households are relatively prevalent in Kazakhstan (33%), compared with the project countries and the reference countries. Adolescent fertility rate (35 per thousand births) is relatively high compared with countries in the region except Russia and Uzbekistan, but certainly lower than the other project countries or the global average of 63. Ninety-one percent of pregnant women in Kazakhstan receive prenatal care, a rate lower than the reference countries’ in the region. However, when it comes to the percentage of births attended by skilled health staff, the percentage reaches nearly 100%. Yet, Kazakhstan’s maternal mortality ratio is 210 for every 100,000 cases, which is high compared with the reference countries or lower-middle-income countries.
49 Gender related development index (GDI) “adjusts the average achievement to reflect the inequalities between men and women” in life expectancy at birth, adult literacy and school enrolments, and estimated earned income (PPP US$). Human Development Report, 2004, p. 261. 50 In the Human Development Report (UNDP, 2004), GDIs are indicated for a total of 144 countries, with Norway ranked the first and Niger the last.
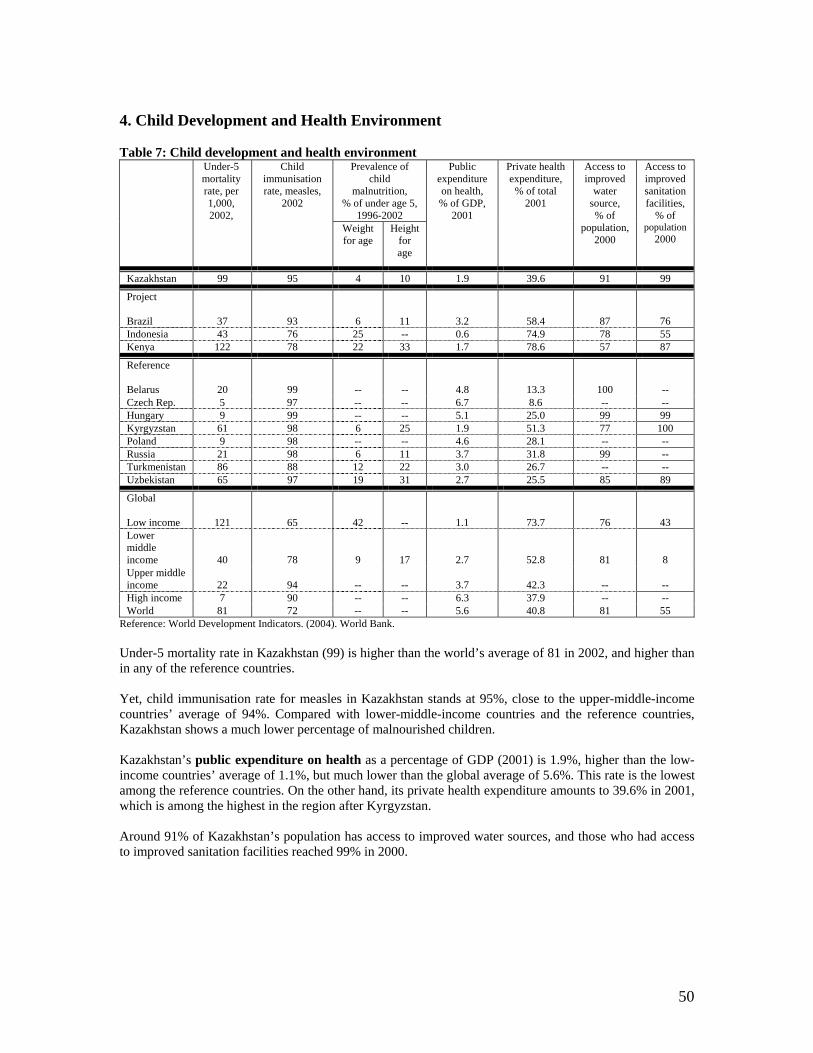
50
4. Child Development and Health Environment Table 7: Child development and health environment
Prevalence of child
malnutrition, % of under age 5,
1996-2002
Under-5 mortality rate, per 1,000, 2002,
Child immunisation rate, measles,
2002
Weight for age
Height for age
Public expenditure on health, % of GDP,
2001
Private health expenditure,
% of total 2001
Access to improved
water source, % of
population, 2000
Access to improved sanitation facilities,
% of population
2000
Kazakhstan 99 95 4 10 1.9 39.6 91 99
Project Brazil
37
93
6
11
3.2
58.4
87 76 Indonesia 43 76 25 -- 0.6 74.9 78 55 Kenya 122 78 22 33 1.7 78.6 57 87
Reference Belarus 20 99 -- -- 4.8 13.3 100 -- Czech Rep. 5 97 -- -- 6.7 8.6 -- -- Hungary 9 99 -- -- 5.1 25.0 99 99 Kyrgyzstan 61 98 6 25 1.9 51.3 77 100 Poland 9 98 -- -- 4.6 28.1 -- -- Russia 21 98 6 11 3.7 31.8 99 -- Turkmenistan 86 88 12 22 3.0 26.7 -- -- Uzbekistan 65 97 19 31 2.7 25.5 85 89
Global Low income
121
65
42
--
1.1
73.7
76 43 Lower middle income
40
78
9
17
2.7
52.8
81
8 Upper middle income
22
94
--
--
3.7
42.3
--
--
High income 7 90 -- -- 6.3 37.9 -- -- World 81 72 -- -- 5.6 40.8 81 55
Reference: World Development Indicators. (2004). World Bank. Under-5 mortality rate in Kazakhstan (99) is higher than the world’s average of 81 in 2002, and higher than in any of the reference countries. Yet, child immunisation rate for measles in Kazakhstan stands at 95%, close to the upper-middle-income countries’ average of 94%. Compared with lower-middle-income countries and the reference countries, Kazakhstan shows a much lower percentage of malnourished children. Kazakhstan’s public expenditure on health as a percentage of GDP (2001) is 1.9%, higher than the low-income countries’ average of 1.1%, but much lower than the global average of 5.6%. This rate is the lowest among the reference countries. On the other hand, its private health expenditure amounts to 39.6% in 2001, which is among the highest in the region after Kyrgyzstan. Around 91% of Kazakhstan’s population has access to improved water sources, and those who had access to improved sanitation facilities reached 99% in 2000.
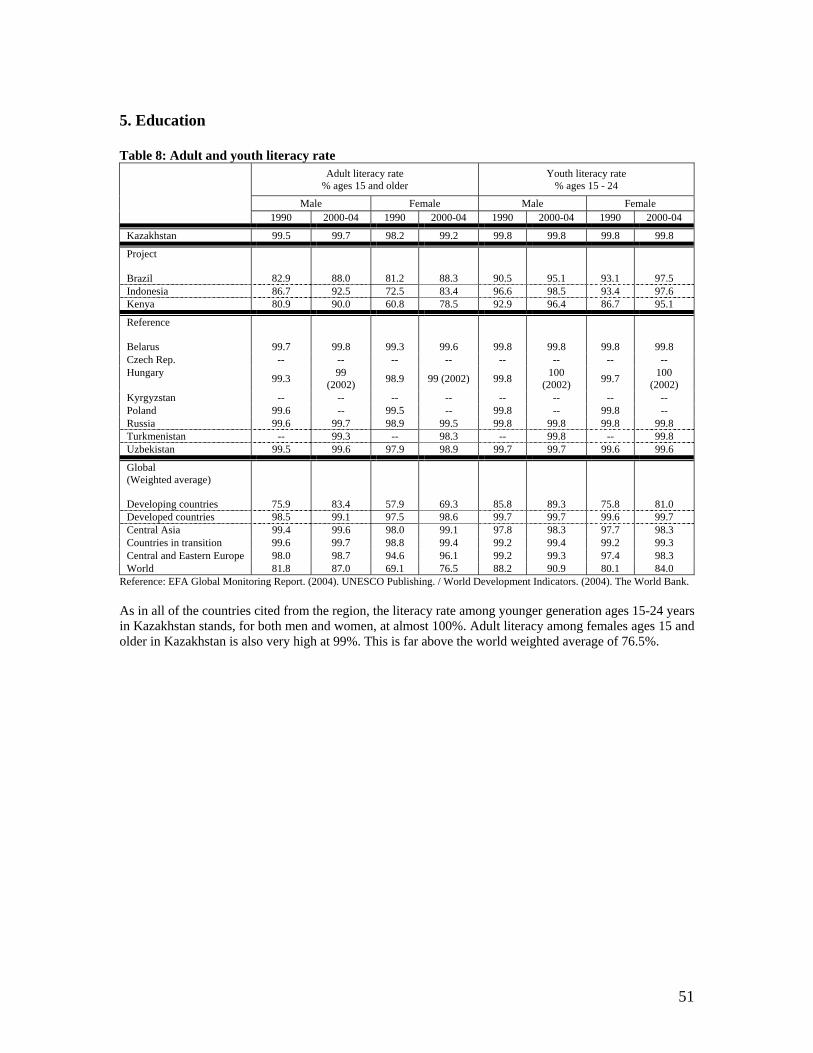
51
5. Education Table 8: Adult and youth literacy rate
Adult literacy rate % ages 15 and older
Youth literacy rate % ages 15 - 24
Male Female Male Female
1990 2000-04 1990 2000-04 1990 2000-04 1990 2000-04
Kazakhstan 99.5 99.7 98.2 99.2 99.8 99.8 99.8 99.8
Project Brazil 82.9 88.0 81.2 88.3 90.5 95.1 93.1 97.5 Indonesia 86.7 92.5 72.5 83.4 96.6 98.5 93.4 97.6 Kenya 80.9 90.0 60.8 78.5 92.9 96.4 86.7 95.1
Reference Belarus 99.7 99.8 99.3 99.6 99.8 99.8 99.8 99.8 Czech Rep. -- -- -- -- -- -- -- -- Hungary
99.3 99
(2002) 98.9 99 (2002) 99.8
100 (2002)
99.7 100
(2002) Kyrgyzstan -- -- -- -- -- -- -- -- Poland 99.6 -- 99.5 -- 99.8 -- 99.8 -- Russia 99.6 99.7 98.9 99.5 99.8 99.8 99.8 99.8 Turkmenistan -- 99.3 -- 98.3 -- 99.8 -- 99.8 Uzbekistan 99.5 99.6 97.9 98.9 99.7 99.7 99.6 99.6
Global (Weighted average) Developing countries 75.9 83.4 57.9 69.3 85.8 89.3 75.8 81.0 Developed countries 98.5 99.1 97.5 98.6 99.7 99.7 99.6 99.7 Central Asia 99.4 99.6 98.0 99.1 97.8 98.3 97.7 98.3 Countries in transition 99.6 99.7 98.8 99.4 99.2 99.4 99.2 99.3 Central and Eastern Europe 98.0 98.7 94.6 96.1 99.2 99.3 97.4 98.3 World 81.8 87.0 69.1 76.5 88.2 90.9 80.1 84.0
Reference: EFA Global Monitoring Report. (2004). UNESCO Publishing. / World Development Indicators. (2004). The World Bank. As in all of the countries cited from the region, the literacy rate among younger generation ages 15-24 years in Kazakhstan stands, for both men and women, at almost 100%. Adult literacy among females ages 15 and older in Kazakhstan is also very high at 99%. This is far above the world weighted average of 76.5%.

52
Table 9: Enrolments and internal efficiency in primary and secondary education
Enrolment ratios Internal efficiency Gross enrolment
ratio in pre-primary
education, 2001
Net enrolment ratio in primary
education, 2001
Net enrolment ratio in secondary education, 2001
Survival rate to last grade of
primary education, 2000
Repeaters in primary
school, 2001
Repeaters in secondary education,
2001
Kazakhstan
19 (2003)51
89.5
84.1
94.8
0.2
0.2
Project Brazil
67.3
96.5
71.6
79.9
21.5
18.0 Indonesia
20.3
92.1
47.4 (1999/2000)
85.9
5.3
0.3
Kenya
44.4
69.9
24.0
56 (2000/01-2002/03)
--
--
Reference Belarus
98.7 94.2 77.5 131 (2000/01-
2002/03) 0.3 0.3 Czech Rep. 95.6 88.5 89.5 96.6 1.1 1.1 Hungary 79.5 90.8 92.1 98.2 2.5 2.2 Kyrgyzstan 14.3 90.0 -- 91.3 0.2 0.2 Poland 49.0 98.0 91.3 98.2 0.6 1 Russia 91.9 -- -- 99.8 0.9 0.8 Turkmenistan -- -- -- -- -- -- Uzbekistan
21.4
--
--
98 (2000/01-2002/03)
--
--
Global Developing countries
35.0
(Weighted average)
82.5
(Weighted average)
48.5
77.5
7.7
(Median)
7.4 Developed countries
81.9
95.6
90.0
--
1.7
--
Central Asia 22.3 94.1 83.6 94.8 0.3 0.3 Countries in transition
30.5
90.1
85.0
95.3
0.3
0.3
Central and Eastern Europe
60.2
88.8
82.7
98.2
1.1
1.1 World 48.6 84.0 54.9 86.2 5.6 4.4
Reference: World Development Indicators. (2004). World Bank. / EFA Global Monitoring Report. (2004). UINESCO Publishing. / Global Education Digest: Comparing Education Statistics Across the World. (2004). UIS.
Net enrolment ratio in primary education in Kazakhstan is about 90%, above the weighted average of Central and Eastern Europe (89%) but lower than the weighted average of Central Asia (94%). Survival rate to last grade of primary education is nearly 95% while repetition is almost 0%. Net enrolment ratio in secondary education is 84.1%, higher than the world average of 54.9%. This rate, however, is lower than some of the reference countries, such as the Czech Republic (89.5%), Hungary (92.1%) and Poland (91.3%). Repetition rate in secondary education (0.2%) is negligible. Internal efficiency in primary and secondary education is not a major problem in Kazakhstan.
51 Data from the MOES, Republic of Kazakhstan.
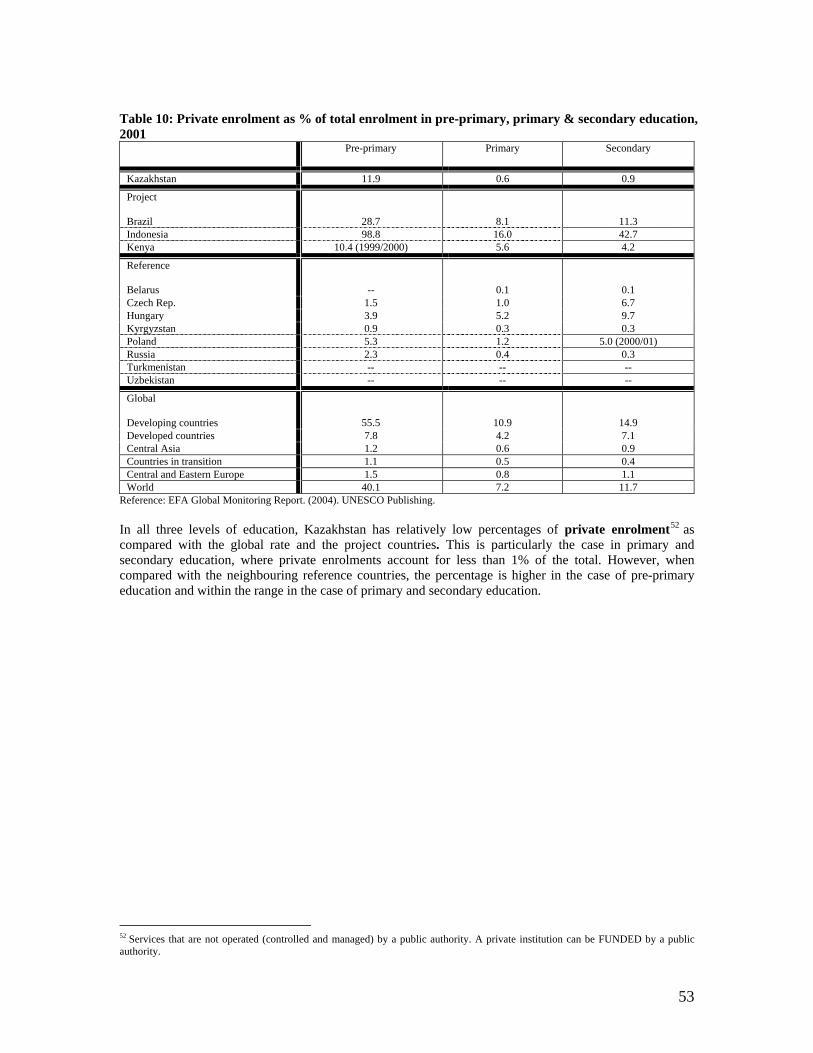
53
Table 10: Private enrolment as % of total enrolment in pre-primary, primary & secondary education, 2001
Pre-primary Primary Secondary
Kazakhstan 11.9 0.6 0.9
Project Brazil
28.7
8.1
11.3 Indonesia 98.8 16.0 42.7 Kenya 10.4 (1999/2000) 5.6 4.2
Reference Belarus -- 0.1 0.1 Czech Rep. 1.5 1.0 6.7 Hungary 3.9 5.2 9.7 Kyrgyzstan 0.9 0.3 0.3 Poland 5.3 1.2 5.0 (2000/01) Russia 2.3 0.4 0.3 Turkmenistan -- -- -- Uzbekistan -- -- --
Global Developing countries 55.5 10.9 14.9 Developed countries 7.8 4.2 7.1 Central Asia 1.2 0.6 0.9 Countries in transition 1.1 0.5 0.4 Central and Eastern Europe 1.5 0.8 1.1 World 40.1 7.2 11.7
Reference: EFA Global Monitoring Report. (2004). UNESCO Publishing. In all three levels of education, Kazakhstan has relatively low percentages of private enrolment52 as compared with the global rate and the project countries. This is particularly the case in primary and secondary education, where private enrolments account for less than 1% of the total. However, when compared with the neighbouring reference countries, the percentage is higher in the case of pre-primary education and within the range in the case of primary and secondary education.
52 Services that are not operated (controlled and managed) by a public authority. A private institution can be FUNDED by a public authority.

54
Table 11: Educational financing
PPP gross national income, per capita ($), 2002
Public expenditure on education,
% of GDP, 2001-02
Kazakhstan 5,630 4.4
Project Brazil
7,450
4.0 Indonesia 3,070 1.3 Kenya 1,010 6.3
Reference Belarus 5,500 6.0 Czech Rep. 14,920 4.4 Hungary 13,070 4.9 Kyrgyzstan 1,560 3.1 Poland 10,450 5.0 Russia 8,080 3.1 Turkmenistan 4,780 -- Uzbekistan 1,640 --
Global Low income
2,110
3.1 Lower middle income
5,290
4.0
Upper middle income
9,550
4.4
High income 28,480 5.2 World 7,820 4.1
Reference: World Development Indicators. (2004). World Bank. Kazakhstan’s expenditure on education as a percentage of GDP stands at 4.4%, higher than the world average and equal to the upper-middle-income countries’ average. However, it remains lower than Belarus, Hungary and Poland where the numbers are 6.0%, 4.9% and 5.0%, respectively.

55
Table 12: Pupil/teacher ratio in pre-primary, primary and secondary education
Pre-primary Primary Secondary Pupil/teacher ratio Pupil/teacher ratio Pupil/teacher ratio
1998 2001 1998 2001 1998 2001
Kazakhstan 9 5 18 19 -- 12
Project Brazil
20
19
--
23
--
19 Indonesia -- 13 -- 21 -- 14 Kenya
27
25
29
32
26
26 (2000/01)
Reference Belarus 5 5 20 17 -- 9 Czech Republic
18
18 (1999/2000)
18
17
13
14 (1999/2000)
Hungary 12 11 11 10 10 11 Kyrgyzstan 12 19 25 24 13 13 Poland -- 12 (2000/01) -- 15 -- -- Russia -- 6 -- 17 -- -- Turkmenistan -- -- -- -- -- -- Uzbekistan -- 7 -- -- -- --
Developing Countries
22
21
28
28
19
20
Developed countries 16 14 16 15 13 12 Central Asia 12 10 20 19 13 12 Countries in transition 9 8 20 19 -- 12 Central and Eastern Europe 12 11 19 17 13 13 World 19 18 24 22 17 17
Reference: EFA Global Monitoring Report. (2004). UNESCO Publishing.
The pupil/teacher ratio in pre-primary education in Kazakhstan stood at 5 in 2001, a ratio lower than most of the reference countries except Belarus. Its pupil/teacher ratio in secondary education is relatively low (12 in 2001) compared to the world median.
Related Documents