Policy, Practice, and Readiness to Teach Primary and Secondary Mathematics in 17 Countries Findings from the IEA Teacher Education and Development Study in Mathematics (TEDS-M) Maria Teresa Tatto Ray Peck John Schwille Kiril Bankov Sharon L. Senk Michael Rodriguez Lawrence Ingvarson Mark Reckase Glenn Rowley

Welcome message from author
This document is posted to help you gain knowledge. Please leave a comment to let me know what you think about it! Share it to your friends and learn new things together.
Transcript

TEDS
Policy, Practice, and Readiness to Teach Primary and Secondary Mathematics in 17 Countries
Findings from the IEA Teacher Education and Development Study in Mathematics (TEDS-M)
Maria Teresa Tatto Ray Peck John Schwille Kiril BankovSharon L. Senk Michael RodriguezLawrence Ingvarson Mark Reckase Glenn Rowley

1
Policy, Practice, and Readiness to Teach Primary and Secondary Mathematics in 17 Countries
Findings from the IEA Teacher Education and Development Study in Mathematics (TEDS-M)
Maria Teresa Tatto Ray Peck John Schwille Kiril BankovSharon L. Senk Michael Rodriguez Lawrence Ingvarson Mark ReckaseGlenn Rowley
with Jean Dumais, Ralph Carstens, Falk Brese, Sabine Meinck, Inese Berzina-Pitcher, Yang Lu, and Richard Holdgreve-Resendez
THE TEACHER EDUCATION AND DEVELOPMENT STUDY IN MATHEMATICS (TEDS-M)2
Copyright © 2012 International Association for the Evaluation of Educational Achievement (IEA)
All rights reserved. No part of the publication may be reproduced, stored in a retrieval system or
transmitted in any form or by any means, electronic, electrostatic, magnetic tape, mechanical,
photocopying, recoding, or otherwise without permission in writing from the copyright holder.
ISBN/EAN: 978-90-79549-12-2
Copies of Policy, Practice, and Readiness to Teach Primary and Secondary Mathematics in 17 Countries
can be obtained from:
IEA Secretariat
Herengracht 487
1017 BT Amsterdam, the Netherlands
Telephone: +31 20 625 3625
Fax: + 31 20 420 7136
Email: [email protected]
Website: www.iea.nl
Printed by Multicopy, Amsterdam, The Netherlands
Edited by Paula Wagemaker Editorial Services, Christchurch, New Zealand
Designed by Becky Bliss Design and Production, Wellington, New Zealand

3
Foreword
As an international non-profit research organization, the International Association for
the Evaluation of Educational Achievement (IEA) has, over the past 50 years, conducted
a large number of studies which focus on the outcomes of schooling in key subject-
matter areas at important educational transition points. These studies have provided
powerful insights into the home- and school-based factors implicated in learning
outcomes at the school level. However, IEA has not focused undivided attention on
what is arguably the key element of successful learning—teachers. The IEA Teacher
Education and Development Study-Mathematics (TEDS-M) is a step toward remedying
that situation.
TEDS-M represents the first large-scale, international comparative study of the
preparation of primary and lower-secondary (specifically, mathematics) teachers. IEA
considers TEDS-M a landmark study in terms of its examination, within both national
and international contexts, of country-level policies relating to the preparation of
future teachers of mathematics. The authors of this report look closely at how these
policies are played out in the participating countries’ varied teacher education programs
and instructional practices, and speculate on the implications of these programs
and practices for student learning in schools. They also suggest how TEDS-M might
contribute to ongoing research into teacher education.
IEA sees TEDS-M as a blueprint for ongoing IEA (and other interested parties’) work on
teaching teachers to teach. The study evolved through a collaborative process involving
many individuals and experts from around the world, including not only the study
directors but also expert panel members and national research coordinators.
Support for this project was provided by generous funding from the US National
Science Foundation, participating countries, and from IEA’s own resources. It is,
however, ultimately the responsibility of a number of key individuals to ensure that the
ambitious goals of projects such as this one are translated into reality.
For their efforts in making TEDS-M and like projects a reality, I thank in particular
Michigan State University’s (MSU) Dr Maria Teresa Tatto, the study’s executive director
and principal investigator. I also offer sincere thanks to the study’s co-directors and
investigators: Dr Jack Schwille and Dr Sharon Senk, from Michigan State University,
and Dr Lawrence Ingvarson, Dr Glenn Rowley, and Dr Ray Peck from the Australian
Council for Educational Research (ACER). MSU and ACER provided the international
research centers for TEDS-M. Thanks go to the researchers from both centers who
contributed to this project.
I furthermore acknowledge Dr Barbara Malak of the IEA Secretariat along with Dirk
Hastedt, Ralph Carstens, Falk Brese, Sabine Meinck, and Robert Whitwell of the IEA
Data Processing and Research Center for their contributions to the development and
reporting of this project. Jean Dumais from Statistics Canada served the important role
of sampling referee for TEDS-M.

THE TEACHER EDUCATION AND DEVELOPMENT STUDY IN MATHEMATICS (TEDS-M)4
IEA studies rely on national teams headed by the national research coordinators in
participating countries. They are the people who manage and execute the study at
the national level. Their contribution is highly appreciated. This study also would
not be possible without the participation of many futures teachers, teacher educators,
and policymakers within these countries. The education world benefits from their
commitment.
Hans Wagemaker
Executive Director, IEA
AMSTERDAM, MARCH 2012

5
Table of Contents
Foreword 3
List of Exhibits 10
CHAPTER 1: THE TEACHER EDUCATION AND DEVELOPMENT STUDY IN 17 MATHEMATICS: AN INTRODUCTORY OVERVIEW
1.1. TEDS-M—Genesis, Purpose, Participants, and Funding 17
1.2 Factors of Potential Relevance to the Education and Performance of Future 18
Teachers
1.2.1 Student Achievement in Mathematics 18
1.2.2 The Mathematics Curriculum 19
1.2.3 The Quality of Mathematics Lessons 19
1.2.4 The Nature of Teacher Education Programs 19
1.2.5 The Content of Teacher Education Programs 20
1.3 Research Questions 21
1.3.1 Research Question 1 21
1.3.2 Research Question 2 22
1.3.3 Research Question 3 22
1.4 The Design of TEDS-M 22
1.4.1 Data Sources 23
1.4.2 Sampling Process 23
1.5 Distinctive Characteristics of and Target Audiences for TEDS-M 23
1.6 Content of this Report 24
References 25
CHAPTER 2: TEACHER EDUCATION POLICIES AND EMPLOYMENT 27 CONDITIONS IN TEDS-M COUNTRIES
2.1 Chapter Overview 27
2.1.1 TEDS-M Organizational Terminology 27
2.2 Structure and Organization of Teacher Education Program-Types 28
2.2.1 Concurrent and Consecutive Program-Types 33
2.2.2 School Grade Levels for which a Program-Type Prepares Teachers 33
2.2.3 Program-Type Duration 34
2.2.4 Subject-Matter Specialization 35
2.2.5 Relative Size of Different Program-Types 35
2.2.6 Grouping Program-Types for Cross-National Analysis 36
2.2.7 Locus of Control with Respect to the Organization of Teacher 37
Education
2.3 Employment and Working Conditions for Practicing Teachers 38
2.3.1 Policies Concerning Systems of Teacher Employment 38
2.3.2 Teacher Working Conditions 38
2.3.3 Teacher Salaries and Incentives 39
2.3.4 Teacher Supply and Demand 40

THE TEACHER EDUCATION AND DEVELOPMENT STUDY IN MATHEMATICS (TEDS-M)6
2.4 Quality Assurance in Teacher Education 40
2.4.1 Recruitment and Selection of Future Teachers 41
2.4.2 Evaluation and Accreditation of Teacher Education Institutions 46
2.4.3 Requirements for Entry to the Teaching Profession 48
2.4.4 Summary of Quality Assurance Policies in TEDS-M Countries 50
2.5 Conclusion 53
References 54
CHAPTER 3.THE DISTINCTIVE NATIONAL IMPRINT OF EACH TEDS-M 57 SYSTEM 57
3.1 Chapter Overview 57
3.2 National Differences in Demographic and Development Indicators 57
3.3 Country-by-Country Introduction to Program-Types and Their National 61
Contexts
3.3.1 Botswana 61
3.3.2 Canada (Newfoundland and Labrador, Nova Scotia, Québec and 63
Ontario)
3.3.3 Chile 65
3.3.4 Chinese Taipei 66
3.3.5 Georgia 68
3.3.6 Germany 70
3.3.7 Malaysia 73
3.3.8 Norway 75
3.3.9 Oman 77
3.3.10 Philippines 78
3.3.11 Poland 80
3.3.12 The Russian Federation 82
3.3.13 Singapore 84
3.3.14 Spain 86
3.3.15 Switzerland 87
3.3.16 Thailand 89
3.3.17 The United States 91
3.4 Conclusion 93
References 93
CHAPTER 4: CHARACTERISTICS OF TEACHER EDUCATION PROGRAMS, 95 TEACHER EDUCATORS, AND FUTURE TEACHERS
4.1 Chapter Overview 95
4.2 Institutional Program Structures and Characteristics 95
4.2.1 Institutions Sampled 95
4.2.2 Program-Groups 97
4.2.3 Program Entry Requirements 97
4.2.4 The Content of Teacher Education Programs 101
4.2.5 Graduation Standards and Guidelines 109
4.3 Teacher Educator Background and Characteristics 111
4.3.1 Teacher Educator Samples 112
4.3.2 Academic and Professional Qualifications of Teacher Educators 114

7
4.4 Future Teachers’ Backgrounds and Characteristics 116
4.4.1 Age of Future Teachers at the Time of the Assessment 118
4.4.2 Gender 119
4.4.3 Future Teachers’ Self-Reported Level of Achievement in Secondary 119
School
4.4.4 Indicators of Socioeconomic Status of Future Teachers 121
4.4.5 Level of Education in the Family 122
4.4.6 Language Spoken at Home 122
4.4.7 Previous Careers and Future Commitment to Teaching 122
4.4.8 Reasons for Becoming a Teacher 125
4.5 Conclusion 126
4.5.1 Teacher Education Institutions and Programs 126
4.5.2 Teacher Educators 127
4.5.3 Future Teachers 127
References 127
CHAPTER 5: THE MATHEMATICS CONTENT KNOWLEDGE AND 129MATHEMATICS PEDAGOGICAL CONTENT KNOWLEDGE OF FUTURE PRIMARY AND LOWER-SECONDARY TEACHERS
5.1 Chapter Overview 129
5.2 Framework for Measuring Knowledge for Teaching Mathematics 129
5.2.1 Framework for Mathematics Content Knowledge 129
5.2.2 Framework for Mathematics Pedagogical Content Knowledge 131
5.3 Instrument Design 132
5.3.1 Survey for Future Primary Teachers 132
5.3.2 Survey for Future Lower-Secondary Teachers 133
5.4 Future Teachers’ Knowledge of Mathematics for Teaching 133
5.4.1 Future Primary Teachers’ Mathematics Knowledge 136
5.4.2 Future Lower-Secondary Teachers’ Mathematics Knowledge 142
5.5 Conclusion 149
References 151
CHAPTER 6: BELIEFS ABOUT MATHEMATICS AND MATHEMATICS 153 LEARNING
6.1 Chapter Overview 153
6.2 Beliefs about the Nature of Mathematics 154
6.2.1 Mathematics as a Set of Rules and Procedures 154
6.2.2 Mathematics as a Process of Enquiry 155
6.3 Beliefs about Learning Mathematics 155
6.3.1 Learning Mathematics through Following Teacher Direction 155
6.3.2 Learning Mathematics through Active Involvement 156
6.4 Beliefs about Mathematics Achievement 156
6.4.1 Mathematics as a Fixed Ability 156
6.5 Scaling of Beliefs 157
6.5.1 IRT Scales for Documenting Relationships among Measures 157
6.5.2 Percent Endorsement for Descriptive Display 157
TAbLE Of CONTENTS

THE TEACHER EDUCATION AND DEVELOPMENT STUDY IN MATHEMATICS (TEDS-M)8
6.6 Results 158 6.6.1 IRT Scales 158
6.6.2 Descriptive Displays 158 6.6.3 Relationships between Beliefs and Mathematics Knowledge 1686.7 Conclusion: Policy Considerations 172References 172
CHAPTER 7: OPPORTUNITY TO LEARN 175
7.1 Chapter Overview 1757.2 Data Used in this Chapter 1757.3 Opportunity to Learn Tertiary-Level Mathematics 178 7.3.1 Future Primary Teachers 179 7.3.2 Future Lower-Secondary Teachers 1797.4 Opportunity to Learn School-Level Mathematics 181 7.4.1 Future Primary Teachers 181 7.4.2 Future Lower-Secondary Teachers 1837.5 Opportunity to Learn Mathematics Pedagogy 183 7.5.1. Future Primary Teachers 183 7.5.2 Future Lower-Secondary Teachers 1857.6 Opportunity to Learn General Pedagogy 185 7.6.1 Future Primary Teachers 185 7.6.2 Future Lower-Secondary Teachers 1857.7 Opportunity to Learn about Teaching Diverse Students 187 7.7.1 Future Primary Teachers 187 7.7.2 Future Lower-Secondary Teachers 1907.8 Opportunity to Learn to Teach Mathematics through School-Based 190 Experiences 7.8.1 Future Primary Teachers 193 7.8.2 Future Lower-Secondary Teachers 1937.9 Opportunity to Learn in a Coherent Program 193 7.9.1 Future Primary Teachers 194 7.9.2 Future Lower-Secondary Teachers 1947.10 Conclusion: Patterns Relating to Opportunities to Learn 194References 197
CHAPTER 8: OVERVIEW OF RESULTS AND CONCLUSIONS 199
8.1 Chapter Overview: The Study of Mathematics Teacher Education 1998.2 Explaining Country Context and Program Variation 199 8.2.1 Variation across Countries 200 8.2.2 Variation across Institutions and Programs 200 8.2.3 Variation among Teacher Educators 201 8.2.4 Variation among Future Teachers 2018.3 Explaining Variation within and across Teacher Education Programs 202 8.3.1 Mathematics and Mathematics Pedagogy Content Knowledge 202 8.3.2 Beliefs 203 8.3.3 Opportunities to Learn in Teacher Education Programs 204 8.3.4 Context and Policy 2058.4 Contribution of TEDS-M to the Study of Mathematics 207
Teacher Education
References 207

9
APPENDICES 209
Appendix A: Supplementary Exhibits Relating to Chapters 3, 4, 6, and 7 211
A.1 Chapter 3 Exhibits 211
A.2 Chapter 4 Exhibits 215
A.3 Chapter 6 Exhibits 240
A.4 Chapter 7 Exhibits 255
Appendix B: Sampling, Scaling, and Reporting Procedures 259B.1 Sampling 259
B.1.1 International Sampling Plan 259
B.1.2 Target Populations: International Requirements and National 260
Implementation
B.1.3 Sample Size Requirements and Implementation 261
B.1.4 Sample Selection 262
B.2 Participation Rates and Adjudication 263
B.3 Weights, Estimation and Sampling Error 264
B.3.1 Computing the Estimation Weights and Estimates 264
B.3.2 Estimating Sampling Error 267
B.4 Calibration and Scale Development 273
B.4.1 Methods Used to Determine MCK and MPCK Scales and 273
Anchor Points
B.4.2 Calibrations and Weights 273
B.4.3 Score Generation 273
B.4.4 Standardization 274
B.4.5 Developing Anchor Points 274
B.5 Reporting Knowledge Scales 275
B.5.1 Country Comparisons 275
B.5.2 Program-Groups 276
B.6 Methods Used to Determine the Opportunity to Learn and Beliefs 281
Scales and Reporting
B.6.1 Opportunity to Learn Measures 281
B.6.2 Opportunity to Learn Scale Development 283
B.6.3 Development, Scaling, and Scoring of Beliefs Scales 285
References 287
Appendix C: Organizations and Individuals Responsible for TEDS-M 289C.1 Introduction 289
C.2 TEDS-M Management and Coordination 289
C.3 Technical and Editorial Advice 291
C.4 Funding 291
C.5 Listings of Organizations and Individuals Responsible for TEDS-M 291
TAbLE Of CONTENTS
THE TEACHER EDUCATION AND DEVELOPMENT STUDY IN MATHEMATICS (TEDS-M)10
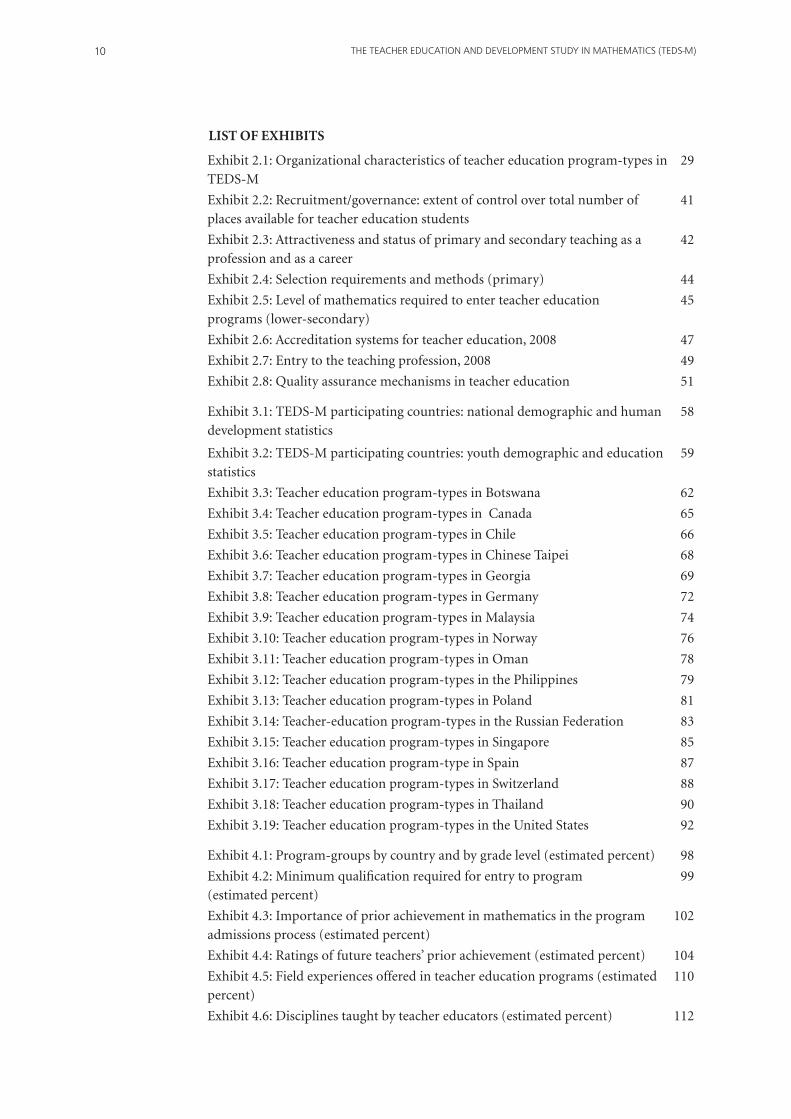
LIST OF EXHIBITS
Exhibit 2.1: Organizational characteristics of teacher education program-types in 29
TEDS-M
Exhibit 2.2: Recruitment/governance: extent of control over total number of 41
places available for teacher education students
Exhibit 2.3: Attractiveness and status of primary and secondary teaching as a 42
profession and as a career
Exhibit 2.4: Selection requirements and methods (primary) 44
Exhibit 2.5: Level of mathematics required to enter teacher education 45
programs (lower-secondary)
Exhibit 2.6: Accreditation systems for teacher education, 2008 47
Exhibit 2.7: Entry to the teaching profession, 2008 49
Exhibit 2.8: Quality assurance mechanisms in teacher education 51
Exhibit 3.1: TEDS-M participating countries: national demographic and human 58
development statistics
Exhibit 3.2: TEDS-M participating countries: youth demographic and education 59
statistics
Exhibit 3.3: Teacher education program-types in Botswana 62
Exhibit 3.4: Teacher education program-types in Canada 65
Exhibit 3.5: Teacher education program-types in Chile 66
Exhibit 3.6: Teacher education program-types in Chinese Taipei 68
Exhibit 3.7: Teacher education program-types in Georgia 69
Exhibit 3.8: Teacher education program-types in Germany 72
Exhibit 3.9: Teacher education program-types in Malaysia 74
Exhibit 3.10: Teacher education program-types in Norway 76
Exhibit 3.11: Teacher education program-types in Oman 78
Exhibit 3.12: Teacher education program-types in the Philippines 79
Exhibit 3.13: Teacher education program-types in Poland 81
Exhibit 3.14: Teacher-education program-types in the Russian Federation 83
Exhibit 3.15: Teacher education program-types in Singapore 85
Exhibit 3.16: Teacher education program-type in Spain 87
Exhibit 3.17: Teacher education program-types in Switzerland 88
Exhibit 3.18: Teacher education program-types in Thailand 90
Exhibit 3.19: Teacher education program-types in the United States 92
Exhibit 4.1: Program-groups by country and by grade level (estimated percent) 98
Exhibit 4.2: Minimum qualification required for entry to program 99
(estimated percent)
Exhibit 4.3: Importance of prior achievement in mathematics in the program 102
admissions process (estimated percent)
Exhibit 4.4: Ratings of future teachers’ prior achievement (estimated percent) 104
Exhibit 4.5: Field experiences offered in teacher education programs (estimated 110
percent)
Exhibit 4.6: Disciplines taught by teacher educators (estimated percent) 112
11
Exhibit 4.7: Gender of teacher educators by disciplines taught (estimated 113
percent female)
Exhibit 4.8: Teacher educators rating mathematics as their “main specialty” 115
by disciplines taught (estimated percent)
Exhibit 4.9: Teacher educators who hold teaching certification by disciplines 116
taught (estimated percent)
Exhibit 4.10: Future teachers’ ages at the time of the TEDS-M assessment 118
(estimated mean in years)
Exhibit 4.11: Gender of future teachers (estimated percent female) 120
Exhibit 4.12: Future teachers’ use of the language of the test at home 123
(estimated percent)
Exhibit 4.13: Future teachers’ responses on whether they had another career 124
before entering teaching (estimated percent responding “yes”)
Exhibit 5.1: Mathematics content knowledge framework, by content subdomain 130
Exhibit 5.2: Mathematics content knowledge framework, by cognitive domain 130
Exhibit 5.3: Mathematics pedagogical content knowledge (MPCK) framework 131
Exhibit 5.4: Overall structure of booklets for the future teacher surveys and 132
allocated times for administration
Exhibit 5.5: TEDS-M rotated block design for the primary survey of 133
knowledge of mathematics for teaching
Exhibit 5.6: TEDS-M rotated block design for the lower-secondary survey of 133
knowledge of mathematics for teaching
Exhibit 5.7: Complex multiple-choice MCK Items MFC202A–D 137
Exhibit 5.8: Multiple-choice MCK Item MFC408 138
Exhibit 5.9: Constructed-response MCK Item MFC509 138
Exhibit 5.10: Future primary teachers’ mathematics content knowledge 139
Exhibit 5.11: Constructed-response MPCK Item MFC505 141
Exhibit 5.12: Constructed-response Items MFC208A–B 141
Exhibit 5.13: Future primary teachers’ mathematics pedagogy content 143
knowledge
Exhibit 5.14: Constructed-response Items MFC604A1–A2 145
Exhibit 5.15: Constructed-response Item MFC704 145
Exhibit 5.16: Multiple-choice MCK Item MFC804 146
Exhibit 5.17: Future lower-secondary teachers’ mathematics content knowledge 147
Exhibit 5.18: Complex multiple-choice MPCK Items MFC709A–B 148
Exhibit 5.19: Constructed-response MPCK Item MFC604B from the 149
lower-secondary survey
Exhibit 5.20: Future secondary teachers’ mathematics pedagogy content 150
knowledge
Exhibit 6.1: Beliefs about mathematics and mathematics learning: percent of 160
statements endorsed, by respondent type within country
Exhibit 6.2: Mathematics is a set of rules and procedures: percentages of 163
teacher educators and future teachers endorsing this statement, by country
Exhibit 6.3: Mathematics is a process of enquiry: percentages of teacher educators 164
and future teachers endorsing this statement, by country

THE TEACHER EDUCATION AND DEVELOPMENT STUDY IN MATHEMATICS (TEDS-M)12
Exhibit 6.4: Learn mathematics by following teacher direction: percentages of 165
teacher educators and future teachers endorsing this statement, by country
Exhibit 6.5: Learn mathematics through active involvement: Percentages of 166
teacher educators and future teachers endorsing this statement, by country
Exhibit 6.6: Mathematics is a fixed ability: Percentages of teacher educators and 167
future teachers endorsing this statement, by country
Exhibit 6.7: Correlations of beliefs about mathematics and mathematics learning 170
with mathematics content knowledge, by country
Exhibit 6.8: Correlations of beliefs about mathematics and mathematics learning 171
with mathematics pedagogy content knowledge, by country
Exhibit 7.1: Proportion of topics in tertiary-level mathematics studied by 180 program-group
Exhibit 7.2: Proportion of topics in school-level mathematics studied by 182
program-group
Exhibit 7.3: Proportion of topics in mathematics pedagogy studied by 184
program-group
Exhibit 7.4: Future primary teachers’ opportunity to learn: general pedagogy 186
Exhibit 7.5: Future primary teachers’ opportunity to learn: teaching for 188
diversity
Exhibit 7.6: Future secondary teachers’ opportunity to learn: teaching for 189
diversity
Exhibit 7.7: Future primary teachers’ practicum: connecting theory to practice 191
Exhibit 7.8: Future secondary teachers’ practicum: connecting theory to 192
practice
Exhibit 7.9: Future primary teachers’ program coherence 195
Exhibit 7.10: Future secondary teachers’ program coherence 196
Appendices
Exhibit A3.1: Sources of national demographic and human development 211
statistics
Exhibit A3.2: Sources of national youth and education statistics 212
Exhibit A4.1: Mean number of teaching contact hours in liberal arts, academic 215
mathematics, and mathematics content related to the school mathematics
curriculum that future primary teachers experience during their programs
(estimated means in hours)
Exhibit A4.2: Mean number of teaching contact hours in liberal arts, academic 216
mathematics, and mathematics content related to the school mathematics
curriculum that future lower-secondary teachers experience during their
programs (estimated means in hours)
Exhibit A4.3: Mean number of teaching contact hours in mathematics 217
pedagogy, foundations, and pedagogy courses that future primary teachers
experience during their programs (estimated means in hours)
Exhibit A4.4: Mean number of teaching contact hours in mathematics 218
pedagogy, foundations, and pedagogy courses that future lower-secondary
teachers experience during their programs (estimated means in hours)

13
Exhibit A4.5: Graduation requirements for future primary teachers (estimated 219
percent) (Part 1)
Exhibit A4.6: Graduation requirements for future primary teachers (estimated 220
percent) (Part 2)
Exhibit A4.7: Graduation requirements for future lower-secondary teachers 221
(estimated percent) (Part 1)
Exhibit A4.8: Graduation requirements for future lower-secondary teachers 222
(estimated percent) (Part 2)
Exhibit A4.9: Locus of control of performance standards in teacher education 223
(estimated percent)
Exhibit A4.10: Teacher educators’ qualifications in mathematics, by disciplines 225
taught (estimated percent)
Exhibit A4.11: Teacher educators’ qualifications in mathematics education, by 226
disciplines taught (estimated percent)
Exhibit A4.12: Teacher educators’ qualifications in education, by disciplines 227
taught (estimated percent female)
Exhibit A4.13: Future primary teachers’ level of achievement during secondary 228
school (estimated percent)
Exhibit A4.14: Future lower-secondary teachers’ level of achievement in 229
secondary school (estimated percent)
Exhibit A4.15: Future primary teachers’ estimates of the number of books in 230
their parents’ or guardians’ homes (estimated percent)
Exhibit A4.16: Future lower-secondary teachers’ estimates of the number of 231
books in their parents’ or guardians’ homes (estimated percent)
Exhibit 4.17: Future primary teachers’ reports of the educational resources they 232
have at home (estimated percent)
Exhibit A4.18: Future lower-secondary teachers’ reports of the educational 233
resources they have at home (estimated percent)
Exhibit A4.19: Future primary teachers’ reports of the highest level of education 234
completed by their mothers, stepmothers, or female guardians (estimated
percent)
Exhibit A4.20: Future lower-secondary teachers’ reports of the highest level of 235
education completed by their mothers, stepmothers, or female guardians
(estimated percent)
Exhibit A4.21: Future primary teachers’ reports of the highest level of 236
education completed by their fathers, stepfathers, or male guardians
(estimated percent)
Exhibit A4.22: Future lower-secondary teachers’ reports of the highest level 237
of education completed by their fathers, stepfathers, or male guardians
(estimated percent)
Exhibit 4.23: Future primary teachers selecting significant or major reasons for 238
becoming a teacher (estimated percent)
Exhibit A4.24: Future lower-secondary teachers selecting significant or major 239
reasons for becoming a teacher (estimated percent)

THE TEACHER EDUCATION AND DEVELOPMENT STUDY IN MATHEMATICS (TEDS-M)14
Exhibit A6.1: Mathematics is a set of rules and procedures: future primary 240
teachers’ endorsement of this statement
Exhibit A6.2: Mathematics is a process of enquiry: future primary teachers’ 241
endorsement of this statement
Exhibit A6.3: Learn mathematics through teacher direction: future primary 242
teachers’ endorsement of this statement
Exhibit A6.4: Learn mathematics through active involvement: future primary 243
teachers’ endorsement of this statement
Exhibit A6.5: Mathematics is a fixed ability: future primary teachers’ 244
endorsement of this statement
Exhibit A6.6: Mathematics is a set of rules and procedures: future secondary 245
teachers’ endorsement of this statement
Exhibit A6.7: Mathematics is a process of enquiry: future secondary teachers’ 246
endorsement of this statement
Exhibit A6.8: Learn mathematics through teacher direction: future 247
secondary teachers’ endorsement of this statement
Exhibit A6.9: Learn mathematics through active involvement: future 248
secondary teachers’ endorsement of this statement
Exhibit A6.10: Mathematics is a fixed ability: future secondary teachers’ 249
endorsement of this statement
Exhibit A6.11: Mathematics is a set of rules and procedures: teacher educators’ 250
endorsement of this statement
Exhibit A6.12: Mathematics is a process of enquiry: teacher educators’ 251
endorsement of this statement
Exhibit A6.13: Learn mathematics through teacher direction: teacher 252 educators’ endorsement of this statement
Exhibit A6.14: Learn mathematics through active involvement: teacher 253 educators’ endorsement of this statement
Exhibit A6.15: Mathematics is a fixed ability: teacher educators’ endorsement 254 of this statement
Exhibit A7.1: Areas of tertiary-level mathematics included in the OTL 255
questionnaire
Exhibit A7.2. Areas of school-level mathematics included in the OTL 255
questionnaire
Exhibit A7.3: Future primary teachers: topics on mathematics pedagogy studied 256
Exhibit A7.4: All future teachers: topics on general pedagogy studied 256
Exhibit A7.5: All future teachers: topics on teaching diverse students studied 256
Exhibit A7.6: All future teachers: items in the classroom to practice index 257
Exhibit A7.7: All future teachers: items in the teacher education program 257
coherence index

15
Exhibit B.1: Summary of annotation recommendations 265
Exhibit B.2: Unweighted participation rates for institutions, future primary 268
and lower-secondary teachers, and teacher educators
Exhibit B.3: Institutions: expected and achieved sample sizes 269
Exhibit B.4: Future primary teachers: expected and achieved sample sizes 270
Exhibit B.5: Future lower-secondary teachers: expected and achieved 271
sample sizes
Exhibit B.6: Teacher educators: expected and achieved sample sizes 272
Exhibit B.7: TEDS-M assessment reliabilities 274
Exhibit B.8: Program types and groupings: future primary teachers 277
Exhibit B.9: Program-types and groupings: future secondary teachers 279
Exhibit B.10: Opportunity to learn indices 282
Exhibit B.11: Beliefs indices 286

THE TEACHER EDUCATION AND DEVELOPMENT STUDY IN MATHEMATICS (TEDS-M)16

17AN INTRODUCTORY OVERVIEW
CHAPTER 1: THE TEACHER EDUCATION AND DEVELOPMENT STUDY IN MATHEMATICS: AN INTRODUCTORY OVERVIEW
1.1. TEDS-M—Genesis, Purpose, Participants, and Funding
The Teacher Education Study in Mathematics (TEDS-M) 2008 is the first cross-national
study to provide data on the knowledge that future primary and lower-secondary school
teachers acquire during their mathematics teacher education. It is also the first major
study to examine variations in the nature and influence of teacher education programs
within and across countries.
The impetus for TEDS-M, conducted in 17 countries under the aegis of the International
Association for the Evaluation of Educational Achievement (IEA), was recognition
that teaching mathematics in primary and secondary schools has become more
challenging worldwide as knowledge demands change and large numbers of teachers
reach retirement age. It has also become increasingly clear that effectively responding
to demands for teacher preparation reform will remain difficult while there is lack of
consensus on what such reform should encompass and while the range of alternatives
continues to be poorly understood let alone based on evidence of what works. In
the absence of empirical data, efforts to reform and improve educational provision
in this highly contested arena continue to be undermined by tradition and implicit
assumptions. TEDS-M accordingly focused on collecting, from the varied national and
cultural settings represented by the participating countries, empirical data that could
inform policy and practice related to recruiting and preparing a new generation of
teachers capable of teaching increasingly demanding mathematics curricula.
Two particular purposes underpinned this work. The first was to identify how the
countries participating in TEDS-M prepare teachers to teach mathematics in primary
and lower-secondary schools. The second was to study variation in the nature and
impact of teacher education programs on mathematics teaching and learning within and
across the participating countries. The information collected came from representative
samples (within the participating countries) of preservice teacher education programs,
their future primary and lower-secondary school teachers, and their teacher educators.
The key research questions for the study focused on the relationships between teacher
education policies, institutional practices, and future-teachers’ mathematics content
knowledge and mathematics pedagogy knowledge.
The 17 countries that participated in TEDS-M were Botswana, Canada (four provinces),
Chile, Chinese Taipei, Georgia, Germany, Malaysia, Norway, Oman (lower-secondary
teacher education only), the Philippines, Poland, the Russian Federation, Singapore,
Spain (primary teacher education only), Switzerland (German-speaking cantons),
Thailand, and the United States of America (public institutions only).

THE TEACHER EDUCATION AND DEVELOPMENT STUDY IN MATHEMATICS (TEDS-M)18
Michigan State University (MSU) and the Australian Council of Educational Research (ACER) were selected as the international study centers for TEDS-M. The members of the two international centers and the national research coordinators (NRCs) of the participating countries worked together from 2006 to 2011 on the study, which received funding from the United States of America National Science Foundation, IEA, and the collaborating countries.
TEDS-M is sponsored by IEA. IEA generously contributed funds that helped initiate and sustain this innovative study. Each participating country was responsible for funding national project costs and implementing TEDS-M 2008 in accordance with the international procedures.
The international costs for TEDS-M 2008 were co-funded by the US National Science Foundation NSF REC 0514431 9/15/2005 to 2/5/2012. Principal investigator (PI): Maria Teresa Tatto. Co-PIs: John Schwille and Sharon Senk.
Any opinions, findings, and conclusions or recommendations expressed in this material are those of the author(s) and do not necessarily reflect the views of the
National Science Foundation.
1.2 Factors of Potential Relevance to the Education and Performance of Future Teachers
Justification for this study and the development of its conceptual framework, design, and methodology were grounded in and supported by the findings of a review of relevant research literature. The review highlighted five fundamental sources of variation within and across nations with respect to the teaching and learning of mathematics. These sources were also deemed to be those with the most potential relevance to the education and performance of future teachers. They are briefly described in the following
sections.
1.2.1 Student Achievement in Mathematics
Data from IEA’s Trends in International Mathematics and Science Study (TIMSS) 2007 showed considerable variation in the average national achievement scores of students from the 37 countries that participated in the study’s Grade 4 mathematics test and the 48 countries that participated in the Grade 8 mathematics test.
At the Grade 4 level, scores on the international achievement scale ranged from 224 points in Yemen to 607 points in Hong Kong SAR (Mullis et al., 2008). Twenty countries had average scores at or above the TIMSS international scale average of 500. Students who attained the highest scores (ranging from 607 to 568) were those from Hong Kong SAR, Singapore, Chinese Taipei, and Japan. Students in the Russian Federation, England, the United States, and Germany had slightly lower average scale scores, ranging from 544 in the Russian Federation to 525 in Germany.
At the Grade 8 level, the gap was even wider: students in only 12 out of the 48 countries scored at or above the TIMSS scale average of 500. Students in five countries—Chinese Taipei, the Republic of Korea, Singapore, Hong Kong SAR, and Japan—achieved very high scores, which ranged from 598 (Chinese Taipei) to 570 (Japan). Students in England, the Russian Federation, and the United States achieved average scores of 513, 512, and 508, respectively. Students in Qatar had the lowest average score (307) on the
international scale (Mullis et al., 2008; National Center for Education Statistics, 2010).

19AN INTRODUCTORY OVERVIEW
1.2.2 The Mathematics Curriculum
While, at the macro-level, Grades K to 12 mathematics curricula are relatively consistent
in terms of content and difficulty across countries (Tatto, Lerman, & Novotná, 2009),
the heterogeneous performance of students in different countries may be associated
with differences in the topics included in the textbooks and/or grade-level mathematics
curricula of each country. For example, Valverde, Bianchi, Schmidt, McKnight, and
Wolfe’s (2002) analyses of Grade 8 mathematics textbooks from countries participating
in TIMSS assessments found that the books in some (albeit relatively few) countries
covered more complex topics than the books from other countries. The more complex
topics included “estimating computations” and “numbers and their properties.” Mullis
et al. (2000) noted considerable cross-national variability in the extent to which students
participating in TIMSS 1999 met international mathematics performance benchmarks
pertaining not only to the overall mathematics test but also to each item on that test.
1.2.3 The Quality of Mathematics Lessons
Both the TIMSS 1995 Video Study (Stigler, Gonzales, Kawanaka, Knoll, & Serrano, 1999)
and the TIMSS 1999 Video Study (Hiebert et al., 2003) rated the quality of mathematics
lessons (i.e., how well these lessons were being taught) in the countries participating in
these studies. Although the rating results for each study should be interpreted with
caution because of the small number of countries included in the ratings (in the case
of the 1995 study) and the small subsamples of lessons from each country in the 1999
study, the differences in the cross-national ratings suggest that the quality of lessons
(specifically how they are taught) is considerable enough to warrant further research.
During the TIMSS 1995 Video Study, an expert panel rated the overall quality of the
samples of mathematics lessons drawn for the three participating countries—Germany,
Japan, and the United States. The panel rated 51% of the lessons from Japan as medium
quality and 39% as high quality. In the United States, 89% of the lessons were rated
low quality; no lesson received a high rating. In Germany, low-quality lessons made up
34% of the whole sample while high-quality lessons made up 28% of the entire sample
(Stigler & Hiebert, 1997).
Subsamples of Grade 8 mathematics lessons from six of the seven countries that
participated in the 1999 study (Australia, the Czech Republic, Hong Kong SAR,
the Netherlands, Switzerland, and the United States1) were rated for quality by a
“mathematics quality analysis group.” Quality was defined according to four precepts:
coherence, presentation, student engagement, and overall quality. The rating scale
ranged from 1 for low to 5 for high. Hong Kong SAR gained the highest average ratings:
coherence (4.9), presentation (3.9), student engagement (4.0), and overall quality (4.0).
The United States received the lowest ratings (3.5, 2.4, 2.4, and 2.3, respectively).
1.2.4 The Nature of Teacher Education Programs
The Organisation for Economic Co-operation and Development (OECD) (2005) case
studies of recruiting, preparing, and retaining effective teachers in 25 countries showed
that teacher education provision varied in important ways across countries. For example,
the providers of teacher education differed from country to country. In some countries,
1 Japan was not included because a sample of Japanese lessons was coded for quality during the earlier TIMSS 1995 Video Study.

THE TEACHER EDUCATION AND DEVELOPMENT STUDY IN MATHEMATICS (TEDS-M)20
universities provided all teacher education. In others, teacher training colleges offered
non-university levels of preparation. There were also countries where agencies outside
the higher education system provided teacher education. The OECD report also revealed
that some teacher education programs were combined with undergraduate preparation
in the discipline students were being prepared to teach, while other programs provided
teacher education (i.e., pedagogy) only after candidates had finished a first university
degree in a subject-matter area. Some countries provided only one route to becoming a
teacher, while others offered more than one route.
Variation in teacher education is a product not only of readily visible differences in
organization and structure but also of divergent views (of, for example, educational
experts, policymakers, and reformers) on how best to conduct the preparation of
teachers. These views encompass the knowledge that is deemed most important to
teach, the relationship between theory and practice, the relative importance of subject
matter, pedagogy, and teacher understanding of students, and whether future teachers
learn best through actual experience in classrooms (Schwille & Dembélé, 2007; Tatto,
2000, 2007).
This diversity is reflected in the terminology used across the field of teacher education
(Eurydice, 2002; Stuart & Tatto, 2000; UNESCO, 1998). For example, the word
“pedagogy” has a wide array of meanings, ranging from a narrow technical focus on
teaching technique (as used in the United States) to a broad concern with everything
that happens in the classroom, including its moral and philosophical underpinnings
(Hamilton & McWilliam, 2001). The broader view is represented in European discourse
on teacher education, where the term “general pedagogy” is typically used to designate
all non-subject-matter theoretical aspects of teacher education programs. In the United
States, these aspects are covered by the term “educational foundations.”
1.2.5 The Content of Teacher Education Programs
Although experts may not be able to consensually define and measure all aspects of what
it takes to teach well, all agree on the importance of subject-matter knowledge (Monk,
1994). But agreement ends there: marked differences exist among stakeholders on
what knowledge is important for teachers to acquire, how teachers should acquire that
knowledge, and how important that knowledge is to each teacher’s success (Grossman,
1990).
Of particular importance to the debate on what should be taught in formal teacher
education is the question of whether teachers who know the subject-matter content
they are to teach can learn on the job everything else they need to teach well or whether
they need to engage in formal teacher education (Darling-Hammond, Holtzman,
Gatlin, & Vasquez Heilig, 2005). This debate tends, however, to ignore the relevance of
what is known in Europe as didactique (Boero, Dapueto, & Parenti, 1996) and in the
United States as knowledge for teaching or, to use educational psychologist Lee Shulman’s
(1987) term, pedagogical content knowledge. The importance that this latter type of
knowledge holds for teaching well is highlighted in a German study which found that
“when mathematics achievement in grade nine was kept constant, students taught by
teachers with higher pedagogy content knowledge (PCK) scores performed significantly
better in mathematics in grade ten” (Brunner et al., 2006, p. 62).

21AN INTRODUCTORY OVERVIEW
Pedagogical content knowledge is just one category within Shulman’s (1987) teacher
knowledge framework. However, it is an important one because, as Shulman explains,
it is what allows teachers to effectively relay and make comprehensible to students
subject-matter knowledge and curricular knowledge. Subject-matter (or content)
knowledge is the set of fundamental assumptions, definitions, concepts, and problem-
solving methods that constitute the ideas to be learned. Pedagogical content knowledge
is evident when teachers use powerful analogies and examples to describe and explain
aspects of the subject being learned. It is also evident when they draw on insights
into what makes the learning of specific topics within the subject curriculum easy or
difficult and then tailor their teaching accordingly, and when they actively appreciate
the conceptions that students of different ages and backgrounds bring with them as
they start to learn various subject-related topics in school.
A number of studies indicate that the mathematics content and pedagogy knowledge
which teachers learn is frequently not the knowledge most useful for teaching
mathematics (see, for example, Ball & Bass, 2000; Graham, Portnoy, & Grundmeier,
2002; Hill, Sleep, Lewis, & Ball, 2007). Various other studies (e.g., Even & Ball, 2009;
Mullis et al., 2008) show that the mathematics knowledge of primary and secondary
school students is weak in many countries, an outcome that may be, in part, a product
of this situation. Also of relevance here is the claim that educational reforms directly
affecting the mathematics preparation of teachers and the curriculum they are expected
to teach are frequently prompted by mandates deployed with little or no empirical basis
supporting their effectiveness (for examples, see Tatto, 2007). These changes have led,
in some cases, to incoherent systems of teacher education and to increasing uncertainty
about what mathematics teachers need to know and how teacher education can help
them acquire such knowledge (Tatto, Lerner, & Novotná, 2009).
1.3 Research Questions
The above considerations led to formulation of three key research questions:
1. What are the policies that support primary and secondary teachers’ achieved level
and depth of mathematics and related teaching knowledge?
2. What learning opportunities, available to prospective primary and secondary
mathematics teachers, allow them to attain such knowledge?
3. What level and depth of mathematics and related teaching knowledge have
prospective primary and secondary teachers attained by the end of their preservice
teacher education?
A common question across these three areas of inquiry (each of which is described in
more detail below) concerned cross-national and intra-national variation: thus, how and
to what extent do teacher education policy, opportunities to learn, and future teachers’
mathematics subject and pedagogy knowledge vary across and within countries?
1.3.1 Research Question 1
Effort to answer this question required examination of national policies directed at
mathematics teachers, including those pertaining to recruitment, selection, preparation,
and certification. More specifically, this question called for collection of data pertaining
to the following:
(a) The policies that regulate and influence the design and delivery of mathematics
teacher education for future primary and secondary teachers;

THE TEACHER EDUCATION AND DEVELOPMENT STUDY IN MATHEMATICS (TEDS-M)22
(b) The institutions and programs charged with implementing these policies;
(c) The distinctive political, historical, and cultural contexts within each country that
influence policy and practice in mathematics teacher education; and
(d) The policies in each country regarding standards for degrees, coverage of topics,
certification practices, and the recruitment, selection, and preparation of future
mathematics teachers.
1.3.2 Research Question 2
This question focused on the intended and implemented curriculums of teacher
education at the institutional level, as well as the overall opportunities to learn embedded
in these curriculums. The data gathered included:
(a) The kinds of institutional and field-based opportunities provided for future
primary and secondary teachers;
(b) The enacted curriculums and standards of teacher education programs;
(c) The content taught in teacher education programs and how instruction is organized;
and
(d) The qualifications and prior experiences of those responsible for implementing
and delivering these programs.
1.3.3 Research Question 3
This question required examination of the intended and achieved goals of teacher
education. Specifically, this question led to exploration and identification of the
following:
(a) The mathematics content knowledge that future teachers are expected to acquire
as an outcome of their teacher education;
(b) The depth of understanding of mathematics that they are expected to achieve;
(c) The mathematics teaching knowledge (i.e., content, pedagogy, curriculum) that
future teachers have achieved by the end of their teacher education (i.e., the point
at which they are considered “ready to teach”);
(d) Other characteristics that might help explain future teachers’ ability to gain mastery
of this knowledge; and
(e) The beliefs about the nature of mathematics and about teaching and learning
mathematics that future teachers hold at the end of their preparation.
1.4 The Design of TEDS-M
The conceptual framework, design, and methodology of TEDS-M are outlined in
Appendix B of this report and thoroughly documented in various other reports (see
Tatto, 2012; Tatto, Schwille, Senk, Ingvarson, Peck, & Rowley, 2008), and we refer readers
to them. However, descriptions of the sources from which study data were collected and
the process used to draw samples of survey respondents provide important contextual
information with respect to the content of this report and so are given here.

23AN INTRODUCTORY OVERVIEW
1.4.1 Data Sources
Data pertaining to the first research question were drawn from case study reports
from each participating country and from questionnaires and interviews issued and
conducted by the TEDS-M international study centers. Data relating to the second and
third questions were gathered through four surveys developed by the international
research centers and administered by the national research centers. The surveys targeted
nationally representative samples of (1) teacher-education institutions and programs, (2)
teacher educators, (3) future primary school teachers preparing to teach mathematics,
and (4) future lower-secondary school teachers preparing to teach mathematics.
1.4.2 Sampling Process
In most countries, TEDS-M implemented a two-stage random sampling design. First,
the sampling unit of the IEA Data Processing and Research Center (DPC) worked with
each participating country’s national research center to select samples representative of
the national population of “teacher preparation” (TP) institutions offering education to
future teachers intending to teach mathematics at the primary and/or lower-secondary
levels. Once an institution had been selected, all programs within that institution offering
mathematics preparation were identified. These institutions (and programs) along with
samples of educators and future teachers from within them were then surveyed. In
many countries, all TP institutions had to be selected in order to achieve IEA sampling
standards, and in the sampled institutions it was necessary for all but a few countries to
survey all eligible educators and all eligible future teachers.
The national research centers in each country used the software package WinW3S to
select the samples of programs, future teachers, and educators. Sampling errors were
computed using balanced half-sample repeated replication (or BRR, a well-established
re-sampling method). All countries participating in TEDS-M were required to provide
complete national coverage of their national-desired target populations. However, in
some cases, organizational and/or operational conditions made it difficult for the centers
to obtain complete national coverage. These occurrences are annotated throughout this
report.
1.5 Distinctive Characteristics of and Target Audiences for TEDS-M
The TEDS-M study is unique in several important respects. It is the first:
• IEAstudyconductedwithinthesphereofhighereducation;
• IEAstudyofteachereducation;
• Cross-nationalstudyofteachereducationdesignedtogatherdatafromnationally
representative probability samples on the knowledge outcomes of teacher education
and on the possible determinants of those outcomes;
• Cross-national study of teacher education to integrate a specific subject matter
(mathematics) with generic issues in teacher education policy and practice and to
be conducted on a nationally representative basis; and
• International assessment of student learning in any field of higher education to
employ representative national samples.

THE TEACHER EDUCATION AND DEVELOPMENT STUDY IN MATHEMATICS (TEDS-M)24
For educational policymakers, TEDS-M contributes data on institutional arrangements
that are effective in helping teachers become sufficiently knowledgeable in mathematics
and related teaching knowledge. For teacher educators who design, implement, and
evaluate teacher education curriculums, TEDS-M contributes a shared language, a
shared database, and benchmarks for examining teacher-education program designs
against what has proved possible and desirable to do in other settings. For mathematics
educators, TEDS-M provides a better understanding of what qualified teachers of
mathematics are able to learn about the content and pedagogy of mathematics, as
well as the arrangements and conditions needed for acquisition of this knowledge.
For educators in general and for informed laypersons, TEDS-M provides a better
understanding about how and what teachers learn as they prepare to teach.
1.6 Content of this ReportThe rest of this report presents the findings of TEDS-M. Chapters 2 and 3 address Research Question 1. Chapter 2 compares national policies and employment conditions in teacher education across the participating countries. It also pays particular heed to the forces that shape the mathematics preparation of future teachers, including the organization and characteristics of teacher education at the national level. Chapter 3 provides “capsule” descriptions of teacher-education systems at the national level in each country. Taken together, Chapters 2 and 3 provide detail about the policy and systems of teacher education that serves as context for the findings of the various surveys.
The remaining chapters present the results of the national surveys used to address Research Questions 2 and 3. Chapter 4 summarizes the main characteristics of the institutions, programs, teacher educators, and future primary and lower-secondary teachers who responded to the TEDS-M questionnaires. The chapter also documents the variation observed across countries with respect to teacher education institutions, credentials granted, curriculum content, and the background characteristics of teacher educators and future teachers. Chapter 5 details the frameworks that TEDS-M used to measure future primary and lower-secondary teachers’ mathematics content knowledge and mathematics pedagogy knowledge, and the results of these tests.
Chapter 6 includes findings concerning future teachers’ beliefs about the nature of mathematics, about learning mathematics, and about mathematics achievement. Chapter 7 describes the theoretical framework, research questions, and domains used to study the opportunities to learn to teach mathematics that the various national teacher education programs offered future teachers.
The final chapter, Chapter 8, includes a discussion of the implications of the TEDS-M findings for policy and further research analysis. Appendix A contains a number of exhibits that complement the discussions in various chapters. Appendix B provides a detailed account of the methodology informing the study as well as descriptions of the research concepts underlying the study and of the methods used to implement the four surveys and to analyze and report the data. Appendix C lists and acknowledges the many people and organizations involved in designing and implementing TEDS-M and
in analyzing and reporting its data.
25AN INTRODUCTORY OVERVIEW
ReferencesBall, D. L., & Bass, H. (2000). Interweaving content and pedagogy in teaching and learning to teach: Knowing and using mathematics. In J. Boaler (Ed.), Multiple perspectives on the teaching and learning of mathematics (pp. 83–104). Westport CT: Ablex.
Boero, P., Dapueto, C., & Parenti, L. (1996). Didactics of mathematics and the professional knowledge of teachers. In A. J. Bishop, M. A. Clements, C. Keitel, J. Kilpatrick, & C. Laborde (Eds.), International handbook of mathematics education (pp. 1097–1121). Dordrecht, the Netherlands: Kluwer Academic Publishers
Brunner, M., Kunter, M., Krauss, S., Klusmann, U., Baumert, J., Blum, W., ... Tsai, Y.-M. (2006). Die professionelle Kompetenz von Mathematiklehrkräften: Konzeptualisierung, Erfassung und Bedeutung für den Unterricht; eine Zwischenbilanz des COACTIV-Projekts [The professional competencies of mathematics teachers: Conceptualization, assessment, and significance for instruction: An interim review of the COACTIV project]. In M. Prenzel & L. Allolio-Näcke (Eds.), Untersuchungen zur Bildungsqualität von Schule: Abschlussbericht des DFG-Schwerpunktprogramms [Studies on the quality of school education: Final report of the DGF Priority Program] (pp. 54–
82). Münster, Germany: Waxmann.
Darling-Hammond, L., Holtzman, D. J., Gatlin, S. J., & Vasquez Heilig, J. (2005). Does teacher
preparation matter? Evidence about teacher certification, Teach for America, and teacher
effectiveness. Education Policy Analysis Archives, 13(42). Available online at http://epaa.asu.edu/
epaa/v13n42/v13n42.pdf
Eurydice. (2002). Key topics in education, Vol. 3. The teaching profession in Europe: Profile, trends and
concerns. Brussels, Belgium: Author.
Even, R., & Ball, D. L. (2009). The professional education and development of teachers of mathematics:
The 15th ICMI Study. New York: Springer.
Graham, K. J., Portnoy, N., & Grundmeier, T. (2002). Making mathematical connections in
programs for prospective teachers. In D. S. Mewborn, D. Y. White, H. G. Wiegel, R. L. Bryant, &
K. Nooney (Eds.), Proceedings of the twenty-fourth annual meeting of the North American Chapter
of the International Group for the Psychology of Mathematics Education (Vol. 4, pp. 1930–1932).
Columbus, OH: ERIC Clearinghouse for Science Mathematics and International Education.
Grossman, P. L. (1990). The making of a teacher: Teacher knowledge and teacher education. New
York: Teachers College Press.
Hamilton, D., & McWilliam, E. (2001). Ex-centric voices that frame research on teaching. In V.
Richardson (Ed.), Handbook of research on teaching (4th ed., pp. 17–47). Washington, DC: American
Educational Research Association.
Hiebert, J., Gallimore, R., Garnier, H., Bogard Givvin, K., Hollingsworth, H., Jacobs, J., …
Stigler, J. (2003). Teaching mathematics in seven countries: Results from the TIMSS 1999 Video Study.
Washington DC: National Center for Education Statistics. Available online at http://timssvideo.
com/sites/default/files/TIMSS%201999%20Math%20Report.pdf
Hill, H. C., Sleep, L., Lewis, J., & Ball, D. L. (2007). Assessing teachers’ mathematical knowledge:
What knowledge matters and what evidence counts? In F. Lester (Ed.), Second handbook of research
on mathematics teaching and learning (pp. 111–156). Charlotte, NC: Information Age Publishing.
Monk, D. H. (1994). Subject area preparation of secondary mathematics and science teachers and
student achievement. Economics of Education Review, 13, 125–145.
Mullis, I. V. S., Martin, M. O., & Foy, P., with Olson, J. F., Preuschoff, C., Erberber, E., … Galia, J.
(2008). TIMSS 2007 international mathematics report: Findings from IEA’s Trends in International
Mathematics and Science Study at the fourth and eighth grades. Chestnut Hill, MA: Boston College.
Available online at http://timss.bc.edu/TIMSS2007/mathreport.html

THE TEACHER EDUCATION AND DEVELOPMENT STUDY IN MATHEMATICS (TEDS-M)26
Mullis, I. V. S, Martin, M. O, Gonzalez, E. J, Gregory, K. D., Garden, R. A., Kathleen M., … Smith,
T. A. (2000). TIMSS 1999 international mathematics report: Findings from IEA’s repeat of the Third
International Mathematics and Science Study at the eighth grade. Chestnut Hill, MA: Boston College.
Available online at http://timss.bc.edu/timss1999i/math_achievement_report.html
National Center for Education Statistics (NCES). (2010). Trends in International Mathematics and
Science Study (TIMSS). Washington, DC: United States Department of Education. Retrieved from
http://nces.ed.gov/timss/
Organisation for Economic Co-operation and Development (OECD). (2005). Attracting,
developing, and retaining effective teachers. Final report: Teachers matter. Paris, France: Author.
Schwille, J., & Dembélé, M. (2007). Global perspectives on teacher learning: Improving policy and
practice (Fundamentals of Educational Planning, No. 84). Paris, France: International Institute for
Educational Planning, UNESCO.
Shulman, L. (1987). Knowledge and teaching: Foundations of the new reform. Harvard Educational
Review, 57, 1–22.
Stigler, J. W., Gonzales, P., Kawanaka, T., Knoll, S., & Serrano, A. (1999). The TIMSS Videotape
Classroom Study: Methods and findings from an exploratory research project on eighth-grade
mathematics instruction in Germany, Japan, and the United States. Washington, DC: National
Center for Education Statistics.
Stigler, J. W., & Hiebert, J. (1997). Understanding and improving classroom mathematics
instruction. Phi Delta Kappan, 79, 14–21.
Stuart, J., & Tatto, M. T. (2000). Designs for initial teacher preparation programs: An international
view. International Journal of Educational Research, 33, 493–514.
Tatto, M. T. (2000). Assessing what we know about teacher quality and development: Empirical
indicators and methodological issues in comparative perspective. Report commissioned by the Board
on Comparative and International Studies in Education (BICSE) National Academy of Sciences/
National Research Council, Washington, DC, USA.
Tatto, M. T. (2007). Reforming teaching globally. Oxford, UK: Symposium Books (reprinted in
2009 by Information Age Publishers).
Tatto, M. T. (2012). Teacher Education and Development Study in Mathematics (TEDS-M): Technical
report. Amsterdam, the Netherlands: International Association for Educational Achievement
(IEA).
Tatto, M. T., Lerman, S., & Novotná, J. (2009). Overview of teacher education systems across the
world. In R. Even & D. L. Ball (Eds.), The professional education and development of teachers of
mathematics: The 15th ICMI Study (pp. 15–23). New York: Springer.
Tatto, M. T., Schwille, J., Senk, S., Ingvarson, L., Peck, R., & Rowley, G. (2008). Teacher Education
and Development Study in Mathematics (TEDS-M): Conceptual framework. Amsterdam, the
Netherlands: International Association for Educational Achievement (IEA). Available online at
http://teds.educ.msu.edu/framework/
UNESCO. (1998). World education report: Teachers and teaching in a changing world. Paris, France:
Author.
Valverde, G. A., Bianchi, L. J., Schmidt, W. H., McKnight, C. C., & Wolfe, R. G. (2002). According to
the book: Using TIMSS to investigate the translation of policy into practice in the world of textbooks.
Dordrecht, the Netherlands: Kluwer Academic Publishers.

27
CHAPTER 2: TEACHER EDUCATION POLICIES AND EMPLOYMENT CONDITIONS IN TEDS-M COUNTRIES
2.1 Chapter Overview
An important aim of TEDS-M is to understand how policies at national and provincial
levels may influence the structure and practices of teacher education programs and the
knowledge, abilities, and beliefs of future teachers enrolled in them. The purpose of this
chapter is to summarize these policies, while focusing on three key aspects pertaining
to them:
• Thestructureandorganizationofteachereducationsystemsinthecountriesthat
participated in TEDS-M (Section 2.2);
• Important features of the policy context, such as the employment and working
conditions for which teachers are prepared (Section 2.3);
• Nationalarrangementsforqualityassuranceinteachereducation(Section2.4).
It is important to note that this chapter also provides a summary of the companion
TEDS-M policy report, National Policies and Regulatory Arrangements for the Preparation
of Teachers in TEDS-M Countries (Ingvarson, Schwille, Tatto, Rowley, Senk & Peck,
forthcoming). That report is based on the following:
• National reports prepared by the TEDS-M national research coordinators from
each of the countries in response to a structured list of questions provided by the
international research centers;
• Asurveyconcerningteacher-educationpoliciesintherespectivecountries.
When reading this chapter, please keep in mind that data for this chapter were gathered
in 2008 and describe the situation as it applied at that time. Some TEDS-M countries
have experienced major changes to their teacher education systems since then. Also
keep in mind that the purpose and organization of teacher-education programs in
countries participating in TEDS-M vary markedly, both between and within countries.
One reason is because teacher education programs reflect differences in the structure of
primary and secondary education across countries.
In order to describe these differences (as well as similarities) more precisely, TEDS-
M uses specific terminology in relation to the structure and organization of teacher
education. This terminology is detailed in the following subsection.
2.1.1. TEDS-M Organizational Terminology
TEDS-M uses three key terms to denote the structure and organization of teacher
education. They are program, program-type, and program-group.
1. Program refers to a course of study leading to a teaching credential.
2. Program-type refers to clusters of programs that share similar purposes and structural
features, such as the credential earned, the type of institution in which the program-
type is offered, whether the program-type is concurrent or consecutive, the range of
school grade levels for which teachers are prepared, the duration of the programs in
the program-type, and the degree of subject-matter specialization for which future

THE TEACHER EDUCATION AND DEVELOPMENT STUDY IN MATHEMATICS (TEDS-M)28
teachers are prepared. In other words, program-type refers to the organizational
features that distinguish between pathways to becoming qualified to teach.
For example, in Poland, one of the program-types is a relatively new first-cycle
Bachelor’s degree, designed to prepare teachers for integrated teaching in Grades 1
to 3. The opportunities to learn that are organized for future teachers in this program-
type have certain attributes in common, regardless of which university offers them.
Some of these common features are different from the common features of other
program-types in Poland, such as the ones that prepare mathematics specialists to
teach in Grade 4 and above.
In contrast, the word program in TEDS-M refers only to how a program-type has
been implemented in one particular institution. In short, the terms program and
program-type are meant to clarify the everyday use of the term program in teacher
education. This everyday usage is ambiguous because it can refer either to teacher
education as organized in one particular institution or to closely related offerings
at multiple institutions—a distinction for which TEDS-M requires clarity. Thus,
whatever National Taiwan Normal University offers to qualify future teachers in
Secondary Mathematics Teacher Education is a program whereas the program-type
Secondary Mathematics Teacher Education consists of the common characteristics
of all such programs throughout Taiwan (Chinese Taipei). Multiple programs of
the same type in multiple institutions typically make up a program-type.1 In short,
programs are nested within program-types.
3. Because of the need to provide a more comparable and sufficiently large grouping of
future teachers for analysis across countries, TEDS-M further aggregates program-
types into program-groups. The concepts of program-type and program-group are both
essential to the purposes of TEDS-M. Each program-type is a recognized, visible part
of the actual institutional structure of teacher education in each country. Knowledge
of which program-types were included in TEDS-M for each country is necessary
for understanding the content of this report. In contrast, the term program-group is
used in TEDS-M to divide the target population of future teachers into categories
that are more comparable for cross-national analysis. Program-groups have no
recognized existence outside TEDS-M. When used together, the terms program-type
and program-group provide a means of explaining and justifying what TEDS-M has
done and found more precisely than would be otherwise possible.
2.2 Structure and Organization of Teacher Education Program-Types
Exhibit 2.1 lists all the program-types included in the TEDS-M target population and
shows how they differ within and between countries. Although the names of program-
types vary from country to country, the characteristics and purpose of program-types
in different countries are often similar. For example, the Elementary Teacher Education
program-type in Chinese Taipei has similar characteristics and purposes to the Bachelor
of Elementary Education program-type in the Philippines. The following subsections
provide a discussion of the basic sources of variation in Exhibit 2.1 (as identified by the
column headings).
1 However, there were a few instances of just one institution in a country offering a program-type (e.g., University of Botswana and the National Institute of Education in Singapore). In these instances, program and program-type are the same.

29TEACHER EDUCATION POLICIES AND EMPLOYMENT CONDITIONS
Exh
ibit
2.1
: Org
aniz
atio
nal c
hara
cter
isti
cs o
f tea
cher
edu
cati
on p
rogr
am-t
ypes
in T
ED
S-M
Co
untr
y Pr
og
ram
-Typ
e C
on
secu
tive
/ D
urat
ion
G
rad
e
Spec
ializ
atio
n
Pro
gra
m-G
roup
Te
st
C
on
curr
ent
(Yea
rs)
Span
A
dm
inis
tere
d
Bo
tsw
ana
D
iplo
ma
in P
rimar
y Ed
ucat
ion
C
oncu
rren
t 3
1–7
Gen
eral
ist
3: P
rimar
y–lo
wer
sec
onda
ry (G
rade
10
max
.)
Prim
ary
D
iplo
ma
in S
econ
dary
Edu
catio
n,
Con
curr
ent
3 8–
10
Spec
ialis
t 5:
Low
er s
econ
dary
(Gra
de 1
0 m
ax.)
Se
cond
ary
C
olle
ges
of E
duca
tion
ba
chel
or o
f Se
cond
ary
Educ
atio
n
Con
curr
ent
4 8–
12
Spec
ialis
t 6:
Upp
er s
econ
dary
(up
to G
rade
11
and
Seco
ndar
y
(Sci
ence
), U
nive
rsity
of
bots
wan
a
ab
ove)
Can
ada
Ont
ario
Pr
imar
y/Ju
nior
C
onse
cutiv
e 4+
1 1–
6 G
ener
alis
t 2:
Prim
ary
(Gra
de 6
max
) N
A
Ju
nior
/Int
erm
edia
te
Con
secu
tive
4+1
4–10
G
ener
alis
t an
d
Bo
th 3
(prim
ary–
low
er s
econ
dary
, Gra
de 1
0 m
ax.)
N
A
spec
ialis
t an
d 5
(low
er s
econ
dary
, Gra
de 1
0 m
ax.)
In
term
edia
te/S
enio
r C
onse
cutiv
e 4+
1 7–
12
Spec
ialis
t (in
6:
Upp
er s
econ
dary
(up
to G
rade
11
and
abov
e)
NA
tw
o su
bjec
ts)
Qué
bec
Prim
ary
Con
curr
ent
4 1–
6 G
ener
alis
t 2:
Prim
ary
(Gra
de 6
max
.)
NA
Se
cond
ary
Con
curr
ent
4 7–
11
Spec
ialis
t 6:
Upp
er s
econ
dary
(up
to G
rade
11
and
abov
e)
NA
Nov
a Sc
otia
Pr
imar
y C
onse
cutiv
e 4+
2 1–
6 G
ener
alis
t 2:
Prim
ary
(Gra
de 6
max
.)
NA
Se
cond
ary
(Jun
ior
and
Seni
or)
Con
secu
tive
4+2
7–12
Sp
ecia
list
6: U
pper
sec
onda
ry (u
p to
Gra
de 1
1 an
d ab
ove)
N
A
New
foun
dlan
d-
Prim
ary/
Elem
enta
ry
Con
curr
ent
5 1–
6 G
ener
alis
t 2:
Prim
ary
(Gra
de 6
max
.)
NA
Labr
ador
In
term
edia
te/S
econ
dary
C
onse
cutiv
e 4+
1 7–
12
Spec
ialis
t 6:
Upp
er s
econ
dary
(up
to G
rade
11
and
abov
e)
NA
Ch
ile
Gen
eral
ist
C
oncu
rren
t 4
1–8
Gen
eral
ist
Bo
th 3
(prim
ary–
low
er s
econ
dary
, Gra
de 1
0 m
ax.)
bo
th
an
d 5
(low
er s
econ
dary
, Gra
de 1
0 m
ax.)
G
ener
alis
t w
ith f
urth
er M
athe
mat
ics
C
oncu
rren
t 4
5–8
Gen
eral
ist
5: L
ower
sec
onda
ry (G
rade
10
max
.)
Seco
ndar
y
Ed
ucat
ion
Ch
ines
e Ta
ipei
El
emen
tary
Tea
cher
Edu
catio
n
Con
curr
ent
4.5
1–6
Gen
eral
ist
2: P
rimar
y (G
rade
6 m
ax.)
Pr
imar
y
Se
cond
ary
Mat
hem
atic
s Te
ache
r
Con
curr
ent
4.5
7–12
Sp
ecia
list
6: U
pper
sec
onda
ry (u
p to
Gra
de 1
1 an
d ab
ove)
Se
cond
ary
Educ
atio
n
Geo
rgia
ba
chel
or o
f Pe
dago
gy
Con
curr
ent
4 1–
4 G
ener
alis
t 1:
Low
er p
rimar
y (G
rade
4 m
ax.)
Pr
imar
y
ba
chel
or o
f A
rts
in M
athe
mat
ics
Con
curr
ent
3 5–
12
Spec
ialis
t 6:
Upp
er s
econ
dary
(up
to G
rade
11
and
abov
e)
Seco
ndar
y
M
aste
r of
Sci
ence
in M
athe
mat
ics
Con
curr
ent
5 5–
12
Spec
ialis
t 6:
Upp
er s
econ
dary
(up
to G
rade
11
and
abov
e)
Seco
ndar
y
M
aste
r of
Sci
ence
in M
athe
mat
ics
Con
secu
tive
5 5–
12
Spec
ialis
t 6:
Upp
er s
econ
dary
(up
to G
rade
11
and
abov
e)
Seco
ndar
y

THE TEACHER EDUCATION AND DEVELOPMENT STUDY IN MATHEMATICS (TEDS-M)30
Exh
ibit
2.1
: Org
aniz
atio
nal c
hara
cter
isti
cs o
f tea
cher
edu
cati
on p
rogr
am-t
ypes
in T
ED
S-M
(co
ntd.
)
Co
untr
y Pr
og
ram
-Typ
e C
on
secu
tive
/ D
urat
ion
G
rad
e
Spec
ializ
atio
n
Pro
gra
m-G
roup
Te
st
C
on
curr
ent
(Yea
rs)
Span
A
dm
inis
tere
d
Ger
man
y
Teac
hers
for
Gra
des
1–4
with
H
ybrid
of
the
two
3.5+
2.0
1–4
Gen
eral
ist
1: L
ower
prim
ary
(Gra
de 4
max
) Pr
imar
y
M
athe
mat
ics
as te
achi
ng s
ubje
ct
(T
ype
1A)
Te
ache
rs fo
r G
rade
s 1–
4 w
ithou
t
Hyb
rid o
f th
e tw
o 3.
5+2.
0 1–
4 G
ener
alis
t 1:
Low
er p
rimar
y (G
rade
4 m
ax)
Prim
ary
mat
hem
atic
s as
a te
achi
ng s
ubje
ct
(T
ype
1b)
Te
ache
rs o
f G
rade
s 1–
9/10
with
H
ybrid
of
the
two
3.5+
2.0
1–9/
10
Spec
ialis
t (in
B
oth
4 (p
rimar
y m
athe
mat
ics
spec
ialis
t)
both
Mat
hem
atic
s as
a T
each
ing
Subj
ect
two
subj
ects
) an
d 5
(low
er s
econ
dary
, Gra
de 1
0 m
ax.)
(Typ
e 2A
)
Te
ache
rs fo
r G
rade
s 1–
10 w
ithou
t
Hyb
rid o
f th
e tw
o
3.5+
2.0
1–4
Gen
eral
ist
1: L
ower
prim
ary
(Gra
de 4
max
.)
Prim
ary
Mat
hem
atic
s as
a T
each
ing
Subj
ect
(Typ
e 2b
)
Te
ache
rs fo
r G
rade
s 5/
7–9/
10 w
ith
Hyb
rid o
f th
e tw
o 3.
5 +2
.0
5/7–
9/10
Sp
ecia
list
(in
5: L
ower
sec
onda
ry (G
rade
10
max
.)
Seco
ndar
y
M
athe
mat
ics
as a
Tea
chin
g Su
bjec
t
two
subj
ects
)
(Typ
e 3)
Te
ache
rs fo
r G
rade
s 5/
7–12
/13
with
H
ybrid
of
the
two
4.5+
2.0
5/7–
12/1
3 Sp
ecia
list
(in
6: U
pper
sec
onda
ry (u
p to
Gra
de 1
1 an
d ab
ove)
Se
cond
ary
Mat
hem
atic
s as
a T
each
ing
Subj
ect
two
subj
ects
)
(Typ
e 4)
Mal
aysi
a ba
chel
or o
f Ed
ucat
ion,
Prim
ary
C
onse
cutiv
e 4
1–6
Spec
ialis
t (in
4:
Prim
ary
mat
hem
atic
s sp
ecia
list
Prim
ary
two
subj
ects
)
D
iplo
ma
of E
duca
tion
(Mat
hem
atic
s)
Con
secu
tive
4+1
1–6
Spec
ialis
t (in
4:
Prim
ary
mat
hem
atic
s sp
ecia
list
Prim
ary
two
subj
ects
)
M
alay
sian
Dip
lom
a of
Tea
chin
g C
onse
cutiv
e 3
1–6
Spec
ialis
t (in
4:
Prim
ary
mat
hem
atic
s sp
ecia
list
Prim
ary
(Mat
hem
atic
s)
tw
o su
bjec
ts)
ba
chel
or o
f Ed
ucat
ion
(Mat
hem
atic
s),
C
onse
cutiv
e 4
7–13
Sp
ecia
list
(in
6: U
pper
sec
onda
ry (u
p to
Gra
de 1
1 an
d ab
ove)
Se
cond
ary
Seco
ndar
y
two
subj
ects
)
ba
chel
or o
f Sc
ienc
e in
Edu
catio
n
Con
secu
tive
4 7–
13
Spec
ialis
t (in
6:
Upp
er s
econ
dary
(up
to G
rade
11
and
abov
e)
Seco
ndar
y
(M
athe
mat
ics)
, Sec
onda
ry
tw
o su
bjec
ts)
No
rway
G
ener
al T
each
er E
duca
tion
(ALU
) C
oncu
rren
t 4
1–10
G
ener
alis
t w
ith
Bo
th 3
(Prim
ary–
low
er s
econ
dary
, Gra
de 1
0 m
ax.)
bo
th
with
Mat
hem
atic
s O
ptio
n
ex
tra m
athe
mat
ics
and
5 (l
ower
sec
onda
ry, G
rade
10
max
.)
G
ener
al T
each
er E
duca
tion
(ALU
) C
oncu
rren
t 4
1–10
G
ener
alis
t B
oth
3 (p
rimar
y–lo
wer
sec
onda
ry, G
rade
10
max
.)
both
w
ithou
t M
athe
mat
ics
Opt
ion
an
d 5
(low
er s
econ
dary
, Gra
de 1
0 m
ax.)
Te
ache
r Ed
ucat
ion
Prog
ram
(PPU
) C
onse
cutiv
e 3+
1 (o
r 5+
1)
8–13
Sp
ecia
list
(in
6: U
pper
sec
onda
ry (u
p to
Gra
de 1
1 an
d ab
ove)
Se
cond
ary
two
subj
ects
)
M
aste
r of
Sci
ence
C
oncu
rren
t 5
8–13
Sp
ecia
list
(in
6: U
pper
sec
onda
ry (u
p to
Gra
de 1
1 an
d ab
ove)
Se
cond
ary
two
subj
ects
)

31TEACHER EDUCATION POLICIES AND EMPLOYMENT CONDITIONS
Exh
ibit
2.1
: Org
aniz
atio
nal c
hara
cter
isti
cs o
f tea
cher
edu
cati
on p
rogr
am-t
ypes
in T
ED
S-M
(co
ntd.
)
Co
untr
y Pr
og
ram
-Typ
e C
on
secu
tive
/ D
urat
ion
G
rad
e
Spec
ializ
atio
n
Pro
gra
m-G
roup
Te
st
C
on
curr
ent
(Yea
rs)
Span
A
dm
inis
tere
d
Om
an
bach
elor
of
Educ
atio
n, U
nive
rsity
C
oncu
rren
t 5
5–12
Sp
ecia
list
6: U
pper
sec
onda
ry (u
p to
Gra
de 1
1 an
d ab
ove)
Se
cond
ary
Ed
ucat
iona
l Dip
lom
a af
ter
bach
elor
C
onse
cutiv
e 5+
1 5–
12
Spec
ialis
t 6:
Upp
er s
econ
dary
(up
to G
rade
11
and
abov
e)
Seco
ndar
y
of
Sci
ence
ba
chel
or o
f Ed
ucat
ion,
Col
lege
s
Con
curr
ent
4 5–
12
Spec
ialis
t 6:
Upp
er s
econ
dary
(up
to G
rade
11
and
abov
e)
Seco
ndar
y
of
Edu
catio
n
Phili
pp
ines
ba
chel
or in
Ele
men
tary
Edu
catio
n
Con
curr
ent
4 1–
6 G
ener
alis
t 2:
Prim
ary
(Gra
de 6
max
.)
Prim
ary
ba
chel
or in
Sec
onda
ry E
duca
tion
C
oncu
rren
t 4
7–10
Sp
ecia
list
5: L
ower
sec
onda
ry (G
rade
10
max
.)
Seco
ndar
y
Pola
nd
ba
chel
or o
f Pe
dago
gy In
tegr
ated
C
oncu
rren
t 3
1–3
Gen
eral
ist
1: L
ower
prim
ary
(Gra
de 4
max
.)
Prim
ary
Teac
hing
, firs
t C
ycle
M
aste
r of
Art
s In
tegr
ated
Tea
chin
g,
Con
curr
ent
5 1–
3 G
ener
alis
t 1:
Low
er p
rimar
y (G
rade
4 m
ax.)
Pr
imar
y
Lo
ng C
ycle
ba
chel
or o
f A
rts
in M
athe
mat
ics,
C
oncu
rren
t 3
4–9
Spec
ialis
t B
oth
4 (p
rimar
y m
athe
mat
ics
spec
ialis
t)
both
fi
rst
Cyc
le
and
5 (l
ower
sec
onda
ry, G
rade
10
max
.)
M
aste
r of
Art
s in
Mat
hem
atic
s,
Con
curr
ent
5 4–
12
Spec
ialis
t B
oth
4 (p
rimar
y m
athe
mat
ics
spec
ialis
t)
both
Lo
ng C
ycle
an
d 6
(upp
er s
econ
dary
, up
to G
rade
11
and
abov
e)
Ru
ssia
n
Prim
ary
Teac
her
Educ
atio
n
Con
curr
ent
5 1–
4 G
ener
alis
t 1:
Low
er p
rimar
y (G
rade
4 m
ax.)
Pr
imar
y
Fed
erat
ion
Te
ache
r of
Mat
hem
atic
s
Con
curr
ent
5 5–
11
Spec
ialis
t 6:
Upp
er s
econ
dary
(up
to G
rade
11
and
abov
e)
Seco
ndar
y
Sin
gap
ore
Po
st-G
radu
ate
Dip
lom
a in
Edu
catio
n,
Con
secu
tive
4+1
1–6
Gen
eral
ist
2: P
rimar
y (G
rade
6 m
ax.)
Pr
imar
y
Pr
imar
y O
ptio
n C
ba
chel
or o
f A
rts
in E
duca
tion,
Prim
ary
Con
curr
ent
4 1–
6 G
ener
alis
t 2:
Prim
ary
(Gra
de 6
max
.)
Prim
ary
ba
chel
or o
f Sc
ienc
e in
Edu
catio
n,
C
oncu
rren
t 4
1–6
Gen
eral
ist
2: P
rimar
y (G
rade
6 m
ax.)
Pr
imar
y
Pr
imar
y
D
iplo
ma
of E
duca
tion,
Prim
ary
C
oncu
rren
t 2
1–6
Spec
ialis
t (in
4:
Prim
ary
mat
hem
atic
s sp
ecia
list
Prim
ary
Opt
ion
A
tw
o su
bjec
ts)
D
iplo
ma
of E
duca
tion,
Prim
ary
C
oncu
rren
t 2
1–6
Gen
eral
ist
2: P
rimar
y (G
rade
6 m
ax.)
Pr
imar
y
O
ptio
n C
Po
st-G
radu
ate
Dip
lom
a in
Edu
catio
n,
Con
secu
tive
4+1
1–6
Spec
ialis
t 4:
Prim
ary
mat
hem
atic
s sp
ecia
list
Prim
ary
Prim
ary
Opt
ion
A
Po
st-G
radu
ate
Dip
lom
a in
Edu
catio
n,
Con
secu
tive
4+1
7–8
Spec
ialis
t (in
5:
Low
er s
econ
dary
(Gra
de 1
0 m
ax.)
Se
cond
ary
Low
er S
econ
dary
two
subj
ects
)
Po
st-G
radu
ate
Dip
lom
a in
Edu
catio
n,
Con
secu
tive
4+1
7–12
Sp
ecia
list
(in
6: U
pper
sec
onda
ry (u
p to
Gra
de 1
1 an
d ab
ove)
Se
cond
ary
Seco
ndar
y
two
subj
ects
)

THE TEACHER EDUCATION AND DEVELOPMENT STUDY IN MATHEMATICS (TEDS-M)32
Spai
n
Teac
her
of P
rimar
y Ed
ucat
ion
C
oncu
rren
t 3
1–6
Gen
eral
ist
2: P
rimar
y (G
rade
6 m
ax.)
Pr
imar
y
Swit
zerl
and
Te
ache
rs fo
r G
rade
s 1–
2/3
C
oncu
rren
t 3
1–2/
3 G
ener
alis
t 1:
Low
er p
rimar
y (G
rade
4 m
ax.)
Pr
imar
y
Te
ache
rs fo
r Pr
imar
y Sc
hool
C
oncu
rren
t 3
1–6
Gen
eral
ist
2: P
rimar
y (G
rade
6 m
ax.)
Pr
imar
y
(G
rade
s 1–
6)
Te
ache
rs fo
r Pr
imar
y Sc
hool
C
oncu
rren
t 3
3–6
Gen
eral
ist
2: P
rimar
y (G
rade
6 m
ax.)
Pr
imar
y
(G
rade
s 3–
6)
Te
ache
rs fo
r Se
cond
ary
Scho
ol
Con
curr
ent
4.5
7–9
Gen
eral
ist,
5:
Low
er s
econ
dary
(Gra
de 1
0 m
ax.)
Se
cond
ary
(Gra
des
7–9)
som
e
spec
ializ
atio
n
Thai
lan
d
bach
elor
of
Educ
atio
n
Con
curr
ent
5 1–
12
Spec
ialis
t B
oth
4 (
prim
ary
mat
hem
atic
s sp
ecia
list)
bo
th
an
d 6
(upp
er s
econ
dary
, up
to G
rade
11
and
abov
e)
G
radu
ate
Dip
lom
a in
Tea
chin
g
Con
secu
tive
4+1
1–12
Sp
ecia
list
Bo
th 4
(prim
ary
mat
hem
atic
s sp
ecia
list)
bo
th
Prof
essi
on
and
6 (u
pper
sec
onda
ry, u
p to
Gra
de 1
1 an
d ab
ove)
Un
ited
Sta
tes
Prim
ary
Con
curr
ent
C
oncu
rren
t 4
1–3/
4/5
Gen
eral
ist
2: P
rimar
y (G
rade
6 m
ax.)
Pr
imar
y
Pr
imar
y C
onse
cutiv
e
Con
secu
tive
4+1
1–3/
4/5
Gen
eral
ist
2: P
rimar
y (G
rade
6 m
ax.)
Pr
imar
y
Pr
imar
y +
Seco
ndar
y C
oncu
rren
t
Con
curr
ent
4 4/
5–8/
9 Sp
ecia
list
Bo
th 4
(prim
ary
mat
hem
atic
s sp
ecia
list)
bo
th
an
d 5
(low
er s
econ
dary
, Gra
de 1
0 m
ax.)
Pr
imar
y +
Seco
ndar
y C
onse
cutiv
e
Con
secu
tive
4+1
4/5–
8/9
Spec
ialis
t B
oth
4 (p
rimar
y m
athe
mat
ics
spec
ialis
t)
both
and
5 (l
ower
sec
onda
ry, G
rade
10
max
.)
Se
cond
ary
Con
curr
ent
C
oncu
rren
t 4
6/7–
12
Spec
ialis
t 6:
Upp
er s
econ
dary
(up
to G
rade
11
and
abov
e)
Seco
ndar
y
Se
cond
ary
Con
secu
tive
C
onse
cutiv
e 4+
1 6/
7–12
Sp
ecia
list
6: U
pper
sec
onda
ry (u
p to
Gra
de 1
1 an
d ab
ove)
Se
cond
ary
No
te: N
A =
not
app
licab
le.
Exh
ibit
2.1
: Org
aniz
atio
nal c
hara
cter
isti
cs o
f tea
cher
edu
cati
on p
rogr
am-t
ypes
in T
ED
S-M
(co
ntd.
)
Co
untr
y Pr
og
ram
-Typ
e C
on
secu
tive
/ D
urat
ion
G
rad
e
Spec
ializ
atio
n
Pro
gra
m-G
roup
Te
st
C
on
curr
ent
(Yea
rs)
Span
A
dm
inis
tere
d

33TEACHER EDUCATION POLICIES AND EMPLOYMENT CONDITIONS
2.2.1 Concurrent and Consecutive Program-Types
One way in which program-types differ within and across the TEDS-M countries relates
to whether they are concurrent or consecutive. Concurrent program-types grant future
teachers a single credential for studies in subject-matter content, pedagogy, and other
courses in education; these components are all included within the first phase of post-
secondary education and sanctioned by a single credential. In contrast, consecutive
teacher education program-types require completion of two phases of post-secondary
education; first, an initial university degree with specialization in the subject-matter
that the future teacher is being prepared to teach, followed by a separate second phase
focused mostly on pedagogy and practicum and sanctioned by a second credential.
Most program-types in the TEDS-M countries are concurrent, but consecutive
program-types exist and were surveyed in Georgia, Malaysia, Norway, Oman, Singapore,
Thailand, and the United States. The only country for which this distinction does not
closely apply is Germany, where preparation for teaching is spread across two phases
similar to those of other consecutive program-types. The first phase takes place in
universities and ends with the first state examination. The second—practical—phase
is provided in special institutions by each federal state and leads to the second state
examination. (Passing the latter examination is recognized in the international ISCED
classification of post-secondary programs as equivalent to reaching Level 5A, a second
university degree.) Unlike in other consecutive programs, the first phase includes, in
addition to coursework in academic subjects, classes in subject-specific pedagogy and
general pedagogy. During the second phase, future teachers pursue mainly pedagogical
study while simultaneously taking full responsibility for teaching assigned classes in a
primary or secondary school.
Although the distinction between concurrent and consecutive program-types has been
used widely in the literature, few systematic cross-national studies have investigated
how concurrent differs from consecutive in curricula and in practice, except for the fact
that consecutive program-types tend to place all or most of their subject-matter content
early in the program-type and to place pedagogical content and field experience toward
the end. However, the differences in course content may not be that great, especially
when, as is commonly the case, concurrent and consecutive programs are offered in the
same institution. A third type of program (i.e., additional to consecutive and concurrent
programs) is now widely available in some countries such as the United States. These
school-based program-types take more of an apprenticeship approach to learning to
teach. They are not represented in the TEDS-M database.
2.2.2 School Grade Levels for which a Program-Type Prepares Teachers
Another obvious way in which to classify teacher education program-types is to
determine whether they prepare teachers for primary or secondary schools. However,
it quickly became apparent within the context of TEDS-M that this is an over-
simplification. The terms primary and secondary do not mean the same thing from
country to country. Instead, the grade spread in teacher education program-types
reflects the structure of schooling in each country. The grade spread is also a useful
indicator of policy decisions—albeit shaped by tradition and history— about the extent
to which the teacher workforce should be unified in its knowledge base and practice as
well as committed to serving all children, not just the élite.

THE TEACHER EDUCATION AND DEVELOPMENT STUDY IN MATHEMATICS (TEDS-M)34
For example, several countries, including Chinese Taipei, Georgia, and Malaysia, have
primary program-types that prepare generalist teachers to teach from Grades 1 to 6
because these grades constitute primary school in those countries (see Exhibit 2.1). In
contrast, in most German states, primary schools are limited to Grades 1 to 4 where
mathematics is taught by generalist teachers. Thereafter, mathematics is taught by
specialist teachers of mathematics. Future generalist primary teachers in Germany
usually undertake a different type of teacher education program from that taken by
future specialist teachers of mathematics.
Chile and Norway have program-types that prepare teachers to teach Grades 1 to 8 and
1 to 10 respectively, reflecting once again the structure of schooling in those countries.
These program-types make little or no distinction between the preparation of teachers
for the early grades and for the middle grades. This situation is radically different from
that in countries such as Chinese Taipei and the Philippines, where the transition from
Grade 6 to Grade 7 provides a clean break between primary school and secondary
school.
These differences in grade spread were a challenge for TEDS-M in terms of deciding
which instruments to administer to which future teachers. The TEDS-M cross-national
assessment instruments were developed to assess mathematics teaching knowledge at
two levels of the mathematics curriculum: content internationally judged appropriate
for those preparing to be primary and lower-secondary teachers respectively. The
right-hand column in Exhibit 2.1 shows that future teachers preparing only for grades
considered primary were administered the primary assessments; likewise, future teachers
preparing only for grades considered secondary were given the secondary assessments.
Future teachers in program-types preparing for both levels were randomly divided into
two halves, one half receiving the primary assessment and the other half the secondary
assessment. For the rest of this report, therefore, it is essential to remember that program-
types from countries that overlap the usual primary–secondary divide appear in both
primary and secondary exhibits. (These countries include Chile, Germany, Norway,
Poland, Thailand, and the United States.) Nevertheless, while completing their teacher
education, the future teachers in each randomly selected half appearing in a primary-
level exhibit experienced exactly the same program-type as the other randomly selected
half appearing in the secondary-level table.
2.2.3 Program-Type Duration
Duration is another basis on which to classify program-type. Most program-types
preparing primary teachers in TEDS-M are four years long. However, as Exhibit 2.1
shows, there is some variation across countries. Concurrent program-types commonly
require four years, while for consecutive program-types the first phase typically lasts
three or four years and the second phase one year. Once again, Germany is an exception.
There, the first phase is usually 3.5 or 4.5 years and the second 2 years.
Duration of initial teacher education is of major concern to policymakers, primarily
because of cost. Full-time program-types of initial teacher preparation are expensive
(see, for example, Schwille & Dembélé, 2007). Longer program-types are ordinarily
more expensive both in terms of institutional costs and in terms of foregone income
and other expenses borne directly by the student. However, while shorter program-types
may be cheaper, they may be less effective (e.g., more teachers requiring professional
development, remediation, or termination).

35TEACHER EDUCATION POLICIES AND EMPLOYMENT CONDITIONS
The documents collected during the TEDS-M survey show that, in recent decades,
some countries have increased program-type duration while others have reduced it. In
some cases (especially school-based rather than university-based program-types), these
changes have tended toward relatively short terms of formal training accompanied by
longer periods of internship and/or probation. Comparable cross-national data on
duration and outcomes could provide a basis for cost-effectiveness studies in teacher
education.
2.2.4 Subject-Matter Specialization
As indicated earlier, program-types can also be classified according to whether they
prepare generalist teachers or specialist teachers of mathematics. In most of the TEDS-M
countries, primary school teachers are prepared as generalists to teach most, if not all,
the core subjects in the school curriculum. (For purposes of precision, future teachers
in TEDS-M are classified as specialists if they are prepared primarily to teach one or
two subjects and as generalists if prepared primarily to teach three or more subjects.)
However, there are countries that also prepare specialist teachers of mathematics to
teach from Grades 4, 3, or even 1. They include Germany, Malaysia, Poland, Singapore,
Thailand, and the United States. In lower-secondary school, specialization is more the
norm across countries, although in many cases the “norm” means teaching not one but
two main subjects, such as mathematics and science.
If the degree of specialization were not kept in mind, it would be misleading to compare
program-types that differ in this respect. A future teacher being prepared to specialize
in the teaching of mathematics will usually be expected to learn more mathematics
content knowledge than a future teacher being prepared to teach more than one subject.
Exhibit 2.1 shows the degree of specialization in each of the program-types included
in TEDS-M.
2.2.5 Relative Size of Different Program-Types
Paying attention to the relative size of the program-types is essential to understanding
the structure of teacher education in any one country. Should this consideration not
be kept to the fore, readers might easily assume that some program-types are bigger
and less marginal than they actually are with respect to meeting the demand for new
teachers. The exhibits for each country in Chapter 3 show how the distribution of future
teachers in the TEDS-M target population varies by program-type. For each country,
the associated exhibit indicates which program-types produce the most graduates and
which the least. In Norway, for example, the importance of not confusing the two main
program-types is made clear when it becomes evident that, of the program-types, ALU
with the mathematics option is a much smaller program-type than the other (ALU
without the mathematics option). The other two secondary program-types in Norway
are very marginal in terms of numbers. In fact, in most countries, certain program-types
are much larger than others and could possibly have more impact on the composition
of the teacher workforce.
This estimate of program-type enrollments in the last year of teacher education was
based on the sum of weights from the achieved TEDS-M sample. These sums of weight
are unbiased estimates of the actual total number of future teachers in the target
population broken down by program-type. It is unlikely that these estimates could
be derived from any source other than TEDS-M—even within a single country. This
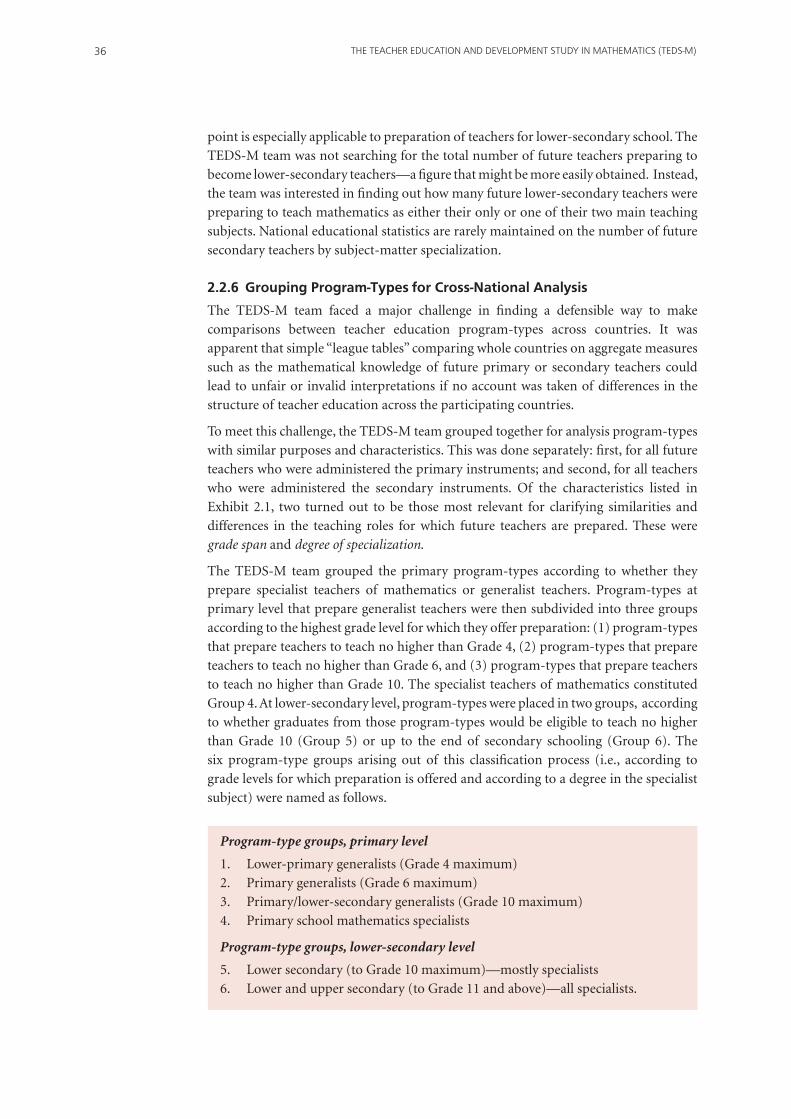
THE TEACHER EDUCATION AND DEVELOPMENT STUDY IN MATHEMATICS (TEDS-M)36
point is especially applicable to preparation of teachers for lower-secondary school. The
TEDS-M team was not searching for the total number of future teachers preparing to
become lower-secondary teachers—a figure that might be more easily obtained. Instead,
the team was interested in finding out how many future lower-secondary teachers were
preparing to teach mathematics as either their only or one of their two main teaching
subjects. National educational statistics are rarely maintained on the number of future
secondary teachers by subject-matter specialization.
2.2.6 Grouping Program-Types for Cross-National Analysis
The TEDS-M team faced a major challenge in finding a defensible way to make
comparisons between teacher education program-types across countries. It was
apparent that simple “league tables” comparing whole countries on aggregate measures
such as the mathematical knowledge of future primary or secondary teachers could
lead to unfair or invalid interpretations if no account was taken of differences in the
structure of teacher education across the participating countries.
To meet this challenge, the TEDS-M team grouped together for analysis program-types
with similar purposes and characteristics. This was done separately: first, for all future
teachers who were administered the primary instruments; and second, for all teachers
who were administered the secondary instruments. Of the characteristics listed in
Exhibit 2.1, two turned out to be those most relevant for clarifying similarities and
differences in the teaching roles for which future teachers are prepared. These were
grade span and degree of specialization.
The TEDS-M team grouped the primary program-types according to whether they
prepare specialist teachers of mathematics or generalist teachers. Program-types at
primary level that prepare generalist teachers were then subdivided into three groups
according to the highest grade level for which they offer preparation: (1) program-types
that prepare teachers to teach no higher than Grade 4, (2) program-types that prepare
teachers to teach no higher than Grade 6, and (3) program-types that prepare teachers
to teach no higher than Grade 10. The specialist teachers of mathematics constituted
Group 4. At lower-secondary level, program-types were placed in two groups, according
to whether graduates from those program-types would be eligible to teach no higher
than Grade 10 (Group 5) or up to the end of secondary schooling (Group 6). The
six program-type groups arising out of this classification process (i.e., according to
grade levels for which preparation is offered and according to a degree in the specialist
subject) were named as follows.
Program-type groups, primary level
1. Lower-primary generalists (Grade 4 maximum)
2. Primary generalists (Grade 6 maximum)
3. Primary/lower-secondary generalists (Grade 10 maximum)
4. Primary school mathematics specialists
Program-type groups, lower-secondary level
5. Lower secondary (to Grade 10 maximum)—mostly specialists
6. Lower and upper secondary (to Grade 11 and above)—all specialists.
37TEACHER EDUCATION POLICIES AND EMPLOYMENT CONDITIONS
Note that while all the program-types in Group 6 prepare specialist teachers of mathematics, this is not the case for program-types in Group 5. As mentioned earlier, teachers teaching mathematics to lower-secondary students in some countries, such as Norway and Chile, are trained as generalists. However, because such cases were relatively few, they were included in Group 5.
Exhibit 2.1 shows the group to which each program-type was assigned. Here we can see, for example, that three different program-types in Germany were assigned to Group 1 because each prepares generalist teachers to teach no higher than Grade 4. In later chapters, we report the results of TEDS-M with respect to knowledge, beliefs, and opportunities to learn within the context of program-groups. Thus, in the case of Germany, all such data for the program-types belonging to Group 1 are aggregated and presented together in tables and graphs. Results for individual program-types (as well as individual programs) are not reported.
It is important to note that some program-types were assigned to more than one program group. These were the program-types where the TEDS-M sample was randomly split into halves so that future teachers from those programs could complete both the primary and secondary surveys. This procedure was appropriate because, according to the countries’ own policies defining the program-type, these teachers were becoming
qualified to teach at both levels.
2.2.7 Locus of Control with Respect to the Organization of Teacher Education
In some countries, policymaking in teacher education is highly centralized, with many decisions about the organization of teacher education being made by policymakers in the national or provincial ministries of education. In other countries, many of the same decisions are left to the institutions of teacher education. The following are examples of program features that are decided in some countries at the national level and in others at the local level.
• Program goals and emphases—for example, whether programs embody a vision of good teaching that serves to unify its curriculum and practices in a coherent fashion; also whether programs uphold “traditional” best practices or are intended to advance a particular reform.
• Duration and other characteristics of practicum/field experience—when scheduled, where, and especially how and by whom practicum assignments are assigned, mentored, and assessed; also nature of responsibilities assigned to future teachers during their practicums, such as observation, tutoring small numbers of students, assisting the teacher in other ways, and eventually taking the lead in teaching a whole class.
• Requirements governing selection of future teachers for a program—for example, enrollment limited to applicants with desired levels of prior academic achievement and other special qualifications.
• Accountability to external authorities—evident in the quality assurance policies discussed later in this chapter.
• Qualifications required of teacher educators—policies governing possession of advanced degrees and requirements for teaching experience in primary or secondary school.
Countries with the most decentralized systems of teacher education governance include
Canada, Chile, Norway, Switzerland, and the United States.

THE TEACHER EDUCATION AND DEVELOPMENT STUDY IN MATHEMATICS (TEDS-M)38
2.3 Employment and Working Conditions for Practicing Teachers
TEDS-M made it possible to document the wide variation in the jobs, careers, and
working conditions for which teacher education programs prepare their future teachers
(Ingvarson et al., forthcoming). In order to facilitate discussion of these matters in this
present report, we have condensed the information provided by the NRCs in their
national reports and organized it under the following headings: (a) teacher employment
systems, (b) teacher working conditions, (c) teacher salaries and incentives, and (d)
teacher supply and demand.
2.3.1 Policies Concerning Systems of Teacher Employment
Two major systems of teacher employment in the world have become known as career-
based and position-based (Organisation for Economic Co-operation and Development
[OECD], 2005).
The career-based system is one where teachers are expected to remain, throughout their
working life, in one well-organized public or civil service, integrated at the national
or provincial level. Promotion follows a well-defined path of seniority and other
requirements, and deployment of teachers is based on bureaucratic procedures rather
than the discretion of local administrators with hiring authority. In such a system,
entry normally occurs at a young age and is based on academic credentials and/or
examinations. Countries able to afford career-based staffing can generally avoid major
teacher supply problems.
In position-based systems, teachers are hired into specific teaching positions within
an unpredictable career-long sequence of assignments. Access is more readily open
to applicants of diverse ages and atypical career backgrounds. Movement in and out
of teaching, to raise children or pursue other opportunities, is possible. Selection for
positions is decentralized, with school administrators or local education authorities
responsible for hiring teachers. Position-based systems typically have more problems
attracting and retaining teachers, especially in areas such as mathematics, where people
with the requisite skills do not necessarily go into teaching because they are in demand
for jobs elsewhere.
Among the countries participating in TEDS-M, Singapore, Oman, Spain, Thailand,
and (until recently) Chinese Taipei are primarily career based, signaling a likely
commitment to lifelong employment for teachers within a highly organized public
service. These systems are more likely than the position-based systems to invest in
initial teacher training, because they can be more confident of retaining teachers for life
and therefore more assured of a lifelong return on their investment in the form of the
teachers’ services. In contrast, Canada, Georgia, Norway, Switzerland, and the United
States are primarily position based, with individuals moving in and out of teaching on
a relatively short-term basis. Many graduates of such systems never occupy a teaching
position, as evidenced in, for example, the national reports from Chinese Taipei and the
United States. Germany and Poland are examples of hybrid systems.
2.3.2 Teacher Working Conditions
Countries where teaching conditions are relatively favorable can readily attract the
required number of talented, highly motivated teachers. In those countries where
conditions are unfavorable, recruiting teachers tends to be difficult. In principle, future
teachers are prepared to face these conditions. In some countries, they enter classrooms
39TEACHER EDUCATION POLICIES AND EMPLOYMENT CONDITIONS
that are well-resourced and in which they will be expected to use sophisticated ICT equipment effectively. In other locations, they need to be prepared to deal, as effectively as possible, with overcrowded classrooms lacking all kinds of resources—furniture, books, paper, and the like—and often inadequately protected against bad weather and noise.
The TEDS-M national reports from Botswana and the Philippines tell of such conditions. In Botswana, for example, the challenges include heavy workloads, shortages of teaching and learning resources, large class sizes in some areas, an insufficient number of classrooms, and considerable diversity in student abilities and home languages. The more affluent countries of Germany, Spain, Switzerland, and Chinese Taipei were much less likely to report difficult working conditions. Chile is more in the middle range in these respects, and the United States is an example of a country with such a high degree of inequality that it is difficult to say whether conditions are generally more favorable or unfavorable. The national report for the United States argued that unfavorable conditions, where they exist, make it difficult to recruit teachers and contribute to high
teacher turnover.
2.3.3 Teacher Salaries and Incentives
TEDS-M countries ranged from those where teaching is selective, well-compensated, and highly regarded, to countries with less selectivity, low salaries, and low status. Chinese Taipei is an example of a country in which the government has had a longstanding policy of providing and supporting favorable conditions for teachers. Their benefits have included competitive salaries, comprehensive health, disability, and life insurance, summer and winter vacations under a full-year salary, retirement pensions, and various special bonuses and allowances (e.g., marriage bonus, birth allowance, funeral allowance, allowance for children’s education, and parental leave). Singapore is another country where the incentive policies are very favorable and competitive relative to other occupations in both the public and private sectors.
In other countries, the picture is more mixed. German salaries are relatively high on average compared to other OECD countries, but not very competitive with respect to private-sector occupations in Germany that also require university degrees. Poland is an example of a country where salaries used to be very low, but which has seen substantial increases since the end of the Communist era.
There is a trend in some countries toward giving local educational administrators and authorities the power to more readily increase incentives to attract and retain teachers. Malaysia is a good example of a country that provides special incentives for certain teaching specialties and assignments (e.g., mathematics teachers and teachers in remote areas). In still other countries, Thailand for example, salaries are low compared to other occupations with which teaching most competes, but because teaching is a career-based occupation offering secure lifelong employment, long vacations, and prescribed avenues of advancement, it still has considerable appeal. In contrast, the salary situation in the Philippines is so bad that finding a solution is proving difficult. At the time the Philippines submitted their TEDS-M country report, salaries were close to the poverty threshold, with new teachers receiving a salary of US$194 per month compared to the poverty threshold of US$156. Among the proposals to rectify this situation is a recent one calling for mathematics and science teachers to be included in a protected category of scientific and technical workers whose salaries have to be funded above a certain
level.

THE TEACHER EDUCATION AND DEVELOPMENT STUDY IN MATHEMATICS (TEDS-M)40
2 The information contained here is based on the reports submitted by each country. Condensed copies of these reports will be found in the TEDS-M encyclopedia (Schwille, Ingvarson, & Holdgreve-Resendez, forthcoming). Writers of these reports followed guidelines provided by the TEDS-M research team. These procedures are described in detail in a companion volume of the TEDS-M report series (Ingvarson et al., forthcoming).
2.3.4 Teacher Supply and Demand
Although the TEDS-M national reports revealed a satisfactory supply of generalist
teachers, most indicated that their teacher workforce is imbalanced with respect to
supply, and in ways that vary from country to country. Countries tending toward
balance include Singapore, Canada (but with uneven distributions), Germany (but with
predicted future shortages), Switzerland (but with scattered shortages), and Chile (but
with some shortages). Other countries tend to have an oversupply of applicants and/
or fully qualified teachers without jobs and/or even placed in overstaffed schools; only
Chinese Taipei and Poland reported surpluses at both primary and secondary levels.
More typical are countries that—in various ways—produce enough, or more than
enough, generalist teachers for primary schools, but are searching for ways to increase
the number of well-qualified mathematics specialist teachers for lower-secondary
and, in some cases, upper-primary school as well. These countries include Botswana,
Malaysia, Norway, Oman, Philippines, and Thailand. Spain also reported a surplus of
primary teachers, but was not able to report on its secondary school teachers. Georgia
said it had both oversupply and shortages in certain subject areas. The four federalist
countries (Canada, Germany, Switzerland, and the United States) all reported a good
deal of variation among their constituent units in their needs for teachers.
2.4 Quality Assurance in Teacher Education
International interest in policies that promote teacher quality has increased markedly
in recent years (OECD, 2005; Tatto, 2007). Policymakers, faced with mounting evidence
that the most important in-school influence on student achievement is teachers’
knowledge and skill (see, for example, Hanushek, 2004; Hattie, 2008), are paying closer
attention to strategies likely to recruit, prepare, and retain the best possible teachers.
This section focuses on policies for assuring the quality of teacher education programs
in the 17 countries participating in TEDS-M.2 It provides a summary of the nature
and strength of quality assurance arrangements in each participating country. The
information provided in this section makes it possible to explore, in later chapters,
relationships between quality assurance policies and teacher education outcomes.
As mentioned earlier, TEDS-M grew out of an interest in exploring why student
achievement in mathematics in international studies such as IEA’s TIMSS varies from
country to country. One obvious hypothesis is that the variation in student achievement
might be due to variation in teacher education systems, particularly policies for
assuring the quality of future teachers and teacher education programs. To explore
this relationship, the TEDS-M team found it necessary to first uncover appropriate
and economical ways of classifying and summarizing quality assurance systems. They
determined that the key components of quality assurance systems include:
• Recruitment and selection: the focus here is on the policies and agencies a country has
in place to monitor and assure the quality of entrants to teacher education.

41TEACHER EDUCATION POLICIES AND EMPLOYMENT CONDITIONS
• Accreditation of teacher education institutions: the focus here is on the policies and
agencies a country has in place to monitor and assure the quality of teacher education
institutions and their programs.
• Entry to the teaching profession: the focus here is on the policies and agencies a country
has in place to ensure that graduates are competent and qualified before gaining
certification and full entry to the profession.
These are the three main mechanisms by which countries seek to assure the quality of
future teachers, and each country deals with them in its own way. Some countries have
concerted policies to assure the attractiveness of teaching in comparison with other
professions. Some have national agencies with responsibility for selecting entrants to
teacher education programs. Others leave the selection to individual universities and
other teacher education providers.
An increasing trend is for countries to establish external accreditation agencies with
responsibility for conducting independent evaluations of teacher education programs.
Another trend is to require graduates of teacher education programs to meet additional
criteria, such as passing tests of subject-matter knowledge or successfully completing
a period of induction or probationary teaching in schools before gaining professional
certification.
2.4.1 Recruitment and Selection of Future Teachers
2.4.1.1 Enrollments in teacher education
Based on the relevant information in the country reports, the TEDS-M research team
classified the participating countries according to the strength and locus of control of
policies concerning teacher recruitment, supply, and the number of available teacher
education places for teacher education students.3
Exhibit 2.2 categorizes the TEDS-M countries according to the extent to which
government agencies exert control over recruitment and governance policies pertaining
to teacher supply. In countries with strong control, such as Singapore, national or state
governments match the number of places to the number of teachers that the school
system needs. They may do this by limiting funding to a specified number of places in
each teacher education institution. National government or quality assurance agencies
may also lay down requirements or standards for students to gain entry to professional
preparation programs. In Malaysia, the Ministry of Education determines the number
of teaching posts based on an assessment of the number of teachers needed to cover
each subject area in schools nationwide.
Exhibit 2.2: Recruitment/governance: extent of control over total number of places available for teacher education students
Level of Control Countries
Strong control botswana, Chinese Taipei, Malaysia, Oman, Singapore
Mixed control Canada,* Germany, Poland, Russian federation, Thailand
Weak control Chile, Georgia, Norway, Philippines, Spain, Switzerland, United States
Note: * Although Canada did not meet the sampling requirements for future teachers in TEDS-M, it did provide a country report and is therefore included in this section of the report.
3 The Russian Federation did not provide a country report. This section relies on information provided by Burghes (2008) and websites for the Ministry of Education and Sciences and the Federal Education and Science Supervision Agency.

THE TEACHER EDUCATION AND DEVELOPMENT STUDY IN MATHEMATICS (TEDS-M)42
In countries with weak controls, universities have few limits or quotas on the number of
future teachers they can enroll. Countries where control is more localized are more likely
to allow institutions to determine the number of students who enroll in their teacher
education programs and/or to have a policy of encouraging alternative providers of
teacher education instead of traditional providers such as universities. Spain reported
a large over-supply of graduates from its schools of primary teacher education and its
faculties of education, which are relatively autonomous.
Quotas exist in some Canadian jurisdictions, but they do not bind universities.
Universities can determine the number of places for teacher education students. There
is a major oversupply of teachers in several provinces and a wide range of academic
achievement among applicants for teacher education places in different universities.
The situation in Germany, Poland, and Thailand is also mixed. Although Germany and
Switzerland, for example, have open-entry policies (every student who has successfully
passed the Abitur or the Matura, the high-school exit examinations, has a legal right
to enroll at university), the academic requirements for graduation from the secondary
schools are relatively high (students who pass the Abitur are in the top 30% of students
in their age cohort).
2.4.1.2 Teaching’s attractiveness as an occupation and a career
Countries participating in TEDS-M were also classified according to the policies they
have in place to maintain and promote the appeal and status of teaching relative to
other career choices. Countries where teaching is a desirable career option have policies
in place to ensure that teaching is an attractive occupation to people with the capacity
to become effective teachers. These attractions include job security, pensions, and other
like benefits. Demand for places from abler graduates in these countries is high. Exhibit
2.3 categorizes the TEDS-M countries on the basis of the content in the country reports
which focused on the appeal that teaching holds within the job marketplace.
Exhibit 2.3: Attractiveness and status of primary and secondary teaching as a profession and as a career
Attractiveness/Status Countries
High Canada, Chinese Taipei, Singapore
Mixed botswana, Germany, Malaysia, Oman, Poland, Russian federation, Spain, Switzerland, United States (secondary)
Low Chile, Georgia, Norway, Philippines, Thailand, United States (primary)
There is a strong demand for teacher education places in Botswana, Canada, Chinese
Taipei, and Singapore from abler high school and university graduates. These countries
are characterized by strategies deliberately designed to maintain or improve teacher
quality. In Singapore, for example, future teachers not only receive free university
education but are also paid a stipend while learning. Salaries for beginning teachers,
relative to other graduate salaries, are high. Working conditions in schools are supportive
of good teaching. Career prospects as a teacher are good—the ratio of final salaries to
starting salaries is comparatively high. Entrants to teacher education programs in these
countries are above-average to high achievers in secondary schools, relative to their
age cohort. In Chinese Taipei, the attractiveness of teaching resulted in a surplus of
teachers in the recent past. As a result, the Ministry of Education moved to decrease
the number of admissions to the normal universities and the universities of education,
43TEACHER EDUCATION POLICIES AND EMPLOYMENT CONDITIONS
which prepare large numbers of future teachers, by 50% in three years beginning in 2004. While the McKinsey Report (Barber & Mourshed, 2007) speculates that this policy may have further increased the attractiveness of teaching in that country, our colleagues argue that the policy has, in practice, increased the competition at the entry point to the teacher education programs in those universities.
In Canada, admission to an education faculty is reported to be competitive. In Germany, the increasing shortage of future teachers means that almost everyone who wants to enter the profession will get a job (unless he or she has a combination of teaching subjects attracting a large number of applicants, such as German or history). In the United States, teaching candidates who pursue elementary education with licensure in mathematics tend to have lower SAT (Scholastic Aptitude Test) scores than the average college graduate. In Norway, applications for teacher education programs had (as of 2009) been decreasing, and the number of dropouts had risen substantially. As competition for study places lessens, some weak and poorly motivated students have been enrolled, which, in turn, has increased the number of dropouts. This situation seems to confirm claims made in the McKinsey Report that the quality of courses drops as the caliber of students in those courses drops “because the quality of any classroom experience is highly dependent on the quality of people in the classroom” (Barber & Mourshed, 2007, p.18).
Malaysia reported a strengthening demand for teaching from students with higher academic qualifications in recent years because of improved conditions for teachers and a slowdown in the private economic sector. Reports from the Russian Federation, however, indicate that although the status of teaching has been high traditionally, the salary and morale of the teaching profession have weakened in recent years and attrition rates have risen (Burghes, 2008). The report from Georgia points out that entrants to teacher education are rated as low achievers compared to other students in their age
cohort.
Sadly, teaching is one of the least desired professions in Georgia. The still ongoing depreciation of the profession includes decreased salaries as well as decreased social status of teaching. While teaching was one of the most respected professions in the Soviet times, it became less appreciated when teachers appeared to be unprepared for the transition period faced by the country.
Exhibit 2.3 lists the other countries which reported that teaching, as an occupation and as a career option, has low appeal.
2.4.1.3 Admission to teacher education
All participating countries require entrants to primary school teacher education programs to have successfully completed secondary education, but few have specific requirements about the level to which entrants should have studied mathematics. Canada, Chile, Georgia, Germany, Malaysia, Norway, the Philippines, Spain, Switzerland, Thailand, and the United States reported no specific mathematics requirement for future primary teachers. The report from the Philippines stated that entrance standards for teacher education are lower than the standards for other degree programs.
Graduation from secondary school with attested proficiency in mathematics is mandated
for admission to primary school teacher education in Botswana, Poland, the Russian
Federation, and Singapore. In Chinese Taipei, students must be enrolled in their second
or higher year of university (including Master’s and doctoral levels) before they can
be admitted to a teacher education program. Although there is no specific secondary

THE TEACHER EDUCATION AND DEVELOPMENT STUDY IN MATHEMATICS (TEDS-M)44
school mathematics requirement, students must pass the national university entrance
examination, which has mathematics as a required test subject.
In Exhibit 2.4, the TEDS-M countries are categorized according to mathematics
requirements for admission to primary teacher education. We emphasize here that
graduation from secondary education is a crude measure of academic standards.4
Graduation in some countries is based on external national examinations, such as the
Matura in Poland, or subject-based examinations conducted at the school level, such as
for the Abitur in Germany. In other countries, graduation may depend more on course
completion than on attaining a particular academic standard.
Botswana, Poland, and Singapore appear together in Exhibit 2.4, but we remind
readers that generalist primary teachers in Poland are expected to teach Grades 1 to
3 only whereas in Botswana they may teach Grades 1 to 7. Understandably, therefore,
expectations about the level of mathematics studied in secondary school vary from
country to country. In addition, in some countries, such as Poland, all teachers of
Grades 4 and beyond are specialist mathematics teachers and are therefore expected to
have a high level of mathematics knowledge and competency.
It is important to note that Exhibit 2.4 does not provide information about the extent to
which future primary teachers must study mathematics during their teacher education
program. That information can be found in Chapters 4 and 7. But to give an example,
Germany (with the exception of a few federal states) requires entrants to the second
cycle of professional preparation to have successfully completed mathematics courses
during the first cycle of tertiary education.
Standards for entry to programs that prepare teachers who will teach mathematics at
the lower-secondary level are more difficult to estimate. We might expect that the level
to which entrants have previously studied mathematics will be greater for consecutive
than for concurrent programs. By definition, entry to consecutive training programs
is only open to students who have completed mathematics courses successfully at
university. Countries with such programs include Canada, Georgia, Malaysia, Norway,
Oman, Singapore, Thailand, and the United States.
Exhibit 2.4: Selection requirements and methods (primary)*
Requirement and Method Countries
Graduation from secondary school— Canada, Chile, Georgia, Germany, Malaysia, Norway, Philippines, Spain, no specific mathematics requirement Switzerland, Thailand, United States
Graduation from secondary school with specific botswana, Poland,** Russian federation, Singapore mathematics requirement
Graduation from secondary school and Chinese Taipei requirement for one year of tertiary-level studies; national examination to enter university with mathematics as a required subject
Notes:
* Oman was not training primary school teachers at the time of TEDS-M because of oversupply.
** Only for teachers in Poland who will teach Grade 4 and above.
4 In Norway, for example, the national research coordinator noted that the requirement in Norway is very low. Applicants need only to have completed Grade 11 general mathematics and be of average proficiency in the subject.

45TEACHER EDUCATION POLICIES AND EMPLOYMENT CONDITIONS
However, to blur the picture somewhat, most of these countries also have concurrent programs for preparing secondary mathematics teachers. These programs include mathematics course requirements to varying levels. Also, as explained earlier, the two-phase programs in Germany cannot be classified simply as either concurrent or consecutive. However, the fact that students must pass the first state examination before proceeding to the second implies these programs have more in common with consecutive than concurrent ones.
In Exhibit 2.5, the TEDS-M countries are grouped in accordance with the level to which entrants to lower-secondary teacher education programs need to have studied mathematics at school. Future lower-secondary teachers in Chile, the Philippines, Thailand, and Switzerland are trained mainly in concurrent programs that have no specific requirements about the level to which entrants must have studied mathematics in secondary school. Most future lower-secondary mathematics teachers in Botswana, Georgia, Malaysia, Norway,5 Oman, Poland, the Russian Federation, and the United States are also trained in concurrent programs, but a specified level of achievement in mathematics at the secondary level is required. However, both groups of countries usually require future mathematics teachers to undertake some mathematics courses as
part of their university program.
The third set of countries has stronger requirements. Teachers at the lower-secondary level are expected to be teachers with specialist training in teaching mathematics (e.g., teaching no more than two or three subjects at that level). In these countries, entrants to programs usually have to complete a university degree in mathematics or complete a number of designated mathematics courses at university level before they can enter the teacher-training phase or, as in the case of Chinese Taipei, students must pass the national university entrance examination, which has mathematics as a required test subject. The countries are Canada, Chinese Taipei, Germany, Norway (PPU and Master’s), Singapore, and Spain.6 Again, even though graduation from secondary education is a rather crude measure of academic standards, it is the selection most commonly cited in the TEDS-M country reports.
For the purposes of the TEDS-M survey, a particular area of interest across the participating countries was whether students at the lower-secondary level (e.g.,
Year 8) are taught mathematics by teachers trained as generalists or teachers with
Exhibit 2.5: Level of mathematics required to enter teacher education programs (lower-secondary)*
Requirements and Methods Countries
Graduation from secondary school— Chile, Philippines, Thailand, Switzerland no specific mathematics requirement
Graduation from secondary school with specific botswana, Georgia, Malaysia, Norway (ALU & ALU+), Oman, Poland,** mathematics requirement Russian federation, United States
Graduation from university with a first degree in Canada, Chinese Taipei, Germany, Norway (PPU & Master’s programs), mathematics or successful completion of designated Singapore, Spain mathematics courses at university level
Notes: * Each country is classified in terms of requirements that apply to most of the future teachers in the TEDS-M sample.** In Poland, this applies only to programs included in the TEDS-M sampling frame. Successful completion of mathematics
courses is a requirement for “second degree studies” in mathematics for secondary school teaching.
5 Norway points out, however, that the standard of mathematics required to enter ALU and ALU plus programs is low.
6 Note, however, that future lower-secondary teachers from Spain did not participate in TEDS-M.

THE TEACHER EDUCATION AND DEVELOPMENT STUDY IN MATHEMATICS (TEDS-M)46
specific training in teaching mathematics. The country reports revealed that teachers
in Botswana, Chile, and Norway are mainly trained in generalist program-types. The
same might appear to be the case for Germany, Thailand, and the United States, but
in these countries, the difference is not clear cut; they have program-types that train
specialist mathematics teachers who are eligible to teach across the later primary and
early secondary levels.
As indicated, expectations about the levels of mathematics required of future lower-
secondary teachers vary with the structure of the school system. If students at the
lower-secondary level are part of schools of basic education linked to primary levels
(such as in Chile or Norway), their mathematics teachers are more likely to be generalist
teachers who teach a range of subjects other than mathematics. Teachers trained to
teach no higher than the lower-secondary level are less likely to be expected to have
specific training in how to teach mathematics as specialists and are more likely to teach
other subjects as well as mathematics.
In Switzerland, lower-secondary schools normally enroll students up to Grade 9,
and students are usually taught by generalist teachers who teach about four different
subjects. If the students are part of secondary schools that provide preparation up to
Grades 12 or 13 (as in Canada, Chinese Taipei, Germany (Gymnasia only), Poland,
Russian Federation, Singapore, and the United States), they are more likely to be taught
mathematics by teachers trained as specialists in mathematics.
In summary, differentiation based on generalized or specialist training is complex,
making it difficult to place countries in the respective categories with full confidence.
What can be said with some confidence, though, is that students are more likely to be
taught mathematics by teachers with specialist training in the teaching of mathematics
in Canada, Chinese Taipei, Germany, Malaysia, Oman, Poland, the Russian Federation,
and Singapore than are students in the other TEDS-M countries.
2.4.2 Evaluation and Accreditation of Teacher Education Institutions
Accreditation in this report refers to an endorsement by an external agency that a
teacher education program is able to produce graduates who are competent to enter the
profession and to begin practice. TEDS-M gathered information from each participating
country about policies and agencies focused on monitoring and assuring the quality of
teacher education institutions and programs.
Some accreditation agencies are part of a national ministry of education, as with the
National Agency for Quality Assurance and Accreditation in Spain, the Federal Education
and Science Supervision Agency in the Russian Federation, and the Commission on
Higher Education (CHED) in the Philippines. Some are part of state governments,
as in Germany. Some are set up as independent statutory authorities, such as the
Ontario College of Teachers, the California Commission on Teacher Credentialing, the
Norwegian Agency for Quality Assurance in Education, and the Office for National
Education Standards and Quality Assessment in Thailand. Many of these bodies have
a certification or licensing function for beginning teachers as well as an accreditation
function. The United States is unique in allowing the establishment of independent,
not-for-profit, national professional agencies that provide voluntary accreditation at
the national level. One such agency is the National Council for Accreditation of Teacher
Education, which accredits about 40% of teacher education programs in the United
States.

47TEACHER EDUCATION POLICIES AND EMPLOYMENT CONDITIONS
There is a strong trend within the European community to establish or strengthen
accreditation agencies in order to facilitate, in accordance with the Bologna Process
(European Commission, 2011), mutual recognition of tertiary qualifications. As a
generalization, institutions for training primary teachers have been more regulated in
the past than have universities for training future secondary teachers.
Countries vary considerably therefore in terms of the locus of authority for regulating
and accrediting teacher education programs and institutions. They also differ in terms
of the nature and strength of central regulation and its capacity to shape and assure
the quality of teacher education. To capture this variation, the TEDS-M research team
classified accreditation systems in countries participating in TEDS-M according to the
following typology, which is adapted from the typology used in the Eurydice study
(Eurydice, 2006):
1. Countries with weak regulations or that have only voluntary systems for evaluating
and accrediting teacher education programs;
2. Countries with general regulations for evaluation of all higher education institutions,
but no regulations specific to teacher education institutions or programs;
3. Countries with specific as well as general regulations, but only for internal
evaluations by institutions—no requirement for external evaluations;
4. Countries that require teacher education institutions or programs to be evaluated
by an independent, external accreditation authority or agency, which have the
power to disaccredit.
Exhibit 2.6 shows the countries participating in the TEDS-M study classified, according
to this typology, on the basis of information provided in the country reports and the
Eurydice study. The exhibit details arrangements mainly for primary teacher education
programs; there is, however, considerable overlap in quality assurance arrangements for
primary and secondary teacher education.
Exhibit 2.6: Accreditation systems for teacher education, 2008
Regulation of Teacher Education Countries
Category 1: Countries with unregulated teacher education systems Chile, Philippines, Georgia, Oman or voluntary accreditation only
Category 2: Countries with agencies responsible for the accreditation Germany, Spain, Switzerland of higher education institutions, but that have limited requirements with respect to evaluating specific teacher education programs
Category 3: Countries with agencies responsible for the accreditation Malaysia, Norway, Polandof teacher education institutions, but based mainly on internal evaluations conducted by institutions; no independent, external evaluation
Category 4: Countries with external evaluation and accreditation of botswana, Canada, Chinese Taipei, Russian federation,teacher education providers by a government, statutory, or professional Thailand, United Statesagency. Power to disaccredit programs
Special case: Singapore
Although all NRCs carefully checked Exhibit 2.6, caution is needed when interpreting
its contents. As a generalization, the strength of the regulatory system increases
from Category 1 to 4. However, the mere presence of an accreditation system is not
necessarily a clear indication that teacher education standards are high, or the reverse.
Some countries have national teacher education accreditation bodies, but these bodies
lack the authority to evaluate programs rigorously or to revoke accreditation for poorly
performing programs. Although Botswana, Chinese Taipei, the Russian Federation,
THE TEACHER EDUCATION AND DEVELOPMENT STUDY IN MATHEMATICS (TEDS-M)48
Thailand, and the United States are alike in having agencies for the accreditation of teacher education, it is clear from the country reports that these agencies differ in their capacity to evaluate teacher education programs and assure their quality.
In Chinese Taipei, the Teacher Education Certification Committee exercises a strong influence over providers. Since 2005, it has adjusted the admission quota of future teachers according to yearly evaluations. Accreditation methods are based primarily on field visitations. Over the past three years, six teacher education universities received Level-3 ratings and were disqualified from providing teacher education programs.
Singapore is a special case because there is only one teacher education provider. It does not have an independent external accreditation body. However, on close inspection, it is evident that quality assurance mechanisms for teacher education are strong in that country. There are close links between the National Institute of Education and the Ministry of Education, and strong feedback systems are in place regarding program quality. In addition, international experts are regularly employed to provide independent evaluations in specialist fields such as mathematics teacher education.
In Germany, specific regulations apply solely to the evaluation of the second, “on-the-job” qualifying phase, which is organized by special second-phase institutions (Studienseminare) in each federal state. External evaluations are not compulsory. The management of universities or teacher education colleges—or the minister of education in the case of the second-phase institutions—are entitled to request an external evaluation if they consider this to be necessary in light of internal evaluation results.
In the Russian Federation, the Federal Education and Science Supervision Agency carries out state-education quality control in educational institutions both independently and with regulatory bodies of education of the constituent entities of the Russian Federation. It also carries out licensing, certification, and state accreditation of educational institutions and their branches as well as of scientific organizations (in the sphere of continuing vocational education and post-graduate education).
Few countries have subject-specific standards for accrediting programs. Chile is moving in this direction for its primary teacher education programs. It is developing detailed guidelines on the mathematical and pedagogical knowledge that it expects future primary teachers to learn. It is doing the same for other subjects, such as science and social studies. Some states in the United States have been moving in this direction as well. The National Council for Accreditation of Teacher Education uses subject-specific standards for accrediting programs, although its system is voluntary. It is also moving
from input- to outcome-based accreditation.
2.4.3 Requirements for Entry to the Teaching Profession
Gaining entry to the profession is arguably the critical decision point in assuring teacher quality. In TEDS-M, data were gathered about policies and agencies that participating countries had in place to ensure that graduates are competent and qualified to gain certification and full entry to the profession. In the TEDS-M study, the term certification is used to mean the same as registration or licensing, that is, an endorsement that a person has attained the standards for full entry to the teaching profession. This endorsement may be given by a government agency, a statutory authority, or, in rare cases in teaching, a professional body. The certification body is often the same agency that is responsible for accrediting teacher education programs. An example is the Ontario College of
Teachers.

49TEACHER EDUCATION POLICIES AND EMPLOYMENT CONDITIONS
Quality assurance policies and practices relating to entry to the profession vary widely
across the TEDS-M participating countries. In 2008, requirements for entry to the
profession in participating countries fell into the following three main categories, as
shown in Exhibit 2.7:
• Category 1 countries, where graduation leads automatically to certification and/or
official entry to the teaching profession;
• Category 2 countries, where entry to the profession depends on passing further tests
set by external agencies (e.g., licensure tests of professional knowledge);
• Category 3 countries, where entry to the profession depends on passing further
tests of professional knowledge and assessments of teaching performance during a
probationary period.
Most TEDS-M countries are in Category 1, which means that those students who have
met the graduation requirements of their training institution are deemed also to have
met the requirements for full entry to the teaching profession. Other countries have
several filters at this stage, including external examinations (e.g., of subject-matter
knowledge), a probationary period in a school, and an assessment of performance
before a graduate teacher can gain official entry to the profession. These filters are
indicative of an increasing trend to distinguish the requirements for graduation from a
university or college from the requirements to gain official entry to the profession (i.e.,
receive certification).
Responsibility for the latter is being placed increasingly in the hands of government
agencies or statutory professional standards boards. Examples include the Ontario
College of Teachers, the Teacher Professional Development Center in Georgia, and the
Teachers Council of Thailand. In part, this practice is an acknowledgment that making an
accurate prediction about a teacher’s competency is difficult until he or she has worked
in schools for a period of time and experienced authentic teaching responsibilities. This
trend is leading to increasing interest in effective mentoring and induction programs
and in more valid ways to assess teacher performance against professional standards.
In Spain, graduation for future primary teachers is sufficient to become a teacher in
a private school. However, teachers who want to be civil service teachers and teach in
a state school must pass a further competitive test which has a fixed quota limiting
the number of passes. In several TEDS-M countries, the agency responsible for official
entry or certification is essentially the national or state government. This is the case in
career-based systems, for example, where teachers gain access to the civil service through
Exhibit 2.7: Entry to the teaching profession, 2008
Entry to the Teaching Profession/Certification Countries
Category 1: Countries where graduation leads automatically to official botswana, Chile, Georgia, Malaysia, Norway, Poland, entry to the teaching profession Russian federation, Singapore, Spain,* Switzerland, Thailand
Category 2: Countries where entry to the profession depends on Canada (Ontario), Oman, Philippines, Spain** passing further tests set by external agencies (e.g., licensure tests of professional knowledge)
Category 3: Countries where entry to the profession or gaining Chinese Taipei, Germany, United Statesemployment depends on passing further tests of professional knowledge and assessments of performance
Notes:
* Spain: private school teachers.
** Spain: public school teachers.

THE TEACHER EDUCATION AND DEVELOPMENT STUDY IN MATHEMATICS (TEDS-M)50
a state examination after graduating from a university teacher education program.
In Singapore, the responsible agency is the Ministry of Education. In such cases, the
government is the body that regulates the teaching profession.
Countries in Category 2 generally require graduates to take an external entry test, in
addition to gaining a university qualification, to assure the quality of new teachers. The
responsible body is usually a state or a national government.
In Category 3, countries such as the United States use a process of certification or
licensing, whereby most states assess the qualifications of individuals to teach. However,
a few states delegate this function to a state professional standards body. In the
Philippines, the responsible body is the Professional Regulation Commission, the agency
that grants licenses to practice in all professions. In Chinese Taipei, entry is a two-stage
process. Graduates must pass a national test, the Teacher Qualification Assessment, to
be officially qualified by the Ministry of Education. However, gaining a position in a
school depends on another “screening” process that operates at the local level. This
involves more written tests, and assessments of teaching performance as well.
2.4.4 Summary of Quality Assurance Policies in TEDS-M Countries
The purpose of the fourth part of this chapter (Section 2.4) has been to summarize
policies for assuring the quality of initial teacher education. This information allows
exploration of relationships between these policies and measures of teacher education
practices and outcomes developed in the TEDS-M study and reported in later chapters
of this report. Among the many questions that can be asked are the following:
• Whatistherelationshipbetweenthemathematicalknowledgeoffutureteachersand
the relative strength of national quality assurance systems?
• Areopportunitiestolearnmathematicsduringteachereducationprogramsgreater
in countries with strong quality assurance systems than in countries without?
• Do future teachers from countries with strong controls over standards for entry
to teacher education programs have more knowledge of mathematics than future
teachers from countries that focus on standards for the accreditation of programs?
• Istherelessvariationinfutureteachers’perceptionsofthequalityoftheirtraining
and their preparedness to teach in countries that have rigorous and compulsory
accreditation systems?
Many similar questions can be explored.
So that they could explore such questions, the TEDS-M research team had to find a
defensible way to assess the relative strength of quality assurance systems. Exhibit 2.8
brings together the findings about quality assurance arrangements presented earlier in
Exhibits 2.2 to 2.7. These arrangements include policies designed to assure:
• Thequalityofentrantstoteachereducation;
• Thequalityofteachereducationprograms;and
• Thequalityofthequalificationsthatgraduatesofteachereducationprogramsmust
have in order to enter the profession.
In Exhibit 2.8, the depth of shading indicates the strength of quality assurance
arrangements. Darker shading indicates stronger quality assurance. More detail on
estimating the relative strength of quality assurance arrangements can be found in
Ingvarson et al. (forthcoming).

51TEACHER EDUCATION POLICIES AND EMPLOYMENT CONDITIONS
Exh
ibit
2.8
: Qua
lity
assu
ranc
e m
echa
nism
s in
teac
her
educ
atio
n
Co
untr
y
Entr
y in
to T
each
er E
duc
atio
n
A
ccre
dit
atio
n o
f
Entr
y to
the
Tea
chin
g R
elat
ive
Stre
ngt
h o
f
Te
ache
r Ed
ucat
ion
Pr
ofe
ssio
n
Qua
lity
Ass
uran
ce S
yste
m
C
on
tro
l ove
r su
pp
ly o
f Pr
om
otio
n o
f te
achi
ng
Se
lect
ion
sta
nd
ard
s Pr
og
ram
s
te
ache
r ed
ucat
ion
as
an
att
ract
ive
care
er
for
entr
y to
tea
cher
st
uden
ts
ed
ucat
ion
Key
: S
tron
g qu
ality
ass
uran
ce p
roce
dure
s M
oder
atel
y st
rong
qua
lity
assu
ranc
e pr
oced
ures
L
imite
d qu
ality
ass
uran
ce p
roce
dure
s
bots
wan
a M
oder
ate
Can
ada
Mod
erat
e
Chi
le
Low
Chi
nese
Tai
pei
Hig
h
Geo
rgia
Lo
w
Ger
man
y M
oder
ate/
Hig
h
Mal
aysi
a M
oder
ate
Nor
way
M
oder
ate/
Low
Om
an (S
econ
dary
) Lo
w
Phili
ppin
es
Low
Pola
nd
Mod
erat
e
Russ
ian
fede
ratio
n M
oder
ate
Sing
apor
e H
igh
Spai
n
Mod
erat
e/Lo
w
Switz
erla
nd
Mod
erat
e
Thai
land
Lo
w
Uni
ted
Stat
es
Mod
erat
e

THE TEACHER EDUCATION AND DEVELOPMENT STUDY IN MATHEMATICS (TEDS-M)52
To illustrate, using Botswana as the example, we can see from Exhibit 2.8 that Botswana
reported relatively strong controls over supply and demand and entry to teacher
education for primary teachers; however, the Botswana NRC reported concerns about
the country’s ability to attract stronger students into mathematics teacher education
programs. The exhibit also shows that Botswana has specific mathematics requirements
for entry to teacher education and moderately strong arrangements for evaluating and
accrediting teacher education programs. And although Botswana has a probationary
period for beginning teachers, there are no formal requirements for graduates to
be assessed before gaining entry to the profession. Overall, Botswana has stronger
arrangements for quality assurance than some countries and weaker arrangements than
others. Its quality assurance arrangements are therefore rated as medium strength in
relation to other countries that participated in TEDS-M.
Exhibit 2.8 furthermore shows that, of the 17 countries participating in TEDS-M,
Chinese Taipei and Singapore have the strongest and most coordinated quality assurance
systems. They have relatively strong policy arrangements in place to assure the quality
of future teachers. There are quotas on the number of teacher education places. Policies
developed over many years ensure that teaching is a relatively attractive career option for
abler students. Selection standards are high. A rigorous system for external evaluation
of teacher education programs is in place and, in the case of Chinese Taipei, entry to
the profession does not follow automatically on graduation from a teacher education
program. In addition, full entry to the profession depends on an additional assessment
of professional knowledge, while securing a teaching position depends on a satisfactory
assessment of performance capabilities after a probationary period in schools.
Four countries in TEDS-M reported having strong controls over the number of entrants
accepted into teacher education programs: Chinese Taipei, Malaysia, Oman, and
Singapore (see Exhibit 2.8). Canada, Chinese Taipei, and Singapore have specific policies
to ensure that teaching is an attractive career and recruits are able high school graduates.
Chinese Taipei and Singapore have the highest requirements for the mathematics
courses that future teachers must complete in order to enter the professional training
component of their teacher education program.
Another finding of note in Exhibit 2.8 is that rigorous procedures for assessing and
accrediting teacher education programs are rare in the TEDS-M countries, a situation
that contrasts with many other professions, such as engineering and accountancy,
which are using outcome measures and moving to international approaches that
provide mutual recognition of accreditation procedures and qualifications. Singapore
and Chinese Taipei have the strongest arrangements for monitoring and evaluating the
effectiveness of their teacher education programs in terms of outcomes.
We can also see from Exhibit 2.8 that graduation from teacher education programs
in most TEDS-M countries leads automatically to full entry to the profession. In the
Province of Ontario, new teachers must complete a probationary year of successful
teaching before being able to apply for full registration, signed off by the superintendent
of the local school board. The Ontario report gave no details on the rigor and consistency
of the methods used to assess success.
The United States has rigorous procedures for assessing beginning teacher performance
in some states, but the procedures are applied inconsistently across institutions and
programs. Some states also allow for alternative routes into teaching and even

53TEACHER EDUCATION POLICIES AND EMPLOYMENT CONDITIONS
“emergency” certification of teachers in areas where there are shortages. Chinese
Taipei enforces its quality control over entrants more consistently than do the other
TEDS-M countries. Germany sits in this group because future teachers in the second
phase of training spend the equivalent of at least 1.5 to 2 years in schools, taking full
responsibility for a class and participating in other school-based tasks. They work with
mentor teachers, and their performance must be assessed as part of the second state
examination.
Ingvarson et al. (forthcoming) explore in more detail the relationships between the
strength of quality assurance arrangements and the mathematical knowledge of future
teachers. The analysis of data conducted for that report indicates that, based on the
TEDS-M countries as units of analysis, there is a relationship between quality assurance
arrangements and the mathematics knowledge of future primary generalist teachers.
There is also a relationship between quality assurance arrangements and the mathematics
knowledge of future lower-secondary teachers and future upper-secondary teachers.
Countries with strong quality assurance arrangements, such as Chinese Taipei and
Singapore, scored highest on the outcome measures used in the TEDS-M survey.
Countries with weaker arrangements, such as Georgia and Chile, tended to score lower
on measures of mathematics content knowledge (MCK) and mathematics pedagogy
content knowledge (MPCK).
2.5 Conclusion
In this chapter, we summarized information about teacher education policies and
working conditions for teachers in the TEDS-M countries. These two factors may be
relevant to understanding the processes and outcomes of teacher education and the
attractiveness of teaching as a career.
The ways in which countries organize their teacher education systems reflect a number
of policy choices. The length of teacher education program-types is an obvious
example, and it is one that has major implications for costs. Whether program-types
are concurrent or consecutive, or whether teachers of mathematics have been trained
as generalists or specialists are others. Exhibit 2.1 provided a comprehensive summary
of the organizational characteristics of teacher education program-types included in
TEDS-M. We explore the extent to which variation in these characteristics leads to
differences in opportunities to learn mathematics content and mathematics pedagogy
and other outcomes in each of the participating countries in later chapters of this report,
as well as in other publications from the TEDS-M project.
Determining differences in the positions and careers for which teachers are being
prepared is an initial step toward understanding what these positions and careers call
for in terms of knowledge for teaching and the nature of the opportunities that future
teachers have to learn this knowledge. These again are issues explored in later chapters of
this report. This section of the current chapter also detailed the challenges, rewards, and
difficulties associated with these positions and careers. From the information provided
in the country reports, it is apparent that some TEDS-M countries have established
very favorable conditions for teachers while others have not, and still others have much
internal diversity in this respect. This variation in employment conditions is determined
by many factors, some of which are directly subject to policy change while others are
not (e.g., resources available to finance schooling and teacher education).

THE TEACHER EDUCATION AND DEVELOPMENT STUDY IN MATHEMATICS (TEDS-M)54
The last section of the chapter, on quality assurance, concentrated on policies that
are more directly under the control of educational policymakers and which could be
expected to influence the quality of teacher education. The main finding was the great
variation in policies related to quality assurance: in particular, the quality of entrants to
teacher education programs, the quality of teacher education programs, and the quality
of graduates who gain full entry to the teaching profession.
The TEDS-M data reveal a substantial relationship between the strength of these
quality assurance arrangements and the quality of graduates as measured by tests used
in the TEDS-M study (as reported later in this volume). Countries with strong quality
assurance arrangements, such as Chinese Taipei and Singapore, scored highest on the
outcome measures used in TEDS-M; countries with weak arrangements scored lowest.
Chinese Taipei and Singapore do very well on international tests of student achievement,
such as TIMSS (Mullis, Martin, Olson, Berger, Milne, & Stanco, 2007). These are the
same countries that not only ensure the quality of entrants to teacher education, but
also have strong systems for reviewing, assessing, and accrediting teacher education
providers. They have also developed strong mechanisms for ensuring that graduates
meet high standards of performance before gaining certification and full entry to the
profession. These country-level relationships between quality assurance policies and
student achievement call for further investigation.
References
Barber, M., & Mourshed, M. (2007). How the best performing school systems come out on top.
London, UK: McKinsey & Co.
Burghes, D. (2008). International Comparative Study in Mathematics Teacher Training (CfBT).
University of Plymouth, UK: Education Trust.
European Commission. (2011). The Bologna Process: Towards the European Higher Education
Area. Brussels, Belgium: Author. Retrieved from http://ec.europa.eu/education/higher-education/
doc1290_en.htm
Eurydice (2006). Quality assurance in teacher education in Europe. Brussels, Belgium: European
Commission.
Hanushek, E. A. (2004). Some simple analytics of school quality (Working Paper No. 10229).
Cambridge, MA: National Bureau of Economic Research.
Hattie, J. (2008). Visible learning: A synthesis of over 800 meta-analyses relating to achievement.
London, UK: Routledge
Ingvarson, L. C., Schwille, J., Tatto, T., Rowley, G., Senk, S., & Peck, R. (forthcoming). National
policies and regulatory arrangements for the preparation of teachers in TEDS-M countries. Amsterdam,
the Netherlands: International Association for the Evaluation of Educational Achievement.
Organisation for Economic Co-operation and Development (OECD). (2005). Teachers matter:
Attracting, developing and retaining effective teachers. Paris, France: Author.
Mullis, I. V. S., Martin, M. O., Olson, J. F., Berger, D. F., Milne, D., & Stanco, G. M. (Eds.). (2008).
TIMSS 2007 encyclopedia: A guide to mathematics and science education around the world (Vols. 1 &
2). Chestnut Hill, MA: Boston College.
Schwille, J., & Dembélé, M. (2007). Global perspectives on teacher learning: Improving policy and
practice (Fundamentals of Educational Planning, No. 84). Paris, France: International Institute for
Educational Planning, UNESCO.

55TEACHER EDUCATION POLICIES AND EMPLOYMENT CONDITIONS
Schwille, J., Ingvarson, L., & Holdgreve-Resendez (Eds.). (forthcoming). TEDS-M encyclopedia:
A guide to teacher education context, structure and quality assurance in the seventeen TEDS-M
countries. East Lansing, MI: TEDS-M International Study Center.
Tatto, M. T. (2007). Reforming teaching globally. Oxford, UK: Symposium Books (reissued in 2009
by Information Age Publishers).

THE TEACHER EDUCATION AND DEVELOPMENT STUDY IN MATHEMATICS (TEDS-M)56

57
CHAPTER 3: THE DISTINCTIVE NATIONAL IMPRINT OF EACH TEDS-M SYSTEM
3.1 Chapter Overview
Although there are many commonalities across national systems of teacher education,
at least in terms of the organizational characteristics by which they were analyzed in
Chapter 1, each has its own particular characteristics. This national imprint is rooted
in history and reflects a particular cultural, social, and political context. We begin this
chapter with a comparison of the 17 countries in terms of relevant demographic and
development indicators, and then provide a brief summary of the salient, distinctive
organizational features of all 17 of the teacher education systems represented in
TEDS-M. What becomes apparent as this chapter unfolds is that the countries and
their teacher education systems parallel one another in various respects, but they also
all differ from one another in distinctive, non-parallel ways that need to be taken into
account when interpreting the TEDS-M survey data. Each country summary is based
primarily on the TEDS-M country reports, with authorship as cited in each section.
3.2 National Differences in Demographic and Development Indicators
The 17 countries that agreed to participate in TEDS-M differ in many important
geographic, demographic, economic, and educational respects. A selection of these
characteristics is presented in Exhibits 3.1 and 3.2. The TEDS-M sample included
very large countries, such as the Russian Federation and the United States, and small
countries such as Singapore. Although well over half the population lives in urban areas
in nearly all of the countries, some countries are densely populated while others are
sparsely populated (just 3 people per square kilometer in Botswana, compared with 230
in Germany, 301 in the Philippines, and 6,545 in the city-state of Singapore). It is more
challenging for education systems, in general, and teacher education, in particular, to
serve a widely dispersed population. Health statistics are also relevant. A high incidence
of poor health affects all sectors of society, including education, and the effect is
especially great in the case of pandemics such as HIV/AIDS. TEDS-M countries are
relatively fortunate in this respect: as shown in Exhibit 3.1, life expectancy at birth is
high in the TEDS-M countries. It is, on average, above 70 in all but three countries (80
or more in six). These healthy, aging populations will, all else being equal, make for
slower growth in the demand for basic education.
The TEDS-M countries vary greatly with respect to per capita income. Countries with
very large per capita incomes can more readily fund the needs of education than those
where resources are far more limited. A look at gross national income (GNI) per capita
(all amounts are shown in US dollars) reveals roughly four levels of wealth across the
TEDS-M countries (the last column of Exhibit 3.1). Countries that score very high on
this index (with a range of $40,000 to just above $60,000) are (in descending order)
Norway, Singapore, the United States, and Switzerland. The next set of countries, labeled
high (a range of $30,000 to $40,000), are Canada, Germany, Chinese Taipei, and Spain.
The set of countries labeled middle (with a range of $10,000 to $30,000) include Oman,
the Russian Federation, Poland, Malaysia, Chile, and Botswana.

THE TEACHER EDUCATION AND DEVELOPMENT STUDY IN MATHEMATICS (TEDS-M)58
bots
wan
a
1.
9 58
2 3
59
54
113
13,
250
Mid
dle
Can
ada
33
.3
9,98
5 3
80
81
10
38
,490
H
igh
Chi
le
16
.8
756
22
88
79
45
13,4
30
Mid
dle
Chi
nese
Tai
pei
2
2.9
36
637
80
78
20
32,
700
Hig
h
Geo
rgia
4.3
70
62
5
3 72
1
17
4,
860
Low
Ger
man
y 8
2.3
357
230
74
80
4
37,5
10
Hig
h
Mal
aysi
a 2
7.0
331
82
70
74
40
13,9
00
Mid
dle
Nor
way
4.8
32
4 12
7
7 81
23
60
,510
Ve
ry h
igh
Om
an
2
.8
310
9 7
2 76
74
24
,530
M
iddl
e
Phili
ppin
es
90.
3 30
0 30
1 6
4 72
47
3,94
0 Lo
w
Pola
nd
38.
1 31
3 12
2 6
1 76
21
17
,640
M
iddl
e
Russ
ian
fede
ratio
n 14
1.4
17,0
98
8 7
3 68
12
19
,770
M
iddl
e
Sing
apor
e
4.6
1
6,54
5 10
0 81
43
52
,000
Ve
ry h
igh
Spai
n
44.
5 50
6 88
7
7 81
9
32
,060
H
igh
Switz
erla
nd
7.5
41
183
73
82
19
42,2
20
Very
hig
h
Thai
land
67.
4 51
3 13
1 3
3 69
32
7
,830
Lo
w
Uni
ted
Stat
es
311
.7
9,62
9 32
8
1 78
1
47
,100
Ve
ry h
igh
Not
es:
1. G
DP
= g
ross
dom
esti
c pr
odu
ct, G
NI
= g
ross
nat
ion
al in
com
e.2.
For
th
e so
urc
es o
f th
ese
stat
isti
cs, s
ee E
xhib
it A
3.1
in A
ppen
dix
A.
Exh
ibit
3.1
: TE
DS-
M p
arti
cipa
ting
cou
ntri
es: n
atio
nal d
emog
raph
ic a
nd h
uman
dev
elop
men
t sta
tist
ics
Co
untr
y Po
pul
atio
n
Are
a (1
,000
s
Pop
ulat
ion
U
rban
Po
pul
atio
n
Life
Exp
ecta
ncy
R
ank
in
GN
I per
Cap
ita
Leve
ls o
f W
ealt
h
(mill
ion
s)
of
sq k
m)
Den
sity
(p
eop
le
(%
of
tota
l)
at B
irth
(ye
ars)
To
tal G
DP
(Pur
chas
ing
p
er s
q k
m)
Po
wer
Par
ity)

59 NATIONAL IMPRINT Of EACH TEDS-M SYSTEM
Exhibit 3.2: TEDS-M participating countries: youth demographic and education statistics
Country Total Fertility Population Age Public Net Enrollment Ratio in Primary Rate Composition Expenditure on Education Student–Teacher Ages 0–14 Education (% of relevant group) Ratio (%) (% of GDP) Primary Secondary
botswana 3 34 8.1 90 64 25
Canada 2 17 4.9 100 94 17
Chile 2 23 3.4 95 85 25
Chinese Taipei 1 17 4.2 97 95 17
Georgia 2 17 2.7 99 81 9
Germany 1 14 4.4 100 89 13
Malaysia 3 30 4.5 96 68 15
Norway 2 19 6.7 99 96 11
Oman 3 32 4.0 72 78 12
Philippines 3 34 2.6 92 61 34
Poland 1 15 4.9 96 94 11
Russian federation 1 15 3.9 91 – 17
Singapore 1 17 2.8 – – 19
Spain 1 15 4.4 100 95 12
Switzerland 1 16 5.3 99 85 13
Thailand 2 22 4.9 89 72 16
United States 2 20 5.5 93 88 14
Note: For sources of these statistics, see Exhibit A3.2 in Appendix A.
The final set of countries—those with the lowest GNI in the TEDS-M study and
therefore labeled low (with a range of $3,000 to $10,000)—are Thailand, Georgia, and
the Philippines. There were no very low income countries in the sample, that is, those
countries with GNI per capita of less than $3,000.
TEDS-M also included some of the largest economies in the world, as measured by total
gross domestic product (GDP) for 2008. The United States (ranked first), Germany
(fourth), Spain (ninth), Canada (10th), and Russia (12th) are all among the most
highly ranked of 186 countries with economies of more than US$1 trillion each in total
GDP. Nine others are also in the first quartile of countries, when ranked by the total
size of their economy, even though some of these countries are very small in terms of
population: Switzerland (19th), Chinese Taipei (20th), Poland (21st), Norway (23rd),
Thailand (32nd), Malaysia (40th), Singapore (43rd), Chile (45th), and the Philippines
(47th). Thus, only one country (Oman) is in the second quartile, and the two remaining
countries (Botswana and Georgia) are just slightly below the median rank. TEDS-M
makes no claim to being representative of the world’s countries. It includes instead a
relatively advantaged, but still diverse, subsample.
The factors affecting population growth—fertility, mortality, and net immigration—
also differ greatly among the TEDS-M countries. A higher rate of population growth
means a greater need for schools and teachers, which, in turn, affects the demand for
teacher education. Conversely, and without compensating for rates of immigration, if
there is a decline in the number of children born because of declining fertility rates, the
need for new teachers will decline, thus reducing the demand for teacher education.
When we look at the total fertility rates of TEDS-M countries, we see that, in general,

THE TEACHER EDUCATION AND DEVELOPMENT STUDY IN MATHEMATICS (TEDS-M)60
this is a group of low-fertility countries. According to recent statistics (shown in Exhibit
3.2), all but four of the TEDS-M countries are at or below the replacement level (which
ranges from about 2.1 to 2.3 children born per woman, depending on adjustments
made for mortality and sex ratios at birth). The four countries with high total fertility
rates are Botswana, Malaysia, Oman, and the Philippines. A closely related statistic, the
percentage of the total population aged birth to 14 years, shows the same four countries
at a relatively high level; about a third of their respective populations comprise this
young age group. All the other countries with lower total fertility rates have a much
smaller proportion of children in the total population, from 14 to 23%. Even with equal
levels of per capita wealth, countries with a lower proportion of children find it easier
to support teachers and teacher education.
In another demonstration of important country differences, Exhibit 3.2 provides key
statistics on education, including public expenditure on education, net enrollment ratios
in primary and secondary schools, and student–teacher ratios. Most revealing among
these data is public expenditure on education, as indicated by percentage of GDP. The
countries that allocate the highest proportion of their GDP to public education are
Botswana and Norway (8.1 and 6.7%, respectively). These are followed by five countries
at about 5.0 to 5.5% (United States, Switzerland, Poland, Thailand, and Canada), then
six countries at about 4.0 to 4.5% (Malaysia, Germany, Spain, Chinese Taipei, Oman,
and Russia), and, finally, four countries at about 2.5 to 3.5% (Singapore, Georgia, the
Philippines, and Chile).
Nevertheless, whatever the differences in resources, other education indicators tend
toward uniformity. Only Oman is below 89% with regard to primary school enrollment
rate and, with the exception of Botswana, Chile, and the Philippines, student–teacher
ratios in primary schools are in the 10 to 20 students per teacher range or even slightly
lower. Secondary enrollment rates, however, show more variation. The move toward a
universal basic education, with 8, 9, or 10 years of compulsory schooling, is still far from
complete, even among the TEDS-M countries.
Within these varied and changing contexts, teacher education has been a work in
progress for the last 200 years (see the historical chapter in the companion TEDS-M
policy volume in Ingvarson, Schwille, Tatto, Rowley, Peck, & Senk, forthcoming), and
there is little sign that this situation will change. Systems are in a constant state of flux,
making it difficult to describe each system as an ongoing entity. At any one time, a system
may be experiencing changing types of program, growth or decline in size, program-
types being phased out or created, and discussions of all sorts of other changes that
may or may not happen. Thus, both a broader and deeper perspective is needed to
make this ongoing mixture of new and old forms of organization, in varying degrees
of implementation, and subject to normal fluctuations of growth and decline, more
understandable. To this end, TEDS-M country reports provide fascinating windows
into how much teacher education systems have come to vary within the context of the
continuing effort to make primary and lower-secondary education universal throughout
the world. In this process, each of the program-types described below has come to have
its own distinctive character in response to these different contexts.

61 NATIONAL IMPRINT Of EACH TEDS-M SYSTEM
3.3 Country-by-Country Introduction to Program-Types and Their National Contexts
The remainder of this chapter portrays the distinctive characteristics and context of
each national system, in terms of what the authors of the country reports consider
is most important for readers to know when analyzing and interpreting the TEDS-M
survey data. In addition to a narrative explanation, each section contains three graphs
that give an immediate visual image of the diversity of program-types within and across
countries. These graphs are based on Exhibit 2.1 and on a table displaying estimated
sizes of program-types as an additional feature.
The three organizational characteristics portrayed in these graphs were discussed in
cross-national terms in Chapter 2. They are:
• Thegradespanforwhicheachcountrypreparesteachers;
• Thedurationofeachprogram-type(i.e.,thetotalnumberofyearsofpost-secondary
education required to become a fully qualified teacher); and
• Thesizeoftheprogram-typeintermsofnumberoffutureteachers(FTs)inthefinal
year of their teacher education (as estimated from the TEDS-M sample).
The narrative summarizes the distinctive national context required for understanding
these program-types and for interpreting the data discussed in later chapters. These are
listed under three headings: (1) institutions and governance, (2) program-types and
credentials, and (3) curriculum content, assessment, and organization.
3.3.1 Botswana1
Botswana is a classic mixed system, in which some teachers are prepared at the university,
while others are enrolled in teachers’ colleges that do not have university status.
3.3.1.1 Institutions and governance
Under its Ministry of Education, Botswana has six colleges of education; four prepare
only primary school teachers and two prepare only secondary school teachers. Primary
and secondary teachers are also trained at what was, until recently, the country’s only
university, the University of Botswana. It has more autonomy than the colleges (e.g., to
set limits on admissions).
3.3.1.2 Program-types and credentials
Primary school in Botswana extends from Grades 1 to 7—longer than in most
countries. Junior secondary schools cover Grades 8 to 10; only 56% of the age group’s
population is enrolled in secondary education, a proportion that is lower than in any
other TEDS-M country. Teacher education aligns with these school types (see Exhibit
3.3). The Botswana authors reported one primary program-type—the Diploma in
Primary Education from the colleges, as portrayed in Exhibit 3.3. (The Bachelor of
Primary Education from the university was not included in TEDS-M due to a lack of
students.) Secondary teachers can be prepared in four program-types: one at the two
colleges for teachers and three at the university. However, as evident in Exhibit 3.3, only
two were included in TEDS-M: the Diploma in Secondary Education at the colleges and
the Bachelor of Secondary Education (Science) at the university.
1 This section is based on the national report written by K. G. Garegae, T. J. Mzwinila, and T. M. Keitumetse.

THE TEACHER EDUCATION AND DEVELOPMENT STUDY IN MATHEMATICS (TEDS-M)62
The latter is a concurrent program-type with more demanding entrance requirements
than the corresponding program-type at the colleges. Graduates of this program-type
can teach up to Grade 12, whereas the graduates of the college program-type can teach
only up to Grade 10. The two secondary program-types not included in the TEDS-
M target population are the consecutive Post-Graduate Diploma in Education, which
produces almost no graduates, and the B.Ed. (secondary) program-type, which is
intended for practicing teachers who have at least two years’ teaching experience.
3.2.1.3 Curriculum content, assessment, and organization
The colleges offer a three-year, full-time program-type. The first year, for example,
includes courses in communication and study skills, educational technology, special
needs education, two teaching subjects, and teaching practice. Although primary
teachers are expected to teach all subjects, a new trend is to add a specialization in
certain areas, such as primary education and mathematics/science. At the university, the
Bachelor of Secondary Education (Science) produces teachers of mathematics as well
as science. It is a full-time, four-year program-type, but students start taking education
coursework only in the second year. Overall, this program-type is 70% content and
30% mathematics education. The instructor determines course content, and submits a
course outline to the department head for his or her approval.
Each program-type has different practicum requirements. The colleges of education
require two weeks of classroom observation in the first year (for primary but not
secondary future teachers), 10 weeks of internship in Year 2, and a five-week practicum
in Year 3. At the university, the Bachelor of Secondary Education (Science) students
undertake seven weeks of teaching practice during both Years 2 and 3.
College students are required to complete written assignments, annual examinations,
and a final research project. An external moderator conducts a final assessment of every
student’s work. This includes a research project and teaching practice. At the university,
the final grade for each course combines continuous assessment and a final examination.
Teaching practice is graded pass or fail; there is no external moderation.
Exhibit 3.3: Teacher education program-types in Botswana
Note: Because the Postgraduate Diploma in Education one-year consecutive program produces very few graduates, it was not included in the TEDS-M target population. The Bachelor of Primary Education at the university was also excluded because of a lack of students. The Bachelor of Education (secondary) program was not included because it is intended for practicing teachers who have at least two years of teaching experience. It was therefore outside the scope of TEDS-M.
1 2 3 4 5 6 7 8 9 10 11 12
A
b
C
Grade span for which teachers are prepared
0 1 2 3 4 5 6
Duration of program-type (years)
0 40 80 120 160 200
Estimated no. of final-year students per program-type
Key to program-type
A—bachelor of Secondary Education (Science), university
b—Diploma of Secondary Education, colleges of education
C—Diploma in Primary Education
63 NATIONAL IMPRINT Of EACH TEDS-M SYSTEM
3.3.2 Canada (Newfoundland and Labrador, Nova Scotia, Québec, and Ontario)2
In Canada, education is the responsibility of each province or territory; there is no
federal body overseeing education at the national level. TEDS-M was conducted in
four Canadian jurisdictions—Newfoundland and Labrador, Nova Scotia, Ontario,
and Québec. These four provinces account for 66% of the total Canadian population,
estimated at nearly 34 million in 2010 (62% of all Canadian residents live in Ontario
and Québec).
3.3.2.1 Institutions and governance
Teacher education is offered in a total of 56 institutions across all provinces in Canada.
A small number of these are affiliates of larger institutions and include English- and
French-speaking programs within the same institution. Multiple institutions are found
in all but two provinces, Newfoundland and Labrador, and Prince Edward Island.
Four institutions in Nova Scotia offer teacher education, three in English and one in
French. Twelve institutions offer teacher education in Québec—nine in French and
three in English. There are 13 faculties of education in Ontario universities. All 13 have
offerings in English and two also in French. There is no preservice teacher education
in Canada’s three territories, as they tend to draw their teachers from the provincial
teacher education institutions across the country.
3.3.2.2 Program-types and credentials
Canada has diverse program-types but they share commonalities. In general, teacher
education institutions offer two routes to graduation—concurrent or consecutive.
Concurrent program-types usually offer four years of professional education courses
along with academic courses. Some of these concurrent program-types lead to a
Bachelor of Education (B.Ed.) degree; others, which require five years, lead to a degree
in an academic specialty, as well as the B.Ed. Consecutive program-types require
candidates to obtain an academic degree before being accepted in a teacher education
program-type, with the latter usually concentrated into one or two years. The duration
is related to certification requirements. For example, the minimum requirement for
certification in Nova Scotia is a two-year program-type following the first degree; in
Ontario, certification follows a one-year post-degree program-type. The general trend
across most provinces is toward consecutive program-types. The exception is Québec,
where almost all preservice teacher education is concurrent.
Most institutions offer primary- and secondary-level intakes for each of the two routes
to the B.Ed. Primary teachers are usually considered generalists, but teachers at the
secondary level are expected to specialize in one or more disciplines. Generally, secondary
teachers are expected to specialize in school subjects, that is, subjects mentioned in
certification requirements and provincial curricula, and taught in schools. Most primary
program-types are concurrent, while secondary program-types are consecutive.
In some jurisdictions, teaching certificates are endorsed only for specific levels or
subjects. However, the degree to which teachers holding these endorsed certificates are
restricted to their defined areas of specialization varies with jurisdiction and location,
and depends on teacher supply and demand.
2 This section was written with the assistance of national research coordinator Pierre Brochu.

THE TEACHER EDUCATION AND DEVELOPMENT STUDY IN MATHEMATICS (TEDS-M)64
All teacher education program-types in Canada require future teachers to participate in
some in-school teaching experience, referred to variously as a practicum, an internship,
or student teaching. The long-term trend is toward longer in-school placements,
distributed throughout the program-type, rather than concentrated at the end.
Because education is a provincial responsibility, curriculum content, assessment, and
certification requirements vary from jurisdiction to jurisdiction (see Exhibit 3.4):
• Newfoundland and Labrador: The main program-type divisions are referred to
as primary/elementary and intermediate/secondary. The primary/elementary
program-type is concurrent, requiring a total of five years to complete. Students
typically enter the professional component in their third year. The secondary
program-type is a three-semester consecutive one, completed over 14 months. A
representative body of stakeholders governs teacher certification in Newfoundland
and Labrador, and the Department of Education administers the system.
• Nova Scotia: Nova Scotia has the only system in Canada in which a two-year
(four-semester) consecutive program-type is the norm and is a requirement for
certification. Teacher certification in Nova Scotia is administered by the Department
of Education. It is offered at two levels—one for Grades 1 to 6 and the other for
Grades 7 to 12.
• Québec: Given the concurrent nature of almost all Québec preservice program-
types, future teachers in that system generally take four years to complete the B.Ed.
degree. Teacher certification in Québec is governed by the Comité d’agrément des
programmes de formation à l’enseignement (CAPFE), a representative body of
stakeholders. Certification is for Grade spans 1 to 6 and 7 to 11.
• Ontario: Almost all Ontario institutions offer consecutive program-types (of
two semesters’ duration) to students who already have a Bachelor’s degree. The
practicum takes up almost half of that time. Three program-types—primary3/
junior (Grades K to 6), junior/intermediate (Grades 4 to 10), and intermediate/
secondary (Grades 7 to 12)—are typical. This structure conforms to the structure
for teacher certification, thereby allowing teachers to be certified to teach across a
range of grade levels. Teacher certification in Ontario is governed by the Ontario
College of Teachers, an independent body.
3 Note that the term primary as used in Ontario differs from its more general use in TEDS-M. In TEDS-M, primary is used consistently for what is generally the first level of compulsory schooling, even when the national terminology is different (e.g., elementary).

65 NATIONAL IMPRINT Of EACH TEDS-M SYSTEM
3.3.3 Chile4
Most teacher education provision in Chile focuses on preparing generalist teachers
for all subjects of the eight-year basic school. In this respect, Chile differs from most
countries, where teachers for Grades 7 and 8 (and sometimes 4, 5, and/or 6) are prepared
differently and are more specialized than teachers in the lower grades.
3.3.3.1 Institutions and governance
Responsibility for teacher education in Chile is almost entirely delegated to the
universities, as well as to a few tertiary-level professional institutes. During the 1990s,
most teacher education in Chile took place in publicly funded universities. More
recently, however, a growing number of private universities have started to provide
teacher education. TEDS-M sampling information shows that when the study began in
2006, 16 public universities, 22 private universities, and 5 professional institutes offered
teacher education program-types for basic education teachers.
Chile has no established government policies related to coordination of teacher
education. Instead, the Ministry of Education maintains an informal relationship with
teacher education institutions.
3.3.3.2 Program-types and credentials
Applicants for teaching positions must have a teaching qualification from a university or
a professional institute appropriate to the level in which they are to teach. Beyond that,
there are no national requirements governing appointment in schools. The Organic
Law of Education (1990) defines teaching qualifications in terms of a licentiate degree
in education and a teaching entitlement (Titulo de Professor).
Exhibit 3.4: Teacher education program-types in Canada
Note: The third graph was omitted because the nature of the data collected meant it was not possible to accurately estimate enrollments by program-type.
Key to program-type
A—Intermediate/Senior (Ontario)
b—Junior/Intermediate (Ontario)
C—Primary Junior (Ontario)
D—Secondary 1–5 (Québec)
E—Primary (Québec)
f—Secondary (Junior and Senior High) (Nova Scotia)
G—Primary (Nova Scotia)
H—Intermediate/Secondary (Newfoundland-Labrador)
I—Primary/Elementary (Newfoundland-Labrador)
1 2 3 4 5 6 7 8 9 10 11 12
A
b
C
D
E
f
G
H
I
Grade span for which teachers are prepared Duration of program-type (years)
0 1 2 3 4 5 6
4 This section is based on the national report written by Beatrice Avalos.

THE TEACHER EDUCATION AND DEVELOPMENT STUDY IN MATHEMATICS (TEDS-M)66
In most institutions, teacher education is offered as a concurrent program-type,
lasting from 8 to 10 semesters. However, as mentioned above, the main program-type
prepares future teachers to teach all subjects in Grades 1 to 8, and 11 institutions offer
supplementary subject-matter specialization, requiring candidates to take additional
courses in a particular subject. As Exhibit 3.5 shows, both program-types serve Grades
5 to 8, but compared to the program-type for Grades 1 to 8, the program-type with
additional mathematics prepares only a few teachers.
3.3.3.3 Curriculum content, assessment, and organization
Within the Chilean program-types, the offerings are similar: subject-matter knowledge,
pedagogy, general education, and field experience. A semester-long or four-month
practicum is required in addition to the program-long field experiences. The licentiate
mandates a written thesis. Students spend the majority of their last semester on this
requirement, working individually or collectively.
Exhibit 3.5: Teacher education program-types in Chile
Note: According to the national research coordinator for Chile, the program-type offering extra mathematics did not include enough mathematics to warrant it being designated a specialist program-type. Estimates for the final-year students per program-type were calculated as the mean of the estimates from the two subsamples for Program-Type B.
1 2 3 4 5 6 7 8 9 10 11 12
A
b
Grade span for which teachers are prepared
0 1 2 3 4 5 6
Duration of program-type (years)
0 640 1,280 1,920 2,560 3,200
Estimated no. of final-year students per program-type
Key to program-type
A—Generalists, but with additional mathematics education
b—Generalists
3.3.4 Chinese Taipei 5
Taiwan is an example of a strong centralized policy-driven teacher education system
that is rigorous and competitive. Successful graduates enjoy very favorable conditions
and incentives, but many others are unable to find teaching jobs.
3.3.4.1 Institutions and governance
In 2007, 59 universities in Chinese Taipei were authorized to provide teacher education.
Of these, 48 universities were admitting future secondary teachers, and 23 universities
were accepting future primary teachers. The current system was developed after the
end of World War II and the Japanese colonial era. The Nationalist (KMT) government
at that time considered the quality of teachers important to political life, economic
development, and national defense, and therefore established advantageous conditions
and incentives for becoming a teacher, in an effort to attract talented people to this
occupation. Throughout this early period, the government exercised tight control over
which institutions could educate teachers and when to increase or decrease the number
5 This section is based on the national report written by F. Hsieh, P. Lin, G. Chao, and T. Wang.

67 NATIONAL IMPRINT Of EACH TEDS-M SYSTEM
of teacher education institutions, the number of teachers being educated, and the
deployment of novice teachers.
From the 1960s to the early 1990s, as the economy developed rapidly and then slumped,
this rigid control was relaxed. New ideas about a free society and free economy clashed
with the existing system. The government made changes to teacher recruitment,
training, and employment policies and practices. For example, the ministry no longer
took responsibility for assigning jobs to teachers. Instead, future teachers had to
compete for specific vacancies. In short, Chinese Taipei was taking steps toward what
the Organisation for Economic Co-operation and Development (OECD, 2005) has
called position-based as opposed to career-based teacher employment.
3.3.4.2 Program-types and credentials
There are two types of teacher in Chinese Taipei—primary school teachers in Grades
1 to 6 and secondary school teachers who teach either lower-secondary (Grades 7 to 9)
or upper-secondary (Grades 10 to 12) classes. Primary school teachers are generalists,
but most secondary school teachers teach within a single level (either junior or senior
high school) and a single subject. Hence, as illustrated in Exhibit 3.6, Chinese Taipei
has only two program-types with respect to TEDS-M, one for primary school teachers
and the other for secondary. In each one, future teachers take four years to complete
the Bachelor’s requirements, after which they complete the half-year practicum. Both
program-types are concurrent; Chinese Taipei has no consecutive program-types.
3.3.4.3 Curriculum content, assessment, and organization
Both program-types include three components. These are general curriculum
requirements for all university students from any field, a subject-matter curriculum,
the goal of which is to improve students’ understanding of the subject(s) that they will
teach, and a professional education curriculum. Universities may choose offerings from
a list established by the ministry. In addition, future teachers must complete a practicum
organized according to ministry guidelines.6
Once these requirements have been completed, future teachers have to take the Teacher
Qualification Assessment. This national test is the last step in quality control of preservice
teacher education. The assessment includes two general subjects and two professional
education subjects. The pass rates for 2007 and 2008 were just under 68% and 76% of
the future teacher cohorts, respectively.
6 These guidelines include or require policies relating to selection of practicum schools and internship supervisors, the qualifications of university supervisors (teaching staff only, no doctoral students), the qualifications of school supervisors (at least three years’ teaching experience), supervision methods, the number of future teachers assigned to each supervisor, the number of hours interns spend in school each week, intern rights and obligations, procedures for handling unsatisfactory performance, intern evaluation, and the provision of counseling literature, hotlines, and internet resources to interns.

THE TEACHER EDUCATION AND DEVELOPMENT STUDY IN MATHEMATICS (TEDS-M)68
3.3.5 Georgia7
Georgia has been undertaking educational reforms that are drastically changing policies
and practices inherited from the Soviet Union. Although the reforms are far from being
completely implemented, the implications for teacher education are profound.
3.3.5.1 Institutions and governance
Ten institutions of higher education currently offer teacher preparation in Georgia.
These are mostly state institutions but there are also some private ones. The 2004 Law
on Higher Education of Georgia mandated major changes in teacher education. Also,
for the first time, the State Commission on Educational Facilities set upper limits on
the number of teacher education students to be admitted to each university. Within
these upper limits, institutions determine the actual number of students admitted.
Institutions previously had complete autonomy in this respect.
3.3.5.2 Program-types and credentials
Candidates holding a Bachelor’s degree in pedagogy or any other subject can become
primary school teachers. They do not need any other certificate issued by the authorities.
However, teaching is becoming a more regulated profession. The qualification being
implemented for secondary school is a Master’s degree in teaching. This requirement
greatly increases the role of educational sciences in the preparation of secondary
teachers.
Even under the new law, a person holding a Bachelor’s remains eligible to teach Grades
1 to 6 and, until 2014, in secondary school. Once implemented, the new law will require
any person entering a teaching career to pass a teacher certification examination after
he or she has received a relevant degree and completed a one-year probationary period
in school.
Exhibit 3.6: Teacher education program-types in Chinese Taipei
Note: Eleven institutions in the target population were excluded because they were very small—fewer than 26 future primary teachers and fewer than five future lower-secondary mathematics teachers in the final year of their programs. The primary and secondary programs both take 4.5 years to complete. This period of time includes the four-year Bachelor’s degree and a six-month practicum.
1 2 3 4 5 6 7 8 9 10 11 12
A
b
Grade span for which teachers are prepared
0 1 2 3 4 5 6
Duration of program-type (years)
0 800 1,600 2,400 3,200 4,000
Estimated no. of final-year full-time students per program-type
Key to program-type
A—Secondary mathematics teacher education
b—Elementary teacher education
7 This section is based on the national report written by N. Mzhavanadze and T. Bokuchava.

69 NATIONAL IMPRINT Of EACH TEDS-M SYSTEM
Given this complex, changing situation, where preparation for teaching still takes
place in a wide range of departments, the TEDS-M sample for Georgia was defined
in terms of four program-types (Exhibit 3.7): a four-year Bachelor of Pedagogy for
future primary school teachers of Grades 1 to 4, and a Bachelor of Mathematics and two
Master’s degrees in teaching at the secondary school level. 8,
8 Out of 10 institutions, 9 offered four-year programs while one institution offered the same program-type as one five years in duration.
9 Chavchavadze State University, for example, decided to discontinue the period of practical training. Its instructors have compensated for this by using case studies, open lessons, and other practical experiences during the academic year.
Exhibit 3.7: Teacher education program-types in Georgia
Note: During the current transitional period of educational reform in Georgia, future teachers in the Bachelor of Mathematics program will be qualified to teach Grades 1–12. However, according to the national research coordinator for Georgia, these students are typically found in Grades 5–12 and therefore the TEDS-M classification of level needed to be secondary, not primary–secondary. The Master’s in Mathematics is a very small program that exists in only two institutions. It is listed twice in this figure because in one institution it is consecutive and in the other is concurrent. The Russian and Azeri sections of the targeted institutions have been excluded from this figure, but they accounted for only 1.4% and 1.7% of the TEDS-M primary and lower-secondary full-time student cohorts, respectively.
1 2 3 4 5 6 7 8 9 10 11 12
A
b
C
D
Grade span for which teachers are prepared
0 1 2 3 4 5 6
Duration of program-type (years)
0 160 320 480 640 800
Estimated no. of final-year full-time students per program -type
Key to program-type
A—Master’s in Mathematics Teaching, consecutive
b—Master’s in Mathematics Teaching, concurrent
C—bachelor’s in Mathematics
D—bachelor’s in Pedagogy
3.3.5.3 Curriculum content, assessment, and organization
Each institution establishes its own entrance standards and requirements. In general,
there are no specific content area requirements and no tests of prerequisite subject-
matter knowledge for entrance into teacher education institutions. Applicants must
have successfully completed a more general national examination. Institutions also
develop their curricula independently. Each unit within a university department of
education decides on the number and content of courses while, in principle, taking into
account the professional standard in mathematics, the national teacher standard, and
the student standard (created by the Ministry of Education and Science).
The traditional Bachelor’s degree in education in Georgia typically takes 36 months
to complete and includes two phases, an academic phase and a nine-month practical
training phase. However, the practical training phase has fallen into disuse.9
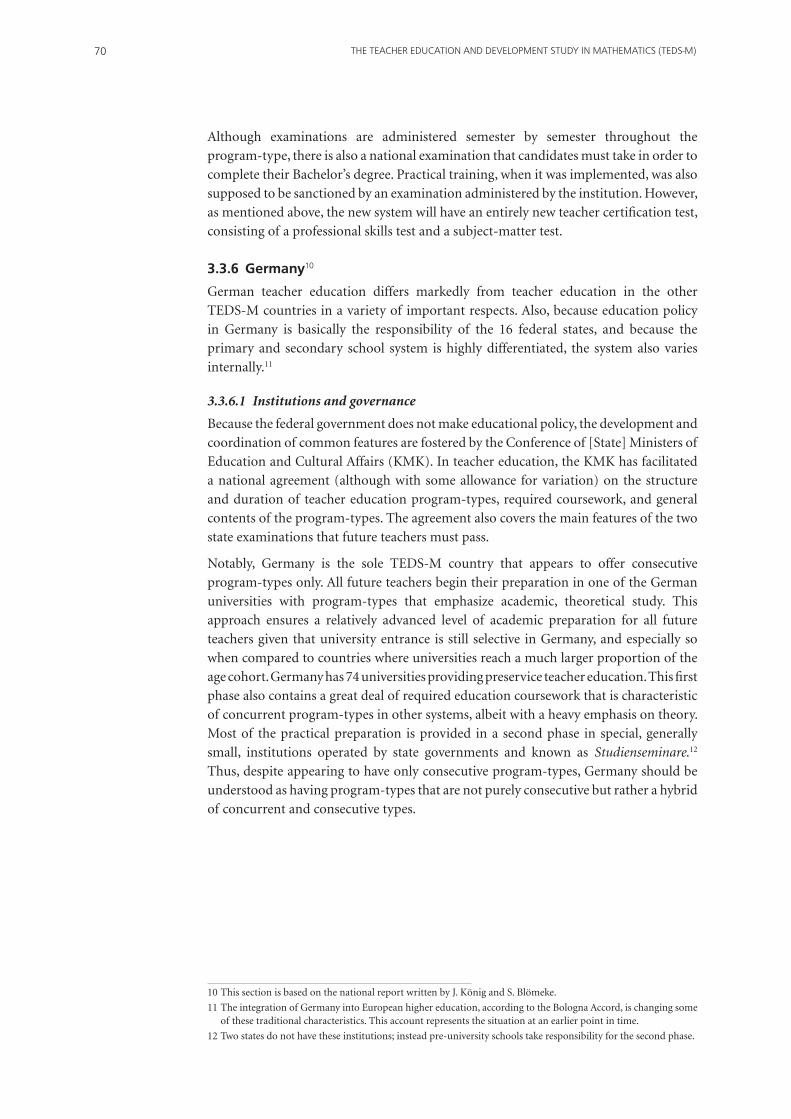
THE TEACHER EDUCATION AND DEVELOPMENT STUDY IN MATHEMATICS (TEDS-M)70
Although examinations are administered semester by semester throughout the
program-type, there is also a national examination that candidates must take in order to
complete their Bachelor’s degree. Practical training, when it was implemented, was also
supposed to be sanctioned by an examination administered by the institution. However,
as mentioned above, the new system will have an entirely new teacher certification test,
consisting of a professional skills test and a subject-matter test.
3.3.6 Germany10
German teacher education differs markedly from teacher education in the other
TEDS-M countries in a variety of important respects. Also, because education policy
in Germany is basically the responsibility of the 16 federal states, and because the
primary and secondary school system is highly differentiated, the system also varies
internally.11
3.3.6.1 Institutions and governance
Because the federal government does not make educational policy, the development and
coordination of common features are fostered by the Conference of [State] Ministers of
Education and Cultural Affairs (KMK). In teacher education, the KMK has facilitated
a national agreement (although with some allowance for variation) on the structure
and duration of teacher education program-types, required coursework, and general
contents of the program-types. The agreement also covers the main features of the two
state examinations that future teachers must pass.
Notably, Germany is the sole TEDS-M country that appears to offer consecutive
program-types only. All future teachers begin their preparation in one of the German
universities with program-types that emphasize academic, theoretical study. This
approach ensures a relatively advanced level of academic preparation for all future
teachers given that university entrance is still selective in Germany, and especially so
when compared to countries where universities reach a much larger proportion of the
age cohort. Germany has 74 universities providing preservice teacher education. This first
phase also contains a great deal of required education coursework that is characteristic
of concurrent program-types in other systems, albeit with a heavy emphasis on theory.
Most of the practical preparation is provided in a second phase in special, generally
small, institutions operated by state governments and known as Studienseminare.12
Thus, despite appearing to have only consecutive program-types, Germany should be
understood as having program-types that are not purely consecutive but rather a hybrid
of concurrent and consecutive types.
10 This section is based on the national report written by J. König and S. Blömeke.
11 The integration of Germany into European higher education, according to the Bologna Accord, is changing some of these traditional characteristics. This account represents the situation at an earlier point in time.
12 Two states do not have these institutions; instead pre-university schools take responsibility for the second phase.
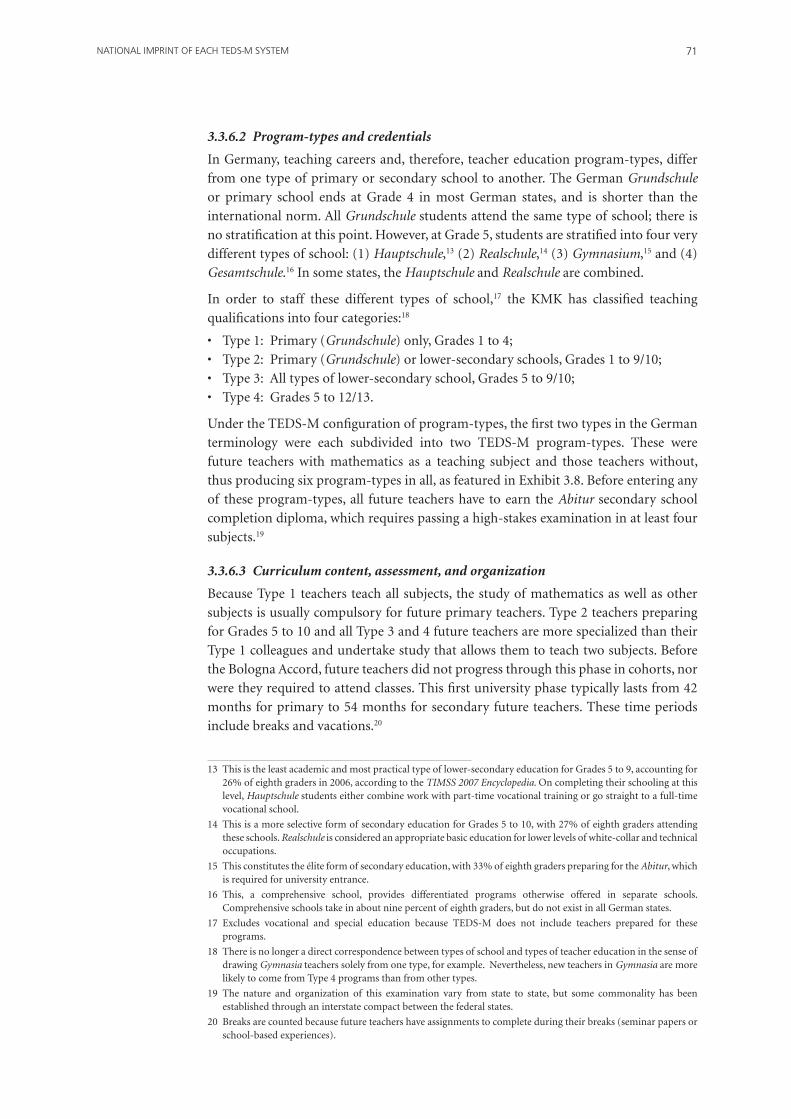
71 NATIONAL IMPRINT Of EACH TEDS-M SYSTEM
3.3.6.2 Program-types and credentials
In Germany, teaching careers and, therefore, teacher education program-types, differ
from one type of primary or secondary school to another. The German Grundschule
or primary school ends at Grade 4 in most German states, and is shorter than the
international norm. All Grundschule students attend the same type of school; there is
no stratification at this point. However, at Grade 5, students are stratified into four very
different types of school: (1) Hauptschule,13 (2) Realschule,14 (3) Gymnasium,15 and (4)
Gesamtschule.16 In some states, the Hauptschule and Realschule are combined.
In order to staff these different types of school,17 the KMK has classified teaching
qualifications into four categories:18
• Type1:Primary(Grundschule) only, Grades 1 to 4;
• Type2:Primary(Grundschule) or lower-secondary schools, Grades 1 to 9/10;
• Type3:Alltypesoflower-secondaryschool,Grades5to9/10;
• Type4:Grades5to12/13.
Under the TEDS-M configuration of program-types, the first two types in the German
terminology were each subdivided into two TEDS-M program-types. These were
future teachers with mathematics as a teaching subject and those teachers without,
thus producing six program-types in all, as featured in Exhibit 3.8. Before entering any
of these program-types, all future teachers have to earn the Abitur secondary school
completion diploma, which requires passing a high-stakes examination in at least four
subjects.19
3.3.6.3 Curriculum content, assessment, and organization
Because Type 1 teachers teach all subjects, the study of mathematics as well as other
subjects is usually compulsory for future primary teachers. Type 2 teachers preparing
for Grades 5 to 10 and all Type 3 and 4 future teachers are more specialized than their
Type 1 colleagues and undertake study that allows them to teach two subjects. Before
the Bologna Accord, future teachers did not progress through this phase in cohorts, nor
were they required to attend classes. This first university phase typically lasts from 42
months for primary to 54 months for secondary future teachers. These time periods
include breaks and vacations.20
13 This is the least academic and most practical type of lower-secondary education for Grades 5 to 9, accounting for 26% of eighth graders in 2006, according to the TIMSS 2007 Encyclopedia. On completing their schooling at this level, Hauptschule students either combine work with part-time vocational training or go straight to a full-time vocational school.
14 This is a more selective form of secondary education for Grades 5 to 10, with 27% of eighth graders attending these schools. Realschule is considered an appropriate basic education for lower levels of white-collar and technical occupations.
15 This constitutes the élite form of secondary education, with 33% of eighth graders preparing for the Abitur, which is required for university entrance.
16 This, a comprehensive school, provides differentiated programs otherwise offered in separate schools. Comprehensive schools take in about nine percent of eighth graders, but do not exist in all German states.
17 Excludes vocational and special education because TEDS-M does not include teachers prepared for these programs.
18 There is no longer a direct correspondence between types of school and types of teacher education in the sense of drawing Gymnasia teachers solely from one type, for example. Nevertheless, new teachers in Gymnasia are more likely to come from Type 4 programs than from other types.
19 The nature and organization of this examination vary from state to state, but some commonality has been established through an interstate compact between the federal states.
20 Breaks are counted because future teachers have assignments to complete during their breaks (seminar papers or school-based experiences).
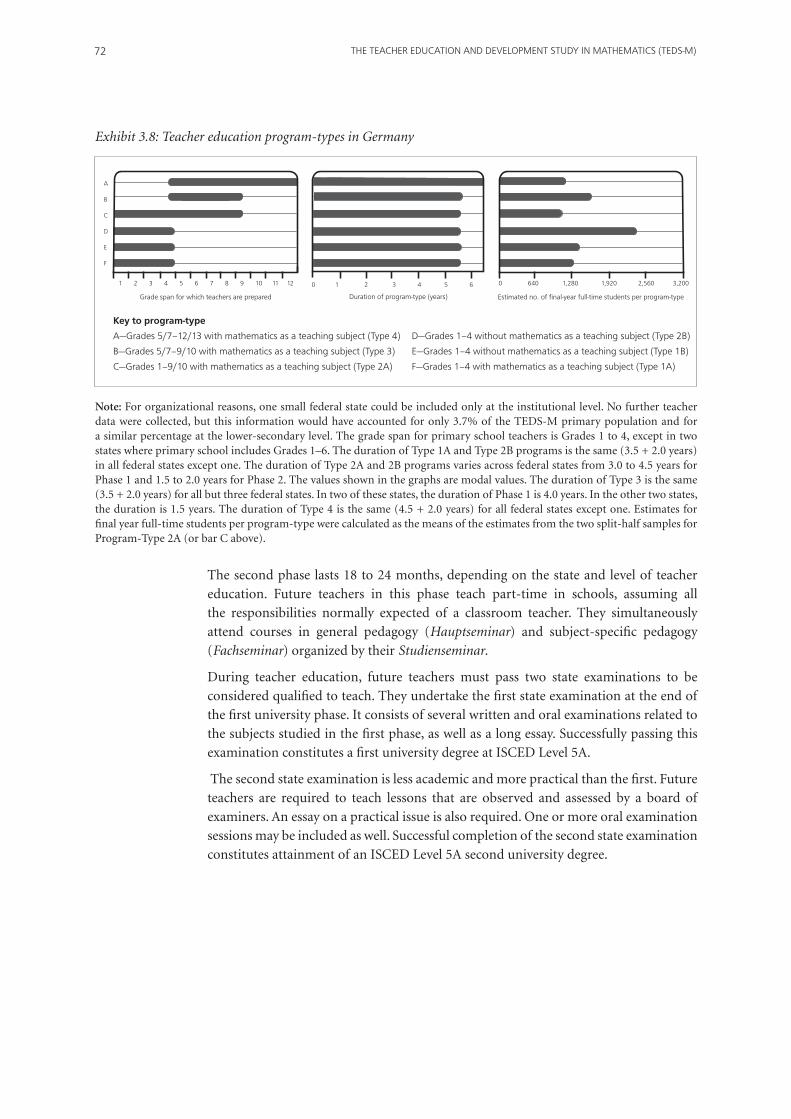
THE TEACHER EDUCATION AND DEVELOPMENT STUDY IN MATHEMATICS (TEDS-M)72
The second phase lasts 18 to 24 months, depending on the state and level of teacher
education. Future teachers in this phase teach part-time in schools, assuming all
the responsibilities normally expected of a classroom teacher. They simultaneously
attend courses in general pedagogy (Hauptseminar) and subject-specific pedagogy
(Fachseminar) organized by their Studienseminar.
During teacher education, future teachers must pass two state examinations to be
considered qualified to teach. They undertake the first state examination at the end of
the first university phase. It consists of several written and oral examinations related to
the subjects studied in the first phase, as well as a long essay. Successfully passing this
examination constitutes a first university degree at ISCED Level 5A.
The second state examination is less academic and more practical than the first. Future
teachers are required to teach lessons that are observed and assessed by a board of
examiners. An essay on a practical issue is also required. One or more oral examination
sessions may be included as well. Successful completion of the second state examination
constitutes attainment of an ISCED Level 5A second university degree.
Exhibit 3.8: Teacher education program-types in Germany
Note: For organizational reasons, one small federal state could be included only at the institutional level. No further teacher data were collected, but this information would have accounted for only 3.7% of the TEDS-M primary population and for a similar percentage at the lower-secondary level. The grade span for primary school teachers is Grades 1 to 4, except in two states where primary school includes Grades 1–6. The duration of Type 1A and Type 2B programs is the same (3.5 + 2.0 years) in all federal states except one. The duration of Type 2A and 2B programs varies across federal states from 3.0 to 4.5 years for Phase 1 and 1.5 to 2.0 years for Phase 2. The values shown in the graphs are modal values. The duration of Type 3 is the same (3.5 + 2.0 years) for all but three federal states. In two of these states, the duration of Phase 1 is 4.0 years. In the other two states, the duration is 1.5 years. The duration of Type 4 is the same (4.5 + 2.0 years) for all federal states except one. Estimates for final year full-time students per program-type were calculated as the means of the estimates from the two split-half samples for Program-Type 2A (or bar C above).
1 2 3 4 5 6 7 8 9 10 11 12
Grade span for which teachers are prepared
0 1 2 3 4 5 6
Duration of program-type (years) Estimated no. of final-year full-time students per program-type
Key to program-type
A—Grades 5/7–12/13 with mathematics as a teaching subject (Type 4)
b—Grades 5/7–9/10 with mathematics as a teaching subject (Type 3)
C—Grades 1–9/10 with mathematics as a teaching subject (Type 2A)
D—Grades 1–4 without mathematics as a teaching subject (Type 2b)
E—Grades 1–4 without mathematics as a teaching subject (Type 1b)
f—Grades 1–4 with mathematics as a teaching subject (Type 1A)
A
b
C
D
E
f
0 640 1,280 1,920 2,560 3,200

73 NATIONAL IMPRINT Of EACH TEDS-M SYSTEM
3.3.7 Malaysia21
In time, Malaysia wants all of its primary and secondary teachers to be university
graduates with degrees (i.e., “graduate teachers”) rather than teachers who have teacher
college diplomas only (i.e., “non-graduate teachers”). However, at the time of the
TEDS-M survey, the non-graduate Malaysian Teaching Diploma was by far the largest
of the program-types preparing primary school teachers (Exhibit 3.9).
3.3.7.1 Institutions and governance
Initial teacher education in Malaysia is conducted at two levels—public and private
universities, and teacher training institutes.22 While all public and private universities
produce graduate teachers, the teacher education institutes still award non-graduate
diplomas as well as Bachelor’s degrees. The Ministry of Education has set a target
of having, by 2015, all teachers in secondary schools and at least 50% of teachers in
primary schools with the status of graduate teachers.
3.3.7.2 Program-types and credentials
Future teachers of mathematics intending to teach in Malaysian primary and secondary
schools have at hand five different preservice program-types: three for primary Grades
1 to 6 and two for secondary Grades 7 to 13 (Exhibit 3.9). At the secondary level, the
universities offer two concurrent program-types, the Bachelor of Science (Education)
and the Bachelor of Arts (Education).23 At the primary level, the concurrent Diploma in
Education, for future teachers who already have a degree, and the Bachelor of Education
are both offered to prepare future primary teachers at the graduate level. The Malaysian
teaching diploma is offered to future primary teachers at the non-graduate level.
3.3.7.3 Curriculum content, assessment, and organization
The Teacher Education Division of the Ministry of Education, with approval from the
ministry’s Central Curriculum Committee and the Malaysian Qualification Agency
(which has been responsible for accrediting all higher education offerings since 2007),
sets the curriculum requirements for teacher education institutes (i.e., the former
teacher colleges). The Teacher Education Division also sets requirements for ongoing
implementation of the goals of two important documents—the National Philosophy of
Education (formulated in 1988)24 and the Philosophy of Teacher Education (formulated
in 1982).25 The focus in these documents is on national unity, national culture, science
and technology, and individual development.
21 This section is based on the national report written by R. Nagappan, N. Ratnavadivel, O. Lebar, I. Kailani, and S. Malakolunthu.
22 The teacher education institutes are former teacher education colleges, which used to prepare teachers for primary and lower-secondary schools, credentialing them with certificates and later diplomas, but are now empowered to award Bachelor’s degrees to their graduates.
23 A Post-Graduate Diploma in Education (PGDE) is also offered, but it was not included in TEDS-M because of a lack of students working toward this qualification.
24 See http://unesdoc.unesco.org/images/0019/001931/193184e.pdf
25 See http://aadcice.hiroshima-u.ac.jp/e/publications/sosho4_2-08.pdf
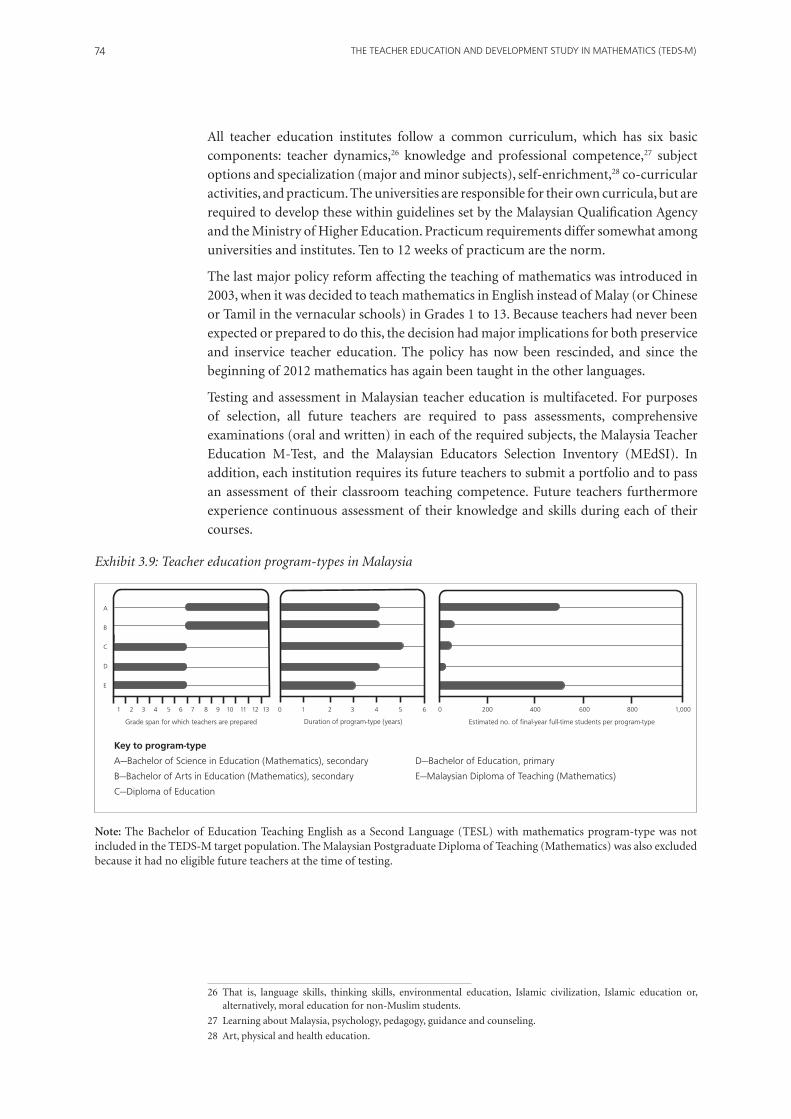
THE TEACHER EDUCATION AND DEVELOPMENT STUDY IN MATHEMATICS (TEDS-M)74
All teacher education institutes follow a common curriculum, which has six basic
components: teacher dynamics,26 knowledge and professional competence,27 subject
options and specialization (major and minor subjects), self-enrichment,28 co-curricular
activities, and practicum. The universities are responsible for their own curricula, but are
required to develop these within guidelines set by the Malaysian Qualification Agency
and the Ministry of Higher Education. Practicum requirements differ somewhat among
universities and institutes. Ten to 12 weeks of practicum are the norm.
The last major policy reform affecting the teaching of mathematics was introduced in
2003, when it was decided to teach mathematics in English instead of Malay (or Chinese
or Tamil in the vernacular schools) in Grades 1 to 13. Because teachers had never been
expected or prepared to do this, the decision had major implications for both preservice
and inservice teacher education. The policy has now been rescinded, and since the
beginning of 2012 mathematics has again been taught in the other languages.
Testing and assessment in Malaysian teacher education is multifaceted. For purposes
of selection, all future teachers are required to pass assessments, comprehensive
examinations (oral and written) in each of the required subjects, the Malaysia Teacher
Education M-Test, and the Malaysian Educators Selection Inventory (MEdSI). In
addition, each institution requires its future teachers to submit a portfolio and to pass
an assessment of their classroom teaching competence. Future teachers furthermore
experience continuous assessment of their knowledge and skills during each of their
courses.
26 That is, language skills, thinking skills, environmental education, Islamic civilization, Islamic education or, alternatively, moral education for non-Muslim students.
27 Learning about Malaysia, psychology, pedagogy, guidance and counseling.
28 Art, physical and health education.
Exhibit 3.9: Teacher education program-types in Malaysia
Note: The Bachelor of Education Teaching English as a Second Language (TESL) with mathematics program-type was not included in the TEDS-M target population. The Malaysian Postgraduate Diploma of Teaching (Mathematics) was also excluded because it had no eligible future teachers at the time of testing.
1 2 3 4 5 6 7 8 9 10 11 12 13
Grade span for which teachers are prepared
0 1 2 3 4 5 6
Duration of program-type (years)
0 200 400 600 800 1,000
Estimated no. of final-year full-time students per program-type
Key to program-type
A—bachelor of Science in Education (Mathematics), secondary
b—bachelor of Arts in Education (Mathematics), secondary
C—Diploma of Education
D—bachelor of Education, primary
E—Malaysian Diploma of Teaching (Mathematics)
A
b
C
D
E

75 NATIONAL IMPRINT Of EACH TEDS-M SYSTEM
3.3.8 Norway29
Norway has a national framework (rammeplan) for teacher education, which all
institutions follow. However, each institution has a great deal of autonomy with regard
to organizing the content and the structure of the subjects taught, although there is less
autonomy than before.
3.3.8.1 Institutions and governance
Norway has seven universities and 27 university colleges. Two universities and 17
university colleges (lærerhøgskoler) offer the general teacher education program-
type (allmennlærer-utdanning or ALU), designed to prepare future teachers to teach
mathematics (as well as other subjects) in both primary and lower-secondary schools.
All seven universities provide preparation for lower- and upper-secondary school
teachers.
3.3.8.2 Program-types and credentials
Norway has four major program-types for teacher education (Exhibit 3.10). The
ALU program-type for primary and lower-secondary school teachers is concurrent; it
provides future teachers with four years of general subject knowledge, pedagogy, and
subject didactics. Teaching practice is included every year.30
All ALU students choose optional subjects during their third and fourth years, providing
students with opportunity to obtain more depth in one of the subjects. Some students
choose mathematics. In TEDS-M, these students were considered a population of
their own and were tested two years later than the ALU future teachers who had not
yet reached the year when they could opt (or not) to choose mathematics. These two
program-types have an extended grade range (1 to 10), which coincides with the
compulsory school system in Norway and includes the lower-secondary school phase
of basic education.
The third program-type is a concurrent five-year Master’s degree offered by the
universities. The fourth program-type is consecutive. It provides future teachers with a
subject-specific education (adjunkt or lektor) that prepares them for work in lower- and
upper-secondary schools (Grades 8 to 13). The final year (PPU) contains pedagogy,
subject-matter didactics, and teaching practice. The last two program-types normally
provide qualification in two teaching subjects. However, as Exhibit 3.10 shows, these
two program-types prepare very few future teachers when compared to the ALU.
29 This section is based on the national report written by T. Breiteig.
30 Note that the numbers do not correspond to the number of institutions in the TEDS-M database. This is because, unlike in other TEDS-M countries, if the same institution in Norway offered more than one program-type, it was counted for TEDS-M purposes as more than one institution.

THE TEACHER EDUCATION AND DEVELOPMENT STUDY IN MATHEMATICS (TEDS-M)76
Because Norwegian institutions enjoy a high level of autonomy, they are responsible for
the quality of what they offer. The links between internal and external quality assurance
are maintained through the Norwegian Agency for Quality Assurance in Education
(NOKUT). However, there is no requirement to test or check particular skills or
knowledge at the end of the teacher education program-types.
The 2003 national curriculum framework addresses the competencies teachers should
acquire; they do not specify subject-matter content. The institutions themselves are
responsible for designing the content that enables future teachers to acquire the
competencies. They are also responsible for demonstrating compliance with the
frameworks. Nevertheless, universities typically resemble one another in terms of
teacher education by offering an ordinary academic degree followed by “practical
pedagogical education” (PPU). In university colleges, teacher education takes four
years. Compulsory subjects such as pedagogical theory, mathematics, Norwegian, and
religion account for half of the program-type. These required courses include subject-
matter didactics. The rest are elective courses. Guided practice takes place during the 20
to 22 weeks of the program-type.
Exhibit 3.10: Teacher education program-types in Norway
Note: The most common PPU program-type is one in which future teachers first complete a Bachelor’s degree in mathematics and another subject (three years) and then continue on with the PPU course (one year). However, students can elect to complete a Master’s degree (five years) before taking the PPU course (one year). The Master’s and PPU program-types formally qualify graduates for Grades 5–13, but almost all graduates end up teaching Grades 8–13. Future teachers in the ALU without extra mathematics were tested at the end of the second year of the program whereas the full-time students in the ALU without mathematics were tested at the end of the fourth and final year of the program. Thus, these two program-types overlap because those students in the ALU without extra mathematics in Year 2 can choose ALU with mathematics in Years 3 or 4. Estimates for final-year full-time students per program-type were calculated as the mean of the estimates from the two split-half samples for Program Types C and D.
1 2 3 4 5 6 7 8 9 10 11 12 13
A
b
C
D
Grade span for which teachers are prepared
0 1 2 3 4 5 6
Duration of program-type (years)
0 320 640 960 1,200 1,600
Estimated no. of final-year full-time students per program-type
Key to program-type
A—Teacher Education Program (PPU)
b—Master’s degree
C—General teacher education (ALU+) with mathematics option
D—General teacher education (ALU) without mathematics option

77 NATIONAL IMPRINT Of EACH TEDS-M SYSTEM
3.3.9 Oman31
A small number of institutions with evolving roles are responsible for teacher
education in Oman. All graduates of program-types that fit the TEDS-M population
have Bachelor’s degrees, but the program-type offered by colleges outside the university
differs in certain respects from that offered at the university (e.g., language of instruction
and practicum requirements).
3.3.9.1 Institutions and governance
Oman currently has no initial teacher education provision for Grades 1 to 4. The reason
is insufficient demand for new teachers at this level. TEDS-M, therefore, encompassed
Grades 5 to 12 only. Recently, Oman’s six colleges of education were converted to
more comprehensive applied colleges of science. Five of them no longer offer teacher
education, but at the time of the TEDS-M data collection, all six still had teacher
education students in their final year and therefore participated as part of the target
population. Teacher education is currently offered at only a few institutions—Sultan
Qaboos University, one college for females under the Ministry of Higher Education,
and three private universities.32
3.3.9.2 Program-types and credentials
In Oman, all secondary teachers of mathematics prepare for just one teaching subject,
although they are actually required to study other subjects as well. Oman has three
major program-types for preparing these mathematics teachers. One is a concurrent
program-type at a college of education, leading to a Bachelor of Education (Exhibit
3.11). The second program-type also leads to a Bachelor of Education, but it is offered
at Sultan Qaboos University, and the third is a consecutive program-type, consisting of
a Bachelor of Science in Mathematics followed by a professional education diploma.
The Bachelor of Education that the university offers takes an average of five years to
complete. In part, this is because most of the mathematics students have to spend one
or two semesters studying English, given that English is the language of instruction for
most of their courses. In the college of education, the Bachelor of Education takes four
years to complete because there is less of an emphasis on English. Arabic is the language
of instruction.
The Bachelor of Science in Mathematics program-type includes the normal two
phases of a consecutive course of study. During the first phase, students are enrolled
in the College of Science for five years, after which they receive a Bachelor’s degree
in mathematics. During the second phase, students enroll in the university’s college
of education for one additional year and then receive the Professional Educational
Diploma in Mathematics. All these graduates are qualified to teach Grades 5 to 12.
31 This section is based on the national report written by M. Al Ghafri, A. Al Abri, and M. Al Shidhani.
32 The private universities had so few graduates in teacher education that they were not included in TEDS-M.
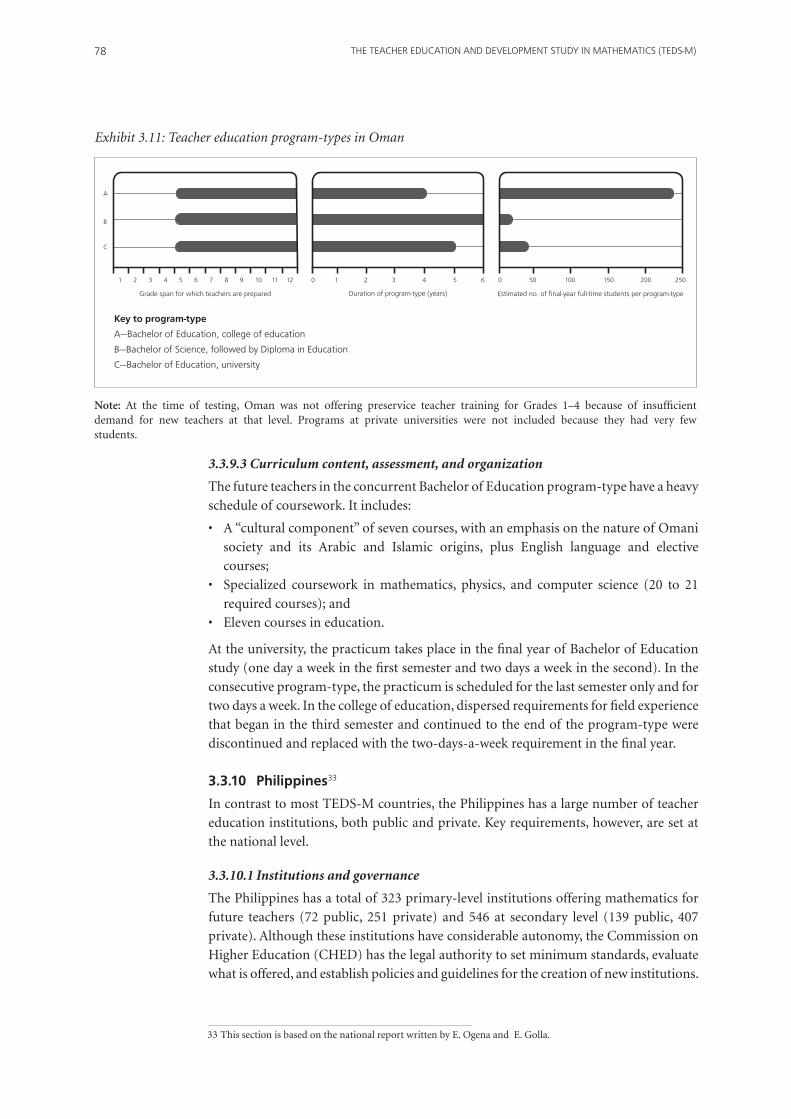
THE TEACHER EDUCATION AND DEVELOPMENT STUDY IN MATHEMATICS (TEDS-M)78
3.3.9.3 Curriculum content, assessment, and organization
The future teachers in the concurrent Bachelor of Education program-type have a heavy
schedule of coursework. It includes:
• A“culturalcomponent”ofsevencourses,withanemphasisonthenatureofOmani
society and its Arabic and Islamic origins, plus English language and elective
courses;
• Specialized coursework in mathematics, physics, and computer science (20 to 21
required courses); and
• Elevencoursesineducation.
At the university, the practicum takes place in the final year of Bachelor of Education
study (one day a week in the first semester and two days a week in the second). In the
consecutive program-type, the practicum is scheduled for the last semester only and for
two days a week. In the college of education, dispersed requirements for field experience
that began in the third semester and continued to the end of the program-type were
discontinued and replaced with the two-days-a-week requirement in the final year.
3.3.10 Philippines33
In contrast to most TEDS-M countries, the Philippines has a large number of teacher
education institutions, both public and private. Key requirements, however, are set at
the national level.
3.3.10.1 Institutions and governance
The Philippines has a total of 323 primary-level institutions offering mathematics for
future teachers (72 public, 251 private) and 546 at secondary level (139 public, 407
private). Although these institutions have considerable autonomy, the Commission on
Higher Education (CHED) has the legal authority to set minimum standards, evaluate
what is offered, and establish policies and guidelines for the creation of new institutions.
Exhibit 3.11: Teacher education program-types in Oman
Note: At the time of testing, Oman was not offering preservice teacher training for Grades 1–4 because of insufficient demand for new teachers at that level. Programs at private universities were not included because they had very few students.
1 2 3 4 5 6 7 8 9 10 11 12
A
b
C
Grade span for which teachers are prepared
0 1 2 3 4 5 6
Duration of program-type (years)
0 50 100 150 200 250
Estimated no. of final-year full-time students per program-type
Key to program-type
A—bachelor of Education, college of education
b—bachelor of Science, followed by Diploma in Education
C—bachelor of Education, university
33 This section is based on the national report written by E. Ogena and E. Golla.

79 NATIONAL IMPRINT Of EACH TEDS-M SYSTEM
The Technical Panel for Teacher Education reviews teacher education curricula as well
as the overall capabilities of teacher education institutions.
3.3.10.2 Program-types and credentials
As Exhibit 3.12 shows, the Philippines has a very simple structure of one primary
program-type (Bachelor of Elementary Education) for Grades 1 to 6 and one secondary
program-type (Bachelor of Secondary Education) for Grades 7 to 10, both of which
take four years to complete and are concurrent. The Bachelor of Secondary Education
requires candidates to take a major subject, and sometimes a minor specialization; a few
institutions require two major specializations.
Because secondary school in the Philippines ends at Grade 10, students are eligible for
vocational training or university. Future teachers, therefore, go into teacher training
after Grade 10, but they continue with basic general education courses in their first year,
before beginning to specialize.
Exhibit 3.12: Teacher education program-types in the Philippines
Note: Sixty-one institutions in the target population were excluded because they were very small (fewer than five primary future teachers and fewer than three lower-secondary teachers).
1 2 3 4 5 6 7 8 9 10 11 12
A
b
Grade span for which teachers are prepared
0 1 2 3 4 5 6
Duration of program-type (years)
0 640 1,280 1,920 2,560 3,200
Estimated no. of final-year full-time students per program-type
Key to program-type
A—bachelor in Secondary Education
b—bachelor in Elementary Education
3.3.10.3 Curriculum content, assessment, and organization
In 2004, a CHED directive required implementation of a new curriculum in 2005/2006.34
This includes a 6- to 12-week student teaching requirement. Student teaching includes
both on- and off-campus components. Although there are guidelines for assessing this
practicum component, much of the assessment is ad hoc, according to the authors of
the country report.
All primary and secondary teaching candidates are required to take the Licensure
Examination for Teachers (LET). The LET includes three main tests—professional
education, general education, and the field of specialization—and is weighted 40%,
20%, and 40%, respectively. The syllabus is publicized and made known to teacher
education institutions.
34 The earlier curriculum, at the beginning of the 1990s, was thought to be too heavy in general education courses, without enough specialized coursework or enough field experience. More subject-matter content was added to the program-types in the subsequent reform. The new curriculum also emphasizes curriculum development, lesson planning, instructional materials development, assessment, and innovative teaching, and gives greater emphasis than previously to experience in the field and in classrooms.

THE TEACHER EDUCATION AND DEVELOPMENT STUDY IN MATHEMATICS (TEDS-M)80
3.3.11 Poland35
In Poland, specialists teach mathematics from Grade 4 on. Poland thus differs from the
norm in other TEDS-M countries with respect to the knowledge expected of teachers
who staff most of the basic education grades.
3.3.11.1 Institutions and governance
Higher education plays a major role in teacher education in Poland. Although teacher
training colleges, which are not considered to be a part of higher education, also
offer teacher education, they produce only a small number of teachers. Students in
teacher training colleges follow a curriculum that is very similar to the curriculum of
Bachelor-degree studies. Their graduates are awarded a diploma (dyplom ukonczenia
kolegium nauczycielskiego). Recent reforms have raised the qualification levels required
for entry into teaching, but there is no licensing; qualifications are defined solely in
terms of required higher education degrees. Teacher education operates within the
general legal and institutional framework of higher education. Special regulations of
the sort developed for all fields of study set out the requirements for the curriculum and
practicum of teacher education.
3.3.11.2 Program-types and credentials
The organization of primary and secondary education changed in 1999. Primary
schools in Poland now offer six years of general education, with a further three years
in lower-secondary schools. Primary school has two stages: a stage of integrated
learning in Grades 1 to 3 and a stage of specialist subject teaching in Grades 4 to 6.
Future teachers wanting to teach mathematics in Grade 4 must complete a higher
education degree in mathematics, which also includes required teacher education
content.36 Graduates in mathematics education from the teacher education colleges can
teach only in Grades 4 to 6 of the primary schools and in basic vocational schools. In
contrast, there is no distinction in Grades 1 to 3 between school subjects; teachers must
be qualified in “integrated teaching”—a qualification acquired through pedagogical-
study program-types at Bachelor’s and Master’s levels in universities or at diploma
level in teacher education colleges. The pedagogical-study program-types include very
little opportunity to learn mathematics, but provide substantial academic knowledge in
general pedagogy.
A two-cycle structure has been introduced as part of Poland’s implementation of the
Bologna Accord—a three-year Bachelor of Arts (second and fourth bars in Exhibit 3.13)
and a two-year Master of Arts. The first-cycle (Bachelor’s) degree in mathematics qualifies
graduates to teach in primary and lower-secondary schools, while the second-cycle
(Master’s) degree in mathematics qualifies graduates to also teach in upper-secondary
schools. The pedagogy degrees usually qualify teachers to teach in kindergartens and
Grades 1 to 3. The old five-year Master’s has been phased out (first and third bars in
Exhibit 3.13). While this program-type is no longer offered, it was included in TEDS-M
because students were still completing their final year of study in 2008. Graduates of
the first cycle (Bachelor’s) programs may enroll in second-cycle (Master’s) programs.
For this reason, second-cycle program-types were not included in the TEDS-M study
because they are offered mostly to persons already qualified to teach.
35 This section is based on the national report written by M. Sitek.
36 Majoring in a degree with substantial mathematics content can also be considered satisfactory. This determination is made by the school principal, who is responsible for teacher employment.

81 NATIONAL IMPRINT Of EACH TEDS-M SYSTEM
In the first-cycle Bachelor’s program-type, future teachers prepare to teach two subjects.
The more advanced degree prepares them for even more specialization in just one subject
(although they still may also teach two). Exhibit 3.13 shows that the top two program-
types (or bars) preparing future teachers for Grades 4 to 12 and 4 to 9, respectively, are
relatively small program-types, compared to those represented by the third and fourth
bars in the exhibit, which focus on Grades 1 to 3. This pattern reflects the popularity of
pedagogy program-types for Grades 1 to 3, which are less selective and less demanding
than the mathematics program-types.
Administrative and survey data show that most of the teachers in Poland hold Master’s
degrees. A survey of specialist mathematics teachers in primary and lower-secondary
schools indicates that 95 and 97%, respectively, hold Master’s degrees. However, many
teachers of mathematics were majoring in other fields of study. As many as 31% of the
primary school mathematics teachers and 25% of the lower-secondary mathematics
teachers had qualified in this subject through post-graduate study. A large majority
of them had previously taught other school subjects, mainly physics or other science
subjects.
Exhibit 3.13: Teacher education program-types in Poland
Note: Postgraduate programs and institutions with consecutive programs only were not covered (9 out of 105 institutions, making for 23.6% of the TEDS-M future primary teacher population and 29% of the lower-secondary population). Programs in teacher training colleges are not separated out from Bachelor of Arts programs in universities in the program-types because their programs are so similar and the proportion of future teachers in them is very small. Earlier in the study, a distinction was made between full-time and part-time program-types. However, in this exhibit, the full-time and part-time programs have been combined, again because the differences are not great enough to constitute separate program-types. In addition, the second cycle program-type (Master’s), which was originally considered part of the target population, was ruled out of scope because most of its students had already become eligible to teach after completing the first cycle (Bachelor’s). Estimates for final-year full-time students per program-type were calculated as the mean of the estimates from the split-half samples for Program-Types A and B.
1 2 3 4 5 6 7 8 9 10 11 12
A
b
C
D
Grade span for which teachers are prepared
0 1 2 3 4 5 6
Duration of program-type (years)
0 800 1,600 2,400 3,200 4,000
Estimated no. of final-year students per program-type
Key to program-type
A—Master’s in Mathematics, long cycle
b—bachelor’s in Mathematics, first cycle
C—Pedagogy, integrated teaching, long cycle Master’s
D—Pedagogy, integrated teaching, first cycle bachelor’s

THE TEACHER EDUCATION AND DEVELOPMENT STUDY IN MATHEMATICS (TEDS-M)82
3.3.11.3 Curriculum content, assessment, and organization
Teacher education is offered as a specialization within other higher education program-
types, which means that a major part of the future teachers’ curriculum is the same as
other tracks within the mathematics field of study (or pedagogy, in the case of future
teachers for Grades 1 to 3). In addition to meeting the standards set for all graduates
in mathematics, students in the teacher education track must complete required
coursework in pedagogy, psychology, didactics, and practicum, as defined in a decree
put out by the Minister of Education. According to the TEDS-M national center in
Poland, teacher education suffers from the “academic drift” of higher education (Fulton,
Santiago, Edquist, El-Khawas, & Hackl, 2007). There is a greater emphasis on academic
subject-matter content than on knowledge of teaching practices and related knowledge
of the schools in which future teachers are likely to teach.
3.3.12 The Russian Federation37
The Russian Federation is transitioning from the system of teacher education that
existed in the Soviet Union to a double-level system that complies with the principles
of the Bologna Accord, which are being applied in many European countries. Thus,
in similar vein to the situation in Poland, the old program-type of unified five-year
teacher preparation, in which all of the TEDS-M sample were enrolled, has been largely
replaced by a Bachelor’s degree followed by a Master’s degree. At the same time, most
of the former pedagogical universities have become faculties of education situated in
more conventional university settings.
3.3.12.1 Institutions and governance
In Russia, public universities, established at national, regional, or municipal levels, are
responsible for qualifying teachers of mathematics. There are no private institutions
preparing mathematics teachers in the federation. Changes made in response to the
Bologna Accord have been rapid. When the TEDS sampling frame was prepared in
2006, 162 higher education institutions were preparing teachers for work in primary
schools and 120 were preparing teachers of mathematics for work in basic and
secondary schools. Among them were 111 pedagogical universities or institutes and 54
state universities. However, by 2009, the number of pedagogical universities preparing
mathematics teachers had dropped sharply—to 62. By that time, many universities had
started offering the new Bachelor’s plus Master’s program-type, but others were still
offering the traditional five-year program-type surveyed in TEDS-M. Some universities
at the time were offering both the old and the new program-types.
3.3.12.2 Program-types and credentials
At the time of the TEDS-M data collection, students in the new Bachelor/Master’s
program-type, established in 2005, had not reached their final year of study and
therefore did not belong in the TEDS-M target population. The population also did
not include students in the pedagogical colleges whose programs were due to be phased
out. These colleges offered either four years of teacher education at secondary school
level (starting at Grade 10) or three years starting immediately after secondary school
(Grade 11). The number of colleges and future teachers in these college program-types
at the time of data collection was unknown (the number of remaining colleges was
estimated to be about 80).
37 This section was written with the assistance of G. Kovaleva.

83 NATIONAL IMPRINT Of EACH TEDS-M SYSTEM
According to the Russian Federation TEDS-M national research coordinator, many
of the graduates of these colleges have continued on to the pedagogical universities,
starting at these institutions in their second or third year of study. Also, at the time of
data collection, an estimated five percent of newly qualified teachers were people who
had a first university degree but had not studied education in any form. After a special
short course, they received their qualification to teach. The TEDS-M target population,
however, was defined only in terms of two program-types, both five years in duration:
one for primary schools, Grades 1 to 4, and the other for secondary schools, Grades
5 to 11 (see Exhibit 3.14). Today, the universities educate both future primary school
and future secondary school teachers. However, one department is responsible for the
primary teachers and a different department for the secondary.
3.3.12.3 Curriculum content, assessment, and organization
The new Bachelor’s plus Master’s and the old TEDS-M program-type are still based
on the model developed during the Soviet era. Although the national government has
a set of state standards for teacher education, each institution can select from these
standards to tailor the curriculum to its own requirements and emphases, which are
mediated by such factors as subject-matter specializations, research capability, and
regional traditions. However, the Ministry of Education and Science must approve this
choice.
The mathematics content in the state standards for teacher education is very similar
to mathematics standards for other mathematics-focused professions. For example,
the standards for the mathematics department of the pedagogical universities, at the
Bachelor’s degree level, include a two-year course in classical mathematical analysis
(calculus) and its applications, a five-term course in algebra and geometry, a course
in probability theory, and electives in mathematics. Special attention is paid to
elementary mathematics courses during the first and seventh terms of study. There
are also demanding requirements throughout the program-type for computer literacy,
computer architecture, computer programming, informatics, mathematical modeling,
and multimedia.
Exhibit 3.14: Teacher-education program-types in the Russian Federation
Note: Coverage of the TEDS-M target population did not include pedagogical colleges, the programs of which were about to be phased out. Nor did the population include the new Bachelor’s/Master’s program-types because their students had not reached their final year. Another estimated five percent of the target population that was not covered consisted of the university graduates who became qualified to teach after a special short training course.
1 2 3 4 5 6 7 8 9 10 11 12
Grade span for which teachers are prepared
0 1 2 3 4 5 6
Duration of program-type (years)
0 1,600 3,200 4,800 6,400 8,000 9,600
Estimated no. of final-year full-time students per program type
Key to program-type
A—Teacher of mathematics
b—Primary teacher education
A
b
THE TEACHER EDUCATION AND DEVELOPMENT STUDY IN MATHEMATICS (TEDS-M)84
In addition, during their first two years of this program-type, students experience three
terms of pedagogy and psychology. They study didactics and mathematics pedagogy
during their second and third years and teaching methods specific to lower- and upper-
secondary school in their third and fourth years. One month of teaching practice is
scheduled in both the third and fourth years.
Under the new Master’s degree program, offered during the fifth and sixth years of
study, students generally have three days of instruction at the university and two to
three days of practical experience at school each week. This same mixed format was
used during the last academic year of the former five-year program-type. At the end of
both the old and new program-types, future teachers must pass two state examinations
and defend a thesis.
3.3.13 Singapore38
The city-state of Singapore has only one teacher education institution, the National
Institute of Education (NIE), which is an autonomous institute of Nanyang Technological
University. As a result, the institution has maintained a high degree of control over
teacher training and certification in the nation. Teachers are recruited by the Ministry
of Education and sent to NIE for training. NIE offers a number of different program-
types.
3.3.13.1 Institutions and governance
Graduating from NIE automatically qualifies candidates recruited by the Ministry of
Education to teach in Singapore’s public schools. The permanent secretary of Singapore’s
Ministry of Education chairs the NIE’s governing council. In general, NIE works very
closely with the ministry.
3.3.13.2 Program-types and credentials
Although only one institution offers teacher education in Singapore, the structure of
the program-types provided is complex (see Exhibit 3.14). Teacher education aligns
with the grade split between primary and secondary education: primary education in
Singapore includes Grades 1 to 6; secondary includes Grades 7 to 10. Post-secondary
education includes Grades 11 and 12. Most future teachers go into teacher training after
Grade 12 (A-level), but some acquire a polytechnic diploma, generally entering this
course of study after completing Grade 10.
Teachers are trained in four concurrent and four consecutive program-types. The
concurrent program-types include two variants of a general diploma program-
type (two years) as well as a Bachelor of Arts (Education) or a Bachelor of Science
(Education) degree (four years). The diploma program-type is the only concurrent
TEDS-M program-type requiring fewer than three years in an institution of higher
education. The primary diploma has A and C options. Students studying under the A
option are trained to teach two subjects, while those studying under the C option are
trained to teach three subjects.39
38 This section is based on the national report written by K. Y. Wong, S. K. Lim-Teo, N. H. Lee, K. L. Boey, C. Koh, J. Dindyal, K. M. Teo, and L. P. Cheng.
39 The diploma program-type is not officially recognized as being a university-level course, even though it takes place within a university. In particular, these future teachers do not complete university-level mathematics. However, those future teachers who receive the non-degree diploma are considered officially qualified to teach, even though other future teachers who obtain a university degree have a higher level of academic achievement.

85 NATIONAL IMPRINT Of EACH TEDS-M SYSTEM
Students completing the consecutive program-types receive a postgraduate diploma in
education (PGDE), one form of which qualifies graduates to teach in primary schools
and the other in secondary schools. The diplomas cater to future teachers who have
already gained a degree and then enroll in NIE for this one-year second phase of the
program-type. The top four bars in the middle chart in Exhibit 3.15 refer to the diplomas
but include the four years of degree study plus one year of teacher education training,
giving a typical duration of five years for this program-type.
Within the school system, about 75% of the teaching-force are graduates and the
remaining 25% are non-graduates. The program-type enrollments in Exhibit 3.15
are based on the numbers of future teachers who took part in the TEDS-M survey in
November 2007 and May 2008. The numbers enrolled in the various program-types in
Singapore tend to change considerably from one year to the next.
Exhibit 3.15: Teacher education program-types in Singapore
Note: There is only one institution of teacher education in Singapore. All eight program-types co-exist in the same institution.
Key to program-type
A—Postgraduate Diploma in Education, secondary
b—Postgraduate Diploma in Education, lower secondary
C—Postgraduate Diploma in Education, primary Option C
D—Postgraduate Diploma in Education, primary Option A
E—bachelor of Science in Education, primary
f—bachelor of Arts in Education, primary
G—Diploma of Education, primary, Option C
H—Diploma of Education, primary, Option A
1 2 3 4 5 6 7 8 9 10 11 12
A
b
C
D
E
f
G
H
Grade span for which teachers are prepared Duration of program-type (years)
0 1 2 3 4 5 6
Estimated no. of final-year students per program-type
0 60 120 180 240 300
3.3.13.3 Curriculum content, assessment, and organization
All teacher education candidates are required to complete core courses in education
studies, subject knowledge (primary only), curriculum studies, academic studies
(degree only), practicum, and what are termed language enhancement and academic
discourse skills (LEADS). LEADS courses are unique to Singapore. They focus on
developing the skills required to use English for communication, in general, and
academic and professional purposes, in particular. Emphasis on the practicum varies
by program-type: diploma, 23% of total preservice education; Bachelor’s degree, 16%;
and postgraduate diploma, 25%.

THE TEACHER EDUCATION AND DEVELOPMENT STUDY IN MATHEMATICS (TEDS-M)86
3.3.14 Spain40
In Spain, state-issued guidelines direct much of the teacher education curriculum of
all universities. This situation has been in force since the creation of Spain’s education
system in the 19th century. Multiple laws and royal decrees continue to define and
develop the complex framework of this system.
13.3.14.1 Institutions and governance
Teachers in public schools in Spain are civil servants. To prepare these teachers, as well
as teachers in private schools, Spain has 76 public and private institutions for primary
teacher education (in faculties of education or schools of teacher education) and 28
for secondary mathematics teacher education (in faculties of mathematics). Private
institutions must meet minimum conditions laid down by the Spanish government, but
those not receiving public funds are free to establish their own internal rules, guidelines,
and regulations. Before 2002, public institutions had to have their teacher education
curricula approved by the Ministry of Education. After 2002, another public agency
(the National Agency for Accreditation) took on this responsibility. Even the curriculum
requirements established by and specific to individual universities must ultimately be
validated by the national authorities and published in the official state gazette.
3.3.14.2 Program-types and credentials
At each level, the academic requirements for teaching are consistent throughout
Spain, varying only with respect to the level of education taught. Primary education
in Spain includes Grades 1 to 6. Compulsory secondary education includes Grades 7
to 12. Teacher education is aligned with these two school types. At present, a degree
commonly called the teacher certificate and offering specialized preparation in primary
education is required to teach students 6 to 12 years of age. Teachers at this level are
generalists, usually teaching all subjects except foreign languages, physical education,
musical education, and religion.
Until 2010, the teacher certificate took three years to acquire and was awarded by
university schools of teacher education and associated entities. The curriculum and
guidelines for this certificate dated back to 1995, and changed little in subsequent years.
Secondary education candidates before 2010 were required to complete a five-year
university degree and then to obtain a Certificate of Pedagogical Aptitude (CAP) at the
end of a short-term course.
Note that TEDS-M in Spain was limited to primary education because of special
difficulties anticipated in collecting data from dispersed and difficult-to-reach future
teachers at the secondary level. Due to this omission, Exhibit 3.16 shows the simplest
structure in TEDS-M, with only one program-type. This program-type is currently
being modified and aligned with the Bologna Accord, adopted in order to “Europeanize”
the continent’s universities.
13.3.14.3 Curriculum content, assessment, and organization
The common core subjects for the primary teacher certificate are psycho-pedagogical
foundations of special education, general pedagogy, organization of educational
institutions, educational and developmental psychology and school-age development,
educational sociology, educational theory and contemporary educational institutions,
40 This section is based on the national report written by E. Castro and P. Flores.
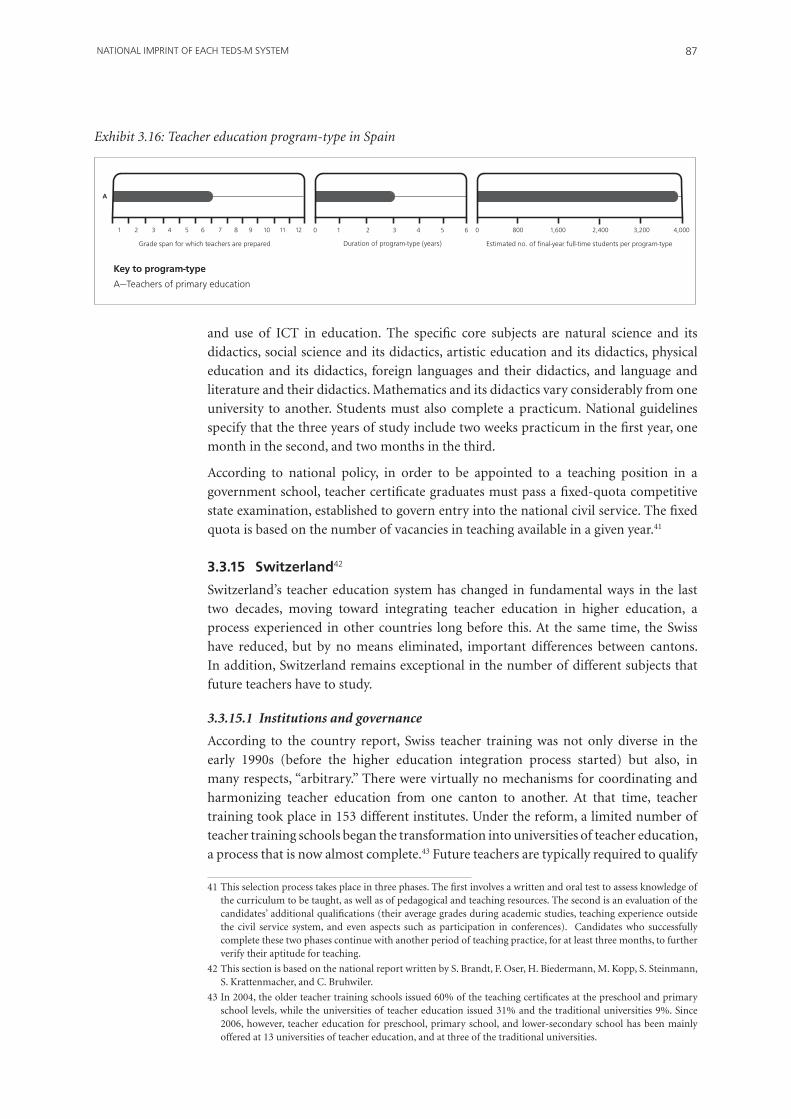
87 NATIONAL IMPRINT Of EACH TEDS-M SYSTEM
and use of ICT in education. The specific core subjects are natural science and its
didactics, social science and its didactics, artistic education and its didactics, physical
education and its didactics, foreign languages and their didactics, and language and
literature and their didactics. Mathematics and its didactics vary considerably from one
university to another. Students must also complete a practicum. National guidelines
specify that the three years of study include two weeks practicum in the first year, one
month in the second, and two months in the third.
According to national policy, in order to be appointed to a teaching position in a
government school, teacher certificate graduates must pass a fixed-quota competitive
state examination, established to govern entry into the national civil service. The fixed
quota is based on the number of vacancies in teaching available in a given year.41
3.3.15 Switzerland42
Switzerland’s teacher education system has changed in fundamental ways in the last
two decades, moving toward integrating teacher education in higher education, a
process experienced in other countries long before this. At the same time, the Swiss
have reduced, but by no means eliminated, important differences between cantons.
In addition, Switzerland remains exceptional in the number of different subjects that
future teachers have to study.
3.3.15.1 Institutions and governance
According to the country report, Swiss teacher training was not only diverse in the
early 1990s (before the higher education integration process started) but also, in
many respects, “arbitrary.” There were virtually no mechanisms for coordinating and
harmonizing teacher education from one canton to another. At that time, teacher
training took place in 153 different institutes. Under the reform, a limited number of
teacher training schools began the transformation into universities of teacher education,
a process that is now almost complete.43 Future teachers are typically required to qualify
Exhibit 3.16: Teacher education program-type in Spain
1 2 3 4 5 6 7 8 9 10 11 12
Grade span for which teachers are prepared
0 1 2 3 4 5 6
Duration of program-type (years)
0 800 1,600 2,400 3,200 4,000
Estimated no. of final-year full-time students per program-type
Key to program-type
A—Teachers of primary education
41 This selection process takes place in three phases. The first involves a written and oral test to assess knowledge of the curriculum to be taught, as well as of pedagogical and teaching resources. The second is an evaluation of the candidates’ additional qualifications (their average grades during academic studies, teaching experience outside the civil service system, and even aspects such as participation in conferences). Candidates who successfully complete these two phases continue with another period of teaching practice, for at least three months, to further verify their aptitude for teaching.
42 This section is based on the national report written by S. Brandt, F. Oser, H. Biedermann, M. Kopp, S. Steinmann, S. Krattenmacher, and C. Bruhwiler.
43 In 2004, the older teacher training schools issued 60% of the teaching certificates at the preschool and primary school levels, while the universities of teacher education issued 31% and the traditional universities 9%. Since 2006, however, teacher education for preschool, primary school, and lower-secondary school has been mainly offered at 13 universities of teacher education, and at three of the traditional universities.
A

THE TEACHER EDUCATION AND DEVELOPMENT STUDY IN MATHEMATICS (TEDS-M)88
for university entrance by gaining the Matura, a qualification awarded on the basis of
passes in final examinations and students’ academic record in the final year of secondary
school. Students who do not have this diploma can still gain admission by sitting and
passing a special entrance examination.
As a result of this reform, cantonal parliaments have lost some of their power over
teacher education while rectors of universities of teacher education, who can now
draw on increased institutional autonomy, are playing a more decisive role. The
federal government has no role in teacher education other than for vocational schools.
Previously, each canton decided whether to recognize the certificates of other cantons.
However, the Swiss Conference of Cantonal Ministers of Education (EDK) has agreed
that teaching certificates from EDK-approved teacher education institutions are now
valid in every canton.
3.3.15.2 Program-types and credentials
Despite cantonal autonomy and variation, the overall structure of Swiss teacher
education in the TEDS-M study (carried out only in German-speaking institutions in
Switzerland) is relatively simple. It consists of the following program-types, as portrayed
in Exhibit 3.17:
• TeachersofsecondaryschoolGrades7to9;
• TeachersofprimaryschoolGrades3to6;
• TeachersofprimaryschoolGrades1to6;
• TeachersofprimaryschoolGrades1to2/3.
Exhibit 3.17: Teacher education program-types in Switzerland
Note: The TEDS-M target population in Switzerland included only institutions where German is the primary language of use and instruction. It did not include institutions operating in other national languages. Also, the distinction between primary and secondary schools varies by canton: in 20 cantons, Grades 1–6 are defined as primary and Grades 7–9 are defined as secondary. However, in a number of other cantons, primary school ends at Grade 4 or 5. Some program-types at primary level qualify future teachers for kindergarten, but because this level of the education system was outside the scope of TEDS-M, no distinction was made between K–Grade 6 and Grades 1–6 programs, for example.
1 2 3 4 5 6 7 8 9 10 11 12
A
b
C
D
Grade span for which teachers are prepared
0 1 2 3 4 5 6
Duration of program-type (years)
0 300 600 900 1,200
Estimated no. of final-year full-time students per program-type
Key to program-type
A—Teachers of secondary school Grades 7–9
b—Teachers of primary school Grades 3–6
C—Teachers of primary school Grades 1–6
D—Teachers of primary school Grades 1–2/3

89 NATIONAL IMPRINT Of EACH TEDS-M SYSTEM
3.3.15.3 Curriculum content, assessment, and organization
Primary teachers teach the core primary subjects as well as music, art, physical education,
and other such subjects. Lower-secondary teachers also teach multiple subjects, but they
usually choose between a language–history oriented cluster and a mathematics–science
oriented cluster. Future teachers preparing for primary school generally take six to
eight subjects, thus putting more emphasis on a wider range of subjects than countries
that concentrate on only a few core subjects. Most primary teacher education includes
German, French, English and/or Italian,44 mathematics, art, physical education, history,
information technology, geography, science, and instrumental (music) instruction.
Additional coursework in education is integrated into the program-types from their
beginnings.
Secondary teaching candidates generally become qualified to teach three to five subjects.
The combination of subjects is mandated in some institutions and is elective in others.45
The practicum ranges from 2 to 12 weeks, with an average of seven. Some universities
add on-the-job training in the social or business sectors, or foreign language study trips,
to this practicum requirement.
In primary school teacher education, interim and final examinations are handled
quite differently by the cantons. Some cantons have no real final examinations. In
most cantons, though, examinations for primary future teachers are held for up to 10
subjects. The timing and modalities of these examinations also differ.46 Success on a
teaching test consisting of one or two lessons is required. Likewise, there are major
differences in assessment across the universities offering education to lower-secondary
future teachers. However, oral and written final examinations for at least three subjects
take place almost everywhere. The practicum and the dissertation component of the
degree are also assessed.
3.3.16 Thailand47
Although Thailand has a comprehensive regulatory framework for teacher education,
institutions continue to enjoy considerable curricular and instructional autonomy.
3.3.16.1 Institutions and governance
In academic year 2007, 46 Thai institutions had mathematics teacher education students.
Thirty-seven of these institutions offered a five-year degree, one institution offered only
a one-year graduate diploma in the teaching profession, and eight institutions offered
both these program-types.
44 Italian is only required within the Italian-speaking cantons.
45 In either case, this combination is drawn from a comprehensive set of subjects from the humanities and mathematics/natural sciences (mathematics, biology, chemistry, physics, and, in rare cases, information technology). Subject-matter content and subject-specific pedagogy are expected to comprise at least 40% of the program-type, the education sciences at least 20%, and practical training at least 10%.
46 They include not only written but also oral examinations, covering the general education and the profession-related parts of the program-type, which means inclusion of at least the mother tongue, one other language, mathematics, pedagogy, psychology, didactics and music, but often also drawing, physical education, history, and the natural sciences.
47 This section is based on the national report written by S. Pativisan, P. Dechsri, S. Maluangnont, and P. Talawat.

THE TEACHER EDUCATION AND DEVELOPMENT STUDY IN MATHEMATICS (TEDS-M)90
The Ministry of Education’s Commission on Higher Education oversees Thai
universities.48 The Teachers’ Council of Thailand is responsible for accrediting degrees
and certificates, subject to guidelines set out by corresponding professional
associations.
3.3.16.2 Program-types and credentials
Thai basic education follows the 6–3–3 system—six years of primary school followed
by three years of lower-secondary school and three years of upper-secondary school.
Nine years are compulsory. Universities with a faculty of education are responsible for
preparing future teachers for both primary and secondary schools. Future teachers who
have earned a Bachelor’s degree outside of education must take one additional year, full-
time, in a modified university program-type, which leads to a graduate diploma—the
second of the two program-types included in TEDS-M for Thailand. The earlier four-
year program-type was changed to five years after the 2007 class graduated. There is
no differentiation between preparation of teachers for the lower grades and secondary
grades up to Grade 12.
All future teachers within the Thai TEDS-M target population were specializing in
mathematics, in line with a recent policy requiring teachers throughout compulsory
education to be competent in mathematics. Thus, as Exhibit 3.18 suggests, the
two program-types in Thailand differ only in that one is concurrent and one is
consecutive.
48 The Bureau of Standards and Evaluation supervises all internal quality assessments at the universities in three domains: standards for graduation, standards for educational management, and standards for developing a knowledgeable society. In addition, the Commission on Higher Education establishes a national framework and standards for academic and professional degrees for the country’s universities. That office also provides broad entry prerequisites, structure, total credits, attendance length, registration, evaluation, and graduation standards/requirements. Each institution, in turn, is responsible for specific details.
Exhibit 3.18: Teacher education program-types in Thailand
Note: Program-types producing primary generalist teachers existed on paper, but at the time of testing and afterwards had no students. All future teachers in the TEDS-M target population were mathematics specialists. Estimates for the final-year full-time students per program-type were calculated as the mean of the estimates from the two split-half samples for Program-Types A and B.
1 2 3 4 5 6 7 8 9 10 11 12
Grade span for which teachers are prepared
0 1 2 3 4 5 6
Duration of program-type (years)
0 400 800 1,200 1,600
Estimated no. of final-year full-time students per program-type
Key to program-type
A—Graduate Diploma in Teaching, consecutive
b—bachelor of Education, concurrent
A
B
91 NATIONAL IMPRINT Of EACH TEDS-M SYSTEM
3.3.16.3 Curriculum content, assessment, and organization
Most Thai curricula for mathematics teacher education have a core of basic professional
courses. The contents of these core courses are extracted from nine areas: language and
technology, curriculum development, learning management, psychology, measurement
and evaluation, classroom management, educational research, innovation and IT,
and teacher characteristics. There is also an allowance for special topics and electives.
Students must also complete a 180-day practicum during the two semesters of their
last year of the five-year concurrent program-type. Students completing the graduate
diploma of teaching must undertake a full-year practicum, but there is some variation
in how this is implemented.
3.3.17 The United States49
The United States has gradually shifted from local control toward centralization of the
teacher licensure or certification policy at the state and, to a lesser extent, the national
level. At the same time, teacher education program-types, licensure requirements,
and program accreditation requirements for primary school and lower-secondary
mathematics teaching have continued to vary significantly both within and across
states.
3.3.17.1 Institutions and governance
In the United States, more than 1,300 public and private colleges and universities as well
as school districts, state agencies, and private organizations offer teacher education for
future primary and secondary teachers. All states require teacher education institutions
to obtain state approval for what they offer, but approval standards vary across states.
3.3.17.2 Program-types and credentials
In the federal No Child Left Behind legislation, the “highly qualified” teacher requirement
mandates teachers to demonstrate knowledge of the subjects they are assigned to teach
but does not impose specific national curriculum requirements.50
Exhibit 3.19 does not attempt to portray all the variations in levels of certification offered
by universities and colleges in the 50 American states. Instead, it gives an overview of
the six main program-types—primary, lower-secondary, and secondary, each of which
is offered in both a concurrent and a consecutive version. Note, however, that the grade
spans overlap: teachers in grades generally identified with primary school can thus be
prepared in a lower-secondary program-type, and teachers in grades usually identified
with lower-secondary can be prepared in either a lower-secondary or a lower- plus
upper-secondary program-type. The content that these prospective teachers at any of
these grade levels study can therefore vary considerably.
49 This section is based on the national report written by P. Youngs and E. Grogan.
50 Instead, primary candidates can demonstrate knowledge of mathematics (and other subjects) by completing a Bachelor’s degree and passing tests of subject-matter knowledge and teaching skills in mathematics, reading/language arts, and writing. Secondary mathematics teaching candidates can demonstrate subject-matter knowledge by passing a subject-matter examination, majoring in mathematics as an undergraduate, earning a graduate degree in mathematics, completing the coursework equivalent to an undergraduate degree, and/or holding advanced board certification from the National Board for Professional Teaching Standards (NBPTS) or the American Board for Certification of Teacher Excellence (ABCTE).
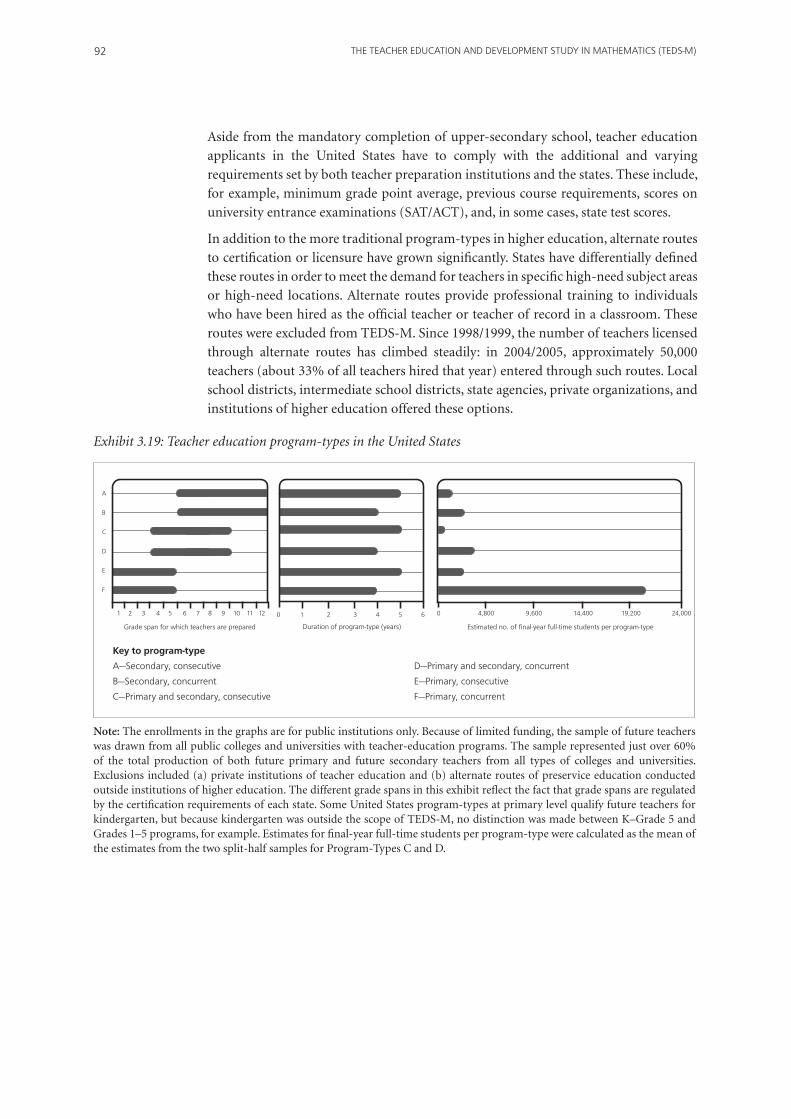
THE TEACHER EDUCATION AND DEVELOPMENT STUDY IN MATHEMATICS (TEDS-M)92
Aside from the mandatory completion of upper-secondary school, teacher education
applicants in the United States have to comply with the additional and varying
requirements set by both teacher preparation institutions and the states. These include,
for example, minimum grade point average, previous course requirements, scores on
university entrance examinations (SAT/ACT), and, in some cases, state test scores.
In addition to the more traditional program-types in higher education, alternate routes
to certification or licensure have grown significantly. States have differentially defined
these routes in order to meet the demand for teachers in specific high-need subject areas
or high-need locations. Alternate routes provide professional training to individuals
who have been hired as the official teacher or teacher of record in a classroom. These
routes were excluded from TEDS-M. Since 1998/1999, the number of teachers licensed
through alternate routes has climbed steadily: in 2004/2005, approximately 50,000
teachers (about 33% of all teachers hired that year) entered through such routes. Local
school districts, intermediate school districts, state agencies, private organizations, and
institutions of higher education offered these options.
Exhibit 3.19: Teacher education program-types in the United States
Note: The enrollments in the graphs are for public institutions only. Because of limited funding, the sample of future teachers was drawn from all public colleges and universities with teacher-education programs. The sample represented just over 60% of the total production of both future primary and future secondary teachers from all types of colleges and universities. Exclusions included (a) private institutions of teacher education and (b) alternate routes of preservice education conducted outside institutions of higher education. The different grade spans in this exhibit reflect the fact that grade spans are regulated by the certification requirements of each state. Some United States program-types at primary level qualify future teachers for kindergarten, but because kindergarten was outside the scope of TEDS-M, no distinction was made between K–Grade 5 and Grades 1–5 programs, for example. Estimates for final-year full-time students per program-type were calculated as the mean of the estimates from the two split-half samples for Program-Types C and D.
1 2 3 4 5 6 7 8 9 10 11 12
Grade span for which teachers are prepared
0 1 2 3 4 5 6
Duration of program-type (years)
0 4,800 9,600 14,400 19,200 24,000
Estimated no. of final-year full-time students per program-type
Key to program-type
A—Secondary, consecutive
b—Secondary, concurrent
C—Primary and secondary, consecutive
D—Primary and secondary, concurrent
E—Primary, consecutive
f—Primary, concurrent
A
b
C
D
E
f

93 NATIONAL IMPRINT Of EACH TEDS-M SYSTEM
3.3.17.3 Curriculum content, assessment, and organization
In general, the primary and lower-secondary program-types differ substantially from
program-types providing secondary mathematics preparation. The latter are specialist
program-types that primarily emphasize coursework in mathematics, mathematics
pedagogy (methods), and some additional education courses (e.g., special education,
social foundations of education, multicultural education). Primary school and middle-
grade program-types prepare generalists and include pedagogy (methods) courses for
language, arts, social studies, and science (as well as mathematics), along with other
education courses. They offer fewer courses in mathematics content than do program-
types that prepare teachers for up to Grade 12.
Program-type requirements vary in other respects as well. Some states provide general
guidelines, while others mandate specific requirements concerning liberal arts courses,
subject-matter courses, and pedagogy courses. Teacher preparation programs, program-
types, and states also vary with regard to requirements for practicum experience. As of
2007/2008, 39 of the 50 states required 5 to 18 weeks of student teaching, 38 required
candidates to pass tests of basic literacy and numeracy, and 41 mandated that candidates
pass tests of content knowledge. Three states did not require candidates to pass either
type of test.
3.4 Conclusion
The main point of this chapter has been to show that, notwithstanding commonalities
in the major organizational parameters, employment conditions, and quality assurance
policies examined in Chapter 2, the TEDS-M teacher education systems differ in
many other relevant ways. Understanding these differences is essential if we are to give
valid interpretations of the findings of the TEDS-M curriculum analyses and surveys
of institutions, teacher educators, and future teachers. However, understanding this
diversity at the national level is only the first step. As the curriculum analysis and survey
data will show, there is much more variation within countries. Understanding these
other differences is important in terms of understanding the opportunities to learn
and outcomes at the program-type, program, and future teacher levels. All this will be
analyzed and reported in the remaining chapters of this publication as well as in other
TEDS-M reports. This material is explored in particular depth in the national reports
written and released by the participating national centers.
References
Fulton, O., Santiago, P., Edquist, C., El-Khawas, E., & Hackl, E. (2007). Review of tertiary education:
Poland. Paris, France: Organisation for Economic Co-operation and Development (OECD).
Ingvarson, L. C., Schwille, J., Tatto, T., Rowley, G., Peck, R., & Senk, S. (forthcoming). An analysis
of teacher education content, structure, and quality assurance arrangements in TEDS-M countries.
Amsterdam, the Netherlands: International Association for the Evaluation of Educational
Achievement (IEA).
Organisation for Economic Co-operation and Development (OECD). (2005). Teachers matter:
Attracting, developing and retaining effective teachers. Paris, France: Author.

THE TEACHER EDUCATION AND DEVELOPMENT STUDY IN MATHEMATICS (TEDS-M)94

95
CHAPTER 4: CHARACTERISTICS OF TEACHER EDUCATION PROGRAMS, TEACHER EDUCATORS, AND FUTURE TEACHERS
4.1 Chapter OverviewThis chapter focuses on the characteristics of teacher education programs in the countries that participated in TEDS-M. It also focuses on the backgrounds of the teacher educators who work in those programs and on the backgrounds of the future teachers enrolled in the programs. The data for this chapter come from four questionnaires administered as part of the study: the Institutional Program Questionnaire (IPQ), the Future Primary Teacher Questionnaire, the Future Lower-Secondary Teacher Questionnaire, and the Teacher Educator Questionnaire. The questionnaires were administered in about 500 teacher preparation institutions in the participating countries to 13,907 future primary teachers, 8,332 future lower-secondary teachers, and 5,505 teacher educators. Some of
the exhibits relevant to this chapter appear in Appendices A and B to this volume.
4.2 Institutional Program Structures and CharacteristicsFor purposes of this study, a teacher education institution was defined as a secondary or post-secondary school, college, or university that offered a program or programs focusing on teacher preparation on a regular and frequent basis. Within each of the sampled teacher-education institutions, there might be one or more programs provided. A program was defined as a specific pathway within an institution that required students to undertake a set of courses and experiences that led to the award of a teaching credential or degree upon successful completion. For example, an institution might provide a concurrent program preparing primary teachers, a concurrent program preparing lower-secondary teachers, and a consecutive program accepting graduates from tertiary institutions and preparing them to be lower-secondary school teachers. (For more detail on definitions, see Tatto, Schwille, Senk, Ingvarson, Peck, and Rowley,
2008.)
4.2.1 Institutions Sampled
Exhibits B.2 and B.3 in Appendix B present summary statistics for the national samples of participating institutions (for more detail on sampling, see Tatto, 2012). Seven hundred and seventy-five programs from 504 institutions were included in one or more of the institutional surveys: thus, each institution submitted one or more completed IPQs. In total, 349 programs preparing future teachers to teach exclusively at the primary school level submitted IPQs, 226 programs preparing future teachers to teach at the lower-secondary school submitted IPQs, and 176 programs preparing future teachers to teach at either the primary or the lower-secondary levels submitted IPQs.
The institutional data reported in the chapter are presented at the national level. Later chapters provide more detailed descriptions of opportunities to learn, as designed within the program-groups described in Chapter 2. Because of the within-country differences across teacher education program-groups discussed in Chapters 2 and 3, we decided not to use whole-country comparisons when reporting on the institutional and
future teacher data. Instead, we elected to compare program-groups cross-nationally,

THE TEACHER EDUCATION AND DEVELOPMENT STUDY IN MATHEMATICS (TEDS-M)96
according to the intended grade level and area of specialization (in mathematics) of the
future teachers: that is, teachers who will undertake similar roles once qualified.
Data show that most future teachers planning to work in primary schools are prepared
as generalists who, once qualified and depending on the country, will teach classes no
higher than Grade 4 or 6. In a few countries, generalist teachers qualify to teach both
primary and lower-secondary grades through to Grade 10. In others, future primary
teachers are qualified to work as specialist teachers of mathematics. In contrast, most
future teachers of mathematics at the lower- secondary level are prepared as mathematics
specialists. Some will be qualified to teach up to Grade 10, while others will be qualified
to teach to Grade 11 and above.
In this chapter, the IPQ findings and the findings from the future teachers’ surveys are
presented according to six program-groups:
• Group1:Lower-primarygeneralists(Grade4maximum)
• Group2:Primarygeneralists(Grade6maximum)
• Group3:Primary/lower-secondarygeneralists(Grade10maximum)
• Group4:Primarymathematicsspecialists
• Group5:Lowersecondary(Grade10maximum)
• Group6:Uppersecondary(Grade11andabove).
Note that many of the exhibits in this chapter present data in the form of estimated
percentages based on weighted data; they also provide standard errors for these
estimates. Note also that in this section of the chapter (dealing with the IPQ data),
all of the results displayed in the exhibits and in the accompanying discussion must
be considered with reference to a number of limitations on the data for particular
countries. The limitations are as follows.
Limitation annotations for institution data
a. Chinese Taipei: exclusion rate was greater than five percent (see the TEDS-M technical report).
b. Malaysia: the participation rate was 57%, and the quality of the IPQ data was questionable.
c. Norway: Norwegian program-types are reported separately because the populations partly overlapped; data from these program-types cannot therefore be aggregated.
d. Oman: the only data provided at the time of testing were secondary teacher education data.
e. Philippines: the exclusion rate was greater than five percent (see the technical report).
f. Poland: institutions not included were those providing consecutive programs only.
g. Russian Federation: the secondary pedagogical institutions were not included. h. Spain: only primary teacher education was covered. i. Switzerland: the only institutions included were those where German is the
primary language of use and instruction.
j. United States: only public institutions were covered.
Note: Data from Canada were unacceptable. Germany did not authorize reporting of the IPQ data. According to IEA standards, low participation rates are < 60%. For more information, see the TEDS-M technical report (Tatto, 2012).

97CHARACTERISTICS Of TEACHER EDUCATION PROGRAMS, TEACHER EDUCATORS, AND fUTURE TEACHERS
4.2.2 Program-Groups
Exhibit 4.1 shows the estimated percentage of each type of program-group offered in
each country at the primary and secondary school levels. In the case of Poland, for
example, we estimated, on the basis of data from the 125 primary-level IPQs completed
and submitted, that 71% of the teacher education programs at that level cater to future
teachers who will be certified to teach up to Grade 4 only. The other 29% of programs
are directed at future primary teachers training to work as primary mathematics
specialists.
Relatively few countries prepare mathematics specialists at the primary level, and fewer
still prepare teachers as upper-primary/lower-secondary generalists (able to teach up to
Grade 10). Many secondary programs prepare teachers to teach school mathematics
to Grade 11 and above. The three types of program-group most prevalent in the
participating countries are primary generalist (Grade 6 maximum), lower-secondary
specialist (Grade 10 maximum), and secondary (Grade 11 and above). Only four
countries (Georgia, Poland, the Russian Federation, and Switzerland) offer primary
generalist programs aimed at Grade 4 and below. Five—Malaysia, Poland, Singapore,
Thailand, and the United States—prepare primary mathematics specialists. Malaysia
and Thailand offer only primary specialist programs.
4.2.3 Program Entry Requirements
One indicator of program selectivity in mathematics teacher education is whether
prospective teachers are required to have a specified level of qualification in order to
enter the program of their choice. Exhibit 4.2 shows that most programs in almost every
country require at least some upper-secondary school qualifications in mathematics. In
general, entrance requirements are higher for those planning to teach upper-secondary
school mathematics.
Some programs, notably those in Chinese Taipei and Singapore, are provided in post-
secondary institutions (at ISCED Level 4 for the former country and ISCED Level 5 for
the latter) for both future primary and secondary teachers. In Chinese Taipei, where
admission to teacher education takes place after admission to university, future teachers
must complete one year of university before being admitted to a teacher education
program. In Singapore, the requirement is a special A-Level qualification, a polytechnic
diploma, or a special post-secondary degree.
4.2.3.1 Future teachers’ prior achievement in mathematics as a selection criterion
Another factor that influences future teachers’ admission to a teacher education
program is the extent to which institutions have admissions policies related to previous
achievement levels in mathematics. Exhibit 4.3 shows, for each program-group in each
country, the estimated percentage of programs using prior mathematics achievement
as an entry criterion. For example, on the basis of the 86 IPQs submitted from Poland,
we estimated that 90% of all teacher education programs in that country do not use
prior achievement in mathematics as an entrance criterion. Eight percent of the IPQ
respondents associated with these programs considered the criterion to be a “not very
important” one, one percent considered it to be “somewhat important,” and one percent
rated it as a “very important” criterion.

THE TEACHER EDUCATION AND DEVELOPMENT STUDY IN MATHEMATICS (TEDS-M)98
Exh
ibit
4.1
: Pro
gram
-gro
ups
by c
ount
ry a
nd b
y gr
ade
leve
l (es
tim
ated
per
cent
)
Co
untr
y Pr
og
ram
-Gro
ups
Prim
ary
Pro
gra
m-G
roup
s Se
con
dar
y
N
umb
er o
f Lo
wer
Pri
mar
y Pr
imar
y
Prim
ary
and
Sec
on
dar
y Pr
imar
y M
athe
mat
ics
Num
ber
of
Low
er S
eco
nd
ary
Low
er &
Up
per
Pr
og
ram
s
(to
Gra
de
4 M
axim
um)
(to
Gra
de
6 M
axim
um)
Gen
eral
ist
Spec
ialis
ts
Pro
gra
ms
(to
Gra
de
10 M
axim
um)
Seco
nd
ary
R
esp
on
din
g
(t
o G
rad
e 10
Max
imum
)
Res
po
nd
ing
(t
o G
rad
e 11
an
d a
bov
e)
Es
t.
(SE)
Es
t.
(SE)
Es
t.
(SE)
Es
t.
(SE)
Est.
(S
E)
Est.
(S
E)
bots
wan
a 4
100.
0 (0
.0)
3 66
.7
(23.
6)
33.3
(2
3.6)
Chi
le†
31
100.
0 (0
.0)
38
100.
0 (0
.0)
Chi
nese
Tai
peia
11
100.
0 (0
.0)
8
10
0.0
(0.0
)
Geo
rgia
10
10
0.0
(0.0
)
7
100.
0 (0
.0)
Mal
aysi
ab 12
10
0.0
(0.0
) 8
100.
0 (0
.0)
Nor
way
(ALU
)†c
16
100.
0 (0
.0)
16
100.
0 (0
.0)
Nor
way
(ALU
+)†c
16
10
0.0
(0.0
)
16
10
0.0
(0.0
)
Nor
way
11
100.
0 (0
.0)
(P
PU &
Mas
ter’
s)c
Om
and
8
100.
0 (0
.0)
Phili
ppin
ese
33
100.
0 (0
.0)
48
100.
0 (0
.0)
Pola
nd†f
12
5 71
.0
(0.9
)
29
.0
(0.9
) 39
53
.8
(2.1
) 46
.2
(2.1
)
Russ
ian
fede
ratio
ng 45
10
0.0
(0.0
)
43
10
0.0
(0.0
)
Sing
apor
e 6
66.7
(2
3.6)
33
.3
(23.
6)
4 50
.0
(35.
4)
50.0
(3
5.4)
Spai
nh 48
10
0.0
(0.0
)
Switz
erla
ndi
21
33.3
(0
.0)
66.7
(0
.0)
7 10
0.0
(0.0
)
Thai
land
† 51
10
0.0
(0.0
) 51
10
0.0
(0.0
)
Uni
ted
Stat
es†j
71
82.3
(6
.4)
17.7
(6
.4)
61
21.0
(6
.5)
79.0
(6
.5)
Not
es:
1. †
Som
e or
all
futu
re t
each
ers
in t
his
cou
ntr
y ar
e be
ing
prep
ared
to
teac
h p
rim
ary
and
low
er-s
econ
dary
stu
den
ts. T
he
prog
ram
-gro
ups
pre
pari
ng
futu
re p
rim
ary
teac
her
s an
d t
he
prog
ram
-gr
oups
pre
pari
ng
low
er-s
econ
dary
tea
cher
s ar
e th
eref
ore
part
ly o
r fu
lly o
verl
appi
ng
(see
th
e T
ED
S-M
tec
hn
ical
rep
ort)
.
2. W
hen
rea
din
g th
is t
able
, kee
p in
min
d th
e lim
itat
ion
s an
not
ated
on
pag
e 96
an
d de
not
ed in
th
e ta
ble
abov
e by
foot
not
e le
tter
s.
3. T
he
shad
ed a
reas
iden
tify
dat
a th
at, f
or r
easo
ns
expl
ain
ed in
th
ese
limit
atio
ns,
can
not
be
com
pare
d w
ith
con
fide
nce
to
data
from
oth
er c
oun
trie
s.

99CHARACTERISTICS Of TEACHER EDUCATION PROGRAMS, TEACHER EDUCATORS, AND fUTURE TEACHERS
Exh
ibit
4.2
: Min
imum
qua
lifica
tion
req
uire
d fo
r en
try
to p
rogr
am (
esti
mat
ed p
erce
nt)
Pro
gra
m-G
roup
C
oun
try
Num
ber
of
Pe
rcen
t o
f Pr
og
ram
s in
Res
po
nse
Cat
ego
ries
(W
eigh
ted
Est
imat
es)
Pr
og
ram
s
Res
po
nd
ing
G
eorg
ia
10
80.0
(1
4.1)
10
.0
(10.
0)
10.0
(1
0.0)
Po
land
f 86
10
0.0
(0.0
)
Ru
ssia
n fe
dera
tiong
44
76.9
(1
5.7)
21
.4
(15.
9)
1.7
(1.8
)
Sw
itzer
land
i 7
71.4
(1
7.5)
28
.6
(17.
5)
C
hine
se T
aipe
ia 11
10
.8
(3.8
)
89
.2
(3.8
)
Ph
ilipp
ines
e 33
1.
7 (1
.7)
85.5
(7
.8)
1.9
(1.4
) 11
.0
(7.4
)
Si
ngap
ore
4
75
.0
(21.
2)
25.0
(2
1.2)
Sp
ainh
48
100.
0 (0
.0)
Sw
itzer
land
i 14
92
.9
(7.1
) 7.
1 (7
.1)
U
nite
d St
ates
j 55
78
.4
(5.7
)
21
.6
(5.7
)
bo
tsw
ana
4
75
.0
(25.
0)
25.0
(2
5.0)
C
hile
† 31
12
.9
(7.2
) 80
.6
(7.2
) 6.
5 (4
.6)
N
orw
ay (A
LU)†c
16
93
.8
(6.3
) 6.
3 (6
.3)
N
orw
ay (A
LU+)
†c
14
100.
0 (0
.0)
M
alay
siab
12
8.3
(8.3
) 91
.7
(8.3
)
Po
land
†f
39
100.
0 (0
.0)
Si
ngap
ore
2
50
.0
(35.
4)
50.0
(3
5.4)
Th
aila
nd†
49
86.0
(3
.5)
14.0
(3
.5)
U
nite
d St
ates
†j
15
80.7
(5
.9)
19.3
(5
.9)
Low
er S
eco
nd
ary
(ISC
ED 2
) U
pp
er S
eco
nd
ary
(ISC
ED 3
) Po
st-S
eco
nd
ary,
D
egre
e (I
SCED
5)
No
n-T
erti
ary
(ISC
ED 4
)
Es
t.
(SE)
Es
t.
(SE)
Es
t.
(SE)
Es
t.
(SE)
Gro
up 1
. Lo
wer
Prim
ary
(to
Gra
de 4
Max
imum
)
Gro
up 2
. Pr
imar
y to
Gra
de 6
Max
imum
)
Gro
up 3
. Pr
imar
y an
d Se
cond
ary
Gen
eral
ists
(to G
rade
10
Max
imum
)
Gro
up 4
. Pr
imar
y M
athe
mat
ics
Spec
ialis
ts

THE TEACHER EDUCATION AND DEVELOPMENT STUDY IN MATHEMATICS (TEDS-M)100
Exh
ibit
4.2
: Min
imum
qua
lifica
tion
req
uire
d fo
r en
try
to p
rogr
am (
esti
mat
ed p
erce
nt)
(con
td.)
Pro
gra
m-G
roup
C
oun
try
Num
ber
of
Pe
rcen
t o
f Pr
og
ram
s in
Res
po
nse
Cat
ego
ries
(W
eigh
ted
Est
imat
es)
Pr
og
ram
s
Res
po
nd
ing
bo
tsw
ana
2
10
0.0
(0.0
)
C
hile
† 38
13
.3
(6.5
) 74
.5
(9.2
) 8.
5 (5
.0)
3.7
(5.3
)
N
orw
ay (A
LU)†c
16
93
.8
(6.3
) 6.
3 (6
.3)
N
orw
ay (A
LU+)
†c
14
100.
0 (0
.0)
Ph
ilipp
ines
e 48
1.
0 (1
.0)
93.1
(4
.2)
0.7
(0.7
) 5.
2 (4
.0)
Po
land
†f
21
100.
0 (0
.0)
Si
ngap
ore
2
10
0.0
(0.0
)
Sw
itzer
land
i 7
100.
0 (0
.0)
U
nite
d St
ates
†j
15
80.7
(5
.9)
19.3
(5
.9)
bo
tsw
ana
1
10
0.0
(0.0
)
C
hine
se T
aipe
ia 8
100.
0 (0
.0)
G
eorg
ia
7
57
.1
(10.
1)
42.9
(1
0.1)
M
alay
siab
8
10
0.0
(0.0
)
N
orw
ay (P
PU &
Mas
ter’
s)c
11
9.2
(13.
1)
90.8
(1
3.1)
O
man
d 8
12.5
(1
2.5)
87
.5
(12.
5)
Po
land
f 18
10
0.0
(0.0
)
Ru
ssia
n fe
dera
tiong
43
98.6
(1
.4)
1.4
(1.4
)
Si
ngap
ore
2
10
0.0
(0.0
)
Th
aila
nd†
49
86.0
(3
.5)
14.0
(3
.5)
U
nite
d St
ates
j 44
77
.8
(4.2
)
22
.2
(4.2
)
Not
es:
1. †
Som
e or
all
futu
re t
each
ers
in t
his
cou
ntr
y ar
e be
ing
prep
ared
to
teac
h p
rim
ary
and
low
er-s
econ
dary
stu
den
ts. T
he
prog
ram
-gro
ups
pre
pari
ng
futu
re p
rim
ary
teac
her
s an
d t
he
prog
ram
-gr
oups
pre
pari
ng
low
er-s
econ
dary
tea
cher
s ar
e th
eref
ore
part
ly o
r fu
lly o
verl
appi
ng
(see
th
e T
ED
S-M
tec
hn
ical
rep
ort)
.
2. W
hen
rea
din
g th
is t
able
, kee
p in
min
d th
e lim
itat
ion
s an
not
ated
on
pag
e 96
an
d de
not
ed in
th
e ta
ble
abov
e by
foot
not
e le
tter
s.
3. T
he
shad
ed a
reas
iden
tify
dat
a th
at, f
or r
easo
ns
expl
ain
ed in
th
ese
limit
atio
ns,
can
not
be
com
pare
d w
ith
con
fide
nce
to
data
from
oth
er c
oun
trie
s.
Low
er S
eco
nd
ary
(ISC
ED 2
) U
pp
er S
eco
nd
ary
(ISC
ED 3
) Po
st-S
eco
nd
ary,
D
egre
e (I
SCED
5)
No
n-T
erti
ary
(ISC
ED 4
)
Es
t.
(SE)
Es
t.
(SE)
Es
t.
(SE)
Es
t.
(SE)
Gro
up 5
. Lo
wer
Sec
onda
ry(t
o G
rade
10
Max
imum
)
Gro
up 6
. Lo
wer
and
Upp
er
Seco
ndar
y(t
o G
rade
11
& a
bove
)

101CHARACTERISTICS Of TEACHER EDUCATION PROGRAMS, TEACHER EDUCATORS, AND fUTURE TEACHERS
Prior mathematics achievement is an important criterion for admission to primary
programs in Georgia, the Philippines, the Russian Federation, and Singapore. This was
also the case for primary/secondary programs in Botswana, primary specialist programs
in Malaysia and Singapore, lower-secondary programs in Botswana, the Philippines,
Poland, Singapore, and the United States, and upper-secondary programs in Botswana,
Chinese Taipei, Georgia, Malaysia, the Russian Federation, Singapore, Thailand, and the
United States.
A related question in the IPQ asked respondents to state how well they thought future
teachers entering the particular program rated with respect to their prior academic
achievement and in reference to national norms. Exhibit 4.4 presents a summary of
their responses. Respondents in most primary and secondary programs rated teachers
as “above-average achievers for their age group.” In Singapore and Oman, programs are
able to recruit a substantial number of students (50% or more of total cohorts) whom
respondents rated as being in the top 20% of their age group. Respondents in other
countries, Chinese Taipei (primary) and Malaysia in particular, gave the same rating,
but for lower percentages (30% or more of student cohorts).
Few teacher education programs reported recruiting students from the top 10% of their
class in significant numbers. Respondents in many countries rated future teachers as
average or below-average achievers in mathematics for their age group.
4.2.4 The Content of Teacher Education Programs
Participating institutions provided detailed information about the academic and
professional content of their teacher education programs. This included information
about the number of subject areas graduates would be qualified to teach (i.e., specialists
versus generalists) and the number of hours of instruction allocated to each area.
One distinct pattern emerged in regard to specialization. While most programs prepare
future primary teachers to teach more than two subjects, those catering for future
secondary teachers prepare them, for the most part, to teach one or two subjects. For
instance, most future teachers of lower- and upper-secondary schools in Chinese Taipei,
Georgia, Oman, Poland, the Russian Federation, Thailand, and the United States are
trained to teach only one subject. Exceptions to this pattern were found in countries
with programs preparing teachers for both primary and secondary certification, as in
Chile, Norway, and some programs in the United States (see Exhibit 2.1 in Chapter 2).

THE TEACHER EDUCATION AND DEVELOPMENT STUDY IN MATHEMATICS (TEDS-M)102
Exh
ibit
4.3
: Im
port
ance
of p
rior
ach
ieve
men
t in
mat
hem
atic
s in
the
prog
ram
adm
issi
ons
proc
ess
(est
imat
ed p
erce
nt)
Pro
gra
m-G
roup
C
oun
try
Num
ber
of
Pe
rcen
t o
f Pr
og
ram
s in
Res
po
nse
Cat
ego
ries
(W
eigh
ted
Est
imat
es)
Pr
og
ram
s
Res
po
nd
ing
G
eorg
ia
10
10.0
(1
0.0)
80
.0
(14.
1)
10.0
(1
0.0)
Po
land
f 86
89
.5
(3.1
) 8.
1 (2
.6)
1.2
(1.2
) 1.
2 (1
.2)
Ru
ssia
n fe
dera
tiong
44
15.0
(6
.6)
2.6
(2.0
) 41
.3
(9.6
) 41
.0
(8.5
)
Sw
itzer
land
i 7
71.4
(2
4.7)
28
.6
(24.
7)
C
hine
se T
aipe
ia 11
40
.6
(24.
0)
43.2
(2
5.7)
16
.2
(6.5
)
Ph
ilipp
ines
e 32
4.
0 (3
.0)
6.3
(6.6
) 24
.7
(9.7
) 65
.0
(12.
2)
Si
ngap
ore
4
10
0.0
(0.0
)
Sp
ainh
46
95.3
(2
.8)
3.1
(2.2
) 1.
6 (1
.6)
Sw
itzer
land
i 13
92
.3
(7.7
) 7.
7 (7
.7)
U
nite
d St
ates
j 54
22
.1
(6.1
) 20
.0
(3.6
) 55
.6
(6.8
) 2.
3 (1
.3)
bo
tsw
ana
4
75
.0
(25.
0)
25.0
(2
5.0)
C
hile
† 28
85
.7
(7.1
) 7.
1 (5
.0)
7.1
(5.0
)
N
orw
ay (A
LU)†c
13
46
.2
(15.
0)
15.4
(1
0.1)
38
.5
(12.
8)
N
orw
ay (A
LU+)
†c
14
35.7
(1
2.4)
21
.4
(12.
4)
42.9
(1
7.5)
M
alay
siab
12
8.3
(8.3
)
58
.3
(14.
4)
33.3
(1
1.8)
Po
land
†f
38
36.8
(8
.2)
5.3
(3.8
) 34
.2
(8.4
) 23
.7
(7.4
)
Si
ngap
ore
2
10
0.0
(0.0
)
Th
aila
nd†
50
12.0
(4
.5)
17.9
(6
.0)
44.1
(7
.5)
26.0
(6
.5)
U
nite
d St
ates
†j
14
5.2
(5.8
) 38
.8
(34.
8)
31.1
(1
8.1)
25
.0
(22.
5)
N
ot C
on
sid
ered
N
ot V
ery
Imp
ort
ant
Som
ewha
t Im
po
rtan
t V
ery
Imp
ort
ant
Es
t.
(SE)
Es
t.
(SE)
Es
t.
(SE)
Es
t.
(SE)
Gro
up 1
. Lo
wer
Prim
ary
(to
Gra
de 4
Max
imum
)
Gro
up 2
. Pr
imar
y to
Gra
de 6
Max
imum
)
Gro
up 3
. Pr
imar
y an
d Se
cond
ary
Gen
eral
ists
(to G
rade
10
Max
imum
)
Gro
up 4
. Pr
imar
y M
athe
mat
ics
Spec
ialis
ts

103CHARACTERISTICS Of TEACHER EDUCATION PROGRAMS, TEACHER EDUCATORS, AND fUTURE TEACHERS
Exh
ibit
4.3
: Im
port
ance
of p
rior
ach
ieve
men
t in
mat
hem
atic
s in
the
prog
ram
adm
issi
ons
proc
ess
(est
imat
ed p
erce
nt)
(con
td.)
Pro
gra
m-G
roup
C
oun
try
Num
ber
of
Pe
rcen
t o
f Pr
og
ram
s in
Res
po
nse
Cat
ego
ries
(W
eigh
ted
Est
imat
es)
Pr
og
ram
s
Res
po
nd
ing
bo
tsw
ana
2
10
0.0
(0.0
)
C
hile
† 34
89
.3
(5.3
) 5.
3 (3
.7)
5.3
(3.7
)
N
orw
ay (A
LU)†c
13
46
.2
(15.
0)
15.4
(1
0.1)
38
.5
(12.
8)
N
orw
ay (A
LU+)
†c
14
35.7
(1
2.4)
21
.4
(12.
4)
42.9
(1
7.5)
Ph
ilipp
ines
e 48
0.
9 (0
.9)
7.7
(5.2
) 26
.7
(8.7
) 64
.7
(9.0
)
Po
land
†f
21
28.6
(1
1.8)
9.
5 (7
.1)
38.1
(1
3.0)
23
.8
(10.
1)
Si
ngap
ore
2
10
0.0
(0.0
)
Sw
itzer
land
i 7
100.
0 (0
.0)
U
nite
d St
ates
†j
14
5.2
(5.8
) 38
.8
(34.
8)
31.1
(1
8.1)
25
.0
(22.
5)
bo
tsw
ana
1
10
0.0
(0.0
)
C
hine
se T
aipe
ia 8
4.8
(4.8
) 81
.0
(6.7
) 14
.3
(4.8
)
G
eorg
ia
7
42
.9
(17.
5)
57.1
(1
7.5)
M
alay
siab
8
12
.5
(12.
5)
87.5
(1
2.5)
N
orw
ay (P
PU &
Mas
ter’
s)c
11
45.6
(1
7.0)
9.
0 (9
.0)
9.0
(9.0
) 36
.4
(17.
0)
O
man
d 8
37.5
(1
2.5)
12
.5
(12.
5)
50.0
(0
.0)
Po
land
f 17
47
.1
(11.
2)
29.4
(9
.6)
23.5
(1
1.3)
Ru
ssia
n fe
dera
tiong
42
4.4
(3.2
) 12
.6
(6.5
) 23
.2
(7.8
) 59
.7
(7.0
)
Si
ngap
ore
2
10
0.0
(0.0
)
Th
aila
nd†
50
12.0
(4
.5)
17.9
(6
.0)
44.1
(7
.5)
26.0
(6
.5)
U
nite
d St
ates
j 46
12
.2
(4.4
) 2.
6 (1
.6)
47.6
(1
0.5)
37
.7
(10.
1)
Not
es:
1. †
Som
e or
all
futu
re t
each
ers
in t
his
cou
ntr
y ar
e be
ing
prep
ared
to
teac
h p
rim
ary
and
low
er-s
econ
dary
stu
den
ts. T
he
prog
ram
-gro
ups
pre
pari
ng
futu
re p
rim
ary
teac
her
s an
d t
he
prog
ram
-gr
oups
pre
pari
ng
low
er-s
econ
dary
tea
cher
s ar
e th
eref
ore
part
ly o
r fu
lly o
verl
appi
ng
(see
th
e T
ED
S-M
tec
hn
ical
rep
ort)
.
2. W
hen
rea
din
g th
is t
able
, kee
p in
min
d th
e lim
itat
ion
s an
not
ated
on
pag
e 96
an
d de
not
ed in
th
e ta
ble
abov
e by
foot
not
e le
tter
s.
3. T
he
shad
ed a
reas
iden
tify
dat
a th
at, f
or r
easo
ns
expl
ain
ed in
th
ese
limit
atio
ns,
can
not
be
com
pare
d w
ith
con
fide
nce
to
data
from
oth
er c
oun
trie
s.
N
ot C
on
sid
ered
N
ot V
ery
Imp
ort
ant
Som
ewha
t Im
po
rtan
t V
ery
Imp
ort
ant
Es
t.
(SE)
Es
t.
(SE)
Es
t.
(SE)
Es
t.
(SE)
Gro
up 5
. Lo
wer
Sec
onda
ry(t
o G
rade
10
Max
imum
)
Gro
up 6
. Lo
wer
and
Upp
er
Seco
ndar
y(t
o G
rade
11
& a
bove
)

THE TEACHER EDUCATION AND DEVELOPMENT STUDY IN MATHEMATICS (TEDS-M)104
Exh
ibit
4.4
: Rat
ings
of f
utur
e te
ache
rs’ p
rior
ach
ieve
men
t (es
tim
ated
per
cent
)
Pro
gra
m-G
roup
C
oun
try
Num
ber
of
Pe
rcen
t o
f Pr
og
ram
s in
Res
po
nse
Cat
ego
ries
(W
eigh
ted
Est
imat
es)
Pr
og
ram
s
Res
po
nd
ing
G
eorg
ia
10
20.0
(1
4.1)
70
.0
(17.
3)
10.0
(1
0.0)
Po
land
f 84
3.
6 (2
.1)
3.6
(2.1
) 17
.9
(4.6
) 69
.0
(5.5
) 6.
0 (2
.6)
Ru
ssia
n fe
dera
tiong
45
14.4
(6
.4)
23.5
(8
.6)
62.1
(1
0.7)
Sw
itzer
land
i 5
20.0
(2
0.4)
80
.0
(20.
4)
C
hine
se T
aipe
ia 11
5.
4 (5
.1)
37.8
(2
6.1)
46
.0
(24.
6)
10.8
(7
.3)
Ph
ilipp
ines
e 33
13
.7
(8.1
) 48
.1
(10.
2)
38.1
(8
.7)
Si
ngap
ore
4
75
.0
(21.
2)
25.0
(2
1.2)
Sp
ainh
47
2.5
(2.5
) 18
.6
(3.0
) 60
.9
(3.4
) 16
.6
(4.3
) 1.
4 (1
.4)
Sw
itzer
land
i 13
23
.1
(13.
4)
46.2
(1
3.8)
23
.1
(7.9
) 7.
7 (7
.7)
U
nite
d St
ates
j 56
6.
4 (3
.0)
14.7
(2
.7)
50.2
(9
.5)
28.7
(7
.8)
bo
tsw
ana
4 25
.0
(25.
0)
25.0
(2
5.0)
50
.0
(0.0
)
C
hile
† 30
3.
3 (3
.3)
33.3
(7
.2)
43.3
(7
.5)
20.0
(7
.6)
N
orw
ay (A
LU)†c
16
6.
3 (6
.3)
12.5
(8
.8)
75.0
(1
2.5)
6.
3 (6
.3)
N
orw
ay (A
LU+)
†c
16
6.3
(6.3
) 18
.8
(6.3
) 75
.0
(0.0
)
M
alay
siab
12
8.3
(8.3
) 33
.3
(16.
7)
41.7
(1
8.6)
8.
3 (8
.3)
8.3
(8.3
)
Po
land
†f
39
2.6
(2.6
) 46
.2
(8.0
) 46
.2
(7.5
) 5.
1 (3
.6)
Si
ngap
ore
2
50
.0
(35.
4)
50.0
(3
5.4)
Th
aila
nd†
47
6.3
(4.2
) 10
.6
(4.4
) 49
.0
(8.1
) 21
.3
(6.1
) 10
.7
(4.8
) 2.
1 (2
.1)
U
nite
d St
ates
†j
15
5.8
(6.6
) 25
.4
(19.
1)
29.5
(1
8.2)
39
.3
(32.
8)
Top
10
% o
f To
p 2
0% o
f A
bov
e-A
vera
ge
Ach
ieve
rs
Ave
rag
e A
chie
vers
Be
low
-Ave
rag
e A
chie
vers
W
ell-B
elow
-Ave
rag
e A
ge
Gro
up
Ag
e G
roup
fo
r A
ge
Gro
up
for
Ag
e G
roup
fo
r A
ge
Gro
up
Ach
ieve
rs f
or
Ag
e G
roup
Est.
(S
E)
Est.
(S
E)
Est.
(S
E)
Est.
(S
E)
Est.
(S
E)
Est.
(S
E)
Gro
up 1
. Lo
wer
Prim
ary
(to
Gra
de 4
Max
imum
)
Gro
up 2
. Pr
imar
y to
Gra
de 6
Max
imum
)
Gro
up 3
. Pr
imar
y an
d Se
cond
ary
Gen
eral
ists
(to G
rade
10
Max
imum
)
Gro
up 4
. Pr
imar
y M
athe
mat
ics
Spec
ialis
ts

105CHARACTERISTICS Of TEACHER EDUCATION PROGRAMS, TEACHER EDUCATORS, AND fUTURE TEACHERS
Exh
ibit
4.4
: Rat
ings
of f
utur
e te
ache
rs’ p
rior
ach
ieve
men
t (es
tim
ated
per
cent
) (c
ontd
.)
Pro
gra
m-G
roup
C
oun
try
Num
ber
of
Pe
rcen
t o
f Pr
og
ram
s in
Res
po
nse
Cat
ego
ries
(W
eigh
ted
Est
imat
es)
Pr
og
ram
s
Res
po
nd
ing
bo
tsw
ana
2
10
0.0
(0.0
)
C
hile
† 36
6.
5 (3
.5)
33.3
(8
.0)
44.9
(8
.2)
15.2
(5
.9)
N
orw
ay (A
LU)†c
16
6.
3 (6
.3)
12.5
(8
.8)
75.0
(1
2.5)
6.
3 (6
.3)
N
orw
ay (A
LU+)
†c
16
6.3
(6.3
) 18
.8
(6.3
) 75
.0
(0.0
)
Ph
ilipp
ines
e 48
9.
0 (5
.3)
63.8
(8
.2)
22.0
(7
.0)
5.3
(3.7
)
Po
land
†f
21
28.6
(1
1.3)
61
.9
(11.
1)
9.5
(6.8
)
Si
ngap
ore
2
10
0.0
(0.0
)
Sw
itzer
land
i 6
83.3
(1
7.1)
16
.7
(17.
1)
U
nite
d St
ates
†j
15
5.8
(6.6
) 25
.4
(19.
1)
29.5
(1
8.2)
39
.3
(32.
8)
bo
tsw
ana
1
10
0.0
(0.0
)
C
hine
se T
aipe
ia 8
4.8
(4.8
)
90
.5
(6.7
) 4.
8 (4
.8)
G
eorg
ia
7
28
.6
(0.0
) 42
.9
(10.
1)
28.6
(1
0.1)
M
alay
siab
8
12
.5
(12.
5)
87.5
(1
2.5)
N
orw
ay (P
PU &
Mas
ter’
s)c
8
12
.7
(10.
6)
49.6
(1
6.2)
37
.7
(21.
6)
O
man
d 8
37.5
(1
2.5)
50
.0
(17.
7)
12.5
(1
2.5)
Po
land
f 18
5.
6 (5
.6)
66.7
(1
1.4)
27
.8
(9.8
)
Ru
ssia
n fe
dera
tiong
43
15.9
(7
.5)
43.9
(9
.4)
40.2
(8
.7)
Si
ngap
ore
2
10
0.0
(0.0
)
Th
aila
nd†
47
6.3
(4.2
) 10
.6
(4.4
) 49
.0
(8.1
) 21
.3
(6.1
) 10
.7
(4.8
) 2.
1 (2
.1)
U
nite
d St
ates
j 44
6.
4 (2
.1)
22.1
(7
.3)
48.3
(1
0.7)
23
.2
(10.
3)
Not
es:
1. †
Som
e or
all
futu
re t
each
ers
in t
his
cou
ntr
y ar
e be
ing
prep
ared
to
teac
h p
rim
ary
and
low
er-s
econ
dary
stu
den
ts. T
he
prog
ram
-gro
ups
pre
pari
ng
futu
re p
rim
ary
teac
her
s an
d t
he
prog
ram
-gr
oups
pre
pari
ng
low
er-s
econ
dary
tea
cher
s ar
e th
eref
ore
part
ly o
r fu
lly o
verl
appi
ng
(see
th
e T
ED
S-M
tec
hn
ical
rep
ort)
.
2. W
hen
rea
din
g th
is t
able
, kee
p in
min
d th
e lim
itat
ion
s an
not
ated
on
pag
e 96
an
d de
not
ed in
th
e ta
ble
abov
e by
foot
not
e le
tter
s.
3. T
he
shad
ed a
reas
iden
tify
dat
a th
at, f
or r
easo
ns
expl
ain
ed in
th
ese
limit
atio
ns,
can
not
be
com
pare
d w
ith
con
fide
nce
to
data
from
oth
er c
oun
trie
s.
Top
10
% o
f To
p 2
0% o
f A
bov
e-A
vera
ge
Ach
ieve
rs
Ave
rag
e A
chie
vers
Be
low
-Ave
rag
e A
chie
vers
W
ell-B
elow
-Ave
rag
e
Ag
e G
roup
A
ge
Gro
up
for
Ag
e G
roup
fo
r A
ge
Gro
up
for
Ag
e G
roup
A
chie
vers
fo
r A
ge
Gro
up
Est.
(S
E)
Est.
(S
E)
Est.
(S
E)
Est.
(S
E)
Est.
(S
E)
Est.
(S
E)
Gro
up 5
. Lo
wer
Sec
onda
ry(t
o G
rade
10
Max
imum
)
Gro
up 6
. Lo
wer
and
Upp
er
Seco
ndar
y(t
o G
rade
11
& a
bove
)

THE TEACHER EDUCATION AND DEVELOPMENT STUDY IN MATHEMATICS (TEDS-M)106
Examination of the data on the relative emphasis that institutions give to specific areas
of their teacher education programs—as indicated by the number of hours allocated
to each—revealed that programs generally offer courses in four areas: (a) liberal arts,
(b) mathematics and related content (academic mathematics, school mathematics,
mathematics pedagogy), (c) educational foundations, and (d) pedagogy.1
Strong emphasis was defined as the allocation of 500 or more class hours over the
duration of the program to a particular area. Exhibits A4.1 and A4.2 in Appendix A
summarize the mean number of teaching contact hours in liberal arts, academic
mathematics, and school mathematics curriculum courses. Exhibits A4.3 and A4.4 (also
in Appendix A) present the mean number of teaching-contact hours in mathematics
pedagogy, foundations, and general pedagogy courses by country and by program-
group.
Overall, the IPQ responses revealed programs giving greater emphasis to academic and
school curriculum mathematics if their future teachers intended to teach mathematics
as specialists. This trend was particularly marked if the future teachers were those
intending to teach in secondary school. A high degree of variability across countries was
found in other content areas, including mathematics pedagogy and general pedagogy.
4.2.4.1 Liberal arts courses
Programs reporting strong emphasis on the liberal arts were found in Georgia, the
Russian Federation in Program-Group 1, Spain in Program-Group 2, and Chile in
Program-Group 3. Switzerland in Program-Group 1 and the United States in Program-
Group 2 came close to the cutoff point. On average, the two countries were allocating
493 and 492 hours respectively to liberal arts. The primary-specialist program-groups
had no means higher than 500. Of the secondary-level program-groups, those in Chile
(1,393 hours) and Switzerland (832 hours) in Program-Group 5 and Botswana (630
1 Definitions of areas*
• Liberal arts courses (except mathematics): theoretical or general courses designed to develop an understanding of the natural and social sciences, the humanities, languages, drama, music, art, philosophy, and religion, among others. In general these courses do not address professional curricula.
• Academic mathematics courses: courses that aim to provide mathematics knowledge to a population of university students that may or may not include future teachers, and are designed to treat content beyond the mathematics learned at the secondary school level, that is, mathematics at the university level (e.g., abstract algebra, functional analysis, differential equations, etc.).
• Mathematics content related to the school mathematics curriculum courses: these deal mainly with the structure, sequence, content, and level of competence required for students to successfully learn from the school mathematics curriculum (primary or secondary levels). Examples of such courses are “structure and content of the lower-secondary mathematics curriculum,” and “development and understanding of the school mathematics curriculum.”
• Mathematics pedagogy courses: courses dealing with the methods of teaching and learning mathematics (e.g., mathematics pedagogy, didactics of mathematics). These courses might include content on learner cognition (e.g., how one learns mathematics) or learners’ thinking in relation to mathematics concepts. Examples of such types of courses include “learner diversity” and the “teaching of mathematics,” and the “teaching of primary and middle-school mathematics.”
• Professional foundations and theory courses: these include the study of education, in terms of such disciplines as history, philosophy, sociology, psychology, social psychology, anthropology, economics, and political science. They also include interdisciplinary fields, such as comparative and international education, multicultural education, and community and adult education, along with many others.
• General pedagogy courses: courses on the art or science of teaching with a focus on the proper use of teaching strategies. Such courses also include the study of associations between teaching strategies, the instructor’s own philosophical beliefs of teaching, and school-students’ background knowledge and experiences, personal situations, and the social and classroom environment. Another facet of these courses involves preparation on setting learning goals.
Source: *Merriam-Webster Dictionary: http://www.merriam-webster.com/dictionary/liberal%20arts
107CHARACTERISTICS Of TEACHER EDUCATION PROGRAMS, TEACHER EDUCATORS, AND fUTURE TEACHERS
hours) and the Russian Federation (1,468 hours) in Group 6 were dedicating more than 500 hours to courses in the liberal arts. The United States mean, at 499 hours, was very close to the cutoff point. Many programs across countries were in the 100 to 500 hours range.
4.2.4.2 Academic mathematics
Among the four primary program-groups, only the Russian Federation in Group 1 and Poland in Group 4 (primary mathematics specialists) were allocating an average of more than 400 teaching hours to academic mathematics. Thailand in Group 4 was allocating more than 300 hours, while Georgia (Group 1), Singapore (Group 2), and Chile and Norway (Group 3) were allocating an average of more than 200 contact hours to academic mathematics. Programs in the other countries had averages of fewer than 200 hours.
In Program-Group 5, which included programs preparing future teachers to teach lower- secondary school up to Grade 10, the emphasis on academic mathematics ranged from no hours in Singapore to an average of 292 hours in Switzerland. The exception was Poland, which reported an average of 666 hours of academic mathematics. In Program-Group 6, which included programs preparing teachers for lower- and upper-secondary schools, there was a greater emphasis on academic mathematics, with programs in Botswana, Chinese Taipei, Georgia, Malaysia, and Oman allocating, on average, over 500 hours to that area. Poland and the Russian Federation were allocating an average of 1,310 and 1,857 hours, respectively. The lowest average time allocations for academic mathematics in Program-Group 5 were evident in Norway PPU and Master’s (134 hours), Thailand (343 hours), and the United States (442 hours).
4.2.4.3 Mathematics content related to the school mathematics curriculum
Most of the four primary program-groups reported spending, on average, fewer than 100 contact hours in this area, with the exception of Georgia and the Russian Federation in Group 1, Chile and Norway in Group 3, and Malaysia and Thailand in Group 4. These programs reported providing more than 100 but fewer than 400 contact hours in this area. Only the Russian Federation and Norway (PPU and Master’s) were allocating, on average, more than 350 teaching contact hours to mathematics content related to the school mathematics curriculum.
In the lower-secondary group, Group 5, the emphasis given to school mathematics was low in the Philippines, Poland, Singapore, Switzerland, and the United States. All five countries reported averages of fewer than 100 contact hours. Only programs in Botswana and Chile averaged more than 100 hours; Norway was allocating more than 350 hours in its ALU and ALU plus mathematics programs. The only country allocating more than 400 hours to this area in its lower- and upper-secondary program (Program-Group 6) was Botswana, followed closely by the Russian Federation, with 380 hours. Chinese Taipei, Poland, Singapore, and the United States were all allocating fewer than 100 hours to this area.
4.2.4.4 Mathematics pedagogy
All of the programs in primary Program-Groups 1 to 4, except those in Norway and the Russian Federation, reported spending fewer than 200 teaching-contact hours on mathematics pedagogy. A number of countries in Program-Groups 1 and 2 reported very low averages: Poland (37) and Switzerland (98) in Group 1, and Chinese Taipei

THE TEACHER EDUCATION AND DEVELOPMENT STUDY IN MATHEMATICS (TEDS-M)108
(22), the Philippines (58), Switzerland (76), and the United States (63) in Program-
Group 2. The average number of hours in this area was greater than 100 in Program-
Groups 3 and 4, with the exception of programs in the United States, which reported an
average of 52 hours in Program-Group 4.
In the lower-secondary program-group, Group 5, the means ranged from as low as
52 hours in the United States to 163 in Switzerland; only programs in Norway were
allocating more than 300 hours to this area. In Program-Group 6, containing programs
that prepare future teachers to teach lower- and upper-secondary classes to Grade 11
and above, only Botswana and the Russian Federation reported allocating more than
200 hours to this area of study. For most other countries, the average number of hours
reported ranged from 100 to 138. However, Chinese Taipei and the United States
reported the lowest mean contact hours—95 and 72, respectively.
4.2.4.5 Foundations courses
Most of the primary program-groups were allocating at least 100 teaching hours to
this area. Means greater than 400 were found in Poland, the Russian Federation, and
Switzerland in Group 1, in Switzerland in Group 2, and in Chile in Group 3. The
Philippines and Singapore in Group 2 and Poland, Singapore, and the United States in
Group 4 were all allocating fewer than 100 hours to foundations courses.
We found considerable cross-national variation with respect to foundations courses
in the secondary program-groups. In Program-Group 5, Botswana, the Philippines,
Poland, Singapore, and the United States were allocating fewer than 100 hours to this
area. The rest were allocating more than 100 contact hours to the study of foundations,
with Switzerland and Norway showing means ranging from close to 200 to close to 300
contact hours. The exception in this program-group was Chile, which was allocating
more than 500 contact hours to this area. In Program-Group 6, a large number
of countries were allocating more than 100 hours, but fewer than 400. The Russian
Federation in Group 6 was allocating more than 600 hours. In Program-Group 6,
Poland and Singapore were allocating fewer than 100 hours.
4.2.4.6 General pedagogy courses
Primary program-groups reported devoting a substantial number of hours to general
pedagogy. Only five programs reported allocating fewer than 100 hours to this area.
They were the Philippines and Singapore in Group 2, Botswana in Group 3, and
Poland and Singapore in Group 4. The Russian Federation and Switzerland in Group 1
and Chile in Group 3 reported very high coverage—more than 500 hours.
Of the countries offering lower-secondary programs (Group 5), Botswana, the
Philippines, Poland, and Singapore reported allocating fewer than 100 hours to
foundations courses. Chile reported allocating more than 700. In Group 6, most countries
reported allocating more than 100 hours. The countries that said they allocated fewer
than 100 hours were Botswana, Poland, and Singapore.

109CHARACTERISTICS Of TEACHER EDUCATION PROGRAMS, TEACHER EDUCATORS, AND fUTURE TEACHERS
4.2.4.7 Field experiences
For the purposes of TEDS-M, field experience was defined as follows:
• Extended teaching practice, with two weeks or more of continuous work in schools
when the main purpose is to prepare and enable future teachers to assume overall
responsibility for teaching a class or classes of students; or as
• Introductory field experiences, for short-term assignments in primary and secondary
schools for various exploratory and preparatory purposes, such as getting to know
schools as organizations and how they work, learning about the work of teachers
and whether they find it an appropriate choice of career, observing and interviewing
students, teachers, and parents, and assisting in teaching tasks in limited and closely
supervised ways.
Although most programs were providing extended teaching practice, we found a high
degree of variation in the percentages of programs within and across countries providing
introductory field experiences, at both the primary and the secondary school levels (see
Exhibit 4.5). Among the primary program-groups, the percentage of programs providing
extended field experience was generally high (over 80%). Countries where more than
50% but fewer than 80% percent of programs reported offering introductory field
experiences at primary school level included Georgia, Poland, the Russian Federation,
and Switzerland in Group 1, Singapore and Switzerland in Group 2, and Botswana
and Norway in Group 3. In Spain, however, only 25% of programs were offering these
experiences. Among the primary specialists, all were close to or above the 80% mark.
Among secondary programs, 75% or more of the Group 5 programs in Chile, the
Philippines, Poland, and the United States were offering extended field experiences.
This was also the case for Group 6 programs in Botswana, Chinese Taipei, Malaysia,
Poland, the Russian Federation, Thailand, and the United States. The extent to which
the remaining programs (in their respective countries) were offering these experiences
varied widely, with the range spanning 0 to 49%.
4.2.5 Graduation Standards and Guidelines
Institutions were asked to specify what requirements future teachers had to meet in order
to successfully complete their programs, and whether the institutions as well as agencies
at national and state levels set prescribed competencies or standards. The findings are
displayed in four exhibits in Appendix A—Exhibits A4.5 and A4.6 for programs at the
primary level and Exhibits A4.7 and A4.8 for those at the secondary level.
The data show that nearly all programs at the primary level across countries require
their future teachers to have passing grades in all courses in order to graduate. The
same applies to the student-teachers’ field experience. Here, graduation relies
on demonstrating an acceptable level of teaching competence in a classroom. A
comprehensive examination of some kind, whether written or oral, is also a common
requirement across institutions. A less frequent requirement is a thesis. The countries
that reported this requirement for most or all of their primary programs were Poland,
the Russian Federation, and Switzerland (Program-Group 1), the Philippines and
Switzerland (Program-Group 2), Botswana (two out of four programs), Chile (most
Group 3 programs), and Poland (many programs in Group 4). Writing and defending
a thesis is a more frequent requirement in secondary Program-Groups 5 and 6. The
countries where this was not the case were Chinese Taipei, Singapore, Norway (PPU
and Master’s), and the United States.

THE TEACHER EDUCATION AND DEVELOPMENT STUDY IN MATHEMATICS (TEDS-M)110
Exhibit 4.5: Field experiences offered in teacher education programs (estimated percent)
Program-Group Country Extended Teaching Practice Introductory Field Experience
Georgia 9 100.0 (0.0) 8 75.0 (15.3)
Polandf 86 93.0 (1.6) 86 67.4 (5.5)
Russian federationg 45 100.0 (0.0) 42 76.2 (16.5)
Switzerlandi 7 100.0 (0.0) 7 71.4 (17.5)
Chinese Taipeia 11 100.0 (0.0) 11 94.6 (5.1)
Philippinese 30 84.5 (10.6) 30 96.7 (2.5)
Singapore 4 100.0 (0.0) 4 50.0 (23.6)
Spainh 48 100.0 (0.0) 39 24.7 (4.7)
Switzerlandi 14 100.0 (0.0) 14 78.6 (7.1)
United Statesj 54 100.0 (0.0) 53 100.0 (0.0)
botswana 4 100.0 (0.0) 4 50.0 (35.4)
Chile† 30 96.7 (3.3) 28 96.4 (3.6)
Norway (ALU)†c 16 100.0 (0.0) 15 73.3 (13.0)
Norway (ALU+)†c 16 100.0 (0.0) 16 62.5 (12.5)
Malaysiab 9 66.7 (7.4) 11 90.9 (9.2)
Poland†f 39 100.0 (0.0) 39 79.5 (6.4)
Singapore 2 100.0 (0.0) 2 0.0 (0.0)
Thailand† 48 100.0 (0.0) 49 100.0 (0.0)
United States†j 15 100.0 (0.0) 15 93.2 (7.8)
botswana 2 100.0 (0.0) 2 50.0 (55.6)
Chile† 37 97.6 (2.4) 35 97.4 (2.6)
Norway (ALU)†c 16 100.0 (0.0) 15 73.3 (13.0)
Norway (ALU+)†c 16 100.0 (0.0) 16 62.5 (12.5)
Philippinese 43 90.0 (6.4) 40 94.6 (2.3)
Poland†f 21 100.0 (0.0) 21 76.2 (8.3)
Singapore 2 100.0 (0.0) 2 0.0 (0.0)
Switzerlandi 6 100.0 (0.0) 7 71.4 (20.2)
United States†j 15 100.0 (0.0) 15 93.2 (7.8)
botswana 1 100.0 (0.0) 1 100.0 (0.0)
Chinese Taipeia 8 100.0 (0.0) 8 100.0 (0.0)
Georgia 6 100.0 (0.0) 6 0.0 (0.0)
Malaysiab 8 100.0 (0.0) 8 100.0 (0.0)
Norway (PPU & Master’s)c 11 63.1 (13.1) 11 17.9 (12.7)
Omand 8 87.5 (12.5) 6 33.3 (19.8)
Polandf 18 100.0 (0.0) 18 83.3 (9.7)
Russian federationg 42 100.0 (0.0) 41 75.6 (5.5)
Singapore 2 100.0 (0.0) 2 0.0 (0.0)
Thailand† 48 100.0 (0.0) 49 100.0 (0.0)
United Statesj 44 98.2 (1.9) 44 100.0 (0.0)
Notes:
1. † Some or all future teachers in this country are being prepared to teach primary and lower-secondary students. The program- groups preparing future primary teachers and the program-groups preparing lower-secondary teachers are therefore partly or fully overlapping (see the TEDS-M technical report).
2. When reading this table, keep in mind the limitations annotated on page 96 and denoted in the table above by footnote letters.
3. The shaded areas identify data that, for reasons explained in the list of limitations, cannot be compared with confidence to data from other countries.
n Est. (SE) n Est. (SE)
Group 1. Lower Primary (to Grade 4 Maximum)
Group 2. Primary to Grade 6 Maximum)
Group 3. Primary and Secondary Generalists (to Grade 10 Maximum)
Group 4. Primary Mathematics Specialists
Group 5. Lower Secondary(to Grade 10 Maximum)
Group 6. Lower and Upper Secondary(to Grade 11 & above)

111CHARACTERISTICS Of TEACHER EDUCATION PROGRAMS, TEACHER EDUCATORS, AND fUTURE TEACHERS
4.2.5.1 Origins of policy guidelines
Most of the guidelines regarding competencies or standards for graduation across the
program-groups originate with the state or provincial government, the institution
where the program is located, or a combination of both. Table A4.9 in Appendix A
summarizes information about where the locus of control of standards for teacher
education resides in the participating countries.
4.3 Teacher Educator Background and Characteristics
Teacher educators were defined as persons with regular, repeated responsibility for
teaching future teachers within a teacher-preparation program. (For more detail on
definitions see Tatto et al., 2008.) Within the context of TEDS-M, teacher educators
were classified into three groups, as follows:
A. Mathematics and mathematics pedagogy educators: those responsible for teaching
one or more required courses in mathematics or mathematics pedagogy during
the TEDS-M data collection year at any stage of the teacher preparation program;
B. General pedagogy educators: those responsible for teaching one or more required
courses in foundations or general pedagogy (other than a mathematics or
mathematics pedagogy course) during the data collection year at any stage of the
teacher preparation program; and
C. Educators belonging to both of the above groups: those responsible for teaching
one or more required courses in mathematics, mathematics pedagogy, or general
pedagogy during the data collection year at any stage of the teacher preparation
program.
The results displayed in the exhibits in this section of the chapter and discussed in the
accompanying text must be considered in the light of a number of limitations on the
data for particular countries, set out in the following panel.
Limitation annotations for teacher educator data
a. Chile: the combined participation rate was 54%.
b. Germany: the combined participation rate was 56%; the surveys of institutions and future teachers
have no connection with the survey of educators.
c. Malaysia: the combined participation rate was 57%.
d. Oman: the only data provided at the time of testing were secondary teacher education data.
e. Poland: the combined participation rate was between 60 and 75%; institutions with consecutive
programs only were not covered.
f. Russian Federation: the secondary pedagogical institutions were not covered.
g. Spain: only primary teacher education was covered.
h. Switzerland: the combined participation rate was 52%. The only institutions covered were those
where German is the primary language of use and instruction.
Note: Data from Canada, Norway, and the United States were deemed unacceptable. According to IEA standards, low participation rates are <60%. For more information, see the TEDS-M technical report (Tatto, 2012).

THE TEACHER EDUCATION AND DEVELOPMENT STUDY IN MATHEMATICS (TEDS-M)112
4.3.1 Teacher Educator Samples
Exhibit B.6 in Appendix B shows the makeup of the TEDS-M teacher educator sample. It included 7,398 teacher educators, of whom 5,190 provided usable data. The exhibit also shows how the teacher educators were distributed across countries. The teacher educator response rate was the lowest among the various TEDS-M surveys. Because of this, the TEDS-M research team considered that only 10 of the participating countries had data sufficiently reliable to be reported. The excluded countries were Canada, Norway, and the United States (combined participation rates below 30%). The data for Chile, Germany, and Malaysia are shaded in the following exhibits in order to highlight the increased likelihood of bias due to low response rates. (For more detail on sampling, see Tatto, 2012.)
4.3.1.1 Distribution of teacher educators by discipline taught
It was not possible to draw separate samples for teacher educators teaching primary programs and those teaching secondary programs because teacher educators commonly teach across levels and, in some cases, across disciplines. Exhibit 4.6 shows the distribution of educators by country and by discipline. The three discipline-based categories used were those stated earlier in this chapter—mathematics and mathematics pedagogy (Category A), general pedagogy (Category B), and both preceding categories combined (Category C).
Of the total teacher-educator sample, the smallest proportion included teacher educators teaching in both main areas, A and B. The rest of the sample was distributed between the two other groups: those teaching mathematics or mathematics pedagogy courses, and those teaching general pedagogy. Certain patterns are worth noticing. In Georgia, Oman, Poland, and the Russian Federation, a majority of teacher educators
were teaching only mathematics or mathematics pedagogy courses.
Exhibit 4.6: Disciplines taught by teacher educators (estimated percent)
Country n A. Mathematics and B. General Pedagogy C. Both Areas Mathematics Pedagogy A and B
botswana 43 36.4 (0.0) 63.6 (0.0) 0.0 (0.0)
Chilea 392 18.0 (0.3) 58.8 (0.6) 23.1 (0.7)
Chinese Taipei 195 40.4 (4.1) 59.0 (4.1) 0.6 (0.2)
Georgia 62 65.6 (1.8) 31.3 (0.3) 3.1 (2.2)
Germanyb 482 12.1 (3.2) 62.0 (5.9) 25.9 (4.6)
Malaysiac 255 59.1 (0.1) 13.4 (0.0) 27.5 (0.1)
Omand 84 62.1 (0.1) 35.9 (0.1) 1.9 (0.0)
Philippines 589 29.5 (3.0) 46.0 (5.9) 24.5 (5.4)
Polande 734 64.9 (0.3) 32.7 (0.2) 2.4 (0.1)
Russian federationf 1,212 76.7 (2.4) 20.6 (1.9) 2.7 (0.9)
Singapore 77 33.0 (0.0) 67.0 (0.0) 0.0 (0.0)
Spaing 533 20.8 (0.7) 76.1 (2.2) 3.1 (2.4)
Switzerlandh 220 18.5 (0.5) 81.3 (0.4) 0.2 (0.2)
Thailand 312 39.0 (0.1) 36.3 (0.1) 24.8 (0.1)
Notes:
1. When reading this table, keep in mind the limitations annotated on page 111 and denoted in the table above by footnote letters.
2. The shaded areas identify data that, for reasons explained in these limitations, cannot be compared with confidence to data from other countries.
Est. (SE) Est. (SE) Est. (SE)

113CHARACTERISTICS Of TEACHER EDUCATION PROGRAMS, TEACHER EDUCATORS, AND fUTURE TEACHERS
In contrast, in Botswana, Chile, Chinese Taipei, Germany, Singapore, Spain, and
Switzerland, a large proportion of the teacher educators were teaching only general
pedagogy courses. In the Philippines and Thailand, teacher educators were more evenly
distributed across the three groups.
4.3.1.2 Gender of teacher educators
Exhibit 4.7 shows the gender distribution of teacher educators by country and by
courses taught. Of those teaching mathematics or mathematics pedagogy courses,
60% or more were males in Chinese Taipei, Georgia, Germany, Oman, Singapore,
and Switzerland. More females than males were teaching pedagogy in the majority of
countries. The exceptions were Oman, Chinese Taipei, Malaysia, and Switzerland. Of
the comparatively few educators with teaching responsibilities in both main areas (i.e.,
educators teaching mathematics, mathematics pedagogy, and general pedagogy), 50%
or more were females, except in Chile, Germany, and Switzerland.
Exhibit 4.7: Gender of teacher educators by disciplines taught (estimated percent female)
botswana 16 43.8 (14.0) 27 58.9 (9.9)
Chilea 82 55.4 (4.6) 245 49.7 (3.0) 54 47.1 (8.3)
Chinese Taipei 81 23.5 (8.1) 103 41.4 (5.3) 2 50.0 (55.6)
Georgia 41 38.1 (7.4) 20 85.0 (8.7) 1 100.0 (0.0)
Germanyb 109 15.6 (3.7) 219 60.7 (4.1) 140 42.3 (11.8)
Malaysiac 163 51.8 (4.2) 21 25.3 (6.9) 68 50.4 (6.2)
Omand 50 5.4 (2.9) 28 2 100.0 (0.0)
Philippines 193 53.9 (4.8) 277 74.5 (6.2) 116 71.3 (5.5)
Polande 449 40.9 (2.9) 248 78.2 (2.9) 24 80.0 (9.4)
Russian federationf 894 70.1 (2.1) 270 84.9 (2.8) 17 98.4 (1.7)
Singapore 25 32.0 (6.9) 52 63.5 (6.4)
Spaing 120 45.6 (5.8) 400 55.8 (2.0) 13 70.7 (4.4)
Switzerlandh 48 33.3 (5.8) 157 37.5 (2.5) 1 0.0 (0.0)
Thailand 121 53.6 (4.9) 115 48.2 (4.8) 73 53.3 (6.4)
Notes:
1. When reading this table, keep in mind the limitations annotated on page 111 and denoted in the table above by footnote letters.
2. The shaded areas identify data that, for reasons explained in these limitations, cannot be compared with confidence to data from other countries.
n Est. (SE) n Est. (SE) n Est. (SE)
Country A. Mathematics and B. General Pedagogy C. Teacher Educators of Mathematics Pedagogy Teacher Educators Both Areas Teacher Educators A. and B.

THE TEACHER EDUCATION AND DEVELOPMENT STUDY IN MATHEMATICS (TEDS-M)114
4.3.2 Academic and Professional Qualifications of Teacher Educators
Teacher educators were asked to provide information about their academic and professional qualifications, their academic rank, and their area of specialization. There was particular interest in determining the extent of their backgrounds in mathematics, mathematics education, and education. The educators’ responses are summarized in Exhibits A4.10, A4.11, and A4.12, in Appendix A.
4.3.2.1 Qualifications in mathematics
A large proportion (60% or more) of the mathematics and mathematics pedagogy educators in Chinese Taipei, Georgia, Germany, Oman, and Poland held doctoral degrees in mathematics. In the other countries, fewer than half of the educators held doctoral degrees. Among the teacher educators teaching in the general pedagogy area, only small proportions reported having a post-graduate degree in mathematics. Teacher educators teaching in both main areas reported relatively low proportions of doctoral-level qualifications in mathematics. The highest proportions of Master’s degrees (close to 69% and 58%, respectively) were found among mathematics and mathematics pedagogy educators in Spain and Botswana. They were followed by the Russian Federation, Thailand, and the Philippines (with close to 53, 52, and 43%, respectively).
4.3.2.2 Qualifications in mathematics education
Exhibit A4.11 in Appendix A shows the proportions of educators whose highest degree was in the field of mathematics education. Over 80% of the mathematics and mathematics pedagogy educators in Botswana, followed by those in the Philippines and Singapore, held a Master’s degree in one of these fields. Among the mathematics and mathematics pedagogy educators, fewer than 50% in all cases held a doctoral degree in mathematics education, with the highest proportion being in Georgia (42%). The range in the other countries was 6 to 31%. In Spain, the Russian Federation, Singapore, and Chinese Taipei, the percentages of teacher educators who were teaching mathematics and mathematics pedagogy and who had a doctoral degree in mathematics education ranged from 23.9 to 31%. A small proportion of teacher educators who were teaching in the general pedagogy area reported having a doctoral degree in mathematics education. The only countries in which more than 20% of the teacher educators who were teaching in both main areas held a doctoral degree in mathematics education were the Russian Federation and Thailand.
4.3.2.3 Qualifications in education
Exhibit A4.12 shows the highest degree that teacher educators earned in the field of education. Botswana, Chile, and the Russian Federation had the highest proportions of mathematics and mathematics educators (about 50%) with Master’s degrees in education. A significant proportion of general pedagogy teacher educators in Botswana (close to 90%) and Thailand (close to 68%) had a Master’s degree in education. The highest proportions of educators who had teaching responsibilities in both main areas and possessed a Master’s degree in education were found in Thailand (50.2%), Malaysia (50%), Chile (close to 49%), and the Philippines (48.5%).
A minority (18% or fewer) of mathematics and mathematics pedagogy educators in Chinese Taipei, Georgia, Oman, the Philippines, Poland, and Spain held doctoral degrees in education. Of the general pedagogy teacher educators in Chinese Taipei, Georgia, Oman,
Poland, and the Russian Federation, more than 60% had doctoral degrees in education.
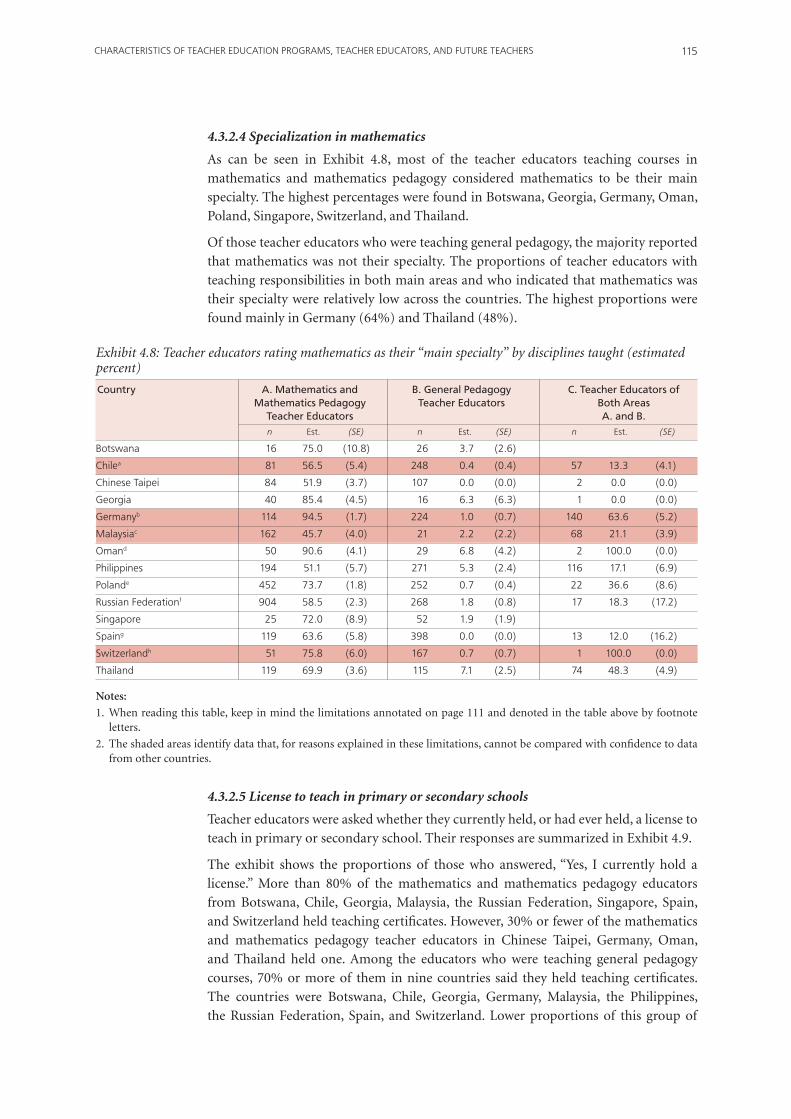
115CHARACTERISTICS Of TEACHER EDUCATION PROGRAMS, TEACHER EDUCATORS, AND fUTURE TEACHERS
4.3.2.4 Specialization in mathematics
As can be seen in Exhibit 4.8, most of the teacher educators teaching courses in
mathematics and mathematics pedagogy considered mathematics to be their main
specialty. The highest percentages were found in Botswana, Georgia, Germany, Oman,
Poland, Singapore, Switzerland, and Thailand.
Of those teacher educators who were teaching general pedagogy, the majority reported
that mathematics was not their specialty. The proportions of teacher educators with
teaching responsibilities in both main areas and who indicated that mathematics was
their specialty were relatively low across the countries. The highest proportions were
found mainly in Germany (64%) and Thailand (48%).
Exhibit 4.8: Teacher educators rating mathematics as their “main specialty” by disciplines taught (estimated percent)
Country A. Mathematics and B. General Pedagogy C. Teacher Educators of Mathematics Pedagogy Teacher Educators Both Areas Teacher Educators A. and B.
botswana 16 75.0 (10.8) 26 3.7 (2.6)
Chilea 81 56.5 (5.4) 248 0.4 (0.4) 57 13.3 (4.1)
Chinese Taipei 84 51.9 (3.7) 107 0.0 (0.0) 2 0.0 (0.0)
Georgia 40 85.4 (4.5) 16 6.3 (6.3) 1 0.0 (0.0)
Germanyb 114 94.5 (1.7) 224 1.0 (0.7) 140 63.6 (5.2)
Malaysiac 162 45.7 (4.0) 21 2.2 (2.2) 68 21.1 (3.9)
Omand 50 90.6 (4.1) 29 6.8 (4.2) 2 100.0 (0.0)
Philippines 194 51.1 (5.7) 271 5.3 (2.4) 116 17.1 (6.9)
Polande 452 73.7 (1.8) 252 0.7 (0.4) 22 36.6 (8.6)
Russian federationf 904 58.5 (2.3) 268 1.8 (0.8) 17 18.3 (17.2)
Singapore 25 72.0 (8.9) 52 1.9 (1.9)
Spaing 119 63.6 (5.8) 398 0.0 (0.0) 13 12.0 (16.2)
Switzerlandh 51 75.8 (6.0) 167 0.7 (0.7) 1 100.0 (0.0)
Thailand 119 69.9 (3.6) 115 7.1 (2.5) 74 48.3 (4.9)
Notes:
1. When reading this table, keep in mind the limitations annotated on page 111 and denoted in the table above by footnote letters.
2. The shaded areas identify data that, for reasons explained in these limitations, cannot be compared with confidence to data from other countries.
n Est. (SE) n Est. (SE) n Est. (SE)
4.3.2.5 License to teach in primary or secondary schools
Teacher educators were asked whether they currently held, or had ever held, a license to
teach in primary or secondary school. Their responses are summarized in Exhibit 4.9.
The exhibit shows the proportions of those who answered, “Yes, I currently hold a
license.” More than 80% of the mathematics and mathematics pedagogy educators
from Botswana, Chile, Georgia, Malaysia, the Russian Federation, Singapore, Spain,
and Switzerland held teaching certificates. However, 30% or fewer of the mathematics
and mathematics pedagogy teacher educators in Chinese Taipei, Germany, Oman,
and Thailand held one. Among the educators who were teaching general pedagogy
courses, 70% or more of them in nine countries said they held teaching certificates.
The countries were Botswana, Chile, Georgia, Germany, Malaysia, the Philippines,
the Russian Federation, Spain, and Switzerland. Lower proportions of this group of

THE TEACHER EDUCATION AND DEVELOPMENT STUDY IN MATHEMATICS (TEDS-M)116
educators held certificates in Chinese Taipei (close to 46%), Poland (close to 55%), and
Singapore (close to 65%). Of those educators with teaching responsibilities in both main
areas, large percentages in Chile, Germany, the Philippines, the Russian Federation, and
Poland reported holding teaching licenses.
4.4 Future Teachers’ Backgrounds and Characteristics
As stated earlier in this report, future teachers were defined as students enrolled in
teacher education programs designed to prepare them to teach mathematics at the
primary or lower-secondary school levels. (For more detail on definitions, see Tatto
et al., 2008.) TEDS-M found that most lower-secondary teacher education programs
also prepare teachers for upper secondary; this is the group called Program-Group 6
throughout this report. Exhibits B.4 and B.5 in Appendix B provide details about the
composition of the TEDS-M sample of future teachers and how they were distributed
across the participating countries. Valid data were obtained from 13,871 future primary
teachers and 8,207 future secondary teachers. (For more detail on sampling, see Tatto,
2012.)
In this section of the chapter, all of the results displayed in the exhibits and in the
accompanying discussion must be read with reference to a number of limitations on
the data from particular countries. These limitations are listed below in two parts. The
first pertains to the future primary teacher data, and the second to the future lower-
secondary teacher data.
Exhibit 4.9: Teacher educators who hold teaching certification by disciplines taught (estimated percent)
Country A. Mathematics and B. General Pedagogy C. Teacher Educators of Mathematics Pedagogy Teacher Educators Both Areas Teacher Educators A. and B.
botswana 16 93.8 (6.3) 26 77.8 (7.9)
Chilea 82 94.0 (2.4) 247 82.8 (2.3) 55 93.2 (3.6)
Chinese Taipei 85 29.4 (12.2) 107 45.7 (2.6) 2 50.0 (55.6)
Georgia 40 97.6 (2.4) 20 95.0 (5.0) 1 100.0 (0.0)
Germanyb 114 11.6 (3.8) 225 89.1 (4.5) 141 90.8 (3.1)
Malaysiac 163 90.6 (1.9) 21 78.8 (14.1) 68 58.3 (5.6)
Omand 47 22.3 (6.2) 28 57.6 (9.0) 2 100.0 (0.0)
Philippines 194 69.8 (5.2) 275 69.9 (4.8) 116 80.3 (7.5)
Polande 444 67.0 (2.4) 252 54.9 (2.5) 24 82.2 (6.1)
Russian federationf 912 83.6 (2.0) 275 98.1 (0.9) 17 100.0 (0.0)
Singapore 25 84.0 (5.7) 51 64.7 (6.8)
Spaing 119 93.0 (2.4) 394 75.2 (3.3) 13 70.7 (4.4)
Switzerlandh 48 96.3 (2.6) 162 89.2 (2.5) 1 100.0 (0.0)
Thailand 119 30.3 (4.2) 111 29.2 (4.5) 72 32.4 (5.8)
Notes:
1. When reading this table, keep in mind the limitations annotated on page 111 and denoted in the table above by footnote letters.
2. The shaded areas identify data that, for reasons explained in these limitations, cannot be compared with confidence to data from other countries.
n Est. (SE) n Est. (SE) n Est. (SE)

117CHARACTERISTICS Of TEACHER EDUCATION PROGRAMS, TEACHER EDUCATORS, AND fUTURE TEACHERS
Limitation annotations for future primary teacher data
a. Botswana: the sample size was small (n = 86), but it arose from a census of a small population. b. Chile: combined participation rate was between 60 and 75%. c. Norway: the combined participation rate was between 60 and 75%. An exception was made to accept
data from one institution because one additional participant would have brought the response rate to above the 50% threshold. Program types ALU and ALU plus mathematics are reported separately because the two populations partly overlap; data from these program types cannot therefore be aggregated.
d. Poland: the combined participation rate was between 60 and 75%. The institutions not covered were those providing consecutive programs only.
e. Russian Federation: the secondary pedagogical institutions were not covered. f. Switzerland: the only institutions covered were those where German is the primary language of use
and instruction. g. United States: only public institutions were covered. The combined participation rate was between
60 and 75%. An exception was made to accept data from two institutions because, in each case, one additional participant would have brought the response rate to above the 50% threshold. Although the participation rate for the complete sample met the required standard, the data contain records that were collected via a telephone interview. This method was used when circumstances did not allow administration of the full questionnaire. Of the 1,501 recorded participants, 1,185 received the full questionnaire. Bias may be evident in the data because of the significant number of individuals who were not administered the full questionnaire.
Note: Data from Canada were unacceptable. Germany did not authorize reporting of the IPQ data. According to IEA standards, low participation rates are < 60%. For more information, see the TEDS-M technical report (Tatto, 2012).
Limitation annotations for future lower-secondary teacher data
a. Botswana: the sample size was small (n = 53), but it arose from a census of a small population. b. Chile: the combined participation rate was between 60 and 75%. c. Georgia: the combined participation rate was between 60 and 75%; an exception was made to accept
data from two institutions because, in each case, one additional participant would have brought the response rate to above the 50% threshold.
d. Norway: the combined participation rate was 58%. Program types ALU, ALU plus mathematics, and Master’s are reported separately because the populations partly overlap; data from these program types cannot therefore be aggregated.
e. Poland: the combined participation rate was between 60 and 75%. The institutions not covered were those providing consecutive programs only.
f. Russian Federation: an unknown percentage of surveyed future teachers were already certificated primary teachers.
g. Switzerland: the only institutions covered were those where German is the primary language of use and instruction.
h. United States: only public institutions were covered. The combined participation rate was between 60 and 75%. An exception was made to accept data from one institution because one additional participant would have brought the response rate to above the 50% threshold. Although the participation rate for the complete sample met the required standard, the data contain records that were completed via a telephone interview. This method was used when circumstances did not allow administration of the full questionnaire. Of the 607 recorded participants, 502 received the full questionnaire. Bias may be evident in the data because of the significant number of individuals who were not administered the full questionnaire.
Note: Data from Canada were unacceptable. Germany did not authorize reporting of the IPQ data. According to IEA standards, low participation rates are < 60%. For more information, see the TEDS-M technical report (Tatto, 2012).
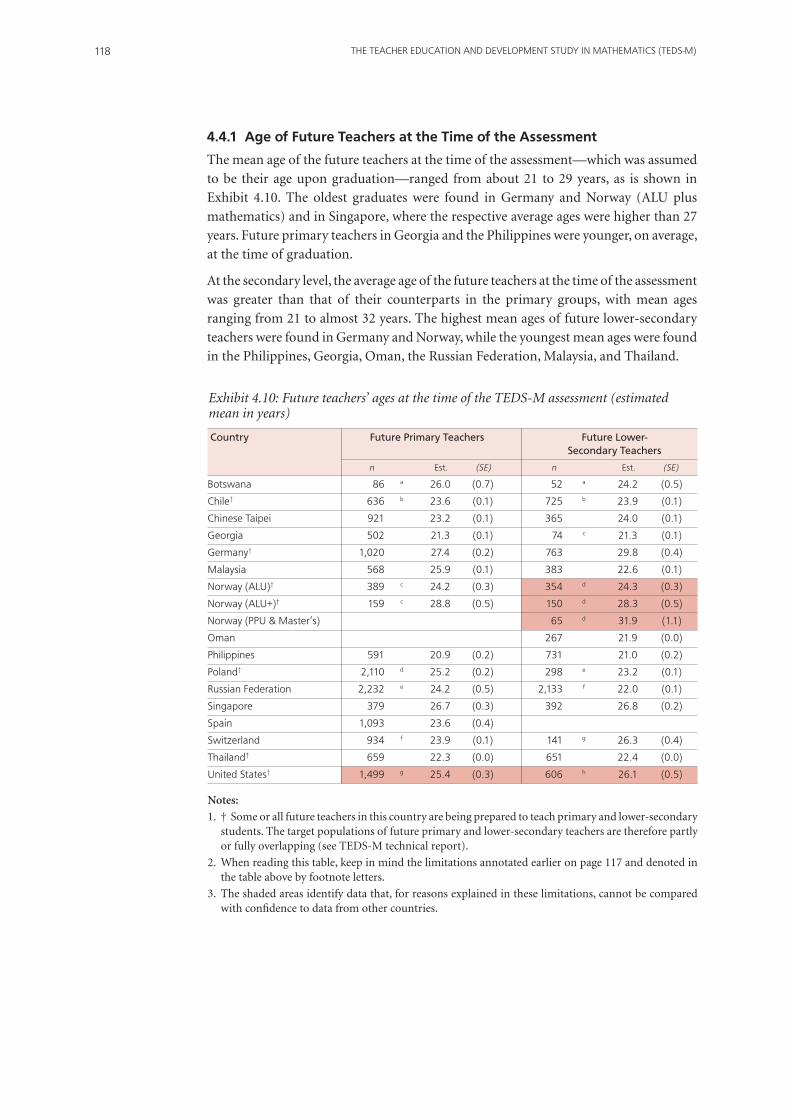
THE TEACHER EDUCATION AND DEVELOPMENT STUDY IN MATHEMATICS (TEDS-M)118
4.4.1 Age of Future Teachers at the Time of the Assessment
The mean age of the future teachers at the time of the assessment—which was assumed
to be their age upon graduation—ranged from about 21 to 29 years, as is shown in
Exhibit 4.10. The oldest graduates were found in Germany and Norway (ALU plus
mathematics) and in Singapore, where the respective average ages were higher than 27
years. Future primary teachers in Georgia and the Philippines were younger, on average,
at the time of graduation.
At the secondary level, the average age of the future teachers at the time of the assessment
was greater than that of their counterparts in the primary groups, with mean ages
ranging from 21 to almost 32 years. The highest mean ages of future lower-secondary
teachers were found in Germany and Norway, while the youngest mean ages were found
in the Philippines, Georgia, Oman, the Russian Federation, Malaysia, and Thailand.
Exhibit 4.10: Future teachers’ ages at the time of the TEDS-M assessment (estimated mean in years)
Country Future Primary Teachers Future Lower- Secondary Teachers
botswana 86 a 26.0 (0.7) 52 a 24.2 (0.5)
Chile† 636 b 23.6 (0.1) 725 b 23.9 (0.1)
Chinese Taipei 921 23.2 (0.1) 365 24.0 (0.1)
Georgia 502 21.3 (0.1) 74 c 21.3 (0.1)
Germany† 1,020 27.4 (0.2) 763 29.8 (0.4)
Malaysia 568 25.9 (0.1) 383 22.6 (0.1)
Norway (ALU)† 389 c 24.2 (0.3) 354 d 24.3 (0.3)
Norway (ALU+)† 159 c 28.8 (0.5) 150 d 28.3 (0.5)
Norway (PPU & Master’s) 65 d 31.9 (1.1)
Oman 267 21.9 (0.0)
Philippines 591 20.9 (0.2) 731 21.0 (0.2)
Poland† 2,110 d 25.2 (0.2) 298 e 23.2 (0.1)
Russian federation 2,232 e 24.2 (0.5) 2,133 f 22.0 (0.1)
Singapore 379 26.7 (0.3) 392 26.8 (0.2)
Spain 1,093 23.6 (0.4)
Switzerland 934 f 23.9 (0.1) 141 g 26.3 (0.4)
Thailand† 659 22.3 (0.0) 651 22.4 (0.0)
United States† 1,499 g 25.4 (0.3) 606 h 26.1 (0.5)
Notes:
1. † Some or all future teachers in this country are being prepared to teach primary and lower-secondary students. The target populations of future primary and lower-secondary teachers are therefore partly or fully overlapping (see TEDS-M technical report).
2. When reading this table, keep in mind the limitations annotated earlier on page 117 and denoted in the table above by footnote letters.
3. The shaded areas identify data that, for reasons explained in these limitations, cannot be compared with confidence to data from other countries.
n Est. (SE) n Est. (SE)
119CHARACTERISTICS Of TEACHER EDUCATION PROGRAMS, TEACHER EDUCATORS, AND fUTURE TEACHERS
4.4.2 Gender
The majority of future teachers at the primary level in all countries were females, and
the same was true for future lower-secondary teachers in most countries. Exhibit 4.11
presents a summary of the relevant data.
In the primary program-groups, the future teachers who were preparing to teach to
Grade 4 maximum—that is, those in Group 1—were most likely to be female. Higher
proportions of males were found in the groups preparing to teach to Grade 6. Among
the future lower-secondary teachers in Program-Groups 5 and 6, more than 50% in
Group 5 in Botswana, Chinese Taipei, and Switzerland were male, as were 50% or more
in Group 6 in Botswana, Singapore, and Norway. Females still predominated (with
over 70%) in Group 5 in Chile, Germany, Poland, Norway, and the United States. The
same can be said for Group 6 in Georgia, Malaysia, Poland, the Russian Federation, and
Thailand.
4.4.3 Future Teachers’ Self-Reported Level of Achievement in Secondary School
To gain a sense of future teachers’ academic achievement in secondary school, the
TEDS-M research team included an item on the questionnaire that asked, “In secondary
school, what was the usual level of marks or grades that you received?” Exhibits A4.13
and A4.14 in Appendix A provide a summary of the future teachers’ responses to this
item.
Among those preparing to teach in the primary grades, a large proportion reported
being “usually near the top of my year level,” or “generally above average for my year
level.” These future teachers included those in Georgia and the Russian Federation in
Program-Group 1, Chinese Taipei, Singapore, Switzerland, and the United States in
Program-Group 2, Botswana, Chile, and Norway in Program-Group 3, and all of the
future teachers in Program-Group 4 (primary mathematics specialists). However, in a
number of countries, many future teachers placed themselves one step lower, within
the range “generally about average for my year level” and “generally below average for
my year level.” This was the case in Germany, Poland, and Switzerland in Program-
Group 1 and in the Philippines and Spain in Program-Group 2. These findings suggest
that programs aimed at training teachers for the higher grades purposefully recruit
candidates who gain high levels of achievement while at secondary school.
Most of the future teachers preparing to teach secondary school reported being either
“always” or “usually near the top” of their class in secondary school; their reported
achievement levels were therefore higher, on average, than the levels that their future
primary teacher counterparts reported. Some exceptions were found among students
in Program-Group 5 in Chile, Germany, and the Philippines. These students placed
themselves within the “generally above average for my year level” and “generally average
for my year level” categories. Larger proportions of those in Program-Group 6 in all
countries other than Thailand and Germany placed themselves either in the “always” or
“usually near the top” categories for their year level.
Very low proportions of future teachers categorized themselves as “generally below
average” for their year level. Overall, these findings show that the higher the grade future
teachers are expected to teach is, the higher their self-reported level of achievement in
secondary school is.

THE TEACHER EDUCATION AND DEVELOPMENT STUDY IN MATHEMATICS (TEDS-M)120
Exh
ibit
4.1
1: G
ende
r of
futu
re te
ache
rs (
esti
mat
ed p
erce
nt fe
mal
e)
Co
untr
y Fu
ture
Pri
mar
y Te
ache
rs
Futu
re L
ow
er-S
eco
nd
ary
Teac
hers
bots
wan
a a
86
59.5
(1
.8)
a
34
43.6
(3
.0)
19
26.3
(5
.3)
Chi
le†
b
65
4 85
.4
(1.5
)
b 74
6 83
.7
(1.6
)
Chi
nese
Tai
pei
923
71.8
(1
.5)
365
38.3
(2
.2)
Geo
rgia
502
100.
0 (0
.0)
c
76
84
.3
(3.8
)
Ger
man
y†
934
93.2
(0
.9)
95
82.3
(6
.2)
40
5 73
.1
(3.1
) 36
2 54
.0
(2.3
)
Mal
aysi
a
56
9 63
.2
(1.4
)
38
6 81
.6
(1.6
)
Nor
way
(ALU
)† c
392
76.2
(1
.9)
d
354
73.9
(2
.4)
Nor
way
(ALU
+)†
c
15
9 67
.9
(3.5
)
d 15
0 62
.7
(4.9
)
Nor
way
(PPU
& M
aste
r’s)
d
65
45
.4
(4.1
)
Om
an
26
8 59
.8
(2.2
)
Phili
ppin
es
591
81.1
(2
.3)
73
1 65
.4
(3.0
)
Pola
nd†
d 1,
811
98.0
(0
.4)
299
77.9
(2
.3)
e 15
8 76
.7
(4.3
) 14
0 74
.1
(4.3
)
Russ
ian
fede
ratio
n e
2,26
0 93
.9
(1.4
)
f
2,13
9 70
.7
(2.1
)
Sing
apor
e
26
3 76
.0
(2.4
)
117
69.9
(3
.6)
14
1 57
.0
(4.4
) 25
1 43
.4
(2.4
)
Spai
n
1,
093
80.5
(1
.4)
Switz
erla
nd
f 12
1 95
.5
(2.0
) 81
5 83
.4
(1.0
)
g
141
42.4
(4
.9)
Thai
land
†
65
9 74
.9
(1.3
)
65
2 75
.1
(1.4
)
Uni
ted
Stat
es†
g
1,30
9 89
.8
(1.6
)
190
82.5
(8
.5)
h 16
9 83
.3
(5.7
) 43
7 62
.8
(2.8
)
Not
es:
1. †
Som
e or
all
futu
re t
each
ers
in t
his
cou
ntr
y ar
e be
ing
prep
ared
to
teac
h p
rim
ary
and
low
er-s
econ
dary
stu
den
ts. T
he
targ
et p
opu
lati
ons
of f
utu
re p
rim
ary
and
low
er-s
econ
dar
y te
ach
ers
are
ther
efor
e pa
rtly
or
fully
ove
rlap
pin
g (s
ee T
ED
S-M
tec
hn
ical
rep
ort)
.
2. W
hen
rea
din
g th
is t
able
, kee
p in
min
d th
e lim
itat
ion
s an
not
ated
ear
lier
on p
age
117
and
den
oted
in t
he
tabl
e ab
ove
by fo
otn
ote
lett
ers.
3. T
he
shad
ed a
reas
iden
tify
dat
a th
at, f
or r
easo
ns
expl
ain
ed in
th
ese
limit
atio
ns,
can
not
be
com
pare
d w
ith
con
fide
nce
to
data
from
oth
er c
oun
trie
s.
Lo
wer
Pri
mar
y Pr
imar
y
Prim
ary
and
Sec
on
dar
y Pr
imar
y M
athe
mat
ics
Low
er S
eco
nd
ary
Lo
wer
an
d U
pp
er S
eco
nd
ary
(t
o G
rad
e 4
Max
imum
) (t
o G
rad
e 6
Max
imum
) (t
o G
rad
e 10
Max
imum
) Sp
ecia
lists
(t
o G
rad
e 10
Max
imum
) (t
o G
rad
e 11
an
d a
bov
e)
n
Est.
(S
E)
n
Est.
(S
E)
n
Est.
(S
E)
n
Est.
(S
E)
n
Es
t.
(SE)
n
Es
t.
(SE)

121CHARACTERISTICS Of TEACHER EDUCATION PROGRAMS, TEACHER EDUCATORS, AND fUTURE TEACHERS
4.4.4 Indicators of Socioeconomic Status of Future Teachers
The questionnaires the future teachers completed included several items that featured
indicators of the socioeconomic status of these students and their families. The indicators
were number of books in the homes of the students’ parents or guardians (few, one
bookshelf, one bookcase, two bookcases, and three or more bookcases), the availability
of a variety of educational resources in those homes (calculator, computer, study desk,
dictionary, encyclopedia, play station, DVD player, and several automobiles), and the
highest level of education completed by their male and female parents or guardians.
The future teachers’ responses are summarized in Exhibits A4.15 through A4.22 in
Appendix A.
4.4.4.1 Books in the home
The number of books in a person’s home is frequently taken in the IEA studies as
an indicator of socioeconomic status. Most of the future teachers preparing to teach
primary grades reported having enough books at home “to fill one or two bookcases,”
with the exception of some future teachers in Botswana and the Philippines. A relatively
large proportion of the future teachers in these two countries (30 to 35%) reported
having few or no books at home. The only countries where more than 40% of future
primary teachers reported having enough books to fill three or more bookcases were
Germany, Switzerland, Norway, and the United States. A very similar pattern appeared
among future teachers preparing to teach secondary grades. These findings are similar
to those reported in Chapter 3: individuals in wealthier countries tend to have more
resources—in this case, books—than those in the less wealthy economies.
4.4.4.2 Educational resources at home
Ninety percent or more of the future primary teachers in 12 countries said they owned
a calculator. The exceptions were found in Georgia and Botswana, with 85 and 89%,
respectively, owning a calculator. Similarly, more than 90% of the future primary
teachers in most countries reported owning a study desk and a dictionary (see Exhibit
A4.17 in Appendix A). In this case, exceptions were found in Georgia, the Philippines,
Botswana, and Thailand, where lower percentages (ranging from 71 to 86%) were
recorded. More than 90% of future primary teachers in the majority of participating
countries surveyed owned computers. The exceptions came from Georgia (26%),
Botswana (38%), the Philippines (38%), Thailand (76%), and the Russian Federation
(78%). Across countries, 70% or more of the surveyed preservice students reported
owning a DVD player. The only exception to this pattern was evident in Georgia,
where fewer than 50% of the preservice students said they had a DVD player. Across
the participating countries, greater variation was evident with respect to owning an
encyclopedia, a play station, and several cars.
The patterns that emerged for the secondary program-groups differed somewhat
from those for the primary program-groups. While almost all future lower-secondary
teachers reported owning a calculator, lower proportions said that they owned a
computer. Fewer than 50% of the future lower-secondary teachers in Botswana, the
Philippines, and Thailand reported owning computers. A higher proportion (80% or
more) of future teachers in the two secondary groups said they owned a study desk, a
dictionary, and a DVD player. More variability was observed with respect to play station
and car ownership.

THE TEACHER EDUCATION AND DEVELOPMENT STUDY IN MATHEMATICS (TEDS-M)122
4.4.5 Level of Education in the Family Twenty-five percent or more of the future primary teachers in the Philippines, Singapore, Spain, Botswana, Malaysia, and Thailand said that the highest level of their parents’ or guardians’ education was primary school. Thirty percent or more of the future primary teachers in Chile, Chinese Taipei, Poland, Singapore, Switzerland, and the United States said the highest level of educational attainment for their mothers and fathers was upper secondary. About 40% of respondents in Georgia and the Russian Federation reported practical, technical, or vocational training at the post-secondary level (ISCED Level 5B) as the highest level of maternal education.
Although these patterns were very similar for the future secondary teachers, parents or guardians of future upper-secondary teachers had higher levels of education than those from the other program groups. More than 20% of parents or guardians in Germany, Norway (PPU and Master’s), Poland, the Russian Federation, and the United States had reached a level of education beyond ISCED Level 5A. Overall, fathers and male guardians had a lower level of educational attainment than mothers and female guardians.
4.4.6 Language Spoken at HomeAnswers to this question indicated two important characteristics of future teachers: how well respondents to the TEDS-M tests and questionnaires spoke the country’s official language, and whether these respondents were immigrants. Results are summarized in Exhibit 4.12.
Sizeable proportions of the future primary teachers in most countries said that they always or almost always spoke the language of the test at home. In several countries, however, significant proportions of teachers indicated that they only sometimes or never spoke the language of the test at home. The countries concerned were Botswana (90%), Chinese Taipei (about 30%), Malaysia (about 87%), the Philippines (about 95%), Singapore (about 43%), and Thailand (about 39%). The pattern was similar among future lower-secondary teachers, with Oman (about 28%) being added to the list of countries where a sizable proportion of the respondents said that they sometimes or never spoke the language of the test at home.
4.4.7 Previous Careers and Future Commitment to TeachingThe two future teacher questionnaires also addressed preservice students’ previous work experience and their commitment to a teaching career. One item focused on whether these prospective teachers had pursued another career before deciding to become teachers. More particularly, respondents were asked whether or not they had been involved in “another career” prior to commencing their teacher education program. “Career” was defined as paid employment that respondents regarded as likely to be their life’s work.
As shown in Exhibit 4.13, about one fourth to one third of the Program-Group 1 future teachers in Germany and Poland reported having been employed in a career-oriented job before they began their teacher education program; lower proportions gave the same response in other countries. A higher proportion of those preparing to teach the more advanced primary grades reported having had another career. Forty percent or more of these future teachers gave the same response in the Philippines, Singapore, and Spain. Lower proportions reported having had another career in Chinese Taipei, Switzerland, and the United States. Among the future teachers in Program-Groups 3 and 4, many said they had worked in other careers. The highest proportion giving this response resided in Singapore (close to 60%) and the lowest proportions giving this
response were in Poland, Thailand, and the United States.

123CHARACTERISTICS Of TEACHER EDUCATION PROGRAMS, TEACHER EDUCATORS, AND fUTURE TEACHERS
Exh
ibit
4.1
2: F
utur
e te
ache
rs’ u
se o
f the
lang
uage
of t
he te
st a
t hom
e (e
stim
ated
per
cent
)
Co
untr
y Fu
ture
Pri
mar
y Te
ache
rs
Futu
re L
ow
er-S
eco
nd
ary
Teac
hers
bots
wan
a a
81
2.2
(1.6
) 7.
5 (2
.4)
74.2
(5
.6)
16.1
(4
.6)
a 49
0.
0 (0
.0)
2.4
(2.3
) 77
.2
(5.8
) 20
.4
(5.5
)
Chi
le†
b 65
3 97
.0
(0.6
) 2.
4 (0
.6)
0.6
(0.2
) 0.
0 (0
.0)
b 74
1 95
.4
(0.8
) 3.
6 (0
.6)
0.7
(0.3
) 0.
4 (0
.2)
Chi
nese
Tai
pei
92
3 17
.1
(1.3
) 53
.3
(2.0
) 28
.2
(1.9
) 1.
4 (0
.4)
36
5 15
.5
(1.6
) 43
.8
(2.1
) 37
.1
(2.3
) 3.
6 (0
.9)
Geo
rgia
494
86.2
(1
.8)
10.5
(1
.5)
3.1
(0.7
) 0.
2 (0
.2)
c 77
91
.9
(3.8
) 4.
2 (2
.4)
1.0
(1.0
) 2.
8 (2
.8)
Ger
man
y†
900
93.0
(1
.3)
4.8
(1.0
) 2.
1 (0
.8)
0.1
(0.1
)
635
90.8
(2
.8)
6.0
(2.1
) 1.
3 (0
.5)
1.9
(1.7
)
Mal
aysi
a
572
6.0
(0.9
) 6.
8 (1
.1)
69.2
(2
.1)
17.9
(1
.8)
38
6 4.
0 (0
.9)
5.6
(1.1
) 70
.6
(2.0
) 19
.8
(2.0
)
Nor
way
(ALU
)† c
391
95.6
(1
.2)
3.3
(1.0
) 0.
5 (0
.3)
0.6
(0.5
) d
355
97.2
(0
.7)
2.3
(0.7
) 0.
3 (0
.3)
0.2
(0.2
)
Nor
way
(ALU
+)†
c 15
9 94
.7
(1.0
) 2.
3 (1
.2)
2.4
(0.9
) 0.
5 (0
.5)
d 15
0 92
.8
(2.3
) 4.
7 (1
.9)
1.2
(0.7
) 1.
3 (0
.8)
Nor
way
(PPU
& M
aste
r’s)
d
65
85.7
(4
.4)
7.8
(3.0
) 3.
1 (0
.3)
3.5
(2.0
)
Om
an
26
6 58
.6
(3.6
) 13
.1
(2.4
) 20
.2
(2.7
) 8.
2 (1
.5)
Phili
ppin
es
59
0 0.
3 (0
.2)
4.7
(1.4
) 90
.9
(1.6
) 4.
1 (0
.8)
73
0 1.
2 (0
.4)
6.2
(1.2
) 86
.3
(1.5
) 6.
3 (0
.9)
Pola
nd†
d 2,
111
96.3
(0
.5)
2.9
(0.4
) 0.
8 (0
.3)
0.0
(0.0
) e
298
97.7
(1
.0)
1.8
(0.9
) 0.
5 (0
.4)
0.0
(0.0
)
Russ
ian
fede
ratio
n e
2,26
1 85
.4
(3.7
) 7.
6 (1
.7)
6.0
(1.8
) 1.
0 (0
.3)
f 2,
140
85.5
(3
.7)
6.9
(1.1
) 6.
2 (2
.4)
1.4
(0.7
)
Sing
apor
e
380
30.7
(2
.5)
26.5
(2
.2)
36.5
(2
.2)
6.3
(1.3
)
391
13.6
(1
.6)
19.5
(1
.7)
49.7
(2
.2)
17.2
(2
.2)
Spai
n
1,09
2 79
.7
(3.4
) 6.
4 (1
.3)
4.9
(0.6
) 8.
9 (2
.9)
Switz
erla
nd
f 93
2 84
.5
(0.9
) 9.
4 (0
.9)
2.6
(0.5
) 3.
5 (0
.5)
g 14
1 86
.1
(2.9
) 6.
5 (2
.0)
3.1
(1.6
) 4.
3 (1
.5)
Thai
land
†
660
50.8
(1
.6)
10.4
(1
.0)
33.1
(1
.5)
5.7
(1.0
)
652
51.6
(1
.6)
10.7
(1
.2)
32.2
(1
.4)
5.5
(0.9
)
Uni
ted
Stat
es†
g 1,
186
94.8
(1
.1)
3.4
(0.6
) 1.
4 (0
.5)
0.4
(0.4
) h
502
93.5
(1
.7)
2.9
(0.9
) 3.
3 (1
.3)
0.4
(0.3
)
Not
es:
1. †
Som
e or
all
futu
re t
each
ers
in t
his
cou
ntr
y ar
e be
ing
prep
ared
to
teac
h p
rim
ary
and
low
er-s
econ
dary
stu
den
ts. T
he
targ
et p
opu
lati
ons
of f
utu
re p
rim
ary
and
low
er-s
econ
dar
y te
ach
ers
are
ther
efor
e pa
rtly
or
fully
ove
rlap
pin
g (s
ee T
ED
S-M
tec
hn
ical
rep
ort)
.
2. W
hen
rea
din
g th
is t
able
, kee
p in
min
d th
e lim
itat
ion
s an
not
ated
ear
lier
on p
age
117
and
den
oted
in t
he
tabl
e ab
ove
by fo
otn
ote
lett
ers.
3. T
he
shad
ed a
reas
iden
tify
dat
a th
at, f
or r
easo
ns
expl
ain
ed in
th
ese
limit
atio
ns,
can
not
be
com
pare
d w
ith
con
fide
nce
to
data
from
oth
er c
oun
trie
s.
Alw
ays
Alm
ost
Alw
ays
Som
etim
es
Nev
er
A
lway
s A
lmo
st A
lway
s So
met
imes
N
ever
n
Est.
(S
E)
Est.
(S
E)
Est.
(S
E)
Est.
(S
E)
n
Est.
(S
E)
Est.
(S
E)
Est.
(S
E)
Est.
(S
E)

THE TEACHER EDUCATION AND DEVELOPMENT STUDY IN MATHEMATICS (TEDS-M)124
Exh
ibit
4.1
3: F
utur
e te
ache
rs’ r
espo
nses
on
whe
ther
the
y ha
d an
othe
r ca
reer
bef
ore
ente
ring
teac
hing
(es
tim
ated
per
cent
res
pond
ing
“yes
”)
Co
untr
y Fu
ture
Pri
mar
y Te
ache
rs
Futu
re L
ow
er-S
eco
nd
ary
Teac
hers
bots
wan
a a
59
27.4
(6
.6)
a
23
13.0
(7
.8)
6 33
.3
(23.
0)
Chi
le†
b
64
9 31
.9
(1.9
)
b 73
0 34
.3
(1.7
)
Chi
nese
Tai
pei
922
5.6
(0.7
)
36
5 4.
9 (1
.2)
Geo
rgia
427
10.8
(2
.1)
68
7.
6 (3
.0)
Ger
man
y†
934
26.5
(2
.1)
95
24.7
(6
.1)
40
5 33
.5
(3.1
) 36
2 30
.8
(2.5
)
Mal
aysi
a
56
7 41
.7
(2.1
)
38
6 26
.4
(1.9
)
Nor
way
(ALU
)† c
390
26.2
(2
.2)
c
354
21.9
(2
.3)
Nor
way
(ALU
+)†
c
15
9 39
.2
(3.8
)
c 14
9 38
.1
(3.8
)
Nor
way
(PPU
& M
aste
r’s)
d
65
44
.4
(4.3
)
Om
an
24
9 4.
0 (1
.2)
Phili
ppin
es
552
48.5
(2
.9)
67
5 51
.1
(2.7
)
Pola
nd†
d 1,
805
31.6
(1
.2)
299
9.9
(1.5
) d
158
14.6
(3
.5)
138
10.7
(3
.0)
Russ
ian
fede
ratio
n e
2,25
6 14
.9
(1.7
)
e
2,12
9 7.
7 (0
.9)
Sing
apor
e
26
3 43
.8
(3.3
)
117
56.9
(3
.8)
14
1 36
.7
(3.7
) 25
0 35
.6
(3.2
)
Spai
n
1,
090
44.7
(4
.0)
Switz
erla
nd
f 11
9 17
.3
(3.4
) 81
4 25
.5
(1.7
)
f
140
22.2
(3
.8)
Thai
land
†
65
8 4.
1 (0
.7)
650
6.1
(0.8
)
Uni
ted
Stat
es†
g
1,03
2 18
.7
(1.8
)
149
15.6
(3
.9)
g 13
1 16
.9
(2.5
) 36
9 23
.1
(3.3
)
Not
es:
1. †
Som
e or
all
futu
re t
each
ers
in t
his
cou
ntr
y ar
e be
ing
prep
ared
to
teac
h p
rim
ary
and
low
er-s
econ
dary
stu
den
ts. T
he
targ
et p
opu
lati
ons
of f
utu
re p
rim
ary
and
low
er-s
econ
dar
y te
ach
ers
are
ther
efor
e pa
rtly
or
fully
ove
rlap
pin
g (s
ee T
ED
S-M
tec
hn
ical
rep
ort)
.
2. W
hen
rea
din
g th
is t
able
, kee
p in
min
d th
e lim
itat
ion
s an
not
ated
ear
lier
on p
age
117
and
den
oted
in t
he
tabl
e ab
ove
by fo
otn
ote
lett
ers.
3. T
he
shad
ed a
reas
iden
tify
dat
a th
at, f
or r
easo
ns
expl
ain
ed in
th
ese
limit
atio
ns,
can
not
be
com
pare
d w
ith
con
fide
nce
to
data
from
oth
er c
oun
trie
s.
Lo
wer
Pri
mar
y Pr
imar
y
Prim
ary
and
Seco
ndar
y G
ener
alis
ts
Prim
ary
Mat
hem
atic
s Lo
wer
Sec
on
dar
y
Low
er a
nd
Up
per
Sec
on
dar
y
(to
Gra
de
4 M
axim
um)
(to
Gra
de
6 M
axim
um)
(to
Gra
de
10 M
axim
um)
Spec
ialis
ts
(to
Gra
de
10 M
axim
um)
(to
Gra
de
11 a
nd
ab
ove)
n
Est.
(S
E)
n
Est.
(S
E)
n
Est.
(S
E)
n
Est.
(S
E)
n
Es
t.
(SE)
n
Es
t.
(SE)
125CHARACTERISTICS Of TEACHER EDUCATION PROGRAMS, TEACHER EDUCATORS, AND fUTURE TEACHERS
The pattern was similar in the secondary program-groups. Twenty percent or more of future teachers in 7 of the 10 countries in Program-Group 5 reported having had other careers; the highest proportion was in the Philippines (about 51%). The lowest prior career rates were found in Botswana, Poland, and the United States (with a range of about 13 to 17%).
Chinese Taipei, Georgia, Oman, Poland, the Russian Federation, and Thailand had the lowest proportions (between 4 and 10.7%) of Group 6 future teachers who had worked in another career before entering teaching. Higher proportions of Group 6 future teachers with previous careers were found in Norway (PPU and Master’s) (close to
44%), Singapore (35.6%), Botswana (33.3%), and Germany (30.8%).
4.4.8 Reasons for Becoming a Teacher
Future teachers were shown a list of nine reasons people might have for wanting to become teachers, and were asked to identify those that had been a significant or major reason for them. The reasons encompassed the nature of the teaching task, personal wellbeing, and a desire to benefit others. Results for future primary teachers and for future lower-secondary teachers are shown in Exhibits A4.23 and A4.24 (Appendix A) respectively.
Because teaching largely involves interacting with students, it is no surprise that high proportions of the future teachers in most program-groups selected “I like working with young people.” Groups 5 and 6 future teachers were those least likely to select this reason. Interestingly, this reason was much less likely to be chosen by future teachers in Chinese Taipei, Georgia, and Thailand, the only three countries for which the most commonly chosen reason in one or more program-groups was “the long-term security associated with being a teacher.” Because high percentages of future teachers in all other countries chose liking to work with young people, other highly favored choices will be of interest to those involved in teacher recruitment.
The numbers of future teachers selecting “I love mathematics” produced a revealing trend in attitudes across program-groups. This reason was usually neither the first nor the second most frequent choice of future teachers in any country in either Group 1 or Group 2, but it was the most frequent choice in one country, Botswana, and for one group (Group 3). For Group 4 future teachers in three countries (Malaysia, Poland, and Thailand), this reason was the first or second most frequent choice. The only future teachers in Group 5 to choose this reason more often than their counterparts in any other group were those in Botswana. However, it was the first or second most favored choice for Group 6 future teachers in nine countries.
High percentages of future teachers from Germany, Chile, Norway, Switzerland, and the United States said they entered teaching because they believed they had “a talent for teaching.” Seeing teaching as a “challenging job” was identified as an important reason by future teachers in Chile, Germany, Norway, the Philippines, and Switzerland. The statement was endorsed by more than 85% of the future teachers in these countries.
Wanting to “have an influence on the next generation” motivated large proportions of future teachers in Group 1 in the Russian Federation, Group 2 in Singapore, Spain, and the United States, Group 5 in the Philippines, Singapore, and the United States, and Group 6 in Thailand.
THE TEACHER EDUCATION AND DEVELOPMENT STUDY IN MATHEMATICS (TEDS-M)126
It appears that neither having been a “good student in school” nor “availability of teaching positions” greatly influenced future teachers to become teachers. Overall, the least frequently chosen reason was “I am attracted by teacher salaries.”
4.5 Conclusion
Although the number of participating countries was not large, and the cultural and
socioeconomic differences among them were, it is still possible to discern a number
of trends and patterns that are likely to interest policymakers, researchers, teacher
educators, and others. We present these under the three headings corresponding to the
major subsections of the chapter: teacher education institutions, teacher educators, and
future teachers.
National research coordinators, who were responsible for collecting the TEDS-M
data from representative samples of their teacher education institutions, their teacher
educator population, and their future teachers, had to deal with a number of challenges
unique to conducting a study of this kind at the post-secondary level. Samples for some
countries were small or response rates were lower than expected, and this means that
caution must frequently be exercised in interpreting the data from those countries.
All such cautions are indicated in the annotated panels associated with the exhibits
throughout this chapter.
4.5.1 Teacher Education Institutions and Programs
Mathematics teacher education in every nation is structured and organized in a variety
of ways that have been shaped by history and tradition in that country, as well as by
current perceptions of the things that teachers need to know and be able to do in order
to teach successfully. The response to these kinds of constraints is diverse, as can be seen
from the high degree of variation in the characteristics of teacher education programs
across countries.
There is considerable variation among countries in the length of programs considered
necessary to prepare teachers for the classroom. There is also great variation across
countries, and across programs within countries, in the amount of class time the teacher
education programs allocate to mathematics and mathematics pedagogy. Institutions in
low-income countries tend to have lower minimum entry qualifications, regardless of
program level. Where minimum qualifications are lower, there is usually more emphasis
on prior achievement in mathematics.
Almost all teacher education programs include extended teaching practice, but fewer
include field experience that enables future teachers to become familiar with school
organizational and managerial issues. In order to graduate, students in most of the
TEDS-M countries must demonstrate readiness for teaching in addition to teaching
competence by gaining passing grades in all subjects, written and/or oral examinations,
and/or theses. Programs for future secondary teachers are more likely to require a thesis
for graduation than programs for future primary teachers.

127CHARACTERISTICS Of TEACHER EDUCATION PROGRAMS, TEACHER EDUCATORS, AND fUTURE TEACHERS
4.5.2 Teacher Educators
Teacher educators were primarily females who had, for the most part, specialized roles
within their programs. However, some of these programs had teacher educators who
were playing multiple roles, who were not highly qualified, and who did not consider
mathematics to be their main specialty. Teacher educators teaching mathematics in
countries with high- or medium-income levels usually had high-level qualifications.
Most of the teacher educators teaching mathematics and mathematics pedagogy
courses considered themselves to be mathematics specialists. Large proportions of
teacher educators were certified teachers.
4.5.3 Future Teachers
The majority of future primary teachers at the primary school level were females, by
a wide margin. There were greater proportions of men among the lower-secondary
samples, but females were still predominant in at least half of the participating
countries.
These individuals often decide to pursue a career in teaching because they like working
with young people, and because they think they might be good at teaching even though
they see teaching as a challenging job and one that will not give them good salaries. Most
are of middle-class background and, with the exception of those from less-developed
countries, have access to a number of resources at home, such as calculators, computers,
and dictionaries. For the most part, these individuals have been successful in their basic
schooling. However, with the exception of those in a few countries who were intending
to teach high school mathematics, they did not see themselves as having been high
achievers in secondary school, a perception that may have had implications for the
kinds of opportunities they will be able to provide for their own students.
References
Tatto, M. T. (2012). Teacher Education and Development Study in Mathematics (TEDS-M): Technical
report. Amsterdam, the Netherlands: International Association for Educational Achievement
(IEA).
Tatto, M. T., Schwille, J., Senk, S., Ingvarson, L., Peck, R., & Rowley, G. (2008). Teacher Education
and Development Study in Mathematics (TEDS-M): Conceptual framework. Amsterdam, the
Netherlands: International Association for Educational Achievement (IEA). Available online at
http://teds.educ.msu.edu/framework.asp

THE TEACHER EDUCATION AND DEVELOPMENT STUDY IN MATHEMATICS (TEDS-M)128

129
CHAPTER 5: THE MATHEMATICS CONTENT KNOWLEDGE AND MATHEMATICS PEDAGOGICAL CONTENT KNOWLEDGE OF FUTURE PRIMARY AND LOWER- SECONDARY TEACHERS
5.1 Chapter Overview
TEDS-M was designed to answer questions about the knowledge of future teachers
across participating countries. In this chapter, we address the following research
questions:
1. What are the level and depth of the knowledge for teaching mathematics attained
by prospective primary and lower-secondary teachers?
2. How does this knowledge vary across countries?
Studying the knowledge that future teachers have at hand is important for two main
reasons. First, teachers’ knowledge influences the mathematics achievement of their
students (Baumert et al., 2010; Hill, Rowan, & Ball, 2005). Second, the knowledge
that future teachers have acquired by the end of their final year of study may be a key
indicator of the success of their teacher education program.
This chapter consists of four sections. The first describes the framework and
procedures used to develop the TEDS-M items that measured future teachers’
knowledge for teaching mathematics. The second describes the design of the
instruments used. The third section presents results related to the research questions,
and the last section contains concluding comments.
5.2. Framework for Measuring Knowledge for Teaching Mathematics
Knowledge for teaching requires both content knowledge and pedagogical content
knowledge (Committee on the Study of Teacher Preparation Programs in the United
States, 2010; Shulman, 1987). Over the past few decades, scholars from around the world
have described how these two constructs can be interpreted with respect to teaching
mathematics (An, Kulm, & Wu, 2004; Conference Board of the Mathematical Sciences,
2001; Even & Ball, 2009; Hill, Rowan, & Ball, 2005; Pepin, 1999; Schmidt et al., 2007).
The TEDS-M research team drew on this research to design the items and instruments
used to measure the mathematics content knowledge (MCK) and the mathematics
pedagogical content knowledge (MPCK) of preservice teachers intending to teach in
primary or lower-secondary schools.
5.2.1 Framework for Mathematics Content Knowledge
Items spanning four content subdomains were used to assess MCK at both the primary
and lower-secondary levels. The four subdomains were number and operations,
algebra and functions, geometry and measurement, and data and chance. These were
derived from the subdomains used in the assessment frameworks for IEA’s Trends in
Mathematics and Science Study (TIMSS) (see Exhibit 5.1).

THE TEACHER EDUCATION AND DEVELOPMENT STUDY IN MATHEMATICS (TEDS-M)130
Each MCK item was further classified into one of three cognitive subdomains:
knowing, applying, and reasoning (see Exhibit 5.2). This framework was based on
descriptions of the cognitive domains used in TIMSS (Garden et al., 2006; Mullis,
Martin, Ruddock, O’Sullivan, Arora, & Erberber, 2007).
Adopting these familiar frameworks provided a focus for item development, ensured
good coverage of MCK, and also enabled items to be systematically categorized for
scale development and reporting.
Exhibit 5.1: Mathematics content knowledge framework, by content subdomain
Subdomain Sample Topics
Number and Operations Whole numbers fractions and decimals Number sentences Patterns and relationships Integers Ratios, proportions, and percentages Irrational numbers Number theory
Geometry and Measurement Geometric shapes Geometric measurement Location and movement
Algebra and functions Patterns Algebraic expressions Equations/formulas and functions Calculus and analysis* Linear algebra and abstract algebra*
Data and Chance Data organization and representation Data reading and interpretation Chance
Note: * Lower-secondary level only.
Source: TIMSS 2007 Content Domain Assessment Framework (Mullis et al., 2007); TIMSS 2008 Advanced Assessment Frameworks (Garden et al., 2006).
Exhibit 5.2: Mathematics content knowledge framework, by cognitive domain Subdomain Sample Behaviors
Knowing Recall Recognize Compute Retrieve Measure Classify/order
Applying Select Represent Model Implement Solve routine problems
Reasoning Analyze Generalize Synthesize/integrate Justify Solve non-routine problems
Source: TIMSS 2007 Cognitive Domain Assessment Framework (Mullis et al., 2007).
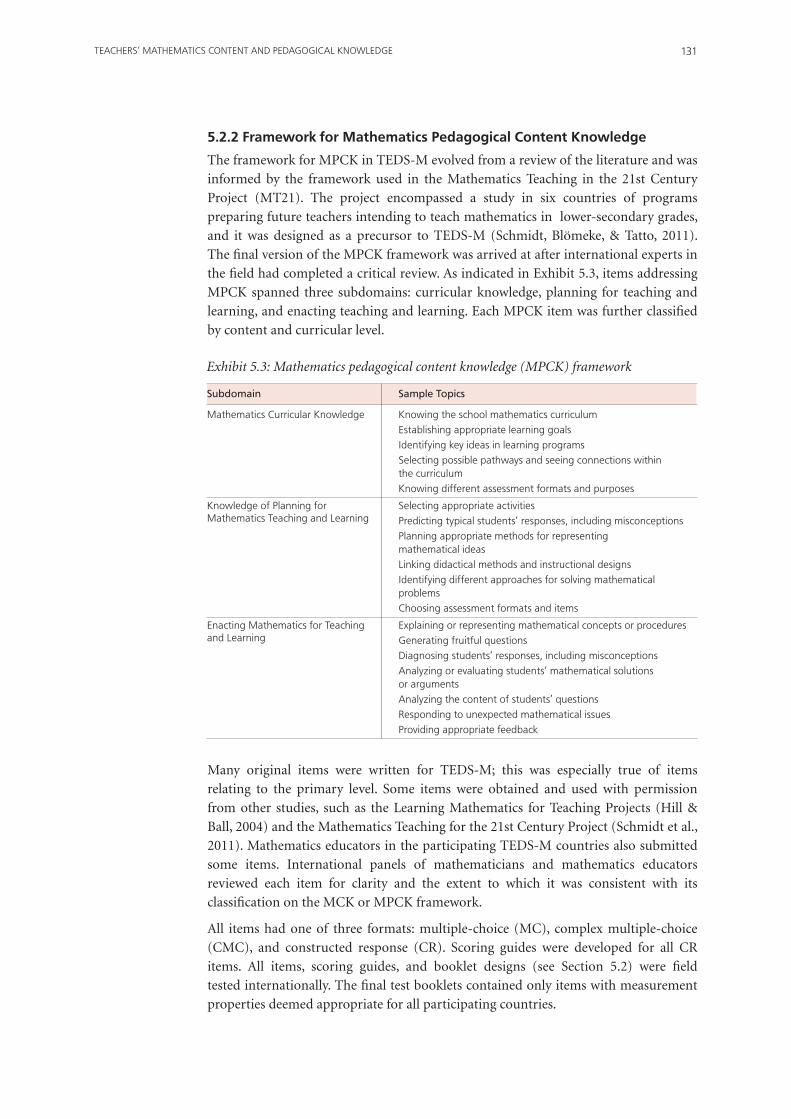
131TEACHERS’ MATHEMATICS CONTENT AND PEDAGOGICAL KNOWLEDGE
5.2.2 Framework for Mathematics Pedagogical Content Knowledge
The framework for MPCK in TEDS-M evolved from a review of the literature and was
informed by the framework used in the Mathematics Teaching in the 21st Century
Project (MT21). The project encompassed a study in six countries of programs
preparing future teachers intending to teach mathematics in lower-secondary grades,
and it was designed as a precursor to TEDS-M (Schmidt, Blömeke, & Tatto, 2011).
The final version of the MPCK framework was arrived at after international experts in
the field had completed a critical review. As indicated in Exhibit 5.3, items addressing
MPCK spanned three subdomains: curricular knowledge, planning for teaching and
learning, and enacting teaching and learning. Each MPCK item was further classified
by content and curricular level.
Exhibit 5.3: Mathematics pedagogical content knowledge (MPCK) framework
Subdomain Sample Topics
Mathematics Curricular Knowledge Knowing the school mathematics curriculum Establishing appropriate learning goals Identifying key ideas in learning programs Selecting possible pathways and seeing connections within the curriculum Knowing different assessment formats and purposes
Knowledge of Planning for Selecting appropriate activitiesMathematics Teaching and Learning Predicting typical students’ responses, including misconceptions Planning appropriate methods for representing mathematical ideas Linking didactical methods and instructional designs Identifying different approaches for solving mathematical problems Choosing assessment formats and items
Enacting Mathematics for Teaching Explaining or representing mathematical concepts or proceduresand Learning Generating fruitful questions Diagnosing students’ responses, including misconceptions Analyzing or evaluating students’ mathematical solutions or arguments Analyzing the content of students’ questions Responding to unexpected mathematical issues Providing appropriate feedback
Many original items were written for TEDS-M; this was especially true of items
relating to the primary level. Some items were obtained and used with permission
from other studies, such as the Learning Mathematics for Teaching Projects (Hill &
Ball, 2004) and the Mathematics Teaching for the 21st Century Project (Schmidt et al.,
2011). Mathematics educators in the participating TEDS-M countries also submitted
some items. International panels of mathematicians and mathematics educators
reviewed each item for clarity and the extent to which it was consistent with its
classification on the MCK or MPCK framework.
All items had one of three formats: multiple-choice (MC), complex multiple-choice
(CMC), and constructed response (CR). Scoring guides were developed for all CR
items. All items, scoring guides, and booklet designs (see Section 5.2) were field
tested internationally. The final test booklets contained only items with measurement
properties deemed appropriate for all participating countries.
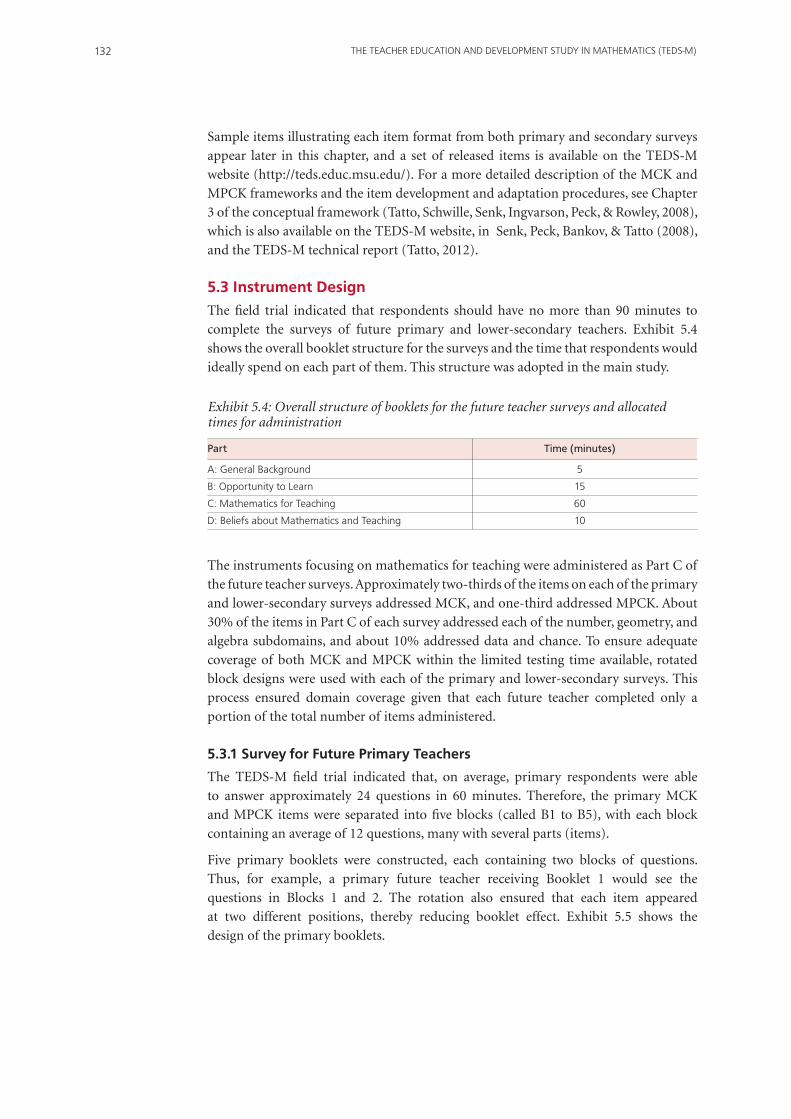
THE TEACHER EDUCATION AND DEVELOPMENT STUDY IN MATHEMATICS (TEDS-M)132
Sample items illustrating each item format from both primary and secondary surveys
appear later in this chapter, and a set of released items is available on the TEDS-M
website (http://teds.educ.msu.edu/). For a more detailed description of the MCK and
MPCK frameworks and the item development and adaptation procedures, see Chapter
3 of the conceptual framework (Tatto, Schwille, Senk, Ingvarson, Peck, & Rowley, 2008),
which is also available on the TEDS-M website, in Senk, Peck, Bankov, & Tatto (2008),
and the TEDS-M technical report (Tatto, 2012).
5.3 Instrument Design
The field trial indicated that respondents should have no more than 90 minutes to
complete the surveys of future primary and lower-secondary teachers. Exhibit 5.4
shows the overall booklet structure for the surveys and the time that respondents would
ideally spend on each part of them. This structure was adopted in the main study.
Exhibit 5.4: Overall structure of booklets for the future teacher surveys and allocated times for administration
Part Time (minutes)
A: General background 5
b: Opportunity to Learn 15
C: Mathematics for Teaching 60
D: beliefs about Mathematics and Teaching 10
The instruments focusing on mathematics for teaching were administered as Part C of
the future teacher surveys. Approximately two-thirds of the items on each of the primary
and lower-secondary surveys addressed MCK, and one-third addressed MPCK. About
30% of the items in Part C of each survey addressed each of the number, geometry, and
algebra subdomains, and about 10% addressed data and chance. To ensure adequate
coverage of both MCK and MPCK within the limited testing time available, rotated
block designs were used with each of the primary and lower-secondary surveys. This
process ensured domain coverage given that each future teacher completed only a
portion of the total number of items administered.
5.3.1 Survey for Future Primary Teachers
The TEDS-M field trial indicated that, on average, primary respondents were able
to answer approximately 24 questions in 60 minutes. Therefore, the primary MCK
and MPCK items were separated into five blocks (called B1 to B5), with each block
containing an average of 12 questions, many with several parts (items).
Five primary booklets were constructed, each containing two blocks of questions.
Thus, for example, a primary future teacher receiving Booklet 1 would see the
questions in Blocks 1 and 2. The rotation also ensured that each item appeared
at two different positions, thereby reducing booklet effect. Exhibit 5.5 shows the
design of the primary booklets.

133TEACHERS’ MATHEMATICS CONTENT AND PEDAGOGICAL KNOWLEDGE
5.3.2 Survey for Future Lower-Secondary Teachers
At the lower-secondary level, the small size of target populations within some
institutions, some programs, and some countries imposed still further restrictions, a
situation that permitted a maximum of three booklets. The field trial showed that future
lower-secondary teachers were able to answer about 30 questions in 60 minutes. Lower-
secondary blocks containing an average of 15 questions were therefore constructed.
Each future teacher of secondary mathematics responded to two blocks of questions,
with each question worth one to four score points. Exhibit 5.6 shows the three-booklet
design for the TEDS-M main study at the lower-secondary level.
Exhibit 5.5: TEDS-M rotated block design for the primary survey of knowledge of mathematics for teaching
Booklet Blocks Administered
1 b1 b
2
2 b2 b
3
3 b3 b
4
4 b4 b
5
5 b5 b
1
Exhibit 5.6: TEDS-M rotated block design for the lower-secondary survey of knowledge of mathematics for teaching
Booklet Blocks Administered
1 b1 b
2
2 b2 b
3
3 b3 b
1
5.4 Future Teachers’ Knowledge of Mathematics for Teaching
As described in Appendix B to this report, future teachers’ knowledge of mathematics
content and mathematics pedagogical content is reported in scaled scores generated
through use of item response theory (IRT). The primary knowledge scales were built
from 74 MCK items and 32 MPCK items, and the lower-secondary scales were built
from 76 MCK items and 27 MPCK items. The international mean for each of the
primary and lower-secondary MCK and MPCK scales was 500; the standard deviation
was 100.
When interpreting the results presented and discussed in the exhibits in this section,
bear in mind the following annotations pertaining to the data from several countries.
The annotations are listed in two panels—one for the primary teacher data, and one for
the lower-secondary teacher data.

THE TEACHER EDUCATION AND DEVELOPMENT STUDY IN MATHEMATICS (TEDS-M)134
Limitation annotations for the future primary teacher MCK and MPCK data
a. Poland: reduced coverage—institutions with consecutive programs only were
not covered; the combined participation rate was between 60 and 75%.
b. Russian Federation: reduced coverage—secondary pedagogical institutions were
excluded.
c. Switzerland: reduced coverage—the only institutions covered were those where
German is the primary language of use and instruction.
d. United States: reduced coverage—public institutions only; the combined
participation rate was between 60 and 75%. An exception was made to accept
data from two institutions because, in each case, one additional participant
would have brought the response rate to above the 50% threshold. Although the
participation rate for the complete sample met the required standard, the data
contain records that were completed via a telephone interview. This method was
used when circumstances did not allow administration of the full questionnaire.
Of the 1,501 recorded participants, 1,185 received the full questionnaire. Bias
may be evident in the data because of the significant number of individuals who
were not administered the full questionnaire.
e. Botswana: the sample size was small (n = 86), but arose from a census of a small
population.
f. Chile: the combined participation rate was between 60 and 75%.
g. Norway: the combined participation rate was between 60 and 75%. An exception
was made to accept data from one institution because one additional participant
would have brought the response rate to above the 50% threshold. Program-
types ALU and ALU plus mathematics are reported separately because the two
populations partly overlapped; data from these program-types cannot therefore
be aggregated.

135TEACHERS’ MATHEMATICS CONTENT AND PEDAGOGICAL KNOWLEDGE
Limitation annotations for the future lower-secondary teacher MCK and MPCK data
a. Botswana: the sample size was small (n = 53), but arose from a census of a small
population.
b. Chile: the combined participation rate was between 60 and 75%.
c. Poland: reduced coverage. The institutions not covered were those with only
consecutive programs. The combined participation rate was between 60 and
75%.
d. Switzerland: reduced coverage—the only institutions covered were those where
German is the primary language of use and instruction.
e. Norway: The combined participation rate was 58%. An exception was made to
accept data from one institution because one additional participant would have
brought the response rate to above the 50% threshold. Of the program-types
preparing preservice teachers to teach up to Grade 10 maximum, program-
types ALU and ALU plus mathematics are reported separately because the
populations partly overlapped; data from these program-types cannot therefore
be aggregated.
f. United States: reduced coverage—public institutions only. The combined
participation rate was between 60 and 75%. An exception was made to accept
data from one institution because one additional participant would have brought
the response rate to above the 50% threshold. Although the participation rate
for the complete sample met the required standards, the data contain records
that were completed via a telephone interview. This method was used when
circumstances did not allow administration of the full questionnaire. Of the
607 recorded participants, 502 received the full questionnaire. Bias may be
evident in the data because of the significant number of individuals who were
not administered the full questionnaire.
g. Georgia: The combined participation rate was between 60 and 75%. An
exception was made to accept data from two institutions because, in each
case, one additional participant brought the response rate to above the 50%
threshold.
h. Russian Federation: an unknown number of those surveyed had previously
qualified to become primary teachers.
To help readers interpret the scores on these scales, the TEDS-M researchers identified key points on the scales, called anchor points. The anchor points do not represent a priori judgments about whether a given scale score is good or bad. Rather, they are descriptions of the performance of those future teachers who had scores at specific points on the scale. Two anchor points were identified for each of the MCK primary and lower-secondary scales, and one anchor point for each of the two MPCK scales. On the MCK scales, Anchor Point 1 represents a lower level of knowledge and Anchor Point 2, a higher level.
Items at the anchor points were determined by the probability that a person with a score at that point would get the relevant item right. Future teachers with scores at the anchor points were able to provide correct answers to items classified at that point or below with a probability of 0.70 or greater. Hence, sets of such items were used to develop descriptions of what future teachers at (or above) the anchor points were likely
THE TEACHER EDUCATION AND DEVELOPMENT STUDY IN MATHEMATICS (TEDS-M)136
to achieve. Items that future teachers were likely to answer correctly with a probability
of less than 0.50 were items that the teachers were unlikely to answer correctly. A panel
of mathematicians and mathematics educators analyzed the items classified at these
anchor points and formulated descriptions of the knowledge that future teachers at
each point held.
5.4.1 Future Primary Teachers’ Mathematics Knowledge
This section describes the mathematics knowledge of future primary teachers in the
study. It starts with MCK and concludes with MPCK. To help readers understand the
levels of knowledge reached by the future teachers across the program-groups, the
anchor points are described and then illustrated through reference to a small number of
selected released items. Finally, summary tables and charts are provided and commented
on in order to facilitate international comparisons.
5.4.1.1 Anchor points for the primary MCK scale
Two anchor points were defined for the primary-level MCK scale. Anchor Point 1,
representing a lower level of MCK, corresponds to a scale score of 431. Anchor Point 2,
representing a higher level of knowledge, corresponds to a scale score of 516.
•Primary MCK Anchor Point 1: future primary teachers scoring at Anchor Point 1
on the primary MCK scale were likely to correctly answer items involving basic
computations with whole numbers, identification of properties of operations with
whole numbers, and reasoning about odd or even numbers. They were generally
able to solve straightforward problems using simple fractions. Future teachers at
this anchor point were also likely to achieve success at visualizing and interpreting
standard two-dimensional and three-dimensional geometric figures, and solving
routine problems about perimeter. They could generally understand straightforward
uses of variables and equivalence of expressions, and solve problems involving simple
equations.
Future primary teachers at Anchor Point 1 also tended to over-generalize and
have difficulty solving abstract problems and problems requiring multiple steps.
They had limited knowledge of proportionality, multiplicative reasoning, and least
common multiples, and had difficulty solving problems that involved coordinates
and problems about relations between geometric figures. Future primary teachers at
Anchor Point 1 were also likely to have difficulty reasoning about multiple statements
and relationships among several mathematical concepts (such as understanding that
there is an infinite number of rational numbers between two given numbers), finding
the area of a triangle drawn on a grid, and identifying an algebraic representation of
three consecutive even numbers.
• Primary MCK Anchor Point 2: in addition to being able to solve the mathematics
tasks that future teachers at Anchor Point 1 could do, future teachers at Anchor
Point 2 also tended to be successful at using fractions to solve story problems and at
recognizing examples of rational and irrational numbers. They were likely to know
how to find the least common multiple of two numbers in a familiar context and to
recognize that some arguments about whole numbers are logically weak. They were
generally able to determine areas and perimeters of simple figures and had some
notion of class inclusion among polygons. Future teachers at Anchor Point 2 also had
some familiarity with linear expressions and functions.

137TEACHERS’ MATHEMATICS CONTENT AND PEDAGOGICAL KNOWLEDGE
Although future primary teachers at Anchor Point 2 could solve some problems
involving proportional reasoning, they often had trouble reasoning about factors,
multiples, and percentages. They found applications of quadratic or exponential
functions challenging, and they had limited success applying algebra to geometric
situations, such as writing an expression for the reflection image of the point with
coordinates (a, b) over the x-axis, identifying a set of geometric statements that
uniquely define a square, and describing properties of a linear function.
Overall, future teachers at Anchor Point 2 tended to do well on items classified as testing
the cognitive domain of knowing, and on standard problems related to numbers,
geometry, and algebra and classified as applying. However, they were likely to have more
difficulty answering problems requiring more complex reasoning in applied or non-
routine situations. For example, the items in Exhibit 5.7 assess whether respondents
know that the commutative and associative properties hold for addition of whole
numbers, but not for subtraction. Parts A, B, and C illustrate items on which future
teachers with scores at Anchor Point 1 or above had high probabilities of success. The
item in Part D behaved differently. Although 64% of the international sample answered
this item correctly, future teachers with scores at Anchor Point 1 had particular difficulty
answering this item correctly: they had a less than 50% chance of responding correctly.
However, future primary teachers with scores at or above Anchor Point 2 had higher
probabilities of selecting the correct answer.
Exhibit 5.8 shows a geometry item that asked respondents to find the area of a triangle
in which neither the magnitude of the base nor the height is indicated. Future primary
teachers with scores at or above Anchor Point 2 on the MCK scale were likely to respond
correctly to this item. Future primary teachers scoring at Anchor Point 1 were not.
The item depicted in Exhibit 5.9 asks a non-routine algebra question about two
expressions in which the underlying mathematics involves the solution of an inequality.
Approximately 35% of the international sample of future primary teachers earned some
credit on this item. Even future teachers with scores at Anchor Point 2 had less than a
50% chance of responding correctly, either partially or completely, to this item.
Exhibit 5.7: Complex multiple-choice MCK Items MFC202A–D*
Indicate whether each of the following statements is true for the set of all whole numbers a, b and c greater than zero.
Check one box in each row.
True Not True
A. a – b = b – a
b. a ÷ b = b ÷ a
C. (a + b) + c = a + (b + c)
D. (a – b) – c = a – (b – c)
Note: * International average percent correct: MFC202 A (81%), B (86%), C (92%), D (64%).

THE TEACHER EDUCATION AND DEVELOPMENT STUDY IN MATHEMATICS (TEDS-M)138
5.4.1.2 MCK results by primary program-group
Exhibit 5.10 shows descriptive statistics and box plots of the achievement of future
primary teachers in each of the program-groups. MCK Anchor Point 1 (431) and
Anchor Point 2 (516) are marked by vertical lines on the display.
Useful comparisons can be made within each country and within each program-type.
Because program-types have different goals and structures, it is perhaps less useful for the
purposes of this chapter to make comparisons between program-types. A characteristic
common to all countries in all four primary program-groups, however, is the wide
range of achievement within each country. Even the highest achieving countries had
some future teachers achieving relatively low scores, and every low-achieving country
had some future primary teachers with scores above Anchor Point 1 (431).
A second finding is that, within each program-group, the difference between the highest
mean MCK scale score and the lowest mean MCK scale score is at least 100 points,
that is, more than one standard deviation. So, on average in some countries, future
teachers at the primary level graduate with considerably more content knowledge than
others, even when grade level and degree of specialization are similar. Nevertheless, in
each program-group, distributions of MCK scale scores overlapped considerably. Thus,
even in the lower-scoring countries, there were some future teachers who outperformed
some of the future teachers in the higher-scoring countries.
Exhibit 5.8: Multiple-choice MCK Item MFC408*
The area of each small square is 1 cm2
What is the area of the shaded triangle in cm2?
Check one box.
A. 3.5 cm2
b. 4 cm2
C. 4.5 cm2
D. 5 cm2
Note: * International average percent correct: 60%.
Exhibit 5.9: Constructed-response MCK Item MFC509*
Students who had been studying algebra were asked the following question:
for any number n, which is larger, 2n or n + 2?
Give the answer and show your reasoning or working.
Note: * International average percent correct: full credit (12%), partial credit (21%).

139TEACHERS’ MATHEMATICS CONTENT AND PEDAGOGICAL KNOWLEDGE
Exh
ibit
5.1
0: F
utur
e pr
imar
y te
ache
rs’ m
athe
mat
ics
cont
ent k
now
ledg
e
Perc
entil
es
5th
25th
75
th
95th
Mea
n an
d C
onfid
ence
Inte
rval
(± 2
SE)
200
30
0 40
0 50
0 60
0 70
0 80
0
Sam
ple
Siz
eV
alid
Dat
a (N
)Pe
rcen
t M
issi
ng
(Wei
ghte
d)
Perc
ent
at
or
abov
e A
ncho
r Po
int
1 (S
E)
Perc
ent
at
or
abov
e A
ncho
r Po
int
2 (S
E)
Scal
ed S
core
:
Mea
n(S
E)
Pro
gra
m-G
roup
Co
untr
y
Not
es:
1. T
his
tab
le a
nd
char
t m
ust
be
read
wit
h a
war
enes
s of
th
e lim
itat
ion
s an
not
ated
on
pag
e 13
4 of
th
is c
hap
ter
and
den
oted
in t
he
abov
e by
foot
not
e le
tter
s.2.
Th
e da
gger
sym
bol (
†) is
use
d to
ale
rt r
eade
rs t
o si
tuat
ion
s w
her
e da
ta w
ere
avai
labl
e fr
om fe
wer
th
an 8
5% o
f re
spon
den
ts.
3. T
he
shad
ed a
reas
iden
tify
dat
a th
at, f
or r
easo
ns
expl
ain
ed in
th
e lim
itat
ion
s, c
ann
ot b
e co
mpa
red
wit
h c
onfi
den
ce t
o da
ta fr
om
o
ther
cou
ntr
ies.
4. T
he
solid
ver
tica
l lin
es o
n t
he
char
t sh
ow t
he
two
anch
or p
oin
ts (
431
and
516)
.
Geo
rgia
50
6 50
6 0.
0 11
.9
(1.4
) 0.
9 (0
.5)
345
(4)
Ger
man
y 93
5 90
7 2.
4 86
.4
(1.3
) 43
.9
(2.1
) 50
1 (3
)
Pola
nd a
1,81
2 1,
799
0.9
67.9
(1
.3)
16.8
(1
.2)
456
(2)
Russ
ian
fede
ratio
n b
2,26
6 2,
260
0.2
89.7
(2
.3)
57.3
(4
.6)
536
(10)
Switz
erla
nd c
121
121
0.0
90.5
(2
.7)
44.2
(5
.4)
512
(6)
Chi
nese
Tai
pei
923
923
0.0
99.4
(0
.3)
93.2
(1
.4)
623
(4)
Phili
ppin
es
592
592
0.0
60.7
(5
.1)
6.3
(0.9
) 44
0 (8
)
Sing
apor
e 26
3 26
2 0.
4 10
0.0
82
.5
(2.3
) 58
6 (4
)
Spai
n 1,
093
1,09
3 0.
0 83
.4
(1.6
) 26
.2
(1.6
) 48
1 (3
)
Switz
erla
nd
815
815
0.0
97.2
(0
.6)
70.6
(1
.4)
548
(2)
Uni
ted
Stat
es †
d 1,
310
951
28.6
92
.9
(1.2
) 50
.0
(3.2
) 51
8 (5
)
bots
wan
a e
86
86
0.0
60.6
(5
.3)
7.1
(2.8
) 44
1 (6
)
Chi
le f
657
654
0.4
39.5
(1
.8)
4.0
(0.7
) 41
3 (2
)
Nor
way
(ALU
) g 39
2 39
2 0.
0 88
.5
(1.5
) 46
.9
(2.8
) 50
9 (4
)
Nor
way
(ALU
+) g
159
159
0.0
96.5
(1
.4)
68.7
(3
.8)
553
(6)
Ger
man
y 97
97
0.
0 96
.0
(2.1
) 71
.7
(7.0
) 55
5 (8
)
Mal
aysi
a 57
6 57
4 0.
4 88
.7
(1.1
) 28
.1
(1.3
) 48
8 (2
)
Pola
nd a
300
300
0.0
97.9
(1
.0)
91.0
(1
.6)
614
(5)
Sing
apor
e 11
7 11
7 0.
0 98
.3
(1.2
) 87
.3
(2.8
) 60
0 (8
)
Thai
land
66
0 66
0 0.
0 91
.7
(0.9
) 56
.2
(1.4
) 52
8 (2
)
Uni
ted
Stat
es †
d 19
1 13
2 33
.2
94.9
(1
.7)
48.1
(6
.5)
520
(7)
Mat
hem
atic
s C
on
ten
t
Gro
up 1
.Lo
wer
Prim
ary
(to
Gra
de 4
M
axim
um)
Gro
up 4
.Pr
imar
y M
athe
mat
ics
Spec
ialis
ts
Gro
up 2
.Pr
imar
y(t
o G
rade
6
Max
imum
)
Gro
up 3
.Pr
imar
y an
d Se
cond
ary
Gen
eral
ists
(to
Gra
de 1
0 M
axim
um)
THE TEACHER EDUCATION AND DEVELOPMENT STUDY IN MATHEMATICS (TEDS-M)140
Of the future teachers in the five countries with programs that prepare teachers for lower-primary grades (i.e., Program-Group 1), future teachers in the Russian Federation earned the highest mean score. The Russian Federation was the only country in that program-group in which more than half the sample achieved scores at or above Anchor Point 2.
Of the future teachers in the six countries that prepare primary generalists to teach through to Grade 6 (Program-Group 2), future teachers in Chinese Taipei earned the highest mean. Almost all future teachers in that country scored at or above Anchor Point 2. Performance was also strong among the Group 2 future teachers in Singapore and Switzerland, where most future teachers scored above Anchor Point 2.
In the programs preparing future teachers for teaching both primary and lower-secondary grades (i.e., the Group 3 programs), respondents in Botswana and in Chile generally found the MCK items difficult. Although the majority of future teachers in Botswana achieved above Anchor Point 1, few achieved above Anchor Point 2. Performance in the two Norwegian program-types was higher, with future teachers in the smaller ALU plus program-type achieving somewhat higher MCK scores than those in the ALU program-type.
Future teachers in programs for primary mathematics specialists in Group 4 generally performed well with respect to the international sample, with all but one country achieving a mean score greater than 500. Future teachers from Poland and Singapore achieved the highest mean MCK scores in this program-group, and almost all future teachers in both samples scored at or above Anchor Point 2.
5.4.1.3 Primary anchor point for MPCK
Because of the relatively small number of items measuring mathematics pedagogical content knowledge, only one anchor point was defined at the primary level. It represents a score of 544 on the MPCK scale.
Future primary teachers who scored at or above this anchor point were generally able to recognize whether or not a teaching strategy was correct for a particular concrete example, and to evaluate students’ work when the content was conventional or typical of the primary grades. They were also likely to identify the arithmetic elements of single-step story problems that influence the difficulty of these problems.
Although future primary teachers at the primary MPCK anchor point were generally able to interpret some students’ work, their responses were often unclear or imprecise. In addition, future teachers at this anchor point were unlikely to use concrete representations to support students’ learning or to recognize how a student’s thinking related to a particular algebraic representation. They were furthermore unlikely to understand some measurement or probability concepts needed to reword or design a task. These future teachers also rarely knew why a particular teaching strategy made sense, if it would always work, or whether a strategy could be generalized to a larger class of problems. They were unlikely to be aware of common misconceptions or to conceive useful representations of numerical concepts.
Exhibit 5.11 shows a primary-level, constructed-response item (MFC505) tapping
pedagogical content knowledge about curriculum and planning. This item required
future teachers to consider four story problems, each of which can be solved using
a single arithmetic operation with whole numbers. The future primary teachers with
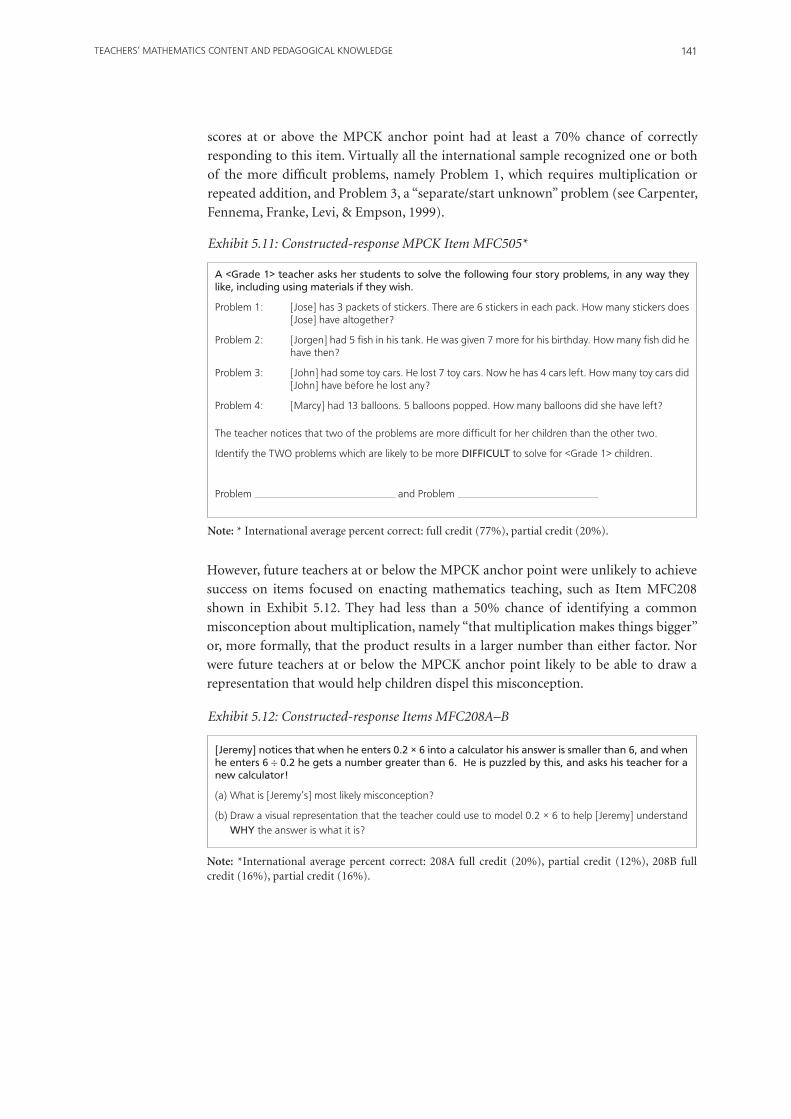
141TEACHERS’ MATHEMATICS CONTENT AND PEDAGOGICAL KNOWLEDGE
scores at or above the MPCK anchor point had at least a 70% chance of correctly
responding to this item. Virtually all the international sample recognized one or both
of the more difficult problems, namely Problem 1, which requires multiplication or
repeated addition, and Problem 3, a “separate/start unknown” problem (see Carpenter,
Fennema, Franke, Levi, & Empson, 1999).
Exhibit 5.11: Constructed-response MPCK Item MFC505*
A <Grade 1> teacher asks her students to solve the following four story problems, in any way they like, including using materials if they wish.
Problem 1: [Jose] has 3 packets of stickers. There are 6 stickers in each pack. How many stickers does [Jose] have altogether?
Problem 2: [Jorgen] had 5 fish in his tank. He was given 7 more for his birthday. How many fish did he have then?
Problem 3: [John] had some toy cars. He lost 7 toy cars. Now he has 4 cars left. How many toy cars did [John] have before he lost any?
Problem 4: [Marcy] had 13 balloons. 5 balloons popped. How many balloons did she have left?
The teacher notices that two of the problems are more difficult for her children than the other two.
Identify the TWO problems which are likely to be more DIFFICULT to solve for <Grade 1> children.
Problem and Problem
Note: * International average percent correct: full credit (77%), partial credit (20%).
However, future teachers at or below the MPCK anchor point were unlikely to achieve
success on items focused on enacting mathematics teaching, such as Item MFC208
shown in Exhibit 5.12. They had less than a 50% chance of identifying a common
misconception about multiplication, namely “that multiplication makes things bigger”
or, more formally, that the product results in a larger number than either factor. Nor
were future teachers at or below the MPCK anchor point likely to be able to draw a
representation that would help children dispel this misconception.
Exhibit 5.12: Constructed-response Items MFC208A–B
[Jeremy] notices that when he enters 0.2 × 6 into a calculator his answer is smaller than 6, and when he enters 6 ÷ 0.2 he gets a number greater than 6. He is puzzled by this, and asks his teacher for a new calculator!
(a) What is [Jeremy’s] most likely misconception?
(b) Draw a visual representation that the teacher could use to model 0.2 × 6 to help [Jeremy] understand WHY the answer is what it is?
Note: *International average percent correct: 208A full credit (20%), partial credit (12%), 208B full credit (16%), partial credit (16%).

THE TEACHER EDUCATION AND DEVELOPMENT STUDY IN MATHEMATICS (TEDS-M)142
5.4.1.4 MPCK results by primary program-group
Exhibit 5.13 shows descriptive statistics and box plots of the distributions of MPCK
scale scores for each country in each program-group; the MPCK anchor point (544)
is marked with a vertical line. In programs preparing lower-primary generalists—
Program-Group 1—most future teachers scored below the MPCK anchor point but
those teachers in two of the five programs achieved means above the international
average (500). Among the future generalist teachers in Program-Group 2, MPCK
performance was strongest in Chinese Taipei and Singapore, where approximately 75%
of the future teachers sampled scored above the anchor point and almost all above the
international mean. A small percentage of future teachers in Singapore in this program-
group performed exceptionally well on the MPCK items compared to future teachers in
all other countries and programs.
In programs preparing future teachers for both primary and lower-secondary grades,
(Program-Group 3), future teachers in both the ALU and ALU plus programs in
Norway were most successful. Their scale score means were at or above the anchor
point. However, it was only in the ALU plus sample that at least half of the future
teachers scored at or above the anchor point.
In programs preparing primary mathematics specialists, Program-Group 4, future
teachers in Singapore achieved the highest mean MPCK score, and more than 80%
scored at or above the MPCK anchor point. More than half of the future teachers in the
samples in Germany and Poland also scored at or above the anchor point.
5.4.2 Future Lower-Secondary Teachers’ Mathematics Knowledge
This section describes the mathematics knowledge of future lower-secondary teachers.
It starts with MCK and concludes with MPCK. As with the previous section, to help
readers understand the levels of knowledge reached by future teachers, we first describe
the anchor points and then illustrate these with a small number of selected released
items. We also provide summary tables and charts in order to facilitate international
comparisons.
5.4.2.1 Anchor points for the lower-secondary MCK scale
Two anchor points were selected for the lower-secondary MCK scale. Anchor Point 1
represents a lower level of performance and corresponds to a scale score of 490. Anchor
Point 2 represents a higher level and corresponds to a scale score of 559.
• Lower-secondary MCK Anchor Point 1: future teachers of lower-secondary school
mathematics who scored at (or above) Anchor Point 1 were likely to correctly answer
items involving concepts related to whole numbers, integers, and rational numbers,
and the associated computations. They were also likely to evaluate algebraic
expressions correctly, and solve simple linear and quadratic equations, particularly
those that can be solved by substitution or trial and error.
These preservice teachers were generally familiar with standard geometric figures
in the plane and space, and were able to identify and apply simple relations in plane
geometry. They were also able to interpret and solve more complex problems about
numbers, algebra, and geometry if the context or problem type was commonly
taught in lower-secondary schools.
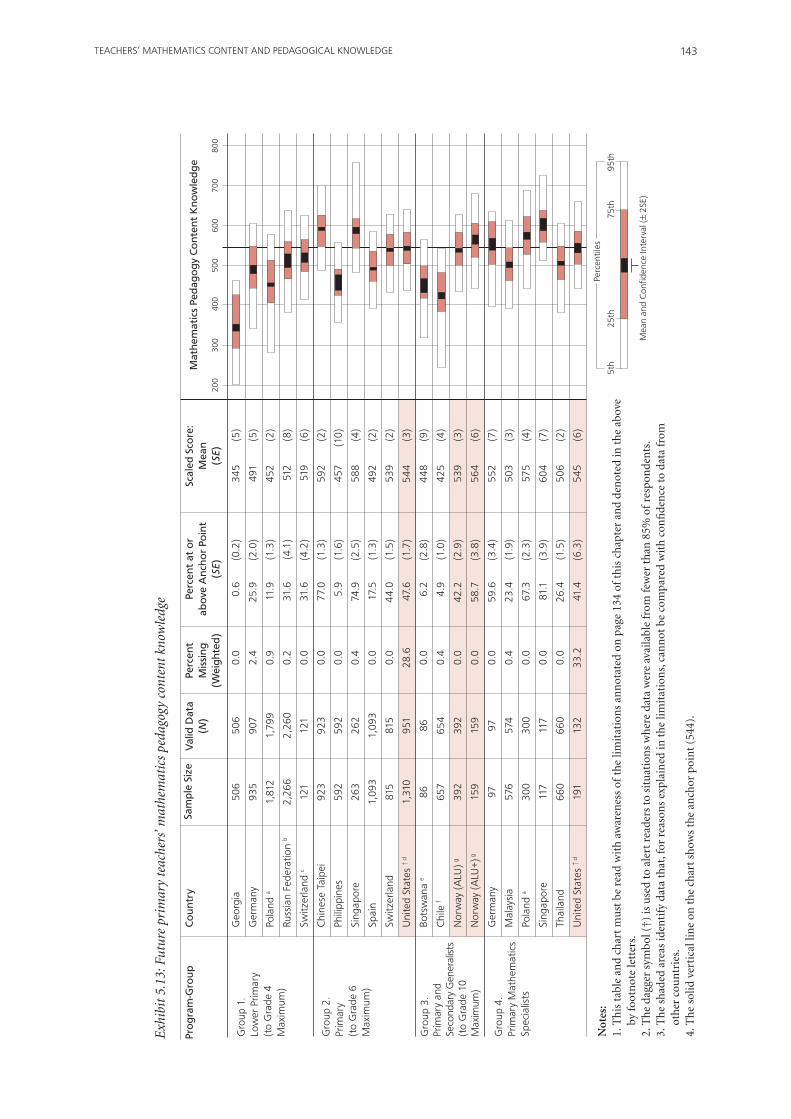
143TEACHERS’ MATHEMATICS CONTENT AND PEDAGOGICAL KNOWLEDGE
Exh
ibit
5.1
3: F
utur
e pr
imar
y te
ache
rs’ m
athe
mat
ics
peda
gogy
con
tent
kno
wle
dge
Perc
entil
es
5th
25th
75
th
95th
Mea
n an
d C
onfid
ence
Inte
rval
(± 2
SE)
200
30
0 40
0 50
0 60
0 70
0 80
0
Sam
ple
Siz
eV
alid
Dat
a (N
)Pe
rcen
t M
issi
ng
(Wei
ghte
d)
Perc
ent
at o
r ab
ove
An
cho
r Po
int
(SE)
Scal
ed S
core
:
Mea
n(S
E)
Pro
gra
m-G
roup
Co
untr
y
Not
es:
1. T
his
tab
le a
nd
char
t m
ust
be
read
wit
h a
war
enes
s of
th
e lim
itat
ion
s an
not
ated
on
pag
e 13
4 of
th
is c
hap
ter
and
den
oted
in t
he
abov
e by
foot
not
e le
tter
s.2.
Th
e da
gger
sym
bol (
†) is
use
d to
ale
rt r
eade
rs t
o si
tuat
ion
s w
her
e da
ta w
ere
avai
labl
e fr
om fe
wer
th
an 8
5% o
f re
spon
den
ts.
3. T
he
shad
ed a
reas
iden
tify
dat
a th
at, f
or r
easo
ns
expl
ain
ed in
th
e lim
itat
ion
s, c
ann
ot b
e co
mpa
red
wit
h c
onfi
den
ce t
o da
ta fr
om
o
ther
cou
ntr
ies.
4. T
he
solid
ver
tica
l lin
e on
th
e ch
art
show
s th
e an
chor
poi
nt
(544
).
Mat
hem
atic
s Pe
dag
ogy
Co
nte
nt
Kn
ow
led
ge
Geo
rgia
50
6 50
6 0.
0 0.
6 (0
.2)
345
(5)
Ger
man
y 93
5 90
7 2.
4 25
.9
(2.0
) 49
1 (5
)
Pola
nd a
1,81
2 1,
799
0.9
11.9
(1
.3)
452
(2)
Russ
ian
fede
ratio
n b
2,26
6 2,
260
0.2
31.6
(4
.1)
512
(8)
Switz
erla
nd c
121
121
0.0
31.6
(4
.2)
519
(6)
Chi
nese
Tai
pei
923
923
0.0
77.0
(1
.3)
592
(2)
Phili
ppin
es
592
592
0.0
5.9
(1.6
) 45
7 (1
0)
Sing
apor
e 26
3 26
2 0.
4 74
.9
(2.5
) 58
8 (4
)
Spai
n 1,
093
1,09
3 0.
0 17
.5
(1.3
) 49
2 (2
)
Switz
erla
nd
815
815
0.0
44.0
(1
.5)
539
(2)
Uni
ted
Stat
es †
d 1,
310
951
28.6
47
.6
(1.7
) 54
4 (3
)
bots
wan
a e
86
86
0.0
6.2
(2.8
) 44
8 (9
)
Chi
le f
657
654
0.4
4.9
(1.0
) 42
5 (4
)
Nor
way
(ALU
) g 39
2 39
2 0.
0 42
.2
(2.9
) 53
9 (3
)
Nor
way
(ALU
+) g
159
159
0.0
58.7
(3
.8)
564
(6)
Ger
man
y 97
97
0.
0 59
.6
(3.4
) 55
2 (7
)
Mal
aysi
a 57
6 57
4 0.
4 23
.4
(1.9
) 50
3 (3
)
Pola
nd a
300
300
0.0
67.3
(2
.3)
575
(4)
Sing
apor
e 11
7 11
7 0.
0 81
.1
(3.9
) 60
4 (7
)
Thai
land
66
0 66
0 0.
0 26
.4
(1.5
) 50
6 (2
)
Uni
ted
Stat
es †
d 19
1 13
2 33
.2
41.4
(6
.3)
545
(6)
Gro
up 1
.Lo
wer
Prim
ary
(to
Gra
de 4
M
axim
um)
Gro
up 2
.Pr
imar
y(t
o G
rade
6
Max
imum
)
Gro
up 4
.Pr
imar
y M
athe
mat
ics
Spec
ialis
ts
Gro
up 3
.Pr
imar
y an
d Se
cond
ary
Gen
eral
ists
(to
Gra
de 1
0 M
axim
um)

THE TEACHER EDUCATION AND DEVELOPMENT STUDY IN MATHEMATICS (TEDS-M)144
Future teachers scoring at Anchor Point 1 were likely to have difficulty describing
general patterns, solving multi-step problems with complex linguistic or mathematical
relations, and relating equivalent representations of concepts. They tended to over-
generalize concepts, and generally did not have a good grasp of mathematical
reasoning. In particular, they found recognizing faulty arguments and justifying or
proving conclusions challenging.
• Lower-secondary MCK Anchor Point 2: the future teachers who scored at Anchor
Point 2 were likely to correctly do all the mathematics that could be done by a future
teacher at Anchor Point 1. In addition, the future teachers at Anchor Point 2 were
likely to correctly answer questions about functions (particularly linear, quadratic,
and exponential), to read, analyze, and apply abstract definitions and notation, and
to make and recognize simple arguments. They knew some definitions and theorems
typically taught in tertiary-level courses, such as calculus, abstract algebra, and college
geometry, and were generally able to apply them in straightforward situations.
However, the future teachers scoring at Anchor Point 2 were unlikely to solve problems
stated in purely abstract terms, or to work competently on foundational material,
such as axiomatic systems. They were likely to make errors in logical reasoning (e.g.,
not attending to all conditions of definitions or theorems and confusing the truth of
a statement with the validity of an argument), and they were unlikely to recognize
valid proofs of more complex statements. Although the future teachers scoring at
Anchor Point 2 could make some progress in constructing mathematical proofs, they
were rarely successful at completing mathematical proofs.
Exhibit 5.14 shows two of the items used to test future lower-secondary teachers’
abilities to apply school algebra; specifically, to solve story problems. Each item involves
three numbers whose sum is 198. Future teachers with scores at or above Anchor Point
1 were likely to achieve success on the first item, that is, they had at least a 70% chance
of getting this item correct.
Notice that in item MFC604A1, the numbers of marbles held by Peter and James are
described as multiples of the number of marbles held by David. The problem can
therefore be solved by setting up a simple linear equation with one unknown and one
integer coefficient. In contrast, the second item has a more complex linguistic structure,
making it less obvious which quantity to use as the base of the comparisons, an outcome
that, in turn, leads to a somewhat more complex equation. Future teachers with scores
at Anchor Point 1 were unlikely to achieve success on MFC604A2. Here, they had less
than a 50% chance of responding correctly to the item. In contrast, those prospective
teachers with scores at Anchor Point 2 had at least a 70% chance of answering item
MFC604A2 correctly.
Exhibits 5.15 and 5.16 show MCK items that differ in content domains, item formats,
and item difficulties. Both the multi-step geometry problem in Exhibit 5.15 and the
straightforward combinatorics item in Exhibit 5.16 illustrate items that future teachers
with MCK scores at Anchor Point 2 were unlikely to answer correctly.
5.4.2.2 MCK results by lower-secondary program-group
Exhibit 5.17 provides descriptive statistics for scores on the lower-secondary MCK
survey by program-group. It also shows box plots of the distributions of scores, with
MCK Anchor Point 1 (490) and Anchor Point 2 (559) marked on the display.

145TEACHERS’ MATHEMATICS CONTENT AND PEDAGOGICAL KNOWLEDGE
As was the case for the distributions of MCK at the primary level, the future teachers’
knowledge varied widely within and across countries. In the lower-secondary program-
group, Program-Group 5, the difference between the highest and the lowest mean MCK
scores was almost 200 points. In the lower- and upper-secondary Program-Group 6,
the differences between the highest and the lowest mean MCK scores were even greater.
However, distributions within the two program-groups also overlapped. Thus, even
in the lower-scoring countries within each program-group, there were some future
teachers who outperformed some future teachers in the higher-scoring countries.
The future lower-secondary teachers enrolled in programs leading to qualifications
to teach up to Grade 10, that is, Program-Group 5, typically found the MCK items
challenging. Only 3 of the 10 countries (Poland, Singapore, and Switzerland) had a
Exhibit 5.14: Constructed-response Items MFC604A1–A2*,**
The following problems appear in a mathematics textbook for <lower secondary school>.
1. [Peter], [David], and [James] play a game with marbles. They have 198 marbles altogether. [Peter] has 6 times as many marbles as [David], and [James] has 2 times as many marbles as [David]. How many marbles does each boy have?
2. Three children [Wendy], [Joyce] and [Gabriela] have 198 zeds altogether. [Wendy] has 6 times as much money as [Joyce], and 3 times as much as [Gabriela]. How many zeds does each child have?
(a) Solve each problem.
Solution to Problem 1
Solution to Problem 2
Notes:
* International average percent correct: 604A1 (72%), 604A2 (50%).
** Part (b) of this item assessing MPCK appears as Figure 5.19 later in this chapter.
Exhibit 5.15: Constructed-response Item MFC704*
On the figure, ABCD is a parallelogram, LBAD=60°, AM and BM are angle bisectors of angles BAD and ABC respectively. If the perimeter of ABCD is 6 cm, find the sides of triangle ABM.
Write your answers on the lines below.
AB = cm
AM = cm
BM = cm
Note: * International average percent correct: full credit (32%), partial credit (25%).
D M C
BA

THE TEACHER EDUCATION AND DEVELOPMENT STUDY IN MATHEMATICS (TEDS-M)146
mean score above the international mean. Even in the country with the highest mean
score, no more than 40% of the future secondary teachers scored at or above Anchor
Point 2.
In contrast, future teachers in 7 of the 12 countries preparing to teach students in the
lower- and upper-secondary grades (Program-Group 6) scored, on average, above the
international mean. The performance of the future teachers in Chinese Taipei was
particularly strong, with about 96% of them scoring at or above Anchor Point 2. In all
countries except Botswana, some future teachers reached Anchor Point 2.
5.4.2.3 Lower-secondary anchor point for MPCK
As was the case at the primary level, the relatively small number of items measuring
mathematics pedagogical content knowledge meant that only one anchor point for
MPCK was defined at the lower-secondary level. It corresponds to a scale score of 509.
The future lower-secondary teachers who scored at (or above) this point were likely
to have some knowledge of the lower-secondary curriculum and of planning for
instruction. For instance, they were likely to identify prerequisites for teaching a
derivation of the quadratic formula, and they could generally determine consequences
of moving the concept of square root from the lower-secondary to the upper-secondary
school mathematics curriculum. They were likely to show some skill in enacting
(teaching) school mathematics. Future teachers at this level were able to evaluate
students’ mathematical work correctly in some situations. For example, they could
generally determine if a student’s diagram satisfied certain given conditions in geometry,
and to recognize a student’s correct argument about divisibility of whole numbers.
The future teachers at this anchor point were also likely to successfully analyze students’
errors when the students’ work involved a single step or short explanations, for
example, identifying an error in a histogram. They struggled, however, to identify or
analyze errors in more complex mathematical situations. For instance, they could not
consistently apply a rubric with descriptions of three performance levels to evaluate
students’ solutions to a problem about linear and non-linear growth.
In general, the future teachers’ own depth of mathematical understanding seemed
to influence their ability to interpret students’ thinking or to determine appropriate
responses to students. Because future teachers at this level seem to lack a well-developed
concept of the meaning of a valid mathematical argument, they frequently were unable
to evaluate some invalid arguments. In particular, they generally did not recognize that
examples are not sufficient to constitute a proof.
Exhibit 5.16: Multiple-choice MCK Item MFC804*
A class has 10 students. If at one time, 2 students are to be chosen, and another time 8 students are to be chosen from the class, which of the following statements is true?
Check one box.
A. There are more ways to choose 2 students than 8 students from the class.
b. There are more ways to choose 8 students than 2 students from the class.
C. The number of ways to choose 2 students equals the number of ways to choose 8 students.
D. It is not possible to determine which selection has more possibilities.
Note: * International average percent correct: 35%.

147TEACHERS’ MATHEMATICS CONTENT AND PEDAGOGICAL KNOWLEDGE
bots
wan
a a
34
34
0.0
6.0
(4.2
) 0.
0
436
(7)
Chi
le b
746
741
0.6
1.2
(0.4
) 0.
0
354
(3)
Ger
man
y 40
8 40
6 0.
3 53
.5
(3.4
) 12
.6
(2.2
) 48
3 (5
)
Phili
ppin
es
733
733
0.0
14.0
(3
.0)
0.2
(0.1
) 44
2 (5
)
Pola
nd c
158
158
0.0
75.6
(3
.5)
34.7
(3
.2)
529
(4)
Sing
apor
e 14
2 14
2 0.
0 86
.9
(3.1
) 36
.6
(4.3
) 54
4 (4
)
Switz
erla
nd d
141
141
0.0
79.7
(3
.4)
26.7
(3
.2)
531
(4)
Nor
way
(ALU
) e 35
6 34
4 3.
9 19
.3
(1.6
) 0.
8 (0
.4)
461
(5)
Nor
way
(ALU
+) e
151
148
1.9
36.1
(3
.7)
2.3
(1.4
) 43
5 (3
)
Uni
ted
Stat
es †
f 16
9 12
1 32
.7
33.5
(2
.2)
2.1
(1.3
) 46
8 (4
)
bots
wan
a a
19
19
0.0
21.1
(7
.4)
0.0
44
9 (8
)
Chi
nese
Tai
pei
365
365
0.0
98.6
(0
.8)
95.6
(1
.0)
667
(4)
Geo
rgia
g 78
78
0.
0 18
.2
(4.4
) 5.
0 (2
.6)
424
(9)
Ger
man
y 36
3 36
2 0.
1 93
.4
(1.5
) 62
.1
(2.9
) 58
5 (4
)
Mal
aysi
a 38
9 38
8 0.
2 57
.1
(2.3
) 6.
9 (0
.9)
493
(2)
Om
an
268
268
0.0
37.1
(2
.7)
1.8
(0.6
) 47
2 (2
)
Pola
nd
140
139
0.8
85.7
(2
.6)
35.7
(2
.7)
549
(4)
Russ
ian
fede
ratio
n h
2,14
1 2,
139
0.1
88.8
(1
.7)
61.1
(4
.3)
594
(13)
Sing
apor
e 25
1 25
1 0.
0 97
.6
(1.0
) 62
.9
(2.6
) 58
7 (4
)
Thai
land
65
2 65
2 0.
0 41
.0
(1.5
) 8.
4 (1
.1)
479
(2)
Nor
way
(PPU
& M
aste
rs) e
65
65
0.0
57.8
(7
.9)
16.0
(4
.6)
503
(8)
Uni
ted
Stat
es †
f 43
8 35
4 21
.3
87.1
(2
.0)
44.5
(3
.9)
553
(5)
Exh
ibit
5.1
7: F
utur
e lo
wer
-sec
onda
ry te
ache
rs’ m
athe
mat
ics
cont
ent k
now
ledg
e
Perc
entil
es
5th
25th
75
th
95th
Mea
n an
d C
onfid
ence
Inte
rval
(± 2
SE)
200
30
0 40
0 50
0 60
0 70
0 80
0
Sam
ple
Si
zeV
alid
D
ata
(N)
Perc
ent
Mis
sin
g (W
eigh
ted
)
Perc
ent
at
or
abov
e A
ncho
r Po
int
1 (S
E)
Perc
ent
at
or
abov
e A
ncho
r Po
int
2 (S
E)
Scal
ed S
core
:
Mea
n(S
E)
Pro
gra
m-G
roup
Co
untr
y
Not
es:
1. T
his
tab
le a
nd
char
t m
ust
be
read
wit
h a
war
enes
s of
th
e lim
itat
ion
s an
not
ated
on
pag
e 13
5 of
th
is c
hap
ter
and
den
oted
in t
he
abov
e by
foot
not
e le
tter
s.2.
Th
e da
gger
sym
bol (
†) is
use
d to
ale
rt r
eade
rs t
o si
tuat
ion
s w
her
e da
ta w
ere
avai
labl
e fr
om fe
wer
th
an 8
5% o
f re
spon
den
ts.
3. T
he
shad
ed a
reas
iden
tify
dat
a th
at, f
or r
easo
ns
expl
ain
ed in
th
e lim
itat
ion
s, c
ann
ot b
e co
mpa
red
wit
h c
onfi
den
ce t
o da
ta fr
om
o
ther
cou
ntr
ies.
4. T
he
solid
ver
tica
l lin
es o
n t
he
char
t sh
ow t
he
two
anch
or p
oin
ts (
490
and
559)
.
Mat
hem
atic
s C
on
ten
t K
no
wle
dg
e
Gro
up 5
.Lo
wer
Sec
onda
ry(t
o G
rade
10
Max
imum
)
Gro
up 6
.Lo
wer
and
Upp
er
Seco
ndar
y (t
o G
rade
11
and
abov
e)
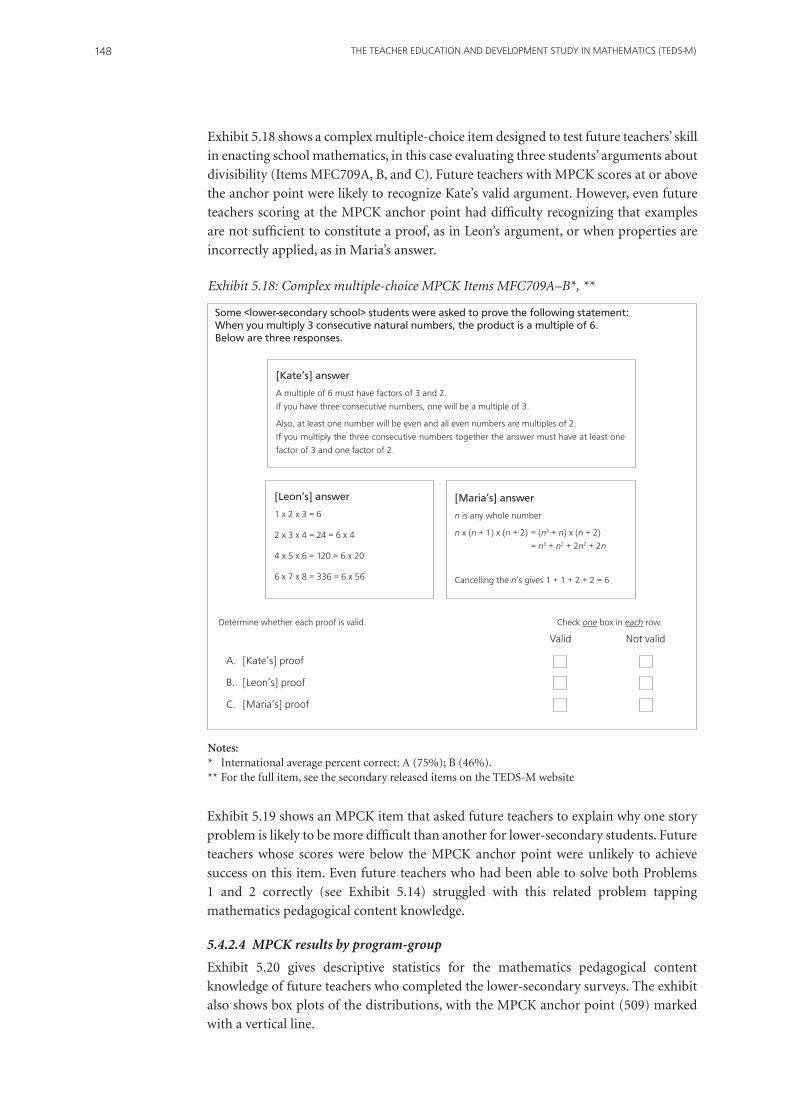
THE TEACHER EDUCATION AND DEVELOPMENT STUDY IN MATHEMATICS (TEDS-M)148
Exhibit 5.18 shows a complex multiple-choice item designed to test future teachers’ skill
in enacting school mathematics, in this case evaluating three students’ arguments about
divisibility (Items MFC709A, B, and C). Future teachers with MPCK scores at or above
the anchor point were likely to recognize Kate’s valid argument. However, even future
teachers scoring at the MPCK anchor point had difficulty recognizing that examples
are not sufficient to constitute a proof, as in Leon’s argument, or when properties are
incorrectly applied, as in Maria’s answer.
Exhibit 5.18: Complex multiple-choice MPCK Items MFC709A–B*, **
Some <lower-secondary school> students were asked to prove the following statement:When you multiply 3 consecutive natural numbers, the product is a multiple of 6.Below are three responses.
Determine whether each proof is valid. Check one box in each row.
Valid Not valid
A. [Kate’s] proof
b. [Leon’s] proof
C. [Maria’s] proof
[Kate’s] answer
A multiple of 6 must have factors of 3 and 2.
If you have three consecutive numbers, one will be a multiple of 3.
Also, at least one number will be even and all even numbers are multiples of 2.
If you multiply the three consecutive numbers together the answer must have at least one
factor of 3 and one factor of 2.
[Leon’s] answer
1 x 2 x 3 = 6
2 x 3 x 4 = 24 = 6 x 4
4 x 5 x 6 = 120 = 6 x 20
6 x 7 x 8 = 336 = 6 x 56
[Maria’s] answer
n is any whole number
n x (n + 1) x (n + 2) = (n2 + n) x (n + 2)
= n3 + n2 + 2n2 + 2n
Cancelling the n’s gives 1 + 1 + 2 + 2 = 6
Notes: * International average percent correct: A (75%); B (46%).** For the full item, see the secondary released items on the TEDS-M website
Exhibit 5.19 shows an MPCK item that asked future teachers to explain why one story
problem is likely to be more difficult than another for lower-secondary students. Future
teachers whose scores were below the MPCK anchor point were unlikely to achieve
success on this item. Even future teachers who had been able to solve both Problems
1 and 2 correctly (see Exhibit 5.14) struggled with this related problem tapping
mathematics pedagogical content knowledge.
5.4.2.4 MPCK results by program-group
Exhibit 5.20 gives descriptive statistics for the mathematics pedagogical content
knowledge of future teachers who completed the lower-secondary surveys. The exhibit
also shows box plots of the distributions, with the MPCK anchor point (509) marked
with a vertical line.

149TEACHERS’ MATHEMATICS CONTENT AND PEDAGOGICAL KNOWLEDGE
Four of the 10 countries in Program-Group 5 achieved mean scores above the
international mean whereas 6 of the 12 countries in Program-Group 6 achieved this
benchmark. In every country, some future teachers scored at or above the MPCK
anchor point. The future teachers in Switzerland and Singapore achieved the highest
mean MPCK scores among those teachers preparing to teach students in the lower-
secondary grades (i.e., Program-Group 5); more than 60% of these teachers in the
two countries scored at or above the MPCK anchor point.
Among the future teachers preparing to teach lower- and upper-secondary grades (i.e.,
Program-Group 6), the performance of the future teachers from Chinese Taipei was
particularly strong, with more than 93% of the sample achieving scores at or above the
MPCK anchor point. In Germany, Poland, the Russian Federation, Singapore, and the
United States, the majority of the future teachers also scored at or above the MPCK
anchor point.
5.5 Conclusion
It is natural to wonder what accounts for differences in knowledge across and within
countries. The answer to this question requires additional analyses, and is beyond
the scope of this report. For each participating unit—a country or an institution, for
example—the results of TEDS-M serve as baseline data from which to carry out further
investigation. For instance, content experts might choose to look at the descriptions
of the anchor points for MCK and MPCK and the percentage of the future teachers
graduating from their unit who reach each anchor point. They might then want to study
how changes in curricula may lead to improved performance. Policymakers might want
to investigate policies that can be implemented to encourage more talented secondary
school graduates to select teaching as a career. Or they might want to look at whether
extending the duration of teacher preparation programs can lead to higher scores on
MCK and MPCK scales.
Exhibit 5.19: Constructed-response MPCK Item MFC604B from the lower-secondary survey*, **
(b) Typically, Problem 2 is more difficult than Problem 1 for <lower secondary> students. Give one reason that might account for the difference in difficulty level.
Notes: * International average percent correct: 39%.** See Exhibit 5.14 for the item stimulus.
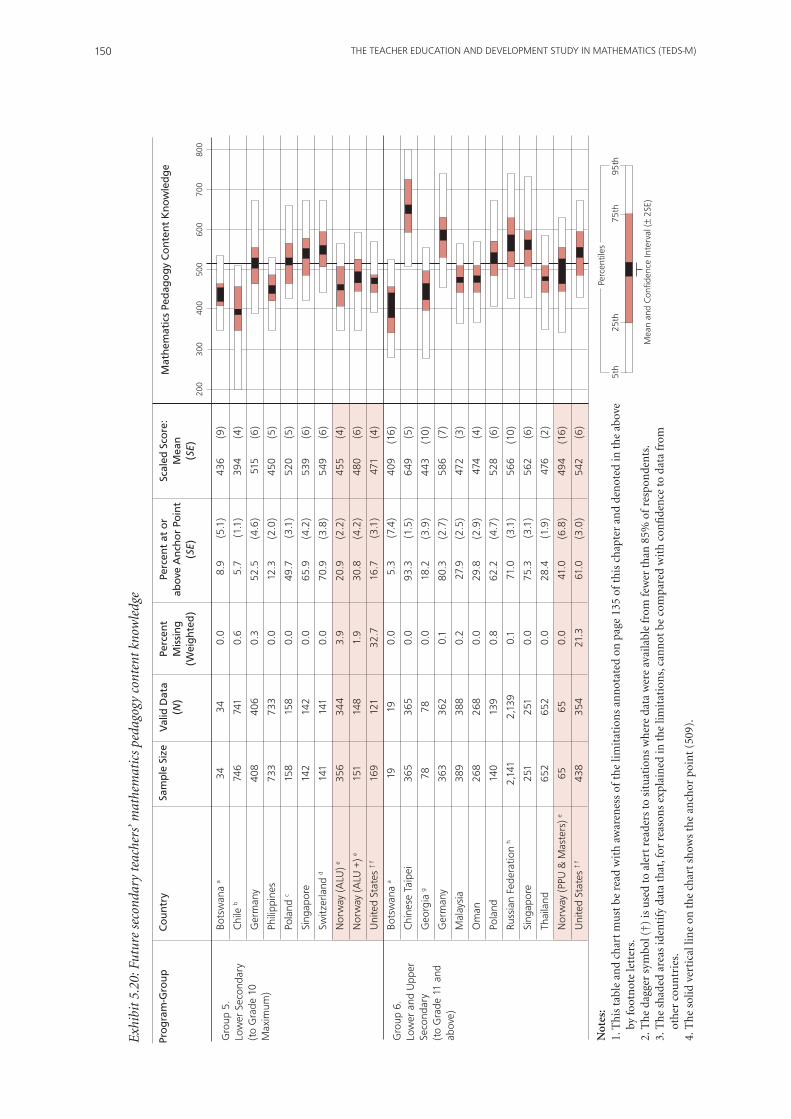
THE TEACHER EDUCATION AND DEVELOPMENT STUDY IN MATHEMATICS (TEDS-M)150
Mat
hem
atic
s Pe
dag
ogy
Co
nte
nt
Kn
ow
led
ge
Exh
ibit
5.2
0: F
utur
e se
cond
ary
teac
hers
’ mat
hem
atic
s pe
dago
gy c
onte
nt k
now
ledg
e
Perc
entil
es
5th
25th
75
th
95th
Mea
n an
d C
onfid
ence
Inte
rval
(± 2
SE)
200
30
0 40
0 50
0 60
0 70
0 80
0
Pro
gra
m-G
roup
Co
untr
y
Not
es:
1. T
his
tab
le a
nd
char
t m
ust
be
read
wit
h a
war
enes
s of
th
e lim
itat
ion
s an
not
ated
on
pag
e 13
5 of
th
is c
hap
ter
and
den
oted
in t
he
abov
e by
foot
not
e le
tter
s.2.
Th
e da
gger
sym
bol (
†) is
use
d to
ale
rt r
eade
rs t
o si
tuat
ion
s w
her
e da
ta w
ere
avai
labl
e fr
om fe
wer
th
an 8
5% o
f re
spon
den
ts.
3. T
he
shad
ed a
reas
iden
tify
dat
a th
at, f
or r
easo
ns
expl
ain
ed in
th
e lim
itat
ion
s, c
ann
ot b
e co
mpa
red
wit
h c
onfi
den
ce t
o da
ta fr
om
o
ther
cou
ntr
ies.
4. T
he
solid
ver
tica
l lin
e on
th
e ch
art
show
s th
e an
chor
poi
nt
(509
).
bots
wan
a a
34
34
0.0
8.9
(5.1
) 43
6 (9
)
Chi
le b
746
741
0.6
5.7
(1.1
) 39
4 (4
)
Ger
man
y 40
8 40
6 0.
3 52
.5
(4.6
) 51
5 (6
)
Phili
ppin
es
733
733
0.0
12.3
(2
.0)
450
(5)
Pola
nd c
158
158
0.0
49.7
(3
.1)
520
(5)
Sing
apor
e 14
2 14
2 0.
0 65
.9
(4.2
) 53
9 (6
)
Switz
erla
nd d
141
141
0.0
70.9
(3
.8)
549
(6)
Nor
way
(ALU
) e 35
6 34
4 3.
9 20
.9
(2.2
) 45
5 (4
)
Nor
way
(ALU
+) e
151
148
1.9
30.8
(4
.2)
480
(6)
Uni
ted
Stat
es †
f 16
9 12
1 32
.7
16.7
(3
.1)
471
(4)
bots
wan
a a
19
19
0.0
5.3
(7.4
) 40
9 (1
6)
Chi
nese
Tai
pei
365
365
0.0
93.3
(1
.5)
649
(5)
Geo
rgia
g 78
78
0.
0 18
.2
(3.9
) 44
3 (1
0)
Ger
man
y 36
3 36
2 0.
1 80
.3
(2.7
) 58
6 (7
)
Mal
aysi
a 38
9 38
8 0.
2 27
.9
(2.5
) 47
2 (3
)
Om
an
268
268
0.0
29.8
(2
.9)
474
(4)
Pola
nd
140
139
0.8
62.2
(4
.7)
528
(6)
Russ
ian
fede
ratio
n h
2,14
1 2,
139
0.1
71.0
(3
.1)
566
(10)
Sing
apor
e 25
1 25
1 0.
0 75
.3
(3.1
) 56
2 (6
)
Thai
land
65
2 65
2 0.
0 28
.4
(1.9
) 47
6 (2
)
Nor
way
(PPU
& M
aste
rs) e
65
65
0.0
41.0
(6
.8)
494
(16)
Uni
ted
Stat
es †
f 43
8 35
4 21
.3
61.0
(3
.0)
542
(6)
Sam
ple
Siz
eV
alid
Dat
a (N
)Pe
rcen
t M
issi
ng
(Wei
ghte
d)
Perc
ent
at o
r ab
ove
An
cho
r Po
int
(SE)
Scal
ed S
core
:
Mea
n(S
E)
Gro
up 5
.Lo
wer
Sec
onda
ry(t
o G
rade
10
Max
imum
)
Gro
up 6
.Lo
wer
and
Upp
er
Seco
ndar
y (t
o G
rade
11
and
abov
e)

151TEACHERS’ MATHEMATICS CONTENT AND PEDAGOGICAL KNOWLEDGE
References
An, S., Kulm, G., & Wu, Z. (2004). The pedagogical content knowledge of middle school mathematics
teachers in China and the U.S. Journal of Mathematics Teacher Education, 7, 145–172.
Baumert, J., Kunter, M., Blum, W., Brunner, M., Voss, T., Jordan, A., … Tsai, Y-M. (2010). Teachers’
mathematical knowledge, cognitive activation in the classroom, and student progress. American
Educational Research Journal, 47(1), 133–180.
Carpenter, T. P., Fennema, E. Franke, M. L., Levi, L., & Empson, S. E. (1999). Children’s mathematics:
Cognitively guided instruction. Westport, CT: Heinemann.
Committee on the Study of Teacher Preparation Programs in the United States. (2010). Preparing
teachers: Building evidence for sound policy. Washington, DC: National Research Council, the
National Academies. Available online at http://www.nap.edu/catalog.php?record_id=12882
Conference Board of the Mathematical Sciences. (2001). The mathematical education of teachers:
Issues in mathematics education (Vol. 11). Washington, DC: American Mathematical Society.
Even, R., & Ball, D. L. (Eds.). (2009). The professional education and development of teachers of
mathematics: The 15th ICMI study (New ICMI Study Series, 11). New York, NY: Springer.
Garden, R., Lie, S., Robitaille, D. F., Angell, C., Martin, M. O., Mullis, I. V. S., …Arora, A. (2006).
TIMSS Advanced 2008 assessment frameworks. Chestnut Hill, MA: Boston College.
Hill, H. C., & Ball, D. L. (2004). Learning mathematics for teaching: Results from California’s
mathematics professional development institutes. Journal of Research in Mathematics Education,
35, 330–351.
Hill, H. C., Rowan, B., & Ball, D. L. (2005). Effects of teachers’ mathematical knowledge for teaching
on student achievement. American Educational Research Journal, 42(2), 371– 406.
Mullis, I. V. S., Martin, M. O., Ruddock, G. J., O’Sullivan, C. Y., Arora, A., & Erberber, E. (2007).
TIMSS 2007 assessment frameworks. Chestnut Hill, MA: Boston College.
Pepin, B. (1999). Existing models of knowledge in teaching: Developing an understanding of the
Anglo/American, the French and the German scene. In B. Hudson, F. Buchberger, P. Kansanen, &
H. Seel (Eds.), Didaktik/Fachdidaktik as Science(s) of the Teaching Profession? (pp. 49–66). Umeå,
Sweden: TNTEE Publications.
Schmidt, W. H., Blömeke, S., & Tatto, M. T. (Eds.). (2011). Teacher education matters: A study of
middle school mathematics teacher preparation in six countries. New York, NY: Teachers College
Press.
Schmidt, W., Tatto, M. T., Bankov, K., Blömeke, S., Cedillo, T., Cogan, L., … Schwille, J. (2007,
December). The preparation gap: Teacher education for middle school mathematics in six countries
(MT21 report) (NSF REC 0231886/January 2003). East Lansing, MI: Michigan State University.
Available online at http://usteds.msu.edu/MT21Report.pdf
Senk, S. L., Peck, R., Bankov, K., & Tatto, M. T. (2008). Conceptualizing and measuring mathematical
knowledge for teaching: Issues from TEDS-M, an IEA cross-national study. Paper prepared for Topic
Study Group 27 (mathematical knowledge for teaching) of the 11th International Congress on
Mathematical Education, Monterrey, Mexico, July 6–13, 2008. Available online at http://tsg.icme11.
org/document/get/746
Shulman, L. (1987). Knowledge and teaching: Foundations of the new reform. Harvard Educational
Review, 57, 1–22.
Tatto, M. T. (2012). TEDS-M 2008 technical report. Amsterdam, the Netherlands: International
Association for Educational Achievement (IEA).
Tatto, M. T., Schwille, J., Senk, S., Ingvarson, L., Peck, R., & Rowley, G. (2008). Teacher Education
and Development Study in Mathematics (TEDS-M): Conceptual framework. Amsterdam, the
Netherlands: International Association for Educational Achievement (IEA).

THE TEACHER EDUCATION AND DEVELOPMENT STUDY IN MATHEMATICS (TEDS-M)152
153
CHAPTER 6: BELIEFS ABOUT MATHEMATICS AND MATHEMATICS LEARNING
6.1 Chapter OverviewAs noted in Chapter 1, one of the key research questions for TEDS-M was this one: What beliefs about the nature of mathematics and about teaching and learning mathematics do future teachers hold at the end of their preparation? While content knowledge and pedagogical knowledge are acknowledged to be essential for successful teaching, there is also widespread agreement that the beliefs held by teachers and students are an important influence on teaching and learning. However, there is little conclusive evidence that beliefs can be effectively influenced by teacher preparation or that they are an intrinsic characteristic of those individuals who become teachers (Tatto & Coupland, 2003).
In his chapter written for the Second Handbook of Research on Mathematics Teaching (Lester, 2007), Randolph Philipp focused on what he termed “teachers’ orientations.” An orientation refers to a pattern of beliefs that a teacher may hold about mathematics and mathematics teaching. Philipp (2007), building on work carried out by Thompson (1992) and by Thompson, Philipp, Thompson, and Boyd (1994), identified two orientations—conceptual and calculational—to describe important dimensions on which teachers are known to differ. In Philipp’s (2007) words, a teacher with a conceptual
orientation is one whose actions
are driven by an image of a system of ideas and ways of thinking she intends her students to develop; an image of how these ideas and ways of thinking can be developed; ideas about features of materials, activities and expositions and the students’ engagement with them that can orient students’ attention in productive ways; and an expectation and insistence that students will be intellectually engaged in tasks and activities. (p. 303)
The actions of a teacher with a calculational orientation, however,
are driven by a fundamental image of mathematics as the application of calculations and procedures for deriving numerical results. Associated with a calculational orientation is a tendency to speak exclusively in the language of number and numerical operations, a predisposition to cast problem solving as producing a numerical solution, and a tendency to disregard context … (p. 304)
It is reasonable to expect that teachers holding these different patterns of belief will engage in different classroom practices, and Philipp cites research evidence (Thompson et al., 1994) suggesting that they do. The extent to which these different practices impact on student outcomes is far from clear, and what evidence there is tends to come from quasi-experimental or naturalistic studies, such as that by Staub and Stern (2002). They compared achievement gains made by Grade 3 students taught by teachers holding a cognitive-constructivist orientation (which focuses strongly on concepts and holds that understanding is based on restructuring one’s own prior knowledge) with those made by students whose teachers held a direct-transmission view (which focuses more on acquiring basic numerical facts and mastering routines and procedures). They found
that
students whose Grade 3 teachers had a stronger cognitive constructivist orientation … displayed higher achievement gains in demanding mathematical word problems than did students whose Grade 3 teachers had less of a cognitive constructivist view, subscribing instead to pedagogical content beliefs that are consistent with a direct-transmission view of learning
and teaching. (p. 354)

THE TEACHER EDUCATION AND DEVELOPMENT STUDY IN MATHEMATICS (TEDS-M)154
Interestingly, Staub and Stern (2002) also found that students taught by teachers with
a cognitive-constructivist orientation achieved as well as or better at routine tasks
involving mathematical facts and procedures than did students of teachers whose
orientation was directed more toward such tasks.
Evidence such as this suggests that the beliefs about mathematics and mathematics
learning that beginning teachers carry with them may influence how they teach, and
subsequently may influence how their students learn. For this reason, TEDS-M resolved
to gather data about three aspects of future teachers’ mathematics-related beliefs:
1. Beliefs about the nature of mathematics;
2. Beliefs about learning mathematics; and
3. Beliefs about mathematics achievement.
Although the measures developed for TEDS-M might be seen as loosely related to
the calculational versus conceptual and the direct transmission versus cognitive-
constructivist distinctions described above, they should not be seen as equivalent to
them.
The development of the TEDS-M questionnaire scales was informed by work done as
part of the Teaching and Learning to Teach Study at Michigan State University (Deng,
1995; Tatto, 1996, 1998, 2003), and resulted in five belief scales covering the above three
areas. The items used to measure these five dimensions of beliefs about mathematics
and mathematics learning were drawn from a number of studies, including one by Deng
(1995), the feasibility study for TEDS-M (Schmidt et al., 2007), and several studies by
Tatto (1996, 1998, 1999, 2003).
6.2 Beliefs about the Nature of Mathematics
The items included in this area explored how the future teachers who participated in
TEDS-M perceived mathematics as a subject (e.g., mathematics as formal, structural,
procedural, or applied). The items are based on work by Grigutsch, Raatz, and Törner,
(1998) and others. Two scales were developed: mathematics as a set of rules and
procedures, and mathematics as a process of inquiry.
6.2.1 Mathematics as a Set of Rules and Procedures
Respondents who score highly on this scale tend to see mathematics as a set of procedures
to be learned, with strict rules as to what is correct and what is incorrect. They typically
agree with statements such as the following ones, included in the scale:
1. Mathematics is a collection of rules and procedures that prescribe how to solve a
problem.
2. Mathematics involves the remembering and application of definitions, formulas,
mathematical facts, and procedures.
3. When solving mathematical tasks, you need to know the correct procedure else
you would be lost.
4. Fundamental to mathematics is its logical rigor and precision.
5. To do mathematics requires much practice, correct application of routines, and
problem solving strategies.
6. Mathematics means learning, remembering, and applying.

155bELIEfS AbOUT MATHEMATICS AND MATHEMATICS LEARNING
6.2.2 Mathematics as a Process of Enquiry
Respondents who score highly on this scale see mathematics as a means of answering
questions and solving problems. They see mathematical procedures as tools of enquiry,
as means to an end, but not as ends in themselves. They typically agree with statements
such as the following ones that feature in the scale:
1. Mathematics involves creativity and new ideas.
2. In mathematics many things can be discovered and tried out by oneself.
3. If you engage in mathematical tasks, you can discover new things (e.g., connections,
rules, concepts).
4. Mathematical problems can be solved correctly in many ways.
5. Many aspects of mathematics have practical relevance.
6. Mathematics helps solve everyday problems and tasks.
Respondents are not forced to choose between the two sets of beliefs about the nature
of mathematics; it is quite possible for them to endorse both sets of propositions, that
is, to believe that mathematics is a set of rules and procedures and a process of enquiry.
In constructing the scales, however, the TEDS-M research team expected that future
teachers would lean toward one or other view of the nature of mathematics, and that
the two scales would be negatively correlated. In general, this was the case.
6.3 Beliefs about Learning Mathematics
In this section, we focus on the appropriateness of particular instructional activities,
questions about students’ cognitive processes, and questions about the purposes of
mathematics as a school subject. The TEDS-M research team developed two belief-
related scales: learning mathematics through following teacher direction, and learning
mathematics through active involvement.
6.3.1 Learning Mathematics through Following Teacher Direction
Respondents who score highly on this scale tend to see mathematics learning as being
heavily teacher-centered: the student’s role is to follow instructions from the teacher, and
through doing so learn mathematics. These respondents typically agree with statements
such as these ones included in the scale:
1. The best way to do well in mathematics is to memorize all the formulas.
2. Pupils need to be taught exact procedures for solving mathematical problems.
3. It doesn’t really matter if you understand a mathematical problem, if you can get
the right answer.
4. To be good in mathematics you must be able to solve problems quickly.
5. Pupils learn mathematics best by attending to the teacher’s explanations.
6. When pupils are working on mathematical problems, more emphasis should be
put on getting the correct answer than on the process followed.
7. Non-standard procedures should be discouraged because they can interfere with
learning the correct procedure.
8. Hands-on mathematics experiences aren’t worth the time and expense.

THE TEACHER EDUCATION AND DEVELOPMENT STUDY IN MATHEMATICS (TEDS-M)156
6.3.2 Learning Mathematics through Active Involvement
Respondents who score highly on this scale tend to see mathematics learning as being
active learning: students must do mathematics, conduct their own enquiries, and
develop ways to solve problems if their mathematics learning is to be effective. These
respondents usually agree with statements such as the following, included in the scale:
1. In addition to getting a right answer in mathematics, it is important to understand
why the answer is correct.
2. Teachers should allow pupils to figure out their own ways to solve mathematical
problems.
3. Time used to investigate why a solution to a mathematical problem works is time
well spent.
4. Pupils can figure out a way to solve mathematical problems without a teacher’s
help.
5. Teachers should encourage pupils to find their own solutions to mathematical
problems even if they are inefficient.
6. It is helpful for pupils to discuss different ways to solve particular problems.
As with the scales reflecting beliefs about the nature of mathematics, respondents are
not forced to choose between the two sets of beliefs about mathematics learning, and
can thus endorse both sets of propositions, believing that mathematics is learned both
through active student involvement and by following teacher directions. Our expectation
was that future teachers would lean toward one or the other view of learning, and that
the two scales would be negatively correlated. This proved to be the case.
6.4 Beliefs about Mathematics Achievement
6.4.1 Mathematics as a Fixed Ability
Respondents who scored highly on this scale tended to see mathematics achievement as
heavily dependent on the ability of the student: school mathematics is something that
is accessible to some students, and relatively inaccessible to others. For those holding
strongly to these beliefs, a key element of mathematics teaching is finding out which
students can learn mathematics well and which cannot. These respondents typically
agree with statements such as the following ones, included in the scale:
1. Since older pupils can reason abstractly, the use of hands-on models and other
visual aids becomes less necessary.
2. To be good at mathematics, you need to have a kind of “mathematical mind.”
3. Mathematics is a subject in which natural ability matters a lot more than effort.
4. Only the more able pupils can participate in multi-step problem-solving
activities.
5. In general, boys tend to be naturally better at mathematics than girls.
6. Mathematical ability is something that remains relatively fixed throughout a
person’s life.
7. Some people are good at mathematics and some aren’t.
8. Some ethnic groups are better at mathematics than others.

157bELIEfS AbOUT MATHEMATICS AND MATHEMATICS LEARNING
6.5 Scaling of Beliefs
Of the five scales developed, two—mathematics as a process of enquiry and learning
mathematics through active involvement—are largely consistent with the orientations
previously described as conceptual (Philipp, 2007) and as cognitive-constructionist
(Staub & Stern, 2002).
The next two scales—mathematics as a set of rules and procedures and learning mathematics
through following teacher direction—are more consistent with the orientations previously
described as calculational (Philipp, 2007) and direct-transmission (Staub & Stern,
2002).
The fifth scale, mathematics as a fixed ability, is not conceptually related to these
orientations. However, it reflects a view of mathematics learning that, if evident in
teachers’ actions, is likely to result in lower expectations for many students. This view is
therefore one that experts in mathematics education discourage.
The TEDS-M team used two methods to develop the scales:
• Itemresponsetheory(IRT)scales,fordocumentingrelationshipsamongmeasures;
• Percentendorsement,fordescriptivedisplay.
6.5.1 IRT Scales for Documenting Relationships among Measures
Using IRT to scale the survey items allowed us to investigate the relationships among
beliefs, mathematics content knowledge, and mathematics pedagogy content knowledge.
For each belief (survey item), the scale was defined so that a score of 10 corresponded
to a neutral response (i.e., equal propensity to agree or disagree with the statements
presented). Scores greater than 10 indicate responses that predominantly agree with
the statements; scores below 10 indicate responses that predominantly disagree with
the statements.
Effort was made during development of the scales to obtain the best possible matching of
the score to the underlying attribute. The scales are particularly suitable for quantifying
relationships among the beliefs or between beliefs and scores on other similarly
constructed TEDS-M scales, in particular, the standardized scores for mathematics
content knowledge and mathematics pedagogy content knowledge.
6.5.2 Percent Endorsement for Descriptive Display
Because IRT scores are not easily interpretable in terms of the extent of agreement or
disagreement with the statements that define the scales, we used a second procedure to
develop measures that would be easier to interpret and to present economically (i.e., in
descriptive displays). An account of this procedure follows.
In order to respond to each statement, respondents were asked to choose from six
response alternatives:
1. Strongly disagree
2. Disagree
3. Slightly disagree
4. Slightly agree
5. Agree
6. Strongly agree.
THE TEACHER EDUCATION AND DEVELOPMENT STUDY IN MATHEMATICS (TEDS-M)158
We considered Responses 5 and 6 (“agree” and “strongly agree”) to be endorsements of the respective statements, and Responses 1 through 4 (“strongly disagree” through to “slightly agree”) as failing to endorse statements. We acknowledge that a case could be made for including slightly agree as an endorsement, but we considered it at best a weak or qualified endorsement, and so excluded it.
For any group of respondents, the proportion of responses endorsing the statements is presented in this report as a measure of the group’s endorsement of the belief. If 90% of responses fell into the agree and strongly agree categories, the group responses indicated strong support for the belief; if only 10 or 20% of responses fell into these categories, the belief had little support from the group. Display of summary data in this form makes explicit just how much countries and groups within countries differ in the
extent to which they endorse the beliefs measured.
6.6 Results
6.6.1 IRT Scales
Descriptive statistics for the IRT scales are presented by program-group, within each country, in Exhibits A6.1 through A6.5 (for future primary teachers), Exhibits A6.6 through A6.10 (for future lower-secondary teachers), and Exhibits A6.11 through A6.15 (for teacher educators). All of these exhibits appear in Appendix A.
Scrutiny of these exhibits allowed us to make a number of generalizations about the data. The statement expressing beliefs most consistent with the conceptual and cognitive-constructivist views of mathematics learning (mathematics is a process of enquiry; learning mathematics requires active involvement) attracted much greater support than the statements expressing beliefs most consistent with the conceptual and calculational views of mathematics learning (mathematics is a set of rules and procedures; learning mathematics requires following teacher direction).
This pattern was common across countries, but not universal. The latter two beliefs were more prevalent than the former two in Georgia (the country where the range of beliefs was also greatest), the Philippines, Malaysia, and, to some extent, Botswana and Thailand.
Differences between patterns of response for the future primary teachers and for the future lower-secondary teachers were not easy to discern, but we could tell they were relatively small. In order to facilitate discernment of such patterns, we developed a set of descriptive charts, which we discuss in the following paragraphs.
6.6.2 Descriptive Displays
For any group of respondents (e.g., teacher educators in a particular country, future teachers in primary programs, etc.), percentage of responses provided a measure of the extent to which these groups endorsed the various scale statements. Thus, in Germany, of the responses received from teacher educators in relation to the six statements forming the mathematics as a set of rules and procedures scale, 27.8% (with a standard error of 1.6%) were categorized as endorsements. In contrast, 73.4% of responses from the German teacher educators endorsed the six statements forming the mathematics as a process of enquiry scale (standard error, 1.9%). Thus, we can infer that German teacher educators give relatively strong endorsement to mathematics as a process of enquiry and only limited support to mathematics as a set of rules and procedures.
Exhibit 6.1 provides a detailed breakdown of the extent (in percentages and standard errors) to which teacher educators, future primary teachers, and future lower-secondary teachers endorsed each of the five beliefs scales. The data for the future primary teachers

159bELIEfS AbOUT MATHEMATICS AND MATHEMATICS LEARNING
and future lower-secondary teachers are further broken down according to program-groups (the level of the education system at which these sets of teachers would be qualified to teach mathematics on graduating; see Section 2.2 of Chapter 2), as was done for the summary data on mathematics content knowledge and mathematics pedagogy content knowledge reported in Chapters 4 and 5.
Exhibits 6.2 through 6.6, which follow, present essentially the same information in graphic form, but reorganized by country, to allow readers to see the extent to which the teacher educators’ and the future teachers’ beliefs were consistent within countries. When interpreting the results presented in Exhibits 6.1 to 6.6 and our discussion of them, bear in mind the following annotations on the data for the listed countries. Although the patterns displayed in these figures are clear, there are sampling limitations that place constraints on the extent to which the data can be considered to represent national aggregates.
Limitation annotations for the data in Exhibits 6.1 to 6.8
a. Botswana: the sample sizes were small but arose from censuses of small populations.b. Chile: the combined participation rates for future teachers were between 60% and 75%. The
participation rate for teacher educators did not meet IEA standards, hence the red shading in some of the exhibits.
c. Germany: the participation rate for teacher educators did not meet IEA standards, hence the red shading in some of the exhibits.
d. Malaysia: the participation rate for teacher educators did not meet IEA standards, hence the red shading in some of the exhibits.
e. Poland: reduced coverage—institutions with consecutive programs only were not covered. The combined participation rate for future teachers (primary and lower-secondary) was between 60 and 75%.
f. Russian Federation: reduced coverage—secondary pedagogical institutions were excluded. An unknown number of the future lower-secondary teachers surveyed had previously qualified to become primary teachers.
g. Switzerland: the participation rate for teacher educators did not meet IEA standards, hence the red shading in some of the exhibits. The only institutions included were those where German is the primary language of use and instruction.
h. United States: reduced coverage—public institutions only. Exceptions were made to accept data from institutions where inclusion of only one additional participant would have brought the response rate to above the 50% threshold. The combined participation rates for both the primary and lower-secondary future teachers were between 60 and 75%. Both the primary and lower-secondary surveys contained records that were completed using a telephone interview. This method was used when circumstances did not allow administration of the full questionnaire. Data on beliefs were not obtained from these respondents (approximately 21% percent of each survey sample). Bias may therefore arise in the data because of the number of individuals who did not receive and complete the full questionnaire.
i. Norway: the combined participation rate was between 60 and 75% for the future primary teachers and 58% for the future lower-secondary teachers. Data were accepted from one institution because the inclusion of only one additional participant would have brought the response rate to above the 50% threshold. Program-types ALU, ALU plus mathematics, and PPU & Master’s are reported separately because the two populations partly overlap; data from these program types cannot therefore be aggregated. These figures do not represent national aggregates, hence the red shading in some of the exhibits.
i. Georgia: the combined participation rate was between 60 and 75% for the future lower-secondary teachers. Data were accepted from two institutions because the inclusion of only one additional participant in each would have brought the response rate to above the 50% threshold.
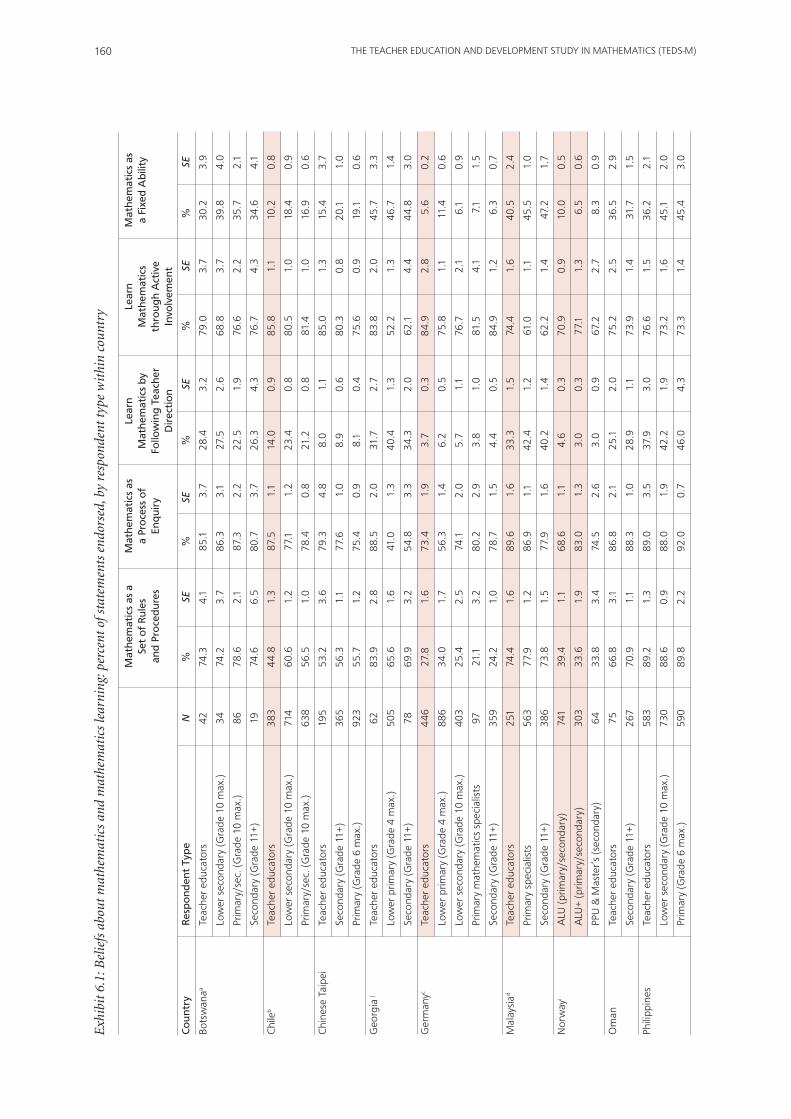
THE TEACHER EDUCATION AND DEVELOPMENT STUDY IN MATHEMATICS (TEDS-M)160
Exh
ibit
6.1
: Bel
iefs
abo
ut m
athe
mat
ics
and
mat
hem
atic
s le
arni
ng: p
erce
nt o
f sta
tem
ents
end
orse
d, b
y re
spon
dent
typ
e w
ithi
n co
untr
y
M
athe
mat
ics
as a
M
athe
mat
ics
as
Lear
n
Lear
n
Mat
hem
atic
s as
Se
t o
f R
ules
a
Pro
cess
of
Mat
hem
atic
s by
M
athe
mat
ics
a
Fixe
d A
bili
ty
and
Pro
ced
ures
En
qui
ry
Follo
win
g Te
ache
r th
roug
h A
ctiv
e
Dir
ecti
on
In
volv
emen
t
Co
untr
y R
esp
on
den
t Ty
pe
N
%
SE
%
SE
%
SE
%
SE
%
SE
bots
wan
aa Te
ache
r ed
ucat
ors
42
74.3
4.
1 85
.1
3.7
28.4
3.
2 79
.0
3.7
30.2
3.
9
Lo
wer
sec
onda
ry (G
rade
10
max
.)
34
74.2
3.
7 86
.3
3.1
27.5
2.
6 68
.8
3.7
39.8
4.
0
Pr
imar
y/se
c. (G
rade
10
max
.)
86
78.6
2.
1 87
.3
2.2
22.5
1.
9 76
.6
2.2
35.7
2.
1
Se
cond
ary
(Gra
de 1
1+)
19
74.6
6.
5 80
.7
3.7
26.3
4.
3 76
.7
4.3
34.6
4.
1
Chi
leb
Teac
her
educ
ator
s 38
3 44
.8
1.3
87.5
1.
1 14
.0
0.9
85.8
1.
1 10
.2
0.8
Lo
wer
sec
onda
ry (G
rade
10
max
.)
714
60.6
1.
2 77
.1
1.2
23.4
0.
8 80
.5
1.0
18.4
0.
9
Pr
imar
y/se
c. (G
rade
10
max
.)
638
56.5
1.
0 78
.4
0.8
21.2
0.
8 81
.4
1.0
16.9
0.
6
Chi
nese
Tai
pei
Teac
her
educ
ator
s 19
5 53
.2
3.6
79.3
4.
8 8.
0 1.
1 85
.0
1.3
15.4
3.
7
Se
cond
ary
(Gra
de 1
1+)
365
56.3
1.
1 77
.6
1.0
8.9
0.6
80.3
0.
8 20
.1
1.0
Pr
imar
y (G
rade
6 m
ax.)
92
3 55
.7
1.2
75.4
0.
9 8.
1 0.
4 75
.6
0.9
19.1
0.
6
Geo
rgia
j Te
ache
r ed
ucat
ors
62
83.9
2.
8 88
.5
2.0
31.7
2.
7 83
.8
2.0
45.7
3.
3
Lo
wer
prim
ary
(Gra
de 4
max
.)
505
65.6
1.
6 41
.0
1.3
40.4
1.
3 52
.2
1.3
46.7
1.
4
Se
cond
ary
(Gra
de 1
1+)
78
69.9
3.
2 54
.8
3.3
34.3
2.
0 62
.1
4.4
44.8
3.
0
Ger
man
yc Te
ache
r ed
ucat
ors
446
27.8
1.
6 73
.4
1.9
3.7
0.3
84.9
2.
8 5.
6 0.
2
Lo
wer
prim
ary
(Gra
de 4
max
.)
886
34.0
1.
7 56
.3
1.4
6.2
0.5
75.8
1.
1 11
.4
0.6
Lo
wer
sec
onda
ry (G
rade
10
max
.)
403
25.4
2.
5 74
.1
2.0
5.7
1.1
76.7
2.
1 6.
1 0.
9
Pr
imar
y m
athe
mat
ics
spec
ialis
ts
97
21.1
3.
2 80
.2
2.9
3.8
1.0
81.5
4.
1 7.
1 1.
5
Se
cond
ary
(Gra
de 1
1+)
359
24.2
1.
0 78
.7
1.5
4.4
0.5
84.9
1.
2 6.
3 0.
7
Mal
aysi
ad Te
ache
r ed
ucat
ors
251
74.4
1.
6 89
.6
1.6
33.3
1.
5 74
.4
1.6
40.5
2.
4
Pr
imar
y sp
ecia
lists
56
3 77
.9
1.2
86.9
1.
1 42
.4
1.2
61.0
1.
1 45
.5
1.0
Se
cond
ary
(Gra
de 1
1+)
386
73.8
1.
5 77
.9
1.6
40.2
1.
4 62
.2
1.4
47.2
1.
7
Nor
way
i A
LU (p
rimar
y/se
cond
ary)
74
1 39
.4
1.1
68.6
1.
1 4.
6 0.
3 70
.9
0.9
10.0
0.
5
A
LU+
(prim
ary/
seco
ndar
y)
303
33.6
1.
9 83
.0
1.3
3.0
0.3
77.1
1.
3 6.
5 0.
6
PP
U &
Mas
ter’
s (s
econ
dary
) 64
33
.8
3.4
74.5
2.
6 3.
0 0.
9 67
.2
2.7
8.3
0.9
Om
an
Teac
her
educ
ator
s 75
66
.8
3.1
86.8
2.
1 25
.1
2.0
75.2
2.
5 36
.5
2.9
Se
cond
ary
(Gra
de 1
1+)
267
70.9
1.
1 88
.3
1.0
28.9
1.
1 73
.9
1.4
31.7
1.
5
Phili
ppin
es
Teac
her
educ
ator
s 58
3 89
.2
1.3
89.0
3.
5 37
.9
3.0
76.6
1.
5 36
.2
2.1
Lo
wer
sec
onda
ry (G
rade
10
max
.)
730
88.6
0.
9 88
.0
1.9
42.2
1.
9 73
.2
1.6
45.1
2.
0
Pr
imar
y (G
rade
6 m
ax.)
59
0 89
.8
2.2
92.0
0.
7 46
.0
4.3
73.3
1.
4 45
.4
3.0

161bELIEfS AbOUT MATHEMATICS AND MATHEMATICS LEARNING
Exh
ibit
6.1
: Bel
iefs
abo
ut m
athe
mat
ics
and
mat
hem
atic
s le
arni
ng: p
erce
nt o
f sta
tem
ents
end
orse
d, b
y re
spon
dent
typ
e w
ithi
n co
untr
y (c
ontd
.)
M
athe
mat
ics
as a
M
athe
mat
ics
as
Lear
n
Lear
n
Mat
hem
atic
s as
Se
t o
f R
ules
a
Pro
cess
of
Mat
hem
atic
s by
M
athe
mat
ics
a
Fixe
d A
bili
ty
and
Pro
ced
ures
En
qui
ry
Follo
win
g Te
ache
r th
roug
h A
ctiv
e
Dir
ecti
on
In
volv
emen
t
Co
untr
y R
esp
on
den
t Ty
pe
N
%
SE
%
SE
%
SE
%
SE
%
SE
Pola
nde
Teac
her
educ
ator
s 70
6 43
.4
1.0
81.6
0.
9 8.
3 0.
6 85
.3
1.2
22.1
1.
0
Lo
wer
prim
ary
(Gra
de 4
max
.)
1,77
8 59
.6
1.0
53.6
1.
0 19
.4
0.6
70.6
0.
8 30
.3
0.6
Lo
wer
sec
onda
ry (G
rade
10
max
.)
156
45.4
2.
6 68
.6
2.1
12.0
1.
5 71
.9
2.0
21.4
1.
8
Pr
imar
y m
athe
mat
ics
spec
ialis
ts
298
38.6
2.
3 77
.2
2.0
7.7
0.6
80.6
2.
1 17
.3
1.3
Se
cond
ary
(Gra
de 1
1+)
138
35.5
2.
6 77
.8
2.9
6.7
1.1
75.8
2.
9 19
.4
1.6
Russ
ian
fede
ratio
nf Te
ache
r ed
ucat
ors
1,19
8 50
.0
1.4
73.1
0.
7 8.
2 0.
5 82
.0
0.8
16.8
0.
9
Lo
wer
prim
ary
(Gra
de 4
max
.)
2,22
5 54
.2
1.6
61.3
1.
6 17
.1
1.1
72.0
1.
6 26
.1
1.3
Se
cond
ary
(Gra
de 1
1+)
2,09
7 45
.3
1.5
63.7
1.
5 13
.8
1.0
68.4
1.
5 24
.8
1.0
Sing
apor
e Te
ache
r ed
ucat
ors
74
46.1
3.
5 79
.3
3.0
9.2
1.7
77.5
2.
3 15
.8
2.4
Lo
wer
sec
onda
ry (G
rade
10
max
.)
142
62.8
3.
0 73
.5
2.9
15.0
1.
5 68
.7
1.9
20.2
1.
4
Pr
imar
y (G
rade
6 m
ax.)
26
1 62
.5
1.8
76.4
1.
7 12
.5
1.0
71.2
1.
6 16
.0
1.1
Pr
imar
y m
athe
mat
ics
spec
ialis
ts
117
64.1
2.
4 83
.5
2.4
10.9
1.
5 74
.4
2.3
14.9
1.
6
Se
cond
ary
(Gra
de 1
1+)
251
59.8
1.
8 77
.0
1.4
13.6
1.
0 64
.7
1.8
18.1
1.
5
Spai
n Te
ache
r ed
ucat
ors
523
50.4
1.
6 87
.8
0.9
8.3
0.7
76.3
1.
2 10
.0
0.6
Pr
imar
y (G
rade
6 m
ax.)
1,
086
54.2
1.
5 73
.4
1.4
11.8
0.
5 68
.6
1.7
13.9
0.
5
Switz
erla
ndg
Teac
her
educ
ator
s 21
4 29
.0
2.2
76.7
1.
8 3.
9 0.
5 86
.4
1.4
5.6
0.8
Lo
wer
prim
ary
(Gra
de 4
max
.)
119
33.8
2.
4 60
.8
2.2
3.2
0.5
82.5
1.
9 4.
8 0.
6
Lo
wer
sec
onda
ry (G
rade
10
max
.)
140
27.3
1.
9 72
.0
2.0
3.4
0.6
83.1
1.
8 7.
0 1.
1
Pr
imar
y (G
rade
6 m
ax.)
81
2 28
.0
1.0
63.3
0.
9 2.
8 0.
2 81
.2
0.6
6.5
0.4
Thai
land
Te
ache
r ed
ucat
ors
306
70.7
2.
1 84
.9
1.5
10.3
0.
9 72
.5
1.9
34.1
1.
5
Pr
imar
y m
athe
mat
ics
spec
ialis
ts
656
77.2
0.
9 83
.8
0.9
12.0
0.
5 71
.4
0.9
36.1
0.
8
Se
cond
ary
(Gra
de 1
1+)
645
77.6
0.
7 83
.3
0.9
15.3
0.
7 71
.8
0.9
40.2
1.
0
Uni
ted
Stat
esh
Low
er s
econ
dary
(Gra
de 1
0 m
ax.)
12
6 67
.6
5.8
82.3
2.
1 10
.7
2.5
73.7
1.
8 10
.0
1.6
Pr
imar
y (G
rade
6 m
ax.)
1,
005
59.2
1.
9 77
.9
1.3
9.8
0.8
72.8
0.
9 9.
8 0.
8
Pr
imar
y m
athe
mat
ics
spec
ialis
ts
144
61.1
3.
8 83
.3
1.7
9.7
1.6
77.3
1.
6 9.
2 2.
3
Se
cond
ary
(Gra
de 1
1+)
365
52.1
2.
0 86
.8
1.6
6.1
1.1
73.5
1.
8 6.
3 0.
7
Not
e: T
his
tab
le s
hou
ld b
e re
ad in
con
jun
ctio
n w
ith
th
e lim
itat
ion
s a
thro
ugh
h a
nn
otat
ed o
n p
age
159.
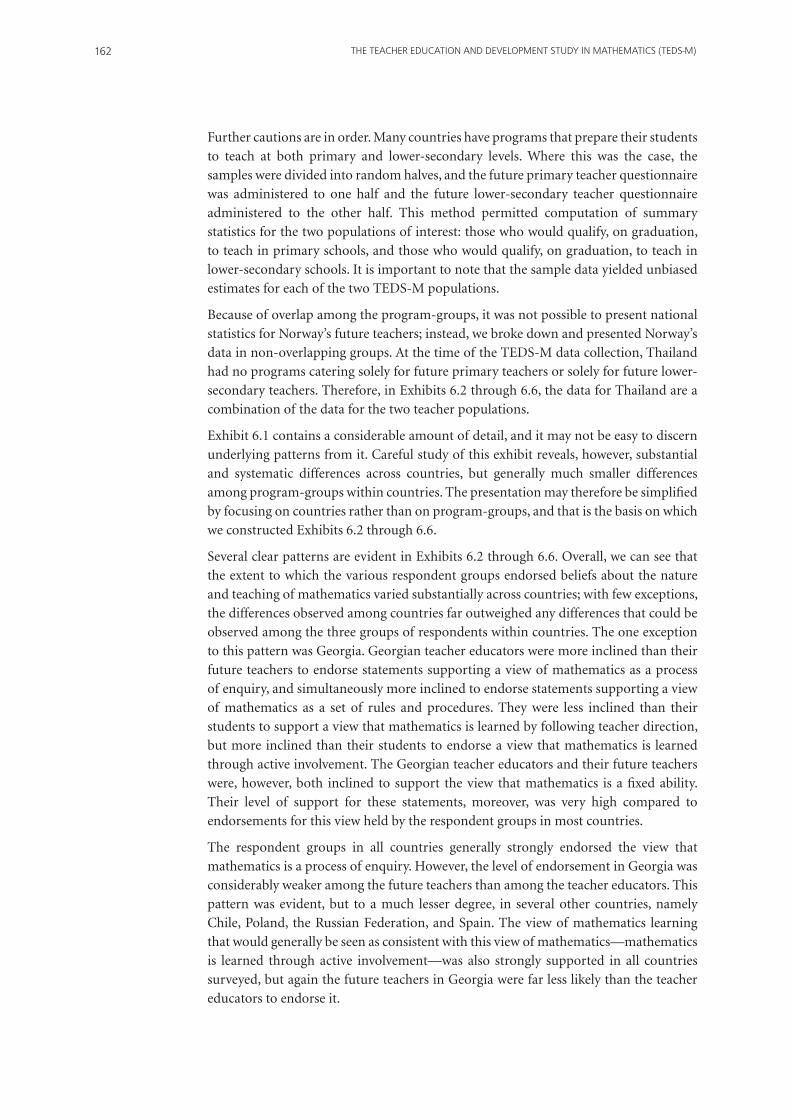
THE TEACHER EDUCATION AND DEVELOPMENT STUDY IN MATHEMATICS (TEDS-M)162
Further cautions are in order. Many countries have programs that prepare their students
to teach at both primary and lower-secondary levels. Where this was the case, the
samples were divided into random halves, and the future primary teacher questionnaire
was administered to one half and the future lower-secondary teacher questionnaire
administered to the other half. This method permitted computation of summary
statistics for the two populations of interest: those who would qualify, on graduation,
to teach in primary schools, and those who would qualify, on graduation, to teach in
lower-secondary schools. It is important to note that the sample data yielded unbiased
estimates for each of the two TEDS-M populations.
Because of overlap among the program-groups, it was not possible to present national
statistics for Norway’s future teachers; instead, we broke down and presented Norway’s
data in non-overlapping groups. At the time of the TEDS-M data collection, Thailand
had no programs catering solely for future primary teachers or solely for future lower-
secondary teachers. Therefore, in Exhibits 6.2 through 6.6, the data for Thailand are a
combination of the data for the two teacher populations.
Exhibit 6.1 contains a considerable amount of detail, and it may not be easy to discern
underlying patterns from it. Careful study of this exhibit reveals, however, substantial
and systematic differences across countries, but generally much smaller differences
among program-groups within countries. The presentation may therefore be simplified
by focusing on countries rather than on program-groups, and that is the basis on which
we constructed Exhibits 6.2 through 6.6.
Several clear patterns are evident in Exhibits 6.2 through 6.6. Overall, we can see that
the extent to which the various respondent groups endorsed beliefs about the nature
and teaching of mathematics varied substantially across countries; with few exceptions,
the differences observed among countries far outweighed any differences that could be
observed among the three groups of respondents within countries. The one exception
to this pattern was Georgia. Georgian teacher educators were more inclined than their
future teachers to endorse statements supporting a view of mathematics as a process
of enquiry, and simultaneously more inclined to endorse statements supporting a view
of mathematics as a set of rules and procedures. They were less inclined than their
students to support a view that mathematics is learned by following teacher direction,
but more inclined than their students to endorse a view that mathematics is learned
through active involvement. The Georgian teacher educators and their future teachers
were, however, both inclined to support the view that mathematics is a fixed ability.
Their level of support for these statements, moreover, was very high compared to
endorsements for this view held by the respondent groups in most countries.
The respondent groups in all countries generally strongly endorsed the view that
mathematics is a process of enquiry. However, the level of endorsement in Georgia was
considerably weaker among the future teachers than among the teacher educators. This
pattern was evident, but to a much lesser degree, in several other countries, namely
Chile, Poland, the Russian Federation, and Spain. The view of mathematics learning
that would generally be seen as consistent with this view of mathematics—mathematics
is learned through active involvement—was also strongly supported in all countries
surveyed, but again the future teachers in Georgia were far less likely than the teacher
educators to endorse it.

163bELIEfS AbOUT MATHEMATICS AND MATHEMATICS LEARNING
Exhibit 6.2: Mathematics is a set of rules and procedures: percentages of future teachers and teacher educators endorsing this statement, by country
botswanaa Primary Lower-Secondary Teacher Educators
Chileb Primary Lower-Secondary Teacher Educators
Chinese Taipei Primary Lower-Secondary
Teacher Educators
Georgia j Primary Lower-Secondary Teacher Educators
Germanyc Primary Lower-Secondary Teacher Educators
Malaysiad Primary Lower-Secondary Teacher Educators
Oman Lower-Secondary
Teacher Educators
Philippines Primary Lower-Secondary Teacher Educators
Polande Primary Lower-Secondary Educators
Russian federationf Primary Lower-Secondary Teacher Educators
Singapore Primary Lower-Secondary Teacher Educators
Spain Primary Teacher Educators
Switzerlandg Primary Lower-Secondary Teacher Educators
Thailand Primary/Lower-Secondary Teacher Educators
United Statesh Primary Lower-Secondary
Norwayi ALU Primary/Lower-Secondary
ALU+ Primary/Lower-Secondary PPU & Master’s Lower-Secondary
Participation rate at or near requirement, except where noted in the limitations annotated earlier in this chapter.
Sample falls short of requirements because of low participation rates and/or overlapping samples (see limitation annotations).
0 10 20 30 40 50 60 70 80 90 100
Note: Participation rate at or near requirement, except where noted in the limitations annotated on page 159.
THE TEACHER EDUCATION AND DEVELOPMENT STUDY IN MATHEMATICS (TEDS-M)164
Exhibit 6.3: Mathematics is a process of enquiry: percentages of future teachers and teacher educators endorsing this statement, by country
botswanaa Primary Lower-Secondary Teacher Educators
Chileb Primary Lower-Secondary Teacher Educators
Chinese Taipei Primary Lower-Secondary
Teacher Educators
Georgia j Primary Lower-Secondary Teacher Educators
Germanyc Primary Lower-Secondary Teacher Educators
Malaysiad Primary Lower-Secondary Teacher Educators
Oman Secondary
Teacher Educators
Philippines Primary Lower-Secondary Teacher Educators
Polande Primary Lower-Secondary Teacher Educators
Russian federationf Primary Lower-Secondary Teacher Educators
Singapore Primary Lower-Secondary Teacher Educators
Spain Primary Teacher Educators
Switzerlandg Primary Lower-Secondary Teacher Educators
Thailand Primary/Lower-Secondary Teacher Educators
United Statesh Primary Lower-Secondary
Norwayi ALU Primary/Lower-Secondary
ALU+ Primary/Lower-Secondary PPU & Master’s Lower-Secondary
Participation rate at or near requirement, except where noted in the limitations annotated earlier in this chapter.
Sample falls short of requirements because of low participation rates and/or overlapping samples (see limitation annotations).
0 10 20 30 40 50 60 70 80 90 100
Note: Participation rate at or near requirement, except where noted in the limitations annotated on page 159.

165bELIEfS AbOUT MATHEMATICS AND MATHEMATICS LEARNING
Exhibit 6.4: Learn mathematics by following teacher direction: percentages of future teachers and teacher educators endorsing this statement, by country
botswanaa Primary Lower-Secondary Teacher Educators
Chileb Primary Lower-Secondary Teacher Educators
Chinese Taipei Primary Lower-Secondary
Teacher Educators
Georgia j Primary Lower-Secondary Teacher Educators
Germanyc Primary Lower-Secondary Teacher Educators
Malaysiad Primary Lower-Secondary Teacher Educators
Oman Lower-Secondary
Teacher Educators
Philippines Primary Lower-Secondary Teacher Educators
Polande Primary Lower-Secondary Teacher Educators
Russian federationf Primary Lower-Secondary Teacher Educators
Singapore Primary Lower-Secondary Teacher Educators
Spain Primary Teacher Educators
Switzerlandg Primary Lower-Secondary Teacher Educators
Thailand Primary/Lower-Secondary Teacher Educators
United Statesh Primary Lower-Secondary
Norwayi ALU Primary/Lower-Secondary
ALU+ Primary/Lower-Secondary PPU & Master’s Lower-Secondary
Participation rate at or near requirement, except where noted in the limitations annotated earlier in this chapter.
Sample falls short of requirements because of low participation rates and/or overlapping samples (see limitation annotations).
0 10 20 30 40 50 60 70 80 90 100
Note: Participation rate at or near requirement, except where noted in the limitations annotated on page 159.
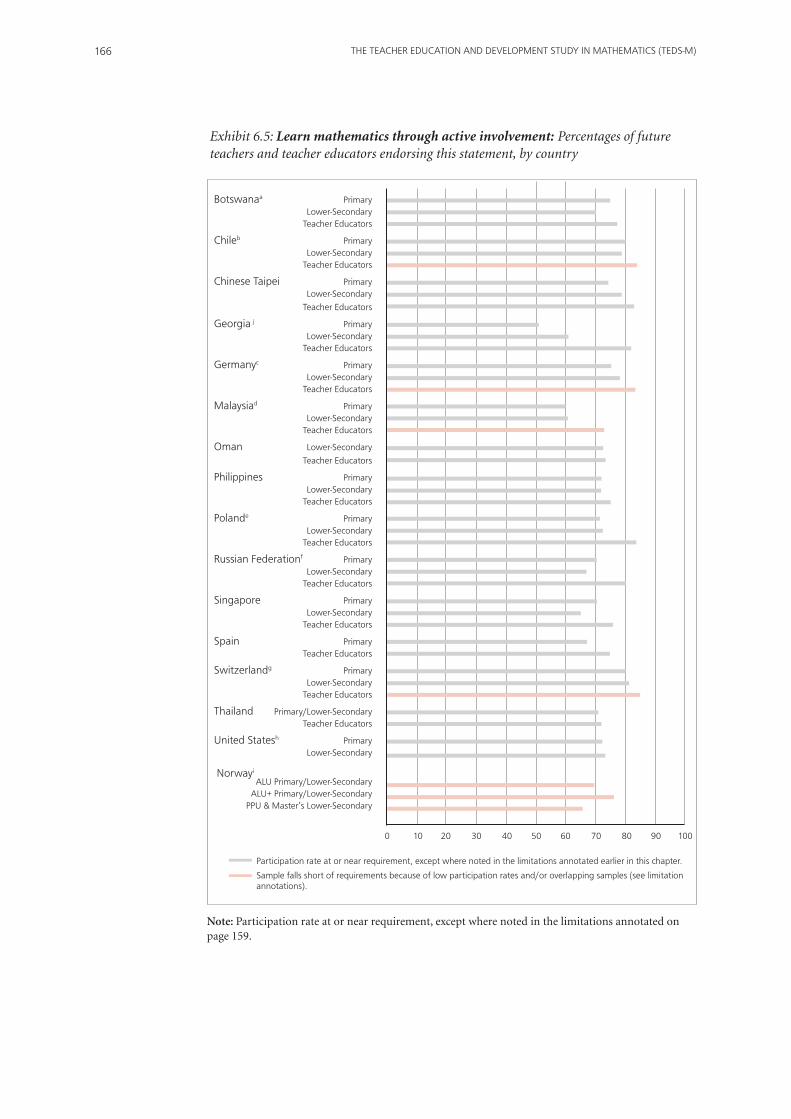
THE TEACHER EDUCATION AND DEVELOPMENT STUDY IN MATHEMATICS (TEDS-M)166
Exhibit 6.5: Learn mathematics through active involvement: Percentages of future teachers and teacher educators endorsing this statement, by country
botswanaa Primary Lower-Secondary Teacher Educators
Chileb Primary Lower-Secondary Teacher Educators
Chinese Taipei Primary Lower-Secondary
Teacher Educators
Georgia j Primary Lower-Secondary Teacher Educators
Germanyc Primary Lower-Secondary Teacher Educators
Malaysiad Primary Lower-Secondary Teacher Educators
Oman Lower-Secondary
Teacher Educators
Philippines Primary Lower-Secondary Teacher Educators
Polande Primary Lower-Secondary Teacher Educators
Russian federationf Primary Lower-Secondary Teacher Educators
Singapore Primary Lower-Secondary Teacher Educators
Spain Primary Teacher Educators
Switzerlandg Primary Lower-Secondary Teacher Educators
Thailand Primary/Lower-Secondary Teacher Educators
United Statesh Primary Lower-Secondary Norwayi
ALU Primary/Lower-Secondary ALU+ Primary/Lower-Secondary PPU & Master’s Lower-Secondary
Participation rate at or near requirement, except where noted in the limitations annotated earlier in this chapter.
Sample falls short of requirements because of low participation rates and/or overlapping samples (see limitation annotations).
0 10 20 30 40 50 60 70 80 90 100
Note: Participation rate at or near requirement, except where noted in the limitations annotated on page 159.

167bELIEfS AbOUT MATHEMATICS AND MATHEMATICS LEARNING
Exhibit 6.6: Mathematics is a fixed ability: Percentages of future teachers and teacher educators endorsing this statement, by country
botswanaa Primary Lower-Secondary Teacher Educators
Chileb Primary Lower-Secondary Teacher Educators
Chinese Taipei Primary Lower-Secondary
Teacher Educators
Georgia j Primary Lower-Secondary Teacher Educators
Germanyc Primary Lower-Secondary Teacher Educators
Malaysiad Primary Lower-Secondary Teacher Educators
Oman Lower-Secondary
Teacher Educators
Philippines Primary Lower-Secondary Teacher Educators
Polande Primary Lower-Secondary Teacher Educators
Russian federationf Primary Lower-Secondary Teacher Educators
Singapore Primary Lower-Secondary Teacher Educators
Spain Primary Teacher Educators
Switzerlandg Primary Lower-Secondary Teacher Educators
Thailand Primary/ Lower-Secondary Teacher Educators
United Statesh Primary Lower-Secondary
Norwayi ALU Primary/Lower-Secondary
ALU+ Primary/Lower-Secondary PPU & Master’s Lower-Secondary
Participation rate at or near requirement, except where noted in the limitations annotated earlier in this chapter.
Sample falls short of requirements because of low participation rates and/or overlapping samples (see limitation annotations).
0 10 20 30 40 50 60 70 80 90 100
Note: Participation rate at or near requirement, except where noted in the limitations annotated on page 159.
THE TEACHER EDUCATION AND DEVELOPMENT STUDY IN MATHEMATICS (TEDS-M)168
The view of mathematics as a set of rules and procedures is reasonably compatible with that of mathematics as a process of enquiry, so we could assume that it would be strongly supported in many countries, which it was. The strongest endorsement of mathematics as a set of rules and procedures came from the Botswana, Georgia, Malaysia, Oman, Philippines, and Thailand; the strongest rejections of this view came from Germany, Switzerland, and Norway. The view that mathematics is best learned by following teacher direction was much less strongly supported, but the country differences were large. This view of mathematics learning received its greatest support in the Georgia, Malaysia, and Philippines; it was most strongly rejected in Germany, Norway, and Switzerland.
The view of mathematics as a fixed ability carries with it the implication that mathematics is not for all—that some children cannot and will not succeed in mathematics. This view has serious implications for how children are grouped and how they are taught. Although a minority view in all countries surveyed, it was most strongly supported by teacher educators and future teachers in Botswana, Georgia, Malaysia, the Philippines, and Thailand. The countries that most firmly rejected this notion were Germany, Norway, Switzerland, and the United States. In summary, the beliefs most consistent with those described by Philipp (2007), Thompson (1992), and Thompson et al. (1994)as a conceptual orientation attracted strong endorsement from teacher educators and future teachers in all countries, although the respondent groups in Georgia were those groups least likely to support these beliefs.
The patterns of beliefs most consistent with those described by the above authors as calculational were most widely endorsed by teacher educators and future teachers in Botswana, Georgia, Malaysia, Oman, the Philippines, and Thailand, and most consistently rejected by the corresponding respondent groups in Germany, Norway, and Switzerland. The patterns of response from several countries (Chile, Chinese Taipei, Poland, the Russian Federation, Singapore, and Spain) were generally consistent with the conceptual orientation, but still gave strong endorsement to the belief that
mathematics is a set of rules and procedures.
6.6.3 Relationships between Beliefs and Mathematics Knowledge
As noted previously, research evidence, although limited, suggests the following:
1. Positive student outcomes are most likely to be associated with teachers who support the notions that mathematics is a process of enquiry and that learning mathematics requires active involvement; and
2. Less likely to be associated with teachers who support the beliefs that mathematics is a set of rules and procedures, learning mathematics requires following teacher direction, and mathematics is a fixed ability.
While the data collected during TEDS-M did not allow us to test these hypotheses, we were able to examine the relationships between each of these beliefs and the mathematics-related knowledge of the future teachers.
At the country level, the future teachers in all countries generally strongly supported the beliefs that mathematics is a process of enquiry and that learning mathematics requires active involvement. There was therefore little variation by country. There was, however, considerable diversity across the countries in the extent to which future teachers believed that mathematics is a set of rules and procedures, learning mathematics
requires following teacher direction, and mathematics is a fixed ability.
169bELIEfS AbOUT MATHEMATICS AND MATHEMATICS LEARNING
The literature that we reviewed also led us to expect that the first two beliefs would be
positively related to the two knowledge measures, while the latter three beliefs would be
negatively correlated with them. At the country level, the data were largely consistent
with this expectation. The countries most strongly endorsing the beliefs consistent
with the conceptual orientation were generally those with higher mean scores on the
knowledge tests, as reported in Chapter 5. The countries most strongly endorsing the
beliefs consistent with the calculational orientation were generally among those with
lower mean scores on the knowledge tests.
However, it would be unwise to draw definite conclusions from these results, for two
reasons. First, the TEDS-M sample of countries was quite small. Second, the participating
countries differ greatly from one another both culturally and historically, and these
differences may influence both beliefs and knowledge in unknown ways.
It is also important to note that whatever generalizations might be made, there are
exceptions. In Chinese Taipei, for example, the patterns of response were generally
consistent with the conceptual orientation, except for mathematics as a set of rules and
procedures, for which endorsement was moderately strong. Chinese Taipei is a country
where knowledge levels are exceptionally high, but cannot be unambiguously fitted into
the two-way categorization that the literature offers us.
Acknowledging that correlations computed within countries might shed some light on
the relationships between knowledge and beliefs, free of systematic country differences,
we used IRT to scale the five beliefs. We then computed correlations between each
of these scales and the measures of mathematics content knowledge (MCK) and
mathematics pedagogy content knowledge (MPCK).
Exhibits 6.7 and 6.8 show these correlations for MCK and MPCK, respectively. In these
tables, the only correlations reported are those that were significantly different from
zero. We applied a one-tailed test because the hypotheses being tested were clearly
directional. It is worth noting that non-significant correlations within countries can
occur because of a lack of relationship between measures brought about by restricted
variance within countries and small sample sizes.
Examination of Exhibits 6.7 and 6.8 reveals that the correlations were generally small.
However, of the 153 significant correlations, 151 were in the hypothesized direction. It
is fair to conclude, then, that within countries there was a general tendency for future
teachers who endorsed the beliefs that mathematics is a process of enquiry and that
learning mathematics requires active involvement to have relatively greater knowledge
of mathematics content and pedagogy than those who rejected those beliefs. Similarly,
there was a general tendency within countries for those future teachers endorsing the
beliefs that mathematics is a set of rules and procedures, learning mathematics requires
following teacher direction, and mathematics is a fixed ability to have relatively lesser
knowledge of mathematics content and pedagogy than those who rejected those beliefs.
Again, the relationships were weak, but consistent.

THE TEACHER EDUCATION AND DEVELOPMENT STUDY IN MATHEMATICS (TEDS-M)170
Country2 N Rules and Process of Teacher Active Fixed (Minimum)3 Procedures Enquiry Direction Involvement Ability
Future Primary Teachers botswana 84 -0.19Chile 630 -0.13 0.11 -0.17 0.11 -0.09Chinese Taipei 923 0.15 -0.17 0.11 -0.10Georgia 459 Germany 977 -0.19 0.36 -0.14 0.22 -0.11Malaysia 561 0.15 0.10 Philippines 586 0.18 -0.25 -0.14Poland 2,063 -0.32 0.27 -0.39 0.17 -0.24Russian federation 2,211 0.13 -0.15 0.11 -0.13Singapore 377 -0.11 -0.12 Spain 1,082 -0.20 0.15 -0.16 0.09 -0.11Switzerland 928 -0.17 0.13 -0.05 -0.08Thailand 652 -0.12 0.10 -0.38 0.08 -0.26United States h 1,079 -0.26 0.21 -0.24 0.18 -0.15
Future Lower-Secondary Teachers botswana 51 0.34 Chile 706 -0.09 0.10 Chinese Taipei 364 -0.21 -0.22 0.13 Georgia 75 -0.17 -0.32 -0.40Germany 758 0.14 0.18 Malaysia 383 Oman 266 0.21 Philippines 725 -0.17 -0.14Poland 291 -0.30 0.12 -0.25 Russian federation 2,075 -0.07 0.07 -0.12 0.09 Singapore 390 -0.18 0.10 -0.13 0.09 Switzerland 140 -0.18 Thailand 640 0.13 -0.27 0.06 -0.13United States h 475 -0.33 0.11 -0.26 -0.24
Exhibit 6.7: Correlations of beliefs about mathematics and mathematics learning with
mathematics content knowledge, by country1
Notes: 1. Only those correlations that were significantly different from zero (a = 0.05, one-tailed) are reported here.
2 . Norway is not included because it was not possible to aggregate to the country level, due to sampling issues.
3. The N used when calculating correlations varied slightly across measures because of occasional non-response, but usually by a fraction of one percent. The reported N is the minimum across measures for each country.
4. The shaded areas identify data that, for reasons explained in the annotations on page 159, cannot be compared with confidence to data from other countries.

171bELIEfS AbOUT MATHEMATICS AND MATHEMATICS LEARNING
Country2 N Rules and Process of Teacher Active Fixed (Minimum)3 Procedures Enquiry Direction Involvement Ability
Future Primary Teachers botswana 84 -0.27Chile 630 0.15 -0.10 0.10 -0.13Chinese Taipei 923 -0.09 0.13 -0.20 0.09 -0.10Georgia 459 -0.07 -0.09Germany 977 -0.21 0.28 -0.16 0.22 -0.15Malaysia 561 -0.12 -0.08Philippines 586 -0.22 0.09 -0.16Poland 2,063 -0.26 0.22 -0.33 0.17 -0.20Russian federation 2,211 0.12 -0.15 0.13 -0.15Singapore 377 Spain 1,082 -0.11 0.06 -0.11 0.10 -0.12Switzerland 928 -0.13 0.12 -0.05 -0.16Thailand 652 -0.15 -0.28 -0.18United Statesh 1,079 -0.22 0.13 -0.22 0.17 -0.11
Future Lower-Secondary Teachers botswana 51 Chile 706 0.10 0.11 Chinese Taipei 364 -0.10 Georgia 75 Germany 758 0.18 -0.15Malaysia 383 Oman 266 0.13 Philippines 725 Poland 291 -0.23 0.18 -0.24 Russian federation 2,075 0.08 -0.12 0.11 Singapore 390 -0.11 Switzerland 140 0.16Thailand 640 -0.11 -0.08United Statesh 475 -0.39 0.09 -0.24 -0.13
Exhibit 6.8: Correlations of beliefs about mathematics and mathematics learning with
mathematics pedagogy content knowledge, by country1
Notes: 1. Only those correlations that were significantly different from zero (a = 0.05, one-tailed) are reported here.
2. Norway is not included because it was not possible to aggregate to the country level, due to sampling issues.
3. The N used when calculating correlations varied slightly across measures because of occasional non-response, but usually by a fraction of one percent. The reported N is the minimum across measures for each country.
4. The shaded areas identify data that, for reasons explained in the annotations on page 159, cannot be compared with confidence to data from other countries.
THE TEACHER EDUCATION AND DEVELOPMENT STUDY IN MATHEMATICS (TEDS-M)172
6.7 Conclusion: Policy Considerations
The results presented in this chapter provide no evidence of cause and effect, and we do
not claim that encouraging any particular belief will lead to increases in future teachers’
knowledge of mathematics content and pedagogy. But we do note the associations that
exist between knowledge and beliefs, and consider these worthy of consideration by those
who develop the curriculum for teacher preparation within each country. Agencies and
authorities with responsibility for the structure, content, and organization of teacher
preparation in participating countries may wish to consider if they are satisfied with
the pattern of beliefs revealed in this report, or whether it is a pattern that they would
seek to change.
Significant change is unlikely to occur unless teacher-preparation programs explicitly
address beliefs about mathematics and mathematics learning. Countries differ greatly,
however, in the extent to which the content of teacher-preparation programs is
subject to central control. Even where a central authority has responsibility for teacher
preparation, introducing new content to the curriculum provides no assurance of
attitudinal change.
We note that, almost without exception, the pattern of beliefs held by the future teachers
in every country matched the pattern of beliefs held by the teacher educators. This
finding suggests that change, if it is to occur, will not come easily, and that substantial
change in the beliefs held by future teachers is unlikely unless it is preceded by change
in the beliefs held by the teacher educators. To simply alter the teacher-preparation
curriculum is unlikely to be sufficient. Marked change in the beliefs of graduating
teachers, if it is to occur, would probably require a significant investment in professional
development for practicing teachers as well as for teacher educators.
References
Deng, Z. (1995). Estimating the reliability of the teacher questionnaire used in the Teacher Education
and Learning to Teach (TELT) (National Center for Research on Teacher Learning Technical Series
95-1, 39 pp.). Available online at http://ncrtl.msu.edu/HTTP/TSeries/TS%2095-1.pdf
Grigutsch, S., Raatz, U., & Törner, G. (1998). Einstellungen gegenüber Mathematik bei
Mathematiklehrern [Mathematics teachers’ epistemological beliefs about the nature of
mathematics]. Journal für Mathematik-Didaktik, 19, 3–45.
Lester, F. K. (Ed.). (2007). Second handbook of research on mathematics teaching and learning.
Charlotte, NC: National Council of Teachers of Mathematics & Information Age Publishing.
Philipp, R. A. (2007). Mathematics teachers’ beliefs and affect. In F. K. Lester (Ed.), Second handbook
of research on mathematics teaching and learning (pp. 257–315). Charlotte, NC: National Council
of Teachers of Mathematics & Information Age Publishing.
Schmidt, W., Tatto, M. T., Bankov, K., Blömeke, S., Cedillo, T., Cogan, L., … Schwille, J. (2007,
December). The preparation gap: Teacher education for middle school mathematics in six countries
(MT21 report). East Lansing, MI: Michigan State University. Available online at http://usteds.msu.
edu/MT21Report.pdf
Staub, F. C., & Stern, E. (2002). The nature of teachers’ pedagogical content beliefs matters for
students’ achievement gains: Quasi-experimental evidence from elementary mathematics. Journal
of Educational Psychology, 94(2), 344–355.
Tatto, M. T. (1996). Examining values and beliefs about teaching diverse students: Understanding
the challenges for teacher education. Educational Evaluation and Policy Analysis, 18(2), 155–180.

173bELIEfS AbOUT MATHEMATICS AND MATHEMATICS LEARNING
Tatto, M. T. (1998). The influence of teacher education on teachers’ beliefs about purposes of
education, roles, and practice. Journal of Teacher Education, 49(1), 66–77.
Tatto, M. T. (1999). The socializing influence of normative cohesive teacher education on teachers’
beliefs about instructional choice. Teachers and Teaching, 5(1), 111–134.
Tatto, M. T. (2003). Evaluating the effectiveness of the teacher preparation program at Michigan State
University: Analyzing survey and ethnographic evidence. Presentation to the annual meeting of the
American Educational Research Association, Chicago, Illinois, April 21–25.
Tatto, M. T., & Coupland, D. (2003). Teaching and measuring attitudes in teacher education. In
J. Raths & A. McAninch (Eds.), Teacher beliefs and classroom performance—the impact of teacher
education: Advances in teacher education (Vol. 6, pp. 123–181). Greenwich, CT: Information Age
Publishing.
Thompson, A. G. (1992). Teachers’ beliefs and conception: A synthesis of the research. In D. A.
Grouws (Ed.), Handbook of research on mathematics teaching and learning (pp. 127–146). New
York: Macmillan.
Thompson, A. G., Philipp, R. A., Thompson, P. W., & Boyd, B. A. (1994). Calculational and
conceptual orientations in teaching mathematics. In D. B. Aicheleb & A. F. Croxford (Eds.),
Professional development for teachers of mathematics (pp. 79–92). Reston, VA: National Council of
Teachers of Mathematics.

THE TEACHER EDUCATION AND DEVELOPMENT STUDY IN MATHEMATICS (TEDS-M)174

175
CHAPTER 7: OPPORTUNITY TO LEARN
7.1 Chapter Overview
IEA studies dating back to the First International Mathematics Study (Husén, 1967)
have collected data on students’ and teachers’ perceptions of students’ opportunities
to learn. In TEDS-M, we used the construct of opportunity to learn (OTL) to explore
what mathematics, mathematics pedagogy, general pedagogy, and related areas future
teachers reported as having studied.
TEDS-M uses the concept of opportunity to learn, as do other studies in the IEA family.
However, the way OTL is addressed varies across studies. For example, in IEA’s Second
International Mathematics Study (SIMS), OTL data were collected from both teachers
and students. Both sets of respondents were asked if students had had opportunities to
learn the content that would allow them to answer the achievement items in the item
pool. In the 1995 iteration of IEA’s Trends in Mathematics and Science Study (TIMSS),
teachers were asked to what extent they had taught a number of topics. In TEDS-M,
future teachers were asked whether or not they had studied a number of topics. Because
of the variation in the approach used to measure OTL, the data gathered from these
different studies are not directly comparable.
7.2 Data Used in this Chapter
The data reported in this chapter come from the TEDS-M future teacher questionnaire
(FTQ) that was administered to future primary and lower-secondary teachers. The
FTQ asked those about to graduate from their preservice teacher education programs
whether they had experienced opportunity to learn (before and during their teacher
education) content and skills relating to seven broad areas hypothesized to influence
knowledge for teaching mathematics:
1. Tertiary-level mathematics;
2. School-level mathematics;
3. Mathematics education pedagogy;
4. General pedagogy;
5. Teaching diverse students;
6. Learning through school-based experiences; and
7. Coherence of their teacher education program.
Responses to items in each of these areas were combined to form seven corresponding
OTL indices. For instance, in order to explore opportunities to learn tertiary-level
mathematics, the TEDS-M researchers asked the future teachers if they had ever
studied each of a number of topics relating to university-level mathematics. These
topics pertained to geometry, discrete structures and logic, continuity and functions,
and probability and statistics.
All future teachers at the primary and lower-secondary levels were asked the same OTL
questions in order to avoid predetermining the range of content covered by teacher
education programs across the participating countries. This strategy also allowed the
TEDS-M researchers to explore whether those future teachers who had studied higher
levels of mathematics performed better on the knowledge tests.
THE TEACHER EDUCATION AND DEVELOPMENT STUDY IN MATHEMATICS (TEDS-M)176
The TEDS-M team developed and piloted the OTL items. They then analyzed the pilot
test results in order to determine the topics for each OTL index. They were aided in this
task by a panel of mathematicians and mathematics educators. The team then tested
the OTL item questions in a field trial and used confirmatory factor analysis to test for
construct validity, that is, whether the measures of the TEDS-M constructs for OTL
were consistent with the team’s understanding of the nature of those constructs. The
confirmatory factor analysis of the main study results was consistent with the results of
the pilot tests and the field trial. The team used the confirmatory factor analysis results
to construct the OTL indices reported in this chapter.1
We report the OTL findings relating to the indices developed for the study separately
for each index for the future primary and the future lower-secondary teachers. The
four TEDS-M indices relating to the academic content of teacher education programs
focused, respectively, on tertiary-level mathematics, school-level mathematics,
mathematics education pedagogy, and general pedagogy. For each topic on each of these
scales, students were asked to indicate if they had ever studied that topic, either in their
current program or earlier. For example, with respect to the tertiary-level mathematics
OTL scale, future teachers were given a list of 17 mathematics-related topics and asked
to indicate, for each one, whether or not they had studied it. In the exhibits related to
those indices in this chapter, we report the results in the form of mean proportions of
topics studied by country, within program-group.2
The FTQ also included OTL items dealing with areas other than academic content. These
included questions about the frequency with which some students experienced activities
in their respective programs. The items also included questions on the opportunities
students had experienced in regard to learning to teach diverse students, and learning
through school-based experiences. Other questions asked future teachers to indicate
their degree of agreement or disagreement with statements about the coherency of their
teacher education programs.
The OTL measures based on these topics were scaled such that information was
combined across multiple items on a four-point rating scale (the choices were never,
rarely, occasionally, and often). The measurement model used for these scales was the
Rasch model, which made it possible to create a measure that reflected more or less
opportunity to learn on an interval scale.3
We report the results from these questions and scales as scaled scores. The international
average for each of these scales was set at 10. A country mean greater than 10 indicates
that students from that country had a greater than average opportunity to learn the
topics included on a given scale, while a country mean below 10 means that students
had a less than average opportunity of doing this.
1 The development of the OTL questionnaires and the confirmatory analyses for each OTL scale are discussed in detail in the TEDS-M technical report (Tatto, 2012).
2 The proportion of topics or areas studied is an average proportion across participants in each program-group within each country. Average proportion is more sensitive to variation across program-groups than an average of topics. This usage also helps one compare across areas and domains, because the number of topics varies across the areas. As a result, the average is not comparable across domains whereas the proportion of topics studied is.
3 These composite measures are stronger measures of OTL because they were scaled through a measurement model (Rasch) rather than by a simple summed score or by taking an average of ordinal rating-scale points and thereby producing an ordinal measure with fewer optimal statistical characteristics. The series of exploratory factor analyses in the pilot and field test trials of the TEDS-M survey made clear that these sets of items were homogenous.

177OPPORTUNITY TO LEARN
As indicated earlier, the OTL findings presented in the exhibits in this chapter are
organized by program-group (see Chapters 2 and 3 for descriptions of the program-
groups) for each opportunity to learn index. We caution readers to bear in mind certain
limitations on the data from a number of countries when interpreting the results
presented and discussed in the exhibits. We list the limitations in the following two
panels: the first panel relates to the primary teacher data, and the second to the lower-
secondary teacher data.
Limitation annotations for the future primary teachers’ opportunity to learn data
a. Poland: reduced coverage—institutions with consecutive programs only were
not covered; the combined participation rate was between 60 and 75%.
b. Russian Federation: reduced coverage—secondary pedagogical institutions
were excluded.
c. Switzerland: reduced coverage—the only institutions covered were those where
German is the primary language of use and instruction.
d. United States: reduced coverage—public institutions only; the combined
participation rate was between 60 and 75%. An exception was made to accept
data from two institutions because, in each case, only one additional participant
would have brought the response rate to above the 50% threshold. Although the
participation rate for the complete sample met the required standard, the data
contain records that were completed via a telephone interview. This method was
used when circumstances did not allow administration of the full questionnaire.
Of the 1,501 recorded participants, 1,185 received the full questionnaire. Bias
may be evident in the data because of the significant number of individuals
who were not administered the full questionnaire.
e. Botswana: the sample size was small (n = 86) but arose from a census of a small
population.
f. Chile: the combined participation rate was between 60 and 75%.
g. Norway: the combined participation rate was between 60 and 75%. An exception
was made to accept data from one institution because only one additional
participant would have brought the response rate to above the 50% threshold.
Program- types ALU and ALU plus mathematics are reported separately
because the two populations partly overlap; data from these program-types
cannot therefore be aggregated.

THE TEACHER EDUCATION AND DEVELOPMENT STUDY IN MATHEMATICS (TEDS-M)178
Limitation annotations for the future lower-secondary teachers’ opportunity to learn data
a. Botswana: the sample size was small (n = 53) but arose from a census of a small
population.
b. Chile: the combined participation rate was between 60 and 75%.
c. Poland: reduced coverage—institutions with consecutive programs only were
not covered. The combined participation rate was between 60 and 75%.
d. Switzerland: reduced coverage—the only institutions covered were those where
German is the primary language of use and instruction.
e. Norway: the combined participation rate was 58%. Of the programs preparing
future teachers to teach up to Grade 10 maximum, program-types ALU, ALU
plus mathematics, and PPU and Master’s are reported separately because the
populations partly overlap; data from these program types cannot therefore be
aggregated.
f. United States: Reduced coverage —public institutions only; combined
participation was between 60 and 75%. An exception was made to accept
data from one institution because only one additional participant would
have brought the response rate to above the 50% threshold. Although the
participation rate for the complete sample met the required standards, the data
contain records that were completed via a telephone interview. This method was
used when circumstances did not allow administration of the full questionnaire.
Of the 607 recorded as participants, 502 received the full questionnaire. Bias
may be evident in the data because of the significant number of individuals
who were not administered the full questionnaire.
g. Georgia: combined participation rate was between 60 and 75%. An exception
was made to accept data from two institutions because, in each case, only one
additional participant would have brought the response rate to above the 50%
threshold.
h. Russian Federation: an unknown number of those surveyed had previously
qualified to become primary teachers.
7.3 Opportunity to Learn Tertiary-Level Mathematics
The OTL tertiary-level mathematics items explored whether or not future teachers had
studied topics from four tertiary-level mathematics areas:
1. Geometry;
2. Discrete structures and logic;
3. Continuity and functions; and
4. Probability and statistics.
Because opportunity to learn in these areas might have occurred before or during
the future teachers’ preservice education, future teachers were asked to check a box
indicating whether they had ever studied each of a number of topics in those areas.
The tertiary-level geometry items included items on foundations of geometry or
axiomatic geometry, analytic and coordinate geometry, non-Euclidean geometry, and
differential geometry. Discrete structures and logic included items about linear algebra,
set theory, abstract algebra, number theory, discrete mathematics, and mathematical

179OPPORTUNITY TO LEARN
logic. Continuity and functions included items about beginning calculus, multivariate
calculus, advanced calculus or real analysis, and differential equations. Probability and
statistics included items on probability and statistics.
Responses to the items in these areas were aggregated into the tertiary-level mathematics
index, which thus represents the composite of topics that the future teachers said they
had studied. The mean can be interpreted as the mean proportion of topics studied, with
values ranging from a 0 to 1, or a low to high opportunity to learn in that area of study.
Exhibit A7.1 in Appendix A shows the OTL index for the tertiary-level mathematics
domain. As is evident from this exhibit, the index was based on responses to 17 items
from across the four mathematics areas.
Exhibit 7.1 below shows the mean proportions of topics in the tertiary-level mathematics
index that the future primary and future lower-secondary teachers said they had studied.
The mean is thus the mean proportion of the 17 topics in tertiary-level mathematics
that the future primary teachers reported having studied (values range from 0 to 1).
The exhibit shows that, on average, future primary teachers in Georgia reported having
studied slightly more than half (0.52) of the 17 topics listed either during their teacher
education program, or earlier.
7.3.1 Future Primary Teachers
The opportunity to learn results for the future primary teachers revealed a high degree
of variability across countries and program-groups. The highest proportions of topics
studied were found among the countries in Program-Group 4 (mathematics specialists).
The countries were Poland, Thailand, and Malaysia, with means of 0.88, 0.85, and 0.71,
respectively. High-achieving countries on the mathematics content knowledge test,
such as the Russian Federation (lower-primary generalists), Chinese Taipei (primary
generalists), and Singapore (primary generalists and specialists), indicated moderate
coverage of these areas. Overall, Program-Groups 1, 2, and 3, that is, those programs
preparing future teachers to teach the lower-primary grades through to Grade 10, had
a low to medium level of exposure to tertiary-level mathematics; means ranged from
0.23 to 0.62.
Among those future teachers who were being prepared as generalists, only those
in Germany, Singapore, and the United States appeared to be relying on previous
mathematics knowledge acquired as a result of participating in a consecutive program
(see Exhibit 2.1 in Chapter 2). While specialists reported having studied a higher
proportion of topics, this finding can also be attributed in some countries to participation
in a consecutive program. This was the case for some programs in Georgia, Germany,
Malaysia, Norway, Oman, Singapore, Thailand, and the United States.
7.3.2 Future Lower-Secondary Teachers
As Exhibit 7.1 makes clear, there was considerable variability in the proportions
of topics studied by the future lower-secondary teachers in the Program-Group 5
countries. Only those future teachers from the Philippines, Poland, and Switzerland
had mean proportions of topics studied of 0.70 or higher. Less variability and higher
topic coverage in this domain were evident among the future secondary teachers in
Program-Group 6. Singapore and Norway (PPU and Master’s) were exceptions, with
mean proportions of 0.63 and 0.65.

THE TEACHER EDUCATION AND DEVELOPMENT STUDY IN MATHEMATICS (TEDS-M)180
Exhibit 7.1: Proportion of topics in tertiary-level mathematics studied by program-group
Program-Group Country N Mean SE SD % Missing
Georgia 478 0.52 0.01 0.20 5.3
Germany 918 0.23 0.01 0.22 1.1
Poland a 1,797 0.45 0.00 0.18 1.1
Russian federation b 2,244 0.55 0.01 0.18 0.8
Switzerland c 121 0.54 0.01 0.17 0.0
Chinese Taipei 923 0.50 0.01 0.17 0.0
Philippines 589 0.62 0.02 0.19 0.3
Singapore 261 0.38 0.02 0.27 0.8
Spain 1,092 0.55 0.01 0.20 0.0
Switzerland 813 0.60 0.01 0.17 0.2
United States d 1,289 0.42 0.01 0.23 1.6
botswana e 83 0.46 0.02 0.19 3.6
Chile f 649 0.43 0.01 0.18 1.2
Norway (ALU) g 392 0.47 0.01 0.20 0.0
Norway (ALU+) g 159 0.59 0.02 0.18 0.0
Germany 97 0.48 0.03 0.22 0.0
Malaysia 570 0.71 0.01 0.23 1.0
Poland a 300 0.88 0.01 0.10 0.0
Singapore 117 0.38 0.03 0.26 0.0
Thailand 658 0.85 0.00 0.11 0.3
United States d 187 0.48 0.02 0.25 1.1
botswana a 34 0.59 0.03 0.16 0.0
Chile b 733 0.44 0.01 0.18 1.8
Germany 405 0.47 0.01 0.23 0.7
Philippines 731 0.71 0.01 0.16 0.4
Poland c 158 0.84 0.01 0.13 0.0
Singapore 140 0.40 0.02 0.28 1.3
Switzerland d 141 0.71 0.01 0.14 0.0
Norway (ALU) e 352 0.46 0.01 0.18 1.0
Norway (ALU+) e 150 0.56 0.01 0.17 1.1
United States f 169 0.42 0.02 0.21 0.0
botswana 19 0.72 0.02 0.09 0.0
Chinese Taipei 365 0.90 0.00 0.11 0.0
Georgia g 75 0.80 0.02 0.15 3.1
Germany 359 0.71 0.01 0.16 0.7
Malaysia 388 0.78 0.01 0.15 0.2
Norway (PPU & Master’s) e 65 0.65 0.02 0.17 0.0
Oman 176 0.86 0.01 0.09 34.4
Poland 140 0.92 0.01 0.10 0.0
Russian federation h 2,133 0.95 0.00 0.08 0.4
Singapore 250 0.63 0.01 0.18 0.4
Thailand 651 0.85 0.00 0.11 0.1
United States f 434 0.77 0.01 0.17 0.89
Notes: 1. When reading this table, keep in mind the limitation annotations listed earlier in this chapter. The footnote letters in the
table above signal the limitations particular to sets of data. The letters pertaining to Program-Groups 1 to 4 relate to the shaded information on page 177. Those relating to Program-Groups 5 and 6 appear on page 178.
2. The shaded areas identify data that, for reasons explained in these annotations, cannot be compared with confidence to data from other countries.
Group 1. Lower Primary(to Grade 4 Maximum)
Group 2. Primary(to Grade 6 Maximum)
Group 3. Primary and SecondaryGeneralists (to Grade 10 Maximum)
Group 4. PrimaryMathematics Specialists
Group 5.Lower Secondary(to Grade 10 Maximum)
Group 6. Lower and Upper Secondary(to Grade 11 and above)
181OPPORTUNITY TO LEARN
The future teachers in Program-Group 6 were more likely than teachers being qualified
to teach at any other level to report a relatively high level of exposure to tertiary-level mathematics topics. Of these Group 6 future teachers, those in Chinese Taipei, Poland, and the Russian Federation experienced almost universal coverage of these topics (mean
proportions of 0.90 or higher).
7.4 Opportunity to Learn School-Level MathematicsFuture teachers responded to several items that explored whether or not they had studied a number of topics in school mathematics as part of their teacher preparation programs. The topics were selected from seven areas:
1. Numbers; 2. Measurement; 3. Geometry; 4. Functions, relations, and equations; 5. Data representation, probability, and statistics; 6. Calculus; and 7. Validation, structuring, and abstracting.
The OTL index for the school-level mathematics domain was based on responses to seven items, as shown in Exhibit A7.2 in Appendix A.
While some knowledge areas may seem more suitable for future primary teachers to study and others more suitable for future lower-secondary teachers to study, every future teacher surveyed was asked to respond to all of the items. Although the school mathematics curriculum in some countries does not include calculus, TEDS-M found that the Asian countries and other countries whose future teachers did well on the TEDS-M tests did offer such areas as part of future primary and lower-secondary teacher education. Similarly, while the secondary curriculum across a large number of countries calls for instruction in basic statistics, the study found, on the basis of the future teachers’ responses, a general gap in this area of teacher education.
Exhibit 7.2 shows the mean proportion of topics in the school-level mathematics index that the future teachers said they had studied. The data are presented by country within
program-group.
7.4.1 Future Primary Teachers
The results for the future primary teachers showed a high degree of variability across countries and program-groups. For instance, it was apparent that the higher the grade level targeted by a teacher education program, the more likely it would be for its students to have studied considerable proportions of topics. Among the countries in Program-Group 1, only the Russian Federation reported a high level of opportunity to learn the school-level mathematics topics listed in the questionnaire. Here, the mean proportion was above 0.70.
Among the countries in Program-Group 2, the mean proportions of topics covered ranged from 0.49 to 0.75. In Program-Group 3, the mean proportions of topics studied ranged from 0.59 to 0.83. In contrast, the mean proportions of topics studied by the future teachers in Program-Group 4 were greater, with mean proportions ranging from 0.62 to 0.93. Future teachers from Thailand and Poland reported proportions greater than 0.90.

THE TEACHER EDUCATION AND DEVELOPMENT STUDY IN MATHEMATICS (TEDS-M)182
Exhibit 7.2: Proportion of topics in school-level mathematics studied by program-group
Program-Group Country N Mean SE SD % Missing
Georgia 502 0.64 0.01 0.22 0.8
Germany 926 0.37 0.01 0.31 0.4
Poland a 1,809 0.44 0.01 0.26 0.1
Russian federation b 2,260 0.74 0.01 0.18 0.2
Switzerland c 121 0.49 0.02 0.26 0.0
Chinese Taipei 923 0.64 0.01 0.24 0.0
Philippines 591 0.75 0.02 0.16 0.0
Singapore 263 0.62 0.01 0.21 0.0
Spain 1,093 0.68 0.01 0.21 0.0
Switzerland 813 0.49 0.01 0.22 0.3
United States d 1,290 0.69 0.01 0.20 1.6
botswana e 86 0.72 0.01 0.16 0.0
Chile f 657 0.59 0.01 0.20 0.0
Norway (ALU) g 392 0.75 0.01 0.13 0.0
Norway (ALU+) g 159 0.83 0.01 0.10 0.0
Germany 97 0.62 0.03 0.22 0.0
Malaysia 571 0.72 0.01 0.27 0.9
Poland a 300 0.93 0.01 0.14 0.0
Singapore 117 0.62 0.02 0.20 0.0
Thailand 659 0.92 0.01 0.15 0.2
United States d 187 0.72 0.01 0.17 1.1
botswana a 34 0.79 0.02 0.16 0.0
Chile b 745 0.59 0.01 0.20 0.1
Germany 400 0.60 0.01 0.24 1.8
Philippines 731 0.81 0.01 0.16 0.4
Poland c 158 0.94 0.01 0.11 0.0
Singapore 141 0.72 0.02 0.19 0.7
Switzerland d 141 0.79 0.02 0.18 0.0
Norway (ALU) e 355 0.75 0.01 0.14 0.2
Norway (ALU +) e 151 0.82 0.01 0.12 0.0
United States f 169 0.71 0.03 0.17 0.0
botswana 19 0.77 0.03 0.19 0.0
Chinese Taipei 365 0.89 0.01 0.18 0.0
Georgia g 77 0.77 0.02 0.18 1.0
Germany 348 0.71 0.01 0.22 4.0
Malaysia 388 0.91 0.01 0.12 0.2
Oman 268 0.87 0.01 0.13 0.0
Poland 140 0.91 0.02 0.15 0.0
Russian federation h 2,135 0.92 0.01 0.15 0.3
Singapore 250 0.81 0.01 0.18 0.4
Thailand 650 0.92 0.01 0.15 0.3
Norway (PPU & Master’s) e 65 0.81 0.02 0.18 0.0
United States f 434 0.80 0.02 0.25 0.9
Notes: 1. When reading this table, keep in mind the limitation annotations listed earlier in this chapter. The footnote letters in the
table above signal the limitations particular to sets of data. The letters pertaining to Program-Groups 1 to 4 relate to the shaded information on page 177. Those relating to Program-Group 5 and 6 appear on page 178.
2. The shaded areas identify data that, for reasons explained in these annotations, cannot be compared with confidence to data from other countries.
Group 1. Lower Primary(to Grade 4 Maximum)
Group 2. Primary(to Grade 6 Maximum)
Group 3. Primary and SecondaryGeneralists (to Grade 10 Maximum)
Group 4. PrimaryMathematics Specialists
Group 5.Lower Secondary(to Grade 10 Maximum)
Group 6. Lower and Upper Secondary(to Grade 11 and above)

183OPPORTUNITY TO LEARN
The contrast between the mean proportion of topics that the future teachers in Poland in Program-Group 1 reported studying (0.44) and the mean proportion studied by Polish future teachers in Program-Group 4 (0.93) may indicate that programs align their level of topic coverage with the grade levels they expect their future teachers to teach.
7.4.2 Future Lower-Secondary Teachers
With few exceptions, future teachers in programs preparing future teachers to teach mathematics in the lower-secondary grades reported mean proportions of 0.70 or more. Future teachers in Poland reported a proportion greater than 0.90. Exceptions were found in Chile and Germany, where mean proportions were 0.59 and 0.60, respectively.
Countries in Program-Group 6, that is, those preparing future teachers for the lower- and upper-secondary grades, including Grade 11 and above, reported relatively high mean proportions of topics studied. Mean proportions greater than 0.80 were reported for Chinese Taipei, Malaysia, Oman, Norway, Poland, the Russian Federation, and Thailand. In Botswana, Georgia, and Germany, the mean proportions were somewhat
lower.
7.5 Opportunity to Learn Mathematics PedagogyFuture teachers were asked to consider a list of topics related to teaching mathematics, and to indicate whether they had studied each one as part of their teacher preparation program. The opportunity to learn mathematics pedagogy index was based on responses to eight items relating to the following areas:
1. Foundations of mathematics; 2. Context of mathematics education; 3. Development of mathematics ability and thinking;4. Mathematics instruction;5. Development of teaching plans;6. Mathematics teaching;7. Mathematics standards and curriculum; and 8. Affective issues in mathematics (see also Exhibit 7.3).
The eight areas are listed in detail in Exhibit A7.3 in Appendix A. Exhibit 7.3 below shows the mean proportion of topics in the mathematics pedagogy index that the future teachers said they had studied. The means are presented by country within program-
group.
7.5.1. Future Primary Teachers
The results displayed in Exhibit 7.3 show considerable variability across countries and program-groups at the primary school level, particularly in Program-Groups 1 and 2, with proportions of topics reported as studied as low as 0.38 in Germany and as high as 0.81 in Switzerland. Notable among these two groups of future primary teachers are the high proportions reported by the future teachers in the Russian Federation and Switzerland, in Program-Group 1, and by the future teachers in the Philippines, Singapore, Switzerland, and the United States, in Program-Group 2. The proportions of reported topic coverage were moderately high among the future teachers in Program-Group 3, ranging from 0.67 to 0.79. In Program-Group 4 (primary mathematics specialists), the future teachers in all but one country reported a relatively high

THE TEACHER EDUCATION AND DEVELOPMENT STUDY IN MATHEMATICS (TEDS-M)184
Exhibit 7.3: Proportion of topics in mathematics pedagogy studied by program-group
Program-Group Country N Mean SE SD % Missing
Georgia 491 0.57 0.01 0.25 2.8
Germany 928 0.38 0.01 0.31 0.5
Poland a 1,808 0.59 0.01 0.23 0.6
Russian federation b 2,252 0.78 0.01 0.20 0.6
Switzerland c 121 0.81 0.02 0.17 0.0
Chinese Taipei 923 0.57 0.01 0.23 0.0
Philippines 592 0.75 0.02 0.24 0.0
Singapore 263 0.71 0.01 0.20 0.0
Spain 1,092 0.57 0.02 0.26 0.1
Switzerland 813 0.76 0.01 0.21 0.3
United States d 1,023 0.75 0.02 0.22 23.1
botswana e 85 0.79 0.02 0.21 1.0
Chile f 657 0.67 0.01 0.23 0.0
Norway (ALU) g 391 0.67 0.01 0.24 0.4
Norway (ALU+) g 159 0.73 0.02 0.25 0.0
Germany 97 0.46 0.03 0.24 0.0
Malaysia 568 0.86 0.01 0.19 1.4
Poland a 300 0.70 0.01 0.20 0.0
Singapore 117 0.68 0.02 0.22 0.0
Thailand 660 0.80 0.01 0.19 0.0
United States d 147 0.75 0.05 0.22 22.7
botswana a 34 0.79 0.04 0.20 0.0
Chile b 741 0.67 0.01 0.25 0.7
Germany 405 0.52 0.02 0.24 1.2
Philippines 731 0.68 0.02 0.27 0.4
Poland c 158 0.76 0.02 0.17 0.0
Singapore 141 0.68 0.02 0.18 0.7
Switzerland d 141 0.75 0.01 0.20 0.0
Norway (ALU) e 355 0.67 0.01 0.22 0.2
Norway (ALU+) e 151 0.73 0.02 0.23 0.0
United States f 129 0.78 0.02 0.18 26.0
botswana 19 0.87 0.03 0.14 0.0
Chinese Taipei 365 0.68 0.01 0.20 0.0
Georgia g 76 0.60 0.03 0.27 2.1
Germany 353 0.54 0.02 0.29 2.6
Malaysia 387 0.81 0.01 0.27 0.6
Oman 268 0.73 0.01 0.20 0.0
Poland 140 0.71 0.02 0.20 0.0
Russian federation h 2,133 0.84 0.02 0.19 0.4
Singapore 250 0.72 0.01 0.20 0.4
Thailand 647 0.79 0.01 0.19 0.8
Norway (PPU & Master’s) e 65 0.74 0.03 0.22 0.0
United States f 369 0.72 0.02 0.23 17.3
Notes: 1. When reading this table, keep in mind the limitation annotations listed earlier in this chapter. The footnote letters in the
table above signal the limitations particular to sets of data. The letters pertaining to Program-Groups 1 to 4 relate to the shaded information on page 177. Those relating to Program-Groups 5 and 6 appear on page 178.
2. The shaded areas identify data that, for reasons explained in these annotations, cannot be compared with confidence to data from other countries.
Group 1. Lower Primary(to Grade 4 Maximum)
Group 2. Primary(to Grade 6 Maximum)
Group 4. PrimaryMathematics Specialists
Group 5.Lower Secondary(to Grade 10 Maximum)
Group 3. Primary and SecondaryGeneralists (to Grade 10 Maximum)
Group 6. Lower and Upper Secondary(to Grade 11 and above)

185OPPORTUNITY TO LEARN
proportion of topics studied. The range extended from 0.68 in Singapore to 0.86 in Malaysia. Overall, a number of program-groups, regardless of grade level and degree of
specialization, were emphasizing this domain, with mean proportions of 0.70 or more.
7.5.2 Future Lower-Secondary Teachers
Exhibit 7.3 also shows the mean proportions of topics by program-group in the
mathematics education OTL pedagogy index that the future lower-secondary teachers
said they had studied. The results for these future teachers were much less variable
than those for the future primary teachers. Except for a few exceptions, and regardless
of program-group, the future secondary teachers reported mean proportions of 0.70
or more with respect to topic coverage in this domain. The higher levels of coverage
(e.g., 0.80 and above) were found in Program-Group 6 in Botswana, Malaysia, and the
Russian Federation, and in programs in Norway.
7.6 Opportunity to Learn General Pedagogy
Future teachers were asked to consider a list of pedagogy areas in the education pedagogy
domain and to indicate whether they had studied each as part of their current teacher
education program. The eight items selected for this domain related to:
1. History of education and education systems;
2. Philosophy of education;
3. Sociology of education;
4. Educational psychology;
5. Theories of schooling;
6. Methods of educational research;
7. Assessment and measurement; and
8. Knowledge of teaching.
Exhibit A7.4 (Appendix A) contains the actual wording of the item stems. Exhibit 7.4
below shows the mean proportion of topics in the general pedagogy index that future
teachers said they had studied. The results are presented by country within program
group.
7.6.1. Future Primary Teachers
Except in a few instances, the results showed a high degree of uniformity and emphasis
with regard to this domain across the countries and programs, with future primary
teachers in most programs reporting a mean proportion of 0.70 or higher of topics
studied. These results are consistent with findings reported by Tatto, Lehman, and
Novotná (2010), which showed that much of the instructional time in teacher education
is spent in the domain of general pedagogy. Lower proportions of topics covered
were found among the mathematics specialists and notably in the high-achieving
(mathematics knowledge) countries of Poland (0.63) and Singapore (0.57).
7.6.2. Future Lower-Secondary Teachers
Exhibit 7.4 shows the mean proportion of topics in the education pedagogy index that
the future lower-secondary teachers (by program-group) reported as having studied.
The future lower-secondary teachers in Program-Group 5 reported a relatively high
proportion of topic coverage in the general pedagogy domain, with teachers in 6 out of
10 countries reporting proportions of 0.80 or above.

THE TEACHER EDUCATION AND DEVELOPMENT STUDY IN MATHEMATICS (TEDS-M)186
Exhibit 7.4: Future primary teachers’ opportunity to learn: general pedagogy
Program-Group Country N Mean SE SD % Missing
Georgia 389 .72 .01 .23 22.9
Germany 927 .69 .01 .21 0.8
Poland a 1,791 .89 .01 .15 1.6
Russian federation b 2,239 .92 .01 .12 1.1
Switzerland c 120 .93 .01 .10 1.0
Chinese Taipei 922 .71 .01 .21 0.2
Philippines 580 .95 .01 .10 1.3
Singapore 262 .60 .01 .24 0.4
Spain 1,063 .77 .01 .19 2.4
Switzerland 806 .92 .00 .12 1.1
United States d 1,014 .84 .01 .19 23.8
botswana e 75 .78 .02 .22 13.7
Chile f 638 .88 .01 .16 3.1
Norway (ALU) g 390 .81 .01 .17 0.6
Norway (ALU+) g 154 .80 .01 .22 3.5
Germany 95 .66 .03 .21 0.5
Malaysia 566 .88 .01 .17 1.8
Poland a 296 .63 .02 .27 1.6
Singapore 117 .57 .02 .25 0.0
Thailand 648 .91 .00 .14 1.8
United States d 147 .84 .04 .21 22.7
botswana a 28 .84 .02 .17 17.6
Chile b 717 .88 .01 .16 4.3
Germany 397 .61 .02 .23 1.6
Philippines 719 .93 .01 .13 1.5
Poland c 158 .75 .02 .21 0.0
Singapore 141 .61 .02 .22 0.7
Switzerland d 139 .84 .01 .16 1.2
Norway (ALU) e 353 .81 .01 .18 0.7
Norway (ALU+) e 148 .79 .02 .20 2.1
United States f 129 .87 .01 .15 25.6
botswana 17 .74 .07 .24 10.5
Chinese Taipei 363 .70 .01 .20 0.6
Georgia g 59 .54 .03 .25 26.3
Germany 343 .59 .01 .24 5.9
Malaysia 385 .89 .01 .18 1.2
Oman 260 .74 .01 .19 3.1
Poland 137 .58 .03 .27 5.7
Russian federation h 2,125 .89 .01 .16 0.9
Singapore 250 .65 .01 .21 0.4
Thailand 641 .90 .01 .14 1.6
Norway (PPU & Master’s) e 60 .74 .04 .24 7.4
United States f 368 .78 .01 .20 17.4
Notes: 1. When reading this table, keep in mind the limitation annotations listed earlier in this chapter. The footnote letters in the
table above signal the limitations particular to sets of data. The letters pertaining to Program-Groups 1 to 4 relate to the shaded information on page 177. Those relating to Program-Groups 5 and 6 appear on page 178.
2. The shaded areas identify data that, for reasons explained in these annotations, cannot be compared with confidence to data from other countries.
Group 1. Lower Primary(to Grade 4 Maximum)
Group 2. Primary(to Grade 6 Maximum)
Group 4. PrimaryMathematics Specialists
Group 5.Lower Secondary(to Grade 10 Maximum)
Group 3. Primary and SecondaryGeneralists (to Grade 10 Maximum)
Group 6. Lower and Upper Secondary(to Grade 11 and above)

187OPPORTUNITY TO LEARN
Again, the higher-achieving countries of Poland and Singapore gave the least emphasis
to these topics, with mean proportions of 0.75 and 0.61 respectively. Future lower- and
upper-secondary teachers in Program-Group 6—the teachers who are prepared to
teach Grade 11 or above—reported moderate to high coverage.
Future teachers in Poland and Singapore, two of the higher achieving countries in
TEDS-M, gave slightly less emphasis to this domain (the proportions were 0.58 and
0.65, respectively). However, Chinese Taipei, the Russian Federation, and Thailand,
which also featured among the higher-achieving countries, paid somewhat higher
attention to this domain. The mean proportions for these countries were 0.70, 0.89,
and 0.90, respectively.
7.7 Opportunity to Learn about Teaching Diverse Students
An increasingly important area for future teachers learning to teach is teaching
mathematics to diverse students. In some TEDS-M countries, students are systematically
grouped in classes; in others, classes are left purposefully diverse. Nevertheless, many
teacher educators see opportunity to learn to teach diverse students as a crucial
component of teacher education programs. They see ability to teach in this way as
an increasingly important skill as classrooms become more integrated and societies
become more diverse.
Future teachers were asked whether they had experienced opportunity to learn to do
the following:
1. Develop specific strategies for teaching students with behavioral and emotional
problems;
2. Develop specific strategies and curriculum for teaching students with learning
disabilities;
3. Develop specific strategies and curriculum for teaching gifted students;
4. Develop specific strategies and curriculum for teaching students from diverse
cultural backgrounds;
5. Accommodate the needs of students with physical disabilities in the classroom;
and
6. Work with children from poor or disadvantaged backgrounds.
Future teachers were asked to indicate, on a four-point scale (often, occasionally,
sometimes, never), how frequently they had learned about teaching diverse students.
The actual wording of the item stems can be found in Exhibit A7.5 in Appendix A.
The future teachers’ responses are displayed in the form of scale scores by program-
group in Exhibit 7.5 for Program-Groups 1 to 4, and in Exhibit 7.6 for Program-Groups
5 and 6. For this analysis, the scale average was set to 10. Scores lower than 10 indicate
less opportunity to learn and scores larger than 10 indicate greater opportunity to learn.
The interpretation of the index scores is based on Rasch scaling, with a score of 10
representing the midpoint on the rating scale.
7.7.1. Future Primary Teachers
The results for the primary groups showed considerable variability in the future primary
teachers’ responses. The variability seemed to be less a function of these future teachers
being enrolled in a particular program-group and more a function of a cultural norm
because almost all of the European countries and some of the Asian countries had means

THE TEACHER EDUCATION AND DEVELOPMENT STUDY IN MATHEMATICS (TEDS-M)188
Exh
ibit
7.5
: Fut
ure
prim
ary
teac
hers
’ opp
ortu
nity
to le
arn:
teac
hing
for
dive
rsit
y
Mea
n an
d C
onfid
ence
Inte
rval
(± 2
SE)
4
5 6
7 8
9 10
11
12
13
14
15
16
Sam
ple
Siz
eV
alid
Dat
a (N
)Pe
rcen
t M
issi
ng
(Wei
ghte
d)
Scal
ed S
core
:
Mea
n(S
E)
Pro
gra
m-G
roup
Co
untr
y
Not
es:
1. T
his
tab
le a
nd
char
t m
ust
be
read
wit
h a
war
enes
s of
th
e lim
itat
ion
s an
not
ated
ear
lier
in t
his
ch
apte
r.2.
Th
e da
gger
sym
bol (
†) is
use
d to
ale
rt r
eade
rs t
o si
tuat
ion
s w
her
e da
ta w
ere
avai
labl
e fr
om fe
wer
th
an
85%
of
resp
onde
nts
.3.
Th
e sh
aded
are
as id
enti
fy d
ata
that
, for
rea
son
s ex
plai
ned
in t
he
limit
atio
ns,
can
not
be
com
pare
d w
ith
co
nfi
den
ce t
o da
ta fr
om o
ther
cou
ntr
ies.
Geo
rgia
†
506
328
35.0
10
.16
(0.1
1)
Ger
man
y 93
5 92
1 1.
7 9.
14
(0.0
6)
Pola
nd a
1,81
2 1,
769
2.8
10.0
7 (0
.05)
Russ
ian
fede
ratio
n b
2,26
6 2,
218
2.1
9.91
(0
.10)
Switz
erla
nd c
121
119
1.7
10.4
4 (0
.08)
Chi
nese
Tai
pei
923
921
0.3
9.54
(0
.05)
Phili
ppin
es
592
569
4.1
11.5
5 (0
.17)
Sing
apor
e 26
3 26
3 0.
0 9.
48
(0.1
2)
Spai
n 1,
093
1,03
6 4.
9 9.
80
(0.1
0)
Switz
erla
nd
815
806
1.3
10.1
5 (0
.05)
Uni
ted
Stat
es †d
1,
310
1,01
5 23
.7
11.3
0 (0
.13)
bots
wan
a †e
86
69
20
.8
11.2
9 (0
.22)
Chi
le f
657
617
6.3
10.9
2 (0
.08)
Nor
way
(ALU
) g 39
2 38
1 5.
3 8.
79
(0.0
8)
Nor
way
(ALU
+) g
159
151
3.1
8.69
(0
.13)
Ger
man
y 97
94
0.
7 8.
57
(0.2
4)
Mal
aysi
a 57
6 56
4 2.
1 10
.48
(0.0
7)
Pola
nd a
300
296
2.3
8.47
(0
.11)
Sing
apor
e 11
7 11
6 0.
9 9.
48
(0.1
1)
Thai
land
66
0 63
7 3.
5 10
.11
(0.0
7)
Uni
ted
Stat
es †d
19
1 14
7 22
.7
11.1
8 (0
.12)
Teac
hin
g fo
r D
iver
sity
OTL
Gro
up 1
.Lo
wer
Prim
ary
(to
Gra
de 4
M
axim
um)
Gro
up 2
.Pr
imar
y(t
o G
rade
6
Max
imum
)
Gro
up 4
.Pr
imar
yM
athe
mat
ics
Spec
ialis
ts
Perc
entil
es
5th
25th
75
th
95th
Gro
up 3
. Pr
imar
y an
d Se
cond
ary
Gen
eral
ists
(to G
rade
10
Max
imum
)

189OPPORTUNITY TO LEARN
Exh
ibit
7.6
: Fut
ure
seco
ndar
y te
ache
rs’ o
ppor
tuni
ty to
lear
n: te
achi
ng fo
r di
vers
ity
Perc
entil
es
5th
25th
75
th
95th
Mea
n an
d C
onfid
ence
Inte
rval
(± 2
SE)
4
5 6
7 8
9 10
11
12
13
14
15
16
Sam
ple
Siz
eV
alid
Dat
a (N
)Pe
rcen
t M
issi
ng
(Wei
ghte
d)
Scal
ed S
core
:
Mea
n(S
E)
Pro
gra
m-G
roup
Co
untr
y
Not
es:
1. T
his
tab
le a
nd
char
t m
ust
be
read
wit
h a
war
enes
s of
th
e lim
itat
ion
s an
not
ated
ear
lier
in t
his
ch
apte
r.2.
Th
e da
gger
sym
bol (
†) is
use
d to
ale
rt r
eade
rs t
o si
tuat
ion
s w
her
e da
ta w
ere
avai
labl
e fr
om fe
wer
th
an
85%
of
resp
onde
nts
.3.
Th
e sh
aded
are
as id
enti
fy d
ata
that
, for
rea
son
s ex
plai
ned
in t
he
limit
atio
ns,
can
not
be
com
pare
d w
ith
co
nfi
den
ce t
o da
ta fr
om o
ther
cou
ntr
ies.
bots
wan
a †a
34
26
23
.6
11.1
6 (0
.31)
Chi
le b
746
694
7.5
10.9
0 (0
.06)
Ger
man
y 40
8 39
7 1.
6 8.
64
(0.0
8)
Phili
ppin
es
733
705
2.7
11.2
2 (0
.15)
Pola
nd c
158
153
3.0
8.97
(0
.17)
Sing
apor
e 14
2 14
0 1.
3 9.
29
(0.1
2)
Switz
erla
nd d
141
139
1.1
9.21
(0
.16)
Nor
way
(ALU
) e 35
6 34
9 1.
9 8.
71
(0.0
8)
Nor
way
(ALU
+ ) e
151
141
6.3
8.49
(0
.12)
Uni
ted
Stat
es †f
16
9 12
8 26
.0
11.6
2 (0
.27)
bots
wan
a †a
19
13
31
.6
10.5
2 (0
.25)
Chi
nese
Tai
pei
365
362
0.8
9.10
(0
.08)
Geo
rgia
†g
78
45
42.9
9.
21
(0.4
1)
Ger
man
y 36
3 34
4 4.
4 8.
04
(0.0
7)
Mal
aysi
a 38
9 38
6 0.
9 10
.34
(0.1
0)
Om
an
268
248
7.5
8.99
(0
.12)
Pola
nd
140
136
6.8
8.23
(0
.19)
Russ
ian
fede
ratio
n h
2141
21
08
1.6
9.35
(0
.18)
Sing
apor
e 25
1 25
0 0.
4 9.
60
(0.1
0)
Thai
land
65
2 63
4 2.
7 10
.16
(0.0
8)
Nor
way
(PPU
& M
aste
r’s) e
65
58
10.9
7.
74
(0.1
9)
Uni
ted
Stat
es †f
43
8 36
6 18
.0
10.4
2 (0
.11)
Teac
hin
g fo
r D
iver
sity
OTL
Gro
up 5
.Lo
wer
Sec
onda
ry(G
rade
10
Max
imum
)
Gro
up 6
. Lo
wer
and
Upp
er
Seco
ndar
y(t
o G
rade
11
and
abov
e)
THE TEACHER EDUCATION AND DEVELOPMENT STUDY IN MATHEMATICS (TEDS-M)190
closer to or lower than 10. Exceptions were found among the programs in Botswana, the
Philippines, and the United States, where means were greater than 11. Future teachers
in Germany, Norway, and Poland reported having never or only occasionally been given
opportunity to learn in this area.
7.7.2. Future Lower-Secondary Teachers
The results for the lower-secondary program-groups were even more striking: these
teachers reported that they rarely or never had opportunities to learn in this domain.
Exceptions were found in Program-Groups 5 and 6 in Botswana and the United States,
as well as in the Philippines in Program-Group 5; the means in these countries were
higher than 11.
The apparent lack of opportunity to learn about teaching diverse students (e.g.,
children with learning disabilities, children of the poor, or children of immigrants)
was most pronounced in both Program-Groups 5 and 6 in Chinese Taipei, Georgia,
Germany, Norway, Oman, Poland, the Russian Federation, Singapore, and Switzerland.
The reason for this lack may be because these systems assign school students to classes
or schools on the basis of perceived ability, thus effectively “homogenizing” the student
body and arguably eliminating the need to factor diversity into the teacher education
curriculum.
7.8 Opportunity to Learn to Teach Mathematics through School-Based Experiences
Future teachers were asked to indicate how often during the school experience
component of their program they were required to engage in these activities:
1. Observe models of the teaching strategies they were learning in their respective
courses;
2. Practice theories for teaching mathematics that they were learning in their
courses;
3. Complete assessment tasks that asked them to show how they were applying ideas
they were learning in their courses;
4. Receive feedback about how well they had implemented teaching strategies they
were learning in their courses;
5. Collect and analyze evidence about student learning as a result of their teaching
methods;
6. Test out findings from educational research about difficulties that students
experience when learning;
7. Develop strategies that would enable them to reflect on their professional
knowledge; and
8. Demonstrate that they could apply the teaching methods they were learning in
their courses.
The future teachers were asked to indicate, on a four-point scale (often, occasionally,
sometimes, never), how frequently they had been able to see the techniques and skills
they had discussed in their teacher education programs enacted in a classroom setting.
The wording of the item stems appears in Exhibit A7.6 in Appendix A, and the results
are displayed in the form of scale scores by program-groups in Exhibits 7.7 and 7.8
below.

191OPPORTUNITY TO LEARN
Exh
ibit
7.7
: Fut
ure
prim
ary
teac
hers
’ pra
ctic
um: c
onne
ctin
g th
eory
to p
ract
ice
Mea
n an
d C
onfid
ence
Inte
rval
(± 2
SE)
4
5 6
7 8
9 10
11
12
13
14
15
16
Sam
ple
Siz
eV
alid
Dat
a (N
)Pe
rcen
t M
issi
ng
(Wei
ghte
d)
Scal
ed S
core
:
Mea
n(S
E)
Pro
gra
m-G
roup
Co
untr
y
Not
es:
1. T
his
tab
le a
nd
char
t m
ust
be
read
wit
h a
war
enes
s of
th
e lim
itat
ion
s an
not
ated
ear
lier
in t
his
ch
apte
r.2.
Th
e da
gger
sym
bol (
†) is
use
d to
ale
rt r
eade
rs t
o si
tuat
ion
s w
her
e da
ta w
ere
avai
labl
e fr
om fe
wer
th
an
85%
of
resp
onde
nts
.3.
Th
e sh
aded
are
as id
enti
fy d
ata
that
, for
rea
son
s ex
plai
ned
in t
he
limit
atio
ns,
can
not
be
com
pare
d w
ith
co
nfi
den
ce t
o da
ta fr
om o
ther
cou
ntr
ies.
4. C
har
ts o
r st
atis
tics
are
not
pre
sen
ted
in in
stan
ces
wh
ere
mor
e th
an 5
0% o
f th
e da
ta w
ere
mis
sin
g.
Geo
rgia
†
506
257
48.7
10
.81
(0.1
2)
Ger
man
y 93
5 85
3 8.
4 9.
53
(0.0
5)
Pola
nd †a
1,
812
1,55
5 15
.0
10.8
4 (0
.04)
Russ
ian
fede
ratio
n b
2,26
6 2,
095
7.4
12.0
8 (0
.09)
Switz
erla
nd c
121
107
12.8
10
.01
(0.1
1)
Chi
nese
Tai
pei
923
900
2.4
10.1
3 (0
.08)
Phili
ppin
es†
59
2 44
4 24
.4
12.3
6 (0
.21)
Sing
apor
e 26
3 26
2 0.
4 10
.79
(0.1
0)
Spai
n†
1,09
3 91
2 16
.6
10.6
8 (0
.05)
Switz
erla
nd
815
751
8.4
9.89
(0
.06)
Uni
ted
Stat
es †d
1,
310
977
25.6
11
.65
(0.1
1)
bots
wan
a†e
86
40
55.6
Chi
le †f
65
7 49
2 25
.1
11.3
8 (0
.07)
Nor
way
(ALU
) †g
392
323
18.8
9.
99
(0.0
5)
Nor
way
(ALU
+) †g
15
9 12
0 26
.2
10.0
8 (0
.11)
Ger
man
y 97
84
14
.7
9.84
(0
.20)
Mal
aysi
a†
576
407
29.3
11
.14
(0.0
8)
Pola
nd a
300
261
12.9
10
.73
(0.1
1)
Sing
apor
e 11
7 11
6 0.
8 10
.69
(0.1
3)
Thai
land
†
660
531
19.5
11
.74
(0.0
5)
Uni
ted
Stat
es †d
19
1 14
0 25
.5
11.8
1 (0
.26)
Prac
ticu
m
Perc
entil
es
5th
25th
75
th
95th
Gro
up 1
.Lo
wer
Prim
ary
(to
Gra
de 4
M
axim
um)
Gro
up 2
.Pr
imar
y(t
o G
rade
6
Max
imum
)
Gro
up 4
.Pr
imar
y M
athe
mat
ics
Spec
ialis
ts
Gro
up 3
. Pr
imar
y an
d Se
cond
ary
Gen
eral
ists
(to G
rade
10
Max
imum
)
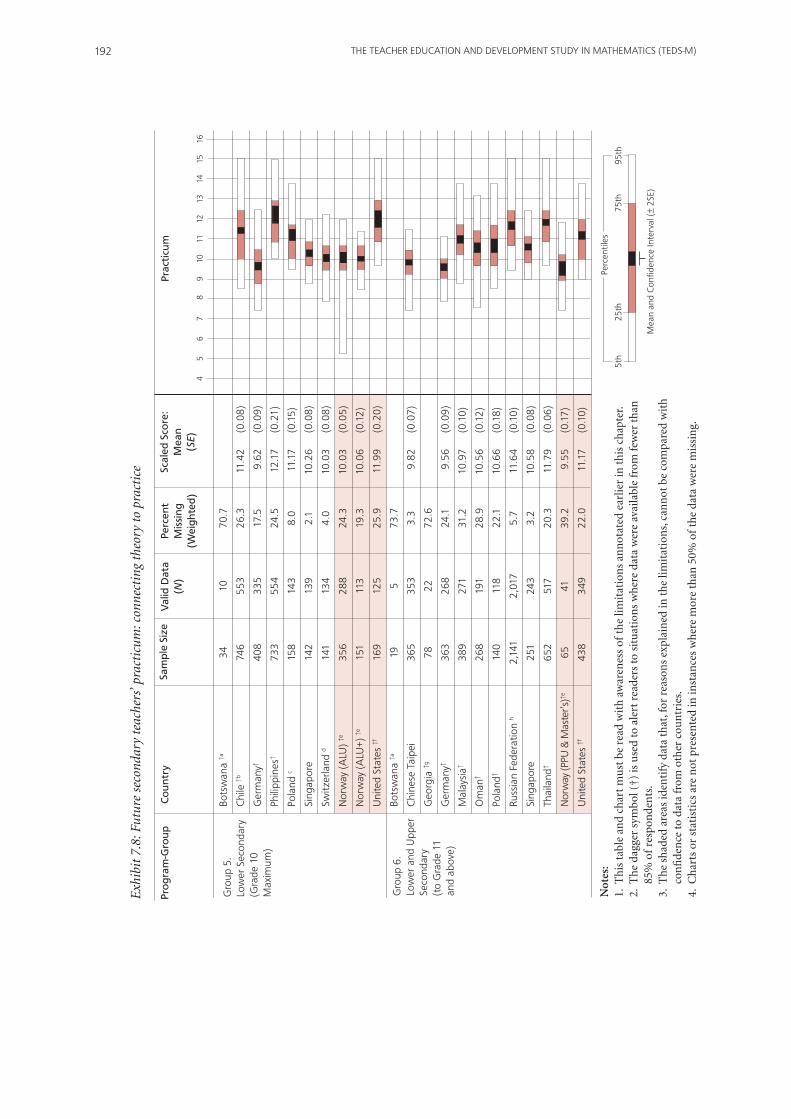
THE TEACHER EDUCATION AND DEVELOPMENT STUDY IN MATHEMATICS (TEDS-M)192
Exh
ibit
7.8
: Fut
ure
seco
ndar
y te
ache
rs’ p
ract
icum
: con
nect
ing
theo
ry to
pra
ctic
e
Perc
entil
es
5th
25th
75
th
95th
Mea
n an
d C
onfid
ence
Inte
rval
(± 2
SE)
4
5 6
7 8
9 10
11
12
13
14
15
16
Sam
ple
Siz
eV
alid
Dat
a (N
)Pe
rcen
t M
issi
ng
(Wei
ghte
d)
Scal
ed S
core
:
Mea
n(S
E)
Pro
gra
m-G
roup
Co
untr
y
Not
es:
1. T
his
tab
le a
nd
char
t m
ust
be
read
wit
h a
war
enes
s of
th
e lim
itat
ion
s an
not
ated
ear
lier
in t
his
ch
apte
r.2.
Th
e da
gger
sym
bol (
†) is
use
d to
ale
rt r
eade
rs t
o si
tuat
ion
s w
her
e da
ta w
ere
avai
labl
e fr
om fe
wer
th
an
85%
of
resp
onde
nts
.3.
Th
e sh
aded
are
as id
enti
fy d
ata
that
, for
rea
son
s ex
plai
ned
in t
he
limit
atio
ns,
can
not
be
com
pare
d w
ith
co
nfi
den
ce t
o da
ta fr
om o
ther
cou
ntr
ies.
4. C
har
ts o
r st
atis
tics
are
not
pre
sen
ted
in in
stan
ces
wh
ere
mor
e th
an 5
0% o
f th
e da
ta w
ere
mis
sin
g.
bots
wan
a †a
34
10
70
.7
Chi
le †b
74
6 55
3 26
.3
11.4
2 (0
.08)
Ger
man
y†
408
335
17.5
9.
62
(0.0
9)
Phili
ppin
es†
733
554
24.5
12
.17
(0.2
1)
Pola
nd c
158
143
8.0
11.1
7 (0
.15)
Sing
apor
e 14
2 13
9 2.
1 10
.26
(0.0
8)
Switz
erla
nd d
141
134
4.0
10.0
3 (0
.08)
Nor
way
(ALU
) †e
356
288
24.3
10
.03
(0.0
5)
Nor
way
(ALU
+) †e
15
1 11
3 19
.3
10.0
6 (0
.12)
Uni
ted
Stat
es †f
16
9 12
5 25
.9
11.9
9 (0
.20)
bots
wan
a †a
19
5
73.7
Chi
nese
Tai
pei
365
353
3.3
9.82
(0
.07)
Geo
rgia
†g
78
22
72.6
Ger
man
y† 36
3 26
8 24
.1
9.56
(0
.09)
Mal
aysi
a† 38
9 27
1 31
.2
10.9
7 (0
.10)
Om
an†
268
191
28.9
10
.56
(0.1
2)
Pola
nd†
140
118
22.1
10
.66
(0.1
8)
Russ
ian
fede
ratio
n h
2,14
1 2,
017
5.7
11.6
4 (0
.10)
Sing
apor
e 25
1 24
3 3.
2 10
.58
(0.0
8)
Thai
land
† 65
2 51
7 20
.3
11.7
9 (0
.06)
Nor
way
(PPU
& M
aste
r’s)†e
65
41
39
.2
9.55
(0
.17)
Uni
ted
Stat
es †f
43
8 34
9 22
.0
11.1
7 (0
.10)
Prac
ticu
m
Gro
up 5
.Lo
wer
Sec
onda
ry(G
rade
10
Max
imum
)
Gro
up 6
.Lo
wer
and
Upp
erSe
cond
ary
(to
Gra
de 1
1an
d ab
ove)
193OPPORTUNITY TO LEARN
For this analysis, the scale average was set to 10. Scores lower than 10 indicate less
opportunity to learn, and scores larger than 10 indicate more opportunity to learn.
The interpretation of the index scores is based on Rasch scaling. Thus, a score of 10
represents the midpoint on the rating scale.
7.8.1 Future Primary Teachers
Exhibit 7.7 shows descriptive statistics relating to future primary teachers’ opportunities
to connect their teacher-education learning with classroom practice, by program-group.
With the exception of programs in Chinese Taipei, Germany, Norway, and Switzerland,
where means were below or close to 10, most programs across program-groups seemed
to be placing some emphasis on helping future primary teachers make connections
between what they were learning in their programs and their future teaching practice.
The highest means were found in the Russian Federation in Program-Group 1 (12.1), in
the Philippines and the United States in Program-Group 2 (12.4 and 11.6, respectively),
in Chile in Program-Group 3 (12.4), and in the United States, Thailand, and Malaysia
in Program-Group 4 (11.8, 11.7, and 11.1, respectively).
7.8.2 Future Lower-Secondary Teachers
Exhibit 7.8 shows descriptive statistics for future lower-secondary teachers’ opportunities
to connect their teacher-education learning with classroom practice, by program-
group. Means lower than or close to 10 were seen in Program-Group 5 in Germany,
Norway ALU, Norway ALU plus mathematics, Singapore, and Switzerland, as well as in
Program-Group 6 in Chinese Taipei, Germany, and Norway.
Most programs across program-groups seemed to be giving some emphasis to helping
future lower-secondary teachers find connections between what they were learning in
their teacher education programs and their classroom practice in schools. The highest
means were found in the Philippines, the United States, and Chile in Program-Group 5
(12.2, 12.0, and 11.4, respectively), and in Thailand, the Russian Federation, and the
United States in Program-Group 6 (11.8, 11.6, and 11.2, respectively).
7.9 Opportunity to Learn in a Coherent Program
The future teacher questionnaire also addressed the coherence of teacher-education
programs, that is, the extent to which future teachers felt their programs had “come
together” for them. The coherence scale included items exploring program consistency,
explicitness of standards, and expectations across courses. It also included items
concerning the experiences that the teacher education programs offered future
teachers.
Future teachers were asked to indicate on a four-point scale (agree, slightly agree, slightly
disagree, disagree) whether:
1. Their program seemed to be planned to meet the main needs they had at each stage
of their preparation;
2. Later courses in the program built on what was taught in earlier courses;
3. The program was organized in a way that covered what they needed to learn to
become an effective teacher;
4. The courses seemed to follow a logical sequence of development in terms of content
and topics;

THE TEACHER EDUCATION AND DEVELOPMENT STUDY IN MATHEMATICS (TEDS-M)194
5. Each of their courses was clearly designed to prepare them to meet a common set
of explicit standard expectations for beginning teachers; and
6. There were clear links between most of the courses in their teacher education
program.
The wording of the item stems can be seen in Exhibit A7.7 in Appendix A. The results
are displayed in the form of scale scores by program-groups in Exhibits 7.9 and 7.10
below. For this analysis, the scale average was set to 10. Scores lower than 10 indicate less
opportunity to learn, and scores larger than 10 indicate greater opportunity to learn.
The interpretation of the index scores is based on Rasch scaling, with a score of 10
representing the midpoint on the rating scale.
7.9.1 Future Primary Teachers
Exhibit 7.9 presents descriptive statistics for future primary teachers’ opportunities to
learn in a coherent teacher education program, by program-group. In general, future
primary teachers rated their program as coherent, organized, and meeting a common
set of standards, as indicated by the means, which ranged in these instances from 11.2
to 13.9. The two German programs in Program-Groups 1 and 4 were exceptions; here,
the means were lower than 10. Some programs were considered highly coherent: for
instance, those in Malaysia, the Philippines, the Russian Federation, Thailand, and the
United States catering to the generalists and specialists groups. All means were larger
than 13. The overall considerable variation in the national means, however, indicates
that coherence varied greatly within program-groups.
7.9.2 Future Lower-Secondary Teachers
The means for the lower-secondary program-groups (see Exhibit 7.10) ranged from 10.2
to 14.0, indicating that the future lower-secondary teachers generally considered their
programs to be coherent. The only exceptions were the program-groups in Germany
and one program-group in Norway. Programs that the future teachers considered highly
coherent were those in Program-Group 5 in the Philippines, and the United States, as
well as in Program-Group 6 in Chinese Taipei, Malaysia, Oman, the Russian Federation,
Singapore, Thailand, and the United States.
7.10 Conclusion: Patterns Relating to Opportunities to Learn
The findings from this chapter are relevant to policymakers, particularly when
considered in conjunction with the results of the mathematics content knowledge
tests discussed in Chapter 5. This concluding section summarizes a number of general
patterns as they relate to the programs featured in TEDS-M. We discuss the perceived
relationships between opportunity to learn and the results for the TEDS-M knowledge
tests in Chapter 8.
The results of our analysis of the opportunity to learn data in seven major areas of
mathematics teacher education showed that:
• Opportunitytolearntertiarymathematicsvariedgreatlyacrossprogram-groups,
often within the same country. This variation seemed to depend on the admission
policies for the programs concerned.

195OPPORTUNITY TO LEARN
Pro
gra
m C
ohe
ren
ce
4
5 6
7 8
9 10
11
12
13
14
15
16
17
Exh
ibit
7.9
: Fut
ure
prim
ary
teac
hers
’ pro
gram
coh
eren
ce
Mea
n an
d C
onfid
ence
Inte
rval
(± 2
SE)
Sam
ple
Siz
eV
alid
Dat
a (N
)Pe
rcen
t M
issi
ng
(Wei
ghte
d)
Scal
ed S
core
:
Mea
n(S
E)
Pro
gra
m-G
roup
Co
untr
y
Not
es:
1. T
his
tab
le a
nd
char
t m
ust
be
read
wit
h a
war
enes
s of
th
e lim
itat
ion
s an
not
ated
ear
lier
in t
his
ch
apte
r.2.
Th
e da
gger
sym
bol (
†) is
use
d t
o al
ert
read
ers
to s
itu
atio
ns
wh
ere
data
wer
e av
aila
ble
from
few
er t
han
85
% o
f re
spon
den
ts.
3. T
he
shad
ed a
reas
iden
tify
dat
a th
at, f
or r
easo
ns
expl
ain
ed in
th
e lim
itat
ion
s, c
ann
ot b
e co
mpa
red
wit
h
con
fide
nce
to
data
from
oth
er c
oun
trie
s.4.
Ch
arts
or
stat
isti
cs a
re n
ot p
rese
nte
d in
inst
ance
s w
her
e m
ore
than
50%
of
the
data
wer
e m
issi
ng.
Geo
rgia
†
506
258
48.9
11
.62
(0.1
9)
Ger
man
y†
935
746
20.3
9.
12
(0.1
2)
Pola
nd †a
1,
812
1,50
9 19
.5
11.2
0 (0
.06)
Russ
ian
fede
ratio
n b
2,26
6 2,
113
7.7
13.5
0 (0
.12)
Switz
erla
nd †c
12
1 10
0 19
.3
10.2
4 (0
.14)
Chi
nese
Tai
pei
923
889
3.6
11.4
7 (0
.05)
Phili
ppin
es†
592
396
33.0
13
.98
(0.3
3)
Sing
apor
e 26
3 26
1 0.
8 12
.69
(0.1
0)
Spai
n†
1,09
3 76
7 30
.3
10.3
0 (0
.14)
Switz
erla
nd
815
714
13.3
10
.19
(0.0
5)
Uni
ted
Stat
es†d
1,
310
933
28.1
13
.32
(0.2
0)
bots
wan
a†e
86
36
59.9
Chi
le†f
65
7 39
3 40
.1
11.8
8 (0
.10)
Nor
way
(ALU
)†g
392
267
33.1
10
.24
(0.1
0)
Nor
way
(ALU
+) †g
15
9 10
2 37
.1
10.1
4 (0
.20)
Ger
man
y†
97
74
23.2
8.
79
(0.3
0)
Mal
aysi
a 57
6 52
2 9.
3 13
.10
(0.1
0)
Pola
nd a
300
255
13.2
11
.47
(0.2
0)
Sing
apor
e 11
7 11
6 0.
9 12
.66
(0.2
0)
Thai
land
66
0 59
8 9.
3 13
.06
(0.0
7)
Uni
ted
Stat
es †f
19
1 13
3 28
.2
13.5
4 (0
.51)
Perc
entil
es
5th
25th
75
th
95th
Gro
up 1
.Lo
wer
Prim
ary
(to
Gra
de 4
M
axim
um)
Gro
up 2
.Pr
imar
y(t
o G
rade
6
Max
imum
)
Gro
up 4
.Pr
imar
y M
athe
mat
ics
Spec
ialis
ts
Gro
up 3
. Pr
imar
y an
d Se
cond
ary
Gen
eral
ists
(to G
rade
10
Max
imum
)

THE TEACHER EDUCATION AND DEVELOPMENT STUDY IN MATHEMATICS (TEDS-M)196
Exh
ibit
7.1
0: F
utur
e se
cond
ary
teac
hers
’ pro
gram
coh
eren
ce
Perc
entil
es
5th
25th
75
th
95th
Mea
n an
d C
onfid
ence
Inte
rval
(± 2
SE)
4
5 6
7 8
9 10
11
12
13
14
15
16
17
Sam
ple
Siz
eV
alid
Dat
a (N
)Pe
rcen
t M
issi
ng
(Wei
ghte
d)
Scal
ed S
core
:
Mea
n(S
E)
Pro
gra
m-G
roup
Co
untr
y
Not
es:
1. T
his
tab
le a
nd
char
t m
ust
be
read
wit
h a
war
enes
s of
th
e lim
itat
ion
s an
not
ated
ear
lier
in t
his
ch
apte
r.2.
Th
e da
gger
sym
bol (
†) is
use
d to
ale
rt r
eade
rs t
o si
tuat
ion
s w
her
e da
ta w
ere
avai
labl
e fr
om fe
wer
th
an
85%
of
resp
onde
nts
.3.
Th
e sh
aded
are
as id
enti
fy d
ata
that
, for
rea
son
s ex
plai
ned
in t
he
limit
atio
ns,
can
not
be
com
pare
d w
ith
co
nfi
den
ce t
o da
ta fr
om o
ther
cou
ntr
ies.
4. C
har
ts o
r st
atis
tics
are
not
pre
sen
ted
in in
stan
ces
wh
ere
mor
e th
an 5
0% o
f th
e da
ta w
ere
mis
sin
g.
Pro
gra
m C
ohe
ren
ce
bots
wan
a †a
34
6
82.3
Chi
le †b
74
6 40
8 46
.0
11.7
9 (0
.13)
Ger
man
y† 40
8 27
8 31
.0
9.25
(0
.11)
Phi
lippi
nes†
733
491
32.4
13
.76
(0.3
1)
Pol
and
c 15
8 13
4 12
.1
11.7
3 (0
.20)
Sin
gapo
re
142
133
6.2
11.8
9 (0
.15)
Sw
itzer
land
d 14
1 12
2 11
.7
10.4
2 (0
.13)
Nor
way
(ALU
) †e
356
231
36.4
9.
89
(0.1
1)
Nor
way
(ALU
+ )†e
15
1 86
41
.5
10.2
6 (0
.21)
Uni
ted
Stat
es †f
16
9 11
8 27
.2
14.0
7 (0
.25)
bot
swan
a †a
19
2
89.5
Chi
nese
Tai
pei
365
352
3.5
11.9
6 (0
.09)
Geo
rgia
†g
78
18
79.8
Ger
man
y† 36
3 23
6 35
.3
9.15
(0
.14)
Mal
aysi
a 38
9 36
1 8.
5 12
.70
(0.1
1)
Om
an†
268
142
46.8
12
.28
(0.1
8)
Pola
nd†
140
96
33.3
11
.14
(0.2
6)
Rus
sian
fed
erat
ion
h 2,
141
1,97
5 8.
0 12
.96
(0.1
2)
Sin
gapo
re
251
237
5.6
12.0
8 (0
.12)
Thai
land
65
2 58
7 9.
8 12
.94
(0.1
1)
Nor
way
(PPU
& M
aste
r’s)†e
65
26
63
.7
Uni
ted
Stat
es †f
43
8 32
3 29
.1
12.6
5 (0
.14)
Gro
up 6
.Lo
wer
and
Upp
erSe
cond
ary
(to
Gra
de 1
1an
d ab
ove)
Gro
up 5
.Lo
wer
Sec
onda
ry(G
rade
10
Max
imum
)

197OPPORTUNITY TO LEARN
• Opportunityto learnschool-levelmathematicswashighlyuniform,referringto
the domains of numbers, measurement, and some geometry (typically taught
at the primary-school level). However, it was highly variable in the domains of
functions, data representation, calculus, and validation.
• Opportunitytolearnhowtoteachdiversestudentswashighlyvariable,withmany
countries reporting few or no opportunities to learn in this domain.
• Opportunitytolearngeneralpedagogywashighamongallprimaryprogramsand
most secondary programs.
• Mostprogramspreparingfutureprimaryteacherswereprovidingtheseteachers
with opportunities to make connections between what they were learning in their
programs and their future teaching practice. These opportunities were not as
prevalent, however, among the secondary program-groups.
• The future teachers’ level of perceived coherence with respect to their teacher
education programs varied across program-groups.
It is evident that those programs focused on preparing teachers to teach higher curricular
levels, such as lower-and upper-secondary, provide, on average, opportunities to learn
mathematics in more depth than those programs that prepare teachers for the primary
level. Thus, on average, the future lower- and upper-secondary teachers participating
in TEDS-M were experiencing more opportunity to learn mathematics, at both the
tertiary level and the school level, than their primary counterparts. The exception to
this pattern was found within the primary mathematics specialist group (Program-
Group 4). The future teachers in this group were more likely than the future teachers
in any other program-group to report a relatively high level of opportunity to learn
tertiary mathematics.
We caution here that these findings need to be considered within the context of national
and institutional policies related to teacher education, especially selectivity policies.
Nevertheless, the variability evidenced by future teachers regarding their opportunity
to learn tertiary-level mathematics is considerable and merits attention.
The findings relating to lower- and upper-school-level mathematics teachers also
showed a great deal of variability overall, with more coverage being given in both the
primary and secondary programs to areas relating to the basic concepts of numbers,
measurement, and geometry and less coverage being given to the areas of functions,
probability, and calculus. Among the primary program-groups, only the mathematics
specialists in Poland and Thailand reported covering more than 90% of the school-level
domains. The future teachers associated with the secondary program-groups generally
reported a higher level of opportunity to learn. This variability was mirrored in the
opportunities to learn in the mathematics pedagogy domains between the primary and
the lower-secondary groups.
References
Husén, T. (Ed.). (1967). International study of achievement in mathematics: A comparison of twelve
countries (Vol. II). New York: John Wiley & Sons.
Tatto, M. T. (2012). Teacher Education and Development Study in Mathematics (TEDS-M): Technical
report. Amsterdam, the Netherlands: International Association for Educational Achievement (IEA).
Tatto, M. T., Lerman, S., & Novotná, J. (2010). The organization of the mathematics preparation
and development of teachers: A report from the ICMI Study 15. Journal of Mathematics Teacher
Education, 13(4), 313–324.

THE TEACHER EDUCATION AND DEVELOPMENT STUDY IN MATHEMATICS (TEDS-M)198

199OVERVIEW Of RESULTS AND CONCLUSIONS
CHAPTER 8: OVERVIEW OF RESULTS AND CONCLUSIONS
8.1 Chapter Overview: The Study of Mathematics Teacher Education
The goal of teaching mathematics effectively to all children, whatever their background,
talent, and motivation, has made teaching more complex and the organization of
teacher education more challenging (Tatto, 2007). This is particularly true in secondary
mathematics where the pool of suitably qualified applicants tends to be smaller than
it is for other school subjects (UNESCO, 2005). As nations across the world move to
implement increasingly complex mathematics curricula, policymakers and educators
need valid and reliable data about the effectiveness of mathematics teacher education.
The Teacher Education and Development Study in Mathematics (TEDS-M) is the first
cross-national study to use nationally representative samples in order to examine the
mathematics preparation of future teachers at both the primary and secondary school
levels. The research questions that guided the study were:
(1) What are the policies that support primary and secondary teachers’ achieved level
and depth of mathematics and related teaching knowledge?
(2) What learning opportunities available to prospective primary and secondary
mathematics teachers allow them to attain such knowledge?
(3) What are the level and depth of the mathematics and related teaching knowledge
attained by prospective primary and secondary teachers at the end of their
preservice teacher education?
Seventeen countries participated in TEDS-M. Approximately 22,000 future teachers
from 750 programs in about 500 institutions were surveyed and tested. Teaching staff
within these programs were also surveyed. In total, close to 5,000 mathematicians,
mathematics educators, and general pedagogy educators took part in the study.
Because of the organizational complexity of teacher education in the participating
countries, we use this concluding chapter to summarize the diversity that we consider
policymakers, educators, and the public need to understand if improvements are to
be made to programs educating future teachers of mathematics. We accordingly
devote most of the chapter to summarizing the variation within and across the teacher
education programs that featured in TEDS-M. Specifically, we consider variation in
contexts and policies, in future teachers’ mathematics knowledge, mathematics pedagogy
content knowledge, and beliefs, and in the opportunities to learn that teacher education
programs offer. We end the chapter by discussing the contribution of TEDS-M to the
study of mathematics teacher education, and offering suggestions for further work in
this area.
8.2 Explaining Country Context and Program Variation
TEDS-M provided new insight into the nature of teacher education across the
participating countries. The more we and other members of the TEDS-M research team
studied the 17 teacher education systems that participated in TEDS-M, the more aware
we became of how varied and complex these systems are. From a research perspective,
this organizational complexity proved to be more challenging than that encountered
in the elementary and secondary areas of education systems that have been the usual
focus of IEA studies. Awareness of this complexity led to an understanding that county-

THE TEACHER EDUCATION AND DEVELOPMENT STUDY IN MATHEMATICS (TEDS-M)200
by-country comparisons, as done in most IEA studies, could only be carried out after
efforts to ensure that similar types of teacher education programs were being compared.
A key task for those of us in the TEDS-M team, therefore, was to develop a terminology
and framework suited to analysis of these differences.
8.2.1 Variation across Countries
Countries throughout the world were invited to participate in TEDS-M. The 17
countries that agreed to do so differed in many important geographic, demographic,
economic, and educational respects. The TEDS-M sample included very large countries,
such as the Russian Federation and the United States of America, as well as small
countries, such as Singapore. These countries vary greatly in financial resources, as
measured by per capita income, and in the aggregate size of their economies. In addition,
a few have high fertility rates that lead to rapidly increasing school enrollments whereas
other countries have rates below replacement levels, which could lead to declining
school enrollments.
Because of these interactive influences, most of the TEDS-M countries are relatively
well off in terms of potential for funding the teacher education that is required, but a
few of them face difficult challenges in securing the funding necessary to accommodate
growing enrollments. This latter situation is, unfortunately, very widespread outside
of the TEDS-M participating countries. TEDS-M, in short, is not representative of the
world’s countries. Instead, it comprises a relatively advantaged—but still diverse—
subsample from which much can be learned.
8.2.2 Variation across Institutions and Programs
The TEDS-M teacher education systems vary in terms of teacher selectivity and
status, but generally tend to maintain a satisfactory supply of generalist teachers while
experiencing more difficulty in recruiting specialist teachers. The selectivity of teacher
education is closely related to the supply of beginning teachers. A shortage of candidates
who want to be teachers may result in lowering standards of admission and selectivity
during and at the end of the programs (as in the United States of America). In contrast,
an oversupply of applicants (as in Chinese Taipei) may lead to tighter admission and
selectivity policy and practices.
TEDS-M provided telling evidence of diversity in the number, size, and nature of
teacher education institutions across the world. As noted above, TEDS-M surveyed
close to 500 teacher education institutions. Within these institutions, 349 programs
were preparing future teachers to teach primary students exclusively, 226 programs were
preparing future teachers to teach secondary students exclusively, and 176 programs
were preparing future teachers to teach primary and secondary students. The number
of surveyed institutions across participating countries ranged from one institution in
Singapore to 78 in Poland.
The nature of these institutions differs widely within and across countries. Some are
public, and some are private. Some are universities, and some are colleges outside
universities. Some offer programs only in education, and some are comprehensive with
regard to the fields of study offered. Some offer university degrees, and some do not.
Teacher education programs are typically categorized according to whether the
opportunities to learn that they offer are directed at preparing future teachers for

201OVERVIEW Of RESULTS AND CONCLUSIONS
primary schools or for secondary schools. However, this categorization proved to be an
over-simplification within the context of TEDS-M. The terms primary and secondary do
not mean the same thing from country to country. There is no universal agreement on
when primary grades end and secondary grades begin. Therefore, instead of relying on
an assumed primary–secondary dividing line, those of us in the TEDS-M team needed
to construct a more refined category based on a fine-grained analysis of the programs.
To ensure that programs with similar purposes and characteristics were being compared
across countries, we used two organizational variables—grade span (the range of school
grades for which teachers in a program were being prepared to teach) and teacher
specialization (whether the program was preparing specialist mathematics teachers
or generalist teachers). We therefore classified programs into program-types within
countries based on the grade spans for which they prepared teachers and according
to whether they prepared generalist teachers or specialist teachers of mathematics. We
then put the same program-types across countries together, a process that led to the
formation of six program-groups (four primary and two secondary). During much
of our analysis work, this categorization allowed us to break down and report the data
along these six groups.
8.2.3 Variation among Teacher Educators
Given the TEDS-M emphasis on the nature and extent of mathematics content and
pedagogy offered to future teachers, the study attempted to collect data that would
help readers of this report judge whether teacher educators are being appropriately
prepared.
Of the close to 5,000 teacher educators surveyed during TEDS-M, the percent with
doctoral degrees in mathematics ranged from 7% in the Philippines to over 60% in
Chinese Taipei, Georgia, Oman, and Poland. In mathematics pedagogy, the range
extended from about 7% in the Philippines to 40% in Georgia. Among these teacher
educators, the percent who said they had some experience of teaching primary or
secondary school ranged from about 20% in Oman to 90% in Georgia.
TEDS-M asked all participating teacher educators if they considered themselves
mathematics specialists. Their responses varied depending on whether they were
a mathematician teaching mathematics content to future teachers, a mathematics
educator teaching mathematics pedagogy, or a teacher educator teaching general
pedagogy. However, a surprising number among those teaching mathematics content
or mathematics pedagogy described themselves as non-specialists: nearly 40% of the
educators in Chile, Chinese Taipei, Malaysia, the Philippines, and the Russian Federation
were in this category. In contrast, close to 70% of the teacher educators in Botswana,
Georgia, Germany, Oman, Poland, Singapore, Switzerland, and Thailand reported
mathematics as their main specialty.
8.2.4 Variation among Future Teachers
Future teachers being prepared to teach at the primary and secondary school levels in
these TEDS-M samples were predominantly female, although there were more males at
the higher levels and in particular countries.
Most of the future teachers studied by TEDS-M seemed to come from well-resourced
homes, leaving low-income families underrepresented in one of the largest occupations

THE TEACHER EDUCATION AND DEVELOPMENT STUDY IN MATHEMATICS (TEDS-M)202
in every country and one that has historically offered an accessible avenue of social
mobility. Many of the future teachers reported having access to such possessions as
calculators, dictionaries, and DVD players, but not personal computers—now widely
considered essential for professional use. The latter was especially the case among
teachers living in less affluent countries such as Botswana, Georgia, the Philippines,
and Thailand.
The TEDS-M survey found that a relatively small proportion of the sample of future
teachers who completed the survey did not speak the official language of their country
(which was used in the TEDS-M surveys and tests) at home. This finding suggests
that linguistic minorities may be underrepresented in future teacher cohorts in some
countries.
Other aspects of the future teachers’ self-reports were encouraging. Most future
teachers described themselves as above average or near the top of their year in academic
achievement by the end of their upper-secondary schooling. Among the reasons the
future teachers gave for deciding to become teachers, liking working with young people
and wanting to influence the next generation were particularly prevalent. Many believed
that despite teaching being a challenging job, they had an aptitude for it.
8.3 Explaining Variation within and across Teacher Education Programs
TEDS-M made apparent the diverse approaches to teacher education across the many
programs studied. It could be argued that this diversity represents variations along a
policy continuum, with those developing policy seeking to obtain an optimal balance
among the plausible opportunities that future teachers need to experience in order to
learn the knowledge required to teach mathematics.1
8.3.1 Mathematics and Mathematics Pedagogy Content Knowledge
TEDS-M has provided the first solid evidence, based on national samples, of major
differences across countries in the (measured) mathematics knowledge outcomes of
teacher education. The answer to the TEDS-M research question about the teaching
mathematics knowledge that future primary and secondary teachers acquire by the end
of their teacher education is clear: for the most part, this knowledge varies considerably
among individuals within every country and across countries.
The difference in mean mathematics content knowledge (MCK) scores between the
highest- and lowest-achieving country in each primary and secondary program-
group was between 100 and 200 score points, or one and two standard deviations.
This difference is a substantial one, comparable to the difference between the 50th and
the 96th percentile in the whole TEDS-M future teacher sample. Differences in mean
achievement across countries in the same program-group on mathematics pedagogical
content knowledge (MPCK) were somewhat smaller, ranging from about 100 to 150
1. As an example, Norway implemented a new structure to replace ALU (and ALU+) in 2010, which has taken them a small step toward specialization. They now have:
•GLU 1–7, which prepares teachers to teach for Grades 1–7. This program-type includes a compulsorymathematics course of 30 credit points.
•GLU 5–10, which prepares teachers to teach Grades 5–10. This program type includes no compulsorymathematics. However, if future teachers want to qualify to teach mathematics, they must choose at least 60 credit points in mathematics.
Note: GLU is an abbreviation for grunnskolelærerutdanning (basic school teacher education).

203OVERVIEW Of RESULTS AND CONCLUSIONS
score points. So, within each program group, and by the end of the teacher preparation
programs, future teachers in some countries had substantially greater mathematics
content knowledge and mathematics pedagogical content knowledge than others.
On average, future primary teachers being prepared as mathematics specialists had
higher MCK and MPCK scores than those being prepared to teach as lower-primary
generalists. Also, on average, future teachers being prepared as lower- and upper-
secondary teachers had higher MCK and MPCK scores than those intending to be
lower-secondary teachers. In the top-scoring countries within each program-group, the
majority of future teachers had average scores on mathematics content knowledge and
mathematics pedagogy content knowledge at or above the higher MCK and MPCK
anchor points.
In countries with more than one program-type per education level, the relative
performance on MCK and on MPCK of the future teachers with respect to their peers in
other countries was not fixed. For instance, the mean mathematics content knowledge
score of future primary teachers in Poland ranked fourth among five countries
preparing lower-primary generalist teachers, but first among six countries preparing
primary mathematics specialist teachers. This finding suggests that the design of teacher
education curricula can have substantial effects on the level of knowledge that future
teachers are able to acquire via the opportunities to learn provided for them.
For each participating country and teacher education institution, the TEDS-M results
serve as a baseline from which to conduct further investigation. For example, content
experts, having looked at the descriptions of the anchor points for MCK and MPCK
and the percent of the future teachers graduating from their program or country who
reached each anchor point, might elect to study how changes in curriculum can and do
lead to improved performance. Policymakers may want to investigate ways to encourage
more talented secondary school graduates to select teaching as a career, or they might
want to look at how teacher preparation programs of the same duration can lead to
higher scores on MCK and MPCK. One conclusion that can be drawn in relation to
such considerations is that goals for improving mathematics content knowledge and
mathematics pedagogy content knowledge among future teachers should be ambitious
yet achievable.
8.3.2 Beliefs
Teachers’ actions in the classroom are guided by their beliefs about the nature of
teaching and about the subjects that they teach. Acknowledging this, the TEDS-M
team gathered data on beliefs from future teachers of mathematics and from the
educators preparing them to be teachers. The survey assessed beliefs about the nature
of mathematics (e.g., mathematics is a set of rules and procedures, mathematics is a
process of enquiry), beliefs about learning mathematics (e.g., mathematics is learned by
following teacher direction, through student activity), and beliefs about mathematics
achievement (e.g., mathematics is a fixed ability).
The beliefs that mathematics is a set of rules and procedures and that it is best learned
by following teacher direction have been characterized in the literature as calculational
and direct-transmission (Phillip, 2007; Staub & Stern, 2002). The beliefs that mathematics
is a process of inquiry and that it is best learned by active student involvement are
consistent with the beliefs described in the same literature as conceptual and cognitive-
constructionist. Several countries (Chile, Chinese Taipei, Poland, the Russian Federation,

THE TEACHER EDUCATION AND DEVELOPMENT STUDY IN MATHEMATICS (TEDS-M)204
Singapore, and Spain) showed endorsement for the belief that mathematics is a set of
rules and procedures.
In general, educators and future teachers in all countries were more inclined to endorse
the pattern of beliefs described as conceptual or cognitive-constructionist in orientation.
Georgia’s endorsement of this pattern was relatively weak, however. Educators and
future teachers in Botswana, Georgia, Malaysia, Oman, the Philippines, and Thailand
endorsed the pattern of beliefs described as computational or direct-transmission;
educators and future teachers in Germany, Norway, and Switzerland for the most part
did not.
The view of mathematics as a fixed ability carries with it the implication that mathematics
is not for all: that some children cannot and will not succeed in mathematics. This view
may have implications for how children are grouped and how they are taught. Although
this view was a minority one in all countries surveyed, its existence is still a matter of
concern because it contravenes the apparent international consensus that all children
need to learn mathematics at a higher level than has generally been the case. Future
teachers and teacher educators in Botswana, Georgia, Malaysia, the Philippines, and
Thailand held to this view, but their counterparts in Germany, Norway, Switzerland,
and the United States rejected it.
The TEDS data made apparent substantial cross-country differences in the extent to
which such views are held. The program-groups within countries endorsing beliefs
consistent with a computational orientation were generally among those with lower
mean scores on the knowledge tests. However, it would be unwise to generalize from
this finding, for two reasons. First, the sample of countries is quite small. Second, the
countries differ greatly from one another both culturally and historically, in ways that
may influence both beliefs and knowledge in unknown ways. In some high-scoring
countries on the MCK and MPCK tests, future teachers endorsed the beliefs that
mathematics is a set of rules and procedures and is a process of enquiry. The TEDS-M
findings thus showed endorsement for both of these conceptions within mathematics
teacher education. However, what is at issue here is the extent to which teacher education
institutions appropriately balance and draw on these conceptions when designing and
delivering the content of their programs (Tatto, 1996, 1998, 1999).
8.3.3 Opportunities to Learn in Teacher Education Programs
In TEDS-M, primary school teachers in most countries are prepared as generalists
able to teach most, if not all, of the core subjects in the school curriculum. However,
some countries also prepare specialist teachers of mathematics to teach below Grade 6.
These include Germany, Malaysia, Poland, Singapore, Thailand, and the United States.
In lower-secondary schools, specialization is the norm across countries, although in
most cases this means teaching not one but two main subjects, such as mathematics
and science. A future teacher being prepared to specialize in teaching mathematics is
likely to require more mathematics content knowledge than is a future teacher being
prepared to teach more than one subject.
One reason for classifying programs in terms of grade span and specialization is that
the resulting groups are likely to have different opportunities to learn (OTL), and these
opportunities, in turn, are likely to lead to different knowledge outcomes. TEDS-M
found that OTL for mathematics, mathematics pedagogy, and general pedagogy

205OVERVIEW Of RESULTS AND CONCLUSIONS
depended on the grade level and the curriculum that future teachers were expected
to teach. For example, programs for future primary teachers gave more coverage than
programs for lower-secondary teachers to the basic concepts of numbers, measurement,
and geometry and less coverage to functions, probability and statistics, calculus, and
structure. Programs designed to prepare teachers to teach higher grades tended to
provide, on average, more opportunities to learn mathematics than those programs
that prepared teachers for lower grades.
The findings of this study thus reflect what seems to be a cultural norm in some
countries, namely, that teachers who are expected to teach in primary—and especially
the lower-primary—grades need little in the way of mathematics content beyond that
included in the school curriculum. The pattern among secondary future teachers is
generally characterized by more and deeper coverage of mathematics content; however,
there was more variability in OTL among those future teachers being prepared for
lower-secondary school (known in some countries as “middle school”) than among
those being prepared to teach Grade 11 and above.
Not surprisingly, the countries with programs providing the most comprehensive
opportunities to learn challenging mathematics had higher scores on the TEDS-M
tests of knowledge. In TEDS-M, primary-level and secondary-level teachers in high-
achieving countries such as Chinese Taipei, Singapore, and the Russian Federation had
significantly more opportunities than their primary and secondary counterparts in the
other participating countries to learn university- and school-level mathematics.
The TEDS-M findings signal an opportunity to examine how these distinct approaches
play out in practice. If relatively little content knowledge is needed for the lower
grades, then a lesser emphasis on mathematics preparation and non-specialization can
be justified. The key question is whether teachers prepared in this fashion can teach
mathematics as effectively as teachers with more extensive and deeper knowledge,
such as that demonstrated by specialist teachers. Although TEDS-M has not provided
definitive conclusions in this regard (this question necessitates studying beginning
teachers and their impact on student learning), what TEDS-M does show is that, within
countries, future teachers intending to be mathematics specialists in primary schools
had higher knowledge scores on average than their generalist counterparts.
8.3.4 Context and Policy
TEDS-M has shown that teachers’ careers and working conditions range from those
where teachers are carefully selected, well compensated, and highly regarded to those
where there is less selectivity, low salaries, and low status. These careers and conditions
are shaped in part by the differences between the two major systems of teacher
employment (career-based and position-based) found in the world’s public schools, as
well as by the various mixed or hybrid models.
Career-based refers to systems where teachers are recruited at a relatively young age to
remain in one coherent, clearly organized, public or civil service system throughout
their working lives. Teacher education is facilitated by the predictability and stability of
careers in these systems. Promotion follows a well-defined path of seniority and other
requirements, and teaching assignments follow bureaucratic deployment principles and
procedures. Countries able to afford career-based staffing can generally avoid major
teacher supply problems and have an advantage in recruiting higher ability applicants.

THE TEACHER EDUCATION AND DEVELOPMENT STUDY IN MATHEMATICS (TEDS-M)206
Conversely, position-based systems take a very different approach to teacher employment. Teachers are not hired into the national civil service or separate national teacher service. Rather, they are hired into specific teaching positions within an unpredictable career-long progression of assignments. As a result, access is more readily open to applicants of diverse ages and atypical career backgrounds. Movement in and out of teaching to raise children or pursue other opportunities is possible. These systems can find it difficult to recruit and retain sufficient numbers of teachers, especially to work in areas such as science and mathematics, which offer entry to attractive opportunities in other occupations. As a result, it is difficult to predict what future teachers in such systems need by way of initial preparation.
In short, this distinction between career- and position-based systems is bound to have a major impact on teacher education. Because appointment in a career-based system is a commitment to lifelong employment, such systems are more justified in investing in initial teacher preparation, knowing that the education system will likely realize the return on this investment throughout the teacher’s working life. Often this commitment is made even before the beginner receives any teacher training. In contrast, in position-based systems, such an investment in initial preparation is less justifiable because the system is based on the assumption that individuals move in and out of teaching on a relatively short-term basis, and that some graduates of teacher education may never occupy a teaching position. While career-based systems have been the norm in many countries, increasingly the tendency is toward position-based systems. In general, position-based systems, with teachers hired on fixed, limited-term contracts, are less expensive for governments to maintain.
One long-term policy evident in all TEDS-M countries is that of requiring teachers to have university degrees. Securing an all-graduate teaching force, that is, a force where all its members have higher education degrees (not just diplomas), has been one of the main goals of teacher education policy in many countries over the years. It has thus affected teacher recruitment and the subsequent experience of these teachers once they are employed.
A major part of TEDS-M involved examining the participating countries’ policies for assuring the quality of future teachers. We found great variation in these policies, especially with respect to the quality of entrants to teacher education programs, the accreditation of teacher education programs, and methods for assessing the quality of graduates before they can gain entry to the teaching profession.
The TEDS-M data indicated a positive relationship between the strength of quality assurance arrangements and country mean scores in the TEDS-M tests of mathematics content knowledge and mathematics pedagogy knowledge. Countries with strong quality assurance arrangements, such as Chinese Taipei and Singapore, scored highest on these measures. Countries with weaker arrangements, such as Georgia and Chile, tended to score lower on the two measures of future teacher knowledge.
These findings have implications for policymakers concerned with promoting teacher quality. Quality assurance policies and arrangements can make an important difference to teacher education. These policies can be designed to cover the full spectrum, from polices designed to make teaching an attractive career through to policies for assuring that entrants to the profession have attained high standards of performance. The TEDS-M findings point to the importance of ensuring that policies designed to promote
teacher quality are coordinated and mutually supportive.
207OVERVIEW Of RESULTS AND CONCLUSIONS
As evident from the TEDS-M data, countries such as Chinese Taipei and Singapore
that do well on international tests of student achievement, such as TIMSS, not only
ensure the quality of entrants to teacher education but also have strong systems for
reviewing, assessing, and accrediting teacher education providers. They also have strong
mechanisms for ensuring that graduates meet high standards of performance before
gaining certification and full entry to the profession.
Reform in this and other respects seems to be the order of the day among the TEDS-M
participating teacher education systems. All were implementing reforms in teacher
education in order to enhance the efficacy of their education systems overall. They were
also, within the context of TEDS-M, striving to increase the mathematics achievement
levels of their students. In the European countries that participated in TEDS-M, changes
to entire university systems are underway as a result of the Bologna Accord for the
creation of a European Higher Education Area. In other countries, such as Malaysia,
changes in teacher education toward more advanced levels of education for teachers
have been precipitated by concerns about the limitations and weaknesses of current
mathematics, science, and technology education. Although reform is ubiquitous in the
TEDS-M countries, it is important to keep in mind that, as in any cross-sectional study,
TEDS-M provides only a snapshot of mathematics teacher preparation, singular to the
year 2008/2009, when the data were collected.
8.4 Contribution of TEDS-M to the Study of Mathematics Teacher Education
TEDS-M was not only the first cross-national research on teacher education, but also
the first cross-national study of higher education. Moreover, the surveys were completed
with high response rates and coverage of the target populations, in most cases meeting
the very high IEA standards for sampling and response rates. In the limited instances
where the IEA standards were not met, the response rates still compared favorably with
general experience in higher education surveys, and especially in those cases where the
targeted participants were all volunteers.
TEDS-M thus lays the foundation for future rigorous cross-national research in
teacher education, having made available a common terminology, sampling methods
tailored to teacher education, and instruments and analyses that can be adapted and
improved for use in subsequent teacher education studies, whether in mathematics or
other curriculum areas. TEDS-M has also served to develop strong capacity within the
countries that participated in this study. Finally, we anticipate that the TEDS-M database
will contribute to this new line of research by permitting researchers throughout the
world to conduct secondary analysis.
References
Philipp, R. A. (2007). Mathematics teachers’ beliefs and affect. In F. K. Lester (Ed.), Second handbook
of research on mathematics teaching and learning (pp. 257–315). Charlotte, NC: National Council
of Teachers of Mathematics & Information Age Publishing.
Staub, F. C., & Stern, E. (2002). The nature of teachers’ pedagogical content beliefs matters for
students’ achievement gains: Quasi-experimental evidence from elementary mathematics. Journal
of Educational Psychology, 94(2), 344–355.

THE TEACHER EDUCATION AND DEVELOPMENT STUDY IN MATHEMATICS (TEDS-M)208
Tatto, M. T. (1996). Examining values and beliefs about teaching diverse students: Understanding
the challenges for teacher education. Educational Evaluation and Policy Analysis, 18(2), 155–180.
Tatto, M. T. (1998). The influence of teacher education on teachers’ beliefs about purposes of
education, roles, and practice. Journal of Teacher Education, 49(1), 66–77.
Tatto, M. T. (1999). The socializing influence of normative cohesive teacher education on teachers’
beliefs about instructional choice. Teachers and Teaching, 5(1), 111–134.
Tatto, M. T. (2007). Reforming teaching globally (Oxford Studies in Comparative Studies in
Education). Oxford, UK: Symposium Books. Available online at http://www.symposium-books.
co.uk/books/bookdetails.asp?bid=11
UNESCO. (2005). EFA global monitoring report: The quality imperative. Paris, France: Author.
209APPENDICES
APPENDICES

THE TEACHER EDUCATION AND DEVELOPMENT STUDY IN MATHEMATICS (TEDS-M)210

211APPENDICES
A1: CHAPTER 3 ExHIBITS
Country Population Area (,1000s Population Urban Life Rank in GNI per Levels (millions) of sq. km) Density Population Expectancy total Capita of Wealth (People (% of at Birth GDP (Purchasing per sq km) total) (Years) Power Parity)
botswana 1.9 1 582 2 3 3 59 4 54 5 113 6 13,250 7 Middle 8
Canada 33.3 9,985 3 80 81 10 38,490 High
Chile 16.8 756 22 88 79 45 13,430 Middle
Chinese Taipei 22.9 9 36 10 637 11 80 12 78 20 13 32,700 14 (High)
Georgia 4.3 70 62 53 72 117 4,860 Low
Germany 82.3 357 230 74 80 4 37,510 High
Malaysia 27.0 331 82 70 74 40 13,900 Middle
Norway 4.8 324 12 77 81 23 60,510 Very high
Oman 2.8 310 9 72 76 74 24,530 Middle
Philippines 90.3 300 301 64 72 47 3,940 Low
Poland 38.1 313 122 61 76 21 17,640 Middle
Russian federation 141.4 17,098 8 73 68 12 19,770 Middle
Singapore 4.6 1 6,545 100 81 43 52,000 Very high
Spain 44.5 506 88 77 81 9 32,060 High
Switzerland 7.5 41 183 73 82 19 42,220 Very high
Thailand 67.4 513 131 33 69 32 7,830 Low
United States 311.7 9,629 32 81 78 1 47,100 Very high
Notes:
1. Based on United Nations data, “Country Profile” (2008), World Statistics Pocketbook, United Nations Statistics Division: http://data.un.org/
Note in particular: numbers are rounded to the nearest tenth (e.g., 44,486,000 = 44.5); numeric citations refer to entire column, with the exception of Chinese Taipei
2. Based on United Nations data, “Country Profile” (2008), World Statistics Pocketbook, United Nations Statistics Division: http://data.un.org/
Note in particular: numbers are rounded to the nearest tenth (e.g., 505,992,000 = 506)
3. Based on United Nations data, “Country Profile” (2008), World Statistics Pocketbook, United Nations Statistics Division: http://data.un.org/
Note in particular: numbers are rounded to the nearest whole number (e.g., 3.3 = 3)
4. Based on United Nations data, (2007), World Statistics Pocketbook, United Nations Statistics Division: http://data.un.org/
Note in particular: numbers are rounded to the nearest whole number (e.g., 58.9 = 59)
5. Based on “World Development Indicators” (2008), World Bank: http://data.worldbank.org/
6. Based on “World Development Indicators” (2008), World Bank: http://data.worldbank.org/
Note in particular: numbers are calculated in international dollars
7. Range: low ($3,000–8,000), medium ($13,000–$25,000), high ($32,000–$39,000), very high ($42,000–$61,000)
8. Based on NationMaster data (2008) derived from World Bank Development Indicators Database and the CIA World Factbook: http://www.nationmaster.com/time.php?stat=peo_pop&country=tw
9. Based on CIA World Factbook: https://www.cia.gov/library/publications/the-world-factbook/geos/tw.html
10. Based on Ministry of Interior, Department of Statistics, Chinese Taipei (2007): http://www.moi.gov.tw/stat/english/interior.asp
11. Based on Directorate-General of Budget, Accounting, and Statistics, Chinese Taipei (2008): http://www.dgbas.gov.tw/ct.asp?xItem=15408&CtNode=4594&mp=1
12. Based on CIA World Factbook (2009): https://www.cia.gov/library/publications/the-world-factbook/geos/tw.html
13. Based on CIA World Factbook (2009), US dollars: https://www.cia.gov/library/publications/the-world-factbook/geos/tw.html
14. Based on CIA World Factbook (2009), US dollars: https://www.cia.gov/library/publications/the-world-factbook/geos/tw.html
Exhibit A3.1: Sources of national demographic and human development statistics
APPENDIX A: Supplementary Exhibits Relating to Chapters 3, 4, 6, and 7
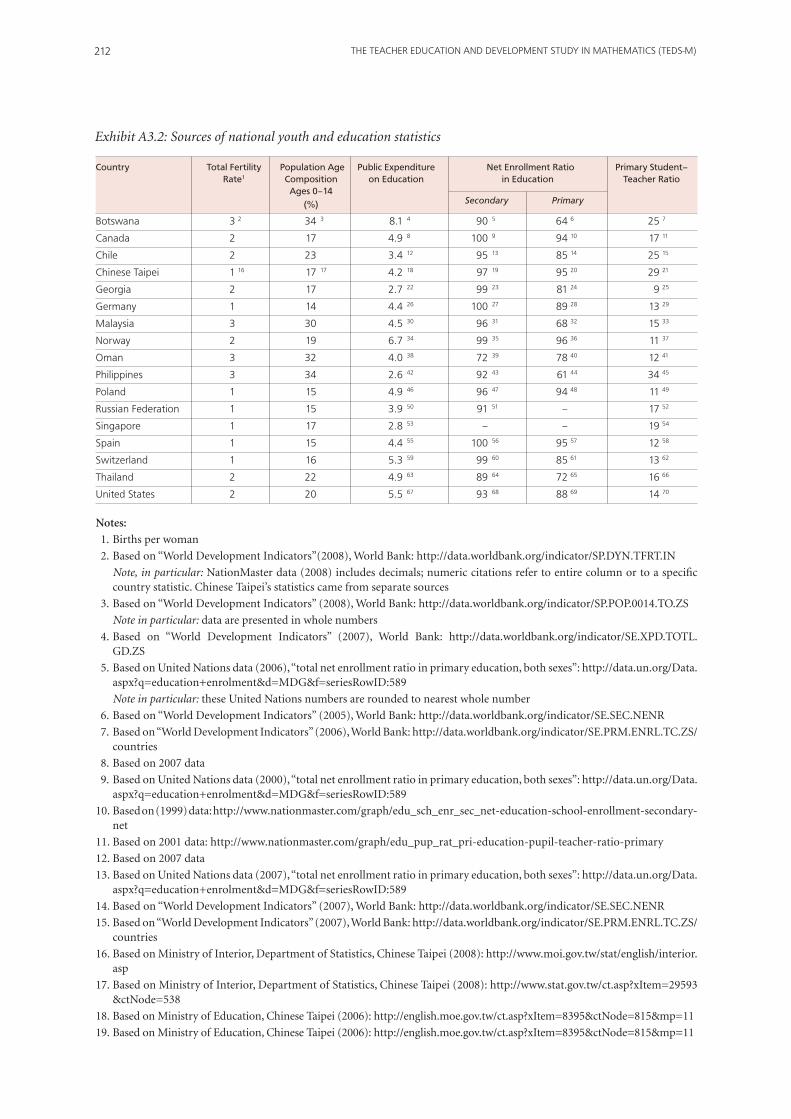
THE TEACHER EDUCATION AND DEVELOPMENT STUDY IN MATHEMATICS (TEDS-M)212
Country Total Fertility Population Age Public Expenditure Net Enrollment Ratio Primary Student– Rate1 Composition on Education in Education Teacher Ratio Ages 0–14 (%) Secondary Primary
botswana 3 2 34 3 8.1 4 90 5 64 6 25 7
Canada 2 17 4.9 8 100 9 94 10 17 11
Chile 2 23 3.4 12 95 13 85 14 25 15
Chinese Taipei 1 16 17 17 4.2 18 97 19 95 20 29 21
Georgia 2 17 2.7 22 99 23 81 24 9 25
Germany 1 14 4.4 26 100 27 89 28 13 29
Malaysia 3 30 4.5 30 96 31 68 32 15 33
Norway 2 19 6.7 34 99 35 96 36 11 37
Oman 3 32 4.0 38 72 39 78 40 12 41
Philippines 3 34 2.6 42 92 43 61 44 34 45
Poland 1 15 4.9 46 96 47 94 48 11 49
Russian federation 1 15 3.9 50 91 51 – 17 52
Singapore 1 17 2.8 53 – – 19 54
Spain 1 15 4.4 55 100 56 95 57 12 58
Switzerland 1 16 5.3 59 99 60 85 61 13 62
Thailand 2 22 4.9 63 89 64 72 65 16 66
United States 2 20 5.5 67 93 68 88 69 14 70
Notes:
1. Births per woman
2. Based on “World Development Indicators”(2008), World Bank: http://data.worldbank.org/indicator/SP.DYN.TFRT.IN
Note, in particular: NationMaster data (2008) includes decimals; numeric citations refer to entire column or to a specific country statistic. Chinese Taipei’s statistics came from separate sources
3. Based on “World Development Indicators” (2008), World Bank: http://data.worldbank.org/indicator/SP.POP.0014.TO.ZS
Note in particular: data are presented in whole numbers
4. Based on “World Development Indicators” (2007), World Bank: http://data.worldbank.org/indicator/SE.XPD.TOTL.GD.ZS
5. Based on United Nations data (2006), “total net enrollment ratio in primary education, both sexes”: http://data.un.org/Data.aspx?q=education+enrolment&d=MDG&f=seriesRowID:589
Note in particular: these United Nations numbers are rounded to nearest whole number
6. Based on “World Development Indicators” (2005), World Bank: http://data.worldbank.org/indicator/SE.SEC.NENR
7. Based on “World Development Indicators” (2006), World Bank: http://data.worldbank.org/indicator/SE.PRM.ENRL.TC.ZS/countries
8. Based on 2007 data
9. Based on United Nations data (2000), “total net enrollment ratio in primary education, both sexes”: http://data.un.org/Data.aspx?q=education+enrolment&d=MDG&f=seriesRowID:589
10. Based on (1999) data: http://www.nationmaster.com/graph/edu_sch_enr_sec_net-education-school-enrollment-secondary-net
11. Based on 2001 data: http://www.nationmaster.com/graph/edu_pup_rat_pri-education-pupil-teacher-ratio-primary
12. Based on 2007 data
13. Based on United Nations data (2007), “total net enrollment ratio in primary education, both sexes”: http://data.un.org/Data.aspx?q=education+enrolment&d=MDG&f=seriesRowID:589
14. Based on “World Development Indicators” (2007), World Bank: http://data.worldbank.org/indicator/SE.SEC.NENR
15. Based on “World Development Indicators” (2007), World Bank: http://data.worldbank.org/indicator/SE.PRM.ENRL.TC.ZS/countries
16. Based on Ministry of Interior, Department of Statistics, Chinese Taipei (2008): http://www.moi.gov.tw/stat/english/interior.asp
17. Based on Ministry of Interior, Department of Statistics, Chinese Taipei (2008): http://www.stat.gov.tw/ct.asp?xItem=29593 &ctNode=538
18. Based on Ministry of Education, Chinese Taipei (2006): http://english.moe.gov.tw/ct.asp?xItem=8395&ctNode=815&mp=11
19. Based on Ministry of Education, Chinese Taipei (2006): http://english.moe.gov.tw/ct.asp?xItem=8395&ctNode=815&mp=11
Exhibit A3.2: Sources of national youth and education statistics

213APPENDICES
20. Based on Ministry of Education, Chinese Taipei (2006): http://english.moe.gov.tw/ct.asp?xItem=8395&ctNode=815&mp=11
21. Based on Ministry of Education, Chinese Taipei (2006): http://english.moe.gov.tw/ct.asp?xItem=8395&ctNode=815&mp=11
22. Based on 2007 data
23. Based on United Nations data (2008), “total net enrollment ratio in primary education, both sexes:” http://data.un.org/Data.aspx?q=education+enrolment&d=MDG&f=seriesRowID:589
24. Based on “World Development Indicators” (2007), World Bank: http://data.worldbank.org/indicator/SE.SEC.NENR
25. Based on “World Development Indicators” (2008), World Bank: http://data.worldbank.org/indicator/SE.PRM.ENRL.TC.ZS/countries
26. Based on 2006 data
27. Based on United Nations data (2007), “total net enrollment ratio in primary education, both sexes:” http://data.un.org/Data.aspx?q=education+enrolment&d=MDG&f=seriesRowID:589
28. Based on “World Development Indicators” (1996), World Bank: http://data.worldbank.org/indicator/SE.SEC.NENR?page=2
29. Based on “World Development Indicators” (2008), World Bank: http://data.worldbank.org/indicator/SE.PRM.ENRL.TC.ZS/countries
30. Based on 2007 data
31. Based on United Nations data (2007), “total net enrollment ratio in primary education, both sexes”: http://data.un.org/Data.aspx?q=education+enrolment&d=MDG&f=seriesRowID:589
32. Based on “World Development Indicators” (2007), World Bank: http://data.worldbank.org/indicator/SE.SEC.NENR
33. Based on “World Development Indicators” (2007), World Bank: http://data.worldbank.org/indicator/SE.PRM.ENRL.TC.ZS/countries
34. Based on 2007 data
35. Based on United Nations data (2008), “total net enrollment ratio in primary education, both sexes:” http://data.un.org/Data.aspx?q=education+enrolment&d=MDG&f=seriesRowID:589
36. Based on “World Development Indicators” (2008), World Bank: http://data.worldbank.org/indicator/SE.SEC.NENR
37. Based on “World Development Indicators” (2004), World Bank: http://data.worldbank.org/indicator/SE.PRM.ENRL.TC.ZS?page=1
38. Based on 2006 data
39. Based on United Nations data (2008), “total net enrollment ratio in primary education, both sexes:” http://data.un.org/Data.aspx?q=education+enrolment&d=MDG&f=seriesRowID:589
40. Based on “World Development Indicators” (2008), World Bank: http://data.worldbank.org/indicator/SE.SEC.NENR
41. Based on “World Development Indicators” (2008), World Bank: http://data.worldbank.org/indicator/SE.PRM.ENRL.TC.ZS/countries
42. Based on 2007 data
43. Based on United Nations data (2008), “total net enrollment ratio in primary education, both sexes:” http://data.un.org/Data.aspx?q=education+enrolment&d=MDG&f=seriesRowID:589
44. Based on “World Development Indicators” (2008), World Bank: http://data.worldbank.org/indicator/SE.SEC.NENR
45. Based on “World Development Indicators” (2007), World Bank: http://data.worldbank.org/indicator/SE.PRM.ENRL.TC.ZS/countries
46. Based on 2007 data
47. Based on United Nations data (2007), “total net enrollment ratio in primary education, both sexes:” http://data.un.org/Data.aspx?q=education+enrolment&d=MDG&f=seriesRowID:589
48. Based on “World Development Indicators” (2007), World Bank: http://data.worldbank.org/indicator/SE.SEC.NENR
49. Based on “World Development Indicators” (2007), World Bank: http://data.worldbank.org/indicator/SE.PRM.ENRL.TC.ZS/countries
50. Based on 2006 data
51. Based on 2004 data: http://www.nationmaster.com/time.php?stat=edu_sch_enr_pri_net-education-school-enrollment-primary-net&country=rs-russia
52. Based on “World Development Indicators” (2008), World Bank: http://data.worldbank.org/indicator/SE.PRM.ENRL.TC.ZS/countries
53. Based on 2008 data
54. Based on “World Development Indicators” (2008), World Bank: http://data.worldbank.org/indicator/SE.PRM.ENRL.TC.ZS/countries
55. Based on 2007 data
56. Based on United Nations data (2008), “total net enrollment ratio in primary education, both sexes:” http://data.un.org/Data.aspx?q=education+enrolment&d=MDG&f=seriesRowID:589
57. Based on “World Development Indicators” (2008), World Bank: http://data.worldbank.org/indicator/SE.SEC.NENR

THE TEACHER EDUCATION AND DEVELOPMENT STUDY IN MATHEMATICS (TEDS-M)214
58. Based on “World Development Indicators” (2008), World Bank: http://data.worldbank.org/indicator/SE.PRM.ENRL.TC.ZS/countries
59. Based on 2007 data
60. Based on United Nations data (2008), “total net enrollment ratio in primary education, both sexes:” http://data.un.org/Data.aspx?q=education+enrolment&d=MDG&f=seriesRowID:589
61. Based on “World Development Indicators” (2008), World Bank: http://data.worldbank.org/indicator/SE.SEC.NENR
62. Based on “World Development Indicators” (2008), World Bank: http://data.worldbank.org/indicator/SE.PRM.ENRL.TC.ZS/countries
63. Based on 2008 data
64. Based on United Nations data (2008), “total net enrollment ratio in primary education, both sexes:” http://data.un.org/Data.aspx?q=education+enrolment&d=MDG&f=seriesRowID:589
65. Based on “World Development Indicators” (2008), World Bank: http://data.worldbank.org/indicator/SE.SEC.NENR
66. Based on “World Development Indicators” (2008), World Bank: http://data.worldbank.org/indicator/SE.PRM.ENRL.TC.ZS/countries
67. Based on 2007 data
68. Based on United Nations data (2008), “total net enrollment ratio in primary education, both sexes:” http://data.un.org/Data.aspx?q=education+enrolment&d=MDG&f=seriesRowID:589
69. Based on “World Development Indicators” (2008), World Bank: http://data.worldbank.org/indicator/SE.SEC.NENR
70. Based on “World Development Indicators” (2008), World Bank: http://data.worldbank.org/indicator/SE.PRM.ENRL.TC.ZS/countries

215APPENDICES
A2:
CH
APT
ER 4
Ex
HIB
ITS
Exh
ibit
A4.
1: M
ean
num
ber
of te
achi
ng c
onta
ct h
ours
in li
bera
l art
s, a
cade
mic
mat
hem
atic
s, a
nd m
athe
mat
ics
cont
ent r
elat
ed to
the
scho
ol m
athe
mat
ics
curr
icul
um
that
futu
re p
rim
ary
teac
hers
exp
erie
nce
duri
ng t
heir
pro
gram
s (e
stim
ated
mea
ns in
hou
rs)
Mea
n N
umb
er o
f Te
achi
ng
Co
nta
ct
Mea
n N
umb
er o
f Te
achi
ng
Co
nta
ct
Mea
n N
umbe
r o
f Te
achi
ng C
ont
act
Ho
urs
P
rog
ram
-Gro
up
Co
untr
y H
our
s fo
r Li
ber
al A
rts
Co
urse
s H
our
s fo
r A
cad
emic
Mat
hem
atic
s
for
Mat
hem
atic
s C
on
ten
t R
elat
ed t
o t
he
Scho
ol M
athe
mat
ics
Cur
ricu
lum
n
Est.
(S
E)
n
Est.
(S
E)
n
Est.
(S
E)
Low
er P
rimar
y G
eorg
ia
10
991
(79.
2)
10
280
(61.
3)
10
152
(25.
5)(t
o G
rade
4
Pola
ndf
57
396
(33.
5)
54
6 (2
.2)
65
31
(4.7
)M
axim
um)
Russ
ian
fede
ratio
ng 43
1,
574
(128
.7)
33
454
(86.
5)
36
366
(104
.1)
Sw
itzer
land
i 5
493
(192
.0)
5 34
(2
4.6)
5
49
(28.
9)
Prim
ary
Chi
nese
Tai
peia
6 22
8 (1
13.8
) 6
17
(7.4
) 5
16
(6.7
)(t
o G
rade
6
Phili
ppin
ese
32
54
(5.3
) 31
50
(4
.3)
20
54
(5.5
)M
axim
um)
Sing
apor
e 4
108
(50.
9)
4 21
6 (1
01.8
) 4
42
(13.
0)
Sp
ainh
36
548
(114
.9)
31
30
(8.4
) 34
63
(1
4.2)
Sw
itzer
land
i 10
41
5 (8
5.4)
7
85
(24.
0)
10
82
(13.
1)
U
nite
d St
ates
j 40
49
2 (5
9.5)
41
12
9 (2
3.2)
43
78
(1
2.8)
Prim
ary
and
bo
tsw
ana
1
164
(0.0
) 1
84
(0.0
)Se
cond
ary
Gen
eral
ists
C
hile
† 27
1,
258
(261
.7)
7 21
1 (4
8.7)
25
18
8 (2
2.9)
(to
Gra
de 1
0 N
orw
ay (A
LU)†c
7
446
(55.
7)
2 26
9 (4
3.1)
14
35
6 (4
2.3)
Max
imum
) N
orw
ay (A
LU+)
†c
8 47
1 (4
7.2)
3
248
(74.
7)
15
360
(42.
2)
Prim
ary
Mal
aysi
ab 7
197
(60.
1)
6 18
6 (9
6.2)
10
11
9 (5
4.0)
Mat
hem
atic
s Po
land
†f
34
168
(15.
1)
34
950
(52.
3)
29
48
(12.
3)Sp
ecia
lists
Si
ngap
ore
2 0
(0.0
) 2
0 (0
.0)
2 78
(2
1.2)
Th
aila
nd†
34
303
(47.
7)
20
343
(49.
1)
25
117
(23.
9)
U
nite
d St
ates
†j
11
272
(130
.9)
13
125
(74.
2)
9 61
(3
1.4)
Not
es:
1. †
Som
e or
all
futu
re t
each
ers
in t
his
cou
ntr
y ar
e be
ing
prep
ared
to
teac
h p
rim
ary
and
low
er-s
econ
dary
stu
den
ts. T
he
prog
ram
-gro
ups
pre
pari
ng
futu
re p
rim
ary
teac
her
s an
d t
he
prog
ram
-gr
oups
pre
pari
ng
low
er-s
econ
dary
tea
cher
s ar
e th
eref
ore
part
ly o
r fu
lly o
verl
appi
ng
(see
TE
DS-
M t
ech
nic
al r
epor
t).
2. W
hen
rea
din
g th
is e
xhib
it, k
eep
in m
ind
the
limit
atio
ns
ann
otat
ed in
Ch
apte
r 4
and
den
oted
in t
he
tabl
e ab
ove
by fo
otn
ote
lett
ers.
3. T
he
shad
ed a
reas
iden
tify
dat
a th
at, f
or r
easo
ns
expl
ain
ed in
th
ese
limit
atio
ns,
can
not
be
com
pare
d w
ith
con
fide
nce
to
data
from
oth
er c
oun
trie
s.
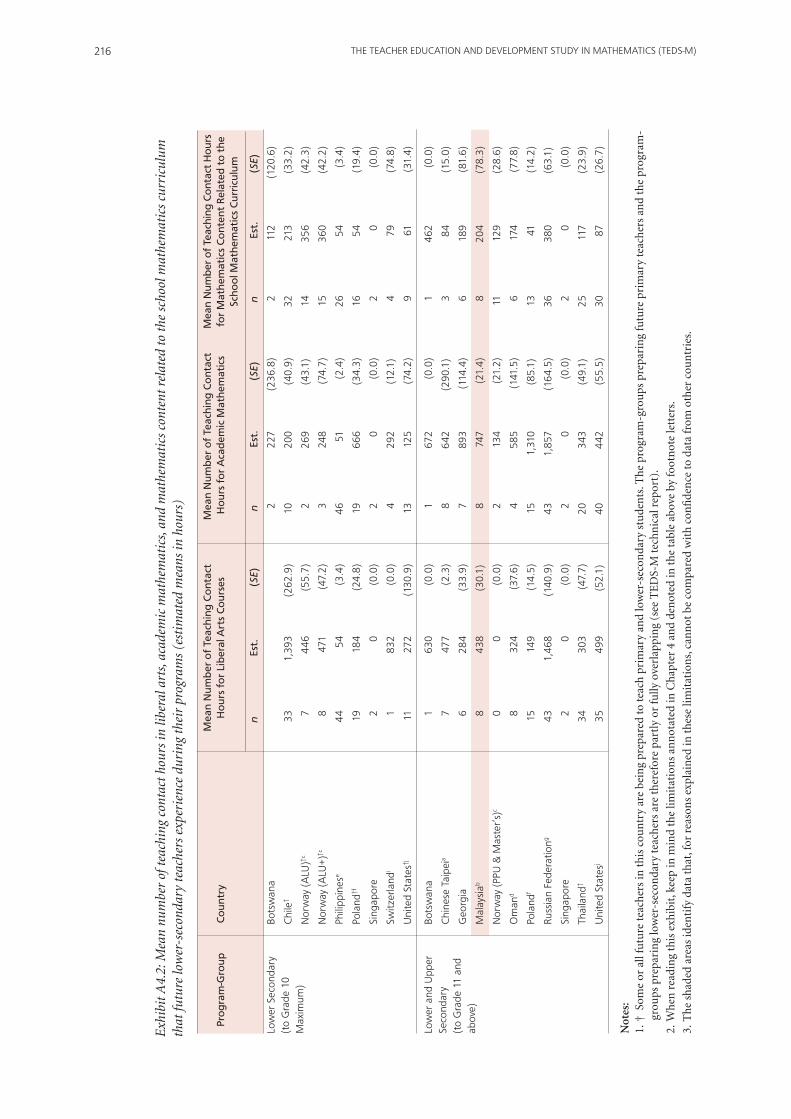
THE TEACHER EDUCATION AND DEVELOPMENT STUDY IN MATHEMATICS (TEDS-M)216
Exh
ibit
A4.
2: M
ean
num
ber
of te
achi
ng c
onta
ct h
ours
in li
bera
l art
s, a
cade
mic
mat
hem
atic
s, a
nd m
athe
mat
ics
cont
ent r
elat
ed to
the
scho
ol m
athe
mat
ics
curr
icul
um
that
futu
re lo
wer
-sec
onda
ry te
ache
rs e
xper
ienc
e du
ring
the
ir p
rogr
ams
(est
imat
ed m
eans
in h
ours
)
Mea
n N
umb
er o
f Te
achi
ng
Co
nta
ct
Mea
n N
umb
er o
f Te
achi
ng
Co
nta
ct
Mea
n N
umbe
r o
f Te
achi
ng C
ont
act
Ho
urs
P
rog
ram
-Gro
up
Co
untr
y H
our
s fo
r Li
ber
al A
rts
Co
urse
s H
our
s fo
r A
cad
emic
Mat
hem
atic
s
for
Mat
hem
atic
s C
on
ten
t R
elat
ed t
o t
he
Scho
ol M
athe
mat
ics
Cur
ricu
lum
n
Est.
(S
E)
n
Est.
(S
E)
n
Est.
(S
E)
Low
er S
econ
dary
bo
tsw
ana
2
227
(236
.8)
2 11
2 (1
20.6
)(t
o G
rade
10
Chi
le†
33
1,39
3 (2
62.9
) 10
20
0 (4
0.9)
32
21
3 (3
3.2)
Max
imum
) N
orw
ay (A
LU)†c
7
446
(55.
7)
2 26
9 (4
3.1)
14
35
6 (4
2.3)
N
orw
ay (A
LU+)
†c
8 47
1 (4
7.2)
3
248
(74.
7)
15
360
(42.
2)
Ph
ilipp
ines
e 44
54
(3
.4)
46
51
(2.4
) 26
54
(3
.4)
Po
land
†f
19
184
(24.
8)
19
666
(34.
3)
16
54
(19.
4)
Si
ngap
ore
2 0
(0.0
) 2
0 (0
.0)
2 0
(0.0
)
Sw
itzer
land
i 1
832
(0.0
) 4
292
(12.
1)
4 79
(7
4.8)
U
nite
d St
ates
†j
11
272
(130
.9)
13
125
(74.
2)
9 61
(3
1.4)
Low
er a
nd U
pper
bo
tsw
ana
1 63
0 (0
.0)
1 67
2 (0
.0)
1 46
2 (0
.0)
Seco
ndar
y
Chi
nese
Tai
peia
7 47
7 (2
.3)
8 64
2 (2
90.1
) 3
84
(15.
0)(t
o G
rade
11
and
Geo
rgia
6
284
(33.
9)
7 89
3 (1
14.4
) 6
189
(81.
6)ab
ove)
M
alay
siab
8 43
8 (3
0.1)
8
747
(21.
4)
8 20
4 (7
8.3)
N
orw
ay (P
PU &
Mas
ter’
s)c
0 0
(0.0
) 2
134
(21.
2)
11
129
(28.
6)
O
man
d 8
324
(37.
6)
4 58
5 (1
41.5
) 6
174
(77.
8)
Po
land
f 15
14
9 (1
4.5)
15
1,
310
(85.
1)
13
41
(14.
2)
Ru
ssia
n fe
dera
tiong
43
1,46
8 (1
40.9
) 43
1,
857
(164
.5)
36
380
(63.
1)
Si
ngap
ore
2 0
(0.0
) 2
0 (0
.0)
2 0
(0.0
)
Th
aila
nd†
34
303
(47.
7)
20
343
(49.
1)
25
117
(23.
9)
U
nite
d St
ates
j 35
49
9 (5
2.1)
40
44
2 (5
5.5)
30
87
(2
6.7)
Not
es:
1. †
Som
e or
all
futu
re t
each
ers
in t
his
cou
ntr
y ar
e be
ing
prep
ared
to
teac
h p
rim
ary
and
low
er-s
econ
dary
stu
den
ts. T
he
prog
ram
-gro
ups
pre
pari
ng
futu
re p
rim
ary
teac
her
s an
d t
he
prog
ram
-gr
oups
pre
pari
ng
low
er-s
econ
dary
tea
cher
s ar
e th
eref
ore
part
ly o
r fu
lly o
verl
appi
ng
(see
TE
DS-
M t
ech
nic
al r
epor
t).
2. W
hen
rea
din
g th
is e
xhib
it, k
eep
in m
ind
the
limit
atio
ns
ann
otat
ed in
Ch
apte
r 4
and
den
oted
in t
he
tabl
e ab
ove
by fo
otn
ote
lett
ers.
3. T
he
shad
ed a
reas
iden
tify
dat
a th
at, f
or r
easo
ns
expl
ain
ed in
th
ese
limit
atio
ns,
can
not
be
com
pare
d w
ith
con
fide
nce
to
data
from
oth
er c
oun
trie
s.

217APPENDICES
Exh
ibit
A4.
3: M
ean
num
ber
of te
achi
ng c
onta
ct h
ours
in m
athe
mat
ics
peda
gogy
, fou
ndat
ions
, and
ped
agog
y co
urse
s th
at fu
ture
pri
mar
y te
ache
rs e
xper
ienc
e du
ring
th
eir
prog
ram
s (e
stim
ated
mea
ns in
hou
rs)
Mea
n N
umb
er o
f Te
achi
ng
Co
nta
ct
Mea
n N
umb
er o
f Te
achi
ng
Co
nta
ct
Mea
n N
umb
er o
f Te
achi
ng
Co
nta
ct
Pro
gra
m-G
roup
C
oun
try
Ho
urs
for
Mat
hem
atic
s Pe
dag
ogy
H
our
s fo
r Fo
und
atio
ns
H
our
s fo
r G
ener
al P
edag
ogy
n
Est.
(S
E)
n
Est.
(S
E)
n
Est.
(S
E)
Low
er P
rimar
y G
eorg
ia
10
125
(34.
1)
10
396
(74.
6)
10
139
(33.
5)(t
o G
rade
4
Pola
ndf
68
37
(3.1
) 59
40
0 (2
1.9)
69
27
2 (2
3.9)
Max
imum
) Ru
ssia
n fe
dera
tiong
44
303
(29.
2)
44
879
(102
.1)
44
715
(130
.5)
Sw
itzer
land
i 5
98
(11.
9)
6 46
9 (6
4.3)
6
507
(221
.3)
Prim
ary
Chi
nese
Tai
peia
8 22
(9
.7)
11
108
(56.
2)
11
115
(59.
4)(t
o G
rade
6
Phili
ppin
ese
24
58
(3.9
) 32
53
(3
.9)
32
49
(5.1
)M
axim
um)
Sing
apor
e 4
102
(2.8
) 4
96
(11.
3)
4 42
(8
.5)
Sp
ainh
44
137
(14.
9)
43
328
(22.
2)
43
345
(56.
1)
Sw
itzer
land
i 9
76
(8.4
) 11
45
8 (4
0.9)
13
35
0 (6
7.8)
U
nite
d St
ates
j 51
63
(9
.4)
52
180
(27.
2)
52
347
(34.
4)
Prim
ary
and
bo
tsw
ana
2 12
4 (2
8.3)
2
186
(72.
1)
3 32
(1
6.9)
Seco
ndar
y G
ener
alist
s C
hile
† 29
14
5 (1
4.8)
28
51
5 (7
5.9)
28
90
4 (1
47.1
)(t
o G
rade
10
Nor
way
(ALU
)†c
14
356
(42.
3)
11
272
(40.
1)
11
272
(40.
1)M
axim
um)
Nor
way
(ALU
+)†c
15
36
0 (4
2.2)
11
29
5 (5
7.1)
11
29
5 (5
7.1)
Prim
ary
Mal
aysi
ab 10
11
8 (1
7.9)
7
122
(43.
7)
10
103
(16.
1)M
athe
mat
ics
Pola
nd†f
35
11
5 (8
.3)
35
73
(6.6
) 33
63
(3
.9)
Spec
ialis
ts
Sing
apor
e 2
108
(8.5
) 2
72
(0.0
) 2
24
(0.0
)
Th
aila
nd†
31
159
(33.
7)
29
284
(48.
7)
30
152
(37.
3)
U
nite
d St
ates
†j
14
52
(12.
7)
14
96
(34.
8)
14
166
(89.
9)
Not
es:
1. †
Som
e or
all
futu
re t
each
ers
in t
his
cou
ntr
y ar
e be
ing
prep
ared
to
teac
h p
rim
ary
and
low
er-s
econ
dary
stu
den
ts. T
he
prog
ram
-gro
ups
pre
pari
ng
futu
re p
rim
ary
teac
her
s an
d t
he
prog
ram
-gr
oups
pre
pari
ng
low
er-s
econ
dary
tea
cher
s ar
e th
eref
ore
part
ly o
r fu
lly o
verl
appi
ng
(see
TE
DS-
M t
ech
nic
al r
epor
t).
2. W
hen
rea
din
g th
is e
xhib
it, k
eep
in m
ind
the
limit
atio
ns
ann
otat
ed in
Ch
apte
r 4
and
den
oted
in t
he
tabl
e ab
ove
by fo
otn
ote
lett
ers.
3. T
he
shad
ed a
reas
iden
tify
dat
a th
at, f
or r
easo
ns
expl
ain
ed in
th
ese
limit
atio
ns,
can
not
be
com
pare
d w
ith
con
fide
nce
to
data
from
oth
er c
oun
trie
s.
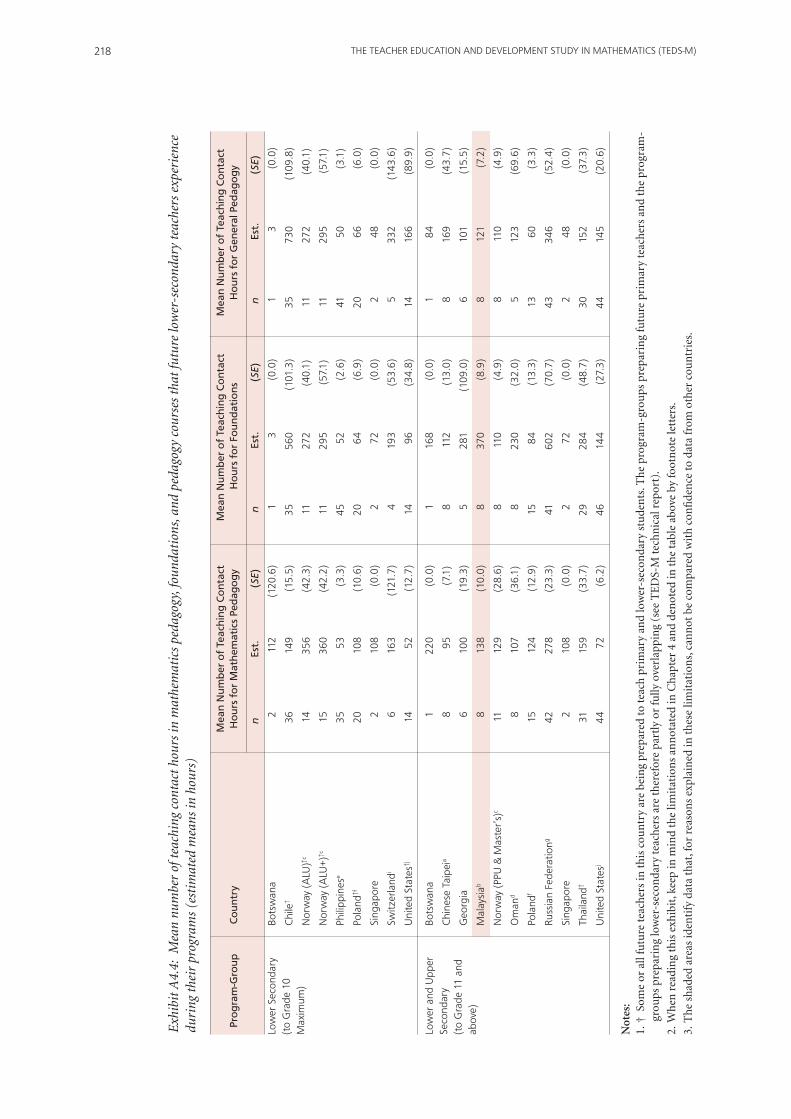
THE TEACHER EDUCATION AND DEVELOPMENT STUDY IN MATHEMATICS (TEDS-M)218
Exh
ibit
A4.
4: M
ean
num
ber
of te
achi
ng c
onta
ct h
ours
in m
athe
mat
ics
peda
gogy
, fou
ndat
ions
, and
ped
agog
y co
urse
s th
at fu
ture
low
er-s
econ
dary
teac
hers
exp
erie
nce
duri
ng th
eir
prog
ram
s (e
stim
ated
mea
ns in
hou
rs)
Mea
n N
umb
er o
f Te
achi
ng
Co
nta
ct
Mea
n N
umb
er o
f Te
achi
ng
Co
nta
ct
Mea
n N
umb
er o
f Te
achi
ng
Co
nta
ct
Pro
gra
m-G
roup
C
oun
try
Ho
urs
for
Mat
hem
atic
s Pe
dag
ogy
H
our
s fo
r Fo
und
atio
ns
H
our
s fo
r G
ener
al P
edag
ogy
n
Est.
(S
E)
n
Est.
(S
E)
n
Est.
(S
E)
Low
er S
econ
dary
bo
tsw
ana
2 11
2 (1
20.6
) 1
3 (0
.0)
1 3
(0.0
)(t
o G
rade
10
Chi
le†
36
149
(15.
5)
35
560
(101
.3)
35
730
(109
.8)
Max
imum
) N
orw
ay (A
LU)†c
14
35
6 (4
2.3)
11
27
2 (4
0.1)
11
27
2 (4
0.1)
N
orw
ay (A
LU+)
†c
15
360
(42.
2)
11
295
(57.
1)
11
295
(57.
1)
Ph
ilipp
ines
e 35
53
(3
.3)
45
52
(2.6
) 41
50
(3
.1)
Po
land
†f
20
108
(10.
6)
20
64
(6.9
) 20
66
(6
.0)
Si
ngap
ore
2 10
8 (0
.0)
2 72
(0
.0)
2 48
(0
.0)
Sw
itzer
land
i 6
163
(121
.7)
4 19
3 (5
3.6)
5
332
(143
.6)
U
nite
d St
ates
†j
14
52
(12.
7)
14
96
(34.
8)
14
166
(89.
9)
Low
er a
nd U
pper
bo
tsw
ana
1 22
0 (0
.0)
1 16
8 (0
.0)
1 84
(0
.0)
Seco
ndar
y
Chi
nese
Tai
peia
8 95
(7
.1)
8 11
2 (1
3.0)
8
169
(43.
7)(t
o G
rade
11
and
Geo
rgia
6
100
(19.
3)
5 28
1 (1
09.0
) 6
101
(15.
5)ab
ove)
M
alay
siab
8 13
8 (1
0.0)
8
370
(8.9
) 8
121
(7.2
)
N
orw
ay (P
PU &
Mas
ter’
s)c
11
129
(28.
6)
8 11
0 (4
.9)
8 11
0 (4
.9)
O
man
d 8
107
(36.
1)
8 23
0 (3
2.0)
5
123
(69.
6)
Po
land
f 15
12
4 (1
2.9)
15
84
(1
3.3)
13
60
(3
.3)
Ru
ssia
n fe
dera
tiong
42
278
(23.
3)
41
602
(70.
7)
43
346
(52.
4)
Si
ngap
ore
2 10
8 (0
.0)
2 72
(0
.0)
2 48
(0
.0)
Th
aila
nd†
31
159
(33.
7)
29
284
(48.
7)
30
152
(37.
3)
U
nite
d St
ates
j 44
72
(6
.2)
46
144
(27.
3)
44
145
(20.
6)
Not
es:
1. †
Som
e or
all
futu
re t
each
ers
in t
his
cou
ntr
y ar
e be
ing
prep
ared
to
teac
h p
rim
ary
and
low
er-s
econ
dary
stu
den
ts. T
he
prog
ram
-gro
ups
pre
pari
ng
futu
re p
rim
ary
teac
her
s an
d t
he
prog
ram
-gr
oups
pre
pari
ng
low
er-s
econ
dary
tea
cher
s ar
e th
eref
ore
par
tly
or fu
lly o
verl
appi
ng
(see
TE
DS-
M t
ech
nic
al r
epor
t).
2. W
hen
rea
din
g th
is e
xhib
it, k
eep
in m
ind
the
limit
atio
ns
ann
otat
ed in
Ch
apte
r 4
and
den
oted
in t
he
tabl
e ab
ove
by fo
otn
ote
lett
ers.
3. T
he
shad
ed a
reas
iden
tify
dat
a th
at, f
or r
easo
ns
expl
ain
ed in
th
ese
limit
atio
ns,
can
not
be
com
pare
d w
ith
con
fide
nce
to
data
from
oth
er c
oun
trie
s.

219APPENDICES
Exh
ibit
A4.
5: G
radu
atio
n re
quir
emen
ts fo
r fu
ture
pri
mar
y te
ache
rs (
esti
mat
ed p
erce
nt)
(Par
t 1)
Pass
ing
Gra
de
on
C
om
pre
hen
sive
Wri
tten
C
om
pre
hen
sive
Ora
l N
atio
nal
or
Stat
e
Pr
og
ram
-Gro
up
Co
untr
y al
l Sub
ject
s Ex
amin
atio
n
Exam
inat
ion
Ex
amin
atio
n
n
Est.
(S
E)
n
Est.
(S
E)
n
Est.
(S
E)
n
Est.
(S
E)
Low
er P
rimar
y G
eorg
ia
10
100.
0 (0
.0)
10
20.0
(1
4.1)
10
70
.0
(10.
0)
10
30.0
(1
0.0
(to
Gra
de 4
Po
land
f 85
10
0.0
(0.0
) 85
4.
7 (2
.4)
84
23.8
(3
.8)
85
9.4
(3.3
)M
axim
um)
Russ
ian
fede
ratio
ng 45
10
0.0
(0.0
) 44
12
.1
(4.3
) 45
91
.9
(3.8
) 45
53
.1
(12.
7)
Sw
itzer
land
i 7
100.
0 (0
.0)
7 85
.7
(20.
2)
7 71
.4
(24.
7)
7 0.
0 (0
.0)
Prim
ary
Chi
nese
Tai
peia
11
100.
0 (0
.0)
10
94.3
(5
.4)
10
77.1
(1
0.7)
10
82
.8
(9.5
)
(to
Gra
de 6
Ph
ilipp
ines
e 33
94
.0
(6.1
) 33
59
.0
(11.
3)
33
35.4
(9
.2)
31
50.0
(1
3.1)
Max
imum
) Si
ngap
ore
4 10
0.0
(0.0
) 4
0.0
(0.0
) 4
0.0
(0.0
) 4
0.0
(0.0
)
Sp
ainh
48
98.1
(1
.9)
48
6.7
(2.0
) 48
0.
0 (0
.0)
48
1.4
(1.4
)
Sw
itzer
land
i 14
10
0.0
(0.0
) 14
64
.3
(16.
0)
14
71.4
(1
0.1)
14
7.
1 (7
.1)
U
nite
d St
ates
j 54
10
0.0
(0.0
) 54
44
.6
(6.2
) 54
10
.7
(4.8
) 54
88
.7
(4.9
)
Prim
ary
and
bots
wan
a 4
100.
0 (0
.0)
4 10
0.0
(0.0
) 3
0.0
(0.0
) 4
50.0
(3
5.4)
Seco
ndar
y G
ener
alist
s C
hile
† 31
10
0.0
(0.0
) 31
22
.6
(7.9
) 31
41
.9
(9.4
) 31
9.
7 (6
.5)
(to
Gra
de 1
0
Nor
way
(ALU
)†c
16
100.
0 (0
.0)
15
60.0
(7
.8)
15
60.0
(7
.8)
15
0.0
(0.0
)M
axim
um)
Nor
way
(ALU
+)†c
16
100.
0 (0
.0)
16
62.5
(8
.8)
15
66.7
(1
0.4)
16
0.
0 (0
.0)
Prim
ary
Mal
aysi
ab 12
10
0.0
(0.0
) 12
91
.7
(8.3
) 12
25
.0
(14.
4)
12
91.7
(8
.3)
Mat
hem
atic
s Po
land
†f 38
10
0.0
(0.0
) 38
7.
9 (2
.7)
37
54.1
(8
.8)
38
10.5
(5
.4)
Spec
ialis
ts
Sing
apor
e 2
100.
0 (0
.0)
2 0.
0 (0
.0)
2 0.
0 (0
.0)
2 0.
0 (0
.0)
Th
aila
nd†
48
100.
0 (0
.0)
46
67.3
(7
.9)
46
23.9
(5
.8)
47
12.8
(3
.1)
U
nite
d St
ates
†j 15
10
0.0
(0.0
) 15
26
.3
(16.
9)
15
0.0
(0.0
) 15
61
.6
(17.
3)
Not
es:
1. †
Som
e or
all
futu
re t
each
ers
in t
his
cou
ntr
y ar
e be
ing
prep
ared
to
teac
h p
rim
ary
and
low
er-s
econ
dary
stu
den
ts. T
he
prog
ram
-gro
ups
pre
pari
ng
futu
re p
rim
ary
teac
her
s an
d t
he
prog
ram
-gr
oups
pre
pari
ng
low
er-s
econ
dary
tea
cher
s ar
e th
eref
ore
part
ly o
r fu
lly o
verl
appi
ng
(see
TE
DS-
M t
ech
nic
al r
epor
t).
2. W
hen
rea
din
g th
is e
xhib
it, k
eep
in m
ind
the
limit
atio
ns
ann
otat
ed in
Ch
apte
r 4
and
den
oted
in t
he
tabl
e ab
ove
by fo
otn
ote
lett
ers.
3. T
he
shad
ed a
reas
iden
tify
dat
a th
at, f
or r
easo
ns
expl
ain
ed in
th
ese
limit
atio
ns,
can
not
be
com
pare
d w
ith
con
fide
nce
to
data
from
oth
er c
oun
trie
s.

THE TEACHER EDUCATION AND DEVELOPMENT STUDY IN MATHEMATICS (TEDS-M)220
Exh
ibit
A4.
6: G
radu
atio
n re
quir
emen
ts fo
r fu
ture
pri
mar
y te
ache
rs (
esti
mat
ed p
erce
nt)
(Par
t 2)
Exam
inat
ion
Set
by
Teac
hin
g C
om
pet
ence
Fi
eld
Exp
erie
nce
Th
esis
Pr
og
ram
-Gro
up
Co
untr
y Pr
og
ram
n
Est.
(S
E)
n
Est.
(S
E)
n
Est.
(S
E)
n
Est.
(S
E)
Low
er P
rimar
y G
eorg
ia
10
60.0
(1
4.1)
10
60
.0
(14.
1)
10
90.0
(1
0.0)
10
20
.0
(14.
1)(t
o G
rade
4
Pola
ndf
85
80.0
(3
.9)
85
62.4
(6
.3)
85
100.
0 (0
.0)
85
95.3
(1
.7)
Max
imum
) Ru
ssia
n fe
dera
tiong
45
95.9
(2
.5)
45
94.6
(0
.8)
45
100.
0 (0
.0)
45
100.
0 (0
.0)
Sw
itzer
land
i 7
100.
0 (0
.0)
7 10
0.0
(0.0
) 7
100.
0 (0
.0)
7 10
0.0
(0.0
)
Prim
ary
Chi
nese
Tai
peia
11
59.4
(2
3.7)
11
89
.2
(6.4
) 11
10
0.0
(0.0
) 11
5.
4 (5
.1)
(to
Gra
de 6
Ph
ilipp
ines
e 33
70
.0
(9.5
) 33
91
.5
(6.9
) 33
94
.0
(6.1
) 33
70
.5
(12.
0)M
axim
um)
Sing
apor
e 4
0.0
(0.0
) 4
100.
0 (0
.0)
4 10
0.0
(0.0
) 4
0.0
(0.0
)
Sp
ainh
48
5.3
(1.4
) 47
36
.4
(11.
5)
48
52.2
(1
1.5)
48
0.
0 (0
.0)
Sw
itzer
land
i 14
85
.7
(10.
1)
14
100.
0 (0
.0)
14
100.
0 (0
.0)
14
100.
0 (0
.0)
U
nite
d St
ates
j 54
35
.6
(10.
5)
54
100.
0 (0
.0)
54
100.
0 (0
.0)
54
10.4
(6
.0)
Prim
ary
and
bots
wan
a 3
66.7
(1
9.0)
4
100.
0 (0
.0)
4 10
0.0
(0.0
) 4
50.0
(3
5.4)
Seco
ndar
y G
ener
alist
s C
hile
† 31
38
.7
(10.
7)
31
67.7
(9
.9)
31
100.
0 (0
.0)
31
80.6
(8
.5)
(to
Gra
de 1
0 N
orw
ay (A
LU)†
c 16
87
.5
(8.8
) 16
10
0.0
(0.0
) 16
10
0.0
(0.0
) 16
0.
0 (0
.0)
Max
imum
) N
orw
ay (A
LU+)
†c 16
87
.5
(8.8
) 16
93
.8
(6.3
) 16
10
0.0
(0.0
) 16
0.
0 (0
.0)
Prim
ary
Mal
aysi
ab 12
83
.3
(11.
8)
12
100.
0 (0
.0)
12
100.
0 (0
.0)
12
8.3
(8.3
)
Mat
hem
atic
s Po
land
†f 36
75
.0
(6.6
) 36
47
.2
(9.8
) 38
10
0.0
(0.0
) 37
86
.5
(5.9
)Sp
ecia
lists
Si
ngap
ore
2 0.
0 (0
.0)
2 10
0.0
(0.0
) 2
100.
0 (0
.0)
2 0.
0 (0
.0)
Th
aila
nd†
46
69.5
(6
.2)
47
89.4
(4
.1)
47
97.9
(2
.1)
47
14.9
(4
.8)
U
nite
d St
ates
†j 15
19
.6
(16.
4)
15
100.
0 (0
.0)
15
100.
0 (0
.0)
15
0.0
(0.0
)
Not
es:
1. †
Som
e or
all
futu
re t
each
ers
in t
his
cou
ntr
y ar
e be
ing
prep
ared
to
teac
h p
rim
ary
and
low
er-s
econ
dary
stu
den
ts. T
he
prog
ram
-gro
ups
pre
pari
ng
futu
re p
rim
ary
teac
her
s an
d t
he
prog
ram
-gr
oups
pre
pari
ng
low
er-s
econ
dary
tea
cher
s ar
e th
eref
ore
part
ly o
r fu
lly o
verl
appi
ng
(see
TE
DS-
M t
ech
nic
al r
epor
t).
2. W
hen
rea
din
g th
is e
xhib
it, k
eep
in m
ind
the
limit
atio
ns
ann
otat
ed in
Ch
apte
r 4
and
den
oted
in t
he
tabl
e ab
ove
by fo
otn
ote
lett
ers.
3. T
he
shad
ed a
reas
iden
tify
dat
a th
at, f
or r
easo
ns
expl
ain
ed in
th
ese
limit
atio
ns,
can
not
be
com
pare
d w
ith
con
fide
nce
to
data
from
oth
er c
oun
trie
s.
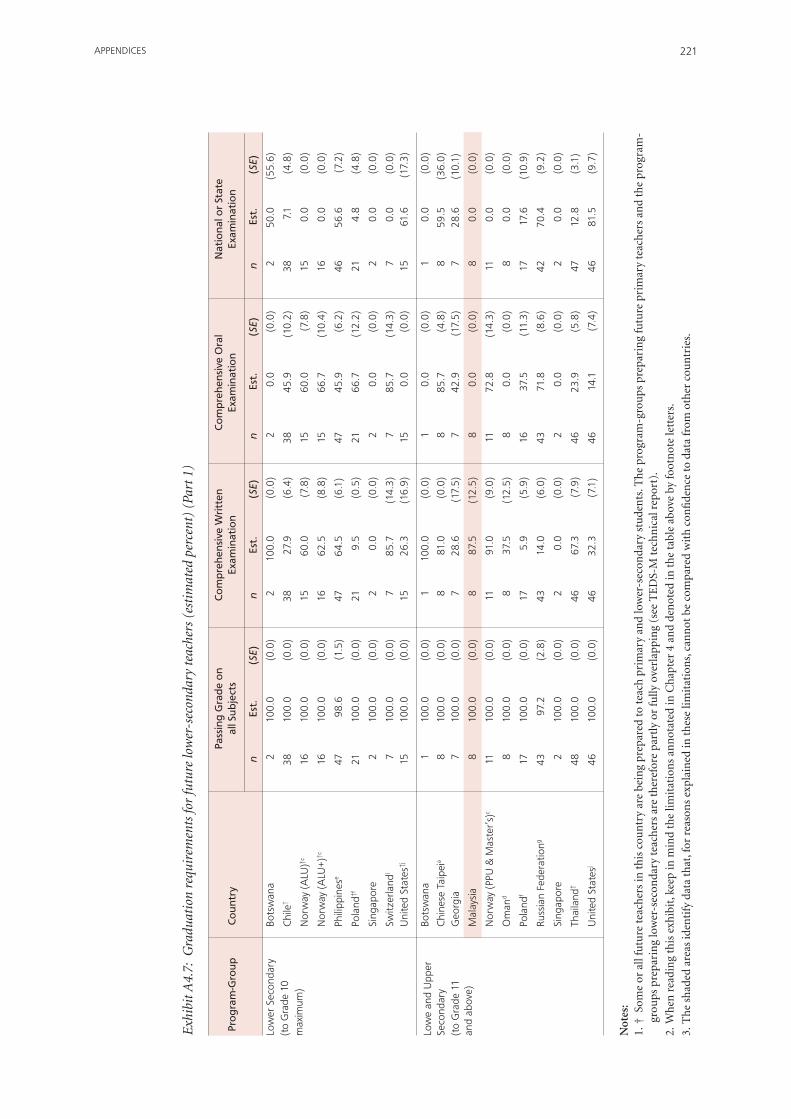
221APPENDICES
Exh
ibit
A4.
7: G
radu
atio
n re
quir
emen
ts fo
r fu
ture
low
er-s
econ
dary
teac
hers
(es
tim
ated
per
cent
) (P
art 1
)
Pass
ing
Gra
de
on
C
om
pre
hen
sive
Wri
tten
C
om
pre
hen
sive
Ora
l N
atio
nal
or
Stat
e
Pr
og
ram
-Gro
up
Co
untr
y al
l Sub
ject
s Ex
amin
atio
n
Exam
inat
ion
Ex
amin
atio
n
n
Est.
(S
E)
n
Est.
(S
E)
n
Est.
(S
E)
n
Est.
(S
E)
Low
er S
econ
dary
bo
tsw
ana
2 10
0.0
(0.0
) 2
100.
0 (0
.0)
2 0.
0 (0
.0)
2 50
.0
(55.
6)(t
o G
rade
10
Chi
le†
38
100.
0 (0
.0)
38
27.9
(6
.4)
38
45.9
(1
0.2)
38
7.
1 (4
.8)
max
imum
) N
orw
ay (A
LU)†c
16
10
0.0
(0.0
) 15
60
.0
(7.8
) 15
60
.0
(7.8
) 15
0.
0 (0
.0)
N
orw
ay (A
LU+)
†c
16
100.
0 (0
.0)
16
62.5
(8
.8)
15
66.7
(1
0.4)
16
0.
0 (0
.0)
Ph
ilipp
ines
e 47
98
.6
(1.5
) 47
64
.5
(6.1
) 47
45
.9
(6.2
) 46
56
.6
(7.2
)
Po
land
†f
21
100.
0 (0
.0)
21
9.5
(0.5
) 21
66
.7
(12.
2)
21
4.8
(4.8
)
Si
ngap
ore
2 10
0.0
(0.0
) 2
0.0
(0.0
) 2
0.0
(0.0
) 2
0.0
(0.0
)
Sw
itzer
land
i 7
100.
0 (0
.0)
7 85
.7
(14.
3)
7 85
.7
(14.
3)
7 0.
0 (0
.0)
U
nite
d St
ates
†j
15
100.
0 (0
.0)
15
26.3
(1
6.9)
15
0.
0 (0
.0)
15
61.6
(1
7.3)
Low
e an
d U
pper
bo
tsw
ana
1 10
0.0
(0.0
) 1
100.
0 (0
.0)
1 0.
0 (0
.0)
1 0.
0 (0
.0)
Seco
ndar
y C
hine
se T
aipe
ia 8
100.
0 (0
.0)
8 81
.0
(0.0
) 8
85.7
(4
.8)
8 59
.5
(36.
0)(t
o G
rade
11
Geo
rgia
7
100.
0 (0
.0)
7 28
.6
(17.
5)
7 42
.9
(17.
5)
7 28
.6
(10.
1)an
d ab
ove)
M
alay
sia
8 10
0.0
(0.0
) 8
87.5
(1
2.5)
8
0.0
(0.0
) 8
0.0
(0.0
)
N
orw
ay (P
PU &
Mas
ter’
s)c
11
100.
0 (0
.0)
11
91.0
(9
.0)
11
72.8
(1
4.3)
11
0.
0 (0
.0)
O
man
d 8
100.
0 (0
.0)
8 37
.5
(12.
5)
8 0.
0 (0
.0)
8 0.
0 (0
.0)
Po
land
f 17
10
0.0
(0.0
) 17
5.
9 (5
.9)
16
37.5
(1
1.3)
17
17
.6
(10.
9)
Ru
ssia
n fe
dera
tiong
43
97.2
(2
.8)
43
14.0
(6
.0)
43
71.8
(8
.6)
42
70.4
(9
.2)
Si
ngap
ore
2 10
0.0
(0.0
) 2
0.0
(0.0
) 2
0.0
(0.0
) 2
0.0
(0.0
)
Th
aila
nd†
48
100.
0 (0
.0)
46
67.3
(7
.9)
46
23.9
(5
.8)
47
12.8
(3
.1)
U
nite
d St
ates
j 46
10
0.0
(0.0
) 46
32
.3
(7.1
) 46
14
.1
(7.4
) 46
81
.5
(9.7
)
Not
es:
1. †
Som
e or
all
futu
re t
each
ers
in t
his
cou
ntr
y ar
e be
ing
prep
ared
to
teac
h p
rim
ary
and
low
er-s
econ
dary
stu
den
ts. T
he
prog
ram
-gro
ups
pre
pari
ng
futu
re p
rim
ary
teac
her
s an
d t
he
prog
ram
-gr
oups
pre
pari
ng
low
er-s
econ
dary
tea
cher
s ar
e th
eref
ore
part
ly o
r fu
lly o
verl
appi
ng
(see
TE
DS-
M t
ech
nic
al r
epor
t).
2. W
hen
rea
din
g th
is e
xhib
it, k
eep
in m
ind
the
limit
atio
ns
ann
otat
ed in
Ch
apte
r 4
and
den
oted
in t
he
tabl
e ab
ove
by fo
otn
ote
lett
ers.
3. T
he
shad
ed a
reas
iden
tify
dat
a th
at, f
or r
easo
ns
expl
ain
ed in
th
ese
limit
atio
ns,
can
not
be
com
pare
d w
ith
con
fide
nce
to
data
from
oth
er c
oun
trie
s.
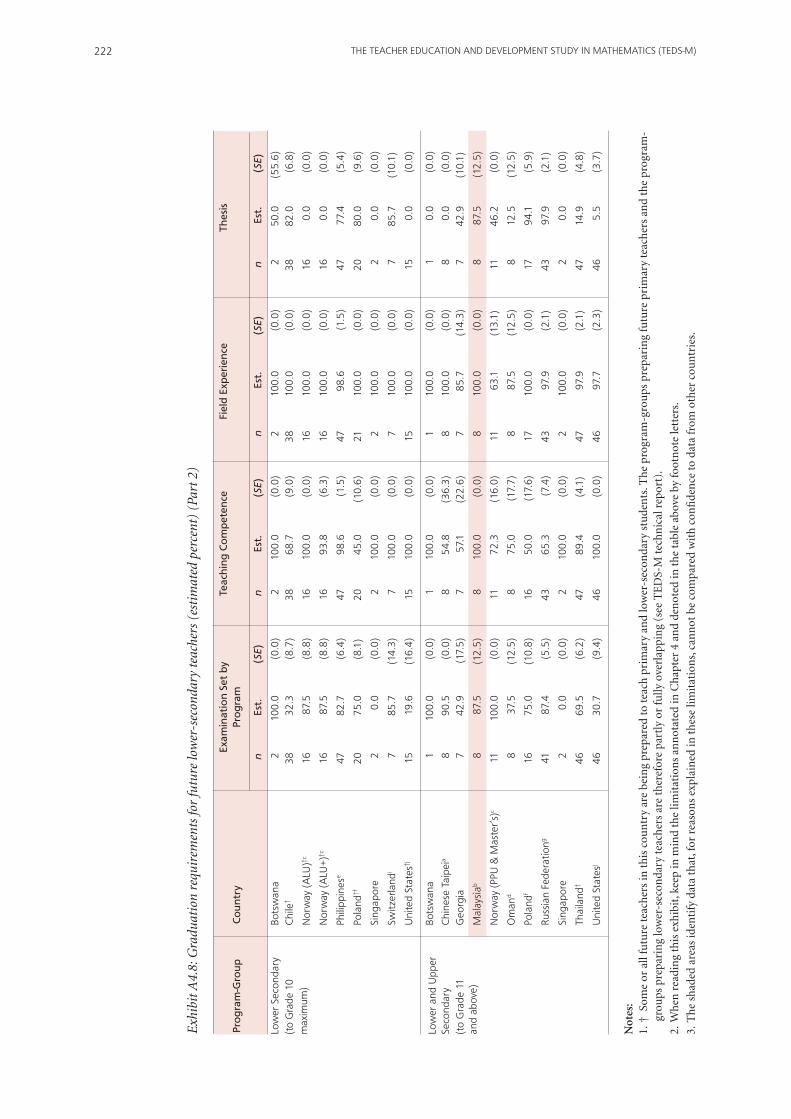
THE TEACHER EDUCATION AND DEVELOPMENT STUDY IN MATHEMATICS (TEDS-M)222
Exh
ibit
A4.
8: G
radu
atio
n re
quir
emen
ts fo
r fu
ture
low
er-s
econ
dary
teac
hers
(es
tim
ated
per
cent
) (P
art 2
)
Exam
inat
ion
Set
by
Teac
hin
g C
om
pet
ence
Fi
eld
Exp
erie
nce
Th
esis
Pro
gra
m-G
roup
C
oun
try
Pro
gra
m
n
Est.
(S
E)
n
Est.
(S
E)
n
Est.
(S
E)
n
Est.
(S
E)
Low
er S
econ
dary
bo
tsw
ana
2 10
0.0
(0.0
) 2
100.
0 (0
.0)
2 10
0.0
(0.0
) 2
50.0
(5
5.6)
(to
Gra
de 1
0 C
hile
† 38
32
.3
(8.7
) 38
68
.7
(9.0
) 38
10
0.0
(0.0
) 38
82
.0
(6.8
)m
axim
um)
Nor
way
(ALU
)†c
16
87.5
(8
.8)
16
100.
0 (0
.0)
16
100.
0 (0
.0)
16
0.0
(0.0
)
N
orw
ay (A
LU+)
†c
16
87.5
(8
.8)
16
93.8
(6
.3)
16
100.
0 (0
.0)
16
0.0
(0.0
)
Ph
ilipp
ines
e 47
82
.7
(6.4
) 47
98
.6
(1.5
) 47
98
.6
(1.5
) 47
77
.4
(5.4
)
Po
land
†f
20
75.0
(8
.1)
20
45.0
(1
0.6)
21
10
0.0
(0.0
) 20
80
.0
(9.6
)
Si
ngap
ore
2 0.
0 (0
.0)
2 10
0.0
(0.0
) 2
100.
0 (0
.0)
2 0.
0 (0
.0)
Sw
itzer
land
i 7
85.7
(1
4.3)
7
100.
0 (0
.0)
7 10
0.0
(0.0
) 7
85.7
(1
0.1)
U
nite
d St
ates
†j
15
19.6
(1
6.4)
15
10
0.0
(0.0
) 15
10
0.0
(0.0
) 15
0.
0 (0
.0)
Low
er a
nd U
pper
bo
tsw
ana
1 10
0.0
(0.0
) 1
100.
0 (0
.0)
1 10
0.0
(0.0
) 1
0.0
(0.0
)
Seco
ndar
y C
hine
se T
aipe
ia 8
90.5
(0
.0)
8 54
.8
(36.
3)
8 10
0.0
(0.0
) 8
0.0
(0.0
)(t
o G
rade
11
Geo
rgia
7
42.9
(1
7.5)
7
57.1
(2
2.6)
7
85.7
(1
4.3)
7
42.9
(1
0.1)
and
abov
e)
Mal
aysi
ab 8
87.5
(1
2.5)
8
100.
0 (0
.0)
8 10
0.0
(0.0
) 8
87.5
(1
2.5)
N
orw
ay (P
PU &
Mas
ter’
s)c
11
100.
0 (0
.0)
11
72.3
(1
6.0)
11
63
.1
(13.
1)
11
46.2
(0
.0)
O
man
d 8
37.5
(1
2.5)
8
75.0
(1
7.7)
8
87.5
(1
2.5)
8
12.5
(1
2.5)
Po
land
f 16
75
.0
(10.
8)
16
50.0
(1
7.6)
17
10
0.0
(0.0
) 17
94
.1
(5.9
)
Ru
ssia
n fe
dera
tiong
41
87.4
(5
.5)
43
65.3
(7
.4)
43
97.9
(2
.1)
43
97.9
(2
.1)
Si
ngap
ore
2 0.
0 (0
.0)
2 10
0.0
(0.0
) 2
100.
0 (0
.0)
2 0.
0 (0
.0)
Th
aila
nd†
46
69.5
(6
.2)
47
89.4
(4
.1)
47
97.9
(2
.1)
47
14.9
(4
.8)
U
nite
d St
ates
j 46
30
.7
(9.4
) 46
10
0.0
(0.0
) 46
97
.7
(2.3
) 46
5.
5 (3
.7)
Not
es:
1. †
Som
e or
all
futu
re t
each
ers
in t
his
cou
ntr
y ar
e be
ing
prep
ared
to
teac
h p
rim
ary
and
low
er-s
econ
dary
stu
den
ts. T
he
prog
ram
-gro
ups
pre
pari
ng
futu
re p
rim
ary
teac
her
s an
d t
he
prog
ram
-gr
oups
pre
pari
ng
low
er-s
econ
dary
tea
cher
s ar
e th
eref
ore
part
ly o
r fu
lly o
verl
appi
ng
(see
TE
DS-
M t
ech
nic
al r
epor
t).
2. W
hen
rea
din
g th
is e
xhib
it, k
eep
in m
ind
the
limit
atio
ns
ann
otat
ed in
Ch
apte
r 4
and
den
oted
in t
he
tabl
e ab
ove
by fo
otn
ote
lett
ers.
3. T
he
shad
ed a
reas
iden
tify
dat
a th
at, f
or r
easo
ns
expl
ain
ed in
th
ese
limit
atio
ns,
can
not
be
com
pare
d w
ith
con
fide
nce
to
data
from
oth
er c
oun
trie
s.

223APPENDICES
Exh
ibit
A4.
9: L
ocus
of c
ontr
ol o
f per
form
ance
sta
ndar
ds in
teac
her
educ
atio
n (e
stim
ated
per
cent
)
Nat
ion
al G
over
nm
ent
Stat
e G
over
nm
ent
Inst
itut
ion
or
Pro
gra
m
Ava
ilab
ility
of
a St
and
ard
Pro
gra
m-G
roup
C
oun
try
D
ocu
men
t
n
Est.
(S
E)
n
Est.
(S
E)
n
Est.
(S
E)
n
Est.
(S
E)
Low
er P
rimar
y G
eorg
ia
3 66
.7
(28.
4)
3 33
.3
(28.
4)
3 10
0.0
(0.0
) 3
66.7
(2
8.4)
(to
Gra
de 4
Po
land
f 69
79
.7
(5.3
) 69
5.
8 (2
.1)
69
79.7
(5
.8)
0 0.
0 (0
.0)
Max
imum
) Ru
ssia
n fe
dera
tiong
44
94.6
(4
.0)
44
0.0
(0.0
) 44
31
.4
(7.4
) 44
0.
0 (0
.0)
Sw
itzer
land
i 7
0.0
(0.0
) 7
14.3
(1
4.3)
7
100.
0 (0
.0)
6 0.
0 (0
.0)
Prim
ary
Chi
nese
Tai
peia
4 15
.4
(21.
8)
4 0.
0 (0
.0)
4 84
.6
(21.
8)
3 0.
0 (0
.0)
(to
Gra
de 6
Ph
ilipp
ines
e 24
61
.8
(13.
1)
24
27.2
(1
1.5)
24
65
.7
(14.
5)
22
0.9
(0.7
)M
axim
um)
Sing
apor
e 0
0.0
(0.0
) 0
0.0
(0.0
) 0
0.0
(0.0
) 0
0.0
(0.0
)
Sp
ainh
13
51.3
(1
4.1)
14
53
.3
(13.
2)
14
46.9
(1
3.3)
14
13
.5
(12.
3)
Sw
itzer
land
i 13
0.
0 (0
.0)
13
15.4
(1
1.4)
13
10
0.0
(0.0
) 13
0.
0 (0
.0)
U
nite
d St
ates
j 53
23
.0
(8.9
) 53
91
.5
(5.5
) 53
90
.0
(3.9
) 45
1.
5 (0
.2)
Prim
ary
and
bots
wan
a 3
100.
0 (0
.0)
3 0.
0 (0
.0)
3 66
.7
(42.
2)
3 33
.3
(26.
7)
Seco
ndar
y G
ener
alist
s C
hile
† 28
42
.9
(7.9
) 29
20
.7
(8.5
) 29
79
.3
(7.0
) 25
16
.0
(7.9
)(t
o G
rade
10
Nor
way
(ALU
)†c
16
87.5
(8
.8)
16
12.5
(8
.8)
15
87.5
(8
.8)
0 0.
0 (0
.0)
Max
imum
) N
orw
ay (A
LU+)
†c
15
86.7
(9
.5)
15
13.3
(9
.5)
16
86.7
(8
.8)
0 0.
0 (0
.0)
Prim
ary
Mal
aysi
ab 5
100.
0 (0
.0)
5 20
.0
(17.
4)
5 20
.0
(17.
4)
5 0.
0 (0
.0)
Mat
hem
atic
s Po
land
†f
30
90.0
(5
.8)
30
3.3
(3.5
) 30
46
.7
(9.3
) 0
0.0
(0.0
)Sp
ecia
lists
Si
ngap
ore
0 0.
0 (0
.0)
0 0.
0 (0
.0)
0 0.
0 (0
.0)
0 0.
0 (0
.0)
Th
aila
nd†
27
44.5
(9
.0)
27
18.6
(6
.8)
27
70.3
(8
.7)
27
0.0
(0.0
)
U
nite
d St
ates
†j
13
12.6
(1
7.3)
13
90
.9
(6.8
) 13
10
0.0
(0.0
) 13
3.
4 (3
.9)
Low
er S
econ
dary
bo
tsw
ana
2 0.
0 (0
.0)
2 0.
0 (0
.0)
2 10
0.0
(0.0
) 2
0.0
(0.0
)(t
o G
rade
10
Chi
le†
34
40.5
(6
.8)
35
27.9
(1
0.1)
35
76
.2
(5.4
) 30
17
.0
(7.7
)M
axim
um)
Nor
way
(ALU
)†c
16
87.5
(8
.8)
16
12.5
(8
.8)
16
87.5
(8
.8)
0 0.
0 (0
.0)
N
orw
ay (A
LU+)
†c
15
86.7
(9
.5)
15
13.3
(9
.5)
15
86.7
(8
.8)
0 0.
0 (0
.0)
Ph
ilipp
ines
e 36
65
.0
(10.
0)
36
41.3
(1
5.6)
36
57
.3
(9.9
) 33
0.
5 (0
.4)
Po
land
†f
17
94.1
(5
.9)
17
0.0
(0.0
) 17
47
.1
(12.
2)
0 0.
0 (0
.0)
Si
ngap
ore
0 0.
0 (0
.0)
0 0.
0 (0
.0)
0 0.
0 (0
.0)
0 0.
0 (0
.0)
Sw
itzer
land
i 6
0.0
(0.0
) 6
0.0
(0.0
) 6
100.
0 (0
.0)
5 20
.0
(21.
4)
U
nite
d St
ates
†j
13
12.6
(1
7.3)
13
90
.9
(6.8
) 13
10
0.0
(0.0
) 13
3.
4 (3
.9)

THE TEACHER EDUCATION AND DEVELOPMENT STUDY IN MATHEMATICS (TEDS-M)224
Exh
ibit
A4.
9: L
ocus
of c
ontr
ol o
f per
form
ance
sta
ndar
ds in
teac
her
educ
atio
n (e
stim
ated
per
cent
) (c
ontd
.)
Nat
ion
al G
over
nm
ent
Stat
e G
over
nm
ent
Inst
itut
ion
or
Pro
gra
m
Ava
ilab
ility
of
a St
and
ard
Pro
gra
m-G
roup
C
oun
try
D
ocu
men
t
n
Est.
(S
E)
n
Est.
(S
E)
n
Est.
(S
E)
n
Est.
(S
E)
Low
er a
nd U
pper
bo
tsw
ana
0 0.
0 (0
.0)
0 0.
0 (0
.0)
0 0.
0 (0
.0)
0 0.
0 (0
.0)
Seco
ndar
y C
hine
se T
aipe
ia 2
88.2
(1
8.4)
2
0.0
(0.0
) 2
100.
0 (0
.0)
2 0.
0 (0
.0)
(to
Gra
de 1
1 G
eorg
ia
4 50
.0
(26.
2)
4 0.
0 (0
.0)
4 10
0.0
(0.0
) 4
0.0
(0.0
)an
d ab
ove)
M
alay
siab
7 10
0.0
(0.0
) 7
0.0
(0.0
) 7
14.3
(1
4.5)
7
0.0
(0.0
)
N
orw
ay (P
PU &
Mas
ter’
s)c
9 66
.4
(15.
9)
9 0.
0 (0
.0)
9 78
.0
(16.
4)
0 0.
0 (0
.0)
O
man
d 7
57.1
(1
4.5)
7
0.0
(0.0
) 7
57.1
(1
4.5)
7
14.3
(1
3.5)
Po
land
f 13
84
.6
(11.
2)
13
7.7
(8.5
) 13
46
.2
(13.
6)
0 0.
0 (0
.0)
Ru
ssia
n fe
dera
tiong
42
95.6
(3
.1)
42
14.2
(7
.1)
42
47.4
(9
.4)
42
1.3
(1.3
)
Si
ngap
ore
0 0.
0 (0
.0)
0 0.
0 (0
.0)
0 0.
0 (0
.0)
0 0.
0 (0
.0)
Th
aila
nd†
27
44.5
(9
.0)
27
18.6
(6
.8)
27
70.3
(8
.7)
27
0.0
(0.0
)
U
nite
d St
ates
j 39
13
.1
(6.2
) 39
87
.0
(7.7
) 39
73
.1
(7.9
) 35
1.
1 (1
.2)
Not
es:
1. †
Som
e or
all
futu
re t
each
ers
in t
his
cou
ntr
y ar
e be
ing
prep
ared
to
teac
h p
rim
ary
and
low
er-s
econ
dary
stu
den
ts. T
he
prog
ram
-gro
ups
pre
pari
ng
futu
re p
rim
ary
teac
her
s an
d t
he
prog
ram
-gr
oups
pre
pari
ng
low
er-s
econ
dary
tea
cher
s ar
e th
eref
ore
part
ly o
r fu
lly o
verl
appi
ng
(see
TE
DS-
M t
ech
nic
al r
epor
t).
2. W
hen
rea
din
g th
is e
xhib
it, k
eep
in m
ind
the
limit
atio
ns
ann
otat
ed in
Ch
apte
r 4
and
den
oted
in t
he
tabl
e ab
ove
by fo
otn
ote
lett
ers.
3. T
he
shad
ed a
reas
iden
tify
dat
a th
at, f
or r
easo
ns
expl
ain
ed in
th
ese
limit
atio
ns,
can
not
be
com
pare
d w
ith
con
fide
nce
to
data
from
oth
er c
oun
trie
s.

225APPENDICES
Exh
ibit
A4.
10: T
each
er e
duca
tors
’ qua
lifica
tion
s in
mat
hem
atic
s, b
y di
scip
lines
taug
ht (
esti
mat
ed p
erce
nt)
M
aste
r’s-
Leve
l Qua
lifica
tio
ns
in M
athe
mat
ics
Do
cto
ral-L
evel
Qua
lifica
tio
ns
in M
athe
mat
ics
Co
untr
y
A.
B.
Teac
her
Educ
ato
rs
A.
B.
Teac
her
Educ
ato
rs
M
athe
mat
ics
and
G
ener
al P
edag
og
y o
f Bo
th A
reas
M
athe
mat
ics
and
G
ener
al P
edag
og
y o
f Bo
th A
reas
Mat
hem
atic
s Pe
dag
og
y
Teac
her
Educ
ato
rs
A. a
nd
B.
Mat
hem
atic
s Pe
dag
og
y Te
ache
r Ed
ucat
ors
A
. an
d B
.
Teac
her
Educ
ato
rs
Teac
her
Educ
ato
rs
n
Est.
(S
E)
n
Est.
(S
E)
n
Est.
(S
E)
n
Est.
(S
E)
n
Est.
(S
E)
n
Est.
(S
E)
bots
wan
a
12
58.3
(1
2.4)
7
0.0
(0.0
) 0
0.0
(0.0
) 12
16
.7
(11.
1)
7 0.
0 (0
.0)
0 0.
0 (0
.0)
Chi
lea
65
8.
9 (4
.2)
64
3.2
(2.8
) 26
11
.9
(6.8
) 65
4.
7 (2
.8)
64
3.9
(2.8
) 26
5.
2 (5
.3)
Chi
nese
Tai
pei
74
11
.0
(3.2
) 58
1.
4 (1
.4)
1 0.
0 (0
.0)
74
64.9
(9
.7)
58
0.0
(0.0
) 1
0.0
(0.0
)
Geo
rgia
36
16.2
(5
.7)
8 12
.5
(11.
2)
0 0.
0 (0
.0)
36
62.2
(6
.0)
8 12
.5
(13.
1)
0 0.
0 (0
.0)
Ger
man
yb
110
0.0
(0.0
) 13
5 25
.3
(7.9
) 13
1 68
.0
(9.9
) 11
0 88
.0
(3.1
) 13
5 0.
0 (0
.0)
131
10.3
(3
.3)
Mal
aysi
ac
119
14.5
(3
.0)
6 0.
0 (0
.0)
40
6.8
(4.0
) 11
9 0.
8 (1
.1)
6 18
.8
(15.
7)
40
30.6
(5
.8)
Om
and
45
1.
8 (1
.8)
9 0.
0 (0
.0)
2 10
0.0
(0.0
) 45
82
.6
(3.7
) 9
0.0
(0.0
) 2
0.0
(0.0
)
Phili
ppin
es
16
7 43
.0
(5.6
) 16
5 6.
4 (3
.1)
81
25.7
(8
.3)
167
7.1
(4.0
) 16
5 1.
3 (1
.3)
81
1.2
(0.8
)
Pola
nde
44
0 23
.0
(1.8
) 13
5 4.
5 (1
.7)
18
48.5
(1
4.5)
44
0 71
.6
(1.7
) 13
5 1.
2 (0
.9)
18
24.2
(1
0.7)
Russ
ian
fede
ratio
nf
814
55.3
(2
.6)
150
43.2
(6
.3)
12
43.8
(1
1.9)
81
4 35
.5
(2.6
) 15
0 0.
0 (0
.0)
12
3.0
(3.1
)
Sing
apor
e
21
4.8
(3.4
) 32
0.
0 (0
.0)
0 0.
0 (0
.0)
21
42.9
(7
.6)
32
0.0
(0.0
) 0
0.0
(0.0
)
Spai
ng
111
69.1
(5
.4)
249
2.4
(0.7
) 9
16.9
(2
1.6)
11
1 17
.5
(4.3
) 24
9 0.
0 (0
.0)
9 0.
0 (0
.0)
Switz
erla
ndh
46
33
.1
(7.0
) 11
8 0.
0 (0
.0)
1 0.
0 (0
.0)
46
8.7
(4.1
) 11
8 0.
0 (0
.0)
1 10
0.0
(0.0
)
Thai
land
82
52.1
(5
.8)
51
3.8
(2.4
) 40
28
.4
(6.0
) 82
11
.8
(2.7
) 51
0.
0 (0
.0)
40
4.6
(2.9
)
Not
es:
1. W
hen
rea
din
g th
is e
xhib
it, k
eep
in m
ind
the
limit
atio
ns
ann
otat
ed in
Ch
apte
r 4
and
den
oted
in t
he
tabl
e ab
ove
by fo
otn
ote
lett
ers.
2. T
he
shad
ed a
reas
iden
tify
dat
a th
at, f
or r
easo
ns
expl
ain
ed in
th
ese
limit
atio
ns,
can
not
be
com
pare
d w
ith
con
fide
nce
to
data
from
oth
er c
oun
trie
s.

THE TEACHER EDUCATION AND DEVELOPMENT STUDY IN MATHEMATICS (TEDS-M)226
Exh
ibit
A4.
11: T
each
er e
duca
tors
’ qua
lifica
tion
s in
mat
hem
atic
s ed
ucat
ion,
by
disc
iplin
es ta
ught
(es
tim
ated
per
cent
)
Mas
ter’
s-Le
vel Q
ualifi
cati
on
s in
Mat
hem
atic
s Ed
ucat
ion
Do
cto
ral-L
evel
Qua
lifica
tio
ns
in E
duc
atio
n
Co
untr
y
A.
B.
Teac
her
Educ
ato
rs
A.
B.
Teac
her
Educ
ato
rs
M
athe
mat
ics
and
G
ener
al P
edag
og
y o
f Bo
th A
reas
M
athe
mat
ics
and
G
ener
al P
edag
og
y o
f Bo
th A
reas
Mat
hem
atic
s Pe
dag
og
y
Teac
her
Educ
ato
rs
A. A
nd
B.
Mat
hem
atic
s Pe
dag
og
y Te
ache
r Ed
ucat
ors
A
. an
d B
.
Teac
her
Educ
ato
rs
Teac
her
Educ
ato
rs
n
Est.
(S
E)
n
Est.
(S
E)
n
Est.
(S
E)
n
Est.
(S
E)
n
Est.
(S
E)
n
Est.
(S
E)
bots
wan
a
9 88
.9
(10.
8)
7 0.
0 (0
.0)
0 0.
0 (0
.0)
9 11
.1
(10.
8)
7 0.
0 (0
.0)
0 0.
0 (0
.0)
Chi
lea
49
27
.5
(7.2
) 58
4.
4 (3
.3)
19
6.3
(6.1
) 49
2.
8 (2
.8)
58
0.0
(0.0
) 19
6.
5 (6
.8)
Chi
nese
Tai
pei
60
11
.9
(4.2
) 58
3.
0 (2
.7)
2 50
.0
(55.
6)
60
23.9
(1
1.0)
58
1.
4 (1
.4)
2 0.
0 (0
.0)
Geo
rgia
28
25.6
(4
.4)
5 0.
0 (0
.0)
0 0.
0 (0
.0)
28
41.9
(6
.1)
5 0.
0 (0
.0)
0 0.
0 (0
.0)
Ger
man
yb
75
2.6
(2.6
) 13
2 28
.2
(5.2
) 11
3 43
.9
(7.9
) 75
0.
0 (0
.0)
132
0.2
(0.3
) 11
3 16
.6
(5.4
)
Mal
aysi
ac
105
33.7
(4
.3)
5 7.
3 (7
.6)
23
7.0
(4.6
) 10
5 7.
9 (2
.2)
5 23
.2
(19.
5)
23
9.8
(7.5
)
Om
and
28
4.
2 (4
.1)
7 0.
0 (0
.0)
2 0.
0 (0
.0)
28
16.6
(3
.9)
7 14
.1
(12.
9)
2 0.
0 (0
.0)
Phili
ppin
es
15
8 58
.5
(5.5
) 16
3 12
.0
(4.0
) 78
25
.9
(6.8
) 15
8 5.
9 (2
.8)
163
1.1
(0.7
) 78
5.
2 (2
.1)
Pola
nde
31
5 21
.4
(2.1
) 12
8 3.
4 (2
.3)
14
32.0
(1
5.3)
31
5 10
.3
(1.6
) 12
8 0.
6 (0
.9)
14
8.0
(6.4
)
Russ
ian
fede
ratio
nf
724
47.5
(4
.3)
148
37.8
(6
.5)
13
39.4
(1
1.7)
72
4 24
.9
(2.8
) 14
8 6.
3 (2
.8)
13
22.6
(1
3.9)
Sing
apor
e
21
57.1
(9
.3)
28
10.7
(6
.0)
0 0.
0 (0
.0)
21
28.6
(9
.0)
28
0.0
(0.0
) 0
0.0
(0.0
)
Spai
ng
90
10.6
(2
.9)
245
3.7
(1.5
) 8
0.0
(0.0
) 90
31
.0
(5.3
) 24
5 0.
0 (0
.0)
8 0.
0 (0
.0)
Switz
erla
ndh
43
17
.5
(6.3
) 11
6 0.
7 (0
.7)
1 0.
0 (0
.0)
43
7.3
(4.2
) 11
6 0.
0 (0
.0)
1 0.
0 (0
.0)
Thai
land
81
34.4
(4
.9)
42
4.6
(2.8
) 46
39
.6
(8.5
) 81
14
.5
(4.2
) 42
0.
0 (0
.0)
46
21.3
(6
.9)
Not
es:
1. W
hen
rea
din
g th
is e
xhib
it, k
eep
in m
ind
the
limit
atio
ns
ann
otat
ed in
Ch
apte
r 4
and
den
oted
in t
he
tabl
e ab
ove
by fo
otn
ote
lett
ers.
2. T
he
shad
ed a
reas
iden
tify
dat
a th
at, f
or r
easo
ns
expl
ain
ed in
th
ese
limit
atio
ns,
can
not
be
com
pare
d w
ith
con
fide
nce
to
data
from
oth
er c
oun
trie
s.

227APPENDICES
Exh
ibit
A4.
12: T
each
er e
duca
tors
’ qua
lifica
tion
s in
edu
cati
on, b
y di
scip
lines
taug
ht (
esti
mat
ed p
erce
nt fe
mal
e)
Mas
ter’
s-Le
vel Q
ualifi
cati
on
s in
Mat
hem
atic
s Ed
ucat
ion
D
oct
ora
l-Lev
el Q
ualifi
cati
on
s in
Mat
hem
atic
s Ed
ucat
ion
Co
untr
y
A.
B.
Teac
her
Educ
ato
rs
A.
B.
Teac
her
Educ
ato
rs
M
athe
mat
ics
and
G
ener
al P
edag
og
y o
f Bo
th A
reas
M
athe
mat
ics
and
G
ener
al P
edag
og
y o
f Bo
th A
reas
Mat
hem
atic
s Pe
dag
og
y
Teac
her
Educ
ato
rs
A. a
nd
B.
Mat
hem
atic
s Pe
dag
og
y Te
ache
r Ed
ucat
ors
A
. an
d B
.
Teac
her
Educ
ato
rs
Teac
her
Educ
ato
rs
n
Est.
(S
E)
n
Est.
(S
E)
n
Est.
(S
E)
n
Est.
(S
E)
n
Est.
(S
E)
n
Est.
(S
E)
bots
wan
a
6 50
.0
(26.
2)
19
89.7
(7
.5)
0 0.
0 (0
.0)
6 16
.7
(16.
3)
19
5.1
(5.2
) 0
0.0
(0.0
)
Chi
lea
62
50
.7
(5.9
) 20
1 50
.4
(3.8
) 47
48
.6
(6.6
) 62
5.
2 (2
.9)
201
16.5
(2
.2)
47
23.7
(5
.6)
Chi
nese
Tai
pei
51
1.
3 (0
.9)
94
27.6
(3
.5)
1 0.
0 (0
.0)
51
6.3
(2.9
) 94
63
.3
(3.1
) 1
100.
0 (0
.0)
Geo
rgia
20
9.7
(1.5
) 20
15
.0
(8.7
) 1
0.0
(0.0
) 20
14
.5
(7.3
) 20
70
.0
(11.
7)
1 10
0.0
(0.0
)
Ger
man
yb
76
1.3
(1.3
) 19
3 49
.6
(9.9
) 10
7 46
.9
(8.0
) 76
0.
0 (0
.0)
193
25.0
(5
.1)
107
10.2
(6
.4)
Mal
aysi
ac
102
46.5
(5
.2)
13
38.4
(1
3.9)
48
50
.2
(6.7
) 10
2 5.
4 (2
.5)
13
48.7
(1
4.2)
48
8.
7 (4
.8)
Om
and
29
5.
3 (3
.2)
15
12.8
(8
.4)
2 0.
0 (0
.0)
29
9.4
(5.3
) 15
74
.8
(11.
5)
2 0.
0 (0
.0)
Phili
ppin
es
14
2 31
.9
(4.4
) 25
3 33
.2
(3.3
) 96
48
.5
(7.6
) 14
2 18
.9
(3.7
) 25
3 37
.7
(6.2
) 96
23
.2
(6.2
)
Pola
nde
30
8 9.
4 (1
.6)
239
35.4
(3
.0)
20
21.1
(1
1.3)
30
8 6.
6 (1
.1)
239
60.9
(3
.4)
20
47.4
(1
0.0)
Russ
ian
fede
ratio
nf
662
48.6
(3
.8)
250
16.1
(3
.5)
13
7.8
(6.1
) 66
2 16
.9
(1.9
) 25
0 78
.4
(4.2
) 13
81
.0
(18.
5)
Sing
apor
e
16
31.3
(9
.8)
45
33.3
(6
.4)
0 0.
0 (0
.0)
16
6.3
(6.1
) 45
44
.4
(7.5
) 0
0.0
(0.0
)
Spai
ng
71
7.7
(3.0
) 31
0 30
.8
(2.3
) 10
39
.2
(7.9
) 71
1.
0 (0
.7)
310
35.2
(2
.4)
10
11.4
(5
.2)
Switz
erla
ndh
39
9.
5 (5
.2)
149
52.7
(4
.7)
1 0.
0 (0
.0)
39
7.2
(4.2
) 14
9 28
.0
(3.6
) 1
0.0
(0.0
)
Thai
land
56
24.0
(4
.8)
91
67.9
(5
.3)
37
55.0
(6
.7)
56
3.4
(2.7
) 91
24
.6
(5.0
) 37
18
.7
(8.6
)
Not
es:
1. W
hen
rea
din
g th
is e
xhib
it, k
eep
in m
ind
the
limit
atio
ns
ann
otat
ed in
Ch
apte
r 4
and
den
oted
in t
he
tabl
e ab
ove
by fo
otn
ote
lett
ers.
2. T
he
shad
ed a
reas
iden
tify
dat
a th
at, f
or r
easo
ns
expl
ain
ed in
th
ese
limit
atio
ns,
can
not
be
com
pare
d w
ith
con
fide
nce
to
data
from
oth
er c
oun
trie
s.

THE TEACHER EDUCATION AND DEVELOPMENT STUDY IN MATHEMATICS (TEDS-M)228
Exh
ibit
A4.
13: F
utur
e pr
imar
y te
ache
rs’ l
evel
of a
chie
vem
ent d
urin
g se
cond
ary
scho
ol (
esti
mat
ed p
erce
nt)
Perc
ent
of
Futu
re P
rim
ary
Teac
hers
in R
esp
on
se C
ateg
ori
es (
wei
ghte
d e
stim
ates
)
P
rog
ram
-Gro
up
Co
untr
y
Alw
ays
at t
he T
op
U
sual
ly N
ear
the
Top
G
ener
ally
Ab
ove
Ave
rag
e G
ener
ally
Ab
out
Ave
rage
G
ener
ally
Bel
ow A
vera
ge
o
f M
y Ye
ar L
evel
o
f M
y Ye
ar L
evel
fo
r M
y Ye
ar L
evel
fo
r M
y Ye
ar L
evel
fo
r M
y Ye
ar L
evel
n
Est.
(S
E)
Est.
(S
E)
Est.
(S
E)
Est.
(S
E)
Est.
(S
E)
Low
er P
rimar
y G
eorg
ia
461
9.0
(1.7
) 41
.5
(2.5
) 31
.8
(1.9
) 17
.4
(1.8
) 0.
2 (0
.2)
(to
Gra
de 4
G
erm
any
929
0.1
(0.1
) 12
.8
(1.5
) 31
.7
(2.2
) 45
.0
(2.3
) 10
.3
(1.1
)M
axim
um)
Pola
ndd
1,80
6 1.
9 (0
.3)
13.8
(0
.9)
35.9
(1
.0)
47.2
(1
.3)
1.2
(0.3
)
Ru
ssia
n fe
dera
tione
2,25
8 9.
7 (1
.3)
35.4
(1
.8)
35.0
(1
.9)
19.7
(1
.6)
0.3
(0.1
)
Sw
itzer
land
f 11
9 1.
0 (1
.0)
20.3
(2
.9)
37.1
(5
.9)
33.6
(4
.7)
7.9
(2.9
)
Prim
ary
Chi
nese
Tai
pei
923
15.4
(1
.5)
23.8
(1
.7)
33.8
(1
.8)
21.4
(2
.2)
5.6
(0.9
)(t
o G
rade
6
Phili
ppin
es
575
3.9
(0.7
) 14
.8
(2.5
) 37
.3
(2.9
) 43
.7
(4.2
) 0.
2 (0
.1)
Max
imum
) Si
ngap
ore
263
6.5
(1.8
) 19
.4
(2.8
) 44
.4
(3.2
) 27
.4
(3.2
) 2.
3 (0
.8)
Sp
ain
1,08
0 11
.6
(0.9
) 12
.8
(1.3
) 19
.6
(1.6
) 49
.5
(2.0
) 6.
5 (0
.7)
Sw
itzer
land
f 81
2 1.
6 (0
.4)
31.6
(1
.8)
30.6
(1
.5)
29.2
(1
.3)
7.0
(0.9
)
U
nite
d St
ates
g 1,
030
15.5
(1
.4)
36.7
(1
.9)
30.0
(1
.6)
16.3
(1
.3)
1.5
(0.5
)
Prim
ary
and
bo
tsw
anaa
64
0.0
(0.0
) 22
.9
(4.8
) 45
.8
(6.5
) 31
.3
(5.6
) 0.
0 (0
.0)
Seco
ndar
y G
ener
alist
s C
hile
†b
651
15.1
(1
.3)
25.8
(1
.5)
23.8
(1
.5)
31.8
(1
.4)
3.6
(0.7
)(t
o G
rade
10
Nor
way
(ALU
)†c
390
2.6
(0.9
) 32
.6
(2.6
) 37
.6
(1.9
) 24
.5
(2.2
) 2.
7 (1
.0)
Max
imum
) N
orw
ay (A
LU+)
†c
156
5.3
(1.8
) 25
.7
(4.3
) 44
.1
(5.2
) 24
.3
(3.3
) 0.
5 (0
.4)
Prim
ary
Ger
man
y† 94
0.
2 (0
.2)
21.6
(7
.7)
47.0
(5
.9)
29.6
(7
.2)
1.7
(1.5
)M
athe
mat
ics
Mal
aysi
a 57
0 21
.6
(1.6
) 36
.3
(2.1
) 28
.3
(1.9
) 11
.7
(1.2
) 2.
1 (0
.8)
Spec
ialis
ts
Pola
nd†d
30
0 6.
0 (1
.4)
41.8
(3
.6)
35.0
(4
.0)
15.5
(2
.3)
1.7
(0.9
)
Si
ngap
ore
117
7.4
(2.2
) 17
.7
(3.5
) 50
.0
(4.7
) 23
.1
(3.7
) 1.
7 (1
.7)
Th
aila
nd†
660
6.4
(1.0
) 37
.9
(1.4
) 38
.2
(1.7
) 17
.0
(1.3
) 0.
4 (0
.3)
U
nite
d St
ates
†g
151
16.8
(3
.2)
34.7
(4
.4)
31.9
(4
.5)
12.1
(2
.8)
4.4
(2.7
)
Not
es:
1. †
Som
e or
all
futu
re t
each
ers
in t
his
cou
ntr
y ar
e be
ing
prep
ared
to
teac
h p
rim
ary
and
low
er-s
econ
dary
stu
den
ts. T
he
prog
ram
-gro
ups
pre
pari
ng
futu
re p
rim
ary
teac
her
s an
d t
he
prog
ram
-gr
oups
pre
pari
ng
low
er-s
econ
dary
tea
cher
s ar
e th
eref
ore
par
tly
or fu
lly o
verl
appi
ng
(see
TE
DS-
M t
ech
nic
al r
epor
t).
2. W
hen
rea
din
g th
is e
xhib
it, k
eep
in m
ind
the
limit
atio
ns
ann
otat
ed in
Ch
apte
r 4
and
den
oted
in t
he
tabl
e ab
ove
by fo
otn
ote
lett
ers.
3. T
he
shad
ed a
reas
iden
tify
dat
a th
at, f
or r
easo
ns
expl
ain
ed in
th
ese
limit
atio
ns,
can
not
be
com
pare
d w
ith
con
fide
nce
to
data
from
oth
er c
oun
trie
s.

229APPENDICES
Exh
ibit
A4.
14: F
utur
e lo
wer
-sec
onda
ry te
ache
rs’ l
evel
of a
chie
vem
ent i
n se
cond
ary
scho
ol (
esti
mat
ed p
erce
nt)
Perc
enta
ge
of
Futu
re L
ow
er-S
eco
nd
ary
Teac
hers
in R
esp
on
se C
ateg
ori
es (
wei
ghte
d e
stim
ates
)
P
rog
ram
-Gro
up
Co
untr
y
Alw
ays
at t
he T
op
U
sual
ly N
ear
the
Top
G
ener
ally
Ab
ove
Ave
rag
e G
ener
ally
Ab
out
Ave
rage
G
ener
ally
Bel
ow A
vera
ge
of
My
Year
Lev
el
of
My
Year
Lev
el
for
My
Year
Lev
el
for
My
Year
Lev
el
for
My
Year
Lev
el
n
Est.
(S
E)
Est.
(S
E)
Est.
(S
E)
Est.
(S
E)
Est.
(S
E)
Low
er S
econ
dary
bo
tsw
anaa
30
6.6
(4.6
) 60
.0
(10.
1)
23.3
(7
.5)
10.0
(5
.7)
0.0
(0.0
)(t
o G
rade
10
Chi
le†b
74
0 16
.3
(1.4
) 25
.6
(1.5
) 24
.2
(1.6
) 31
.1
(1.9
) 2.
7 (0
.6)
Max
imum
) G
erm
any†
405
1.8
(0.7
) 29
.7
(4.7
) 32
.3
(4.8
) 31
.8
(3.8
) 4.
4 (1
.2)
N
orw
ay (A
LU)†d
35
4 4.
3 (1
.0)
32.3
(2
.2)
34.5
(2
.4)
25.6
(2
.5)
3.2
(0.9
)
N
orw
ay (A
LU+)
†d
146
7.0
(1.8
) 29
.9
(3.3
) 35
.2
(5.0
) 26
.6
(4.2
) 1.
4 (1
.2)
Ph
ilipp
ines
70
4 12
.9
(2.2
) 20
.1
(2.2
) 36
.6
(3.2
) 30
.3
(2.7
) 0.
0 (0
.0)
Po
land
†e
158
8.4
(2.0
) 36
.2
(4.0
) 37
.0
(3.4
) 18
.3
(3.3
) 0.
0 (0
.0)
Si
ngap
ore
141
9.8
(3.0
) 31
.8
(3.9
) 37
.0
(4.1
) 19
.4
(4.1
) 2.
1 (1
.2)
Sw
itzer
land
g 14
0 3.
4 (1
.4)
54.8
(4
.8)
24.4
(3
.0)
12.8
(2
.5)
4.6
(1.9
)
U
nite
d St
ates
†h
131
17.3
(4
.7)
39.5
(4
.3)
21.8
(5
.4)
21.3
(3
.9)
0.2
(0.2
)
Low
er a
nd U
pper
bo
tsw
ana†h
10
30
.0
(15.
9)
50.0
(1
9.6)
20
.0
(16.
0)
0.0
(0.0
) 0.
0 (0
.0)
Seco
ndar
y C
hine
se T
aipe
i 36
4 25
.8
(2.2
) 30
.4
(2.3
) 29
.4
(2.3
) 11
.0
(1.7
) 3.
4 (1
.0)
(to
Gra
de 1
1 G
eorg
iac
72
24.9
(5
.3)
52.3
(6
.2)
15.1
(3
.4)
7.7
(3.6
) 0.
0 (0
.0)
and
abov
e)
Ger
man
y 36
1 9.
2 (1
.9)
57.9
(3
.6)
23.8
(2
.8)
7.4
(1.7
) 1.
6 (1
.0)
M
alay
sia
388
26.6
(2
.1)
36.3
(2
.6)
25.8
(2
.4)
11.2
(1
.7)
0.0
(0.0
)
N
orw
ay (P
PU &
Mas
ter’
s)d
64
14.8
(3
.8)
47.6
(6
.8)
22.0
(5
.9)
12.4
(4
.3)
3.3
(2.3
)
O
man
25
8 67
.5
(2.8
) 26
.6
(2.5
) 5.
9 (1
.4)
0.0
(0.0
) 0.
0 (0
.0)
Po
land
e 13
9 11
.1
(5.0
) 38
.7
(5.7
) 37
.7
(6.6
) 12
.5
(3.5
) 0.
0 (0
.0)
Ru
ssia
n fe
dera
tionf
2,13
7 22
.4
(1.6
) 42
.7
(1.3
) 25
.2
(1.7
) 9.
5 (1
.4)
0.3
(0.2
)
Si
ngap
ore
250
20.0
(2
.2)
36.0
(2
.8)
34.4
(2
.6)
8.4
(2.2
) 1.
2 (0
.7)
Th
aila
nd†
650
5.2
(0.9
) 37
.1
(2.0
) 40
.5
(1.7
) 16
.5
(1.4
) 0.
8 (0
.4)
U
nite
d St
ates
h
370
29.4
(2
.7)
42.8
(2
.5)
19.3
(2
.6)
7.2
(2.0
) 1.
3 (0
.6)
Not
es:
1. †
Som
e or
all
futu
re t
each
ers
in t
his
cou
ntr
y ar
e be
ing
prep
ared
to
teac
h p
rim
ary
and
low
er-s
econ
dary
stu
den
ts. T
he
prog
ram
-gro
ups
pre
pari
ng
futu
re p
rim
ary
teac
her
s an
d t
he
prog
ram
-gr
oups
pre
pari
ng
low
er-s
econ
dary
tea
cher
s ar
e th
eref
ore
par
tly
or fu
lly o
verl
appi
ng
(see
TE
DS-
M t
ech
nic
al r
epor
t).
2. W
hen
rea
din
g th
is e
xhib
it, k
eep
in m
ind
the
limit
atio
ns
ann
otat
ed in
Ch
apte
r 4
and
den
oted
in t
he
tabl
e ab
ove
by fo
otn
ote
lett
ers.
3. T
he
shad
ed a
reas
iden
tify
dat
a th
at, f
or r
easo
ns
expl
ain
ed in
th
ese
limit
atio
ns,
can
not
be
com
pare
d w
ith
con
fide
nce
to
data
from
oth
er c
oun
trie
s.

THE TEACHER EDUCATION AND DEVELOPMENT STUDY IN MATHEMATICS (TEDS-M)230
Exh
ibit
A4.
15: F
utur
e pr
imar
y te
ache
rs’ e
stim
ates
of t
he n
umbe
r of
boo
ks in
thei
r pa
rent
s’ or
gua
rdia
ns’ h
omes
(es
tim
ated
per
cent
)
Perc
ent
of
Futu
re P
rim
ary
Teac
hers
in R
esp
on
se C
ateg
ori
es (
wei
ghte
d e
stim
ates
)
P
rog
ram
-Gro
up
Co
untr
y
No
ne
or
Few
En
oug
h to
Fill
En
oug
h to
Fill
En
oug
h to
Fill
En
oug
h to
Fill
Thr
ee
O
ne
Boo
kshe
lf
On
e Bo
okc
ase
Two
Bo
okc
ases
o
r M
ore
Bo
ok
Cas
es
n
Est.
(S
E)
Est.
(S
E)
Est.
(S
E)
Est.
(S
E)
Est.
(S
E)
Low
er P
rimar
y G
eorg
ia
497
1.3
(0.5
) 9.
6 (1
.2)
31.1
(2
.2)
29.7
(2
.2)
28.2
(1
.9)
(to
Gra
de 4
G
erm
any
835
1.0
(0.6
) 4.
1 (1
.0)
13.3
(1
.7)
17.2
(1
.6)
64.4
(2
.6)
Max
imum
) Po
land
d 1,
809
4.0
(0.8
) 15
.3
(1.2
) 40
.3
(1.3
) 22
.9
(1.6
) 17
.5
(1.3
)
Ru
ssia
n fe
dera
tione
2,24
6 1.
3 (0
.3)
8.0
(1.0
) 36
.1
(1.7
) 33
.7
(1.9
) 20
.9
(1.4
)
Sw
itzer
land
f 12
1 1.
0 (1
.0)
1.6
(1.1
) 25
.7
(4.7
) 26
.5
(4.1
) 45
.3
(4.4
)
Prim
ary
Chi
nese
Tai
pei
923
6.6
(0.9
) 12
.6
(0.9
) 31
.8
(1.2
) 19
.5
(1.3
) 29
.5
(1.6
)(t
o G
rade
6
Phili
ppin
es
591
31.2
(2
.8)
46.7
(3
.4)
18.4
(5
.2)
2.8
(0.9
) 0.
9 (0
.3)
Max
imum
) Si
ngap
ore
263
3.9
(1.1
) 15
.2
(2.4
) 36
.2
(3.0
) 20
.4
(2.4
) 24
.4
(2.7
)
Sp
ain
1,09
3 0.
5 (0
.2)
6.6
(0.8
) 30
.8
(2.4
) 27
.1
(1.8
) 35
.0
(1.4
)
Sw
itzer
land
r 81
5 1.
7 (0
.4)
3.4
(0.5
) 20
.4
(1.5
) 29
.2
(1.8
) 45
.3
(1.9
)
U
nite
d St
ates
g 1,
035
2.4
(0.6
) 9.
5 (1
.2)
28.7
(1
.9)
22.0
(1
.2)
37.4
(2
.4)
Prim
ary
and
bo
tsw
anaa
85
35.1
(4
.4)
32.0
(5
.1)
21.3
(4
.1)
6.3
(2.1
) 5.
3 (2
.6)
Seco
ndar
y G
ener
alist
s C
hile
†b
653
4.7
(0.8
) 19
.9
(1.1
) 43
.3
(2.1
) 20
.7
(1.7
) 11
.4
(1.4
)(t
o Gra
de 1
0 N
orw
ay (A
LU)†c
39
2 2.
4 (0
.9)
4.7
(1.0
) 18
.5
(1.8
) 21
.5
(2.5
) 52
.9
(2.7
)M
axim
um)
Nor
way
(ALU
+)†c
15
8 1.
2 (0
.0)
6.4
(2.3
) 24
.6
(3.7
) 14
.7
(2.7
) 53
.1
(4.0
)
Prim
ary
Ger
man
y† 80
0.
3 (0
.3)
4.5
(2.5
) 14
.1
(6.3
) 32
.9
(8.5
) 48
.2
(9.7
)M
athe
mat
ics
Mal
aysi
a 56
7 9.
9 (1
.1)
27.6
(1
.8)
39.8
(2
.1)
11.7
(1
.3)
10.9
(1
.5)
Spec
ialis
ts
Pola
nd†d
30
0 3.
0 (1
.1)
9.5
(1.6
) 40
.3
(3.6
) 24
.0
(2.0
) 23
.3
(3.2
)
Si
ngap
ore
117
3.5
(1.7
) 14
.4
(3.1
) 36
.7
(4.9
) 22
.4
(3.5
) 23
.0
(4.0
)
Th
aila
nd†
659
13.9
(1
.4)
27.9
(1
.5)
37.0
(2
.0)
12.0
(1
.3)
9.2
(1.2
)
U
nite
d St
ates
†g
150
1.9
(1.5
) 5.
5 (1
.8)
29.5
(5
.8)
18.8
(2
.4)
44.3
(5
.6)
Not
es:
1. †
Som
e or
all
futu
re t
each
ers
in t
his
cou
ntr
y ar
e be
ing
prep
ared
to
teac
h p
rim
ary
and
low
er-s
econ
dary
stu
den
ts. T
he
prog
ram
-gro
ups
pre
pari
ng
futu
re p
rim
ary
teac
her
s an
d t
he
prog
ram
-gr
oups
pre
pari
ng
low
er-s
econ
dary
tea
cher
s ar
e th
eref
ore
part
ly o
r fu
lly o
verl
appi
ng
(see
TE
DS-
M t
ech
nic
al r
epor
t).
2. W
hen
rea
din
g th
is e
xhib
it, k
eep
in m
ind
the
limit
atio
ns
ann
otat
ed in
Ch
apte
r 4
and
den
oted
in t
he
tabl
e ab
ove
by fo
otn
ote
lett
ers.
3. T
he
shad
ed a
reas
iden
tify
dat
a th
at, f
or r
easo
ns
expl
ain
ed in
th
ese
limit
atio
ns,
can
not
be
com
pare
d w
ith
con
fide
nce
to
data
from
oth
er c
oun
trie
s.

231APPENDICES
Exh
ibit
A4.
16: F
utur
e lo
wer
-sec
onda
ry te
ache
rs’ e
stim
ates
of t
he n
umbe
r of
boo
ks in
thei
r pa
rent
s’ or
gua
rdia
ns’ h
omes
(es
tim
ated
per
cent
)
Perc
ent
of
Futu
re P
rim
ary
Teac
hers
in R
esp
on
se C
ateg
ori
es (
wei
ghte
d e
stim
ates
)
P
rog
ram
-Gro
up
Co
untr
y
No
ne
or
Few
En
oug
h to
Fill
En
oug
h to
Fill
En
oug
h to
Fill
En
oug
h to
Fill
Thr
ee
O
ne
Boo
kshe
lf
On
e Bo
okc
ase
Two
Bo
okc
ases
o
r M
ore
Bo
ok
Cas
es
n
Es
t.
(SE)
Es
t.
(SE)
Es
t.
(SE)
Es
t.
(SE)
Es
t.
(SE)
Low
er S
econ
dary
bo
tsw
anaa
33
45.4
(9
.2)
33.2
(6
.3)
21.3
(8
.0)
0.0
(0.0
) 0.
0 (0
.0)
(to
Gra
de 1
1 C
hile
†b
745
6.2
(0.9
) 20
.7
(1.5
) 44
.6
(1.9
) 16
.9
(1.3
) 11
.6
(1.0
)M
axim
um)
Ger
man
y† 34
6 3.
6 (2
.7)
9.8
(3.8
) 21
.6
(5.7
) 18
.3
(2.5
) 46
.7
(5.6
)
N
orw
ay (A
LU)†d
35
5 1.
4 (0
.7)
6.4
(1.3
) 17
.9
(1.8
) 25
.8
(2.7
) 48
.4
(2.5
)
N
orw
ay (A
LU+)
†d
148
0.6
(0.6
) 5.
9 (2
.1)
30.5
(3
.9)
23.0
(4
.0)
40.1
(4
.4)
Ph
ilipp
ines
73
1 37
.1
(4.2
) 39
.7
(4.4
) 20
.4
(3.0
) 1.
9 (0
.5)
0.9
(0.4
)
Po
land
†e
158
3.4
(1.5
) 12
.8
(2.6
) 38
.4
(4.0
) 26
.8
(3.8
) 18
.6
(3.9
)
Si
ngap
ore
141
5.9
(2.3
) 19
.3
(3.2
) 29
.7
(3.3
) 24
.4
(4.0
) 20
.8
(3.0
)
Sw
itzer
land
g 14
1 2.
7 (1
.4)
5.4
(2.1
) 26
.0
(3.6
) 22
.4
(3.3
) 43
.4
(4.1
)
U
nite
d St
ates
†h
131
0.0
(0.0
) 5.
5 (1
.1)
23.0
(4
.1)
31.2
(4
.6)
40.3
(7
.2)
Low
er a
nd U
pper
bo
tsw
ana†h
19
31
.6
(7.4
) 31
.6
(11.
2)
26.3
(8
.3)
10.5
(7
.4)
0.0
(0.0
)Se
cond
ary
Chi
nese
Tai
pei
364
12.1
(1
.8)
18.7
(2
.0)
30.6
(3
.2)
17.0
(2
.0)
21.6
(2
.3)
(to
Gra
de 1
1 G
eorg
iac
75
0.0
(0.0
) 11
.8
(3.2
) 35
.0
(6.4
) 18
.5
(4.7
) 34
.6
(5.1
)an
d ab
ove)
G
erm
any
303
1.1
(0.5
) 4.
8 (1
.6)
18.7
(2
.9)
16.5
(2
.7)
59.0
(3
.2)
M
alay
sia
387
18.9
(2
.0)
24.4
(3
.0)
39.1
(2
.4)
8.9
(1.6
) 8.
7 (1
.6)
N
orw
ay (P
PU &
Mas
ter’
s)d
65
0.0
(0.0
) 4.
2 (2
.7)
14.7
(4
.8)
21.8
(3
.0)
59.3
(5
.4)
O
man
26
7 14
.4
(2.0
) 26
.9
(2.5
) 39
.3
(2.7
) 11
.7
(1.8
) 7.
7 (1
.3)
Po
land
e 14
0 0.
8 (0
.6)
9.1
(2.5
) 39
.4
(5.4
) 23
.0
(4.3
) 27
.7
(5.9
)
Ru
ssia
n fe
dera
tionf
2,13
8 1.
4 (0
.4)
8.8
(0.7
) 37
.4
(1.2
) 31
.3
(1.3
) 21
.1
(1.6
)
Si
ngap
ore
251
6.8
(1.3
) 17
.9
(2.3
) 37
.8
(2.3
) 18
.3
(2.1
) 19
.1
(2.8
)
Th
aila
nd†
651
16.5
(1
.2)
26.4
(1
.9)
36.2
(1
.9)
12.0
(1
.4)
8.9
(1.1
)
U
nite
d St
ates
h
371
6.5
(1.3
) 11
.0
(1.9
) 27
.8
(2.5
) 22
.5
(3.4
) 32
.2
(3.9
)
Not
es:
1. †
Som
e or
all
futu
re t
each
ers
in t
his
cou
ntr
y ar
e be
ing
prep
ared
to
teac
h p
rim
ary
and
low
er-s
econ
dary
stu
den
ts. T
he
prog
ram
-gro
ups
pre
pari
ng
futu
re p
rim
ary
teac
her
s an
d t
he
prog
ram
-gr
oups
pre
pari
ng
low
er-s
econ
dary
tea
cher
s ar
e th
eref
ore
par
tly
or fu
lly o
verl
appi
ng
(see
TE
DS-
M t
ech
nic
al r
epor
t).
2. W
hen
rea
din
g th
is e
xhib
it, k
eep
in m
ind
the
limit
atio
ns
ann
otat
ed in
Ch
apte
r 4
and
den
oted
in t
he
tabl
e ab
ove
by fo
otn
ote
lett
ers.
3. T
he
shad
ed a
reas
iden
tify
dat
a th
at, f
or r
easo
ns
expl
ain
ed in
th
ese
limit
atio
ns,
can
not
be
com
pare
d w
ith
con
fide
nce
to
data
from
oth
er c
oun
trie
s.
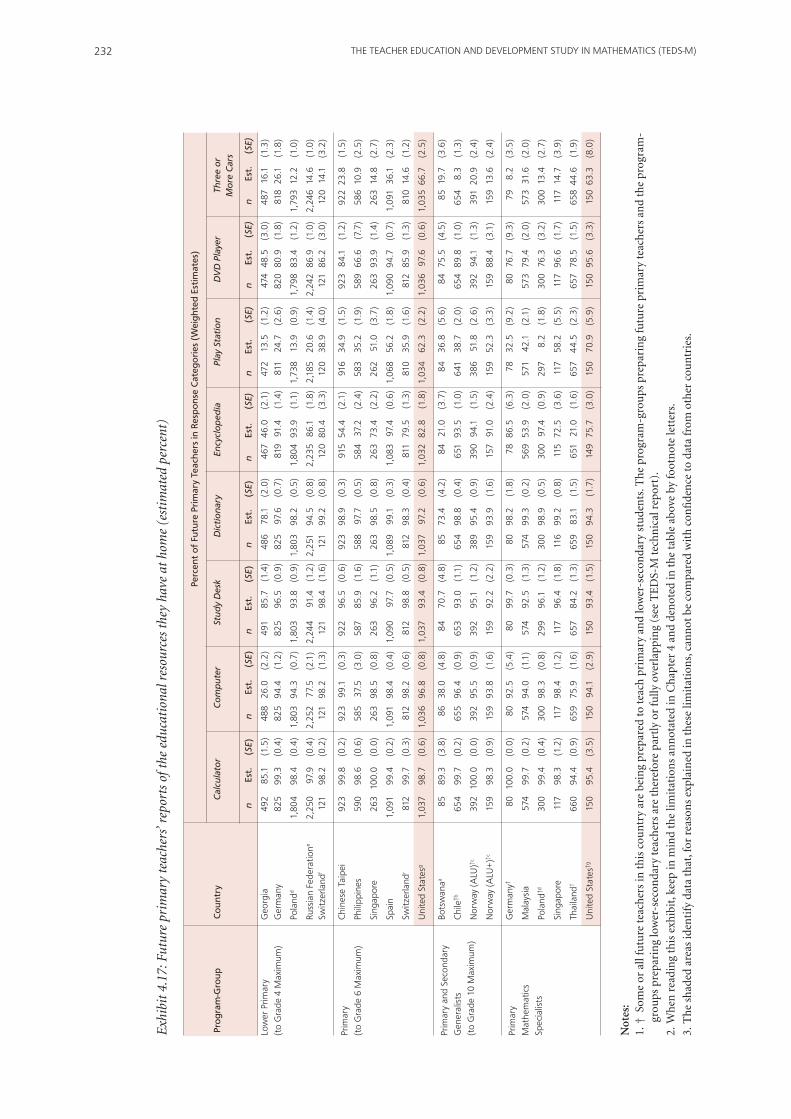
THE TEACHER EDUCATION AND DEVELOPMENT STUDY IN MATHEMATICS (TEDS-M)232
Exh
ibit
4.1
7: F
utur
e pr
imar
y te
ache
rs’ r
epor
ts o
f the
edu
cati
onal
res
ourc
es th
ey h
ave
at h
ome
(est
imat
ed p
erce
nt)
Pr
og
ram
-Gro
up
Co
untr
y C
alcu
lato
r C
om
put
er
Stud
y D
esk
Dic
tio
nar
y En
cycl
op
edia
Pl
ay S
tati
on
D
VD
Pla
yer
Thre
e o
r
M
ore
Car
s
n
Est.
(S
E)
n
Est.
(S
E)
n
Est.
(S
E)
n
Est.
(S
E)
n
Est.
(S
E)
n
Est.
(S
E)
n
Est.
(S
E)
n
Est.
(S
E)
Low
er P
rimar
y G
eorg
ia
492
85.1
(1
.5)
488
26.0
(2
.2)
491
85.7
(1
.4)
486
78.1
(2
.0)
467
46.0
(2
.1)
472
13.5
(1
.2)
474
48.5
(3
.0)
487
16.1
(1
.3)
(to
Gra
de 4
Max
imum
) G
erm
any
825
99.3
(0
.4)
825
94.4
(1
.2)
825
96.5
(0
.9)
825
97.6
(0
.7)
819
91.4
(1
.4)
811
24.7
(2
.6)
820
80.9
(1
.8)
818
26.1
(1
.8)
Po
land
d 1,
804
98.4
(0
.4)
1,80
3 94
.3
(0.7
) 1,
803
93.8
(0
.9)
1,80
3 98
.2
(0.5
) 1,
804
93.9
(1
.1)
1,73
8 13
.9
(0.9
) 1,
798
83.4
(1
.2)
1,79
3 12
.2
(1.0
)
Ru
ssia
n fe
dera
tione
2,25
0 97
.9
(0.4
) 2,
252
77.5
(2
.1)
2,24
4 91
.4
(1.2
) 2,
251
94.5
(0
.8)
2,23
5 86
.1
(1.8
) 2,
185
20.6
(1
.4)
2,24
2 86
.9
(1.0
) 2,
246
14.6
(1
.0)
Sw
itzer
land
f 12
1 98
.2
(0.2
) 12
1 98
.2
(1.3
) 12
1 98
.4
(1.6
) 12
1 99
.2
(0.8
) 12
0 80
.4
(3.3
) 12
0 38
.9
(4.0
) 12
1 86
.2
(3.0
) 12
0 14
.1
(3.2
)
Prim
ary
Chi
nese
Tai
pei
923
99.8
(0
.2)
923
99.1
(0
.3)
922
96.5
(0
.6)
923
98.9
(0
.3)
915
54.4
(2
.1)
916
34.9
(1
.5)
923
84.1
(1
.2)
922
23.8
(1
.5)
(to
Gra
de 6
Max
imum
) Ph
ilipp
ines
59
0 98
.6
(0.6
) 58
5 37
.5
(3.0
) 58
7 85
.9
(1.6
) 58
8 97
.7
(0.5
) 58
4 37
.2
(2.4
) 58
3 35
.2
(1.9
) 58
9 66
.6
(7.7
) 58
6 10
.9
(2.5
)
Si
ngap
ore
263
100.
0 (0
.0)
263
98.5
(0
.8)
263
96.2
(1
.1)
263
98.5
(0
.8)
263
73.4
(2
.2)
262
51.0
(3
.7)
263
93.9
(1
.4)
263
14.8
(2
.7)
Sp
ain
1,09
1 99
.4
(0.2
) 1,
091
98.4
(0
.4)
1,09
0 97
.7
(0.5
) 1,
089
99.1
(0
.3)
1,08
3 97
.4
(0.6
) 1,
068
56.2
(1
.8)
1,09
0 94
.7
(0.7
) 1,
091
36.1
(2
.3)
Sw
itzer
land
r 81
2 99
.7
(0.3
) 81
2 98
.2
(0.6
) 81
2 98
.8
(0.5
) 81
2 98
.3
(0.4
) 81
1 79
.5
(1.3
) 81
0 35
.9
(1.6
) 81
2 85
.9
(1.3
) 81
0 14
.6
(1.2
)
U
nite
d St
ates
g 1,
037
98.7
(0
.6)
1,03
6 96
.8
(0.8
) 1,
037
93.4
(0
.8)
1,03
7 97
.2
(0.6
) 1,
032
82.8
(1
.8)
1,03
4 62
.3
(2.2
) 1,
036
97.6
(0
.6)
1,03
5 66
.7
(2.5
)
Prim
ary
and
Seco
ndar
y bo
tsw
anaa
85
89.3
(3
.8)
86
38.0
(4
.8)
84
70.7
(4
.8)
85
73.4
(4
.2)
84
21.0
(3
.7)
84
36.8
(5
.6)
84
75.5
(4
.5)
85 1
9.7
(3.6
)
Gen
eral
ists
C
hile
†b
654
99.7
(0
.2)
655
96.4
(0
.9)
653
93.0
(1
.1)
654
98.8
(0
.4)
651
93.5
(1
.0)
641
38.7
(2
.0)
654
89.8
(1
.0)
654
8.3
(1.3
)(t
o G
rade
10
Max
imum
) N
orw
ay (A
LU)†c
39
2 10
0.0
(0.0
) 39
2 95
.5
(0.9
) 39
2 95
.1
(1.2
) 38
9 95
.4
(0.9
) 39
0 94
.1
(1.5
) 38
6 51
.8
(2.6
) 39
2 94
.1
(1.3
) 39
1 20
.9
(2.4
)
N
orw
ay (A
LU+)
†c
159
98.3
(0
.9)
159
93.8
(1
.6)
159
92.2
(2
.2)
159
93.9
(1
.6)
157
91.0
(2
.4)
159
52.3
(3
.3)
159
88.4
(3
.1)
159
13.6
(2
.4)
Prim
ary
Ger
man
y† 80
10
0.0
(0.0
) 80
92
.5
(5.4
) 80
99
.7
(0.3
) 80
98
.2
(1.8
) 78
86
.5
(6.3
) 78
32
.5
(9.2
) 80
76
.7
(9.3
) 79
8.
2 (3
.5)
Mat
hem
atic
s M
alay
sia
574
99.7
(0
.2)
574
94.0
(1
.1)
574
92.5
(1
.3)
574
99.3
(0
.2)
569
53.9
(2
.0)
571
42.1
(2
.1)
573
79.4
(2
.0)
573
31.6
(2
.0)
Spec
ialis
ts
Pola
nd†d
30
0 99
.4
(0.4
) 30
0 98
.3
(0.8
) 29
9 96
.1
(1.2
) 30
0 98
.9
(0.5
) 30
0 97
.4
(0.9
) 29
7 8.
2 (1
.8)
300
76.3
(3
.2)
300
13.4
(2
.7)
Si
ngap
ore
117
98.3
(1
.2)
117
98.4
(1
.2)
117
96.4
(1
.8)
116
99.2
(0
.8)
115
72.5
(3
.6)
117
58.2
(5
.5)
117
96.6
(1
.7)
117
14.7
(3
.9)
Th
aila
nd†
660
94.4
(0
.9)
659
75.9
(1
.6)
657
84.2
(1
.3)
659
83.1
(1
.5)
651
21.0
(1
.6)
657
44.5
(2
.3)
657
78.5
(1
.5)
658
44.6
(1
.9)
U
nite
d St
ates
†g
150
95.4
(3
.5)
150
94.1
(2
.9)
150
93.4
(1
.5)
150
94.3
(1
.7)
149
75.7
(3
.0)
150
70.9
(5
.9)
150
95.6
(3
.3)
150
63.3
(8
.0)
Not
es:
1. †
Som
e or
all
futu
re t
each
ers
in t
his
cou
ntr
y ar
e be
ing
prep
ared
to
teac
h p
rim
ary
and
low
er-s
econ
dary
stu
den
ts. T
he
prog
ram
-gro
ups
pre
pari
ng
futu
re p
rim
ary
teac
her
s an
d t
he
prog
ram
-gr
oups
pre
pari
ng
low
er-s
econ
dary
tea
cher
s ar
e th
eref
ore
part
ly o
r fu
lly o
verl
appi
ng
(see
TE
DS-
M t
ech
nic
al r
epor
t).
2. W
hen
rea
din
g th
is e
xhib
it, k
eep
in m
ind
the
limit
atio
ns
ann
otat
ed in
Ch
apte
r 4
and
den
oted
in t
he
tabl
e ab
ove
by fo
otn
ote
lett
ers.
3. T
he
shad
ed a
reas
iden
tify
dat
a th
at, f
or r
easo
ns
expl
ain
ed in
th
ese
limit
atio
ns,
can
not
be
com
pare
d w
ith
con
fide
nce
to
data
from
oth
er c
oun
trie
s.
Pe
rcen
t o
f Fu
ture
Pri
mar
y Te
ache
rs in
Res
po
nse
Cat
ego
ries
(W
eigh
ted
Est
imat
es)

233APPENDICES
Exh
ibit
A4.
18: F
utur
e lo
wer
-sec
onda
ry te
ache
rs’ r
epor
ts o
f the
edu
cati
onal
res
ourc
es th
ey h
ave
at h
ome
(est
imat
ed p
erce
nt)
Pr
og
ram
-Gro
up
Co
untr
y C
alcu
lato
r C
om
put
er
Stud
y D
esk
Dic
tio
nar
y En
cycl
op
edia
Pl
ay S
tati
on
D
VD
Pla
yer
Thre
e o
r
M
ore
Car
s
n
Est.
(S
E)
n
Est.
(S
E)
n
Est.
(S
E)
n
Est.
(S
E)
n
Est.
(S
E)
n
Est.
(S
E)
n
Est.
(S
E)
n
Est.
(S
E)
Low
er S
econ
dary
bo
tsw
anaa
33
94.0
(4
.3)
33
30.0
(7
.4)
33
88.2
(4
.2)
32
84.4
(7
.0)
32
6.1
(4.3
) 33
39
.3
(11.
0)
33
78.8
(8
.0)
32 1
5.3
(5.4
)(t
o G
rade
10
Chi
le†b
70
8 98
.9
(0.4
) 70
8 94
.8
(0.8
) 70
5 92
.1
(0.9
) 70
6 99
.3
(0.3
) 70
5 94
.5
(0.8
) 69
1 36
.9
(2.2
) 70
9 90
.7
(1.1
) 70
0 10
.5
(1.2
)M
axim
um)
Ger
man
y† 34
2 97
.4
(2.6
) 34
2 83
.9
(4.9
) 34
2 94
.7
(2.9
) 34
2 95
.3
(2.9
) 33
8 84
.7
(4.5
) 33
3 25
.8
(3.1
) 34
0 69
.6
(4.9
) 33
7 17
.4
(2.1
)
N
orw
ay (A
LU)†d
35
5 99
.4
(0.4
) 35
4 96
.5
(0.7
) 35
5 93
.0
(1.3
) 35
5 95
.1
(1.0
) 35
2 94
.0
(1.2
) 35
2 51
.6
(2.8
) 35
5 96
.5
(0.9
) 35
5 21
.5
(2.1
)
N
orw
ay (A
LU+)
†d
150
95.4
(1
.0)
150
89.1
(1
.8)
150
87.9
(2
.8)
150
94.3
(1
.9)
149
94.3
(2
.0)
150
46.7
(4
.7)
149
83.5
(2
.4)
149
17.8
(3
.2)
Ph
ilipp
ines
73
2 97
.2
(1.0
) 72
6 32
.4
(1.8
) 72
9 78
.8
(2.9
) 73
0 94
.6
(1.4
) 72
4 38
.8
(3.3
) 72
4 25
.4
(2.2
) 72
7 62
.2
(3.8
) 72
7 5.
3 (0
.9)
Po
land
†e
158
100.
0 (0
.0)
158
97.7
(1
.3)
158
95.8
(1
.7)
158
99.2
(0
.8)
157
92.3
(2
.3)
154
8.5
(1.8
) 15
8 77
.1
(3.5
) 15
8 12
.3
(2.5
)
Si
ngap
ore
141
100.
0 (0
.0)
141
98.5
(1
.0)
141
94.3
(1
.8)
141
98.5
(1
.0)
138
62.9
(3
.7)
141
43.5
(3
.9)
141
94.3
(2
.5)
141
9.8
(2.4
)
Sw
itzer
land
g 14
1 10
0.0
(0.0
) 14
1 96
.9
(1.6
) 14
1 98
.3
(1.2
) 14
1 98
.3
(1.2
) 14
1 83
.9
(2.9
) 14
0 39
.5
(5.2
) 14
1 85
.5
(3.0
) 14
1 16
.1
(2.8
)
U
nite
d St
ates
†h
130
100.
0 (0
.0)
130
97.8
(0
.8)
130
95.3
(1
.2)
130
99.7
(0
.4)
130
81.6
(2
.7)
130
58.0
(2
.2)
130
98.3
(0
.8)
130
67.6
(1
.6)
Low
er a
nd U
pper
bo
tsw
ana†h
19
94
.7
(5.3
) 19
42
.1
(11.
2)
19
78.9
(9
.8)
19
94.7
(5
.3)
19
21.1
(9
.8)
19
42.1
(6
.4)
19
89.5
(6
.4)
19 1
0.5
(6.4
)
Seco
ndar
y C
hine
se T
aipe
ic 36
5 98
.9
(0.5
) 36
5 96
.2
(0.9
) 36
5 95
.2
(1.0
) 36
5 97
.6
(0.8
) 36
3 46
.1
(2.2
) 36
4 40
.4
(2.7
) 36
5 78
.4
(2.2
) 36
5 17
.7
(2.3
)(t
o G
rade
11
Geo
rgia
c 77
90
.8
(4.5
) 77
32
.1
(5.2
) 78
89
.7
(2.7
) 78
85
.2
(3.8
) 77
50
.3
(5.1
) 76
15
.5
(3.8
) 77
35
.0
(4.6
) 76
12.
2 (3
.9)
and
abov
e)
Ger
man
y 29
8 99
.4
(0.4
) 29
9 92
.1
(2.4
) 29
9 93
.0
(2.0
) 29
9 95
.3
(1.8
) 29
7 89
.0
(2.3
) 29
5 21
.3
(2.6
) 29
8 71
.5
(3.6
) 29
7 15
.7
(2.7
)
M
alay
sia
388
99.6
(0
.3)
388
87.1
(1
.8)
388
87.1
(2
.0)
388
98.5
(0
.7)
385
42.6
(2
.6)
388
44.7
(2
.5)
388
77.3
(2
.3)
385
31.1
(2
.1)
N
orw
ay (P
PU &
Mas
ter’s
)d 64
96
.4
(2.6
) 64
88
.4
(4.4
) 64
89
.4
(3.5
) 64
94
.9
(2.5
) 64
92
.2
(3.1
) 64
29
.3
(6.8
) 64
83
.1
(4.4
) 64
20.
6 (4
.7)
O
man
26
8 99
.6
(0.4
) 26
7 93
.9
(1.8
) 26
6 68
.2
(2.6
) 26
7 88
.9
(1.7
) 26
4 60
.6
(2.9
) 26
3 68
.7
(2.4
) 26
7 49
.7
(3.1
) 26
6 53
.7
(2.5
)
Po
land
e 14
0 10
0.0
(0.0
) 14
0 96
.0
(2.4
) 14
0 97
.8
(1.1
) 14
0 10
0.0
(0.0
) 14
0 92
.3
(3.3
) 13
7 9.
9 (1
.9)
140
63.6
(3
.9)
140
11.9
(5
.0)
Ru
ssia
n fe
dera
tionf
2,13
5 98
.0
(0.7
) 2,
134
89.5
(1
.1)
2,13
4 90
.6
(1.1
) 2,
131
92.8
(0
.9)
2,13
3 85
.9
(1.3
) 2,
098
16.4
(1
.5)
2,13
2 77
.7
(1.3
) 2,
128
12.8
(1
.2)
Si
ngap
ore
250
99.2
(0
.6)
250
98.0
(0
.9)
250
95.2
(1
.3)
250
96.4
(1
.1)
250
59.6
(2
.8)
249
45.4
(3
.1)
250
91.6
(1
.6)
250
12.4
(2
.3)
Th
aila
nd†
650
95.0
(0
.9)
649
75.3
(1
.5)
650
80.3
(1
.4)
651
80.8
(1
.5)
647
19.9
(1
.4)
651
43.8
(1
.6)
650
81.3
(1
.2)
649
47.1
(2
.0)
U
nite
d St
ates
h 37
1 98
.4
(0.7
) 37
1 96
.5
(1.3
) 37
1 90
.5
(1.7
) 37
1 96
.5
(1.0
) 37
0 77
.2
(2.2
) 37
1 64
.6
(3.1
) 37
1 97
.3
(0.8
) 37
1 61
.3
(4.6
)
Not
es:
1. †
Som
e or
all
futu
re t
each
ers
in t
his
cou
ntr
y ar
e be
ing
prep
ared
to
teac
h p
rim
ary
and
low
er-s
econ
dary
stu
den
ts. T
he
prog
ram
-gro
ups
pre
pari
ng
futu
re p
rim
ary
teac
her
s an
d t
he
prog
ram
-gr
oups
pre
pari
ng
low
er-s
econ
dary
tea
cher
s ar
e th
eref
ore
part
ly o
r fu
lly o
verl
appi
ng
(see
TE
DS-
M t
ech
nic
al r
epor
t).
2. W
hen
rea
din
g th
is e
xhib
it, k
eep
in m
ind
the
limit
atio
ns
ann
otat
ed in
Ch
apte
r 4
and
den
oted
in t
he
tabl
e ab
ove
by fo
otn
ote
lett
ers.
3. T
he
shad
ed a
reas
iden
tify
dat
a th
at, f
or r
easo
ns
expl
ain
ed in
th
ese
limit
atio
ns,
can
not
be
com
pare
d w
ith
con
fide
nce
to
data
from
oth
er c
oun
trie
s.
Pe
rcen
t o
f Fu
ture
Lo
wer
-Sec
on
dar
y Te
ache
rs in
Res
po
nse
Cat
ego
ries
(w
eigh
ted
est
imat
es)

THE TEACHER EDUCATION AND DEVELOPMENT STUDY IN MATHEMATICS (TEDS-M)234
Exh
ibit
A4.
19: F
utur
e pr
imar
y te
ache
rs’ r
epor
ts o
f the
hig
hest
leve
l of e
duca
tion
com
plet
ed b
y th
eir
mot
hers
, ste
pmot
hers
, or
fem
ale
guar
dian
s (e
stim
ated
per
cent
)
Perc
ent
of
Futu
re P
rim
ary
Teac
hers
in R
esp
on
se C
ateg
ori
es (
wei
ghte
d e
stim
ates
)
P
rog
ram
-Gro
up
Co
untr
y Pr
imar
y Lo
wer
U
pp
er
Post
-Sec
on
dar
y Pr
acti
cal o
r Fi
rst
Deg
ree
Beyo
nd
D
on’
t K
now
Se
con
dar
y Se
con
dar
y N
on
-Ter
tiar
y V
oca
tio
nal
ISC
ED 5
A
Trai
nin
g
n
Est.
(S
E)
Est.
(S
E)
Est.
(S
E)
Est.
(S
E)
Est.
(S
E)
Est.
(S
E)
Est.
(S
E)
Est.
(S
E)
Low
er P
rimar
y G
eorg
ia
472
1.7
(0.6
) 0.
2 (0
.2)
14.3
(1
.5)
28.3
(2
.8)
39.0
(2
.7)
8.9
(1.0
) 4.
8 (1
.2)
2.7
(0.8
)(t
o G
rade
4
Ger
man
y 91
7 4.
1 (1
.0)
19.3
(1
.7)
5.9
(1.2
) 37
.7
(2.2
) 6.
6 (1
.1)
10.1
(1
.4)
14.7
(1
.7)
1.6
(0.6
)M
axim
um)
Pola
ndd
1,62
3 0.
0 (0
.0)
9.1
(0.9
) 75
.3
(1.4
) 0.
0 (0
.0)
0.0
(0.0
) 4.
1 (0
.4)
11.0
(0
.9)
0.5
(0.2
)
Russ
ian
fede
ratio
ne 2,
241
0.4
(0.2
) 3.
4 (0
.6)
7.8
(0.9
) 15
.2
(0.8
) 45
.5
(1.4
) 6.
2 (0
.9)
20.8
(1
.3)
0.7
(0.2
)
Switz
erla
ndf
120
2.3
(1.3
) 17
.5
(3.1
) 39
.9
(5.1
) 10
.7
(3.2
) 7.
9 (2
.4)
12.9
(3
.4)
4.5
(2.0
) 4.
2 (1
.9)
Prim
ary
Chi
nese
Tai
pei
923
19.9
(1
.1)
18.9
(1
.0)
37.8
(1
.6)
10.9
(1
.0)
0.0
(0.0
) 10
.3
(1.1
) 1.
8 (0
.5)
0.6
(0.3
)
(to
Gra
de 6
Ph
ilipp
ines
58
4 26
.7
(2.9
) 9.
9 (1
.5)
21.4
(2
.3)
13.2
(2
.3)
8.9
(1.6
) 15
.9
(2.2
) 2.
4 (0
.9)
1.7
(0.5
)M
axim
um)
Sing
apor
e 26
3 26
.6
(2.5
) 12
.2
(2.1
) 39
.1
(2.5
) 11
.8
(2.0
) 3.
4 (1
.3)
2.6
(0.8
) 0.
8 (0
.6)
3.4
(1.3
)
Spai
n 1,
077
37.6
(2
.8)
16.7
(1
.3)
15.2
(2
.1)
0.0
(0.0
) 15
.6
(1.3
) 8.
4 (1
.0)
4.6
(1.0
) 2.
0 (0
.5)
Switz
erla
ndr
810
4.0
(0.9
) 21
.3
(1.7
) 35
.9
(1.6
) 5.
9 (0
.8)
10.0
(1
.0)
15.6
(1
.4)
6.2
(0.9
) 1.
1 (0
.4)
Uni
ted
Stat
esg
1,30
0 1.
5 (0
.5)
2.6
(0.5
) 34
.5
(1.9
) 9.
9 (1
.0)
14.3
(1
.1)
21.7
(1
.5)
14.7
(1
.0)
0.8
(0.3
)
Prim
ary
and
bo
tsw
anaa
85
47.9
(6
.0)
12.4
(3
.2)
6.9
(2.8
) 9.
4 (3
.2)
2.4
(1.7
) 3.
5 (1
.9)
4.6
(2.3
) 12
.9
(4.3
)
Seco
ndar
y G
ener
alis
ts
Chi
le†b
65
0 13
.4
(1.1
) 12
.4
(1.7
) 40
.7
(2.1
) 8.
2 (1
.1)
10.7
(1
.3)
10.2
(1
.0)
3.8
(0.7
) 0.
6 (0
.3)
(to
Gra
de 1
0 N
orw
ay (A
LU)†c
39
0 1.
6 (0
.7)
8.3
(1.3
) 14
.7
(1.6
) 15
.6
(1.7
) 14
.9
(1.5
) 14
.7
(2.0
) 25
.3
(2.2
) 4.
9 (1
.1)
Max
imum
) N
orw
ay (A
LU+)
†c
158
2.3
(1.1
) 14
.4
(2.7
) 18
.9
(2.6
) 10
.7
(2.1
) 17
.0
(2.6
) 12
.1
(2.9
) 18
.8
(2.6
) 6.
0 (1
.8)
Prim
ary
Ger
man
y† 95
4.
7 (4
.3)
25.6
(7
.2)
3.1
(2.1
) 42
.5
(8.4
) 1.
9 (1
.5)
2.6
(1.5
) 18
.9
(6.6
) 0.
8 (0
.4)
Mat
hem
atic
s M
alay
sia
575
34.7
(1
.8)
15.5
(1
.4)
29.4
(2
.0)
4.1
(0.9
) 7.
1 (1
.1)
4.3
(0.8
) 0.
9 (0
.4)
4.1
(0.8
)
Spec
ialis
ts
Pola
nd†d
27
2 0.
0 (0
.0)
4.8
(1.1
) 70
.9
(3.7
) 0.
0 (0
.0)
0.0
(0.0
) 3.
6 (1
.3)
18.8
(4
.0)
1.9
(0.9
)
Sing
apor
e 11
6 27
.6
(4.1
) 13
.7
(3.5
) 34
.2
(3.8
) 9.
9 (3
.0)
2.7
(1.5
) 7.
0 (2
.8)
0.0
(0.0
) 4.
9 (2
.0)
Thai
land
† 65
9 62
.4
(1.8
) 7.
6 (1
.0)
5.2
(0.9
) 4.
6 (0
.7)
1.4
(0.5
) 15
.5
(1.3
) 1.
5 (0
.4)
1.8
(0.5
)
Uni
ted
Stat
es†g
18
9 1.
2 (1
.4)
1.1
(0.7
) 43
.4
(4.0
) 8.
3 (2
.9)
17.5
(5
.7)
16.8
(3
.4)
11.7
(3
.4)
0.0
(0.0
)
Not
es:
1. †
Som
e or
all
futu
re t
each
ers
in t
his
cou
ntr
y ar
e be
ing
prep
ared
to
teac
h p
rim
ary
and
low
er-s
econ
dary
stu
den
ts. T
he
prog
ram
-gro
ups
pre
pari
ng
futu
re p
rim
ary
teac
her
s an
d t
he
prog
ram
-gr
oups
pre
pari
ng
low
er-s
econ
dary
tea
cher
s ar
e th
eref
ore
part
ly o
r fu
lly o
verl
appi
ng
(see
TE
DS-
M t
ech
nic
al r
epor
t).
2. W
hen
rea
din
g th
is e
xhib
it, k
eep
in m
ind
the
limit
atio
ns
ann
otat
ed in
Ch
apte
r 4
and
den
oted
in t
he
tabl
e ab
ove
by fo
otn
ote
lett
ers.
3. T
he
shad
ed a
reas
iden
tify
dat
a th
at, f
or r
easo
ns
expl
ain
ed in
th
ese
limit
atio
ns,
can
not
be
com
pare
d w
ith
con
fide
nce
to
data
from
oth
er c
oun
trie
s.
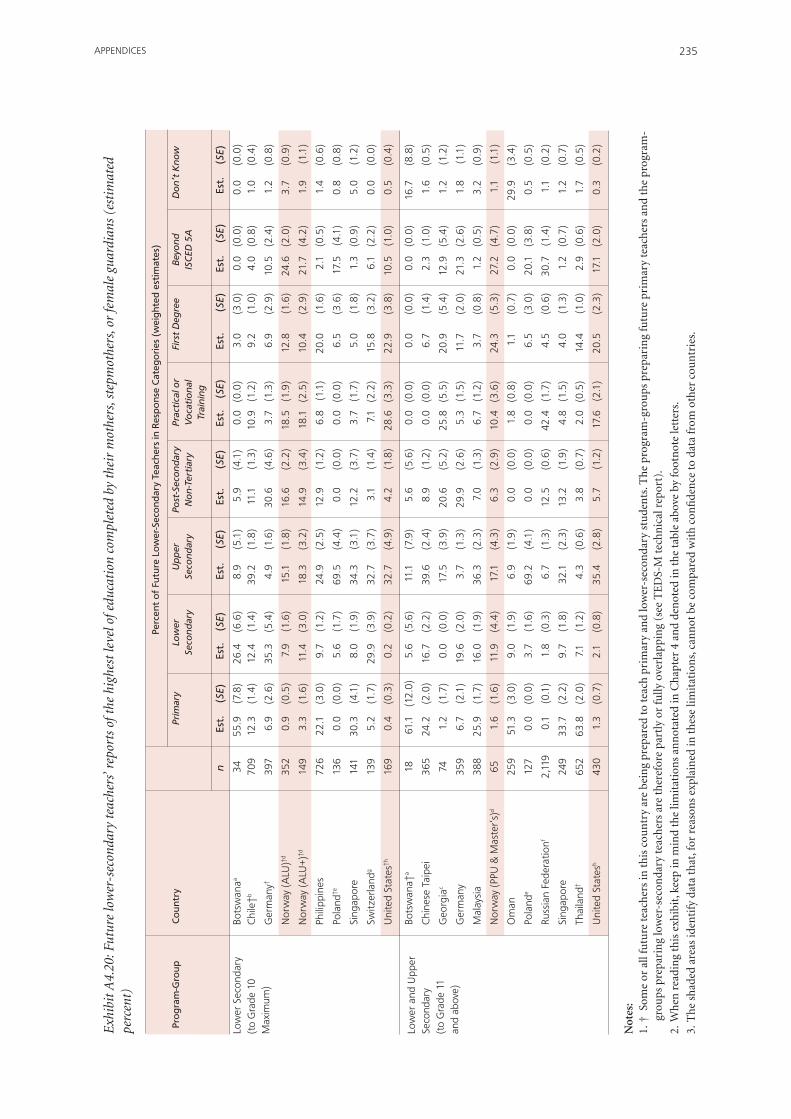
235APPENDICES
Exh
ibit
A4.
20: F
utur
e lo
wer
-sec
onda
ry te
ache
rs’ r
epor
ts o
f the
hig
hest
leve
l of e
duca
tion
com
plet
ed b
y th
eir
mot
hers
, ste
pmot
hers
, or
fem
ale
guar
dian
s (e
stim
ated
pe
rcen
t)
Perc
ent
of
Futu
re L
ow
er-S
eco
nd
ary
Teac
hers
in R
esp
on
se C
ateg
ori
es (
wei
ghte
d e
stim
ates
)
P
rog
ram
-Gro
up
Co
untr
y Pr
imar
y Lo
wer
U
pp
er
Post
-Sec
on
dar
y Pr
acti
cal o
r Fi
rst
Deg
ree
Beyo
nd
D
on’
t K
now
Se
con
dar
y Se
con
dar
y N
on
-Ter
tiar
y V
oca
tio
nal
ISC
ED 5
A
Trai
nin
g
n
Est.
(S
E)
Est.
(S
E)
Est.
(S
E)
Est.
(S
E)
Est.
(S
E)
Est.
(S
E)
Est.
(S
E)
Est.
(S
E)
Low
er S
econ
dary
bo
tsw
anaa
34
55.9
(7
.8)
26.4
(6
.6)
8.9
(5.1
) 5.
9 (4
.1)
0.0
(0.0
) 3.
0 (3
.0)
0.0
(0.0
) 0.
0 (0
.0)
(to
Gra
de 1
0
Chi
le†b
709
12.3
(1
.4)
12.4
(1
.4)
39.2
(1
.8)
11.1
(1
.3)
10.9
(1
.2)
9.2
(1.0
) 4.
0 (0
.8)
1.0
(0.4
)M
axim
um)
Ger
man
y† 39
7 6.
9 (2
.6)
35.3
(5
.4)
4.9
(1.6
) 30
.6
(4.6
) 3.
7 (1
.3)
6.9
(2.9
) 10
.5
(2.4
) 1.
2 (0
.8)
Nor
way
(ALU
)†d
352
0.9
(0.5
) 7.
9 (1
.6)
15.1
(1
.8)
16.6
(2
.2)
18.5
(1
.9)
12.8
(1
.6)
24.6
(2
.0)
3.7
(0.9
)
Nor
way
(ALU
+)†d
14
9 3.
3 (1
.6)
11.4
(3
.0)
18.3
(3
.2)
14.9
(3
.4)
18.1
(2
.5)
10.4
(2
.9)
21.7
(4
.2)
1.9
(1.1
)
Phili
ppin
es
726
22.1
(3
.0)
9.7
(1.2
) 24
.9
(2.5
) 12
.9
(1.2
) 6.
8 (1
.1)
20.0
(1
.6)
2.1
(0.5
) 1.
4 (0
.6)
Pola
nd†e
13
6 0.
0 (0
.0)
5.6
(1.7
) 69
.5
(4.4
) 0.
0 (0
.0)
0.0
(0.0
) 6.
5 (3
.6)
17.5
(4
.1)
0.8
(0.8
)
Sing
apor
e 14
1 30
.3
(4.1
) 8.
0 (1
.9)
34.3
(3
.1)
12.2
(3
.7)
3.7
(1.7
) 5.
0 (1
.8)
1.3
(0.9
) 5.
0 (1
.2)
Switz
erla
ndg
139
5.2
(1.7
) 29
.9
(3.9
) 32
.7
(3.7
) 3.
1 (1
.4)
7.1
(2.2
) 15
.8
(3.2
) 6.
1 (2
.2)
0.0
(0.0
)
Uni
ted
Stat
es†h
16
9 0.
4 (0
.3)
0.2
(0.2
) 32
.7
(4.9
) 4.
2 (1
.8)
28.6
(3
.3)
22.9
(3
.8)
10.5
(1
.0)
0.5
(0.4
)
Low
er a
nd U
pper
bo
tsw
ana†
a 18
61
.1
(12.
0)
5.6
(5.6
) 11
.1
(7.9
) 5.
6 (5
.6)
0.0
(0.0
) 0.
0 (0
.0)
0.0
(0.0
) 16
.7
(8.8
)
Seco
ndar
y C
hine
se T
aipe
i 36
5 24
.2
(2.0
) 16
.7
(2.2
) 39
.6
(2.4
) 8.
9 (1
.2)
0.0
(0.0
) 6.
7 (1
.4)
2.3
(1.0
) 1.
6 (0
.5)
(to
Gra
de 1
1 G
eorg
iac
74
1.2
(1.7
) 0.
0 (0
.0)
17.5
(3
.9)
20.6
(5
.2)
25.8
(5
.5)
20.9
(5
.4)
12.9
(5
.4)
1.2
(1.2
)an
d ab
ove)
G
erm
any
359
6.7
(2.1
) 19
.6
(2.0
) 3.
7 (1
.3)
29.9
(2
.6)
5.3
(1.5
) 11
.7
(2.0
) 21
.3
(2.6
) 1.
8 (1
.1)
Mal
aysi
a 38
8 25
.9
(1.7
) 16
.0
(1.9
) 36
.3
(2.3
) 7.
0 (1
.3)
6.7
(1.2
) 3.
7 (0
.8)
1.2
(0.5
) 3.
2 (0
.9)
Nor
way
(PPU
& M
aste
r’s)
d 65
1.
6 (1
.6)
11.9
(4
.4)
17.1
(4
.3)
6.3
(2.9
) 10
.4
(3.6
) 24
.3
(5.3
) 27
.2
(4.7
) 1.
1 (1
.1)
Om
an
259
51.3
(3
.0)
9.0
(1.9
) 6.
9 (1
.9)
0.0
(0.0
) 1.
8 (0
.8)
1.1
(0.7
) 0.
0 (0
.0)
29.9
(3
.4)
Pola
nde
127
0.0
(0.0
) 3.
7 (1
.6)
69.2
(4
.1)
0.0
(0.0
) 0.
0 (0
.0)
6.5
(3.0
) 20
.1
(3.8
) 0.
5 (0
.5)
Russ
ian
fede
ratio
nf 2,
119
0.1
(0.1
) 1.
8 (0
.3)
6.7
(1.3
) 12
.5
(0.6
) 42
.4
(1.7
) 4.
5 (0
.6)
30.7
(1
.4)
1.1
(0.2
)
Sing
apor
e 24
9 33
.7
(2.2
) 9.
7 (1
.8)
32.1
(2
.3)
13.2
(1
.9)
4.8
(1.5
) 4.
0 (1
.3)
1.2
(0.7
) 1.
2 (0
.7)
Thai
land
† 65
2 63
.8
(2.0
) 7.
1 (1
.2)
4.3
(0.6
) 3.
8 (0
.7)
2.0
(0.5
) 14
.4
(1.0
) 2.
9 (0
.6)
1.7
(0.5
)
Uni
ted
Stat
esh
430
1.3
(0.7
) 2.
1 (0
.8)
35.4
(2
.8)
5.7
(1.2
) 17
.6
(2.1
) 20
.5
(2.3
) 17
.1
(2.0
) 0.
3 (0
.2)
Not
es:
1. †
Som
e or
all
futu
re t
each
ers
in t
his
cou
ntr
y ar
e be
ing
prep
ared
to
teac
h p
rim
ary
and
low
er-s
econ
dary
stu
den
ts. T
he
prog
ram
-gro
ups
pre
pari
ng
futu
re p
rim
ary
teac
her
s an
d t
he
prog
ram
-gr
oups
pre
pari
ng
low
er-s
econ
dary
tea
cher
s ar
e th
eref
ore
part
ly o
r fu
lly o
verl
appi
ng
(see
TE
DS-
M t
ech
nic
al r
epor
t).
2. W
hen
rea
din
g th
is e
xhib
it, k
eep
in m
ind
the
limit
atio
ns
ann
otat
ed in
Ch
apte
r 4
and
den
oted
in t
he
tabl
e ab
ove
by fo
otn
ote
lett
ers.
3. T
he
shad
ed a
reas
iden
tify
dat
a th
at, f
or r
easo
ns
expl
ain
ed in
th
ese
limit
atio
ns,
can
not
be
com
pare
d w
ith
con
fide
nce
to
data
from
oth
er c
oun
trie
s.

THE TEACHER EDUCATION AND DEVELOPMENT STUDY IN MATHEMATICS (TEDS-M)236
Exh
ibit
A4.
21:
Futu
re p
rim
ary
teac
hers
’ rep
orts
on
the
high
est l
evel
of e
duca
tion
com
plet
ed b
y th
eir
fath
ers,
ste
pfat
hers
, or
mal
e gu
ardi
ans
(est
imat
ed p
erce
nt)
Perc
ent
of
Futu
re P
rim
ary
Teac
hers
in R
esp
on
se C
ateg
ori
es (
wei
ghte
d e
stim
ates
)
P
rog
ram
-Gro
up
Co
untr
y Pr
imar
y Lo
wer
U
pp
er
Post
-Sec
on
dar
y Pr
acti
cal o
r Fi
rst
Deg
ree
Beyo
nd
D
on’
t K
now
Seco
nd
ary
Seco
nd
ary
No
n-T
erti
ary
Vo
cati
on
al
IS
CED
5A
Trai
nin
g
n
Est.
(S
E)
Est.
(S
E)
Est.
(S
E)
Est.
(S
E)
Est.
(S
E)
Est.
(S
E)
Est.
(S
E)
Est.
(S
E)
Low
er P
rimar
y G
eorg
ia
476
0.2
(0.2
) 0.
8 (0
.4)
17.9
(1
.5)
32.3
(2
.1)
35.8
(2
.1)
6.1
(0.7
) 4.
0 (1
.0)
2.9
(0.8
)(t
o G
rade
4
Ger
man
y 91
6 2.
9 (0
.9)
15.9
(1
.6)
3.4
(0.8
) 27
.2
(1.8
) 11
.0
(1.5
) 17
.2
(1.8
) 19
.2
(2.1
) 3.
3 (1
.0)
Max
imum
) Po
land
d 1,
729
0.0
(0.0
) 7.
8 (0
.9)
81.9
(1
.4)
0.0
(0.0
) 0.
0 (0
.0)
3.3
(0.4
) 5.
5 (0
.9)
1.5
(0.3
)
Russ
ian
fede
ratio
ne 2,
220
0.5
(0.2
) 4.
2 (0
.5)
7.2
(1.0
) 19
.6
(1.4
) 42
.6
(1.6
) 5.
0 (0
.8)
17.0
(1
.5)
4.0
(0.6
)
Switz
erla
ndf
119
2.8
(1.7
) 14
.8
(3.0
) 34
.1
(4.7
) 1.
0 (1
.0)
21.4
(5
.0)
7.9
(2.7
) 14
.6
(3.3
) 3.
3 (1
.9)
Prim
ary
Chi
nese
Tai
pei
923
11.5
(1
.0)
14.7
(1
.0)
36.8
(1
.5)
15.3
(1
.2)
0.0
(0.0
) 16
.5
(1.0
) 4.
8 (0
.6)
0.4
(0.2
)
(to
Gra
de 6
Ph
ilipp
ines
58
1 25
.5
(3.0
) 8.
1 (0
.8)
24.1
(2
.8)
10.9
(2
.3)
14.5
(1
.2)
12.5
(1
.6)
2.0
(0.8
) 2.
4 (0
.9)
Max
imum
) Si
ngap
ore
262
19.6
(2
.4)
13.3
(2
.2)
28.6
(2
.5)
13.3
(1
.9)
11.0
(1
.7)
8.9
(1.9
) 2.
3 (0
.9)
3.1
(1.2
)
Spai
n 1,
087
35.9
(2
.4)
15.1
(0
.8)
14.7
(1
.3)
0.0
(0.0
) 15
.4
(1.4
) 6.
1 (1
.0)
9.6
(1.1
) 3.
3 (0
.5)
Switz
erla
ndr
811
3.0
(0.6
) 12
.9
(1.2
) 31
.4
(1.7
) 0.
6 (0
.3)
20.7
(1
.3)
9.6
(1.0
) 20
.1
(1.6
) 1.
7 (0
.5)
Uni
ted
Stat
esg
1,30
2 1.
4 (0
.3)
3.0
(0.6
) 32
.2
(2.0
) 11
.6
(1.1
) 10
.1
(0.9
) 22
.3
(1.7
) 16
.7
(2.4
) 2.
6 (0
.4)
Prim
ary
and
bo
tsw
anaa
83
28.8
(7
.0)
13.5
(3
.8)
4.5
(1.7
) 5.
1 (2
.5)
4.4
(2.2
) 3.
7 (2
.1)
2.4
(1.5
) 37
.6
(5.9
)
Seco
ndar
y G
ener
alist
s C
hile
†b
650
10
.4
(1.3
) 11
.8
(1.6
) 35
.7
(1.9
) 11
.2
(1.1
) 12
.0
(1.3
) 10
.0
(1.0
) 4.
3 (0
.9)
4.6
(0.7
)(t
o G
rade
10
Nor
way
(ALU
)†c
390
1.
3 (0
.5)
9.1
(1.6
) 8.
2 (1
.6)
6.9
(1.4
) 30
.4
(2.6
) 12
.0
(1.6
) 28
.2
(2.1
) 4.
0 (1
.0)
Max
imum
) N
orw
ay (A
LU+)
†c
159
0.6
(0.6
) 13
.9
(2.7
) 8.
7 (2
.1)
10.2
(2
.1)
30.6
(3
.1)
8.2
(2.2
) 23
.1
(2.5
) 4.
7 (1
.5)
Prim
ary
Ger
man
y† 94
4.
5 (4
.3)
19.1
(6
.7)
3.9
(2.1
) 28
.6
(9.3
) 11
.0
(5.1
) 14
.7
(5.4
) 14
.5
(5.2
) 3.
6 (1
.9)
Mat
hem
atic
s M
alay
sia
576
29.3
(1
.8)
14.4
(1
.5)
28.5
(2
.2)
6.9
(1.2
) 9.
2 (1
.1)
7.5
(1.0
) 1.
5 (0
.5)
2.6
(0.6
)Sp
ecia
lists
Po
land
†d
286
0.0
(0.0
) 9.
3 (1
.8)
74.8
(2
.7)
0.0
(0.0
) 0.
0 (0
.0)
4.4
(1.2
) 8.
9 (2
.3)
2.6
(1.0
)
Sing
apor
e 11
7 25
.5
(4.4
) 8.
6 (2
.7)
31.3
(3
.8)
12.2
(2
.5)
4.4
(0.8
) 10
.6
(3.0
) 2.
4 (1
.4)
5.0
(1.6
)
Thai
land
† 65
9 48
.6
(1.9
) 9.
0 (1
.2)
9.8
(1.4
) 6.
0 (0
.9)
1.5
(0.4
) 18
.2
(1.3
) 5.
0 (0
.9)
2.0
(0.6
)
Uni
ted
Stat
es†g
19
0 2.
2 (1
.2)
0.2
(0.2
) 33
.7
(6.6
) 9.
8 (2
.6)
16.9
(1
.6)
17.6
(2
.0)
19.8
(4
.7)
0.0
(0.0
)
Not
es:
1. †
Som
e or
all
futu
re t
each
ers
in t
his
cou
ntr
y ar
e be
ing
prep
ared
to
teac
h p
rim
ary
and
low
er-s
econ
dary
stu
den
ts. T
he
prog
ram
-gro
ups
pre
pari
ng
futu
re p
rim
ary
teac
her
s an
d t
he
prog
ram
-gr
oups
pre
pari
ng
low
er-s
econ
dary
tea
cher
s ar
e th
eref
ore
part
ly o
r fu
lly o
verl
appi
ng
(see
TE
DS-
M t
ech
nic
al r
epor
t).
2. W
hen
rea
din
g th
is e
xhib
it, k
eep
in m
ind
the
limit
atio
ns
ann
otat
ed in
Ch
apte
r 4
and
den
oted
in t
he
tabl
e ab
ove
by fo
otn
ote
lett
ers.
3. T
he
shad
ed a
reas
iden
tify
dat
a th
at, f
or r
easo
ns
expl
ain
ed in
th
ese
limit
atio
ns,
can
not
be
com
pare
d w
ith
con
fide
nce
to
data
from
oth
er c
oun
trie
s.

237APPENDICES
Exh
ibit
A4.
22:
Futu
re lo
wer
-sec
onda
ry te
ache
rs’ r
epor
ts o
n th
e hi
ghes
t lev
el o
f edu
cati
on c
ompl
eted
by
thei
r fa
ther
s, s
tepf
athe
rs, o
r m
ale
guar
dian
s (e
stim
ated
pe
rcen
t)
Perc
ent
of
Futu
re L
ow
er-S
eco
nd
ary
Teac
hers
in R
esp
on
se C
ateg
ori
es (
wei
ghte
d e
stim
ates
)
P
rog
ram
-Gro
up
Co
untr
y Pr
imar
y Lo
wer
U
pp
er
Post
-Sec
on
dar
y Pr
acti
cal o
r Fi
rst
Deg
ree
Beyo
nd
D
on’
t K
now
Se
con
dar
y Se
con
dar
y N
on
-Ter
tiar
y V
oca
tio
nal
ISC
ED 5
A
Trai
nin
g
n
Est.
(S
E)
Est.
(S
E)
Est.
(S
E)
Est.
(S
E)
Est.
(S
E)
Est.
(S
E)
Est.
(S
E)
Est.
(S
E)
Low
er S
econ
dary
bo
tsw
anaa
34
38.3
(6
.6)
20.6
(5
.1)
8.9
(5.1
) 3.
0 (3
.0)
8.9
(5.1
) 3.
0 (3
.0)
2.9
(2.9
) 14
.6
(6.5
)(t
o G
rade
10
Chi
le†b
74
0 11
.4
(1.3
) 11
.4
(1.3
) 36
.5
(1.4
) 11
.5
(0.9
) 8.
7 (1
.1)
11.7
(1
.2)
4.8
(0.8
) 4.
0 (0
.7)
Max
imum
) G
erm
any†
395
7.7
(3.3
) 23
.3
(3.6
) 2.
0 (0
.6)
19.2
(4
.2)
12.9
(3
.5)
13.4
(2
.5)
19.4
(3
.6)
2.0
(0.9
)
Nor
way
(ALU
)†d
354
1.1
(0.4
) 8.
5 (1
.5)
9.7
(1.9
) 9.
5 (1
.4)
26.3
(2
.1)
11.4
(1
.6)
30.5
(2
.5)
3.1
(1.0
)
Nor
way
(ALU
+)†d
14
9 5.
2 (1
.6)
9.0
(2.5
) 13
.3
(2.9
) 4.
3 (1
.7)
26.2
(3
.6)
6.8
(1.6
) 32
.8
(4.3
) 2.
5 (1
.2)
Phili
ppin
es
728
22.9
(2
.9)
6.4
(1.0
) 25
.5
(4.0
) 11
.3
(1.0
) 14
.8
(1.8
) 15
.1
(1.7
) 2.
2 (0
.6)
1.7
(0.7
)
Pola
nd†e
15
3 0.
0 (0
.0)
3.6
(1.1
) 83
.1
(4.0
) 0.
0 (0
.0)
0.0
(0.0
) 3.
7 (1
.6)
7.1
(2.7
) 2.
6 (1
.5)
Sing
apor
e 14
1 19
.7
(2.8
) 18
.1
(3.0
) 31
.1
(3.4
) 9.
9 (2
.5)
6.5
(2.2
) 7.
2 (1
.7)
2.1
(1.2
) 5.
3 (1
.8)
Switz
erla
ndg
141
5.4
(1.7
) 18
.7
(2.4
) 23
.6
(3.3
) 0.
9 (0
.7)
22.2
(3
.3)
9.8
(2.8
) 18
.8
(2.9
) 0.
6 (0
.6)
Uni
ted
Stat
es†h
16
9 0.
8 (0
.6)
0.2
(0.3
) 30
.4
(3.7
) 4.
4 (2
.2)
13.1
(2
.2)
28.9
(3
.8)
21.0
(3
.7)
1.3
(0.9
)
Low
er a
nd U
pper
bo
tsw
ana†h
17
47
.1
(13.
3)
11.8
(8
.4)
5.9
(5.9
) 0.
0 (0
.0)
0.0
(0.0
) 0.
0 (0
.0)
5.9
(5.9
) 29
.4
(9.6
)
Seco
ndar
y C
hine
se T
aipe
i 36
5 16
.3
(2.3
) 16
.6
(1.7
) 31
.2
(3.0
) 17
.2
(2.1
) 0.
0 (0
.0)
14.2
(2
.0)
3.6
(0.9
) 0.
8 (0
.5)
(to
Gra
de 1
1 G
eorg
iac
75
0.0
(0.0
) 0.
0 (0
.0)
16.4
(3
.8)
24.7
(5
.0)
23.6
(5
.1)
24.3
(5
.1)
9.9
(3.4
) 1.
2 (1
.2)
and
abov
e)
Ger
man
y 35
7 3.
3 (1
.5)
13.0
(2
.5)
3.3
(1.2
) 19
.4
(2.9
) 9.
2 (1
.9)
21.3
(2
.6)
28.8
(1
.8)
1.6
(1.0
)
Mal
aysi
a 38
6 19
.0
(2.1
) 15
.3
(2.1
) 36
.7
(3.3
) 5.
7 (1
.1)
8.9
(1.3
) 6.
4 (1
.3)
3.6
(0.9
) 4.
4 (0
.9)
Nor
way
(PPU
& M
aste
r’s)
d 65
4.
6 (2
.5)
6.0
(3.1
) 10
.7
(4.0
) 8.
7 (4
.8)
23.9
(5
.1)
18.3
(4
.3)
27.8
(6
.0)
0.0
(0.0
)
Om
an
260
34.1
(3
.4)
17.0
(2
.9)
12.7
(2
.1)
2.4
(1.0
) 5.
1 (1
.3)
3.9
(1.5
) 2.
4 (0
.8)
22.2
(2
.7)
Pola
nde
137
0.0
(0.0
) 7.
9 (2
.0)
73.4
(4
.0)
0.0
(0.0
) 0.
0 (0
.0)
6.4
(2.6
) 9.
8 (3
.1)
2.6
(1.5
)
Russ
ian
fede
ratio
nf 2,
112
0.3
(0.2
) 2.
7 (0
.5)
8.3
(1.2
) 17
.6
(1.2
) 39
.9
(1.6
) 3.
9 (0
.4)
21.5
(1
.1)
5.9
(0.7
)
Sing
apor
e 25
0 24
.0
(2.2
) 15
.2
(2.3
) 28
.4
(2.9
) 13
.6
(1.9
) 6.
4 (1
.4)
5.6
(1.6
) 4.
4 (1
.2)
2.4
(1.1
)
Thai
land
† 65
2 52
.9
(2.1
) 8.
4 (1
.0)
8.8
(1.3
) 3.
6 (0
.7)
0.9
(0.4
) 17
.8
(1.6
) 5.
5 (0
.8)
2.1
(0.5
)
Uni
ted
Stat
esh
430
1.1
(0.7
) 2.
9 (1
.1)
27.0
(2
.4)
9.4
(1.7
) 10
.8
(1.3
) 23
.6
(2.4
) 24
.8
(3.1
) 0.
5 (0
.3)
Not
es:
1. †
Som
e or
all
futu
re t
each
ers
in t
his
cou
ntr
y ar
e be
ing
prep
ared
to
teac
h p
rim
ary
and
low
er-s
econ
dary
stu
den
ts. T
he
prog
ram
-gro
ups
pre
pari
ng
futu
re p
rim
ary
teac
her
s an
d t
he
prog
ram
-gr
oups
pre
pari
ng
low
er-s
econ
dary
tea
cher
s ar
e th
eref
ore
part
ly o
r fu
lly o
verl
appi
ng
(see
TE
DS-
M t
ech
nic
al r
epor
t).
2. W
hen
rea
din
g th
is e
xhib
it, k
eep
in m
ind
the
limit
atio
ns
ann
otat
ed in
Ch
apte
r 4
and
den
oted
in t
he
tabl
e ab
ove
by fo
otn
ote
lett
ers.
3. T
he
shad
ed a
reas
iden
tify
dat
a th
at, f
or r
easo
ns
expl
ain
ed in
th
ese
limit
atio
ns,
can
not
be
com
pare
d w
ith
con
fide
nce
to
data
from
oth
er c
oun
trie
s.

THE TEACHER EDUCATION AND DEVELOPMENT STUDY IN MATHEMATICS (TEDS-M)238
Exh
ibit
A4.
23: F
utur
e pr
imar
y te
ache
rs s
elec
ting
sig
nific
ant o
r m
ajor
rea
sons
for
beco
min
g a
teac
her
(est
imat
ed p
erce
nt)
Pr
og
ram
-Gro
up
Co
untr
y G
oo
d S
tud
ent
A
vaila
ble
Lo
ve
Tale
nt
Teac
hin
g
Like
Wor
king
with
Te
ache
r Sa
lari
es
Nex
t G
ener
atio
n
Cha
llen
gin
g J
ob
Lo
ng
-Ter
m
Po
siti
on
s
Mat
hem
atic
s
Youn
g P
eop
le
Se
curi
ty
n
Est.
(S
E)
n
Est.
(S
E)
n
Est.
(S
E)
n
Est.
(S
E)
n
Est.
(S
E)
n
Est.
(S
E)
n
Est.
(S
E)
n
Est.
(S
E)
n
Est.
(S
E)
Low
er P
rimar
y G
eorg
ia
231
37.6
(4
.0)
205
36.4
(3
.7)
202
42.6
(3
.2)
206
48.1
(3
.8)
219
60.1
(3
.3)
191
28.3
(3
.5)
200
53.0
(3
.5)
241
64.7
(3
.9)
206
56.9
(2
.9)
(to
Gra
de 4
G
erm
any
875
34.8
(2
.3)
871
24.0
(2
.0)
866
32.8
(2
.0)
870
89.1
(1
.6)
868
94.3
(1
.1)
871
35.2
(2
.3)
870
75.4
(1
.8)
873
90.9
(1
.2)
873
54.2
(1
.9)
Max
imum
) Po
land
d 1,
740
15.5
(0
.9)
1,73
3 8.
0 (0
.7)
1,71
7 5.
1 (0
.9)
1,72
1 53
.4
(1.5
) 1,
737
79.9
(1
.1)
1,70
4 3.
5 (0
.5)
1,71
8 46
.7
(1.8
) 1,
717
54.9
(1
.6)
1,71
8 41
.7
(1.3
)
Ru
ssia
n fe
dera
tione
2,17
5 30
.5
(1.8
) 2,
142
37.1
(2
.0)
2,15
2 31
.2
(2.6
) 2,
149
59.0
(2
.0)
2,19
2 90
.9
(1.2
) 2,
134
4.6
(0.7
) 2,
146
63.9
(2
.0)
2,14
7 42
.0
(2.5
) 2,
148
42.6
(2
.0)
Sw
itzer
land
f 11
3 24
.8
(3.9
) 11
2 12
.6
(2.0
) 11
4 16
.3
(3.8
) 11
3 93
.2
(2.5
) 11
4 10
0.0
(0.0
) 11
2 36
.6
(4.7
) 11
2 80
.0
(4.2
) 11
1 98
.1
(1.4
) 11
1 52
.8
(3.7
)
Prim
ary
Chi
nese
Tai
pei
921
11.3
(0
.8)
922
6.5
(0.7
) 92
1 13
.6
(1.0
) 92
2 47
.1
(1.3
) 92
1 59
.8
(1.8
) 92
2 57
.1
(1.5
) 92
1 60
.1
(1.4
) 92
1 54
.4
(1.7
) 92
0 75
.4
(1.4
)
(to
Gra
de 6
Ph
ilipp
ines
50
5 60
.2
(3.7
) 50
1 63
.4
(4.0
) 50
1 70
.2
(5.2
) 49
1 77
.9
(1.7
) 48
8 84
.0
(2.1
) 48
4 29
.9
(5.5
) 47
3 83
.5
(1.2
) 47
3 85
.3
(1.5
) 46
8 79
.6
(1.2
)M
axim
um)
Sing
apor
e 26
3 32
.4
(3.2
) 26
2 25
.6
(3.0
) 26
1 53
.4
(3.4
) 26
2 76
.4
(2.8
) 26
1 88
.2
(1.6
) 26
2 31
.7
(3.2
) 26
3 85
.6
(2.1
) 26
0 77
.3
(2.6
) 26
2 53
.2
(4.0
)
Sp
ain
1,06
7 26
.9
(1.9
) 1,
059
35.4
(2
.4)
1,06
4 22
.0
(1.1
) 1,
065
84.9
(1
.7)
1,06
9 86
.3
(1.4
) 1,
059
36.5
(2
.1)
1,06
3 87
.4
(1.4
) 1,
056
73.8
(1
.5)
1,06
2 55
.3
(2.7
)
Sw
itzer
land
r 81
0 34
.9
(2.0
) 80
7 23
.2
(1.2
) 81
1 29
.7
(1.8
) 80
7 90
.5
(1.1
) 80
6 99
.1
(0.3
) 80
7 38
.7
(1.3
) 80
6 79
.1
(1.3
) 80
7 94
.4
(0.7
) 80
6 55
.8
(1.9
))
U
nite
d St
ates
g 1,
031
35.4
(2
.5)
1,02
9 19
.9
(1.7
) 1,
019
22.3
(1
.9)
1,03
0 90
.9
(1.4
) 1,
024
97.5
(0
.6)
1,02
6 7.
7 (1
.3)
1,02
9 94
.7
(0.9
) 1,
026
77.9
(1
.8)
1,02
7 52
.3
(2.4
)
Prim
ary
and
Seco
ndar
y bo
tsw
anaa
46
50.9
(8
.2)
38
39.6
(7
.2)
44
88.4
(4
.3)
43
71.6
(6
.1)
42
75.8
(7
.4)
37
16.0
(7
.1)
35
82.5
(6
.5)
36
63.2
(7
.7)
33
50.4
(8
.6)
Gen
eral
ists
C
hile
†b
607
34.9
(1
.7)
601
41.8
(2
.1)
596
25.9
(1
.4)
607
92.0
(1
.3)
603
85.6
(1
.4)
586
9.0
(1.3
) 59
5 88
.8
(1.5
) 59
3 90
.5
(1.3
) 58
9 44
.5
(1.5
)
(to
Gra
de 6
N
orw
ay (A
LU)†c
38
6 32
.3
(2.9
) 38
6 45
.4
(2.4
) 38
7 33
.1
(2.2
) 38
8 86
.3
(1.6
) 38
7 97
.9
(0.8
) 38
6 4.
5 (1
.4)
384
71.3
(1
.8)
155
91.7
(1
.1)
387
40.3
(2
.6)
Max
imum
) N
orw
ay (A
LU+)
†c
157
28.9
(3
.5)
156
39.9
(3
.9)
157
77.2
(3
.6)
156
87.7
(2
.8)
155
96.7
(1
.5)
155
6.0
(1.9
) 15
5 66
.9
(3.6
) 38
6 90
.1
(2.5
) 15
4 30
.1
(3.8
)
Prim
ary
Ger
man
y† 91
51
.5
(8.7
) 91
26
.9
(7.0
) 90
73
.6
(8.4
) 91
88
.2
(5.3
) 92
98
.2
(1.5
) 90
29
.5
(8.0
) 91
81
.3
(6.3
) 91
88
.7
(5.4
) 91
42
.2
(7.4
)
Mat
hem
atic
s M
alay
sia
563
49.8
(2
.1)
563
70.3
(2
.4)
564
90.5
(1
.2)
563
79.1
(1
.6)
561
76.0
(1
.6)
560
45.3
(2
.1)
560
84.5
(1
.6)
562
84.4
(1
.8)
561
74.3
(1
.6)
Spec
ialis
ts
Pola
nd†d
29
3 30
.8
(3.7
) 29
4 6.
9 (1
.6)
295
67.2
(3
.1)
294
49.7
(3
.8)
293
68.2
(3
.8)
293
4.5
(1.2
) 29
0 34
.5
(3.5
) 29
3 49
.1
(3.9
) 29
2 40
.4
(4.4
)
Si
ngap
ore
117
33.4
(4
.5)
117
21.1
(4
.4)
117
72.0
(3
.6)
117
79.8
(4
.2)
116
90.7
(2
.8)
117
24.5
(4
.0)
117
89.9
(2
.9)
116
73.2
(3
.5)
117
48.3
(5
.0)
Th
aila
nd†
651
38.7
(2
.0)
653
64.9
(1
.8)
650
87.9
(1
.4)
653
61.7
(1
.7)
648
59.6
(1
.7)
651
24.1
(1
.5)
648
82.7
(1
.2)
648
77.0
(1
.5)
651
90.2
(1
.3)
U
nite
d St
ates
†g
148
41.4
(8
.8)
149
28.1
(5
.9)
149
30.8
(6
.8)
149
88.6
(1
.7)
149
95.2
(2
.2)
149
7.2
(3.4
) 14
9 91
.9
(4.8
) 14
8 81
.4
(5.8
) 14
9 58
.8
(6.4
)
Not
es:
1. †
Som
e or
all
futu
re t
each
ers
in t
his
cou
ntr
y ar
e be
ing
prep
ared
to
teac
h p
rim
ary
and
low
er-s
econ
dary
stu
den
ts. T
he
prog
ram
-gro
ups
pre
pari
ng
futu
re p
rim
ary
teac
her
s an
d t
he
prog
ram
-gr
oups
pre
pari
ng
low
er-s
econ
dary
tea
cher
s ar
e th
eref
ore
part
ly o
r fu
lly o
verl
appi
ng
(see
TE
DS-
M t
ech
nic
al r
epor
t).
2. W
hen
rea
din
g th
is e
xhib
it, k
eep
in m
ind
the
limit
atio
ns
ann
otat
ed in
Ch
apte
r 4
and
den
oted
in t
he
tabl
e ab
ove
by fo
otn
ote
lett
ers.
3. T
he
shad
ed a
reas
iden
tify
dat
a th
at, f
or r
easo
ns
expl
ain
ed in
th
ese
limit
atio
ns,
can
not
be
com
pare
d w
ith
con
fide
nce
to
data
from
oth
er c
oun
trie
s.
Pe
rcen
t o
f Fu
ture
Lo
wer
-Sec
on
dar
y Te
ache
rs in
Res
po
nse
Cat
ego
ries
(w
eigh
ted
est
imat
es)

239APPENDICES
Exh
ibit
A4.
24: F
utur
e lo
wer
-sec
onda
ry te
ache
rs s
elec
ting
sig
nific
ant o
r m
ajor
rea
sons
for
beco
min
g a
teac
her
(est
imat
ed p
erce
nt)
Pr
og
ram
-Gro
up
Co
untr
y G
oo
d S
tud
ent
A
vaila
ble
Lo
ve
Tale
nt
Teac
hin
g
Like
Wor
king
with
Te
ache
r Sa
lari
es
Nex
t G
ener
atio
n
Cha
llen
gin
g J
ob
Lo
ng
-Ter
m
Po
siti
on
s
Mat
hem
atic
s
Youn
g P
eop
le
Se
curi
ty
n
Est.
(S
E)
n
Est.
(S
E)
n
Est.
(S
E)
n
Est.
(S
E)
n
Est.
(S
E)
n
Est.
(S
E)
n
Est.
(S
E)
n
Est.
(S
E)
n
Est.
(S
E)
Low
er S
econ
dary
bo
tsw
anaa
15
40.0
(15.
4)
15
26.2
(11
.9)
18 1
00.0
(0
.0)
15
60.2
(15.
4)
14
85.9
(9
.0)
14
7.0
(6.8
) 14
78
.5 (
12.5
) 14
71
.5 (
13.1
) 14
29
.1 (1
3.4)
(to
Gra
de 1
0 C
hile
† b 67
5 34
.1
(2.1
) 67
2 36
.5
(1.9
) 65
6 27
.6
(1.7
) 68
0 93
.7
(1.0
) 66
1 88
.3
(1.1
) 65
3 8.
1 (1
.1)
665
87.1
(1
.1)
657
88.6
(1
.2)
630
40.8
(2
.2)
Max
imum
) G
erm
any†
404
44.1
(5
.0)
404
33.9
(4
.2)
405
76.9
(2
.1)
404
85.8
(3
.7)
406
97.8
(0
.9)
406
41.3
(5
.6)
406
71.7
(4
.2)
403
88.3
(4
.0)
404
53.8
(5
.4)
N
orw
ay (A
LU)†d
35
1 28
.2
(2.6
) 35
1 45
.8
(2.5
) 34
9 32
.9
(2.6
) 34
8 87
.8
(1.9
) 34
9 95
.8
(1.0
) 34
7 4.
8 (1
.1)
345
73.2
(2
.4)
345
92.9
(1
.1)
344
46.6
(2
.2)
N
orw
ay (A
LU+)
†d
149
28.8
(3
.6)
149
33.7
(3
.9)
149
79.7
(4
.1)
149
87.6
(2
.1)
148
95.6
(1
.7)
148
4.9
(1.7
) 14
9 64
.9
(4.2
) 14
7 89
.3
(2.7
) 14
9 33
.8
(3.0
)
Ph
ilipp
ines
63
7 58
.4
(1.7
) 62
1 55
.8
(2.8
) 62
9 81
.5
(3.1
) 61
8 75
.8
(3.6
) 60
5 69
.0
(2.1
) 60
5 25
.5
(2.4
) 60
3 84
.6
(1.9
) 59
9 82
.8
(2.8
) 59
2 69
.9
(3.0
)
Po
land
†e
157
32.0
(4
.3)
157
5.7
(1.8
) 15
7 57
.0
(3.4
) 15
7 47
.3
(4.6
) 15
7 67
.1
(4.7
) 15
6 1.
5 (1
.0)
156
28.5
(3
.4)
156
51.1
(4
.0)
157
33.1
(3
.4)
Si
ngap
ore
138
35.0
(4
.3)
139
21.9
(4
.1)
139
51.7
(3
.9)
139
69.8
(4
.4)
140
84.9
(2
.9)
139
30.4
(4
.2)
139
80.7
(2
.6)
138
62.7
(3
.5)
139
35.3
(3
.7)
Sw
itzer
land
g 14
0 34
.9
(3.8
) 14
0 36
.6
(3.8
) 14
0 76
.0
(3.8
) 14
0 90
.8
(2.3
) 14
0 95
.9
(1.7
) 14
0 48
.7
(3.7
) 13
8 73
.3
(3.7
) 14
0 88
.0
(3.5
) 14
0 59
.6
(4.6
)
U
nite
d St
ates
†h
131
35.5
(5
.5)
131
39.6
(6
.7)
129
38.5
(4
.4)
131
89.2
(1
.1)
129
96.8
(1
.0)
131
6.4
(1.0
) 13
0 94
.1
(1.1
) 13
1 77
.1
(3.5
) 13
0 59
.1
(5.6
)
Low
er a
nd U
pper
bo
tsw
ana†h
5
80.0
(20.
7)
5 40
.0 (
23.7
) 6
100.
0 (0
.0)
5 10
0.0
(0.0
) 5
100.
0 (0
.0)
5 0.
0 (0
.0)
5 10
0.0
(0.0
) 5
100.
0 (0
.0)
5 20
.0 (2
0.7)
Seco
ndar
y C
hine
se T
aipe
i 36
5 12
.0
(1.5
) 36
4 9.
6 (1
.8)
364
72.6
(2
.2)
365
57.6
(2
.7)
364
64.1
(2
.1)
364
46.8
(2
.4)
364
63.5
(2
.8)
364
59.5
(2
.7)
364
68.7
(2
.4)
(to
Gra
de 1
1 an
d G
eorg
iac
40
54.7
(8
.6)
41
37.0
(6
.5)
49
61.0
(5
.9)
41
47.2
(7
.7)
40
52.9
(7
.2)
36
36.2
(6
.9)
35
46.8
(10
.0)
36
55.0
(9
.1)
35
53.2
(8
.8)
abov
e)
Ger
man
y 35
7 47
.4
(3.2
) 36
1 47
.8
(3.6
) 35
9 85
.0
(2.2
) 36
1 87
.6
(1.9
) 36
0 92
.8
(1.6
) 35
9 34
.5
(3.3
) 36
1 57
.4
(3.6
) 36
0 79
.2
(2.4
) 36
0 57
.2
(4.0
)
M
alay
sia
383
50.3
(2
.3)
382
64.6
(1
.8)
382
87.4
(1
.4)
382
70.2
(2
.3)
380
60.1
(2
.3)
380
36.1
(2
.2)
380
72.9
(2
.5)
380
77.8
(2
.4)
380
65.3
(2
.2)
N
orw
ay (P
PU &
Mas
ter’
s)d
64
28.4
(5
.6)
64
33.5
(7
.8)
64
95.5
(2
.5)
64
81.3
(5
.0)
65
87.6
(4
.9)
64
3.9
(2.8
) 64
58
.7
(7.8
) 64
91
.1
(3.5
) 64
28
.3
(5.5
)
O
man
23
6 73
.4
(2.8
) 23
0 48
.2
(3.8
) 23
7 90
.0
(2.0
) 22
4 79
.3
(3.2
) 22
2 35
.8
(3.1
) 22
1 31
.6
(3.2
) 21
9 86
.1
(2.0
) 21
7 71
.1
(2.8
) 22
0 54
.7
(3.0
)
Po
land
e 13
7 40
.3
(3.5
) 13
6 6.
2 (2
.5)
136
64.7
(5
.4)
136
49.1
(6
.3)
133
72.1
(4
.7)
134
5.4
(4.8
) 13
4 32
.7
(4.9
) 13
3 55
.0
(4.6
) 13
4 45
.6
(5.1
)
Ru
ssia
n fe
dera
tionf
2,09
7 32
.7
(1.3
) 2,
068
23.4
(1
.6)
2,10
4 77
.7
(2.0
) 2,
054
40.3
(1
.5)
2,08
1 66
.3
(1.6
) 2,
057
4.2
(0.7
) 2,
055
45.2
(1
.7)
2,05
3 27
.2
(1.8
) 2,
069
29.0
(1
.6)
Si
ngap
ore
249
43.4
(2
.8)
248
18.6
(2
.3)
249
74.3
(3
.3)
249
73.5
(2
.6)
247
83.8
(1
.9)
249
27.3
(3
.0)
249
78.7
(2
.4)
249
69.5
(3
.1)
249
37.8
(2
.3)
Th
aila
nd†
646
36.6
(2
.1)
647
67.1
(1
.8)
647
85.2
(1
.3)
642
60.9
(2
.2)
644
59.3
(1
.7)
640
25.4
(1
.5)
644
84.7
(1
.4)
642
80.0
(1
.6)
644
88.6
(1
.1)
U
nite
d St
ates
h
363
45.9
(4
.1)
365
31.4
(3
.3)
363
85.8
(3
.1)
366
90.6
(2
.5)
364
92.9
(2
.1)
364
6.7
(1.5
) 36
3 90
.1
(1.2
) 36
3 75
.2
(2.0
) 36
3 51
.1
(2.3
)
Not
es:
1. †
Som
e or
all
futu
re t
each
ers
in t
his
cou
ntr
y ar
e be
ing
prep
ared
to
teac
h p
rim
ary
and
low
er-s
econ
dary
stu
den
ts. T
he
prog
ram
-gro
ups
pre
pari
ng
futu
re p
rim
ary
teac
her
s an
d t
he
prog
ram
-gr
oups
pre
pari
ng
low
er-s
econ
dary
tea
cher
s ar
e th
eref
ore
part
ly o
r fu
lly o
verl
appi
ng
(see
TE
DS-
M t
ech
nic
al r
epor
t).
2. W
hen
rea
din
g th
is e
xhib
it, k
eep
in m
ind
the
limit
atio
ns
ann
otat
ed in
Ch
apte
r 4
and
den
oted
in t
he
tabl
e ab
ove
by fo
otn
ote
lett
ers.
3. T
he
shad
ed a
reas
iden
tify
dat
a th
at, f
or r
easo
ns
expl
ain
ed in
th
ese
limit
atio
ns,
can
not
be
com
pare
d w
ith
con
fide
nce
to
data
from
oth
er c
oun
trie
s.
Pe
rcen
t o
f Fu
ture
Lo
wer
-Sec
on
dar
y Te
ache
rs in
Res
po
nse
Cat
ego
ries
(w
eigh
ted
est
imat
es)

THE TEACHER EDUCATION AND DEVELOPMENT STUDY IN MATHEMATICS (TEDS-M)240
A3:
CH
APT
ER 6
Ex
HIB
ITS
Exh
ibit
A6.
1: M
athe
mat
ics
is a
set
of r
ule
s an
d pr
oced
ure
s: fu
ture
pri
mar
y te
ache
rs’ e
ndor
sem
ent o
f thi
s st
atem
ent
5
6 7
8 9
10
11
12
13
14
15
16
Sam
ple
Siz
eV
alid
Dat
a (N
)Pe
rcen
t M
issi
ng
(Wei
ghte
d)
Scal
ed S
core
:
Mea
n(S
E)
Pro
gra
m-G
roup
Co
untr
y
Not
es:
1. T
his
tab
le a
nd
char
t m
ust
be
read
wit
h a
war
enes
s of
th
e lim
itat
ion
s an
not
ated
in C
hap
ter
6.2.
Th
e da
gger
sym
bol (
†) is
use
d t
o al
ert
read
ers
to s
itu
atio
ns
wh
ere
data
wer
e av
aila
ble
f
rom
few
er t
han
85%
of
resp
onde
nts
.3.
Th
e sh
aded
are
as id
enti
fy d
ata
that
, for
rea
son
s ex
plai
ned
in t
he
limit
atio
ns,
can
not
be
com
pare
d w
ith
co
nfi
den
ce t
o da
ta fr
om o
ther
cou
ntr
ies.
Mat
hem
atic
s as
a S
et o
f R
ules
an
d P
roce
dur
es
Mea
n an
d C
onfid
ence
Inte
rval
(± 2
SE)
Perc
entil
es
5th
25th
75
th
95th
Gro
up 1
.Lo
wer
Prim
ary
(to
Gra
de 4
M
axim
um)
Gro
up 2
.Pr
imar
y(t
o G
rade
6
Max
imum
)
Gro
up 4
.Pr
imar
y M
athe
mat
ics
Spec
ialis
ts
Geo
rgia
506
490
3.1
11.0
0 (0
.09)
Ger
man
y 93
5 88
6 3.
1 10
.09
(0.0
6)
Pola
nd a
1,81
2 1,
775
2.5
11.0
7 (0
.04)
Russ
ian
fede
ratio
n b
2,26
6 2,
215
1.9
10.7
5 (0
.05)
Switz
erla
nd c
121
119
2.0
10.1
0 (0
.06)
Chi
nese
Tai
pei
923
923
0.0
10.7
5 (0
.04)
Phili
ppin
es
592
589
0.9
12.6
4 (0
.13)
Sing
apor
e 26
3 26
1 0.
8 11
.06
(0.0
7)
Spai
n
1,09
3 1,
086
0.7
10.7
5 (0
.05)
Switz
erla
nd
815
812
0.4
9.98
(0
.02)
Uni
ted
Stat
es †d
1,
310
1,00
5 24
.1
11.0
2 (0
.08)
bots
wan
ae 86
86
0.
0 11
.96
(0.1
5)
Chi
le f
657
634
3.5
10.8
8 (0
.04)
Nor
way
(ALU
) g 39
2 38
7 1.
6 10
.27
(0.0
4)
Nor
way
(ALU
+) g
159
156
1.6
9.93
(0
.07)
Ger
man
y 97
97
0.
0 9.
69
(0.1
0)
Mal
aysi
a
576
562
2.4
11.7
4 (0
.07)
Pola
nd a
300
298
0.7
10.3
2 (0
.11)
Sing
apor
e 11
7 11
6 0.
9 11
.02
(0.1
0)
Thai
land
66
0 65
3 1.
1 11
.86
(0.0
5)
Uni
ted
Stat
es †d
19
1 14
4 25
.6
11.0
1 (0
.14)
Gro
up 3
.Pr
imar
y an
d Se
cond
ary
Gen
eral
ists
(to
Gra
de 1
0 M
axim
um)

241APPENDICES
Exh
ibit
A6.
2: M
athe
mat
ics
is a
pro
cess
of e
nqu
iry:
futu
re p
rim
ary
teac
hers
’ end
orse
men
t of t
his
stat
emen
t
6
7 8
9 10
11
12
13
14
15
16
Sam
ple
Siz
eV
alid
Dat
a (N
)Pe
rcen
t M
issi
ng
(Wei
ghte
d)
Scal
ed S
core
:
Mea
n(S
E)
Pro
gra
m-G
roup
Co
untr
y
Not
es:
1. T
his
tab
le a
nd
char
t m
ust
be
read
wit
h a
war
enes
s of
th
e lim
itat
ion
s an
not
ated
in C
hap
ter
6.2.
Th
e da
gger
sym
bol (
†) is
use
d to
ale
rt r
eade
rs t
o si
tuat
ion
s w
her
e da
ta w
ere
avai
labl
e
fro
m fe
wer
th
an 8
5% o
f re
spon
den
ts.
3. T
he
shad
ed a
reas
iden
tify
dat
a th
at, f
or r
easo
ns
expl
ain
ed in
th
e lim
itat
ion
s, c
ann
ot b
e co
mpa
red
wit
h
con
fide
nce
to
data
from
oth
er c
oun
trie
s.
Geo
rgia
506
480
5.1
10.2
5 (0
.07)
Ger
man
y 93
5 88
6 3.
1 11
.09
(0.0
6)
Pola
nd a
1,81
2 1,
770
3.1
11.0
3 (0
.05)
Russ
ian
fede
ratio
n b
2,26
6 2,
211
2.1
11.2
0 (0
.07)
Switz
erla
nd c
121
119
2.0
11.2
5 (0
.10)
Chi
nese
Tai
pei
923
923
0.0
11.9
4 (0
.04)
Phili
ppin
es
592
587
1.0
13.2
5 (0
.18)
Sing
apor
e 26
3 26
1 0.
8 11
.86
(0.0
8)
Spai
n
1,09
3 1,
086
0.7
11.9
1 (0
.07)
Switz
erla
nd
815
812
0.4
11.3
3 (0
.04)
Uni
ted
Stat
es †d
1,
310
1,00
5 24
.1
12.1
2 (0
.06)
bots
wan
ae 86
85
1.
0 13
.09
(0.1
9)
Chi
le f
657
635
3.3
12.4
3 (0
.05)
Nor
way
(ALU
) g 39
2 38
7 1.
6 11
.66
(0.0
8)
Nor
way
(ALU
+) g
159
156
1.6
12.3
7 (0
.11)
Ger
man
y 97
97
0.
0 12
.16
(0.2
9)
Mal
aysi
a
576
562
2.4
12.6
3 (0
.09)
Pola
nd a
300
297
1.0
12.0
7 (0
.10)
Sing
apor
e 11
7 11
6 0.
9 12
.28
(0.1
3)
Thai
land
66
0 65
3 1.
1 12
.48
(0.0
6)
Uni
ted
Stat
es †d
19
1 14
4 25
.6
12.5
5 (0
.14)
Mat
hem
atic
s as
a P
roce
ss o
f En
qui
ry
Mea
n an
d C
onfid
ence
Inte
rval
(± 2
SE)
Perc
entil
es
5th
25th
75
th
95th
Gro
up 1
.Lo
wer
Prim
ary
(to
Gra
de 4
M
axim
um)
Gro
up 2
.Pr
imar
y(t
o G
rade
6
Max
imum
)
Gro
up 4
.Pr
imar
y M
athe
mat
ics
Spec
ialis
ts
Gro
up 3
.Pr
imar
y an
d Se
cond
ary
Gen
eral
ists
(to
Gra
de 1
0 M
axim
um)

THE TEACHER EDUCATION AND DEVELOPMENT STUDY IN MATHEMATICS (TEDS-M)242
Exh
ibit
A6.
3: L
earn
mat
hem
atic
s th
rou
gh t
each
er d
irec
tion
: fut
ure
prim
ary
teac
hers
’ end
orse
men
t of t
his
stat
emen
t
6
7 8
9 10
11
12
13
14
15
16
Sam
ple
Siz
eV
alid
Dat
a (N
)Pe
rcen
t M
issi
ng
(Wei
ghte
d)
Scal
ed S
core
:
Mea
n(S
E)
Pro
gra
m-G
roup
Co
untr
y
Not
es:
1. T
his
tab
le a
nd
char
t m
ust
be
read
wit
h a
war
enes
s of
th
e lim
itat
ion
s an
not
ated
in C
hap
ter
6.2.
Th
e da
gger
sym
bol (
†) is
use
d to
ale
rt r
eade
rs t
o si
tuat
ion
s w
her
e da
ta w
ere
avai
labl
e
fro
m fe
wer
th
an 8
5% o
f re
spon
den
ts.
3. T
he
shad
ed a
reas
iden
tify
dat
a th
at, f
or r
easo
ns
expl
ain
ed in
th
e lim
itat
ion
s, c
ann
ot b
e co
mpa
red
wit
h
con
fide
nce
to
data
from
oth
er c
oun
trie
s.
Geo
rgia
506
486
3.7
10.1
9 (0
.04)
Ger
man
y 93
5 88
5 3.
3 8.
98
(0.0
4)
Pola
nd a
1,81
2 1,
775
2.8
9.61
(0
.02)
Russ
ian
fede
ratio
n b
2,26
6 2,
219
1.7
9.65
(0
.04)
Switz
erla
nd c
121
119
2.0
8.72
(0
.06)
Chi
nese
Tai
pei
923
923
0.0
9.12
(0
.03)
Phili
ppin
es
592
586
1.4
10.5
7 (0
.13)
Sing
apor
e 26
3 26
1 0.
8 9.
36
(0.0
5)
Spai
n
1,09
3 1,
086
0.6
9.18
(0
.03)
Switz
erla
nd
815
811
0.5
8.82
(0
.02)
Uni
ted
Stat
es †d
1,
310
1,00
5 24
.1
9.10
(0
.05)
bots
wan
ae 86
84
2.
2 9.
54
(0.0
8)
Chi
le f
657
635
3.4
9.60
(0
.03)
Nor
way
(ALU
) g 39
2 38
8 1.
1 8.
90
(0.0
5)
Nor
way
(ALU
+) g
159
156
1.6
8.63
(0
.08)
Ger
man
y 97
97
0.
0 8.
85
(0.1
1)
Mal
aysi
a
576
562
2.5
10.4
6 (0
.04)
Pola
nd a
300
298
0.7
9.07
(0
.05)
Sing
apor
e 11
7 11
7 0.
0 9.
16
(0.0
8)
Thai
land
66
0 65
3 1.
1 9.
14
(0.0
4)
Uni
ted
Stat
es †d
19
1 14
4 25
.6
9.15
(0
.07)
Lear
n M
athe
mat
ics
thro
ugh
Teac
her
Dir
ecti
on
Mea
n an
d C
onfid
ence
Inte
rval
(± 2
SE)
Perc
entil
es
5th
25th
75
th
95th
Gro
up 1
.Lo
wer
Prim
ary
(to
Gra
de 4
M
axim
um)
Gro
up 2
.Pr
imar
y(t
o G
rade
6
Max
imum
)
Gro
up 3
.Pr
imar
y an
d Se
cond
ary
Gen
eral
ists
(to
Gra
de 1
0 M
axim
um)
Gro
up 4
.Pr
imar
y M
athe
mat
ics
Spec
ialis
ts

243APPENDICES
Exh
ibit
A6.
4: L
earn
mat
hem
atic
s th
rou
gh a
ctiv
e in
volv
emen
t: fu
ture
pri
mar
y te
ache
rs’ e
ndor
sem
ent o
f thi
s st
atem
ent
6
7 8
9 10
11
12
13
14
15
16
Sam
ple
Siz
eV
alid
Dat
a (N
)Pe
rcen
t M
issi
ng
(Wei
ghte
d)
Scal
ed S
core
:
Mea
n(S
E)
Pro
gra
m-G
roup
Co
untr
y
Not
es:
1. T
his
tab
le a
nd
char
t m
ust
be
read
wit
h a
war
enes
s of
th
e lim
itat
ion
s an
not
ated
in C
hap
ter
6.2.
Th
e da
gger
sym
bol (
†) is
use
d t
o al
ert
read
ers
to s
itu
atio
ns
wh
ere
data
wer
e av
aila
ble
f
rom
few
er t
han
85%
of
resp
onde
nts
.3.
Th
e sh
aded
are
as id
enti
fy d
ata
that
, for
rea
son
s ex
plai
ned
in t
he
limit
atio
ns,
can
not
be
com
pare
d w
ith
co
nfi
den
ce t
o da
ta fr
om o
ther
cou
ntr
ies.
Geo
rgia
506
476
5.7
10.8
1 (0
.06)
Ger
man
y 93
5 88
4 3.
4 12
.18
(0.0
6)
Pola
nd a
1,81
2 1,
766
3.2
11.9
3 (0
.05)
Russ
ian
fede
ratio
n b
2,26
6 2,
218
1.7
11.8
3 (0
.06)
Switz
erla
nd c
121
119
2.0
12.5
9 (0
.11)
Chi
nese
Tai
pei
923
923
0.0
12.1
3 (0
.04)
Phili
ppin
es
592
587
1.4
11.9
5 (0
.09)
Sing
apor
e 26
3 26
1 0.
8 11
.72
(0.0
7)
Spai
n
1,09
3 1,
085
0.9
11.7
8 (0
.08)
Switz
erla
nd
815
810
0.6
12.3
6 (0
.04)
Uni
ted
Stat
es †d
1,
310
1,00
5 24
.1
12.0
0 (0
.06)
bots
wan
ae 86
85
1.
0 12
.00
(0.1
6)
Chi
le f
657
632
3.8
12.6
6 (0
.06)
Nor
way
(ALU
) g 39
2 38
5 1.
9 11
.94
(0.0
8)
Nor
way
(ALU
+) g
159
156
1.6
12.1
2 (0
.12)
Ger
man
y 97
97
0.
0 12
.50
(0.2
8)
Mal
aysi
a
576
562
2.5
11.3
2 (0
.05)
Pola
nd a
300
298
0.7
12.3
6 (0
.09)
Sing
apor
e 11
7 11
7 0.
0 11
.83
(0.0
8)
Thai
land
66
0 65
2 1.
2 11
.86
(0.0
5)
Uni
ted
Stat
es †d
19
1 14
4 25
.6
12.0
7 (0
.09)
Lear
n M
athe
mat
ics
thro
ugh
Act
ive
Invo
lvem
ent
Mea
n an
d C
onfid
ence
Inte
rval
(± 2
SE)
Perc
entil
es
5th
25th
75
th
95th
Gro
up 1
.Lo
wer
Prim
ary
(to
Gra
de 4
M
axim
um)
Gro
up 2
.Pr
imar
y(t
o G
rade
6
Max
imum
)
Gro
up 3
.Pr
imar
y an
d Se
cond
ary
Gen
eral
ists
(to
Gra
de 1
0 M
axim
um)
Gro
up 4
.Pr
imar
yM
athe
mat
ics
Spec
ialis
ts

THE TEACHER EDUCATION AND DEVELOPMENT STUDY IN MATHEMATICS (TEDS-M)244
Exh
ibit
A6.
5: M
athe
mat
ics
is a
fixe
d ab
ilit
y: fu
ture
pri
mar
y te
ache
rs’ e
ndor
sem
ent o
f thi
s st
atem
ent
6
7 8
9 10
11
12
13
14
15
16
Sam
ple
Siz
eV
alid
Dat
a (N
)Pe
rcen
t M
issi
ng
(Wei
ghte
d)
Scal
ed S
core
:
Mea
n(S
E)
Pro
gra
m-G
roup
Co
untr
y
Not
es:
1. T
his
tab
le a
nd
char
t m
ust
be
read
wit
h a
war
enes
s of
th
e lim
itat
ion
s an
not
ated
in C
hap
ter
6.2.
Th
e da
gger
sym
bol (
†) is
use
d t
o al
ert
read
ers
to s
itu
atio
ns
wh
ere
data
wer
e av
aila
ble
f
rom
few
er t
han
85%
of
resp
onde
nts
.3.
Th
e sh
aded
are
as id
enti
fy d
ata
that
, for
rea
son
s ex
plai
ned
in t
he
limit
atio
ns,
can
not
be
com
pare
d w
ith
co
nfi
den
ce t
o da
ta fr
om o
ther
cou
ntr
ies.
Geo
rgia
506
459
9.1
10.4
1 (0
.06)
Ger
man
y 93
5 88
4 3.
4 9.
34
(0.0
4)
Pola
nd a
1,81
2 1,
767
2.8
10.1
4 (0
.02)
Russ
ian
fede
ratio
n b
2,26
6 2,
212
2.0
10.1
3 (0
.04)
Switz
erla
nd c
121
118
3.0
9.13
(0
.05)
Chi
nese
Tai
pei
923
923
0.0
9.78
(0
.02)
Phili
ppin
es
592
586
1.5
10.6
1 (0
.06)
Sing
apor
e 26
3 26
1 0.
8 9.
49
(0.0
4)
Spai
n
1,09
3 1,
082
1.0
9.26
(0
.03)
Switz
erla
nd
815
810
0.6
9.11
(0
.03)
Uni
ted
Stat
es †d
1,
310
1,00
4 24
.3
9.04
(0
.06)
bots
wan
ae 86
86
0.
0 9.
95
(0.0
8)
Chi
le f
657
631
3.9
9.30
(0
.03)
Nor
way
(ALU
) g 39
2 38
7 2.
1 9.
29
(0.0
4)
Nor
way
(ALU
+) g
159
155
1.3
9.06
(0
.05)
Ger
man
y 97
96
0.
2 9.
21
(0.0
9)
Mal
aysi
a
576
561
2.7
10.5
8 (0
.03)
Pola
nd a
300
296
1.1
9.80
(0
.04)
Sing
apor
e 11
7 11
7 0.
0 9.
45
(0.0
7)
Thai
land
66
0 65
3 1.
1 10
.24
(0.0
3)
Uni
ted
Stat
es †d
19
1 14
4 25
.6
8.97
(0
.17)
Mat
hem
atic
s as
a F
ixed
Ab
ility
Mea
n an
d C
onfid
ence
Inte
rval
(± 2
SE)
Perc
entil
es
5th
25th
75
th
95th
Gro
up 1
.Lo
wer
Prim
ary
(to
Gra
de 4
M
axim
um)
Gro
up 2
.Pr
imar
y(t
o G
rade
6
Max
imum
)
Gro
up 3
.Pr
imar
y an
d Se
cond
ary
Gen
eral
ists
(to
Gra
de 1
0 M
axim
um)
Gro
up 4
.Pr
imar
y M
athe
mat
ics
Spec
ialis
ts

245APPENDICES
Exh
ibit
A6.
6: M
athe
mat
ics
is a
set
of r
ule
s an
d pr
oced
ure
s: fu
ture
sec
onda
ry te
ache
rs’ e
ndor
sem
ent o
f thi
s st
atem
ent
6
7 8
9 10
11
12
13
14
15
16
Sam
ple
Siz
eV
alid
Dat
a (N
)Pe
rcen
t M
issi
ng
(Wei
ghte
d)
Scal
ed S
core
:
Mea
n(S
E)
Pro
gra
m-G
roup
Co
untr
y
Not
es:
1. T
his
tab
le a
nd
char
t m
ust
be
read
wit
h a
war
enes
s of
th
e lim
itat
ion
s an
not
ated
in C
hap
ter
6.2.
Th
e da
gger
sym
bol (
†) is
use
d t
o al
ert
read
ers
to s
itu
atio
ns
wh
ere
data
wer
e av
aila
ble
f
rom
few
er t
han
85%
of
resp
onde
nts
.3.
Th
e sh
aded
are
as id
enti
fy d
ata
that
, for
rea
son
s ex
plai
ned
in t
he
limit
atio
ns,
can
not
be
com
pare
d w
ith
co
nfi
den
ce t
o da
ta fr
om o
ther
cou
ntr
ies.
bots
wan
a a
34
34
0.0
11.4
9 (0
.17)
Chi
le b
746
712
4.2
11.0
6 (0
.04)
Ger
man
y 40
8 40
3 1.
4 9.
73
(0.0
6)
Phili
ppin
es
733
729
0.6
12.6
1 (0
.12)
Pola
nd c
158
155
1.4
10.5
6 (0
.08)
Sing
apor
e 14
2 14
2 0.
0 10
.98
(0.0
8)
Switz
erla
nd d
141
140
0.7
9.86
(0
.05)
Nor
way
(ALU
) e 35
6 35
3 1.
1 10
.33
(0.0
5)
Nor
way
(ALU
+) e
151
148
1.6
10.0
6 (0
.06)
Uni
ted
Stat
es †f
16
9 12
6 27
.8
11.3
1 (0
.23)
bots
wan
a a
19
19
0.0
11.5
6 (0
.33)
Chi
nese
Tai
pei
365
364
0.3
10.8
1 (0
.06)
Geo
rgia
g 78
78
0.
0 11
.31
(0.1
6)
Ger
man
y 36
3 35
7 1.
1 9.
59
(0.0
3)
Mal
aysi
a 38
9 38
5 1.
1 11
.57
(0.0
7)
Om
an
268
267
0.4
11.3
8 (0
.05)
Pola
nd
140
138
0.8
10.1
4 (0
.10)
Russ
ian
fede
ratio
n h
2,14
1 2,
093
2.2
10.5
1 (0
.05)
Sing
apor
e 25
1 25
1 0.
0 10
.88
(0.0
8)
Thai
land
65
2 64
4 1.
2 11
.86
(0.0
4)
Nor
way
(PPU
& M
aste
r’s) e
65
64
1.3
10.0
2 (0
.09)
Uni
ted
Stat
es †f
43
8 36
4 18
.6
10.6
8 (0
.08)
Perc
entil
es
5th
25th
75
th
95th
Mea
n an
d C
onfid
ence
Inte
rval
(± 2
SE)
Mat
hem
atic
s as
a S
et o
f R
ules
an
d P
roce
dur
es
Gro
up 5
.Lo
wer
Sec
onda
ry(G
rade
10
Max
imum
)
Gro
up 6
.Lo
wer
and
Upp
erSe
cond
ary
(to
Gra
de 1
1an
d ab
ove)

THE TEACHER EDUCATION AND DEVELOPMENT STUDY IN MATHEMATICS (TEDS-M)246
Exh
ibit
A6.
7: M
athe
mat
ics
is a
pro
cess
of e
nqu
iry:
futu
re s
econ
dary
teac
hers
’ end
orse
men
t of t
his
stat
emen
t
6
7 8
9 10
11
12
13
14
15
16
Sam
ple
Siz
eV
alid
Dat
a (N
)Pe
rcen
t M
issi
ng
(Wei
ghte
d)
Scal
ed S
core
:
Mea
n(S
E)
Pro
gra
m-G
roup
Co
untr
y
Not
es:
1. T
his
tab
le a
nd
char
t m
ust
be
read
wit
h a
war
enes
s of
th
e lim
itat
ion
s an
not
ated
in C
hap
ter
6.2.
Th
e da
gger
sym
bol (
†) is
use
d t
o al
ert
read
ers
to s
itu
atio
ns
wh
ere
data
wer
e av
aila
ble
f
rom
few
er t
han
85%
of
resp
onde
nts
.3.
Th
e sh
aded
are
as id
enti
fy d
ata
that
, for
rea
son
s ex
plai
ned
in t
he
limit
atio
ns,
can
not
be
com
pare
d w
ith
co
nfi
den
ce t
o da
ta fr
om o
ther
cou
ntr
ies.
bots
wan
a a
34
34
0.0
12.4
3 (0
.21)
Chi
le b
746
712
4.2
12.3
4 (0
.08)
Ger
man
y 40
8 40
3 1.
4 11
.93
(0.1
3)
Phili
ppin
es
733
729
0.6
13.0
0 (0
.13)
Pola
nd c
158
155
1.4
11.7
3 (0
.12)
Sing
apor
e 14
2 14
2 0.
0 11
.68
(0.1
1)
Switz
erla
nd d
141
140
0.7
11.7
3 (0
.10)
Nor
way
(ALU
) e 35
6 35
2 1.
4 11
.50
(0.0
7)
Nor
way
(ALU
+) e
151
148
1.6
12.2
1 (0
.14)
Uni
ted
Stat
es †f
16
9 12
6 27
.8
12.3
6 (0
.17)
bots
wan
a a
19
19
0.0
12.3
4 (0
.20)
Chi
nese
Tai
pei
365
364
0.3
12.0
8 (0
.07)
Geo
rgia
g 78
78
0.
0 10
.98
(0.1
5)
Ger
man
y 36
3 35
7 1.
1 12
.06
(0.1
1)
Mal
aysi
a 38
9 38
5 1.
1 12
.11
(0.0
9)
Om
an
268
266
0.8
12.8
5 (0
.09)
Pola
nd
140
138
0.8
12.0
2 (0
.13)
Russ
ian
fede
ratio
n h
2,14
1 2,
091
2.3
11.4
2 (0
.06)
Sing
apor
e 25
1 25
1 0.
0 11
.80
(0.0
7)
Thai
land
65
2 64
4 1.
2 12
.49
(0.0
5)
Nor
way
(PPU
& M
aste
r’s) e
65
64
1.3
11.8
3 (0
.15)
Uni
ted
Stat
es †f
43
8 36
4 18
.6
12.6
8 (0
.10)
Perc
entil
es
5th
25th
75
th
95th
Mea
n an
d C
onfid
ence
Inte
rval
(± 2
SE)
Mat
hem
atic
s as
a P
roce
ss o
f En
qui
ry
Gro
up 5
.Lo
wer
Sec
onda
ry(G
rade
10
Max
imum
)
Gro
up 6
.Lo
wer
and
Upp
erSe
cond
ary
(to
Gra
de 1
1an
d ab
ove)

247APPENDICES
Exh
ibit
A6.
8: L
earn
mat
hem
atic
s th
rou
gh t
each
er d
irec
tion
: fut
ure
seco
ndar
y te
ache
rs’ e
ndor
sem
ent o
f thi
s st
atem
ent
6
7
8 9
10
11
12
13
14
15
16
Sam
ple
Siz
eV
alid
Dat
a (N
)Pe
rcen
t M
issi
ng
(Wei
ghte
d)
Scal
ed S
core
:
Mea
n(S
E)
Pro
gra
m-G
roup
Co
untr
y
Not
es:
1. T
his
tab
le a
nd
char
t m
ust
be
read
wit
h a
war
enes
s of
th
e lim
itat
ion
s an
not
ated
in C
hap
ter
6.2.
Th
e da
gger
sym
bol (
†) is
use
d t
o al
ert
read
ers
to s
itu
atio
ns
wh
ere
data
wer
e av
aila
ble
f
rom
few
er t
han
85%
of
resp
onde
nts
.3.
Th
e sh
aded
are
as id
enti
fy d
ata
that
, for
rea
son
s ex
plai
ned
in t
he
limit
atio
ns,
can
not
be
com
pare
d w
ith
co
nfi
den
ce t
o da
ta fr
om o
ther
cou
ntr
ies.
bots
wan
a a
34
34
0.0
9.78
(0
.10)
Chi
le b
746
714
4.0
9.68
(0
.03)
Ger
man
y 40
8 40
2 1.
4 8.
98
(0.0
8)
Phili
ppin
es
733
729
0.6
10.4
5 (0
.06)
Pola
nd c
158
155
1.4
9.48
(0
.07)
Sing
apor
e 14
2 14
2 0.
0 9.
56
(0.0
6)
Switz
erla
nd d
141
140
0.7
8.92
(0
.07)
Nor
way
(ALU
) e 35
6 35
4 0.
7 8.
98
(0.0
3)
Nor
way
(ALU
+) e
151
148
1.6
8.84
(0
.05)
Uni
ted
Stat
es †f
16
9 12
6 27
.8
9.28
(0
.14)
bots
wan
a a
19
19
0.0
9.88
(0
.14)
Chi
nese
Tai
pei
365
365
0.0
9.02
(0
.04)
Geo
rgia
g 78
78
0.
0 10
.13
(0.0
5)
Ger
man
y 36
3 35
7 0.
9 8.
77
(0.0
6)
Mal
aysi
a 38
9 38
6 0.
8 10
.39
(0.0
4)
Om
an
268
267
0.4
9.98
(0
.03)
Pola
nd
140
138
0.8
8.98
(0
.06)
Russ
ian
fede
ratio
n h
2,14
1 2,
091
2.2
9.55
(0
.03)
Sing
apor
e 25
1 25
1 0.
0 9.
46
(0.0
4)
Thai
land
65
2 64
2 1.
5 9.
28
(0.0
4)
Nor
way
(PPU
& M
aste
r’s) e
65
64
1.3
9.03
(0
.06)
Uni
ted
Stat
es †f
43
8 36
4 18
.6
8.94
(0
.05)
Perc
entil
es
5th
25th
75
th
95th
Mea
n an
d C
onfid
ence
Inte
rval
(± 2
SE)
Lear
n M
athe
mat
ics
thro
ugh
Teac
her
Dir
ecti
on
Gro
up 5
.Lo
wer
Sec
onda
ry(G
rade
10
Max
imum
)
Gro
up 6
.Lo
wer
and
Upp
erSe
cond
ary
(to
Gra
de 1
1an
d ab
ove)

THE TEACHER EDUCATION AND DEVELOPMENT STUDY IN MATHEMATICS (TEDS-M)248
Exh
ibit
A6.
9: L
earn
mat
hem
atic
s th
rou
gh a
ctiv
e in
volv
emen
t: fu
ture
sec
onda
ry te
ache
rs’ e
ndor
sem
ent o
f thi
s st
atem
ent
6
7 8
9 10
11
12
13
14
15
16
Sam
ple
Siz
eV
alid
Dat
a (N
)Pe
rcen
t M
issi
ng
(Wei
ghte
d)
Scal
ed S
core
:
Mea
n(S
E)
Pro
gra
m-G
roup
Co
untr
y
Not
es:
1. T
his
tab
le a
nd
char
t m
ust
be
read
wit
h a
war
enes
s of
th
e lim
itat
ion
s an
not
ated
in C
hap
ter
6.2.
Th
e da
gger
sym
bol (
†) is
use
d to
ale
rt r
eade
rs t
o si
tuat
ion
s w
her
e da
ta w
ere
avai
labl
e
fro
m fe
wer
th
an 8
5% o
f re
spon
den
ts.
3. T
he
shad
ed a
reas
iden
tify
dat
a th
at, f
or r
easo
ns
expl
ain
ed in
th
e lim
itat
ion
s, c
ann
ot b
e co
mpa
red
wit
h
con
fide
nce
to
data
from
oth
er c
oun
trie
s.
bots
wan
a a
34
34
0.0
11.7
3 (0
.21)
Chi
le b
746
710
4.5
12.6
5 (0
.08)
Ger
man
y 40
8 40
2 1.
4 12
.12
(0.1
0)
Phili
ppin
es
733
728
0.6
11.9
2 (0
.14)
Pola
nd c
158
155
1.4
12.0
9 (0
.10)
Sing
apor
e 14
2 14
2 0.
0 11
.67
(0.0
8)
Switz
erla
nd d
141
140
0.7
12.4
9 (0
.12)
Nor
way
(ALU
) e 35
6 35
3 1.
0 11
.72
(0.0
6)
Nor
way
(ALU
+) e
151
148
1.6
12.0
8 (0
.13)
Uni
ted
Stat
es †f
16
9 12
6 27
.8
12.2
6 (0
.14)
bots
wan
a a
19
19
0.0
12.0
1 (0
.18)
Chi
nese
Tai
pei
365
365
0.0
12.3
6 (0
.05)
Geo
rgia
g 78
75
3.
6 11
.49
(0.2
0)
Ger
man
y 36
3 35
6 1.
4 12
.67
(0.1
0)
Mal
aysi
a 38
9 38
4 1.
3 11
.35
(0.0
6)
Om
an
268
267
0.4
12.0
3 (0
.07)
Pola
nd
140
138
0.8
12.2
0 (0
.17)
Russ
ian
fede
ratio
n h
2,14
1 2,
084
2.4
11.8
5 (0
.07)
Sing
apor
e 25
1 25
0 0.
4 11
.45
(0.0
7)
Thai
land
65
2 64
0 1.
8 11
.92
(0.0
5)
Nor
way
(PPU
& M
aste
r’s) e
65
64
1.3
11.6
2 (0
.10)
Uni
ted
Stat
es †f
43
8 36
4 18
.6
12.1
0 (0
.10)
Perc
entil
es
5th
25th
75
th
95th
Mea
n an
d C
onfid
ence
Inte
rval
(± 2
SE)
Lear
n M
athe
mat
ics
thro
ugh
Act
ive
Invo
lvem
ent
Gro
up 5
.Lo
wer
Sec
onda
ry(G
rade
10
Max
imum
)
Gro
up 6
.Lo
wer
and
Upp
erSe
cond
ary
(to
Gra
de 1
1an
d ab
ove)

249APPENDICES
Exh
ibit
A6.
10: M
athe
mat
ics
is a
fixe
d ab
ilit
y: fu
ture
sec
onda
ry te
ache
rs’ e
ndor
sem
ent o
f thi
s st
atem
ent
6
7 8
9 10
11
12
13
14
15
16
Sam
ple
Siz
eV
alid
Dat
a (N
)Pe
rcen
t M
issi
ng
(Wei
ghte
d)
Scal
ed S
core
:
Mea
n(S
E)
Pro
gra
m-G
roup
Co
untr
y
Not
es:
1. T
his
tab
le a
nd
char
t m
ust
be
read
wit
h a
war
enes
s of
th
e lim
itat
ion
s an
not
ated
in C
hap
ter
6.2.
Th
e da
gger
sym
bol (
†) is
use
d t
o al
ert
read
ers
to s
itu
atio
ns
wh
ere
data
wer
e av
aila
ble
f
rom
few
er t
han
85%
of
resp
onde
nts
.3.
Th
e sh
aded
are
as id
enti
fy d
ata
that
, for
rea
son
s ex
plai
ned
in t
he
limit
atio
ns,
can
not
be
com
pare
d w
ith
co
nfi
den
ce t
o da
ta fr
om o
ther
cou
ntr
ies.
bots
wan
a a
34
33
2.9
10.1
4 (0
.13)
Chi
le b
746
707
4.9
9.31
(0
.05)
Ger
man
y 40
8 40
2 1.
4 9.
16
(0.0
6)
Phili
ppin
es
733
725
0.8
10.5
7 (0
.07)
Pola
nd c
158
155
1.4
9.94
(0
.06)
Sing
apor
e 14
2 14
1 0.
7 9.
73
(0.0
5)
Switz
erla
nd d
141
140
0.7
9.17
(0
.06)
Nor
way
(ALU
) e 35
6 35
3 1.
0 9.
38
(0.0
3)
Nor
way
(ALU
+ )
e 15
1 14
8 1.
6 9.
06
(0.0
5)
Uni
ted
Stat
es †f
16
9 12
6 27
.8
9.07
(0
.28)
bots
wan
a a
19
18
5.3
10.1
5 (0
.19)
Chi
nese
Tai
pei
365
365
0.0
9.83
(0
.04)
Geo
rgia
g 78
75
4.
3 10
.41
(0.1
0)
Ger
man
y 36
3 35
6 1.
0 8.
92
(0.0
5)
Mal
aysi
a 38
9 38
3 1.
5 10
.63
(0.0
5)
Om
an
268
263
1.8
10.1
1 (0
.05)
Pola
nd
140
137
1.9
9.85
(0
.07)
Russ
ian
fede
ratio
n h
2,14
1 20
76
2.6
10.0
8 (0
.02)
Sing
apor
e 25
1 24
9 0.
8 9.
71
(0.0
7)
Thai
land
65
2 64
2 1.
5 10
.36
(0.0
3)
Nor
way
(PPU
& M
aste
r’s) e
65
64
1.3
9.23
(0
.08)
Uni
ted
Stat
es †f
43
8 36
3 18
.8
8.83
(0
.06)
Perc
entil
es
5th
25th
75
th
95th
Mea
n an
d C
onfid
ence
Inte
rval
(± 2
SE)
Mat
hem
atic
s as
a F
ixed
Ab
ility
Gro
up 5
.Lo
wer
Sec
onda
ry(G
rade
10
Max
imum
)
Gro
up 6
.Lo
wer
and
Upp
erSe
cond
ary
(to
Gra
de 1
1an
d ab
ove)

THE TEACHER EDUCATION AND DEVELOPMENT STUDY IN MATHEMATICS (TEDS-M)250
Exh
ibit
A6.
11: M
athe
mat
ics
is a
set
of r
ule
s an
d pr
oced
ure
s: te
ache
r ed
ucat
ors’
end
orse
men
t of t
his
stat
emen
t
6
7 8
9 10
11
12
13
14
15
16
Sam
ple
Siz
eV
alid
Dat
a (N
)M
issi
ng
Dat
a (%
)Sc
aled
Sco
re:
M
ean
(SE)
Co
untr
y
Not
es:
1.
Th
is t
able
an
d c
har
t m
ust
be
read
wit
h a
war
enes
s of
th
e lim
itat
ion
s an
not
ated
in
Ch
apte
r 6.
2. T
he
shad
ed a
reas
iden
tify
dat
a th
at, f
or r
easo
ns
expl
ain
ed in
th
e lim
itat
ion
s, c
ann
ot
be c
ompa
red
wit
h c
onfi
den
ce t
o da
ta fr
om o
ther
cou
ntr
ies.
bots
wan
a 43
40
6.
8 11
.38
(0.2
6)
Chi
le a
392
380
2.9
10.0
1 (0
.06)
Chi
nese
Tai
pei
195
193
2.5
10.4
2 (0
.13)
Geo
rgia
62
62
0.
0 12
.27
(0.1
9)
Ger
man
y b
482
446
4.8
9.55
(0
.05)
Mal
aysi
a c
255
250
1.7
11.2
4 (0
.08)
Om
an
84
72
14.3
11
.14
(0.1
6)
Phili
ppin
es
589
582
1.5
12.3
3 (0
.12)
Pola
nd d
734
701
4.8
10.0
7 (0
.04)
Russ
ian
fede
ratio
n e
1,21
2 1,
191
1.8
10.2
9 (0
.06)
Sing
apor
e 77
74
3.
9 10
.21
(0.1
4)
Spai
n 53
3 51
8 3.
0 10
.28
(0.0
6)
Switz
erla
nd f
220
213
2.7
9.57
(0
.07)
Thai
land
31
2 30
3 2.
8 11
.47
(0.1
2)
Perc
entil
es
5th
25th
75
th
95th
Mea
n an
d C
onfid
ence
Inte
rval
(± 2
SE)
Mat
hem
atic
s as
a S
et
of
Rul
es a
nd
Pro
ced
ures

251APPENDICES
Exh
ibit
A6.
12: M
athe
mat
ics
is a
pro
cess
of e
nqu
iry:
teac
her
educ
ator
s’ e
ndor
sem
ent o
f thi
s st
atem
ent
6
7 8
9 10
11
12
13
14
15
16
Sam
ple
Siz
eV
alid
Dat
a (N
)M
issi
ng
Dat
a (%
)Sc
aled
Sco
re:
M
ean
(SE)
Co
untr
y
Not
es:
1.
Th
is t
able
an
d ch
art
mu
st b
e re
ad w
ith
aw
aren
ess
of t
he
limit
atio
ns
ann
otat
ed in
C
hap
ter
6.2.
Th
e sh
aded
are
as id
enti
fy d
ata
that
, for
rea
son
s ex
plai
ned
in t
he
limit
atio
ns,
can
not
be
com
pare
d w
ith
con
fide
nce
to
data
from
oth
er c
oun
trie
s.
bots
wan
a 43
40
6.
8 13
.05
(0.2
5)
Chi
le a
392
380
2.9
13.1
2 (0
.08)
Chi
nese
Tai
pei
195
193
2.5
12.2
2 (0
.20)
Geo
rgia
62
62
0.
0 13
.29
(0.2
2)
Ger
man
y b
482
446
4.8
12.1
4 (0
.08)
Mal
aysi
a c
255
250
1.7
12.9
3 (0
.11)
Om
an
84
73
13.3
12
.80
(0.1
8)
Phili
ppin
es
589
581
1.5
13.2
4 (0
.15)
Pola
nd d
734
703
4.3
12.6
3 (0
.06)
Russ
ian
fede
ratio
n e
1,21
2 1,
192
1.7
11.8
8 (0
.05)
Sing
apor
e 77
74
3.
9 12
.29
(0.1
9)
Spai
n 53
3 52
1 2.
3 12
.91
(0.0
8)
Switz
erla
nd f
220
213
2.7
12.3
0 (0
.08)
Thai
land
31
2 30
3 2.
8 12
.89
(0.1
3)
Perc
entil
es
5th
25th
75
th
95th
Mea
n an
d C
onfid
ence
Inte
rval
(± 2
SE)
Mat
hem
atic
s as
a P
roce
ss o
f En
qui
ry
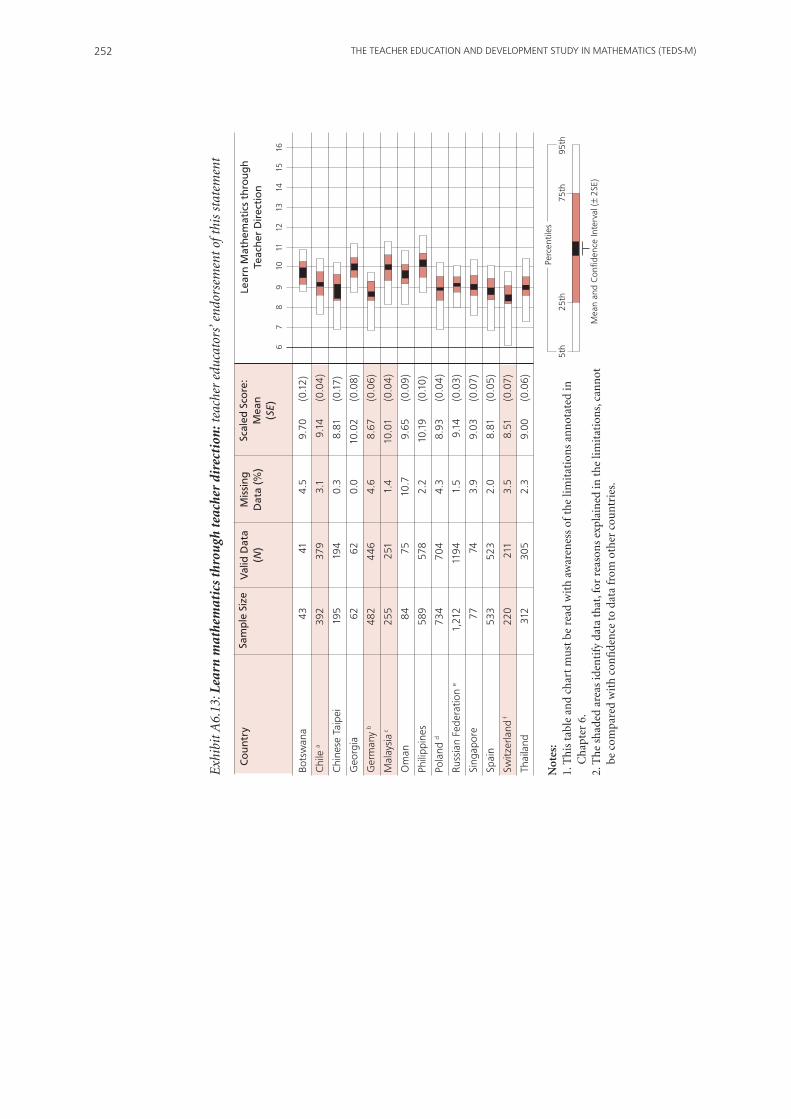
THE TEACHER EDUCATION AND DEVELOPMENT STUDY IN MATHEMATICS (TEDS-M)252
Exh
ibit
A6.
13: L
earn
mat
hem
atic
s th
rou
gh t
each
er d
irec
tion
: tea
cher
edu
cato
rs’ e
ndor
sem
ent o
f thi
s st
atem
ent
6
7 8
9 10
11
12
13
14
15
16
Sam
ple
Siz
eV
alid
Dat
a (N
)M
issi
ng
Dat
a (%
)Sc
aled
Sco
re:
M
ean
(SE)
Co
untr
y
Not
es:
1.
Th
is t
able
an
d ch
art
mu
st b
e re
ad w
ith
aw
aren
ess
of t
he
limit
atio
ns
ann
otat
ed in
C
hap
ter
6.2.
Th
e sh
aded
are
as id
enti
fy d
ata
that
, for
rea
son
s ex
plai
ned
in t
he
limit
atio
ns,
can
not
be
com
pare
d w
ith
con
fide
nce
to
data
from
oth
er c
oun
trie
s.
bots
wan
a 43
41
4.
5 9.
70
(0.1
2)
Chi
le a
392
379
3.1
9.14
(0
.04)
Chi
nese
Tai
pei
195
194
0.3
8.81
(0
.17)
Geo
rgia
62
62
0.
0 10
.02
(0.0
8)
Ger
man
y b
482
446
4.6
8.67
(0
.06)
Mal
aysi
a c
255
251
1.4
10.0
1 (0
.04)
Om
an
84
75
10.7
9.
65
(0.0
9)
Phili
ppin
es
589
578
2.2
10.1
9 (0
.10)
Pola
nd d
734
704
4.3
8.93
(0
.04)
Russ
ian
fede
ratio
n e
1,21
2 11
94
1.5
9.14
(0
.03)
Sing
apor
e 77
74
3.
9 9.
03
(0.0
7)
Spai
n 53
3 52
3 2.
0 8.
81
(0.0
5)
Switz
erla
nd f
220
211
3.5
8.51
(0
.07)
Thai
land
31
2 30
5 2.
3 9.
00
(0.0
6)
Perc
entil
es
5th
25th
75
th
95th
Mea
n an
d C
onfid
ence
Inte
rval
(± 2
SE)
Lear
n M
athe
mat
ics
thro
ugh
Teac
her
Dir
ecti
on
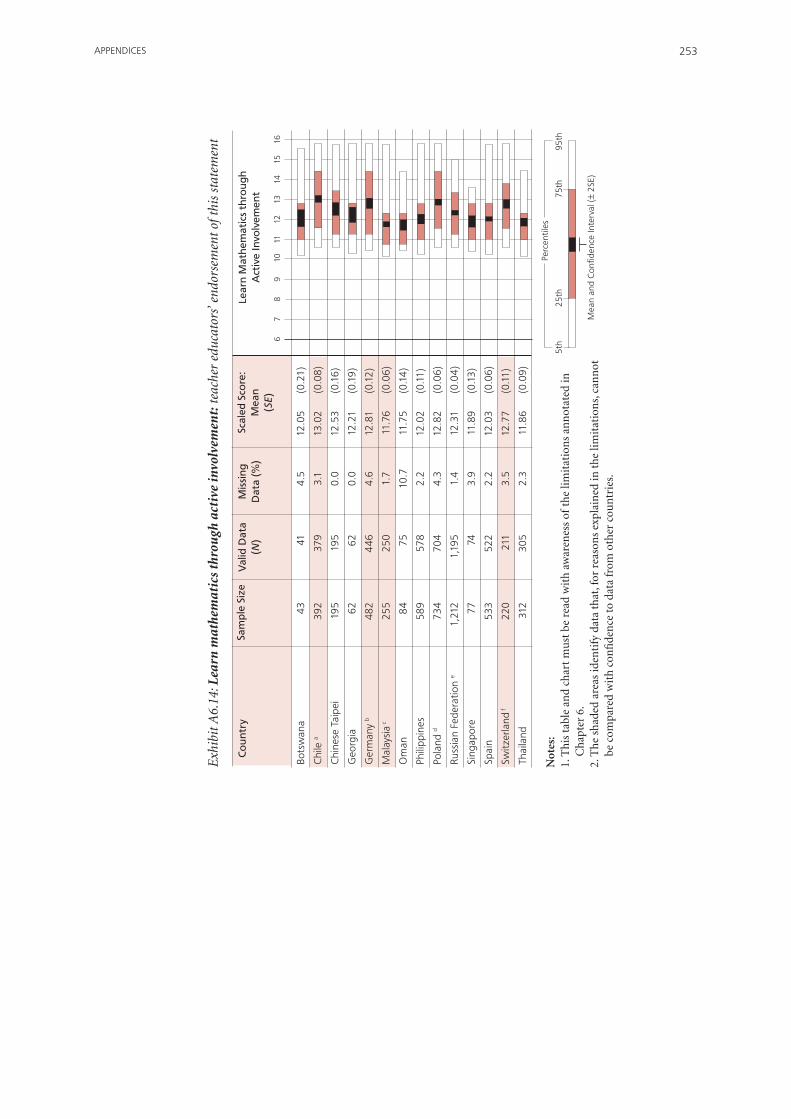
253APPENDICES
bots
wan
a 43
41
4.
5 12
.05
(0.2
1)
Chi
le a
392
379
3.1
13.0
2 (0
.08)
Chi
nese
Tai
pei
195
195
0.0
12.5
3 (0
.16)
Geo
rgia
62
62
0.
0 12
.21
(0.1
9)
Ger
man
y b
482
446
4.6
12.8
1 (0
.12)
Mal
aysi
a c
255
250
1.7
11.7
6 (0
.06)
Om
an
84
75
10.7
11
.75
(0.1
4)
Phili
ppin
es
589
578
2.2
12.0
2 (0
.11)
Pola
nd d
734
704
4.3
12.8
2 (0
.06)
Russ
ian
fede
ratio
n e
1,21
2 1,
195
1.4
12.3
1 (0
.04)
Sing
apor
e 77
74
3.
9 11
.89
(0.1
3)
Spai
n 53
3 52
2 2.
2 12
.03
(0.0
6)
Switz
erla
nd f
220
211
3.5
12.7
7 (0
.11)
Thai
land
31
2 30
5 2.
3 11
.86
(0.0
9)
Exh
ibit
A6.
14: L
earn
mat
hem
atic
s th
rou
gh a
ctiv
e in
volv
emen
t: te
ache
r ed
ucat
ors’
end
orse
men
t of t
his
stat
emen
t
6
7 8
9 10
11
12
13
14
15
16
Sam
ple
Siz
eV
alid
Dat
a (N
)M
issi
ng
Dat
a (%
)Sc
aled
Sco
re:
M
ean
(SE)
Co
untr
y
Not
es:
1.
Th
is t
able
an
d c
har
t m
ust
be
read
wit
h a
war
enes
s of
th
e lim
itat
ion
s an
not
ated
in
Ch
apte
r 6.
2. T
he
shad
ed a
reas
iden
tify
dat
a th
at, f
or r
easo
ns
expl
ain
ed in
th
e lim
itat
ion
s, c
ann
ot
be c
ompa
red
wit
h c
onfi
den
ce t
o da
ta fr
om o
ther
cou
ntr
ies.
Perc
entil
es
5th
25th
75
th
95th
Mea
n an
d C
onfid
ence
Inte
rval
(± 2
SE)
Lear
n M
athe
mat
ics
thro
ugh
Act
ive
Invo
lvem
ent

THE TEACHER EDUCATION AND DEVELOPMENT STUDY IN MATHEMATICS (TEDS-M)254
Exh
ibit
A6.
15: M
athe
mat
ics
is a
fixe
d ab
ilit
y: te
ache
r ed
ucat
ors’
end
orse
men
t of t
his
stat
emen
t
6
7 8
9 10
11
12
13
14
15
16
Sam
ple
Siz
eV
alid
Dat
a (N
)M
issi
ng
Dat
a (%
)Sc
aled
Sco
re:
M
ean
(SE)
Co
untr
y
Not
es:
1.
Th
is t
able
an
d ch
art
mu
st b
e re
ad w
ith
aw
aren
ess
of t
he
limit
atio
ns
ann
otat
ed in
C
hap
ter
6.2.
Th
e sh
aded
are
as id
enti
fy d
ata
that
, for
rea
son
s ex
plai
ned
in t
he
limit
atio
ns,
can
not
be
com
pare
d w
ith
con
fide
nce
to
data
from
oth
er c
oun
trie
s.
bots
wan
a 43
41
4.
5 9.
80
(0.2
4)
Chi
le a
392
375
4.0
8.59
(0
.07)
Chi
nese
Tai
pei
195
195
0.0
9.59
(0
.13)
Geo
rgia
62
62
0.
0 10
.58
(0.1
1)
Ger
man
y b
482
445
5.6
8.92
(0
.09)
Mal
aysi
a c
255
250
1.8
10.3
7 (0
.08)
Om
an
84
73
13.7
10
.17
(0.1
5)
Phili
ppin
es
589
580
1.8
10.2
8 (0
.07)
Pola
nd d
734
701
5.0
9.92
(0
.04)
Russ
ian
fede
ratio
n e
1,21
2 1,
191
1.6
9.81
(0
.03)
Sing
apor
e 77
74
3.
9 9.
50
(0.1
3)
Spai
n 53
3 51
8 2.
7 8.
98
(0.0
4)
Switz
erla
nd f
220
209
4.2
8.62
(0
.07)
Thai
land
31
2 30
6 1.
9 10
.30
(0.0
3)
Perc
entil
es
5th
25th
75
th
95th
Mea
n an
d C
onfid
ence
Inte
rval
(± 2
SE)
Mat
hem
atic
s as
a F
ixed
Ab
ility

255APPENDICES
Exhibit A7.1: Areas of tertiary-level mathematics included in the OTL questionnaire*
Question 1. “Consider the following topics in university level mathematics. Please indicate whether you have ever studied each topic. Check one box in each row. Studied/Not studied”
Geometry A. foundations of geometry or axiomatic geometry (e.g., Euclidean axioms)b. Analytic/coordinate geometry (e.g., equations of lines, curves, conic sections, rigid transformations or
isometrics)C. Non-Euclidean geometry (e.g., geometry on a sphere) D. Differential geometry (e.g., sets that are manifolds, curvature of curves, and surfaces)
Discrete Structures & Logic f. Linear algebra (e.g., vector spaces, matrices, dimensions, eigenvalues, eigenvectors)G. Set theory H. Abstract algebra (e.g., group theory, field theory, ring theory, ideals)I. Number theory (e.g., divisibility, prime numbers, structuring integers)P. Discrete mathematics, graph theory, game theory, combinatorics or boolean algebraS. Mathematical logic (e.g., truth tables, symbolic logic, propositional logic, set theory, binary operations)
Continuity & Functions J. beginning calculus topics (e.g., limits, series, sequences)K. Calculus (e.g., derivatives and integrals)L. Multivariate calculus (e.g., partial derivatives, multiple integrals)M. Advanced calculus or real analysis or measure theoryN. Differential equations (e.g., ordinary differential equations and partial differential equations)
Probability & Statistics Q. ProbabilityR. Theoretical or applied statistics
Note: *Items that had poor fit were eliminated from the scale.
Exhibit A7.2. Areas of school-level mathematics included in the OTL questionnaire
Question 2. “Consider the following list of mathematics topics that are often taught at the <primary> or <secondary> school level. Please indicate whether you have studied each topic as part of your current teacher preparation program. Check one box in each row. Studied/ Not studied”
Numbers, Measurement, and Geometry MFB2SLMNA. Numbers (e.g., whole numbers, fractions, decimals, integer, rational, and real numbers; number concepts;
number theory; estimation; ratio and proportionality)b. Measurement (e.g., measurement units; computations and properties of length, perimeter, area, and
volume; estimation and error)C. Geometry (e.g., 1-D and 2-D coordinate geometry, Euclidean geometry, transformational geometry,
congruence and similarity, constructions with straightedge and compass, 3-D geometry, vector geometry)
Functions, Probability, and Calculus MFB2SLMFD. functions, Relations, and Equations (e.g., algebra, trigonometry, analytic geometry)E. Data Representation, Probability, and Statistics f. Calculus (e.g., infinite processes, change, differentiation, integration)G. Validation, Structuring, and Abstracting (e.g., boolean algebra, mathematical induction, logical connectives,
sets, groups, fields, linear space, isomorphism, homomorphism)
A4: CHAPTER 7 ExHIBITS
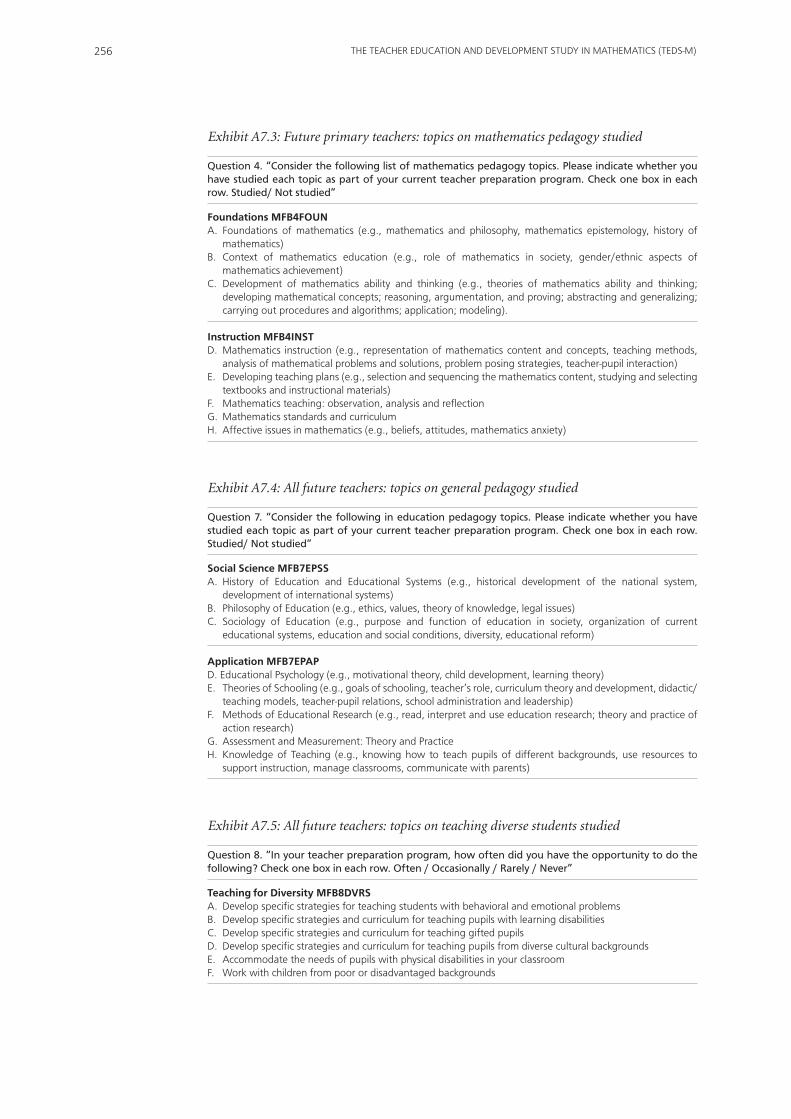
THE TEACHER EDUCATION AND DEVELOPMENT STUDY IN MATHEMATICS (TEDS-M)256
Exhibit A7.3: Future primary teachers: topics on mathematics pedagogy studied
Question 4. “Consider the following list of mathematics pedagogy topics. Please indicate whether you have studied each topic as part of your current teacher preparation program. Check one box in each row. Studied/ Not studied”
Foundations MFB4FOUNA. foundations of mathematics (e.g., mathematics and philosophy, mathematics epistemology, history of
mathematics)b. Context of mathematics education (e.g., role of mathematics in society, gender/ethnic aspects of
mathematics achievement)C. Development of mathematics ability and thinking (e.g., theories of mathematics ability and thinking;
developing mathematical concepts; reasoning, argumentation, and proving; abstracting and generalizing; carrying out procedures and algorithms; application; modeling).
Instruction MFB4INSTD. Mathematics instruction (e.g., representation of mathematics content and concepts, teaching methods,
analysis of mathematical problems and solutions, problem posing strategies, teacher-pupil interaction)E. Developing teaching plans (e.g., selection and sequencing the mathematics content, studying and selecting
textbooks and instructional materials)f. Mathematics teaching: observation, analysis and reflectionG. Mathematics standards and curriculumH. Affective issues in mathematics (e.g., beliefs, attitudes, mathematics anxiety)
Exhibit A7.4: All future teachers: topics on general pedagogy studied
Question 7. “Consider the following in education pedagogy topics. Please indicate whether you have studied each topic as part of your current teacher preparation program. Check one box in each row. Studied/ Not studied”
Social Science MFB7EPSS A. History of Education and Educational Systems (e.g., historical development of the national system,
development of international systems)b. Philosophy of Education (e.g., ethics, values, theory of knowledge, legal issues)C. Sociology of Education (e.g., purpose and function of education in society, organization of current
educational systems, education and social conditions, diversity, educational reform)
Application MFB7EPAP D. Educational Psychology (e.g., motivational theory, child development, learning theory)E. Theories of Schooling (e.g., goals of schooling, teacher’s role, curriculum theory and development, didactic/
teaching models, teacher-pupil relations, school administration and leadership)f. Methods of Educational Research (e.g., read, interpret and use education research; theory and practice of
action research)G. Assessment and Measurement: Theory and PracticeH. Knowledge of Teaching (e.g., knowing how to teach pupils of different backgrounds, use resources to
support instruction, manage classrooms, communicate with parents)
Exhibit A7.5: All future teachers: topics on teaching diverse students studied
Question 8. “In your teacher preparation program, how often did you have the opportunity to do the following? Check one box in each row. Often / Occasionally / Rarely / Never”
Teaching for Diversity MFB8DVRS A. Develop specific strategies for teaching students with behavioral and emotional problemsb. Develop specific strategies and curriculum for teaching pupils with learning disabilitiesC. Develop specific strategies and curriculum for teaching gifted pupilsD. Develop specific strategies and curriculum for teaching pupils from diverse cultural backgroundsE. Accommodate the needs of pupils with physical disabilities in your classroomf. Work with children from poor or disadvantaged backgrounds
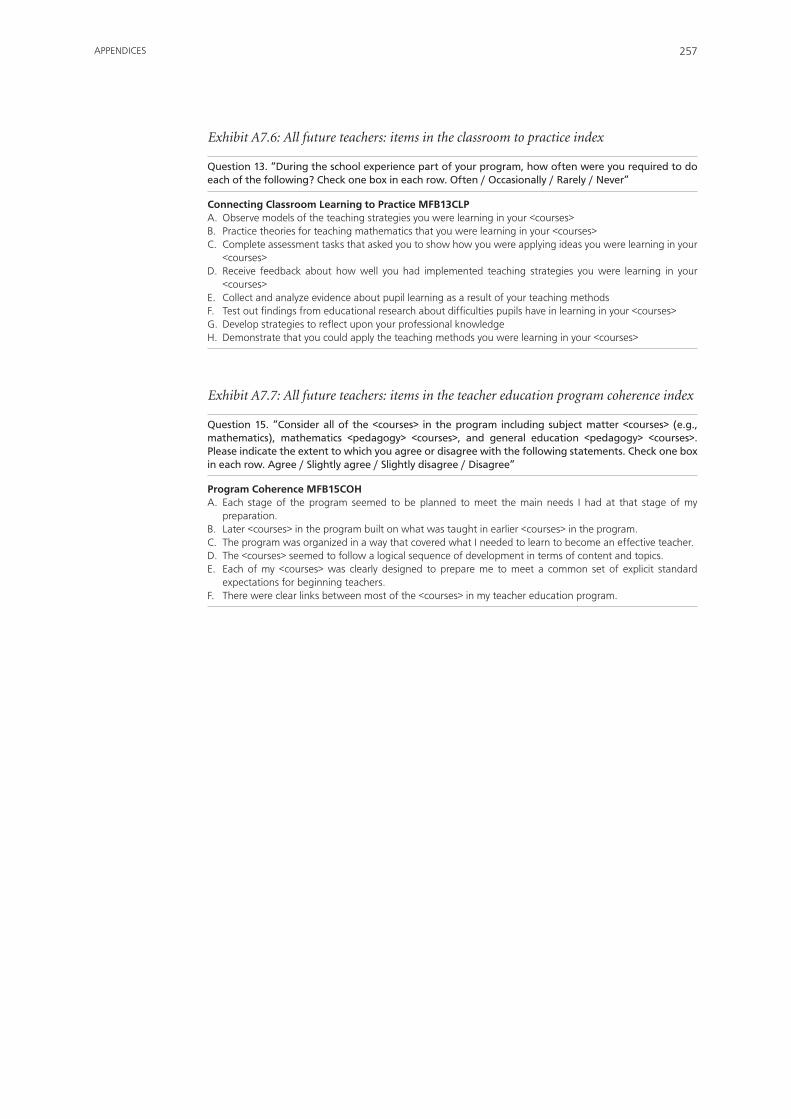
257APPENDICES
Exhibit A7.6: All future teachers: items in the classroom to practice index
Question 13. “During the school experience part of your program, how often were you required to do each of the following? Check one box in each row. Often / Occasionally / Rarely / Never”
Connecting Classroom Learning to Practice MFB13CLP A. Observe models of the teaching strategies you were learning in your <courses> b. Practice theories for teaching mathematics that you were learning in your <courses> C. Complete assessment tasks that asked you to show how you were applying ideas you were learning in your
<courses> D. Receive feedback about how well you had implemented teaching strategies you were learning in your
<courses> E. Collect and analyze evidence about pupil learning as a result of your teaching methods f. Test out findings from educational research about difficulties pupils have in learning in your <courses> G. Develop strategies to reflect upon your professional knowledge H. Demonstrate that you could apply the teaching methods you were learning in your <courses>
Exhibit A7.7: All future teachers: items in the teacher education program coherence index
Question 15. “Consider all of the <courses> in the program including subject matter <courses> (e.g., mathematics), mathematics <pedagogy> <courses>, and general education <pedagogy> <courses>.Please indicate the extent to which you agree or disagree with the following statements. Check one box in each row. Agree / Slightly agree / Slightly disagree / Disagree”
Program Coherence MFB15COHA. Each stage of the program seemed to be planned to meet the main needs I had at that stage of my
preparation.b. Later <courses> in the program built on what was taught in earlier <courses> in the program.C. The program was organized in a way that covered what I needed to learn to become an effective teacher.D. The <courses> seemed to follow a logical sequence of development in terms of content and topics.E. Each of my <courses> was clearly designed to prepare me to meet a common set of explicit standard
expectations for beginning teachers.f. There were clear links between most of the <courses> in my teacher education program.

THE TEACHER EDUCATION AND DEVELOPMENT STUDY IN MATHEMATICS (TEDS-M)258

259APPENDICES
APPENDIx B: SAMPLING, SCALING, AND REPORTING PROCEDURES
The methodology of TEDS-M is described in detail in the TEDS-M technical report
(Tatto, 2012), which is also available on the official TEDS-M website (http://teds.educ.
msu.edu/). This technical appendix contains basic information that allows readers to
understand the key definitions and methods used in the study.
B.1 Sampling
B.1.1 International Sampling Plan
The Teacher Education Development Study–Mathematics (TEDS-M) surveyed, as part
of its data-collection plan, each of the study’s target populations. The populations of
interest included institutions where future primary and secondary teachers were receiving
their preparation to teach mathematics, the teacher educators who were preparing
them in mathematics and mathematics pedagogy as well as in general pedagogy, and
the future teachers in their last year of training. The international sampling plan used
a stratified multi-stage probability sampling design. The targeted individuals (teacher
educators and future teachers) were randomly selected from a list of in-scope teacher
educators and future teachers for each of the randomly selected teacher preparation
(TP) institutions.
Note: Programs and routes
Two concepts play a key role in how TP is organized—the program and the
route. A program is a specific pathway that exists within an institution, and it is
where students undertake a set of subjects and experiences that lead to the award
of a common credential or credentials on completion. A route is a set of teacher
education programs available in a given country. TP programs within a given route
share a number of common features that distinguish them from TP programs in
other routes. For the purposes of TEDS-M, two kinds of routes were defined:
• Concurrent routes: these consist of a single program that includes studies in the
subjects future teachers will be teaching (academic studies), studies of pedagogy
and education (professional studies), and practical experience in the classroom.
• Consecutive routes: these consist of a first phase involving academic studies
(leading to a degree or diploma), followed by a second phase of professional
studies and practical experience (leading to a separate credential/qualification).
A route cannot be considered consecutive if the institution or the government
authorities do not award a degree, diploma, or official certificate at the end of
the first phase. The first and second phases do not need to be completed in the
same institution. In some education systems, it is customary for future teachers
to complete the first and second phases in different institutions, or they may even
be required to do this.

THE TEACHER EDUCATION AND DEVELOPMENT STUDY IN MATHEMATICS (TEDS-M)260
B.1.2 Target Populations: International Requirements and National Implementation
The sampling frame for TEDS-M included all programs in target countries preparing persons to teach mathematics at primary and lower-secondary school levels. Both concurrent and consecutive programs were of interest. Programs were sampled within
countries, and then individuals were sampled from the programs. The international target population of TP institutions was defined as follows:
The set of secondary or post-secondary schools, colleges, or universities which offer
structured “opportunities to learn” (i.e., a program or programs) on a regular and frequent
basis to future teachers within a route of teacher preparation.1
The national research coordinators (NRCs) for each participating country were asked to list all routes where TP programs could be found and to indicate which were of principal interest (i.e., a major route) to TEDS-M and which were of marginal interest. Each NRC and the sampling team sought agreement as to which routes would constitute the national desired target population for the country of interest. Countries could also opt to exclude routes or institutions of very small size. (The remaining populations are referred to, within the context of TEDS-M, as the national defined target populations.) A TP institution did not have to be teaching mathematics content in order to be part of the target population. However, it was necessary for the institution to be teaching mathematics pedagogy.
The target population of educators was determined as all persons with regular, repeated responsibility for teaching future teachers within given TP programs. This target population could comprise up to three subpopulations:
• Educators of mathematics and mathematics pedagogy: persons responsible for teaching one or more of the program’s required courses in mathematics or mathematics pedagogy during the study’s data collection year at any stage of the institution’s TP program;
• General pedagogy educators: persons responsible for teaching one or more of the program’s required courses in foundations or general pedagogy (other than a mathematics or mathematics pedagogy course) during the study’s data-collection year at any stage of the institution’s teacher preparation program; and
• Educators belonging to both Groups 1 and 2 (as described above): persons responsible for teaching one or more of the program’s required courses in mathematics and/or mathematics pedagogy and/or general pedagogy during the study’s data-collection year at any stage of the institution’s teacher preparation program.
The target population of future teachers was to include all members of a route in their last year of training, enrolled in an institution offering formal opportunities to learn to teach mathematics and explicitly intended to prepare individuals qualified to teach mathematics in any of Grades 1 to 8.
TEDS-M distinguished between two different groups of future teachers: future teachers who would be certified to teach primary students (ISCED Level 1; primary or basic education, Cycle 1) and future teachers who would be certified to teach lower-secondary students (ISCED Level 2; lower-secondary or basic education, Cycle 2).2 TEDS-M refers to these two groups as two distinct “levels.”
1 Readers are also referred to the TEDS-M conceptual framework (Tatto, Schwille, Senk, Ingvarson, Peck, & Rowley, 2008) for key definitions.
2 ISCED levels as classified by UNESCO (1997).

261APPENDICES
In some countries, it is not possible to distinguish between primary and lower-
secondary levels. Teachers may be prepared for both levels because they will be expected
to teach at any level from Grade 1 to Grade 8 in the school where they eventually work.
Where this was the case, TEDS-M randomly selected some future teachers to complete
the knowledge tests and answer the survey for future primary teachers, and randomly
selected others to complete the tests and answer the survey targeting future lower-
secondary teachers.
B.1.3 Sample Size Requirements and Implementation
To allow for reliable estimation and modeling as well as some degree of non-response,
TEDS-M set the minimum sample size as:
• Fiftyinstitutionsperrouteandlevel;
• Thirty(orall)mathematicsandmathematicspedagogyeducators;and
• Thirty(orall)educatorsofgeneralpedagogyperselectedinstitution.
The study set an effective sample size as 400 future teachers per route and level in a given
country.3 “Effective sample size” means that the sample design must be as efficient (i.e.,
precise) as a simple random sample of 400 teachers from a (hypothetical) list of all
eligible future teachers found in a level and a route.
When the TEDS-M two-stage sample design was implemented, it was apparent that
the sample size required for each level and route was larger than the nominal 400. This
occurred because two-stage sample designs are typically less precise than a simple
random sample due to the clustering effect. The actual number of future teachers
required for each level and each route within the selected TP institutions and overall
was dictated mainly by the following:
• Thetotalnumberofinstitutionsinthecountry;
• Thesizesoftheinstitutionsinthecountry;and
• Theselectionmethodusedintheinstitutions.
TP institutions offering education to both future primary and future lower-secondary
school teachers could be part of both samples. Similarly, TP institutions offering more
than one route to students could be part of more than one sample. Twelve out of the 17
countries participating in TEDS-M identified fewer than 50 (or only slightly more than
50) eligible institutions; these countries conducted a census of institutions.
For operational purposes, TEDS-M divided each institution in the sample into
subgroups that were defined by level by route by program-type combinations. These
subgroups, called “teacher preparation units” (TPUs), comprised the actual programs
offered in a given institution.
Every future teacher in-scope for TEDS-M had to be allocated to exactly one and only
one TPU. The minimum sample size of future teachers within institutions was set to
30 future teachers per TPU. TPUs with fewer than 30 future teachers in their final year
3 The numbers 50 and 30 were set after discussion between the TEDS-M sampling referee and the international study center at Michigan State University in consultation with advisors to TEDS-M and with reference to knowledge gained from the pre-TEDS-M planning study. TEDS-M considered these numbers as reasonable given the expected population sizes in the countries and institutions of interest; it was expected that these numbers would already exceed the actual numbers in the countries and institutions. After more within-country exploration, the TEDS-M and within-country sampling experts ended up conducting censuses in most institutions. Note that IEA surveys use 400 as the “golden yardstick” with respect to estimating the prevalence of some feature (with p = 0.50, s(p) = 2.5%, and confidence intervals of 10% in width).

THE TEACHER EDUCATION AND DEVELOPMENT STUDY IN MATHEMATICS (TEDS-M)262
of study, or where the sampling of future teachers would have resulted in a sampling
fraction of more than 50%, were to be surveyed in full. In countries where the number
of TP institutions in a participating country was small, or where the institutions
themselves were small, on average, all eligible future teachers had to be selected for the
survey in order to reach the TEDS-M precision requirements. Exclusions could not
exceed five percent of the national desired target population.
B.1.4 Sample Selection
B.1.4.1 Sampling of institutions
Where required, TEDS-M used systematic random sampling within explicit strata,
according to the national sampling plans, to select samples of institutions. If reliable
measures of size for the institutions were available, TEDS-M applied sampling with
probability proportional to size (PPS). If the institutions were so small that censuses
of individuals within the institutions were expected, sampling with equal probabilities
was employed.
When implicit stratification was used, TEDS-M sorted institutions in explicit strata
by implicit strata and a measure of size prior to sampling. Whenever possible, two
replacement units were designated for each unit selected for the sample of the main
survey; this was applicable solely to the sample of institutions. Non-responding
individuals, teacher educators, and future teachers could not be replaced.
B.1.4.1.1 Sampling within institutions: teacher educators
For each selected institution, TEDS-M compiled a comprehensive list of eligible teacher
educators. Each teacher educator then had to be allocated to one of the teacher educator
groups. TEDS-M used software (WinW3S—within institution sampling software)
provided by the IEA Data Processing and Research Center (DPC) to select a systematic
random sample of at least 30 mathematics/mathematics-pedagogy teacher educators
and a systematic random sample of 30 general-pedagogy teacher educators. In many
institutions in all participating countries, TEDS-M had to conduct a census of teacher
educators because there were fewer than 30 such educators in given groups.
B.1.4.1.2 Sampling within institutions: future teachers
In order to select future teachers within TPUs, TEDS-M implemented two different
procedures, both of which required use of WinW3S:
1. Selection of whole-session groups: some TEDS-M participating countries (e.g.,
Germany, Chinese Taipei, the Russian Federation) or some selected institutions
were grouping future teachers together for organizational purposes. TEDS-M
called these groups “session groups.” In very large institutions, in particular,
TEDS-M found that it was sometimes operationally desirable and more convenient
to select whole-session groups instead of individual future teachers. The downside
of this sampling approach is that the sampling design is usually less efficient
because of the impact that clustering effects can have on such groups.
TEDS-M addressed this concern by appraising each situation and, when deemed
necessary, increasing the within-institution sample sizes. A comprehensive list
of session groups was compiled whenever this approach was used. Each eligible
future teacher in a TPU was allocated to one, and only one, session group. Next,
predetermined numbers of session groups were randomly selected with equal

263APPENDICES
probability. TEDS-M then asked all future teachers within the selected session
groups to participate in the study.
2. Selection of individual future teachers: TEDS-M compiled a comprehensive list of
eligible future teachers for each TPU and then randomly selected at least 30 (or all)
future teachers for that TPU.
All sampling procedures and processes were extensively documented either by the
sampling team (institution samples) or automatically by WinW3S. This approach
meant that every selection step could be reproduced at any time.
B.2 Participation Rates and Adjudication
The TEDS-M quality standards required minimum participation rates for all its target
populations. This requirement was necessary to ensure that any reported statistics
purporting to describe characteristics of those populations did indeed do this. The
aim of these standards was to ensure that bias resulting from non-response was kept
within acceptable limits. TEDS-M calculated and reported, separately for each country,
participation rates for the four TEDS-M target populations. Reports describing the
results for each target population consider the participation rate for that population
only.
In essence, the minimum requirement that TEDS-M had to meet in order to publish
statistical key data for international comparisons for each population was either
• that the overall (combined) participation rate (weighted or unweighted) of that
population was at least 75%
or
• thattheparticipationrate(weightedorunweighted)ofinstitutionsfortheconsidered
population and the participation rate for individuals within the participating
institutions were both at least 85%.
Chapter 11 of the TEDS-M technical report (Tatto, 2012, and also available on the
official TEDS-M website) provides a detailed description of the calculation procedures
for the different participation rates.
In this appendix we present an exhibit (Exhibit B.1 below) that summarizes all
adjudication comments for each participating country and for each of the four
TEDS-M survey populations (institutions, teacher educators, future primary teachers,
and future lower-secondary teachers). The sampling adjudication meetings took place
at the Michigan State International Research Center either as face-to-face meetings or
via teleconference. The meetings were attended by the study director and co-directors,
two sampling referees from Statistics Canada, and a representative of the IEA DPC’s
sampling team.
After completing the adjudication, the adjudication team made recommendations
on reporting TEDS-M data. For each country and for each data source (institutions,
teacher educators, future primary teachers, and future lower-secondary teachers), the
team judged the extent to which the IEA sampling standards had been met, and then
recommended which of the following annotations/actions should be implemented:
1. Reporting without any annotation: this comment applied if all participation-rate
requirements were met, the exclusion rate was below five percent, and full coverage
of the target population was observed.

THE TEACHER EDUCATION AND DEVELOPMENT STUDY IN MATHEMATICS (TEDS-M)264
2. Annotation because of low participation rates: this comment applied if the
participation rate was below the requirement but the combined participation rate
was still above 60%. Annotation was also advised if the exclusion rate exceeded five
percent or if reduced coverage of the target population was observed.
3. Participation rates lower than those stipulated in (2) above, and direct comparison
with other countries therefore not advisable: this comment was used if the combined
participation rate dropped below 60% but was still above 30%. These countries and
populations are signaled in TEDS-M reports via a color band that alerts readers to
the likelihood of participation introducing bias in the results.
4. Unacceptable: this comment refers to situations where the combined participation
rate dropped below 30% percent. Data for that country were not included in the
report.
Exhibit B.1 summarizes the results of the adjudication, with these results being used to
annotate the presentation of country-specific data as required in the TEDS-M reports.
Details of participation rates, samples, and populations sampled and samples achieved
are presented elsewhere in Appendix B.
B.3 Weights, Estimation, and Sampling Error
Selection of representative samples of institutions, future primary and future lower-
secondary teachers and their educators was a key component of the TEDS-M survey. As
an essential part of their sampling activities, NRCs provided detailed documentation
describing their national sampling plans (structure of mathematics teacher education
and educational institutions, including measures of size and the institution sampling
frame).
DPC staff selected the institution samples, but the national teams were responsible
for selecting the samples of future teachers and teacher educators within the selected
institutions. Teams used the WinW3S software provided by the IEA DPC to carry out
this work.
The DPC sampling team reviewed and completed all sampling documentation,
including details on coverage and exclusions, and stratification. This documentation
was also used to evaluate the quality of the samples.
The international sampling plan was prepared as a self-weighting design, which meant
that each individual would have the same final estimation weight. However, the actual
conditions in the field made that ideal plan impossible to execute. In the end, each
national sampling plan was deemed unique, with the total complement of plans ranging
from a stratified multi-stage probability sampling plan with unequal probabilities of
selection to a simple and complete census of all units of interest.
B.3.1 Computing Estimation Weights and Estimates
Most of the statistics produced for TEDS-M were derived from data obtained through
samples of institutions, educators, and future primary and future lower-secondary
school teachers being prepared to teach mathematics. If these statistics were to be
meaningful for a country, they needed to reflect the whole population from which they
were drawn and not merely the sample used to collect them.

265APPENDICES
Exh
ibit
B.1
: Sum
mar
y of
ann
otat
ion
reco
mm
enda
tion
s
Co
untr
ies
Inst
itut
ion
s Te
ache
r Ed
ucat
ors
Fu
ture
Pri
mar
y Te
ache
rs
Futu
re L
ow
er-S
eco
nd
ary
Teac
hers
bots
wan
a N
one
Non
e N
one
Non
e
Can
ada
(fou
r
Una
ccep
tabl
y lo
w p
artic
ipat
ion
rate
s.
Una
ccep
tabl
y lo
w p
artic
ipat
ion
rate
s.
Una
ccep
tabl
y lo
w p
artic
ipat
ion
rate
s.
Una
ccep
tabl
y lo
w p
artic
ipat
ion
rate
s.Pr
ovin
ces)
Th
e da
ta re
mai
n un
wei
ghte
d an
d ar
e Th
e da
ta re
mai
n un
wei
ghte
d an
d ar
e Th
e da
ta re
mai
n un
wei
ghte
d an
d ar
e Th
e da
ta re
mai
n un
wei
ghte
d an
d ar
e
no
t re
port
ed
not
repo
rted
no
t re
port
ed
not
repo
rted
Chi
le
Non
e Lo
w p
artic
ipat
ion
rate
s; d
ata
are
C
ombi
ned
part
icip
atio
n ra
te b
etw
een
60
Com
bine
d pa
rtic
ipat
ion
rate
bet
wee
n 60
high
light
ed to
mak
e re
ader
s aw
are
of
75 p
erce
nt.
75
perc
ent.
incr
ease
d lik
elih
ood
of b
ias.
Chi
nese
Tai
pei
Excl
usio
n ra
te >
5%
(ver
y sm
all
Non
e N
one
N
one
in
stitu
tions
wer
e ex
clud
ed).
Geo
rgia
N
one
Non
e N
one
Com
bine
d pa
rtic
ipat
ion
rate
bet
wee
n 60
and
75%
. An
exce
ptio
n w
as m
ade
to
ac
cept
dat
a fr
om t
wo
inst
itutio
ns b
ecau
se,
in
eac
h ca
se, o
ne a
dditi
onal
par
ticip
ant
wou
ld h
ave
brou
ght
the
resp
onse
rate
to
ab
ove
the
50%
thr
esho
ld.
Ger
man
y N
one
Low
par
ticip
atio
n ra
tes;
dat
a ar
e
Non
e N
one
high
light
ed to
mak
e ap
pare
nt th
e in
crea
sed
lik
elih
ood
of b
ias.
Sur
veys
of
inst
itutio
ns
and
teac
hers
wer
e no
t co
nnec
ted
with
su
rvey
of
educ
ator
s.
Mal
aysi
a Lo
w p
artic
ipat
ion
rate
s; d
ata
are
Lo
w p
artic
ipat
ion
rate
s; d
ata
are
Non
e N
one
hi
ghlig
hted
to m
ake
appa
rent
the
high
light
ed to
mak
e ap
pare
nt th
e in
crea
sed
incr
ease
d lik
elih
ood
of b
ias.
lik
elih
ood
of b
ias.
Nor
way
N
one
Part
icip
atio
n ra
tes
coul
d no
t be
cal
cula
ted;
C
ombi
ned
part
icip
atio
n ra
te b
etw
een
60
Low
par
ticip
atio
n ra
tes;
dat
a ar
e
da
ta re
mai
n un
wei
ghte
d an
d ar
e no
t
and
75%
. An
exce
ptio
n w
as m
ade
to
high
light
ed to
mak
e ap
pare
nt th
e in
crea
sed
re
port
ed.
acce
pt d
ata
beca
use
one
addi
tiona
l lik
elih
ood
of b
ias.
Pro
gram
-type
s “A
LU”
pa
rtic
ipan
t w
ould
hav
e br
ough
t th
e an
d “A
LU p
lus
mat
hem
atic
s” a
re p
artly
re
spon
se ra
te to
abo
ve t
he 5
0% t
hres
hold
. ov
erla
ppin
g po
pula
tions
; res
ults
der
ived
Pr
ogra
m-ty
pes
“ALU
” an
d “A
LU p
lus
from
ana
lysi
s ac
ross
pro
gram
-type
s sh
ould
m
athe
mat
ics”
are
par
tly o
verla
ppin
g be
con
duct
ed w
ith c
are
to a
void
und
ue
popu
latio
ns; a
naly
sis
acro
ss p
rogr
am-ty
pes
over
lap
of p
opul
atio
ns.
is
inap
prop
riate
bec
ause
of
this
ove
rlap.

THE TEACHER EDUCATION AND DEVELOPMENT STUDY IN MATHEMATICS (TEDS-M)266
Exh
ibit
B.1
: Sum
mar
y of
ann
otat
ion
reco
mm
enda
tion
s (c
ontd
.)
Co
untr
ies
Inst
itut
ion
s Te
ache
r Ed
ucat
ors
Fu
ture
Pri
mar
y Te
ache
rs
Futu
re L
ow
er-S
eco
nd
ary
Teac
hers
Om
an
Prov
ided
edu
catio
n fo
r fu
ture
Pr
ovid
ed e
duca
tion
for
futu
re s
econ
dary
N
ot a
pplic
able
N
one
se
cond
ary
teac
hers
onl
y at
the
tim
e of
te
ache
rs o
nly
at t
he t
ime
of te
stin
g.
test
ing.
Phili
ppin
es
Excl
usio
n ra
te >
5%
(ver
y sm
all
Non
e N
one
Non
e
inst
itutio
ns w
ere
excl
uded
).
Pola
nd
Inst
itutio
ns w
ith c
onse
cutiv
e pr
ogra
ms
C
ombi
ned
part
icip
atio
n ra
te b
etw
een
60
Com
bine
d pa
rtic
ipat
ion
rate
bet
wee
n 60
C
ombi
ned
part
icip
atio
n ra
te b
etw
een
60
only
wer
e no
t co
vere
d.
and
75%
; ins
titut
ions
with
con
secu
tive
and
75%
; ins
titut
ions
with
con
secu
tive
and
75%
; ins
titut
ions
with
con
secu
tive
pro
gram
s on
ly w
ere
not
cove
red.
pr
ogra
ms
only
wer
e no
t co
vere
d.
prog
ram
s on
ly w
ere
not
cove
red.
Russ
ian
fede
ratio
n Se
cond
ary
peda
gogi
cal i
nstit
utio
ns
Seco
ndar
y pe
dago
gica
l ins
titut
ions
Se
cond
ary
peda
gogi
cal i
nstit
utio
ns
An
unkn
own
perc
enta
ge o
f su
rvey
ed
wer
e no
t co
vere
d.
wer
e no
t co
vere
d.
wer
e no
t co
vere
d.
futu
re te
ache
rs w
ere
alre
ady
cert
ifica
ted
prim
ary
teac
hers
.
Sing
apor
e N
one
Non
e N
one
Non
e
Spai
n (P
rimar
y
Non
e N
one
Non
e N
ot a
pplic
able
Educ
atio
n O
nly)
Switz
erla
nd (G
erm
an-
Non
e Lo
w p
artic
ipat
ion
rate
s; d
ata
are
N
one
Non
e
Spea
king
Par
ts)
hi
ghlig
hted
to m
ake
appa
rent
the
in
crea
sed
likel
ihoo
d of
bia
s.
Thai
land
N
one
Non
e N
one
Non
e
Uni
ted
Stat
es
Non
e U
nacc
epta
bly
low
par
ticip
atio
n ra
tes;
dat
a
An
exce
ptio
n w
as m
ade
to a
ccep
t da
ta
Com
bine
d pa
rtic
ipat
ion
rate
bet
wee
n 60
(Pub
lic In
stitu
tions
)
rem
ain
unw
eigh
ted
and
are
not
repo
rted
fr
om t
wo
inst
itutio
ns b
ecau
se, i
n ea
ch
and
75%
onl
y. A
n ex
cept
ion
was
mad
e to
here
. ca
se, o
ne a
dditi
onal
par
ticip
ant
wou
ld
acce
pt d
ata
from
one
inst
itutio
n be
caus
e
have
bro
ught
the
resp
onse
rate
to a
bove
ra
te w
ithin
it w
as b
elow
50%
. Thi
s
the
50%
thr
esho
ld. I
tem
s w
ith lo
w
brou
ght
the
resp
onse
rate
to a
bove
the
resp
onse
s ar
e cl
early
mar
ked.
50
% t
hres
hold
.

267APPENDICES
In countries where censuses are conducted, it is sufficient to adjust the collected data for non-response in order to obtain unbiased estimates of the population parameters. When the sample design is complex and involves stratification and unequal probabilities of selection, estimation weights are required to achieve unbiased estimates (Lohr, 1999).
Estimation weights are the product of one or many design or base weights and one or many adjustment factors; the former are the inverse of the selection probability at each selection stage, and the latter compensate for non-response, again at each selection stage. These design weights and adjustment factors are specific to each stage of the sample design and to each explicit stratum. Because each country participating in TEDS-M had to adapt the general TEDS-M sample design to its own conditions, the estimation weights had to conform to the national adaptations.
Usually, one set of estimation weights is produced for each participating country. However, in the case of TEDS-M, four sets of estimation weights were required to reflect the various TEDS-M surveys: the institutions, the teacher educators, the future teachers of primary school mathematics, and the future teachers of lower-secondary school mathematics.
All estimates computed for any one of the four TEDS-M surveys were produced using the appropriate estimation weight, as developed by Horwitz-Thompson (Lohr, 1999). Chapter 11 of the IEA technical report (Tatto, 2012) provides a detailed description of how TEDS-M calculated the different weight components and the resulting estimation
weights for the four populations.
B.3.2 Estimating Sampling Error
Surveys with complex designs such as TEDS-M require special attention to estimation, especially estimation of the sampling error. Both the survey design and the unequal weights need to be taken into account in order to obtain (approximately) design-unbiased estimates of sampling error. (Failure to do this can lead to severe underestimation of the sampling error.)
TEDS-M adopted the balanced repeated replication (BRR) technique (McCarthy, 1966) to estimate sampling error. More specifically, TEDS-M used the variant of this technique known as Fay’s method (Fay, 1989). BRR is a well-established and documented technique that is used in other international educational studies, notably the Programme for International Student Assessment (PISA) and the Teaching and Learning International Survey (TALIS), both conducted by the Organisation for Economic Co-operation and Development (OECD). Chapter 11 of the TEDS-M technical report (Tatto, 2012) describes how the replicates were created and how the BRR estimates of sampling error were computed for TEDS-M. These estimates of the sampling error are another key
element of the statistical quality of survey outcomes.
Note: The need for precision
Reporting measures of precision are necessary to enable readers to evaluate the
confidence and accuracy of any given estimate. Exhibits B.2 to B.6 provide further
information on the results of the sampling processes.
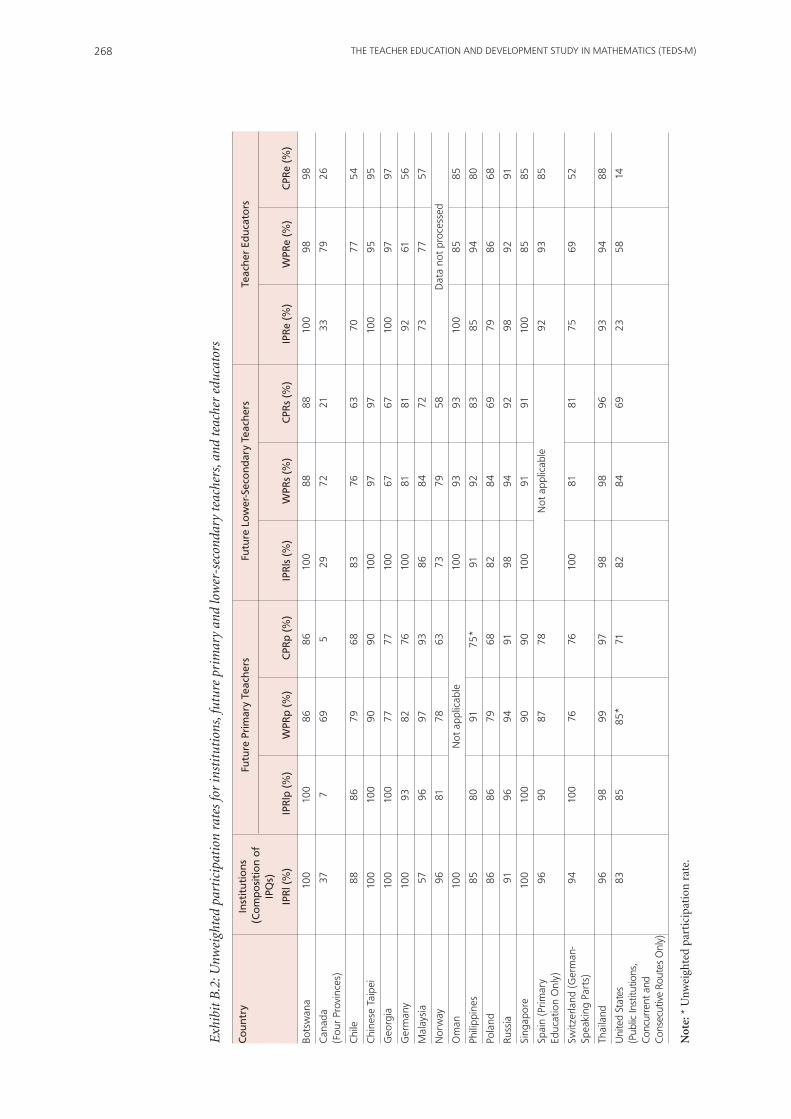
THE TEACHER EDUCATION AND DEVELOPMENT STUDY IN MATHEMATICS (TEDS-M)268
Exh
ibit
B.2
: Unw
eigh
ted
part
icip
atio
n ra
tes
for
inst
itut
ions
, fut
ure
prim
ary
and
low
er-s
econ
dary
teac
hers
, and
teac
her
educ
ator
s
Co
untr
y In
stit
utio
ns
Fu
ture
Pri
mar
y Te
ache
rs
Fu
ture
Lo
wer
-Sec
on
dar
y Te
ache
rs
Te
ache
r Ed
ucat
ors
(
Co
mp
osi
tio
n o
f
IP
Qs)
IP
Rl (
%)
IPR
lp (
%)
WPR
p (
%)
CPR
p (
%)
IPR
ls (
%)
WPR
s (%
) C
PRs
(%)
IPR
e (%
) W
PRe
(%)
CPR
e (%
)
bots
wan
a 10
0 10
0 86
86
10
0 88
88
10
0 98
98
Can
ada
37
7 69
5
29
72
21
33
79
26
(f
our
Prov
ince
s)
Chi
le
88
86
79
68
83
76
63
70
77
54
Chi
nese
Tai
pei
100
100
90
90
100
97
97
100
95
95
Geo
rgia
10
0 10
0 77
77
10
0 67
67
10
0 97
97
Ger
man
y 10
0 93
82
76
10
0 81
81
92
61
56
Mal
aysi
a 57
96
97
93
86
84
72
73
77
57
Nor
way
96
81
78
63
73
79
58
Dat
a no
t pr
oces
sed
Om
an
100
N
ot a
pplic
able
100
93
93
100
85
85
Phili
ppin
es
85
80
91
75*
91
92
83
85
94
80
Pola
nd
86
86
79
68
82
84
69
79
86
68
Russ
ia
91
96
94
91
98
94
92
98
92
91
Sing
apor
e 10
0 10
0 90
90
10
0 91
91
10
0 85
85
Spai
n (P
rimar
y 96
90
87
78
Not
app
licab
le
92
93
85
Educ
atio
n O
nly)
Switz
erla
nd (G
erm
an-
94
100
76
76
100
81
81
75
69
52
Sp
eaki
ng P
arts
)
Thai
land
96
98
99
97
98
98
96
93
94
88
Uni
ted
Stat
es
83
85
85*
71
82
84
69
23
58
14
(P
ublic
Inst
itutio
ns,
Con
curr
ent a
nd
Con
secu
tive
Rout
es O
nly)
Not
e: *
Unw
eigh
ted
part
icip
atio
n r
ate.

269APPENDICES
Exh
ibit
B.3
: Ins
titu
tion
s: e
xpec
ted
and
achi
eved
sam
ple
size
s
Co
untr
y N
umb
er o
f In
stit
utio
ns
Inel
igib
le In
stit
utio
ns
Tota
l Num
ber
of
Inst
itut
ion
s N
umb
er o
f Ex
pec
ted
IPQ
s N
umb
er o
f R
etur
ned
in
Ori
gin
al S
amp
le
Pr
ovid
ing
Res
po
nse
to
w
ithi
n P
arti
cip
atin
g IP
Qs
wit
hin
Par
tici
pat
ing
the
IPQ
In
stit
utio
ns
Inst
itut
ion
s
bots
wan
a
7 0
7 7
7
Can
ada
30
0 11
32
23
(f
our
Prov
ince
s)
Chi
le
50
10
35
42
38
Chi
nese
Tai
pei
19
0
19
19
19
Geo
rgia
10
0 10
17
17
Ger
man
y
16
0 16
51
51
Mal
aysi
a
34
4 17
33
20
Nor
way
47
2 43
43
43
Om
an
7
0 7
8 8
Phili
ppin
es
80
20
51
83
82
Pola
nd
92
1
78
130
125
Russ
ian
fede
ratio
n
58
1 52
98
88
Sing
apor
e
1 0
1 10
10
Spai
n (P
rimar
y
50
0 48
48
48
Ed
ucat
ion
Onl
y)
Switz
erla
nd (G
erm
an-
16
0
15
32
28
Spea
king
Par
ts)
Thai
land
46
0 44
53
51
Uni
ted
Stat
es
60
0
50
136
117
(P
ublic
Inst
itutio
ns,
Con
curr
ent
and
C
onse
cutiv
e Ro
utes
Onl
y)

THE TEACHER EDUCATION AND DEVELOPMENT STUDY IN MATHEMATICS (TEDS-M)270
Exh
ibit
B.4
: Fut
ure
prim
ary
teac
hers
: exp
ecte
d an
d ac
hiev
ed s
ampl
e si
zes
Co
untr
y N
umb
er o
f In
stit
utio
ns
Inel
igib
le In
stit
utio
ns
Tota
l Num
ber
of
Inst
itut
ion
s N
umb
er o
f Sa
mp
led
Fut
ure
Num
ber
of
Part
icip
atin
g
in O
rigi
nal
Sam
ple
that
Par
tici
pat
ed
Prim
ary
Teac
hers
in
Futu
re P
rim
ary
Pa
rtic
ipat
ing
Inst
itut
ion
s Te
ache
rs
bots
wan
a
4 0
4 10
0 86
Can
ada
28
0 2
52
36
(f
our
Prov
ince
s)
Chi
le
50
14
31
83
6 65
7
Chi
nese
Tai
pei
11
0
11
1,02
3 92
3
Geo
rgia
9 0
9 65
9 50
6
Ger
man
y
15
0 14
1,
261
1,03
2
Mal
aysi
a
28
4 23
59
5 57
6
Nor
way
32
0 26
70
9 55
1
Om
an
N
ot a
pplic
able
Phili
ppin
es
60
19
33
65
3 59
2
Pola
nd
91
0
78
2,67
3 2,
112
Russ
ian
fede
ratio
n
52
1 49
2,
403
2,26
6
Sing
apor
e
1 0
1 42
4 38
0
Spai
n (P
rimar
y
50
0 45
1,
259
1,09
3
Educ
atio
n O
nly)
Switz
erla
nd (G
erm
an-
14
0
14
1,23
0
936
Sp
eaki
ng P
arts
)
Thai
land
46
0
45
666
660
Uni
ted
Stat
es
60
0
51
1,80
7 1,
501
(P
ublic
Inst
itutio
ns,
C
oncu
rren
t an
d
C
onse
cutiv
e Ro
utes
Onl
y)

271APPENDICES
Exh
ibit
B.5
: Fut
ure
low
er-s
econ
dary
teac
hers
: exp
ecte
d an
d ac
hiev
ed s
ampl
e si
zes
Co
untr
y N
umb
er o
f In
stit
utio
ns
Inel
igib
le In
stit
utio
ns
Tota
l Num
ber
of
Inst
itut
ion
s N
umb
er o
f Sa
mp
led
Fut
ure
Num
ber
of
Part
icip
atin
g
in O
rigi
nal
Sam
ple
that
Par
tici
pat
ed
Low
er-S
eco
nd
ary
Teac
hers
in
Futu
re L
ow
er-
Pa
rtic
ipat
ing
Inst
itut
ion
s Se
con
dar
y Te
ache
rs
bots
wan
a
3 0
3 60
53
Can
ada
28
0 8
174
125
(fou
r Pr
ovin
ces)
Chi
le
50
10
33
97
7 74
6
Chi
nese
Tai
pei
21
2
19
375
365
Geo
rgia
6 0
6 11
6 78
Ger
man
y
13
0 13
95
2 77
1
Mal
aysi
a
7 0
6 46
2 38
9
Nor
way
47
2 33
72
4 57
2
Om
an
7
0 7
288
268
Phili
ppin
es
60
7
48
800
733
Pola
nd
28
0
23
355
298
Russ
ian
fede
ratio
n
50
1 48
2,
275
2,14
1
Sing
apor
e
1 0
1 43
1 39
3
Spai
n (P
rimar
y
Not
app
licab
le
Ed
ucat
ion
Onl
y)
Switz
erla
nd (G
erm
an-
6
0 6
174
141
Spea
king
Par
ts)
Thai
land
46
0 45
66
7 65
2
Uni
ted
Stat
es
59
3
46
726
607
(P
ublic
Inst
itutio
ns,
Con
curr
ent
and
C
onse
cutiv
e Ro
utes
Onl
y)

THE TEACHER EDUCATION AND DEVELOPMENT STUDY IN MATHEMATICS (TEDS-M)272
Exh
ibit
B.6
: Tea
cher
edu
cato
rs: e
xpec
ted
and
achi
eved
sam
ple
size
s
Co
untr
y N
umb
er o
f In
stit
utio
ns
Inel
igib
le In
stit
utio
ns
Tota
l Num
ber
of
Inst
itut
ion
s N
umb
er o
f Sa
mp
led
N
umb
er o
f Pa
rtic
ipat
ing
in
Ori
gin
al S
amp
le
th
at P
arti
cip
ated
Te
ache
r Ed
ucat
ors
in
Teac
her
Educ
ato
rs
Pa
rtic
ipat
ing
Inst
itut
ion
s
bots
wan
a
7 0
7 44
43
Can
ada
30
0 10
94
74
(fou
r Pr
ovin
ces)
Chi
le
50
10
28
51
0 39
2
Chi
nese
Tai
pei
19
0
19
205
195
Geo
rgia
10
0 10
64
62
Ger
man
y
50
0 46
79
2 48
2
Mal
aysi
a
34
4 22
33
0 25
5
Nor
way
Dat
a no
t pr
oces
sed
Om
an
7
0 7
99
84
Phili
ppin
es
80
20
51
62
6 58
9
Pola
nd
92
1
72
857
734
Russ
ian
fede
ratio
n
58
1 56
1,
311
1,21
2
Sing
apor
e
1 0
1 91
77
Spai
n (P
rimar
y
50
0 46
57
4 53
3
Ed
ucat
ion
Onl
y)
Switz
erla
nd (G
erm
an-
16
0
12
318
220
Spea
king
Par
ts)
Thai
land
46
0 43
33
1 31
2
Uni
ted
Stat
es
60
0
14
407
241
(Pub
lic In
stitu
tions
,
Con
curr
ent
and
C
onse
cutiv
e Ro
utes
Onl
y)

273APPENDICES
B.4 Calibration and Scale Development
B.4.1 Methods Used to Determine MCK and MPCK Scales and Anchor Points
The TEDS-M tests of future teachers’ mathematics content knowledge (MCK) and
mathematics pedagogical content knowledge (MPCK) used a balanced-incomplete-
block design so that the desired content would be well covered while simultaneously
allowing the test to be completed within a reasonable administration time. Achieving
this aim meant that each future teacher was given only a portion of the full set of
items.
Because the set of items taken by each teacher was not comparable, summing the scores
on the items taken by that person would not have yielded meaningful results. If summed
scores were to be comparable, all of the test booklets would have to be constructed to be
equivalent in content and difficulty. This was not possible because of the complexity of
the content domains. To obtain comparable estimates of performance, TEDS-M used
item response theory (IRT). IRT allows estimates of performance to be obtained on
the same scale even when the set of items taken by each individual is different. (For a
description of IRT methodology, see, for example, De Ayala, 2009.)
B.4.2 Calibrations and Weights
TEDS-M used item response models from the Rasch family to carry out calibration.
The standard Rasch (1980) model was used for the dichotomous items, and the partial
credit model (Masters, 1982) was used to fit the matrix of item scores for the polytomous
items. Both item types were analyzed simultaneously using ACER Conquest software
(Wu, Adams, Wilson, & Haldane, 2007).
B.4.2.1 Confirmation of calibration procedures
At each stage of the calibration, analyses were conducted at the Australian Council
for Educational Research (ACER) and the results were then sent to the TEDS-M
international study center at Michigan State University. Although the TEDS-M
researchers at both institutions agreed on the details of the calibration (e.g., what items
to include and exclude, how to treat missing data), the two centers conducted their
analyses independently and then compared results. If results differed, the reasons were
identified and the analyses repeated until agreement was reached.
B.4.3 Score Generation
Once calibration had been completed, TEDS-M used the item parameter estimates
to estimate achievement for each respondent. In accordance with standard practice,
items at the end of blocks without responses were considered as “not reached.” TEDS-M
treated these items as “missing” in the calibration but scored them as “incorrect” when
estimating scores for individuals.

THE TEACHER EDUCATION AND DEVELOPMENT STUDY IN MATHEMATICS (TEDS-M)274
B.4.4 Standardization
The calibration data were used to carry out standardization. TEDS-M standardized the achievement estimates (in logits) to a mean of 500 and a standard deviation of 100, in line with the procedure followed in TIMSS, wherein all countries are weighted so that they contribute equally to the standardization sample. This process was repeated for each of the four key measures: MCK (primary), MCK (lower-secondary), MPCK (primary), and MPCK (lower-secondary).
Once standardization was completed, scores were computed for all participants for whom MCK and MPCK estimates could be obtained, including those participants not included in the final sample. The mean of 500 and the standard deviation of 100 thus apply to the calibration sample rather than to the complete set of scores. Exhibit B7
provides information about the assessment reliabilities.
Primary MCK
Sample Mean Standard Deviation Reliability Standard Error of Measurement
International 0.078 1.156 0.83 0.482
Primary MPCK
Sample Mean Standard Deviation Reliability Standard Error of Measurement
International -0.060 1.024 0.66 0.594
Lower-Secondary MCK
Sample Mean Standard Deviation Reliability Standard Error of Measurement
International 0.120 1.110 0.91 0.331
Lower-Secondary MPCK
Sample Mean Standard Deviation Reliability Standard Error of Measurement
International 0.087 1.223 0.72 0.644
Exhibit B.7: TEDS-M assessment reliabilities
B.4.5 Developing Anchor Points
The calibration results were also used to identify anchor points for the score scale. Anchor points are specific values on the score scale, each of which pertains to a description of what examinees at this point know and can do. TEDS-M identified two sets of test items to support development of the descriptions of the skills and knowledge at each anchor point.
The first set of test items contained those items that a person at that anchor point on the scale score would, according to the IRT model, be able to answer correctly with a probability of 0.70 or greater. The second set of test items included those items that a person at that anchor point on the scale score would, based on the IRT model, have a probability of 0.50 or less of answering correctly.
The anchor points selected were those for which there would be sufficient items of each type (between 10 and 12 items) to develop a description of the skills and knowledge that a person at that anchor point would have. Given these requirements, two anchor points were identified for the MCK primary scale and two for the MCK lower-secondary scale: Anchor Point 1 represented a lower level of performance, and Anchor Point 2 represented a higher level. Only one anchor point was selected for the MPCK scales
because TEDS-M had fewer items measuring MPCK than MCK.

275APPENDICES
In order to develop descriptions of the capabilities of persons near each anchor point
on the scales, committees of mathematicians and mathematics educators conducted
detailed analyses of the sets of items for the respective anchor points. They did this
work in workshops specifically set up for this purpose at the international research
center at Michigan State University. The resulting anchor point descriptions give
tangible meaning to points on the reporting score scales. They can be found in Chapter
6 of this report. A more detailed description is included in the TEDS-M technical report
(Tatto, 2012).
B.5 Reporting Knowledge-Scale Scores
Although the mathematical content knowledge (MCK) measures (assessments) were
different for the future primary teachers and the future lower-secondary teachers, and
different from the mathematical pedagogical content knowledge (MPCK) measures, all
were standardized in the same way. Readers unfamiliar with methodological detail may
therefore consider findings generated by these measures comparable. In order to avoid
the possibility of confusion, we report the findings pertaining to each scale separately,
and none of our exhibits in this report lines up primary against secondary, or MCK
against MPCK.
B.5.1 Country Comparisons
TEDS-M acknowledges that “teacher education is understood and structured differently
across national settings and even between institutions in the same country” (Tatto et
al., 2008, p. 17). The initial chapters of this report detailed the many ways in which the
structure of teacher education programs differs across the 17 TEDS-M countries. It is
clear from this report that, within the two populations of future teachers (primary and
lower-secondary), there were substantial differences in the teaching roles for which the
future teachers were being prepared.
Among those future teachers who would qualify to become primary teachers, for
example, most would qualify as generalist teachers across all primary levels, which,
depending on the country, might be Grades 6, 7, or 8. Others would become generalist
primary teachers qualified to teach classes no higher than Grade 4. And others again
would qualify as specialist teachers of mathematics, able to teach throughout the
primary school level and, in some cases, on into the secondary school level as well.
Similarly, among those who would qualify to teach mathematics in junior secondary
school, some would be qualified to teach only up to Grade 8 while others would be
mathematics specialists qualified to teach to Grade 12 and beyond.
In other IEA studies, such as TIMSS, for example, the population definitions yield a
more consistent pattern of participants across countries. In TIMSS, the two populations
of interest (fourth- and eighth-grade students) have a high degree of commonality
across countries. TIMSS reports make clear that the samples chosen at each of these
levels differ very little across countries with respect to their average age4 and their years
of schooling at the time of testing. When reporting TIMSS results, therefore, it makes
sense to compare whole countries.
4 The definition given to grade level in TIMSS is actually designed to ensure that this is so.

THE TEACHER EDUCATION AND DEVELOPMENT STUDY IN MATHEMATICS (TEDS-M)276
While it is equally possible in TEDS-M to compare countries, the intent of the study
has always been to conduct country comparisons only within the context of program-
group. Nevertheless, when a country such as Chinese Taipei or the Russian Federation
has only one program-type at the primary and one at the lower-secondary level, it is
not possible to avoid whole-country rankings. But again, whole-country comparisons
per se are not the key purpose of TEDS-M because they typically compare like with
unlike. The presentation of TEDS-M results is directed, as far as possible, at comparing
like with like—in this case, teachers who are being prepared to undertake similar roles
once they qualify.
B.5.2 Program-Groups
The programs that future teachers undertake can be grouped according to the level
at which these individuals will qualify to teach, and the degree of specialization in
the teaching role that they qualify to undertake. Exhibits B.8 and B.9 show how these
program-groups differ from one country to another.
The two exhibits present clearly identifiable program-groups—four at the primary level
and two at the secondary level. These are, as annotated on the tables:
• Futureprimaryteachergroups:
1. Generalists, no higher than Grade 4
2. Generalists, no higher than Grade 6
3. Generalists, no higher than Grade 10
4. Mathematics specialists.
• Futuresecondaryteachers:
5. Lower secondary, no higher than Grade 10
6. Lower and upper secondary, above Grade 10.
These groupings were used as the basis for reporting MCK and MPCK score summaries.
The summaries presented in this report and elsewhere include:
• Tablesofmeans,standarddeviations,andstandarderrors,byprogram-groupsand
by country, and indicating the number of cases and percent of missing cases. In these
tables, the standard errors are calculated as described in Section B.3.2 of this report.
The IDB analyzer was used for these calculations.
• Standardbox-plots,usedtoportraywholedistributionsandpresentingthemedian,
the 25th and 75th percentiles, and the range (excluding outliers). In the exhibits,
overlay lines on the box-plots indicate the anchor points on the score scales.

277APPENDICES
Exh
ibit
B.8
: Pro
gram
-typ
es a
nd g
roup
ings
: fut
ure
prim
ary
teac
hers
Pro
gra
m-G
roup
C
oun
try
Pro
gra
ms
Num
ber
of
G
rad
e Sp
an
R
esp
on
den
ts
Geo
rgia
ba
chel
or in
Ped
agog
y (4
yea
rs)
485
1–4
ba
chel
or in
Ped
agog
y (5
yea
rs)
21
1–4
Ger
man
y Te
ache
rs fo
r G
rade
s 1-
4 w
ith M
athe
mat
ics
as T
each
ing
Subj
ect
(Typ
e 1A
) 36
0 1–
4
Te
ache
rs fo
r G
rade
s 1-
4 w
ithou
t M
athe
mat
ics
as T
each
ing
Subj
ect
(Typ
e 1b
) 16
2 1–
4
Te
ache
rs fo
r G
rade
s 1-
10 w
ithou
t M
athe
mat
ics
as T
each
ing
Subj
ect
(Typ
e 2b
) 41
3 1–
4
Pola
nd
bach
elor
of
Peda
gogy
Inte
grat
ed T
each
ing,
firs
t cy
cle
(ful
l-tim
e pr
ogra
ms)
; Yea
rs: 3
51
0 1–
3
M
aste
r of
Art
s In
tegr
ated
Tea
chin
g, lo
ng c
ycle
(ful
l-tim
e pr
ogra
ms)
; Yea
rs: 5
26
8 1–
3
ba
chel
or o
f Pe
dago
gy In
tegr
ated
Tea
chin
g, fi
rst
cycl
e (p
art-
time
prog
ram
s); Y
ears
: 3
828
1–3
M
aste
r of
Art
s In
tegr
ated
Tea
chin
g, lo
ng c
ycle
(par
t-tim
e pr
ogra
ms)
; Yea
rs: 5
20
6 1–
3
Russ
ian
fede
ratio
n Pr
imar
y Te
ache
r Ed
ucat
ion
2,26
6 1–
4
Switz
erla
nd
Teac
hers
for
Gra
des
1-2/
3 (K
inde
rgar
ten
and
Gra
des
1–2)
75
1–
2/3
(Ger
man
-spe
akin
g pa
rts)
Te
ache
rs fo
r G
rade
s 1-
2/3
(Kin
derg
arte
n an
d G
rade
1–3
) 46
1–
2/3
Chi
nese
Tai
pei
Elem
enta
ry T
each
er E
duca
tion
923
1–6
Phili
ppin
es
bach
elor
in E
lem
enta
ry E
duca
tion
592
1–6
Sing
apor
e D
iplo
ma
of E
duca
tion,
Prim
ary
Opt
ion
C
107
1–6
ba
chel
or o
f A
rts
in E
duca
tion,
Prim
ary
31
1–
6
ba
chel
or o
f Sc
ienc
e in
Edu
catio
n, P
rimar
y 36
1–
6
Po
st-G
radu
ate
Dip
lom
a in
Edu
catio
n, P
rimar
y O
ptio
n C
89
1–
6
Spai
n Te
ache
r of
Prim
ary
Educ
atio
n 1,
093
1–6
(P
rimar
y Ed
ucat
ion
Onl
y)
Switz
erla
nd
Teac
hers
for
Prim
ary
Scho
ol (G
rade
s 1-
6) (K
inde
rgar
ten
and
Gra
des
1–6)
23
5 1–
6
(Ger
man
-Spe
akin
g Pa
rts)
Te
ache
rs fo
r Pr
imar
y Sc
hool
(Gra
des
1-6)
55
6 1–
6
Te
ache
rs fo
r Pr
imar
y Sc
hool
(Gra
des
3-6)
24
3–
6
Uni
ted
Stat
es
Prim
ary
Con
curr
ent
1,13
7 1–
3/4/
5
(Pub
lic In
stitu
tions
) Pr
imar
y C
onse
cutiv
e
173
1–3/
4/5
Prog
ram
-Typ
e 2.
Prim
ary
(to
Gra
de 6
M
axim
um)
Prog
ram
-Typ
e 1.
Low
er P
rimar
y
(to
Gra
de 4
M
axim
um)

THE TEACHER EDUCATION AND DEVELOPMENT STUDY IN MATHEMATICS (TEDS-M)278
Exh
ibit
B.8
: Pro
gram
-typ
es a
nd g
roup
ings
: fut
ure
prim
ary
teac
hers
(co
ntd.
)
Pro
gra
m-G
roup
C
oun
try
Pro
gra
ms
Num
ber
of
G
rad
e Sp
an
R
esp
on
den
ts
bots
wan
a D
iplo
ma
in P
rimar
y Ed
ucat
ion
86
1–7
Chi
le
Gen
eral
ist
657
1–8
Nor
way
G
ener
al T
each
er E
duca
tion
(ALU
) with
out
Mat
hem
atic
s O
ptio
n 39
2 1–
10
G
ener
al T
each
er E
duca
tion
(ALU
) with
Mat
hem
atic
s O
ptio
n 15
9 1–
10
Ger
man
y Te
ache
rs o
f G
rade
s 1-
9/10
with
Mat
hem
atic
s as
Tea
chin
g Su
bjec
t (T
ype
2A)
97
1–9/
10
Mal
aysi
a M
alay
sian
Dip
lom
a of
Tea
chin
g (M
athe
mat
ics)
51
2 1–
6
ba
chel
or o
f Ed
ucat
ion,
Prim
ary
17
1–6
D
iplo
ma
of E
duca
tion
(Mat
hem
atic
s)
47
1–6
Pola
nd
bach
elor
of
Art
s in
Mat
hem
atic
s, fi
rst
cycl
e (f
ull-t
ime
teac
her
educ
atio
n pr
ogra
ms)
; Yea
rs: 3
13
4 4–
9
M
aste
r of
Art
s in
Mat
hem
atic
s, lo
ng c
ycle
(ful
l-tim
e te
ache
r ed
ucat
ion
prog
ram
s); Y
ears
: 5
123
4–12
ba
chel
or o
f A
rts
in M
athe
mat
ics,
firs
t cy
cle
(par
t-tim
e te
ache
r ed
ucat
ion
prog
ram
s); Y
ears
: 3
20
4–9
M
aste
r of
Art
s in
Mat
hem
atic
s, lo
ng c
ycle
(par
t-tim
e te
ache
r ed
ucat
ion
prog
ram
s); Y
ears
: 5
23
4–12
Sing
apor
e D
iplo
ma
of E
duca
tion,
Prim
ary
Opt
ion
A
45
1–6
Po
st-G
radu
ate
Dip
lom
a in
Edu
catio
n, P
rimar
y O
ptio
n A
72
1–
6
Thai
land
ba
chel
or o
f Ed
ucat
ion
599
1–12
G
radu
ate
Dip
lom
a in
Tea
chin
g Pr
ofes
sion
61
1–
12
Uni
ted
Stat
es
Prim
ary
+ Se
cond
ary
Con
curr
ent
18
4 4/
5–8/
9
(Pub
lic In
stitu
tions
) Pr
imar
y +
Seco
ndar
y C
onse
cutiv
e
7 4/
5–8/
9
Prog
ram
-Typ
e 3.
Prim
ary/
Low
er
Seco
ndar
y (t
o G
rade
4
Max
imum
Prog
ram
-Typ
e 4.
Prim
ary
Mat
hem
atic
s Sp
ecia
lists

279APPENDICES
bots
wan
a D
iplo
ma
in S
econ
dary
Edu
catio
n, C
olle
ges
of E
duca
tion
34
8–10
Chi
le
Gen
eral
ist
648
1–8
G
ener
alis
t w
ith f
urth
er m
athe
mat
ics
educ
atio
n 98
5–
8
Ger
man
y Te
ache
rs o
f G
rade
s 1–
9/10
with
Mat
hem
atic
s as
Tea
chin
g Su
bjec
t (T
ype
2A)
87
1–9/
10
Te
ache
rs fo
r G
rade
s 5/
7–9/
10 w
ith M
athe
mat
ics
as T
each
ing
Subj
ect
(Typ
e 3)
32
1 5/
7–9/
10
Nor
way
G
ener
al T
each
er E
duca
tion
(ALU
) with
out
Mat
hem
atic
s O
ptio
n 35
6 1–
10
G
ener
al T
each
er E
duca
tion
(ALU
) with
Mat
hem
atic
s O
ptio
n 15
1 1–
10
Phili
ppin
es
bach
elor
in S
econ
dary
Edu
catio
n 73
3 7–
10
Pola
nd
bach
elor
of
Art
s in
Mat
hem
atic
s, fi
rst
cycl
e (f
ull-t
ime
teac
her
educ
atio
n pr
ogra
ms)
; Yea
rs: 3
13
5 4–
9
ba
chel
or o
f A
rts
in M
athe
mat
ics,
firs
t cy
cle
(par
t-tim
e te
ache
r ed
ucat
ion
prog
ram
s); Y
ears
: 3
23
4–9
Sing
apor
e Po
st-G
radu
ate
Dip
lom
a in
Edu
catio
n, L
ower
Sec
onda
ry,
Janu
ary
2007
inta
ke
50
7–8
Po
st-G
radu
ate
Dip
lom
a in
Edu
catio
n, L
ower
Sec
onda
ry, J
uly
2007
inta
ke
92
7–8
Switz
erla
nd
Teac
hers
for
Seco
ndar
y Sc
hool
(Gra
des
7-9)
14
1 7–
9
(Ger
man
-Spe
akin
g Pa
rts)
Uni
ted
Stat
es
Prim
ary
+ Se
cond
ary
Con
curr
ent
16
1 4/
5–8/
9
(Pub
lic In
stitu
tions
) Pr
imar
y +
Seco
ndar
y C
onse
cutiv
e
8 4/
5–8/
9
Exh
ibit
B.9
: Pro
gram
typ
es a
nd g
roup
ings
: fut
ure
seco
ndar
y te
ache
rs
Pro
gra
m-G
roup
C
oun
try
Pro
gra
ms
Num
ber
of
G
rad
e Sp
an
R
esp
on
den
ts
Prog
ram
Typ
e 5:
Low
er-S
econ
dary
(t
o G
rade
10
Max
imum
)
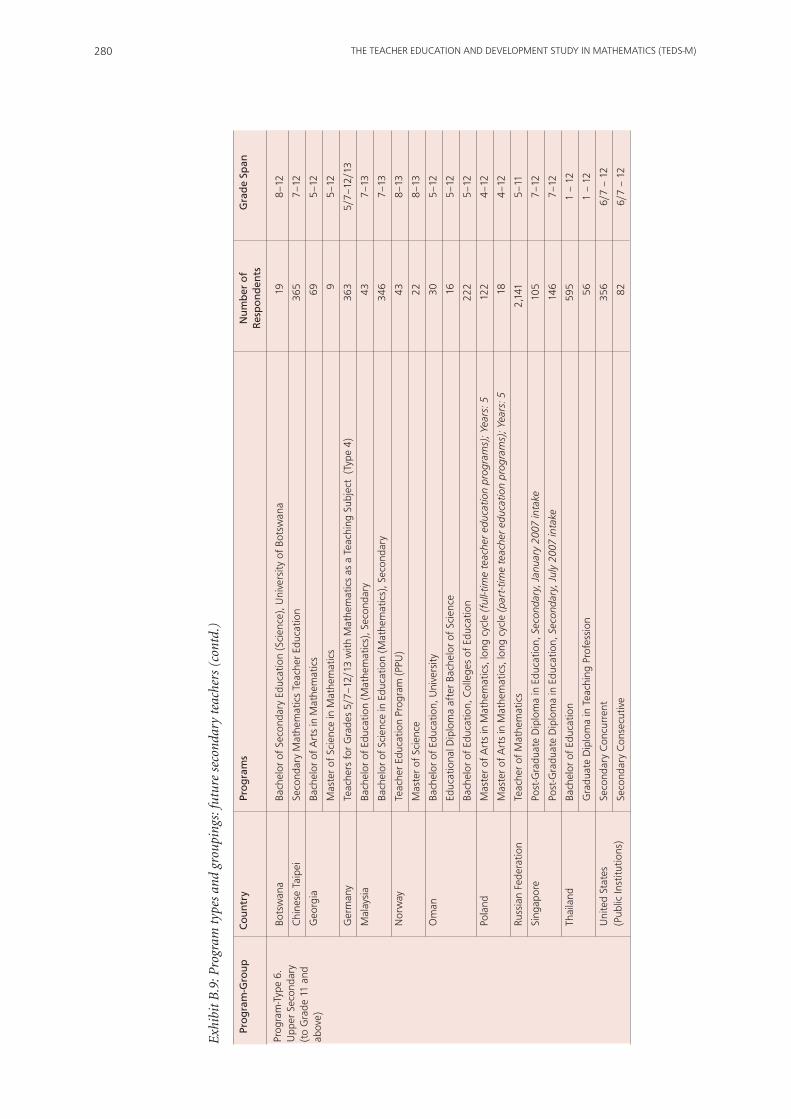
THE TEACHER EDUCATION AND DEVELOPMENT STUDY IN MATHEMATICS (TEDS-M)280
Exh
ibit
B.9
: Pro
gram
typ
es a
nd g
roup
ings
: fut
ure
seco
ndar
y te
ache
rs (
cont
d.)
P
rog
ram
-Gro
up
Co
untr
y Pr
og
ram
s N
umb
er o
f
Gra
de
Span
Res
po
nd
ents
bots
wan
a ba
chel
or o
f Se
cond
ary
Educ
atio
n (S
cien
ce),
Uni
vers
ity o
f bo
tsw
ana
19
8–12
Chi
nese
Tai
pei
Seco
ndar
y M
athe
mat
ics
Teac
her
Educ
atio
n 36
5 7–
12
Geo
rgia
ba
chel
or o
f A
rts
in M
athe
mat
ics
69
5–12
M
aste
r of
Sci
ence
in M
athe
mat
ics
9 5–
12
Ger
man
y Te
ache
rs fo
r G
rade
s 5/
7–12
/13
with
Mat
hem
atic
s as
a T
each
ing
Subj
ect
(Typ
e 4)
36
3 5/
7–12
/13
Mal
aysi
a ba
chel
or o
f Ed
ucat
ion
(Mat
hem
atic
s), S
econ
dary
43
7–
13
ba
chel
or o
f Sc
ienc
e in
Edu
catio
n (M
athe
mat
ics)
, Sec
onda
ry
346
7–13
Nor
way
Te
ache
r Ed
ucat
ion
Prog
ram
(PPU
) 43
8–
13
M
aste
r of
Sci
ence
22
8–
13
Om
an
bach
elor
of
Educ
atio
n, U
nive
rsity
30
5–
12
Ed
ucat
iona
l Dip
lom
a af
ter
bach
elor
of
Scie
nce
16
5–12
ba
chel
or o
f Ed
ucat
ion,
Col
lege
s of
Edu
catio
n 22
2 5–
12
Pola
nd
Mas
ter
of A
rts
in M
athe
mat
ics,
long
cyc
le (f
ull-t
ime
teac
her
educ
atio
n pr
ogra
ms)
; Yea
rs: 5
12
2 4–
12
M
aste
r of
Art
s in
Mat
hem
atic
s, lo
ng c
ycle
(par
t-tim
e te
ache
r ed
ucat
ion
prog
ram
s); Y
ears
: 5
18
4–12
Russ
ian
fede
ratio
n Te
ache
r of
Mat
hem
atic
s 2,
141
5–11
Sing
apor
e Po
st-G
radu
ate
Dip
lom
a in
Edu
catio
n, S
econ
dary
, Jan
uary
200
7 in
take
10
5 7–
12
Po
st-G
radu
ate
Dip
lom
a in
Edu
catio
n, S
econ
dary
, Jul
y 20
07 in
take
14
6 7–
12
Thai
land
ba
chel
or o
f Ed
ucat
ion
595
1 –
12
G
radu
ate
Dip
lom
a in
Tea
chin
g Pr
ofes
sion
56
1
– 12
Uni
ted
Stat
es
Seco
ndar
y C
oncu
rren
t
356
6/7
– 12
(Pub
lic In
stitu
tions
) Se
cond
ary
Con
secu
tive
82
6/7
– 12
Prog
ram
-Typ
e 6.
Upp
er S
econ
dary
(t
o G
rade
11
and
abov
e)

281APPENDICES
B.6 Methods Used to Determine the Opportunity to Learn and Beliefs Scales and Reporting
B.6.1 Opportunity to Learn Measures
Opportunity to learn (OTL) measures were based on scales and items developed in
a variety of ways. Several were based on previous research conducted at Michigan
State University and elsewhere. Some were based on previous research conducted at
the Australian Council for Educational Research (ACER), and some were developed
specifically for TEDS-M, in collaborative workshops and meetings which included the
researchers in the international research centers at Michigan State University and ACER,
and in the national research centers in the participating countries.
After completing an extensive pilot of a larger set of items, TEDS-M researchers selected
items that appeared to provide information on program, institution, and country
variation. Items that survived initial exploratory factor analyses were used in the
operational forms for the main study.
The researchers then conducted a confirmatory factor analysis (described more fully
below) that was based on a preconceived conceptualization of OTL as encompassing
four broad categories relating to mathematics content areas: tertiary and school-level
mathematics, mathematics education pedagogy, general education pedagogy, and
school-based experiences. The aim of the analysis was to assess the fit of each OTL index
(measure) to the data and the index interrelations. Each of the four broad categories
contained several indices, which taken together across the categories resulted in 24
individual, distinct OTL indices.
Using as their reference the best-fitting models, the researchers then created OTL index
scores. The OTL indices for topics studied (mathematics content, mathematics pedagogy,
and general pedagogy) were derived from summing the number of topics studied.
Rasch logit scores were estimated for the OTL indices using rating scales (e.g., activities
in which future teachers participated from “never” to “often”). These scores (described
more fully below) were centered at the point on the OTL scale that is associated with
the middle of the rating scale (essentially “neutral”). More explicitly, this step involved
using the test characteristic curve to identify the point on the θ-scale associated with
the midpoint on the summed score scale. The θ-value was used to center the OTL scale
so that it would be located at a scaled value of 10.
All OTL scales consisting of number of topics are interpretable given the number of
topics within each scale; the research team used mean proportions to report outcomes in
terms of number of topics studied for each OTL index (for instance, a mean proportion
of .52 would indicate that about half of the future teachers reported studying a given
topic).
All OTL scales based on Rasch logit scores can be interpreted given the location of the
mid-point, where 10 is associated with the “neutral” position. Thus, for example, the
median score on the scale teaching for diversity in a given program is 12.2, indicating a
moderately high level of OTL.

THE TEACHER EDUCATION AND DEVELOPMENT STUDY IN MATHEMATICS (TEDS-M)282
Exh
ibit
B.1
0: O
ppor
tuni
ty to
lear
n in
dice
s
OTL
Ind
ex L
abel
Prim
ary
and
Sec
on
dar
y In
dic
es
Te
ache
r Ed
ucat
or
Ind
ices
Sect
ion
B Ite
m L
ette
r Va
riabl
e N
ame
Sect
ion
and
Ite
m L
ette
r Va
riabl
e N
ame
Q
uest
ion
No.
Q
uest
ion
No.
Tert
iary
-Lev
el M
athe
mat
ics–
geom
etry
Q
1 A
, b, C
, D
Mfb
1GEO
M
Non
e
Tert
iary
-Lev
el M
athe
mat
ics–
disc
rete
str
uctu
res
and
logi
c
f, G
, H, I
, P, S
M
fb1D
ISC
N
one
Tert
iary
-Lev
el M
athe
mat
ics–
cont
inui
ty a
nd f
unct
ions
J, K
, L, M
, N
Mfb
1CO
NT
Non
e
Tert
iary
-Lev
el M
athe
mat
ics–
prob
abili
ty a
nd s
tatis
tics
Q
, R
Mfb
1PRS
T N
one
Scho
ol-L
evel
Mat
hem
atic
s–nu
mbe
rs, m
easu
rem
ent,
geo
met
ry
Q2
A–C
M
fb2S
LMN
N
one
Scho
ol-L
evel
Mat
hem
atic
s—fu
nctio
ns, p
roba
bilit
y, c
alcu
lus
D
–G
Mfb
2SLM
f N
one
Mat
hem
atic
s Ed
ucat
ion
peda
gogy
—fo
unda
tions
Q
4 A
–C
Mfb
4fO
UN
N
one
Mat
hem
atic
s Ed
ucat
ion
Peda
gogy
—in
stru
ctio
n
D–H
M
fb4I
NST
N
one
Mat
hem
atic
s Ed
Ped
agog
y—cl
ass
part
icip
atio
n Q
5 b–
f M
fb5P
ART
I1
b-
f M
EI1P
ART
Mat
hem
atic
s Ed
Ped
agog
y—cl
ass
read
ing
H
–K
Mfb
5REA
D
I1
H-K
M
EI1R
EAD
Mat
hem
atic
s Ed
Ped
agog
y—so
lvin
g pr
oble
ms
L–
O
Mfb
5SO
LV
I1
L-O
M
EI5S
OLV
Mat
hem
atic
s Ed
Ped
agog
y—in
stru
ctio
nal p
ract
ice
Q6
L, N
, Q, R
, T, Z
M
fb6I
PRA
G
2 C
, E-I
MEG
2IPR
A
Mat
hem
atic
s Ed
Ped
agog
y—in
stru
ctio
nal p
lann
ing
A
, G–K
, X
Mfb
6IPL
A
I3
A, E
-I, P
M
EI3I
PLA
Mat
hem
atic
s Ed
Ped
agog
y—as
sess
men
t us
es
Q6
O, P
, U, V
, W
Mfb
6AU
SE
I3
J, K
, M-O
M
EI3A
USE
Mat
hem
atic
s Ed
Ped
agog
y—as
sess
men
t pr
actic
e
b–f
Mfb
6APR
A
G2
A-b
M
EG2A
PRA
I3
C-D
Educ
atio
n Pe
dago
gy—
soci
al s
cien
ce
Q7
A–C
M
fb7E
PSS
Non
e
Educ
atio
n Pe
dago
gy—
appl
icat
ion
D
–H
Mfb
7EPA
P N
one
Teac
hing
for
Div
ersi
ty
Q8
A–f
M
fb8D
VRS
H
2 A
-f
MEH
2DV
RS
Teac
hing
for
Refle
ctio
n on
Pra
ctic
e Q
89
8G–J
M
fb8R
EfL
H2
G-J
MEH
2REf
L
Teac
hing
for
Impr
ovin
g Pr
actic
e
9E–L
M
fb9I
MPR
H
1 E-
L M
EH1I
MPR
Scho
ol E
xper
ienc
e—co
nnec
ting
clas
sroo
m le
arni
ng to
pra
ctic
e Q
13
A–H
M
fb13
CLP
I2
A
-H
MEI
2CLP
Supe
rvis
ing
Teac
her
Rein
forc
emen
t of
Uni
vers
ity G
oals
for
Prac
ticum
Q
14
A–E
M
fb14
STR
Non
e
Supe
rvis
ing
Teac
her
feed
back
Qua
lity
f–
I M
fb14
STf
Non
e
Prog
ram
Coh
eren
ce
Q15
A
–f
Mfb
15CO
H
J1
A-f
M
EJ1C
OH

283APPENDICES
B.6.2 Opportunity to Learn Scale Development
B.6.2.1 Initial development and item selection
The development of OTL indices began at the beginning of the TEDS-M project, with
TEDS-M researchers using information from previous research, including Pre-TEDS,
ACER, and related OTL research (Papanastasiou & Tatto, 2011; Richardson, Shields, &
Tatto, 2001; Tatto, 1996, 1998, 1999, 2001a, 2001b: Tatto & Papanastasiou, 2002). Several
of the indices, such as connecting theories of teaching and learning and connecting practice
and reflection, had been developed and used successfully in previous ACER-conducted
research. Prior evidence regarding the effectiveness and usefulness of such information
was gathered when the TEDS-M pilot instruments were developed. These connections
to prior research and theory provide strong validity-related evidence regarding the
content of the OTL scales as well as their meaningfulness and appropriateness.
B.6.2.2 Analysis of pilot item data
TEDS-M pilot results were analyzed with reference to the project’s conceptual
framework, previous research and evidence, and the TEDS-M pilot data. The TEDS-M
team conducted several levels of exploratory and confirmatory analyses on the pilot
responses to all OTL items. The team then used the comprehensive analyses of OTL
item response data to select the final OTL items for inclusion in the operational surveys.
The comprehensive analyses of pilot results and the consistency in OTL index structures
made evident through prior research provide validity-related evidence regarding the
construct definitions of OTL for future teachers.
B.6.2.3 Initial analysis of operational survey results
The initial analyses of these results employed exploratory methods, including factor
analysis, scale reliability analyses, and some limited Rasch scaling. Results were
remarkably similar to the pilot findings, and there was strong consistency between
the future primary teacher and future lower-secondary teacher results. These initial
commonalities suggest successful identification of OTL indices, particularly in light of
the consistency with pilot results and their connections to previous research.
B.6.2.4 Validity evidence for OTL indices
Each of the OTL indices was analyzed for psychometric quality, including the provision
of internal-consistency evidence, score reliability evidence, and (in particular) evidence
of measurement invariance. These methods were primarily based on confirmatory
models—models that are appropriate given the nature of the data.
B.6.2.5 Confirmatory factor analysis
Confirmatory factor analysis (CFA) provided strong construct-related evidence
regarding the factor structure of each OTL index. It was imperative for the TEDS-M
team to establish the independence of each measure of OTL in order to provide clear
information about independent explanatory variables that could potentially explain
variation in important outcomes of teacher preparation. CFA enables testing of data-
model fit and provides a means of assessing the usefulness of simpler versus more
complex factor structures. The goal in this approach is to identify the most parsimonious
set of OTL indices.

THE TEACHER EDUCATION AND DEVELOPMENT STUDY IN MATHEMATICS (TEDS-M)284
To complete the CFA for each set of OTL measures, the TEDS-M researchers used the statistical software package Mplus 5.2. The data analysis was done at the teacher level, using final teacher weights. The factor structure, based on factors expected from previous research and pilot results, were initially assessed across countries. To assess the degree to which these factor structures were invariant across countries, the research team used multiple group confirmatory factor analysis (MCFA). This type of analysis allowed the team to test the fit of a given factor structure in each country. The test was an important one in terms of defending the meaningfulness of each OTL index within and across countries. Mplus MCFA has particular features that made it a strong application for TEDS-M, namely accommodation of missing data, the utility of handling complex survey data, and opportunity to conduct single- or multiple-group analyses.
Mplus also allows for non-normal continuous factor indicators, which TEDS-M employed when analyzing the OTL indices from the future teacher survey. Some TEDS-M OTL indices were based on topics studied, for example, the tertiary-level mathematics topics. The responses from these indicators include studied/never studied, resulting in dichotomous responses (0/1).
The remaining OTL indices were based on ordinal indicators on a four-point scale (either “never” to “often,” or “disagree” to “agree”). Mplus furthermore allows for proper CFA estimation with non-normal data, including accommodation of missing data. The default estimator for this type of analysis is a robust weighted least squares estimator, employing probit regression for factor estimation.
Finally, Mplus was used to conduct a second-order factor analysis. This step involved an examination of the combined structures of the entire set of OTL indices, which could
also be tested via MCFA across countries.
B.6.2.6 Rasch scaling
The TEDS-M team used Rasch scaling to produce the reporting score scale for the OTL indices. Rasch scaling provides measures of OTL that have several scale (statistical) properties which make them stronger variables in general linear model (GLM-based) analyses. When the assumptions of the model are met, Rasch scales approximate interval-level measurement, providing a scale with properties suited for correlational methods.
The improved scale properties relative to the use of a simple summed score is probably the most significant benefit of using Rasch scaling. The Rasch analysis locates each indicator on the same scale as that for person-trait levels, thereby providing for a meaningful ordering of indicators relaying information about the rarity or severity of each indicator (a form of item difficulty). Rasch scaling provides an efficient way to estimate trait values for individuals who have not responded to every item. It also makes it possible to conduct weighted analyses when estimating item locations on the trait scale.
To complete the scaling, the TEDS-M researchers scaled the OTL indices independently, using a combined file of primary and future lower-secondary teachers across countries. Only those cases that responded to more than 50% of the items were included in the scaling. Future teacher weights were recomputed for each OTL index. This step accounted for the variation in the resulting sample based on the inclusion criteria (response to more than 50% of the items within a scale) resulting from each scale responded to by a
different proportion of respondents within each country.
285APPENDICES
TEDS-M researchers next adjusted the weights again so that they summed to 500 for
each country for primary and lower-secondary separately. Thus, each country with
primary and lower secondary respondents contributed 500 primary and 500 lower-
secondary units of observations to the final scaling. The weights were estimated using a
simple transformation based on resulting sample size and effective sum of 500 for each
population in each country. This first level of analysis with valid cases constituted the
calibration sample.
Winsteps, with the partial-credit model, was used to estimate the Rasch item
calibrations. This procedure allowed each item to contribute different threshold values
for each rating-scale point. The calibration values were then used to provide scores for
all cases responding to more than 50% of the items, regardless of validity status. This
was done in order to provide scores for all cases, even those excluded as an outcome of
sample adjudication. This approach meant that countries with cases not included could
conduct, if they deemed it meaningful to do so, full analyses of all their cases.
Several OTL indices were also available in the educator data. The item parameters
calibrated from future teachers were used as fixed parameters to estimate scale scores
for educators, thereby placing the OTL scale scores from educators on the same scale
as that for future teachers and thus facilitating comparative inferences. Information
about the fit of the OTL measures with the educator responses, as estimated by MPlus
through a confirmatory factor analysis process (described above), is available in the
technical report (Tatto, in press).
B.6.2.7 Identification of the OTL indices
Exhibit B.10 presents the indices of OTL identified. The technical report (Tatto, 2012)
contains additional tables with detailed information about model fit.
B.6.3 Development, Scaling, and Scoring of Beliefs Scales
The belief scales were based on items from research-based belief scales used in earlier
studies already cited in the OTL section. On completion of the extensive pilot, TEDS-M
researchers selected items from those that had survived the exploratory factor analyses.
They also selected a subset of highly homogeneous items per scale for the operational
forms. The next step was to evaluate the effectiveness of the six-point rating scale (used
for some belief scales). The additional Rasch rating-scale analyses conducted for this
stage supported continued use of the six-point scale. The complete analytical process
mirrored that used for the OTL scales, as described above.
Using as their reference point a series of confirmatory factor analyses, the TEDS-M
team used the Rasch model to scale the belief scales. They then rescaled the results so
that they were centered at the point on the scale that is associated with the middle of the
rating scale (essentially “neutral”). All belief scales were therefore based on a score scale
where 10 was located at the neutral position. The same process used for the OTL indices
that were based on the rating-scale items was used for the beliefs scales.
B.6.3.1 Identification of beliefs indices
Exhibit B.11 sets out the beliefs indices identified for TEDS-M. The technical report
(Tatto, 2012) contains additional tables with detailed information about the model fit
of these indices.

THE TEACHER EDUCATION AND DEVELOPMENT STUDY IN MATHEMATICS (TEDS-M)286
Exh
ibit
B.1
1: B
elie
fs in
dice
s
Bel
iefs
Ind
ex L
abel
Prim
ary
and
Sec
on
dar
y In
dic
es
Te
ache
r Ed
ucat
or
Ind
ices
Sect
ion
and
Item
lett
er
Varia
ble
nam
e Se
ctio
n an
d
Item
lett
er
Varia
ble
nam
e
ques
tion
no.
ques
tion
no.
bELI
EfS
AbO
UT
THE
NA
TURE
Of
MA
THEM
ATI
CS
Rule
s an
d Pr
oced
ures
D
1 A
, b, E
, G, K
, L
MfD
1RU
LE
K1
A, b
, E, G
, K, L
M
EK1R
ULE
Proc
ess
of In
quiry
D, f
, H, I
, J
MfD
1PRO
C
C
, D, f
, H, I
, J
MEK
1PRO
C
bELI
EfS
AbO
UT
LEA
RNIN
G M
ATH
EMA
TIC
S
Teac
her
Dire
ctio
n D
2 A
–f, I
, J
MfD
2TEA
C
K2
A–f
, I, J
M
EK2T
EAC
Act
ive
Lear
ning
G, H
, K–N
M
fD2A
CTV
G, H
, K–N
M
EK2A
CTV
bELI
EfS
AbO
UT
MA
THEM
ATI
CS
AC
HIE
VEM
ENT
fixe
d A
bilit
y D
3 A
–H
MfD
3fIX
D
K3
A–H
M
EK3f
IXD
bELI
EfS
AbO
UT
THE
PRO
GRA
M A
S A
WH
OLE
Prep
ared
ness
for
Teac
hing
Mat
hem
atic
s D
4 A
–M
MfD
4PRE
P L1
A
–M
MEL
1PRE
P
Prog
ram
Eff
ectiv
enes
s D
5 A
–f
MfD
5PRO
G
Non
e

287APPENDICES
References
De Ayala, R. J. (2009). The theory and practice of item response theory. New York: The Guilford
Press.
Fay, R. E. (1989). Theoretical application of weighting for variance calculation. In Proceedings
of the Section on Survey Research Methods of the American Statistical Association (pp. 212–217).
Alexandria, VA: American Statistical Association.
Lohr, L. S. (1999). Sampling: Design and analysis. Pacific Grove, CA: Duxbury Press.
Masters, G. (1982). A Rasch model for partial credit scoring. Psychometrika, 47, 149–174.
McCarthy P. (1966). Replication: An approach to the analysis of data from complex surveys. In
Vital and Health Statistics (Series 2, No. 14). Hyatsville, MD: National Center for Health Statistics.
Papanastasiou, E. C., & Tatto, M. T. (2011). Program theory, program documents, and state
standards in evaluating teacher education. Assessment and Evaluation in Higher Education, 36,
1–16.
Rasch, G. (1980). Probabilistic models for some intelligence and attainment tests. Chicago, IL:
University of Chicago Press (originally published 1960).
Richardson, V., Shields, P., & Tatto, M. T. (2001, March). Alternative assessments of teaching and
teacher education. Forum presentation at the annual conference of the American Association of
Colleges of Teacher Education, Dallas, TX.
Tatto, M. T. (1996). Examining values and beliefs about teaching diverse students: Understanding
the challenges for teacher education. Educational Evaluation and Policy Analysis, 18(2), 155–180.
Tatto, M. T. (1998). The influence of teacher education on teachers’ beliefs about purposes of
education, roles, and practice. Journal of Teacher Education, 49(1), 66–77.
Tatto, M. T. (1999). The socializing influence of normative cohesive teacher education on teachers’
beliefs about instructional choice. Teachers and Teaching, 5(1), 111–134.
Tatto, M.T. (2001a, March). Evaluating the teacher preparation program at Michigan State University:
Challenges involved in testing the theory of teacher preparation and of current accreditation guidelines.
Paper presented at the annual conference of the American Association of Colleges of Teacher
Education, Dallas, Texas, United States.
Tatto, M. T. (2001b, April). Evaluating the teacher preparation program at Michigan State University:
Some reflections and preliminary results. Paper presented at the annual meeting of the American
Education Research Association, Seattle, Washington, United States.
Tatto, M. T. (2012). The Teacher Education Study in Mathematics (TEDS-M) technical report.
Amsterdam, the Netherlands: International Association for the Evaluation of Educational
Achievement (IEA) and Springer.
Tatto, M. T., & Papanastasiou, E. (2002, April). Developing long-term systemic inquiry in teacher
education programs: Challenges involved in testing the theory of teacher education programs and of
current accreditation guidelines. Paper presented at the annual meeting of the American Education
Research Association, New Orleans, Louisiana, United States.
Tatto, M. T., Schwille, J., Senk, S., Ingvarson, L., Peck, R., & Rowley, G. (2008). Teacher Education Study
in Mathematics (TEDS-M): Conceptual framework. Amsterdam, the Netherlands: International
Association for Educational Achievement (IEA).
UNESCO. (1997). ISCED levels. Retrieved from http://www.unesco.org/education/ information/
nfsunesco/doc/isced_1997.htm
Wu, M., Adams, R., Wilson, M., & Haldane, S. (2007). ACER Conquest: Generalised item response
modelling software (Version 2.0). Melbourne, Victoria, Australia: Australian Council for Educational
Research (ACER).

THE TEACHER EDUCATION AND DEVELOPMENT STUDY IN MATHEMATICS (TEDS-M)288

289APPENDICES
APPENDIx C: ORGANIZATIONS AND INDIVIDUALS RESPONSIBLE FOR TEDS-M
C.1 Introduction
TEDS-M is the result of scholars and institutions working in collaboration in order to
study the mathematics preparation of future primary and lower-secondary teachers.
The study’s success is due to the extraordinary work and competence of a great many
people. The key contributors among this group are listed below.
Credit is due to the country national research centers, to the coordinators of the teacher
education programs in the TEDS-M samples, and to the future teachers and teacher
educators who made the collection of data possible. All potential respondents were free
to refuse to answer our questionnaires. The willingness of so many future teachers and
teacher educators to participate was therefore very gratifying, and even more so given
that participation for the future teachers meant agreeing to take a test of mathematics
content and mathematics pedagogy knowledge.
The participating countries were Botswana, Canada, Chile, Chinese Taipei, Georgia,
Germany, Malaysia, Norway, Oman, the Philippines, Poland, the Russian Federation,
Singapore, Spain, Switzerland, Thailand, and the United States of America. The
commitment of these countries to participate in and overcome the many challenges of
implementing a study of such magnitude as TEDS-M has made it possible to envisage a
rich future of cross-national research on teacher education.
C.2 TEDS-M Management and Coordination
TEDS-M was conducted under the auspices of the International Association for the
Evaluation of Educational Achievement (IEA). The College of Education at Michigan
State University (MSU) and the Australian Council of Educational Research (ACER) were
appointed by IEA as the joint international study centers (ISCs) for TEDS-M under the
executive direction of Maria Teresa Tatto of MSU. To design and carry out the study, the
ISCs worked in collaboration with the IEA Data Processing and Research Center (DPC)
in Hamburg, the IEA Secretariat in Amsterdam, Statistics Canada, and the TEDS-M
national research centers in the 17 participating countries. Together, these teams of
researchers and institutions conceptualized the study, designed and administered the
instruments, collected and analyzed the data, and reported the results.
The TEDS-M ISC at Michigan State University worked closely with ACER and the IEA
Secretariat in Amsterdam, which provided overall guidance, and was responsible for
verification of translations of the survey instruments produced by the participating
countries and quality control of data collection.
The IEA DPC worked with the TEDS-M international center at MSU to prepare the
manuals guiding the collection of data, and with both ISCs in all other aspects of
data verification. The DPC was also responsible for data processing and verifying the
internal consistency and accuracy of the data submitted by the participants. They were
furthermore responsible for developing the TEDS-M database that will be publicly
available for secondary analysis by researchers worldwide.

THE TEACHER EDUCATION AND DEVELOPMENT STUDY IN MATHEMATICS (TEDS-M)290
The sampling unit of the IEA DPC in collaboration with the ISC at MSU was responsible
for the innovative sampling design that produced nationally representative samples
of teacher education institutions, future primary and lower-secondary teachers, and
teacher educators. We thank Statistics Canada for serving as the sampling referee.
Michigan State University in collaboration with ACER and the University of Minnesota
provided expertise on the application of psychometric methods and on data calibration
and scaling of the opportunity to learn, beliefs, and knowledge-assessment data. We are
thankful to Eugene Gonzales of the IEA DPC for his contribution to the data calibration
and scaling process.
The TEDS-M management team met twice a year throughout the study to discuss
progress, procedures, and schedule. In addition, the directors of the TEDS-M ISCs
met with members of IEA’s technical executive group twice yearly to review technical
issues.
Maria Teresa Tatto from Michigan State University was the principal investigator, the
executive director of TEDS-M, and chair of the TEDS-M management team. The
study co-directors were John Schwille and Sharon Senk at the ISC at MSU. Lawrence
Ingvarson, Glenn Rowley, and Ray Peck co-directed the study center at ACER.
Sharon Senk, Kiril Bankov, and Ray Peck served as the TEDS-M mathematics
coordinators. Maria Teresa Tatto and Michael Rodriguez were responsible for the
background questionnaires, coordinated the opportunity to learn study, and, together
with Glenn Rowley, the beliefs study. Maria Teresa Tatto and Jack Schwille coordinated
the institution /program study. Jack Schwille, Lawrence Ingvarson, and Maria Teresa
Tatto coordinated the policy study.
Development of the overall study methods and instruments was led by Maria Teresa
Tatto, Glenn Rowley, Michael Rodriguez, Mark Reckase, and Kiril Bankov. Sabine
Meinck from the IEA DPC developed the sampling frame and worked with the national
research centers to implement each country’s sample design. Jean Dumais from Statistics
Canada served as the sampling referee. Ralph Carstens and Falk Brese from the IEA
DPC were responsible for producing the manuals guiding data collection and entry and
for developing the TEDS-M international database.
TEDS-M frequently brought together panels of internationally recognized experts
in mathematics and mathematics education, research, curriculum, instruction, and
assessment; their advice and review were critical to the credibility of the study and the
results achieved. Their names and institutions are listed below.
In order to expedite work with the international team and coordinate within-country
activities, each participating country designated one or more individuals to be the
TEDS-M national research coordinator or NRC. The NRCs had the complicated and
challenging task of advising the international design team as well as implementing
TEDS-M in their countries in accordance with international guidelines and procedures.
The quality of the TEDS-M assessment and other data depended on the NRCs and
their colleagues carefully carrying out the very complex sampling, data collection, and
scoring tasks involved. Their names and affiliations are listed below.
TEDS-M benefited from the six-country developmental study, which was co-directed
by William Schmidt and Maria Teresa Tatto and funded by the National Science
Foundation (USA). This developmental study informed the design and instruments

291APPENDICES
used in TEDS-M. The participating countries were Bulgaria, Germany, Korea, Mexico,
Taiwan, and the United States.
C.3 Technical and Editorial Advice
Throughout TEDS-M, the writing and publishing of the various reports associated
with it benefited from the careful reviews of the IEA technical executive committee,
comprising Hans Wagemaker (chair), Jan Eric Gustafson, Larry Hedges, Marc Joncas,
Mick Martin, Ina Mullis, Heiko Sibberns, and Norman Verhelst. The IEA publications
committee provided excellent editorial feedback; special thanks go to David Robitaille
and Bob Garden.
C.4 Funding
TEDS-M was made possible through a generous grant to Michigan State University
from the National Science Foundation (REC 0514431). Additional support came from
countries’ IEA participation fees and from IEA’s own financial reserves. This financial
support is gratefully acknowledged as critical to the successful completion of this study.
In addition, we gratefully acknowledge our program officer at the National Science
Foundation, James Dietz, and the executive director of IEA, Hans Wagemaker, for their
clear vision and unwavering support throughout the study.
Any opinions, findings, and conclusions or recommendations expressed in this report
are those of the author(s) and do not necessarily reflect the views of the National Science
Foundation.
C.5 Listings of Organizations and Individuals Responsible for TEDS-M
TEDS-M Joint Management Committee
• MSU:MariaTeresaTatto(chair),SharonSenk,JohnSchwille
• ACER:LawrenceIngvarson,RayPeck,GlennRowley
• IEA:HansWagemaker,BarbaraMalak(ex-officio)
• DPC: Dirk Hastedt (ex-officio), Ralph Carstens (ex-officio), Falk Brese (ex-officio),
and Sabine Meinck (ex-officio)
• StatisticsCanada:JeanDumais(ex-officio)
The International Study Center at Michigan State University (TEDS-M Lead Institution)
• MariaTeresaTatto,TEDS-Mexecutivedirectorandprincipalinvestigator
• SharonL.SenkandJohnSchwille,co-directorsandco-principalinvestigators
• KirilBankov,UniversityofSofia,seniorresearchcoordinatorformathematicsand
mathematics pedagogy knowledge
• Michael Rodriguez, University of Minnesota, senior research coordinator for
statistics, measurement, and psychometrics
• MartinCarnoy,StanfordUniversity,seniorresearchcoordinatorforthecoststudy
• YukikoMaeda,researchassociateforstatistics,measurement,andpsychometrics
• Soo-yongByun,researchassociateforstatisticsanddataanalysis
• Mustafa Demir, Todd Drummond, Richard Holdgreve-Resendez, Nils Kauffman,
Wangjun Kim, Patrick Leahy, Yang Lu, Sungworn Ngudgratoke, Irini Papaieronymou,
Eduardo Rodrigues, and Tian Song, research assistants
• IneseBerzina-Pitcher,consortiumcoordinator
• AnnPitchford,administrativeassistant
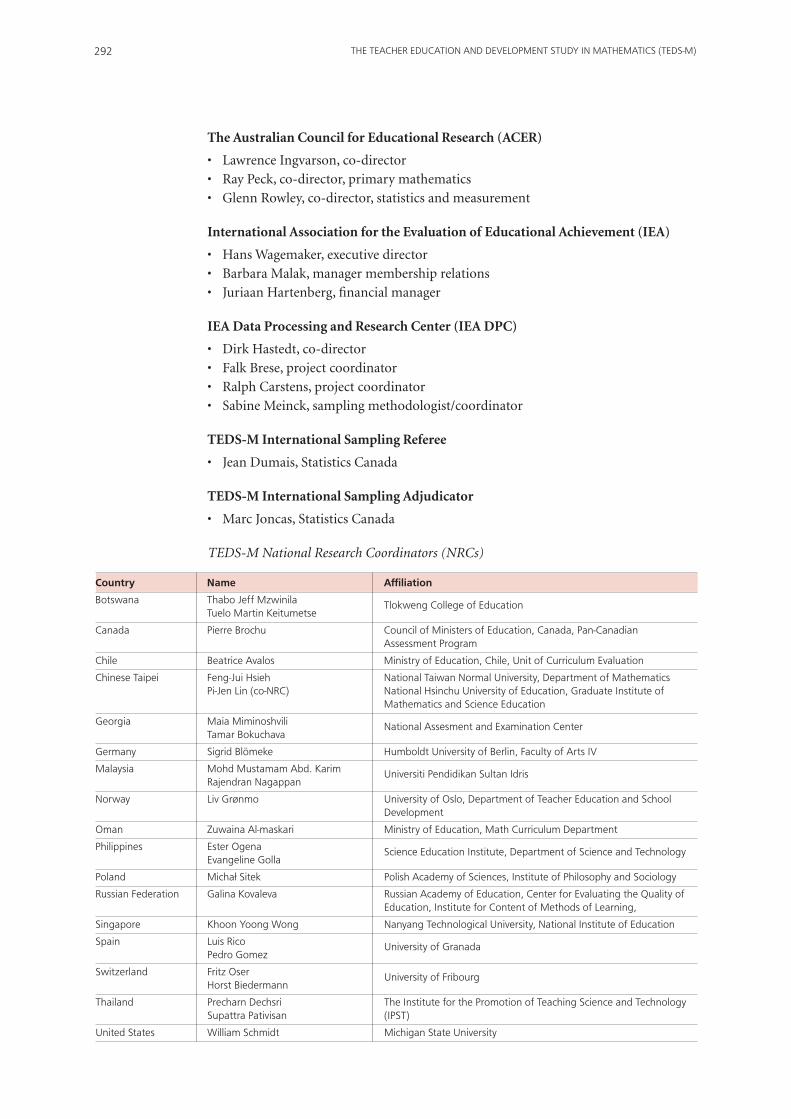
THE TEACHER EDUCATION AND DEVELOPMENT STUDY IN MATHEMATICS (TEDS-M)292
The Australian Council for Educational Research (ACER)
• LawrenceIngvarson,co-director
• RayPeck,co-director,primarymathematics
• GlennRowley,co-director,statisticsandmeasurement
International Association for the Evaluation of Educational Achievement (IEA)
• HansWagemaker,executivedirector
• BarbaraMalak,managermembershiprelations
• JuriaanHartenberg,financialmanager
IEA Data Processing and Research Center (IEA DPC)
• DirkHastedt,co-director
• FalkBrese,projectcoordinator
• RalphCarstens,projectcoordinator
• SabineMeinck,samplingmethodologist/coordinator
TEDS-M International Sampling Referee
• JeanDumais,StatisticsCanada
TEDS-M International Sampling Adjudicator
• MarcJoncas,StatisticsCanada
TEDS-M National Research Coordinators (NRCs)
Country Name Affiliation
botswana Thabo Jeff Mzwinila Tuelo Martin Keitumetse
Tlokweng College of Education
Canada Pierre brochu Council of Ministers of Education, Canada, Pan-Canadian Assessment Program
Chile beatrice Avalos Ministry of Education, Chile, Unit of Curriculum Evaluation
Chinese Taipei feng-Jui Hsieh National Taiwan Normal University, Department of Mathematics Pi-Jen Lin (co-NRC) National Hsinchu University of Education, Graduate Institute of Mathematics and Science Education
Georgia Maia Miminoshvili Tamar bokuchava
National Assesment and Examination Center
Germany Sigrid blömeke Humboldt University of berlin, faculty of Arts IV
Malaysia Mohd Mustamam Abd. Karim Rajendran Nagappan
Universiti Pendidikan Sultan Idris
Norway Liv Grønmo University of Oslo, Department of Teacher Education and School Development
Oman Zuwaina Al-maskari Ministry of Education, Math Curriculum Department
Philippines Ester Ogena Evangeline Golla
Science Education Institute, Department of Science and Technology
Poland Michał Sitek Polish Academy of Sciences, Institute of Philosophy and Sociology
Russian federation Galina Kovaleva Russian Academy of Education, Center for Evaluating the Quality of Education, Institute for Content of Methods of Learning,
Singapore Khoon Yoong Wong Nanyang Technological University, National Institute of Education
Spain Luis Rico Pedro Gomez
University of Granada
Switzerland fritz Oser Horst biedermann
University of fribourg
Thailand Precharn Dechsri The Institute for the Promotion of Teaching Science and Technology Supattra Pativisan (IPST)
United States William Schmidt Michigan State University

293APPENDICES
TEDS-M Expert Panels and Meetings
Specialist Advisory/Expert Panel Meetings for TEDS-M, November 2002
Meeting Participants Country/Affiliation
fernand Rochette belgium (flemish)
Liselotte Van De Perre belgium (flemish)
Ann Van Driessche belgium (flemish)
Marcel Crahay belgium (french)
Julien Nicaise belgium (french)
Per fibæk Laursen Denmark
bjarne Wahlgren Denmark
Gerard bonnet france
Catharine Regneir france
Ranier Lehmann Germany
Georgia K. Polydores Greece
bruno Losito Italy
Ryo Watanabe Japan
Andris Kangro Latvia
Jean-Claude fandel Luxembourg
Jean-Paul Reeff Luxembourg
Seamus Hegarty UK
Arlette Delhaxe Eurydice
barbara Malak-Minkiewicz IEA Secretariat
Maria Teresa Tatto MSU
Specialist Advisory/Expert Panel Meetings for TEDS-M, June 2003
Meeting Participants Country/Affiliation
Peter fensham Australia
Kiril bankov bulgaria
Martial Dembele burkina faso and Québec-Canada
beatrice Avalos Chile
Per fibæk Laursen Denmark
Sigrid blömeke Germany
frederick Leung Hong Kong SAR
Losito bruno Italy
Ciaran Sugrue Ireland
Lee Chong-Jae Korea
Loyiso Jita South Africa
Marilyn Leask UK
Christopher Day UK
Michael Eraut UK
Drew Gitomer USA
Susanna Loeb USA
Lynn Paine USA
David Plank USA
Paul Sally USA
William Schmidt USA
Adrian beavis IEA-TEDS-M ACER
Lawrence Ingvarson IEA-TEDS-M ACER
Jack Schwille IEA-TEDS-M MSU
Maria Teresa Tatto IEA-TEDS-M MSU
Special IEA advisory meeting on approval of TEDS-M Study, brussels, belgium November 4–5, 2002
IEA TEDS-M expert panel meeting, Amsterdam, The Netherlands,June 16–21, 2003

THE TEACHER EDUCATION AND DEVELOPMENT STUDY IN MATHEMATICS (TEDS-M)294
Specialist Advisory/Expert Panel Meeting for TEDS-M, December 2003
Meeting Participants Country/Affiliation
Peter fensham Australia
Kiril bankov bulgaria
beatrice Avalos Chile
Per fibæ Laursen Denmark
Sigrid blömeke Germany
frederick Leung Hong Kong
Ciaran Sugrue Ireland
bruno Losito Italy
Tenoch Cedillo Avalos Mexico
Marcela Santillan-Nieto Mexico
Loyiso C. Jita South Africa
Marilyn Leask UK
Angelo Collins USA
Lynn Paine USA
Hans Wagemaker IEA
Pierre foy IEA DPC
Dirk Hastedt IEA DPC
Lawrence Ingvarson IEA-TEDS-M ACER
Jack Schwille IEA-TEDS-M MSU
Maria Teresa Tatto IEA-TEDS-M MSU
Specialist Advisory/Expert Panel Meetings for TEDS-M, June 2006
Meeting Participants University
Edward Aboufadel Grand Valley State University
Sandra Crespo MSU
Glenda Lappan MSU
Vince Melfi MSU
Jeanne Wald MSU
Rebecca Walker Grand Valley State University
Specialist Advisory/Expert Panel Meetings for TEDS-M, September 2006
Meeting Participants University
Doug Clarke Australian Catholic University
Peter Sullivan Monash University
Kaye Stacey Melbourne University
Gaye Williams Deakin University
barb Clarke Monash University
Ann Roche Australian Catholic University
Ray Peck IEA TEDS-M ACER
Lawrence Ingvarson IEA TEDS-M ACER
IEA TEDS expert panel meeting,Hamburg, Germany,December 1–5, 2003
Expert panel for review of primary TEDS-M items for mathematics content knowledge and mathematics pedagogy content knowledge,Melbourne, AustraliaSeptember 18, 2006
Expert panel for review of TEDS-M items and data from field trialEast Lansing, Michigan, USAJune, 2006

295APPENDICES
Expert panel for review of TEDS-M test items and questionnaires,Grand Rapids, Michigan, USASeptember 29–30, 2006
TEDS-M Mathematics and Mathematics Pedagogy Scale Anchoring Workshops in East Lansing, MI.
Note: The objective of these workshops was to develop descriptions of the characteristics of persons whose scores on the mathematics and mathematics pedagogy tests placed them at various locations on the scales.
Specialist Advisory/Expert Panel Meetings for TEDS-M, September 2006
Meeting Participants Country/Affiliation
Kiril bankov bulgaria
Jarmila Novotna Czech Republic
Paul Conway Ireland
Ruhama Even Israel
Kyungmee Park Korea
Maarten Dolk Netherlands
Ingrid Munck Sweden
Hyacinth Evans West Indies
Lynn Paine IEA-TEDS-M MSU
Sharon Senk IEA-TEDS-M MSU
Jack Schwille IEA-TEDS-M MSU
Maria Teresa Tatto IEA-TEDS-M MSU
Specialist Advisory/Expert Panel Meetings for TEDS-M, June and July 2009
Meeting Participants University
Mathematicians Primary
Anna bargagliotti University of Memphis
Hyman bass MSU
Michael frazier University of Tennessee
Mathematicians Lower Secondary
Roger Howe Yale University
Cathy Kessel Independent consultant
Alejandro Uribe University of Michigan
Jeanne Wald MSU
Mathematics Educators—Primary
Lillie Albert MSU
Sandra Crespo MSU
Cynthia Langrall Illinois State University
Edward Silver University of Michigan
Alejandra Sorto Texas State University
Rebecca Walker Grand Valley State University
Mathematics Educators—Lower-Secondary
Jennifer bay Williams University of Louisville
Jeremy Kilpatrick University of Georgia
Glenda Lappan MSU
Xuihui Li California State University
Sharon McCrone University of New Hampshire
Rheta Rubenstein University of Michigan
Denisse Thompson University of South florida

The Teacher Education and Development Study (TEDS-M) is the first cross-national study to use representative samples in order to examine the preparation of future teachers of mathematics at both the primary and secondary school levels. The study was conducted under the auspices of the International Association for the Evaluation of Educational Achievement (IEA).
In its 54 years of activities, IEA has conducted over 30 comparative research studies focusing on educational policies, practices, and outcomes in various school subjects in more than 80 countries around the world. TEDS-M is the first IEA project to focus on tertiary education and to pay particular attention to teachers and their learning.
Seventeen countries participated in TEDS-M. Data were gathered from approximately 22,000 future teachers from 750 programs in about 500 teacher education institutions. Teaching staff within these programs were also surveyed. Altogether, close to 5,000 mathematicians, mathematics educators, and general pedagogy educators participated in TEDS-M.
The key research questions for the study focused on the associations between teacher education policies, institutional practices, and future teachers’ knowledge (by the end of their preservice education) of mathematics and pedagogy. This report describes and compares national policies relating to teacher education and documents how the participating countries organize their teacher education provision. The report provides insight not only into the main characteristics of the various tertiary-education programs and their curricula, but also into the opportunities to learn about mathematics and mathematics pedagogy that the programs offer their future teachers.
The findings of assessments of the participating future teachers’ mathematics content knowledge and mathematics pedagogy knowledge are presented within this context, as are the results of surveys on the teachers’ beliefs about mathematics and learning mathematics. The report also provides information on various characteristics of programs’ teacher educators in the participating countries.
The TEDS-M results provide evidence that may be used to improve policy and practice relating to preparing teachers of mathematics. It also provides a new baseline for future research on teacher education and development.
This report is the third publication to emerge from TEDS-M. It was preceded by a report documenting the study’s conceptual framework and a report that considered teacher salaries within the scope of student achievement. Future publications include a detailed report on the contexts in which teacher education takes place, an encyclopedia presenting country by country TEDS-M information, and a technical report. IEA will also make available an international database of TEDS-M findings that the wider research community can use in order to conduct secondary analyses.
Related Documents