1 Policy options for improved food security in the Republic of Marshall Islands AUGUST 2014 Sub-regional Office for the Pacific Islands

Welcome message from author
This document is posted to help you gain knowledge. Please leave a comment to let me know what you think about it! Share it to your friends and learn new things together.
Transcript

1
Policy options for improved food security in the Republic of
Marshall Islands
AUGUST 2014
Sub-regional Office for the Pacific Islands

2
The designations employed and the presentation of material in this report do not imply the
expression of any opinion whatsoever on the part of the Food and Agriculture Organization of the
United Nations concerning the legal or development status of any country, territory, city or area
or of its authorities, or concerning the delimitation of its frontiers or boundaries. The mention of
specific companies or products of manufacturers, whether or not these have been patented,
does not imply that these have been endorsed or recommended by FAO in preference to others
of a similar nature that are not mentioned.
The findings, interpretations and conclusions expressed in this report are those of the authors
and do not necessarily represent the views of FAO.
Policy options for improved food security in the Republic of
Marshall Islands
August 2014

3
Acknowledgements
The study team undertaking the research and compiling this report included Tim Martyn (FAO Policy
Officer) and Tuifa’asisina Steve Rogers (Consultant). Our gratitude is extended to the Ministry of
Resources and Development, particularly, Rebecca Lorennij, Henry Capelle and Karness Kusto who
facilitated the mission and efficiently organized all the consultation meetings and a field trip to Arno
Atoll.
Many other people have contributed information and ideas that have been fed into the findings in this
report. Thanks are extended to all stakeholders that generously provided time and information and
shared their ideas with the study team. Daniel Timothy from the RMI Customs Office kindly provided a
range of food trade statistics and Dahlia Kaneko from EPPSO provided information on the consumer
price index.

4
Table of Contents Acknowledgements ....................................................................................................................................... 3
Acronyms and Abbreviations ........................................................................................................................ 5
Executive Summary ....................................................................................................................................... 6
1. Introduction .......................................................................................................................................... 9
Implementation of the RMI’s Food Security Policy ................................................................................ 12
2. Promoting food security goals through price policy ........................................................................... 14
Review of import tariffs and taxes to prioritize food security ................................................................ 16
Application of ‘sin’ tariffs on food and beverages contributing to NCDs ........................................... 19
3. Improved transport linkages for facilitating domestic market opportunities .................................... 21
Outer Islands Sea Freight Fund and Price Monitoring ........................................................................ 23
4. Enhanced school feeding program ..................................................................................................... 26
Capacity of local food producers to supply the school feeding program ........................................... 27
Credit and business and technical services ......................................................................................... 28
5. Co-ordination of policy and regulatory reform ................................................................................... 30
Annex 1: Model for a health tax based on fat and salt content ................................................................. 32
Annex 2: Items included in the food monitoring program ......................................................................... 38
Annex 3: List of people consulted ............................................................................................................... 39
Annex 4: References ................................................................................................................................... 40

5
Acronyms and Abbreviations
ADB Asian Development Bank
CIF Cash Insurance Freight
CPI Consumer Price Index
CTF Compact Trust Fund
EPPSO Economic Policy, Planning and Statistics Office
FY Financial Year
HS Harmonized System
GDP Gross Domestic Product
GRT Gross Receipts Tax
ILF Import Levy Fund
IMF International Monetary Fund
MFED Ministry of Finance and Economic Development (Kiribati)
MIA Ministry of Internal Affairs
MICT Marshal Islands Consumption Tax
MIET Marshall Islands Excise Tax
MISC Marshall Islands Shipping Corporation
NCD Non Communicable Disease
Oz. Ounce
PICs Pacific Island Countries
PNA Parties to the Nauru Agreement
R&D Ministry of Resources and Development
RMI Republic of Marshall Islands
SOE State Owned Enterprise
SPC Secretariat of the Pacific Community
TCPA Tobolar Copra Processing Authority
TRAM Tax and Revenue Reform and Modernization program
US United States
VDS Vessel Day Scheme

6
Executive Summary The lack of domestic food production capacity and high-level of food import dependence in the Republic
of Marshall Islands (RMI), poses some significant challenges to national food security. This has led the
Government of RMI to request assistance from the Food and Agriculture Organization (FAO) to
undertake a review of the policies and other interventions affecting food prices in the Republic, and to
develop an action plan for reducing national food import dependence. This report presents a number of
policy options aimed at stimulating local food production and import substitution: through the provision
of price incentives for the consumption of nutritious, local foods, at the expense of foods known to
contribute to Non-Communicable Diseases (NCDs); by reducing the impact of transport costs on the
competitiveness of domestic agricultural production; and by introducing an improved school feeding
program designed to offer improved market opportunities for domestic producers, and result in better
nutrition outcomes for the population. As such, it is designed to assist the RMI to successfully achieve
the objectives of its National Food Security Policy.
Food imports currently represent about 30% of the total value of the RMI’s national import bill. The high
level of RMIs food import dependence increases the exposure of households, as well as national foreign
exchange reserves, to the risks associated with fluctuations in global commodity prices. In addition, a
historical shift in diet away from locally sourced staples and fish to imported processed food products
high in fat and salt has contributed to a rising level of obesity and diet related NCDs such as diabetes,
which has seen an increase in mortality, morbidity, and health care costs. This has led national policy-
makers to identify improving the capacity of the agriculture sector to supply domestic markets with
nutritious and affordable food products, as a key strategy for improving food security.
Restructuring national price policies and exploiting synergies between the health, education and
agriculture sectors to promote local production and consumption of nutritious local foods will play a
critical part in the battle against NCDs. Such preventive NCD measures would result in significant cost
savings to individuals, the health budget and the economy, thereby constituting a fiscally responsible
investment of public resources.
Given that the price and availability of food products shapes consumption choices and the incidence
rate of NCDs associated with poor nutrition (such as diabetes), then efforts to incentivize the
consumption of nutritious food through appropriate pricing policies should improve nutrition outcomes
in the Marshall Islands. Further, policies which stimulate local production of nutritious foods through
the introduction of public interventions aimed at eliminating the transport costs which undermine
domestic market opportunities, will improve income opportunities for the primary sector.
The current price policy settings in RMI, however, have worked to facilitate improved access to and
increased consumption of cheaper imported food commodities, including many which are linked to
rising obesity levels and NCDs. The imposition of price monitoring and controls for a wide range of
imported food products laudably aims to ensure more access to affordable food in the outer islands.
However this policy also makes certain foods associated with NCDs more accessible with at least six
products deemed to be high in sugar, salt or fat included in the monitoring program. Products which are
recognized to contribute to NCDs should be removed from the price control program in order to reduce

7
the price incentives they introduce for the consumption habits which result in poor dietary and health
outcomes.
Furthermore, the absence tariff preferences for healthier alternative food commodities such as
wholegrain or fortified rice and flour, has reduced consumption of these products.
The scheduled Tax and Revenue Reform and Modernization (TRAM) program proposes eliminating all
import duties and implementing a uniform 10% consumption tax; as well as the introduction of an
additional excise tax on ‘sin’ products such as cigarettes and alcohol, and on motor vehicles depending
on their engine size. The tax reform program could be taken as an opportunity to expand the use of ‘sin’
excises on food and beverage products that are linked to negative health outcomes, and use additional
revenue generated to make local nutritious food more available and affordable.
In addition, the proposed outer island sea freight fund should be targeted in such a way that it provides
a price incentive to the more healthy food alternatives. It should also explicitly make available funds to
subsidize the transportation of local fresh produce (farm and fisheries) from the outer islands to the
urban centers. This would provide a strong market incentive for local food production.
Finally, an outstanding win-win opportunity exists to strengthen food security and boost local food
production by explicitly linking agricultural development to enhancing the faltering school feeding
program. Full implementation of the school feeding program could be financed by potential revenue
collected from ‘health’ excises imposed on products deemed high in sugar, salt or fat. A daily lunch plate
served for 10,500 school children over 180 days of the school year with regulated minimum local food
content would provide a substantial predictable and structured market demand for local food produce;
thus making it easier, less risky and more profitable for producers to invest in upgrading their farm
technology to increase productivity. The use of the structured demand to supply the school feeding
program would therefore provide an attractive avenue through which to kick start a process of
agricultural transformation in RMI as well as promoting the delivery of priority education and health
policy outcomes.
Therefore the recommendations of this policy plan are:
Recommendation 1: The Ministry of Health together with the Ministry of Resources and
Development (R&D)should lead the consultation with the Ministry of Finance for the
implementation of a ‘health excise’ on food (& beverage) products with a negative impact on
NCDs, and the identification of priority programmes for facilitating improved access to healthier
substitute propducts.
Recommendation 2: Prescribed goods under the Price Monitoring Program should be reviewed
and products which are recognized to contribute to NCDs should be removed from the price
control program in order to reduce the price incentives they introduce for the consumption
habits which result in poor dietary and health outcomes.
Recommendation 3: The draft Bill for the Outer Islands Sea Freight Fund should specifically
make available a designated portion of the Fund to subsidize the transportation of locally
produced fresh food produce (farm and fisheries) from the outer islands to the urban centers.

8
Recommendation 4: MIMRA should work together with R&D to coordinate fish and farm
produce transportation to the urban markets and where necessary utilize resources from the
proposed ‘Outer Islands Sea Freight Fund’ to subsidize transportation costs.
Recommendation 5: The R&D together with the Ministry of Education and the Ministry of
Health should advocate for an amendment to the Public Law 1991-125 such that a regulated
proportion of local food content is included in the school feeding program.
Recommendation 6: The Ministry of Education together with R&D and the Ministry of Health
should review the school lunch program and provide a healthier menu choice including more
local fresh produce (fruits and vegetables) and redesign the procurement and distribution
system for the food to facilitate increased purchasing from local farmers and fishers. The
enhanced school feeding program could be a ‘flagship’ program under the National Food
Security Policy.
Recommendation 7: The Ministry of Resources and Development should join with the Ministries
of Finance, Health and Education to facilitate the establishment of Food Policy Council with
mandate to design and implement whole of government policy measures to address the
strategic issues common to food production and consumption trends in RMI; and to enhance co-
operation between the public and private sectors to ensure a sustainable, healthy and equitable
food system.

9
1. Introduction The Republic of Marshall Islands (RMI) is an archipelago nation of five islands and 29 atolls, spread over
1.9 million square kilometers of ocean. At the time of the 2011 Census 74% of the population of 53, 840
were living in Majuro and Kwajalein; and the rest inhabited 25 of the outer islands. The country’s land
resources are limited to just 181 square kilometers, and characterized by relative infertile soil and poor
growing conditions.
Fishing plays a most important role in national food security, and the primary sector economy. In 2012
fishing activities contributed 1.2 percentage points to real GDP growth and accounted for about 10
percent of total employment, providing the largest private sector source of employment. Fish is also by
far the largest export commodity, constituting nearly 90 percent of total exports and fishing license fees
are an important source of government revenue which has increased considerably following the
implementation of the Vessel Day Scheme (VDS) under the Partners to the Nauru Agreement (PNA)1.
In contrast, agricultural production remains relatively small and generally comprises of traditional food
crops, small livestock and one cash crop, copra. Local food production is constrained by poor soil
growing conditions, lack of investment and adoption of appropriate technology, difficult transportation
and market access.
Lack of domestic food production capacity has seen growth in imports that have increasingly
outstripped exports (Figure 1). However, over the last decade commercialized vegetable farming has
increased significantly in Laura on Majuro Atoll to supply a growing proximate urban market demand.
Source: ADB Key Indicators for Asia & Pacific 2013
1 International Monetary Fund (2013) Republic of the Marshall Islands Staff Report for the 2013 Article IV
Consultation. IMF Country Report No. 14/26
-150000
-100000
-50000
0
50000
100000
150000
200000
tho
usa
nd
s U
S D
olla
rs
1995 - 2010
Figure 1: RMI Trade Balance 1995-2010
Exports fob
Imports cif
Trade balance

10
The RMI economy runs a deep trade deficit, which is covered by inflows on income and transfer
accounts, especially Compact grants2 and payments associated with US military base at Kwajalein Atoll.
The national import bill is largely dominated by fuel, food and beverages with foodstuff imports
accounting for about 30% of the import bill in 20103.
Source: ADB Key Indicators for Asia & Pacific 2013; index 1
st Quarter 2003 = 100
Source: RMI Economic Policy, Planning and Statistics Office (EPPSO) CPI Data
The economy’s high import dependence poses a substantial risk to real incomes and food security from
fluctuations in global commodity prices. The Majuro Consumer Price Index (CPI) witnessed an
unprecedented dramatic increase of over 14% in 2008 during the spike in global commodity prices; food
and utility groups were largely responsible for the increase, reflecting soaring global prices for food and
2 Under the renewed Compact Agreement with the US, the RMI will continue to receive annually declining grants
averaging US$45 million (26 percent of GDP as of FY2012) until FY2023. A Compact Trust Fund (CTF) is being built up to provide funding from FY2024 onwards. 3 Government of the Republic of Marshall Islands (2012) Trade Policy of the Republic of Marshall Islands, Ministry
of Resources and Development, Trade and Investment Division.
0
2
4
6
8
10
12
14
16
0.0
20.0
40.0
60.0
80.0
100.0
120.0
140.0
160.0
2003 2004 2005 2006 2007 2008 2009 2010 2011
CP
I pe
rce
nt
chan
ge
CP
I In
de
x
Figure 2; Majuro Consumer Price Index change 2003-20011
% change CPI CPI Majuro Food price index
0.00
5.00
10.00
15.00
20.00
2003 2004 2005 2006 2007 2008 2009 2010 2011 2012
US$
Figure 3. Cost of 20 lb bag of Rice, 20 lb bag of Flour, and 2 kg of Sugar in Majuro
Rice
Flour
Sugar

11
oil (Figures 2 & 3). In response the government reduced the import duty on some basic food items (rice,
flour, sugar, milk, tin fish) from 5% to zero.
A constant flow of people moving from rural outer islands to Majuro and Kwajalein in search of jobs and
better services has resulted in very densely populated urban settlements with large-scale youth
unemployment and associated social problems. The influx and consumption of less nutritious imported
food have induced prevalent health problems such as diabetes, hypertension, obesity, and gout. Indeed,
diabetes related diseases remain the leading cause of death in 2012 with over 20% of deaths due to
diabetes related diseases such as the End Stage Renal Failure, Uremia, and Septicemia4.
The RMI has a young population with a median age of 20.6 years and 40 percent of the population is
under the age of 15 years (Population Census, 2011). The main risk factors for NCDs being laid down
now in younger life, including smoking, poor nutrition, alcohol and physical inactivity, overweight and
obesity is feeding a pipeline of NCDs which will mean overwhelming pressures for future health-care
expenditures and also for the overall development of the nation.
Meanwhile, the RMI faces persistent strain on the budget with a large public sector wage bill and risks
from poorly performing state owned enterprises (SOEs) that continue to claim substantial public
subsidies and capital transfers to extend often limited services to the dispersed population. While
budgeted current expenditure has been contained relative to GDP in recent years, volatile domestic
revenue, declining foreign grants, and occasional off-budget spending by ad-hoc directives pose
constant threats to maintaining fiscal surpluses. Going forward, debt service obligations, a tendency to
continue to fund the SOEs and declines in real Compact flows will contribute to a tightening fiscal
environment. With the expiry of Compact grants looming in FY2023, achieving long-term budgetary self-
reliance and sustained growth is becoming an even more urgent task for the RMI5. Paradoxically, public
spending represents a vital source of demand in Marshall Islands with public sector employment and
procurement supporting local businesses. Indeed, RMI private sector activity and economy-wide output
is driven by and strongly correlated with public spending6 . Unfortunately, when the budget is under
stress delivery of important social service programs may suffer, for example a $700,000 cut in the
Education budget in FY2010 necessitated the closure of the school feeding program for Majuro schools
which negatively impacts school attendance and academic attainment7.
Recognizing the vulnerability of the nation’s food security the Government recently adopted a national
Food Security Policy which emphasizes increasing and stabilizing domestic production, processing and
preservation of local nutritious food as well as strengthening local markets and food distribution
systems. The policy also acknowledges the importance of a thriving coconut industry for rural
livelihoods, the economy and thus food security in RMI - particularly in the outer-islands where few
other economic opportunities avail. In addition, the Policy also proposes an investigation of price policy
4 Government of the Republic of Marshall Islands (2012) The FY2012 Annual Health Data report, Table 31.5 page 39
5 International Monetary Fund (2013) Republic of the Marshall Islands Staff Report for the 2013 Article IV
Consultation. IMF Country Report No. 14/26 6 Asian Development Bank (2014) ADB Pacific Economic Monitor, July 2014.
7 Personal communication Kanchia Hosia, Assistant Secretary for Schools.

12
measures which promote healthy food choices, such as: preferential tariffs for inputs important to
improving agricultural productivity and ‘sin food’-taxes on alcohol, “junk food” and soft drinks known to
be high in sugars, saturated and trans-fats, and / or high salt content.
To further the implementation of the Food Security Policy the Food and Agriculture Organization was
requested to provide technical support to the Government of the RMI to prepare a policy action plan for
strengthening food security by reducing food import dependence and improving domestic market
opportunities for local agricultural products. This report provides an overview of the pricing policy and
regulatory reforms which, when supported by strategic interventions, will effectively increase the
opportunities for local producers to supply the domestic market, and improve competitiveness of local
producers in the targeted markets.
Implementation of the RMI’s Food Security Policy The recently approved national Food Security Policy identifies 38 strategic actions to deliver the
following five priority development outcomes:
1. Local food production increased and producers better linked to consumers
2. Strengthened access to nutritious foods for vulnerable households and individuals
3. A better informed and knowledgeable public about food security and nutrition and increased
home gardening
4. More efficient food distribution channels
5. Enhanced safety, quality and resilience in food supply and production
Implementation of these strategies will require multi-sector actions which are well coordinated. The
Policy recommends that the strategic actions can be broken down into a number of mutually supporting
priority programs designed to deliver the five food security development outcomes. This report presents
specific proposals for implementing 7 of the Strategies outlined in the Policy. These include:
Strategy 1.5: Adopt a supply chain approach to facilitate and support the establishment of viable production and marketing chains from input supplies, through farm (& fisheries) production to end markets
Strategy 1.6: Give high priority to development of robust domestic food supply chains
Strategy 1.11: Introduce local purchasing policies regulating use of local produce in all government catering purchases
Strategy 2.6: Maintain and enhance the school feeding program
Strategy 3.2: Investigate possible market/price and regulatory measures (e.g. preferential tariffs, ‘sin food’ tax, content regulations, fortification etc.) which promote healthy food choices
Strategy 3.3: Consideration will particularly be given to increasing taxes on alcohol, “junk food” and soft drinks known to be high in sugars, saturated and trans-fats and/ or high salt content
Strategy 4.3: Explore the feasibility of targeted ‘smart’ freight subsidies for local producers/traders in fresh produce

13
Following this introduction the report is divided into four sections. Section 2 examines how price policy
can be applied to promote food security goals and presents some specific price policy instruments which
could be used to promote Food Security in RMI. Section 3 provides an overview of inter-island shipping
services and a discrete set of recommendations to improve the competitiveness of local food producers
on the domestic market. Section 4 provides an outline of a program of multi-sector policy actions
centered on an enhanced school feeding program to improve nutrition outcomes, reduce food import
dependence and provide domestic market opportunities to farmers and fishers in RMI. Finally, Section 5
presents some conclusions and identifies some next steps for co-ordinating the policy interventions
identified in this plan.

14
2. Promoting food security goals through price policy The price and availability of food products shapes the Marshallese people’s diets, which are a key driver
of the burden of NCD related diseases. Incentivizing local food production and making it more available
and affordable through appropriate price policy could improve nutrition outcomes.
A schematic exploring the pathways between price policy and nutrition outcomes is shown in Figure 4.
Price policies can have direct effects on food consumption via food prices (pathway 1) or indirect effects
through income generation (pathway 2).

15
Changes in food prices have impacts on the quantity and quality of food consumption depending on the
responsiveness of demand to price (price elasticity) which will be mediated by a range of factors such as
income level, urban or rural residence, education of household head and women’s control of income. In
addition, the relative price of commodities has an impact on the composition of processed foods, whose
consumption can be further influenced by marketing strategies. The impacts of changes in food
consumption on nutrition status and health depend on a number of complementary inputs such as
access to clean water, sanitation and hygiene, child care provision, health services and opportunities for
physical activity in addition to biological factors such as individual genotype and metabolism.8
8 Dangour et al, 2013
Micro-economic development
indicators Income/
employment Household assets
Livelihoods
Commodity prices &
availability
Quantity & quality of food consumption
Nutritional Status
Price policies Tariffs Excises Taxes Subsidies Price control
Price elasticity
Inco
me elasticity
Imported processed foods Verses
Local fresh foods
Mediating Factors: Education Marketing
Intra-household distribution Urban/rural inequalities
Food processing
Mediating factors Health services Physical activity
Genotype Metabolism
Water quality Sanitation
Health
Figure 4: Linkages and pathways between price policy, food consumption and nutrition outcomes
Adapted from Dangour et al (2013)
1
2

16
Agriculture price policy is used to alter prices of agricultural outputs or inputs. Price policy instruments
include: quotas, tariffs, or subsidies on imports; quotas, taxes or subsidies on exports; and consumption
taxes or subsidies for domestic products. These policy instruments aim to directly decrease or increase
domestic prices, and raise government revenue. They also act to increase or decrease the volume of
products supplied from local sources, and the incomes of local producers, by increasing their price
competitiveness relative to imports.
The ongoing global commodity price fluctuations have significantly intensified political interest in
agriculture price policies. In the RMI the majority of households are net food buyers of largely imported
products. Increases in global food prices make net food buyers worse off, in the absence of
compensating policies. Similarly, increasing the price for some of the imported food products upon
which consumers depend will also have a negative impact on households, without a corresponding
decrease in the price for alternative food products. Thus, policies which increase income opportunities
for farming households but result in a net increase in the price of food will leave consumers worse off.
As a result, pricing policies aimed at improving food security must be nuanced and strike a balance
between increasing rural incomes, stabilizing net food prices, and ensuring that households are
incentivized to consume food products that contribute to positive, rather than negative, health
outcomes.
In most Pacific Island Countries (PICs), the thrust of agricultural price policy over the last two decades
has been towards reduction of government interventions. This deregulation aimed to increase prices to
farmers by reducing the share of the price retained by Government, and thus stimulate greater output
in the short run and investment in the medium term. The process of deregulation was combined with
trade liberalization, with the result that domestic producers were asked to compete on price with
products from more efficient overseas markets. This has resulted in a reduction in prices for consumers,
as well as for farmers. Farmers have unfortunately failed to supply the domestic market at the lower
international price, which has resulted in an increasing dependence upon imported food products.
While food prices have been on the whole lower, PICs like RMI have found themselves exposed to
periodic food price spikes (such as in 2007 and 2008), as a result of sharp increases in the price of
international agricultural commodities. This has led to some concern about the level of dependence
upon imported food products, and the potential for future price spikes to reduce access to food among
lower income households in RMI.
Review of import tariffs and taxes to prioritize food security RMI has a fairly liberal trade import tariff regime (Table 2 below). Over 66% of RMI imports originate
from the US, including Guam and Hawaii.9 Most food items are subject to 5% import duty, but some
selected basic food items are exempt from import duty. Most other ‘non-food’ items are subject to an
8% tariff. The relatively low rate of tariff applied by RMI aims to facilitate improved access to imported
food at affordable prices. However, this policy has also resulted in the application of relatively higher
tariffs on agricultural inputs critical to increasing the efficiency of local production. For example, under
the current trade regime imported tin fish is subject to zero duty whilst inputs for agriculture production
9 RMI Customs Office, Ministry of Finance
17
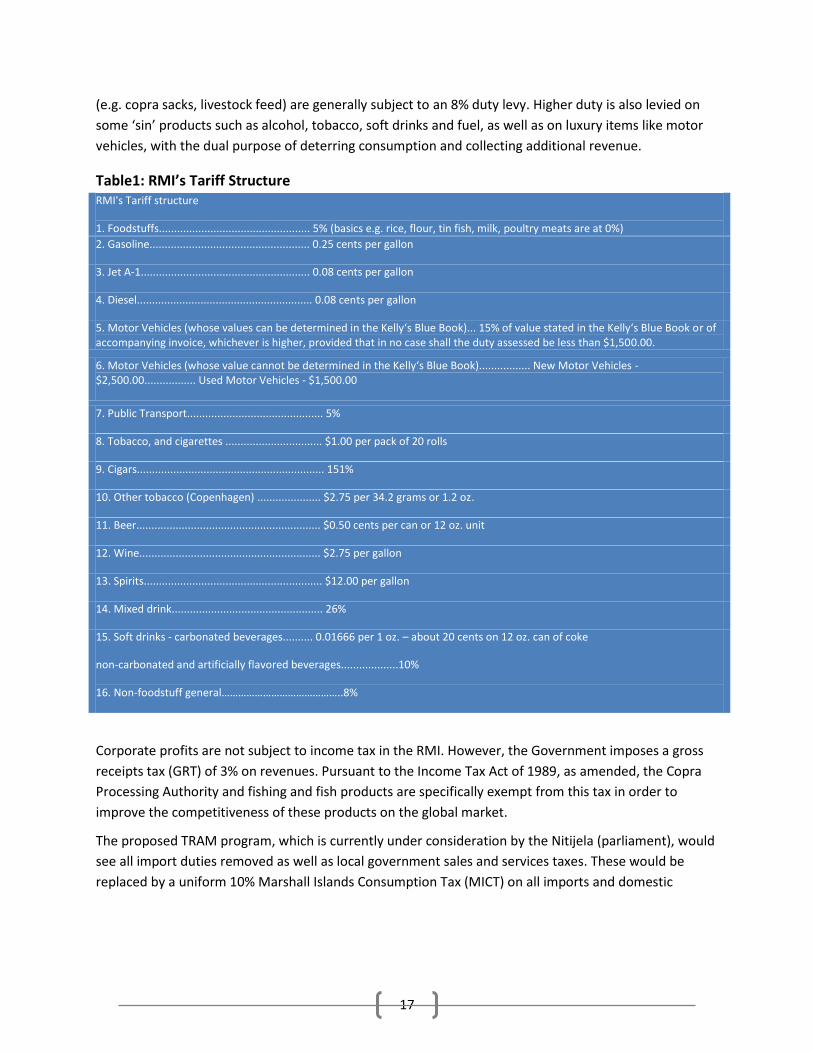
(e.g. copra sacks, livestock feed) are generally subject to an 8% duty levy. Higher duty is also levied on
some ‘sin’ products such as alcohol, tobacco, soft drinks and fuel, as well as on luxury items like motor
vehicles, with the dual purpose of deterring consumption and collecting additional revenue.
Table1: RMI’s Tariff Structure RMI's Tariff structure
1. Foodstuffs.................................................. 5% (basics e.g. rice, flour, tin fish, milk, poultry meats are at 0%)
2. Gasoline..................................................... 0.25 cents per gallon
3. Jet A-1........................................................ 0.08 cents per gallon
4. Diesel.......................................................... 0.08 cents per gallon
5. Motor Vehicles (whose values can be determined in the Kelly‘s Blue Book)... 15% of value stated in the Kelly‘s Blue Book or of accompanying invoice, whichever is higher, provided that in no case shall the duty assessed be less than $1,500.00.
6. Motor Vehicles (whose value cannot be determined in the Kelly‘s Blue Book)................. New Motor Vehicles - $2,500.00................. Used Motor Vehicles - $1,500.00
7. Public Transport............................................. 5%
8. Tobacco, and cigarettes ................................ $1.00 per pack of 20 rolls
9. Cigars.............................................................. 151%
10. Other tobacco (Copenhagen) ..................... $2.75 per 34.2 grams or 1.2 oz.
11. Beer............................................................. $0.50 cents per can or 12 oz. unit
12. Wine............................................................ $2.75 per gallon
13. Spirits........................................................... $12.00 per gallon
14. Mixed drink.................................................. 26%
15. Soft drinks - carbonated beverages.......... 0.01666 per 1 oz. – about 20 cents on 12 oz. can of coke
non-carbonated and artificially flavored beverages...................10%
16. Non-foodstuff general……………………………………..8%
Corporate profits are not subject to income tax in the RMI. However, the Government imposes a gross
receipts tax (GRT) of 3% on revenues. Pursuant to the Income Tax Act of 1989, as amended, the Copra
Processing Authority and fishing and fish products are specifically exempt from this tax in order to
improve the competitiveness of these products on the global market.
The proposed TRAM program, which is currently under consideration by the Nitijela (parliament), would
see all import duties removed as well as local government sales and services taxes. These would be
replaced by a uniform 10% Marshall Islands Consumption Tax (MICT) on all imports and domestic

18
supplies (of goods and services) with minimum exemptions10. Compulsory registration for MICT will
apply if taxable sales by an enterprise in any twelve month period will be $100,000 or greater.
Effectively MICT is a value added tax.
Additionally, under the TRAM program it is proposed to introduce a Marshall Islands Excise Tax (MIET).
The excise tax will replace the special national import duties and local government sales taxes currently
imposed on alcohol, tobacco products, petroleum products, soft drinks and motor vehicles.
Table 2 (First Schedule) Excisable Goods and Rates of MIET
Excisable Goods MIET Rate
Gasoline $0.45 per gallon
Jet A-1 $0.28 per gallon
Diesel $0.28 per gallon
Motor Vehicles Engine Capacity Vehicle Type
from to new used
zero cc 1000 cc $2,000 $1,000
1001 cc 2000 cc $2,500 $1,250
2001 cc 3000 cc $3,000 $1,500
3001 cc 4000 cc $4,000 $2,000
Greater than 4000 cc $5,000 $2,500
Public Transport 12% of excisable value
Tobacco & Cigarettes $2.00 per pack of 20 rolls
Cigars 151% of excisable value
Other Tobacco $3.70 per 34.02 grams
Beer $0.50 per 12 oz. can
Wine $10.00 per gallon
Spirits $25 per gallon
Mixed Drink 60% of excisable value
Soft Drinks Carbonated beverages $0.55 per 12 oz. can
Soft Drink Non-carbonated and artificially -flavored beverages
15% of excisable value
Betel nut $1.00 per pound Source:
1 Bill No: 15 - Draft Bill for an Act to amend Title 48 of MIRC, in order to provide for the imposition of the
Marshall Islands Excise Tax
These products are subject to additional taxation to offset the negative effects that consumption can
have on health or the environment. 11 The proposed excise rates to be levied are shown in Table 2.
Goods subject to excise tax will be exempt from MICT. In recognition of the adverse health issues the
excise rate on tobacco and cigarettes has been set at $2.00 per pack of 20 rolls, which is higher than
the existing combined national and local government average tax rate of $1.35. The excise on
10
Bill No: 11 - A Bill for an Act to amend Title 48 Chapter 1 of MIRC, in order to provide for the imposition of the Marshall Islands Consumption Tax and for matters connected therewith. 11
Bill No: 15 - A Bill for an Act to amend Title 48 of MIRC, in order to provide for the imposition of the Marshall Islands Excise Tax and for matters connected therewith.

19
carbonated soft drinks has increased from the current duty rate of $0.20 to $0.55 per 12 oz. can to take
account of local government taxes currently levied on these products.
The current price policy settings in RMI have worked to facilitate access to and encourage increased
consumption of cheaper imported food commodities including many food and beverage products which
are linked to rising obesity levels and NCDs. The current tariff structure provides no price incentives for
local food producers (farmers and fishers). Furthermore there is no tariff preference given to healthy
alternatives such as wholegrain or fortified rice and flour – the ‘good’ and the ‘bad’ are both subject to
the same zero duty levy. Going forward the Tax and Revenue Reform and Modernization (TRAM)
program proposes eliminating all import duties and implementing a uniform 10% consumption tax and
introduction of an excise tax on ‘sin’ products and motor vehicle engine size. The tax reform program
could be taken as an opportunity to expand the use of excises on other food products that are linked to
negative health outcomes and use any additional revenue generated to make local nutritious food more
available and affordable.
Application of ‘sin’ tariffs on food and beverages contributing to NCDs
Price policy may be used to help shift the balance on food choice away from less healthy foods (and
beverages) and towards more nutritious foods. Research into the links between poor diet, obesity and
increased risk of developing Non-Communicable Diseases over the last three decades, has led a number
of constituencies to introduce levies on foods and beverages with high sugar, salt and fat content12. The
result of these levies indicates that the best way to encourage healthy eating is to use revenue collected
from public health taxes to make healthy substitute products cheaper, or more available13. Furthermore,
research has found that the price of a product would need to be increase by at least 20% in order to
make an impact on consumption volumes14.
The Marshall Islands Excise Tax proposed in the TRAM program would implement an excise on
carbonated soft drinks (high in sugar content) at the rate of $0.55 per 12 ounce can. Using 2009
Custom’s import data (the only detailed data that could be currently accessed) we have calculated
below the potential additional revenue collected through the new excise rate.
In 2009 the value of imported carbonated soft drinks (HS220210) was $1,339,424 and the duty collected
was $931,769. At the current import duty rate of $0.20 per 12 ounce can (Table 1) then 4,658,845 cans
must have been imported. If the proposed new excise rate of $0.55 was applied to these imports the
revenue collected would be $2,562,365. This implies that an additional amount of around $1.6m could
be collected and potentially available to make healthy substitute products cheaper or more available.
Health taxes may also be considered for other food products high in salt and fat. Below in Table 3, we
present evidence of the potential revenue raised by an ad valorem excise levied at the rate of 20 and 30
percent on imports of a sample of 4 food products deemed to be very high in salt and/or saturated fat
by nutritionists (see Annex 1 for full details). This example demonstrates that if a tariff of 20 percent was
12
Thow et al., 2010 13
Horgen, K.B., Brownell, K.D., 2002 14
Myton et al., 2012

20
applied to just these 4 food products – canned beef; spam; hot dog franks; instant noodles it would be
sufficient to collect annually around US$320,000 for programs to fight obesity, and improve the health
of the nation. If the levy was raised to 30 percent then this would generate revenue almost US$478,000
that could be used for such worthwhile programs.
Table 3: Potential excise revenue collected from 4 food products deemed to be high in salt or fat
Product HS Code Value (CIF) 2009 US$
Revenue from 20% excise US$
Revenue from 30% excise US$
Canned beef 1602.50.00 634,414 126,882 190,324
Spam 1602.40.00 375,586 75,117 112,675
Franks/sausage 1601.00.00 328,955 65,791 98,687
Instant noodle 1902.30.00 254,147 50,828 76,243
Total Revenue 318,618 477,929
Recommendation 1: The Ministry of Health together with the Ministry of Resources and Development
(R&D)should lead the consultation with the Ministry of Finance for the implementation of a ‘health
excise’ on food (& beverage) products with a negative impact on NCDs, and the identification of
priority programmes for facilitating improved access to healthier substitute propducts.

21
3. Improved transport linkages for facilitating domestic market
opportunities Domestic shipping has a fundamental and vital service role in the Marshall Islands with a population
dispersed over many islands. The Government currently owns and operates most shipping services
within the country. The Marshall Islands Shipping Corporation (MISC) is responsible for providing
services between Majuro and outer-islands for both cargo and passengers. MISC was established in
FY2007 under Public Law 2005-41: the Marshall Islands Shipping Corporation Act, 2004. MISC was
established to manage and operate RMI’s shipping vessels. It is tasked to provide regular fieldtrip
services from Majuro to the Outer Islands, with a target of visiting each island at least once every 3
months15. MISC plays a key role in the collection and transportation of copra from the islands to the
processing mill in Majuro. Prior to 2011 MISC operated five ships including one landing craft. However,
in January 2011 its landing craft, the Jeljelat AE, sank. With the deterioration of the condition of its other
ships, fieldtrip services were significantly reduced from 43 in 2010 to 25 in 2011, whilst ships were dry
docked in Fiji for maintenance and repairs (Table 5). The establishment of the Shipping Vessel Repairs
and Maintenance Act in 2011 has now decreed that sufficient funds are available to undertake
necessary repairs and maintenance on a regular basis. With the addition of two new ships (including a
new landing craft) provided by the government of Japan and completion of dry dock repairs of the
remainder of MISCs fleet, five cargo/passenger vessels and one landing craft were in operation in 2014.
Source: Source: Marshall Islands Shipping Corporation Notes and Financial Statements (Years ending September 30
th, 2012 and 2011). Deloitte & Touche LLP, Tamuning, Guam.
15
Personal Communication Wally Milne MISC General Manager
050,000
100,000150,000200,000250,000300,000350,000400,000450,000500,000
US$
Figure 5: MISC Components of Operating Revenues 2010-2012
2010
2011
2012

22
MISC’s main operating revenues are from cargo, ship sales16, and charter. The steep fall in revenue from
charter in 2011 and 2012 reflect the loss of the landing craft which was their main charter vessel (Figure
7). MISC’s main expenses are staff costs (salaries, wages and benefits) and fuel costs (Figure 8).
Source: Marshall Islands Shipping Corporation Notes and Financial Statements (Years ending September 30
th, 2012
and 2011). Deloitte & Touche LLP, Tamuning, Guam.
Historically, the operating revenue generated by MISC has never been sufficient to cover related
expenses necessary to operate the shipping vessels and to provide sea-transportation services.
Table 4: Marshall Islands Shipping Corporation Financial Outcomes FY2008-FY2012
2012 ($) 2011 ($) 2010 ($) 2009 ($) 2008 ($)
Total operating revenues 841,608 844,307 1,296,317 1,269,407 1,500,688
Total operating expenses 2,007,138 2,305,581 2,368,189 2,600,523 2,682,755
Operating loss (1,165,530) (1,461,274) (1,071,872) (1,331,116) (1,182,067)
Operating subsidy 1,396,335* 1,142,446* 969,150 1,091,847 1,008,150
Loss disposal of equipment (25,303)
Change in Net Assets 230,805 (344,131) (102,722) (239,269) (173,917)
Net Assets at beginning of year (320,849) 23,282 126,044 365,273 539,190
Net Assets (deficiency) at end of year
(90,044) (320,849) 23,282 126,004 365,273
Number of fieldtrips 28 25 43
*The subsidy in 2012 includes $550,889 solely for the purpose of the Sipping Vessel Repairs & Maintenance Act and
only $845,466 for operating subsidy; in 2011 $297,000 was solely for the Shipping Repairs and Maintenance Act and $845,466 subsidy. Source: Marshall Islands Shipping Corporation Notes and Financial Statements (Years ending September 30
th, 2009 and 2008 & 2012 and 2011). Deloitte & Touche LLP, Tamuning, Guam.
16
Since 2009 MISC has operated onboard retail sales of goods on its fieldtrips which has become an important
revenue earner
0200,000400,000600,000800,000
1,000,0001,200,000
US$
Figure 6: MISC Components of Operating Expenses 2010-2012
2010
2011
2012

23
Over the period 2008 to 2012 MISC had operating losses averaging $1.24 million per year. With
government real operating subsidies averaging $952,000 annually, it has continued to show a declining
trend in Net Assets (Table 5). MISC has managed a gradual small reduction in operating expenses, in part
due to efficiency improvements, but also because of reduced fieldtrip services delivered in 2011 and
2012, and reduction in staff after the loss of the Jeljelat AE. However, MISC continues to be unable to
achieve a positive financial outcome.
Current freight and passenger tariffs – established at the same rate first set in 1982 - are charged per
voyage and fixed for unlimited miles. The freight rate is charged at $56.50 per ton and the passenger fee
is $2 per trip, regardless of distance; and therefore the same amount is charged on a trip to Arno (30
miles) or a trip to Enewetak (595 miles). The current fixed voyage tariff used by MISC indicates rates of
$1.88 per freight ton mile for the shortest journey to Arno and $0.09 per freight mile for the longest
voyage to Enewetak. MISCs Strategic Plan 2012-2015 states that: “for financial sustainability freight
income needs to be doubled, assuming a fleet of 4 adequate vessels. And freight rates and Community
Service Obligations (CSO) annual payments need to be equivalent of 4 times current freight rate income
level to achieve overall MISC Operational Surplus and 5 times to achieve operation surplus, provide
adequate maintenance expenditure and provide modest return on MISC assets at current values”.
Despite MISC petitioning government to increase tariff rates, this has not been agreed. Clearly
government recognizes the important community service affordable shipping provides and with a
tendency for migration from the outer islands, maintaining a low and uniform tariff rate across the
nation is seen as crucial to support viable island communities. In the absence of subsidized fright rates
food and other living costs in the islands would increase significantly leading to reduced food security
and an increase in migration to urban centers. However if tariff rates are not increased, MISCs capacity
to provide affordable sea-transport services to the people will be dependent on an increase in the
subsidy amounts provided to MISC. Additionally, it may be possible to better target subsidies only to
essential cargo items and on voyages to remote destinations which would always demand a community
service obligation. This could also encourage greater private sector participation on viable routes.
The acquisition of a ship by Tobolar Copra Processing Authority (TCPA) to collect copra which is targeting
the largest copra producing islands within a 215 mile zone from Majuro (this distance being the freight
cost break-even limit) could further challenge MISCs operating revenues as copra is the main cargo
carried on return voyages from outer islands. The current Tobolar ship has cargo capacity to carry 150
tons of copra, and at 75% load and assuming 2 trips a month, it could bring in about 2,700 tons of copra
a year – about 40-55% of annual production. It has been suggested that Taiwan may provide a further 2
vessels to TCPA based on the performance of the first vessel17. Careful coordination between MISC and
TCPA will be essential as MISC stands to lose valuable return cargo. Financial viability of the two SOEs
will only be improved by exploiting synergies and not through direct competition.
Outer Islands Sea Freight Fund and Price Monitoring
The Ministry of Internal Affairs (MIA) has prepared a draft Bill for an Act that would see the introduction
of a freight levy on cargo imported into RMI. This Bill proposes to incorporate under Title 11, Chapter 15
17
Tobolar Copra Processing Authority Strategic Reform Plan, October 2012 – September 2016, pg. 18

24
of the MIRC, imposition of 1.385% tariff on the value of imported goods excluding certain items in order
to fund the subsidization of the transportation of goods to and from the outer islands and atolls.
The justification for the ordinance is that prices of essential goods on the outer islands are up to 65-85%
higher than in Majuro and Ebeye. By subsidizing the shipping cost, it is anticipated that the cost of goods
will be reduced and thus improve living standards in the outer islands. It is estimated that such a levy, on
current imports, would collect revenue of around $1.5 million.18
Government have also legislated to control the mark up price of prescribes goods to be no more than
plus 25% of the Majuro wholesale price plus freight costs (the base price), in order to reduce price
inflation in the outer islands. The Retail Price Monitoring Office is responsible for enforcing this
regulation. The initial list of goods to be monitored includes 38 items, mostly food and beverages.
Included in the food items selected for price control are processed canned foods high in salt and fat and
other products high in sugar content which are linked to diet related NCDs. In line with the national
Food Security Policy and current health policy the price signal from such products should work to deter
excessive consumption rather than encourage it.
The proposed draft Bill does mention subsidizing the transportation of goods from the outer islands,
though the only product mentioned specifically is copra. Subsidizing the transportation of local food
produce from the outer islands to Majuro and Kwajalein centers would improve market access
opportunity for farmers on the outer islands and facilitate better availability of local food produce on
the urban markets. A similar freight levy scheme has been used for many years in Kiribati to subsidize
transportation of food goods including fresh produce from the outer islands to the urban market in
Tarawa (Box 1)
.
18
Personal Communication Kato Rubon, Chief Price Monitoring Office, MIA.
Box 1: Kiribati Freight Levy Fund In order to ensure equal access to basic goods, including food, at the same price for most of the country, the Kiribati Government controls the price of basic goods (defined to include rice, wheat flour, sugar, corned beef, bar soap, kerosene, and twist tobacco) and subsidizes transport costs of all goods from the port of entry (Tarawa) to all islands except South Tarawa through its Import Levy Fund (ILF). This program has been operating since before independence. Without the transport subsidy program food costs would be significantly higher on the outer islands and malnutrition and urbanization would likely increase.
The ILF was created by an Ordinance in June 1972 which has been amended from time to time, the last being in 1993 when a provision to provide subsidized support to the transport of some local agricultural produce from the outer islands to Tarawa was included. The ILF is financed by an import levy on all goods imported into Tarawa for commercial purposes. The levy is additional to other import duties. The current levy is set at AU$ 30 per cubic meter or per 875 kg of goods imported regardless of value. The Customs Department of the Ministry of Finance and Economic Development (MFED) assesses and collects the levy to be paid by importers together with other duties and charges as part of the Bill of Entry.
Funds from the ILF are used to subsidize the costs of transporting goods, imported or locally sourced, from South Tarawa to the outer islands. Payments are made from the ILF to wholesalers as (i) reimbursement of actual freight costs (not exceeding the approved freight rates set by the Kiribati Shipping Company Ltd; and (ii) reimbursement of actual freight costs (not exceeding the approved freight rates set by the Kiribati Shipping Company Ltd) of selected agricultural produce from the outer islands to South Tarawa. Reimbursement is limited to freight costs and does not include land transport, loading and other wharfage charges. The Accounts Department of the MFED manages the ILF and makes the payments according to the schedule set out in the Ordinance against proof of payment (receipts) of freight costs from the shipping companies. The accounts of the ILF are included within the accounts of the MFED and are reported and audited as part of the Kiribati Government’s Annual Account.
Together with the Price Control Ordinance, the ILF is one of the main mechanisms through which the Government of Kiribati is able to reduce the cost of living in the Outer Islands and improve the affordability of major food items.
Source: World Bank

25
Currently MIMRA, operate a fleet of five vessels that travel inter-
island to collect reef fish from the various fishermen as well as
provide transportation of the fish collected at their outlet fish bases
located in the Arno, Namu, Alinglalap and Likiep Atolls to their fish
markets in Majuro and Ebeye. The boats visit several outer islands
at least once per week and journey time back to Majuro on most
voyages is less than 24 hours. Whilst the primary purpose of this
service is for fish marketing the boats also have some opportunity
to carry a small amount of additional fresh produce cargo. Current
cargo rate is $0.17 per lb. As the fishermen utilizing this service to market their fish in Majuro and
Kwajalein are also farmers on the outer islands, linking these two activities to deliver fish and farm
produce to supply the school lunch programs in Majuro and Kwajalein would seem to be opportune.
Untargeted shipping subsidies and price monitoring with control on prices for a wide range of imported
food products laudably aims to ensure more access to affordable food in the outer islands. But it also
makes certain foods associated with NCDs more accessible (Annex 2 shows the list of products to be
monitored which includes at least six products deemed to be high in sugar, salt or fat). The proposed
outer island sea freight fund should be targeted in such a way that it provides a price incentive to the
more healthy food alternatives. It should also explicitly make available funds to subsidize the
transportation of local fresh produce (farm and fisheries) from the outer islands to the urban centers.
This would provide a strong market incentive for local food production.
Recommendation 2: Prescribed goods under the Price Monitoring Program should be reviewed and
products which are recognized to contribute to NCDs should be removed from the price control
program in order to reduce the price incentives they introduce for the consumption habits which
result in poor dietary and health outcomes.
Recommendation 3: The draft Bill for the Outer Islands Sea Freight Fund should specifically make
available a designated portion of the Fund to subsidize the transportation of locally produced fresh
food produce (farm and fisheries) from the outer islands to the urban centers
Recommendation 4: MIMRA should work together with R&D to coordinate fish and farm produce
transportation to the urban markets and where necessary utilize resources from the proposed ‘Outer
Islands Sea Freight Fund’ to subsidize transportation costs.
MIMRA boat docked in Majuro

26
4. Enhanced school feeding program Nutritional and health status are powerful influences on a child’s learning and on how well a child
performs in school. Poor nutrition among school-age children diminish their cognitive development
either through physiological changes or by reducing their ability
to participate in learning experiences - or both. The extra
demands on school-age children (to perform chores, for
example, or walk long distances to school) create a need for
energy that is much greater than that of younger children.
Research and program experience shows that improving
nutrition and health can lead to better performance, fewer
repeated grades and reduced dropout rate19.
The evidence around the education and health benefits of school feeding programs is well understood.
School feeding programs can help to get children into school and help keep them there, through
enhancing enrolment and reducing absenteeism; and once the children are in school, the programs can
contribute to their learning, through avoiding hunger and enhancing cognitive abilities.20 21 One of the
motivations for establishing school feeding programs is to provide targeted families and their children,
including girls, an incentive to attend school. However, in recent years, the idea of using school feeding
programs as a vehicle for agricultural development has also gained momentum. The rationale behind
school feeding programs based on the use of locally-produced food is that they can provide a regular
market opportunity and a reliable source of income for smallholder farmers.22
School feeding programs can thus be a powerful instrument for achieving many multi-sector benefits –
education, gender equality, food security, poverty reduction, nutrition and health, and agricultural
development. The recent food, fuel and financial crises have highlighted the importance of the provision
of supplementary food, such as through school feeding programs. Such programs act as both a social
safety net for children living in poverty and food insecurity, and as a tool for stimulating local agricultural
production and economic opportunities in rural communities.23
The RMI’s school feeding programs are enshrined in Public Law 1991-125 (with 2008 revision) to ensure
that school children have access to nutritious food required for productive learning and healthy living.
However, budgetary constraints have seen significant cut-back in delivery and quality of the school
feeding program24. Reinstating and enhancing the school feeding program with appropriate nutritional
guidelines for the lunch menu and with regulated local food content inclusion (≥50%) would bring
multiple benefits including; improved nutrition for vulnerable children, increased school attendance and
academic attainment whilst also creating a substantial market demand for locally produced food and
19
Del Rosso,1999 20
Bundy et al, 2009 21
Adelman et al, 2008 22
Sumberg and Sabates-Wheeler, 2011 23
Demek et al (2014) 24
Personal Communication Kanchia Hosia, Assistant Secretary for Schools.

27
thus foster local economic development. Providing school children with a well-balanced meal rich in
local food content, would also be a powerful awareness raising tool to influence improved dietary
choices early in life.
In full attendance, the public school role including kindergarten (5 years) primary (6-14 years) and
secondary (15-18) is around 10,500 children. In school year 2013/14, only kindergarten and the public
boarding schools are fully receiving the entitled free school lunch. The current allowance for the
preparation of a school lunch plate is around $1.50 and lunches need to be provided for 180 days in a
school year. Therefore the cost of fully delivering the program would be in excess of $2.8 million. The
potential revenue collected from health excise (levied on beverages and food deemed high in sugar, salt,
or fat) was estimated at around $3.0 million and thus would provide substantial revenue to support the
school feeding program. Purchasing greater than 50% of the lunch content from locally sourced food
would provide a substantial market for local farmer’s produce and local fish (including by-catch). Local
women’s groups or other private sector suppliers could be contracted to prepare and supply the meals
in accordance with the regulated lunch menus.
The Education Department already has two in-house health and nutrition specialists who could
supervise appropriate menu choices. The elementary school curriculum covers nutrition in grades 1
through 8 with the intention that students are able to demonstrate good knowledge of nutrition and
have the ability to make healthy food choices for themselves. A curriculum benchmark expectation is
that students will be able to apply their knowledge of food groups and good nutrition to plan healthy
meals. A possible awareness raising opportunity to launch a revamped school feeding program could be
a national school competition to design the nutritious school lunch menus which include at least 50%
local food content.
A key driver for increasing local agricultural production through the adoption of improved production
methods will be establishing a strong and sustainable market for local farm products with efficient and
supply chains from farm to market, including affordable sea transportation where necessary. As the
school feeding program runs for a fixed 180 days a year and would require a pre-determined food
basket, it would provide a real opportunity to benefit small farmers by generating a stable, structured,
and predictable demand for their products. A well-established market and robust supply chain would
also help to build the enabling systems to support sustainability (e.g. subsidized freight rates on
shipping, ‘soft’ loan finance for agriculture development, business support services and technical
support for new farming technology and practices). This in turn should also have broader impacts on the
local economy. Jobs and profits may be created not only for farmers, but for those involved in the
transportation, processing, and preparation of food along the school feeding supply chain.
Capacity of local food producers to supply the school feeding program
The highest school populations are in Majuro and Ebeye. There are eight elementary schools in Majuro,
four in the urban center which enroll around 500 or more children in each school and four in the rural
areas which enroll between 100-500 children. Ebeye Elementary school in Kwajelein Atoll is the largest
school in the country with more than 1,000 students. There are a further 67 elementary schools spread
throughout the outer islands which generally have between 50 and 100 students, although a few

28
schools enroll up to 200 children. The public secondary schools have about 2,000 students enrolled in 6
schools, three in Majuro, one in Kwajalein and two boarding schools located in Jaluit and Wotje.25The
largest quantity of farm produce will be required to provide local food content for the school lunch
program in Majuro and Kwajalein.
Attention should focus initially on this demand by building robust domestic supply chains. The Laura
farms already have significant capacity for production and currently service several market outlets in
Majuro including the Majuro farmers market, some hotels/restaurants, some supermarkets and the
fishing boats. Scarce data exists on total production capacity and potential to increase this. However
records kept by the Taiwan project and R&D indicate that vegetable produce (including papaya and
pumpkin) supplied by Laura farmers and sold in the Majuro markets amounted to some 21,604 lb.
valued at $26,906 in 201326. These production figures do not include breadfruit, taro, banana, pandanus
and limes. A group of up to 69 farmers are involved in this production and marketing. However,
according to the 2011 Census there are some 188 households in Laura and Woja/Arrak areas which are
growing crops for the market27. Whilst there is still likely to be some capacity to increase production
from these areas to supply a predictable demand from the school feeding program for Majuro schools,
additional supply would also be required from other outer islands. Supply from outer island would also
be needed for the Ebeye schools as there is very limited capacity for crop production on Kwajalein Atoll.
Supply for the two boarding schools located on Jaluit and Wotje could primarily be sourced from local
producers on these atolls.
A number of outer islands should have potential to participate in a coordinated supply chain for the
school feeding program providing that regular ship transportation is available with affordable
(subsidized if necessary) cargo rates and capacity to carry the requisite amounts of produce.
Arno Atoll would be a prime choice to kick-start a program for increased crop production for the school
feeding program with its relatively good growing environment and close proximity to Majuro with
frequent ship services and voyage length of less than two hours. According to the 2011 Census there
were 126 households growing crops for income. Until recently farmers in Arno were regularly marketing
some of their food produce in Majuro. There are at least six boat trips between Arno and Majuro each
week and a basket (or copra sack) full of fresh produce is subject to a freight charge of $1 between Arno
and Majuro. Arno farmers would have excellent potential to increase production of breadfruit, pumpkin
and papaya as well as other vegetables. Other atolls such as Jaluit and Ebon have good growing
conditions and potentially could produce surplus to add to the school feeding program supply chain.
Credit and business and technical services
The structured demand from the school feeding program would provide the incentive for smallholder
farmers to improve quantity and quality of production through investment in better inputs and
technology. The assured market would reduce risk and thus allow the Bank of Marshall Islands to extend
more small loans to farmers (currently offered at 7% and available in Majuro and at outer island
25
RMI Ministry of Education (undated) 26
Data provided from the Taiwan-RMI Agricultural Production and Development Project Fund 27
RMI 2011 Census of Population and Housing Report, pg. 454

29
branches). The RMI Small Business Development Center is available to help farmers prepare loan
applications and provide training to upgrade business skills. Technical assistance can be provided to help
farmers improve production through the R&D’s agriculture program supported by their development
partners such as Taiwan Technical Mission, FAO and SPC.
Recommendation 5: The R&D together with the Ministry of Education and the Ministry of Health
should advocate for an amendment to the Public Law 1991-125 such that a regulated proportion of
local food content is included in the school feeding program.
Recommendation 6: The Ministry of Education together with R&D and the Ministry of Health should
review the school lunch program and provide a healthier menu choice including more local fresh
produce (fruits and vegetables) and redesign the procurement and distribution system for the food to
facilitate increased purchasing from local farmers and fishers. The enhanced school feeding program
could be a ‘flagship’ program under the National Food Security Policy.

30
5. Co-ordination of policy and regulatory reform
Simple dietary changes can save lives and money. Policies that change the prices of foods at a national
level can influence food choices and thus have an effect on population-level nutrition and health
outcomes. Restructuring price policy and agriculture policy to promote production and consumption of
nutritious local foods to help mitigate the grim effects of NCDs is long overdue. Such preventive NCD
measures would result in significant cost savings to individuals, the health budget and the economy,
thereby constituting a fiscally responsible investment of public resources.
Excise taxes and import tariffs together with freight subsidies have the potential to alter the relative
prices of imported processed food and local fresh foods making local foods more competitive and
accessible. Revitalizing and enhancing the school feeding program to include a regulated amount of local
nutritious food content would provide a structured and sustainable market demand for local food
produce thus making it easier, less risky and more profitable for producers to invest in upgrading their
farm technology to increase productivity. The use of the structured demand to supply the school feeding
program would therefore provide an attractive avenue through which to kick start a process of
agricultural and livelihood transformation in RMI as well as promoting the delivery of priority education
and health policy outcomes.
Strengthening food security in the RMI will be dependent on coordinated multi-sector interventions,
improved policy coherence and the ability to resolve conflicts of interest. This will require a forum such
as a “Food Policy Council” that can bring together a diverse range of stakeholders united in their interest
to transform the food system through collaborative policy making.
Establishing the policy and regulatory settings and institutional service provision necessary to reduce
RMI’s heavy dependence on food imports and strengthen food security, will require a coordinated effort
reaching across many areas of government responsibility. It will also need to include a strong voice from
the private sector (farmers, fishers, traders, retailers, processors, food service and transportation etc.)
and civil society. Therefore, there is a critical need for the establishment a formal forum where key
stakeholders from government, the private sector and civil society can come together to identify and
lobby for the policy and regulatory reforms which are necessary for tackling the NCD health crisis,
achieving import substitution, encouraging local agri-business development and protecting the
sustainability and equity of RMI’s food system. The R&D previously coordinated a food security
committee, whilst the Ministry of Health leads a nutrition committee, uniting these committees under
one formal body such as a Food Policy Council would lift their political profile and enhance their
credibility across multiple disciplines enabling them to form coalitions to develop a coherent set of
policy and regulatory reforms necessary to strengthen food security in RMI. A Food Policy Council could
thus play a critical role in galvanizing multi-sector support for enhancing the school feeding program and
revitalizing local food production

31
The Food Policy Council would be responsible for overseeing the implementation of the priority
integrated food security programs proposed in the Food security Policy. Figure 5 below, provides a
schematic of the proposed integrated Food Security plan focused on the use of pricing policy
interventions in order to improve dietary intake, and provide capital for implementing an to enhanced
school feeding program utilizing locally grown food.
Recommendation 7: The Ministry of Resources and Development should join with the Ministries of
Finance, Health and Education to facilitate the establishment of Food Policy Council with mandate to
design and implement whole of government policy measures to address the strategic issues common
to food production and consumption trends in RMI; and to enhance co-operation between the public
and private sectors to ensure a sustainable, healthy and equitable food system.
($3.0 m)
($1.5 m)
REVENUES $
INCREASED MARKET DEMAND FOR LOCAL FOOD PRODUCE
Breadfruit, pumpkin, papaya, pandanus, taro, banana, coconut, greens, limes, fish
Fund healthy school lunch Local content ≥ 50%
(10,500 children x 180 days) (Cost $2.8 m)
IMPROVED FOOD SECURITY
reduced NCDs
Shipping
HEALTH TAX sugar, salt, fat
FREIGHT LEVY (1.385%) on certain cargo imports
Influence food choices
Frei
ght
sub
sid
y
Laura farmers
Arno farmers
Jaluit farmers
Ebon farmers
Increased access to soft loan (7%) finance from Bank of MI
Figure 5: A program of coordinated multi-sector actions to improve food security

32
Annex 1: Model for a health tax based on fat and salt content
What foods should a ‘health tax’ target?
According to the Australian and New Zealand Food Standard Code (FSC), a balanced diet (8700 kilijoules)
for an average adult should include no more than the following levels of daily intake of saturated fat,
sugar and sodium (http://www.foodstandards.gov.au/code/Pages/default.aspx):
Sodium – 2300 miligrams
Saturated Fat – 24 grams
Sugar – 90 grams
Health authorities (USDA) considers that a serving of any food item which contains more than 20% of
the recommended maximum daily intake of that ingredient, is considered to contain a high-level of that
ingredient, and should be consumed only in moderation. However there are a large number of foods
containing far more than this rate, and their consumption could therefore beneficially be reduced
through the use of a tax.
Research into the impact of fat taxes shows that the price of a product would need to increase by at
least 20% in order to make an impact on consumption volumes (Myton et al 2012). In this example we
look at the revenue raising impact of the introduction of a tax that results in a 20% and a 30% increase in
the price of a sample of food products deemed to very high in salt or saturated fat by nutritionists. For
the purposes of this study we have selected 4 products commonly consumed and available in RMI
stores: tinned corned beef (Palm); tinned ham product (Spam); Hot Dog Franks (Bar-S); instant noodles
(Maggi). A full description of the nutritional content of each of these products is included at the end of
this Annex.
In order to compare the contents of each product, we select 100g as a sample serving size. While many
products display a serving size that is lower than100g, this often obscures the serving sizes being
consumed in the Pacific Islands and their real impact on health. Thus we used 100g as the standard size
in order to provide a comparison between products. We highlight in the table below any product for
which a 100g serve contains more than a third (33%) of recommended daily intake (RDI) of salt of
saturated fat. Three of the four products - canned corned beef; canned spam; and hot dog franks– pass
the threshold for saturated fat content, and three products –canned spam, hot dog franks and noodles-
pass the threshold for salt. Therefore all four products have been selected to be subject to a health tax.

33
Table: Contents of 100g serve of select food items
Food item Saturated Fat content Sodium Content
Grams % DRI Milligrams % DRI
tinned corned beef 8.4 35 630 27
tinned ham product 10.5 53 1383 60
Hot dog franks 8.4 35 904 39
Instant noodles 7.5 31 1188 60
Using 2013 official national import data, providing the total volume and FOB value of each of these
products that was imported into the country that year, we can investigate what revenue would be
raised by applying a 20% & 30% ad valorem excise tax to imports of these products. The results are
presented in Table 6 in the main body of the report and copied in the table below.
Product HS Code Value (CIF) 2009 US$
Revenue from 20% excise US$
Revenue from 30% excise US$
Canned beef 1602.50.00 634,414 126,882 190,324
Spam 1602.40.00 375,586 75,117 112,675
Franks/sausage 1601.00.00 328,955 65,791 98,687
Instant noodle 1902.30.00 254,147 50,828 76,243
Total Revenue 318,618 477,929

34
Corned Beef Nutrition Facts
Per serving size 100 grams
Amount Per Serving
Calories from Fat 142
Calories 248
% Daily Values*
Total Fat 16g 22%
Saturated Fat 8.4g 35%
Cholesterol 63mg 21%
Sodium 630mg 27%
Total Carbohydrate 0g 0%
Dietary Fiber 0g 0%
Sugars 0g
Protein 14g
Vitamin A -
Vitamin C -
Calcium -
Iron 6%
* Percent Daily Values are based on a 2000 calorie diet. Your daily values may be higher or lower depending on your calorie needs.

35
Spam Nutrition Facts
Per serving size100g
Amount Per Serving
Calories from Fat 245
Calories 315
% Daily Values*
Total Fat 28g 38%
Saturated Fat 10.5g 53%
Trans Fat 0g
Cholesterol 123mg 41%
Sodium 1383mg 60%
Total Carbohydrate 3.5g 0%
Dietary Fiber 0g 0%
Sugars 0g
Protein 12.25g
Vitamin A 0%
Vitamin C 0%
Calcium 0%
Iron 2%
* Percent Daily Values are based on a 2000 calorie diet. Your daily values may be higher or lower depending on your calorie needs.

36
Hot Dog Franks Nutrition Facts
Serving Size 100 g
Amount Per Serving
Calories from Fat 214
Calories 286
% Daily Values*
Total Fat 23.81g 38%
Saturated Fat 8.4g 35%
Cholesterol 85.3mg 28.6%
Sodium 904mg 39%
Total Carbohydrate 4g 2.4%
Dietary Fiber 0g 0%
Sugars 4.8g
Protein 7.1g
Vitamin A 0%
Vitamin C 0%
Calcium9%
Iron 5%
* Percent Daily Values are based on a 2000 calorie diet. Your daily values may be higher or lower depending on your calorie needs.
Nutrition Values are based on USDA Nutrient Database SR18

37
Instant Noodles Nutrition Facts
Serving Size 100g
Amount Per Serving
Calories from Fat 163
Calories 450
% Daily Values*
Total Fat 17g 23%
Saturated Fat 7.5g 31%
Trans Fat 0g
Cholesterol 0mg 0%
Sodium 1188mg 52%
Total Carbohydrate 59g 20%
Dietary Fiber 2.5g 10%
Sugars 3g
Protein 7g
Vitamin A 0%
Vitamin C 0%
Calcium 10%
Iron 2%
* Percent Daily Values are based on a 2000 calorie diet. Your daily values may be higher or lower depending on your calorie needs.

38
Annex 2: Items included in the food monitoring program
FLOUR TEA
Gem #27 COFFEE INSTANT
Hawaiian Baker 25# COFFEE MATE
Island Enriched 24# GROUND COFFEE
Taiwan Baker 25# TUNA
PFM Flour 25# MACKEREL
PMF Fiji Flour 22# CORNED BEEF
Punji Fiji Flour 22# LUNCHEON MEAT
Aus Baker's Flour SPAM
FMF Baker's Flour25# SAUSAGE
Island Pacific Flour CORNED BEEF HASH
RICE BEEF STEW
SunWhite Rice 20# SOY SAUCE
Pearl Rice KETCHUP
Is. Sun Calrose Rice 20# MIXED VEGETABLE
Guam Rice 20# CORN
Homai Rice 20# TOILET TISSUE
Yokwe Rice 20# TOOTH PASTE
California Select 20# MOSQUITO- COIL
Micronesia State Rice 15# MATCHES
SUGAR ZORIES/SLIPPERS
BISCUIT BATTERIES
INFANT FORMULA NOTE BOOK
SHORTENING COMPOSITION BOOK
BAKING POWDER BUTANE GAS CAN
BAKING SODA OUTBOARD ENGINE OIL
YEAST GASOLINE 53 gal/drum
EVAPORATED MILK DILES 53 gal/drum
PUNCH KEROSENE 53gal/drum
POWDERED DRINKS

39
Annex 3: List of people consulted
Name Position Alton Riklon Price Monitoring Officer, MOIA
Amando Reyes Food & Beverages Manager, Marshall Islands Resort
Anel N. Philimon Service Center Director, SBDC, MOR&D
Carl Hacker Director College of Marshall Islands
Casten Nemra Chief Secretary
Bruce Loeak Microfinance, Bank of Marshall Islands
Dahlia Kaneko Monitoring & Evaluation/Aid Coordination, EPPSO
Daniel Timothy Chief, Customs , MOF
Eonmita Rakinmefo Health Curriculum Specialist, MOE
Florence Edwards Principal Officer Oceanic Fisheries, MIMRA
Fred deBrum Director, EPPSO
Glorina Harris Health (& nutrition)Specialist Ministry of Education
Henry Capelle Chief Agriculture Ministry of Resources and Development
Itibo Tofinga Chief of Taxation & Revenue Ministry of Finance
Jemi Nasho General Manager Tobolar Copra Processing Authority
Julia Alfred Secretary Ministry of Health
Kanchi Hosia Assistant Secretary, Ministry of Education
Karness Kusto Assistant Chief of Agriculture, MOR&D
Kato Rubon Chief, Price Monitoring Office, MOIA
Patrick Chen President/CEO Bank of Marshall Islands
Phil Philippo Secretary, Ministry of Transport & Communications
Radika Kumar National Trade Adviser, MOR&D
Rebecca Lorennij Secretary, MOR&D
Wally Milne General Manage Marshall Islands Shipping Corporation
Participants attending the R&D/FAO roundtable consultation meeting 30 July 2014.
Name Position Alton Riklon Price Monitoring Officer, MOIA
Anel N. Philimon Service Center Director, SBDC, MOR&D
Bruce Loeak Microfinance, Bank of Marshall Islands
Dahlia Kaneko Monitoring & Evaluation/Aid Coordination, EPPSO
Daniel Timothy Chief, Customs , MOF
Emma Kabua Policy Officer, MIMRA
Eonmita Rakinmefo Health Curriculum Specialist, MOE
Florence Edwards Oceanic Fisheries, MIMRA
Fred deBrum Director, EPPSO
Karness Kusto Asistant Chief of Agriculture, MOR&D
Kato Rubon Chief, Price Monitoring Office, MOIA
Phil Philippo Secretary, Ministry of Transport & Communications
Radika Kumar National Trade Adviser, MOR&D
Rebecca Lorennij Secretary, MOR&D

40
Annex 4: References
Asian Development Bank (2012) Key Indicators for Asia and the Pacific 2013
Dangour AD, Hawkesworth S, Shankar B, et al (2013) Can nutrition be promoted through agriculture-led food price policies? A systematic review. BMJ Open 2013;3:e002937.doi:10.1136/bmjopen-2013-002937
Del Rosso, JM (1999) School Feeding Programs: Improving effectiveness and increasing the benefit to education. A Guide for Program Managers, the Partnership for Child Development.
Demek, M, Spinelli, A, Crose S, et al (2014) Food and agriculture policy decisions Trends, emerging issues and policy alignments since the 2007/08 food security crisis. Food and Agriculture Organization of the United Nations Rome, 2014.
Drake L, McMahon B, Burbano, C, Singh S, Gelli A, Cirri G, Bundy D (2012) School Feeding: Linking Education, Health and Agricultural Development Paper for the 2012 International Conference on Child Development Hosted by the China Development Research Foundation
Horgen KB, Brownell KD (2002). "Comparison of price change and health message interventions in promoting healthy food choices". Health Psychology 21 (5): 505–512
International Monetary Fund (2014) Republic of Marshall Islands 2013 Article IV Consultation, IMF Country Report No. 14/26
Ministry of Education (undated) The Republic of Marshall Islands Education for all Mid-Decade Assessment, prepared with support from UNESCO.
Myton O, Gray A, Rayner M, Rutter H (2007) “Could targeted foods improve health?” Journal of Epidimological Community Health Vol. 61 No. 1 pp.689-694
Sumberg J R and Sabates-Wheeler (2011). Linking agricultural development to school feeding in sub-Saharan Africa: theoretical perspectives. Food Policy 36(3): 341-349
Thow A, Heywood P, Scultz J Quested C, Jan S, Colagiuri S (2011) Trade and the Nutrition Transition: Strengthening Policy for Health in the Pacific: Strengthening Policy for Health in the Pacific, Ecology of Food and Nutrition, 50:1, 18-42
Related Documents