NATIONAL PLANNING AUTHORITY COMPREHENSIVE EVALUATION OF THE UNIVERSAL PRIMARY EDUCATION (UPE) POLICY Thematic Report 1: Policy, Legal, Regulatory and Institutional Framework November, 2018

Welcome message from author
This document is posted to help you gain knowledge. Please leave a comment to let me know what you think about it! Share it to your friends and learn new things together.
Transcript

NATIONAL PLANNING AUTHORITY
COMPREHENSIVE EVALUATION OF THE UNIVERSAL PRIMARY EDUCATION
(UPE) POLICY
Thematic Report 1:
Policy, Legal, Regulatory and
Institutional Framework
November, 2018

NATIONAL PLANNING AUTHORITY
COMPREHENSIVE EVALUATION OF THE UNIVERSAL PRIMARY EDUCATION
(UPE) POLICY
Thematic Report 1:
Policy, Legal, Regulatory and Institutional Framework
November, 2018

i
NATIONAL PLANNING AUTHORITY
i
FOREWORD
This independent comprehensive evaluation of the Universal Primary Education (UPE) policy is one of the many evaluations of Government policies and programmes to be produced by the National Planning Authority (NPA) in fulfilment to the National Planning Act (2002) and the National Development Plan (NDPII). Two decades since the UPE policy was introduced, it isimportant to look back and take stock of the remarkable gains attained, identify the challengesfaced, and lessons learnt during the implementation of the UPE policy.
The objectives of the UPE Policy were:1) To provide facilities and resources to enable every child to enter school;2) To ensure the completion of the primary cycle of education;3) To make education equitable in order to eliminate disparities and inequalities;4) To ensure that education is affordable by the majority of Ugandans; and5) To reduce poverty by equipping every individual with basic skills.
This comprehensive evaluation set out to assess the extent to which the above objectives havebeen achieved. In an effort to provide guided policy direction, the evaluation was undertaken along six (6) thematic areas that include:
(i) Policy, Legal, Regulatory and Institutional frameworks; (ii) Efficacy of the Primary School Curriculum in Supporting the Realization of UPE;(iii) Primary Teacher Training for Producing Competent Teachers to deliver UPE;(iv) Efficacy of School inspection in Supporting the delivery of UPE;(v) Financing and Costing of UPE; and (vi) Education Modelling and Forecasting.
These Reports provide over-arching findings and recommendations necessary for improving the quality of primary education in Uganda. In particular, the reports are useful in: informing the finalization of the review of the Education White Paper; improving teacher training mechanisms and policies; improving adequacy of the curriculum; strengthening policies and guidelines regarding community participation; inspection; providing status for the 2030 Agenda on Sustainable Development Goal 4 on Education for All; and informing policy planning and the Uganda Vision 2040.
The comprehensive evaluation used both quantitative (secondary and primary) and qualitative evidence using data from; the UNHS, EMIS, UNEB, NAPE, MTEF, World Bank, UNESCO, and NPA Survey among others. The quantitative analysis was based on rigorous econometric and non-econometric models that include the: Standard Mincerian Regression; Stochastic Frontier production function; Benefit Incidence analysis, cohort analysis, ordinary least squares analysis, logit analyses, UNESCO’s Education Policy and strategy simulation (EPSSim). With respect to the qualitative analysis, we undertook a rigorous desk review of the relevant literature with bench marked good country policy practices, various formative and summative evaluations on the UPE policy before, interviews and field work.
ii
Policy, Legal, Regulatory and Institutional Framework
ii
This comprehensive evaluation was based on the standard OECD-DAC evaluation principles which includes; relevance, effectiveness, efficiency, impact and sustainability.The rating criteria is categorized into 3 decision rules namely; Substantially Achieved, Partially Achieved, and Not Achieved. Overall the UPE Policy has been partially achievedbased on the OECD criteria rating.
The UPE policy substantially meets the relevance principle. The policy is aligned to national priorities and policies such as the Poverty Eradication Action Plan (PEAP), Millennium Development Goal (MDG) 2 of achieving Universal Primary education, Education Act 2008, Sustainable Development Goal (SDG) 4, NDPs and Uganda Vision 2040. Empirical evidence indicates that: 88 percent of the school going age children are in school; and equity in terms of gender parity and Special Needs Education have greatly improved.
On the other hand, the UPE policy partially meets the effectiveness principle. Overall, 60percent of the UPE objectives have been substantially achieved under objective 1, 3 and 5, but with partial achievement registered on 2 and 4. This rating is as a result of performance on the following indicators; access of 88 percent, PLE completion of 65 percent, remarkable improvement in literacy and numeracy, cohort completion rate of 38 percent, dropout rate of 38.5, repetition rate of 1.5 percent.
This policy partially meets the efficiency principle in producing the maximum possible outcome given the available inputs. This is explained by the government-aided schools being away from the maximum possible outcome by only 0.38 percent when compared to their private schools counterparts at 11.8 percent. This implies that, for Government to improve learning outcomes, it should increase financing to the primary school sector. However, the evaluation notes that there are still leakages in the system among which include; poor completion, absentiseem, less time on task by teachers and low pass rates.
The UPE policy partially meets the policy impact principle. Notably, the policy has significantly impacted on the years of schooling especially on the average years of education for the household head that have increased to 10 years from 4.2 years in 1997. Empirical evidence shows that completing 7 years of primary increases household incomes by about 10.2 percent as compared to their counterparts who don’t complete the cycle. Similarly, the analysis showed that an additional year of schooling improves Primary Health Care (PHC) outcomes of these households, as well as equipping individuals with basic skills and knowledge to exploit the environment for self-development and national development.
The UPE policy partially meets the sustainability principle. The comprehensive evaluation notes that while donor financing has gone down over the years, government financing and household education expenditure have increased. Over the same period, the per capita expenditure has consistently reduced occasioned by increase in enrolment out-pacing growth in the education budget, indicating a financial sustainability constraint. Beyond that, a review
iii
NATIONAL PLANNING AUTHORITY
ii
This comprehensive evaluation was based on the standard OECD-DAC evaluation principles which includes; relevance, effectiveness, efficiency, impact and sustainability.The rating criteria is categorized into 3 decision rules namely; Substantially Achieved, Partially Achieved, and Not Achieved. Overall the UPE Policy has been partially achievedbased on the OECD criteria rating.
The UPE policy substantially meets the relevance principle. The policy is aligned to national priorities and policies such as the Poverty Eradication Action Plan (PEAP), Millennium Development Goal (MDG) 2 of achieving Universal Primary education, Education Act 2008, Sustainable Development Goal (SDG) 4, NDPs and Uganda Vision 2040. Empirical evidence indicates that: 88 percent of the school going age children are in school; and equity in terms of gender parity and Special Needs Education have greatly improved.
On the other hand, the UPE policy partially meets the effectiveness principle. Overall, 60percent of the UPE objectives have been substantially achieved under objective 1, 3 and 5, but with partial achievement registered on 2 and 4. This rating is as a result of performance on the following indicators; access of 88 percent, PLE completion of 65 percent, remarkable improvement in literacy and numeracy, cohort completion rate of 38 percent, dropout rate of 38.5, repetition rate of 1.5 percent.
This policy partially meets the efficiency principle in producing the maximum possible outcome given the available inputs. This is explained by the government-aided schools being away from the maximum possible outcome by only 0.38 percent when compared to their private schools counterparts at 11.8 percent. This implies that, for Government to improve learning outcomes, it should increase financing to the primary school sector. However, the evaluation notes that there are still leakages in the system among which include; poor completion, absentiseem, less time on task by teachers and low pass rates.
The UPE policy partially meets the policy impact principle. Notably, the policy has significantly impacted on the years of schooling especially on the average years of education for the household head that have increased to 10 years from 4.2 years in 1997. Empirical evidence shows that completing 7 years of primary increases household incomes by about 10.2 percent as compared to their counterparts who don’t complete the cycle. Similarly, the analysis showed that an additional year of schooling improves Primary Health Care (PHC) outcomes of these households, as well as equipping individuals with basic skills and knowledge to exploit the environment for self-development and national development.
The UPE policy partially meets the sustainability principle. The comprehensive evaluation notes that while donor financing has gone down over the years, government financing and household education expenditure have increased. Over the same period, the per capita expenditure has consistently reduced occasioned by increase in enrolment out-pacing growth in the education budget, indicating a financial sustainability constraint. Beyond that, a review
iii
of the institutions that support UPE indicates that albeit their challenges, they are technically capable of spear heading a successful UPE Programme. Moreover, Government continues to greatly support primary education amidst other education sub-sectors like BTVET and USE which compete for the available fixed resource envelope. Notwithstanding, there are other factors which hinder the sustainability of the policy, that include; high population growth rate, high dropout, negligence by parents and poverty among others.
Overall, empirical evidence indicates that the UPE policy remains relevant, pro-poor and has largely fulfilled its primary objective of increasing equitable access. However, challenges that include leakages within the system affect learning outcomes. Similarly, to attain the desired quality Universal Primary Education, the per pupil expenditure should increase to UGX 63,546 for Urban schools and UGX 59,503 for rural schools from the current UGX 10,000 that government is contributing. In fact, the demand constraints have reduced over the UPE span, with Uganda pursuing an inclusive economic growth and rapid reduction in poverty which has significantly increased the financial resources at the disposal of households. This also illustrates the increasing priority that Ugandans have accorded to these areas and the impact of the UPE policy in raising awareness and addressing cultural constraints even among the poorest households.
Indeed, Government was right on its decision to implement the policy and is therefore advised to continue pursuing this programme with improved financing and institution strengthening as indicated in the respective thematic reports.
In conclusion, I extend my gratitude to the; First Lady/Minister of Education and Sports for the overwhelming support, Parliament of Uganda and the Ministry of Finance Planning and Economic Development for appropriating funds for the first comprehensive evaluation. Also, we acknowledge the support from; the Inter-Agency Committee, Ministry of Education and Sports, Local Governments, Schools visited, the NPA Fraternity especially the M&E Department and the Research Assistants that collected the data that informed part of the analysis.
Joseph Muvawala (PhD)EXECUTIVE DIRECTOR
iv
Policy, Legal, Regulatory and Institutional Framework
v
NATIONAL PLANNING AUTHORITY
iv
Table of ContentFOREWORD ............................................................................................................................................. i
Table of Content ...................................................................................................................................... iv
Table of Figures ...................................................................................................................................... vii
Executive Summary.................................................................................................................................. x
SECTION ONE: ...................................................................................................................................... 1
1.0. INTRODUCTION ....................................................................................................................... 1
1.1. Background.............................................................................................................................. 1
1.2. Scope of the Evaluation ........................................................................................................... 1
1.3. Objectives of UPE in Uganda .................................................................................................. 2
1.4. Objectives of UPE evaluation.................................................................................................. 2
1.5. Structure of the Report ............................................................................................................ 2
2.1 Evolution of UPE .................................................................................................................... 3
2.2 Policy and Legal Framework Governing Uganda Primary Education .................................... 4
SECTION THREE: ................................................................................................................................. 9
3.0. METHODOLGY .......................................................................................................................... 9
3.1 Evaluation Techniques used for this Theme ............................................................................ 9
3.2 Data Sources ............................................................................................................................ 9
3.3 Sample Selection ..................................................................................................................... 9
3.4 Data Analysis......................................................................................................................... 10
SECTION FOUR: ................................................................................................................................. 11
4.0. ANALYSIS AND FINDINGS .................................................................................................... 11
4.1 Overview ............................................................................................................................... 11
4.2 Extent of iimplementation of UPE Policy, Legal and Rregulatory Frameworks .................. 11
4.2.1. National Policy Framework for UPE ................................................................................ 11
4.2.1.1 Universal Education Policy ........................................................................................... 13
4.2.1.2 Automatic Promotion Policy ......................................................................................... 21
4.2.1.3 Text book policy ............................................................................................................ 27
4.2.1.4 Early Childhood Development (ECD) policy ................................................................ 32
4.2.1.5 Instruction in local language policy (Lower Primary) ................................................... 37
4.2.1.6 Customized performance targets policy ........................................................................ 42
4.2.1.7 Policy on provision of minimum necessary UPE facilities by government .................. 44
4.2.1.8 Abolition of PTA charges .............................................................................................. 49
4.2.1.9 Policy on Feeding and other Child Care Forms ............................................................. 53
4.2.1.10 Decentralization of the Provision of Primary Education ........................................... 57
4.2.1.11 Recruitment, Deployment and Promotion of Teachers ............................................. 62
vi
Policy, Legal, Regulatory and Institutional Framework
v
4.2.1.12 Policy on One Primary School Per Parish ................................................................. 66
4.2.1.13 Physical Education and Sports Policy, 2005 ............................................................. 67
4.2.1.14 Education and Sports National Policy on HIV/AIDS, 2006 ...................................... 68
4.2.2.1. The 1995 Constitution ...................................................................................................... 70
4.2.2.2. The Education Act, 2008 ........................................................................................... 76
4.2.2.4. Education White Paper .............................................................................................. 79
4.2.3. Institutional Framework and Coordination Mechanisms in the Delivery of Primary Education ........................................................................................................................................... 80
4.2.3.1 Institutional Framework and Coordination at Central Government level ......................... 80
4.2.3.2 Institutional Framework and Coordination at Local Government level ............................ 80
5.1 Emerging Issues..................................................................................................................... 98
SECTION SIX: .................................................................................................................................... 100
6.0 CONCLUSIONS AND RECOMMENDATIONS ........................................................................ 100
6.1 Conclusion ........................................................................................................................... 100
6.2 Policy Recommendations .................................................................................................... 100
REFERENCES ..................................................................................................................................... 108
Annex 1: Organogram of the Ministry of Education and Sports ......................................................... 110
Annex : Sampling .......................................................................................................................... 112
vii
NATIONAL PLANNING AUTHORITY
v
4.2.1.12 Policy on One Primary School Per Parish ................................................................. 66
4.2.1.13 Physical Education and Sports Policy, 2005 ............................................................. 67
4.2.1.14 Education and Sports National Policy on HIV/AIDS, 2006 ...................................... 68
4.2.2.1. The 1995 Constitution ...................................................................................................... 70
4.2.2.2. The Education Act, 2008 ........................................................................................... 76
4.2.2.4. Education White Paper .............................................................................................. 79
4.2.3. Institutional Framework and Coordination Mechanisms in the Delivery of Primary Education ........................................................................................................................................... 80
4.2.3.1 Institutional Framework and Coordination at Central Government level ......................... 80
4.2.3.2 Institutional Framework and Coordination at Local Government level ............................ 80
5.1 Emerging Issues..................................................................................................................... 98
SECTION SIX: .................................................................................................................................... 100
6.0 CONCLUSIONS AND RECOMMENDATIONS ........................................................................ 100
6.1 Conclusion ........................................................................................................................... 100
6.2 Policy Recommendations .................................................................................................... 100
REFERENCES ..................................................................................................................................... 108
Annex 1: Organogram of the Ministry of Education and Sports ......................................................... 110
Annex : Sampling .......................................................................................................................... 112
vi
List of Tables
Table 4.1: Documentation of Policies and Guidelines governing UPE in Uganda ............................... 11Table 4. 2: Enrolment, PCR and PTR, 1996 - 2016 .............................................................................. 15Table 4.3: Primary level enrolment (2007-2016) ................................................................................. 18Table 4.4: Literacy rates for 10 years and above................................................................................... 18Table 4.5: Challenges following the Abolition of School Fees............................................................. 20Table 4.6: Selected indicators on internal inefficiencies ....................................................................... 23Table 4.7: Challenges of Automatic grade promotion........................................................................... 26Table 4.8: Recommendations on automatic Grade Promotion.............................................................. 26Table 4. 9: Unit Costs for Selected Primary School Textbooks (USD) ................................................ 29Table 4.10: Issues arising on Textbook policy implementation ................................................... 31Table 4. 11: ECD distribution by region and location, 2016......................................................... 34Table 4. 12: Issues arising on ECD Policy Implementation.................................................................. 35Table 4. 13: Recommendations to Improve on ECD Policy Implementation ....................................... 37Table 4.14: The stock of textbooks and teachers’ guides in local language.......................................... 40Table 4.15: Issues arising on the Local language policy....................................................................... 41Table 4.16: Issues arising on Customized Performance Targets Policy....................................... 43Table 4.17: Follow up on recommendations on Customized Performance targets ............................... 44Table 4.18: Stock of facilities................................................................................................................ 47Table 4.19: Achievements on provision of minimum necessary facilities by Government .................. 47Table 4.20: Challenges of provision of minimum necessary facilities by government......................... 48Table 4.21: Recommendations on provision of minimum necessary facilities by government ............ 49Table 4. 22: Challenges of abolition of PTA Charges........................................................................... 52Table 4.23: Achievements on the requirement for parents to feed, clothe, shelter and transport their children.................................................................................................................................................. 55Table 4. 24: Challenges on the requirement for parents to feed, clothes, shelter and transport their children.................................................................................................................................................. 56Table 4.25: Achievements for decentralization of provision of primary education .............................. 59Table 4. 26: Challenges of decentralization of provision of primary education.................................... 60Table 4. 27: Recommendations with respect to Decentralization provision of primary education....... 61Table 4. 28: Achievements for recruitment, deployment and promotion of teachers ........................... 63Table 4. 29: Challenges on recruitment, deployment and promotion of teachers ................................. 65Table 4.30: Reasons for children not completing primary level of education....................................... 72Table 4.31: Penalties for non-payment of extra charges ....................................................................... 72Table 4. 32: Main other forms of penalties for non-payment of extra charges by region ..................... 73Table 4.33: Challenges on the requirement for parents to feed their children....................................... 76Table 4. 34: Charges levied in primary schools .................................................................................... 77Table 4. 35: Status of inspectors in LGs and gaps................................................................................. 85Table 4. 36: Responsibilities of government Agencies in education and training ................................ 92
viii
Policy, Legal, Regulatory and Institutional Framework
vii
Table of Figures
Figure 4.1: Growth in Primary School Enrollment by Gender, 1963-2014 .......................................... 16Figure 4.2: Achievements on abolition of School fees.......................................................................... 17Figure 4. 3: Pupil Classroom Ratio in primary schools (FY 2014/15- FY 2015/16) .................... 19Figure 4.4: Recommendations following abolition of school fees ........................................................ 21Figure 4. 5: Achievements arising from Automatic Grade promotion policy implementation............. 25Figure 4.6: Follow up on recommendations on Text book policy......................................................... 32Figure 4.7: GoU Development funding for SFG (UGX Billion) ..................................................... 46Figure 4.8: Achievements following abolition of PTA charges ............................................................ 51Figure 4.9: Recommendations with regard to abolition of PTA Charges ............................................. 53Figure 4. 10: Recommendations on the requirement for parents to feed, clothes, shelter and transport their children.......................................................................................................................................... 57Figure 4. 11: Recommendations on recruitment, deployment and promotion of teachers.................... 66Figure 4.12: Public primary education being completely free ....................................................... 71Figure 4.13: Trends in enrolment in Primary Education from 2002 -2015 ........................................... 74Figure 4. 14: Whose role is it to feed children?.................................................................................... 75Figure 4.15: Challenges of inspection............................................................................................ 84Figure 4.16: The existing structure of the education system................................................................. 95
ix
NATIONAL PLANNING AUTHORITY
vii
Table of Figures
Figure 4.1: Growth in Primary School Enrollment by Gender, 1963-2014 .......................................... 16Figure 4.2: Achievements on abolition of School fees.......................................................................... 17Figure 4. 3: Pupil Classroom Ratio in primary schools (FY 2014/15- FY 2015/16) .................... 19Figure 4.4: Recommendations following abolition of school fees ........................................................ 21Figure 4. 5: Achievements arising from Automatic Grade promotion policy implementation............. 25Figure 4.6: Follow up on recommendations on Text book policy......................................................... 32Figure 4.7: GoU Development funding for SFG (UGX Billion) ..................................................... 46Figure 4.8: Achievements following abolition of PTA charges ............................................................ 51Figure 4.9: Recommendations with regard to abolition of PTA Charges ............................................. 53Figure 4. 10: Recommendations on the requirement for parents to feed, clothes, shelter and transport their children.......................................................................................................................................... 57Figure 4. 11: Recommendations on recruitment, deployment and promotion of teachers.................... 66Figure 4.12: Public primary education being completely free ....................................................... 71Figure 4.13: Trends in enrolment in Primary Education from 2002 -2015 ........................................... 74Figure 4. 14: Whose role is it to feed children?.................................................................................... 75Figure 4.15: Challenges of inspection............................................................................................ 84Figure 4.16: The existing structure of the education system................................................................. 95
viii
List of Acronyms and Abbreviations
AIDS Acquired Immune Deficiency Syndrome
CAO Chief Administrative Officer
CAPE Creative Arts and Physical Education
CPA Creative Performance Arts
CPD Continuing Professional Development
CCT Centre Coordinating Tutors
DEO District Education Officer
DES Directorate of Education Standards
DIS District Inspector of Schools
ECD Early Childhood Development
ESC Education Service Commission
ESSAPR Education and Sports Sector Annual Performance Report
EPRC Economic Policy Review Commission
GER Gross Enrolment Ratio
GKMA Greater Kampala Metropolitan Area
HIV Human Immunodeficiency Virus
IMU Instructional Materials Unit
LG Local Government
MDAs Ministries Departments and Agencies
MoES Ministry of Education and Sports
NCHE National Council for Higher Education
NDPII Second National Development Plan
NER Net Enrolment Ratio
NPA National Planning Authority
x
Policy, Legal, Regulatory and Institutional Framework
ix
NTC National Teachers’ College
NCDC National Curriculum Development Centre
NTC National Teachers College
PCR Pupil Classroom Ratio
PTA Parent Teacher Association
PTR Pupil Teacher Ratio
SAS Senior Assistant Secretary
SFG School Facilities Grant
SMC School Management Committee
TDMS Teacher Development and Management System
UDHS Uganda Demographic and Health Survey
UBOS Uganda Bureau of Statistics
UNEB Uganda National Examinations Board
UPE Universal Primary Education
xi
NATIONAL PLANNING AUTHORITY
ix
NTC National Teachers’ College
NCDC National Curriculum Development Centre
NTC National Teachers College
PCR Pupil Classroom Ratio
PTA Parent Teacher Association
PTR Pupil Teacher Ratio
SAS Senior Assistant Secretary
SFG School Facilities Grant
SMC School Management Committee
TDMS Teacher Development and Management System
UDHS Uganda Demographic and Health Survey
UBOS Uganda Bureau of Statistics
UNEB Uganda National Examinations Board
UPE Universal Primary Education
x
Executive Summary
Government of Uganda introduced Universal Primary Education (UPE) in 1997 and abolished school fees in line with the goal of UPE as stated in the 1992 Government White Paper on Education. The National Planning Authority commissioned an independent comprehensive evaluation of the overall outcomes and impacts of UPE to inform wide-ranging policy planning and implementation improvements. The overarching goal of the comprehensive evaluation of the UPE policy is to assess whether the goals and objectives of UPE have been met and are still relevant. The evaluation also assesses the overall contribution and impact of the policy to human capital development. The assessment draws lessons for informing the review of the White Paper (1989) and provides a benchmark for evidence-based policy actions for enhancing the quality of education as envisaged in Uganda’s development policy frameworks, the Second National Development Plan (NDPII) and the Uganda Vision 2040.
This report provides findings of the evaluation with regard to the Policy, legal, regulatory and institutional frameworks based on approaches used in the assessment, including collection of primary data from local administrations and schools. A summary of the main messages stemming from the analysis carried out in the Policy, Legal, Regulatory and Institutional areaprovided in the section below. The presentation is structured along the following areas: (i) Policies; (ii) legal frameworks; and (iii) Institutional Framework.
1.0 Primary Education Policies
1.1 Universal Education Policy
Findings
i) Primary education in Uganda has one of the most elaborate and institutionalized legal frameworks. Government of Uganda has formulated a number of policies on primary education to propel the sector into achieving Education for All (EFA) targets. These include: Universal Education Policy, Physical Education and Sports Policy (2005), Education and Sports National Policy Guidelines on HIV/AIDS (2006), Basic Education Policy for Disadvantaged Groups (2006); Early Childhood Development Policy (2007); Gender in Education Policy (2009); Local Language Policy; and Automatic Promotion Policy (2005).
ii) However, there is no document detailing what Universal Primary Education (UPE) is and how it was supposed to be implemented. Although UPE is the cornerstone of Uganda’s primary education sub-sector, there is no document detailing what it is and how it was supposed to be implemented. The UPE policy is not anywhere in writing. The policy was therefore not properly targeted and sequenced. There is no clear documentation of standards, targets and service levels. In addition, given that the sector has a number of policies, some of these are not documented. Most of the policies are pronouncements and have been disseminated in form of guidelines and in workshops. These include: Universal education policy; Automatic Grade promotion; ECD Policy; Local language policy; and Abolition of PTA charges.
iii) Additionally, there are hardly any statutory instruments issued by the Minister on UPE as required by the Education Act, 2008. Different Agencies in the MoES and schools have continuously issued policies, manuals, guidelines under this section of Education Act. These are difficult to trace since many of them are pronouncements while in conferences and meetings.
xii
Policy, Legal, Regulatory and Institutional Framework
xi
iv) Increased equitable access to education. The introduction of UPE has contributed toa more than threefold increase in total primary school enrolment from 2.7 million in 1996 to 8.5 million in 2016 (EMIS,2016). This was however, not followed by commensurate budget to support teaching and learning thus compromising quality. Although UPE increased access to education, it has resulted in deterioration of quality. The Public spending for education as a share of total government expenditure declined from 18.6 percent in FY2005/06 to 13.3 percent 2017/18 which is way below the target of 20 percent recommended by the Global Partnership for Education (GPE). In addition, budget allocated to education currently represents 2.7% of GDP in 2016/17 reducing from 3.5% of GDP in 2005/06. UPE objective 3 that aimed to make education equitable in order to eliminate disparities and inequalities was achieved. Female enrollments have steadily increased from 39% in 1970 to 47% in 1999 to 50.4% in 2016.
v) Inadequacy and poor school infrastructure in primary schools. After introduction of UPE, enrolment rates increased faster than the planned levels of investment in infrastructure, especially classrooms. As a result, the pupil classroom ratios have remained higher and many schools have dilapidated structures that require renovationand maintenance. Although the PCR for both government and private has since decreased from 131:1 in 1998/99 to 118:1 in FY2000/01, 72:1 in 2007, 59:1 in 2014/15, to 63:1 in 2015/16 and 54:1 in 2016/17 (ESSAR, 2017), the figure is still higher than the middle-income target of 30:1.
vi) There is a misconception of UPE definition within the Education Sector especially at the time of releasing PLE Exams where schools are categorized as UPE and non-UPE. UPE by design is delivered through two mechanisms i.e. government aided and private schools. The two contribute to universal access to education. The categorization of schools during examination release should simply be based on each government or private schools.
1.2 Automatic Promotion Policy
i) Automatic promotion has improved progression and number of years of schooling. The policy has enabled every pupil to progress to next levels, reduced dropout rate, increased access to education and motivated pupils to learn. Repetition reduced by 31 percent from 988,933 in 2005 to 682,943 in 2016. The primary sevencompletion rate improved from 52 percent in 2009 to 72 percent in 2014/15 before declining to 61.5 percent in 2016/17. The statistics are staggeringly below the East African and far above middle-income standard of 3%. Although children are able to progress to higher levels, the policy has had a negative effect on the quality of primary education. This is attributed to lack of competition, de-motivation of pupils and teachers, hence lowering of teaching and learning outcomes. The policy also reduced financial wastage which would arise from repetition and accommodation of more numbers from incoming cohorts with the available resource. This study therefore recommends promotion based on assessment and on indicators of merit (attendance and achievement in all subjects).
1.3 Text book policy
i) The policy of decentralized selection of materials to school level has made positive impact on teaching and learning. The textbook and instructional materials policy, announced in 1993 removed the monopoly of National Curriculum Development
xiii
NATIONAL PLANNING AUTHORITY
xi
iv) Increased equitable access to education. The introduction of UPE has contributed toa more than threefold increase in total primary school enrolment from 2.7 million in 1996 to 8.5 million in 2016 (EMIS,2016). This was however, not followed by commensurate budget to support teaching and learning thus compromising quality. Although UPE increased access to education, it has resulted in deterioration of quality. The Public spending for education as a share of total government expenditure declined from 18.6 percent in FY2005/06 to 13.3 percent 2017/18 which is way below the target of 20 percent recommended by the Global Partnership for Education (GPE). In addition, budget allocated to education currently represents 2.7% of GDP in 2016/17 reducing from 3.5% of GDP in 2005/06. UPE objective 3 that aimed to make education equitable in order to eliminate disparities and inequalities was achieved. Female enrollments have steadily increased from 39% in 1970 to 47% in 1999 to 50.4% in 2016.
v) Inadequacy and poor school infrastructure in primary schools. After introduction of UPE, enrolment rates increased faster than the planned levels of investment in infrastructure, especially classrooms. As a result, the pupil classroom ratios have remained higher and many schools have dilapidated structures that require renovationand maintenance. Although the PCR for both government and private has since decreased from 131:1 in 1998/99 to 118:1 in FY2000/01, 72:1 in 2007, 59:1 in 2014/15, to 63:1 in 2015/16 and 54:1 in 2016/17 (ESSAR, 2017), the figure is still higher than the middle-income target of 30:1.
vi) There is a misconception of UPE definition within the Education Sector especially at the time of releasing PLE Exams where schools are categorized as UPE and non-UPE. UPE by design is delivered through two mechanisms i.e. government aided and private schools. The two contribute to universal access to education. The categorization of schools during examination release should simply be based on each government or private schools.
1.2 Automatic Promotion Policy
i) Automatic promotion has improved progression and number of years of schooling. The policy has enabled every pupil to progress to next levels, reduced dropout rate, increased access to education and motivated pupils to learn. Repetition reduced by 31 percent from 988,933 in 2005 to 682,943 in 2016. The primary sevencompletion rate improved from 52 percent in 2009 to 72 percent in 2014/15 before declining to 61.5 percent in 2016/17. The statistics are staggeringly below the East African and far above middle-income standard of 3%. Although children are able to progress to higher levels, the policy has had a negative effect on the quality of primary education. This is attributed to lack of competition, de-motivation of pupils and teachers, hence lowering of teaching and learning outcomes. The policy also reduced financial wastage which would arise from repetition and accommodation of more numbers from incoming cohorts with the available resource. This study therefore recommends promotion based on assessment and on indicators of merit (attendance and achievement in all subjects).
1.3 Text book policy
i) The policy of decentralized selection of materials to school level has made positive impact on teaching and learning. The textbook and instructional materials policy, announced in 1993 removed the monopoly of National Curriculum Development
xii
Centre (NCDC) writing and supplying books for schools, liberalized the supply of instructional materials to schools, and introduced vetting of all books and other materials going to schools. The policy decentralized selection of materials to school level. The private sector welcomed the policy as it levelled the playing ground, which hitherto favored only foreign publishers.
ii) Reduction in the unit cost of textbooks. The introduction of a transparent competitive tendering process in 2000 resulted in a reduction in the unit costs of primary textbooks procured for the same grades and subjects by 58% from US$3.67 in 1998 to US$1.53 in 2002 for the textbooks.
iii) Textbook-pupil ratio target of 1:1 not achieved as anticipated. Although the introduction of a transparent competitive tendering process resulted in a reduction in the unit cost of primary textbooks, the anticipated textbook-pupil ratio of 1:1 was not achieved. The textbook-pupil ratio stood at 1:3 in 2017. The shortage of textbooks is attributed to; existence of several titles by subject yet the budget allocated in inadequate to procure all required titles; the continued increase in enrollment numbers for pupils by class keep making the rations unstable; the life time of the Textbook Instructional Materials is estimated to last between 2-3 years; yet some books may be damaged before their expected life time with the curriculum content being still valid.
iv) Inadequate textbooks to be accessed by pupils. Lockheed, Verspoor and Associates (1991, p. 49) argue that the availability of textbooks and instructional materials has a positive effect on children’s achievement in developing countries, but they state that inputs are only important if they help children learn, implying that textbooks and teachers’ guides need to be used effectively by teachers and children for them to contribute to the learning process. Although the stock of textbooks increased by 9.6% from 11,379,533 in 2011 to 12,581,648 in 2016, the enrolment also increased from 8,098,177 to 8,655,924 in the same period1. The textbook-pupil ratio that currently stands at 1:3 is still high implying that the textbooks are not available in sufficient numbers to be accessed by pupils.
v) Quality of textbooks. The approved textbooks by MoES are not 100% compliant to the curriculum. The technical evaluation ceiling of 60% related to the curriculum objective leaves the approved textbooks at different levels. The process of correcting to fulfill 100% requirement is not undertaken after the books have been cleared by the evaluation committee.
vi) Use of technology as a supplement to traditional textbooks. To be able to minimize the cost and burden of purchasing the many textbooks and maximize their use since access will be increased, technology should be used however, this should be viewed as a necessary supplement to traditional textbooks, not a replacement. NCDC should publish on its website a list of approved textbooks in line with the current curriculum by level. This will enable the users to have accurate information on the books that are aligned to the syllabus. In addition, the approved textbooks should be posted online such that soft copies are used.
1.4 Early Childhood Development (ECD) Policy
i) Inadequate ECD facilities and trained teachers arising from limited government involvement as prescribed by the Act. Existing ECD centres are battling with inadequate infrastructure, equipment and supplies, a lack of practitioners and poorly trained practitioners, as well as inadequate health and safety measures, among other
1 Education Statistical Abstracts, 2011, 2014, 2015, 2016
xiv
Policy, Legal, Regulatory and Institutional Framework
xiii
issues. This follows government failure to embrace the first education level as given in the Education Act, 2008. Regional analysis by MoES, 2016 indicates that Buganda has the highest number of preprimary schools totaling to 2,386 (35.1%) of the total preprimary schools whereas Karamoja registers the least number of preprimary schools totaling up to 100 (1.5%).
ii) Participation of ECD is inequitable by regions and location. Analysis of ECD centres by region shows that of the total 7,210 ECD centers country wide in 2016,Buganda accommodates 2,793 (39 %) followed by Bunyoro and Toro regions with 733 and 717 respectively representing 10 percent. The rest of the regions are below 8 percent with Karamoja being with the least at 2 percent (124 centres). The distribution of ECD centres by location is 1,918 (27%) in urban, 1,697 (24%) in peri-urban and 3,595 (50%) in rural. Government should therefore establish ECD centres in areas of very low access.
iii) ECD domination by private sector. ECD services are largely provided by the private service sector. For any input or expenditure from LGs to be channeled to ECD related activities requires guidelines to be provided for them through the LG structures. The LG Act at present has no mention of ECD services to operationalize the ECD policy at the district level. The LG Act should be reviewed to include ECD services in its structures, as a first step towards public sector participation.
iv) Limited adoption of the ECD Policy - pre-primary education in Uganda is optional. Due to the significance of ECD in setting the foundation for learning, there is need to declare pre-primary education compulsory to ensure a firm foundation for all children before they enter primary one.
v) Lack of data on ECD under EMIS limits policy discussion. Whereas ECD data variables are similar to those under EMIS database, there still remains information gaps especially on funding due to the fact that it’s privately managed unlike UPE which is a government policy, private players are hesitant in availing informationregarding funding on ECD programmes. Systems for collecting data on key elements of ECD such as funding and net enrollment to guide policy planning are lacking.
1.5 Instruction in local language policy (lower primary)
i) The use of local language has enhanced the comprehension ability of the children.From the NPA’s UPE survey, respondents attest that the use of local language has enhanced the comprehension ability of the children. Prior to 2007, the curriculum for the lower primary section in Uganda was a traditional subject-based curriculum with English as the medium of instruction. However, a range of performance and achievement tests conducted by different agencies demonstrated low levels of pupil performance in the basic skills of reading, writing, comprehension, speaking and number work. NAPE, 2006 indicated that 45.6% and 42.6% of P3 (equivalent to Grade 3) pupils reached a defined level of literacy and numeracy respectively. The study also found that children were not adapting to English language instruction due to the prevalence of local languages. Following implementation of the local language policy, NAPE, 2015 indicates that scores at P.3 indicated an improvement in numeracy and literacy competencies of 69.8% and 60.2% respectively.
ii) Diversity of languages is hindering instruction in local language. Most districts in Uganda have several mother tongues. These have not been orthographed, while some communities are cosmopolitan. This complicates debate in the choice of language of instruction. The prominences of some of these languages have outshined the
xv
NATIONAL PLANNING AUTHORITY
xiii
issues. This follows government failure to embrace the first education level as given in the Education Act, 2008. Regional analysis by MoES, 2016 indicates that Buganda has the highest number of preprimary schools totaling to 2,386 (35.1%) of the total preprimary schools whereas Karamoja registers the least number of preprimary schools totaling up to 100 (1.5%).
ii) Participation of ECD is inequitable by regions and location. Analysis of ECD centres by region shows that of the total 7,210 ECD centers country wide in 2016,Buganda accommodates 2,793 (39 %) followed by Bunyoro and Toro regions with 733 and 717 respectively representing 10 percent. The rest of the regions are below 8 percent with Karamoja being with the least at 2 percent (124 centres). The distribution of ECD centres by location is 1,918 (27%) in urban, 1,697 (24%) in peri-urban and 3,595 (50%) in rural. Government should therefore establish ECD centres in areas of very low access.
iii) ECD domination by private sector. ECD services are largely provided by the private service sector. For any input or expenditure from LGs to be channeled to ECD related activities requires guidelines to be provided for them through the LG structures. The LG Act at present has no mention of ECD services to operationalize the ECD policy at the district level. The LG Act should be reviewed to include ECD services in its structures, as a first step towards public sector participation.
iv) Limited adoption of the ECD Policy - pre-primary education in Uganda is optional. Due to the significance of ECD in setting the foundation for learning, there is need to declare pre-primary education compulsory to ensure a firm foundation for all children before they enter primary one.
v) Lack of data on ECD under EMIS limits policy discussion. Whereas ECD data variables are similar to those under EMIS database, there still remains information gaps especially on funding due to the fact that it’s privately managed unlike UPE which is a government policy, private players are hesitant in availing informationregarding funding on ECD programmes. Systems for collecting data on key elements of ECD such as funding and net enrollment to guide policy planning are lacking.
1.5 Instruction in local language policy (lower primary)
i) The use of local language has enhanced the comprehension ability of the children.From the NPA’s UPE survey, respondents attest that the use of local language has enhanced the comprehension ability of the children. Prior to 2007, the curriculum for the lower primary section in Uganda was a traditional subject-based curriculum with English as the medium of instruction. However, a range of performance and achievement tests conducted by different agencies demonstrated low levels of pupil performance in the basic skills of reading, writing, comprehension, speaking and number work. NAPE, 2006 indicated that 45.6% and 42.6% of P3 (equivalent to Grade 3) pupils reached a defined level of literacy and numeracy respectively. The study also found that children were not adapting to English language instruction due to the prevalence of local languages. Following implementation of the local language policy, NAPE, 2015 indicates that scores at P.3 indicated an improvement in numeracy and literacy competencies of 69.8% and 60.2% respectively.
ii) Diversity of languages is hindering instruction in local language. Most districts in Uganda have several mother tongues. These have not been orthographed, while some communities are cosmopolitan. This complicates debate in the choice of language of instruction. The prominences of some of these languages have outshined the
xiv
indigenous and mother tongue languages. There is therefore difficulty in choosing an appropriate local language to be used at lower primary.
iii) Limited capacity among teachers in local language. Although government has since integrated local language in teaching at lower primary level, aimed at facilitating learning, this has not been followed by a comprehensive and requisite training of teachers. Local Language has always been part of the teacher training curriculum and the PTCs teach local language pedagogy. However, each PTC is supposed to have one local language tutor and so the total staff establishment for Local Language is 45 and currently only 20 are available within the PTC system and 25 are vacant. There are in addition variations in the posting of existing stock of teachers and their language capabilities.
iv) Inadequate local language instructional materials. The NPA study established gaps in existence of local language materials including textbooks, teacher guides and charts. The stock of local language textbooks increased by 46% from 756,816 in 2011 to 1,088,071 in 2016. Although there was an increase in the percentage of the total by 2% in the same period, this existing stock of textbooks in local language is limited in number to cover the ever-increasing enrolment. However, the textbooks have been translated in a few languages. Similarly, teachers’ guides in local language as a percentage of the total increased from 6.6% in 2011 to 8.6%, in 2016 which are low in number. The lack of materials has made it difficult for teachers to do lesson planning.
1.6 Customized performance targets policy
i) Weak supervision structure. The policy implementation structure that required subcounty chiefs to supervise headteacher perfomance against the set targets has met resistance, as their capacity has been contested.
ii) Negative perceptions about the policy. The performance target policy has attracted criticism regarding its principles, processes and purpose since its inception. Asignificant number of LCV chairpersons and Senior Assistant Secretaries interviewed have not appreciated the rationale of the policy. The policy is seen as an instrument to apprehend culprits rather than a tool to improve performance resulting into low levels of commitment towards its implementation.
iii) Rewards and sanctions on performance. This policy to be effectively implemented, government should initiate and operationalize annual rewards and sanctions for good and bad performance. This practice will motivate and improve performance of primary education in Uganda. Action should be taken for ability and failure to meet the targets.
1.7 Policy on feeding and other child care forms
i) Neglect of parents on their roles and duties. Of the respondents countrywide, 48% identified parents’ neglect of their roles as a major hindrance to attainment of education outcomes. Despite the provisions in the Education Act, parents have neglected their roles especially that of feeding their children. In particular, many parents think it is the role of government to feed their children. The long-time absence of clarity on the matter has aggravated the problem of negligence of parents providing lunches to their children
ii) Poverty and hunger among parents/ households. Household poverty emerged as another major obstacle to educational success for children. Thirty six (36%) of the respondents decry poverty/hunger as a major limiting factor to the provision of school meals to children. Indeed, the poverty levels have since increased from 19.7% in
xvi
Policy, Legal, Regulatory and Institutional Framework
xv
2012/13 to 21.4% in 2016/17 according to UBOS. Evidence shows that low income children lag in cognitive development and lie one year behind in vocabulary when they enter school, with long-term consequences: “such early gaps may affect low-income children’s attitudes towards school and their aspirations for school attainment” (Waldfogel & Washbrook, 2010).
1.8 Decentralization of provision of primary education
i) Quality of works is still low. Most LGs reported shoddy works attributed to hiring incompetent contractors. This has undermined the quality education service delivery,particularly in classrooms, teachers’ houses and latrine construction in schools. This study finds no policy providing a life span of structures constructed in schools. There are no service delivery standards and targeted years /lifespan for classrooms, teachers’ houses and latrines construction for contractors / engineers to base on. However, it’sassumed that schools are meant to last for 25 years with continued operation and maintenance. Nevertheless, the current shoddy work doesn’t depict the years.
ii) Inadequate human resource to improve education service delivery. The decentralization of recruitment of education human resource has not yielded adequate education personnel. Moreover, this policy does not permit reallocation of education personnel from one district to another, except from a mother district to a new district. This has been evidenced where some LGs have few staff while others have excess personnel. In addition, the low staff levels arise from staff sealing provided by MoES. LGs cannot recruit beyond the staff sealing and the budget for wage provided by MoFPED.
iii) Low revenue mobilization. The decentralization policy assumed that LGs would raise revenue from local sources to support education service delivery. However, this has not been realized. In particular, LGs have continued to register low revenue collections as a result of low-income sources in districts which has affected the implementation of UPE.
1.9 Recruitment, deployment and promotion of teachers
i) The Education Act does not provide for regulation of teacher recruitment in private schools. Private schools recruit teachers without control of government and without paying attention to the guidelines set by the Ministry of Education and Sports (MoES). Majority of teachers in private schools do not have contracts and are vulnerable to losing jobs. Private school teachers are underpaid because the teachers’ union possesses an unfair advantage, since they don’t have that power. Teachers recruited in most cases teach examinable subjects rather than the entire curriculum.This has affected the expected homogeneity of the learners.
ii) Teacher allocation inefficiency. There are varying numbers of teachers by region, district and school that are not based on approved teacher recruitment guidelines. For example, the Central and Western regions have excess teachers compared to the North and Eastern regions where shortage of teachers have been observed.
iii) Non-transferability of teachers across districts. The current procedure of teacher recruitment undertaken by the DSCs limits the transfer of teachers from one district to another. As a result, excess teachers from one district cannot be transferred to fill the shortage in another district.
iv) Adhoc teacher promotions. Teacher promotions are sometimes not based on the prescribed guidelines by the Ministry that requires teachers to be promoted after a
xvii
NATIONAL PLANNING AUTHORITY
xv
2012/13 to 21.4% in 2016/17 according to UBOS. Evidence shows that low income children lag in cognitive development and lie one year behind in vocabulary when they enter school, with long-term consequences: “such early gaps may affect low-income children’s attitudes towards school and their aspirations for school attainment” (Waldfogel & Washbrook, 2010).
1.8 Decentralization of provision of primary education
i) Quality of works is still low. Most LGs reported shoddy works attributed to hiring incompetent contractors. This has undermined the quality education service delivery,particularly in classrooms, teachers’ houses and latrine construction in schools. This study finds no policy providing a life span of structures constructed in schools. There are no service delivery standards and targeted years /lifespan for classrooms, teachers’ houses and latrines construction for contractors / engineers to base on. However, it’sassumed that schools are meant to last for 25 years with continued operation and maintenance. Nevertheless, the current shoddy work doesn’t depict the years.
ii) Inadequate human resource to improve education service delivery. The decentralization of recruitment of education human resource has not yielded adequate education personnel. Moreover, this policy does not permit reallocation of education personnel from one district to another, except from a mother district to a new district. This has been evidenced where some LGs have few staff while others have excess personnel. In addition, the low staff levels arise from staff sealing provided by MoES. LGs cannot recruit beyond the staff sealing and the budget for wage provided by MoFPED.
iii) Low revenue mobilization. The decentralization policy assumed that LGs would raise revenue from local sources to support education service delivery. However, this has not been realized. In particular, LGs have continued to register low revenue collections as a result of low-income sources in districts which has affected the implementation of UPE.
1.9 Recruitment, deployment and promotion of teachers
i) The Education Act does not provide for regulation of teacher recruitment in private schools. Private schools recruit teachers without control of government and without paying attention to the guidelines set by the Ministry of Education and Sports (MoES). Majority of teachers in private schools do not have contracts and are vulnerable to losing jobs. Private school teachers are underpaid because the teachers’ union possesses an unfair advantage, since they don’t have that power. Teachers recruited in most cases teach examinable subjects rather than the entire curriculum.This has affected the expected homogeneity of the learners.
ii) Teacher allocation inefficiency. There are varying numbers of teachers by region, district and school that are not based on approved teacher recruitment guidelines. For example, the Central and Western regions have excess teachers compared to the North and Eastern regions where shortage of teachers have been observed.
iii) Non-transferability of teachers across districts. The current procedure of teacher recruitment undertaken by the DSCs limits the transfer of teachers from one district to another. As a result, excess teachers from one district cannot be transferred to fill the shortage in another district.
iv) Adhoc teacher promotions. Teacher promotions are sometimes not based on the prescribed guidelines by the Ministry that requires teachers to be promoted after a
xvi
specified period of three years. The evaluation established that a number of teachers have stayed in their posting without promotion beyond the stipulated time. It was also established that a significant number of promotions are based on favors as opposed to the guidelines. Wages and establishment ceilings are determined centrally. Performance evaluations are rarely done; however, merit is usually taken into account in considering promotions. Discipline is a significant problem, with little ability to enforce discipline in many cases. Political influence at the local level sometimes makes it difficult to enforce codes of conduct. A serious problem for local staff is the lack of career perspective and mobility.
v) Inadequate teacher houses. Teachers’ houses have not increased to match the pace of teacher recruitment. The existing stock of 44,470 teacher houses does not match the current number of teachers on the payroll (202,617 teachers of which 116,109 were males and 86,508 were females) in 2016. The stock of teachers on the payroll increased by 115% from 89,247 (1997) to 192,566 in 2015 (MoES, 2016). The SFG guidelines require that ideally, the target is for every primary school to achieve permanent accommodation for at least four (4) teachers.
Therefore, teachers have been recruited without adequate provisions of housing facilities by government. This has demotivated some teachers and others have resisted transfers to schools without / with inadequate teacher accommodation.
1.10 Policy on One primary school per parish
There are currently 525 parishes (as of 2017) that require construction of a Government aided primary school. The current average distance to a government primary school outside the LC1 of less than 5km distance is 97.2 percent (83.8% for 0<3 and 13.4% for 3<5) and 96 percent (83.1% for 0<3 and 12.9% for 3<5) for the private primary schools (UNHS, 2017). The policy is therefore not bound by the size of the parishes and there has been a proliferation of Parishes recently following the creation of new Local Government units. The continued splitting of sub counties to create more parishes makes the policy implementation a challenge since this does not take cognizance of the distance to the nearest primary school. The policy does not also take care of the existing private schools in the parishes. The statistics therefore render the policy inapplicable where by its implementation requires a needs-based assessment to be able to invest in the remaining 2.8 percent whose distance to the government school is over 5 km.
2. Legal framework
i) Overall, Uganda has a good legal framework that supports and protects the right to basic education. Basic Education is guaranteed in the constitution, and Uganda is a party to the most important regional and international conventions protecting the right to education. Education in Uganda is governed by the legal framework comprising: (i) the 1995 Constitution; (ii) the 1992 Government White Paper on Education; and (iii) the Education (Pre-Primary, Primary and Post-Primary) Act, 2008; and the LG Act, 1997.
2.1 The Constitution
i) Education not free as required by the 1995 Constitution. The Constitution of the Republic of Uganda requires the State to promote free and compulsory basic education. This is further reiterated by the Education Act, 2008 which defines UPE as
xviii
Policy, Legal, Regulatory and Institutional Framework
xvii
a State funded programme where tuition fees are paid by Government. The NPA field findings indicated that education is not free as provided by the law given that parents continue to contribute towards the system. Parents from both Governments aided primary schools (80.5%) and Private schools (82.2%) confirmed that public primary education is not completely free. On average, Ugx. 42,000/= and Ugx. 52,000/= is paid by the parents of Government aided schools for lower and upper primary school levels respectively. Pupils are sent back home after failure to pay the extra charges.
ii) Minimal and decreasing budget allocation constrains attainment of basic education. A key concern regarding the fulfillment of the right to education is that Uganda’s budget allocation towards education has been decreasing in the last years. Budget allocated to education now represents 2.7% of GDP reducing from 3.5% of GDP in 2005/06. This is further significantly less than, for instance, Botswana (7.2% of GDP towards education in FY2017/18). Uganda has to spend the maximum of its available resources to fulfill economic, social and cultural rights, including the right to education.
iii) Education continues to be expensive because of several charges inflicted on parents. Findings indicate that children continue to drop out of school because education is expensive following the several charges inflicted on parents and a lack of scholastic materials. Results from the NPA UPE 2017 Survey reveal that the components that are mainly paid for in public primary education are: fees (40.8%); scholastic materials (including uniform) (27.7%); and school feeding (19.5%). The fees collections include various specific components such as development fund, remedial teaching, examination, extra co-curricular activities, PTA funds, report books, utilities, boarding fees, and school trips.
iv) There has been an increase in the number of schools and institutions set up by private investors. Since the government of Uganda decision in 1993 to liberalize the education sector, thousands of schools and institutions have been set up by private investors. The total number of private schools increased from 1,481 in 1999/00 to 7,647 in 2016.
2.2 1992 White Paper
i) Decentralized services. The Education Policy Review Commission report proposed various changes in the current organization structure. These include; Decentralization of decision-making process in order to improve efficiency and accelerate policy implementation. Government to this effect decentralized primary education. Although the decentralization process has brought services closer to the people, some services like financing remain centralized.
2.3 Education Act, 2008
i) UPE is being implemented only in Government Aided primary schools. Whereas government is obliged under the Education Act, 2008 to provide access, quality and equitable education and sports to all learners, which entails payment for capitation, inspection, instructional materials, infrastructure and teachers’ wages, these are majorly fulfilled in public primary schools. In addition, inspection funding is intended to cover both public and private schools but mostly caters for government schools.This is attributed to the limited resource envelop.
ii) Poor performance in government aided schools. Although public schools are well facilitated with instructional materials in all subjects, performance is still low whereas
xix
NATIONAL PLANNING AUTHORITY
xvii
a State funded programme where tuition fees are paid by Government. The NPA field findings indicated that education is not free as provided by the law given that parents continue to contribute towards the system. Parents from both Governments aided primary schools (80.5%) and Private schools (82.2%) confirmed that public primary education is not completely free. On average, Ugx. 42,000/= and Ugx. 52,000/= is paid by the parents of Government aided schools for lower and upper primary school levels respectively. Pupils are sent back home after failure to pay the extra charges.
ii) Minimal and decreasing budget allocation constrains attainment of basic education. A key concern regarding the fulfillment of the right to education is that Uganda’s budget allocation towards education has been decreasing in the last years. Budget allocated to education now represents 2.7% of GDP reducing from 3.5% of GDP in 2005/06. This is further significantly less than, for instance, Botswana (7.2% of GDP towards education in FY2017/18). Uganda has to spend the maximum of its available resources to fulfill economic, social and cultural rights, including the right to education.
iii) Education continues to be expensive because of several charges inflicted on parents. Findings indicate that children continue to drop out of school because education is expensive following the several charges inflicted on parents and a lack of scholastic materials. Results from the NPA UPE 2017 Survey reveal that the components that are mainly paid for in public primary education are: fees (40.8%); scholastic materials (including uniform) (27.7%); and school feeding (19.5%). The fees collections include various specific components such as development fund, remedial teaching, examination, extra co-curricular activities, PTA funds, report books, utilities, boarding fees, and school trips.
iv) There has been an increase in the number of schools and institutions set up by private investors. Since the government of Uganda decision in 1993 to liberalize the education sector, thousands of schools and institutions have been set up by private investors. The total number of private schools increased from 1,481 in 1999/00 to 7,647 in 2016.
2.2 1992 White Paper
i) Decentralized services. The Education Policy Review Commission report proposed various changes in the current organization structure. These include; Decentralization of decision-making process in order to improve efficiency and accelerate policy implementation. Government to this effect decentralized primary education. Although the decentralization process has brought services closer to the people, some services like financing remain centralized.
2.3 Education Act, 2008
i) UPE is being implemented only in Government Aided primary schools. Whereas government is obliged under the Education Act, 2008 to provide access, quality and equitable education and sports to all learners, which entails payment for capitation, inspection, instructional materials, infrastructure and teachers’ wages, these are majorly fulfilled in public primary schools. In addition, inspection funding is intended to cover both public and private schools but mostly caters for government schools.This is attributed to the limited resource envelop.
ii) Poor performance in government aided schools. Although public schools are well facilitated with instructional materials in all subjects, performance is still low whereas
xviii
for the private schools that employ teachers of the same qualification register better performance. This is because there is a gap in monitoring teaching and learning in these schools. In addition, UPE returns (PLE performance, staff motivation, capitation unit cost, staff accommodation etc.) in public schools remain low. Because of the inadequate funding for infrastructural development (SFG), many classrooms are still in sorry state, inadequate classroom furniture, dilapidated / inadequate sanitation facilities which are exaggerated by the absence of Operation and Maintenance funding at school level.
iii) There is no tracking system for drop outs. Section 10(3b) of the Education Act, 2008 requires Government to ensure a child who drops out of school before completing primary education cycle attains basic education through alternative approaches to providing that education. The drop-out rate in Uganda has continued to increase, however, there is no government strategy in place to trace students that have left before completing primary education cycle to attain basic education. MoES should partner with National Identification Registration Authority (NIRA) to make the best use of the National Identification Numbers (NIN) which act as unique identifiers to trace drop outs.
iv) Revise a section of the Education Act, 2008 that requires every district to have a three-year rolling Education Development Plan. Section 27 (1) of the Education Act requires the district council to cause an education development plan to be prepared, covering a period of three years as prescribed by the LG Act. The plan is required to be part of the comprehensive and integrated development plan of the district. However, the LG Act was amended and the three-year rolling plan was changed to a 5-year Local Government Development Plan. There is therefore need to amend this section of the Act for it to be in line with the LG Act and the Comprehensive National Development Planning Framework (CNDPF).
2.4 Local Government Act, Cap 243, Laws of Uganda 2000
The line Ministry (Ministry of Education and Sports), has no direct control over the LGs since it has to go through the mother Ministry (Ministry of Local Government).
i) Process to develop and approve By-laws and Ordinances is too long and bureaucratic. The LG Act 243 (38) provides powers for a district council to make laws that are not inconsistent with the Constitution or any other law made by Parliament. The local bill passed by a district council is forwarded to the Attorney General through the Minister of Local Government to certify that the local bill is not inconsistent with the Constitution or any other law enacted by Parliament before the chairperson signs the law. However, although the procedure indicates that the bill be returned with comments to the relevant council for modification or other appropriate action within ninety days, this always takes over a year or even forever. It’s therefore difficult to make ordinances since the approval process takes long and there are no punitive actions in case the Minister or Attorney General does not comply. The LGs are also very many and may be cumbersome for the Minister and Attorney General to handle them within the required period. The Ministry of Local Government should therefore be mandated to approve the By-laws and ordinances for consistency with other supreme legislations. For instance, in Botswana, the Ministry of Local Government approves the By-laws and ordinances.
ii) Primary education not fully decentralized. Whereas all the primary education activities relating to UPE implementation are decentralized, financing has remained at
xx
Policy, Legal, Regulatory and Institutional Framework
xix
the centre. The LG Act cap 243 states that the recurrent and development budget is a decentralized service. The Local Revenue is insufficient and LGs have continued to depend on funds from the center which are mostly conditional. Government should therefore relax fixing resources as conditional on certain services. For instance, a school could be able to relocate money from construction to renovation of a dilapidated structure. LGs should also be given the autonomy of having their own resource envelop rather than only depending on the centre for its entire financing.
3. Institutional Framework
The UPE institutional frame work comprises a number of institutions namely; (i) MoES, (ii) DES, (iii) UNEB, (iv) NCDC, and (v) DEOs. An over view of their performance assessment is reviewed in the sections below;
3.1 Directorate of Education Standards (DES)
i) There is lack of a comprehensive and approved compendium of standards for the primary Education Sector as required by the Education Act, 2008. The Directorate has over the years instead been guided by a number of frameworks in assessing the quality of education including EFA, MDG, and SDG goals; the Ministry of Education and Sports Education Sector; Strategic Plan 2016- 2020; and DES Strategic Plan 2016- 2020. However, the evaluation established that the DES has developed a number of guidelines for inspection and other inspection materials that help both national and LG inspectors in school inspection as provided for by section 25(1)(a) of the LG Act. These include: Inspection framework, the Hand book for School Inspectors, the Basic Requirements and Minimum Standards booklets, Guides for school improvement booklets (Six booklets on different aspects), leadership and management, the teaching and learning process, learner achievement, learner support (equity) and inspection.
ii) Structural inadequacies and reporting mismatch. The current legal and institutional architecture of the inspection function where the inspectorate at the district reports to the CAO and not DES, and where the DES reports to the PS MoES, continues to negatively impact on the quality of inspection and hence the quality of education standards. The structure is disjointed and inefficient and the envisaged relationship between DES and LGs (in the Education Act 2008) has not been feasible and not functioning as expected. Also, it can be concluded that having an inspection body accountable to the Ministry of Education PS compromises the quality of inspection and reporting as result of undue influences.
iii) Existence of gaps in the reporting lines of inspectors as enshrined in the Act. In particular, Section 25(1)(a) requires the inspector to inspect and provide a report to the Permanent Secretary, the District Education Officer and the relevant foundation body, in a format prescribed by the Director of Education Standards. Synergies and reforms resulting from inspection would best be achieved if inspection findings and recommendations were directly reported to the DES as well. This will enable having a single harmonized inspection report for a given period that takes care of all LG inspection reports.
iv) The inspection function is characterized by duplication and wastage of resources. Currently, inspection services are provided by two categories of school inspectors. These include; inspectors in the Directorate of Education Standards (DES) operating from the centre and the four regional offices (Mpigi, Mbale,
xxi
NATIONAL PLANNING AUTHORITY
xix
the centre. The LG Act cap 243 states that the recurrent and development budget is a decentralized service. The Local Revenue is insufficient and LGs have continued to depend on funds from the center which are mostly conditional. Government should therefore relax fixing resources as conditional on certain services. For instance, a school could be able to relocate money from construction to renovation of a dilapidated structure. LGs should also be given the autonomy of having their own resource envelop rather than only depending on the centre for its entire financing.
3. Institutional Framework
The UPE institutional frame work comprises a number of institutions namely; (i) MoES, (ii) DES, (iii) UNEB, (iv) NCDC, and (v) DEOs. An over view of their performance assessment is reviewed in the sections below;
3.1 Directorate of Education Standards (DES)
i) There is lack of a comprehensive and approved compendium of standards for the primary Education Sector as required by the Education Act, 2008. The Directorate has over the years instead been guided by a number of frameworks in assessing the quality of education including EFA, MDG, and SDG goals; the Ministry of Education and Sports Education Sector; Strategic Plan 2016- 2020; and DES Strategic Plan 2016- 2020. However, the evaluation established that the DES has developed a number of guidelines for inspection and other inspection materials that help both national and LG inspectors in school inspection as provided for by section 25(1)(a) of the LG Act. These include: Inspection framework, the Hand book for School Inspectors, the Basic Requirements and Minimum Standards booklets, Guides for school improvement booklets (Six booklets on different aspects), leadership and management, the teaching and learning process, learner achievement, learner support (equity) and inspection.
ii) Structural inadequacies and reporting mismatch. The current legal and institutional architecture of the inspection function where the inspectorate at the district reports to the CAO and not DES, and where the DES reports to the PS MoES, continues to negatively impact on the quality of inspection and hence the quality of education standards. The structure is disjointed and inefficient and the envisaged relationship between DES and LGs (in the Education Act 2008) has not been feasible and not functioning as expected. Also, it can be concluded that having an inspection body accountable to the Ministry of Education PS compromises the quality of inspection and reporting as result of undue influences.
iii) Existence of gaps in the reporting lines of inspectors as enshrined in the Act. In particular, Section 25(1)(a) requires the inspector to inspect and provide a report to the Permanent Secretary, the District Education Officer and the relevant foundation body, in a format prescribed by the Director of Education Standards. Synergies and reforms resulting from inspection would best be achieved if inspection findings and recommendations were directly reported to the DES as well. This will enable having a single harmonized inspection report for a given period that takes care of all LG inspection reports.
iv) The inspection function is characterized by duplication and wastage of resources. Currently, inspection services are provided by two categories of school inspectors. These include; inspectors in the Directorate of Education Standards (DES) operating from the centre and the four regional offices (Mpigi, Mbale,
xx
Mbarara and Gulu); and the LG School inspectors based at the districts and municipalities. In order to strengthen inspection in schools and training institutions, government needs to establish a semiautonomous body responsible for education and training to carry out inspection.
v) Poor linkage between the Centre and LGs while undertaking inspection. As the DES undertakes inspection, it is required to incorporate the municipal and district inspectors as associate assessors in all its regional or national inspection programs as the need may arise. This therefore implies that the MoES inspection can be done with or without the LG inspectors.
vi) Adhoc school inspections. The evaluation established inconsistent visits by inspectors to schools. Inadequate supervision is one of the leading contributors to the increasingly high failure rates in primary schools. The four-major challenges towards school inspection identified by the implementers from the study include; inadequate transport, financial constraint, understaffing and hard to reach areas. The lack of inspection therefore presents a high risk of having schools that do not meet the requirements while operating without acquiring a license and poor curriculum implementation especially during the teaching and learning process.
vii) Existence of Schools without operating license. Although the education Act, 2008 allows new schools to open as the registration and process of acquiring an operation license is ongoing, some schools ignore to formalize their operation with the education Ministry. The evaluation established that a significant number of schools are operating without minimum requirements.
viii) Non-Professionalized school inspection function. The Inspector of schools is required to hold an Honors Bachelor’s Degree in Education from a recognized University or Institution as a minimum requirement. This has proved to be insufficient for the current inspector of schools for the delivery of primary school inspection function. This is because: (i) the University degree holders do not haveadequate training as provided by the Teacher training institutions; and (ii) they have minimal knowledge on primary education.
3.2 Uganda National Examinations Board (UNEB)
i) Non-existence of a policy that guides continuous assessment in Uganda. The Uganda National Examinations Board Act, 1983 gives UNEB the mandate to undertake assessment of the Primary curriculum at the end of the cycle and leaves continuous assessment to individual schools. Assessment is therefore not uniform as assessment is often limited to only examinable subjects, especially in private schools. Areas such as Music, Dance and Drama and co-curricular activities are often neglected.
ii) Existence of unregulated continuous assessments. The evaluation established that there are unregulated private bodies (Business oriented Companies) that set and print examinations for commercial purposes. These include; beginning of term examinations, mid-term examinations, end of term examinations, regional and holiday packages. This leads to the non-attainment of formative assessment objectives. Therefore, outcomes of such assessments used do not effectively improve learning.
iii) Confidentiality of examination information weaknesses are common.Commercialization of Education has forced many School heads into cheating to attract more enrolment neglecting comprehensive teaching. UNEB has since been battling with a series of malpractices of exam cheats leading to cancellation of results and centre numbers of schools. However, the head teachers and teachers involved are
xxii
Policy, Legal, Regulatory and Institutional Framework
xxi
never apprehended. There is need to enact examination misconduct and confidentiality legal instruments with strict penalties and rewards ranging from suspension, expulsion and retirement in public interest of any of the culprits. UNEB should, in additionconsider setting regional exams to curb malpractices.
3.3 National Curriculum Development Centre (NCDC)
i) The NCDC Act is inadequate as a legal tool in regulating curricula for international schools. The Act is silent about the role of the Centre with regard to curricula used by international schools on learners in Uganda. Without regulation, international schools could promote unacceptable foreign behavior in schools. Due to lack of regulation, international school’s curriculum is incompatible with the nationalwhich complicates integration of Ugandan learners into the Ugandan school learning system.
ii) Limited quality assurance of supplied teaching materials. There is limited attention paid to quality assurance of books during production, packaging and distribution.
iii) Inadequate community involvement in curriculum implementation. The UPE policy provides different responsibilities on the parents in different circumstances but most parents do not appreciate their role in ensuring teaching and learning of their children.
3.4 Education System in Uganda
i) Education system of 7-4-2-3 is still relevant. This evaluation finds the current education system relevant contrary to the numerous reports by some researchers and agencies’, such as EPRC’s recommendation of changing from the current from the current 7-4-2-3 system to 8-3-2-3 system. The system only requires to be strengthened to achieve its intended results. The system attracts pupils/students nation-wide.
ii) Formalize the pre-primary education level by introducing ECD Centres at all schools. Primary education is still considered the first level of formal education in which pupils follow a common basic curriculum. Given the big enrolment in UPE schools with under age in the lower section, government should review this provision in the Education Act so that ECD centres can be attached to all schools including those implementing UPE (which have big enrolments of under aged children in lower classes).
3.5 Sector Wide Approach (SWAp)
i) Education SWAp is limited to the sector rather than enhancing inter and intra sectoral linkages. The SWAp considers only the MOES and key stakeholders that include donors within the education sector to work in a fully participatory manner,which does not provide enough space for inter-sectoral linkages. However, the group lacks inter-sectoral linkages as it only focusses on stakeholders in education.
Overall, the main policy thrusts of education sector over the years of focusing on expanding the functional capacity of educational structures and institutions as well as reducing on the inequalities of access to education between sexes, geographical areas, and social classes has had mixed results.
Policy recommendations
xxiii
NATIONAL PLANNING AUTHORITY
xxi
never apprehended. There is need to enact examination misconduct and confidentiality legal instruments with strict penalties and rewards ranging from suspension, expulsion and retirement in public interest of any of the culprits. UNEB should, in additionconsider setting regional exams to curb malpractices.
3.3 National Curriculum Development Centre (NCDC)
i) The NCDC Act is inadequate as a legal tool in regulating curricula for international schools. The Act is silent about the role of the Centre with regard to curricula used by international schools on learners in Uganda. Without regulation, international schools could promote unacceptable foreign behavior in schools. Due to lack of regulation, international school’s curriculum is incompatible with the nationalwhich complicates integration of Ugandan learners into the Ugandan school learning system.
ii) Limited quality assurance of supplied teaching materials. There is limited attention paid to quality assurance of books during production, packaging and distribution.
iii) Inadequate community involvement in curriculum implementation. The UPE policy provides different responsibilities on the parents in different circumstances but most parents do not appreciate their role in ensuring teaching and learning of their children.
3.4 Education System in Uganda
i) Education system of 7-4-2-3 is still relevant. This evaluation finds the current education system relevant contrary to the numerous reports by some researchers and agencies’, such as EPRC’s recommendation of changing from the current from the current 7-4-2-3 system to 8-3-2-3 system. The system only requires to be strengthened to achieve its intended results. The system attracts pupils/students nation-wide.
ii) Formalize the pre-primary education level by introducing ECD Centres at all schools. Primary education is still considered the first level of formal education in which pupils follow a common basic curriculum. Given the big enrolment in UPE schools with under age in the lower section, government should review this provision in the Education Act so that ECD centres can be attached to all schools including those implementing UPE (which have big enrolments of under aged children in lower classes).
3.5 Sector Wide Approach (SWAp)
i) Education SWAp is limited to the sector rather than enhancing inter and intra sectoral linkages. The SWAp considers only the MOES and key stakeholders that include donors within the education sector to work in a fully participatory manner,which does not provide enough space for inter-sectoral linkages. However, the group lacks inter-sectoral linkages as it only focusses on stakeholders in education.
Overall, the main policy thrusts of education sector over the years of focusing on expanding the functional capacity of educational structures and institutions as well as reducing on the inequalities of access to education between sexes, geographical areas, and social classes has had mixed results.
Policy recommendations
xxii
i) Comprehensively document the respective policies. There is need to document what UPE is and how it should be implemented so as to facilitate its implementation, inspection and Monitoring and Evaluation. The sector needs to undertake an assessment and document all policies relating to education, carefully stating the objectives and their respective assumptions.
ii) The Minister should issue a statutory instrument on UPE as required under the Education Act, 2008. The continued conflicts between parents, teachers and the politicians in the implementation of UPE in particular, feeding is as result of lack of consensus / knowledge of their roles. The issuance of the instruments by the Minister will go a long way to address this missing link. The media has also been used to disseminate information before it is well synthesized and signed off by the Minister responsible.
iii) Sensitize parents and the community on their roles. Parents and the community do not understand their roles and responsibilities and to that effect, respondents suggest sensitization of the parents and community on their roles will help increase parents’ support to UPE. The phrase “bona basome” to parents literally meant that government took over their roles entirely on education. They thought that the government would pay fees, provide all the scholastic needs including stationery, uniforms, textbooks and tuition. The effect is that almost all UPE government aided primary schools stopped providing meals to the learners. Most parents went ahead to produce more children since they knew the burden of school was taken away. This study strongly recommends enforcement of provision of food at school and where possible, by laws passed to punish parents who do not provide meals for their school going children.
iv) Increase funding for UPE, recruit more teachers and share Local Revenue. The evaluation recommends increment in the funding for UPE. This will thus address and fill the gaps identified. The gaps include: limited infrastructure, dilapidated structures and motivation of teachers. Given the high PTR, respondents especially in Eastern, Northern and Central Uganda recommend recruitment of more teachers to bridge the gap brought about by high enrolment rates. In addition, the Local Revenue collected should be decentralized / shared with schools as it is only used at the district. It should therefore handle schools with scarcity.
v) Promotion should be based on assessment. The Ministry of Education and Sports should review the automatic promotion policy setting minimum qualification standards to advance to subsequent grades. Evidence indicates that the policy is believed to be compromising the quality of education. Majority of implementers interviewed (CAOs, LCV chairpersons, DEOs, head teachers and teachers)recommend the promotion to be based on assessment and a compromise of allowing repeating for weak pupils. It should be based on indicators of merit (attendance and achievement in all subjects).
vi) Increase the supply and stock of approved textbooks. Government should improve on the supply of textbooks to schools to improve the textbook- pupil ratio from the current 3:1. In addition, NCDC should publish on its website a list of approved textbooks annually. This will enable users have accurate information on the books that are aligned to the syllabus. Approved textbooks should in addition be posted online such that soft copies are used. This will minimize the cost and burden of purchasing the many text books and maximize their use since access will be increased. However, technology should be viewed as a necessary supplement to traditional textbooks, not a replacement.
xxiv
Policy, Legal, Regulatory and Institutional Framework
xxiii
vii) Introduce ECD section in areas of very low access. ECD is the most important stage in the life of children and the ECD policy falls short of declaring pre-primary education a must for all children. ECD ensures a firm foundation for all children before they enter primary one and that must be harnessed. Government must take overall responsibility over its provision and make it compulsory as it is in the case of many developed countries. ECD / pre-primary education in Uganda is optional. Due to the cost implication of having ECD centres established at every primary school, this evaluation recommends introduction of the centres in areas of scarcity.
viii) Enroll children at the right age and ensure that they do not leave school without completing the full cycle of primary education. Only when every child is enrolled at the right age and does not leave school without completing the full cycle of primary education would it be possible to ensure that all the citizens have the basic education needed for living a full life. It would also help in achieving transformation of the society leading to greater unity among the people, higher moral standards and an accelerated growth of the economy.
ix) Support local language development. Government should strengthen language boards to have them fully functional to aid standardization of learning materials to facilitate the learning. In addition, a National Language Advisory Board should be established to assist in the development of Uganda languages. Increase the production and supply of local language teaching materials to schools.
x) Extend the implementation of the local language policy to private schools. The study finds that majority of private schools do not use local language despite the policy being applicable to both government and private aided schools. There is therefore need to enforce implementation of the policy by all.
xi) Rewards and sanctions mechanism for performance. This policy to be effectively implemented, government should initiate annual rewards and sanctions for good and bad performance. This practice will motivate and improve performance of primary education in Uganda.
xii) Regularize Continuous Professional Development. Teachers should regularly undertake pedagogy trainings to enhance their teaching capabilities and allow for career growth. These have a direct bearing on teacher efficiency and effectiveness that in turn leads to improved pupil performance.
xiii) Regulate charges to pupils in schools. Charges are one of the reasons children drop out of school and this contradicts policy on UPE since Universal access to education is the ability of all people (not only state funded) to have equal opportunity in education, regardless of their social class, gender, ethnicity background or physical and mental disabilities. The school dues charged in different schools should therefore be regulated by the concerned stakeholders and accountability presented to all those concerned. The main aims as to why different dues are charged should also be made clearly known to the parents, guardians and stakeholders.
xiv) Increase budget allocation towards Human Capital Development. Human capital is essential for boosting productivity, pivotal for economic growth and also vital with regard to the resilience of economies. A country's human capital is mainly built through the education system, which is mostly funded by public money. Spending on education is a genuine and decisive public investment in the sense that the expected returns are quite high and typically materialize over a long period. This holds both for individuals (private returns) as well as for the society at large, as human capital accumulation is a key driver for economic/productivity growth, innovation activities and also the resilience of an economy in times of crises.
xxv
NATIONAL PLANNING AUTHORITY
xxiii
vii) Introduce ECD section in areas of very low access. ECD is the most important stage in the life of children and the ECD policy falls short of declaring pre-primary education a must for all children. ECD ensures a firm foundation for all children before they enter primary one and that must be harnessed. Government must take overall responsibility over its provision and make it compulsory as it is in the case of many developed countries. ECD / pre-primary education in Uganda is optional. Due to the cost implication of having ECD centres established at every primary school, this evaluation recommends introduction of the centres in areas of scarcity.
viii) Enroll children at the right age and ensure that they do not leave school without completing the full cycle of primary education. Only when every child is enrolled at the right age and does not leave school without completing the full cycle of primary education would it be possible to ensure that all the citizens have the basic education needed for living a full life. It would also help in achieving transformation of the society leading to greater unity among the people, higher moral standards and an accelerated growth of the economy.
ix) Support local language development. Government should strengthen language boards to have them fully functional to aid standardization of learning materials to facilitate the learning. In addition, a National Language Advisory Board should be established to assist in the development of Uganda languages. Increase the production and supply of local language teaching materials to schools.
x) Extend the implementation of the local language policy to private schools. The study finds that majority of private schools do not use local language despite the policy being applicable to both government and private aided schools. There is therefore need to enforce implementation of the policy by all.
xi) Rewards and sanctions mechanism for performance. This policy to be effectively implemented, government should initiate annual rewards and sanctions for good and bad performance. This practice will motivate and improve performance of primary education in Uganda.
xii) Regularize Continuous Professional Development. Teachers should regularly undertake pedagogy trainings to enhance their teaching capabilities and allow for career growth. These have a direct bearing on teacher efficiency and effectiveness that in turn leads to improved pupil performance.
xiii) Regulate charges to pupils in schools. Charges are one of the reasons children drop out of school and this contradicts policy on UPE since Universal access to education is the ability of all people (not only state funded) to have equal opportunity in education, regardless of their social class, gender, ethnicity background or physical and mental disabilities. The school dues charged in different schools should therefore be regulated by the concerned stakeholders and accountability presented to all those concerned. The main aims as to why different dues are charged should also be made clearly known to the parents, guardians and stakeholders.
xiv) Increase budget allocation towards Human Capital Development. Human capital is essential for boosting productivity, pivotal for economic growth and also vital with regard to the resilience of economies. A country's human capital is mainly built through the education system, which is mostly funded by public money. Spending on education is a genuine and decisive public investment in the sense that the expected returns are quite high and typically materialize over a long period. This holds both for individuals (private returns) as well as for the society at large, as human capital accumulation is a key driver for economic/productivity growth, innovation activities and also the resilience of an economy in times of crises.
xxiv
Moreover, next to economic returns, education is also an effective remedy to fight poverty and flatten the income distribution, i.e. many education policies are expected to deliver a double-dividend for the society at large.
xv) Address poverty among most parents for them to be able to feed their children. Failure by parents to provide food to their pupils is highly related to the high poverty levels among the parents. Previously, Uganda has had a strong poverty reduction performance in the past two decades where monetary poverty halved, with the poverty headcount rate declining from 56.4 percent in 1992/93 to 24.5 percent in 2009/10. This further reduced to 19.7 percent in 2012/13 before reversing to 21 in FY2016/17. The NDPII target of reducing the poverty rates from 19.7 percent to 14.2 percent and reducing inequality co-efficient from 0.443 to 0.452 by 2019/20 is far from being achieved. Government in its public policies need to shift / move towards taking a fresh look at addressing poverty, and therefore need to develop a new wave of ideas and approaches to address the causes of poverty.
xvi) Implement UPE in both public and private primary schools. UPE by definition is State funded Universal Primary Education programme meaning its implementation should be both public and private schools. However, the laws (Constitution, Education Act, 2008) provide for funding for UPE in public schools. Likewise, the parents fund for the same in private primary schools. At the inception, UPE was funded by government in both public and private schools until 1999 when public funding for UPE was suspended in private primary schools. Whereas government is obliged to provide access, quality and equitable education and sports to all learners; which entail payment for capitation, inspection, instructional materials, infrastructure and teachers’ wages, these are only fulfilled in public schools. In addition, inspection funding for quality assurance in public and private schools provided for by government is still insufficient and mostly covers government schools.
xvii) Improve monitoring and learning in public schools to improve performance.Although public schools are well facilitated with instructional materials in all subjects, performance is still low whereas for the private schools that employ teachers of the same qualification, performance is better. This is because there is a gap in monitoring teaching and learning in these schools. In addition, UPE returns (PLE performance, staff motivation, capitation unit cost, staff accommodation etc.) in public schools remain low.
xviii) Introduce a web-based tracking system for drop outs. Section 10(3b) of the Education Act, 2008 requires Government to ensure a child who drops out of school before completing primary education cycle attains basic education through alternative approaches to providing that education. The drop-out rate in Uganda has continued to increase and yet there is no government strategy to trace the whereabouts of students that have left before completing primary education cycle to attain basic education. With the introduction of the National IDs by NIRA, an integrated system should be put in place so that these pupils can be traced and helped.
xix) Review the education Act, 2008 to be in line with other laws. In particular, review section 27 (1) of the Education Act, 2008 that requires every district to have a three-year rolling Education Development Plan. Despite amending the LG Act to provide for 5-year Development Plans from three-year rolling plans, the education Act was not amended. There is therefore need to amend this section of the Education Act for it to be in line with the LG Act and the Comprehensive National
xxvi
Policy, Legal, Regulatory and Institutional Framework
xxv
Development Planning Framework (CNDPF). Departments in LGs are required to have work plans that are derived from the Local Government Development Plan.
xx) Introduce clearance and approval of By-laws and Ordinances by the Ministry of LG. The local bill passed by a district council is required to be forwarded to the Attorney General through the Minister to certify that the local bill is not inconsistent with the Constitution or any other law enacted by Parliament before the chairperson signs the law. However, although the procedure indicates that the bill be returned with comments to the relevant council for modification or other appropriate action within ninety days, this always takes more than a year. It has therefore been difficult to make ordinances since the approval process takes long and there are no punitive actions in case the Minister or Attorney General does not act in time. The LGs are also very many and may be cumbersome for the Minister and Attorney General to handle within the required period. The Ministry of Local Government (MoLG) should therefore be strengthened and granted authority to approve /clear the By-laws and ordinances for consistency with other supreme legislations through creation of alegal department.
xxi) Decentralize Primary education financing. Whereas the all primary education activities relating to UPE implementation are decentralized, financing has remained at the centre to decide the funding. The LG Act cap 243 clearly specifies that the recurrent and development budget is a decentralized service. The LR is insufficient and LGs have continued to depend on funds from the center which are also conditional. Funding should also be based on the needs of the people (bottom up) rather than the centre dictating ceilings for education activities at institution levels. The process should consider inclusive participation of UPE implementers.
xxii) DES should develop a comprehensive compendium of standards for primary education. The Education Act, 2008 requires that this be in place for easy tracking of education outcomes. Attempts to establish standards were made by the MoES in 2009 and led to introduction of the Basic Requirements and Minimum Standards(BRMS) indicators for education institutions which were customized for use in inspections at LG level. However, the attempts are not comprehensive as they do not provide indicators and targets for middle income standards. Given that DES is also mandated to assess the achievement of standards and to evaluate the effectiveness of education programmes of institutions and agencies throughout Uganda, this is not possible without this compendium.
xxiii) Establish a semi-autonomous or autonomous body responsible for carryingout inspection. The school inspection function of all basic education and post-primary training should be re-centralized and consolidated under one independent non-Ministerial entity reporting directly to Parliament. This is in alignment to the original objective for the establishment of the now defunct Education Standards Agency (ESA). In this regard, this report recommends benchmarking the inspectorate structures of Chile, England, and New Zealand to inform the recommended reforms. The lack of inspection therefore presents a high risk of having schools that do not meet the requirements while operating without acquiring a license and poor curriculum implementation especially during the teaching and learning process.
xxiv) Revise the provision of the Education Act granting operation of schools without acquiring an operation license. Before a school is granted a license, a thorough assessment should be done to ensure that the school meets the requirements. Provision of licenses has been at the expense of the district inspectors. At the same time the education Act, allows new schools to open as the registration
1
NATIONAL PLANNING AUTHORITY
xxv
Development Planning Framework (CNDPF). Departments in LGs are required to have work plans that are derived from the Local Government Development Plan.
xx) Introduce clearance and approval of By-laws and Ordinances by the Ministry of LG. The local bill passed by a district council is required to be forwarded to the Attorney General through the Minister to certify that the local bill is not inconsistent with the Constitution or any other law enacted by Parliament before the chairperson signs the law. However, although the procedure indicates that the bill be returned with comments to the relevant council for modification or other appropriate action within ninety days, this always takes more than a year. It has therefore been difficult to make ordinances since the approval process takes long and there are no punitive actions in case the Minister or Attorney General does not act in time. The LGs are also very many and may be cumbersome for the Minister and Attorney General to handle within the required period. The Ministry of Local Government (MoLG) should therefore be strengthened and granted authority to approve /clear the By-laws and ordinances for consistency with other supreme legislations through creation of alegal department.
xxi) Decentralize Primary education financing. Whereas the all primary education activities relating to UPE implementation are decentralized, financing has remained at the centre to decide the funding. The LG Act cap 243 clearly specifies that the recurrent and development budget is a decentralized service. The LR is insufficient and LGs have continued to depend on funds from the center which are also conditional. Funding should also be based on the needs of the people (bottom up) rather than the centre dictating ceilings for education activities at institution levels. The process should consider inclusive participation of UPE implementers.
xxii) DES should develop a comprehensive compendium of standards for primary education. The Education Act, 2008 requires that this be in place for easy tracking of education outcomes. Attempts to establish standards were made by the MoES in 2009 and led to introduction of the Basic Requirements and Minimum Standards(BRMS) indicators for education institutions which were customized for use in inspections at LG level. However, the attempts are not comprehensive as they do not provide indicators and targets for middle income standards. Given that DES is also mandated to assess the achievement of standards and to evaluate the effectiveness of education programmes of institutions and agencies throughout Uganda, this is not possible without this compendium.
xxiii) Establish a semi-autonomous or autonomous body responsible for carryingout inspection. The school inspection function of all basic education and post-primary training should be re-centralized and consolidated under one independent non-Ministerial entity reporting directly to Parliament. This is in alignment to the original objective for the establishment of the now defunct Education Standards Agency (ESA). In this regard, this report recommends benchmarking the inspectorate structures of Chile, England, and New Zealand to inform the recommended reforms. The lack of inspection therefore presents a high risk of having schools that do not meet the requirements while operating without acquiring a license and poor curriculum implementation especially during the teaching and learning process.
xxiv) Revise the provision of the Education Act granting operation of schools without acquiring an operation license. Before a school is granted a license, a thorough assessment should be done to ensure that the school meets the requirements. Provision of licenses has been at the expense of the district inspectors. At the same time the education Act, allows new schools to open as the registration
xxvi
and process of acquiring an operation license is ongoing, some schools ignore to formalize their operation with the education Ministry. Any school without an operation license does not meet standards and should not be allowed to open.
xxv) To address examination malpractice, government should enact anExamination Misconduct and Confidentiality policy with strict penalties and rewards ranging from suspension, expulsion and resignation of any of the stakeholders including: students, teachers, employees at UNEB after thorough investigation. Commercialization of Education has forced many School heads into cheating to attract more enrolment neglecting thorough/comprehensive teaching. The UNEB Act should therefore be revised.
xxvi) The NCDC should study and get best practice on how to handle international schools. The NCDC has no mandate regarding international schools and yet they should be bound by the country’s legal provisions. The Act is silent about the role of the Centre in relation to curricula used by international schools on learners in Uganda.
xxvii) Sector Wide Approaches (SWAps) should be strengthened. The SWAP considers the MOES and key stakeholders that include donors within education sector to work in a fully participatory manner. However, the group lacks inter-sectoral linkages as it only focuses on stakeholders in education. Therefore, the SWAP approach should also be inclusive to involve other stakeholders beyond the education sector. These will facilitate identification of priorities, planning, budgeting, and Monitoring and Evaluation.
2
Policy, Legal, Regulatory and Institutional Framework
1
SECTION ONE:
1.0. INTRODUCTION1.1. Background
In line with its mandate, under the National Planning Authority Act 15, 2002 Sections 7(2) and 7(3d), the Authority commissioned an independent comprehensive evaluation of the Universal Primary Education (UPE) Policy to inform wide-ranging policy planning and implementation improvements.
The overarching goal of the comprehensive evaluation of the UPE policy is to assess whether the goals and objectives of UPE have been met and still relevant. The evaluation also assesses the overall contribution and impact of the policy on human capital development. The study draws lessons for informing the review of the White Paper (1989) and provides abenchmark for evidence-based policy actions for enhancing the quality of education envisaged in Uganda’s development policy frameworks, the Second National Development Plan (NDPII) and the Uganda Vision 2040.
In light of the main goal of the evaluation study, scoping studies were designed and implemented along three inter-related areas of UPE policy, namely: i) Policy, legal, regulatory and institutional frameworks; ii) Education economics with a focus on Costing and Financing; and iii) Education Statistical Analysis (Effectiveness assessment and Forecasting). This report provides findings of the main evaluation on the Policy, legal, regulatory and institutional frameworks thematic area arising from a number of approaches used for the evaluation, including collection of primary data from local administrations and schools.
1.2. Scope of the Evaluation
This evaluation covers the entire period of Universal Primary Education implementation from inception in 1997 to date. The report covers the extent of implementation of key proposed reforms based on assumptions before and during UPE implementation, with specific focus to policy, legal, regulatory and institutional frameworks.
The scope takes cognizance of the various reforms that have taken place before andduring implementation of UPE. Worthwhile to note is that, primary education reformsbegan in 1993, four years before UPE was formally launched. These earlier reforms included the introduction of: (a) Teacher Development and Management System (TDMS); (b) Instructional Materials Unit (IMU); (c) National Assessment in Education; and (d) Improving Educational Quality (IEQ) research project.
Following the introduction of UPE in 1997, the Ministry of Education and Sports Handbook as an outcome of the National Conference on UPE programme held in Kampala on 9th and 10th September 1998 was developed. The handbook consists of guidelines on policies, roles and responsibilities of stakeholders in implementation of UPE. This report therefore, provides an assessment of the extent of implementation and effectiveness of the UPE policy, legal, regulatory and institutional reforms over the 20-yearperiod.
3
NATIONAL PLANNING AUTHORITY
1
SECTION ONE:
1.0. INTRODUCTION1.1. Background
In line with its mandate, under the National Planning Authority Act 15, 2002 Sections 7(2) and 7(3d), the Authority commissioned an independent comprehensive evaluation of the Universal Primary Education (UPE) Policy to inform wide-ranging policy planning and implementation improvements.
The overarching goal of the comprehensive evaluation of the UPE policy is to assess whether the goals and objectives of UPE have been met and still relevant. The evaluation also assesses the overall contribution and impact of the policy on human capital development. The study draws lessons for informing the review of the White Paper (1989) and provides abenchmark for evidence-based policy actions for enhancing the quality of education envisaged in Uganda’s development policy frameworks, the Second National Development Plan (NDPII) and the Uganda Vision 2040.
In light of the main goal of the evaluation study, scoping studies were designed and implemented along three inter-related areas of UPE policy, namely: i) Policy, legal, regulatory and institutional frameworks; ii) Education economics with a focus on Costing and Financing; and iii) Education Statistical Analysis (Effectiveness assessment and Forecasting). This report provides findings of the main evaluation on the Policy, legal, regulatory and institutional frameworks thematic area arising from a number of approaches used for the evaluation, including collection of primary data from local administrations and schools.
1.2. Scope of the Evaluation
This evaluation covers the entire period of Universal Primary Education implementation from inception in 1997 to date. The report covers the extent of implementation of key proposed reforms based on assumptions before and during UPE implementation, with specific focus to policy, legal, regulatory and institutional frameworks.
The scope takes cognizance of the various reforms that have taken place before andduring implementation of UPE. Worthwhile to note is that, primary education reformsbegan in 1993, four years before UPE was formally launched. These earlier reforms included the introduction of: (a) Teacher Development and Management System (TDMS); (b) Instructional Materials Unit (IMU); (c) National Assessment in Education; and (d) Improving Educational Quality (IEQ) research project.
Following the introduction of UPE in 1997, the Ministry of Education and Sports Handbook as an outcome of the National Conference on UPE programme held in Kampala on 9th and 10th September 1998 was developed. The handbook consists of guidelines on policies, roles and responsibilities of stakeholders in implementation of UPE. This report therefore, provides an assessment of the extent of implementation and effectiveness of the UPE policy, legal, regulatory and institutional reforms over the 20-yearperiod.
2
1.3. Objectives of UPE in Uganda
The adoption of UPE as a Government of Uganda policy coincided with the Global declaration on the Millennium Development Goals (MDG 2) aimed at achieving universal enrollment, completion and literacy for primary education. According to the 1992 White Paper Review Report, UPE was intended to achieve the following objectives:
(i) Provide facilities and resources to enable every child to enter school;(ii) Ensure the completion of the primary cycle of education;(iii)Make education equitable in order to eliminate disparities and inequalities;(iv)Ensure that education is affordable by the majority of Ugandans; and(v) Reduce poverty by equipping every individual with basic skills.
1.4. Objectives of UPE evaluation
The overall objective of the evaluation is to assess the policy impact of the UPE program and provide a benchmark for informed policy action for further improvement of the quality of UPE.
The following are the specific objectives for the UPE evaluation:
1) Assess the extent to which the goals and objectives of the UPE program have been achieved, taking into account the socio-economic and political economy changes;
2) Assess the adequacy of the policy, legal and regulatory frameworks in the delivery of UPE;
3) Assess the adequacy of the implementation institutional framework andcoordination mechanisms (Structures, Key Actors, Roles and Responsibilities, UPE Partners) in the delivery of UPE;
4) Assess the efficiency and effectiveness of the Planning, budgeting and Financing Frameworks; and
5) Assess the adequacy and impact of the UPE program on acquisition of basic skills and knowledge necessary to exploit their environment for self-development, life sustenance and social development.
1.5. Structure of the Report
The Report has six Sections. Section One provides background information relevant to the evaluation of the UPE Policy, legal, regulatory and Institutional framework in Uganda. It also highlights the objectives of the evaluation and UPE in Uganda and structure of the report.Section Two provides the conceptual framework for UPE Policy, Legal, regulatory and Institutional Framework. Specifically, it provides UPE evolution and the Policies and legal framework governing UPE. The third Section clearly outlines the methodology used in the study. Section Four provides an analysis and findings on the extent of implementation of the UPE policy, legal, regulatory and institutional frameworks. It in addition assesses the adequacy of the implementation institutional framework and the coordination mechanism in the delivery of UPE; and gaps within the laws and policies. Section five provides a summary of lessons learned/ best practices and emerging issues. Finally, Section Six provides conclusions and recommendations for effective and efficient UPE delivery.
4
Policy, Legal, Regulatory and Institutional Framework
3
SECTION TWO:
2.0. UPE POLICY, LEGAL AND INSTITUTIONAL FRAMEWORK
2.1 Evolution of UPE
Government involvement in formal education began in the colonial period following a report in 1922 by the Phelps-Stokes Fund. Prior to that report formal education was entirely in the hands of missionary organizations. The first Commission was the de Bunsen Committee appointed in 1952, which recommended among other things:
(i) The expansion of secondary education to provide teachers for primary and junior secondary schools;
(ii) The expansion of facilities, both primary and secondary, for girls and;(iii) The establishment of new primary schools.
The major but limited function that these recommendations were apparently meant to serve was to provide a Ugandan cadre for the local colonial civil service especially at the lower levels. However, it did serve to construct a foundation for an education system that was possible to build on later that withstood difficult political and economic conditions.
The next Commission was the Castle Commission appointed in 1963, less than a year after independence. The demand then was for high-level human power to take over the running and management of both the public and private sectors. Although the need for expanding primary education was recognized (including an OAU recommendation in 1961), it was felt that there were not enough resources to handle both the primary-levels and the higher levels. A large proportion of the education budget then went to post-primary institutions. The practice of more resources going to post-primary institutions continued for more than two decades. That situation persisted despite two attempts to promote universal primary education through The Third Five Year Development Plan (1972-1976) and the Education Policy Review Commission of 1977. The major constraint to achieving universal primary education was the negative political climate coupled with poor economic growth that characterized that period.
On taking power in 1986, the NRM government instituted a series of Commissions to investigate the situation in all areas of government. One of them was Education Policy Review Commission (EPRC), which was appointed in 1987 under the Chairpersonship of Professor W. Senteza Kajubi. Their terms of reference included, among others, recommending policies at all levels - primary, secondary and tertiary. The EPRC met for two years and consulted widely with key stakeholders around the country. A major recommendation made by this commission was the Universalization of Primary Education (UPE) as soon as possible but not later than the year 2000. The commission defended their position thus: Only when every child is enrolled at the right age and does not leave school without completing the full cycle of primary education would it be possible to ensure that all the citizens have the basic education needed for living a full life. It would also help in achieving transformation of the society leading to greater unity among the people, higher moral standards and an accelerated growth of the economy.
5
NATIONAL PLANNING AUTHORITY
3
SECTION TWO:
2.0. UPE POLICY, LEGAL AND INSTITUTIONAL FRAMEWORK
2.1 Evolution of UPE
Government involvement in formal education began in the colonial period following a report in 1922 by the Phelps-Stokes Fund. Prior to that report formal education was entirely in the hands of missionary organizations. The first Commission was the de Bunsen Committee appointed in 1952, which recommended among other things:
(i) The expansion of secondary education to provide teachers for primary and junior secondary schools;
(ii) The expansion of facilities, both primary and secondary, for girls and;(iii) The establishment of new primary schools.
The major but limited function that these recommendations were apparently meant to serve was to provide a Ugandan cadre for the local colonial civil service especially at the lower levels. However, it did serve to construct a foundation for an education system that was possible to build on later that withstood difficult political and economic conditions.
The next Commission was the Castle Commission appointed in 1963, less than a year after independence. The demand then was for high-level human power to take over the running and management of both the public and private sectors. Although the need for expanding primary education was recognized (including an OAU recommendation in 1961), it was felt that there were not enough resources to handle both the primary-levels and the higher levels. A large proportion of the education budget then went to post-primary institutions. The practice of more resources going to post-primary institutions continued for more than two decades. That situation persisted despite two attempts to promote universal primary education through The Third Five Year Development Plan (1972-1976) and the Education Policy Review Commission of 1977. The major constraint to achieving universal primary education was the negative political climate coupled with poor economic growth that characterized that period.
On taking power in 1986, the NRM government instituted a series of Commissions to investigate the situation in all areas of government. One of them was Education Policy Review Commission (EPRC), which was appointed in 1987 under the Chairpersonship of Professor W. Senteza Kajubi. Their terms of reference included, among others, recommending policies at all levels - primary, secondary and tertiary. The EPRC met for two years and consulted widely with key stakeholders around the country. A major recommendation made by this commission was the Universalization of Primary Education (UPE) as soon as possible but not later than the year 2000. The commission defended their position thus: Only when every child is enrolled at the right age and does not leave school without completing the full cycle of primary education would it be possible to ensure that all the citizens have the basic education needed for living a full life. It would also help in achieving transformation of the society leading to greater unity among the people, higher moral standards and an accelerated growth of the economy.
4
Following the EPRC report, published in 1989, a White Paper Committee was given the task to examine the EPRC report and identify the recommendations which were acceptable to government and feasible to implement and to make amendments where necessary. Government co-opted 40 more people and again carried out consultations as widely as possible. The Government White Paper was published in 1992. The White Paper accepted the major recommendation of the EPRC on primary education reform and only modified the UPE implementation time frame to allow for completion of the programmepreparation to the year 2003. Some preparations for UPE began soon after, including the training of teachers and head teachers and the supply of scholastic materials. Most of these reforms began in 1993 under the umbrella of the Primary Education and Teacher Development Project as outlined in the table below.
PRIMARY EDUCATION AND TEACHER DEVELOPMENT PROJECTTo carry out restructuring and revitalization of the education system
Reform Teacher Development and Management System
Curriculum Reform
Assessment Reform
Instructional Materials Unit
Continuous Assessment
National Assessment of progress in Education
Objective To carry out reform in primary teacher education
To prepare the reform in the curriculum for primaryeducation
To reform examinations and introduce other forms of assessment
To provide textbooks and other teaching and learning materials
To introduce formative assessment in schools
To monitor the performance of education
During the first direct general elections of 1996, the President, Yoweri Museveni, made the introduction of UPE as a campaign pledge, promising free primary education for four children per family. On being elected, President Museveni fulfilled his pledge when he announced in December 1996 that implementation of UPE was to begin in January 1997. That was the breakthrough in Uganda’s in the quest for UPE. In early January 1997 a nation-wide enumeration exercise was carried out to register the four children per family. A month later UPE pupils started school.
2.2 Policy and Legal Framework Governing Uganda Primary Education
Primary education has one of the most elaborate and institutionalized legal frameworks.The policy framework governing primary education in Uganda includes: (a) United Nations Declaration of Human Rights; (b) Uganda’s Constitution; (c) 1992 Government White Paper on Education; (d) The Education (Pre-Primary, Primary and Post-Primary) Act, 2008; and (e) Uganda Vision 2040 and the various National Development Planning frameworks. Specifically, the legal framework is constituted by the following:
(i) The Constitution of the Republic of Uganda 1995 (which obliges government to provide free primary education to all Ugandan citizens),
(ii) The Government White paper on Education (GWPE, 1992), (iii) The UNEB Act (1983), the BTVET Act (2008), the NCDC Act (2000),
Education Service Act (2002), the Universities and other Tertiary Institutions Act (2001) and the recently enacted Higher Education students’ Financing Act (2014).
6
Policy, Legal, Regulatory and Institutional Framework
5
(iv) The NRM Party Manifestos (1996, 2001, 2006, 2011, 2016),(v) The Local Government Act as amended in 2002 (which devolves the
responsibility for primary education to the local governments), (vi) The Education (Pre-primary, Primary and Post-Primary) Act, 2008 (which
makes primary education compulsory), and(vii) International Commitments on Primary Education, particularly the Millennium
Development Goals (MDGs), Sustainable Development Goals (SDGs) and the Education for All (EFA) Goals).
Whereas the actual planning of primary education is spearheaded by the Ministry of Education and Sports (MOES), other active stakeholders include the other Ministries (Ministry of Finance, Planning and Economic Development; Ministry of Public Service; Education Service Commission; and Ministry of Local Government) and the Local Governments. United Nations Declaration of Human Rights
The UPE policy framework is derived from the United Nations Declaration of Human Rights (United Nations, 1948). Article 26 notes that: “(a) Everyone has the right to education. Education shall be free, at least in the elementary and foundational stages. Elementary education shall be compulsory. Technical and professional education shall be made generally available and higher education shall be equally accessible to all on the basis of merit. (b) Education shall be directed to the full development of the human personality and to the strengthening of respect for human rights and fundamental freedoms. It shall promote understanding, tolerance and friendship among all nations, racial or religious groups, and shall further the activities of the United Nations for the maintenance of peace. (c) Parents have a prior right to choose the kind of education that shall be given to their children.”
(a) Uganda’s Constitution 1995
The right to education is guaranteed by the Uganda’s Constitution of 1995 whose educational objectives state that: (i) the state shall promote free and compulsory basic education; (ii) the state shall take appropriate measures to afford every citizen equal opportunity to attain highest educational standards possible; and (iii) Individuals, religious bodies and NGOs shall be free to build and operate educational institutions in line with the education policy (Objective XVIII (18) National Objectives and Directive principles of StatePolicy. Every citizen has a duty to promote responsible parenthood (Objective XVIII (29) (d)National Objectives and Directive Principles of State policy). Every citizen has a duty to protect children and vulnerable persons from any form of abuse, harassment and ill treatment (Article 7 (i) of the Constitution), all the persons have the right to Education (Article 30 of the Constitution). It is the right and duty of every parent to care for and bring up their Children (Article 31 (4) of the constitution). Rights of children to basic Education are the responsibility of the state and parents [Article 34 (2) of the Constitution] and the Functions of Education Service Commission (ESC) to advise the President (Article 168 of the Constitution).
In this case, the role of the State in education arises as part of its overall concern to achieve economic prosperity, social well-being and a good quality of life within a democratically structured society. This concern affirms fundamental human values and confers on the State a responsibility to protect the rights of individuals and to safeguard the common good. Education is a right for each individual and a means to enhancing well-being and quality of life for the whole of society.
7
NATIONAL PLANNING AUTHORITY
5
(iv) The NRM Party Manifestos (1996, 2001, 2006, 2011, 2016),(v) The Local Government Act as amended in 2002 (which devolves the
responsibility for primary education to the local governments), (vi) The Education (Pre-primary, Primary and Post-Primary) Act, 2008 (which
makes primary education compulsory), and(vii) International Commitments on Primary Education, particularly the Millennium
Development Goals (MDGs), Sustainable Development Goals (SDGs) and the Education for All (EFA) Goals).
Whereas the actual planning of primary education is spearheaded by the Ministry of Education and Sports (MOES), other active stakeholders include the other Ministries (Ministry of Finance, Planning and Economic Development; Ministry of Public Service; Education Service Commission; and Ministry of Local Government) and the Local Governments. United Nations Declaration of Human Rights
The UPE policy framework is derived from the United Nations Declaration of Human Rights (United Nations, 1948). Article 26 notes that: “(a) Everyone has the right to education. Education shall be free, at least in the elementary and foundational stages. Elementary education shall be compulsory. Technical and professional education shall be made generally available and higher education shall be equally accessible to all on the basis of merit. (b) Education shall be directed to the full development of the human personality and to the strengthening of respect for human rights and fundamental freedoms. It shall promote understanding, tolerance and friendship among all nations, racial or religious groups, and shall further the activities of the United Nations for the maintenance of peace. (c) Parents have a prior right to choose the kind of education that shall be given to their children.”
(a) Uganda’s Constitution 1995
The right to education is guaranteed by the Uganda’s Constitution of 1995 whose educational objectives state that: (i) the state shall promote free and compulsory basic education; (ii) the state shall take appropriate measures to afford every citizen equal opportunity to attain highest educational standards possible; and (iii) Individuals, religious bodies and NGOs shall be free to build and operate educational institutions in line with the education policy (Objective XVIII (18) National Objectives and Directive principles of StatePolicy. Every citizen has a duty to promote responsible parenthood (Objective XVIII (29) (d)National Objectives and Directive Principles of State policy). Every citizen has a duty to protect children and vulnerable persons from any form of abuse, harassment and ill treatment (Article 7 (i) of the Constitution), all the persons have the right to Education (Article 30 of the Constitution). It is the right and duty of every parent to care for and bring up their Children (Article 31 (4) of the constitution). Rights of children to basic Education are the responsibility of the state and parents [Article 34 (2) of the Constitution] and the Functions of Education Service Commission (ESC) to advise the President (Article 168 of the Constitution).
In this case, the role of the State in education arises as part of its overall concern to achieve economic prosperity, social well-being and a good quality of life within a democratically structured society. This concern affirms fundamental human values and confers on the State a responsibility to protect the rights of individuals and to safeguard the common good. Education is a right for each individual and a means to enhancing well-being and quality of life for the whole of society.
6
The State must therefore seek to create, promote and support the conditions within which education can realize its potential in society. The democratic character of this society requires education to embrace the diverse traditions, beliefs and values of its people.
(b) 1992 Government White Paper on Education
The 1995 Constitution and the UN declaration on human rights notwithstanding, the1992 Government White Paper on Education is the basis of official policy on the purposes and programs of education. While some of the programs have been revised as a result of intervening events, the White Paper’s articulation of the purposes of Uganda’s education system continues to be the supreme guidance for the sector. It seeks to promote:citizenship; moral, ethical and spiritual values; scientific, technical and cultural knowledge, skills, and attitudes; eradication of illiteracy and equipping individuals with basic skills and knowledge and ability to “contribute to the building of an integrated, self-sustaining and independent national economy”.
The primary education and teacher development project was approved in 1993, to support the government’s long-term objectives of access, quality and relevance in the education sector, by monitoring resource mobilization and allocation in the sector and by financing specific investments.
(c) The Education Act, 2008
The Education Act, 2008 strengthens decentralized school management system byclearly spelling out roles and responsibilities of various key stake holders/players in the delivery of education services. It also promotes public private partnership. The Act mandates the Minister of Education and Sports, from time to time, to issue statutory instruments regarding UPE, Universal Post Primary Education and Training, school meals, school charges, school uniforms, management and governance of education institutions in accordance with the Act. The Act makes primary education compulsory.
(d) The Universal Primary Education (UPE) Policy
Midway through implementation of the Primary Education and Teacher Development Project in December 1996, the President fulfilled an election promise to eliminate primary school fees, starting with four children. The result was an almost doubleenrollment in early 1997, from 2.5 million to 4.8 million pupils, which overwhelmed schools and threatened collapse of the system unless additional resources were made available (World Bank, 2004).
This policy became known as Universal Primary Education (UPE). It was seen as the main tool for achieving the economic, social and political objectives outlined in the Ministry of Education and Sports policy document of 1998.
It should be noted that there is, however, no written policy guiding Universal Primary Education. In particular, there are hardly any policy documents upon which reference toUganda’s primary education sub-sector have been based. This includes documents detailing what UPE is and how it was supposed to be implemented. For instance, a part from themotivation by government’s manifesto ahead of the 1996 Presidential and Parliamentary
8
Policy, Legal, Regulatory and Institutional Framework
7
elections, there are no details on how the initial four (4) children per family was arrived at.Nevertheless, the slow response by technocrats to work out the details did not deter timely action to ensure implementation of the policy.
(e) Uganda Vision 2040, Sustainable Development Goal four and NDPII.
The Uganda Vision 2040 articulates reforms required in the education system and curriculum to obtain a globally competitive human resource with skills relevant to the development paradigm (page XV). It also highlights the need to promote Swahili as a national language and its integration in the education curriculum, among others.
The Second National Development Plan (NDPII) outlines the following national education goals and targets:
(1) All girls and boys should be able to complete free, equitable and quality primary and secondary education leading to relevant and effective learning outcomes;
(2) All girls and boys should have access to quality early childhood development, care and pre-primary education to prepare them for primary education;
(3) There should be equal access for all women and men to affordable quality technical,vocational and tertiary education, including university;
(4) There should be an increase in the percentage of youth and adults who have relevant skills, including technical and vocational skills, for employment, decent jobs and entrepreneurship;
(5) There should be no gender disparities in education instead there should be equal access to all levels of education and vocational training for the vulnerable, including persons with disabilities, indigenous peoples, and children in vulnerable situations; and
(6) All youths and at least a considerable percentage of adults, both men and women should be literate and numerate.
The SDG Goal 4 aims at ensuring inclusive and equitable quality education and promoting life-long learning opportunities for all. That is also incorporated into the NDPII.
2.3. Institutional Framework Governing Primary Education
i. The Sector is institutionally organized into a number of entities including; Public Institutions, The Private Sector, The Civil Society/Non-Government Organizations (NGOs) and Development Partners. The Public Sector is constituted:of the Ministry of Education and Sports (MoES); other key stakeholder like Ministry of Finance, Planning and Economic Development (MOFPED), Ministry of Local Government (MoLG) and Ministry of Public Service (MoPS). It also includes of other semi-autonomous affiliate entities execute certain specified responsibilities on behalf of and in liaison with the lead Ministry (MoES). These include the National Council of Sports (NCS), Uganda National Examinations Board (UNEB), National Council for Higher Education (NCHE), National Curriculum Development Centre (NCDC), Directorate of Education Standards (DES), Universities, and the Education Service Commission (ESC).
ii. Primary Education is under the Directorate of Basic and Secondary Education at the Ministry of Education and Sports (MoES). The other Directorates at MoES are; the Directorate of Higher, Technical and Vocational Education and Training; The
9
NATIONAL PLANNING AUTHORITY
7
elections, there are no details on how the initial four (4) children per family was arrived at.Nevertheless, the slow response by technocrats to work out the details did not deter timely action to ensure implementation of the policy.
(e) Uganda Vision 2040, Sustainable Development Goal four and NDPII.
The Uganda Vision 2040 articulates reforms required in the education system and curriculum to obtain a globally competitive human resource with skills relevant to the development paradigm (page XV). It also highlights the need to promote Swahili as a national language and its integration in the education curriculum, among others.
The Second National Development Plan (NDPII) outlines the following national education goals and targets:
(1) All girls and boys should be able to complete free, equitable and quality primary and secondary education leading to relevant and effective learning outcomes;
(2) All girls and boys should have access to quality early childhood development, care and pre-primary education to prepare them for primary education;
(3) There should be equal access for all women and men to affordable quality technical,vocational and tertiary education, including university;
(4) There should be an increase in the percentage of youth and adults who have relevant skills, including technical and vocational skills, for employment, decent jobs and entrepreneurship;
(5) There should be no gender disparities in education instead there should be equal access to all levels of education and vocational training for the vulnerable, including persons with disabilities, indigenous peoples, and children in vulnerable situations; and
(6) All youths and at least a considerable percentage of adults, both men and women should be literate and numerate.
The SDG Goal 4 aims at ensuring inclusive and equitable quality education and promoting life-long learning opportunities for all. That is also incorporated into the NDPII.
2.3. Institutional Framework Governing Primary Education
i. The Sector is institutionally organized into a number of entities including; Public Institutions, The Private Sector, The Civil Society/Non-Government Organizations (NGOs) and Development Partners. The Public Sector is constituted:of the Ministry of Education and Sports (MoES); other key stakeholder like Ministry of Finance, Planning and Economic Development (MOFPED), Ministry of Local Government (MoLG) and Ministry of Public Service (MoPS). It also includes of other semi-autonomous affiliate entities execute certain specified responsibilities on behalf of and in liaison with the lead Ministry (MoES). These include the National Council of Sports (NCS), Uganda National Examinations Board (UNEB), National Council for Higher Education (NCHE), National Curriculum Development Centre (NCDC), Directorate of Education Standards (DES), Universities, and the Education Service Commission (ESC).
ii. Primary Education is under the Directorate of Basic and Secondary Education at the Ministry of Education and Sports (MoES). The other Directorates at MoES are; the Directorate of Higher, Technical and Vocational Education and Training; The
8
Directorate of Education Standards; and the Directorate of Industrial Training. The private sector and civil society comprise; Private Investors, Faith Based Organizations (FBOs), NGOs and the development Partners under the Education Funding Agencies Group (EFAG). The international NGOs include the United Nations Education Scientific and Cultural Organization (UNESCO) and the United Nations International Children’s Education Fund (UNICEF).
iii. Primary education is also a decentralized function in terms of planning, budgeting and implementation coordinated by MoES. These roles are executed through the Sector Wide Arrangements /Approach (SWAp), which works through sector working groups, namely: (i) Monitoring and Evaluation Working Group (MEWG), (ii) Education Sector Budget Working Group (ESBWG), and (iii) Sector Policy Management (SPM). Critical issues of financial and policy nature arising from WGs are forwarded to the Education Sector Consultative Committee (ESCC) and Top Management for decision making.
iv. The LG primary education institutional framework is coordinated by the Education Department headed by the District Education Officer. The Department has a number of inspectors headed by the District Inspector of Schools. Part of the Inspection team includes Centre Coordinating Tutors (CCTs) based at Core PTCs who serve as outreach teacher educators to provide Continuous Professional Development (CPDs) to primary schools, head teachers and teachers. The Chief Administrative Officer (CAO) is the overall accounting officer. The Council is the highest political authority within the area of jurisdiction of a local government and it has legislative and executive powers to be exercised in accordance with the Constitution and this Act. TheDistrict Executive Committee is in charge of monitoring on behalf of the district council is responsible for initiating and formulating policy for approval of the council; Overseeing the implementation of the Government and the council’s policies and monitor and coordinate activities of nongovernmental organizations in a district; (c) monitoring the implementation of council programmes and take remedial action where necessary; (e) receive and solve problems or disputes forwarded to it from lower local government councils; and (f) at the end of each financial year consider and evaluate the performance of the council against the approved work plans and programmes; and (g) carry out any other duty as may be authorized by the council or any law.
v. At Municipality level, the Education department is headed by the Municipal Education Officer who supervises the Municipal Inspectors of Schools. The Town Clerk is the accounting officer for primary education programmes in the municipality. At Sub county level, the Senior Assistant Secretary (SAS) is the Accounting Officer and is required to monitor and supervise each primary school on a regular basis. The lowest institutional level for primary education is the school headed by a headteacher who works closely with the School Management Committee (SMC) in management of the primary school.
10
Policy, Legal, Regulatory and Institutional Framework
9
SECTION THREE:
3.0. METHODOLGY
3.1 Evaluation Techniques used for this Theme
Initially, the assessment involved identification of the policies, laws, regulations and institutional reforms introduced for purposes of achieving UPE objectives and other related outcomes. Cumulative stock taking of the achievements was then undertaken against each legal and institutional framework introduced. At the end, it was important to know whether any difference was made as a result of these reforms. Cases where reforms were not the right thing to do have also been highlighted. Lessons have been captured on the implementation of the reforms.
3.2 Data Sources
In order to ascertain the impact, relevance, effectiveness, efficiency and sustainability of the legal and institutional reforms, secondary and primary data was collected and analyzed. Most of the secondary data was collected during the scoping studies were used to collect most of the secondary data. The secondary data sources used include; existing laws, policies, guidelines, regulations, strategic plans, manuals and various reports.
Primary data was collected from the LGs and the respective stakeholder institutionswhich include; Primary Teachers’ Colleges (PTCs), National Teachers Colleges (NTCs), National Curriculum Development Centre (NCDC), Ministry of Education and Sports (MoES) and Local Government (LG) Administration. The LG data collection was conducted in two phases. Phase one covered efficiency and effectiveness, while phase twocovered curriculum, community participation and Teacher Training modules.
Efficiency and effectiveness data collection phase included; face to face interviews and capturing of required data from the LCV, CAO, DEO, SAS, SMC, Head teachers and teachers interviewed, while in phase II under the Curriculum, Teacher training and Community participation modules, data was collected from the DIS, CCTs, UPE Beneficiaries, the PTA Members, School Management, Parents, Head Teachers and Teachers.
3.3 Sample Selection
Primary data was collected in two phases and the study stratified the country into ten (10) regions giving birth to 10 groups each composed of seven (7) enumerators in first phase and nine (9) enumerators in the second phase. The regions covered include: Greater Kampala Metropolitan Areas (GKMA); Central I2; Central II3; Western; South Western; Eastern I (Bukedi & Teso); Eastern II (Busoga); Acholi/Lango; West Nile; and Karamoja. Kampala had all divisions covered. A multi stage sampling criteria which involved dividing the population into groups was used in identifying the sampling units. In phase one, 605 schools from 91 districts and 10 Municipalities were covered, while 392 schools from 70 2 Kayunga, Buikwe, Buvuma, Luwero, Nakasongola, Nakaseke, Mubende, Mityana, Kiboga and Lyantonde
3 Kalungu, Lwengo, Bukomansimbi, Rakai, Masaka, Mpigi, Butambala, Gomba, Sembabule and Kalagala
11
NATIONAL PLANNING AUTHORITY
9
SECTION THREE:
3.0. METHODOLGY
3.1 Evaluation Techniques used for this Theme
Initially, the assessment involved identification of the policies, laws, regulations and institutional reforms introduced for purposes of achieving UPE objectives and other related outcomes. Cumulative stock taking of the achievements was then undertaken against each legal and institutional framework introduced. At the end, it was important to know whether any difference was made as a result of these reforms. Cases where reforms were not the right thing to do have also been highlighted. Lessons have been captured on the implementation of the reforms.
3.2 Data Sources
In order to ascertain the impact, relevance, effectiveness, efficiency and sustainability of the legal and institutional reforms, secondary and primary data was collected and analyzed. Most of the secondary data was collected during the scoping studies were used to collect most of the secondary data. The secondary data sources used include; existing laws, policies, guidelines, regulations, strategic plans, manuals and various reports.
Primary data was collected from the LGs and the respective stakeholder institutionswhich include; Primary Teachers’ Colleges (PTCs), National Teachers Colleges (NTCs), National Curriculum Development Centre (NCDC), Ministry of Education and Sports (MoES) and Local Government (LG) Administration. The LG data collection was conducted in two phases. Phase one covered efficiency and effectiveness, while phase twocovered curriculum, community participation and Teacher Training modules.
Efficiency and effectiveness data collection phase included; face to face interviews and capturing of required data from the LCV, CAO, DEO, SAS, SMC, Head teachers and teachers interviewed, while in phase II under the Curriculum, Teacher training and Community participation modules, data was collected from the DIS, CCTs, UPE Beneficiaries, the PTA Members, School Management, Parents, Head Teachers and Teachers.
3.3 Sample Selection
Primary data was collected in two phases and the study stratified the country into ten (10) regions giving birth to 10 groups each composed of seven (7) enumerators in first phase and nine (9) enumerators in the second phase. The regions covered include: Greater Kampala Metropolitan Areas (GKMA); Central I2; Central II3; Western; South Western; Eastern I (Bukedi & Teso); Eastern II (Busoga); Acholi/Lango; West Nile; and Karamoja. Kampala had all divisions covered. A multi stage sampling criteria which involved dividing the population into groups was used in identifying the sampling units. In phase one, 605 schools from 91 districts and 10 Municipalities were covered, while 392 schools from 70 2 Kayunga, Buikwe, Buvuma, Luwero, Nakasongola, Nakaseke, Mubende, Mityana, Kiboga and Lyantonde
3 Kalungu, Lwengo, Bukomansimbi, Rakai, Masaka, Mpigi, Butambala, Gomba, Sembabule and Kalagala
10
districts were covered in phase two. The detailed sampling designs for both phases attached in Annex1.
3.4 Data Analysis
Data analysis first entailed data coding where extensive datasets were condensed in a systematic way into smaller analyzable units through the creation of categories and concepts from the data derived from open ended questions. Data collected included multiple responses and was therefore entered using Microsoft Access data entry interface. Data cleaning was undertaken to find possible outliers, non-normal distributions, and other anomalies in the data. The process was directly supervised by NPA technical staff.
The data was analyzed in stages and by categories including: Policy makers -administrative and technical (CAO, LCV, DEO); and implementers (Head teachers, teachers, SMC, and SAS). To explore the characteristics of UPE variables, descriptive statistics were computed. The averages, standard deviations, proportions and frequencies were computed for each of the variables. Graphs and charts were drawn to present the analysis in graphical form. More specifically, frequencies and percentages were computed for all the variables generated. To assess performance between demographic characteristics (age, sex, and district), bivariate analysis was performed. The obtained data were cleaned and analyzed using SPSS 23 and STATA 13 software.
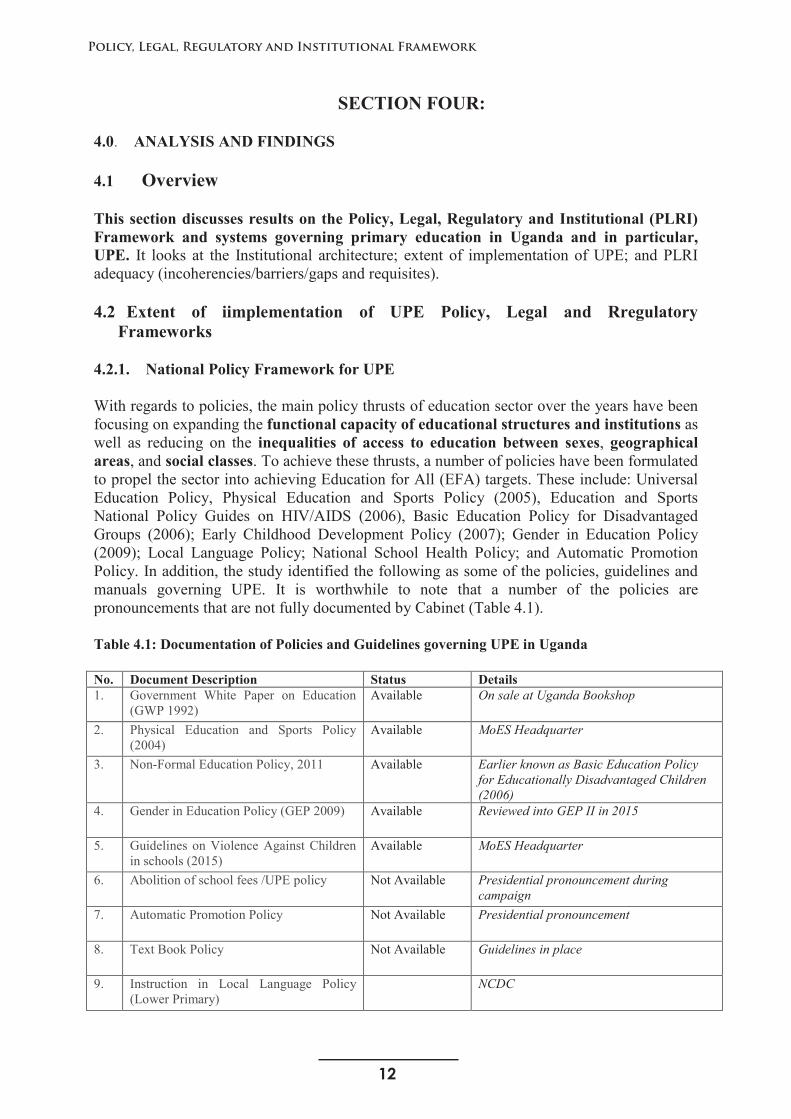
12
Policy, Legal, Regulatory and Institutional Framework
11
SECTION FOUR:
4.0. ANALYSIS AND FINDINGS
4.1 Overview
This section discusses results on the Policy, Legal, Regulatory and Institutional (PLRI) Framework and systems governing primary education in Uganda and in particular,UPE. It looks at the Institutional architecture; extent of implementation of UPE; and PLRI adequacy (incoherencies/barriers/gaps and requisites).
4.2 Extent of iimplementation of UPE Policy, Legal and RregulatoryFrameworks
4.2.1. National Policy Framework for UPE
With regards to policies, the main policy thrusts of education sector over the years have been focusing on expanding the functional capacity of educational structures and institutions as well as reducing on the inequalities of access to education between sexes, geographical areas, and social classes. To achieve these thrusts, a number of policies have been formulated to propel the sector into achieving Education for All (EFA) targets. These include: Universal Education Policy, Physical Education and Sports Policy (2005), Education and Sports National Policy Guides on HIV/AIDS (2006), Basic Education Policy for Disadvantaged Groups (2006); Early Childhood Development Policy (2007); Gender in Education Policy (2009); Local Language Policy; National School Health Policy; and Automatic Promotion Policy. In addition, the study identified the following as some of the policies, guidelines and manuals governing UPE. It is worthwhile to note that a number of the policies are pronouncements that are not fully documented by Cabinet (Table 4.1).
Table 4.1: Documentation of Policies and Guidelines governing UPE in Uganda
No. Document Description Status Details1. Government White Paper on Education
(GWP 1992)Available On sale at Uganda Bookshop
2. Physical Education and Sports Policy (2004)
Available MoES Headquarter
3. Non-Formal Education Policy, 2011 Available Earlier known as Basic Education Policy for Educationally Disadvantaged Children (2006)
4. Gender in Education Policy (GEP 2009) Available Reviewed into GEP II in 2015
5. Guidelines on Violence Against Children in schools (2015)
Available MoES Headquarter
6. Abolition of school fees /UPE policy Not Available Presidential pronouncement during campaign
7. Automatic Promotion Policy Not Available Presidential pronouncement
8. Text Book Policy Not Available Guidelines in place
9. Instruction in Local Language Policy (Lower Primary)
NCDC
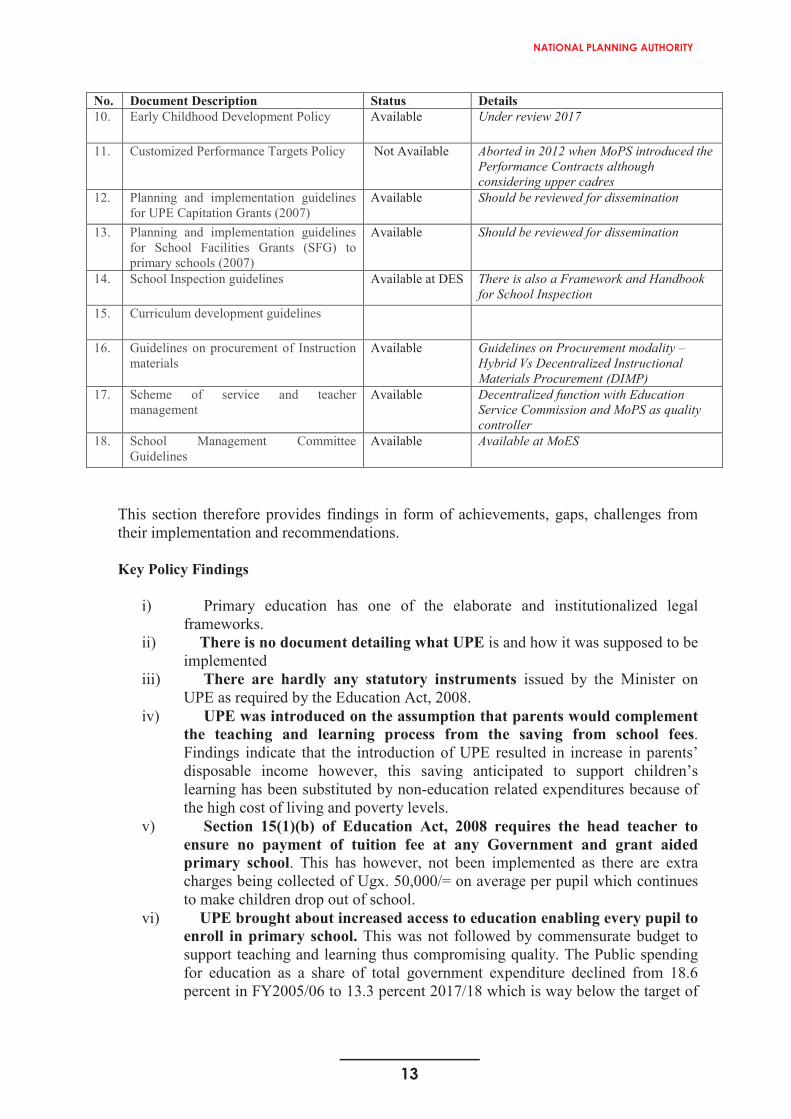
13
NATIONAL PLANNING AUTHORITY
11
SECTION FOUR:
4.0. ANALYSIS AND FINDINGS
4.1 Overview
This section discusses results on the Policy, Legal, Regulatory and Institutional (PLRI) Framework and systems governing primary education in Uganda and in particular,UPE. It looks at the Institutional architecture; extent of implementation of UPE; and PLRI adequacy (incoherencies/barriers/gaps and requisites).
4.2 Extent of iimplementation of UPE Policy, Legal and RregulatoryFrameworks
4.2.1. National Policy Framework for UPE
With regards to policies, the main policy thrusts of education sector over the years have been focusing on expanding the functional capacity of educational structures and institutions as well as reducing on the inequalities of access to education between sexes, geographical areas, and social classes. To achieve these thrusts, a number of policies have been formulated to propel the sector into achieving Education for All (EFA) targets. These include: Universal Education Policy, Physical Education and Sports Policy (2005), Education and Sports National Policy Guides on HIV/AIDS (2006), Basic Education Policy for Disadvantaged Groups (2006); Early Childhood Development Policy (2007); Gender in Education Policy (2009); Local Language Policy; National School Health Policy; and Automatic Promotion Policy. In addition, the study identified the following as some of the policies, guidelines and manuals governing UPE. It is worthwhile to note that a number of the policies are pronouncements that are not fully documented by Cabinet (Table 4.1).
Table 4.1: Documentation of Policies and Guidelines governing UPE in Uganda
No. Document Description Status Details1. Government White Paper on Education
(GWP 1992)Available On sale at Uganda Bookshop
2. Physical Education and Sports Policy (2004)
Available MoES Headquarter
3. Non-Formal Education Policy, 2011 Available Earlier known as Basic Education Policy for Educationally Disadvantaged Children (2006)
4. Gender in Education Policy (GEP 2009) Available Reviewed into GEP II in 2015
5. Guidelines on Violence Against Children in schools (2015)
Available MoES Headquarter
6. Abolition of school fees /UPE policy Not Available Presidential pronouncement during campaign
7. Automatic Promotion Policy Not Available Presidential pronouncement
8. Text Book Policy Not Available Guidelines in place
9. Instruction in Local Language Policy (Lower Primary)
NCDC
12
No. Document Description Status Details10. Early Childhood Development Policy Available Under review 2017
11. Customized Performance Targets Policy Not Available Aborted in 2012 when MoPS introduced the Performance Contracts although considering upper cadres
12. Planning and implementation guidelines for UPE Capitation Grants (2007)
Available Should be reviewed for dissemination
13. Planning and implementation guidelines for School Facilities Grants (SFG) to primary schools (2007)
Available Should be reviewed for dissemination
14. School Inspection guidelines Available at DES There is also a Framework and Handbookfor School Inspection
15. Curriculum development guidelines
16. Guidelines on procurement of Instruction materials
Available Guidelines on Procurement modality –Hybrid Vs Decentralized InstructionalMaterials Procurement (DIMP)
17. Scheme of service and teacher management
Available Decentralized function with EducationService Commission and MoPS as quality controller
18. School Management Committee Guidelines
Available Available at MoES
This section therefore provides findings in form of achievements, gaps, challenges from their implementation and recommendations.
Key Policy Findings
i) Primary education has one of the elaborate and institutionalized legal frameworks.
ii) There is no document detailing what UPE is and how it was supposed to be implemented
iii) There are hardly any statutory instruments issued by the Minister on UPE as required by the Education Act, 2008.
iv) UPE was introduced on the assumption that parents would complement the teaching and learning process from the saving from school fees.Findings indicate that the introduction of UPE resulted in increase in parents’disposable income however, this saving anticipated to support children’s learning has been substituted by non-education related expenditures because of the high cost of living and poverty levels.
v) Section 15(1)(b) of Education Act, 2008 requires the head teacher to ensure no payment of tuition fee at any Government and grant aided primary school. This has however, not been implemented as there are extra charges being collected of Ugx. 50,000/= on average per pupil which continuesto make children drop out of school.
vi) UPE brought about increased access to education enabling every pupil to enroll in primary school. This was not followed by commensurate budget to support teaching and learning thus compromising quality. The Public spending for education as a share of total government expenditure declined from 18.6 percent in FY2005/06 to 13.3 percent 2017/18 which is way below the target of
14
Policy, Legal, Regulatory and Institutional Framework
13
20 percent recommended by the Global Partnership for Education (GPE). In addition, budget allocated to education currently represents 2.7% of GDP in 2016/17 reducing from 3.5% of GDP in 2005/06.
vii) There is a decline in funding for primary education sub sector as evidenced by the reduction in the primary subsector allocation as a share of education budget from 68% in FY2005/06 to 52% in FY2016/17. Thisdecline is attributed to the introduction of Universal Secondary Education (USE) / Universal Post O-level Education and Training Program (UPOLET)which has continued to crowd out the increasing primary numbers.
viii) The UPE policy implementation has exacerbated learning outcomes particularly achieving quality education for all. This is evident from the high expenditures on development investment with little consideration to the teaching and learning activities like Continuous Professional Development(CPD), school feeding, among others.
ix) No clear documentation of standards, targets and good service levelsx) Uganda's constitutional requirements on affirmative action in favor of
marginalized groups has been achieved. In addition, UPE objective 3 aimed to make education equitable in order to eliminate disparities and inequalities has also been achieved. There were more female pupils (50.4%) in 2016 than males. Female enrolment has seen a gradual improvement over the years. From 39% in 1970 to the 47% in 1999 and 50.4% in 2016
xi) Objective four of UPE policy of having education being affordable has been achieved as evidenced by the increased access to education by all (girls, disabled and orphans). Gross Enrolment Rates (GER) were equally dramatic when they jumped from 77% in 1996 to 137% in 1997 while Net Enrolment Rate (NER) went up from 57% in 1996 to 85% in 1997.
xii) Parents have neglected their roles in the education process and have left the burden to Government. School feeding is an expensive venture which government cannot afford alone and should therefore remain a role of the parents.
xiii) There is need for a dynamic formula for allocation of grants to the beneficiary institutions by location (rural, urban) and consideration for special needs. The principle of “one size fit all” for allocation of capitation grants has proved to be inappropriate in its current state.
xiv) In conclusion, the policy is still relevant particularly related to its initial objectives. It has achieved most of its objectives, however; its success has been bedeviled by the limited financing. There appears to be an under dose onfinancing of the policy and government has not provided the necessary financial threshold to ensure quality education.
4.2.1.1 Universal Education Policy
Key Findings
i) There is no document detailing what Universal Primary Education (UPE) is and how it was supposed to be implemented. Although UPE is the cornerstoneof Uganda’s primary education sub-sector, there is no document detailing what it is and how it was supposed to be implemented. The UPE policy is not anywhere in writing. The policy was therefore not properly planned, targeted and sequenced. It is a policy that was motivated by government’s manifesto ahead of the 1996
15
NATIONAL PLANNING AUTHORITY
13
20 percent recommended by the Global Partnership for Education (GPE). In addition, budget allocated to education currently represents 2.7% of GDP in 2016/17 reducing from 3.5% of GDP in 2005/06.
vii) There is a decline in funding for primary education sub sector as evidenced by the reduction in the primary subsector allocation as a share of education budget from 68% in FY2005/06 to 52% in FY2016/17. Thisdecline is attributed to the introduction of Universal Secondary Education (USE) / Universal Post O-level Education and Training Program (UPOLET)which has continued to crowd out the increasing primary numbers.
viii) The UPE policy implementation has exacerbated learning outcomes particularly achieving quality education for all. This is evident from the high expenditures on development investment with little consideration to the teaching and learning activities like Continuous Professional Development(CPD), school feeding, among others.
ix) No clear documentation of standards, targets and good service levelsx) Uganda's constitutional requirements on affirmative action in favor of
marginalized groups has been achieved. In addition, UPE objective 3 aimed to make education equitable in order to eliminate disparities and inequalities has also been achieved. There were more female pupils (50.4%) in 2016 than males. Female enrolment has seen a gradual improvement over the years. From 39% in 1970 to the 47% in 1999 and 50.4% in 2016
xi) Objective four of UPE policy of having education being affordable has been achieved as evidenced by the increased access to education by all (girls, disabled and orphans). Gross Enrolment Rates (GER) were equally dramatic when they jumped from 77% in 1996 to 137% in 1997 while Net Enrolment Rate (NER) went up from 57% in 1996 to 85% in 1997.
xii) Parents have neglected their roles in the education process and have left the burden to Government. School feeding is an expensive venture which government cannot afford alone and should therefore remain a role of the parents.
xiii) There is need for a dynamic formula for allocation of grants to the beneficiary institutions by location (rural, urban) and consideration for special needs. The principle of “one size fit all” for allocation of capitation grants has proved to be inappropriate in its current state.
xiv) In conclusion, the policy is still relevant particularly related to its initial objectives. It has achieved most of its objectives, however; its success has been bedeviled by the limited financing. There appears to be an under dose onfinancing of the policy and government has not provided the necessary financial threshold to ensure quality education.
4.2.1.1 Universal Education Policy
Key Findings
i) There is no document detailing what Universal Primary Education (UPE) is and how it was supposed to be implemented. Although UPE is the cornerstoneof Uganda’s primary education sub-sector, there is no document detailing what it is and how it was supposed to be implemented. The UPE policy is not anywhere in writing. The policy was therefore not properly planned, targeted and sequenced. It is a policy that was motivated by government’s manifesto ahead of the 1996
14
Presidential and Parliamentary elections. There are no proper guidelines on how initially the figure of four (4) children per family was arrived at. Government committed itself to providing free primary education to a maximum of 4 children per family in 1997 before it was rolled out to cover everybody. Government not only made a pledge in May 1997 about UPE but also took action to implement the pledge by December 1997.
ii) There are hardly any statutory instruments issued by the Minister inform of rules, procedures and regulations on UPE. The Education (Pre-primary, Primary and Post Primary) Act, 2008 requires the Minister to, from time to time, issue statutory instruments regarding UPE, Universal Post Primary Education and Training, school meals, school charges, school uniforms, management and governance of education institutions in accordance with the Act. There are hardly any statutory instruments issued inform of rules, procedures and regulations on UPE. A number have been issued to implementers in form of policies, manuals,guidelines under this section of Education Act. These are in anyway difficult to trace since some of them are pronouncements while in conferences.
iii) Introduction of UPE was hinged on inability by parents to pay school fees for their children. The policy was also launched at the time when the country was focused on poverty eradication as guided by the Poverty Eradication Action Plan (PEAP). This assumption was true as evidenced by a rapid increase in enrolments on the onset of its implementation. Primary Education is seen as the first step in laying the foundation for future educational opportunities and lifelong skills. Through the skills and knowledge imbued, primary education enables people to participate in the social, economic and political activities of their communities to their fullest potential. It is also seen as a basic human right that frees human beings from a state of ignorance and helps to reduce the negative effects of poverty, relating in particular to health and nutrition. In an increasingly competitive global economy of free markets, a well-educated high-quality workforce is seen as vital to a country's economy in order to attract foreign investments that generate jobs and create wealth. Hence, good quality primary education is increasingly recognized as an important foundation for economic growth and seen as instrumental in the attainment of other development objectives.
iv) The reforms introduced following UPE policy implementation did not matchthe growth in numbers, like the increased enrolment which included the poor, old age, gender and disabled. Reforms such as Teacher Development and Management System (TDMS) were introduced to carry out reform in primary teacher education. Nevertheless, the recruitment of teachers was inadequate as the Pupil Teacher Ratio (PTR) worsened from 60 in 1997 to 65 in 2000, before steadily reducing to 43 in 2016. According to the Education and Sports Sector Strategic Plan (2017/18-2019/20), government seeks to maintain a PTR of 43 in the medium term. The PTR measures the number of pupils per teacher. It reflects teacher workload and the availability of teachers' services to their pupils. The lower the pupil/teacher ratio, the higher the availability of teacher services to pupils. The pupil/teacher ratio has implications not only for the cost of education, but also for the quality. However, Uganda needs to aim higher by revising its targets towards middle income aspirations. Given that the PTR target of 43 was achieved, there is need to do more as a country in order to further reduce it. For instance, in India, the Right of Children to Free and Compulsory Education Act provides a maximum PTR of 40:1 for grades 1 to 5, and 35:1 for grades 6 to 8 at the elementary level, with specialist teachers for science, mathematics, languages
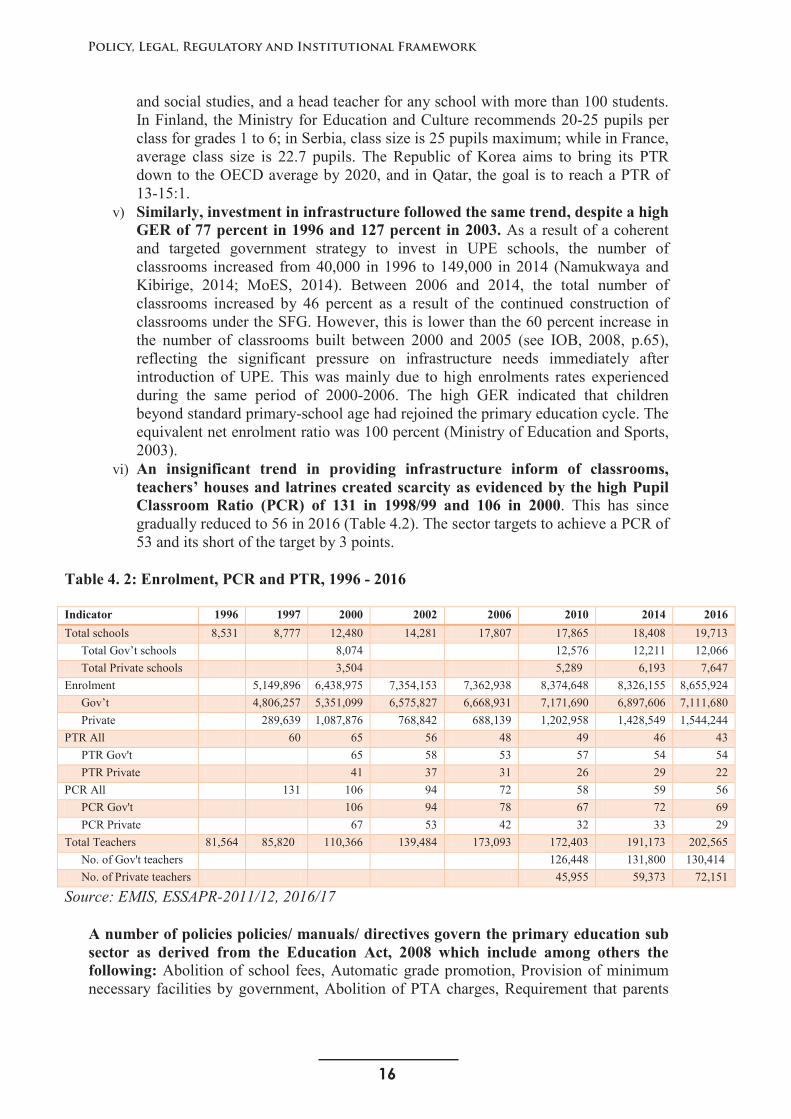
16
Policy, Legal, Regulatory and Institutional Framework
15
and social studies, and a head teacher for any school with more than 100 students. In Finland, the Ministry for Education and Culture recommends 20-25 pupils perclass for grades 1 to 6; in Serbia, class size is 25 pupils maximum; while in France, average class size is 22.7 pupils. The Republic of Korea aims to bring its PTR down to the OECD average by 2020, and in Qatar, the goal is to reach a PTR of 13-15:1.
v) Similarly, investment in infrastructure followed the same trend, despite a high GER of 77 percent in 1996 and 127 percent in 2003. As a result of a coherent and targeted government strategy to invest in UPE schools, the number of classrooms increased from 40,000 in 1996 to 149,000 in 2014 (Namukwaya and Kibirige, 2014; MoES, 2014). Between 2006 and 2014, the total number of classrooms increased by 46 percent as a result of the continued construction of classrooms under the SFG. However, this is lower than the 60 percent increase in the number of classrooms built between 2000 and 2005 (see IOB, 2008, p.65), reflecting the significant pressure on infrastructure needs immediately after introduction of UPE. This was mainly due to high enrolments rates experienced during the same period of 2000-2006. The high GER indicated that children beyond standard primary-school age had rejoined the primary education cycle. The equivalent net enrolment ratio was 100 percent (Ministry of Education and Sports, 2003).
vi) An insignificant trend in providing infrastructure inform of classrooms, teachers’ houses and latrines created scarcity as evidenced by the high Pupil Classroom Ratio (PCR) of 131 in 1998/99 and 106 in 2000. This has since gradually reduced to 56 in 2016 (Table 4.2). The sector targets to achieve a PCR of 53 and its short of the target by 3 points.
Table 4. 2: Enrolment, PCR and PTR, 1996 - 2016
Indicator 1996 1997 2000 2002 2006 2010 2014 2016Total schools 8,531 8,777 12,480 14,281 17,807 17,865 18,408 19,713
Total Gov’t schools 8,074 12,576 12,211 12,066Total Private schools 3,504 5,289 6,193 7,647
Enrolment 5,149,896 6,438,975 7,354,153 7,362,938 8,374,648 8,326,155 8,655,924Gov’t 4,806,257 5,351,099 6,575,827 6,668,931 7,171,690 6,897,606 7,111,680Private 289,639 1,087,876 768,842 688,139 1,202,958 1,428,549 1,544,244
PTR All 60 65 56 48 49 46 43PTR Gov't 65 58 53 57 54 54PTR Private 41 37 31 26 29 22
PCR All 131 106 94 72 58 59 56PCR Gov't 106 94 78 67 72 69PCR Private 67 53 42 32 33 29
Total Teachers 81,564 85,820 110,366 139,484 173,093 172,403 191,173 202,565 No. of Gov't teachers 126,448 131,800 130,414 No. of Private teachers 45,955 59,373 72,151
Source: EMIS, ESSAPR-2011/12, 2016/17
A number of policies policies/ manuals/ directives govern the primary education sub sector as derived from the Education Act, 2008 which include among others the following: Abolition of school fees, Automatic grade promotion, Provision of minimum necessary facilities by government, Abolition of PTA charges, Requirement that parents
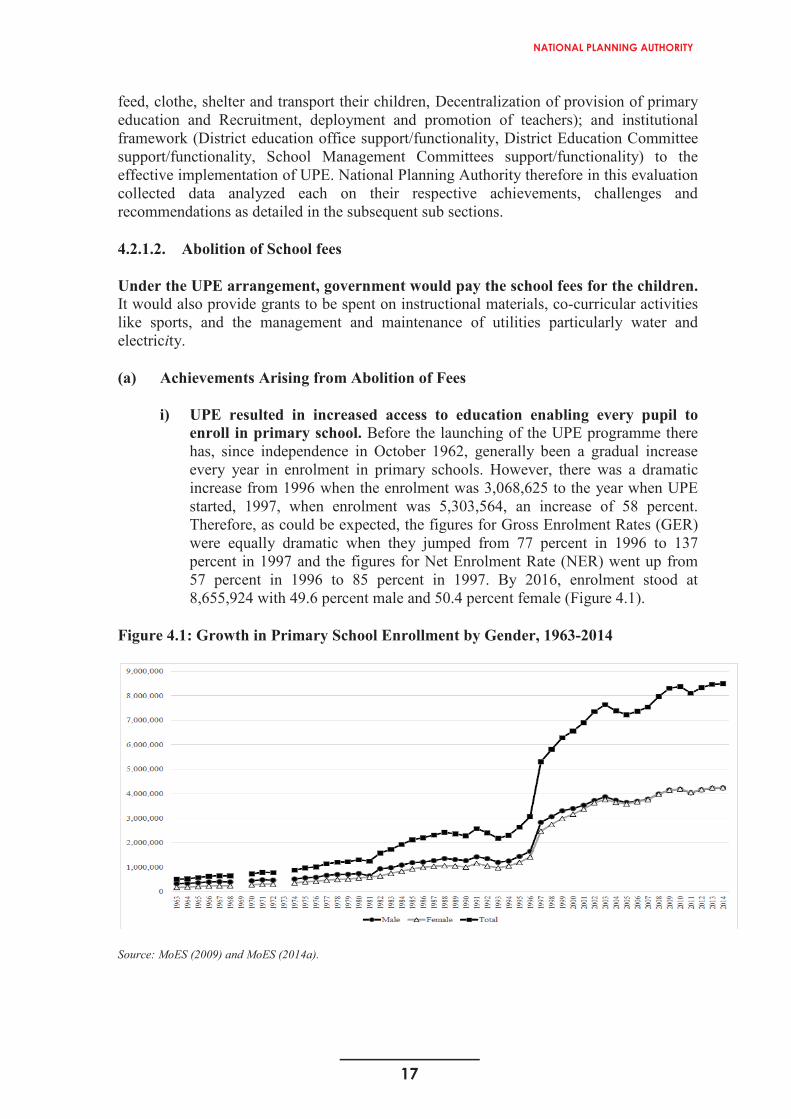
17
NATIONAL PLANNING AUTHORITY
16
feed, clothe, shelter and transport their children, Decentralization of provision of primary education and Recruitment, deployment and promotion of teachers); and institutional framework (District education office support/functionality, District Education Committee support/functionality, School Management Committees support/functionality) to the effective implementation of UPE. National Planning Authority therefore in this evaluation collected data analyzed each on their respective achievements, challenges and recommendations as detailed in the subsequent sub sections.
4.2.1.2. Abolition of School fees
Under the UPE arrangement, government would pay the school fees for the children.It would also provide grants to be spent on instructional materials, co-curricular activities like sports, and the management and maintenance of utilities particularly water and electricity.
(a) Achievements Arising from Abolition of Fees
i) UPE resulted in increased access to education enabling every pupil to enroll in primary school. Before the launching of the UPE programme there has, since independence in October 1962, generally been a gradual increase every year in enrolment in primary schools. However, there was a dramatic increase from 1996 when the enrolment was 3,068,625 to the year when UPE started, 1997, when enrolment was 5,303,564, an increase of 58 percent.Therefore, as could be expected, the figures for Gross Enrolment Rates (GER) were equally dramatic when they jumped from 77 percent in 1996 to 137percent in 1997 and the figures for Net Enrolment Rate (NER) went up from 57 percent in 1996 to 85 percent in 1997. By 2016, enrolment stood at 8,655,924 with 49.6 percent male and 50.4 percent female (Figure 4.1).
Figure 4.1: Growth in Primary School Enrollment by Gender, 1963-2014
Source: MoES (2009) and MoES (2014a).
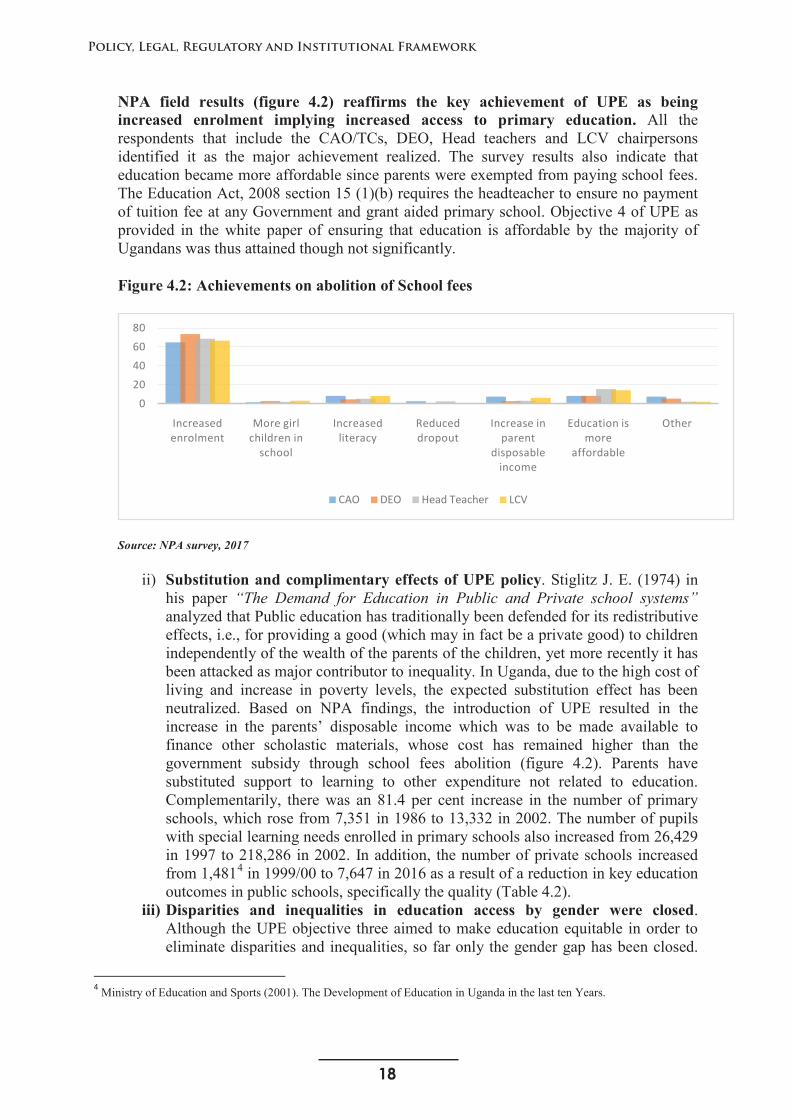
18
Policy, Legal, Regulatory and Institutional Framework
17
NPA field results (figure 4.2) reaffirms the key achievement of UPE as beingincreased enrolment implying increased access to primary education. All the respondents that include the CAO/TCs, DEO, Head teachers and LCV chairpersons identified it as the major achievement realized. The survey results also indicate that education became more affordable since parents were exempted from paying school fees. The Education Act, 2008 section 15 (1)(b) requires the headteacher to ensure no payment of tuition fee at any Government and grant aided primary school. Objective 4 of UPE as provided in the white paper of ensuring that education is affordable by the majority of Ugandans was thus attained though not significantly.
Figure 4.2: Achievements on abolition of School fees
Source: NPA survey, 2017
ii) Substitution and complimentary effects of UPE policy. Stiglitz J. E. (1974) in his paper “The Demand for Education in Public and Private school systems”analyzed that Public education has traditionally been defended for its redistributive effects, i.e., for providing a good (which may in fact be a private good) to children independently of the wealth of the parents of the children, yet more recently it has been attacked as major contributor to inequality. In Uganda, due to the high cost of living and increase in poverty levels, the expected substitution effect has been neutralized. Based on NPA findings, the introduction of UPE resulted in the increase in the parents’ disposable income which was to be made available to finance other scholastic materials, whose cost has remained higher than the government subsidy through school fees abolition (figure 4.2). Parents have substituted support to learning to other expenditure not related to education. Complementarily, there was an 81.4 per cent increase in the number of primary schools, which rose from 7,351 in 1986 to 13,332 in 2002. The number of pupils with special learning needs enrolled in primary schools also increased from 26,429in 1997 to 218,286 in 2002. In addition, the number of private schools increased from 1,4814 in 1999/00 to 7,647 in 2016 as a result of a reduction in key education outcomes in public schools, specifically the quality (Table 4.2).
iii) Disparities and inequalities in education access by gender were closed.Although the UPE objective three aimed to make education equitable in order to eliminate disparities and inequalities, so far only the gender gap has been closed.
4 Ministry of Education and Sports (2001). The Development of Education in Uganda in the last ten Years.
0
20
40
60
80
Increased enrolment
More girl children in
school
Increased literacy
Reduced dropout
Increase in parent
disposable income
Education is more
affordable
Other
CAO DEO Head Teacher LCV
19
NATIONAL PLANNING AUTHORITY
17
NPA field results (figure 4.2) reaffirms the key achievement of UPE as beingincreased enrolment implying increased access to primary education. All the respondents that include the CAO/TCs, DEO, Head teachers and LCV chairpersons identified it as the major achievement realized. The survey results also indicate that education became more affordable since parents were exempted from paying school fees. The Education Act, 2008 section 15 (1)(b) requires the headteacher to ensure no payment of tuition fee at any Government and grant aided primary school. Objective 4 of UPE as provided in the white paper of ensuring that education is affordable by the majority of Ugandans was thus attained though not significantly.
Figure 4.2: Achievements on abolition of School fees
Source: NPA survey, 2017
ii) Substitution and complimentary effects of UPE policy. Stiglitz J. E. (1974) in his paper “The Demand for Education in Public and Private school systems”analyzed that Public education has traditionally been defended for its redistributive effects, i.e., for providing a good (which may in fact be a private good) to children independently of the wealth of the parents of the children, yet more recently it has been attacked as major contributor to inequality. In Uganda, due to the high cost of living and increase in poverty levels, the expected substitution effect has been neutralized. Based on NPA findings, the introduction of UPE resulted in the increase in the parents’ disposable income which was to be made available to finance other scholastic materials, whose cost has remained higher than the government subsidy through school fees abolition (figure 4.2). Parents have substituted support to learning to other expenditure not related to education. Complementarily, there was an 81.4 per cent increase in the number of primary schools, which rose from 7,351 in 1986 to 13,332 in 2002. The number of pupils with special learning needs enrolled in primary schools also increased from 26,429in 1997 to 218,286 in 2002. In addition, the number of private schools increased from 1,4814 in 1999/00 to 7,647 in 2016 as a result of a reduction in key education outcomes in public schools, specifically the quality (Table 4.2).
iii) Disparities and inequalities in education access by gender were closed.Although the UPE objective three aimed to make education equitable in order to eliminate disparities and inequalities, so far only the gender gap has been closed.
4 Ministry of Education and Sports (2001). The Development of Education in Uganda in the last ten Years.
0
20
40
60
80
Increased enrolment
More girl children in
school
Increased literacy
Reduced dropout
Increase in parent
disposable income
Education is more
affordable
Other
CAO DEO Head Teacher LCV
18
Figure 4.1 indicates that the gender gap in enrollment disappeared in the late 2000s. Table 4.3 further illustrates that there were more female pupils (50.4%) in 2016 than males. Female enrolment has seen a gradual improvement over the years, from 39 percent in 1970 to the 47 percent in 1999 and 50.4 percent in 2016. The enrolment of UPE was carried out with a request for parents to include girls, disabled and orphans among the four children per family they registered. In 1997, it is estimated that about 3 percent of the pupils enrolled were disabled. The NPA field findings (figure 4.2) further revealed that there are more girl children in school following the introduction of UPE.
Table 4.3: Primary level enrolment (2007-2016)
Sex 1997 2007 2009 2011 2013 2015 2016Male 3,779,338 4,150,037 4,039,734 4,219,523 4,122,663 4,294,473Female 3,758,633 4,147,743 4,058,443 4,240,197 4,141,654 4,361,451Total 5,149,896 7,537,971 8,297,780 8,098,177 8,459,720 8,264,317 8,655,924
Source: Education and Sports Sector Strategic Plan, 2017/18 - 2019/20
iv) Improvement in Literacy Levels. Although literacy levels increased from 49.6 percent in 2007 to 51.9 percent in 2015 (Education and Sports Sector Strategic Plan, 2017/18-2019/20), this is negligible and should be worrying to government and the parents. In a similar, the NPA field findings picked it as one of the achievements, the results are far from the targets. In addition to the PEAP objectives, government committed itself to achieving MDG goal number two of Universal Primary Education on literacy. UPE had an improved literacy rate for 10 years and above. Table 4.4 indicates that the literacy rates for 10 years and abovehave slowly progressed. This could be attributed to the increased GERs where all categories of people including the old age and disabled were able to access school.
Table 4.4: Literacy rates for 10 years and above
1997 1999/00 2005/06 2012/13 2016/17Male Female Total Male Female Total Male Female Total Male Female Total Male Female Total
Total 74 57 65 74 57 65 76 63 69 77 65 71 77.5 69.9 73.5Urban 89 79 83 92 82 86 89 83 86 88 81 85 89 84.6 86.6Rural 70 49 59 72 54 62 74 58 66 74 59 66 73.6 64.4 68.8
Source: Uganda National Household Census Reports (various)
(b) Challenges on abolition of fees
i) The key assumption that abolition of fees would be followed by a complementing effect has not been realized. In fact, parents have substituted supplementing education with other expenses. According to the study, the abolition of fees has brought about many challenges most notably; parents have neglected their roles in the education process and left the burden to Government. Section 15 (1)(b) of Education Act, 2008 is always mis quoted by parents and use it for not getting engaged in school activities. The section requires the headteacher to ensure no payment of tuition fee at any Government and grant aided primary school.
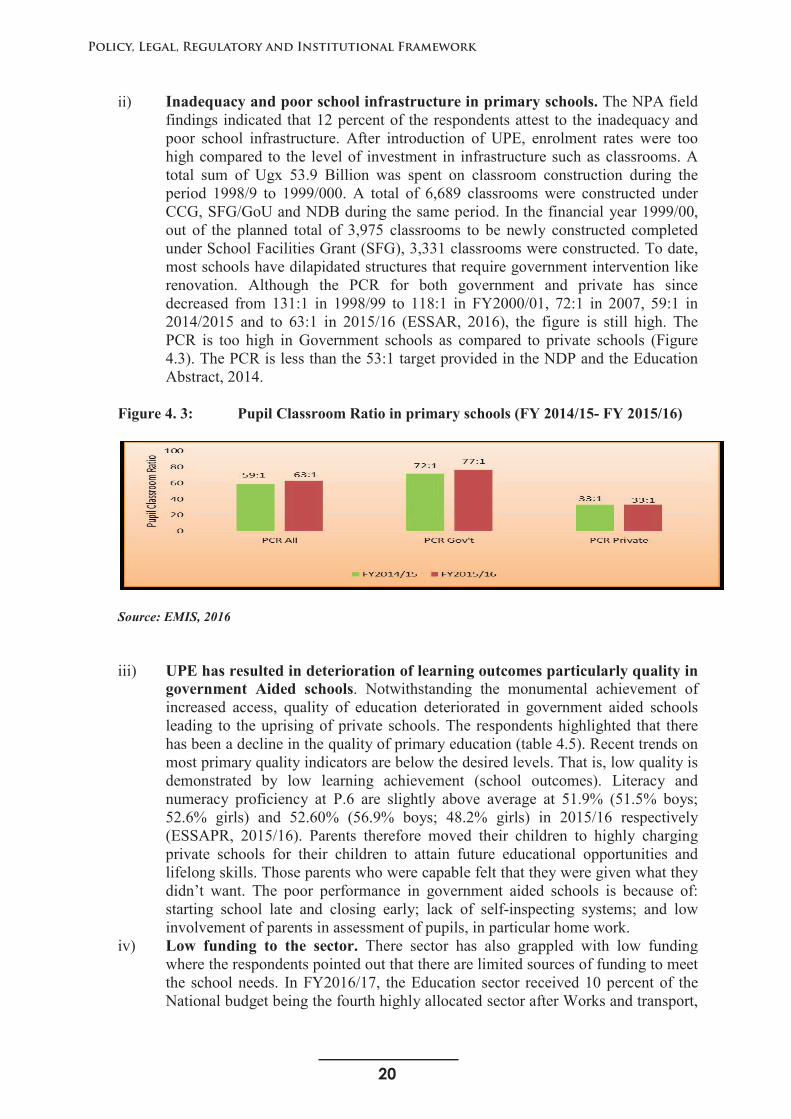
20
Policy, Legal, Regulatory and Institutional Framework
19
ii) Inadequacy and poor school infrastructure in primary schools. The NPA field findings indicated that 12 percent of the respondents attest to the inadequacy and poor school infrastructure. After introduction of UPE, enrolment rates were too high compared to the level of investment in infrastructure such as classrooms. Atotal sum of Ugx 53.9 Billion was spent on classroom construction during the period 1998/9 to 1999/000. A total of 6,689 classrooms were constructed under CCG, SFG/GoU and NDB during the same period. In the financial year 1999/00, out of the planned total of 3,975 classrooms to be newly constructed completed under School Facilities Grant (SFG), 3,331 classrooms were constructed. To date, most schools have dilapidated structures that require government intervention like renovation. Although the PCR for both government and private has sincedecreased from 131:1 in 1998/99 to 118:1 in FY2000/01, 72:1 in 2007, 59:1 in 2014/2015 and to 63:1 in 2015/16 (ESSAR, 2016), the figure is still high. The PCR is too high in Government schools as compared to private schools (Figure 4.3). The PCR is less than the 53:1 target provided in the NDP and the Education Abstract, 2014.
Figure 4. 3: Pupil Classroom Ratio in primary schools (FY 2014/15- FY 2015/16)
Source: EMIS, 2016
iii) UPE has resulted in deterioration of learning outcomes particularly quality in government Aided schools. Notwithstanding the monumental achievement of increased access, quality of education deteriorated in government aided schools leading to the uprising of private schools. The respondents highlighted that there has been a decline in the quality of primary education (table 4.5). Recent trends on most primary quality indicators are below the desired levels. That is, low quality is demonstrated by low learning achievement (school outcomes). Literacy and numeracy proficiency at P.6 are slightly above average at 51.9% (51.5% boys; 52.6% girls) and 52.60% (56.9% boys; 48.2% girls) in 2015/16 respectively (ESSAPR, 2015/16). Parents therefore moved their children to highly charging private schools for their children to attain future educational opportunities and lifelong skills. Those parents who were capable felt that they were given what they didn’t want. The poor performance in government aided schools is because of: starting school late and closing early; lack of self-inspecting systems; and low involvement of parents in assessment of pupils, in particular home work.
iv) Low funding to the sector. There sector has also grappled with low funding where the respondents pointed out that there are limited sources of funding to meet the school needs. In FY2016/17, the Education sector received 10 percent of the National budget being the fourth highly allocated sector after Works and transport,
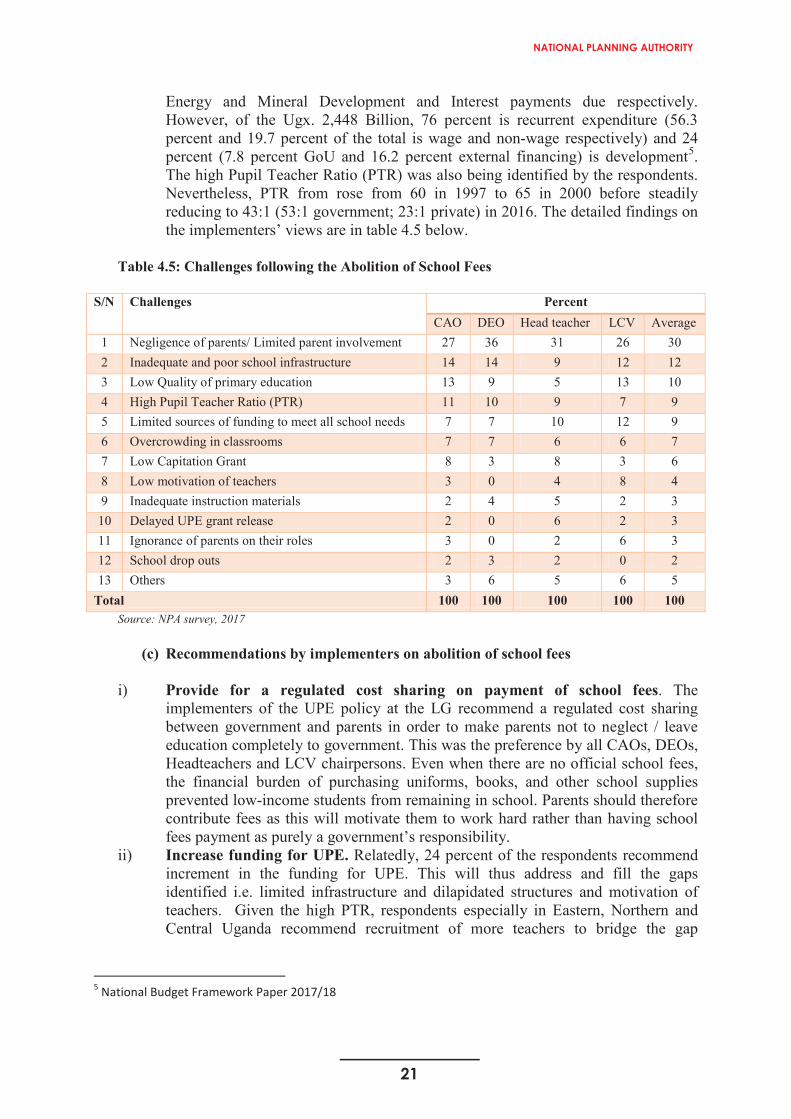
21
NATIONAL PLANNING AUTHORITY
19
ii) Inadequacy and poor school infrastructure in primary schools. The NPA field findings indicated that 12 percent of the respondents attest to the inadequacy and poor school infrastructure. After introduction of UPE, enrolment rates were too high compared to the level of investment in infrastructure such as classrooms. Atotal sum of Ugx 53.9 Billion was spent on classroom construction during the period 1998/9 to 1999/000. A total of 6,689 classrooms were constructed under CCG, SFG/GoU and NDB during the same period. In the financial year 1999/00, out of the planned total of 3,975 classrooms to be newly constructed completed under School Facilities Grant (SFG), 3,331 classrooms were constructed. To date, most schools have dilapidated structures that require government intervention like renovation. Although the PCR for both government and private has sincedecreased from 131:1 in 1998/99 to 118:1 in FY2000/01, 72:1 in 2007, 59:1 in 2014/2015 and to 63:1 in 2015/16 (ESSAR, 2016), the figure is still high. The PCR is too high in Government schools as compared to private schools (Figure 4.3). The PCR is less than the 53:1 target provided in the NDP and the Education Abstract, 2014.
Figure 4. 3: Pupil Classroom Ratio in primary schools (FY 2014/15- FY 2015/16)
Source: EMIS, 2016
iii) UPE has resulted in deterioration of learning outcomes particularly quality in government Aided schools. Notwithstanding the monumental achievement of increased access, quality of education deteriorated in government aided schools leading to the uprising of private schools. The respondents highlighted that there has been a decline in the quality of primary education (table 4.5). Recent trends on most primary quality indicators are below the desired levels. That is, low quality is demonstrated by low learning achievement (school outcomes). Literacy and numeracy proficiency at P.6 are slightly above average at 51.9% (51.5% boys; 52.6% girls) and 52.60% (56.9% boys; 48.2% girls) in 2015/16 respectively (ESSAPR, 2015/16). Parents therefore moved their children to highly charging private schools for their children to attain future educational opportunities and lifelong skills. Those parents who were capable felt that they were given what they didn’t want. The poor performance in government aided schools is because of: starting school late and closing early; lack of self-inspecting systems; and low involvement of parents in assessment of pupils, in particular home work.
iv) Low funding to the sector. There sector has also grappled with low funding where the respondents pointed out that there are limited sources of funding to meet the school needs. In FY2016/17, the Education sector received 10 percent of the National budget being the fourth highly allocated sector after Works and transport,
20
Energy and Mineral Development and Interest payments due respectively. However, of the Ugx. 2,448 Billion, 76 percent is recurrent expenditure (56.3 percent and 19.7 percent of the total is wage and non-wage respectively) and 24 percent (7.8 percent GoU and 16.2 percent external financing) is development5.The high Pupil Teacher Ratio (PTR) was also being identified by the respondents. Nevertheless, PTR from rose from 60 in 1997 to 65 in 2000 before steadily reducing to 43:1 (53:1 government; 23:1 private) in 2016. The detailed findings on the implementers’ views are in table 4.5 below.
Table 4.5: Challenges following the Abolition of School Fees
S/N Challenges PercentCAO DEO Head teacher LCV Average
1 Negligence of parents/ Limited parent involvement 27 36 31 26 302 Inadequate and poor school infrastructure 14 14 9 12 123 Low Quality of primary education 13 9 5 13 104 High Pupil Teacher Ratio (PTR) 11 10 9 7 95 Limited sources of funding to meet all school needs 7 7 10 12 96 Overcrowding in classrooms 7 7 6 6 77 Low Capitation Grant 8 3 8 3 68 Low motivation of teachers 3 0 4 8 49 Inadequate instruction materials 2 4 5 2 310 Delayed UPE grant release 2 0 6 2 311 Ignorance of parents on their roles 3 0 2 6 312 School drop outs 2 3 2 0 213 Others 3 6 5 6 5
Total 100 100 100 100 100Source: NPA survey, 2017
(c) Recommendations by implementers on abolition of school fees
i) Provide for a regulated cost sharing on payment of school fees. The implementers of the UPE policy at the LG recommend a regulated cost sharing between government and parents in order to make parents not to neglect / leave education completely to government. This was the preference by all CAOs, DEOs, Headteachers and LCV chairpersons. Even when there are no official school fees, the financial burden of purchasing uniforms, books, and other school supplies prevented low-income students from remaining in school. Parents should therefore contribute fees as this will motivate them to work hard rather than having school fees payment as purely a government’s responsibility.
ii) Increase funding for UPE. Relatedly, 24 percent of the respondents recommend increment in the funding for UPE. This will thus address and fill the gaps identified i.e. limited infrastructure and dilapidated structures and motivation of teachers. Given the high PTR, respondents especially in Eastern, Northern and Central Uganda recommend recruitment of more teachers to bridge the gap
5 National Budget Framework Paper 2017/18

22
Policy, Legal, Regulatory and Institutional Framework
21
brought about by high enrolment rates. Finally, the Local Revenue collected is not decentralized / shared with schools as it is only used at the district.
iii) Enroll children at the right age and ensure that they do not leave school without completing the full cycle of primary education. Only when every child is enrolled at the right age and does not leave school without completing the full cycle of primary education would it be possible to ensure that all the citizens have the basic education needed for living a full life. It would also help in achieving transformation of the society leading to greater unity among the people, higher moral standards and an accelerated growth of the economy.
iv) Sensitize parents and the community on their roles. Parents and the community do not understand their roles and responsibilities and to that effect, 20 percent think sensitization of the parents and community on their roles might help to increase support to UPE from parents. The results of the survey conducted on LG UPE administrators by NPA on abolition of school fees are illustrated in figure 4.4.
Figure 4.4: Recommendations following abolition of school fees
Source: NPA survey, 2017
4.2.1.2 Automatic Promotion Policy
Key policy findings
i) The automatic promotion policy is nowhere in writing / not documented.
ii) Automatic Promotion policy has been successful in promoting proper progression,reduced dropout rate, increased access to education and hence contributed to the national average of years in school.
iii) The Policy is compromising the quality of education; increasing laxity of pupils and parents; and contributing to high failure rates at completion. The policy assumes existence of an ideal environment in Uganda which ensures minimum proficiency which is not the case. The country has high PCR and PTR(which sometimes exceed 1:100 in lower primary) that limit class interaction of teachers with pupils.
34%
20%7%
20% 19%
33%25%
9%20%
13%
29% 27%
11%21%
12%
37%
23%
5%20%
16%
33%
24%
8%20%
15%0%5%
10%15%20%25%30%35%40%
Regulated cost sharing
Increase UPE funding
Recruit more teachers
Sensitize parents and community on
their roles
Others
PERC
ENTA
GE
RECOMMENDATIONS
CAO DEO Headteacher LCV Average
23
NATIONAL PLANNING AUTHORITY
21
brought about by high enrolment rates. Finally, the Local Revenue collected is not decentralized / shared with schools as it is only used at the district.
iii) Enroll children at the right age and ensure that they do not leave school without completing the full cycle of primary education. Only when every child is enrolled at the right age and does not leave school without completing the full cycle of primary education would it be possible to ensure that all the citizens have the basic education needed for living a full life. It would also help in achieving transformation of the society leading to greater unity among the people, higher moral standards and an accelerated growth of the economy.
iv) Sensitize parents and the community on their roles. Parents and the community do not understand their roles and responsibilities and to that effect, 20 percent think sensitization of the parents and community on their roles might help to increase support to UPE from parents. The results of the survey conducted on LG UPE administrators by NPA on abolition of school fees are illustrated in figure 4.4.
Figure 4.4: Recommendations following abolition of school fees
Source: NPA survey, 2017
4.2.1.2 Automatic Promotion Policy
Key policy findings
i) The automatic promotion policy is nowhere in writing / not documented.
ii) Automatic Promotion policy has been successful in promoting proper progression,reduced dropout rate, increased access to education and hence contributed to the national average of years in school.
iii) The Policy is compromising the quality of education; increasing laxity of pupils and parents; and contributing to high failure rates at completion. The policy assumes existence of an ideal environment in Uganda which ensures minimum proficiency which is not the case. The country has high PCR and PTR(which sometimes exceed 1:100 in lower primary) that limit class interaction of teachers with pupils.
34%
20%7%
20% 19%
33%25%
9%20%
13%
29% 27%
11%21%
12%
37%
23%
5%20%
16%
33%
24%
8%20%
15%0%5%
10%15%20%25%30%35%40%
Regulated cost sharing
Increase UPE funding
Recruit more teachers
Sensitize parents and community on
their roles
Others
PERC
ENTA
GE
RECOMMENDATIONS
CAO DEO Headteacher LCV Average
22
iv) Need to address the key drivers leading to inefficiencies; in form of grade repetition, reducing school dropout, improving pedagogical duration and efficacy, thus improving learning outcomes.
v) Provide unique numbers to all pupils inform of National IDs to help track the movement of pupils from one school to another. Digitalization means that the pupils have unique identifiers making it easy to locate them to be able to compute accurate drop outs.
vi) Promotion should be based on assessment and therefore government needs to abolish the policy to allow repeating for the weak pupils.
Uganda adopted and implemented the automatic promotion policy in 2005, as astrategy aimed at enhancing the internal efficiency and quality of primary education.Implying that it was and is still targeted at eliminating if not reducing grade repetition, reducing school dropout, improving pedagogical duration and efficacy, hence improving learning outcomes (Ndaruhutse, 2008). The policy assumed that all resources would fully be available and utilized while children attain the minimum scores to progress. Since education is a public service, provided under a cost-sharing arrangement, involving the government and households, with governments covering tuition for all the students’ enrolled, instructional materials, teachers’ salaries, and households covering costs associated with school uniform, books, and pens, a high student dropout rate is a strong indicator of internal inefficiencies and wastage of resource.
Automatic Policy was implemented as part of broader national education strategy aimed at enhancing internal efficiency under basic education. This is because by 2004 grade retention and dropout were recorded at approximately 35% and 21% respectively (Okurut, 2015). Moreover, there were differences in inefficiency levels, along school location (rural or urban) and gender. In particular, repetition and dropout rates were higher among schools in rural areas and female students. There is evidence, however, of a significant drop-out rate of pupils from the primary education cycle. Although it is difficult to estimate completion rates precisely, of the 2,159,850 pupils that were enrolled in primary school level one in 1997 at the time UPE was introduced, only 485,703 (23%) reached primary seven in 2003. For 1000 students entering the first year of primary school in 2014, 32.6 percent are expected to complete the cycle. According to EMIS database (2010), the dropout rate in 2004 was approximately 21%, which by gender component was about 22% female and 20% male. By school location it was around 28% and 13% for students in rural and urban schools respectively. The above differences in dropout rates have been acknowledged and highlighted by Tamusuza (2011); and Okumu & Nakajjo (2008). As expected, most of the losses in efficiency come from drop-outs at 90 percent as opposed to repetition at 10 percent. Overall, as a result of inefficiencies, it took 7.4 years to produce a primary school completer in 2014. The evaluation highlights the main reason for children not completing primary level are: (i) education is expensive; (ii) marriages/pregnancies; (iii) loss of a parent(s); and, (iv) menstruation related challenges.
i) Lack of an effective system to track the movement of students in and out of an education system has led to inaccurate identification and calculation of student dropout rates. Moreover, the absence of an effective system to help governments and other education stakeholders track the movement of students in and out of an education system has led to inaccurate identification and calculation
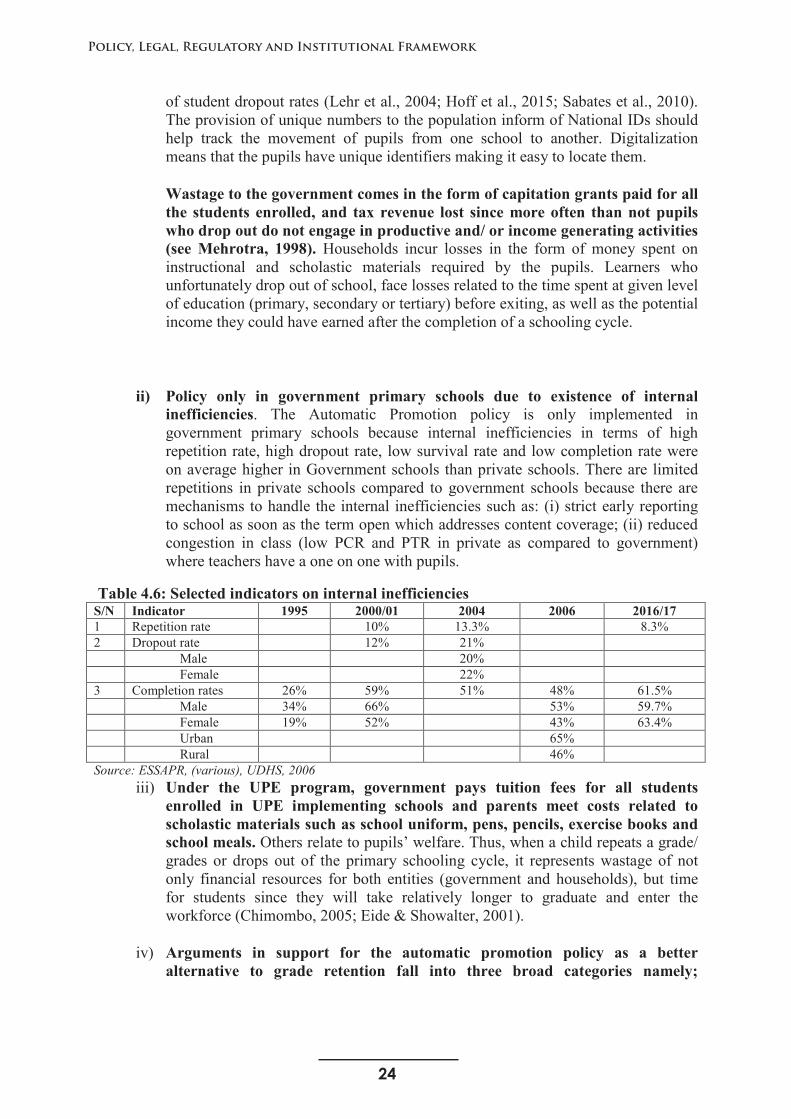
24
Policy, Legal, Regulatory and Institutional Framework
23
of student dropout rates (Lehr et al., 2004; Hoff et al., 2015; Sabates et al., 2010).The provision of unique numbers to the population inform of National IDs should help track the movement of pupils from one school to another. Digitalization means that the pupils have unique identifiers making it easy to locate them.
Wastage to the government comes in the form of capitation grants paid for all the students enrolled, and tax revenue lost since more often than not pupilswho drop out do not engage in productive and/ or income generating activities (see Mehrotra, 1998). Households incur losses in the form of money spent on instructional and scholastic materials required by the pupils. Learners who unfortunately drop out of school, face losses related to the time spent at given level of education (primary, secondary or tertiary) before exiting, as well as the potential income they could have earned after the completion of a schooling cycle.
ii) Policy only in government primary schools due to existence of internal inefficiencies. The Automatic Promotion policy is only implemented in government primary schools because internal inefficiencies in terms of high repetition rate, high dropout rate, low survival rate and low completion rate were on average higher in Government schools than private schools. There are limited repetitions in private schools compared to government schools because there are mechanisms to handle the internal inefficiencies such as: (i) strict early reporting to school as soon as the term open which addresses content coverage; (ii) reduced congestion in class (low PCR and PTR in private as compared to government) where teachers have a one on one with pupils.
Table 4.6: Selected indicators on internal inefficiencies S/N Indicator 1995 2000/01 2004 2006 2016/17 1 Repetition rate 10% 13.3% 8.3%2 Dropout rate 12% 21%
Male 20%Female 22%
3 Completion rates 26% 59% 51% 48% 61.5%Male 34% 66% 53% 59.7%Female 19% 52% 43% 63.4%Urban 65%Rural 46%
Source: ESSAPR, (various), UDHS, 2006iii) Under the UPE program, government pays tuition fees for all students
enrolled in UPE implementing schools and parents meet costs related to scholastic materials such as school uniform, pens, pencils, exercise books and school meals. Others relate to pupils’ welfare. Thus, when a child repeats a grade/ grades or drops out of the primary schooling cycle, it represents wastage of not only financial resources for both entities (government and households), but time for students since they will take relatively longer to graduate and enter the workforce (Chimombo, 2005; Eide & Showalter, 2001).
iv) Arguments in support for the automatic promotion policy as a better alternative to grade retention fall into three broad categories namely;
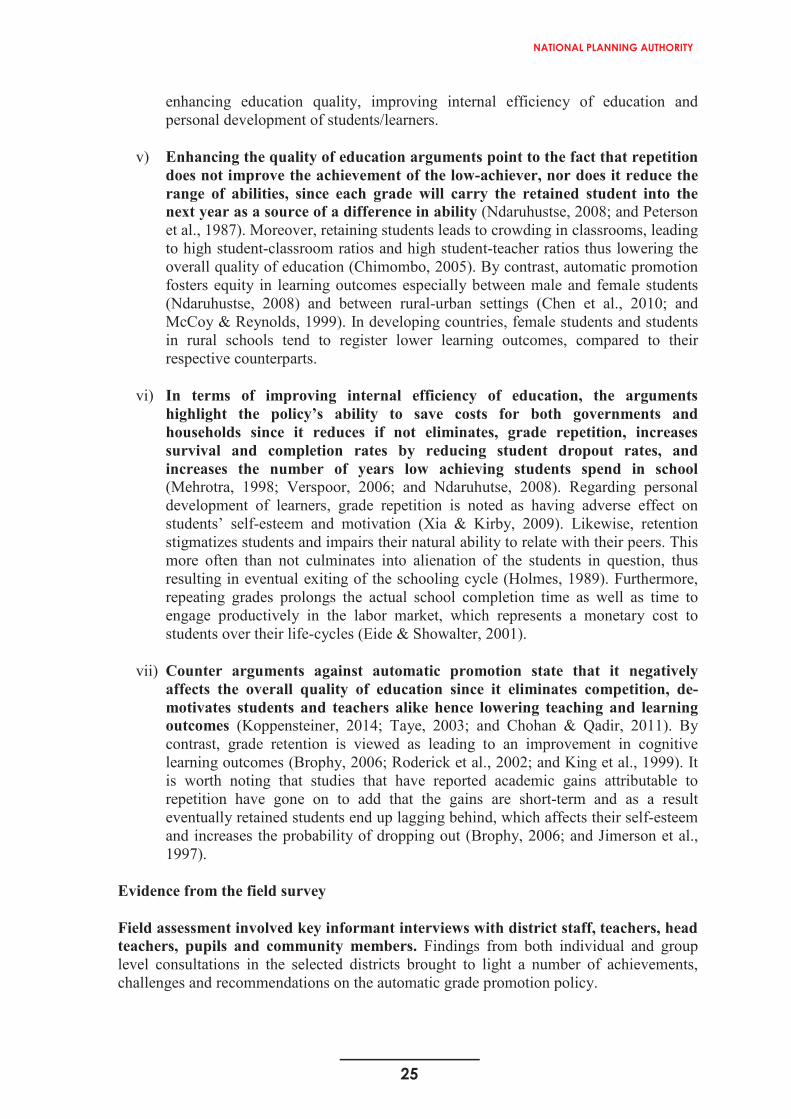
25
NATIONAL PLANNING AUTHORITY
23
of student dropout rates (Lehr et al., 2004; Hoff et al., 2015; Sabates et al., 2010).The provision of unique numbers to the population inform of National IDs should help track the movement of pupils from one school to another. Digitalization means that the pupils have unique identifiers making it easy to locate them.
Wastage to the government comes in the form of capitation grants paid for all the students enrolled, and tax revenue lost since more often than not pupilswho drop out do not engage in productive and/ or income generating activities (see Mehrotra, 1998). Households incur losses in the form of money spent on instructional and scholastic materials required by the pupils. Learners who unfortunately drop out of school, face losses related to the time spent at given level of education (primary, secondary or tertiary) before exiting, as well as the potential income they could have earned after the completion of a schooling cycle.
ii) Policy only in government primary schools due to existence of internal inefficiencies. The Automatic Promotion policy is only implemented in government primary schools because internal inefficiencies in terms of high repetition rate, high dropout rate, low survival rate and low completion rate were on average higher in Government schools than private schools. There are limited repetitions in private schools compared to government schools because there are mechanisms to handle the internal inefficiencies such as: (i) strict early reporting to school as soon as the term open which addresses content coverage; (ii) reduced congestion in class (low PCR and PTR in private as compared to government) where teachers have a one on one with pupils.
Table 4.6: Selected indicators on internal inefficiencies S/N Indicator 1995 2000/01 2004 2006 2016/17 1 Repetition rate 10% 13.3% 8.3%2 Dropout rate 12% 21%
Male 20%Female 22%
3 Completion rates 26% 59% 51% 48% 61.5%Male 34% 66% 53% 59.7%Female 19% 52% 43% 63.4%Urban 65%Rural 46%
Source: ESSAPR, (various), UDHS, 2006iii) Under the UPE program, government pays tuition fees for all students
enrolled in UPE implementing schools and parents meet costs related to scholastic materials such as school uniform, pens, pencils, exercise books and school meals. Others relate to pupils’ welfare. Thus, when a child repeats a grade/ grades or drops out of the primary schooling cycle, it represents wastage of not only financial resources for both entities (government and households), but time for students since they will take relatively longer to graduate and enter the workforce (Chimombo, 2005; Eide & Showalter, 2001).
iv) Arguments in support for the automatic promotion policy as a better alternative to grade retention fall into three broad categories namely;
24
enhancing education quality, improving internal efficiency of education and personal development of students/learners.
v) Enhancing the quality of education arguments point to the fact that repetition does not improve the achievement of the low-achiever, nor does it reduce the range of abilities, since each grade will carry the retained student into the next year as a source of a difference in ability (Ndaruhustse, 2008; and Peterson et al., 1987). Moreover, retaining students leads to crowding in classrooms, leading to high student-classroom ratios and high student-teacher ratios thus lowering the overall quality of education (Chimombo, 2005). By contrast, automatic promotion fosters equity in learning outcomes especially between male and female students (Ndaruhustse, 2008) and between rural-urban settings (Chen et al., 2010; and McCoy & Reynolds, 1999). In developing countries, female students and students in rural schools tend to register lower learning outcomes, compared to their respective counterparts.
vi) In terms of improving internal efficiency of education, the arguments highlight the policy’s ability to save costs for both governments and households since it reduces if not eliminates, grade repetition, increases survival and completion rates by reducing student dropout rates, and increases the number of years low achieving students spend in school(Mehrotra, 1998; Verspoor, 2006; and Ndaruhutse, 2008). Regarding personal development of learners, grade repetition is noted as having adverse effect on students’ self-esteem and motivation (Xia & Kirby, 2009). Likewise, retention stigmatizes students and impairs their natural ability to relate with their peers. This more often than not culminates into alienation of the students in question, thus resulting in eventual exiting of the schooling cycle (Holmes, 1989). Furthermore, repeating grades prolongs the actual school completion time as well as time to engage productively in the labor market, which represents a monetary cost to students over their life-cycles (Eide & Showalter, 2001).
vii) Counter arguments against automatic promotion state that it negatively affects the overall quality of education since it eliminates competition, de-motivates students and teachers alike hence lowering teaching and learning outcomes (Koppensteiner, 2014; Taye, 2003; and Chohan & Qadir, 2011). By contrast, grade retention is viewed as leading to an improvement in cognitive learning outcomes (Brophy, 2006; Roderick et al., 2002; and King et al., 1999). It is worth noting that studies that have reported academic gains attributable to repetition have gone on to add that the gains are short-term and as a result eventually retained students end up lagging behind, which affects their self-esteem and increases the probability of dropping out (Brophy, 2006; and Jimerson et al., 1997).
Evidence from the field survey
Field assessment involved key informant interviews with district staff, teachers, head teachers, pupils and community members. Findings from both individual and group level consultations in the selected districts brought to light a number of achievements, challenges and recommendations on the automatic grade promotion policy.

26
Policy, Legal, Regulatory and Institutional Framework
25
(a) Achievements
The Automatic Grade Promotion policy was aimed at enhancing learning out comes.Figure 4.5 provides an overview of NPA findings on achievements of the policy: 34.1% of respondents appreciated the fact that the automatic promotion has improved progression and number of years of schooling, that is children are able to progress to higher levels. The policy has enabled every pupil to progress to next levels, reduced dropout rate, increased access to education and motivated pupils to learn more. This therefore partly points to the achievement of the objectives of reducing on the high repetition rates and dropout rates. Repetition reduced by 31 percent from 988,933 in 2005 to 682,943 in 2016. The primary seven completion rate improved from 52 percent in 2009 to 72 percent in 2014/15 before declining to 61.5 percent in 2016/17. The statistics are staggeringly below the East African and lower middle-income countries. Although children are able to progress to higher levels, the policy has negatively affected the overall quality of education since it eliminates competition, de-motivates students and teachers alike, hence lowering teaching and learning outcomes.
Others include; increased efficiency in government spending; and reduced congestion in class. The policy also reduced financial wastage which would arise from repeaters thus accommodating more numbers of learners from incoming cohorts with the available resource.
Figure 4. 5: Achievements arising from Automatic Grade promotion policy implementation
Source: NPA survey, 2017
b) Challenges
The achievements of automatic grade promotion, notwithstanding, system is believed to be compromising the quality of education. The Automatic Promotion policy assumes an ideal environment which ensures minimum proficiency which is not the case in Uganda. It is therefore compromising the quality of education; increasing laxity of pupils and parents; and contributing to high failure rates at completion. According to the NPA survey, automatic promotion is not consistent with quality requirements. This was highlighted by a majority of implementers/ head teachers who sighted the issue of
11%
30% 28%21%
11%20%
25%
37%
14%
3%10%
30%40%
15%5%
9%
28% 31%25%
6%
0%10%20%30%40%50%
Many children are motivated to learn
Reduced dropout rate
More pupils are able to progress to
higher levels
Increased access to education
Other
PER
CEN
T
ACHIEVEMENTS
CAO H/T DEO LCV
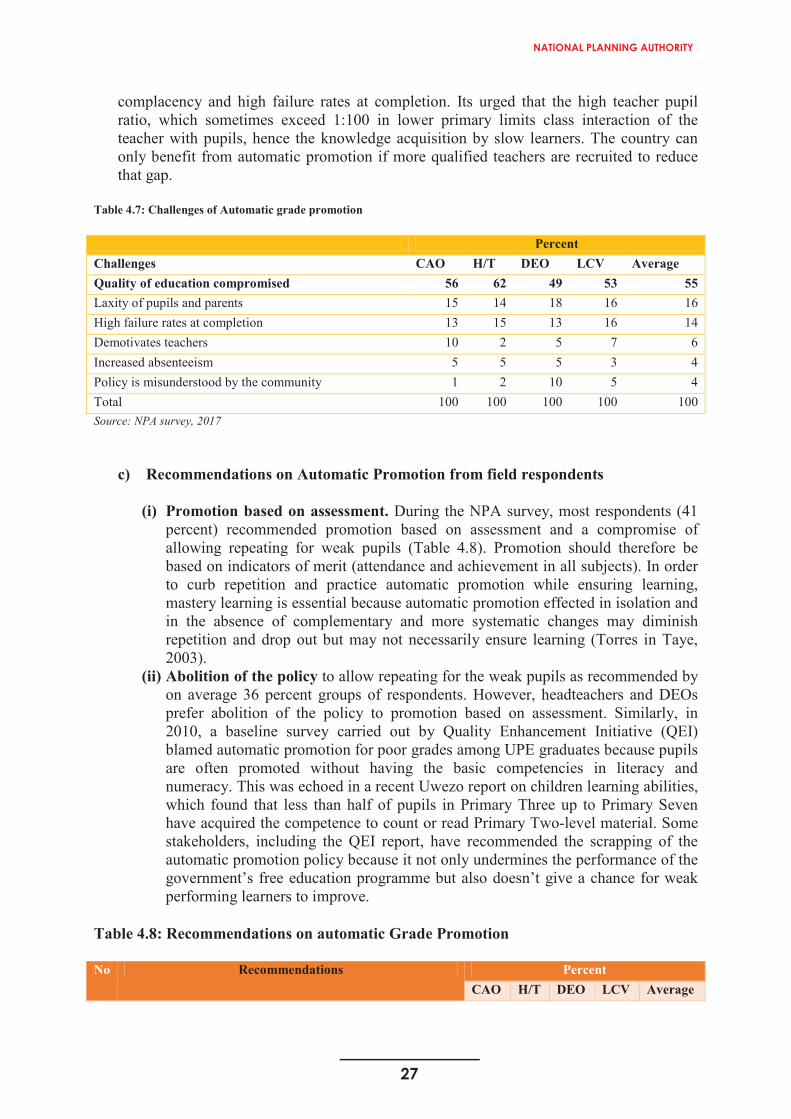
27
NATIONAL PLANNING AUTHORITY
25
(a) Achievements
The Automatic Grade Promotion policy was aimed at enhancing learning out comes.Figure 4.5 provides an overview of NPA findings on achievements of the policy: 34.1% of respondents appreciated the fact that the automatic promotion has improved progression and number of years of schooling, that is children are able to progress to higher levels. The policy has enabled every pupil to progress to next levels, reduced dropout rate, increased access to education and motivated pupils to learn more. This therefore partly points to the achievement of the objectives of reducing on the high repetition rates and dropout rates. Repetition reduced by 31 percent from 988,933 in 2005 to 682,943 in 2016. The primary seven completion rate improved from 52 percent in 2009 to 72 percent in 2014/15 before declining to 61.5 percent in 2016/17. The statistics are staggeringly below the East African and lower middle-income countries. Although children are able to progress to higher levels, the policy has negatively affected the overall quality of education since it eliminates competition, de-motivates students and teachers alike, hence lowering teaching and learning outcomes.
Others include; increased efficiency in government spending; and reduced congestion in class. The policy also reduced financial wastage which would arise from repeaters thus accommodating more numbers of learners from incoming cohorts with the available resource.
Figure 4. 5: Achievements arising from Automatic Grade promotion policy implementation
Source: NPA survey, 2017
b) Challenges
The achievements of automatic grade promotion, notwithstanding, system is believed to be compromising the quality of education. The Automatic Promotion policy assumes an ideal environment which ensures minimum proficiency which is not the case in Uganda. It is therefore compromising the quality of education; increasing laxity of pupils and parents; and contributing to high failure rates at completion. According to the NPA survey, automatic promotion is not consistent with quality requirements. This was highlighted by a majority of implementers/ head teachers who sighted the issue of
11%
30% 28%21%
11%20%
25%
37%
14%
3%10%
30%40%
15%5%
9%
28% 31%25%
6%
0%10%20%30%40%50%
Many children are motivated to learn
Reduced dropout rate
More pupils are able to progress to
higher levels
Increased access to education
Other
PER
CEN
T
ACHIEVEMENTS
CAO H/T DEO LCV
26
complacency and high failure rates at completion. Its urged that the high teacher pupil ratio, which sometimes exceed 1:100 in lower primary limits class interaction of the teacher with pupils, hence the knowledge acquisition by slow learners. The country can only benefit from automatic promotion if more qualified teachers are recruited to reduce that gap.
Table 4.7: Challenges of Automatic grade promotion
PercentChallenges CAO H/T DEO LCV AverageQuality of education compromised 56 62 49 53 55Laxity of pupils and parents 15 14 18 16 16High failure rates at completion 13 15 13 16 14Demotivates teachers 10 2 5 7 6Increased absenteeism 5 5 5 3 4Policy is misunderstood by the community 1 2 10 5 4Total 100 100 100 100 100Source: NPA survey, 2017
c) Recommendations on Automatic Promotion from field respondents
(i) Promotion based on assessment. During the NPA survey, most respondents (41 percent) recommended promotion based on assessment and a compromise of allowing repeating for weak pupils (Table 4.8). Promotion should therefore be based on indicators of merit (attendance and achievement in all subjects). In order to curb repetition and practice automatic promotion while ensuring learning, mastery learning is essential because automatic promotion effected in isolation and in the absence of complementary and more systematic changes may diminish repetition and drop out but may not necessarily ensure learning (Torres in Taye, 2003).
(ii) Abolition of the policy to allow repeating for the weak pupils as recommended by on average 36 percent groups of respondents. However, headteachers and DEOs prefer abolition of the policy to promotion based on assessment. Similarly, in 2010, a baseline survey carried out by Quality Enhancement Initiative (QEI) blamed automatic promotion for poor grades among UPE graduates because pupils are often promoted without having the basic competencies in literacy and numeracy. This was echoed in a recent Uwezo report on children learning abilities, which found that less than half of pupils in Primary Three up to Primary Seven have acquired the competence to count or read Primary Two-level material. Some stakeholders, including the QEI report, have recommended the scrapping of the automatic promotion policy because it not only undermines the performance of the government’s free education programme but also doesn’t give a chance for weak performing learners to improve.
Table 4.8: Recommendations on automatic Grade Promotion
No Recommendations PercentCAO H/T DEO LCV Average

28
Policy, Legal, Regulatory and Institutional Framework
27
1 Promotion based on assessment 51 42 27 46 412 Abolish the policy to allow repeating for the weak pupils 28 45 29 41 363 Encourage continuous assessment 5 4 15 3 74 Introduce regional examinations for lower classes 2 1 2 2 25 Regular sensitization on the policy 4 3 9 3 56 Vocational training as an alternative 2 1 1 0 17 Remedial lessons for weak performers 5 1 10 2 48 Joint discussion between parents and teachers 2 2 5 0 29 Recruitment of more teachers 1 1 2 3 2
Total 100 100 100 100 100Source: NPA survey, 2017
4.2.1.3 Text book policy
Key policy findings
i) The textbook and instructional materials policy announced in 1993 does not exist and is instead in form of Guidelines.
ii) The introduction of a transparent competitive tendering process in 2000 resulted in a reduction in the unit costs of primary textbooks by 58% from US$3.67 in 1998 to US$1.53 in 2002 for the textbooks procured for the same grades and subjects.
iii) Inadequate textbooks to be accessed by pupils. The shortage of textbooks is attributed to; (a) Instructional Materials are expensive and yet the budget is limited; (b) There are several titles by subject yet the budget allocated in inadequate to procure all required titles; (c) The enrollment numbers for pupils by class keep on increasing making the rations unstable; (d) The life time of the Textbook Instructional Materials is estimated to last between 2-3 years; yet some books may be damaged before their expected life time whereas the curriculum content is still valid.
iv) Quality of a teacher’s teaching has a bigger impact on learning than spending more on textbooks and learning materials. There is need therefore to reassess the pre-service and in-service teacher training programmes in light of the UPE agenda.
v) Approved textbooks by NCDC are of different quality. After meeting thetechnical evaluation ceiling of 60% related to the curriculum objective leaves the approved textbooks at different levels and there is no follow up mechanism to ensure full compliance of 100%.
vi) Use of technology as a supplement to traditional textbooks. NCDC should in addition publish on its website a list of approved textbooks annually. This will enable users have accurate information on the books that are aligned to the syllabus. Approved textbooks should in addition be posted online such that soft copies are used. It will minimize the cost and burden of purchasing the many text books and maximize their use since access will be increased.
29
NATIONAL PLANNING AUTHORITY
27
1 Promotion based on assessment 51 42 27 46 412 Abolish the policy to allow repeating for the weak pupils 28 45 29 41 363 Encourage continuous assessment 5 4 15 3 74 Introduce regional examinations for lower classes 2 1 2 2 25 Regular sensitization on the policy 4 3 9 3 56 Vocational training as an alternative 2 1 1 0 17 Remedial lessons for weak performers 5 1 10 2 48 Joint discussion between parents and teachers 2 2 5 0 29 Recruitment of more teachers 1 1 2 3 2
Total 100 100 100 100 100Source: NPA survey, 2017
4.2.1.3 Text book policy
Key policy findings
i) The textbook and instructional materials policy announced in 1993 does not exist and is instead in form of Guidelines.
ii) The introduction of a transparent competitive tendering process in 2000 resulted in a reduction in the unit costs of primary textbooks by 58% from US$3.67 in 1998 to US$1.53 in 2002 for the textbooks procured for the same grades and subjects.
iii) Inadequate textbooks to be accessed by pupils. The shortage of textbooks is attributed to; (a) Instructional Materials are expensive and yet the budget is limited; (b) There are several titles by subject yet the budget allocated in inadequate to procure all required titles; (c) The enrollment numbers for pupils by class keep on increasing making the rations unstable; (d) The life time of the Textbook Instructional Materials is estimated to last between 2-3 years; yet some books may be damaged before their expected life time whereas the curriculum content is still valid.
iv) Quality of a teacher’s teaching has a bigger impact on learning than spending more on textbooks and learning materials. There is need therefore to reassess the pre-service and in-service teacher training programmes in light of the UPE agenda.
v) Approved textbooks by NCDC are of different quality. After meeting thetechnical evaluation ceiling of 60% related to the curriculum objective leaves the approved textbooks at different levels and there is no follow up mechanism to ensure full compliance of 100%.
vi) Use of technology as a supplement to traditional textbooks. NCDC should in addition publish on its website a list of approved textbooks annually. This will enable users have accurate information on the books that are aligned to the syllabus. Approved textbooks should in addition be posted online such that soft copies are used. It will minimize the cost and burden of purchasing the many text books and maximize their use since access will be increased.
28
vii) None utilization of textbooks by pupils. Despite the current textbook-pupil ratio of 1:3, findings indicate that there is minimal usage of the available textbooks. There is need for government involvement as an influencer of reading culture.
viii) Local publishers in Uganda have a lot of capital but are reluctant to publish.Whereas authors are writing a series of trade books in different formats and selling them in and beyond Uganda, only publishers are reluctant to publish and distribute them. Publishers have a high dependence on government as ready market for curricular books.
ix) Make curriculum-compliant teaching materials more widely available in schools and train teachers on how to use these materials effectively.
x) Technology; The increasing internet access nationwide should be capitalized upon.
The introduction of UPE in 1997 doubled primary enrolments and worsened the pupil textbook ratio. Government has since put in place significant measures to improve the textbook-pupil ratio to at least 1:3 for all core subjects. This caused a worsening ratio of textbooks to pupils, as available funding had not kept pace with the increase in demand. Between 1995 and January 1999, the supply of core textbooks to primary schools had increased from l6,000 in 1995 to 2,699,421 by January 1999, an increase of 277 percent. By 2000, a total 7,065,907 core textbooks and supplement readers had been provided to government-aided primary schools.
The textbook policy guidelines decentralized selection of materials to school level.The textbook and instructional materials policy, announced in 1993 removed the monopoly of National Curriculum Development Centre (NCDC) writing books for schools, liberalized the supply of instructional materials to schools, and introduced vetting of all books and other materials going to primary and secondary schools. The policy decentralized selection of materials to school level. Local publishers welcomed the policy as it levelled the playing ground, which hitherto favored only foreign publishers.
In December 2000, the MoES launched the Instructional Materials Reform Programme. The new system had the following characteristics:
i) A competitive evaluation and approval system was introduced with a limitation of three on the number of textbooks to be approved for each subject and grade. As a general rule, the more limited the number of approved textbooks, the more fierce the competition among publishers for approved status and, thus the more keen the submitted prices. The evaluation system is as objective as possible and applies only to the new curriculum textbooks;
ii) Price was one of the main criteria in evaluation (40% of all evaluation marks) and there are minimum content thresholds for conformity to curriculum requirements and for content/presentation. Minimum physical production specifications are compulsory for all textbook titles approved for use in Ugandan schools in order to achieve the target textbook life in the classroom;
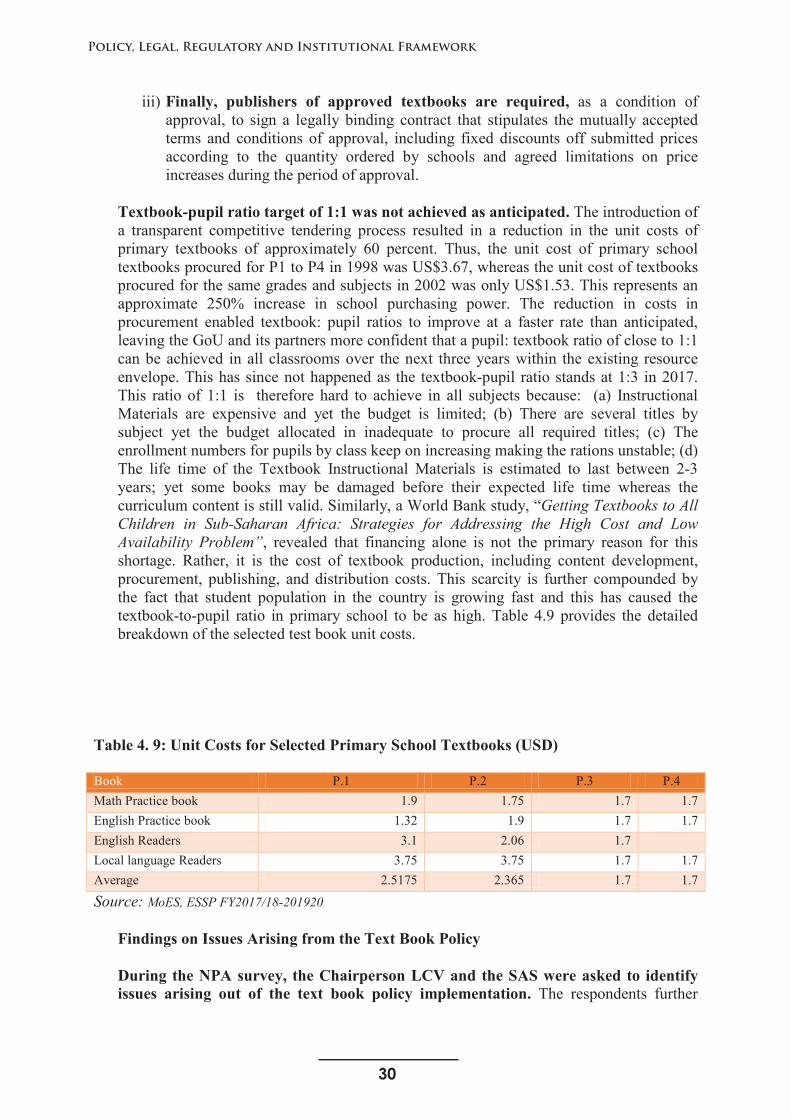
30
Policy, Legal, Regulatory and Institutional Framework
29
iii) Finally, publishers of approved textbooks are required, as a condition of approval, to sign a legally binding contract that stipulates the mutually accepted terms and conditions of approval, including fixed discounts off submitted prices according to the quantity ordered by schools and agreed limitations on price increases during the period of approval.
Textbook-pupil ratio target of 1:1 was not achieved as anticipated. The introduction of a transparent competitive tendering process resulted in a reduction in the unit costs of primary textbooks of approximately 60 percent. Thus, the unit cost of primary school textbooks procured for P1 to P4 in 1998 was US$3.67, whereas the unit cost of textbooks procured for the same grades and subjects in 2002 was only US$1.53. This represents an approximate 250% increase in school purchasing power. The reduction in costs in procurement enabled textbook: pupil ratios to improve at a faster rate than anticipated, leaving the GoU and its partners more confident that a pupil: textbook ratio of close to 1:1 can be achieved in all classrooms over the next three years within the existing resource envelope. This has since not happened as the textbook-pupil ratio stands at 1:3 in 2017. This ratio of 1:1 is therefore hard to achieve in all subjects because: (a) Instructional Materials are expensive and yet the budget is limited; (b) There are several titles by subject yet the budget allocated in inadequate to procure all required titles; (c) The enrollment numbers for pupils by class keep on increasing making the rations unstable; (d) The life time of the Textbook Instructional Materials is estimated to last between 2-3years; yet some books may be damaged before their expected life time whereas the curriculum content is still valid. Similarly, a World Bank study, “Getting Textbooks to All Children in Sub-Saharan Africa: Strategies for Addressing the High Cost and Low Availability Problem”, revealed that financing alone is not the primary reason for this shortage. Rather, it is the cost of textbook production, including content development, procurement, publishing, and distribution costs. This scarcity is further compounded by the fact that student population in the country is growing fast and this has caused the textbook-to-pupil ratio in primary school to be as high. Table 4.9 provides the detailed breakdown of the selected test book unit costs.
Table 4. 9: Unit Costs for Selected Primary School Textbooks (USD)
Book P.1 P.2 P.3 P.4Math Practice book 1.9 1.75 1.7 1.7English Practice book 1.32 1.9 1.7 1.7English Readers 3.1 2.06 1.7Local language Readers 3.75 3.75 1.7 1.7Average 2.5175 2.365 1.7 1.7
Source: MoES, ESSP FY2017/18-201920
Findings on Issues Arising from the Text Book Policy
During the NPA survey, the Chairperson LCV and the SAS were asked to identify issues arising out of the text book policy implementation. The respondents further
31
NATIONAL PLANNING AUTHORITY
29
iii) Finally, publishers of approved textbooks are required, as a condition of approval, to sign a legally binding contract that stipulates the mutually accepted terms and conditions of approval, including fixed discounts off submitted prices according to the quantity ordered by schools and agreed limitations on price increases during the period of approval.
Textbook-pupil ratio target of 1:1 was not achieved as anticipated. The introduction of a transparent competitive tendering process resulted in a reduction in the unit costs of primary textbooks of approximately 60 percent. Thus, the unit cost of primary school textbooks procured for P1 to P4 in 1998 was US$3.67, whereas the unit cost of textbooks procured for the same grades and subjects in 2002 was only US$1.53. This represents an approximate 250% increase in school purchasing power. The reduction in costs in procurement enabled textbook: pupil ratios to improve at a faster rate than anticipated, leaving the GoU and its partners more confident that a pupil: textbook ratio of close to 1:1 can be achieved in all classrooms over the next three years within the existing resource envelope. This has since not happened as the textbook-pupil ratio stands at 1:3 in 2017. This ratio of 1:1 is therefore hard to achieve in all subjects because: (a) Instructional Materials are expensive and yet the budget is limited; (b) There are several titles by subject yet the budget allocated in inadequate to procure all required titles; (c) The enrollment numbers for pupils by class keep on increasing making the rations unstable; (d) The life time of the Textbook Instructional Materials is estimated to last between 2-3years; yet some books may be damaged before their expected life time whereas the curriculum content is still valid. Similarly, a World Bank study, “Getting Textbooks to All Children in Sub-Saharan Africa: Strategies for Addressing the High Cost and Low Availability Problem”, revealed that financing alone is not the primary reason for this shortage. Rather, it is the cost of textbook production, including content development, procurement, publishing, and distribution costs. This scarcity is further compounded by the fact that student population in the country is growing fast and this has caused the textbook-to-pupil ratio in primary school to be as high. Table 4.9 provides the detailed breakdown of the selected test book unit costs.
Table 4. 9: Unit Costs for Selected Primary School Textbooks (USD)
Book P.1 P.2 P.3 P.4Math Practice book 1.9 1.75 1.7 1.7English Practice book 1.32 1.9 1.7 1.7English Readers 3.1 2.06 1.7Local language Readers 3.75 3.75 1.7 1.7Average 2.5175 2.365 1.7 1.7
Source: MoES, ESSP FY2017/18-201920
Findings on Issues Arising from the Text Book Policy
During the NPA survey, the Chairperson LCV and the SAS were asked to identify issues arising out of the text book policy implementation. The respondents further
30
provided recommendations on the issues arising as follows: The most prevalent issue identified by the respondents is “inadequate textbooks to be accessed by pupils' (57percent)”, followed by “inadequate storage facilities at the school’ (10 percent)” and “the None utilization of textbooks by pupils' (8 percent)” (Table 4.10).
i) Inadequate Textbooks to be Assessed by Pupils. Although the stock of textbooks increased by 9.6% from 11,379,533 in 2011 to 12,581,648 in 2016, the enrolment also increased from 8,098,177 to 8,655,924 in the same period6. The textbook-pupil ratio that currently stands at 1:3 is still high implying that the textbooks are not available in sufficient numbers to be accessed by pupils. It’s important to note that the total number of textbooks is an aggregation of all subjects that include; Agriculture, English, Integrated production skills, Kiswahili, Local language, Mathematics, Performing Arts & Physical Education, Religious Studies, Science and Social Studies. Lockheed, Verspoor and Associates (1991, p. 49) argue that the availability of textbooks and instructional materials has a positive effect on children’s achievement in developing countries, but they state that inputs are only important if they help children learn implying that textbooks and teachers’ guides need to be used effectively by teachers and children for them to contribute to the learning process. Good textbooks are those that are pedagogically sound, culturally relevant and physically durable (Lockheed, Verspoor and Associates, 1991).
ii) Inadequate Supply of Teachers’ Guides. Teachers’ guides are virtually non-existent and teachers are not trained in how to use textbooks to enhance learning, thus teaching methods differ from school to school due to the lack of guides. Teachers guides slightly increased by 0.5% from 1,288,607 in 2014 to 1,371,736 in 2016 (Education Abstract, 2014, 2016). A Report by UNESCO (1998a, p. 33) cites several studies which show that the quality of a teacher’s teaching has a bigger impact on learning than spending more on textbooks and learning materials. There is, therefore, need to reassess the pre-service and in-service teacher training programmes in light of the UPE agenda, to see how to make them more effective in improving the quality of schooling and in retaining more children in schools for a full cycle of primary education. Lewin and Stuart (2003) also suggests that providing trainee teachers with lots of support materials is much easier and cheaper than the mass production of textbooks and is likely to have a significant impact on the quality of teaching.
iii) Quality of Text Books. Approved textbooks by NCDC are not 100% compliant to the curriculum. The technical evaluation ceiling of 60% related to the curriculum objective leaves the approved textbooks at different levels. The process of correcting to full fill 100% requirement is not undertaken after the books have been cleared by the evaluation committee.
iv) Inadequate Storage Facilities at the School. More generally, the lack of a secure place to keep textbooks is a common problem in many schools. Few schools have libraries, and laboratories where they exist are not well equipped, with a serious shortage of science materials to support the teaching of science. Even where textbooks have been supplied to schools, often they were kept locked away in a cupboard in the headteachers’ office and were not actively used either due to a
6 Education Statistical Abstracts, 2011, 2014, 2015, 2016
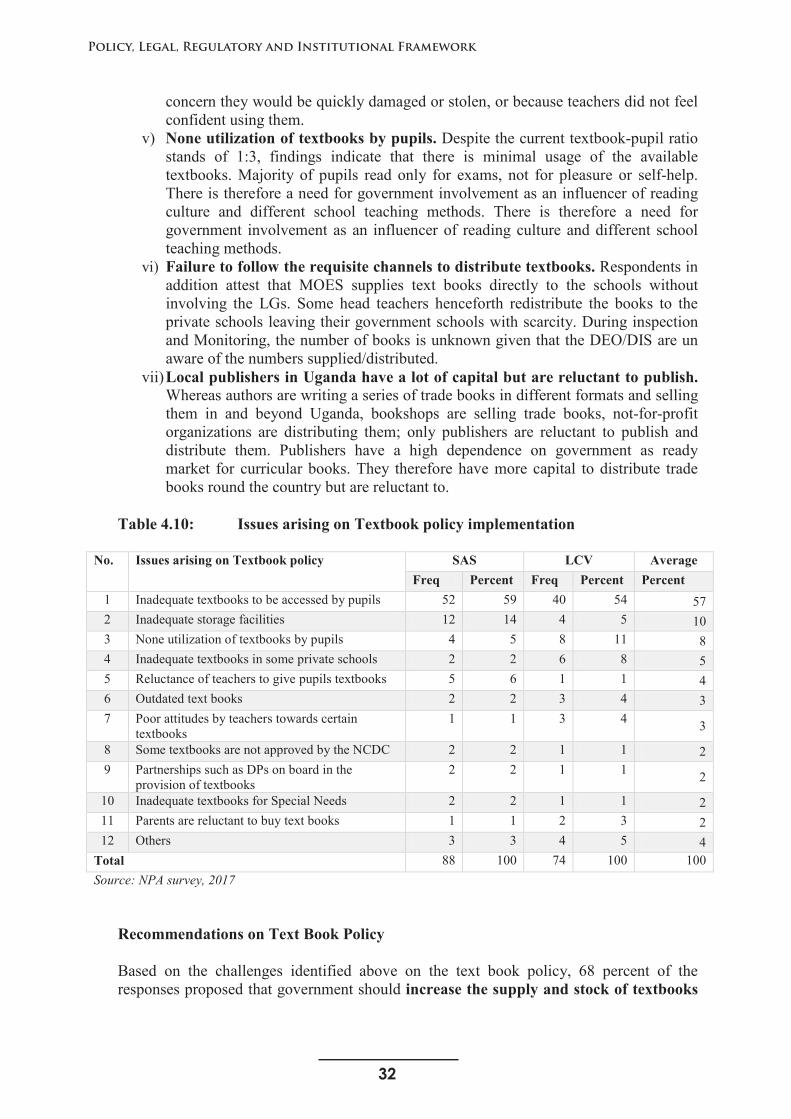
32
Policy, Legal, Regulatory and Institutional Framework
31
concern they would be quickly damaged or stolen, or because teachers did not feel confident using them.
v) None utilization of textbooks by pupils. Despite the current textbook-pupil ratio stands of 1:3, findings indicate that there is minimal usage of the available textbooks. Majority of pupils read only for exams, not for pleasure or self-help. There is therefore a need for government involvement as an influencer of reading culture and different school teaching methods. There is therefore a need for government involvement as an influencer of reading culture and different school teaching methods.
vi) Failure to follow the requisite channels to distribute textbooks. Respondents in addition attest that MOES supplies text books directly to the schools without involving the LGs. Some head teachers henceforth redistribute the books to the private schools leaving their government schools with scarcity. During inspection and Monitoring, the number of books is unknown given that the DEO/DIS are un aware of the numbers supplied/distributed.
vii)Local publishers in Uganda have a lot of capital but are reluctant to publish.Whereas authors are writing a series of trade books in different formats and selling them in and beyond Uganda, bookshops are selling trade books, not-for-profit organizations are distributing them; only publishers are reluctant to publish and distribute them. Publishers have a high dependence on government as ready market for curricular books. They therefore have more capital to distribute trade books round the country but are reluctant to.
Table 4.10: Issues arising on Textbook policy implementation
No. Issues arising on Textbook policy SAS LCV AverageFreq Percent Freq Percent Percent
1 Inadequate textbooks to be accessed by pupils 52 59 40 54 572 Inadequate storage facilities 12 14 4 5 103 None utilization of textbooks by pupils 4 5 8 11 84 Inadequate textbooks in some private schools 2 2 6 8 55 Reluctance of teachers to give pupils textbooks 5 6 1 1 46 Outdated text books 2 2 3 4 37 Poor attitudes by teachers towards certain
textbooks1 1 3 4 3
8 Some textbooks are not approved by the NCDC 2 2 1 1 29 Partnerships such as DPs on board in the
provision of textbooks2 2 1 1 2
10 Inadequate textbooks for Special Needs 2 2 1 1 211 Parents are reluctant to buy text books 1 1 2 3 212 Others 3 3 4 5 4
Total 88 100 74 100 100Source: NPA survey, 2017
Recommendations on Text Book Policy
Based on the challenges identified above on the text book policy, 68 percent of the responses proposed that government should increase the supply and stock of textbooks
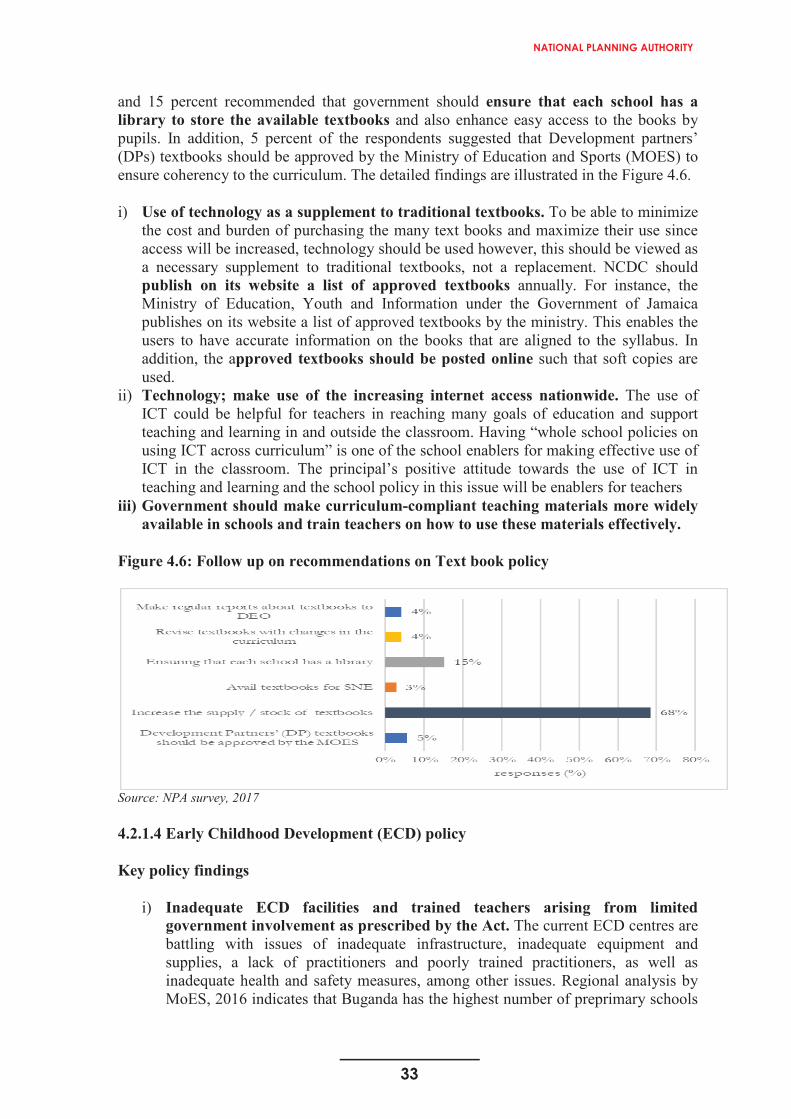
33
NATIONAL PLANNING AUTHORITY
31
concern they would be quickly damaged or stolen, or because teachers did not feel confident using them.
v) None utilization of textbooks by pupils. Despite the current textbook-pupil ratio stands of 1:3, findings indicate that there is minimal usage of the available textbooks. Majority of pupils read only for exams, not for pleasure or self-help. There is therefore a need for government involvement as an influencer of reading culture and different school teaching methods. There is therefore a need for government involvement as an influencer of reading culture and different school teaching methods.
vi) Failure to follow the requisite channels to distribute textbooks. Respondents in addition attest that MOES supplies text books directly to the schools without involving the LGs. Some head teachers henceforth redistribute the books to the private schools leaving their government schools with scarcity. During inspection and Monitoring, the number of books is unknown given that the DEO/DIS are un aware of the numbers supplied/distributed.
vii)Local publishers in Uganda have a lot of capital but are reluctant to publish.Whereas authors are writing a series of trade books in different formats and selling them in and beyond Uganda, bookshops are selling trade books, not-for-profit organizations are distributing them; only publishers are reluctant to publish and distribute them. Publishers have a high dependence on government as ready market for curricular books. They therefore have more capital to distribute trade books round the country but are reluctant to.
Table 4.10: Issues arising on Textbook policy implementation
No. Issues arising on Textbook policy SAS LCV AverageFreq Percent Freq Percent Percent
1 Inadequate textbooks to be accessed by pupils 52 59 40 54 572 Inadequate storage facilities 12 14 4 5 103 None utilization of textbooks by pupils 4 5 8 11 84 Inadequate textbooks in some private schools 2 2 6 8 55 Reluctance of teachers to give pupils textbooks 5 6 1 1 46 Outdated text books 2 2 3 4 37 Poor attitudes by teachers towards certain
textbooks1 1 3 4 3
8 Some textbooks are not approved by the NCDC 2 2 1 1 29 Partnerships such as DPs on board in the
provision of textbooks2 2 1 1 2
10 Inadequate textbooks for Special Needs 2 2 1 1 211 Parents are reluctant to buy text books 1 1 2 3 212 Others 3 3 4 5 4
Total 88 100 74 100 100Source: NPA survey, 2017
Recommendations on Text Book Policy
Based on the challenges identified above on the text book policy, 68 percent of the responses proposed that government should increase the supply and stock of textbooks
32
and 15 percent recommended that government should ensure that each school has a library to store the available textbooks and also enhance easy access to the books by pupils. In addition, 5 percent of the respondents suggested that Development partners’ (DPs) textbooks should be approved by the Ministry of Education and Sports (MOES) to ensure coherency to the curriculum. The detailed findings are illustrated in the Figure 4.6.
i) Use of technology as a supplement to traditional textbooks. To be able to minimize the cost and burden of purchasing the many text books and maximize their use since access will be increased, technology should be used however, this should be viewed as a necessary supplement to traditional textbooks, not a replacement. NCDC should publish on its website a list of approved textbooks annually. For instance, the Ministry of Education, Youth and Information under the Government of Jamaica publishes on its website a list of approved textbooks by the ministry. This enables the users to have accurate information on the books that are aligned to the syllabus. In addition, the approved textbooks should be posted online such that soft copies are used.
ii) Technology; make use of the increasing internet access nationwide. The use of ICT could be helpful for teachers in reaching many goals of education and support teaching and learning in and outside the classroom. Having “whole school policies on using ICT across curriculum” is one of the school enablers for making effective use of ICT in the classroom. The principal’s positive attitude towards the use of ICT in teaching and learning and the school policy in this issue will be enablers for teachers
iii) Government should make curriculum-compliant teaching materials more widely available in schools and train teachers on how to use these materials effectively.
Figure 4.6: Follow up on recommendations on Text book policy
Source: NPA survey, 2017
4.2.1.4 Early Childhood Development (ECD) policy
Key policy findings
i) Inadequate ECD facilities and trained teachers arising from limited government involvement as prescribed by the Act. The current ECD centres are battling with issues of inadequate infrastructure, inadequate equipment and supplies, a lack of practitioners and poorly trained practitioners, as well as inadequate health and safety measures, among other issues. Regional analysis by MoES, 2016 indicates that Buganda has the highest number of preprimary schools
34
Policy, Legal, Regulatory and Institutional Framework
33
totaling to 2,386 (35.1%) of the total preprimary schools whereas Karamoja registers the least number of 100 (1.5%).
ii) ECD domination by private sector. The LG Act has no mention of ECD servicesto operationalize the ECD policy at the district level. According to Education Act, 2008, pre-primary is to be run by private agencies or persons to provide education to children aged from two years to five years and the financing of that type of education shall be a responsibility of the parents or guardians.
iii) Limited adoption of the ECD Policy / pre-primary education in Uganda is optional. The ECD policy falls short of declaring pre-primary education as a must for all children to ensure a firm foundation for all children before they enter primary one. The implication of this is that some children have to stay at home and wait to join primary on a weak foundation.
iv) The policy lacks appropriate enforcement mechanism or sanctions identified to be applied to stakeholders, individuals or institutions that flout the Guidelines.
v) There is weak regulation of ECD.
The Ministry of Education and Sports developed and launched the Ugandan Education sector ECD policy in 2007 aimed to have effective implementation of efficient ECD programmes. Early childhood development that is also referred to as pre-primary education in Uganda has arms in other related sectors like health and social development. The system of education in Uganda has a structure of 3 years of pre-primary, 7 years of primary education, 6 years of secondary education (divided into 4 years of ordinary secondary and 2 years of advanced secondary school), and 2 to 5 years of post-secondary education. However, recognition of pre-primary as the first 3 years of education is a recent development ushered in by the Education Act, 2008. Primary education, however, is still considered the first level of formal education since government has not established any pre-primary school for children and pre-primary qualification is not a requirement anywhere. ECD targets children from conception to eight (8) years and has been proven through various research to contribute to social, economic and human development, increase of workforce productivity, and poverty reduction.
ECD Policy issues arising
The key outstanding issues arising identified by the respondents (Senior Assistant Secretaries and LCV chairpersons) are: (i) Inadequate ECD facilities (ii) Inadequate ECD trained teachers; (iii) ECD domination by private sector; and (iv) the limited adoption of the ECD Policy (table 4.11).
i) Inadequate ECD facilities and trained teachers arising from limited government involvement as prescribed by the Act. ECD centres are battling with issues of inadequate infrastructure, inadequate equipment and supplies, a lack of practitioners and poorly trained practitioners, as well as inadequate health and safety measures, among other issues. This follows from the fact that government has not fully embraced the first education level as given in the Education Act, 2008. Regional analysis by MoES, 2016 indicates that Buganda has the highest number of preprimary schools totaling to 2,386 (35.1%) of the total pre-primary schools whereas Karamoja registers the least number of preprimary schools totaling up to 100 (1.5%). Furthermore, while the ECD policy identified ECD as
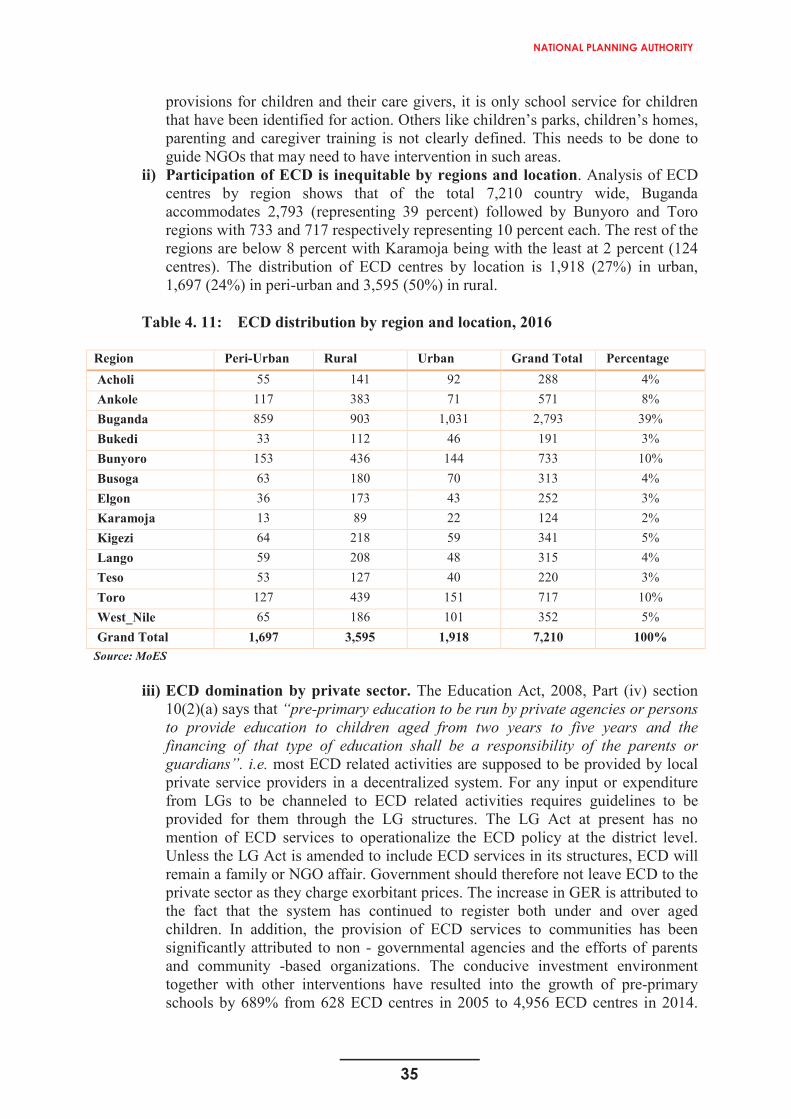
35
NATIONAL PLANNING AUTHORITY
33
totaling to 2,386 (35.1%) of the total preprimary schools whereas Karamoja registers the least number of 100 (1.5%).
ii) ECD domination by private sector. The LG Act has no mention of ECD servicesto operationalize the ECD policy at the district level. According to Education Act, 2008, pre-primary is to be run by private agencies or persons to provide education to children aged from two years to five years and the financing of that type of education shall be a responsibility of the parents or guardians.
iii) Limited adoption of the ECD Policy / pre-primary education in Uganda is optional. The ECD policy falls short of declaring pre-primary education as a must for all children to ensure a firm foundation for all children before they enter primary one. The implication of this is that some children have to stay at home and wait to join primary on a weak foundation.
iv) The policy lacks appropriate enforcement mechanism or sanctions identified to be applied to stakeholders, individuals or institutions that flout the Guidelines.
v) There is weak regulation of ECD.
The Ministry of Education and Sports developed and launched the Ugandan Education sector ECD policy in 2007 aimed to have effective implementation of efficient ECD programmes. Early childhood development that is also referred to as pre-primary education in Uganda has arms in other related sectors like health and social development. The system of education in Uganda has a structure of 3 years of pre-primary, 7 years of primary education, 6 years of secondary education (divided into 4 years of ordinary secondary and 2 years of advanced secondary school), and 2 to 5 years of post-secondary education. However, recognition of pre-primary as the first 3 years of education is a recent development ushered in by the Education Act, 2008. Primary education, however, is still considered the first level of formal education since government has not established any pre-primary school for children and pre-primary qualification is not a requirement anywhere. ECD targets children from conception to eight (8) years and has been proven through various research to contribute to social, economic and human development, increase of workforce productivity, and poverty reduction.
ECD Policy issues arising
The key outstanding issues arising identified by the respondents (Senior Assistant Secretaries and LCV chairpersons) are: (i) Inadequate ECD facilities (ii) Inadequate ECD trained teachers; (iii) ECD domination by private sector; and (iv) the limited adoption of the ECD Policy (table 4.11).
i) Inadequate ECD facilities and trained teachers arising from limited government involvement as prescribed by the Act. ECD centres are battling with issues of inadequate infrastructure, inadequate equipment and supplies, a lack of practitioners and poorly trained practitioners, as well as inadequate health and safety measures, among other issues. This follows from the fact that government has not fully embraced the first education level as given in the Education Act, 2008. Regional analysis by MoES, 2016 indicates that Buganda has the highest number of preprimary schools totaling to 2,386 (35.1%) of the total pre-primary schools whereas Karamoja registers the least number of preprimary schools totaling up to 100 (1.5%). Furthermore, while the ECD policy identified ECD as
34
provisions for children and their care givers, it is only school service for children that have been identified for action. Others like children’s parks, children’s homes, parenting and caregiver training is not clearly defined. This needs to be done to guide NGOs that may need to have intervention in such areas.
ii) Participation of ECD is inequitable by regions and location. Analysis of ECD centres by region shows that of the total 7,210 country wide, Buganda accommodates 2,793 (representing 39 percent) followed by Bunyoro and Toro regions with 733 and 717 respectively representing 10 percent each. The rest of the regions are below 8 percent with Karamoja being with the least at 2 percent (124centres). The distribution of ECD centres by location is 1,918 (27%) in urban, 1,697 (24%) in peri-urban and 3,595 (50%) in rural.
Table 4. 11: ECD distribution by region and location, 2016
Region Peri-Urban Rural Urban Grand Total Percentage Acholi 55 141 92 288 4%Ankole 117 383 71 571 8%Buganda 859 903 1,031 2,793 39%Bukedi 33 112 46 191 3%Bunyoro 153 436 144 733 10%Busoga 63 180 70 313 4%Elgon 36 173 43 252 3%Karamoja 13 89 22 124 2%Kigezi 64 218 59 341 5%Lango 59 208 48 315 4%Teso 53 127 40 220 3%Toro 127 439 151 717 10%West_Nile 65 186 101 352 5%Grand Total 1,697 3,595 1,918 7,210 100%
Source: MoES
iii) ECD domination by private sector. The Education Act, 2008, Part (iv) section 10(2)(a) says that “pre-primary education to be run by private agencies or persons to provide education to children aged from two years to five years and the financing of that type of education shall be a responsibility of the parents or guardians”. i.e. most ECD related activities are supposed to be provided by local private service providers in a decentralized system. For any input or expenditure from LGs to be channeled to ECD related activities requires guidelines to be provided for them through the LG structures. The LG Act at present has no mention of ECD services to operationalize the ECD policy at the district level. Unless the LG Act is amended to include ECD services in its structures, ECD will remain a family or NGO affair. Government should therefore not leave ECD to the private sector as they charge exorbitant prices. The increase in GER is attributed to the fact that the system has continued to register both under and over aged children. In addition, the provision of ECD services to communities has been significantly attributed to non - governmental agencies and the efforts of parents and community -based organizations. The conducive investment environment together with other interventions have resulted into the growth of pre-primary schools by 689% from 628 ECD centres in 2005 to 4,956 ECD centres in 2014.
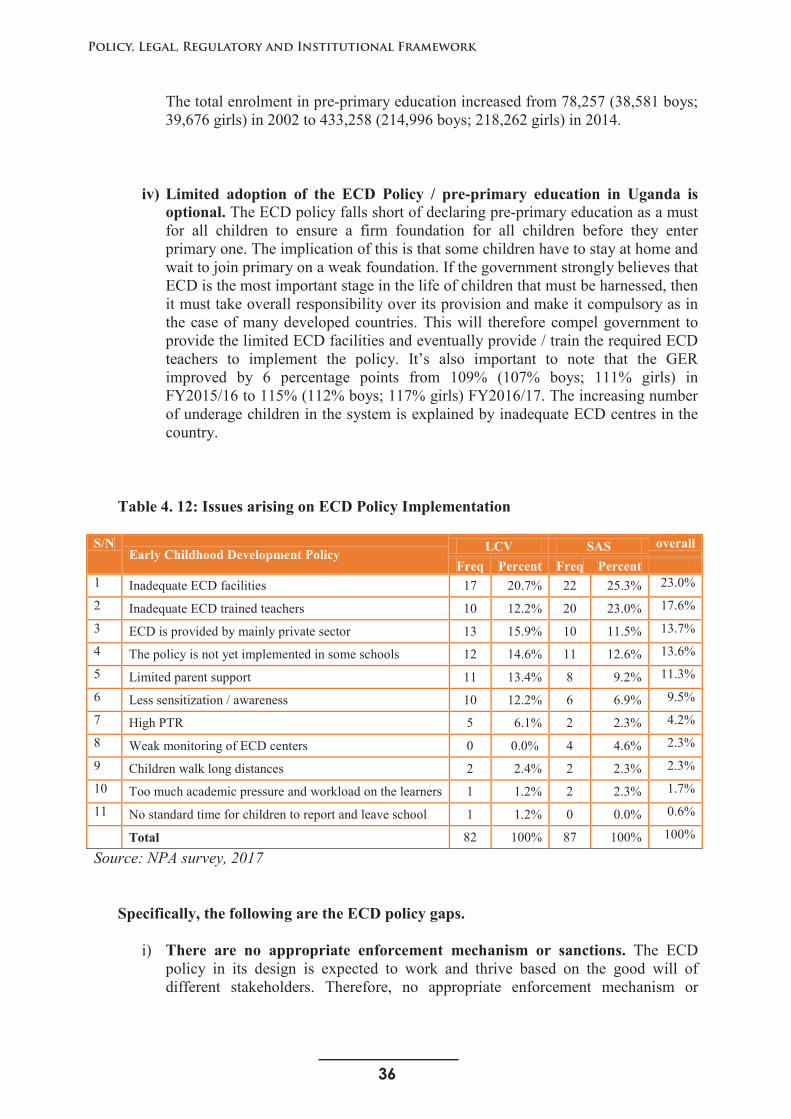
36
Policy, Legal, Regulatory and Institutional Framework
35
The total enrolment in pre-primary education increased from 78,257 (38,581 boys; 39,676 girls) in 2002 to 433,258 (214,996 boys; 218,262 girls) in 2014.
iv) Limited adoption of the ECD Policy / pre-primary education in Uganda is optional. The ECD policy falls short of declaring pre-primary education as a must for all children to ensure a firm foundation for all children before they enter primary one. The implication of this is that some children have to stay at home and wait to join primary on a weak foundation. If the government strongly believes that ECD is the most important stage in the life of children that must be harnessed, then it must take overall responsibility over its provision and make it compulsory as in the case of many developed countries. This will therefore compel government to provide the limited ECD facilities and eventually provide / train the required ECD teachers to implement the policy. It’s also important to note that the GER improved by 6 percentage points from 109% (107% boys; 111% girls) in FY2015/16 to 115% (112% boys; 117% girls) FY2016/17. The increasing number of underage children in the system is explained by inadequate ECD centres in the country.
Table 4. 12: Issues arising on ECD Policy Implementation
S/NEarly Childhood Development Policy LCV SAS overall
Freq Percent Freq Percent1 Inadequate ECD facilities 17 20.7% 22 25.3% 23.0%
2 Inadequate ECD trained teachers 10 12.2% 20 23.0% 17.6%
3 ECD is provided by mainly private sector 13 15.9% 10 11.5% 13.7%
4 The policy is not yet implemented in some schools 12 14.6% 11 12.6% 13.6%
5 Limited parent support 11 13.4% 8 9.2% 11.3%
6 Less sensitization / awareness 10 12.2% 6 6.9% 9.5%
7 High PTR 5 6.1% 2 2.3% 4.2%
8 Weak monitoring of ECD centers 0 0.0% 4 4.6% 2.3%
9 Children walk long distances 2 2.4% 2 2.3% 2.3%
10 Too much academic pressure and workload on the learners 1 1.2% 2 2.3% 1.7%
11 No standard time for children to report and leave school 1 1.2% 0 0.0% 0.6%
Total 82 100% 87 100% 100%
Source: NPA survey, 2017
Specifically, the following are the ECD policy gaps.
i) There are no appropriate enforcement mechanism or sanctions. The ECD policy in its design is expected to work and thrive based on the good will of different stakeholders. Therefore, no appropriate enforcement mechanism or
37
NATIONAL PLANNING AUTHORITY
35
The total enrolment in pre-primary education increased from 78,257 (38,581 boys; 39,676 girls) in 2002 to 433,258 (214,996 boys; 218,262 girls) in 2014.
iv) Limited adoption of the ECD Policy / pre-primary education in Uganda is optional. The ECD policy falls short of declaring pre-primary education as a must for all children to ensure a firm foundation for all children before they enter primary one. The implication of this is that some children have to stay at home and wait to join primary on a weak foundation. If the government strongly believes that ECD is the most important stage in the life of children that must be harnessed, then it must take overall responsibility over its provision and make it compulsory as in the case of many developed countries. This will therefore compel government to provide the limited ECD facilities and eventually provide / train the required ECD teachers to implement the policy. It’s also important to note that the GER improved by 6 percentage points from 109% (107% boys; 111% girls) in FY2015/16 to 115% (112% boys; 117% girls) FY2016/17. The increasing number of underage children in the system is explained by inadequate ECD centres in the country.
Table 4. 12: Issues arising on ECD Policy Implementation
S/NEarly Childhood Development Policy LCV SAS overall
Freq Percent Freq Percent1 Inadequate ECD facilities 17 20.7% 22 25.3% 23.0%
2 Inadequate ECD trained teachers 10 12.2% 20 23.0% 17.6%
3 ECD is provided by mainly private sector 13 15.9% 10 11.5% 13.7%
4 The policy is not yet implemented in some schools 12 14.6% 11 12.6% 13.6%
5 Limited parent support 11 13.4% 8 9.2% 11.3%
6 Less sensitization / awareness 10 12.2% 6 6.9% 9.5%
7 High PTR 5 6.1% 2 2.3% 4.2%
8 Weak monitoring of ECD centers 0 0.0% 4 4.6% 2.3%
9 Children walk long distances 2 2.4% 2 2.3% 2.3%
10 Too much academic pressure and workload on the learners 1 1.2% 2 2.3% 1.7%
11 No standard time for children to report and leave school 1 1.2% 0 0.0% 0.6%
Total 82 100% 87 100% 100%
Source: NPA survey, 2017
Specifically, the following are the ECD policy gaps.
i) There are no appropriate enforcement mechanism or sanctions. The ECD policy in its design is expected to work and thrive based on the good will of different stakeholders. Therefore, no appropriate enforcement mechanism or
36
sanctions have been identified to be applied in policy or its guidelines to stakeholders, individuals or institutions that flout the guidelines. This means that even if a good guideline is put in place, there is no mechanism to enforce use of such guidelines. What you find therefore is the guideline in the shelves while the stakeholders continue doing “what they feel is right.
ii) The ECD policy has not been able to identify funding targets, or sources of funding for ECD related activities either at national or local level. This gap makes ECD, a sector that is crucial for human growth at national level a non-funded priority.
iii) While the policy has identified some roles of stakeholders in ECD, no particular mechanism of coordination of willing stakeholders to do their part has been put in place. The implication of this is that at the local level many NGOs and private individuals keep duplicating each other’s roles and function in an uncoordinated way within the same area. It is therefore not uncommon to find two NGOs running different parenting programmes in the same village to the same parents but each organization operating independently.
iv) There is need for the different ECD activities at the district level to be coordinated. The DEO under education department in the district administration, the CDO and community-based services under LG, and welfare office under gender need some kind of coordination. At present, the ECD focal point person at the district seem as the coordinator, but there is not coordination structure that can be followed and respected by all. Also, the post of ECD focal point person at the district is not an established post but an added responsibility to a DIS. The DIS must first complete the assigned duties as established by his/her post before starting the ECD assignment.
v) Another key area not explicitly explored in the ECD policy is Sports. Building of positive attitudes towards sports and other sporting activities need to be nurtured early at this level.
vi) Whereas the ECD policy makes consideration for ALL children, there is no special focus on children with special needs that may not necessarily benefit from services that are provided for every child. A clear provision needs to be identified to cater for such children in order to make services to benefit ALL children.
vii)Incomplete information on ECD under EMIS. Whereas data variables are similar to those under primary are captured under EMIS database, there still remains information gaps especially on funding due to the fact that its privately managed unlike UPE which a government policy is, private players are hesitant in availing information regarding funding on ECD programmes.
Recommendations for an Effective ECD policy
i) The respondents recommended for more ECD teachers to be trained, increasing awareness on the policy (21 percent); Introduction of ECD section in all primary schools (19 percent); Improvement in ECD facilities especiallypermanent classrooms (15 percent); and Increasing facilitation of ECD care takers (14 percent).
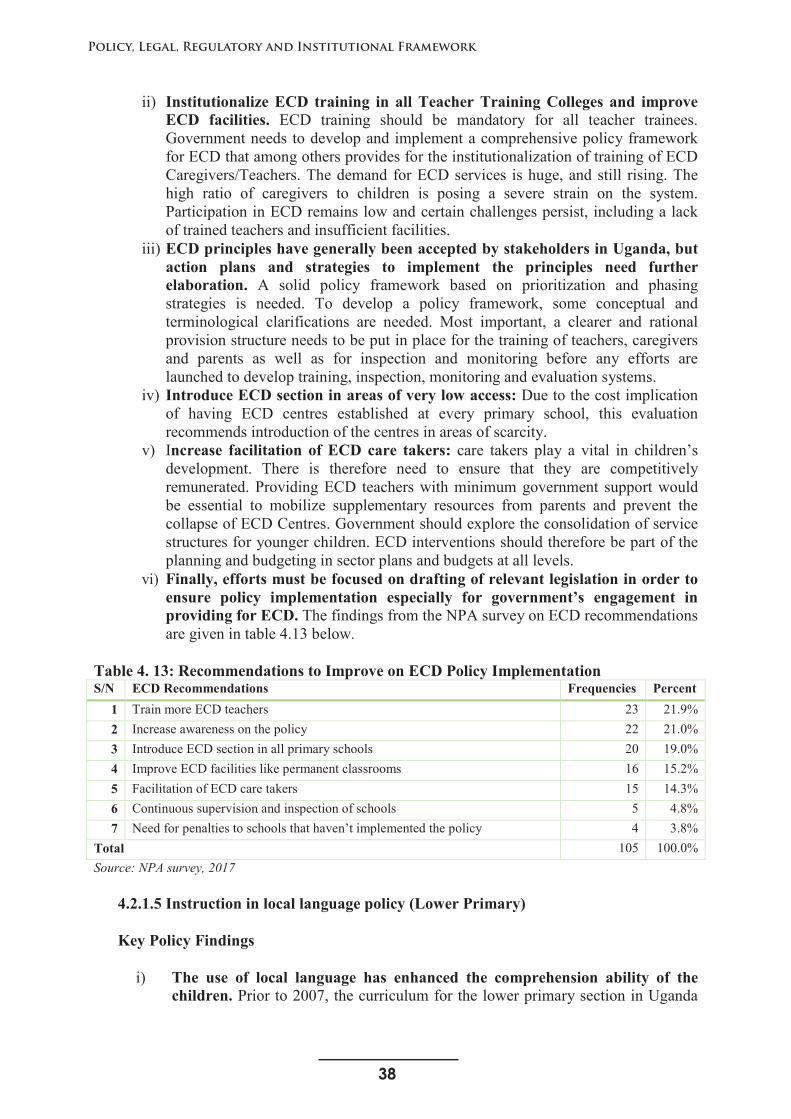
38
Policy, Legal, Regulatory and Institutional Framework
37
ii) Institutionalize ECD training in all Teacher Training Colleges and improve ECD facilities. ECD training should be mandatory for all teacher trainees.Government needs to develop and implement a comprehensive policy framework for ECD that among others provides for the institutionalization of training of ECD Caregivers/Teachers. The demand for ECD services is huge, and still rising. The high ratio of caregivers to children is posing a severe strain on the system. Participation in ECD remains low and certain challenges persist, including a lack of trained teachers and insufficient facilities.
iii) ECD principles have generally been accepted by stakeholders in Uganda, but action plans and strategies to implement the principles need further elaboration. A solid policy framework based on prioritization and phasing strategies is needed. To develop a policy framework, some conceptual and terminological clarifications are needed. Most important, a clearer and rational provision structure needs to be put in place for the training of teachers, caregivers and parents as well as for inspection and monitoring before any efforts are launched to develop training, inspection, monitoring and evaluation systems.
iv) Introduce ECD section in areas of very low access: Due to the cost implication of having ECD centres established at every primary school, this evaluation recommends introduction of the centres in areas of scarcity.
v) Increase facilitation of ECD care takers: care takers play a vital in children’s development. There is therefore need to ensure that they are competitively remunerated. Providing ECD teachers with minimum government support would be essential to mobilize supplementary resources from parents and prevent the collapse of ECD Centres. Government should explore the consolidation of service structures for younger children. ECD interventions should therefore be part of theplanning and budgeting in sector plans and budgets at all levels.
vi) Finally, efforts must be focused on drafting of relevant legislation in order to ensure policy implementation especially for government’s engagement in providing for ECD. The findings from the NPA survey on ECD recommendations are given in table 4.13 below.
Table 4. 13: Recommendations to Improve on ECD Policy ImplementationS/N ECD Recommendations Frequencies Percent
1 Train more ECD teachers 23 21.9%2 Increase awareness on the policy 22 21.0%3 Introduce ECD section in all primary schools 20 19.0%4 Improve ECD facilities like permanent classrooms 16 15.2%5 Facilitation of ECD care takers 15 14.3%6 Continuous supervision and inspection of schools 5 4.8%7 Need for penalties to schools that haven’t implemented the policy 4 3.8%
Total 105 100.0%Source: NPA survey, 2017
4.2.1.5 Instruction in local language policy (Lower Primary)
Key Policy Findings
i) The use of local language has enhanced the comprehension ability of the children. Prior to 2007, the curriculum for the lower primary section in Uganda
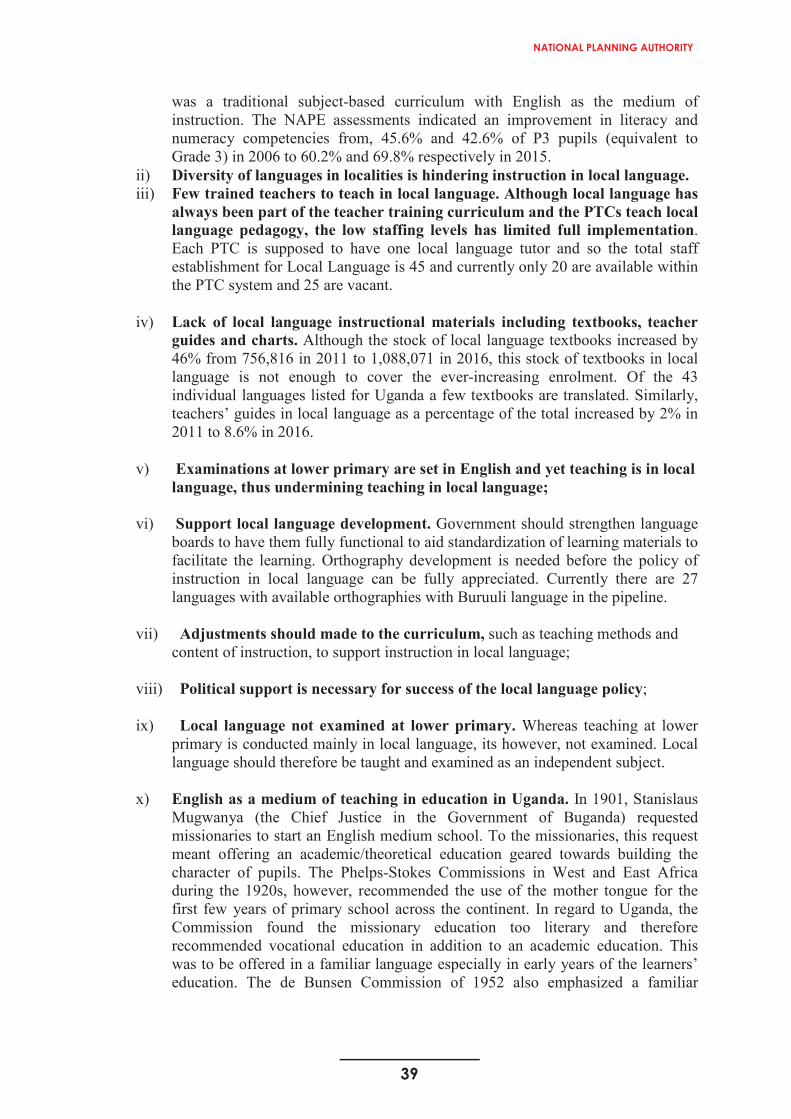
39
NATIONAL PLANNING AUTHORITY
37
ii) Institutionalize ECD training in all Teacher Training Colleges and improve ECD facilities. ECD training should be mandatory for all teacher trainees.Government needs to develop and implement a comprehensive policy framework for ECD that among others provides for the institutionalization of training of ECD Caregivers/Teachers. The demand for ECD services is huge, and still rising. The high ratio of caregivers to children is posing a severe strain on the system. Participation in ECD remains low and certain challenges persist, including a lack of trained teachers and insufficient facilities.
iii) ECD principles have generally been accepted by stakeholders in Uganda, but action plans and strategies to implement the principles need further elaboration. A solid policy framework based on prioritization and phasing strategies is needed. To develop a policy framework, some conceptual and terminological clarifications are needed. Most important, a clearer and rational provision structure needs to be put in place for the training of teachers, caregivers and parents as well as for inspection and monitoring before any efforts are launched to develop training, inspection, monitoring and evaluation systems.
iv) Introduce ECD section in areas of very low access: Due to the cost implication of having ECD centres established at every primary school, this evaluation recommends introduction of the centres in areas of scarcity.
v) Increase facilitation of ECD care takers: care takers play a vital in children’s development. There is therefore need to ensure that they are competitively remunerated. Providing ECD teachers with minimum government support would be essential to mobilize supplementary resources from parents and prevent the collapse of ECD Centres. Government should explore the consolidation of service structures for younger children. ECD interventions should therefore be part of theplanning and budgeting in sector plans and budgets at all levels.
vi) Finally, efforts must be focused on drafting of relevant legislation in order to ensure policy implementation especially for government’s engagement in providing for ECD. The findings from the NPA survey on ECD recommendations are given in table 4.13 below.
Table 4. 13: Recommendations to Improve on ECD Policy ImplementationS/N ECD Recommendations Frequencies Percent
1 Train more ECD teachers 23 21.9%2 Increase awareness on the policy 22 21.0%3 Introduce ECD section in all primary schools 20 19.0%4 Improve ECD facilities like permanent classrooms 16 15.2%5 Facilitation of ECD care takers 15 14.3%6 Continuous supervision and inspection of schools 5 4.8%7 Need for penalties to schools that haven’t implemented the policy 4 3.8%
Total 105 100.0%Source: NPA survey, 2017
4.2.1.5 Instruction in local language policy (Lower Primary)
Key Policy Findings
i) The use of local language has enhanced the comprehension ability of the children. Prior to 2007, the curriculum for the lower primary section in Uganda
38
was a traditional subject-based curriculum with English as the medium of instruction. The NAPE assessments indicated an improvement in literacy and numeracy competencies from, 45.6% and 42.6% of P3 pupils (equivalent to Grade 3) in 2006 to 60.2% and 69.8% respectively in 2015.
ii) Diversity of languages in localities is hindering instruction in local language.iii) Few trained teachers to teach in local language. Although local language has
always been part of the teacher training curriculum and the PTCs teach local language pedagogy, the low staffing levels has limited full implementation.Each PTC is supposed to have one local language tutor and so the total staff establishment for Local Language is 45 and currently only 20 are available within the PTC system and 25 are vacant.
iv) Lack of local language instructional materials including textbooks, teacher guides and charts. Although the stock of local language textbooks increased by 46% from 756,816 in 2011 to 1,088,071 in 2016, this stock of textbooks in local language is not enough to cover the ever-increasing enrolment. Of the 43 individual languages listed for Uganda a few textbooks are translated. Similarly, teachers’ guides in local language as a percentage of the total increased by 2% in 2011 to 8.6% in 2016.
v) Examinations at lower primary are set in English and yet teaching is in local language, thus undermining teaching in local language;
vi) Support local language development. Government should strengthen language boards to have them fully functional to aid standardization of learning materials to facilitate the learning. Orthography development is needed before the policy of instruction in local language can be fully appreciated. Currently there are 27 languages with available orthographies with Buruuli language in the pipeline.
vii) Adjustments should made to the curriculum, such as teaching methods and content of instruction, to support instruction in local language;
viii) Political support is necessary for success of the local language policy;
ix) Local language not examined at lower primary. Whereas teaching at lower primary is conducted mainly in local language, its however, not examined. Local language should therefore be taught and examined as an independent subject.
x) English as a medium of teaching in education in Uganda. In 1901, Stanislaus Mugwanya (the Chief Justice in the Government of Buganda) requested missionaries to start an English medium school. To the missionaries, this request meant offering an academic/theoretical education geared towards building the character of pupils. The Phelps-Stokes Commissions in West and East Africa during the 1920s, however, recommended the use of the mother tongue for the first few years of primary school across the continent. In regard to Uganda, the Commission found the missionary education too literary and therefore recommended vocational education in addition to an academic education. This was to be offered in a familiar language especially in early years of the learners’ education. The de Bunsen Commission of 1952 also emphasized a familiar

40
Policy, Legal, Regulatory and Institutional Framework
39
language if learners were to grasp concepts from the teaching-learning situation, and this chimed with Africa-wide recommendations in the 1953.
xi) The subsequent policies did not explicitly contextualize the issue of language in education until the Kajubi Report of 1989 (i.e. the Report of the Education Policy Review Commission of 1987-89). The recommendations from this Report were later adopted into the Government White Paper on Education of 1992. This document has become a guiding policy for mother-tongue education, also known as the use of the local language as medium in Uganda. A SECTION on the language policy in the White Paper clearly stipulates that children from Primary One to Four (P1-4) (later revised to Primary Three/P3) should be taught in their mother tongue. From Primary Five (P5) onwards, the White Paper recommends that the medium of instruction should be English. Students in secondary school are expected to study English, an area language (the term used to denote a domestic regional language of wider communication in Uganda), and a local language (if different from the area language). The policy places emphasis on Kiswahili as a language of wider communication in East Africa (i.e. cross-border language of wider communication) and sets out an elaborate strategy to teach this language in schools and institutions.
xii) The national language policy is that the local language should be the language of instruction at lower primary. Instruction in the official language begins at grade five. However, both parents and teachers have had mixed opinions on this policy, and the following issues emerged and recommendations were given as illustrated in the analysis below.
Issues arising on the Local Language Policy
i) The use of local language has enhanced the comprehension ability of the children. From the NPA UPE evaluation (table 4.14), respondents attest that the use of local language has enhanced the comprehension ability of the children. Prior to 2007, the curriculum for the lower primary section in Uganda was a traditional subject-based curriculum with English as the medium of instruction. However, a range of performance and achievement tests conducted by different agencies demonstrated low levels of pupil performance in the basic skills of reading, writing, comprehension, speaking and number work. The National Assessment of Progress in Education (NAPE) indicated that in 2006, 45.6% and 42.6% of P3 (equivalent to Grade 3) pupils reached a defined level of literacy and numeracy respectively. The study also found that children were not adapting to English language instruction due to the prevalence of local languages. Following implementation of the local language policy, NAPE, 2015 indicates that scores at P.3 indicated an improvement in numeracy and literacy competencies of 69.8%and 60.2% respectively.
ii) Diversity of languages hindering instruction in local language. Most districts in Uganda have several languages spoken in the homes and market places of a community. For instance, in Pallisa district over three languages are spoken including Ateso, Lugishu, Lugwere, Lusoga and Luganda among others. The prominence of some of these languages have outshined the indigenous and mother tongue languages. There is therefore difficulty in choosing an appropriate local language to be used at lower primary. In addition, the number of individual
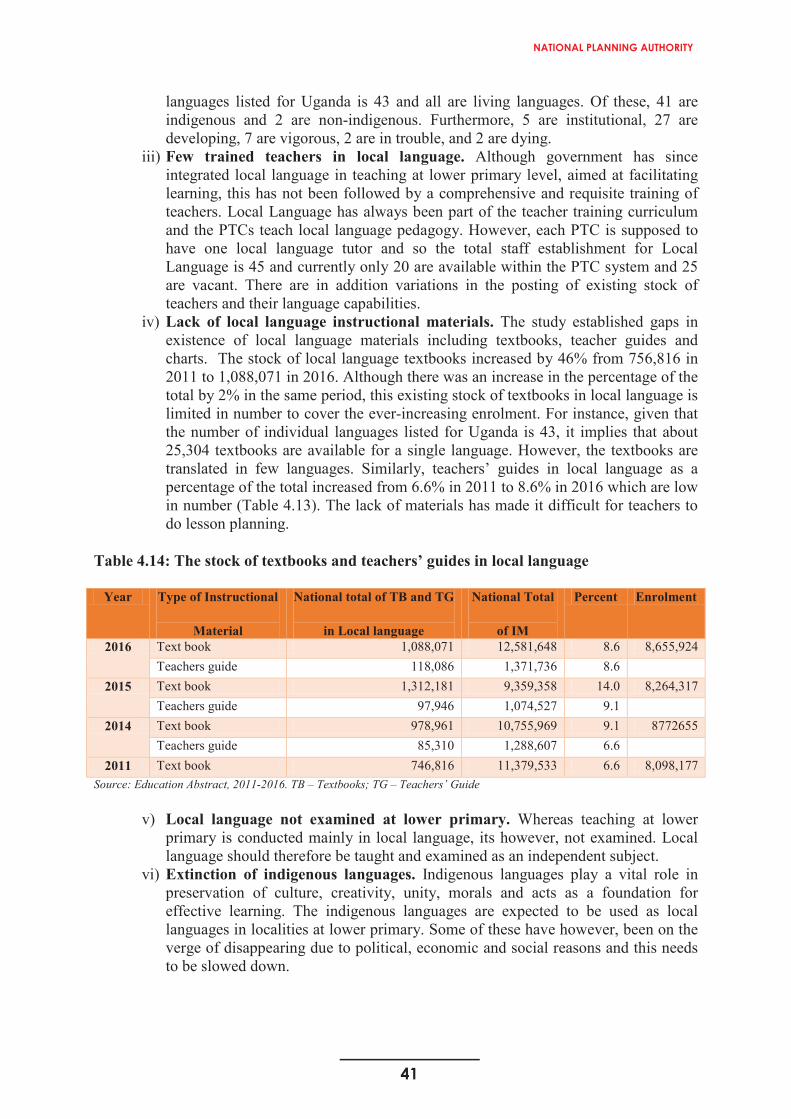
41
NATIONAL PLANNING AUTHORITY
39
language if learners were to grasp concepts from the teaching-learning situation, and this chimed with Africa-wide recommendations in the 1953.
xi) The subsequent policies did not explicitly contextualize the issue of language in education until the Kajubi Report of 1989 (i.e. the Report of the Education Policy Review Commission of 1987-89). The recommendations from this Report were later adopted into the Government White Paper on Education of 1992. This document has become a guiding policy for mother-tongue education, also known as the use of the local language as medium in Uganda. A SECTION on the language policy in the White Paper clearly stipulates that children from Primary One to Four (P1-4) (later revised to Primary Three/P3) should be taught in their mother tongue. From Primary Five (P5) onwards, the White Paper recommends that the medium of instruction should be English. Students in secondary school are expected to study English, an area language (the term used to denote a domestic regional language of wider communication in Uganda), and a local language (if different from the area language). The policy places emphasis on Kiswahili as a language of wider communication in East Africa (i.e. cross-border language of wider communication) and sets out an elaborate strategy to teach this language in schools and institutions.
xii) The national language policy is that the local language should be the language of instruction at lower primary. Instruction in the official language begins at grade five. However, both parents and teachers have had mixed opinions on this policy, and the following issues emerged and recommendations were given as illustrated in the analysis below.
Issues arising on the Local Language Policy
i) The use of local language has enhanced the comprehension ability of the children. From the NPA UPE evaluation (table 4.14), respondents attest that the use of local language has enhanced the comprehension ability of the children. Prior to 2007, the curriculum for the lower primary section in Uganda was a traditional subject-based curriculum with English as the medium of instruction. However, a range of performance and achievement tests conducted by different agencies demonstrated low levels of pupil performance in the basic skills of reading, writing, comprehension, speaking and number work. The National Assessment of Progress in Education (NAPE) indicated that in 2006, 45.6% and 42.6% of P3 (equivalent to Grade 3) pupils reached a defined level of literacy and numeracy respectively. The study also found that children were not adapting to English language instruction due to the prevalence of local languages. Following implementation of the local language policy, NAPE, 2015 indicates that scores at P.3 indicated an improvement in numeracy and literacy competencies of 69.8%and 60.2% respectively.
ii) Diversity of languages hindering instruction in local language. Most districts in Uganda have several languages spoken in the homes and market places of a community. For instance, in Pallisa district over three languages are spoken including Ateso, Lugishu, Lugwere, Lusoga and Luganda among others. The prominence of some of these languages have outshined the indigenous and mother tongue languages. There is therefore difficulty in choosing an appropriate local language to be used at lower primary. In addition, the number of individual
40
languages listed for Uganda is 43 and all are living languages. Of these, 41 are indigenous and 2 are non-indigenous. Furthermore, 5 are institutional, 27 are developing, 7 are vigorous, 2 are in trouble, and 2 are dying.
iii) Few trained teachers in local language. Although government has since integrated local language in teaching at lower primary level, aimed at facilitating learning, this has not been followed by a comprehensive and requisite training of teachers. Local Language has always been part of the teacher training curriculum and the PTCs teach local language pedagogy. However, each PTC is supposed to have one local language tutor and so the total staff establishment for Local Language is 45 and currently only 20 are available within the PTC system and 25 are vacant. There are in addition variations in the posting of existing stock of teachers and their language capabilities.
iv) Lack of local language instructional materials. The study established gaps in existence of local language materials including textbooks, teacher guides and charts. The stock of local language textbooks increased by 46% from 756,816 in 2011 to 1,088,071 in 2016. Although there was an increase in the percentage of the total by 2% in the same period, this existing stock of textbooks in local language is limited in number to cover the ever-increasing enrolment. For instance, given that the number of individual languages listed for Uganda is 43, it implies that about 25,304 textbooks are available for a single language. However, the textbooks are translated in few languages. Similarly, teachers’ guides in local language as a percentage of the total increased from 6.6% in 2011 to 8.6% in 2016 which are low in number (Table 4.13). The lack of materials has made it difficult for teachers to do lesson planning.
Table 4.14: The stock of textbooks and teachers’ guides in local language
Year Type of Instructional
Material
National total of TB and TG
in Local language
National Total
of IM
Percent Enrolment
2016 Text book 1,088,071 12,581,648 8.6 8,655,924Teachers guide 118,086 1,371,736 8.6
2015 Text book 1,312,181 9,359,358 14.0 8,264,317Teachers guide 97,946 1,074,527 9.1
2014 Text book 978,961 10,755,969 9.1 8772655Teachers guide 85,310 1,288,607 6.6
2011 Text book 746,816 11,379,533 6.6 8,098,177Source: Education Abstract, 2011-2016. TB – Textbooks; TG – Teachers’ Guide
v) Local language not examined at lower primary. Whereas teaching at lower primary is conducted mainly in local language, its however, not examined. Local language should therefore be taught and examined as an independent subject.
vi) Extinction of indigenous languages. Indigenous languages play a vital role in preservation of culture, creativity, unity, morals and acts as a foundation for effective learning. The indigenous languages are expected to be used as local languages in localities at lower primary. Some of these have however, been on the verge of disappearing due to political, economic and social reasons and this needs to be slowed down.
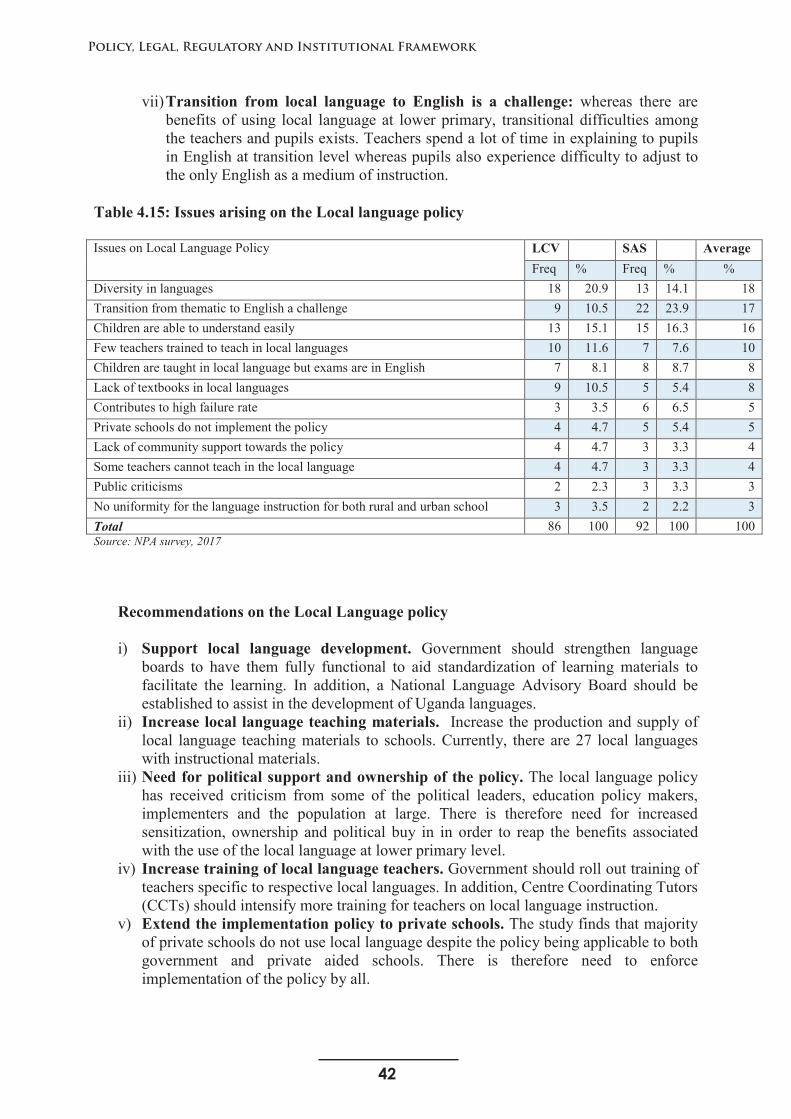
42
Policy, Legal, Regulatory and Institutional Framework
41
vii)Transition from local language to English is a challenge: whereas there are benefits of using local language at lower primary, transitional difficulties among the teachers and pupils exists. Teachers spend a lot of time in explaining to pupils in English at transition level whereas pupils also experience difficulty to adjust to the only English as a medium of instruction.
Table 4.15: Issues arising on the Local language policy
Issues on Local Language Policy LCV SAS AverageFreq % Freq % %
Diversity in languages 18 20.9 13 14.1 18Transition from thematic to English a challenge 9 10.5 22 23.9 17Children are able to understand easily 13 15.1 15 16.3 16Few teachers trained to teach in local languages 10 11.6 7 7.6 10Children are taught in local language but exams are in English 7 8.1 8 8.7 8Lack of textbooks in local languages 9 10.5 5 5.4 8Contributes to high failure rate 3 3.5 6 6.5 5Private schools do not implement the policy 4 4.7 5 5.4 5Lack of community support towards the policy 4 4.7 3 3.3 4Some teachers cannot teach in the local language 4 4.7 3 3.3 4Public criticisms 2 2.3 3 3.3 3No uniformity for the language instruction for both rural and urban school 3 3.5 2 2.2 3Total 86 100 92 100 100Source: NPA survey, 2017
Recommendations on the Local Language policy
i) Support local language development. Government should strengthen language boards to have them fully functional to aid standardization of learning materials to facilitate the learning. In addition, a National Language Advisory Board should be established to assist in the development of Uganda languages.
ii) Increase local language teaching materials. Increase the production and supply of local language teaching materials to schools. Currently, there are 27 local languages with instructional materials.
iii) Need for political support and ownership of the policy. The local language policy has received criticism from some of the political leaders, education policy makers, implementers and the population at large. There is therefore need for increased sensitization, ownership and political buy in in order to reap the benefits associated with the use of the local language at lower primary level.
iv) Increase training of local language teachers. Government should roll out training of teachers specific to respective local languages. In addition, Centre Coordinating Tutors (CCTs) should intensify more training for teachers on local language instruction.
v) Extend the implementation policy to private schools. The study finds that majority of private schools do not use local language despite the policy being applicable to both government and private aided schools. There is therefore need to enforce implementation of the policy by all.
43
NATIONAL PLANNING AUTHORITY
41
vii)Transition from local language to English is a challenge: whereas there are benefits of using local language at lower primary, transitional difficulties among the teachers and pupils exists. Teachers spend a lot of time in explaining to pupils in English at transition level whereas pupils also experience difficulty to adjust to the only English as a medium of instruction.
Table 4.15: Issues arising on the Local language policy
Issues on Local Language Policy LCV SAS AverageFreq % Freq % %
Diversity in languages 18 20.9 13 14.1 18Transition from thematic to English a challenge 9 10.5 22 23.9 17Children are able to understand easily 13 15.1 15 16.3 16Few teachers trained to teach in local languages 10 11.6 7 7.6 10Children are taught in local language but exams are in English 7 8.1 8 8.7 8Lack of textbooks in local languages 9 10.5 5 5.4 8Contributes to high failure rate 3 3.5 6 6.5 5Private schools do not implement the policy 4 4.7 5 5.4 5Lack of community support towards the policy 4 4.7 3 3.3 4Some teachers cannot teach in the local language 4 4.7 3 3.3 4Public criticisms 2 2.3 3 3.3 3No uniformity for the language instruction for both rural and urban school 3 3.5 2 2.2 3Total 86 100 92 100 100Source: NPA survey, 2017
Recommendations on the Local Language policy
i) Support local language development. Government should strengthen language boards to have them fully functional to aid standardization of learning materials to facilitate the learning. In addition, a National Language Advisory Board should be established to assist in the development of Uganda languages.
ii) Increase local language teaching materials. Increase the production and supply of local language teaching materials to schools. Currently, there are 27 local languages with instructional materials.
iii) Need for political support and ownership of the policy. The local language policy has received criticism from some of the political leaders, education policy makers, implementers and the population at large. There is therefore need for increased sensitization, ownership and political buy in in order to reap the benefits associated with the use of the local language at lower primary level.
iv) Increase training of local language teachers. Government should roll out training of teachers specific to respective local languages. In addition, Centre Coordinating Tutors (CCTs) should intensify more training for teachers on local language instruction.
v) Extend the implementation policy to private schools. The study finds that majority of private schools do not use local language despite the policy being applicable to both government and private aided schools. There is therefore need to enforce implementation of the policy by all.
42
4.2.1.6 Customized performance targets policy
Key policy findings
i) Weak supervision structure. The policy implementation structure required Subcounty chiefs to supervise headteacher perfomance against the set targets but this met resistance, as these contested their capacity.
ii) Non-familiarity of stakeholders with the targets. All stakeholders including parents, community, SMC have a role in implementation of the set targets. However, majority of these have remained unaware of the existence and objeectivies of this policy.
iii) Negative perceptions about the policy. The policy is seen as an instrument to apprehend culprits rather than a tool to improve performance
iv) Low involvement of stakeholders in setting targets. The policy to be owned requires wider and rigorous consultations of key stakeholders including the teachers and parents. Most of them are not aware of the policy making it difficult to monitor.
v) Continuous capacity building on performance management is neededvi) Governmnet should initiate an annual rewards and sanctions modality for
good and bad performance so to motivate and improve performance of primary education in the country. Action should therefore be taken for ability and failure to meet the targets.
This policy was introduced in 2005 by Ministry of Public Service (MoPs) to help demonstrate compliance to standards for improved performance at the primary school level. This was as a result of various surveys by MoES which established that absentism of headteachers was partly responsible for the poor performance of pupils. However, several teachers rejected it on grounds that the parameters used to measure performance were un clear and intended to marginalize some of the schools. Relatedly, the Uganda National Teachers’ Union (UNATU) maintained that headteachers would be rendered insecure because they would be required to work under contractual terms and required to sign performance agreements. The policy was reviewed allowing headteachers and their deputies to be rated against specific target requirements which include: enhanced public learning achievement; general school management; and leadership, financial management and control. The other targets are effective utilization of innovativeness in instructional materials, Human Resource management, school records management and school assets management.
Weak supervision structure. The policy implementation structure that required subcounty chiefs to supervise headteacher perfomance against the set targets has met resistance, as they contested there capacity. Several LGs have remained complacent on the monitoring of the policy yet its sucessful implementation rests on their good will as well.
Non-familiarity of stakeholders with the targets. The policy rollout and dissemination were not widely undertaken by the responsible Ministry. Therefore, majority of stakeholders have remained unaware of the existence of this policy in addition to its intended objectives. This has resulted into lack of knowledge and clarity on the part of stakeholders about the functionality of the policy.
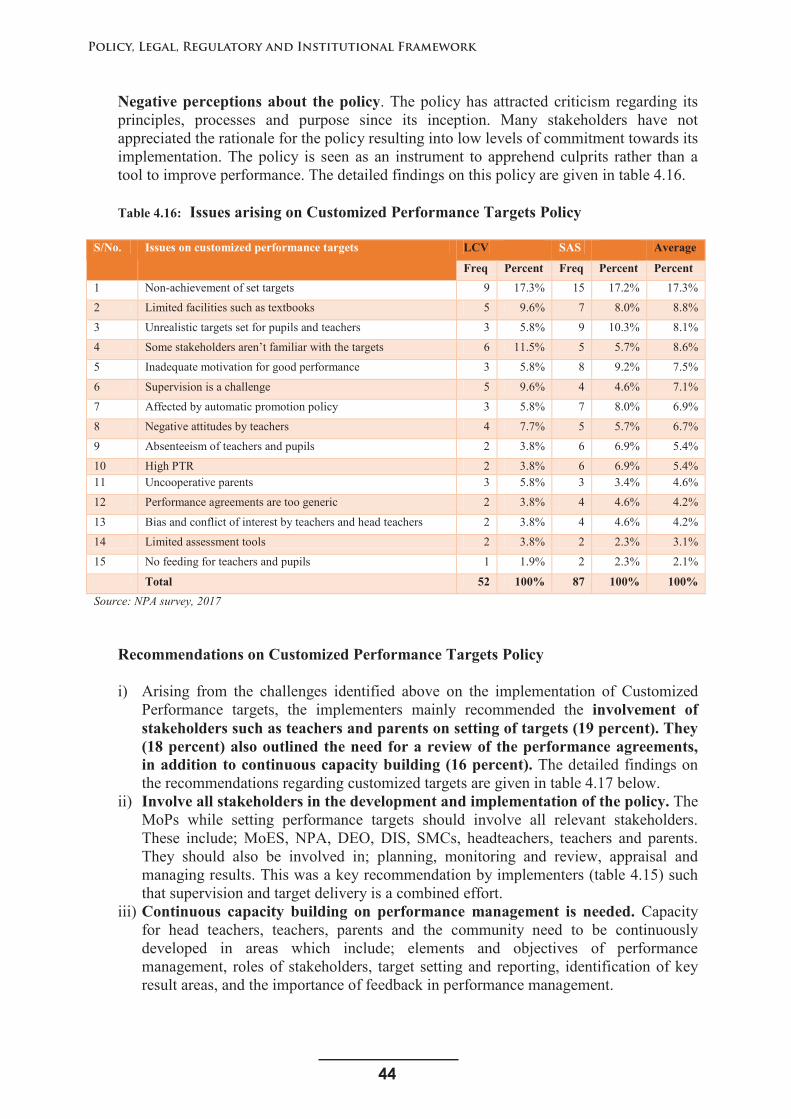
44
Policy, Legal, Regulatory and Institutional Framework
43
Negative perceptions about the policy. The policy has attracted criticism regarding its principles, processes and purpose since its inception. Many stakeholders have not appreciated the rationale for the policy resulting into low levels of commitment towards its implementation. The policy is seen as an instrument to apprehend culprits rather than a tool to improve performance. The detailed findings on this policy are given in table 4.16.
Table 4.16: Issues arising on Customized Performance Targets Policy
S/No. Issues on customized performance targets LCV SAS Average
Freq Percent Freq Percent Percent 1 Non-achievement of set targets 9 17.3% 15 17.2% 17.3%
2 Limited facilities such as textbooks 5 9.6% 7 8.0% 8.8%
3 Unrealistic targets set for pupils and teachers 3 5.8% 9 10.3% 8.1%
4 Some stakeholders aren’t familiar with the targets 6 11.5% 5 5.7% 8.6%
5 Inadequate motivation for good performance 3 5.8% 8 9.2% 7.5%
6 Supervision is a challenge 5 9.6% 4 4.6% 7.1%
7 Affected by automatic promotion policy 3 5.8% 7 8.0% 6.9%
8 Negative attitudes by teachers 4 7.7% 5 5.7% 6.7%
9 Absenteeism of teachers and pupils 2 3.8% 6 6.9% 5.4%
10 High PTR 2 3.8% 6 6.9% 5.4%11 Uncooperative parents 3 5.8% 3 3.4% 4.6%
12 Performance agreements are too generic 2 3.8% 4 4.6% 4.2%
13 Bias and conflict of interest by teachers and head teachers 2 3.8% 4 4.6% 4.2%
14 Limited assessment tools 2 3.8% 2 2.3% 3.1%
15 No feeding for teachers and pupils 1 1.9% 2 2.3% 2.1%
Total 52 100% 87 100% 100%Source: NPA survey, 2017
Recommendations on Customized Performance Targets Policy
i) Arising from the challenges identified above on the implementation of Customized Performance targets, the implementers mainly recommended the involvement of stakeholders such as teachers and parents on setting of targets (19 percent). They (18 percent) also outlined the need for a review of the performance agreements, in addition to continuous capacity building (16 percent). The detailed findings on the recommendations regarding customized targets are given in table 4.17 below.
ii) Involve all stakeholders in the development and implementation of the policy. The MoPs while setting performance targets should involve all relevant stakeholders. These include; MoES, NPA, DEO, DIS, SMCs, headteachers, teachers and parents. They should also be involved in; planning, monitoring and review, appraisal and managing results. This was a key recommendation by implementers (table 4.15) such that supervision and target delivery is a combined effort.
iii) Continuous capacity building on performance management is needed. Capacity for head teachers, teachers, parents and the community need to be continuously developed in areas which include; elements and objectives of performance management, roles of stakeholders, target setting and reporting, identification of key result areas, and the importance of feedback in performance management.

45
NATIONAL PLANNING AUTHORITY
43
Negative perceptions about the policy. The policy has attracted criticism regarding its principles, processes and purpose since its inception. Many stakeholders have not appreciated the rationale for the policy resulting into low levels of commitment towards its implementation. The policy is seen as an instrument to apprehend culprits rather than a tool to improve performance. The detailed findings on this policy are given in table 4.16.
Table 4.16: Issues arising on Customized Performance Targets Policy
S/No. Issues on customized performance targets LCV SAS Average
Freq Percent Freq Percent Percent 1 Non-achievement of set targets 9 17.3% 15 17.2% 17.3%
2 Limited facilities such as textbooks 5 9.6% 7 8.0% 8.8%
3 Unrealistic targets set for pupils and teachers 3 5.8% 9 10.3% 8.1%
4 Some stakeholders aren’t familiar with the targets 6 11.5% 5 5.7% 8.6%
5 Inadequate motivation for good performance 3 5.8% 8 9.2% 7.5%
6 Supervision is a challenge 5 9.6% 4 4.6% 7.1%
7 Affected by automatic promotion policy 3 5.8% 7 8.0% 6.9%
8 Negative attitudes by teachers 4 7.7% 5 5.7% 6.7%
9 Absenteeism of teachers and pupils 2 3.8% 6 6.9% 5.4%
10 High PTR 2 3.8% 6 6.9% 5.4%11 Uncooperative parents 3 5.8% 3 3.4% 4.6%
12 Performance agreements are too generic 2 3.8% 4 4.6% 4.2%
13 Bias and conflict of interest by teachers and head teachers 2 3.8% 4 4.6% 4.2%
14 Limited assessment tools 2 3.8% 2 2.3% 3.1%
15 No feeding for teachers and pupils 1 1.9% 2 2.3% 2.1%
Total 52 100% 87 100% 100%Source: NPA survey, 2017
Recommendations on Customized Performance Targets Policy
i) Arising from the challenges identified above on the implementation of Customized Performance targets, the implementers mainly recommended the involvement of stakeholders such as teachers and parents on setting of targets (19 percent). They (18 percent) also outlined the need for a review of the performance agreements, in addition to continuous capacity building (16 percent). The detailed findings on the recommendations regarding customized targets are given in table 4.17 below.
ii) Involve all stakeholders in the development and implementation of the policy. The MoPs while setting performance targets should involve all relevant stakeholders. These include; MoES, NPA, DEO, DIS, SMCs, headteachers, teachers and parents. They should also be involved in; planning, monitoring and review, appraisal and managing results. This was a key recommendation by implementers (table 4.15) such that supervision and target delivery is a combined effort.
iii) Continuous capacity building on performance management is needed. Capacity for head teachers, teachers, parents and the community need to be continuously developed in areas which include; elements and objectives of performance management, roles of stakeholders, target setting and reporting, identification of key result areas, and the importance of feedback in performance management.
44
iv) Address implementation challenges. There are some weaknesses in the current reporting lines as provided by the policy. Some of the sub-county chiefs do not have the capacity to effectively undertake supervision of customized performance targets. This role should be re-designated to the DIS.
v) Rewards and sanctions on performance. This policy to be effectively implemented, government should initiate annual rewards and sanctions for good and bad performance. This practice will motivate and improve performance of primary education in Uganda. Action should be taken for ability and failure to meet the targets.
Table 4.17: Follow up on recommendations on Customized Performance targets
S/N Recommendations Frequency Percent1 Involve stakeholders (teachers and parents) 13 19%2 Review the performance agreements 12 18%3 Capacity building 11 16%4 Continuous supervision and inspection of schools 10 15%5 Improve teachers’ terms of service 8 12%6 Develop and enforce penalties for those who don’t achieve targets 6 9%7 Avail scholastic materials (textbooks) 5 7%8 Hire more competent teachers 3 4%
Total 68 100%Source: NPA survey, 2017
4.2.1.7 Policy on provision of minimum necessary UPE facilities by government
Key Policy Findings
i) Additional infrastructure and facilities have been provided. However, these are inadequate. The increase in the education inputs explained the gradual improvement of some education quality indicators although still below the required targets as provided in the SFG guidelines. That is the target for every primary school is achieve a PCR of 55:1; pupil: desk ratio of 3:1; pupil: latrine ratio of 40:1 and permanent accommodation for at least four teachers. The number of classrooms increased from 40,000 in 1996 to 160,381 in 2016 which translated to the improvement in the PCR from 110 in 2000 to 56 in 2016 before it reversed to 77 in 2017. The PTR was 43:1 while the PSR was at 52:1 in 2016.
ii) The Education Act, 2008 section 34(4) provision that allows for semi-permanent buildings in private schools should be reviewed since it is below standards. The failure to uphold high standards in education service delivery in terms of infrastructure is a constraint to effective learning
iii) The School Facilities Grant (SFG) is tied and does not provide for renovationsor maintenance. Government structures have continued to be in a sorry state as there is no commitment from either government or parents to take the lead. SFG targets to increase on the stock rather than keep the existing stock in good shape. SFG is Government financing mechanism created in 1998 in the PEAP period and requires to be updated given the change in the government planning framework.
iv) Undertake needs assessment before supply of facilities to schools. Although schools identify their needs to their respective LGs, government’s priorities vary and therefore schools end up not receiving what they planned for.
46
Policy, Legal, Regulatory and Institutional Framework
45
v) Poor quality /un durable facilities. Whereas government has endeavored to provide facilities under the UPE arrangement, these have a low life span. In addition, the Education Act, 2008 section 34(4) allows for semi-permanent buildings in private schools. Implementers noted that the facilities are not durable and are of low quality. This is majorly attributed to the lack of supervision of the constructions.
The Education Act, 2008 Section 5(1(a)) provides that government through its relevant agencies shall be responsible for the provision of learning and instructional materials, structural development and teachers welfare. On the other hand, section 5(2(c)) of the Act stipulates that providing food, clothing, shelter, medical care and transport is a duty of parents. In line with the UPE implementation, the Education Act, 2008 Section 15(5) stipulates that there shall be no fees collection for building classrooms, teachers’ houses, latrines, uniforms, buying text books, furniture, test or examinations but a school in the area of jurisdiction of an urban council may levy a charge for administrative and utility expenses not exceeding 10,400/= per school year or as may be prescribed from time to time and subject to this regulation, any school may levy a charge for mid-day meals as determined by the management committee in consultation with the district council. The Education Act, 2008 Section 21(m(iv)), further provides that the headteacher shall ensure that the school community participates in the general maintenance and up-keep of the school; and under Section 31(4) of the Act, buildings in semi-permanent material are acceptable in private schools if approved by the appropriate authorities.
The Education Act (2008) legalized the 1998 UPE Implementation Guidelines. Under these Guidelines, government is responsible for the provision of textbooks, teachers guide,construction of basic school facilities such as classrooms, teacher houses, and libraries and supervision of the implementation of UPE activities. On the other hand, parents were supposed to provide scholastic materials, clothing and meals for their children and ensure proper utilization of UPE funds. To facilitate the implementation of UPE, Government continues to provide capitation grants (CG) to schools of about UGX 10,000 per pupil per year to be spent on instructional materials, co-curricular activities, school management and on school administration. Under the school facilities grant (SFG) governmentconstructs new classrooms, renovates/rehabilitates dilapidated classrooms, constructteachers’ houses and purchases classroom furniture for the pupils and teachers.
Issues on the provision of minimum necessary UPE facilities
i) Education Act, 2008 section 31(4) acceptance of semi-permanent buildings is inappropriate and lowers education standards. The provision in the Education Act,2008 that allows private schools to have buildings in semi-permanent materialspossess a standards issue. The failure to uphold high standards in education service delivery in terms of infrastructure is a constraint to effective learning. This provision needs to be revised to comply to the required minimum standards of constructing permanent structures in education for both private and primary schools.
ii) Inadequate Budget Provisions. Whereas pupil enrollment has been increasing, budget provisions by MoFPED and donors have failed to match the requirements to cater for this surge. The public spending at primary education has not kept pace with the increase in enrolment. This has led to inadequacies in school facilities,
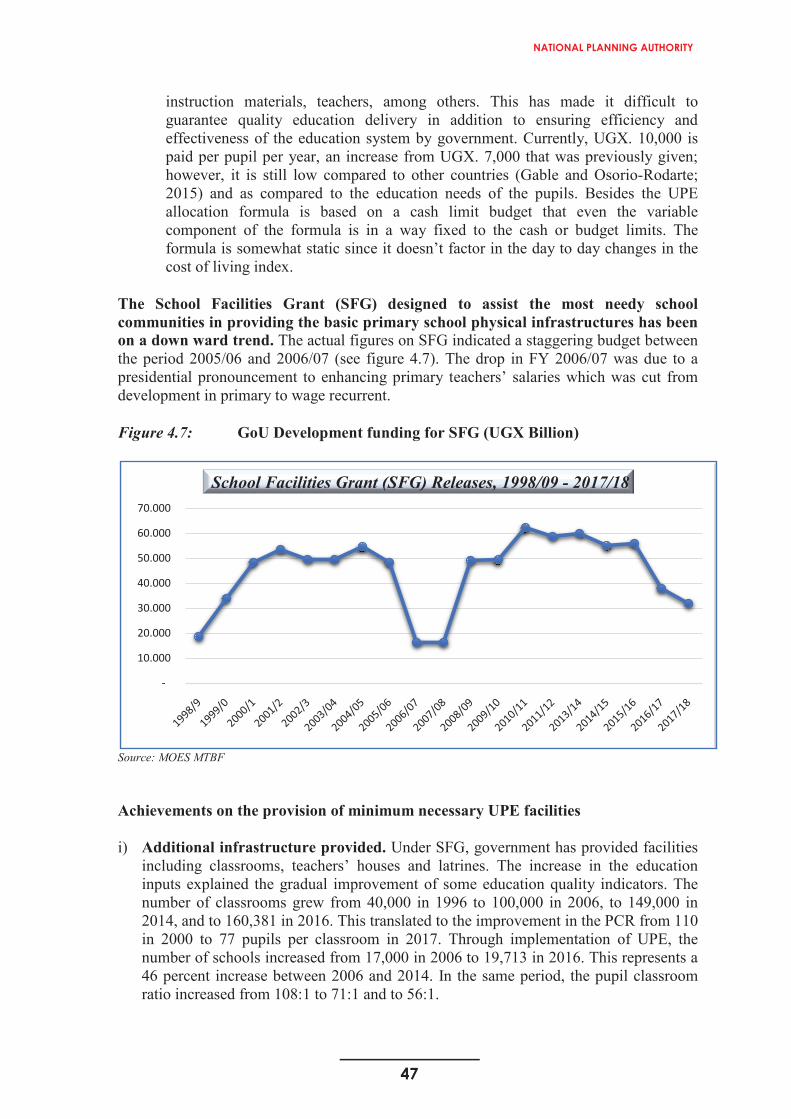
47
NATIONAL PLANNING AUTHORITY
45
v) Poor quality /un durable facilities. Whereas government has endeavored to provide facilities under the UPE arrangement, these have a low life span. In addition, the Education Act, 2008 section 34(4) allows for semi-permanent buildings in private schools. Implementers noted that the facilities are not durable and are of low quality. This is majorly attributed to the lack of supervision of the constructions.
The Education Act, 2008 Section 5(1(a)) provides that government through its relevant agencies shall be responsible for the provision of learning and instructional materials, structural development and teachers welfare. On the other hand, section 5(2(c)) of the Act stipulates that providing food, clothing, shelter, medical care and transport is a duty of parents. In line with the UPE implementation, the Education Act, 2008 Section 15(5) stipulates that there shall be no fees collection for building classrooms, teachers’ houses, latrines, uniforms, buying text books, furniture, test or examinations but a school in the area of jurisdiction of an urban council may levy a charge for administrative and utility expenses not exceeding 10,400/= per school year or as may be prescribed from time to time and subject to this regulation, any school may levy a charge for mid-day meals as determined by the management committee in consultation with the district council. The Education Act, 2008 Section 21(m(iv)), further provides that the headteacher shall ensure that the school community participates in the general maintenance and up-keep of the school; and under Section 31(4) of the Act, buildings in semi-permanent material are acceptable in private schools if approved by the appropriate authorities.
The Education Act (2008) legalized the 1998 UPE Implementation Guidelines. Under these Guidelines, government is responsible for the provision of textbooks, teachers guide,construction of basic school facilities such as classrooms, teacher houses, and libraries and supervision of the implementation of UPE activities. On the other hand, parents were supposed to provide scholastic materials, clothing and meals for their children and ensure proper utilization of UPE funds. To facilitate the implementation of UPE, Government continues to provide capitation grants (CG) to schools of about UGX 10,000 per pupil per year to be spent on instructional materials, co-curricular activities, school management and on school administration. Under the school facilities grant (SFG) governmentconstructs new classrooms, renovates/rehabilitates dilapidated classrooms, constructteachers’ houses and purchases classroom furniture for the pupils and teachers.
Issues on the provision of minimum necessary UPE facilities
i) Education Act, 2008 section 31(4) acceptance of semi-permanent buildings is inappropriate and lowers education standards. The provision in the Education Act,2008 that allows private schools to have buildings in semi-permanent materialspossess a standards issue. The failure to uphold high standards in education service delivery in terms of infrastructure is a constraint to effective learning. This provision needs to be revised to comply to the required minimum standards of constructing permanent structures in education for both private and primary schools.
ii) Inadequate Budget Provisions. Whereas pupil enrollment has been increasing, budget provisions by MoFPED and donors have failed to match the requirements to cater for this surge. The public spending at primary education has not kept pace with the increase in enrolment. This has led to inadequacies in school facilities,
46
instruction materials, teachers, among others. This has made it difficult to guarantee quality education delivery in addition to ensuring efficiency and effectiveness of the education system by government. Currently, UGX. 10,000 is paid per pupil per year, an increase from UGX. 7,000 that was previously given; however, it is still low compared to other countries (Gable and Osorio-Rodarte; 2015) and as compared to the education needs of the pupils. Besides the UPE allocation formula is based on a cash limit budget that even the variable component of the formula is in a way fixed to the cash or budget limits. The formula is somewhat static since it doesn’t factor in the day to day changes in the cost of living index.
The School Facilities Grant (SFG) designed to assist the most needy school communities in providing the basic primary school physical infrastructures has been on a down ward trend. The actual figures on SFG indicated a staggering budget between the period 2005/06 and 2006/07 (see figure 4.7). The drop in FY 2006/07 was due to a presidential pronouncement to enhancing primary teachers’ salaries which was cut from development in primary to wage recurrent.
Figure 4.7: GoU Development funding for SFG (UGX Billion)
Source: MOES MTBF
Achievements on the provision of minimum necessary UPE facilities
i) Additional infrastructure provided. Under SFG, government has provided facilities including classrooms, teachers’ houses and latrines. The increase in the education inputs explained the gradual improvement of some education quality indicators. The number of classrooms grew from 40,000 in 1996 to 100,000 in 2006, to 149,000 in 2014, and to 160,381 in 2016. This translated to the improvement in the PCR from 110 in 2000 to 77 pupils per classroom in 2017. Through implementation of UPE, the number of schools increased from 17,000 in 2006 to 19,713 in 2016. This represents a 46 percent increase between 2006 and 2014. In the same period, the pupil classroom ratio increased from 108:1 to 71:1 and to 56:1.
-
10.000
20.000
30.000
40.000
50.000
60.000
70.000
School Facilities Grant (SFG) Releases, 1998/09 - 2017/18
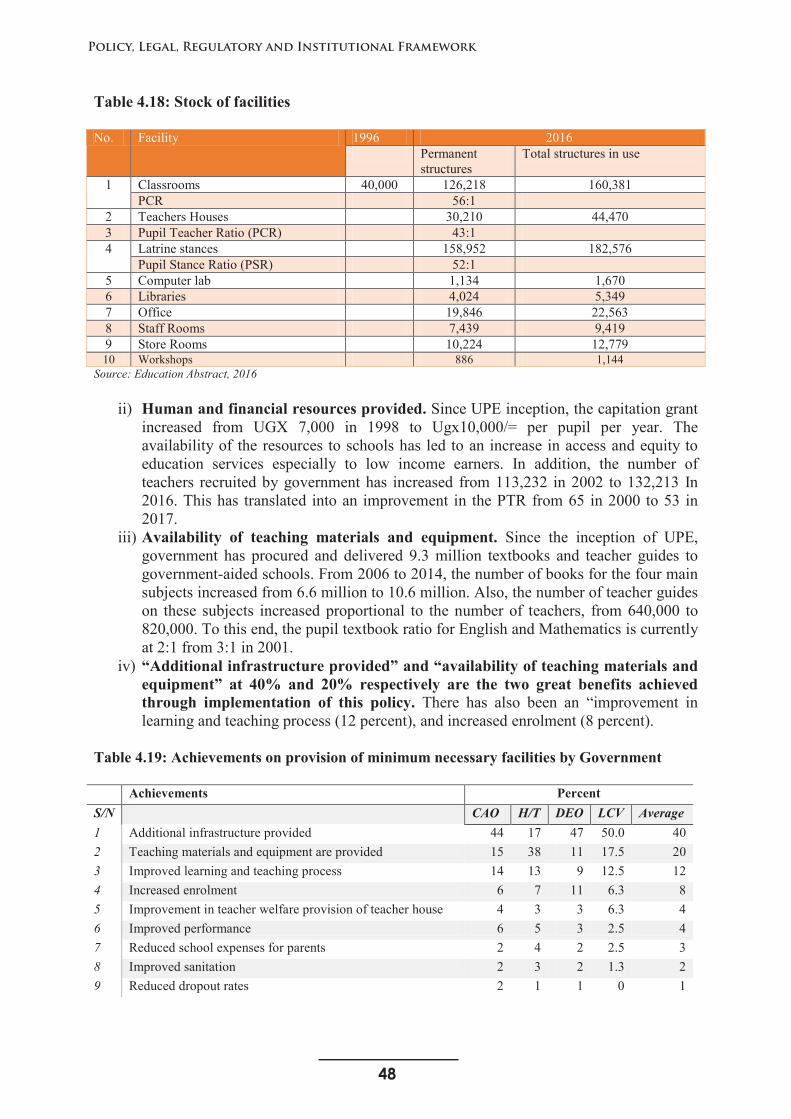
48
Policy, Legal, Regulatory and Institutional Framework
47
Table 4.18: Stock of facilities
No. Facility 1996 2016Permanent structures
Total structures in use
1 Classrooms 40,000 126,218 160,381PCR 56:1
2 Teachers Houses 30,210 44,4703 Pupil Teacher Ratio (PCR) 43:14 Latrine stances 158,952 182,576
Pupil Stance Ratio (PSR) 52:15 Computer lab 1,134 1,670 6 Libraries 4,024 5,349 7 Office 19,846 22,563 8 Staff Rooms 7,439 9,419 9 Store Rooms 10,224 12,779 10 Workshops 886 1,144
Source: Education Abstract, 2016
ii) Human and financial resources provided. Since UPE inception, the capitation grant increased from UGX 7,000 in 1998 to Ugx10,000/= per pupil per year. The availability of the resources to schools has led to an increase in access and equity to education services especially to low income earners. In addition, the number of teachers recruited by government has increased from 113,232 in 2002 to 132,213 In 2016. This has translated into an improvement in the PTR from 65 in 2000 to 53 in 2017.
iii) Availability of teaching materials and equipment. Since the inception of UPE, government has procured and delivered 9.3 million textbooks and teacher guides to government-aided schools. From 2006 to 2014, the number of books for the four main subjects increased from 6.6 million to 10.6 million. Also, the number of teacher guides on these subjects increased proportional to the number of teachers, from 640,000 to 820,000. To this end, the pupil textbook ratio for English and Mathematics is currently at 2:1 from 3:1 in 2001.
iv) “Additional infrastructure provided” and “availability of teaching materials and equipment” at 40% and 20% respectively are the two great benefits achieved through implementation of this policy. There has also been an “improvement in learning and teaching process (12 percent), and increased enrolment (8 percent).
Table 4.19: Achievements on provision of minimum necessary facilities by Government
Achievements PercentS/N CAO H/T DEO LCV Average1 Additional infrastructure provided 44 17 47 50.0 402 Teaching materials and equipment are provided 15 38 11 17.5 203 Improved learning and teaching process 14 13 9 12.5 124 Increased enrolment 6 7 11 6.3 85 Improvement in teacher welfare provision of teacher house 4 3 3 6.3 46 Improved performance 6 5 3 2.5 47 Reduced school expenses for parents 2 4 2 2.5 38 Improved sanitation 2 3 2 1.3 29 Reduced dropout rates 2 1 1 0 1
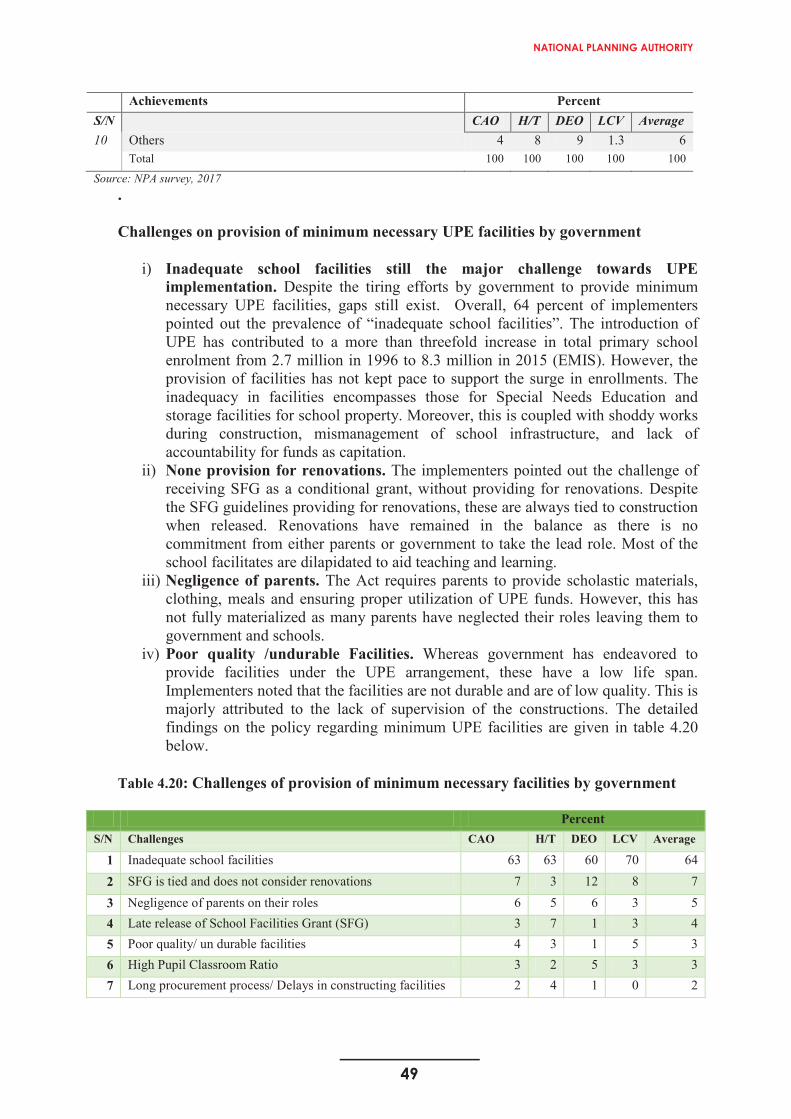
49
NATIONAL PLANNING AUTHORITY
47
Table 4.18: Stock of facilities
No. Facility 1996 2016Permanent structures
Total structures in use
1 Classrooms 40,000 126,218 160,381PCR 56:1
2 Teachers Houses 30,210 44,4703 Pupil Teacher Ratio (PCR) 43:14 Latrine stances 158,952 182,576
Pupil Stance Ratio (PSR) 52:15 Computer lab 1,134 1,670 6 Libraries 4,024 5,349 7 Office 19,846 22,563 8 Staff Rooms 7,439 9,419 9 Store Rooms 10,224 12,779 10 Workshops 886 1,144
Source: Education Abstract, 2016
ii) Human and financial resources provided. Since UPE inception, the capitation grant increased from UGX 7,000 in 1998 to Ugx10,000/= per pupil per year. The availability of the resources to schools has led to an increase in access and equity to education services especially to low income earners. In addition, the number of teachers recruited by government has increased from 113,232 in 2002 to 132,213 In 2016. This has translated into an improvement in the PTR from 65 in 2000 to 53 in 2017.
iii) Availability of teaching materials and equipment. Since the inception of UPE, government has procured and delivered 9.3 million textbooks and teacher guides to government-aided schools. From 2006 to 2014, the number of books for the four main subjects increased from 6.6 million to 10.6 million. Also, the number of teacher guides on these subjects increased proportional to the number of teachers, from 640,000 to 820,000. To this end, the pupil textbook ratio for English and Mathematics is currently at 2:1 from 3:1 in 2001.
iv) “Additional infrastructure provided” and “availability of teaching materials and equipment” at 40% and 20% respectively are the two great benefits achieved through implementation of this policy. There has also been an “improvement in learning and teaching process (12 percent), and increased enrolment (8 percent).
Table 4.19: Achievements on provision of minimum necessary facilities by Government
Achievements PercentS/N CAO H/T DEO LCV Average1 Additional infrastructure provided 44 17 47 50.0 402 Teaching materials and equipment are provided 15 38 11 17.5 203 Improved learning and teaching process 14 13 9 12.5 124 Increased enrolment 6 7 11 6.3 85 Improvement in teacher welfare provision of teacher house 4 3 3 6.3 46 Improved performance 6 5 3 2.5 47 Reduced school expenses for parents 2 4 2 2.5 38 Improved sanitation 2 3 2 1.3 29 Reduced dropout rates 2 1 1 0 1
48
Achievements PercentS/N CAO H/T DEO LCV Average10 Others 4 8 9 1.3 6
Total 100 100 100 100 100
Source: NPA survey, 2017.
Challenges on provision of minimum necessary UPE facilities by government
i) Inadequate school facilities still the major challenge towards UPE implementation. Despite the tiring efforts by government to provide minimum necessary UPE facilities, gaps still exist. Overall, 64 percent of implementers pointed out the prevalence of “inadequate school facilities”. The introduction of UPE has contributed to a more than threefold increase in total primary school enrolment from 2.7 million in 1996 to 8.3 million in 2015 (EMIS). However, the provision of facilities has not kept pace to support the surge in enrollments. The inadequacy in facilities encompasses those for Special Needs Education and storage facilities for school property. Moreover, this is coupled with shoddy works during construction, mismanagement of school infrastructure, and lack of accountability for funds as capitation.
ii) None provision for renovations. The implementers pointed out the challenge of receiving SFG as a conditional grant, without providing for renovations. Despite the SFG guidelines providing for renovations, these are always tied to construction when released. Renovations have remained in the balance as there is no commitment from either parents or government to take the lead role. Most of the school facilitates are dilapidated to aid teaching and learning.
iii) Negligence of parents. The Act requires parents to provide scholastic materials, clothing, meals and ensuring proper utilization of UPE funds. However, this has not fully materialized as many parents have neglected their roles leaving them to government and schools.
iv) Poor quality /undurable Facilities. Whereas government has endeavored to provide facilities under the UPE arrangement, these have a low life span. Implementers noted that the facilities are not durable and are of low quality. This is majorly attributed to the lack of supervision of the constructions. The detailed findings on the policy regarding minimum UPE facilities are given in table 4.20below.
Table 4.20: Challenges of provision of minimum necessary facilities by government
PercentS/N Challenges CAO H/T DEO LCV Average
1 Inadequate school facilities 63 63 60 70 642 SFG is tied and does not consider renovations 7 3 12 8 73 Negligence of parents on their roles 6 5 6 3 54 Late release of School Facilities Grant (SFG) 3 7 1 3 45 Poor quality/ un durable facilities 4 3 1 5 36 High Pupil Classroom Ratio 3 2 5 3 37 Long procurement process/ Delays in constructing facilities 2 4 1 0 2
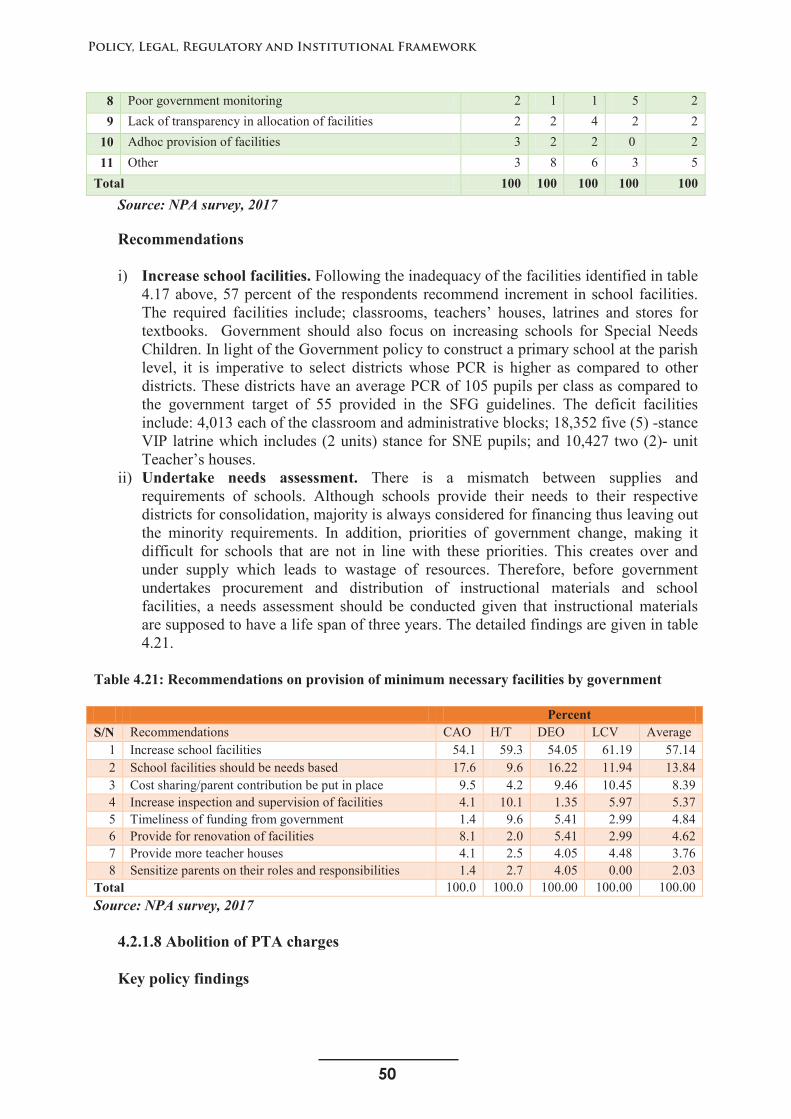
50
Policy, Legal, Regulatory and Institutional Framework
49
8 Poor government monitoring 2 1 1 5 29 Lack of transparency in allocation of facilities 2 2 4 2 2
10 Adhoc provision of facilities 3 2 2 0 211 Other 3 8 6 3 5
Total 100 100 100 100 100Source: NPA survey, 2017
Recommendations
i) Increase school facilities. Following the inadequacy of the facilities identified in table 4.17 above, 57 percent of the respondents recommend increment in school facilities. The required facilities include; classrooms, teachers’ houses, latrines and stores for textbooks. Government should also focus on increasing schools for Special Needs Children. In light of the Government policy to construct a primary school at the parish level, it is imperative to select districts whose PCR is higher as compared to other districts. These districts have an average PCR of 105 pupils per class as compared to the government target of 55 provided in the SFG guidelines. The deficit facilities include: 4,013 each of the classroom and administrative blocks; 18,352 five (5) -stance VIP latrine which includes (2 units) stance for SNE pupils; and 10,427 two (2)- unit Teacher’s houses.
ii) Undertake needs assessment. There is a mismatch between supplies and requirements of schools. Although schools provide their needs to their respective districts for consolidation, majority is always considered for financing thus leaving out the minority requirements. In addition, priorities of government change, making it difficult for schools that are not in line with these priorities. This creates over and under supply which leads to wastage of resources. Therefore, before government undertakes procurement and distribution of instructional materials and schoolfacilities, a needs assessment should be conducted given that instructional materials are supposed to have a life span of three years. The detailed findings are given in table 4.21.
Table 4.21: Recommendations on provision of minimum necessary facilities by government
PercentS/N Recommendations CAO H/T DEO LCV Average
1 Increase school facilities 54.1 59.3 54.05 61.19 57.142 School facilities should be needs based 17.6 9.6 16.22 11.94 13.843 Cost sharing/parent contribution be put in place 9.5 4.2 9.46 10.45 8.394 Increase inspection and supervision of facilities 4.1 10.1 1.35 5.97 5.375 Timeliness of funding from government 1.4 9.6 5.41 2.99 4.846 Provide for renovation of facilities 8.1 2.0 5.41 2.99 4.627 Provide more teacher houses 4.1 2.5 4.05 4.48 3.768 Sensitize parents on their roles and responsibilities 1.4 2.7 4.05 0.00 2.03
Total 100.0 100.0 100.00 100.00 100.00Source: NPA survey, 2017
4.2.1.8 Abolition of PTA charges
Key policy findings
51
NATIONAL PLANNING AUTHORITY
49
8 Poor government monitoring 2 1 1 5 29 Lack of transparency in allocation of facilities 2 2 4 2 2
10 Adhoc provision of facilities 3 2 2 0 211 Other 3 8 6 3 5
Total 100 100 100 100 100Source: NPA survey, 2017
Recommendations
i) Increase school facilities. Following the inadequacy of the facilities identified in table 4.17 above, 57 percent of the respondents recommend increment in school facilities. The required facilities include; classrooms, teachers’ houses, latrines and stores for textbooks. Government should also focus on increasing schools for Special Needs Children. In light of the Government policy to construct a primary school at the parish level, it is imperative to select districts whose PCR is higher as compared to other districts. These districts have an average PCR of 105 pupils per class as compared to the government target of 55 provided in the SFG guidelines. The deficit facilities include: 4,013 each of the classroom and administrative blocks; 18,352 five (5) -stance VIP latrine which includes (2 units) stance for SNE pupils; and 10,427 two (2)- unit Teacher’s houses.
ii) Undertake needs assessment. There is a mismatch between supplies and requirements of schools. Although schools provide their needs to their respective districts for consolidation, majority is always considered for financing thus leaving out the minority requirements. In addition, priorities of government change, making it difficult for schools that are not in line with these priorities. This creates over and under supply which leads to wastage of resources. Therefore, before government undertakes procurement and distribution of instructional materials and schoolfacilities, a needs assessment should be conducted given that instructional materials are supposed to have a life span of three years. The detailed findings are given in table 4.21.
Table 4.21: Recommendations on provision of minimum necessary facilities by government
PercentS/N Recommendations CAO H/T DEO LCV Average
1 Increase school facilities 54.1 59.3 54.05 61.19 57.142 School facilities should be needs based 17.6 9.6 16.22 11.94 13.843 Cost sharing/parent contribution be put in place 9.5 4.2 9.46 10.45 8.394 Increase inspection and supervision of facilities 4.1 10.1 1.35 5.97 5.375 Timeliness of funding from government 1.4 9.6 5.41 2.99 4.846 Provide for renovation of facilities 8.1 2.0 5.41 2.99 4.627 Provide more teacher houses 4.1 2.5 4.05 4.48 3.768 Sensitize parents on their roles and responsibilities 1.4 2.7 4.05 0.00 2.03
Total 100.0 100.0 100.00 100.00 100.00Source: NPA survey, 2017
4.2.1.8 Abolition of PTA charges
Key policy findings
50
i) Abolition of PTA charges dramatically increased pupil enrollment in government-aided schools between 1996 to 1997; where an additional 2.2 million pupils entering primary school was registered.
ii) Abolition of PTA charges relieved parents of the extra charges and therefore made education more affordable by all. In most cases pupils were always sent back home after failure to pay the extra charges
iii) Increased the relationship between parents and schools. Parents used to hide from schools because of being defaulters. Following the abolition, parents became close to the school administration thus bridging the gap.
iv) Increased congestion in schools/classrooms. PTA charges aided schools to construct additional infrastructure. However, the abolition worsened PCR and PTR as additional requisite infrastructure and teachers to cater for the increased pupil enrollment has not been timely provided by government. To a great extent, school infrastructure has dilapidated due to abolition of PTA charges
v) Schools fail to meet their financial obligations. Prior to the introduction of UPE, most schools charged additional fees through these associations and the money was used to supplement teachers’ salaries. But with the advent of UPE, government abolished tuition fees and PTA charges in its aided schools. Most schools regret this as they are un able to meet the costs of funding since they only depend on central government transfers.
vi) Most parents have neglected their roles towards ensuring learning for their children. Abolition of PTA charges was misunderstood and therefore most parents have neglected their roles in education service delivery with respect to provision of basic needs, scholastic materials and maintenance/renovation of school infrastructure.
vii)Expected income and substitution effects from the school fees waiver have not been realized due to high poverty rates in the country.
viii) PTA fees were not backed by adequate consultations on parents’ willingness to pay.
ix) Limited adherence to the policy as some schools have not followed it.
The Parents Teachers Associations (PTAs) were formed by the religious authorities and the parents as a result of the enactment of the 1963 Education Act. The purpose of PTA was to generate money that would be used to: build new classrooms and to maintain the old ones; boost the teachers' salaries; and subsidize the school fees payable by the parents. Eventually the parents would be paying decreasing school fees if not that, the school fees would be kept constant without being raised every term. This would also endear these schools to parents. Parents and teachers of respective schools would agree on the amount, which varied from school to school.
Based on the 1992 white paper recommendation, in particular providing free basic primary education, government funding did not lead to increase enrollment, owing to the fact that PTA charges were still paid in most schools as this additional funding was complementing and not substituting these fees. Charging PTA and all tuition fees were abolished at the onset of UPE following the general elections of 1996 by H.E the President of Uganda Yoweri Kaguta Museveni.
Achievements following abolition of PTA charges
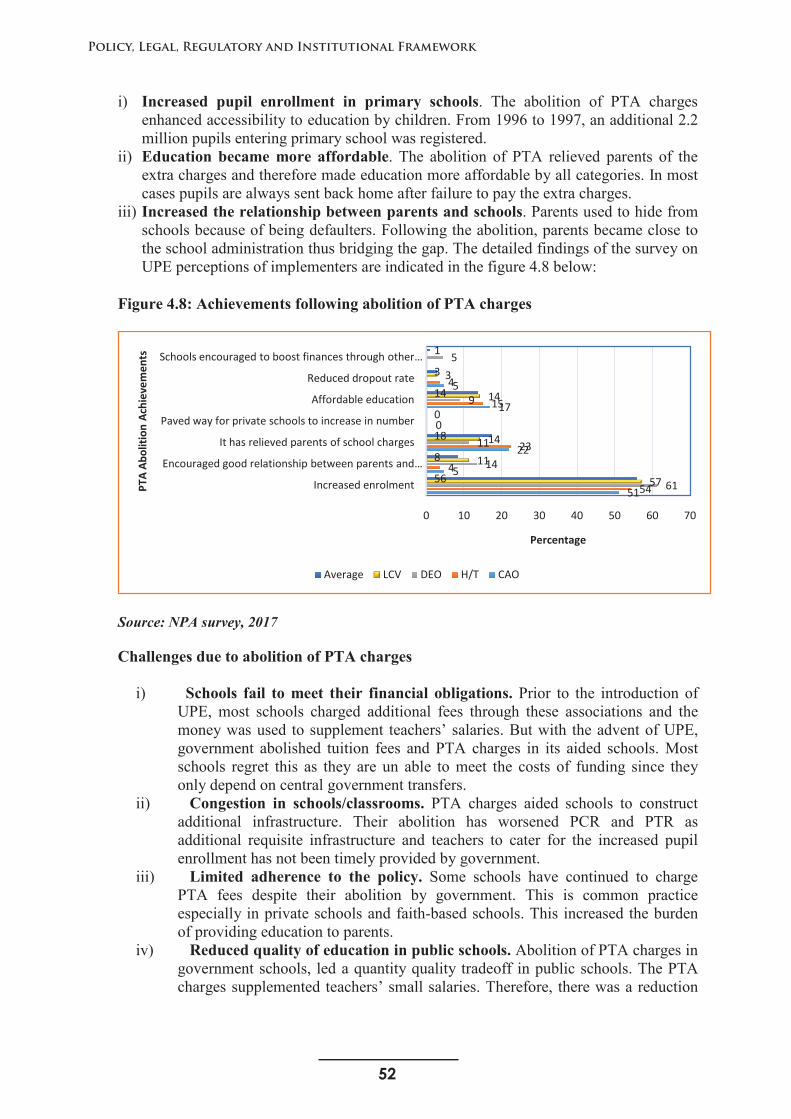
52
Policy, Legal, Regulatory and Institutional Framework
51
i) Increased pupil enrollment in primary schools. The abolition of PTA charges enhanced accessibility to education by children. From 1996 to 1997, an additional 2.2 million pupils entering primary school was registered.
ii) Education became more affordable. The abolition of PTA relieved parents of the extra charges and therefore made education more affordable by all categories. In mostcases pupils are always sent back home after failure to pay the extra charges.
iii) Increased the relationship between parents and schools. Parents used to hide from schools because of being defaulters. Following the abolition, parents became close to the school administration thus bridging the gap. The detailed findings of the survey on UPE perceptions of implementers are indicated in the figure 4.8 below:
Figure 4.8: Achievements following abolition of PTA charges
Source: NPA survey, 2017
Challenges due to abolition of PTA charges
i) Schools fail to meet their financial obligations. Prior to the introduction of UPE, most schools charged additional fees through these associations and the money was used to supplement teachers’ salaries. But with the advent of UPE, government abolished tuition fees and PTA charges in its aided schools. Most schools regret this as they are un able to meet the costs of funding since they only depend on central government transfers.
ii) Congestion in schools/classrooms. PTA charges aided schools to construct additional infrastructure. Their abolition has worsened PCR and PTR as additional requisite infrastructure and teachers to cater for the increased pupil enrollment has not been timely provided by government.
iii) Limited adherence to the policy. Some schools have continued to charge PTA fees despite their abolition by government. This is common practice especially in private schools and faith-based schools. This increased the burden of providing education to parents.
iv) Reduced quality of education in public schools. Abolition of PTA charges in government schools, led a quantity quality tradeoff in public schools. The PTA charges supplemented teachers’ small salaries. Therefore, there was a reduction
51
5
22
17
5
54
4
23
0
15
4
61
14
11
9
5
57
11
14
14
3
56
8
18
0
14
3
1
0 10 20 30 40 50 60 70
Increased enrolment
Encouraged good relationship between parents and …
It has relieved parents of school charges
Paved way for private schools to increase in number
Affordable education
Reduced dropout rate
Schools encouraged to boost finances through other …
Percentage
PTA
Abol
ition
Ach
ieve
men
ts
Average LCV DEO H/T CAO
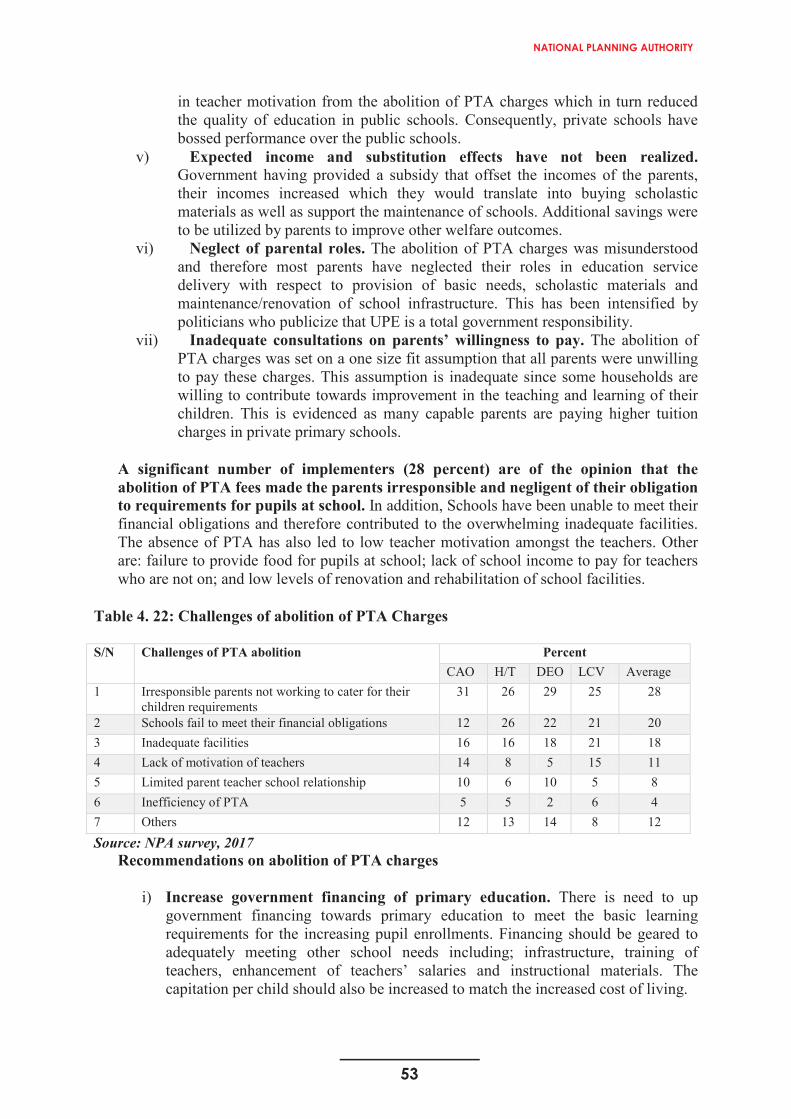
53
NATIONAL PLANNING AUTHORITY
51
i) Increased pupil enrollment in primary schools. The abolition of PTA charges enhanced accessibility to education by children. From 1996 to 1997, an additional 2.2 million pupils entering primary school was registered.
ii) Education became more affordable. The abolition of PTA relieved parents of the extra charges and therefore made education more affordable by all categories. In mostcases pupils are always sent back home after failure to pay the extra charges.
iii) Increased the relationship between parents and schools. Parents used to hide from schools because of being defaulters. Following the abolition, parents became close to the school administration thus bridging the gap. The detailed findings of the survey on UPE perceptions of implementers are indicated in the figure 4.8 below:
Figure 4.8: Achievements following abolition of PTA charges
Source: NPA survey, 2017
Challenges due to abolition of PTA charges
i) Schools fail to meet their financial obligations. Prior to the introduction of UPE, most schools charged additional fees through these associations and the money was used to supplement teachers’ salaries. But with the advent of UPE, government abolished tuition fees and PTA charges in its aided schools. Most schools regret this as they are un able to meet the costs of funding since they only depend on central government transfers.
ii) Congestion in schools/classrooms. PTA charges aided schools to construct additional infrastructure. Their abolition has worsened PCR and PTR as additional requisite infrastructure and teachers to cater for the increased pupil enrollment has not been timely provided by government.
iii) Limited adherence to the policy. Some schools have continued to charge PTA fees despite their abolition by government. This is common practice especially in private schools and faith-based schools. This increased the burden of providing education to parents.
iv) Reduced quality of education in public schools. Abolition of PTA charges in government schools, led a quantity quality tradeoff in public schools. The PTA charges supplemented teachers’ small salaries. Therefore, there was a reduction
51
5
22
17
5
54
4
23
0
15
4
61
14
11
9
5
57
11
14
14
3
56
8
18
0
14
3
1
0 10 20 30 40 50 60 70
Increased enrolment
Encouraged good relationship between parents and …
It has relieved parents of school charges
Paved way for private schools to increase in number
Affordable education
Reduced dropout rate
Schools encouraged to boost finances through other …
Percentage
PTA
Abol
ition
Ach
ieve
men
ts
Average LCV DEO H/T CAO
52
in teacher motivation from the abolition of PTA charges which in turn reduced the quality of education in public schools. Consequently, private schools have bossed performance over the public schools.
v) Expected income and substitution effects have not been realized.Government having provided a subsidy that offset the incomes of the parents, their incomes increased which they would translate into buying scholastic materials as well as support the maintenance of schools. Additional savings were to be utilized by parents to improve other welfare outcomes.
vi) Neglect of parental roles. The abolition of PTA charges was misunderstood and therefore most parents have neglected their roles in education service delivery with respect to provision of basic needs, scholastic materials and maintenance/renovation of school infrastructure. This has been intensified by politicians who publicize that UPE is a total government responsibility.
vii) Inadequate consultations on parents’ willingness to pay. The abolition of PTA charges was set on a one size fit assumption that all parents were unwilling to pay these charges. This assumption is inadequate since some households are willing to contribute towards improvement in the teaching and learning of their children. This is evidenced as many capable parents are paying higher tuition charges in private primary schools.
A significant number of implementers (28 percent) are of the opinion that the abolition of PTA fees made the parents irresponsible and negligent of their obligation to requirements for pupils at school. In addition, Schools have been unable to meet their financial obligations and therefore contributed to the overwhelming inadequate facilities. The absence of PTA has also led to low teacher motivation amongst the teachers. Other are: failure to provide food for pupils at school; lack of school income to pay for teachers who are not on; and low levels of renovation and rehabilitation of school facilities.
Table 4. 22: Challenges of abolition of PTA Charges
S/N Challenges of PTA abolition PercentCAO H/T DEO LCV Average
1 Irresponsible parents not working to cater for their children requirements
31 26 29 25 28
2 Schools fail to meet their financial obligations 12 26 22 21 203 Inadequate facilities 16 16 18 21 184 Lack of motivation of teachers 14 8 5 15 115 Limited parent teacher school relationship 10 6 10 5 86 Inefficiency of PTA 5 5 2 6 47 Others 12 13 14 8 12Source: NPA survey, 2017
Recommendations on abolition of PTA charges
i) Increase government financing of primary education. There is need to up government financing towards primary education to meet the basic learning requirements for the increasing pupil enrollments. Financing should be geared to adequately meeting other school needs including; infrastructure, training of teachers, enhancement of teachers’ salaries and instructional materials. The capitation per child should also be increased to match the increased cost of living.
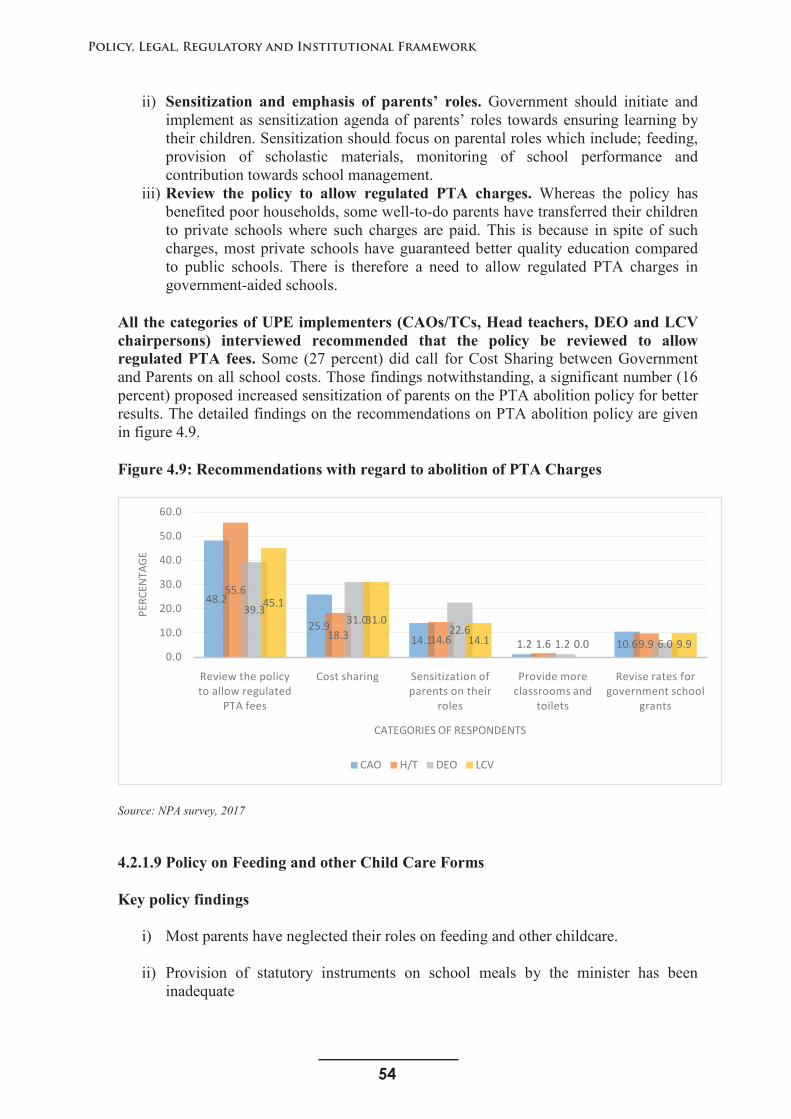
54
Policy, Legal, Regulatory and Institutional Framework
53
ii) Sensitization and emphasis of parents’ roles. Government should initiate and implement as sensitization agenda of parents’ roles towards ensuring learning by their children. Sensitization should focus on parental roles which include; feeding, provision of scholastic materials, monitoring of school performance and contribution towards school management.
iii) Review the policy to allow regulated PTA charges. Whereas the policy has benefited poor households, some well-to-do parents have transferred their children to private schools where such charges are paid. This is because in spite of such charges, most private schools have guaranteed better quality education compared to public schools. There is therefore a need to allow regulated PTA charges in government-aided schools.
All the categories of UPE implementers (CAOs/TCs, Head teachers, DEO and LCV chairpersons) interviewed recommended that the policy be reviewed to allow regulated PTA fees. Some (27 percent) did call for Cost Sharing between Government and Parents on all school costs. Those findings notwithstanding, a significant number (16 percent) proposed increased sensitization of parents on the PTA abolition policy for better results. The detailed findings on the recommendations on PTA abolition policy are given in figure 4.9.
Figure 4.9: Recommendations with regard to abolition of PTA Charges
Source: NPA survey, 2017
4.2.1.9 Policy on Feeding and other Child Care Forms
Key policy findings
i) Most parents have neglected their roles on feeding and other childcare.
ii) Provision of statutory instruments on school meals by the minister has been inadequate
48.2
25.914.1 1.2 10.6
55.6
18.3 14.6 1.6 9.9
39.331.0
22.61.2 6.0
45.131.0
14.1 0.0 9.90.0
10.0
20.0
30.0
40.0
50.0
60.0
Review the policy to allow regulated
PTA fees
Cost sharing Sensitization of parents on their
roles
Provide more classrooms and
toilets
Revise rates for government school
grants
PERC
ENTA
GE
CATEGORIES OF RESPONDENTS
CAO H/T DEO LCV
55
NATIONAL PLANNING AUTHORITY
53
ii) Sensitization and emphasis of parents’ roles. Government should initiate and implement as sensitization agenda of parents’ roles towards ensuring learning by their children. Sensitization should focus on parental roles which include; feeding, provision of scholastic materials, monitoring of school performance and contribution towards school management.
iii) Review the policy to allow regulated PTA charges. Whereas the policy has benefited poor households, some well-to-do parents have transferred their children to private schools where such charges are paid. This is because in spite of such charges, most private schools have guaranteed better quality education compared to public schools. There is therefore a need to allow regulated PTA charges in government-aided schools.
All the categories of UPE implementers (CAOs/TCs, Head teachers, DEO and LCV chairpersons) interviewed recommended that the policy be reviewed to allow regulated PTA fees. Some (27 percent) did call for Cost Sharing between Government and Parents on all school costs. Those findings notwithstanding, a significant number (16 percent) proposed increased sensitization of parents on the PTA abolition policy for better results. The detailed findings on the recommendations on PTA abolition policy are given in figure 4.9.
Figure 4.9: Recommendations with regard to abolition of PTA Charges
Source: NPA survey, 2017
4.2.1.9 Policy on Feeding and other Child Care Forms
Key policy findings
i) Most parents have neglected their roles on feeding and other childcare.
ii) Provision of statutory instruments on school meals by the minister has been inadequate
48.2
25.914.1 1.2 10.6
55.6
18.3 14.6 1.6 9.9
39.331.0
22.61.2 6.0
45.131.0
14.1 0.0 9.90.0
10.0
20.0
30.0
40.0
50.0
60.0
Review the policy to allow regulated
PTA fees
Cost sharing Sensitization of parents on their
roles
Provide more classrooms and
toilets
Revise rates for government school
grants
PERC
ENTA
GE
CATEGORIES OF RESPONDENTS
CAO H/T DEO LCV
54
iii) Ignorance of most parents on the provisions of their roles in the Act.
iv) In many cases, there is, misuse of funds by school management committees.
v) Provision of school meals has increased school attendance and improved schoolperformance.
vi) Continued socioeconomic support to marginalized areas is still needed.
The Education Act, 2008 section 5(2)(a) clearly stipulates the responsibilities of the parents and guardians to include feeding, clothing, shelter, medical care and transport to the children. The Act further requires that: (i) the Minister shall from time to time issue statutory requirements on school meals (section 3 (2(b)); (ii) the head teacher shall collect fees for mid-day meals in case of city and municipality councils (section 15(2(c)); (iii) the school may levy a charge for mid-day meals as determined by the management committee in consultation with the district council (section 15(5); (iv) the taking of mid-day meals at school and the payment for such meals shall be voluntary and no pupil who has opted not to pay for or take mid-day meals at school shall be excluded from school for non-payment for such meals (section 15(6); and, (v) the funds of a management committee shall consist of moneys paid for mid-day meals (section 19(1)).
Achievements on the policy on feeding and other child care interventions
i) Increased school attendance. In respect to feeding, schools with midday meals tended to have lower dropout rate, absenteeism and higher enrolment than those not providing meals. Both in school meals and take-home feeding plans have positively impacted on school attendance. The provision of school meals has increased full time school attendance and reduced absenteeism.
ii) Improvement in performance. There has been an improvement of both pupils and teachers in terms concentration and commitment to learning and teaching, attributed to the implementation of school feeding which has minimized short term hunger related issues. This has also led to an improvement in learning outcomes and completion of the primary cycle.
iii) Increased parents’ participation in school activities. Parents are well represented through various committees at school level (SMC, PTA, etc). Their involved is more vivid during co-curricular activities, like MDD, sports and immunization campaigns. However, with regard to school feeding, majority of parents have not fulfilled their obligation.
iv) The survey used a number of attributes as proxies for the provision of school lunches, clothing (uniforms), shelter (accommodation) and transport to and from school. The results of the survey indicate that a significant number (30 percent) of implementers think parent have gotten more involved in education of their children as a result of the policy. The implementers also think implementation of the policy has led to increased pupil attendance and better teacher and pupil performance. The detailed findings on the implementers’ views on the feeding policy are given in table 4.23 below.
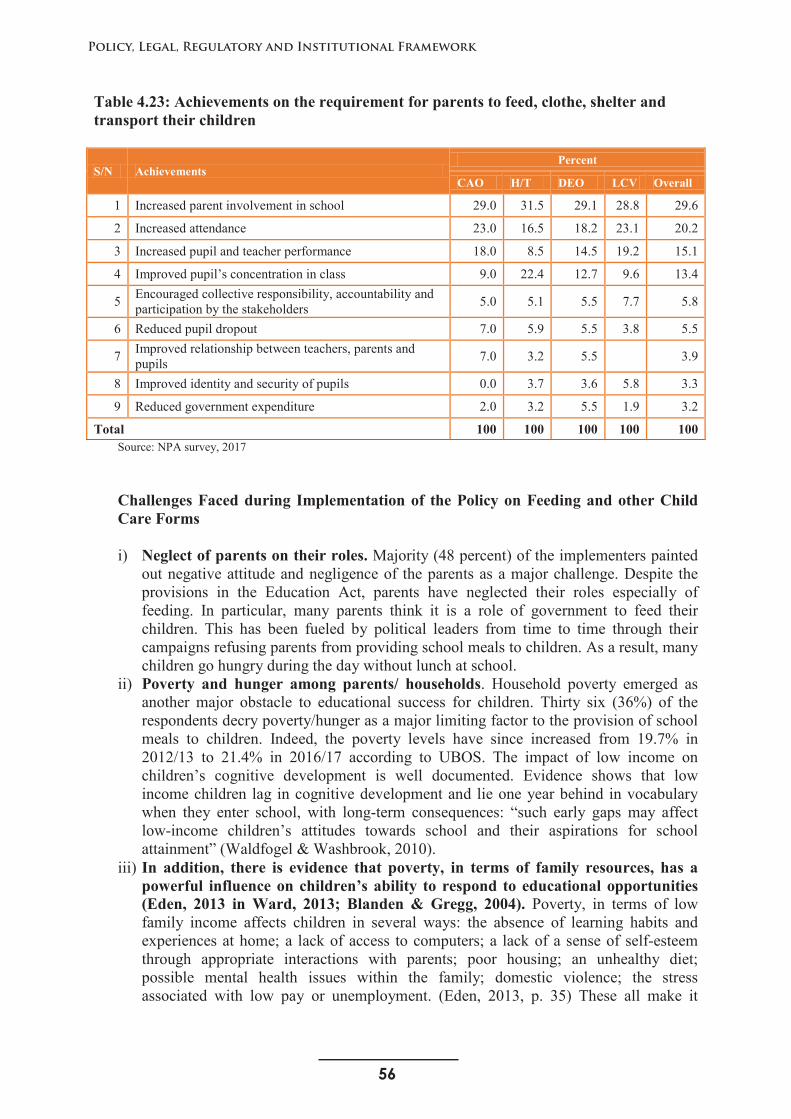
56
Policy, Legal, Regulatory and Institutional Framework
55
Table 4.23: Achievements on the requirement for parents to feed, clothe, shelter and transport their children
S/N Achievements Percent
CAO H/T DEO LCV Overall
1 Increased parent involvement in school 29.0 31.5 29.1 28.8 29.6
2 Increased attendance 23.0 16.5 18.2 23.1 20.2
3 Increased pupil and teacher performance 18.0 8.5 14.5 19.2 15.1
4 Improved pupil’s concentration in class 9.0 22.4 12.7 9.6 13.4
5 Encouraged collective responsibility, accountability andparticipation by the stakeholders 5.0 5.1 5.5 7.7 5.8
6 Reduced pupil dropout 7.0 5.9 5.5 3.8 5.5
7 Improved relationship between teachers, parents and pupils 7.0 3.2 5.5 3.9
8 Improved identity and security of pupils 0.0 3.7 3.6 5.8 3.3
9 Reduced government expenditure 2.0 3.2 5.5 1.9 3.2
Total 100 100 100 100 100Source: NPA survey, 2017
Challenges Faced during Implementation of the Policy on Feeding and other Child Care Forms
i) Neglect of parents on their roles. Majority (48 percent) of the implementers painted out negative attitude and negligence of the parents as a major challenge. Despite the provisions in the Education Act, parents have neglected their roles especially of feeding. In particular, many parents think it is a role of government to feed their children. This has been fueled by political leaders from time to time through their campaigns refusing parents from providing school meals to children. As a result, many children go hungry during the day without lunch at school.
ii) Poverty and hunger among parents/ households. Household poverty emerged as another major obstacle to educational success for children. Thirty six (36%) of the respondents decry poverty/hunger as a major limiting factor to the provision of school meals to children. Indeed, the poverty levels have since increased from 19.7% in 2012/13 to 21.4% in 2016/17 according to UBOS. The impact of low income on children’s cognitive development is well documented. Evidence shows that low income children lag in cognitive development and lie one year behind in vocabulary when they enter school, with long-term consequences: “such early gaps may affect low-income children’s attitudes towards school and their aspirations for school attainment” (Waldfogel & Washbrook, 2010).
iii) In addition, there is evidence that poverty, in terms of family resources, has a powerful influence on children’s ability to respond to educational opportunities (Eden, 2013 in Ward, 2013; Blanden & Gregg, 2004). Poverty, in terms of low family income affects children in several ways: the absence of learning habits and experiences at home; a lack of access to computers; a lack of a sense of self-esteem through appropriate interactions with parents; poor housing; an unhealthy diet; possible mental health issues within the family; domestic violence; the stress associated with low pay or unemployment. (Eden, 2013, p. 35) These all make it
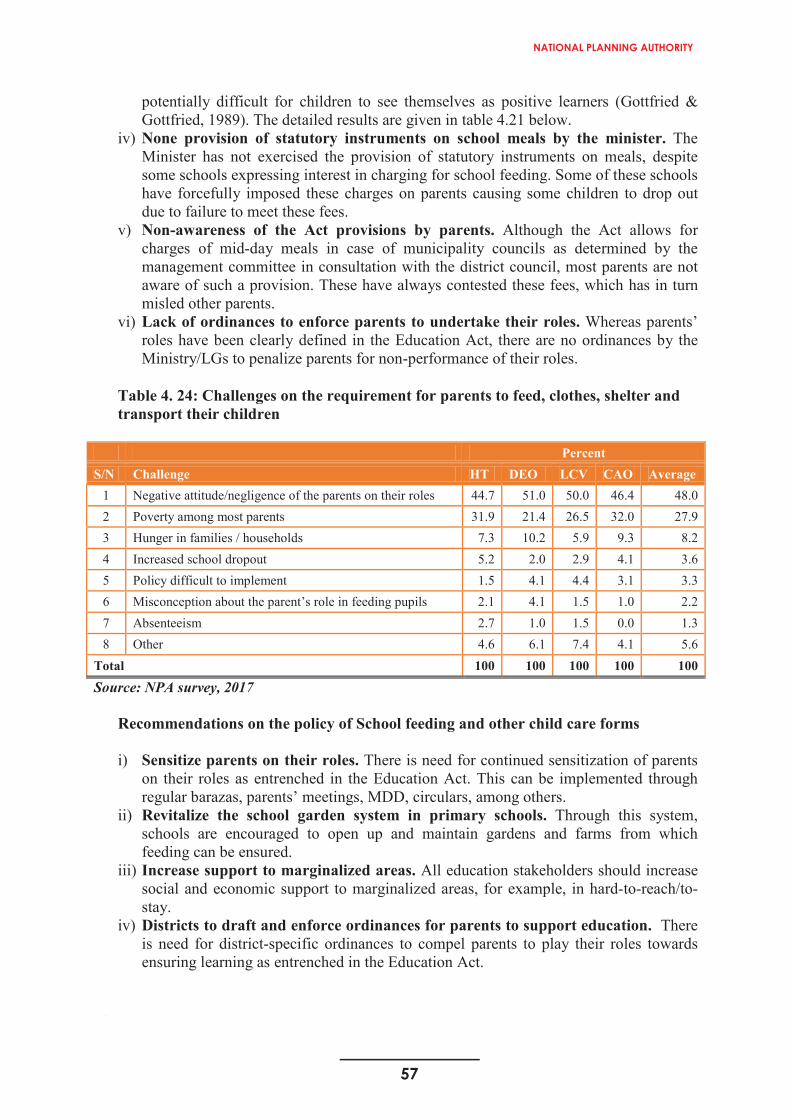
57
NATIONAL PLANNING AUTHORITY
55
Table 4.23: Achievements on the requirement for parents to feed, clothe, shelter and transport their children
S/N Achievements Percent
CAO H/T DEO LCV Overall
1 Increased parent involvement in school 29.0 31.5 29.1 28.8 29.6
2 Increased attendance 23.0 16.5 18.2 23.1 20.2
3 Increased pupil and teacher performance 18.0 8.5 14.5 19.2 15.1
4 Improved pupil’s concentration in class 9.0 22.4 12.7 9.6 13.4
5 Encouraged collective responsibility, accountability andparticipation by the stakeholders 5.0 5.1 5.5 7.7 5.8
6 Reduced pupil dropout 7.0 5.9 5.5 3.8 5.5
7 Improved relationship between teachers, parents and pupils 7.0 3.2 5.5 3.9
8 Improved identity and security of pupils 0.0 3.7 3.6 5.8 3.3
9 Reduced government expenditure 2.0 3.2 5.5 1.9 3.2
Total 100 100 100 100 100Source: NPA survey, 2017
Challenges Faced during Implementation of the Policy on Feeding and other Child Care Forms
i) Neglect of parents on their roles. Majority (48 percent) of the implementers painted out negative attitude and negligence of the parents as a major challenge. Despite the provisions in the Education Act, parents have neglected their roles especially of feeding. In particular, many parents think it is a role of government to feed their children. This has been fueled by political leaders from time to time through their campaigns refusing parents from providing school meals to children. As a result, many children go hungry during the day without lunch at school.
ii) Poverty and hunger among parents/ households. Household poverty emerged as another major obstacle to educational success for children. Thirty six (36%) of the respondents decry poverty/hunger as a major limiting factor to the provision of school meals to children. Indeed, the poverty levels have since increased from 19.7% in 2012/13 to 21.4% in 2016/17 according to UBOS. The impact of low income on children’s cognitive development is well documented. Evidence shows that low income children lag in cognitive development and lie one year behind in vocabulary when they enter school, with long-term consequences: “such early gaps may affect low-income children’s attitudes towards school and their aspirations for school attainment” (Waldfogel & Washbrook, 2010).
iii) In addition, there is evidence that poverty, in terms of family resources, has a powerful influence on children’s ability to respond to educational opportunities (Eden, 2013 in Ward, 2013; Blanden & Gregg, 2004). Poverty, in terms of low family income affects children in several ways: the absence of learning habits and experiences at home; a lack of access to computers; a lack of a sense of self-esteem through appropriate interactions with parents; poor housing; an unhealthy diet; possible mental health issues within the family; domestic violence; the stress associated with low pay or unemployment. (Eden, 2013, p. 35) These all make it
56
potentially difficult for children to see themselves as positive learners (Gottfried & Gottfried, 1989). The detailed results are given in table 4.21 below.
iv) None provision of statutory instruments on school meals by the minister. The Minister has not exercised the provision of statutory instruments on meals, despite some schools expressing interest in charging for school feeding. Some of these schools have forcefully imposed these charges on parents causing some children to drop out due to failure to meet these fees.
v) Non-awareness of the Act provisions by parents. Although the Act allows for charges of mid-day meals in case of municipality councils as determined by the management committee in consultation with the district council, most parents are not aware of such a provision. These have always contested these fees, which has in turn misled other parents.
vi) Lack of ordinances to enforce parents to undertake their roles. Whereas parents’roles have been clearly defined in the Education Act, there are no ordinances by the Ministry/LGs to penalize parents for non-performance of their roles.
Table 4. 24: Challenges on the requirement for parents to feed, clothes, shelter and transport their children
PercentS/N Challenge HT DEO LCV CAO Average
1 Negative attitude/negligence of the parents on their roles 44.7 51.0 50.0 46.4 48.02 Poverty among most parents 31.9 21.4 26.5 32.0 27.93 Hunger in families / households 7.3 10.2 5.9 9.3 8.24 Increased school dropout 5.2 2.0 2.9 4.1 3.65 Policy difficult to implement 1.5 4.1 4.4 3.1 3.36 Misconception about the parent’s role in feeding pupils 2.1 4.1 1.5 1.0 2.27 Absenteeism 2.7 1.0 1.5 0.0 1.38 Other 4.6 6.1 7.4 4.1 5.6
Total 100 100 100 100 100
Source: NPA survey, 2017
Recommendations on the policy of School feeding and other child care forms
i) Sensitize parents on their roles. There is need for continued sensitization of parents on their roles as entrenched in the Education Act. This can be implemented through regular barazas, parents’ meetings, MDD, circulars, among others.
ii) Revitalize the school garden system in primary schools. Through this system, schools are encouraged to open up and maintain gardens and farms from which feeding can be ensured.
iii) Increase support to marginalized areas. All education stakeholders should increase social and economic support to marginalized areas, for example, in hard-to-reach/to-stay.
iv) Districts to draft and enforce ordinances for parents to support education. There is need for district-specific ordinances to compel parents to play their roles towards ensuring learning as entrenched in the Education Act.
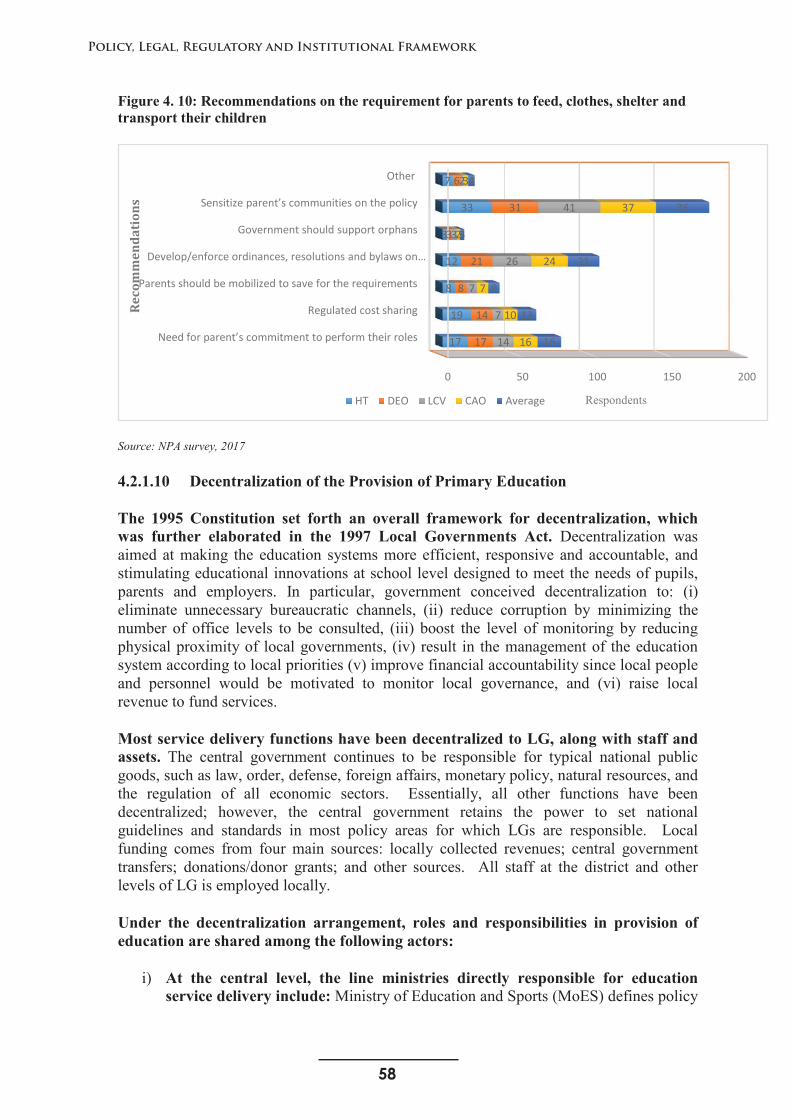
58
Policy, Legal, Regulatory and Institutional Framework
57
Figure 4. 10: Recommendations on the requirement for parents to feed, clothes, shelter and transport their children
Source: NPA survey, 2017
4.2.1.10 Decentralization of the Provision of Primary Education
The 1995 Constitution set forth an overall framework for decentralization, which was further elaborated in the 1997 Local Governments Act. Decentralization was aimed at making the education systems more efficient, responsive and accountable, and stimulating educational innovations at school level designed to meet the needs of pupils, parents and employers. In particular, government conceived decentralization to: (i) eliminate unnecessary bureaucratic channels, (ii) reduce corruption by minimizing the number of office levels to be consulted, (iii) boost the level of monitoring by reducing physical proximity of local governments, (iv) result in the management of the education system according to local priorities (v) improve financial accountability since local people and personnel would be motivated to monitor local governance, and (vi) raise local revenue to fund services.
Most service delivery functions have been decentralized to LG, along with staff and assets. The central government continues to be responsible for typical national public goods, such as law, order, defense, foreign affairs, monetary policy, natural resources, and the regulation of all economic sectors. Essentially, all other functions have been decentralized; however, the central government retains the power to set national guidelines and standards in most policy areas for which LGs are responsible. Local funding comes from four main sources: locally collected revenues; central government transfers; donations/donor grants; and other sources. All staff at the district and other levels of LG is employed locally.
Under the decentralization arrangement, roles and responsibilities in provision of education are shared among the following actors:
i) At the central level, the line ministries directly responsible for education service delivery include: Ministry of Education and Sports (MoES) defines policy
0 50 100 150 200
Need for parent’s commitment to perform their roles
Regulated cost sharing
Parents should be mobilized to save for the requirements
Develop/enforce ordinances, resolutions and bylaws on …
Government should support orphans
Sensitize parent’s communities on the policy
Other
17
19
8
12
3
33
7
17
14
8
21
3
31
6
14
7
7
26
3
41
2
16
10
7
24
2
37
3
16
13
8
21
3
36
4
Respondents
Reco
mm
enda
tion
s
HT DEO LCV CAO Average
59
NATIONAL PLANNING AUTHORITY
57
Figure 4. 10: Recommendations on the requirement for parents to feed, clothes, shelter and transport their children
Source: NPA survey, 2017
4.2.1.10 Decentralization of the Provision of Primary Education
The 1995 Constitution set forth an overall framework for decentralization, which was further elaborated in the 1997 Local Governments Act. Decentralization was aimed at making the education systems more efficient, responsive and accountable, and stimulating educational innovations at school level designed to meet the needs of pupils, parents and employers. In particular, government conceived decentralization to: (i) eliminate unnecessary bureaucratic channels, (ii) reduce corruption by minimizing the number of office levels to be consulted, (iii) boost the level of monitoring by reducing physical proximity of local governments, (iv) result in the management of the education system according to local priorities (v) improve financial accountability since local people and personnel would be motivated to monitor local governance, and (vi) raise local revenue to fund services.
Most service delivery functions have been decentralized to LG, along with staff and assets. The central government continues to be responsible for typical national public goods, such as law, order, defense, foreign affairs, monetary policy, natural resources, and the regulation of all economic sectors. Essentially, all other functions have been decentralized; however, the central government retains the power to set national guidelines and standards in most policy areas for which LGs are responsible. Local funding comes from four main sources: locally collected revenues; central government transfers; donations/donor grants; and other sources. All staff at the district and other levels of LG is employed locally.
Under the decentralization arrangement, roles and responsibilities in provision of education are shared among the following actors:
i) At the central level, the line ministries directly responsible for education service delivery include: Ministry of Education and Sports (MoES) defines policy
0 50 100 150 200
Need for parent’s commitment to perform their roles
Regulated cost sharing
Parents should be mobilized to save for the requirements
Develop/enforce ordinances, resolutions and bylaws on …
Government should support orphans
Sensitize parent’s communities on the policy
Other
17
19
8
12
3
33
7
17
14
8
21
3
31
6
14
7
7
26
3
41
2
16
10
7
24
2
37
3
16
13
8
21
3
36
4
Respondents
Reco
mm
enda
tion
s
HT DEO LCV CAO Average
58
and ensures quality and achievement in education; Ministry of Public Service (MoPs) manages the education human resource payroll; MoLG oversees the implementation of the education programs within the LGs; MoFPED provides financial resources for education service delivery. In addition, there are government agencies, NGOs and CSOs.
ii) At LG level, the CAO superintends the implementation of the educational policy. He coordinates smooth implementation of activities with other stakeholders. The District Education Department monitors the quality of education, the use of funds received by schools, and the implementation of policies.
iii) There is a District Service Commission (DSC) in each district, appointed by the District Council; the DSCs are responsible for advertising vacancies, interviewing and hiring front-line workers, and providing oversight of personnel practices, both for districts and other LG. General recruitment standards are set by the Public Service Committee at the national level. Recruitment is expected to be based on merit and staff may be recruited from anywhere in the country, although this is not always true in practice.
iv) At the school level, the School Management Committee (SMC) is the statutoryorgan that governs the school on behalf of the government. Head teachers are the accounting officer at school level.
This decentralization has been carried out within a tight set of policy and administrative controls from the center, ranging from centrally established pay rates, policy norms, establishment ceilings and conditional fiscal transfers, to the extent that decentralization is better described as delegation than true devolution. As local capacity continues to improve, however, it may be that some of the more restrictive dictates from the center can be loosened.
Key Findings on Decentralization of Education
i) Quality of works is still low. Most LGs are characterized with shoddy works as result of hiring incompetent contractors. This has undermined quality education service delivery in classroom, teachers’ houses and latrine construction in schools. This study finds no policy providing a life span of structures constructed in schools. There are therefore no standards contractors / engineers base on for classrooms, teachers’ houses and latrines construction and targeted years /lifespan. However, its assumed that schools are meant to last for 25 years with continued operation and maintenance.Nevertheless, the current shoddy work doesn’t depict the years. Parents have continued to reject schools constructed over shoddy work.
ii) Delays in the flow of funds from the center to the implementing units. Although the policy on funds flow from the Centre to LGs has faced several reversals to ensure efficiency and effectiveness, bureaucratic tendencies have persisted. This has createdunnecessary delays in implementation of government education programs and projects at school level.
iii) Inadequate human resource to improve on education service delivery. The decentralization of recruitment of education human resource has not yielded adequate education personnel. Moreover, this policy does not permit reallocation of education personnel from one district to another, except from a mother district to a new district. This has been evidenced where some LGs have few staff while others have excess personnel. In addition, the low staff levels arise from staff sealing provided by MoES.
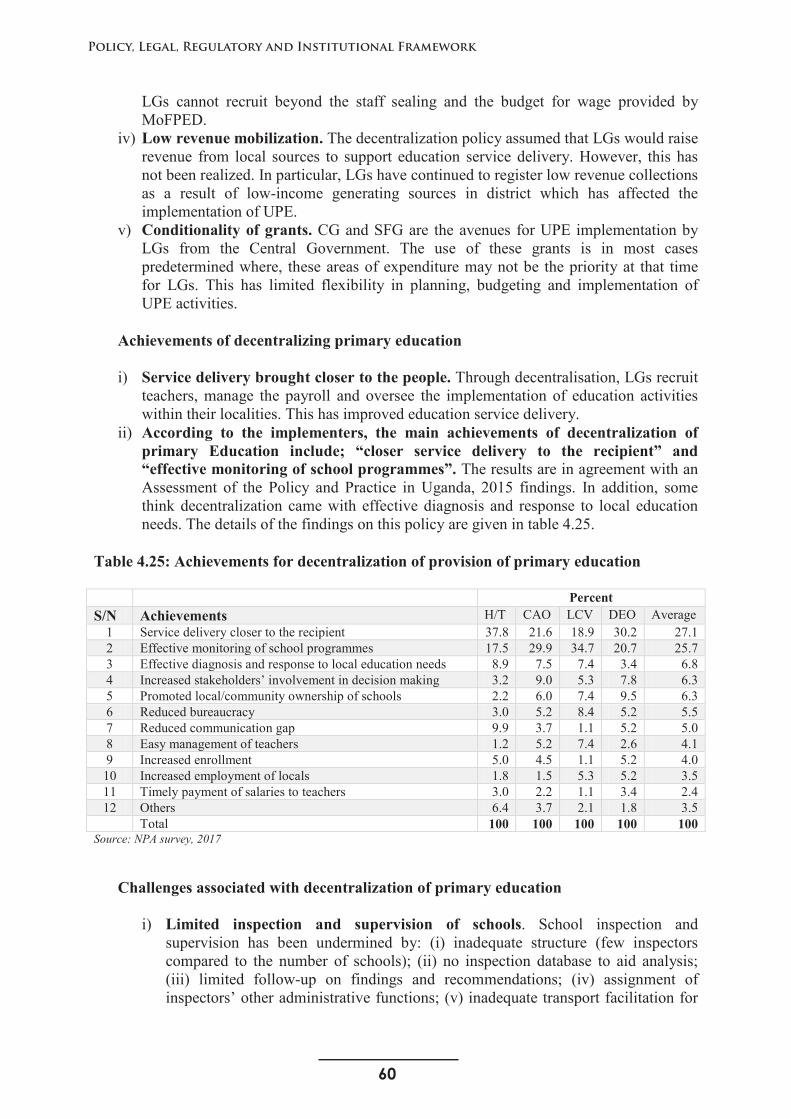
60
Policy, Legal, Regulatory and Institutional Framework
59
LGs cannot recruit beyond the staff sealing and the budget for wage provided by MoFPED.
iv) Low revenue mobilization. The decentralization policy assumed that LGs would raise revenue from local sources to support education service delivery. However, this has not been realized. In particular, LGs have continued to register low revenue collections as a result of low-income generating sources in district which has affected the implementation of UPE.
v) Conditionality of grants. CG and SFG are the avenues for UPE implementation by LGs from the Central Government. The use of these grants is in most cases predetermined where, these areas of expenditure may not be the priority at that time for LGs. This has limited flexibility in planning, budgeting and implementation ofUPE activities.
Achievements of decentralizing primary education
i) Service delivery brought closer to the people. Through decentralisation, LGs recruit teachers, manage the payroll and oversee the implementation of education activitieswithin their localities. This has improved education service delivery.
ii) According to the implementers, the main achievements of decentralization of primary Education include; “closer service delivery to the recipient” and “effective monitoring of school programmes”. The results are in agreement with an Assessment of the Policy and Practice in Uganda, 2015 findings. In addition, some think decentralization came with effective diagnosis and response to local education needs. The details of the findings on this policy are given in table 4.25.
Table 4.25: Achievements for decentralization of provision of primary education
PercentS/N Achievements H/T CAO LCV DEO Average
1 Service delivery closer to the recipient 37.8 21.6 18.9 30.2 27.12 Effective monitoring of school programmes 17.5 29.9 34.7 20.7 25.73 Effective diagnosis and response to local education needs 8.9 7.5 7.4 3.4 6.84 Increased stakeholders’ involvement in decision making 3.2 9.0 5.3 7.8 6.35 Promoted local/community ownership of schools 2.2 6.0 7.4 9.5 6.36 Reduced bureaucracy 3.0 5.2 8.4 5.2 5.57 Reduced communication gap 9.9 3.7 1.1 5.2 5.08 Easy management of teachers 1.2 5.2 7.4 2.6 4.19 Increased enrollment 5.0 4.5 1.1 5.2 4.010 Increased employment of locals 1.8 1.5 5.3 5.2 3.511 Timely payment of salaries to teachers 3.0 2.2 1.1 3.4 2.412 Others 6.4 3.7 2.1 1.8 3.5
Total 100 100 100 100 100Source: NPA survey, 2017
Challenges associated with decentralization of primary education
i) Limited inspection and supervision of schools. School inspection and supervision has been undermined by: (i) inadequate structure (few inspectors compared to the number of schools); (ii) no inspection database to aid analysis;(iii) limited follow-up on findings and recommendations; (iv) assignment ofinspectors’ other administrative functions; (v) inadequate transport facilitation for
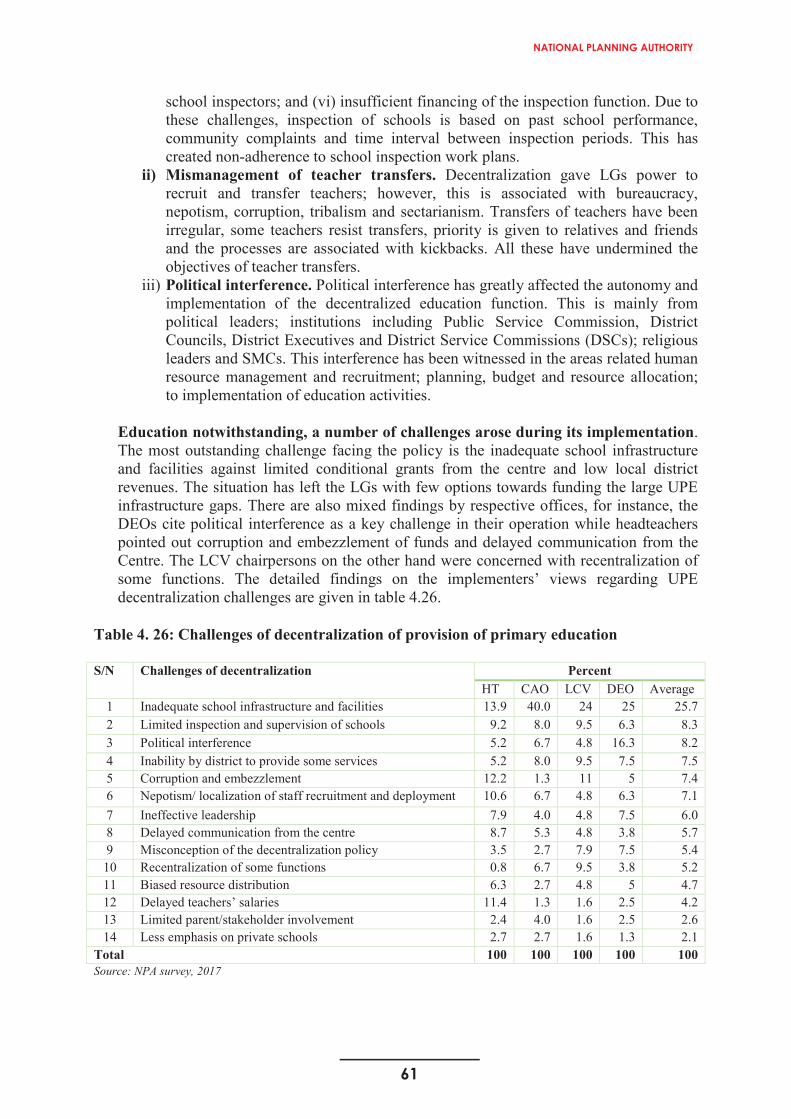
61
NATIONAL PLANNING AUTHORITY
59
LGs cannot recruit beyond the staff sealing and the budget for wage provided by MoFPED.
iv) Low revenue mobilization. The decentralization policy assumed that LGs would raise revenue from local sources to support education service delivery. However, this has not been realized. In particular, LGs have continued to register low revenue collections as a result of low-income generating sources in district which has affected the implementation of UPE.
v) Conditionality of grants. CG and SFG are the avenues for UPE implementation by LGs from the Central Government. The use of these grants is in most cases predetermined where, these areas of expenditure may not be the priority at that time for LGs. This has limited flexibility in planning, budgeting and implementation ofUPE activities.
Achievements of decentralizing primary education
i) Service delivery brought closer to the people. Through decentralisation, LGs recruit teachers, manage the payroll and oversee the implementation of education activitieswithin their localities. This has improved education service delivery.
ii) According to the implementers, the main achievements of decentralization of primary Education include; “closer service delivery to the recipient” and “effective monitoring of school programmes”. The results are in agreement with an Assessment of the Policy and Practice in Uganda, 2015 findings. In addition, some think decentralization came with effective diagnosis and response to local education needs. The details of the findings on this policy are given in table 4.25.
Table 4.25: Achievements for decentralization of provision of primary education
PercentS/N Achievements H/T CAO LCV DEO Average
1 Service delivery closer to the recipient 37.8 21.6 18.9 30.2 27.12 Effective monitoring of school programmes 17.5 29.9 34.7 20.7 25.73 Effective diagnosis and response to local education needs 8.9 7.5 7.4 3.4 6.84 Increased stakeholders’ involvement in decision making 3.2 9.0 5.3 7.8 6.35 Promoted local/community ownership of schools 2.2 6.0 7.4 9.5 6.36 Reduced bureaucracy 3.0 5.2 8.4 5.2 5.57 Reduced communication gap 9.9 3.7 1.1 5.2 5.08 Easy management of teachers 1.2 5.2 7.4 2.6 4.19 Increased enrollment 5.0 4.5 1.1 5.2 4.010 Increased employment of locals 1.8 1.5 5.3 5.2 3.511 Timely payment of salaries to teachers 3.0 2.2 1.1 3.4 2.412 Others 6.4 3.7 2.1 1.8 3.5
Total 100 100 100 100 100Source: NPA survey, 2017
Challenges associated with decentralization of primary education
i) Limited inspection and supervision of schools. School inspection and supervision has been undermined by: (i) inadequate structure (few inspectors compared to the number of schools); (ii) no inspection database to aid analysis;(iii) limited follow-up on findings and recommendations; (iv) assignment ofinspectors’ other administrative functions; (v) inadequate transport facilitation for
60
school inspectors; and (vi) insufficient financing of the inspection function. Due to these challenges, inspection of schools is based on past school performance, community complaints and time interval between inspection periods. This has created non-adherence to school inspection work plans.
ii) Mismanagement of teacher transfers. Decentralization gave LGs power to recruit and transfer teachers; however, this is associated with bureaucracy, nepotism, corruption, tribalism and sectarianism. Transfers of teachers have been irregular, some teachers resist transfers, priority is given to relatives and friends and the processes are associated with kickbacks. All these have undermined the objectives of teacher transfers.
iii) Political interference. Political interference has greatly affected the autonomy andimplementation of the decentralized education function. This is mainly from political leaders; institutions including Public Service Commission, District Councils, District Executives and District Service Commissions (DSCs); religious leaders and SMCs. This interference has been witnessed in the areas related human resource management and recruitment; planning, budget and resource allocation; to implementation of education activities.
Education notwithstanding, a number of challenges arose during its implementation.The most outstanding challenge facing the policy is the inadequate school infrastructure and facilities against limited conditional grants from the centre and low local district revenues. The situation has left the LGs with few options towards funding the large UPE infrastructure gaps. There are also mixed findings by respective offices, for instance, the DEOs cite political interference as a key challenge in their operation while headteachers pointed out corruption and embezzlement of funds and delayed communication from the Centre. The LCV chairpersons on the other hand were concerned with recentralization of some functions. The detailed findings on the implementers’ views regarding UPE decentralization challenges are given in table 4.26.
Table 4. 26: Challenges of decentralization of provision of primary education
S/N Challenges of decentralization PercentHT CAO LCV DEO Average
1 Inadequate school infrastructure and facilities 13.9 40.0 24 25 25.72 Limited inspection and supervision of schools 9.2 8.0 9.5 6.3 8.33 Political interference 5.2 6.7 4.8 16.3 8.24 Inability by district to provide some services 5.2 8.0 9.5 7.5 7.55 Corruption and embezzlement 12.2 1.3 11 5 7.46 Nepotism/ localization of staff recruitment and deployment 10.6 6.7 4.8 6.3 7.17 Ineffective leadership 7.9 4.0 4.8 7.5 6.08 Delayed communication from the centre 8.7 5.3 4.8 3.8 5.79 Misconception of the decentralization policy 3.5 2.7 7.9 7.5 5.410 Recentralization of some functions 0.8 6.7 9.5 3.8 5.211 Biased resource distribution 6.3 2.7 4.8 5 4.712 Delayed teachers’ salaries 11.4 1.3 1.6 2.5 4.213 Limited parent/stakeholder involvement 2.4 4.0 1.6 2.5 2.614 Less emphasis on private schools 2.7 2.7 1.6 1.3 2.1
Total 100 100 100 100 100Source: NPA survey, 2017
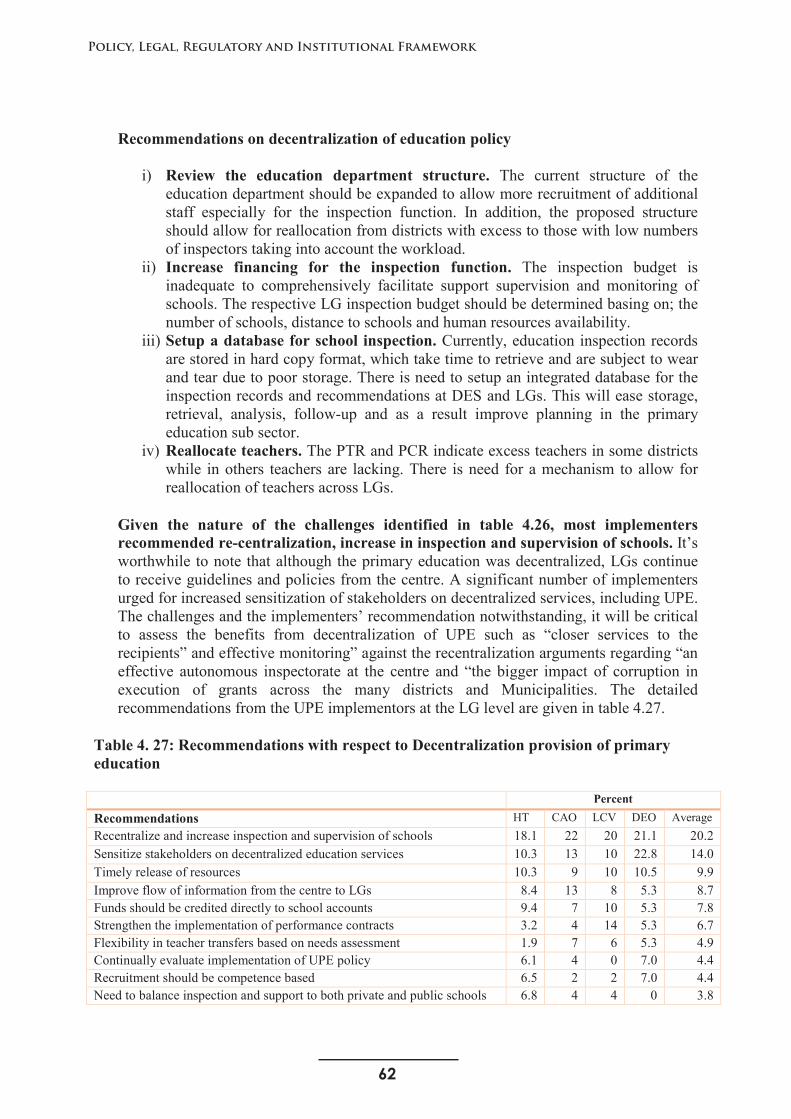
62
Policy, Legal, Regulatory and Institutional Framework
61
Recommendations on decentralization of education policy
i) Review the education department structure. The current structure of the education department should be expanded to allow more recruitment of additional staff especially for the inspection function. In addition, the proposed structure should allow for reallocation from districts with excess to those with low numbers of inspectors taking into account the workload.
ii) Increase financing for the inspection function. The inspection budget is inadequate to comprehensively facilitate support supervision and monitoring of schools. The respective LG inspection budget should be determined basing on; the number of schools, distance to schools and human resources availability.
iii) Setup a database for school inspection. Currently, education inspection records are stored in hard copy format, which take time to retrieve and are subject to wear and tear due to poor storage. There is need to setup an integrated database for the inspection records and recommendations at DES and LGs. This will ease storage, retrieval, analysis, follow-up and as a result improve planning in the primary education sub sector.
iv) Reallocate teachers. The PTR and PCR indicate excess teachers in some districts while in others teachers are lacking. There is need for a mechanism to allow for reallocation of teachers across LGs.
Given the nature of the challenges identified in table 4.26, most implementers recommended re-centralization, increase in inspection and supervision of schools. It’s worthwhile to note that although the primary education was decentralized, LGs continue to receive guidelines and policies from the centre. A significant number of implementers urged for increased sensitization of stakeholders on decentralized services, including UPE. The challenges and the implementers’ recommendation notwithstanding, it will be critical to assess the benefits from decentralization of UPE such as “closer services to the recipients” and effective monitoring” against the recentralization arguments regarding “an effective autonomous inspectorate at the centre and “the bigger impact of corruption in execution of grants across the many districts and Municipalities. The detailed recommendations from the UPE implementors at the LG level are given in table 4.27.
Table 4. 27: Recommendations with respect to Decentralization provision of primary education
Percent
Recommendations HT CAO LCV DEO AverageRecentralize and increase inspection and supervision of schools 18.1 22 20 21.1 20.2Sensitize stakeholders on decentralized education services 10.3 13 10 22.8 14.0Timely release of resources 10.3 9 10 10.5 9.9Improve flow of information from the centre to LGs 8.4 13 8 5.3 8.7Funds should be credited directly to school accounts 9.4 7 10 5.3 7.8Strengthen the implementation of performance contracts 3.2 4 14 5.3 6.7Flexibility in teacher transfers based on needs assessment 1.9 7 6 5.3 4.9Continually evaluate implementation of UPE policy 6.1 4 0 7.0 4.4Recruitment should be competence based 6.5 2 2 7.0 4.4Need to balance inspection and support to both private and public schools 6.8 4 4 0 3.8
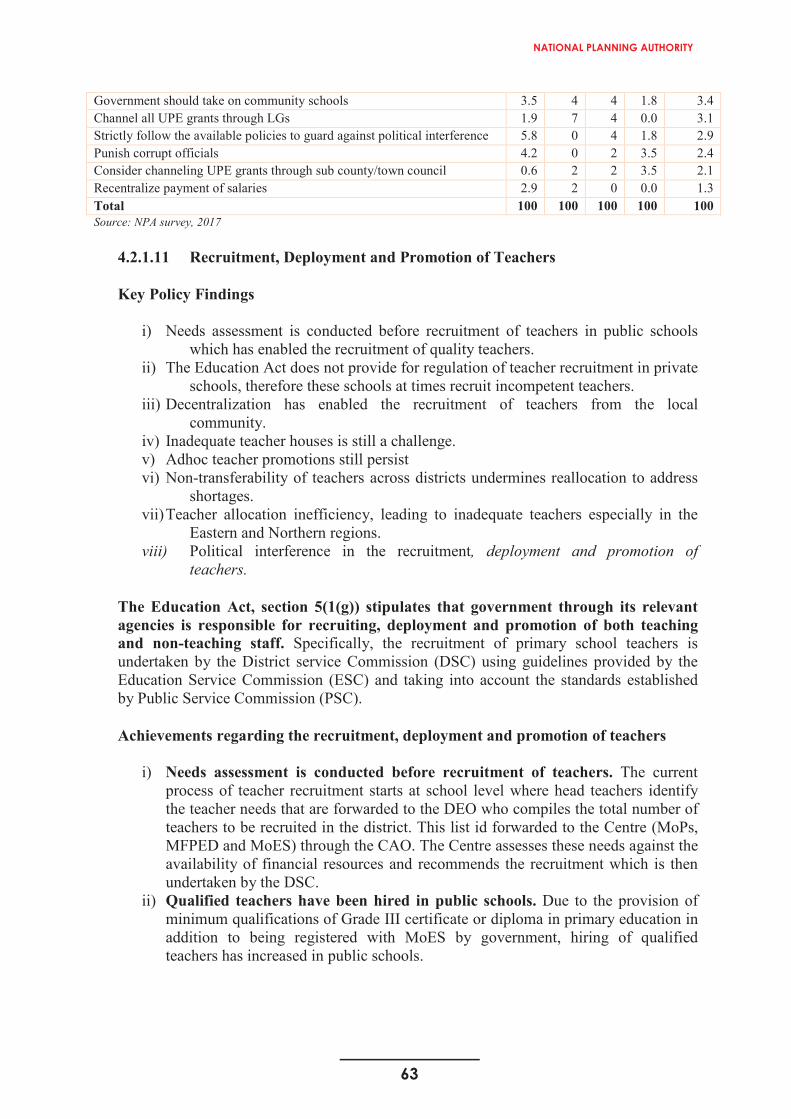
63
NATIONAL PLANNING AUTHORITY
61
Recommendations on decentralization of education policy
i) Review the education department structure. The current structure of the education department should be expanded to allow more recruitment of additional staff especially for the inspection function. In addition, the proposed structure should allow for reallocation from districts with excess to those with low numbers of inspectors taking into account the workload.
ii) Increase financing for the inspection function. The inspection budget is inadequate to comprehensively facilitate support supervision and monitoring of schools. The respective LG inspection budget should be determined basing on; the number of schools, distance to schools and human resources availability.
iii) Setup a database for school inspection. Currently, education inspection records are stored in hard copy format, which take time to retrieve and are subject to wear and tear due to poor storage. There is need to setup an integrated database for the inspection records and recommendations at DES and LGs. This will ease storage, retrieval, analysis, follow-up and as a result improve planning in the primary education sub sector.
iv) Reallocate teachers. The PTR and PCR indicate excess teachers in some districts while in others teachers are lacking. There is need for a mechanism to allow for reallocation of teachers across LGs.
Given the nature of the challenges identified in table 4.26, most implementers recommended re-centralization, increase in inspection and supervision of schools. It’s worthwhile to note that although the primary education was decentralized, LGs continue to receive guidelines and policies from the centre. A significant number of implementers urged for increased sensitization of stakeholders on decentralized services, including UPE. The challenges and the implementers’ recommendation notwithstanding, it will be critical to assess the benefits from decentralization of UPE such as “closer services to the recipients” and effective monitoring” against the recentralization arguments regarding “an effective autonomous inspectorate at the centre and “the bigger impact of corruption in execution of grants across the many districts and Municipalities. The detailed recommendations from the UPE implementors at the LG level are given in table 4.27.
Table 4. 27: Recommendations with respect to Decentralization provision of primary education
Percent
Recommendations HT CAO LCV DEO AverageRecentralize and increase inspection and supervision of schools 18.1 22 20 21.1 20.2Sensitize stakeholders on decentralized education services 10.3 13 10 22.8 14.0Timely release of resources 10.3 9 10 10.5 9.9Improve flow of information from the centre to LGs 8.4 13 8 5.3 8.7Funds should be credited directly to school accounts 9.4 7 10 5.3 7.8Strengthen the implementation of performance contracts 3.2 4 14 5.3 6.7Flexibility in teacher transfers based on needs assessment 1.9 7 6 5.3 4.9Continually evaluate implementation of UPE policy 6.1 4 0 7.0 4.4Recruitment should be competence based 6.5 2 2 7.0 4.4Need to balance inspection and support to both private and public schools 6.8 4 4 0 3.8
62
Government should take on community schools 3.5 4 4 1.8 3.4Channel all UPE grants through LGs 1.9 7 4 0.0 3.1Strictly follow the available policies to guard against political interference 5.8 0 4 1.8 2.9Punish corrupt officials 4.2 0 2 3.5 2.4Consider channeling UPE grants through sub county/town council 0.6 2 2 3.5 2.1Recentralize payment of salaries 2.9 2 0 0.0 1.3Total 100 100 100 100 100Source: NPA survey, 2017
4.2.1.11 Recruitment, Deployment and Promotion of Teachers
Key Policy Findings
i) Needs assessment is conducted before recruitment of teachers in public schoolswhich has enabled the recruitment of quality teachers.
ii) The Education Act does not provide for regulation of teacher recruitment in private schools, therefore these schools at times recruit incompetent teachers.
iii) Decentralization has enabled the recruitment of teachers from the local community.
iv) Inadequate teacher houses is still a challenge. v) Adhoc teacher promotions still persistvi) Non-transferability of teachers across districts undermines reallocation to address
shortages. vii)Teacher allocation inefficiency, leading to inadequate teachers especially in the
Eastern and Northern regions.viii) Political interference in the recruitment, deployment and promotion of
teachers.
The Education Act, section 5(1(g)) stipulates that government through its relevant agencies is responsible for recruiting, deployment and promotion of both teaching and non-teaching staff. Specifically, the recruitment of primary school teachers is undertaken by the District service Commission (DSC) using guidelines provided by the Education Service Commission (ESC) and taking into account the standards established by Public Service Commission (PSC).
Achievements regarding the recruitment, deployment and promotion of teachers
i) Needs assessment is conducted before recruitment of teachers. The current process of teacher recruitment starts at school level where head teachers identify the teacher needs that are forwarded to the DEO who compiles the total number of teachers to be recruited in the district. This list id forwarded to the Centre (MoPs, MFPED and MoES) through the CAO. The Centre assesses these needs against the availability of financial resources and recommends the recruitment which is then undertaken by the DSC.
ii) Qualified teachers have been hired in public schools. Due to the provision of minimum qualifications of Grade III certificate or diploma in primary education in addition to being registered with MoES by government, hiring of qualified teachers has increased in public schools.
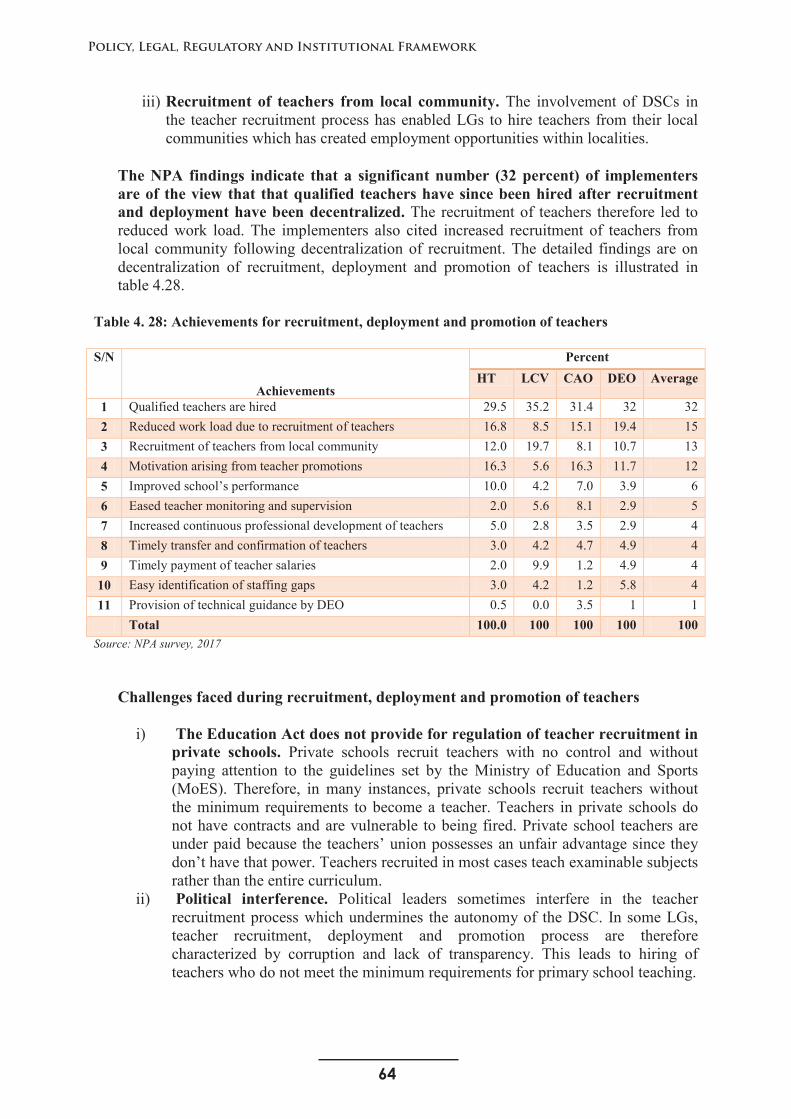
64
Policy, Legal, Regulatory and Institutional Framework
63
iii) Recruitment of teachers from local community. The involvement of DSCs in the teacher recruitment process has enabled LGs to hire teachers from their local communities which has created employment opportunities within localities.
The NPA findings indicate that a significant number (32 percent) of implementersare of the view that that qualified teachers have since been hired after recruitment and deployment have been decentralized. The recruitment of teachers therefore led toreduced work load. The implementers also cited increased recruitment of teachers from local community following decentralization of recruitment. The detailed findings are on decentralization of recruitment, deployment and promotion of teachers is illustrated in table 4.28.
Table 4. 28: Achievements for recruitment, deployment and promotion of teachers
S/N
Achievements
PercentHT LCV CAO DEO Average
1 Qualified teachers are hired 29.5 35.2 31.4 32 322 Reduced work load due to recruitment of teachers 16.8 8.5 15.1 19.4 153 Recruitment of teachers from local community 12.0 19.7 8.1 10.7 134 Motivation arising from teacher promotions 16.3 5.6 16.3 11.7 125 Improved school’s performance 10.0 4.2 7.0 3.9 66 Eased teacher monitoring and supervision 2.0 5.6 8.1 2.9 57 Increased continuous professional development of teachers 5.0 2.8 3.5 2.9 48 Timely transfer and confirmation of teachers 3.0 4.2 4.7 4.9 49 Timely payment of teacher salaries 2.0 9.9 1.2 4.9 4
10 Easy identification of staffing gaps 3.0 4.2 1.2 5.8 411 Provision of technical guidance by DEO 0.5 0.0 3.5 1 1
Total 100.0 100 100 100 100Source: NPA survey, 2017
Challenges faced during recruitment, deployment and promotion of teachers
i) The Education Act does not provide for regulation of teacher recruitment in private schools. Private schools recruit teachers with no control and without paying attention to the guidelines set by the Ministry of Education and Sports (MoES). Therefore, in many instances, private schools recruit teachers without the minimum requirements to become a teacher. Teachers in private schools do not have contracts and are vulnerable to being fired. Private school teachers are under paid because the teachers’ union possesses an unfair advantage since they don’t have that power. Teachers recruited in most cases teach examinable subjects rather than the entire curriculum.
ii) Political interference. Political leaders sometimes interfere in the teacher recruitment process which undermines the autonomy of the DSC. In some LGs, teacher recruitment, deployment and promotion process are therefore characterized by corruption and lack of transparency. This leads to hiring of teachers who do not meet the minimum requirements for primary school teaching.
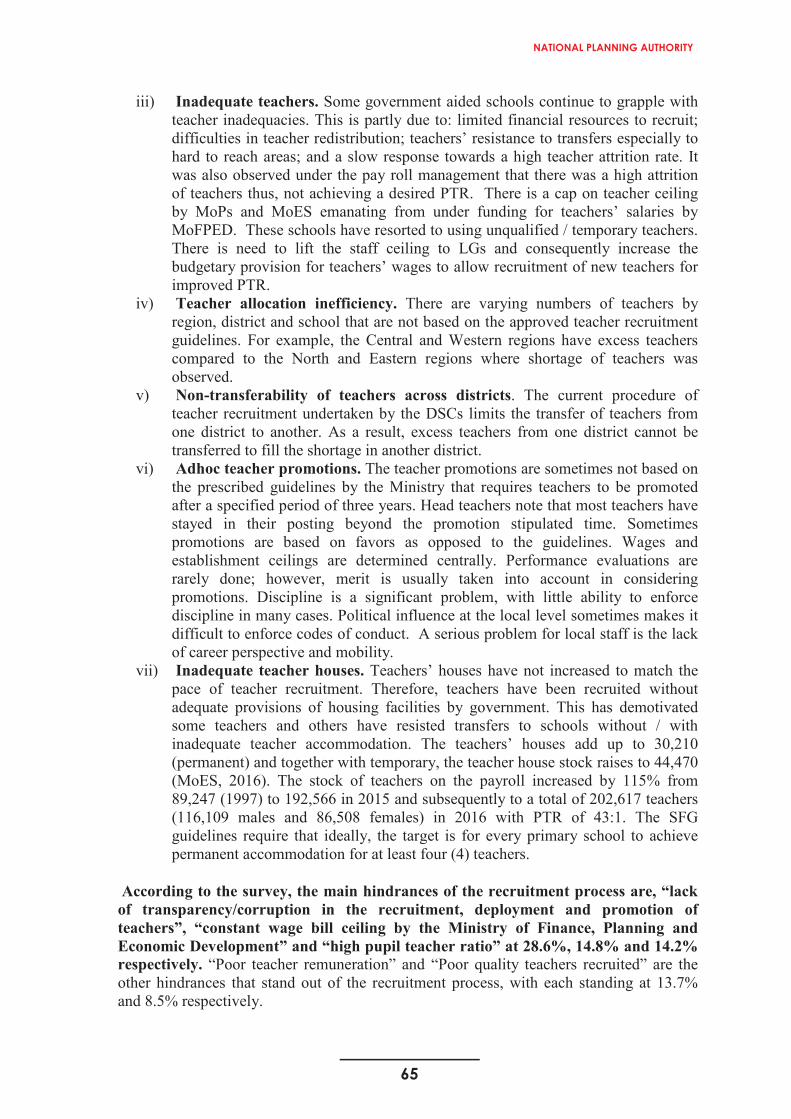
65
NATIONAL PLANNING AUTHORITY
63
iii) Recruitment of teachers from local community. The involvement of DSCs in the teacher recruitment process has enabled LGs to hire teachers from their local communities which has created employment opportunities within localities.
The NPA findings indicate that a significant number (32 percent) of implementersare of the view that that qualified teachers have since been hired after recruitment and deployment have been decentralized. The recruitment of teachers therefore led toreduced work load. The implementers also cited increased recruitment of teachers from local community following decentralization of recruitment. The detailed findings are on decentralization of recruitment, deployment and promotion of teachers is illustrated in table 4.28.
Table 4. 28: Achievements for recruitment, deployment and promotion of teachers
S/N
Achievements
PercentHT LCV CAO DEO Average
1 Qualified teachers are hired 29.5 35.2 31.4 32 322 Reduced work load due to recruitment of teachers 16.8 8.5 15.1 19.4 153 Recruitment of teachers from local community 12.0 19.7 8.1 10.7 134 Motivation arising from teacher promotions 16.3 5.6 16.3 11.7 125 Improved school’s performance 10.0 4.2 7.0 3.9 66 Eased teacher monitoring and supervision 2.0 5.6 8.1 2.9 57 Increased continuous professional development of teachers 5.0 2.8 3.5 2.9 48 Timely transfer and confirmation of teachers 3.0 4.2 4.7 4.9 49 Timely payment of teacher salaries 2.0 9.9 1.2 4.9 4
10 Easy identification of staffing gaps 3.0 4.2 1.2 5.8 411 Provision of technical guidance by DEO 0.5 0.0 3.5 1 1
Total 100.0 100 100 100 100Source: NPA survey, 2017
Challenges faced during recruitment, deployment and promotion of teachers
i) The Education Act does not provide for regulation of teacher recruitment in private schools. Private schools recruit teachers with no control and without paying attention to the guidelines set by the Ministry of Education and Sports (MoES). Therefore, in many instances, private schools recruit teachers without the minimum requirements to become a teacher. Teachers in private schools do not have contracts and are vulnerable to being fired. Private school teachers are under paid because the teachers’ union possesses an unfair advantage since they don’t have that power. Teachers recruited in most cases teach examinable subjects rather than the entire curriculum.
ii) Political interference. Political leaders sometimes interfere in the teacher recruitment process which undermines the autonomy of the DSC. In some LGs, teacher recruitment, deployment and promotion process are therefore characterized by corruption and lack of transparency. This leads to hiring of teachers who do not meet the minimum requirements for primary school teaching.
64
iii) Inadequate teachers. Some government aided schools continue to grapple with teacher inadequacies. This is partly due to: limited financial resources to recruit;difficulties in teacher redistribution; teachers’ resistance to transfers especially to hard to reach areas; and a slow response towards a high teacher attrition rate. It was also observed under the pay roll management that there was a high attrition of teachers thus, not achieving a desired PTR. There is a cap on teacher ceiling by MoPs and MoES emanating from under funding for teachers’ salaries by MoFPED. These schools have resorted to using unqualified / temporary teachers. There is need to lift the staff ceiling to LGs and consequently increase the budgetary provision for teachers’ wages to allow recruitment of new teachers for improved PTR.
iv) Teacher allocation inefficiency. There are varying numbers of teachers by region, district and school that are not based on the approved teacher recruitment guidelines. For example, the Central and Western regions have excess teachers compared to the North and Eastern regions where shortage of teachers was observed.
v) Non-transferability of teachers across districts. The current procedure of teacher recruitment undertaken by the DSCs limits the transfer of teachers from one district to another. As a result, excess teachers from one district cannot be transferred to fill the shortage in another district.
vi) Adhoc teacher promotions. The teacher promotions are sometimes not based on the prescribed guidelines by the Ministry that requires teachers to be promoted after a specified period of three years. Head teachers note that most teachers have stayed in their posting beyond the promotion stipulated time. Sometimes promotions are based on favors as opposed to the guidelines. Wages and establishment ceilings are determined centrally. Performance evaluations are rarely done; however, merit is usually taken into account in considering promotions. Discipline is a significant problem, with little ability to enforce discipline in many cases. Political influence at the local level sometimes makes it difficult to enforce codes of conduct. A serious problem for local staff is the lack of career perspective and mobility.
vii) Inadequate teacher houses. Teachers’ houses have not increased to match the pace of teacher recruitment. Therefore, teachers have been recruited without adequate provisions of housing facilities by government. This has demotivated some teachers and others have resisted transfers to schools without / with inadequate teacher accommodation. The teachers’ houses add up to 30,210 (permanent) and together with temporary, the teacher house stock raises to 44,470 (MoES, 2016). The stock of teachers on the payroll increased by 115% from 89,247 (1997) to 192,566 in 2015 and subsequently to a total of 202,617 teachers (116,109 males and 86,508 females) in 2016 with PTR of 43:1. The SFG guidelines require that ideally, the target is for every primary school to achieve permanent accommodation for at least four (4) teachers.
According to the survey, the main hindrances of the recruitment process are, “lack of transparency/corruption in the recruitment, deployment and promotion of teachers”, “constant wage bill ceiling by the Ministry of Finance, Planning and Economic Development” and “high pupil teacher ratio” at 28.6%, 14.8% and 14.2% respectively. “Poor teacher remuneration” and “Poor quality teachers recruited” are the other hindrances that stand out of the recruitment process, with each standing at 13.7% and 8.5% respectively.
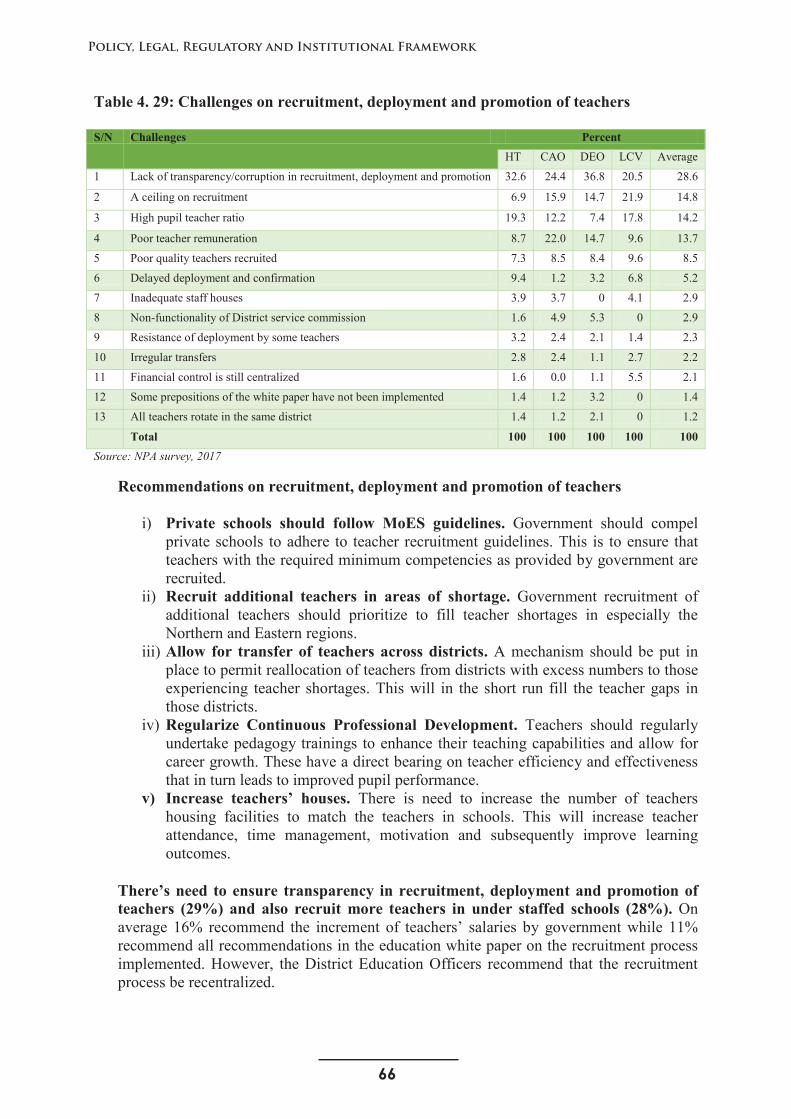
66
Policy, Legal, Regulatory and Institutional Framework
65
Table 4. 29: Challenges on recruitment, deployment and promotion of teachers
S/N Challenges PercentHT CAO DEO LCV Average
1 Lack of transparency/corruption in recruitment, deployment and promotion 32.6 24.4 36.8 20.5 28.6
2 A ceiling on recruitment 6.9 15.9 14.7 21.9 14.8
3 High pupil teacher ratio 19.3 12.2 7.4 17.8 14.2
4 Poor teacher remuneration 8.7 22.0 14.7 9.6 13.7
5 Poor quality teachers recruited 7.3 8.5 8.4 9.6 8.5
6 Delayed deployment and confirmation 9.4 1.2 3.2 6.8 5.2
7 Inadequate staff houses 3.9 3.7 0 4.1 2.9
8 Non-functionality of District service commission 1.6 4.9 5.3 0 2.9
9 Resistance of deployment by some teachers 3.2 2.4 2.1 1.4 2.3
10 Irregular transfers 2.8 2.4 1.1 2.7 2.2
11 Financial control is still centralized 1.6 0.0 1.1 5.5 2.1
12 Some prepositions of the white paper have not been implemented 1.4 1.2 3.2 0 1.4
13 All teachers rotate in the same district 1.4 1.2 2.1 0 1.2
Total 100 100 100 100 100Source: NPA survey, 2017
Recommendations on recruitment, deployment and promotion of teachers
i) Private schools should follow MoES guidelines. Government should compel private schools to adhere to teacher recruitment guidelines. This is to ensure that teachers with the required minimum competencies as provided by government are recruited.
ii) Recruit additional teachers in areas of shortage. Government recruitment of additional teachers should prioritize to fill teacher shortages in especially the Northern and Eastern regions.
iii) Allow for transfer of teachers across districts. A mechanism should be put in place to permit reallocation of teachers from districts with excess numbers to those experiencing teacher shortages. This will in the short run fill the teacher gaps in those districts.
iv) Regularize Continuous Professional Development. Teachers should regularly undertake pedagogy trainings to enhance their teaching capabilities and allow for career growth. These have a direct bearing on teacher efficiency and effectiveness that in turn leads to improved pupil performance.
v) Increase teachers’ houses. There is need to increase the number of teachers housing facilities to match the teachers in schools. This will increase teacher attendance, time management, motivation and subsequently improve learning outcomes.
There’s need to ensure transparency in recruitment, deployment and promotion of teachers (29%) and also recruit more teachers in under staffed schools (28%). On average 16% recommend the increment of teachers’ salaries by government while 11% recommend all recommendations in the education white paper on the recruitment process implemented. However, the District Education Officers recommend that the recruitment process be recentralized.
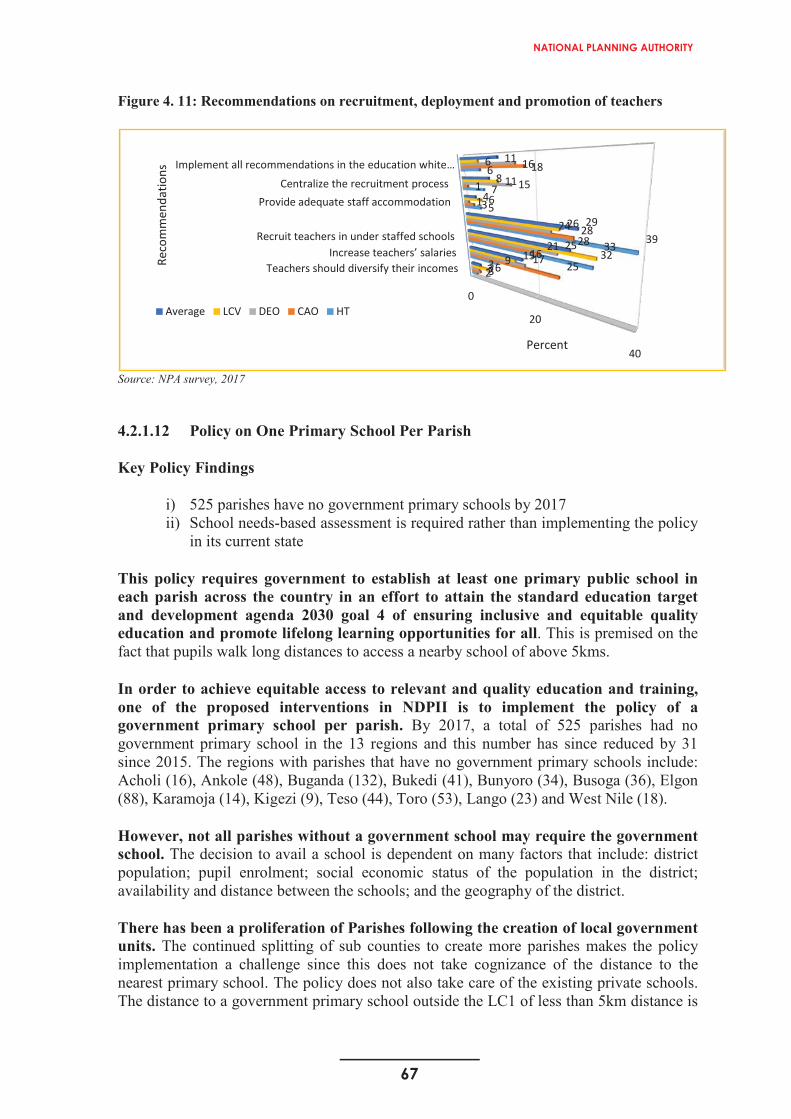
67
NATIONAL PLANNING AUTHORITY
65
Table 4. 29: Challenges on recruitment, deployment and promotion of teachers
S/N Challenges PercentHT CAO DEO LCV Average
1 Lack of transparency/corruption in recruitment, deployment and promotion 32.6 24.4 36.8 20.5 28.6
2 A ceiling on recruitment 6.9 15.9 14.7 21.9 14.8
3 High pupil teacher ratio 19.3 12.2 7.4 17.8 14.2
4 Poor teacher remuneration 8.7 22.0 14.7 9.6 13.7
5 Poor quality teachers recruited 7.3 8.5 8.4 9.6 8.5
6 Delayed deployment and confirmation 9.4 1.2 3.2 6.8 5.2
7 Inadequate staff houses 3.9 3.7 0 4.1 2.9
8 Non-functionality of District service commission 1.6 4.9 5.3 0 2.9
9 Resistance of deployment by some teachers 3.2 2.4 2.1 1.4 2.3
10 Irregular transfers 2.8 2.4 1.1 2.7 2.2
11 Financial control is still centralized 1.6 0.0 1.1 5.5 2.1
12 Some prepositions of the white paper have not been implemented 1.4 1.2 3.2 0 1.4
13 All teachers rotate in the same district 1.4 1.2 2.1 0 1.2
Total 100 100 100 100 100Source: NPA survey, 2017
Recommendations on recruitment, deployment and promotion of teachers
i) Private schools should follow MoES guidelines. Government should compel private schools to adhere to teacher recruitment guidelines. This is to ensure that teachers with the required minimum competencies as provided by government are recruited.
ii) Recruit additional teachers in areas of shortage. Government recruitment of additional teachers should prioritize to fill teacher shortages in especially the Northern and Eastern regions.
iii) Allow for transfer of teachers across districts. A mechanism should be put in place to permit reallocation of teachers from districts with excess numbers to those experiencing teacher shortages. This will in the short run fill the teacher gaps in those districts.
iv) Regularize Continuous Professional Development. Teachers should regularly undertake pedagogy trainings to enhance their teaching capabilities and allow for career growth. These have a direct bearing on teacher efficiency and effectiveness that in turn leads to improved pupil performance.
v) Increase teachers’ houses. There is need to increase the number of teachers housing facilities to match the teachers in schools. This will increase teacher attendance, time management, motivation and subsequently improve learning outcomes.
There’s need to ensure transparency in recruitment, deployment and promotion of teachers (29%) and also recruit more teachers in under staffed schools (28%). On average 16% recommend the increment of teachers’ salaries by government while 11% recommend all recommendations in the education white paper on the recruitment process implemented. However, the District Education Officers recommend that the recruitment process be recentralized.
66
Figure 4. 11: Recommendations on recruitment, deployment and promotion of teachers
Source: NPA survey, 2017
4.2.1.12 Policy on One Primary School Per Parish
Key Policy Findings
i) 525 parishes have no government primary schools by 2017ii) School needs-based assessment is required rather than implementing the policy
in its current state
This policy requires government to establish at least one primary public school in each parish across the country in an effort to attain the standard education target and development agenda 2030 goal 4 of ensuring inclusive and equitable quality education and promote lifelong learning opportunities for all. This is premised on the fact that pupils walk long distances to access a nearby school of above 5kms.
In order to achieve equitable access to relevant and quality education and training, one of the proposed interventions in NDPII is to implement the policy of a government primary school per parish. By 2017, a total of 525 parishes had no government primary school in the 13 regions and this number has since reduced by 31 since 2015. The regions with parishes that have no government primary schools include: Acholi (16), Ankole (48), Buganda (132), Bukedi (41), Bunyoro (34), Busoga (36), Elgon(88), Karamoja (14), Kigezi (9), Teso (44), Toro (53), Lango (23) and West Nile (18).
However, not all parishes without a government school may require the government school. The decision to avail a school is dependent on many factors that include: district population; pupil enrolment; social economic status of the population in the district; availability and distance between the schools; and the geography of the district.
There has been a proliferation of Parishes following the creation of local government units. The continued splitting of sub counties to create more parishes makes the policy implementation a challenge since this does not take cognizance of the distance to the nearest primary school. The policy does not also take care of the existing private schools.The distance to a government primary school outside the LC1 of less than 5km distance is
0
20
40
Teachers should diversify their incomesIncrease teachers’ salaries
Recruit teachers in under staffed schools
Provide adequate staff accommodationCentralize the recruitment process
Implement all recommendations in the education white …
29 32
39
57
6
3 25
2128
31
18
317
25
24
115
16
615
33
26
611
6
316
28
29
48
11
Percent
Reco
mm
enda
tions
Average LCV DEO CAO HT
68
Policy, Legal, Regulatory and Institutional Framework
67
97.2 percent (83.8% for 0<3 and 13.4% for 3<5) and 96 percent (83.1% for 0<3 and 12.9% for 3<5) for the private primary schools (UNHS, 2017).
The policy is therefore not bound by the size of the parishes and there has been a proliferation of Parishes recently following the creation of local government units.The continued splitting of sub counties to create more parishes makes the policy implementation a challenge since this does not take cognizance of the distance to the nearest primary school. The policy does also not take care of the existing private schools in the parishes. The statistics therefore render the policy inapplicable and therefore its implementation requires a needs-based assessment to be able to invest in the remaining 2.8% whose distance to the government school is over 5 km
Going forward, a school needs-based assessment is required rather than implementing the policy in its current state.
4.2.1.13 Physical Education and Sports Policy, 2005
Key Policy Findings
i) Regions with specific talents should be mapped out and developed further. ii) Government should fast track the development of the National High-Altitude
Training Centre at Teryet in Kapchorwaiii) Need to increase budget allocation to PES sub-sector for implementation of their
activities.iv) Physical Education is not assessed using pen and paper at the end of the cycle like
the rest of the subjects
This policy was introduced in 2005, and it aims at; improving planning, management and coordination of Physical Education and Sports in the country; improving and sustaining physical education through formal and non-formal programs; and identifyingtalents in games and sports among children and youth both at school and those out of school for further training and specialization. This policy is of particular importance to Education for All because the programs and initiatives under under it: contribute to enhancing retention and completion rates in schools; inculcate positive values and life skills; and empower and promote inclusion of marginalized groups into the education system.
Physical Education is a field of learning which aims at the development of the knowledge, understanding, positive social behavior and attitudes through the following structured learning components: practical physical activities, body exercises and sports skills. It also involves the extended application of the above learning components to the development of physical fitness; health lifestyle and social interaction within safe and structured play environments. PE is not assessed using pen and paper at the end of the cycle like the rest of the subjects but learners are engaged in practical activities and assessed to enable mastery of skills for life long wellbeing in line with the UPE objectives.
Due to limited funding, the training of teachers of physical education, including conducting sports in-service training for teachers annually, as a means of

69
NATIONAL PLANNING AUTHORITY
67
97.2 percent (83.8% for 0<3 and 13.4% for 3<5) and 96 percent (83.1% for 0<3 and 12.9% for 3<5) for the private primary schools (UNHS, 2017).
The policy is therefore not bound by the size of the parishes and there has been a proliferation of Parishes recently following the creation of local government units.The continued splitting of sub counties to create more parishes makes the policy implementation a challenge since this does not take cognizance of the distance to the nearest primary school. The policy does also not take care of the existing private schools in the parishes. The statistics therefore render the policy inapplicable and therefore its implementation requires a needs-based assessment to be able to invest in the remaining 2.8% whose distance to the government school is over 5 km
Going forward, a school needs-based assessment is required rather than implementing the policy in its current state.
4.2.1.13 Physical Education and Sports Policy, 2005
Key Policy Findings
i) Regions with specific talents should be mapped out and developed further. ii) Government should fast track the development of the National High-Altitude
Training Centre at Teryet in Kapchorwaiii) Need to increase budget allocation to PES sub-sector for implementation of their
activities.iv) Physical Education is not assessed using pen and paper at the end of the cycle like
the rest of the subjects
This policy was introduced in 2005, and it aims at; improving planning, management and coordination of Physical Education and Sports in the country; improving and sustaining physical education through formal and non-formal programs; and identifyingtalents in games and sports among children and youth both at school and those out of school for further training and specialization. This policy is of particular importance to Education for All because the programs and initiatives under under it: contribute to enhancing retention and completion rates in schools; inculcate positive values and life skills; and empower and promote inclusion of marginalized groups into the education system.
Physical Education is a field of learning which aims at the development of the knowledge, understanding, positive social behavior and attitudes through the following structured learning components: practical physical activities, body exercises and sports skills. It also involves the extended application of the above learning components to the development of physical fitness; health lifestyle and social interaction within safe and structured play environments. PE is not assessed using pen and paper at the end of the cycle like the rest of the subjects but learners are engaged in practical activities and assessed to enable mastery of skills for life long wellbeing in line with the UPE objectives.
Due to limited funding, the training of teachers of physical education, including conducting sports in-service training for teachers annually, as a means of
68
strengthening physical education and sports in schools has not been implemented.However, the policy is not being implemented because Physical Education and Sports arenot examinable / assessed.
Going forward, there is need to identify talent regions, construct the National High-Altitude Training Centre at Teryet in Kapchorwa and increase budget allocation to PES sub-sector for implementation of their activities.
4.2.1.14 Education and Sports National Policy on HIV/AIDS, 2006
Key Policy Findings
i) Schools should use professional counselors in order to reduce stigma and increase sex education among the children
ii) Talking compound on HIV/AIDS awareness should be enforced in all schools
This policy provides a framework for responding to HIV/AIDS in the Education and Sports Sector. It provides a guide to the entire education and sports sector institutions on HIV/AIDS. The policy addresses HIV/AIDS issues among Teachers, Learners (i.e. Pupils and students), educators, education and sports managers and other categories of employees in the education and sports sector. It also provides a guide for HIV/AIDS prevention, care treatment and support program, interventions and initiatives in the sector. Its major objectives include; ensuring that learners, students, education managers, educators and other sector employees access HIV/AIDS prevention, treatment, care and support services.
The Presidential Initiative on AIDS Strategy to Youth (PIASCY) was launched by the President in 2001 to reduce the spread of HIV AIDS upon His return from the UN special Assembly. It’s designed to prevent the spread of HIV/AIDS and to mitigate its impact on primary and post Primary institutions in Uganda. Since inception, students have learnt about productive health, life skills, and HIV transmission and prevention beginning primary three. The PIASCY on Aids Strategy Communication to Youth is a ministry of Education programme that guides schools on communicating about HIV/AIDS. PIASCY materials have been reviewed and have comprehensively incorporated stigma and discrimination. The materials include PIASCY Teacher’s Reference guide both for primary and post-primary education and training institutions. Training manuals have been used by key partners in the School Health and Reading Programme to train teachers in HIV counselling, care, support skills and HIV/Aids Stigma and discrimination.
Schools provide a single largest catchment area for majority of young people and therefore provide a good opportunity to emphasize core messaging on HIV/AIDS.
Talking compounds. These use compounds and classrooms to display messages on HIV. They therefore help create awareness among pupils on staying safe and longer in schools. However, most private schools do not practice talking compounds. In addition, most messages are in English and should be translated in local area language. They should be developed in appropriate languages to avoid misinterpretation. They talk what others can’t talk.
70
Policy, Legal, Regulatory and Institutional Framework
70
Budget allocation towards education is minimal and decreasing. A key concern regarding the fulfilment of the right to education is that Uganda’s budget allocation towards education has been decreasing in the last years. Budget allocated to education now represents 2.7% of GDP7 reducing from 3.5% of GDP in 2005/06. This is further significantly less than, for instance, Botswana (7.2% of GDP towards education in 2017/18). In nominal terms, in 2017/18, total spending of the education sector equaled Ugx. 2,501.1 (11.4%)8 compared to P12.7 billion (21.3%) in the total budget. Uganda has to spend the maximum of its available resources to fulfill economic, social and cultural rights, including the right to education.
4.2.2.1. The 1995 Constitution
The 1995 Constitution (as amended in 2006), which is the overarching legalframework posts education as a right, specifying that each child is entitled to basiceducation as a shared responsibility of the State and the parent. The Constitution is the highest legislative norm; it sets out general principles to which all other national laws and policies have to adhere. The constitution of the Republic of Uganda outlines the national educational objectives thus: (i) The State shall promote free and compulsory basic education; (ii) The State shall take appropriate measures to afford every citizen equal opportunity to attain the highest educational standard possible; (iii) Individuals, religious bodies and other nongovernmental organizations shall be free to found and operate educational institutions if they comply with the general educational policy of the country and maintain national standards.
(i) The State shall promote free and compulsory basic education
Further to the 1995 Constitution that requires the State to promote free and compulsory basic education, the Education Act, 2008 defines UPE as a State funded programme where tuition fees are paid by Government where the principle of equitable access to conducive, quality, relevant and affordable education is emphasized for all children of all sexes, categories and in special circumstances. In addition, Uganda ratified the Convention on the Rights of the Child (CRC), which makes it a legal obligation for the government to ensure compulsory primary education of good quality for all children, free of costs.
a) Education not free. The NPA field findings as a result of interaction with the community indicated that primary education is not free as provided by the law given that parents continue to contribute through payment of various fees. Parents from both Governments aided primary schools (80.5%) and Private schools (82.2%) confirmed that public primary education is not completely free (Figure 4.11). On average, Ugx. 42,000/= and 52,000/= is paid by the parents for lower and upper primary school levels respectively. Charges are categorized as; termly examination fees, feeding charges, extra curricula charges, construction charges among others. Pupils are sent back home after failure to pay the extra charges.This is a contradiction on the definition of UPE; because Universal access to education is the ability of all people (not only state funded) to have equal
7 UBOS, 2017
8 National Budget Framework Paper 2018/19
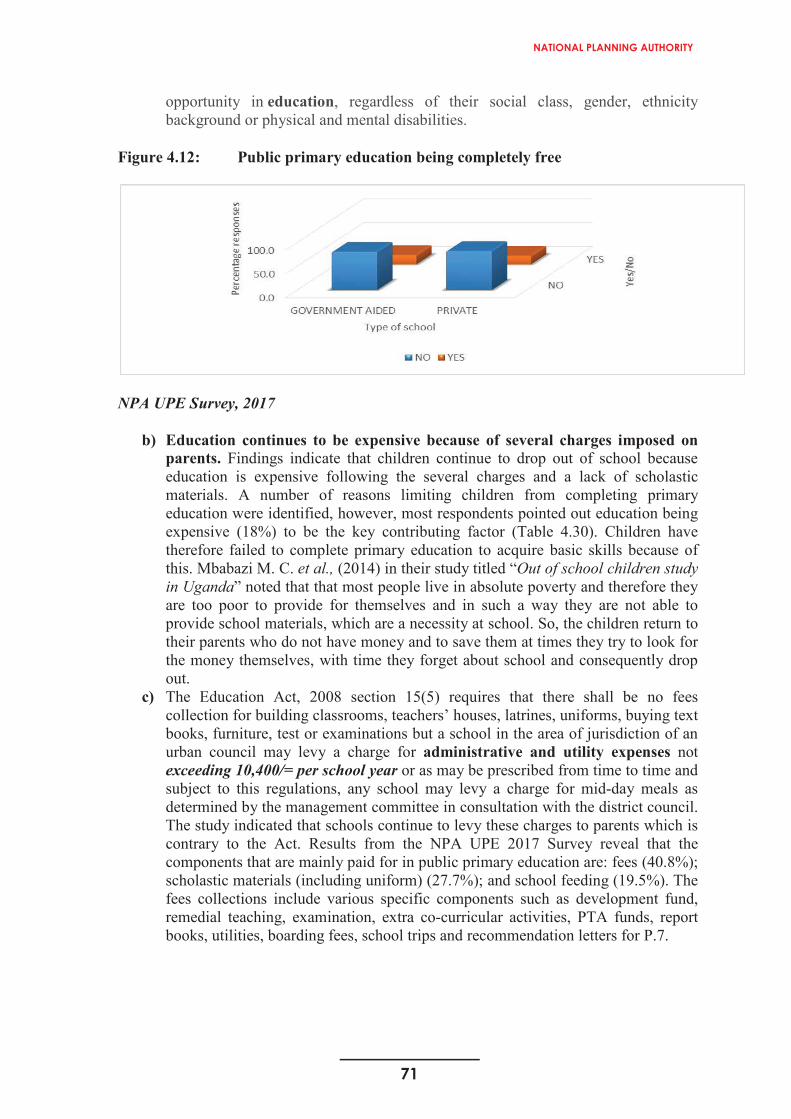
71
NATIONAL PLANNING AUTHORITY
70
Budget allocation towards education is minimal and decreasing. A key concern regarding the fulfilment of the right to education is that Uganda’s budget allocation towards education has been decreasing in the last years. Budget allocated to education now represents 2.7% of GDP7 reducing from 3.5% of GDP in 2005/06. This is further significantly less than, for instance, Botswana (7.2% of GDP towards education in 2017/18). In nominal terms, in 2017/18, total spending of the education sector equaled Ugx. 2,501.1 (11.4%)8 compared to P12.7 billion (21.3%) in the total budget. Uganda has to spend the maximum of its available resources to fulfill economic, social and cultural rights, including the right to education.
4.2.2.1. The 1995 Constitution
The 1995 Constitution (as amended in 2006), which is the overarching legalframework posts education as a right, specifying that each child is entitled to basiceducation as a shared responsibility of the State and the parent. The Constitution is the highest legislative norm; it sets out general principles to which all other national laws and policies have to adhere. The constitution of the Republic of Uganda outlines the national educational objectives thus: (i) The State shall promote free and compulsory basic education; (ii) The State shall take appropriate measures to afford every citizen equal opportunity to attain the highest educational standard possible; (iii) Individuals, religious bodies and other nongovernmental organizations shall be free to found and operate educational institutions if they comply with the general educational policy of the country and maintain national standards.
(i) The State shall promote free and compulsory basic education
Further to the 1995 Constitution that requires the State to promote free and compulsory basic education, the Education Act, 2008 defines UPE as a State funded programme where tuition fees are paid by Government where the principle of equitable access to conducive, quality, relevant and affordable education is emphasized for all children of all sexes, categories and in special circumstances. In addition, Uganda ratified the Convention on the Rights of the Child (CRC), which makes it a legal obligation for the government to ensure compulsory primary education of good quality for all children, free of costs.
a) Education not free. The NPA field findings as a result of interaction with the community indicated that primary education is not free as provided by the law given that parents continue to contribute through payment of various fees. Parents from both Governments aided primary schools (80.5%) and Private schools (82.2%) confirmed that public primary education is not completely free (Figure 4.11). On average, Ugx. 42,000/= and 52,000/= is paid by the parents for lower and upper primary school levels respectively. Charges are categorized as; termly examination fees, feeding charges, extra curricula charges, construction charges among others. Pupils are sent back home after failure to pay the extra charges.This is a contradiction on the definition of UPE; because Universal access to education is the ability of all people (not only state funded) to have equal
7 UBOS, 2017
8 National Budget Framework Paper 2018/19
71
opportunity in education, regardless of their social class, gender, ethnicity background or physical and mental disabilities.
Figure 4.12: Public primary education being completely free
NPA UPE Survey, 2017
b) Education continues to be expensive because of several charges imposed on parents. Findings indicate that children continue to drop out of school because education is expensive following the several charges and a lack of scholastic materials. A number of reasons limiting children from completing primary education were identified, however, most respondents pointed out education being expensive (18%) to be the key contributing factor (Table 4.30). Children have therefore failed to complete primary education to acquire basic skills because of this. Mbabazi M. C. et al., (2014) in their study titled “Out of school children study in Uganda” noted that that most people live in absolute poverty and therefore they are too poor to provide for themselves and in such a way they are not able to provide school materials, which are a necessity at school. So, the children return to their parents who do not have money and to save them at times they try to look for the money themselves, with time they forget about school and consequently drop out.
c) The Education Act, 2008 section 15(5) requires that there shall be no fees collection for building classrooms, teachers’ houses, latrines, uniforms, buying text books, furniture, test or examinations but a school in the area of jurisdiction of an urban council may levy a charge for administrative and utility expenses not exceeding 10,400/= per school year or as may be prescribed from time to time and subject to this regulations, any school may levy a charge for mid-day meals as determined by the management committee in consultation with the district council. The study indicated that schools continue to levy these charges to parents which is contrary to the Act. Results from the NPA UPE 2017 Survey reveal that the components that are mainly paid for in public primary education are: fees (40.8%); scholastic materials (including uniform) (27.7%); and school feeding (19.5%). The fees collections include various specific components such as development fund, remedial teaching, examination, extra co-curricular activities, PTA funds, report books, utilities, boarding fees, school trips and recommendation letters for P.7.

72
Policy, Legal, Regulatory and Institutional Framework
72
Table 4.30: Reasons for children not completing primary level of education
S/N Reasons for Leaving School Percent1 Generally expensive (scholastic materials, several charges) 17.82 Early Marriages/pregnancies 13.03 Loss of parent(s) 6.94 Parental Decision 5.85 Discouraged by own poor performance in class 5.66 Searching for work to earn income 5.57 Mistreatment at Home 4.98 Long distance to school 4.79 Indiscipline and Expulsion 4.5
10 No school meals 4.511 Disability 4.412 Caring for a sick relative 4.213 Menstruation related challenges 4.214 Harassment at school 3.915 Traditions/ Cultures 3.216 Poor sanitary facilities 3.017 Insecurity 2.618 Lack of interest by pupils (no guidance and role models, peer influence) 0.819 Other 0.3
Total 100%NPA, UPE Survey 2017
d) Pupils are sent back home after failure to pay the extra charges. Although the Education Act, 2008 requires that no child should be sent home, for failure to pay any school charges, findings indicate that the pupils have continued to be sent home, suspended, not given report cards and no meals hence deterring them for school. Therefore, the various contributions required from parents and the punishments negate the objective of providing free education.
Table 4.31: Penalties for non-payment of extra charges
S/N Penalty Frequency Percent1 Suspension 87 24.82 No meals to child 72 20.53 Not receiving report cards 48 13.74 Sending children back home 45 12.85 Denial of exams and tests 26 7.46 Warning letters 24 6.87 Confiscating of parents’ properties 9 2.68 Withholding of PLE results 8 2.39 Fines 8 2.310 Public humiliation 7 2.011 Punishing children 6 1.712 Expulsion of the child 5 1.413 Arrest of parents 4 1.1

73
NATIONAL PLANNING AUTHORITY
72
Table 4.30: Reasons for children not completing primary level of education
S/N Reasons for Leaving School Percent1 Generally expensive (scholastic materials, several charges) 17.82 Early Marriages/pregnancies 13.03 Loss of parent(s) 6.94 Parental Decision 5.85 Discouraged by own poor performance in class 5.66 Searching for work to earn income 5.57 Mistreatment at Home 4.98 Long distance to school 4.79 Indiscipline and Expulsion 4.5
10 No school meals 4.511 Disability 4.412 Caring for a sick relative 4.213 Menstruation related challenges 4.214 Harassment at school 3.915 Traditions/ Cultures 3.216 Poor sanitary facilities 3.017 Insecurity 2.618 Lack of interest by pupils (no guidance and role models, peer influence) 0.819 Other 0.3
Total 100%NPA, UPE Survey 2017
d) Pupils are sent back home after failure to pay the extra charges. Although the Education Act, 2008 requires that no child should be sent home, for failure to pay any school charges, findings indicate that the pupils have continued to be sent home, suspended, not given report cards and no meals hence deterring them for school. Therefore, the various contributions required from parents and the punishments negate the objective of providing free education.
Table 4.31: Penalties for non-payment of extra charges
S/N Penalty Frequency Percent1 Suspension 87 24.82 No meals to child 72 20.53 Not receiving report cards 48 13.74 Sending children back home 45 12.85 Denial of exams and tests 26 7.46 Warning letters 24 6.87 Confiscating of parents’ properties 9 2.68 Withholding of PLE results 8 2.39 Fines 8 2.310 Public humiliation 7 2.011 Punishing children 6 1.712 Expulsion of the child 5 1.413 Arrest of parents 4 1.1
73
14 Parents forced to providing labor 2 0.6Total 351 100
NPA, UPE Survey 2017
e) There is no social responsibility for children dropping out of school. Although the Constitution requires the State to provide compulsory basic education, this isyet to be compulsory in Uganda. Several reasons identified in table 4.27 indicate that a child is able to drop out of school without any intervention of government or stakeholders like parents and the community to have then return to school. Non-enrolment is not as widely understood and reflected upon as drop-outs. Little emphasis is being made to address the issue of non-enrolment given the fact that the Constitution provides for compulsory basic education.
Penalties for non-payment of extra charges by region
i) Common penalties by region also differ, for example; the main forms of penalties in West Nile: are not receiving report cards, sending children back home, and denial of exams at 53.8percent, 23.1percent and 23.1percent respectively. In Acholi, the outstanding penalties are: sending children back home and fines at 51.4percent and 10.8percent respectively. The other major regional classifications of penalties are shown in table below.
Table 4. 32: Main other forms of penalties for non-payment of extra charges by region
Region Penalty Percentage West Nile Not receiving report card 53.8
Sending children back home 23.1Denial of examinations 23.1
Acholi Sending children back home 51.4Fines 10.8
Karamoja Not receiving report card 44.0Confiscation of parents' property 33.3
Bukedi Sending children back home 47.4Denial of examinations 21.1
Busoga Not receiving report card 60.0Withholding PLE (Exam) results 30.0Sending children back home 30.0Denial of examinations 40.0
Central I Warning letters 33.3Punishing child 16.7
Central II Not receiving report card 69.2GKMA Warning letter 44.4
Denial of examinations 22.2Fines 22.0
Western Not receiving report card 28.6Denial of examinations 23.8Expulsion 14.3Public humiliation 14.3
South Western Warning letter 30.8Denial of examinations 23.1
NPA UPE Survey, 2017
74
Policy, Legal, Regulatory and Institutional Framework
74
ii) Penalties classified by rural or urban schools are comparably similar. For example, sending children back home, non-issuance of report cards and issuance of warning letters are the most common forms of penalties for non-payment in urban schools at 36.7 percent, 31.6 percent and 17.7 percent respectively whereas the most common in rural areas are: not receiving report cards, sending children back home and denial of tests and exams at 34.3 percent, 23.9 percent and 17.9 percent respectively. Penalties like public humiliation and punishing children are mainly in urban areas.
iii) The most common types of penalties for non-payment by both Government and Private schools are: non-issuance of a report card, sending back children back home and issuance of warning letters, although they change in magnitude across the two types of schools.
iv) There has been an increase in the number of schools and institutions set up by private investors. The constitution requires individuals, religious bodies and other nongovernmental organizations to be free to found and operate educational institutions if they comply with the general educational policy of the country and maintain national standards. A number of stakeholders have engaged in primary education. Since the government of Uganda decision in 1993 to liberalize the education sector, thousands of schools and institutions have been set up by private investors. The total number of private primary schools increased from 1,481 in 1999/00 to 7,647 in 2016.
v) Any person in Uganda has a right to education. Article 30 of the Constitution of the Republic of Uganda requires that any person has a right to education. Uganda has done commendably well in expanding access to primary education which is measured using enrolment figures and the population figures with respect to the official school going age at primary level of education. In the case of Uganda, the official age for primary education is 6 to 12 years. Therefore, all children aged 6-12 years are expected to be in primary school. In 2015, total enrolment in primary education was 8,264,317 (i.e. 4,122,663 boys; 4,141,654 girls), while GIR and NIR stood at 152% and 65% in 2014 respectively. The Net Enrolment Ratio (NER) reduced from 110% to 91% while Gross Enrolment Ratio (GER) increased from 93.7% to 109% in 2014 and 2015 respectively. The 109% GER in 2015 implies that formal schooling in primary cycle includes many children older than 12 years as well as some as young than 6 years meaning that everybody has the ability to go to school. In terms of infrastructure, in 2014, the number of Government primary schools stood at 12,203 while classroom stock was at 103,186.
Figure 4.13: Trends in enrolment in Primary Education from 2002 -2015
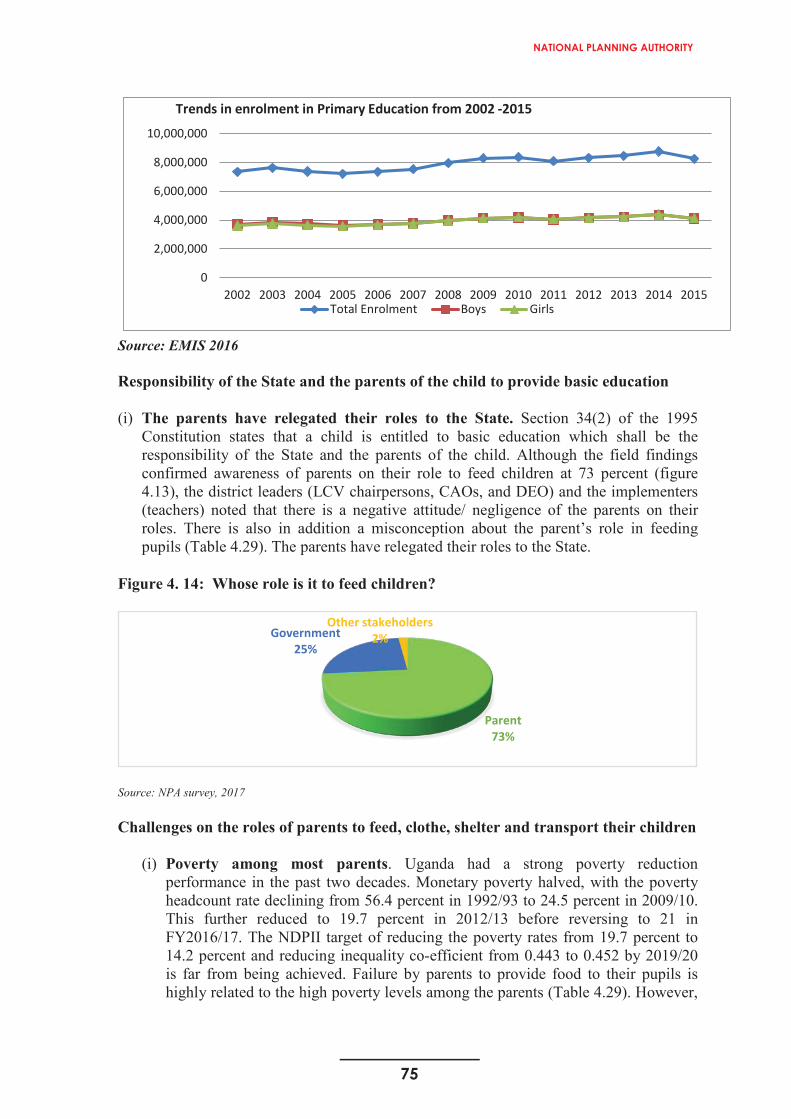
75
NATIONAL PLANNING AUTHORITY
74
ii) Penalties classified by rural or urban schools are comparably similar. For example, sending children back home, non-issuance of report cards and issuance of warning letters are the most common forms of penalties for non-payment in urban schools at 36.7 percent, 31.6 percent and 17.7 percent respectively whereas the most common in rural areas are: not receiving report cards, sending children back home and denial of tests and exams at 34.3 percent, 23.9 percent and 17.9 percent respectively. Penalties like public humiliation and punishing children are mainly in urban areas.
iii) The most common types of penalties for non-payment by both Government and Private schools are: non-issuance of a report card, sending back children back home and issuance of warning letters, although they change in magnitude across the two types of schools.
iv) There has been an increase in the number of schools and institutions set up by private investors. The constitution requires individuals, religious bodies and other nongovernmental organizations to be free to found and operate educational institutions if they comply with the general educational policy of the country and maintain national standards. A number of stakeholders have engaged in primary education. Since the government of Uganda decision in 1993 to liberalize the education sector, thousands of schools and institutions have been set up by private investors. The total number of private primary schools increased from 1,481 in 1999/00 to 7,647 in 2016.
v) Any person in Uganda has a right to education. Article 30 of the Constitution of the Republic of Uganda requires that any person has a right to education. Uganda has done commendably well in expanding access to primary education which is measured using enrolment figures and the population figures with respect to the official school going age at primary level of education. In the case of Uganda, the official age for primary education is 6 to 12 years. Therefore, all children aged 6-12 years are expected to be in primary school. In 2015, total enrolment in primary education was 8,264,317 (i.e. 4,122,663 boys; 4,141,654 girls), while GIR and NIR stood at 152% and 65% in 2014 respectively. The Net Enrolment Ratio (NER) reduced from 110% to 91% while Gross Enrolment Ratio (GER) increased from 93.7% to 109% in 2014 and 2015 respectively. The 109% GER in 2015 implies that formal schooling in primary cycle includes many children older than 12 years as well as some as young than 6 years meaning that everybody has the ability to go to school. In terms of infrastructure, in 2014, the number of Government primary schools stood at 12,203 while classroom stock was at 103,186.
Figure 4.13: Trends in enrolment in Primary Education from 2002 -2015
75
0
2,000,000
4,000,000
6,000,000
8,000,000
10,000,000
2002 2003 2004 2005 2006 2007 2008 2009 2010 2011 2012 2013 2014 2015
Trends in enrolment in Primary Education from 2002 -2015
Total Enrolment Boys Girls
Source: EMIS 2016
Responsibility of the State and the parents of the child to provide basic education
(i) The parents have relegated their roles to the State. Section 34(2) of the 1995 Constitution states that a child is entitled to basic education which shall be the responsibility of the State and the parents of the child. Although the field findings confirmed awareness of parents on their role to feed children at 73 percent (figure 4.13), the district leaders (LCV chairpersons, CAOs, and DEO) and the implementers (teachers) noted that there is a negative attitude/ negligence of the parents on their roles. There is also in addition a misconception about the parent’s role in feeding pupils (Table 4.29). The parents have relegated their roles to the State.
Figure 4. 14: Whose role is it to feed children?
Source: NPA survey, 2017
Challenges on the roles of parents to feed, clothe, shelter and transport their children
(i) Poverty among most parents. Uganda had a strong poverty reduction performance in the past two decades. Monetary poverty halved, with the poverty headcount rate declining from 56.4 percent in 1992/93 to 24.5 percent in 2009/10.This further reduced to 19.7 percent in 2012/13 before reversing to 21 in FY2016/17. The NDPII target of reducing the poverty rates from 19.7 percent to 14.2 percent and reducing inequality co-efficient from 0.443 to 0.452 by 2019/20is far from being achieved. Failure by parents to provide food to their pupils is highly related to the high poverty levels among the parents (Table 4.29). However,
Parent73%
Government25%
Other stakeholders2%
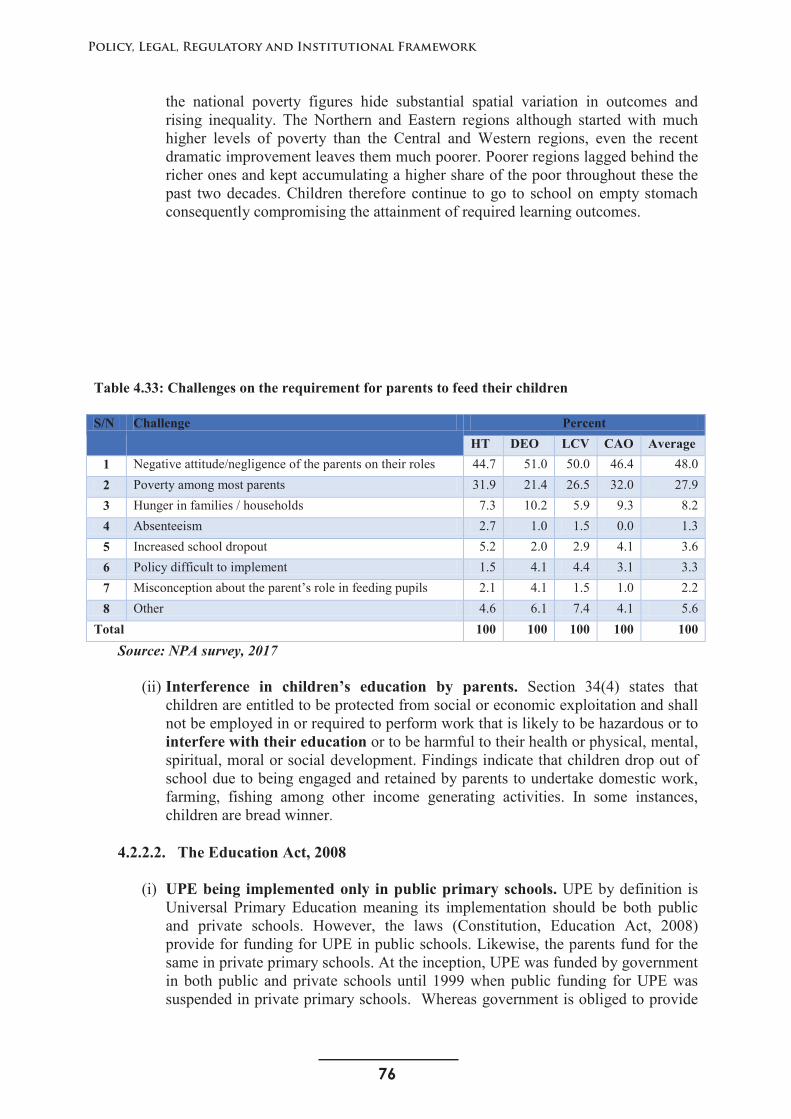
76
Policy, Legal, Regulatory and Institutional Framework
76
the national poverty figures hide substantial spatial variation in outcomes and rising inequality. The Northern and Eastern regions although started with much higher levels of poverty than the Central and Western regions, even the recent dramatic improvement leaves them much poorer. Poorer regions lagged behind the richer ones and kept accumulating a higher share of the poor throughout these the past two decades. Children therefore continue to go to school on empty stomach consequently compromising the attainment of required learning outcomes.
Table 4.33: Challenges on the requirement for parents to feed their children
S/N Challenge PercentHT DEO LCV CAO Average
1 Negative attitude/negligence of the parents on their roles 44.7 51.0 50.0 46.4 48.02 Poverty among most parents 31.9 21.4 26.5 32.0 27.93 Hunger in families / households 7.3 10.2 5.9 9.3 8.24 Absenteeism 2.7 1.0 1.5 0.0 1.35 Increased school dropout 5.2 2.0 2.9 4.1 3.66 Policy difficult to implement 1.5 4.1 4.4 3.1 3.37 Misconception about the parent’s role in feeding pupils 2.1 4.1 1.5 1.0 2.28 Other 4.6 6.1 7.4 4.1 5.6
Total 100 100 100 100 100Source: NPA survey, 2017
(ii) Interference in children’s education by parents. Section 34(4) states that children are entitled to be protected from social or economic exploitation and shall not be employed in or required to perform work that is likely to be hazardous or to interfere with their education or to be harmful to their health or physical, mental, spiritual, moral or social development. Findings indicate that children drop out of school due to being engaged and retained by parents to undertake domestic work, farming, fishing among other income generating activities. In some instances, children are bread winner.
4.2.2.2. The Education Act, 2008
(i) UPE being implemented only in public primary schools. UPE by definition is Universal Primary Education meaning its implementation should be both public and private schools. However, the laws (Constitution, Education Act, 2008)provide for funding for UPE in public schools. Likewise, the parents fund for the same in private primary schools. At the inception, UPE was funded by government in both public and private schools until 1999 when public funding for UPE was suspended in private primary schools. Whereas government is obliged to provide
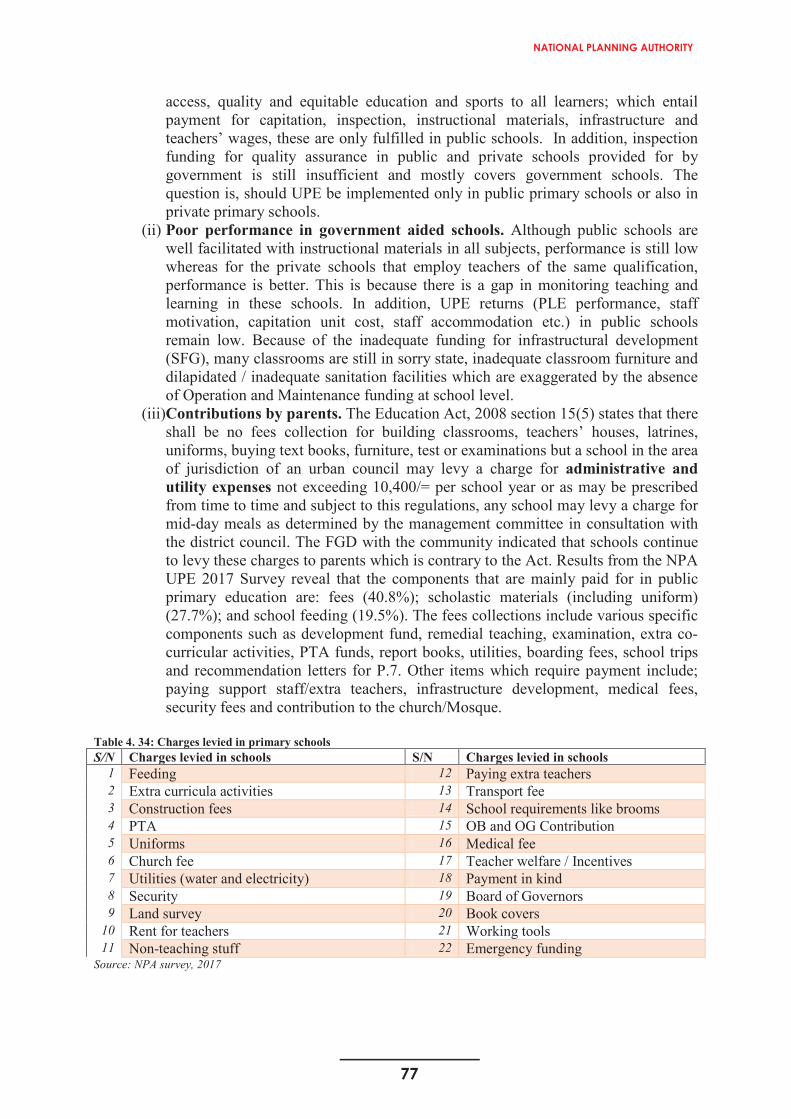
77
NATIONAL PLANNING AUTHORITY
76
the national poverty figures hide substantial spatial variation in outcomes and rising inequality. The Northern and Eastern regions although started with much higher levels of poverty than the Central and Western regions, even the recent dramatic improvement leaves them much poorer. Poorer regions lagged behind the richer ones and kept accumulating a higher share of the poor throughout these the past two decades. Children therefore continue to go to school on empty stomach consequently compromising the attainment of required learning outcomes.
Table 4.33: Challenges on the requirement for parents to feed their children
S/N Challenge PercentHT DEO LCV CAO Average
1 Negative attitude/negligence of the parents on their roles 44.7 51.0 50.0 46.4 48.02 Poverty among most parents 31.9 21.4 26.5 32.0 27.93 Hunger in families / households 7.3 10.2 5.9 9.3 8.24 Absenteeism 2.7 1.0 1.5 0.0 1.35 Increased school dropout 5.2 2.0 2.9 4.1 3.66 Policy difficult to implement 1.5 4.1 4.4 3.1 3.37 Misconception about the parent’s role in feeding pupils 2.1 4.1 1.5 1.0 2.28 Other 4.6 6.1 7.4 4.1 5.6
Total 100 100 100 100 100Source: NPA survey, 2017
(ii) Interference in children’s education by parents. Section 34(4) states that children are entitled to be protected from social or economic exploitation and shall not be employed in or required to perform work that is likely to be hazardous or to interfere with their education or to be harmful to their health or physical, mental, spiritual, moral or social development. Findings indicate that children drop out of school due to being engaged and retained by parents to undertake domestic work, farming, fishing among other income generating activities. In some instances, children are bread winner.
4.2.2.2. The Education Act, 2008
(i) UPE being implemented only in public primary schools. UPE by definition is Universal Primary Education meaning its implementation should be both public and private schools. However, the laws (Constitution, Education Act, 2008)provide for funding for UPE in public schools. Likewise, the parents fund for the same in private primary schools. At the inception, UPE was funded by government in both public and private schools until 1999 when public funding for UPE was suspended in private primary schools. Whereas government is obliged to provide
77
access, quality and equitable education and sports to all learners; which entail payment for capitation, inspection, instructional materials, infrastructure and teachers’ wages, these are only fulfilled in public schools. In addition, inspection funding for quality assurance in public and private schools provided for by government is still insufficient and mostly covers government schools. The question is, should UPE be implemented only in public primary schools or also in private primary schools.
(ii) Poor performance in government aided schools. Although public schools are well facilitated with instructional materials in all subjects, performance is still lowwhereas for the private schools that employ teachers of the same qualification, performance is better. This is because there is a gap in monitoring teaching andlearning in these schools. In addition, UPE returns (PLE performance, staff motivation, capitation unit cost, staff accommodation etc.) in public schools remain low. Because of the inadequate funding for infrastructural development(SFG), many classrooms are still in sorry state, inadequate classroom furniture and dilapidated / inadequate sanitation facilities which are exaggerated by the absence of Operation and Maintenance funding at school level.
(iii)Contributions by parents. The Education Act, 2008 section 15(5) states that there shall be no fees collection for building classrooms, teachers’ houses, latrines, uniforms, buying text books, furniture, test or examinations but a school in the area of jurisdiction of an urban council may levy a charge for administrative and utility expenses not exceeding 10,400/= per school year or as may be prescribed from time to time and subject to this regulations, any school may levy a charge for mid-day meals as determined by the management committee in consultation withthe district council. The FGD with the community indicated that schools continue to levy these charges to parents which is contrary to the Act. Results from the NPA UPE 2017 Survey reveal that the components that are mainly paid for in public primary education are: fees (40.8%); scholastic materials (including uniform) (27.7%); and school feeding (19.5%). The fees collections include various specific components such as development fund, remedial teaching, examination, extra co-curricular activities, PTA funds, report books, utilities, boarding fees, school trips and recommendation letters for P.7. Other items which require payment include; paying support staff/extra teachers, infrastructure development, medical fees, security fees and contribution to the church/Mosque.
Table 4. 34: Charges levied in primary schoolsS/N Charges levied in schools S/N Charges levied in schools
1 Feeding 12 Paying extra teachers2 Extra curricula activities 13 Transport fee3 Construction fees 14 School requirements like brooms4 PTA 15 OB and OG Contribution5 Uniforms 16 Medical fee6 Church fee 17 Teacher welfare / Incentives7 Utilities (water and electricity) 18 Payment in kind8 Security 19 Board of Governors9 Land survey 20 Book covers
10 Rent for teachers 21 Working tools11 Non-teaching stuff 22 Emergency funding
Source: NPA survey, 2017
78
Policy, Legal, Regulatory and Institutional Framework
78
(iv)There is no tracking system for drop outs. Section 10(3b) of the Education Act, 2008 requires Government to ensure a child who drops out of school before completing primary education cycle attains basic education through alternative approaches to providing that education. The drop out in Uganda has continued to increase however, there is no government strategy in place to trace students that have left before completing primary education cycle to attain basic education.
(v) Education Act, 2008 requires every district to have a three-year rolling Education Development Plan. Section 27 (1) of the Education Act requires the district council to cause an education development plan to be prepared in respect of such educational services to be administered by the LG, which shall cover a period of three years as prescribed by the LG Act, and the plan shall be part of the comprehensive and integrated development plan of the district. (2) Every district standing committee responsible for education shall prepare, in consultation with the District Education Officer and municipal, division, town and Sub county Council Education Officer for which it is established, an education development plan for promoting educational services for which it is responsible. However, the Local Government Act was amended and the three-year rolling plan was changed to a 5-year Local Government Development Plan. There is therefore need to amend this section of the Act for it to be in line with the LG Act and the Comprehensive National Development Planning Framework (CNDPF). In addition, there shouldn’t be individual departmental plans but these must have work plans derived from the Local Government Development Plan. There must therefore be only one LGDP in the LG.
4.2.2.3.Local Government Act, Cap 243, Laws of Uganda 2000
(i) The Local Government Act, Article 96, 97 and 99 provides how LGs collaborate with Ministries, Departments and Agencies (MDAs) at the Center.LG Act, Article, 97 (1) mandates the Ministry of Education and Sports as a line Ministry to local governments to: (a) monitor and coordinate Government initiatives and policies as they apply to local governments; (b) coordinate and advise persons and organizations in relation to projects involving direct relations with LGs; and (c) assist in the provision of technical assistance to local governments. The line Ministry (Ministry of Education and Sports) however, has no direct control over the LGs since it has to go through the mother Ministry (Ministry of LG). The Ministry has therefore no direct control over a LG to sanction.
(ii) Process to develop and approve By-laws and Ordinances is too long and bureaucratic. The LG Act 243 (38) provides powers for a district council to make laws that are not inconsistent with the Constitution or any other law made by Parliament which power shall be exercised by the passing of local bills into ordinances by the council and signed by the chairperson. The local bill passed by a district council is forwarded to the Attorney General through the Minister of Local Government to certify that the local bill is not inconsistent with the Constitution or any other law enacted by Parliament before the chairperson signs the law. However, although the procedure indicates that the bill be returned with comments to the relevant council for modification or other appropriate action within ninety days, this always takes over a year. It’s therefore difficult to make ordinances since the approval process takes long and there are no punitive actions in case the Minister or Attorney General does not act. The LGs are also very many
79
NATIONAL PLANNING AUTHORITY
78
(iv)There is no tracking system for drop outs. Section 10(3b) of the Education Act, 2008 requires Government to ensure a child who drops out of school before completing primary education cycle attains basic education through alternative approaches to providing that education. The drop out in Uganda has continued to increase however, there is no government strategy in place to trace students that have left before completing primary education cycle to attain basic education.
(v) Education Act, 2008 requires every district to have a three-year rolling Education Development Plan. Section 27 (1) of the Education Act requires the district council to cause an education development plan to be prepared in respect of such educational services to be administered by the LG, which shall cover a period of three years as prescribed by the LG Act, and the plan shall be part of the comprehensive and integrated development plan of the district. (2) Every district standing committee responsible for education shall prepare, in consultation with the District Education Officer and municipal, division, town and Sub county Council Education Officer for which it is established, an education development plan for promoting educational services for which it is responsible. However, the Local Government Act was amended and the three-year rolling plan was changed to a 5-year Local Government Development Plan. There is therefore need to amend this section of the Act for it to be in line with the LG Act and the Comprehensive National Development Planning Framework (CNDPF). In addition, there shouldn’t be individual departmental plans but these must have work plans derived from the Local Government Development Plan. There must therefore be only one LGDP in the LG.
4.2.2.3.Local Government Act, Cap 243, Laws of Uganda 2000
(i) The Local Government Act, Article 96, 97 and 99 provides how LGs collaborate with Ministries, Departments and Agencies (MDAs) at the Center.LG Act, Article, 97 (1) mandates the Ministry of Education and Sports as a line Ministry to local governments to: (a) monitor and coordinate Government initiatives and policies as they apply to local governments; (b) coordinate and advise persons and organizations in relation to projects involving direct relations with LGs; and (c) assist in the provision of technical assistance to local governments. The line Ministry (Ministry of Education and Sports) however, has no direct control over the LGs since it has to go through the mother Ministry (Ministry of LG). The Ministry has therefore no direct control over a LG to sanction.
(ii) Process to develop and approve By-laws and Ordinances is too long and bureaucratic. The LG Act 243 (38) provides powers for a district council to make laws that are not inconsistent with the Constitution or any other law made by Parliament which power shall be exercised by the passing of local bills into ordinances by the council and signed by the chairperson. The local bill passed by a district council is forwarded to the Attorney General through the Minister of Local Government to certify that the local bill is not inconsistent with the Constitution or any other law enacted by Parliament before the chairperson signs the law. However, although the procedure indicates that the bill be returned with comments to the relevant council for modification or other appropriate action within ninety days, this always takes over a year. It’s therefore difficult to make ordinances since the approval process takes long and there are no punitive actions in case the Minister or Attorney General does not act. The LGs are also very many
79
and may be cumbersome for the Minister and Attorney General to handle within the required period. In Botswana, the Ministry of Local Government approves the By-laws and ordinances for consistency with other supreme legislations.
(iii)Primary education not fully decentralized. Whereas all the primary education activities relating to UPE implementation are decentralized, financing has remained at the centre. The LG Act cap 243 states that the recurrent and development budget is a decentralized service. The LR is insufficient and LGs have continued to depend on funds from the center which are mostly conditional.Funding should also be based on the needs of the people (bottom up) rather than the centre dictating ceilings for education activities at institution levels. The process should consider inclusive participation of UPE implementers.
4.2.2.4.Education White Paper
The Education Policy Review Commission report proposed various changes in the current organization structure. These include; Decentralization of decision making process in order to improve efficiency and accelerate policy implementation. Government to this effect decentralized primary education. Although the decentralization process has brought services closer to the people, some services like financing remain centralized.
Key Policy Findings
(i) This evaluation finds the current education system relevant contrary to the EPRC’s recommendation of changing from the current from the current 7-4-2-3 system to 8-3-2-3 system. The current system only requires to be strengthened to achieve its intended results.
(ii) There is no policy that guides assessment in Uganda. The Uganda NationalExaminations Board Act, 1983 gives UNEB the mandate to undertake assessment of the Primary curriculum at the end of the cycle and leaves out continuous assessment to individual schools. Assessment is therefore not uniform as some restrict assessment to only examinable subjects which is common with private schools. Areas like Music, Dance and Drama and co-curricular activities are often neglected.
(iii)Regulation on the materials used for continuous assessment is lacking. There are private bodies (Business oriented companies) that are non-regulated that set and print examinations for schools for commercial purposes. This leads to the non-attainment of formative assessment objectives. The companies are in addition not licensed / quality assured. The outcomes of such assessments used do not effectively improve learning.
(iv)Confidentiality of examination information lacking. Need to enact an Examination Misconduct and Confidentiality policy with strict penalties and rewards ranging from suspension, expulsion and resignation of any of the culprits. UNEB should also setup regional exams to curb examination malpractice
(v) The NCDC Act is inadequate as a legal tool, i.e., the act is silent about the role of the Centre in relation to curricula used by international schools on learners in Uganda.
(vi)There is no compendium on standards set by DES in educational practice and provision as required by the Education Act, 2008.
(vii) Although DES a department responsible for the inspection programme provides inspection procedures, instruments or tools and templates to
80
Policy, Legal, Regulatory and Institutional Framework
80
inspectors working at LG, the law does not require them to report to DES.Section 25(1)(a) requires the inspector to inspect and provide a report to the Permanent Secretary, the district education officer and the relevant foundation body, in a format prescribed by the Director of Education standards.
(viii) Weak enforcement mechanisms on inspection recommendations. Failure by headteachers to implement recommendations raised has no prescribed actions against.
4.2.3. Institutional Framework and Coordination Mechanisms in the Delivery ofPrimary Education
4.2.3.1 Institutional Framework and Coordination at Central Government leveli) The sector institutional players include: Public sector institutions, Private
sector, Civil Society/ Non-Government Organizations (NGOs) and Development Partners. The Public Sector is constituted by different MDAs which include: Ministry of Education and Sports, Departments and Affiliate bodies, key stakeholder ministries including; MoFPED, MoLG, and MoPS. In addition, there are semi-autonomous institutions that execute certain responsibilities on behalf of and in liaison with the lead Ministry (MoES). These include the National Council of Sports (NCS), Uganda National Examinations Board (UNEB), National Council for Higher Education (NCHE), National Curriculum Development Centre (NCDC), Directorate of Education Standards (DES), Universities, and the Education Service Commission (ESC).
ii) At MoES, the primary education function is under the Directorate of Basic and Secondary Education. The other directorates at MoES are; the Directorate of Higher, Technical and Vocational Education and Training; the Directorate of Education Standards and the Directorate of Industrial Training.
iii) The private sector and civil society comprise; investors, Faith Based Organizations (FBOs), NGOs and the development Partners under the Education Funding Agencies Group (EFAG). The international NGOs includethe United Nations Education Scientific and Cultural Organization (UNESCO) and the United Nations International Children’s Education Fund (UNICEF).
iv) Primary education is a decentralized function in terms of planning, budgetingand implementation coordinated by MoES. These roles are executed through the Sector Wide Arrangements /Approach (SWAp), which works through sector working groups, namely: (i) Monitoring and Evaluation Working Group (MEWG),(ii) Education Sector Budget Working Group (ESBWG), and (iii) Sector Policy Management (SPM). Critical issues of financial and policy nature arising from WGs are forwarded to the Education Sector Consultative Committee (ESCC) and Top Management for decision making
The organization of the sector is reflected in the Institutional framework as highlighted in Annex 1 in the Appendix.
4.2.3.2 Institutional Framework and Coordination at Local Government leveli) The LG primary education institutional framework is coordinated by the
Education department headed by the District Education Officer. The department has a number of inspectors headed by the District Inspector of Schools. Part of the Inspection team includes Centre Coordinating Tutors (CCTs) based at
81
NATIONAL PLANNING AUTHORITY
80
inspectors working at LG, the law does not require them to report to DES.Section 25(1)(a) requires the inspector to inspect and provide a report to the Permanent Secretary, the district education officer and the relevant foundation body, in a format prescribed by the Director of Education standards.
(viii) Weak enforcement mechanisms on inspection recommendations. Failure by headteachers to implement recommendations raised has no prescribed actions against.
4.2.3. Institutional Framework and Coordination Mechanisms in the Delivery ofPrimary Education
4.2.3.1 Institutional Framework and Coordination at Central Government leveli) The sector institutional players include: Public sector institutions, Private
sector, Civil Society/ Non-Government Organizations (NGOs) and Development Partners. The Public Sector is constituted by different MDAs which include: Ministry of Education and Sports, Departments and Affiliate bodies, key stakeholder ministries including; MoFPED, MoLG, and MoPS. In addition, there are semi-autonomous institutions that execute certain responsibilities on behalf of and in liaison with the lead Ministry (MoES). These include the National Council of Sports (NCS), Uganda National Examinations Board (UNEB), National Council for Higher Education (NCHE), National Curriculum Development Centre (NCDC), Directorate of Education Standards (DES), Universities, and the Education Service Commission (ESC).
ii) At MoES, the primary education function is under the Directorate of Basic and Secondary Education. The other directorates at MoES are; the Directorate of Higher, Technical and Vocational Education and Training; the Directorate of Education Standards and the Directorate of Industrial Training.
iii) The private sector and civil society comprise; investors, Faith Based Organizations (FBOs), NGOs and the development Partners under the Education Funding Agencies Group (EFAG). The international NGOs includethe United Nations Education Scientific and Cultural Organization (UNESCO) and the United Nations International Children’s Education Fund (UNICEF).
iv) Primary education is a decentralized function in terms of planning, budgetingand implementation coordinated by MoES. These roles are executed through the Sector Wide Arrangements /Approach (SWAp), which works through sector working groups, namely: (i) Monitoring and Evaluation Working Group (MEWG),(ii) Education Sector Budget Working Group (ESBWG), and (iii) Sector Policy Management (SPM). Critical issues of financial and policy nature arising from WGs are forwarded to the Education Sector Consultative Committee (ESCC) and Top Management for decision making
The organization of the sector is reflected in the Institutional framework as highlighted in Annex 1 in the Appendix.
4.2.3.2 Institutional Framework and Coordination at Local Government leveli) The LG primary education institutional framework is coordinated by the
Education department headed by the District Education Officer. The department has a number of inspectors headed by the District Inspector of Schools. Part of the Inspection team includes Centre Coordinating Tutors (CCTs) based at
81
Core PTCs who serve as outreach teacher educators to provide Continuous Professional Development (CPDs) to primary schools, head teachers and teachers. The Chief Administrative Officer (CAO) is the overall accounting officer. The council is the highest political authority within the area of jurisdiction of a local government and it has legislative and executive powers to be exercised in accordance with the Constitution and this Act. The District Executive Committee is in charge of monitoring on behalf of the district council is responsible for initiating and formulating policy for approval of the council; Overseeing the implementation of the Government and the council’s policies and monitor and coordinate activities of nongovernmental organizations in a district; (c) monitoring the implementation of council programmes and take remedial action where necessary; (e) receive and solve problems or disputes forwarded to it from lower local government councils; and (f) at the end of each financial year consider and evaluate the performance of the council against the approved work plans and programmes; and (g) carry out any other duty as may be authorized by the council or any law.
ii) At Municipality level, the Education department is headed by the Municipal Education Officer who supervises the Municipal Inspectors of Schools. The Town Clerk is the accounting officer for primary education programmes in the municipality. At Sub county level, the Senior Assistant Secretary (SAS) is the Accounting Officer and is required to monitor and supervise each primary school on a regular basis. The lowest institutional level for primary education is the school headed by a headteacher who works closely with the School Management Committee (SMC) in management of the primary school.
iii) SMCs are legitimate bodies provided for in the Education Act, 2008. The SMCs are comprised of 12 members, representing; foundation body, district local government; local council executive committee; sub-county or city division or municipal representative; parents; staff (both non-teaching and teaching); and former pupils.
iv) Each district has a District Education Officer and an Inspector of Schools, with a Municipality having a Municipal Education Officer, in who are charged with the responsibility of maintaining a close administrative, Supervisory and inspectorial contact with schools on behalf of the central government. They work closely with the District and Urban Authorities.
4.3. Assessment of Performance of Institutional Frameworks
Prior and after declaration of UPE, a number of reforms have been proposed for implementation with a view to enhance effectiveness and efficiency of institutions across the country. The performance of the various institutions since the inception of UPE is discussed in the sections that follow.
4.4.1. Ministry of Education and Sports
i) The mandate and functions of MoES have evolved over the period after introduction of UPE beyond policy formulation, planning, budgeting and implementation to include sports and science and technology. The function of science and technology was later, in FY2016/17, elevated to a fully-fledged sector.
ii) The most marked restructuring of MoES was undertaken between 2000 and 2010 when the number of Departments expanded from 10 to 12 (Guidance and Counseling and Private Secondary Schools). In addition, the restructuring created
82
Policy, Legal, Regulatory and Institutional Framework
82
four new directorates (i.e. Higher, Technical and Vocational Education and Training; Basic and Secondary; Education Standards; and Industrial training).
iii) Organization and staffing under education. Despite the historically strong central issues of the MoES, financial, communication and staffing levels have reduced the effectiveness of headquarters in exercising control over the district and school level operations. This is particularly prominent in the primary education sub sector where the operation of the school is the responsibility of the headteacher and the management committee. The restructuring of MoES Headquarters should be followed by full implementation for improved service delivery.
The specific reforms by institutions that were aimed at improving UPE are reviewed in the sections below.
4.4.1.1 Directorate of Education Standards (DES)
The Directorate of Education Standards (DES) evolved from Education Standards Agency (ESA) which was established in 2001. The operations of ESA were guided by the recommendations of the ESA Report of June 2000 and the Policy Guidelines and Implementation Strategy document (Executive Agency Implementation Strategy). The restructuring of MoES, in 2008 and Enactment of Education Act 2008 turned ESA into the Directorate of Education Standards (DES).
The Education Act, 2008 under article 46 stipulates the functions of DES as follows: to set, define and review standards in educational practice and provision through planned series of inspections; to assess the achievement of standards and to evaluate the effectiveness of education programmes of institutions and agencies throughout Uganda; to develop systematic approaches to inspection and evaluation, and to encourage evaluation and self-evaluation systems, using appropriate quality indicators, within the education service; to provide and disseminate regular reports on the quality of education at all levels; to develop the use of the reports as a mechanism to provide support for and the dissemination of good practice, and thus to improve the quality of practice in the education service as a whole, and in particular aspects; to provide independent expert comment and advice on educational provision and practice at all levels of education; and to give advice to the Minister on such matters related to quality control in education.
On setting of standards for primary education, this evaluation established lack of a comprehensive and approved compendium of standards for the Education Sector as required by the Education Act, 2008. The Directorate has over the years instead been guided by a number of frameworks in assessing the quality of education including EFA, MDG, and SDG goals; and the Ministry of Education and Sports Education Sector Strategic Plan 2016- 2020 and DES Strategic Plan 2016- 2020. However, the DES has developed a number of guidelines for inspection. The findings of this evaluation indicate that DES focusses more on field inspection than establishment of frameworks such as education standards. The absence of approved standards was highlighted by the first National Development Plan, 2010/11-2015/16 as one of the major encumbrances to effective and efficient Education Service Delivery. Attempts to establish standards were made by the MoES in 2009 and led to introduction of the Basic Requirements and Minimum Standards (BRMS) indicators for education institutions which were customized for use in inspections at LG level.
83
NATIONAL PLANNING AUTHORITY
82
four new directorates (i.e. Higher, Technical and Vocational Education and Training; Basic and Secondary; Education Standards; and Industrial training).
iii) Organization and staffing under education. Despite the historically strong central issues of the MoES, financial, communication and staffing levels have reduced the effectiveness of headquarters in exercising control over the district and school level operations. This is particularly prominent in the primary education sub sector where the operation of the school is the responsibility of the headteacher and the management committee. The restructuring of MoES Headquarters should be followed by full implementation for improved service delivery.
The specific reforms by institutions that were aimed at improving UPE are reviewed in the sections below.
4.4.1.1 Directorate of Education Standards (DES)
The Directorate of Education Standards (DES) evolved from Education Standards Agency (ESA) which was established in 2001. The operations of ESA were guided by the recommendations of the ESA Report of June 2000 and the Policy Guidelines and Implementation Strategy document (Executive Agency Implementation Strategy). The restructuring of MoES, in 2008 and Enactment of Education Act 2008 turned ESA into the Directorate of Education Standards (DES).
The Education Act, 2008 under article 46 stipulates the functions of DES as follows: to set, define and review standards in educational practice and provision through planned series of inspections; to assess the achievement of standards and to evaluate the effectiveness of education programmes of institutions and agencies throughout Uganda; to develop systematic approaches to inspection and evaluation, and to encourage evaluation and self-evaluation systems, using appropriate quality indicators, within the education service; to provide and disseminate regular reports on the quality of education at all levels; to develop the use of the reports as a mechanism to provide support for and the dissemination of good practice, and thus to improve the quality of practice in the education service as a whole, and in particular aspects; to provide independent expert comment and advice on educational provision and practice at all levels of education; and to give advice to the Minister on such matters related to quality control in education.
On setting of standards for primary education, this evaluation established lack of a comprehensive and approved compendium of standards for the Education Sector as required by the Education Act, 2008. The Directorate has over the years instead been guided by a number of frameworks in assessing the quality of education including EFA, MDG, and SDG goals; and the Ministry of Education and Sports Education Sector Strategic Plan 2016- 2020 and DES Strategic Plan 2016- 2020. However, the DES has developed a number of guidelines for inspection. The findings of this evaluation indicate that DES focusses more on field inspection than establishment of frameworks such as education standards. The absence of approved standards was highlighted by the first National Development Plan, 2010/11-2015/16 as one of the major encumbrances to effective and efficient Education Service Delivery. Attempts to establish standards were made by the MoES in 2009 and led to introduction of the Basic Requirements and Minimum Standards (BRMS) indicators for education institutions which were customized for use in inspections at LG level.
83
DES is also mandated to assess the achievement of standards and to evaluate the effectiveness of education programmes of institutions and agencies throughout Uganda. Due to capacity and other challenges, DES has not been able to fully execute this mandate. There was no evidence at the time of this evaluation of evaluation reports on the effectiveness of education programmes, institutions and agencies. This may be the reason for the lack of continuous evidence-based institutional improvement reforms in theprimary education sub-sector.
(i) Systematic approaches to inspection and evaluation developed: DES has since developed a number of materials that help both national and LG inspectors in school inspection as provided by section 25(1)(a) of the LG Act. These include: Inspection framework, the Hand book for School Inspectors, the Basic Requirements and Minimum Standards booklets, Guides for school improvement booklets (Six booklets on different aspects), leadership and management, the teaching and learning process, learner achievement, learner support (equity) and inspection. These materials help inspectors to select the appropriate type of inspection and the tools for carrying out the inspection itself, to plan an inspectionactivity, generate evidence, compare with set standards, use it to make judgments’ and to write appropriate reports and disseminate them. It is essential that all inspectors carry out inspections in the same way. School inspectors are expected to follow up schools and check whether schools are following the advice from inspectors to improve education service provision in the school.
(ii) Inspector of Schools not mandated by law to report to DES: there exists gaps in the reporting lines of inspectors as enshrined in the Act. In particular, Section 25(1)(a) requires the inspector to inspect and provide a report to the Permanent Secretary, the District Education Officer and the relevant foundation body, in a format prescribed by the Director of Education Standards9. Synergies and reforms resulting from inspection would best be achieved if inspection findings and recommendations were directly reported to DES as well. This will enable having a single harmonized inspection report for a given period taking care of all LG inspection reports.
(iii)Duplication and wastage of resources on inspection. Currently, inspection services are provided by two categories of school inspectors. These include inspectors in the Directorate of Education Standards (DES) operating from the centre and the four regional offices (Mpigi, Mbale, Mbarara and Gulu) and the Local Government school inspectors based at the districts and municipalities.There is therefore need for a harmonized institutional inspection framework to address the reporting, duplication and wastage of the meagre government resources.
(iv)Poor linkage between the Centre and LGs while undertaking inspection. As the DES undertakes inspection, it is required to incorporate the municipal and district inspectors as associate assessors in all its regional or national inspection programs as the need may arise10. This therefore implies that the MoES inspection
10 Part VIII, Section 48 of Education Act, 2008 says that “to ensure effective implementation of national policies and adherence to performance standards on the part of local governments, and consistency with sections 96, 97 and 98 of the Local Governments Act, the Directorate shall incorporate the municipal and district inspectors as associate assessors in all its regional or national inspection programs as the need may arise
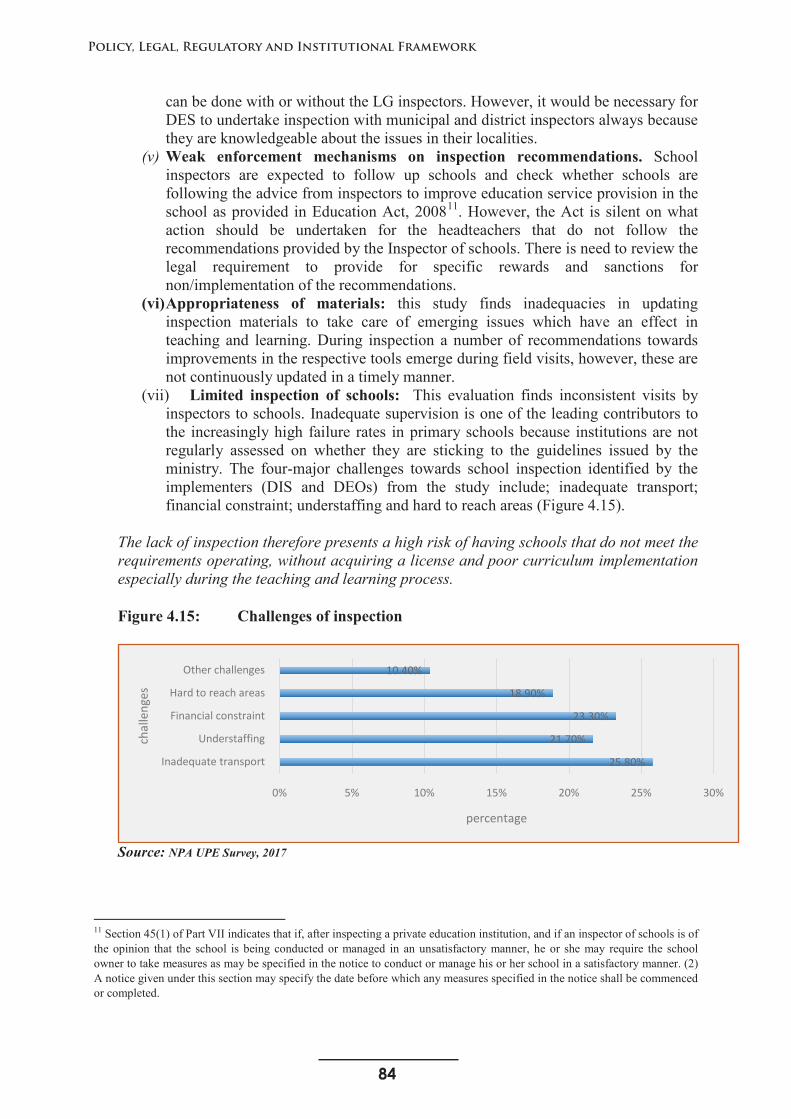
84
Policy, Legal, Regulatory and Institutional Framework
84
can be done with or without the LG inspectors. However, it would be necessary for DES to undertake inspection with municipal and district inspectors always because they are knowledgeable about the issues in their localities.
(v) Weak enforcement mechanisms on inspection recommendations. School inspectors are expected to follow up schools and check whether schools are following the advice from inspectors to improve education service provision in the school as provided in Education Act, 200811. However, the Act is silent on what action should be undertaken for the headteachers that do not follow the recommendations provided by the Inspector of schools. There is need to review the legal requirement to provide for specific rewards and sanctions for non/implementation of the recommendations.
(vi)Appropriateness of materials: this study finds inadequacies in updating inspection materials to take care of emerging issues which have an effect in teaching and learning. During inspection a number of recommendations towards improvements in the respective tools emerge during field visits, however, these are not continuously updated in a timely manner.
(vii) Limited inspection of schools: This evaluation finds inconsistent visits by inspectors to schools. Inadequate supervision is one of the leading contributors to the increasingly high failure rates in primary schools because institutions are not regularly assessed on whether they are sticking to the guidelines issued by the ministry. The four-major challenges towards school inspection identified by the implementers (DIS and DEOs) from the study include; inadequate transport; financial constraint; understaffing and hard to reach areas (Figure 4.15).
The lack of inspection therefore presents a high risk of having schools that do not meet the requirements operating, without acquiring a license and poor curriculum implementation especially during the teaching and learning process.
Figure 4.15: Challenges of inspection
Source: NPA UPE Survey, 2017
11 Section 45(1) of Part VII indicates that if, after inspecting a private education institution, and if an inspector of schools is of the opinion that the school is being conducted or managed in an unsatisfactory manner, he or she may require the school owner to take measures as may be specified in the notice to conduct or manage his or her school in a satisfactory manner. (2) A notice given under this section may specify the date before which any measures specified in the notice shall be commenced or completed.
25.80%
21.70%
23.30%
18.90%
10.40%
0% 5% 10% 15% 20% 25% 30%
Inadequate transport
Understaffing
Financial constraint
Hard to reach areas
Other challenges
percentage
chal
leng
es
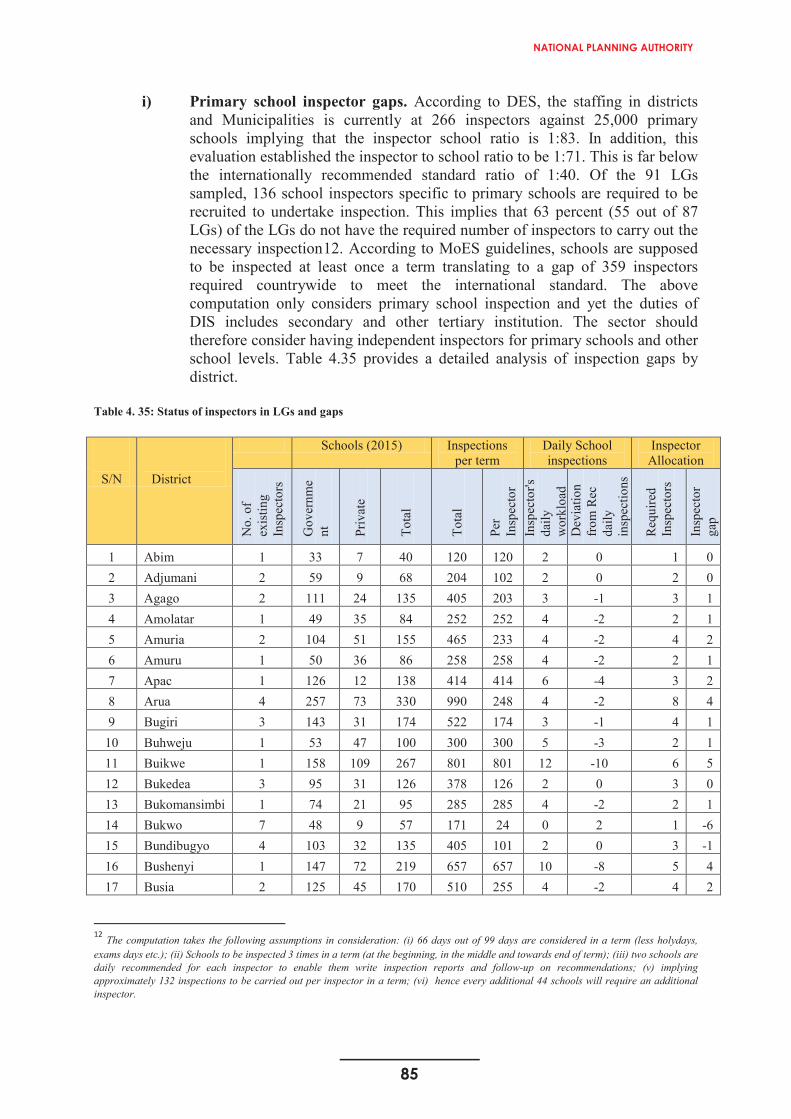
85
NATIONAL PLANNING AUTHORITY
84
can be done with or without the LG inspectors. However, it would be necessary for DES to undertake inspection with municipal and district inspectors always because they are knowledgeable about the issues in their localities.
(v) Weak enforcement mechanisms on inspection recommendations. School inspectors are expected to follow up schools and check whether schools are following the advice from inspectors to improve education service provision in the school as provided in Education Act, 200811. However, the Act is silent on what action should be undertaken for the headteachers that do not follow the recommendations provided by the Inspector of schools. There is need to review the legal requirement to provide for specific rewards and sanctions for non/implementation of the recommendations.
(vi)Appropriateness of materials: this study finds inadequacies in updating inspection materials to take care of emerging issues which have an effect in teaching and learning. During inspection a number of recommendations towards improvements in the respective tools emerge during field visits, however, these are not continuously updated in a timely manner.
(vii) Limited inspection of schools: This evaluation finds inconsistent visits by inspectors to schools. Inadequate supervision is one of the leading contributors to the increasingly high failure rates in primary schools because institutions are not regularly assessed on whether they are sticking to the guidelines issued by the ministry. The four-major challenges towards school inspection identified by the implementers (DIS and DEOs) from the study include; inadequate transport; financial constraint; understaffing and hard to reach areas (Figure 4.15).
The lack of inspection therefore presents a high risk of having schools that do not meet the requirements operating, without acquiring a license and poor curriculum implementation especially during the teaching and learning process.
Figure 4.15: Challenges of inspection
Source: NPA UPE Survey, 2017
11 Section 45(1) of Part VII indicates that if, after inspecting a private education institution, and if an inspector of schools is of the opinion that the school is being conducted or managed in an unsatisfactory manner, he or she may require the school owner to take measures as may be specified in the notice to conduct or manage his or her school in a satisfactory manner. (2) A notice given under this section may specify the date before which any measures specified in the notice shall be commenced or completed.
25.80%
21.70%
23.30%
18.90%
10.40%
0% 5% 10% 15% 20% 25% 30%
Inadequate transport
Understaffing
Financial constraint
Hard to reach areas
Other challenges
percentage
chal
leng
es
85
i) Primary school inspector gaps. According to DES, the staffing in districts and Municipalities is currently at 266 inspectors against 25,000 primary schools implying that the inspector school ratio is 1:83. In addition, this evaluation established the inspector to school ratio to be 1:71. This is far below the internationally recommended standard ratio of 1:40. Of the 91 LGs sampled, 136 school inspectors specific to primary schools are required to be recruited to undertake inspection. This implies that 63 percent (55 out of 87 LGs) of the LGs do not have the required number of inspectors to carry out the necessary inspection12. According to MoES guidelines, schools are supposed to be inspected at least once a term translating to a gap of 359 inspectors required countrywide to meet the international standard. The above computation only considers primary school inspection and yet the duties of DIS includes secondary and other tertiary institution. The sector should therefore consider having independent inspectors for primary schools and other school levels. Table 4.35 provides a detailed analysis of inspection gaps by district.
Table 4. 35: Status of inspectors in LGs and gaps
S/N District
Schools (2015) Inspections per term
Daily School inspections
Inspector Allocation
No.
of
exis
ting
Insp
ecto
rs
Gov
ernm
ent Pr
ivat
e
Tota
l
Tota
l
Per
Insp
ecto
rIn
spec
tor's
da
ily
wor
kloa
dD
evia
tion
from
Rec
da
ily
insp
ectio
ns
Req
uire
d In
spec
tors
Insp
ecto
r ga
p
1 Abim 1 33 7 40 120 120 2 0 1 02 Adjumani 2 59 9 68 204 102 2 0 2 03 Agago 2 111 24 135 405 203 3 -1 3 14 Amolatar 1 49 35 84 252 252 4 -2 2 15 Amuria 2 104 51 155 465 233 4 -2 4 26 Amuru 1 50 36 86 258 258 4 -2 2 17 Apac 1 126 12 138 414 414 6 -4 3 28 Arua 4 257 73 330 990 248 4 -2 8 49 Bugiri 3 143 31 174 522 174 3 -1 4 1
10 Buhweju 1 53 47 100 300 300 5 -3 2 111 Buikwe 1 158 109 267 801 801 12 -10 6 512 Bukedea 3 95 31 126 378 126 2 0 3 013 Bukomansimbi 1 74 21 95 285 285 4 -2 2 114 Bukwo 7 48 9 57 171 24 0 2 1 -615 Bundibugyo 4 103 32 135 405 101 2 0 3 -116 Bushenyi 1 147 72 219 657 657 10 -8 5 417 Busia 2 125 45 170 510 255 4 -2 4 2
12 The computation takes the following assumptions in consideration: (i) 66 days out of 99 days are considered in a term (less holydays, exams days etc.); (ii) Schools to be inspected 3 times in a term (at the beginning, in the middle and towards end of term); (iii) two schools are daily recommended for each inspector to enable them write inspection reports and follow-up on recommendations; (v) implying approximately 132 inspections to be carried out per inspector in a term; (vi) hence every additional 44 schools will require an additional inspector.
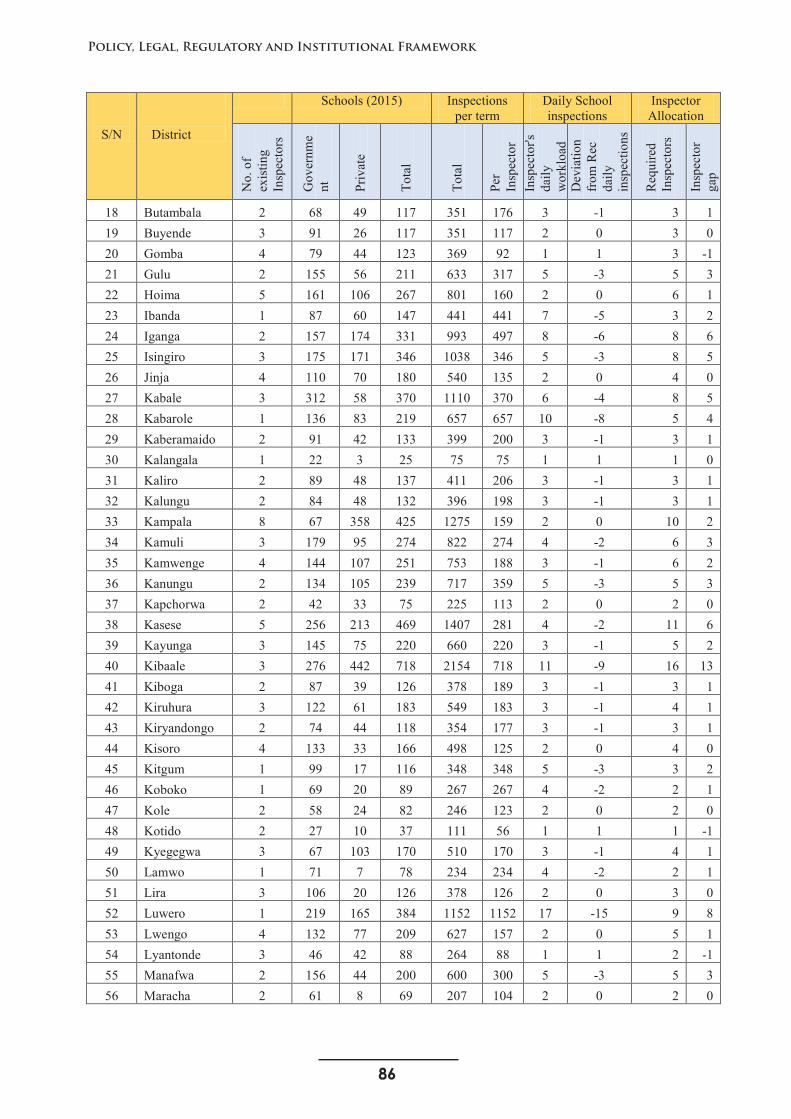
86
Policy, Legal, Regulatory and Institutional Framework
86
S/N District
Schools (2015) Inspections per term
Daily School inspections
Inspector Allocation
No.
of
exis
ting
Insp
ecto
rs
Gov
ernm
ent Pr
ivat
e
Tota
l
Tota
l
Per
Insp
ecto
rIn
spec
tor's
da
ily
wor
kloa
dD
evia
tion
from
Rec
da
ily
insp
ectio
ns
Req
uire
d In
spec
tors
Insp
ecto
r ga
p
18 Butambala 2 68 49 117 351 176 3 -1 3 119 Buyende 3 91 26 117 351 117 2 0 3 020 Gomba 4 79 44 123 369 92 1 1 3 -121 Gulu 2 155 56 211 633 317 5 -3 5 322 Hoima 5 161 106 267 801 160 2 0 6 123 Ibanda 1 87 60 147 441 441 7 -5 3 224 Iganga 2 157 174 331 993 497 8 -6 8 625 Isingiro 3 175 171 346 1038 346 5 -3 8 526 Jinja 4 110 70 180 540 135 2 0 4 027 Kabale 3 312 58 370 1110 370 6 -4 8 528 Kabarole 1 136 83 219 657 657 10 -8 5 429 Kaberamaido 2 91 42 133 399 200 3 -1 3 130 Kalangala 1 22 3 25 75 75 1 1 1 031 Kaliro 2 89 48 137 411 206 3 -1 3 132 Kalungu 2 84 48 132 396 198 3 -1 3 133 Kampala 8 67 358 425 1275 159 2 0 10 234 Kamuli 3 179 95 274 822 274 4 -2 6 335 Kamwenge 4 144 107 251 753 188 3 -1 6 236 Kanungu 2 134 105 239 717 359 5 -3 5 337 Kapchorwa 2 42 33 75 225 113 2 0 2 038 Kasese 5 256 213 469 1407 281 4 -2 11 639 Kayunga 3 145 75 220 660 220 3 -1 5 240 Kibaale 3 276 442 718 2154 718 11 -9 16 1341 Kiboga 2 87 39 126 378 189 3 -1 3 142 Kiruhura 3 122 61 183 549 183 3 -1 4 143 Kiryandongo 2 74 44 118 354 177 3 -1 3 144 Kisoro 4 133 33 166 498 125 2 0 4 045 Kitgum 1 99 17 116 348 348 5 -3 3 246 Koboko 1 69 20 89 267 267 4 -2 2 147 Kole 2 58 24 82 246 123 2 0 2 048 Kotido 2 27 10 37 111 56 1 1 1 -149 Kyegegwa 3 67 103 170 510 170 3 -1 4 150 Lamwo 1 71 7 78 234 234 4 -2 2 151 Lira 3 106 20 126 378 126 2 0 3 052 Luwero 1 219 165 384 1152 1152 17 -15 9 853 Lwengo 4 132 77 209 627 157 2 0 5 154 Lyantonde 3 46 42 88 264 88 1 1 2 -155 Manafwa 2 156 44 200 600 300 5 -3 5 356 Maracha 2 61 8 69 207 104 2 0 2 0
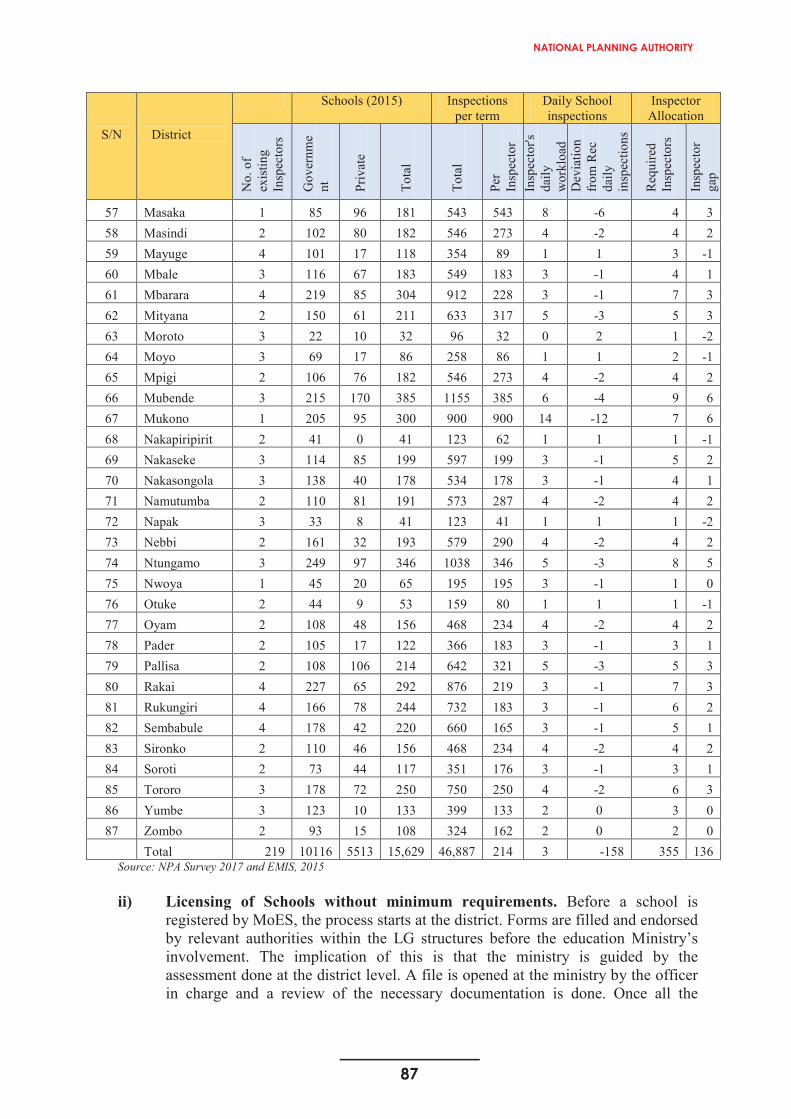
87
NATIONAL PLANNING AUTHORITY
86
S/N District
Schools (2015) Inspections per term
Daily School inspections
Inspector Allocation
No.
of
exis
ting
Insp
ecto
rs
Gov
ernm
ent Pr
ivat
e
Tota
l
Tota
l
Per
Insp
ecto
rIn
spec
tor's
da
ily
wor
kloa
dD
evia
tion
from
Rec
da
ily
insp
ectio
ns
Req
uire
d In
spec
tors
Insp
ecto
r ga
p
18 Butambala 2 68 49 117 351 176 3 -1 3 119 Buyende 3 91 26 117 351 117 2 0 3 020 Gomba 4 79 44 123 369 92 1 1 3 -121 Gulu 2 155 56 211 633 317 5 -3 5 322 Hoima 5 161 106 267 801 160 2 0 6 123 Ibanda 1 87 60 147 441 441 7 -5 3 224 Iganga 2 157 174 331 993 497 8 -6 8 625 Isingiro 3 175 171 346 1038 346 5 -3 8 526 Jinja 4 110 70 180 540 135 2 0 4 027 Kabale 3 312 58 370 1110 370 6 -4 8 528 Kabarole 1 136 83 219 657 657 10 -8 5 429 Kaberamaido 2 91 42 133 399 200 3 -1 3 130 Kalangala 1 22 3 25 75 75 1 1 1 031 Kaliro 2 89 48 137 411 206 3 -1 3 132 Kalungu 2 84 48 132 396 198 3 -1 3 133 Kampala 8 67 358 425 1275 159 2 0 10 234 Kamuli 3 179 95 274 822 274 4 -2 6 335 Kamwenge 4 144 107 251 753 188 3 -1 6 236 Kanungu 2 134 105 239 717 359 5 -3 5 337 Kapchorwa 2 42 33 75 225 113 2 0 2 038 Kasese 5 256 213 469 1407 281 4 -2 11 639 Kayunga 3 145 75 220 660 220 3 -1 5 240 Kibaale 3 276 442 718 2154 718 11 -9 16 1341 Kiboga 2 87 39 126 378 189 3 -1 3 142 Kiruhura 3 122 61 183 549 183 3 -1 4 143 Kiryandongo 2 74 44 118 354 177 3 -1 3 144 Kisoro 4 133 33 166 498 125 2 0 4 045 Kitgum 1 99 17 116 348 348 5 -3 3 246 Koboko 1 69 20 89 267 267 4 -2 2 147 Kole 2 58 24 82 246 123 2 0 2 048 Kotido 2 27 10 37 111 56 1 1 1 -149 Kyegegwa 3 67 103 170 510 170 3 -1 4 150 Lamwo 1 71 7 78 234 234 4 -2 2 151 Lira 3 106 20 126 378 126 2 0 3 052 Luwero 1 219 165 384 1152 1152 17 -15 9 853 Lwengo 4 132 77 209 627 157 2 0 5 154 Lyantonde 3 46 42 88 264 88 1 1 2 -155 Manafwa 2 156 44 200 600 300 5 -3 5 356 Maracha 2 61 8 69 207 104 2 0 2 0
87
S/N District
Schools (2015) Inspections per term
Daily School inspections
Inspector Allocation
No.
of
exis
ting
Insp
ecto
rs
Gov
ernm
ent Pr
ivat
e
Tota
l
Tota
l
Per
Insp
ecto
rIn
spec
tor's
da
ily
wor
kloa
dD
evia
tion
from
Rec
da
ily
insp
ectio
ns
Req
uire
d In
spec
tors
Insp
ecto
r ga
p
57 Masaka 1 85 96 181 543 543 8 -6 4 358 Masindi 2 102 80 182 546 273 4 -2 4 259 Mayuge 4 101 17 118 354 89 1 1 3 -160 Mbale 3 116 67 183 549 183 3 -1 4 161 Mbarara 4 219 85 304 912 228 3 -1 7 362 Mityana 2 150 61 211 633 317 5 -3 5 363 Moroto 3 22 10 32 96 32 0 2 1 -264 Moyo 3 69 17 86 258 86 1 1 2 -165 Mpigi 2 106 76 182 546 273 4 -2 4 266 Mubende 3 215 170 385 1155 385 6 -4 9 667 Mukono 1 205 95 300 900 900 14 -12 7 668 Nakapiripirit 2 41 0 41 123 62 1 1 1 -169 Nakaseke 3 114 85 199 597 199 3 -1 5 270 Nakasongola 3 138 40 178 534 178 3 -1 4 171 Namutumba 2 110 81 191 573 287 4 -2 4 272 Napak 3 33 8 41 123 41 1 1 1 -273 Nebbi 2 161 32 193 579 290 4 -2 4 274 Ntungamo 3 249 97 346 1038 346 5 -3 8 575 Nwoya 1 45 20 65 195 195 3 -1 1 076 Otuke 2 44 9 53 159 80 1 1 1 -177 Oyam 2 108 48 156 468 234 4 -2 4 278 Pader 2 105 17 122 366 183 3 -1 3 179 Pallisa 2 108 106 214 642 321 5 -3 5 380 Rakai 4 227 65 292 876 219 3 -1 7 381 Rukungiri 4 166 78 244 732 183 3 -1 6 282 Sembabule 4 178 42 220 660 165 3 -1 5 183 Sironko 2 110 46 156 468 234 4 -2 4 284 Soroti 2 73 44 117 351 176 3 -1 3 185 Tororo 3 178 72 250 750 250 4 -2 6 386 Yumbe 3 123 10 133 399 133 2 0 3 087 Zombo 2 93 15 108 324 162 2 0 2 0
Total 219 10116 5513 15,629 46,887 214 3 -158 355 136Source: NPA Survey 2017 and EMIS, 2015
ii) Licensing of Schools without minimum requirements. Before a school is registered by MoES, the process starts at the district. Forms are filled and endorsed by relevant authorities within the LG structures before the education Ministry’s involvement. The implication of this is that the ministry is guided by the assessment done at the district level. A file is opened at the ministry by the officer in charge and a review of the necessary documentation is done. Once all the
88
Policy, Legal, Regulatory and Institutional Framework
88
minimum requirements are provided, the school is given a provisional license. Although the education Act, 2008 allows new schools to open as the registrationand process of acquiring an operation license is ongoing, some schools ignore to formalize their operation with the education Ministry. Specifically, section 32(1) of the Education Act, 2008 indicates that Permission to operate a new school shall be given in the first instance, in the form of a license to operate a provisionally classified school for two school years. Any school without an operation license does not meet standards and should not be allowed to open. The schools have therefore been able to maneuver through the system due to the lack of inspection which has been hindered majorly by four challenges that include: Inadequate transport to reach the schools, financial constraint, under staffing and hard to reach areas. This therefore tantamount to poor curriculum implementation since schools that do not meet the requirements are in operation.
iii) Qualification of Inspectors of schools: The Inspector of schools is required tohold an Honors Bachelor’s Degree in Education from a recognized University or Institution as a minimum requirement. This has proved to be insufficient for the current inspector of schools for the delivery of primary school inspection function.This is because: (i) the University degree holders do not have adequate training as provided by the Teacher training institutions; (ii) they have minimal knowledge onprimary education. Going forward: (i) recruitment of Inspectors of schools should consider teachers that trained through the primary teacher training institutions; (ii) the MoES should introduce professional courses in inspectors which shall be a requirement for all inspectors; (iii) recruit independent inspectors for primary and other education institutions.
Other recommendations to improve inspection
(i) Strengthening the current inspection system: - Strengthen the current inspection system and approaches by increasing the frequency of inspection of schools and institutions. The focus will be on the quality of leadership and management, teaching and learning process and learner achievement.
(ii) Recruitment and allocation of inspection resources should be based on the number of schools in the district such that the workload is uniform. Therefore, there is need to review the structure of the DEO’s office, in line with the number of schools in the LG. This is intended progressively standardize the inspection function to the required inspector school ratio. In the short term, re –allocation of inspectors should be undertaken from districts with excess number of inspectors to those with inadequate number of inspectors.
(iii)Independence of inspection requires attention. Whereas the inspection function was decentralized, this has not yielded the intended results as many of the inspectors have not performed to the expected levels. For instance: inspectorsrecommend schools without minimum requirements for licensing; others have not taken the inspection function seriously; while others fail to follow up on the inspection recommendations. On the other hand, some inspectors have only focused on one type of inspection. These two types of inspection should also be taken care of when independent. These are educational quality inspections (which include a focused compliance inspection) and regulatory compliance inspections. Educational quality inspections report on the two main outcomes for pupils: achievement and personal development. Reporting is with reference to contributory factors such as the curriculum and teaching while Regulatory
89
NATIONAL PLANNING AUTHORITY
88
minimum requirements are provided, the school is given a provisional license. Although the education Act, 2008 allows new schools to open as the registrationand process of acquiring an operation license is ongoing, some schools ignore to formalize their operation with the education Ministry. Specifically, section 32(1) of the Education Act, 2008 indicates that Permission to operate a new school shall be given in the first instance, in the form of a license to operate a provisionally classified school for two school years. Any school without an operation license does not meet standards and should not be allowed to open. The schools have therefore been able to maneuver through the system due to the lack of inspection which has been hindered majorly by four challenges that include: Inadequate transport to reach the schools, financial constraint, under staffing and hard to reach areas. This therefore tantamount to poor curriculum implementation since schools that do not meet the requirements are in operation.
iii) Qualification of Inspectors of schools: The Inspector of schools is required tohold an Honors Bachelor’s Degree in Education from a recognized University or Institution as a minimum requirement. This has proved to be insufficient for the current inspector of schools for the delivery of primary school inspection function.This is because: (i) the University degree holders do not have adequate training as provided by the Teacher training institutions; (ii) they have minimal knowledge onprimary education. Going forward: (i) recruitment of Inspectors of schools should consider teachers that trained through the primary teacher training institutions; (ii) the MoES should introduce professional courses in inspectors which shall be a requirement for all inspectors; (iii) recruit independent inspectors for primary and other education institutions.
Other recommendations to improve inspection
(i) Strengthening the current inspection system: - Strengthen the current inspection system and approaches by increasing the frequency of inspection of schools and institutions. The focus will be on the quality of leadership and management, teaching and learning process and learner achievement.
(ii) Recruitment and allocation of inspection resources should be based on the number of schools in the district such that the workload is uniform. Therefore, there is need to review the structure of the DEO’s office, in line with the number of schools in the LG. This is intended progressively standardize the inspection function to the required inspector school ratio. In the short term, re –allocation of inspectors should be undertaken from districts with excess number of inspectors to those with inadequate number of inspectors.
(iii)Independence of inspection requires attention. Whereas the inspection function was decentralized, this has not yielded the intended results as many of the inspectors have not performed to the expected levels. For instance: inspectorsrecommend schools without minimum requirements for licensing; others have not taken the inspection function seriously; while others fail to follow up on the inspection recommendations. On the other hand, some inspectors have only focused on one type of inspection. These two types of inspection should also be taken care of when independent. These are educational quality inspections (which include a focused compliance inspection) and regulatory compliance inspections. Educational quality inspections report on the two main outcomes for pupils: achievement and personal development. Reporting is with reference to contributory factors such as the curriculum and teaching while Regulatory
89
compliance inspections report on a school’s compliance with the IndependentSchool Standards Regulations or the National Minimum Standards.
(iv)Education Service Commission to recruit District and Municipal Inspectors of Schools. Findings indicate that there is inadequate number of LG inspectors of schools in some LGs and excess in others. For instance, the following LGs have excess number of inspectors: LGs: Bukwo (6); Bundibugyo (1); Gomba (1); Kotido (1); Lyantonde (1); Mayuge (1); Moroto (2); Moyo (1); Nakapirirpirit (1); Napak (2); and Otuke (1). This would call for a reallocation / transfer, however, this is not possible because LG inspectors are recruited by the District Service Commission. To this end, all Inspectors in Uganda need to be appointed by the Education Service Commission and posted to any part of the country. This is only possible if the inspection services are re-centralised and made autonomous like in Kenya where inspection is managed by the Education Standards and Quality Assurance Council. The job of the Inspectors should be on a contract of five years renewable subject to fulfillment of acceptable working norms and standards. The idea of having Inspectors working as permanent and pensionable has made some of them lazy, incompetent and district have no leeway of getting rid of them and replaced them with competent persons who have the zeal and commitment to work. Hard to reach districts should be given special attention while allocating inspectors.
4.4.1.2 Uganda National Examinations Board (UNEB)
(i) Assessment of the Primary curriculum at the end of the cycle is mandated and undertaken by Uganda National Examinations Board (UNEB), a body formed in 1983, by an act of the parliament-The Uganda National Examinations Board Act, 1983. The chief functions of the board include: (i) to conduct primary, secondary, technical and such other examinations within Uganda as it may consider desirable in the public interest; (ii) to publish past examination papers; (iii) to award certificates or diplomas to successful candidates in such examinations; (iv) to invite anybody or bodies outside Uganda, as it may think fit, to conduct jointly academic, technical and other examinations; (v) to award acceptable certificates or diplomas to successful candidates jointly with the invited bodies; (vi) to invite other bodies, as it may think fit, to conduct examinations and award acceptable certificates or diplomas; (vii) to advise anybody or bodies so invited under paragraphs (iv) and (vi) upon the adoption of examinations necessary for the requirements of Uganda and to assist any such body or bodies to conduct such examinations; (viii) to make arrangements for the conduct of research and development of examination systems; (ix) to make rules regulating the conduct of examinations and for all purposes incidental thereto.
(ii) Indeed, the activities of UNEB have included; Assessing learning achievements, registration of candidates, development of tests, printing, distribution, field conduct, marking, processing of results and certificates/diplomas. Assessment, in relation to learning, takes two main forms; assessment of learning (summative assessment) and assessment for learning (formative assessment). The latter is meant to provide timely feedback to reinforce the learning process and it is supposed to be conducted by the teacher during the learning/teaching process. It is a more productive and learner friendly form of assessment as it is done as the instructional process progresses. Anxiety is reduced and practical skills can be assessed. On the other hand, summative assessment
90
Policy, Legal, Regulatory and Institutional Framework
90
involves evaluating learning at the end of an instructional unit by comparing it against some standard or benchmark. Examples include: mid-term, end-term, PLE, UCE, UACE, etc.
(iii)In Uganda, there are private bodies that set and print examinations for commercial purposes that include; beginning of term examinations, mid-term examinations, end of term examinations, regional and holiday packages. Schools buy and administer these assessment instruments to the pupils. There are also headteachers’ associations that mainly set end of term examinations to learners. The implication is that pupils are not assessed based on the coverage. One of the outstanding features of studies of assessment in recent years has been the shift in the focus of attention, towards greater interest in the interactions between assessment and classroom learning away from concentration on the properties of restricted forms of tests which are only weakly linked to the learning experiences of students. It’s therefore evident that education outcomes lack a wholesome assessment of the curriculum that includes among examinations, assessment on physical education, MDD and generally talent development. This therefore implies that the assessment used do not effectively improve learning. Government therefore needs to review the assessment in place to include assessment of co-curricular activities and assessment at lower grades other than National Assessment for Progress in Education (NAPE) whose assessment covers Numeracy, Literacy and oral reading (English and local languages) at primary level of primary 4 and 6. The NAPE should be made comprehensive to cover the national curriculum.
(iv)Extent to which examination information is confidential: Commercialization of Education has forced many School heads into cheating to attract more enrolmentneglecting thorough/comprehensive teaching. UNEB has since been battling with a series of malpractice in cheating exams leading to cancellation of results and centre numbers of these schools. However, the head teachers and teachers involved are never apprehended. Government should therefore enact an Examination Misconduct and Confidentiality policy with strict penalties and rewards ranging from suspension, expulsion and resignation of any of the stakeholders including: students, teachers, employees at UNEB after thorough investigation.
(v) There’s no policy on assessment.
4.4.1.3 National Curriculum Development Centre (NCDC)
The curriculum in Uganda is designed and developed by the National Curriculum Development Centre (NCDC), which is a corporate autonomous body of the Ministry of Education and Sports. It was established by the NCDC Act SECTION 135, Laws of Uganda Revised Edition 2000 whose history is Decree No.7 of 1973.
It is responsible for inter-alia; development of curricula and related materials for various levels of education (Pre-Primary, Primary, Secondary and other Tertiary), organizing capacity building courses for stakeholders on curricula and matters related thereto. The functions of the centre are provided under section 3 of the act; (i) to investigate and evaluate the need for syllabus revision and curriculum reform at primary, secondary, tertiary levels of education, in pre-school and post-school education and in teacher education. (ii) to initiate new syllabi, revise existing ones, carry out curriculum reform, research testing and evaluation to bring up-to-date and improve syllabi for school and college courses; (iii) to provide consultancy services to institutions on matters relating
91
NATIONAL PLANNING AUTHORITY
90
involves evaluating learning at the end of an instructional unit by comparing it against some standard or benchmark. Examples include: mid-term, end-term, PLE, UCE, UACE, etc.
(iii)In Uganda, there are private bodies that set and print examinations for commercial purposes that include; beginning of term examinations, mid-term examinations, end of term examinations, regional and holiday packages. Schools buy and administer these assessment instruments to the pupils. There are also headteachers’ associations that mainly set end of term examinations to learners. The implication is that pupils are not assessed based on the coverage. One of the outstanding features of studies of assessment in recent years has been the shift in the focus of attention, towards greater interest in the interactions between assessment and classroom learning away from concentration on the properties of restricted forms of tests which are only weakly linked to the learning experiences of students. It’s therefore evident that education outcomes lack a wholesome assessment of the curriculum that includes among examinations, assessment on physical education, MDD and generally talent development. This therefore implies that the assessment used do not effectively improve learning. Government therefore needs to review the assessment in place to include assessment of co-curricular activities and assessment at lower grades other than National Assessment for Progress in Education (NAPE) whose assessment covers Numeracy, Literacy and oral reading (English and local languages) at primary level of primary 4 and 6. The NAPE should be made comprehensive to cover the national curriculum.
(iv)Extent to which examination information is confidential: Commercialization of Education has forced many School heads into cheating to attract more enrolmentneglecting thorough/comprehensive teaching. UNEB has since been battling with a series of malpractice in cheating exams leading to cancellation of results and centre numbers of these schools. However, the head teachers and teachers involved are never apprehended. Government should therefore enact an Examination Misconduct and Confidentiality policy with strict penalties and rewards ranging from suspension, expulsion and resignation of any of the stakeholders including: students, teachers, employees at UNEB after thorough investigation.
(v) There’s no policy on assessment.
4.4.1.3 National Curriculum Development Centre (NCDC)
The curriculum in Uganda is designed and developed by the National Curriculum Development Centre (NCDC), which is a corporate autonomous body of the Ministry of Education and Sports. It was established by the NCDC Act SECTION 135, Laws of Uganda Revised Edition 2000 whose history is Decree No.7 of 1973.
It is responsible for inter-alia; development of curricula and related materials for various levels of education (Pre-Primary, Primary, Secondary and other Tertiary), organizing capacity building courses for stakeholders on curricula and matters related thereto. The functions of the centre are provided under section 3 of the act; (i) to investigate and evaluate the need for syllabus revision and curriculum reform at primary, secondary, tertiary levels of education, in pre-school and post-school education and in teacher education. (ii) to initiate new syllabi, revise existing ones, carry out curriculum reform, research testing and evaluation to bring up-to-date and improve syllabi for school and college courses; (iii) to provide consultancy services to institutions on matters relating
91
to curriculum; (iv) to draft teaching schemes, textbooks, teacher’s manuals, syllabi and design specimen examination papers based on specification tables and marking guides. (v) to design and develop teaching aids and instructional materials to promote effective teaching and learning. (vi) to devise, test and evaluate examination questions and methods of examining students with other appropriate teaching and examining bodies. (vii) to organise and conduct in-service courses in collaboration with relevant institutions for persons intending or required to teach new courses developed at the Centre for acquisition of relevant competencies. (ivii) to organise and conduct courses in curriculum development for persons required to participate in curriculum development work. (ix) to hold seminars and conferences on curriculum development projects and problems. (x) to collect, compile, analyse and abstract statistical information on curriculum and matters related thereto; (xi) to publish and market syllabi, teacher’s manuals, textbooks, bulletins, digests, periodicals or other written materials concerning curriculum and other matters related thereto; and (xii) to disseminate and promote general and other better knowledge and understanding of new curricula, teaching methods and teaching aids.
The NCDC Act is inadequate as a legal tool in regulating curricula for international schools. The Act is silent about the role of the Centre in relation to curricula used by international schools on learners in Uganda. Nevertheless, the NCDC seeks to undertake an evaluation of the International curriculum for benchmarking with the National Curriculum (NCDC Strategic Plan, 2016-2019).
(i) Inadequate textbook storage facilities. The study established absence of library facilities in most schools. In most schools, textbooks are stored in the headteachers’ offices. As a result, overcrowding and poor handling reduces the expected life span of these books. Going forward, government should prioritize establishing of textbook storage facilities in primary schools.
(ii) Limited quality assurance of supplied teaching materials. There is limited attention paid to quality assurance of books during production, packaging and distribution. This leads to loose and empty pages and poor quality materials at production level. In addition, books are worn out during transportation which reduces their life span.
(iii)Inadequate community involvement in curriculum implementation. The UPE policy provides different responsibilities on the parents in different circumstances but most parents don’t understand that they have a role in ensuring teaching and learning of their children. Many parents especially in rural areas are unable to support their children to improve learning.
4.1.1.4 Local Government Level / District Education Department (DED)
This department is responsible for delivery of education services in their respective districts. In this respect, a DED performs the following functions: (i) controls education standards through support supervision/ monitoring and evaluation of pre-primary, primary, secondary, primary teacher colleges, and tertiary institutions; (ii) ensures compliance to government education policy and the teaching curriculum; (iii) ensures rational deployment and management of administrative staff, teachers, and head teachers; (iv) ensures prudent financial management, including disbursement of grants to schools, and follow up on accountability; (v) participates in mobilization/sensitization of parents with regard to their roles and responsibilities; and (vi) ensures sound school governance
92
Policy, Legal, Regulatory and Institutional Framework
92
systems through School Management Committees (SMCs) and parent–teacher associations (PTAs).
i) Inadequate staffing of the DED. The number of inspectors is low compared to the increasing number of schools. this has in-turn increased the inspection and administrative workload. Going forward, there is need to review the DED structure to increase the number of staff in the DED taking into consideration of the number of schools in the LGs.
ii) Inadequate transportation facilitation. The DED budget is inadequate to comprehensively finance the inspection function. Some LGs don’t have vehicles and in others they are dilapidated.
iii) Political interference/influence on the recruitment process. Given that DSCs are politically appointed by District Councils following nominations and approvals by both the District Executives and the Public Service Commission, this sometimes undermines their transparency in executing their roles. For instance, incompetent staff are sometimes recruited, deployed and promoted.
iv) Bureaucracy in transfer, deployment, promotion and terminating teachers. The government system of permanent and pensionable guarantees teachers a life time job which breeds inefficiencies. DEDs cannot make thesedecisions on their own without consulting the CAOs or the Principal Personnel Officers (PPOs) and SMCs for approval.
4.1.1.5. District service commission
The District Service Commission (DSC) is fully responsible for advertisement and recruitment of staff for the DED, including teachers and head teachers for primary schools.
Responsibilities of stakeholders in education and training
The Education Act, 2008 provides the roles and responsibilities of stakeholders in education and training. Specifically, section 5(1) indicates that government through its relevant agencies shall be responsible for the roles indicated in table 4.33 below. This evaluation finds gaps on existing roles of education institutions to fulfil education and training as provided in the Act. The Ministry of Education and Sports has most of the roles as provided in the Act and to this effect, some areas remain unprioritized thus breeding inefficiencies in service delivery. The Ministry carries out both policy related and implementation functions. In addition, although MoES is responsible for both government and private aided schools, less emphasis is given to private schools especially supervision.
Table 4. 36: Responsibilities of government Agencies in education and training
S/N Responsibility as given in the education Act ImplementingAgency
Comment
a Provision of learning and instructional materials, structural development and teachers’ welfare
MoES
b Setting policy for all matters concerning education and training MoESc Setting and maintaining the national goals and broad aims of
educationMoES
d Providing and controlling the national curriculum NCDC

93
NATIONAL PLANNING AUTHORITY
92
systems through School Management Committees (SMCs) and parent–teacher associations (PTAs).
i) Inadequate staffing of the DED. The number of inspectors is low compared to the increasing number of schools. this has in-turn increased the inspection and administrative workload. Going forward, there is need to review the DED structure to increase the number of staff in the DED taking into consideration of the number of schools in the LGs.
ii) Inadequate transportation facilitation. The DED budget is inadequate to comprehensively finance the inspection function. Some LGs don’t have vehicles and in others they are dilapidated.
iii) Political interference/influence on the recruitment process. Given that DSCs are politically appointed by District Councils following nominations and approvals by both the District Executives and the Public Service Commission, this sometimes undermines their transparency in executing their roles. For instance, incompetent staff are sometimes recruited, deployed and promoted.
iv) Bureaucracy in transfer, deployment, promotion and terminating teachers. The government system of permanent and pensionable guarantees teachers a life time job which breeds inefficiencies. DEDs cannot make thesedecisions on their own without consulting the CAOs or the Principal Personnel Officers (PPOs) and SMCs for approval.
4.1.1.5. District service commission
The District Service Commission (DSC) is fully responsible for advertisement and recruitment of staff for the DED, including teachers and head teachers for primary schools.
Responsibilities of stakeholders in education and training
The Education Act, 2008 provides the roles and responsibilities of stakeholders in education and training. Specifically, section 5(1) indicates that government through its relevant agencies shall be responsible for the roles indicated in table 4.33 below. This evaluation finds gaps on existing roles of education institutions to fulfil education and training as provided in the Act. The Ministry of Education and Sports has most of the roles as provided in the Act and to this effect, some areas remain unprioritized thus breeding inefficiencies in service delivery. The Ministry carries out both policy related and implementation functions. In addition, although MoES is responsible for both government and private aided schools, less emphasis is given to private schools especially supervision.
Table 4. 36: Responsibilities of government Agencies in education and training
S/N Responsibility as given in the education Act ImplementingAgency
Comment
a Provision of learning and instructional materials, structural development and teachers’ welfare
MoES
b Setting policy for all matters concerning education and training MoESc Setting and maintaining the national goals and broad aims of
educationMoES
d Providing and controlling the national curriculum NCDC
93
e Evaluating academic standards through continuous assessment and national examinations
UNEB
f Registering and licensing of teachers MoES, LG Based on recommendation of DIS recommendations
g Recruiting, deployment and promotion of both teaching and non-teaching staff
ESC, DSC, MoPS
h Determining the language and medium of instruction MoES, NCDC, language Board
Language only determined under curriculum by NCDC
i Encouraging the development for a national language MoES Not entrenched in the education system
j Ensuring equitable distribution of education institutions MoES No education institution with specific roles forensuring autonomy in distribution
k Regulating, establishing, and registering of Educational institutions
MoES
l Management, monitoring, supervising and disciplining of staff and students
LG, MoES, DSC, ESC
m Ensuring supervision of performance in both public and private schools
MoES has played a lower role in supervising private schools
n Development of management policies for all Government and private aided schools
MoES Policies developed cut across government and private schools but are more tailored to government aided schools
Source: Education Act, 2008
4.5. Education System in Uganda
(i) The Education Act, 2008 provides the structure of Education under which section 10(1) indicates that there shall be four levels of education as follows; (a) pre-primary education; (b) primary education; (c) post primary education and training; and (d) tertiary and university education (figure 4.22). The Act further notes under section 10 (3) that the following shall apply to primary education; (a) primary education shall be universal and compulsory for pupils aged 6 (six) years and above which shall last seven years; (b) all children of school going age shall enter and complete the primary education cycle of seven years; and (c) Government shall ensure that a child who drops out of school before completing primary education cycle attains basic education through alternative approaches to providing that education.
(ii) Formalize the pre-primary education level by introducing ECD centres at all schools. The Education Act, 2008 indicates that pre-primary education to be run by private agencies or persons to provide education to children aged from two years to five years and the financing of that type of education shall be a responsibility of the parents or guardians. Primary education is still considered the first level of formal education in which pupils follow a common basic curriculum. Given the big enrolment in UPE schools with under age in the lower section, government should review this provision in the Act so that ECD centres can be
94
Policy, Legal, Regulatory and Institutional Framework
94
attached to all schools including those implementing UPE (which have big enrolments of under aged children in lower classes).
(iii)Primary education, however, is still considered the first level of formal education in which pupils follow a common basic curriculum. This is followed by a secondary cycle of six years (four at lower secondary and two and higher secondary) before proceeding to university education for three to five years depending on the duration of the course offered. On successful completion of primary school, the pupils can go either for secondary education; or take a three-year crafts course in technical schools. Those completing Uganda Certificate of Education have four possible outlets: successful candidates can either proceed for an advanced certificate of education; join a two-year advanced crafts course in technical institutes; join a two-year grade III primary teaching programme; or join any of the government's departmental programmes such as agriculture, health, veterinary, and cooperatives. After the completion of the advanced certificate of education the students can either: proceed to university; join a two-year course leading to ordinary diploma in teacher education, technical education; business studies or join departmental programme. In summary, the four levels form a single-track structure of 7-4-2-3 years, with minor variations in length of particular courses after primary education (Figure 4.22).
(iv)Education system of 7-4-2-3 still relevant. The Economic Policy Review Commission (EPRC) proposed a change in structure of Education system in Uganda from the current 7-4-2-3 system to 8-3-2-3 system. To that effect, a White Paper was passed by Cabinet endorsing the system. However, wider consultations and debate were yet to be carried out before the system was adopted. In recommending the new system, the EPRC argued that the primary cycle should be extended to 8 years in order to allow the pupils to mature sufficiently to benefit from the proposed vocational training that would be intensified under both formal and non-formal systems. On lower secondary level, the EPRC felt that most of the time was wasted on revision work upper primary stage and therefore the need to reduce the course from the current 4 years to 3 years; while the upper Secondary level stays at 2 years. This evaluation finds the current education system relevant although contrary to the EPRC’s recommendation. The system only requires to be strengthened rather than a change to archive its intended results. The education in Uganda attracts pupils from outside Uganda.
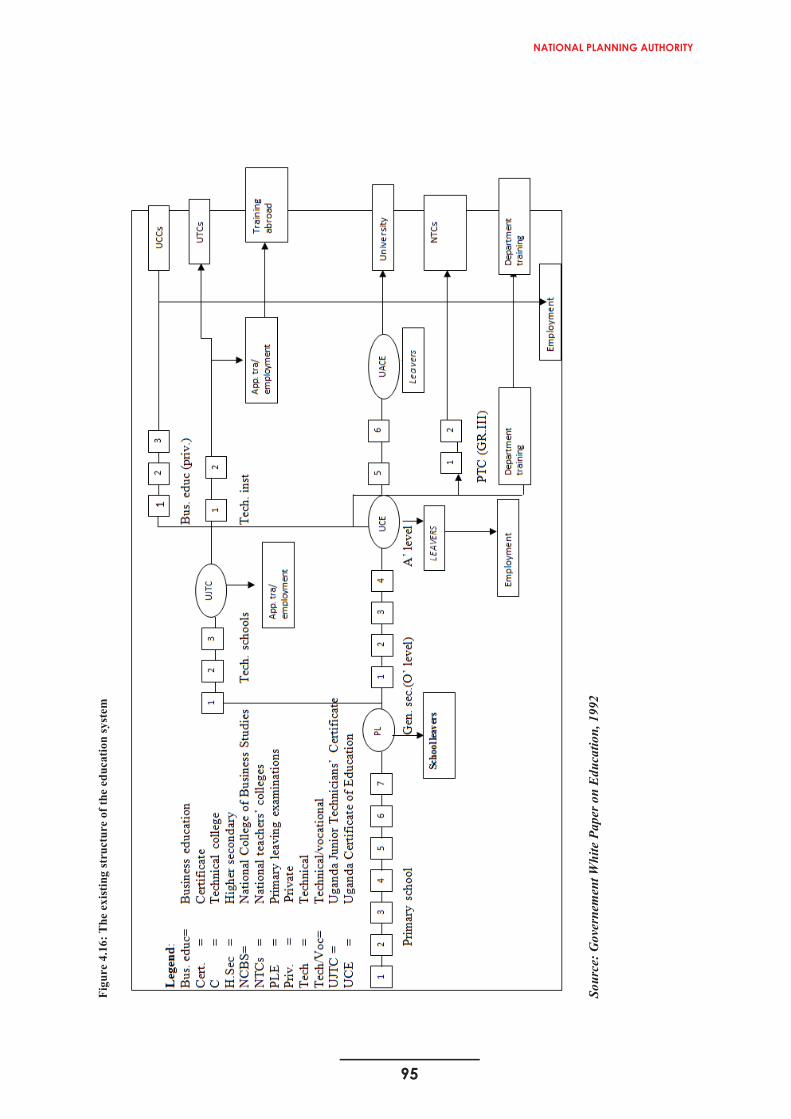
95
NATIONAL PLANNING AUTHORITY
94
attached to all schools including those implementing UPE (which have big enrolments of under aged children in lower classes).
(iii)Primary education, however, is still considered the first level of formal education in which pupils follow a common basic curriculum. This is followed by a secondary cycle of six years (four at lower secondary and two and higher secondary) before proceeding to university education for three to five years depending on the duration of the course offered. On successful completion of primary school, the pupils can go either for secondary education; or take a three-year crafts course in technical schools. Those completing Uganda Certificate of Education have four possible outlets: successful candidates can either proceed for an advanced certificate of education; join a two-year advanced crafts course in technical institutes; join a two-year grade III primary teaching programme; or join any of the government's departmental programmes such as agriculture, health, veterinary, and cooperatives. After the completion of the advanced certificate of education the students can either: proceed to university; join a two-year course leading to ordinary diploma in teacher education, technical education; business studies or join departmental programme. In summary, the four levels form a single-track structure of 7-4-2-3 years, with minor variations in length of particular courses after primary education (Figure 4.22).
(iv)Education system of 7-4-2-3 still relevant. The Economic Policy Review Commission (EPRC) proposed a change in structure of Education system in Uganda from the current 7-4-2-3 system to 8-3-2-3 system. To that effect, a White Paper was passed by Cabinet endorsing the system. However, wider consultations and debate were yet to be carried out before the system was adopted. In recommending the new system, the EPRC argued that the primary cycle should be extended to 8 years in order to allow the pupils to mature sufficiently to benefit from the proposed vocational training that would be intensified under both formal and non-formal systems. On lower secondary level, the EPRC felt that most of the time was wasted on revision work upper primary stage and therefore the need to reduce the course from the current 4 years to 3 years; while the upper Secondary level stays at 2 years. This evaluation finds the current education system relevant although contrary to the EPRC’s recommendation. The system only requires to be strengthened rather than a change to archive its intended results. The education in Uganda attracts pupils from outside Uganda.
95 Fi
gure
4.1
6: T
he e
xist
ing
stru
ctur
e of
the
educ
atio
n sy
stem
Sour
ce:G
over
nem
ent W
hite
Pap
er o
n E
duca
tion,
199
2
96
Policy, Legal, Regulatory and Institutional Framework
96
4.5.1. Sector Wide Approach (SWAP)
i. Following the successful formulation of the first comprehensive Education Sector Investment Plan (ESIP) of 1999-2003, Uganda adopted the SWAp as a way of enhancing the financing and management of its education system as well as strengthening partnerships between and among all stakeholders. This was not only historic but was also a bold move given the fact that Uganda had neither previous experience nor practical knowledge of managing a SWAp process. The Ugandan education sector therefore became a torch- bearer for SWAp in unchartered waters. It is now described as a process that deals with the planning, financing and implementation of all activities, both at the central and the district levels, rather than a blueprint for solving education sector maladies. It has also meant a constant review of partnership arrangements based on trust and professionalism (UNESCO, 2004).
ii. Education planning in Uganda is guided by the Sector Wide Approach (SWAp).This arrangement entails the MoES working together with key stakeholders including donors to agree on key priorities, and allocation of resources in a manner that enhances efficiency and effectiveness. Within the SWAp, the Government leads the implementation of education activities while the donors contribute funds to support jointly agreed sector priorities.
iii. Education SWAp is limited to the sector rather than enhancing inter and intra sectoral linkages. The SWAp considers only the MOES and key stakeholders that include, donors within education sector to work in a fully participatory manner. However, the group lacks inter sectoral linkages as it only focusses on stakeholders in education. Education for instance entails training the medical workers and therefore the working group could consider having membership of the institutions who are linked to education. There should also be changed to Technical Working Groups (TWGs) rather than SWGs. Botswana uses TWG in identification of priorities, planning, budgeting and Monitoring.
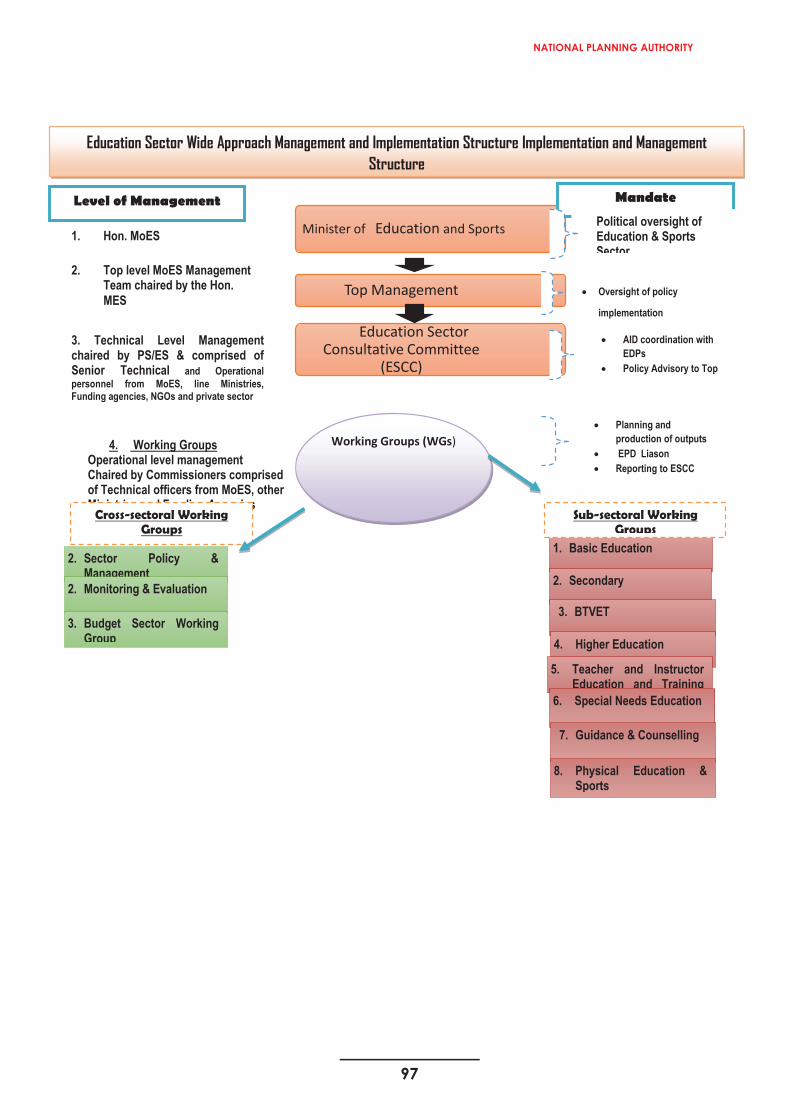
97
NATIONAL PLANNING AUTHORITY
97
Minister of Education and Sports
Top Management
Education Sector Consultative Committee
(ESCC)
• Oversight of policy
implementation
2. Top level MoES Management Team chaired by the Hon. MES
1. Hon. MoES
1. Basic Education
Level of Management Mandate
Political oversight of Education & Sports Sector
3. Technical Level Management chaired by PS/ES & comprised of Senior Technical and Operational personnel from MoES, line Ministries, Funding agencies, NGOs and private sector
Working Groups (WGs)
• AID coordination with EDPs
• Policy Advisory to Top
Sub-sectoral Working Groups
4. Working GroupsOperational level management Chaired by Commissioners comprised of Technical officers from MoES, other Ministries and Funding Agencies
2. Secondary
3. BTVET
4. Higher Education
5. Teacher and Instructor Education and Training
6. Special Needs Education
7. Guidance & Counselling
8. Physical Education & Sports
2. Sector Policy & Management
2. Monitoring & Evaluation
3. Budget Sector Working Group
Cross-sectoral Working Groups
• Planning and production of outputs
• EPD Liason• Reporting to ESCC
Education Sector Wide Approach Management and Implementation Structure Implementation and Management Structure

98
Policy, Legal, Regulatory and Institutional Framework
98
SECTION FIVE:
5.0 LESSONS LEARNT/ BEST PRACTICES & EMERGING ISSUES
5.1 Emerging Issues
i) There is a glaring gap regarding knowledge of existing policies that govern Education by the implementers. Most respondents when asked about the policies responded “I don’t know” hence could not thereafter provide gaps in policies
ii) Several advocates of Universal Primary Education (UPE) do not seem to believe in it themselves. The researchers discovered that all the advocates of UPE, none had a child in a UPE school when they have primary going school children. It was even discovered that some teachers who are teaching in the UPE schools and the heads of LGs (CAO, Town Clerks, DEOs, DISs) take their own children in the neighboring private schools where the quality of education is better.
iii) As a condition for acquiring a license, the applicant must prove ownership of the land and must also attach details of the resources available for the school.However, a number of schools have no land for expansion and for undertaking co-curricular activities. There are in addition land conflicts for the existing government schools which are affecting education. This is one of the unintended outcomes and is an important area that needs further research in Northern and Central Uganda. Land issues range from households that are being displaced to schools which are losing land. All people around are encroaching to school lands because most schools had land without titles hence nobody can tell the actual boundaries of the school.
iv) Ordinances take long to be approved i.e. the process is bureaucratic. The process requires authorization from the Attorney General through the MoLG and the District LG
v) Assessment is based on procurement of tests for exams rather than teachers setting the tests and exams. Tests and exams are now a business by some companies. Assessment is meant to be on curriculum coverage
vi) The system does not automatically reward (promote) those who have attained a certain level of competence, i.e. experience, individual upgrading etc.
vii) Local language exams are set in English at Kyambogoviii) Too much bureaucracy in firing teachers. Its next to impossible to fire a teacher.
This encourages non-commitmentix) Reduced focus on learning but assessments. Children are continuously provided
with tests where they are majorly trained to pass exams and less emphasis is put onlearning.
x) Increase in entry requirements to Primary Teachers College, i.e. having credits in both Mathematics and English subjects has reduced enrolments PTCs, for instance, enrolment has decreased in Kisoro Sacred Heart PTC. There is therefore need to study this policy further such that the quality of entrants / intake is not compromised.
xi) Curriculum reviews are irregular. Curriculum changes are rapid in a sense that as teachers are getting used to the revised curriculum, a new one is rolled out. NCDC
99
NATIONAL PLANNING AUTHORITY
98
SECTION FIVE:
5.0 LESSONS LEARNT/ BEST PRACTICES & EMERGING ISSUES
5.1 Emerging Issues
i) There is a glaring gap regarding knowledge of existing policies that govern Education by the implementers. Most respondents when asked about the policies responded “I don’t know” hence could not thereafter provide gaps in policies
ii) Several advocates of Universal Primary Education (UPE) do not seem to believe in it themselves. The researchers discovered that all the advocates of UPE, none had a child in a UPE school when they have primary going school children. It was even discovered that some teachers who are teaching in the UPE schools and the heads of LGs (CAO, Town Clerks, DEOs, DISs) take their own children in the neighboring private schools where the quality of education is better.
iii) As a condition for acquiring a license, the applicant must prove ownership of the land and must also attach details of the resources available for the school.However, a number of schools have no land for expansion and for undertaking co-curricular activities. There are in addition land conflicts for the existing government schools which are affecting education. This is one of the unintended outcomes and is an important area that needs further research in Northern and Central Uganda. Land issues range from households that are being displaced to schools which are losing land. All people around are encroaching to school lands because most schools had land without titles hence nobody can tell the actual boundaries of the school.
iv) Ordinances take long to be approved i.e. the process is bureaucratic. The process requires authorization from the Attorney General through the MoLG and the District LG
v) Assessment is based on procurement of tests for exams rather than teachers setting the tests and exams. Tests and exams are now a business by some companies. Assessment is meant to be on curriculum coverage
vi) The system does not automatically reward (promote) those who have attained a certain level of competence, i.e. experience, individual upgrading etc.
vii) Local language exams are set in English at Kyambogoviii) Too much bureaucracy in firing teachers. Its next to impossible to fire a teacher.
This encourages non-commitmentix) Reduced focus on learning but assessments. Children are continuously provided
with tests where they are majorly trained to pass exams and less emphasis is put onlearning.
x) Increase in entry requirements to Primary Teachers College, i.e. having credits in both Mathematics and English subjects has reduced enrolments PTCs, for instance, enrolment has decreased in Kisoro Sacred Heart PTC. There is therefore need to study this policy further such that the quality of entrants / intake is not compromised.
xi) Curriculum reviews are irregular. Curriculum changes are rapid in a sense that as teachers are getting used to the revised curriculum, a new one is rolled out. NCDC
99
should come up with a streamlined timeframe and have it followed. This will reduce expenditure on training implementers / users.
xii) CCTs play a very important role in the education system and are on ground however, their facilitation is not streamlined and is wanting.
100
SECTION SIX:
6.0 CONCLUSIONS AND RECOMMENDATIONS
6.1 Conclusion
i. Primary education has one of the most elaborate policy and institutional framework focusing on expanding the functional capacity of educational structures and institutions, as well as reducing on the inequalities of access to education between sexes, geographical areas, and social classes; enhancing equality and addressing gender and equity in education. A few areas therefore require strengthening so as to achieve education objectives.
ii. Uganda's Constitutional requirements on affirmative action in favor of marginalized groups was achieved. In addition, UPE objective three (3) aimed to make education equitable in order to eliminate disparities and inequalities. There were more female pupils (50.4%) in 2016 than males. Female enrolment has seen a gradual improvement over the years. From 39% in 1970 to the 47% in 1999 and 50.4% in 2016.
iii. Objective four of the UPE policy of having education being affordable was achieved as evidenced by the increased enrolment. Improved access to education by all (girls, disabled and orphans) in the short run. Gross Enrolment Rates (GER) were equally dramatic when they jumped from 77% in 1996 to 137% in 1997 while Net Enrolment Rate (NER) went up from 57% in 1996 to 85% in 1997.
iv. The Education (Pre-primary, Primary and Post Primary) Act, 2008, requires the Minister to, from time to time, issue statutory instruments regarding UPE, Universal Post Primary Education and Training, school meals, school charges, school uniforms, management and governance of education institutions in accordance with the Act. There is hardly any statutory instrument issued inform of rules, procedures and regulations on UPE. A number have been issued to implementers in form of policies, manuals, guidelines under this section of Education Act. These are in anyway difficult to trace since some of them are pronouncements while in conferences.
v. The key focus area where the good policies are short of is their implementation. The policies despite being good on paper, are however, never implemented. A system / framework for its implementation should therefore be in place. There are in addition, a number of recommendations that have since not been implemented. For instance, it was recommended that the optimal levels of staffing be provided especially under inspection under the Government White Paper. Government should fully implement recommendations provided by the different committees.
The evaluation noted the need to strengthen the current institutional architecture in ways that improve its efficiency and effectiveness.
6.2 Policy Recommendations
1. Comprehensively document the respective policies. There is need to document what UPE is and how it was supposed to be implemented. The sector needs to undertake an assessment and document all policies relating to education, carefully stating the
100
Policy, Legal, Regulatory and Institutional Framework
101
objectives and their respective assumptions. Most policies in place (UPE policy, Automatic Promotion policy, Text book policy, Early Childhood Development Policy,Local language (Lower primary) policy, Science subjects’ policy, Abolition of PTA charges etc.) have been either statements in workshops or political pronouncements and have never been in any way followed up with comprehensive documentation for effective implementation and subsequent evaluations.
2. The Minister needs to issue a statutory instrument on UPE as required under the Education Act, 2008. The continued conflicts between parents, teachers and the politicians in the implementation of UPE in particular, feeding is as result of lack of consensus / knowledge of their roles. The issuance of the instruments by the Minister will go a long way to address this missing link. The media has also been used to disseminate information before it is well synthesized and signed off by the Minister responsible.
3. Sensitize parents and the community on their roles. Parents and the community do not understand their roles and responsibilities and to that effect, 20 percent think sensitization of the parents and community on their roles might help to increase support to UPE from parents. When UPE was introduced, many parents thought that the government is solely responsible for everything a child needs at school. The phrase “bona basome” to parents literally meant that government took over their roles entirely as far as education is concerned. They though that the government would pay fees, provide all the scholastic needs including stationery, uniforms, textbooks and tuition. The effect is that almost all UPE government aided primary schools stopped providing meals to the learners. Most parents went ahead to produce more children since they knew the burden of school was taken away. It is strongly recommended that provision of food at school should be enforced, and where possible, by laws passed to punish parents who do not provide meals for their school going children. According to Mbabazi et al., (2014), provision of meals at school was a high motivating factor for school attendance in all districts. For Karamoja region, during times of famine, parents will force their children to go to school since there are assured of what to it.
4. Increase funding for UPE, recruit more teachers and share Local Revenue. The evaluation recommends increment in the funding for UPE. This will thus address and fill the gaps identified. The gaps include: limited infrastructure, dilapidated structures and motivation of teachers. Given the high PTR, respondents especially in Eastern, Northern and Central Uganda recommend recruitment of more teachers to bridge the gap brought about by high enrolment rates. Finally, the Local Revenue collected is not decentralized / shared with schools as it is only used at the district.
5. Promotion based on assessment. The Ministry of Education and Sports (MoES) should review the automatic promotion policy setting minimum qualification standards to advance to subsequent grades. Evidence indicates that the policy is believed to be compromising the quality of education. It was a pronouncement and was not properly disseminated as it was received through workshops. Majority of respondents (CAO, LCV, DEO, headteachers and teachers) recommend the promotion to be based on assessment and a compromise of allowing repeating for weak pupils. It should be based on indicators of merit (attendance and achievement in all subjects). On the other hand, some respondents suggest that the policy be abolished.
6. Increase the supply and stock of approved textbooks. Government should improve on the supply of textbooks to schools to improve the textbook- pupil ratio from the current
101
NATIONAL PLANNING AUTHORITY
101
objectives and their respective assumptions. Most policies in place (UPE policy, Automatic Promotion policy, Text book policy, Early Childhood Development Policy,Local language (Lower primary) policy, Science subjects’ policy, Abolition of PTA charges etc.) have been either statements in workshops or political pronouncements and have never been in any way followed up with comprehensive documentation for effective implementation and subsequent evaluations.
2. The Minister needs to issue a statutory instrument on UPE as required under the Education Act, 2008. The continued conflicts between parents, teachers and the politicians in the implementation of UPE in particular, feeding is as result of lack of consensus / knowledge of their roles. The issuance of the instruments by the Minister will go a long way to address this missing link. The media has also been used to disseminate information before it is well synthesized and signed off by the Minister responsible.
3. Sensitize parents and the community on their roles. Parents and the community do not understand their roles and responsibilities and to that effect, 20 percent think sensitization of the parents and community on their roles might help to increase support to UPE from parents. When UPE was introduced, many parents thought that the government is solely responsible for everything a child needs at school. The phrase “bona basome” to parents literally meant that government took over their roles entirely as far as education is concerned. They though that the government would pay fees, provide all the scholastic needs including stationery, uniforms, textbooks and tuition. The effect is that almost all UPE government aided primary schools stopped providing meals to the learners. Most parents went ahead to produce more children since they knew the burden of school was taken away. It is strongly recommended that provision of food at school should be enforced, and where possible, by laws passed to punish parents who do not provide meals for their school going children. According to Mbabazi et al., (2014), provision of meals at school was a high motivating factor for school attendance in all districts. For Karamoja region, during times of famine, parents will force their children to go to school since there are assured of what to it.
4. Increase funding for UPE, recruit more teachers and share Local Revenue. The evaluation recommends increment in the funding for UPE. This will thus address and fill the gaps identified. The gaps include: limited infrastructure, dilapidated structures and motivation of teachers. Given the high PTR, respondents especially in Eastern, Northern and Central Uganda recommend recruitment of more teachers to bridge the gap brought about by high enrolment rates. Finally, the Local Revenue collected is not decentralized / shared with schools as it is only used at the district.
5. Promotion based on assessment. The Ministry of Education and Sports (MoES) should review the automatic promotion policy setting minimum qualification standards to advance to subsequent grades. Evidence indicates that the policy is believed to be compromising the quality of education. It was a pronouncement and was not properly disseminated as it was received through workshops. Majority of respondents (CAO, LCV, DEO, headteachers and teachers) recommend the promotion to be based on assessment and a compromise of allowing repeating for weak pupils. It should be based on indicators of merit (attendance and achievement in all subjects). On the other hand, some respondents suggest that the policy be abolished.
6. Increase the supply and stock of approved textbooks. Government should improve on the supply of textbooks to schools to improve the textbook- pupil ratio from the current
102
3:1. In addition, NCDC should publish on its website a list of approved textbooks annually. This will enable users have accurate information on the books that are aligned to the syllabus. Approved textbooks should in addition be posted online such that soft copies are used. This will minimize the cost and burden of purchasing the many text books and maximize their use since access will be increased. However, technology should be viewed as a necessary supplement to traditional textbooks, not a replacement.
7. Improve storage of textbooks. Government should ensure that each school has a library to store the available textbooks and also enhance easy access to the books by pupils.
8. Introduce ECD section in all primary schools: ECD is the most important stage in the life of children and the ECD policy falls short of declaring pre-primary education a must for all children. ECD ensures a firm foundation for all children before they enter primary one and that must be harnessed. Government must take overall responsibility over its provision and make it compulsory as it is in the case of many developed countries. ECD / pre-primary education in Uganda is optional. In addition to findings of this evaluation, Strategy 4 of the National Integrated Early Childhood Development Policy Action Plan of Uganda (2016-2021) recommends for the establishment of ECD centres at every primary school and support community based centres.
9. Government should explore the provision of one-year free pre-primary education, but emphasis must first be placed on the consolidation of service structures for younger children. ECD interventions should therefore be part of the planning and budgeting in sector plans and budgets at all levels. Efforts must be focused on drafting of relevant legislation in order to ensure policy implementation especially for government’s engagement in providing for ECD.
10. Government should not leave ECD to the private sector as they charge exorbitant prices. The Education Act, 2008, Part (iv) section 10(2)(a) says that “pre-primary education to be run by private agencies or persons to provide education to children aged from two years to five years and the financing of that type of education shall be a responsibility of the parents or guardians”. i.e. most ECD related activities are supposed to be provided by local private service providers in a decentralized system. For any input or expenditure from LGs to be channeled to ECD related activities requires guidelines to be provided for them through the LG structures. The LG Act at present has no mention of ECD services to operationalize the ECD policy at the district level. Unless the LG Act is reformed to include ECD services in its structures, ECD will remain a family or NGO affair.
11. Enroll children at the right age and ensure that they do not leave school without completing the full cycle of primary education. Only when every child is enrolled at the right age and does not leave school without completing the full cycle of primary education would it be possible to ensure that all the citizens have the basic education needed for living a full life. It would also help in achieving transformation of the society leading to greater unity among the people, higher moral standards and an accelerated growth of the economy.
12. Support local language development. Government should strengthen language boards to have them fully functional to aid standardization of learning materials to facilitate the learning. In addition, a National Language Advisory Board should be established to assist in the development of Uganda languages. Increase the production and supply of local language teaching materials to schools.
102
Policy, Legal, Regulatory and Institutional Framework
103
13. Extend the implementation of the local language policy to private schools. The study finds that majority of private schools do not use local language despite the policy being applicable to both government and private aided schools. There is therefore need to enforce implementation of the policy by all.
14. Involve all stakeholders in the development and implementation of the customized performance targets policy. The MoPs while setting performance targets should involve all relevant stakeholders. These include; MoES, NPA, DEO, DIS, SMCs, head teachers, teachers and parents. They should also be involved in; planning, monitoring and review, appraisal and managing results. This was a key recommendation by implementers (table 4.15) such that supervision and target delivery is a combined effort.
15. Rewards and sanctions mechanism for performance. This policy to be effectively implemented, government should initiate annual rewards and sanctions for good and bad performance. This practice will motivate and improve performance of primary education in Uganda.
16. Revitalize the school garden system in primary schools. Through this system, schoolsare encouraged to open up and maintain gardens and farms from which feeding can be ensured.
17. Districts to draft and enforce ordinances for parents to support education. There is need for district-specific ordinances to compel parents to play their roles towards ensuring learning as entrenched in the Education Act. These ordinances must also be fast tracked.
18. Allow for transfer of teachers across districts. A mechanism should be put in place to permit reallocation of teachers from districts with excess numbers to those experiencing teacher shortages. This will in the short run fill the teacher gaps in those districts lacking.
19. Regularize Continuous Professional Development. Teachers should regularly undertake pedagogy trainings to enhance their teaching capabilities and allow for career growth. These have a direct bearing on teacher efficiency and effectiveness that in turn leads to improved pupil performance.
20. Regulate charges to pupils in schools. The school dues charged in different schools should be regulated by the concerned stakeholders and accountability presented to all those concerned. The main aims as to why different dues are charged should also be made clearly known to the parents, guardians and stakeholders (For SMCs, PTAs). Charges are one of the reasons children drop out of school and this contradicts policy on UPE since Universal access to education is the ability of all people (not only state funded) to have equal opportunity in education, regardless of their social class, gender, ethnicity background or physical and mental disabilities.
21. Increase budget allocation towards Human Capital Development. Human capital is essential for boosting productivity, pivotal for economic growth and also vital with regard to the resilience of economies. A country's human capital is mainly built through the education system, which is mostly funded by public money. Spending on education is a genuine and decisive public investment in the sense that the expected returns are quite high and typically materialize over a long period. This holds both for individuals (private returns) as well as for the society at large, as human capital accumulation is a key driver for economic/productivity growth, innovation activities and also the resilience of an economy in times of crises. Moreover, next to economic returns, education is also an
103
NATIONAL PLANNING AUTHORITY
104
effective remedy to fight poverty and flatten the income distribution, i.e. many education policies are expected to deliver a double-dividend for the society at large.
22. Address the poverty among most parents for them to be able to feed their children.Government in its public policies needs to shift / move toward taking a fresh look at addressing poverty, and therefore need to develop a new wave of ideas and approaches to address the causes of poverty. Failure by parents to provide food to their pupils is highly related to the high poverty levels among the parents. Previously, Uganda has had a strong poverty reduction performance in the past two decades where monetary poverty halved, with the poverty headcount rate declining from 56.4 percent in 1992/93 to 24.5 percent in 2009/10. This further reduced to 19.7 percent in 2012/13 before reversing to 21 in FY2016/17. The NDPII target of reducing the poverty rates from 19.7 percent to 14.2 percent and reducing inequality co-efficient from 0.443 to 0.452 by 2019/20 is far from being achieved.
23. Implement UPE in both public and private primary schools. UPE by definition is Universal Primary Education meaning its implementation should be both public and private schools. However, the laws (Constitution, Education Act, 2008) provide for funding for UPE in public schools. Likewise, the parents fund for the same in private primary schools. At the inception, UPE was funded by government in both public and private schools until 1999 when public funding for UPE was suspended in private primary schools. Whereas government is obliged to provide access, quality and equitable education and sports to all learners; which entail payment for capitation, inspection, instructional materials, infrastructure and teachers’ wages, these are only fulfilled in public schools. In addition, inspection funding for quality assurance in public and private schools provided for by government is still insufficient and mostly covers governmentschools.
24. Improve monitoring and learning in public schools to improve performance.Although public schools are well facilitated with instructional materials in all subjects, performance is still low whereas for the private schools that employ teachers of the same qualification, performance is better. This is because there is a gap in monitoring teaching and learning in these schools. In addition, UPE returns (PLE performance, staff motivation, capitation unit cost, staff accommodation etc.) in public schools remain low.
25. Introduce a web-based tracking system for drop outs. Section 10(3b) of the Education Act, 2008 requires Government to ensure a child who drops out of school before completing primary education cycle attains basic education through alternative approaches to providing that education. The drop out in Uganda has continued to increase and yet there is no government strategy to trace the whereabouts of students that have left before completing primary education cycle to attain basic education. With the introduction of the National IDs by NIRA, an integrated system should be put in place so that these pupils can be traced and helped.
26. Review Section 27 (1) of the Education Act, 2008 that requires every district to have a three-year rolling Education Development Plan. The Education Act requires the district council to cause an education development plan to be prepared in respect of such educational services to be administered by the LG, which shall cover a period of three years as prescribed by the LG Act, and the plan shall be part of the comprehensive and integrated development plan of the district. Despite amendment of the LG Act to provide for 5-year Development Plans from three-year rolling plans, this was not changed. There

104
Policy, Legal, Regulatory and Institutional Framework
105
is therefore need to amend this section of the Act for it to be in line with the LG Act and the Comprehensive National Development Planning Framework (CNDPF). In addition, there shouldn’t be individual departmental plans but these must have workplans derived from the District Development Plan.
27. Introduce clearance and approval of By-laws and Ordinances by the Ministry of LG. The local bill passed by a district council is required to be forwarded to the Attorney General through the Minister to certify that the local bill is not inconsistent with the Constitution or any other law enacted by Parliament before the chairperson signs the law. However, although the procedure indicates that the bill be returned with comments to the relevant council for modification or other appropriate action within ninety days, this always takes forever. It has therefore been difficult to make ordinances since the approval process takes long and there are no punitive actions in case the Minister or Attorney General does not act. The LGs are also very many and may be cumbersome for the Minister and Attorney General to handle within the required period. The Ministry of Local Government therefore, should be given the authority to approve the By-laws and Ordinances for consistency with other supreme legislations.
28. Decentralize Primary education financing. Whereas the all primary education activities relating to UPE implementation are decentralized, financing has remained at the centre to decide the funding. The LG Act cap 243 clearly specifies that the recurrent and development budget is a decentralized service. The LR is insufficient and LGs have continued to depend on funds from the center which are also conditional. Funding should also be based on the needs of the people (bottom up) rather than the centre dictating ceilings for education activities at institution levels. The process should consider inclusive participation of UPE implementers.
29. DES should develop a comprehensive compendium of standards for primary education. The Education Act, 2008 requires that this be in place for easy tracking of education outcomes. Attempts to establish standards were made by the MoES in 2009 and led to introduction of the Basic Requirements and Minimum Standards (BRMS) indicators for education institutions which were customized for use in inspections at LG level. However, the attempts are not comprehensive as they do not provide indicators and targets for middle income standards. Given that DES is also mandated to assess the achievement of standards and to evaluate the effectiveness of education programmes of institutions and agencies throughout Uganda, this is not possible without this compendium.
30. Address the inspection challenges. This evaluation finds inconsistent visits by inspectors to schools. Inadequate supervision is one of the leading contributors to the increasingly high failure rates in primary schools because institutions are not regularly assessed on whether they are sticking to the guidelines issued by the ministry. The four-major challenges towards school inspection identified by the implementers (DIS and DEOs) from the study include; inadequate transport; financial constraint; understaffing and hard to reach areas. The lack of inspection therefore presents a high risk of having schools that do not meet the requirements while operating without acquiring a license and poor curriculum implementation especially during the teaching and learning process.
31. Revise the provision of the Education Act granting operation of schools without acquiring an operation license. Before a school is granted a license, a thorough
105
NATIONAL PLANNING AUTHORITY
106
assessment should be done to ensure that the school meets the requirements. Provision of licenses has been at the expense of the district inspectors. At the same time the education Act, allows new schools to open as the registration and process of acquiring an operation license is ongoing, some schools ignore to formalize their operation with the education Ministry. Any school without an operation license does not meet standards and should not be allowed to open.
32. Regulate and license private bodies that set and print examinations. Private bodies that print exams for commercial purposes that include; beginning of term examinations, mid-term examinations, end of term examinations, regional and holiday packages should be regulated and licensed. Schools buy and administer these assessment instruments to the pupils. There are also headteachers associations that mainly set end of term examinations to learners. The implication is that pupils are not assessed based on thecoverage. One of the outstanding features of studies of assessment in recent years has been the shift in the focus of attention, towards greater interest in the interactions between assessment and classroom learning away from concentration on the properties of restricted forms of tests which are only weakly linked to the learning experiences of students. Its therefore evident that education outcomes lack a wholesome assessment of the curriculum that includes among examinations, assessment on physical education, MDD and generally talent development. This therefore implies that the assessment used do not effectively improve learning. Government therefore needs to review the assessment in place to include assessment of co-curricular activities and assessment atlower grades other than National Assessment for Progress in Education (NAPE) whose assessment covers Numeracy, Literacy and oral reading (English and local languages) at primary level of primary 4 and 6. The NAPE should be made comprehensive to cover thenational curriculum.
33. To address examination malpractice, government should enact an Examination Misconduct and Confidentiality policy with strict penalties and rewards ranging from suspension, expulsion and resignation of any of the stakeholders including: students, teachers, employees at UNEB after thorough investigation. Commercialization of Education has forced many School heads into cheating to attract more enrolment neglecting thorough/comprehensive teaching.
34. The NCDC should study and get best practice on how to handle international schools. The NCDC has no mandate regarding international schools and yet they should be bound by the country’s legal provisions. The Act is silent about the role of the Centre in relation to curricula used by international schools on learners in Uganda.
35. Address staffing and transport facilitation and political interference/influence on the recruitment process at the LG level. To improve on the service delivery in education, there is need to facilitate LGs to be able to monitor and supervise schools.
36. Sector Wide Approaches (SWAps) should be strengthened. The SWAp considers the MOES and key stakeholders that include donors within education sector to work in a fully participatory manner. However, this approach lacks inter-sectoral linkages as it only focuses on stakeholders in education. Therefore, the SWA approach should also be inclusive to involve other stakeholders beyond the education sector. These will facilitate identification of priorities, planning, budgeting, and Monitoring and Evaluation.
106
Policy, Legal, Regulatory and Institutional Framework
109
Okurut, J.M. (2015). Examining the Effect of Automatic Promotion on Students’ Learning Achievements in Uganda’s Primary Education. Retrieved from http://wje.sciedupress.com
Stiglitz J. E. (1974). The Demand for Education in Public and Private school systems
107
NATIONAL PLANNING AUTHORITY
108
REFERENCES
Education (Pre-Primary, Primary and Post Primary) Act, 2008
Guidelines for the Implementation of Local Government Structures, (September, 2016). Ministry of Public Service
Government of Uganda, Government White Paper on the Education Policy Review Commission Report Entitled “Education for National Integration and Development” Government Printer, Kampala, April 1992.
Ministry of Education and Sports, the Ugandan Experience of Universal Primary Education (UPE); July 1999.
Ministry of Education and Sports, March 2005: Education Sector Strategic Plan, 2004-2015
Ministry of Education and Sports, 2017: Education and Sports Sector Strategic Plan, 2017/18 -2019/20
Ejuu G. (2012). The Status of Implementation of the Education Sector Early Childhood Development Policy in Uganda. Kampala: Uganda National Commission for UNESCO.
Ndaruhutse, S. (2008). Grade repetition in primary schools in Sub-Saharan Africa: An evidence base for change. Center for British Teachers (CfBT) Education Trust, pp 1-76.
The Ugandan Experience of Universal Primary Education (UPE), (1999). Ministry of Education and Sports
Ojijo, 2014: Review of Education Policy in Uganda
Mbabazi M. C, Awich O et al., (2014). Out of school children study in Uganda
Ministry of Education and Sports (2001). The Development of Education in Uganda in the last ten Years. Report on the Development of Education for the 46th Session of (ice) 5th – 7th September 2001, Geneva.
Ministry of Education and Sports, (2008b). Guidelines of policy, planning and roles and responsibility of stakeholders in the implementation of UPE for districts and urban councils.
Ministry of Education and Sports 2004, Enhancing UPE. A stakeholders Handbook
Ministry of Education and Sports, 2016. National Education Accounts Report Uganda.
109
Okurut, J.M. (2015). Examining the Effect of Automatic Promotion on Students’ Learning Achievements in Uganda’s Primary Education. Retrieved from http://wje.sciedupress.com
Stiglitz J. E. (1974). The Demand for Education in Public and Private school systems
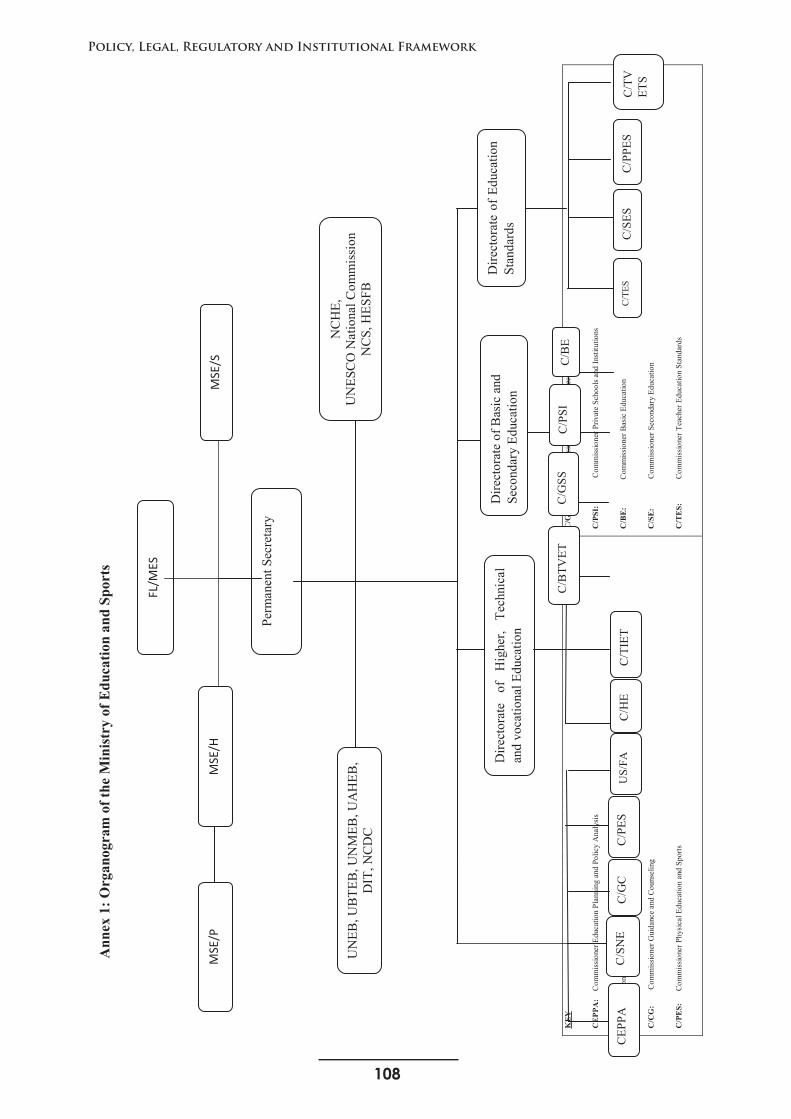
108
Policy, Legal, Regulatory and Institutional Framework
110
Ann
ex 1
: Org
anog
ram
of t
he M
inis
try
of E
duca
tion
and
Spor
ts
KEY
CEP
PA:
Com
mis
sione
r Edu
catio
n Pl
anni
ng a
nd P
olic
y A
naly
sis
C/S
NE:
Com
mis
sione
r Spe
cial
Nee
ds E
duca
tion
C/C
G:
Com
mis
sione
r Gui
danc
e an
d C
ouns
elin
g
C/P
ES:
C
omm
issio
ner P
hysi
cal E
duca
tion
and
Spor
ts
C/G
SS:
C
omm
issio
ner G
over
nmen
t Sec
onda
ry S
choo
ls
C/P
SI:
Com
miss
ione
r Priv
ate
Scho
ols a
nd In
stitu
tions
C/B
E:
C
omm
issio
ner B
asic
Edu
catio
n
C/S
E:C
omm
issio
ner S
econ
dary
Edu
catio
n
C/T
ES:
C
omm
issio
ner T
each
er E
duca
tion
Stan
dard
s
Perm
anen
t Sec
reta
ry
NC
HE,
UN
ESC
O N
atio
nal C
omm
issi
onN
CS,
HES
FB
Dire
ctor
ate
of B
asic
and
Se
cond
ary
Educ
atio
nD
irect
orat
e of
Edu
catio
n St
anda
rds
Dire
ctor
ate
of
Hig
her,
Tech
nica
l an
d vo
catio
nal E
duca
tion
C/H
EC
/TIE
T
C/B
TVET
C/G
SSC
/PSI
C/B
E
C/T
ESC
/SES
C/P
PES
C/T
VET
S
C/S
NE
C/G
CC
/PES
UN
EB, U
BTE
B, U
NM
EB, U
AH
EB,
DIT
, NC
DC
US/
FAC
EPPA
MSE
/PM
SE/H
MSE
/S
FL/M
ES
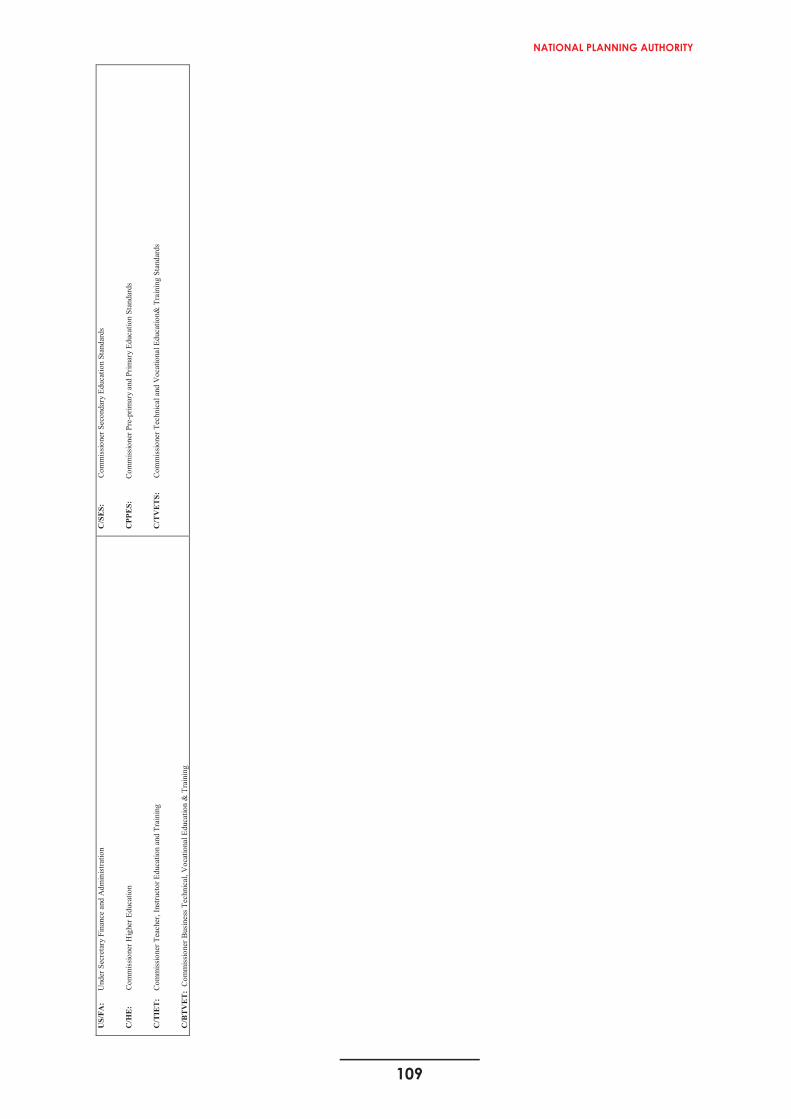
109
NATIONAL PLANNING AUTHORITY
111
US/
FA:
U
nder
Sec
reta
ry F
inan
ce a
nd A
dmin
istra
tion
C/H
E:
C
omm
issio
ner H
ighe
r Edu
catio
n
C/T
IET:
C
omm
issio
ner T
each
er, I
nstru
ctor
Edu
catio
n an
d Tr
aini
ng
C/B
TVET
: C
omm
issio
ner B
usin
ess T
echn
ical
, Voc
atio
nal E
duca
tion
& T
rain
ing
C/S
ES:
C
omm
issio
ner S
econ
dary
Edu
catio
n St
anda
rds
CPP
ES:
Co
mm
issio
ner P
re-p
rimar
y an
d Pr
imar
y Ed
ucat
ion
Stan
dard
s
C/T
VET
S:
C
omm
issio
ner T
echn
ical
and
Voc
atio
nal E
duca
tion&
Tra
inin
g St
anda
rds
110
Policy, Legal, Regulatory and Institutional Framework
112
Annex : Sampling
1. Sampling Design (Phase I)
A multi stage sampling criteria which involved dividing the population into groups was used in identifying the sampling units. The first stage as illustrated in sub-section 2.3.1 stratified the country into 10 regions. These regions have been used by UBOS in the major surveys like UDHS, 2011.
The second stage involved selecting districts from the strata identified above. A sampling frame was therefore used to generate the districts. The districts were selected based on the following characteristics: districts that existed in the periods 1997, 2008 (NDPI baseline), and 2014 to capture old and new districts; hard-to-reach and stay districts; and municipality. In addition, the district selection / classification considered unique characteristics within a region for example Eastern category took care of; Teso, Bukedi, Sebei, and Bugisu.
Stage three involved selecting administrative units (sub-counties/divisions) within a district/ Municipality. In this particular stage, a list of administrative units (rural and urban) were generated, from which 3 sub-counties and 1 division/town council were selected using systematic sampling technique and simple random sampling, respectively. For Kampala District, all the divisions were considered.
Stage four involved selecting the sampling units using a systematic sampling technique. Firstly, the sub-county/ division schools were listed as private and public schools to provide two independent sampling frames detailing their residences, i.e. rural or urban and total enrolments. The schools were then ranked by enrolments before selecting the sampling units. Secondly, using the sampling frame, the sampling units (schools) were selected at a sampling interval of n/(n1=3) = k; where n is the number of schools in the sampling frame and n1 is the sampling size (number of sampling units required from a sub-county sampling frame); and k in the sampling interval. The first unit were identified through simple random sampling and the other remaining units were selected at intervals (k). Simple random sampling was used in selecting one (1) private school for the study.
Sample size
Using the Yamane (1967) formula for calculating the sample size, 605 schools in total were selected from a total of 18,887 schools in the country. Of this, 64 percent is government owned and 36 percent is private.
𝑛𝑛𝑛𝑛 = 𝑁𝑁𝑁𝑁1+𝑁𝑁𝑁𝑁(𝑒𝑒𝑒𝑒)2 Where 𝑛𝑛𝑛𝑛 is the required sample size, 𝑁𝑁𝑁𝑁 is the population size of the study and 𝑒𝑒𝑒𝑒 is the
level of significance (1- level of confidence).
Therefore, 𝑒𝑒𝑒𝑒 = 0.04;
Sample size;
𝑛𝑛𝑛𝑛 = 18,8871+18,887(0.04)2 ≃ 605 Schools
Specifically, 385 government and 219 private schools were sampled across the country and visited. These schools were therefore randomly selected from the MOES EMIS as provided in sections 2.3.2.
111
NATIONAL PLANNING AUTHORITY
113
2. Sampling Design (Phase II)
A similar sampling design used in phase I was used in phase II. A sub set of the schools visited in phase I (392 schools as determined below) in the first phase were visited in the second phase. The idea was to have continuity and correlated data set. The sample size was determined as per the Yamane (1967) formula.
Sample size
Using the Yamane (1967) formula for calculating the sample size, 392 schools (64 percent government and 36 private) in total were selected and visited from a total of 18,887 schools in the country.
𝑛𝑛𝑛𝑛 = 𝑁𝑁𝑁𝑁1+𝑁𝑁𝑁𝑁(𝑒𝑒𝑒𝑒)2 Where 𝑛𝑛𝑛𝑛 is the required sample size, 𝑁𝑁𝑁𝑁 is the population size of the study and 𝑒𝑒𝑒𝑒 is the
level of significance (1- level of confidence).
Therefore, 𝑒𝑒𝑒𝑒 = 0.05;
Sample size for;
𝑛𝑛𝑛𝑛 = 18,8871+18,887(0.05)2 ≃ 392 Schools
Given that there are a total 18,887 primary schools in the country and 12,035 are Government Schools while 6,852 are Private, the computation gives a sample size of 250 Government and 142 Private Schools sampled across the country.
112
Policy, Legal, Regulatory and Institutional Framework
114
Procedure of Registering a School
Before a school is registered by the MoES, there are procedures to follow. The process starts at the district. Forms are filled and endorsed by relevant authorities within the LG structures before the education Ministry’s involvement. The implication of this is that the ministry is guided by the assessment done at the district level. A file is opened at the ministry by the officer in charge and a review of the necessary documentation is done. Once all the minimum requirements are provided, the school is given a provisional license.
Conditions
i. Land on which the school is located. The applicant must prove ownership of the land and must also attach details of the resources available for the school, like bank statements
ii. Also required is the number of Staff going to run the school and their qualifications. The management team or board of directors in case of private schools needs to be indicated
iii. Evidence of access to recreational facilities, including sports fields. Some schools do not own fields but it is permissible to bring evidence that you have permission to use recreational facilities that are within your reach or the school vicinity. This is especially for schools that might be situated within cities or towns
iv. The schools must have a minimum number of classrooms, depending on the level of the school.v. The school structures should meet building specifications of the works ministry.
vi. Each school must have a qualified headteacher registered with the educational ministry. The headteacher must also have a minimum teaching experience of five years.
vii. Primary schools should have a minimum of seven teachers, secondary a minimum of 12. viii. All the teachers must be trained and registered with the education ministry.

113
NATIONAL PLANNING AUTHORITY
114
Procedure of Registering a School
Before a school is registered by the MoES, there are procedures to follow. The process starts at the district. Forms are filled and endorsed by relevant authorities within the LG structures before the education Ministry’s involvement. The implication of this is that the ministry is guided by the assessment done at the district level. A file is opened at the ministry by the officer in charge and a review of the necessary documentation is done. Once all the minimum requirements are provided, the school is given a provisional license.
Conditions
i. Land on which the school is located. The applicant must prove ownership of the land and must also attach details of the resources available for the school, like bank statements
ii. Also required is the number of Staff going to run the school and their qualifications. The management team or board of directors in case of private schools needs to be indicated
iii. Evidence of access to recreational facilities, including sports fields. Some schools do not own fields but it is permissible to bring evidence that you have permission to use recreational facilities that are within your reach or the school vicinity. This is especially for schools that might be situated within cities or towns
iv. The schools must have a minimum number of classrooms, depending on the level of the school.v. The school structures should meet building specifications of the works ministry.
vi. Each school must have a qualified headteacher registered with the educational ministry. The headteacher must also have a minimum teaching experience of five years.
vii. Primary schools should have a minimum of seven teachers, secondary a minimum of 12. viii. All the teachers must be trained and registered with the education ministry.

114
Policy, Legal, Regulatory and Institutional Framework


NATIONAL PLANNING AUTHORITYPlanning House , Clement Hill Road Plot 17B, P.O. Box 21434.Kampala - UgandaTel: +256 414 250 229 / 0312 310 730
Learn more at:
www.npa.ug www.facebook.com/NPAUGANDA #@NPA_UG For any queries Email: [email protected].
Related Documents