Poleward propagation of boreal summer intraseasonal oscillations in a coupled model: role of internal processes R. S. Ajayamohan • H. Annamalai • Jing-Jia Luo • Jan Hafner • Toshio Yamagata Received: 3 February 2010 / Accepted: 4 May 2010 / Published online: 22 May 2010 Ó Springer-Verlag 2010 Abstract The study compares the simulated poleward migration characteristics of boreal summer intraseasonal oscillations (BSISO) in a suite of coupled ocean–atmo- spheric model sensitivity integrations. The sensitivity experiments are designed in such a manner to allow full coupling in specific ocean basins but forced by temporally varying monthly climatological sea surface temperature (SST) adopted from the fully coupled model control runs (ES10). While the local air–sea interaction is suppressed in the tropical Indian Ocean and allowed in the other oceans in the ESdI run, it is suppressed in the tropical Pacific and allowed in the other oceans in the ESdP run. Our diag- nostics show that the basic mean state in precipitation and easterly vertical shear as well as the BSISO properties remain unchanged due to either inclusion or exclusion of local air–sea interaction. In the presence of realistic east- erly vertical shear, the continuous emanation of Rossby waves from the equatorial convection is trapped over the monsoon region that enables the poleward propagation of BSISO anomalies in all the model sensitivity experiments. To explore the internal processes that maintain the tropo- spheric moisture anomalies ahead of BSISO precipitation anomalies, moisture and moist static energy budgets are performed. In all model experiments, advection of ano- malous moisture by climatological winds anchors the moisture anomalies that in turn promote the northward migration of BSISO precipitation. While the results indi- cate the need for realistic simulation of all aspects of the basic state, our model results need to be taken with caution because in the ECHAM family of coupled models the internal variance at intraseasonal timescales is indeed very high, and therefore local air–sea interactions may not play a pivotal role. 1 Introduction The seasonal mean rainfall associated with the Asian summer monsoon (ASM) dictates the livelihoods of mil- lions of people across India, southeast and east Asia. The economic and industrial developments of these countries are dependent on the rain-fed agriculture. The ASM rainfall variability occurs from synoptic to decadal and longer time scales. Of interest here is assessing the relative roles of local air–sea interactions and internal processes on the propagation characteristics of the variability associated with intraseasonal time scales (30–60 days). All-year round, the tropics experience strong and coherent variations in winds and precipitation at intrasea- sonal time scales, known as Madden-Julian oscillation (MJO; Madden and Julian 1994). While the MJO is pre- dominantly confined to the equatorial region in boreal winter and spring, rainfall and wind anomalies in boreal summer propagate northward from the equatorial Indian R. S. Ajayamohan (&) Canadian Centre for Climate Modelling and Analysis, University of Victoria, P.O. Box 3065, STN CSC, Victoria, BC V8W 3V6, Canada e-mail: [email protected] H. Annamalai Á J. Hafner International Pacific Research Center, University of Hawaii, Honolulu, USA J.-J. Luo Á T. Yamagata Frontier Research Centre for Global Change, Japan Agency for Marine-Earth Science and Technology, Yokohama, Japan T. Yamagata Department of Earth and Planetary Science, The University of Tokyo, Tokyo, Japan 123 Clim Dyn (2011) 37:851–867 DOI 10.1007/s00382-010-0839-6

Welcome message from author
This document is posted to help you gain knowledge. Please leave a comment to let me know what you think about it! Share it to your friends and learn new things together.
Transcript
Poleward propagation of boreal summer intraseasonal oscillationsin a coupled model: role of internal processes
R. S. Ajayamohan • H. Annamalai •
Jing-Jia Luo • Jan Hafner • Toshio Yamagata
Received: 3 February 2010 / Accepted: 4 May 2010 / Published online: 22 May 2010
� Springer-Verlag 2010
Abstract The study compares the simulated poleward
migration characteristics of boreal summer intraseasonal
oscillations (BSISO) in a suite of coupled ocean–atmo-
spheric model sensitivity integrations. The sensitivity
experiments are designed in such a manner to allow full
coupling in specific ocean basins but forced by temporally
varying monthly climatological sea surface temperature
(SST) adopted from the fully coupled model control runs
(ES10). While the local air–sea interaction is suppressed in
the tropical Indian Ocean and allowed in the other oceans
in the ESdI run, it is suppressed in the tropical Pacific and
allowed in the other oceans in the ESdP run. Our diag-
nostics show that the basic mean state in precipitation and
easterly vertical shear as well as the BSISO properties
remain unchanged due to either inclusion or exclusion of
local air–sea interaction. In the presence of realistic east-
erly vertical shear, the continuous emanation of Rossby
waves from the equatorial convection is trapped over the
monsoon region that enables the poleward propagation of
BSISO anomalies in all the model sensitivity experiments.
To explore the internal processes that maintain the tropo-
spheric moisture anomalies ahead of BSISO precipitation
anomalies, moisture and moist static energy budgets are
performed. In all model experiments, advection of ano-
malous moisture by climatological winds anchors the
moisture anomalies that in turn promote the northward
migration of BSISO precipitation. While the results indi-
cate the need for realistic simulation of all aspects of the
basic state, our model results need to be taken with caution
because in the ECHAM family of coupled models the
internal variance at intraseasonal timescales is indeed very
high, and therefore local air–sea interactions may not play
a pivotal role.
1 Introduction
The seasonal mean rainfall associated with the Asian
summer monsoon (ASM) dictates the livelihoods of mil-
lions of people across India, southeast and east Asia. The
economic and industrial developments of these countries
are dependent on the rain-fed agriculture. The ASM rainfall
variability occurs from synoptic to decadal and longer time
scales. Of interest here is assessing the relative roles of
local air–sea interactions and internal processes on the
propagation characteristics of the variability associated
with intraseasonal time scales (30–60 days).
All-year round, the tropics experience strong and
coherent variations in winds and precipitation at intrasea-
sonal time scales, known as Madden-Julian oscillation
(MJO; Madden and Julian 1994). While the MJO is pre-
dominantly confined to the equatorial region in boreal
winter and spring, rainfall and wind anomalies in boreal
summer propagate northward from the equatorial Indian
R. S. Ajayamohan (&)
Canadian Centre for Climate Modelling and Analysis,
University of Victoria, P.O. Box 3065, STN CSC, Victoria,
BC V8W 3V6, Canada
e-mail: [email protected]
H. Annamalai � J. Hafner
International Pacific Research Center,
University of Hawaii, Honolulu, USA
J.-J. Luo � T. Yamagata
Frontier Research Centre for Global Change,
Japan Agency for Marine-Earth Science and Technology,
Yokohama, Japan
T. Yamagata
Department of Earth and Planetary Science,
The University of Tokyo, Tokyo, Japan
123
Clim Dyn (2011) 37:851–867
DOI 10.1007/s00382-010-0839-6
Ocean (IO) and western Pacific to the land masses of India
and Southeast Asia, pacing the active and break cycles of
the ASM. While the changes in the mean conditions
between boreal winter and summer are attributed to the
changes in the propagation characteristics, during boreal
summer observed seasonal mean rainfall show that there
are three regional rainfall zones over the ASM domain. Of
them, the primary one is noted over the Indian subcontinent
and the Bay of Bengal between 15�N and 25�N. The sec-
ondary zones are observed over the equatorial IO between
the equator and 10�S, and over the warm waters of the
tropical western Pacific (Goswami and Ajayamohan 2001;
Annamalai and Slingo 2001). The boreal summer intra-
seasonal oscillation (BSISO) originates over the equatorial
IO and through eastward and north-northwestward propa-
gations influences other regional heat sources (Annamalai
and Sperber 2005).
Understanding the processes responsible, and modeling
and predicting the complex space–time propagation
characteristics of the BSISO have received wide attention
(see the reviews in Goswami 2005; Wang 2005; Waliser
2006). Many models of increasing complexity (simple toy
models to fully coupled ocean–atmosphere general cir-
culation models) have been employed to identify the
BSISO mechanisms (e.g., Yamagata and Hayashi 1984).
The large zonal scale (*15,000 km) compared to the
meridional scale (*3,000 km) of the BSISO motivated
the application of zonally symmetric dynamics for an
explanation of its genesis, poleward propagation and
temporal scale selection (Webster 1983; Goswami and
Shukla 1984). A notable result from these studies is the
existence of meridional gradient in sensible heat flux,
moist static energy and mean specific humidity (northern
side being more unstable than the southern side) that
favors the northward movement of the BSISO. Employing
three-dimensional models and invoking wave dynamics
Lau and Peng (1990) suggested that convective feedback
between monsoon flow and the equatorial MJO could
trigger westward propagating Rossby waves over the
Indian monsoon region. The model results of Wang and
Xie (1997) show that BSISO is strongly influenced by the
background circulation and low-level moisture. They
described the BSISO as a convection front formed by
continuous emanation of equatorial Rossby waves and the
northward propagation is anchored due to the eastward
movement of the northwest tilted convection front. The
GCM results of Wu et al. (2006) support the findings of
Wang and Xie (1997). Krishnan et al. (2000) also sug-
gested the importance of Rossby waves in triggering
monsoon break conditions. While the role of Rossby
waves in promoting poleward migration requires eastward
propagating component of the BSISO, Jiang et al. (2004)
proposed the importance of barotropic vorticity for
independent poleward migrating events (i.e., without
eastward component) over the Indian longitudes.
Apart from the internal processes, local air–sea inter-
action has also been identified as one of the factors
responsible for pre-conditioning the boundary layer mois-
ture ahead of convection. Idealized modeling studies
(Woolnough et al. 2001), and observational diagnostics
with high temporal resolution satellite and in-situ data
highlighted the temporal phase relationship among SST,
surface fluxes, precipitation and other related parameters
(Bhat et al. 2004; Vecchi and Harrison 2002; Sengupta
et al. 2001). Adopting a series of perturbation experiments
with ECHAM4 Atmospheric General Circulation Model
(AGCM) coupled with an intermediate ocean model, Fu
et al. (2003); Fu and Wang (2004) showed that the coupled
model simulates a more realistic phase structure of BSISO
compared to an atmosphere-only version of the model. The
central hypothesis arrived from these studies is that warm
(cold) SST anomalies lead the northward-propagating wet
(dry) phase of convection by about 7–10 days, and this
positive SST anomaly promotes enhanced moisture per-
turbation through increase in evaporation (Shinoda et al.
1998; Woolnough et al. 2001; Annamalai and Sperber
2005).
Waliser et al. (2004) examined a suite of AGCMs and
their coupled versions and noted that the BSISO is better
represented in latter. In a comprehensive study, Sperber
and Annamalai (2008) examined 18 coupled model simu-
lations and noted that all models capture the equatorial
component of the BSISO but not necessarily the poleward
component over the monsoon region. The authors con-
cluded that while the basic state is a necessary but not a
sufficient condition for realistic simulation of the BSISO.
In summary, it is well recognized that MJO or BSISO owes
its existence to internal atmospheric variability (Madden
and Julian 1994; Slingo et al. 2005; Wang 2005) but their
spatial structure and statistical properties such as frequency
and amplitude may be influenced by factors such as soil
moisture (e.g., Ferranti et al. 1999), and air–sea interaction
(e.g., Waliser et al. 2004).
Based on observational and modeling studies (Kemball-
Cook and Wang 2001; Lawrence and Webster 2001), the
sequence of events of internal origin leading to poleward
migration of BSISO can be summarized as follows: (1) In
the presence of background mean flow with easterly ver-
tical shear, the anomalous circulation driven by the diabatic
heating associated with the BSISO produces cyclonic
vorticity to the north of BSISO-related cloud band; (2) The
cyclonic vorticity then drives frictional convergence in the
planetary boundary layer that leads to higher moisture
convergence north of the cloud band; and (3) In addition,
the mean flow and the associated meridional gradient in
boundary layer moisture favors moisture convergence in
852 R. S. Ajayamohan et al.: BSISO propagation: role of internal processes
123
the north. It appears that moistening of the planetary
boundary layer either by internal processes and/or by local
air–sea interactions ahead of convection plays a role in the
poleward propagation of the BSISO. Three-dimensional
specific humidity observations from satellite support this
particular view (Tian et al. 2006).
During boreal summer, it is clear that maximum intra-
seasonal variability is observed over the ASM region. A
question that is not examined in detail is: what is the rela-
tive role of local air–sea interactions versus internal pro-
cesses in the life-cycle of the BSISO, in particular for
moistening of the boundary layer ahead of convection? The
present study examines these particular aspects by diag-
nosing output from a suite of coupled model integrations.
The model experiments are designed by permitting free
coupling in certain ocean basins while forced by tempo-
rally varying monthly climatological SST taken from
control integrations in other ocean sites (details in Sect. 2).
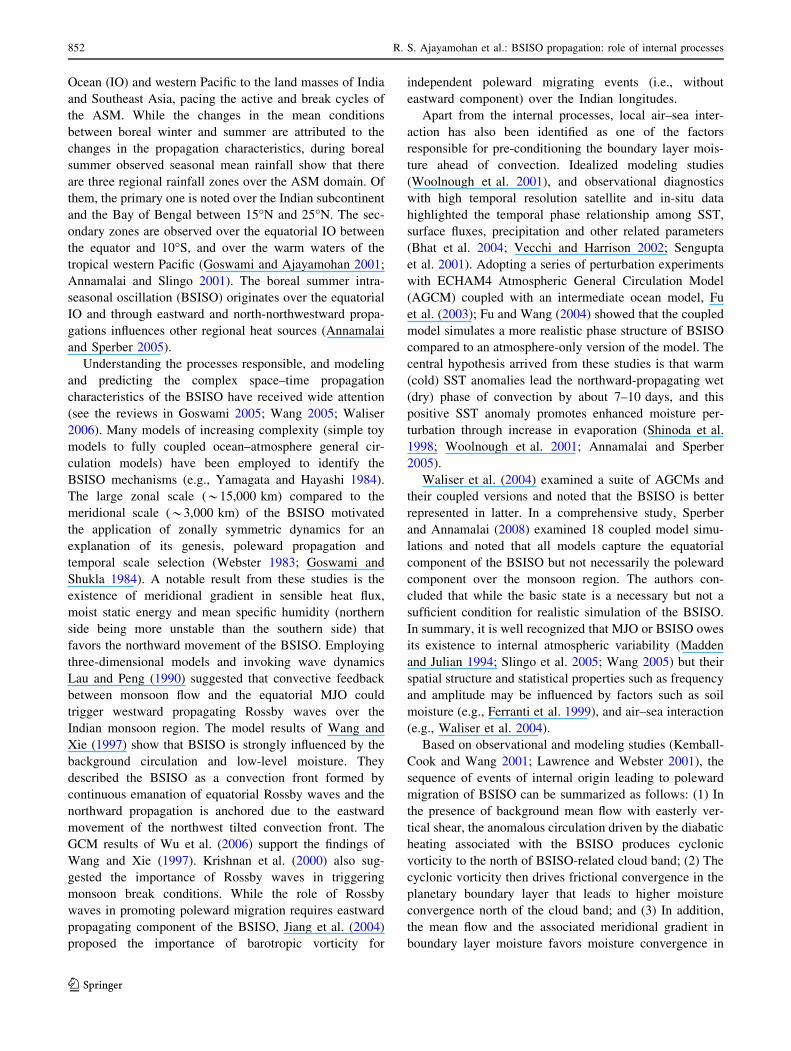
To motivate our interest, Fig. 1 shows the latitude–time
precipitation regression maps (data processing is discussed
in Sect. 2) from observations (Fig. 1a), the control simu-
lation (Fig. 1b) and sensitivity experiment where air–sea
interaction is not allowed only over the tropical Indian
Ocean (Fig. 1c). Compared to observations, both model
runs simulate the northward migration of precipitation
anomalies over the Indian monsoon region, but there are
differences in details. This finding allows us to identify
other processes apart from local air–sea interactions on the
BSISOs poleward characteristics in this model. We use a
suite of diagnostic tools on selected model variables, and
apply moisture and moist static energy budget analyses to
identify the processes that promote tropospheric moisture
ahead of the convection.
The remainder of the paper is organized as follows. The
model details and experimental designs are described in
Sect. 2. The model’s basic state and BSISO characteristics
are presented in Sect. 3. Budget diagnostics and mecha-
nisms identified for the poleward migration are discussed
in Sect. 4. Major findings of the present study are sum-
marized in Sect. 5.
2 Model and experimental design
The global ocean–atmosphere coupled general circulation
model used in this study, SINTEX-F1 was developed from
the original European SINTEX model (Gualdi et al. 2003;
Guilyardi et al. 2003) at the Frontier Research Center for
Global Change under the European Union-Japan collabo-
ration (more details in Luo et al. 2005). The atmospheric
component (ECHAM4) has a resolution of 1.1� 9 1.1�(T106) with 19 vertical levels (Roeckner et al. 1996). The
oceanic component (OPA8.2) has a resolution of a 2�Mercator mesh (increased to 0.5� in the latitudinal direc-
tion near the equator) with 31 vertical levels (Madec et al.
1998). To avoid the singularity in the coordinate system,
the finite mesh is designed in a way such that the North
Pole is replaced by two nodal points located over North
America and Eurasia. Those two components are directly
coupled every 2 h without any flux corrections using a
standardized model coupler (Valcke et al. 2000). No sea
ice model is incorporated in this version. The SINTEX-F1
(a) (b) (c)
Fig. 1 Lag-latitude diagrams of regressed precipitation anomalies
(mm day-1) averaged over 80�E–90�E illustrating poleward propa-
gation in a observations (CMAP), b ES10 simulations and c ESdI
simulations. First solid (dashed) contour of precipitation is 0.2
(-0.2) mm day-1 and contour interval is 0.8 (-0.8) mm day-1
R. S. Ajayamohan et al.: BSISO propagation: role of internal processes 853
123
model realistically simulates the El Nino and Southern
Oscillation (ENSO) and Indian Ocean Dipole (IOD)
(Gualdi et al. 2003; Yamagata et al. 2004; Luo et al. 2007)
and shows skill in experimental seasonal predictions (Luo
et al. 2008; Jin et al. 2008). The fully coupled control runs
are referred to as ES10, and pentad-mean data from the last
50 years of the total 70-year integration are analyzed here.
For the present study, to assess the regional air–sea
interactions on BSISO characteristics, coupled model
experiments have been conducted by allowing full cou-
pling in specific ocean basins but forced by temporally
varying monthly climatological SST adopted from ES10
runs in other ocean basins. This experimental set-up allows
one to suppress the air–sea interaction at all time scales in
specific ocean sites by decoupling the ocean and atmo-
sphere in that region. A ‘sponge layer’ of 10� width in
longitude and 5� in latitude, where weights of the free air–
sea coupling increase linearly toward the outside ocean,
was applied in order to avoid unrealistic instability near the
boundary. We briefly explain the experiments here, and
more details are available in Luo et al. (2007, 2009).
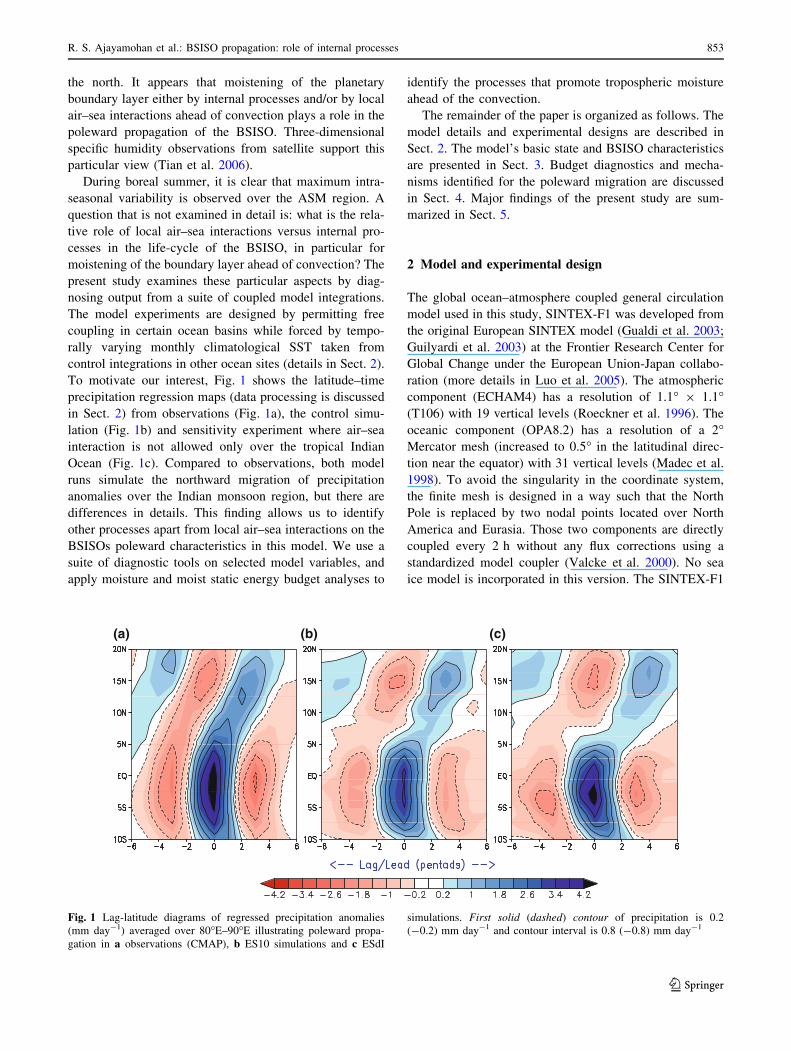
• Air–sea interactions suppressed over the tropical Indian
Ocean:
Monthly mean values of SST derived from the control
run (ES10 run) are specified in the tropical IO (see
Fig. 2a) to force the atmosphere, and this experiment is
referred to as ESdI runs. By comparing results from
ES10 and ESdI runs, the possible role of local air–sea
interactions on BSISO characteristics in the Indian
monsoon region can be assessed.
• Air–sea interactions suppressed over the tropical
Pacific Ocean:
In this experiment, coupling is suppressed over the
tropical Pacific (25�S–25�N, Fig. 2b) and is referred to
as ESdP runs. By comparing results from ES10 and
ESdP, we can assess the importance of local air–sea
interactions on BSISO characteristics over the tropical
west Pacific.
In both ESdI and ESdP simulations pentad-mean data
from the last 50 years of the total 70-year integration are
diagnosed here. First, pentad anomalies are calculated by
removing the respective pentad climatology. Then,
Lanczos bandpass filter with 200 weights and retaining
periods of 20–100 days are applied to the full data set
covering all the months. Finally, pentads corresponding to
the boreal summer season (June through September) are
extracted for analysis. For validating the model results,
we use pentad precipitation data from the Climate Pre-
diction Center Merged Analysis (CMAP) and winds from
NCEP/NCAR reanalyses, respectively for the period
1979–2006.
3 Simulation of mean state and BSISO characteristics
In this section, we present the ability of the model in
simulating the basic state and BSISO characteristics, first in
ES10 (Sect. 3.1), and then in the sensitivity experiments
(Sect. 3.2). We close the section by discussing space–time
evolution in BSISO characteristics (Sect. 3.3).
3.1 Basic state and BSISO in ES10 runs
The description of the SINTEX mean state has been dis-
cussed in detail elsewhere (Gualdi et al. 2003; Cherchi
et al. 2007; Ajayamohan et al. 2009). Here, we discuss the
simulated boreal summer precipitation and SST climatol-
ogies over the ASM region in ES10 runs (Fig. 3a, b).
Compared to observations, the spatial extent of the Indo-
Pacific warm pool (area covered by SST [28�C) is rea-
sonably simulated. In the model, the lack of a minimum
SST along the Somali–Oman coast implies a weaker cross-
equatorial flow and hence reduced upwelling (not shown).
As regards to precipitation, while the model captures the
location of the major regional centers the simulated
intensities are indeed weak. The excess rainfall over the
equatorial western IO may be attributed to high mean SST
simulated there. The pattern correlation between the
observed and model simulated precipitation climatology
over the ASM region (40�E–120�E, 20�S–30�N) is 0.85.
This model simulated precipitation climatology is compa-
rable to other state-of-art coupled models that showed
(a) (b)Fig. 2 SINTEX-F decoupling
experiments. The shaded region
represents decoupling area in
a ESdI, b ESdP experiments. A
‘sponge layer’ where weights of
the free air–sea coupling
increase linearly toward the
outside ocean was applied near
the boundary
854 R. S. Ajayamohan et al.: BSISO propagation: role of internal processes
123
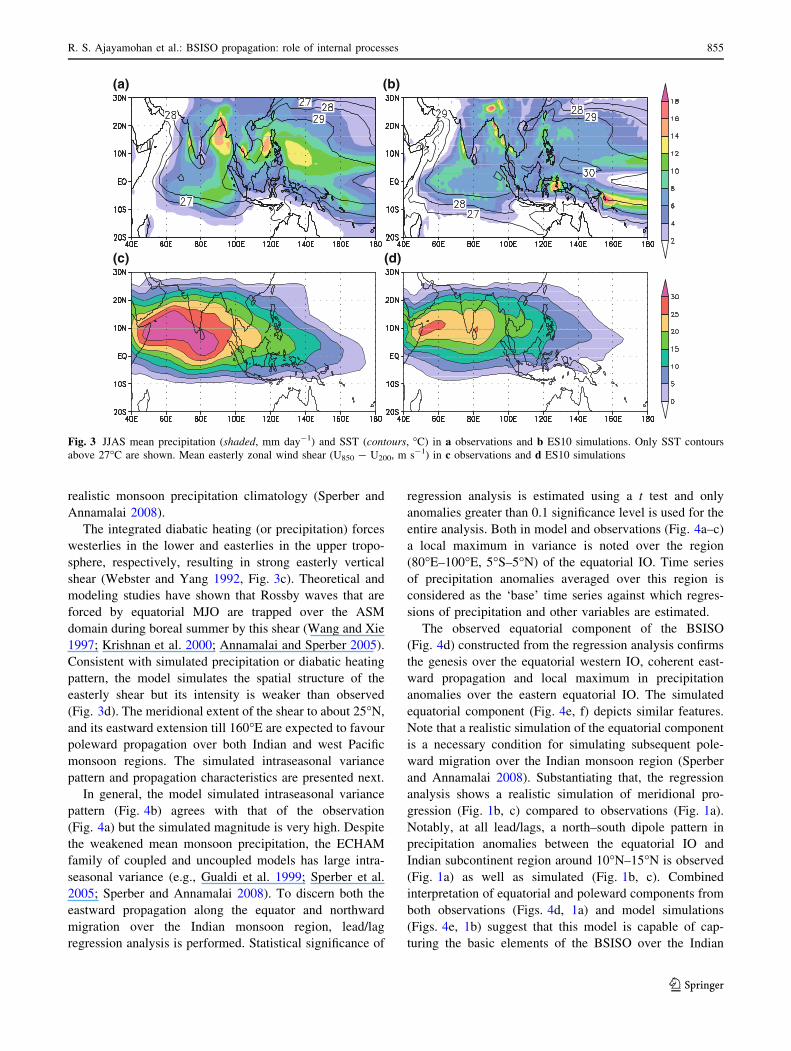
realistic monsoon precipitation climatology (Sperber and
Annamalai 2008).
The integrated diabatic heating (or precipitation) forces
westerlies in the lower and easterlies in the upper tropo-
sphere, respectively, resulting in strong easterly vertical
shear (Webster and Yang 1992, Fig. 3c). Theoretical and
modeling studies have shown that Rossby waves that are
forced by equatorial MJO are trapped over the ASM
domain during boreal summer by this shear (Wang and Xie
1997; Krishnan et al. 2000; Annamalai and Sperber 2005).
Consistent with simulated precipitation or diabatic heating
pattern, the model simulates the spatial structure of the
easterly shear but its intensity is weaker than observed
(Fig. 3d). The meridional extent of the shear to about 25�N,
and its eastward extension till 160�E are expected to favour
poleward propagation over both Indian and west Pacific
monsoon regions. The simulated intraseasonal variance
pattern and propagation characteristics are presented next.
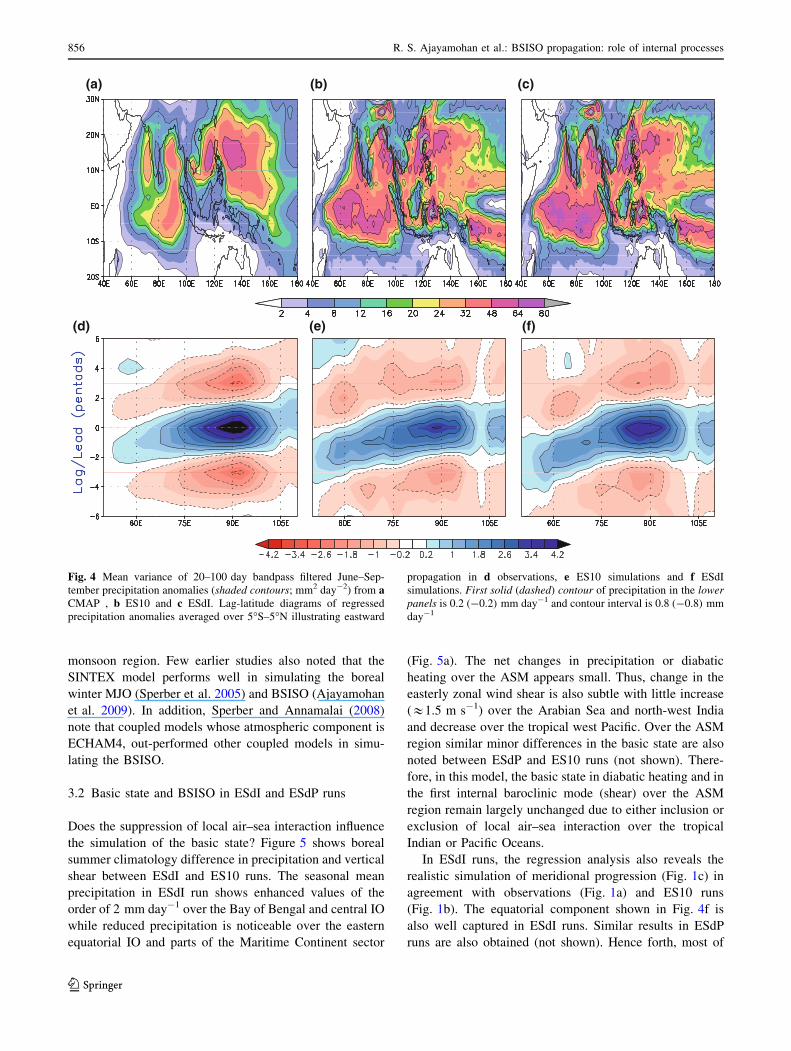
In general, the model simulated intraseasonal variance
pattern (Fig. 4b) agrees with that of the observation
(Fig. 4a) but the simulated magnitude is very high. Despite
the weakened mean monsoon precipitation, the ECHAM
family of coupled and uncoupled models has large intra-
seasonal variance (e.g., Gualdi et al. 1999; Sperber et al.
2005; Sperber and Annamalai 2008). To discern both the
eastward propagation along the equator and northward
migration over the Indian monsoon region, lead/lag
regression analysis is performed. Statistical significance of
regression analysis is estimated using a t test and only
anomalies greater than 0.1 significance level is used for the
entire analysis. Both in model and observations (Fig. 4a–c)
a local maximum in variance is noted over the region
(80�E–100�E, 5�S–5�N) of the equatorial IO. Time series
of precipitation anomalies averaged over this region is
considered as the ‘base’ time series against which regres-
sions of precipitation and other variables are estimated.
The observed equatorial component of the BSISO
(Fig. 4d) constructed from the regression analysis confirms
the genesis over the equatorial western IO, coherent east-
ward propagation and local maximum in precipitation
anomalies over the eastern equatorial IO. The simulated
equatorial component (Fig. 4e, f) depicts similar features.
Note that a realistic simulation of the equatorial component
is a necessary condition for simulating subsequent pole-
ward migration over the Indian monsoon region (Sperber
and Annamalai 2008). Substantiating that, the regression
analysis shows a realistic simulation of meridional pro-
gression (Fig. 1b, c) compared to observations (Fig. 1a).
Notably, at all lead/lags, a north–south dipole pattern in
precipitation anomalies between the equatorial IO and
Indian subcontinent region around 10�N–15�N is observed
(Fig. 1a) as well as simulated (Fig. 1b, c). Combined
interpretation of equatorial and poleward components from
both observations (Figs. 4d, 1a) and model simulations
(Figs. 4e, 1b) suggest that this model is capable of cap-
turing the basic elements of the BSISO over the Indian
(a) (b)
(d)(c)
Fig. 3 JJAS mean precipitation (shaded, mm day-1) and SST (contours, �C) in a observations and b ES10 simulations. Only SST contours
above 27�C are shown. Mean easterly zonal wind shear (U850 - U200, m s-1) in c observations and d ES10 simulations
R. S. Ajayamohan et al.: BSISO propagation: role of internal processes 855
123
monsoon region. Few earlier studies also noted that the
SINTEX model performs well in simulating the boreal
winter MJO (Sperber et al. 2005) and BSISO (Ajayamohan
et al. 2009). In addition, Sperber and Annamalai (2008)
note that coupled models whose atmospheric component is
ECHAM4, out-performed other coupled models in simu-
lating the BSISO.
3.2 Basic state and BSISO in ESdI and ESdP runs
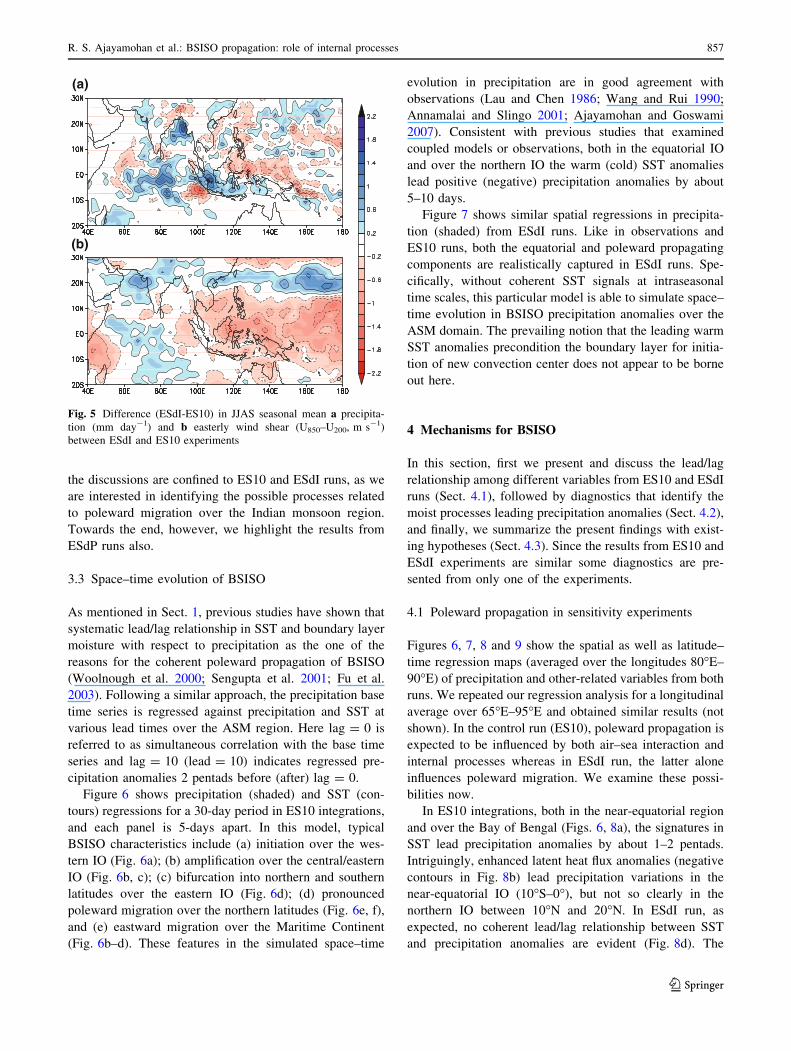
Does the suppression of local air–sea interaction influence
the simulation of the basic state? Figure 5 shows boreal
summer climatology difference in precipitation and vertical
shear between ESdI and ES10 runs. The seasonal mean
precipitation in ESdI run shows enhanced values of the
order of 2 mm day-1 over the Bay of Bengal and central IO
while reduced precipitation is noticeable over the eastern
equatorial IO and parts of the Maritime Continent sector
(Fig. 5a). The net changes in precipitation or diabatic
heating over the ASM appears small. Thus, change in the
easterly zonal wind shear is also subtle with little increase
(&1.5 m s-1) over the Arabian Sea and north-west India
and decrease over the tropical west Pacific. Over the ASM
region similar minor differences in the basic state are also
noted between ESdP and ES10 runs (not shown). There-
fore, in this model, the basic state in diabatic heating and in
the first internal baroclinic mode (shear) over the ASM
region remain largely unchanged due to either inclusion or
exclusion of local air–sea interaction over the tropical
Indian or Pacific Oceans.
In ESdI runs, the regression analysis also reveals the
realistic simulation of meridional progression (Fig. 1c) in
agreement with observations (Fig. 1a) and ES10 runs
(Fig. 1b). The equatorial component shown in Fig. 4f is
also well captured in ESdI runs. Similar results in ESdP
runs are also obtained (not shown). Hence forth, most of
(a) (b) (c)
(f)(e)(d)
Fig. 4 Mean variance of 20–100 day bandpass filtered June–Sep-
tember precipitation anomalies (shaded contours; mm2 day-2) from aCMAP , b ES10 and c ESdI. Lag-latitude diagrams of regressed
precipitation anomalies averaged over 5�S–5�N illustrating eastward
propagation in d observations, e ES10 simulations and f ESdI
simulations. First solid (dashed) contour of precipitation in the lowerpanels is 0.2 (-0.2) mm day-1 and contour interval is 0.8 (-0.8) mm
day-1
856 R. S. Ajayamohan et al.: BSISO propagation: role of internal processes
123
the discussions are confined to ES10 and ESdI runs, as we
are interested in identifying the possible processes related
to poleward migration over the Indian monsoon region.
Towards the end, however, we highlight the results from
ESdP runs also.
3.3 Space–time evolution of BSISO
As mentioned in Sect. 1, previous studies have shown that
systematic lead/lag relationship in SST and boundary layer
moisture with respect to precipitation as the one of the
reasons for the coherent poleward propagation of BSISO
(Woolnough et al. 2000; Sengupta et al. 2001; Fu et al.
2003). Following a similar approach, the precipitation base
time series is regressed against precipitation and SST at
various lead times over the ASM region. Here lag = 0 is
referred to as simultaneous correlation with the base time
series and lag = 10 (lead = 10) indicates regressed pre-
cipitation anomalies 2 pentads before (after) lag = 0.
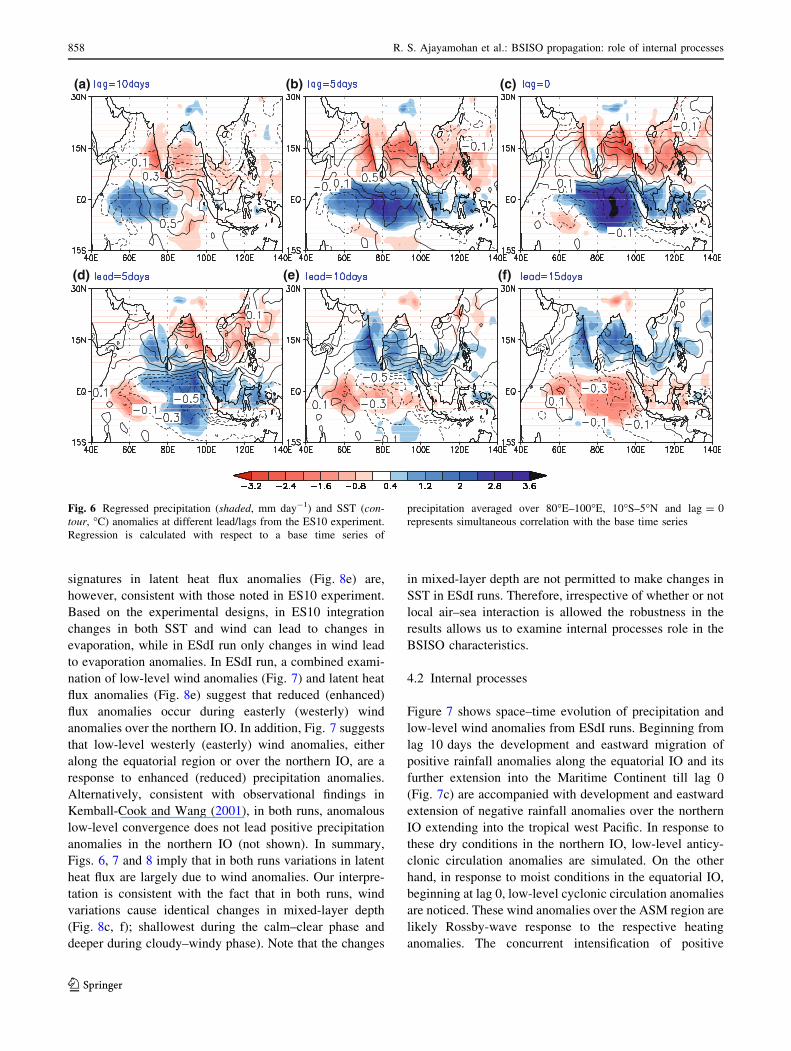
Figure 6 shows precipitation (shaded) and SST (con-
tours) regressions for a 30-day period in ES10 integrations,
and each panel is 5-days apart. In this model, typical
BSISO characteristics include (a) initiation over the wes-
tern IO (Fig. 6a); (b) amplification over the central/eastern
IO (Fig. 6b, c); (c) bifurcation into northern and southern
latitudes over the eastern IO (Fig. 6d); (d) pronounced
poleward migration over the northern latitudes (Fig. 6e, f),
and (e) eastward migration over the Maritime Continent
(Fig. 6b–d). These features in the simulated space–time
evolution in precipitation are in good agreement with
observations (Lau and Chen 1986; Wang and Rui 1990;
Annamalai and Slingo 2001; Ajayamohan and Goswami
2007). Consistent with previous studies that examined
coupled models or observations, both in the equatorial IO
and over the northern IO the warm (cold) SST anomalies
lead positive (negative) precipitation anomalies by about
5–10 days.
Figure 7 shows similar spatial regressions in precipita-
tion (shaded) from ESdI runs. Like in observations and
ES10 runs, both the equatorial and poleward propagating
components are realistically captured in ESdI runs. Spe-
cifically, without coherent SST signals at intraseasonal
time scales, this particular model is able to simulate space–
time evolution in BSISO precipitation anomalies over the
ASM domain. The prevailing notion that the leading warm
SST anomalies precondition the boundary layer for initia-
tion of new convection center does not appear to be borne
out here.
4 Mechanisms for BSISO
In this section, first we present and discuss the lead/lag
relationship among different variables from ES10 and ESdI
runs (Sect. 4.1), followed by diagnostics that identify the
moist processes leading precipitation anomalies (Sect. 4.2),
and finally, we summarize the present findings with exist-
ing hypotheses (Sect. 4.3). Since the results from ES10 and
ESdI experiments are similar some diagnostics are pre-
sented from only one of the experiments.
4.1 Poleward propagation in sensitivity experiments
Figures 6, 7, 8 and 9 show the spatial as well as latitude–
time regression maps (averaged over the longitudes 80�E–
90�E) of precipitation and other-related variables from both
runs. We repeated our regression analysis for a longitudinal
average over 65�E–95�E and obtained similar results (not
shown). In the control run (ES10), poleward propagation is
expected to be influenced by both air–sea interaction and
internal processes whereas in ESdI run, the latter alone
influences poleward migration. We examine these possi-
bilities now.
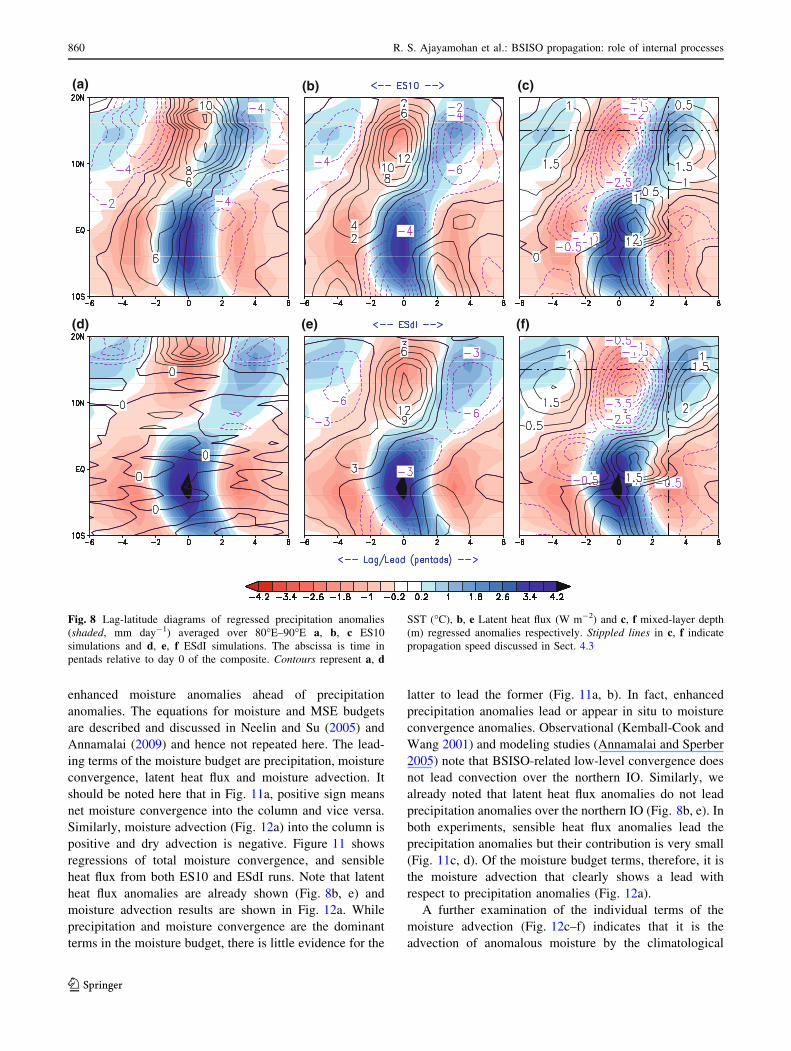
In ES10 integrations, both in the near-equatorial region
and over the Bay of Bengal (Figs. 6, 8a), the signatures in
SST lead precipitation anomalies by about 1–2 pentads.
Intriguingly, enhanced latent heat flux anomalies (negative
contours in Fig. 8b) lead precipitation variations in the
near-equatorial IO (10�S–0�), but not so clearly in the
northern IO between 10�N and 20�N. In ESdI run, as
expected, no coherent lead/lag relationship between SST
and precipitation anomalies are evident (Fig. 8d). The
(a)
(b)
Fig. 5 Difference (ESdI-ES10) in JJAS seasonal mean a precipita-
tion (mm day-1) and b easterly wind shear (U850–U200, m s-1)
between ESdI and ES10 experiments
R. S. Ajayamohan et al.: BSISO propagation: role of internal processes 857
123
signatures in latent heat flux anomalies (Fig. 8e) are,
however, consistent with those noted in ES10 experiment.
Based on the experimental designs, in ES10 integration
changes in both SST and wind can lead to changes in
evaporation, while in ESdI run only changes in wind lead
to evaporation anomalies. In ESdI run, a combined exami-
nation of low-level wind anomalies (Fig. 7) and latent heat
flux anomalies (Fig. 8e) suggest that reduced (enhanced)
flux anomalies occur during easterly (westerly) wind
anomalies over the northern IO. In addition, Fig. 7 suggests
that low-level westerly (easterly) wind anomalies, either
along the equatorial region or over the northern IO, are a
response to enhanced (reduced) precipitation anomalies.
Alternatively, consistent with observational findings in
Kemball-Cook and Wang (2001), in both runs, anomalous
low-level convergence does not lead positive precipitation
anomalies in the northern IO (not shown). In summary,
Figs. 6, 7 and 8 imply that in both runs variations in latent
heat flux are largely due to wind anomalies. Our interpre-
tation is consistent with the fact that in both runs, wind
variations cause identical changes in mixed-layer depth
(Fig. 8c, f); shallowest during the calm–clear phase and
deeper during cloudy–windy phase). Note that the changes
in mixed-layer depth are not permitted to make changes in
SST in ESdI runs. Therefore, irrespective of whether or not
local air–sea interaction is allowed the robustness in the
results allows us to examine internal processes role in the
BSISO characteristics.
4.2 Internal processes
Figure 7 shows space–time evolution of precipitation and
low-level wind anomalies from ESdI runs. Beginning from
lag 10 days the development and eastward migration of
positive rainfall anomalies along the equatorial IO and its
further extension into the Maritime Continent till lag 0
(Fig. 7c) are accompanied with development and eastward
extension of negative rainfall anomalies over the northern
IO extending into the tropical west Pacific. In response to
these dry conditions in the northern IO, low-level anticy-
clonic circulation anomalies are simulated. On the other
hand, in response to moist conditions in the equatorial IO,
beginning at lag 0, low-level cyclonic circulation anomalies
are noticed. These wind anomalies over the ASM region are
likely Rossby-wave response to the respective heating
anomalies. The concurrent intensification of positive
(a) (b) (c)
(f)(e)(d)
Fig. 6 Regressed precipitation (shaded, mm day-1) and SST (con-tour, �C) anomalies at different lead/lags from the ES10 experiment.
Regression is calculated with respect to a base time series of
precipitation averaged over 80�E–100�E, 10�S–5�N and lag = 0
represents simultaneous correlation with the base time series
858 R. S. Ajayamohan et al.: BSISO propagation: role of internal processes
123
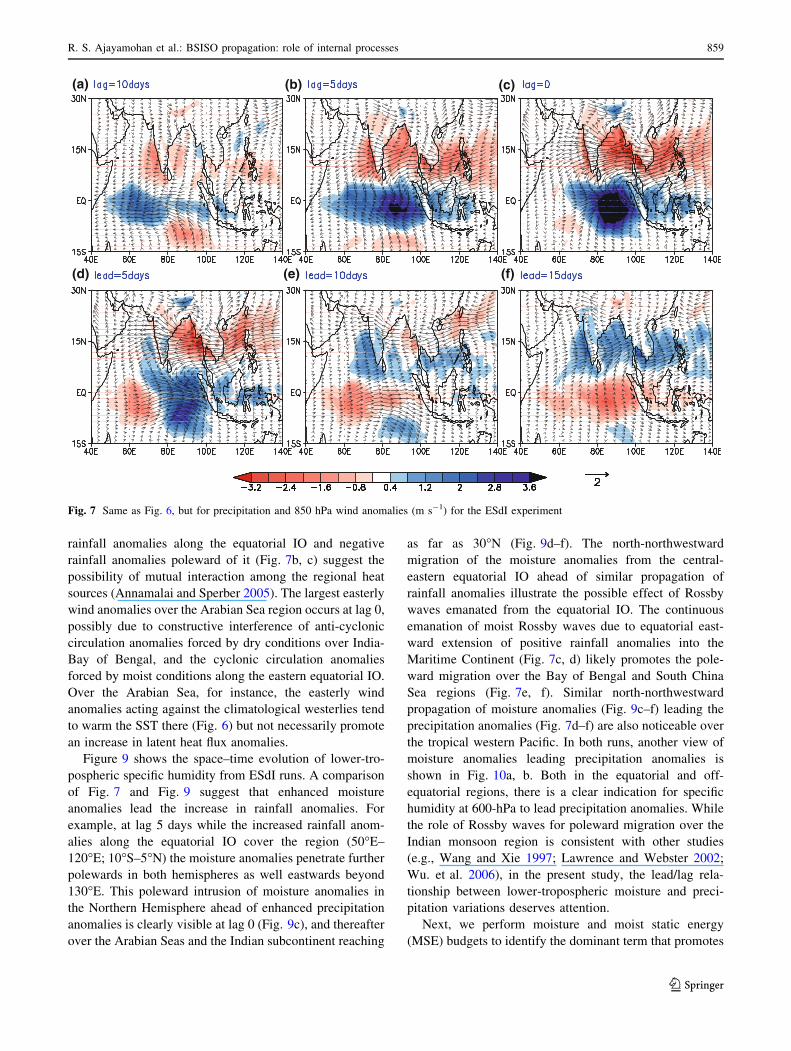
rainfall anomalies along the equatorial IO and negative
rainfall anomalies poleward of it (Fig. 7b, c) suggest the
possibility of mutual interaction among the regional heat
sources (Annamalai and Sperber 2005). The largest easterly
wind anomalies over the Arabian Sea region occurs at lag 0,
possibly due to constructive interference of anti-cyclonic
circulation anomalies forced by dry conditions over India-
Bay of Bengal, and the cyclonic circulation anomalies
forced by moist conditions along the eastern equatorial IO.
Over the Arabian Sea, for instance, the easterly wind
anomalies acting against the climatological westerlies tend
to warm the SST there (Fig. 6) but not necessarily promote
an increase in latent heat flux anomalies.
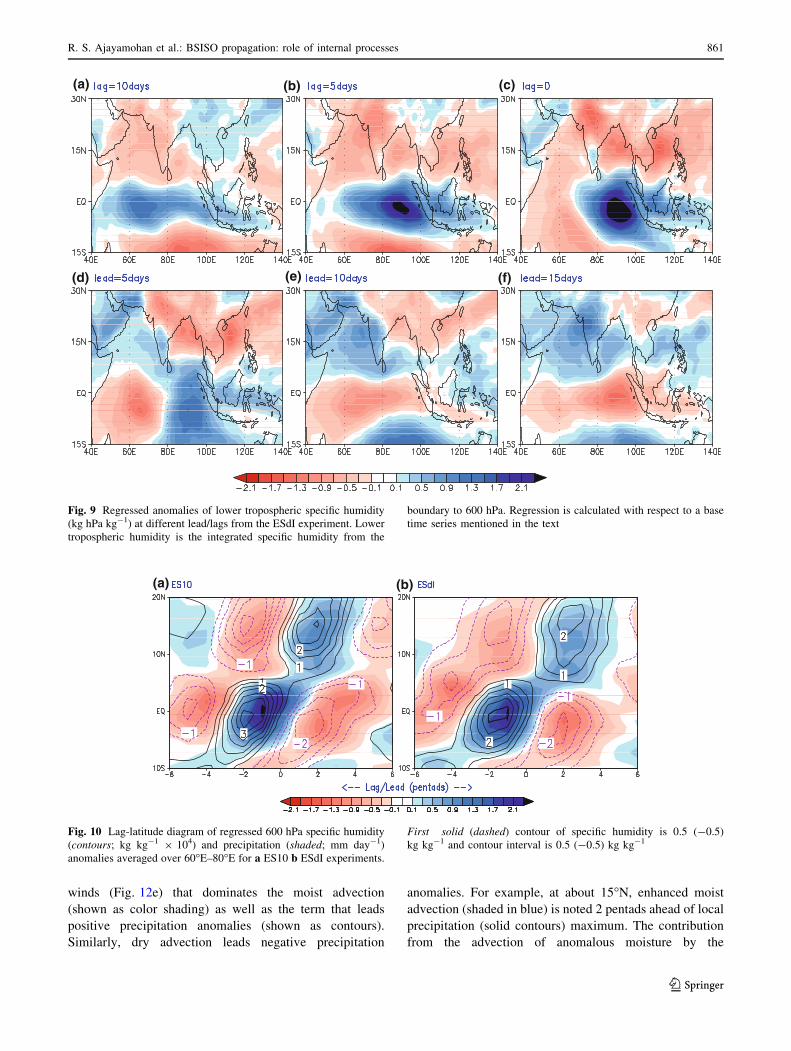
Figure 9 shows the space–time evolution of lower-tro-
pospheric specific humidity from ESdI runs. A comparison
of Fig. 7 and Fig. 9 suggest that enhanced moisture
anomalies lead the increase in rainfall anomalies. For
example, at lag 5 days while the increased rainfall anom-
alies along the equatorial IO cover the region (50�E–
120�E; 10�S–5�N) the moisture anomalies penetrate further
polewards in both hemispheres as well eastwards beyond
130�E. This poleward intrusion of moisture anomalies in
the Northern Hemisphere ahead of enhanced precipitation
anomalies is clearly visible at lag 0 (Fig. 9c), and thereafter
over the Arabian Seas and the Indian subcontinent reaching
as far as 30�N (Fig. 9d–f). The north-northwestward
migration of the moisture anomalies from the central-
eastern equatorial IO ahead of similar propagation of
rainfall anomalies illustrate the possible effect of Rossby
waves emanated from the equatorial IO. The continuous
emanation of moist Rossby waves due to equatorial east-
ward extension of positive rainfall anomalies into the
Maritime Continent (Fig. 7c, d) likely promotes the pole-
ward migration over the Bay of Bengal and South China
Sea regions (Fig. 7e, f). Similar north-northwestward
propagation of moisture anomalies (Fig. 9c–f) leading the
precipitation anomalies (Fig. 7d–f) are also noticeable over
the tropical western Pacific. In both runs, another view of
moisture anomalies leading precipitation anomalies is
shown in Fig. 10a, b. Both in the equatorial and off-
equatorial regions, there is a clear indication for specific
humidity at 600-hPa to lead precipitation anomalies. While
the role of Rossby waves for poleward migration over the
Indian monsoon region is consistent with other studies
(e.g., Wang and Xie 1997; Lawrence and Webster 2002;
Wu. et al. 2006), in the present study, the lead/lag rela-
tionship between lower-tropospheric moisture and preci-
pitation variations deserves attention.
Next, we perform moisture and moist static energy
(MSE) budgets to identify the dominant term that promotes
(a) (b) (c)
(f)(e)(d)
Fig. 7 Same as Fig. 6, but for precipitation and 850 hPa wind anomalies (m s-1) for the ESdI experiment
R. S. Ajayamohan et al.: BSISO propagation: role of internal processes 859
123
enhanced moisture anomalies ahead of precipitation
anomalies. The equations for moisture and MSE budgets
are described and discussed in Neelin and Su (2005) and
Annamalai (2009) and hence not repeated here. The lead-
ing terms of the moisture budget are precipitation, moisture
convergence, latent heat flux and moisture advection. It
should be noted here that in Fig. 11a, positive sign means
net moisture convergence into the column and vice versa.
Similarly, moisture advection (Fig. 12a) into the column is
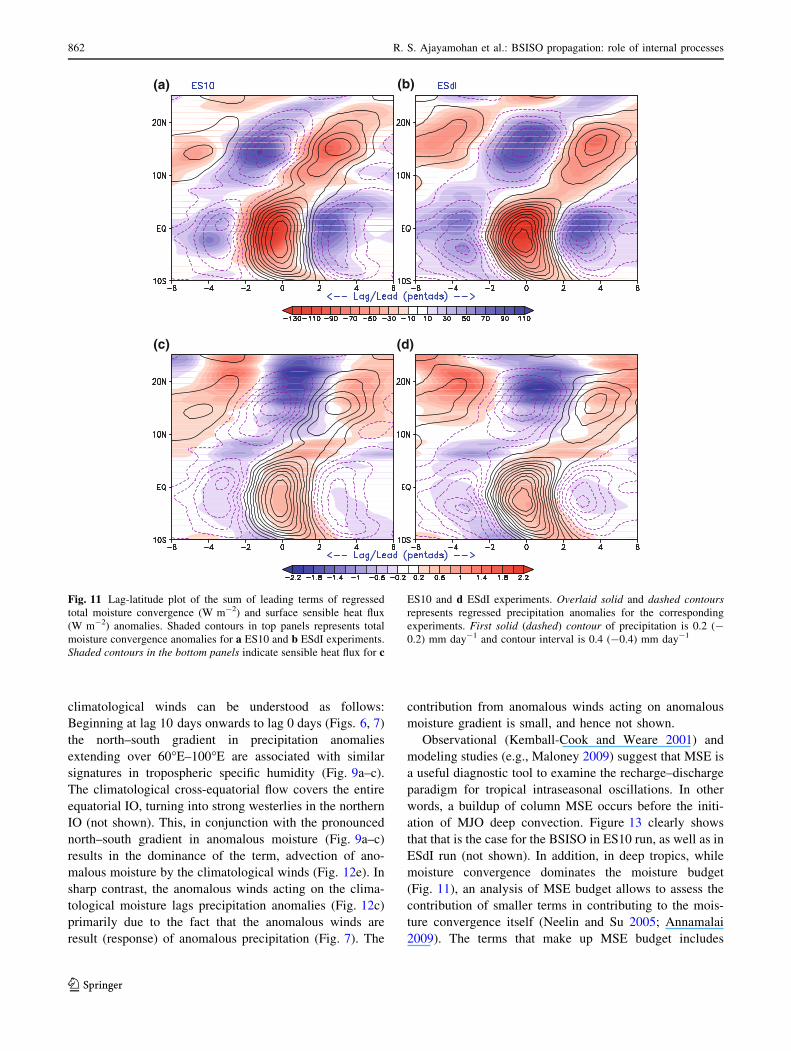
positive and dry advection is negative. Figure 11 shows
regressions of total moisture convergence, and sensible
heat flux from both ES10 and ESdI runs. Note that latent
heat flux anomalies are already shown (Fig. 8b, e) and
moisture advection results are shown in Fig. 12a. While
precipitation and moisture convergence are the dominant
terms in the moisture budget, there is little evidence for the
latter to lead the former (Fig. 11a, b). In fact, enhanced
precipitation anomalies lead or appear in situ to moisture
convergence anomalies. Observational (Kemball-Cook and
Wang 2001) and modeling studies (Annamalai and Sperber
2005) note that BSISO-related low-level convergence does
not lead convection over the northern IO. Similarly, we
already noted that latent heat flux anomalies do not lead
precipitation anomalies over the northern IO (Fig. 8b, e). In
both experiments, sensible heat flux anomalies lead the
precipitation anomalies but their contribution is very small
(Fig. 11c, d). Of the moisture budget terms, therefore, it is
the moisture advection that clearly shows a lead with
respect to precipitation anomalies (Fig. 12a).
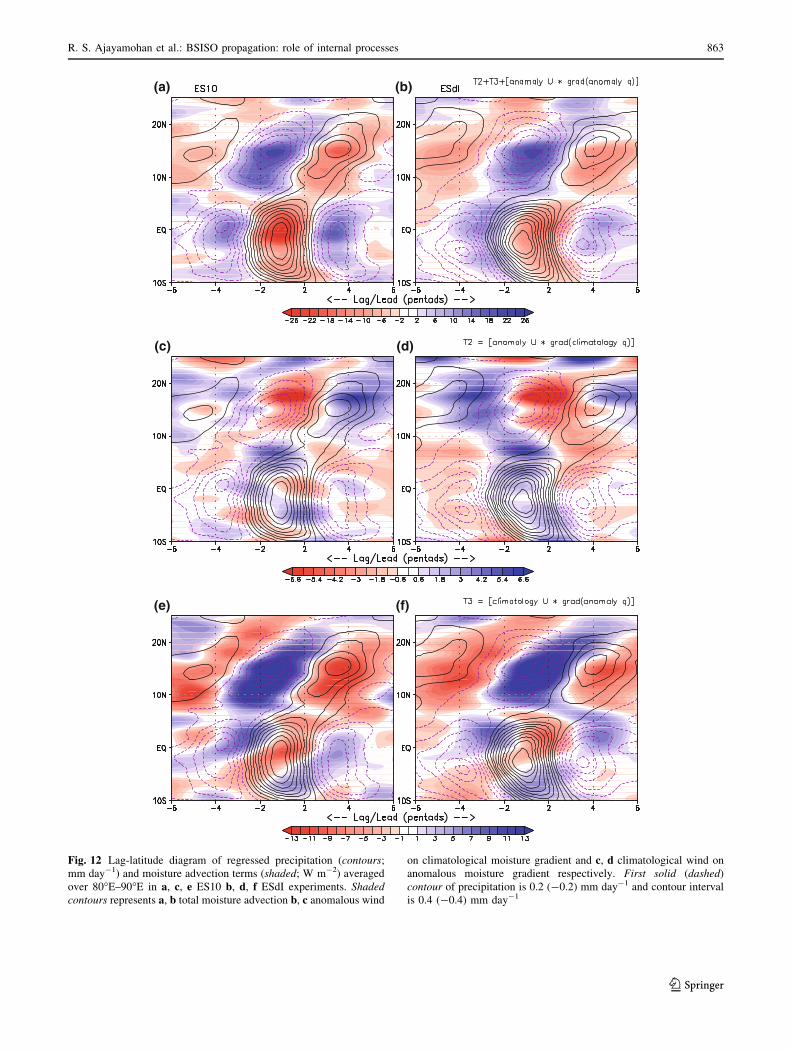
A further examination of the individual terms of the
moisture advection (Fig. 12c–f) indicates that it is the
advection of anomalous moisture by the climatological
(a) (b) (c)
(f)(e)(d)
Fig. 8 Lag-latitude diagrams of regressed precipitation anomalies
(shaded, mm day-1) averaged over 80�E–90�E a, b, c ES10
simulations and d, e, f ESdI simulations. The abscissa is time in
pentads relative to day 0 of the composite. Contours represent a, d
SST (�C), b, e Latent heat flux (W m-2) and c, f mixed-layer depth
(m) regressed anomalies respectively. Stippled lines in c, f indicate
propagation speed discussed in Sect. 4.3
860 R. S. Ajayamohan et al.: BSISO propagation: role of internal processes
123
winds (Fig. 12e) that dominates the moist advection
(shown as color shading) as well as the term that leads
positive precipitation anomalies (shown as contours).
Similarly, dry advection leads negative precipitation
anomalies. For example, at about 15�N, enhanced moist
advection (shaded in blue) is noted 2 pentads ahead of local
precipitation (solid contours) maximum. The contribution
from the advection of anomalous moisture by the
(a) (b) (c)
(f)(d) (e)
Fig. 9 Regressed anomalies of lower tropospheric specific humidity
(kg hPa kg-1) at different lead/lags from the ESdI experiment. Lower
tropospheric humidity is the integrated specific humidity from the
boundary to 600 hPa. Regression is calculated with respect to a base
time series mentioned in the text
(a) (b)
Fig. 10 Lag-latitude diagram of regressed 600 hPa specific humidity
(contours; kg kg-1 9 104) and precipitation (shaded; mm day-1)
anomalies averaged over 60�E–80�E for a ES10 b ESdI experiments.
First solid (dashed) contour of specific humidity is 0.5 (-0.5)
kg kg-1 and contour interval is 0.5 (-0.5) kg kg-1
R. S. Ajayamohan et al.: BSISO propagation: role of internal processes 861
123
climatological winds can be understood as follows:
Beginning at lag 10 days onwards to lag 0 days (Figs. 6, 7)
the north–south gradient in precipitation anomalies
extending over 60�E–100�E are associated with similar
signatures in tropospheric specific humidity (Fig. 9a–c).
The climatological cross-equatorial flow covers the entire
equatorial IO, turning into strong westerlies in the northern
IO (not shown). This, in conjunction with the pronounced
north–south gradient in anomalous moisture (Fig. 9a–c)
results in the dominance of the term, advection of ano-
malous moisture by the climatological winds (Fig. 12e). In
sharp contrast, the anomalous winds acting on the clima-
tological moisture lags precipitation anomalies (Fig. 12c)
primarily due to the fact that the anomalous winds are
result (response) of anomalous precipitation (Fig. 7). The
contribution from anomalous winds acting on anomalous
moisture gradient is small, and hence not shown.
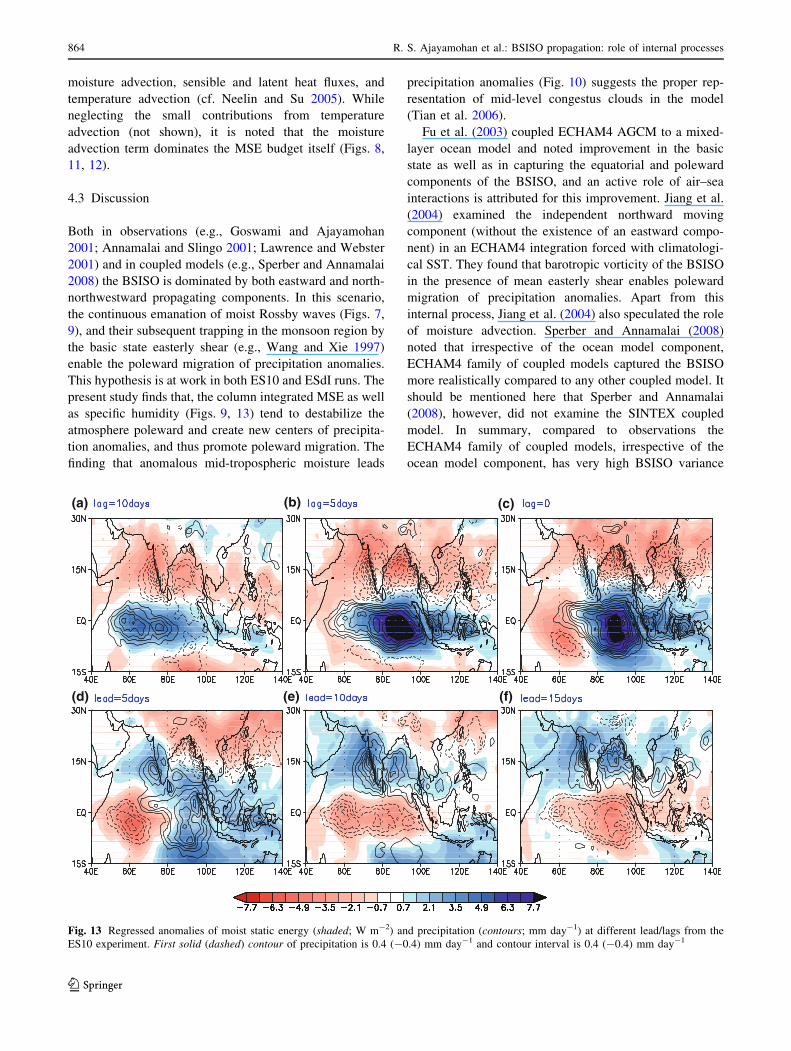
Observational (Kemball-Cook and Weare 2001) and
modeling studies (e.g., Maloney 2009) suggest that MSE is
a useful diagnostic tool to examine the recharge–discharge
paradigm for tropical intraseasonal oscillations. In other
words, a buildup of column MSE occurs before the initi-
ation of MJO deep convection. Figure 13 clearly shows
that that is the case for the BSISO in ES10 run, as well as in
ESdI run (not shown). In addition, in deep tropics, while
moisture convergence dominates the moisture budget
(Fig. 11), an analysis of MSE budget allows to assess the
contribution of smaller terms in contributing to the mois-
ture convergence itself (Neelin and Su 2005; Annamalai
2009). The terms that make up MSE budget includes
(a) (b)
(c) (d)
Fig. 11 Lag-latitude plot of the sum of leading terms of regressed
total moisture convergence (W m-2) and surface sensible heat flux
(W m-2) anomalies. Shaded contours in top panels represents total
moisture convergence anomalies for a ES10 and b ESdI experiments.
Shaded contours in the bottom panels indicate sensible heat flux for c
ES10 and d ESdI experiments. Overlaid solid and dashed contoursrepresents regressed precipitation anomalies for the corresponding
experiments. First solid (dashed) contour of precipitation is 0.2 (-
0.2) mm day-1 and contour interval is 0.4 (-0.4) mm day-1
862 R. S. Ajayamohan et al.: BSISO propagation: role of internal processes
123
(a) (b)
(d)(c)
(e) (f)
Fig. 12 Lag-latitude diagram of regressed precipitation (contours;
mm day-1) and moisture advection terms (shaded; W m-2) averaged
over 80�E–90�E in a, c, e ES10 b, d, f ESdI experiments. Shadedcontours represents a, b total moisture advection b, c anomalous wind
on climatological moisture gradient and c, d climatological wind on
anomalous moisture gradient respectively. First solid (dashed)
contour of precipitation is 0.2 (-0.2) mm day-1 and contour interval
is 0.4 (-0.4) mm day-1
R. S. Ajayamohan et al.: BSISO propagation: role of internal processes 863
123
moisture advection, sensible and latent heat fluxes, and
temperature advection (cf. Neelin and Su 2005). While
neglecting the small contributions from temperature
advection (not shown), it is noted that the moisture
advection term dominates the MSE budget itself (Figs. 8,
11, 12).
4.3 Discussion
Both in observations (e.g., Goswami and Ajayamohan
2001; Annamalai and Slingo 2001; Lawrence and Webster
2001) and in coupled models (e.g., Sperber and Annamalai
2008) the BSISO is dominated by both eastward and north-
northwestward propagating components. In this scenario,
the continuous emanation of moist Rossby waves (Figs. 7,
9), and their subsequent trapping in the monsoon region by
the basic state easterly shear (e.g., Wang and Xie 1997)
enable the poleward migration of precipitation anomalies.
This hypothesis is at work in both ES10 and ESdI runs. The
present study finds that, the column integrated MSE as well
as specific humidity (Figs. 9, 13) tend to destabilize the
atmosphere poleward and create new centers of precipita-
tion anomalies, and thus promote poleward migration. The
finding that anomalous mid-tropospheric moisture leads
precipitation anomalies (Fig. 10) suggests the proper rep-
resentation of mid-level congestus clouds in the model
(Tian et al. 2006).
Fu et al. (2003) coupled ECHAM4 AGCM to a mixed-
layer ocean model and noted improvement in the basic
state as well as in capturing the equatorial and poleward
components of the BSISO, and an active role of air–sea
interactions is attributed for this improvement. Jiang et al.
(2004) examined the independent northward moving
component (without the existence of an eastward compo-
nent) in an ECHAM4 integration forced with climatologi-
cal SST. They found that barotropic vorticity of the BSISO
in the presence of mean easterly shear enables poleward
migration of precipitation anomalies. Apart from this
internal process, Jiang et al. (2004) also speculated the role
of moisture advection. Sperber and Annamalai (2008)
noted that irrespective of the ocean model component,
ECHAM4 family of coupled models captured the BSISO
more realistically compared to any other coupled model. It
should be mentioned here that Sperber and Annamalai
(2008), however, did not examine the SINTEX coupled
model. In summary, compared to observations the
ECHAM4 family of coupled models, irrespective of the
ocean model component, has very high BSISO variance
(a) (b) (c)
(f)(e)(d)
Fig. 13 Regressed anomalies of moist static energy (shaded; W m-2) and precipitation (contours; mm day-1) at different lead/lags from the
ES10 experiment. First solid (dashed) contour of precipitation is 0.4 (-0.4) mm day-1 and contour interval is 0.4 (-0.4) mm day-1
864 R. S. Ajayamohan et al.: BSISO propagation: role of internal processes
123
over the ASM region (e.g., Fig. 4). Thus, the model
internal variability at intraseasonal time scales dominates.
The comparable variance in precipitation and other asso-
ciated variables (Figs. 6, 7, 8, 9) in both ES10 and ESdI
simulations further indicate that the propagating compo-
nent of the BSISO is not necessarily sensitive to local
air–sea interaction. Only notable difference in BSISO
characteristics between ES10 and ESdI integrations is that
the rate of poleward migration of precipitation anomalies is
faster by about &1 pentad in the latter (see stippled lines in
Fig. 8).
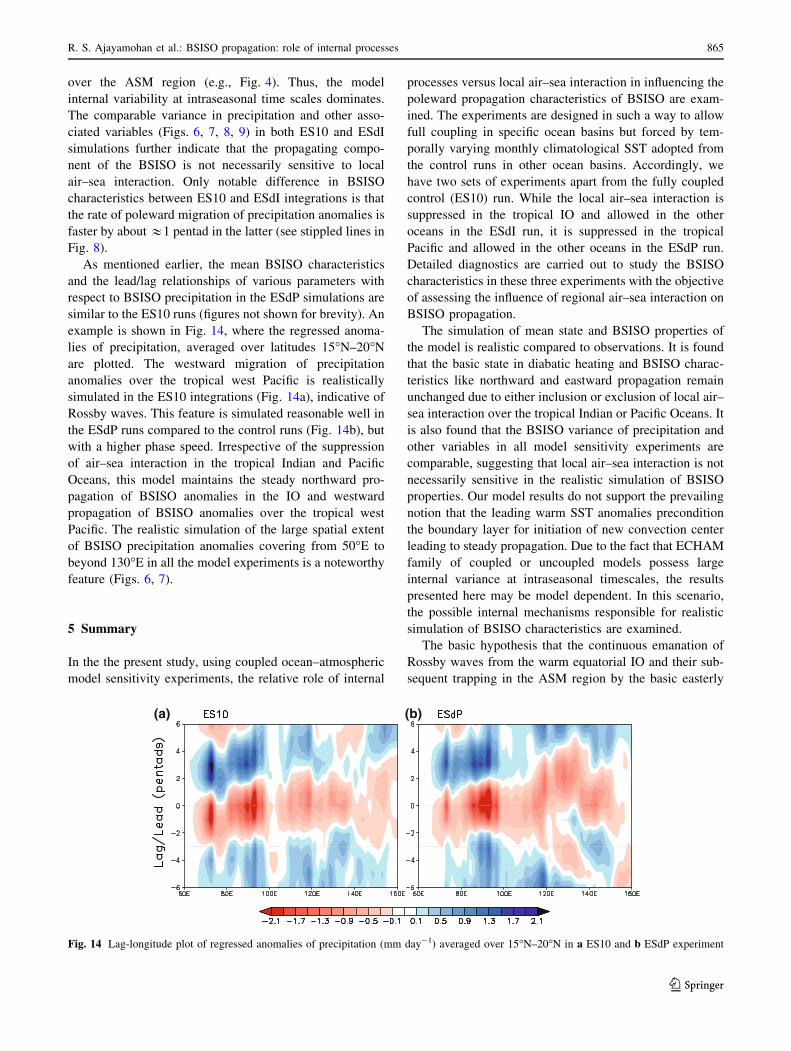
As mentioned earlier, the mean BSISO characteristics
and the lead/lag relationships of various parameters with
respect to BSISO precipitation in the ESdP simulations are
similar to the ES10 runs (figures not shown for brevity). An
example is shown in Fig. 14, where the regressed anoma-
lies of precipitation, averaged over latitudes 15�N–20�N
are plotted. The westward migration of precipitation
anomalies over the tropical west Pacific is realistically
simulated in the ES10 integrations (Fig. 14a), indicative of
Rossby waves. This feature is simulated reasonable well in
the ESdP runs compared to the control runs (Fig. 14b), but
with a higher phase speed. Irrespective of the suppression
of air–sea interaction in the tropical Indian and Pacific
Oceans, this model maintains the steady northward pro-
pagation of BSISO anomalies in the IO and westward
propagation of BSISO anomalies over the tropical west
Pacific. The realistic simulation of the large spatial extent
of BSISO precipitation anomalies covering from 50�E to
beyond 130�E in all the model experiments is a noteworthy
feature (Figs. 6, 7).
5 Summary
In the the present study, using coupled ocean–atmospheric
model sensitivity experiments, the relative role of internal
processes versus local air–sea interaction in influencing the
poleward propagation characteristics of BSISO are exam-
ined. The experiments are designed in such a way to allow
full coupling in specific ocean basins but forced by tem-
porally varying monthly climatological SST adopted from
the control runs in other ocean basins. Accordingly, we
have two sets of experiments apart from the fully coupled
control (ES10) run. While the local air–sea interaction is
suppressed in the tropical IO and allowed in the other
oceans in the ESdI run, it is suppressed in the tropical
Pacific and allowed in the other oceans in the ESdP run.
Detailed diagnostics are carried out to study the BSISO
characteristics in these three experiments with the objective
of assessing the influence of regional air–sea interaction on
BSISO propagation.
The simulation of mean state and BSISO properties of
the model is realistic compared to observations. It is found
that the basic state in diabatic heating and BSISO charac-
teristics like northward and eastward propagation remain
unchanged due to either inclusion or exclusion of local air–
sea interaction over the tropical Indian or Pacific Oceans. It
is also found that the BSISO variance of precipitation and
other variables in all model sensitivity experiments are
comparable, suggesting that local air–sea interaction is not
necessarily sensitive in the realistic simulation of BSISO
properties. Our model results do not support the prevailing
notion that the leading warm SST anomalies precondition
the boundary layer for initiation of new convection center
leading to steady propagation. Due to the fact that ECHAM
family of coupled or uncoupled models possess large
internal variance at intraseasonal timescales, the results
presented here may be model dependent. In this scenario,
the possible internal mechanisms responsible for realistic
simulation of BSISO characteristics are examined.
The basic hypothesis that the continuous emanation of
Rossby waves from the warm equatorial IO and their sub-
sequent trapping in the ASM region by the basic easterly
(b)(a)
Fig. 14 Lag-longitude plot of regressed anomalies of precipitation (mm day-1) averaged over 15�N–20�N in a ES10 and b ESdP experiment
R. S. Ajayamohan et al.: BSISO propagation: role of internal processes 865
123
wind shear enabling the poleward propagation of BSISO
anomalies is working well in all the model sensitivity
experiments. It is found that mid-tropospheric moisture and
MSE anomalies lead precipitation anomalies in the ESdI
run like the ES10 runs, thereby destabilizing the atmosphere
poleward to create new centers of convection. By analyzing
the MSE budget, it is further shown that the moisture
advection of anomalous moisture gradient by climatological
winds plays a dominant role in BSISO propagation.
The results presented here confirm earlier suggestions
that a realistic basic state, in particular the zonal and
meridional extent of the vertical easterly shear (e.g., Wang
and Xie 1997), and a proper representation of the equato-
rial component with sufficient intensity to force equatorial
Rossby waves (e.g., Sperber and Annamalai 2008) are
basic ingredients that models need to possess for a rea-
sonable representation of the BSISO. In the present study,
the identification of the role of climatological winds
advecting anomalous moisture gradient in the life-cycle of
the BSISO further emphasizes the need for realistic simu-
lation of the basic elements.
Acknowledgements RSA is supported by the Global Atmosphere–
Ocean Prediction and Predictability research network, funded by the
Canadian Foundation for Climate and Atmospheric Sciences.
H. Annamalai is supported by the IPRC through its institutional grants
from NOAA, NASA and JAMSTEC.
References
Ajayamohan RS, Goswami BN (2007) Dependence of simulation of
boreal summer tropical intraseasonal oscillations on the simu-
lation of seasonal mean. J Atmos Sci 64:460–478. doi:
10.1175/JAS3844.1
Ajayamohan RS, Rao SA, Luo JJ, Yamagata T (2009) Influence of
Indian Ocean dipole on boreal summer intraseasonal oscillations
in a coupled general circulation model. J Geophys Res
114:D06119. doi:10.1029/2008JD011096
Annamalai H (2009) Moist dynamical linkage between the equatorial
Indian Ocean and the south Asian monsoon trough. J Atmos Sci.
doi:10.1175/2009JAS2991.1
Annamalai H, Slingo JM (2001) Active/break cycles: diagnosis of the
intraseasonal variability of the Asian summer monsoon. Clim
Dyn 18:85–102
Annamalai H, Sperber KR (2005) Regional heat sources and the
active and break phases of boreal summer intraseasonal (30–
50 day) variability. J Atmos Sci 62:2726–2748
Bhat GS, Vecchi GA, Gadgil S (2004) Sea surface temperature of the
Bay of Bengal derived from the TRMM microwave imager.
J Atmos Ocean Technol 21:1283–1290
Cherchi A, Gualdi S, Behera S, Luo JJ, Masson S, Yamagata T,
Navarra A (2007) The influence of tropical Indian Ocean SST on
the Indian summer monsoon. J Clim 20:3083–3105
Ferranti L, Slingo JM, Palmer TN, Hoskins BJ (1999) The effect of
land-surface feedbacks on monsoon circulation. Q J R Meteor
Soc 125:1527–1550
Fu X, Wang B (2004) Differences of boreal summer intraseasonal
oscillations in an atmosphere–ocean coupled model and atmo-
sphere-only model. J Clim 17:1263–1271
Fu X, Wang B, Li T, McCreary J (2003) Coupling between northward
propagating intraseasonal oscillations and sea-surface tempera-
ture in the Indian Ocean. J Atmos Sci 60(15):1733–1753
Goswami BN (2005) South Asian monsoon. In: Lau WKM, Waliser
DE (ed) Intraseasonal variability in the Atmosphere–Ocean
climate system, chap 2. Praxis Springer, Berlin, pp 19–61
Goswami BN, Ajayamohan RS (2001) Intraseasonal oscillations and
interannual variability of the Indian summer monsoon. J Clim
14:1180–1198
Goswami BN, Shukla J (1984) Quasi-periodic oscillations in a
symmetric general circulation model. J Atmos Sci 41:20–37
Gualdi S, Navarra A, Tinarelli G (1999) The interannual variability of
the MaddenJulian oscillation in an ensemble of GCM simula-
tions. Clim Dyn 15:643–658
Gualdi S, Navarra A, Guilyardi E, Delecluse P (2003) Assessment of
the tropical Indo-Pacific climate in the sintex CGCM. Ann
Geophys 46:1–26
Guilyardi E, Delecluse P, Gualdi S, Navarra A (2003) Mechanisms
for ENSO phase change in a coupled GCM. J Clim 16:1141–
1158
Jiang X, Li T, Wang B (2004) Structures and mechanisms of the
northward propagating boreal summer intraseasonal oscillation.
J Clim 17:1022–1039
Jin EK, Kinter JL, Wang B, Park CK, Kang IS, Kirtman BP, Kug JS,
Kumar A, Luo JJ, Schemm J, Shukla J, Yamagata T (2008)
Current status of ENSO prediction skill in coupled ocean–
atmosphere model. Clim Dyn. doi:10.1007/s00382-008-0397-3
Kemball-Cook SR, Wang B (2001) Equatorial waves and air–sea
interaction in the boreal summer intraseasonal oscillation. J Clim
14:2923–2942
Kemball-Cook SR, Weare BC (2001) The onset of convection in the
Madden-Julian oscillation. J Clim 14:780–793
Krishnan R, Zhang C, Sugi M (2000) Dynamics of breaks in the
Indian summer monsoon. J Atmos Sci 57:1354–1372
Lau KM, Chen PH (1986) Aspects of 30–50 day oscillation during
summer as inferred from outgoing longwave radiation. Mon Wea
Rev 114:1354–1369
Lau KM, Peng L (1990) Orgin of low-frequency (intraseasonal)
oscillations in the tropical atmosphere. Part III: monsoon
dynamics. J Atmos Sci 47:1443–1462
Lawrence DM, Webster PJ (2001) Interannual variations of the
intraseasonal oscillation in the south Asian summer monsoon
region. J Clim 14:2910–2922
Lawrence DM, Webster PJ (2002) The boreal summer intraseasonal
oscillation: relationship between northward and eastward move-
ment of convection. J Atmos Sci 59:1593–1606
Luo JJ, Masson S, Roeckner E, Madec G, Yamagata T (2005)
Reducing climatology bias in an ocean–atmosphere CGCM with
improved coupling physics. J Clim 18:2344–2360
Luo JJ, Masson S, Behera S, Yamagata T (2007) Experimental
forecasts of the Indian Ocean Dipole using a coupled OAGCM.
J Clim 20:2178–2190
Luo JJ, Masson S, Behera S, Yamagata T (2008) Extended ENSO
predictions using a fully coupled ocean–atmosphere model.
J Clim 21:84–93
Luo JJ, Zhang R, Behera S, Masumoto Y, Jin FF, Lukas R, Yamagata
T (2009) Interaction between El Nino and extreme Indian ocean
dipole. J Clim. doi:10.1175/2009JCLI3104.1
Madden RA, Julian PR (1994) Observations of the 40–50 day tropical
oscillation: a review. Mon Wea Rev 122:813–837
Madec G, Delecluse P, Imbard M, Lvy C (1998) Opa 8.1 Ocean
general circulation model reference manual. Tech. Rep. Note 11,
LODYC/IPSL, Paris, France
Maloney ED (2009) The moist static energy budget of a composite
tropical intraseasonal oscillation in a climate model. J Clim
22:711–729
866 R. S. Ajayamohan et al.: BSISO propagation: role of internal processes
123
Neelin JD, Su H (2005) Moist teleconnection mechanisms for the
tropical South America and Atlantic sector. J Clim 18:3928–
3950
Roeckner E, Arpe K, Bengtsson L, Christoph M, Claussen M, Dmenil
L, Esch M, Giorgetta M, Schlese U, Schulzweida U (1996) The
atmospheric general circulation model ECHAM-4: model
description and simulation of present-day climate. The Max
Planck Institute for Meteorology, Hamburg, Germany, report
no:218, 90 pp
Sengupta D, Goswami BN, Senan R (2001) Coherent intraseasonal
oscillations of ocean and atmosphere during the Asian summer
monsoon. Geophys Res Lett 28:4127–4130
Shinoda T, Hendon HH, Glick J (1998) Intraseasonal variability of
surface fluxes and sea surface temperature in the tropical western
Pacific and Indian Oceans. J Clim 11:2668–2685
Slingo JM, Inness PM, Sperber KR (2005) Modelling the MJO. In:
Lau WKM, Waliser DE (eds) Intraseasonal variability in the
atmosphere–ocean climate system, chap 11. Praxis Springer,
Berlin, pp 361–388
Sperber KR, Annamalai H (2008) Coupled model simulations of
boreal summer intraseasonal (3050 day) variability, part 1:
Systematic errors and caution on use of metrics. Clim Dyn
31:345–372. doi:10.1007/s00382-008-0367-9
Sperber KR, Gualdi S, Legutke S, Gayler V (2005) The Madden-
Julian oscillation in ECHAM4 coupled and uncoupled general
circulation models. Clim Dyn 25:117–140
Tian B, Waliser DE, Fetzer EJ, Lambrigtsen BH, Yung TL, Wang B
(2006) Vertical moist thermodynamical structure and spatio-
temporal evolution of the MJO in AIRS observations. J Atmos
Sci 63:2462–2485
Valcke S, Terray L, Piacentini A (2000) Oasis 2.4 ocean atmosphere
soil user’s guide. Tech. Rep. TR/CGMC/00-10, CERFACS, 42
Avenue Coriolis, 31057 Toulouse, 85 pp. http://citeseer.ist.psu.
edu/valcke00oasis.html
Vecchi GA, Harrison DE (2002) Monsoon breaks and subseasonal sea
surface temperature variability in the Bay of Bengal. J Clim
15:1485–1493
Waliser DE (2006) Intraseasonal variability. In: Wang B (ed) The
Asian monsoon, chap 5. Praxis Springer, Chichester, pp 203–258
Waliser DE, Murtugudde R, Lucas L (2004) Indo-Pacific response to
atmospheric intraseasonal variability. Part ii: boreal summer and
the intraseasonal oscillation. J Geophys Res 109:C03030. doi:
10.1029/2003JC002002
Wang B (2005) Theory. In: Lau WKM, Waliser DE (eds) Intrasea-
sonal variability in the atmosphere–ocean climate system, chap
10. Praxis Springer, Berlin, pp 307–360
Wang B, Rui H (1990) Synoptic climatology of transient tropical
intraseasonal convection anomalies: 1975–1985. Met Atmos
Phys 44:43–61
Wang B, Xie X (1997) A model for the boreal summer intraseasonal
oscillations. J Atmos Sci 54:72–86
Webster PJ (1983) Mechanism of monsoon low-frequency variability:
surface hydrological effects. J Atmos Sci 40:2110–2124
Webster PJ, Yang S (1992) Monsoon and ENSO: selectively
interactive systems. Q J Meteor Soc 118:877–920
Woolnough SJ, Slingo JM, Hoskins BJ (2000) The relationship
between convection and sea surface temperature anomalies on
intraseasonal time scales. J Clim 13:2086–2104
Woolnough SJ, Slingo JM, Hoskins BJ (2001) The organization of
tropical convection by intraseasonal sea surface temperature
anomalies. Q J R Meteor Soc 127:888–907
Wu MLC, Schubert SD, Suarez MJ, Pegion PJ, Waliser DE (2006)
Seasonality and meridional propagation of the MJO. J Clim
19:1901–1921
Yamagata T, and Y. Hayashi (1984) A simple diagnostic model for
the 30–50 day oscillation in the tropics. J Meteor Soc Jpn
62(5):709–7117
Yamagata T, Behera SK, Luo JJ, Masson S, Jury MR, Rao SA (2004)
Coupled ocean–atmosphere variability in the tropical Indian
Ocean. In: Wang C, Xie SP, Carton JA (eds) In earth climate: the
ocean–atmosphere interaction. Geophys. Monogr. Ser., vol 147.
AGU, Washington, DC, pp 189–212
R. S. Ajayamohan et al.: BSISO propagation: role of internal processes 867
123
Related Documents