Point-Source Pollutants and Technology Jen Wilcox Department of Energy Resources Engineering US-Iran Symposium on Air Pollution in Megacities Irvine, CA Wednesday September 4 th , 2013

Welcome message from author
This document is posted to help you gain knowledge. Please leave a comment to let me know what you think about it! Share it to your friends and learn new things together.
Transcript
Point-Source Pollutants and Technology
Jen Wilcox Department of Energy Resources Engineering
US-Iran Symposium on Air Pollution in Megacities Irvine, CA
Wednesday September 4th, 2013

Clean Energy Conversions Team - 2013
• Bryce Anzelmo (PhD)
• Panithita Rochana (PhD)
• Ekin Ozdogan (PhD)
• Jiajun He (PhD)
• Kyoungjin Lee (PhD)
• Abby Kirchofer (PhD)
• Ana Suarez Negreira (PhD, ChemE)
• Mengyao Yuan (PhD)
• Beibei Wang (MS)
• Tao Narakornpijit (MS)
• Jeremy Hoffman (UG, Chem)
• Reza Haghpanah (Post-doc)
• Dong-Hee Lim (Post-doc)
• Mahnaz Firouzi (Post-doc)
• Dawn Geatches (Post-doc)
• Erik Rupp (Research Assistant)

Clean Energy Conversions Team - 2013
Thailand, Turkey, China, South Korea, US, Spain, Iran, India and United Kingdom
Clean Energy Conversions
Ongoing Projects
1. Carbon Capture
– Steam methane reforming for on-board CO2 capture
– N2-selective membrane technology (EPA/NSF/ARL)
– CO2-selective adsorption (GCEP)
2. Carbon Sequestration
– CO2 transport and adsorption in micro/mesoporous systems, gas shale with kerogen and clay (DOE-NETL/BP/Aramco)
3. Trace Metal Capture
– Hg, Se, As sorbent/catalyst testing (NSF/Johnson Matthey/EPRI/Novinda)
4. Hydrogen Fuel Cells and Storage
– Oxygen reduction across Pt nanoparticles (Air Force/DOE)
– Hydrogen production and storage (Shell/ARL/DOE)
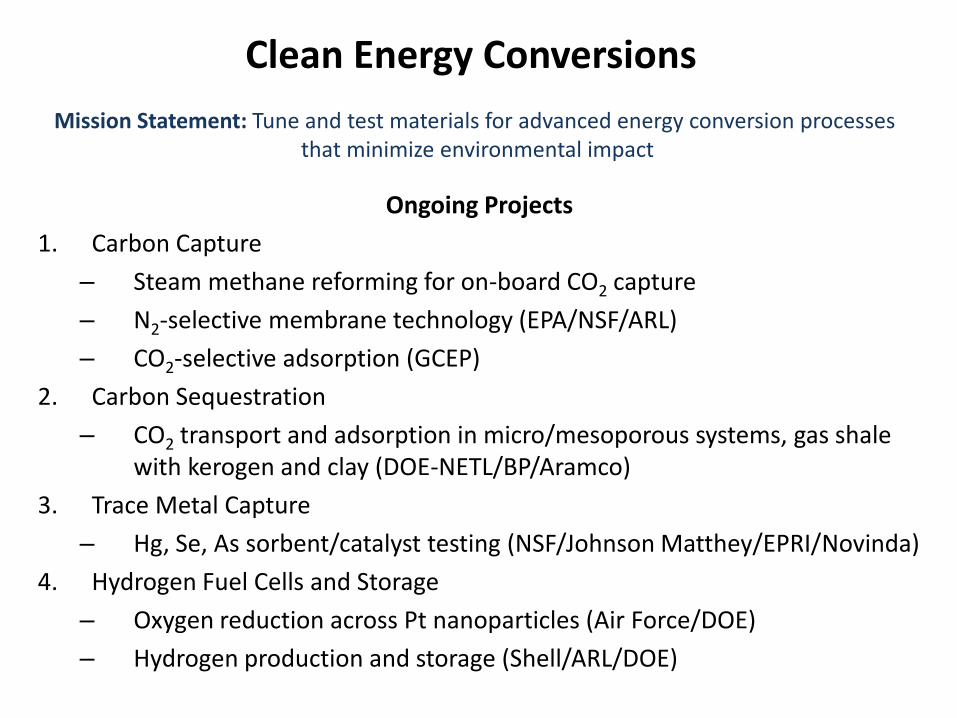
Mission Statement: Tune and test materials for advanced energy conversion processes that minimize environmental impact

Clean Energy Conversions
Ongoing Projects
1. Carbon Capture
– Steam methane reforming for on-board CO2 capture
– N2-selective membrane technology (EPA/NSF/ARL)
– CO2-selective adsorption (GCEP)
2. Carbon Sequestration
– CO2 transport and adsorption in micro/mesoporous systems, gas shale with kerogen and clay (DOE-NETL/BP/Aramco)
3. Trace Metal Capture
– Hg, Se, As sorbent/catalyst testing (NSF/Johnson Matthey/EPRI/Novinda)
4. Hydrogen Fuel Cells and Storage
– Oxygen reduction across Pt nanoparticles (Air Force/DOE)
– Hydrogen production and storage (Shell/ARL/DOE)
Mission Statement: Tune and test materials for advanced energy conversion processes that minimize environmental impact

Agenda
Emissions Sources, Scale, and Work
Research Example: On-board CO2 Capture

CO2 Emissions Source – Matching Quiz
Iran US
India China
?

Quiz – Match
US Iran
India China
Reference: United Nations GHG Inventory Data, 2012

To Prevent 2 °C Warming …
• Between 2000-2050 if cumulative emissions are less than:
– 1,000 Gt → 25% probability global warming beyond 2 °C
– 1,440 Gt → 50% probability global warming beyond 2 °C
Where we’re projected to go (BAU):
– Assuming annual increases:
• Coal – 0.3%
• Oil – 0.9%
• Natural Gas – 2.3%
– ≈ 31 Gt CO2 emitted in 2011
– ≈ 44 Gt CO2 projected in 2050
– 1790 cum. Gt CO2 in 2050!
BAU
2009 2050
Ref: Allen et al., Nature, 2009
Ref: BP Statistical Rev. of World Energy, 2012

Appreciating the Scale – Concept of “CCS”
• US population ≈ 316,668,500
• Iran population ≈ 79,853,900
• Annual emissions per capita:
– US (2nd) ≈ 17 tons CO2
– Iran (9th) ≈ 7 tons CO2
• Flight from SF to Iran RT ≈ 1.7 tons CO2
• Depending on sorbent loading and performance (cycling)
– 17.5 tons ➔ total 150 tons material
Just the CO2 per person in US!
Just the sorbent + CO2 per person in US!

Capture and Regeneration are Both Key
• Capturing CO2 is only ½ the story
• MUST regenerate
• Options for usage:
– Chemical feedstock?
• Challenge – market is small
– Enhanced oil recovery (aka EOR)
• Seems to be best near-term option
– Conversion to fuel
– Storage
• Challenges include public perception and overcoming risks of potential seismic events
Amine Scrubbing - Current State-of-the-Art
Technology for Point-Source Capture of CO2

Expanding the Impact of CCS
BAU - 1790 Gt CO2
1000 Gt CO2 → 25% probability of ↑2°C
1440 Gt CO2 → 50% probability of ↑2°C
Scenario Avoided Cum. Gt CO2
Replace Coal w/ NG 1512
90% Capture (Point Source Electric Sector) 1288
90% Capture (Point Source Electric Sector) + 50% Transport (on-board capture; EV; DAC)
1083

What is Direct Air Capture?
• Pros:
– Allows us to ‘go negative’
– Method for dealing with transportation sector
– Place a DAC plant anywhere
• Cons:
– Air is dilute in CO2!
– Energy costs are high
– Footprint is large
– Air must be filtered ($)
• CO2 in air is ≈ 390 ppm
• Combustion:
– Natural gas ≈ 6%
– Oil ≈ 8%
– Coal ≈ 12%
~ 390 ppm
~ 12%

Understanding Dilution
0
5
10
15
20
25
30
35
40
45
50
0 10 20 30 40 50
DAC 390/M ≈ 1/2500
0
5
10
15
20
25
30
35
40
45
50
0 10 20 30 40 50
0
5
10
15
20
25
30
35
40
45
50
0 10 20 30 40 50
Natural Gas Flue Gas ≈ 100x ≈ 100/2500 = 1/25
2500 pixels in each grid
Coal Flue Gas ≈ 300x ≈ 300/2500 = 3/25
must process a lot of gas in DAC to capture the equivalent CO2 from a point-source

Footprint Comparison
• 500-MW plant emits ≈ 11,000 tons CO2/day and assume capture 90% (≈ 10,000 tons)
• Plant size is ≈ 0.15 km2
• Current SOA amine scrubbing to capture is
≈ 0.02 km2 or 13% of the plant’s land area
• Building a DAC plant:
– Assume air speed 2 m/s
– Capture same amount of CO2, process
≈ 133,000 m2 gas
– Requires land area ≈ 0.13 km2 or 90% of the land area of this 500-MW power plant
0
2
4
6
8
10
0 1 2 3 4 5 6 7 8 9 10
0
2
4
6
8
10
0 1 2 3 4 5 6 7 8 9 10
0
2
4
6
8
10
0 1 2 3 4 5 6 7 8 9 10

What Might it Take? to capture CO2 directly from air

A Power Plant!
• Energy requirements are enormous!
• Must use non-carbonized (preferably renewable) energy resources
– Wind, solar, etc.
• CO2 capture from point sources is still in its infancy and expensive
– Coal – parasitic losses are ≈ 20% w/ amine scrubbing
– Compression for pipeline transport adds ≈ 10% hit

Minimum Work for Separation combined first and second laws
Wmin = RT nBCO2 ln(yB
CO2 ) + nBB-CO2 ln(yB
B -CO2 )[ ] + RT nCCO2 ln(yC
CO2 ) + nCC -CO2 ln(yC
C -CO2 )[ ]
-RT nACO2 ln(yA
CO2 ) + nAA-CO2 ln(yA
A-CO2 )[ ]
Wilcox, Carbon Capture, Springer, 2012
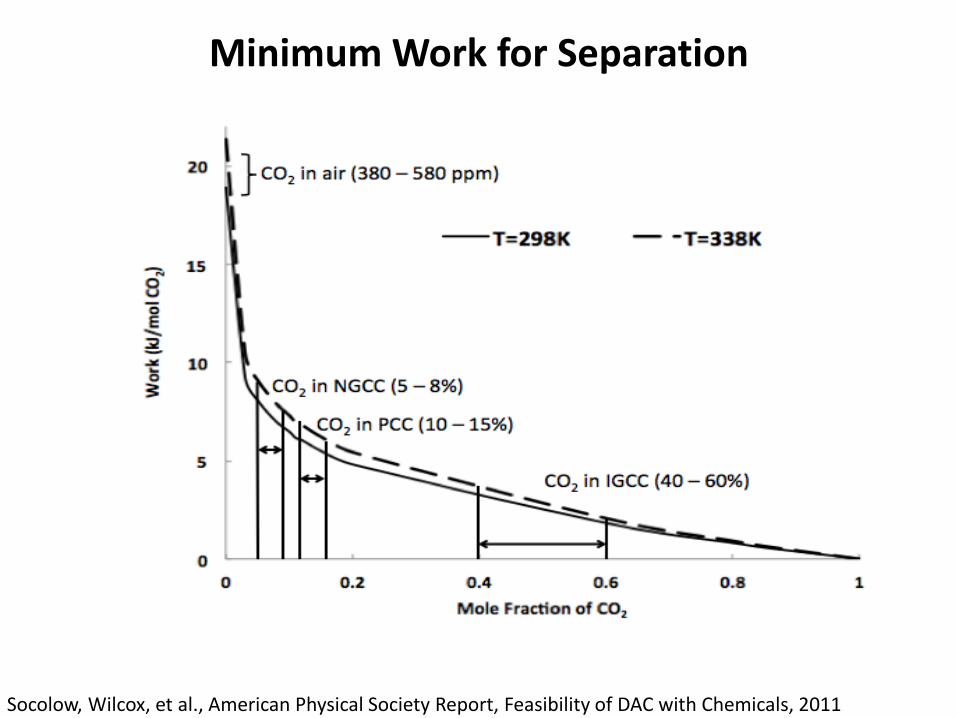
Minimum Work for Separation
Socolow, Wilcox, et al., American Physical Society Report, Feasibility of DAC with Chemicals, 2011

Sherwood Plot for Flue Gas Scrubbing
Calculations carried out using IECM, all cases assume 500-MW plant burning Appalachian bituminous, NGCC (477-MW) O&M + annualized capital costs are included in the cost estimates
“the recovery of potentially valuable solutes from dilute solution is dominated by the costs
of processing large masses of unwanted materials.”1 -Edwin Lightfoot

1
3
5
7
9
11
13
15
17
19
0 0.1 0.2 0.3 0.4
Min
imu
m W
ork
(kJ
/mo
l CO
2 C
aptu
red
)
CO2 Concentration
50% capture; 80% purity75% capture; 80% purity90% capture; 80% purity50% capture; 95% purity75% capture; 95% purity90% capture; 95% purity50% capture; 99% purity75% capture; 99% purity90% capture; 99% purity
Minimum Work
Coal Gasification 1-
4 kJ/mol CO2
Natural Gas Combustion 6-9 kJ/mol CO2
Coal Combustion 5-7 kJ/mol CO2
Direct Air Capture 19 – 21 kJ/mol CO2
• DAC is always ≈ 20 kJ/mol CO2, regardless of % capture and purity
• Reason: capturing less of a given total gas
• Additional work required due to density changes w/ mixtures of CO2 and N2
• 95%CO2 + 5%N2: 681 kg/m3
• 80%CO2 + 20%N2: 343 kg/m3
• ≈ 0.5 kJ/mol CO2 additional compression energy!
Wilcox, Carbon Capture, 2012

Agenda
Emissions Sources, Scale, and Work
Research Example: On-board CO2 Capture
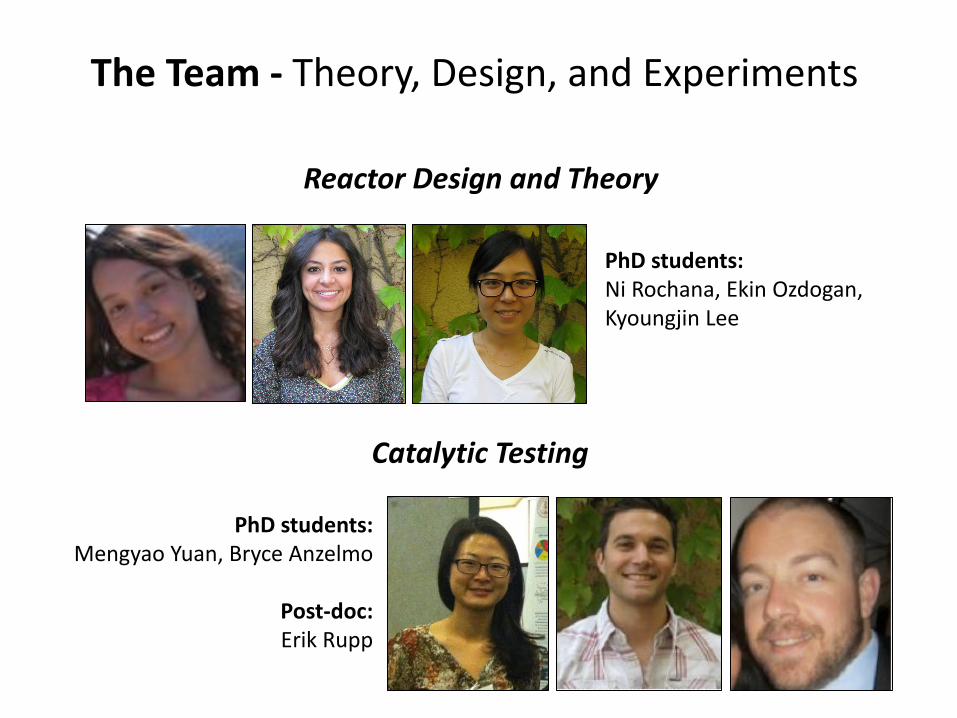
The Team - Theory, Design, and Experiments
Reactor Design and Theory
Catalytic Testing
PhD students: Ni Rochana, Ekin Ozdogan, Kyoungjin Lee
PhD students: Mengyao Yuan, Bryce Anzelmo
Post-doc: Erik Rupp

CO2 Capture from Transportation Sector
• ~20% of global CO2 emissions are from the transportation sector (40% - long-haul trucks, in US)
• Current strategies for CO2 abatement from this sector
– Electrify the transportation sector (careful of WY and coal heavy states)
– Switching from gasoline to natural gas is an incremental decrease in CO2 emissions (not a long-term solution)
– Direct air capture
– Changing mobility (removal of cars in city centers – uber, zipcar, etc.)
– Moving toward local vs global food/products to decrease need for long-haul trucks
• Great long-term solutions, BUT they don’t touch the existing billion cars on the planet and the additional ones to come

Reactor Schematic
Range: ~ 350 mi w/ full “charge” Volume of Reactor: ~ 2x typical 15-gall gas tank Goals: ↓ reactor size by using low-end mesoporous Ni-based catalysts and/or zeolites ⟶ ↑ gas density

Combined SMR and WGS w/ H2 Production
• Catalytic membrane allows steam methane reforming and water gas shift reactions to take place at the same operating conditions
• Operating Conditions: 200 bar; 650 K
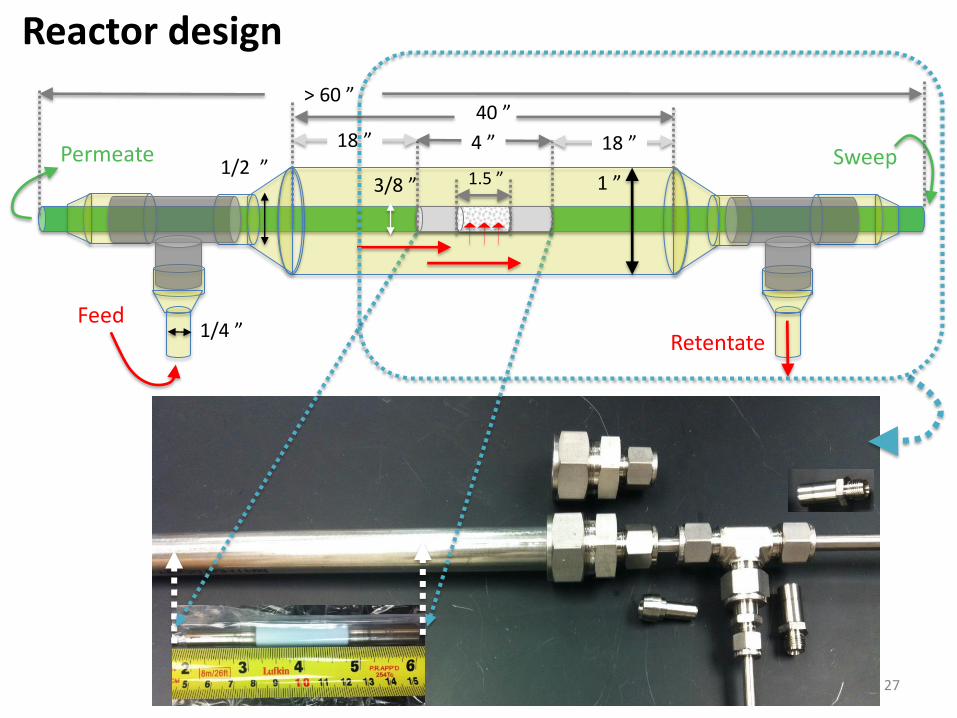
Reactor design
27
40 ”
4 ”
1.5 ” 1/2 ”
3/8 ” 1 ”
Permeate
Feed Retentate
Sweep
1/4 ”
18 ” 18 ”
> 60 ”

Benefits
• Natural gas is converted using steam within the framework of a catalytic membrane to produce H2 and CO2 – this will allow NG to play a larger role in the transportation sector
• CO2 is produced on the high-pressure side of the membrane, while H2 is sent to either an H2 internal combustion engine (retrofitting existing fleet) or to a H2 fuel cell (new fleet) – this leads to vehicles w/ near-zero CO2 emissions
• This would allow for an individual to make the choice of retrofitting their existing automobile or purchasing a new automobile that’s CO2-free
• Range is greater than current electric vehicles
• A great place to start would be the Permian Basin where there are CO2 compression stations, pipelines and a market for EOR operations
Gigaton Challenge – Think Outside the Box! Message to students: don’t worry… you’ll still graduate and find a job
Ekin Ozdogan, PhD 2013 Shell, Research Engineer, Process Evaluations Houston, TX
Ni Rochana, PhD 2013 PTT, Research Engineer, Business Development Bangkok, Thailand

Shell Technical Day, October 24th, 2012
Merci !
Clean Energy Conversions Website: http://cec-lab.stanford.edu

Additional Information:
From Springer site: http://www.springer.com/chemistry/book/978-1-4614-2214-3
Clean Energy Conversions Website: http://cec-lab.stanford.edu/
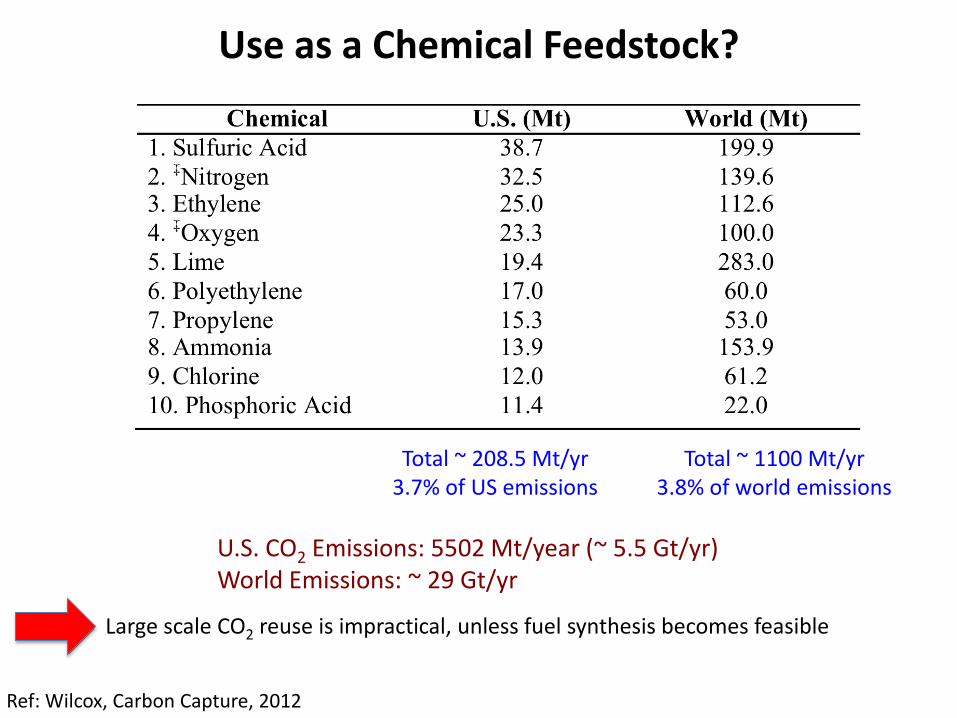
Use as a Chemical Feedstock?
U.S. CO2 Emissions: 5502 Mt/year (~ 5.5 Gt/yr) World Emissions: ~ 29 Gt/yr
Large scale CO2 reuse is impractical, unless fuel synthesis becomes feasible
Total ~ 208.5 Mt/yr 3.7% of US emissions
Total ~ 1100 Mt/yr 3.8% of world emissions
Ref: Wilcox, Carbon Capture, 2012

Current EOR Activities

EOR Opportunities
Benefit of DAC – no location restrictions
Existing CO2 Pipelines and Projects (Permian Basin)
But there are many power plants
2200 – 3900 MW ~ 50 Mt/yr
1200 – 2200 MW (x2) ~ 25 Mt/yr
434 – 1199 MW (x8) ~ 50 Mt/yr
25 – 433 MW (x14) ~ 25 Mt/yr
Total Regional Power Plant Production ~ 1.5 Bt CO2/yr
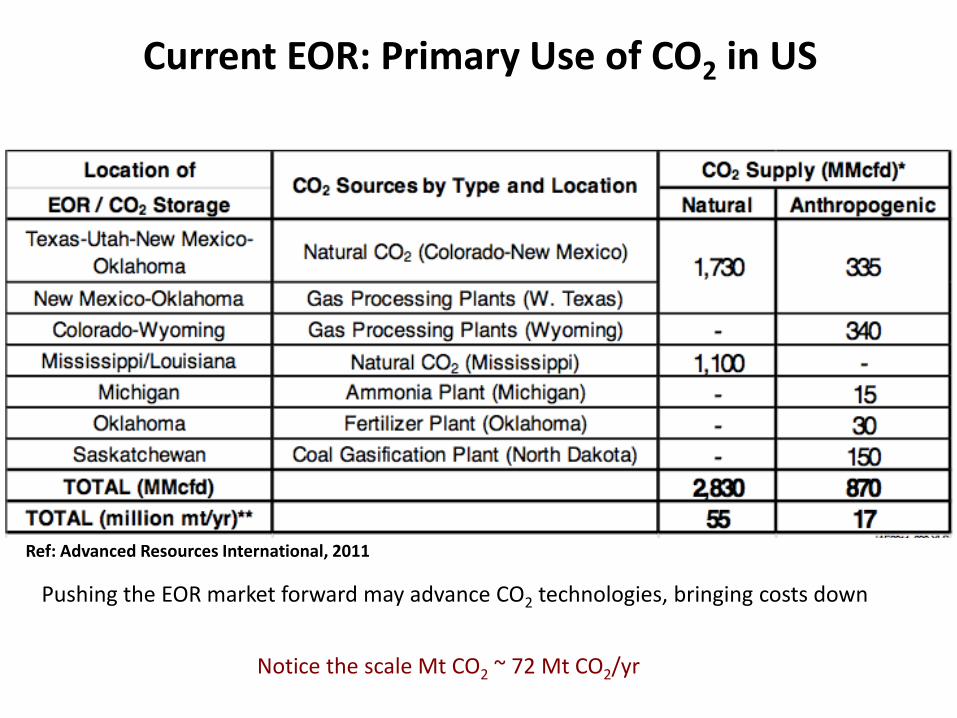
Current EOR: Primary Use of CO2 in US
Pushing the EOR market forward may advance CO2 technologies, bringing costs down
Notice the scale Mt CO2 ~ 72 Mt CO2/yr
Ref: Advanced Resources International, 2011

NETL Report – CO2-EOR State of the Art and Next Generation
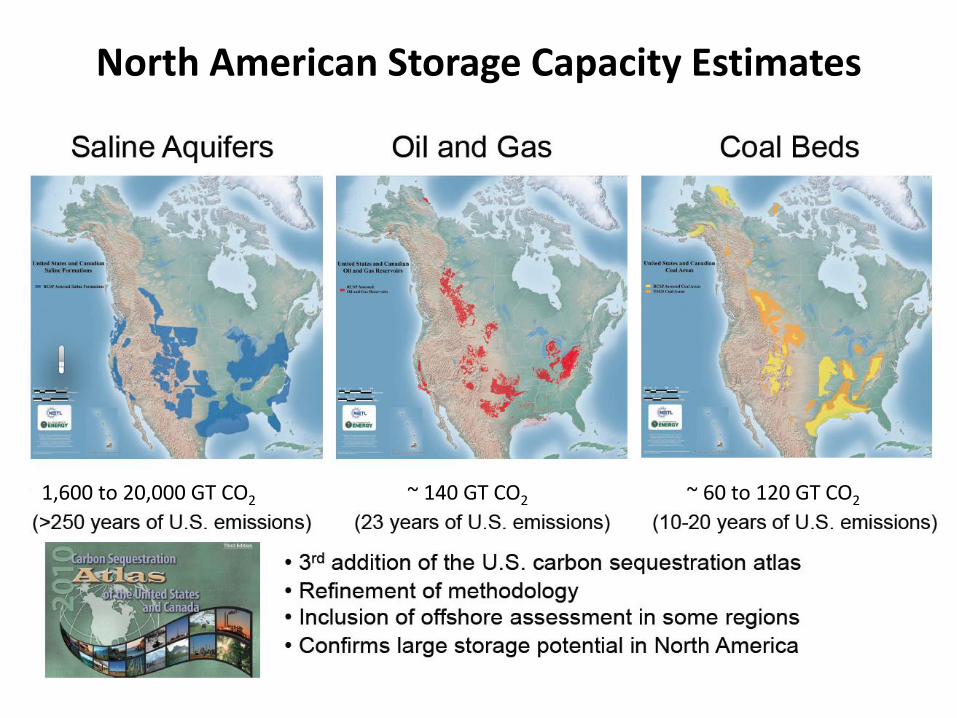
North American Storage Capacity Estimates
1,600 to 20,000 GT CO2 ~ 140 GT CO2 ~ 60 to 120 GT CO2

Capture and Regeneration are Both Key
• Capturing CO2 is only ½ the story
• MUST regenerate
• Options for usage:
– Chemical feedstock?
• Challenge – market is small
– Enhanced oil recovery (aka EOR)
• Seems to be best near-term option
– Storage
• Challenges include public perception and overcoming risks of potential seismic events
Amine Scrubbing - Current State-of-the-Art
Technology for Point-Source Capture of CO2
Related Documents