PODS: an Ecological Microsensor Network Edo Biagioni, ICS Kim Bridges, Botany Brian Chee, ICS and many more!

PODS: an Ecological Microsensor Network
Dec 30, 2015
PODS: an Ecological Microsensor Network. Edo Biagioni, ICS Kim Bridges, Botany Brian Chee, ICS and many more!. Overview. Introduction Interpreting Spatial and Temporal Environmental Information Early Deployment Technical Details: Wireless Communications and Routing. Part 1. - PowerPoint PPT Presentation
Welcome message from author
This document is posted to help you gain knowledge. Please leave a comment to let me know what you think about it! Share it to your friends and learn new things together.
Transcript

PODS: an Ecological Microsensor Network
Edo Biagioni, ICSKim Bridges, Botany
Brian Chee, ICSand many more!
Overview
• Introduction
• Interpreting Spatial and Temporal Environmental Information
• Early Deployment
• Technical Details: Wireless Communications and Routing

Part 1
Interpreting Spatial and TemporalEnvironmental Information
The Challenge
• Endangered plants grow in few locations
• Hawai'i has steep weather gradients: the weather is different in nearby locations
• A single weather station doesn’t help, so
• Have many sensors (PODS)
• Make them unobtrusive: rock or log
• Resulting in lots of data

Data Collection
• Wind, Rain, Temperature, Light, Moisture
• At each pod
• Every 5 minutes to 1 hour, for years
• Images at some of the pods
• Networking challenge: getting the data back without discharging the batteries
• How to make sense of all this data?

Spatial Patterns
• Wet and dry areas have different plants
• Cold and warm areas have different plants
• Where is the boundary? The boundary will be different for different plant species
• Does cloud cover matter?
• Does wind matter? Pollinators, herbivores
Temporal Patterns
• Is this a warm summer? Winter?
• Is it a warm summer everywhere, or just in some places?
• Does it rain more when it is warmer?
• What events cause flowering?
• How long does it take the plant to recover after an herbivore passes?

Who needs the Information?
• Scientists (botanists)
• High-School Students
• Virtual Tourists
• Farmers
What use is the Information?
• Study the plants, prevent decline
• Determine what is essential for the plant’s survival: e.g., how will global warming affect it?
• Locate alternative areas
• Watch what happens, instead of trying to reconstruct what happened
• Capture rare phenomena

How is the data communicated?
• Graphs, maps, tables
• Tables unwieldy for large numbers of PODS
• Graphs need many different scales
• Maps can help intuitive understanding
• Ultimately, need to find useful patterns

Picture of weather data, from web
• http://weather.yahoo.com/graphics/satellite/east_usa.html

Simple Map
http://red2.ics.hawaii.edu/cgi-bin/location
Blue: rain
Big Blue: recent rain
Cyan: cool, dry
Red: warm, dry

Graphs vs. Maps
• Graphs• Good for recognition
of temporal patterns• Can summarize a lot
of data very concisely• Mostly for
homogeneous data
• Maps• Good for recognition
of spatial patterns• Can summarize a lot
of data very concisely• Good for
heterogeneous data

Strategies
• Data Mining: search data for patterns, try to match to plant distribution
• Machine Learning: try to predict new data. If prediction is wrong, something unpredicted (unpredictable!) is happening
• Better maps, incorporating lots of data including images, but in a way that supports intuitive analysis

Better Map
Not (yet) automated on the web…
Blue: rain
Red: temperature
Yellow: sunlight
Plant population

Where to go from here
• Plant “surveillance”: being there, remotely
• Data Collection is only the essential first step
• Data Analysis must be supported by appropriate tools
• Find out what really matters in the life of an endangered plant

Part 2: Early Deployment
• Deployment of hybrid PODS
• Computer, radio, and some sensors built by a team at MIT
• Enclosures, most sensors, and power built by UH pods team
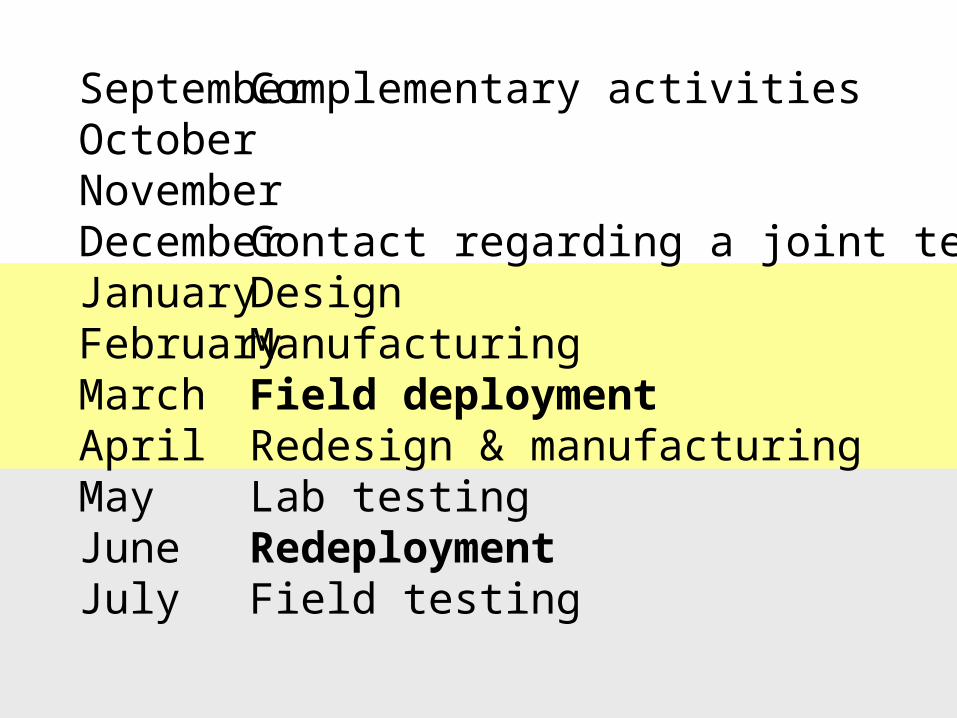
SeptemberOctoberNovemberDecemberJanuaryFebruaryMarchAprilMayJuneJuly
Complementary activities
Contact regarding a joint testDesignManufacturingField deploymentRedesign & manufacturingLab testingRedeploymentField testing
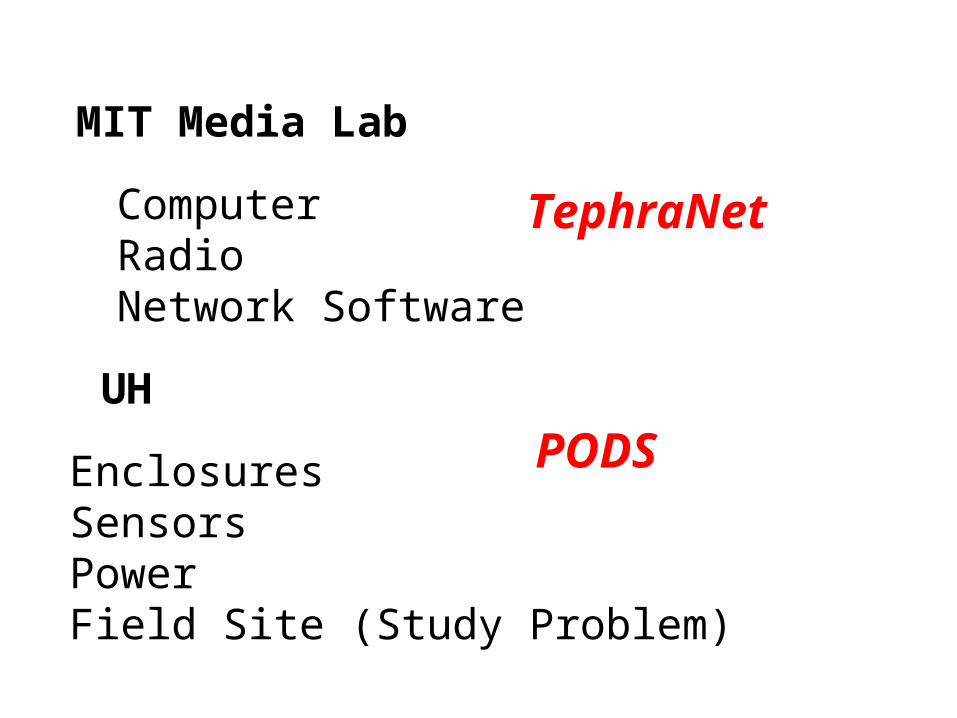
MIT Media Lab
UH
ComputerRadioNetwork Software
EnclosuresSensorsPowerField Site (Study Problem)
TephraNet
PODS

Kilauea Crater
Halemaumau
Hawaii VolcanoesObservatory
SouthwestRift Zone
Hawaii VolcanoesNational Park
Chain of Craters Highway

SW Rift Zone

Rainfall Gradient
Desert
Rainforest

Silene Study Area
Hawaii VolcanoesObservatory
Southwest Rift Zone
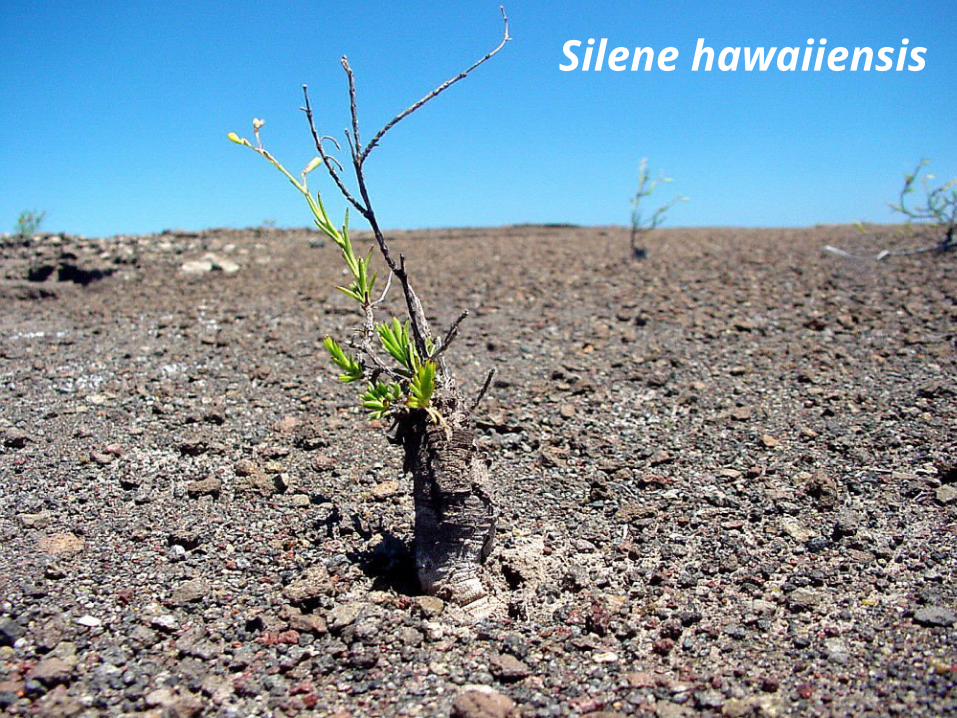
Silene hawaiiensis


temperature
humidity
light
wind (bend)
Computer& Radio
Batteries
Rock Enclosures
Internal: voltage

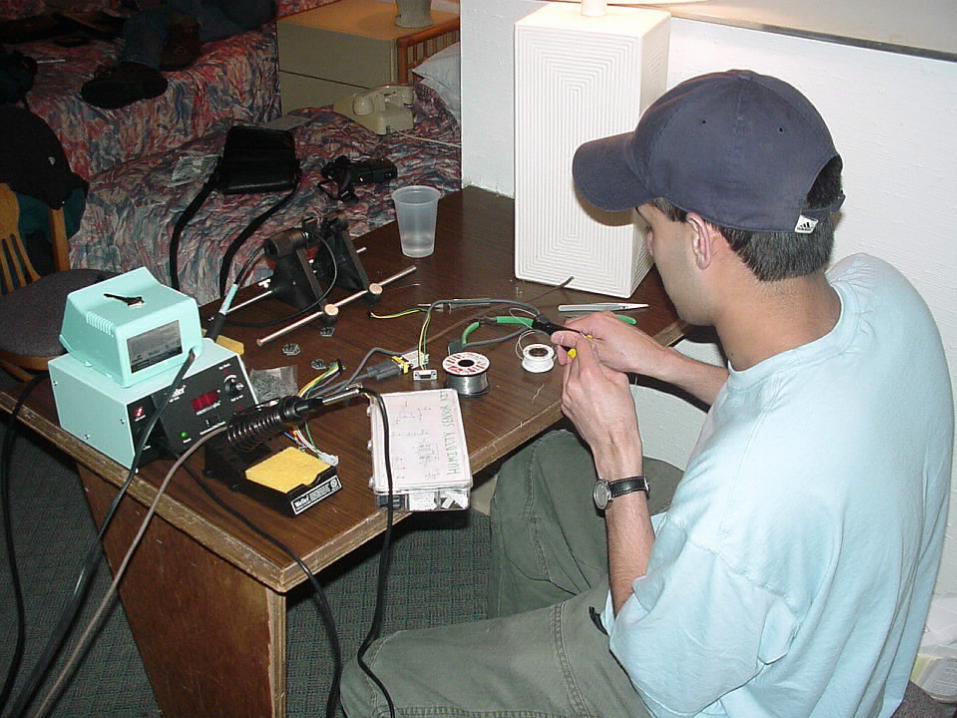
Michael Lurvey
Inner mold: Latex & gauze
Outer mold: Plaster of Paris
Casting: pretinted “bondo”
rockmaker


MIT TephraNetMIT TephraNet

Silene Study Area
Hawaii VolcanoesObservatory
Southwest Rift Zone
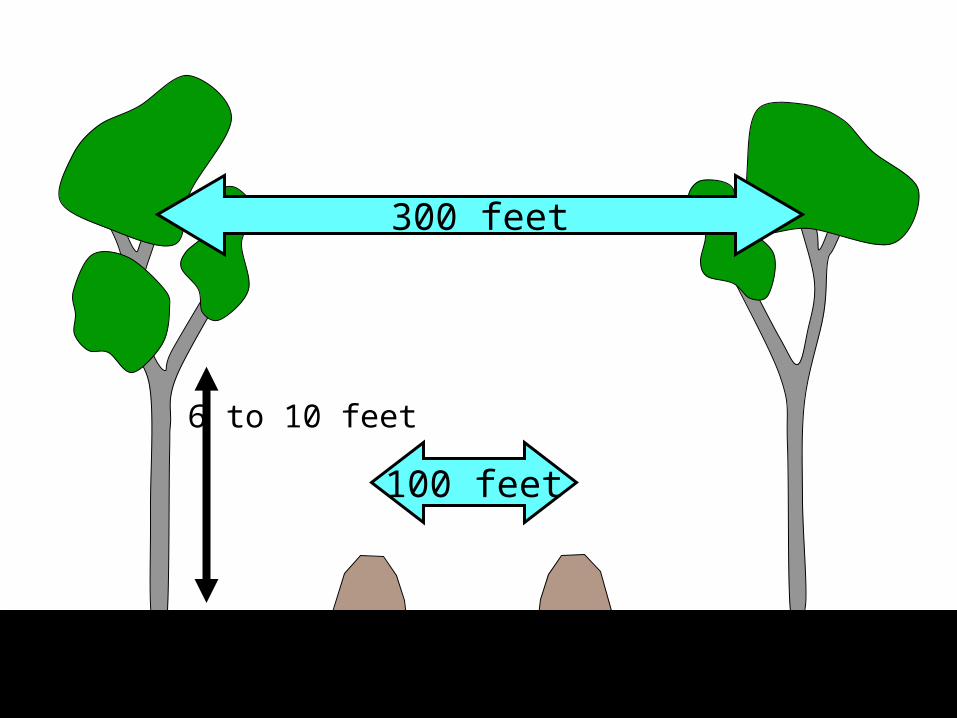
300 feet
100 feet
6 to 10 feet

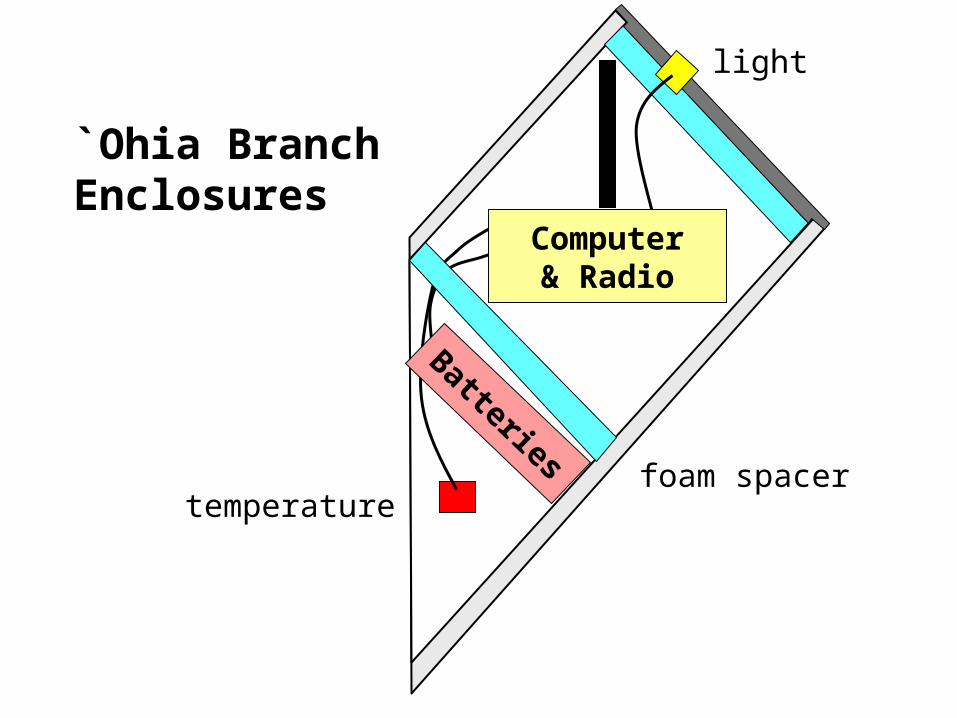
`Ohia BranchEnclosures
temperature
light
Batteries
Computer& Radio
foam spacer

6” PVC pipeLaser-printed textureWaterproof spray coating“Bondo” caps
6” PVC pipeLaser-printed textureWaterproof spray coating“Bondo” caps

Battery Pack SpacersBattery Pack Spacers
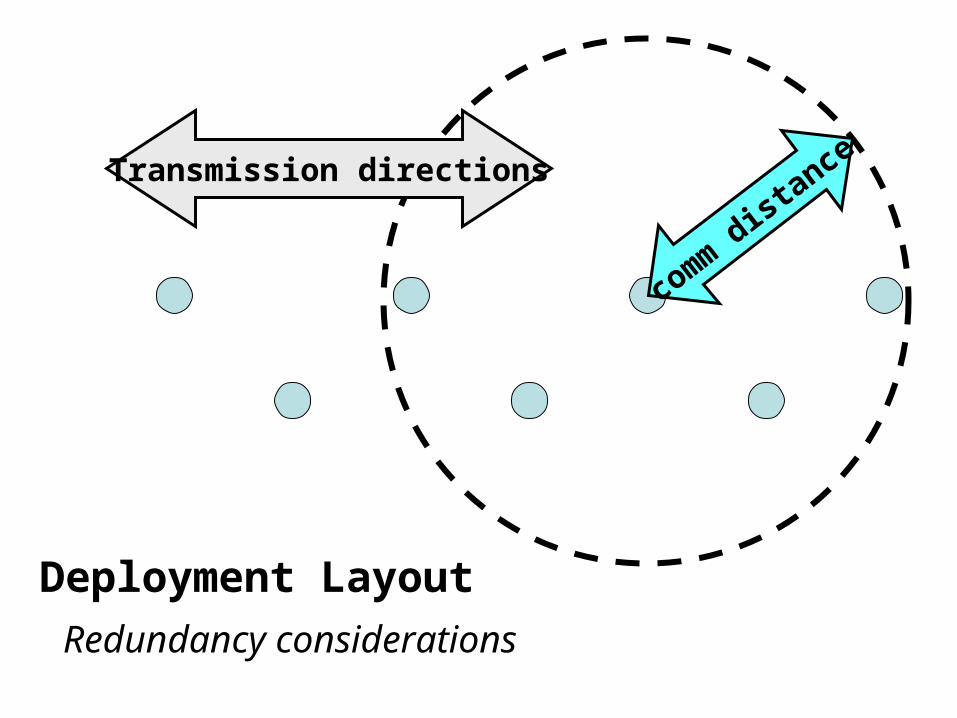
comm distance
Deployment Layout
Redundancy considerations
Transmission directions
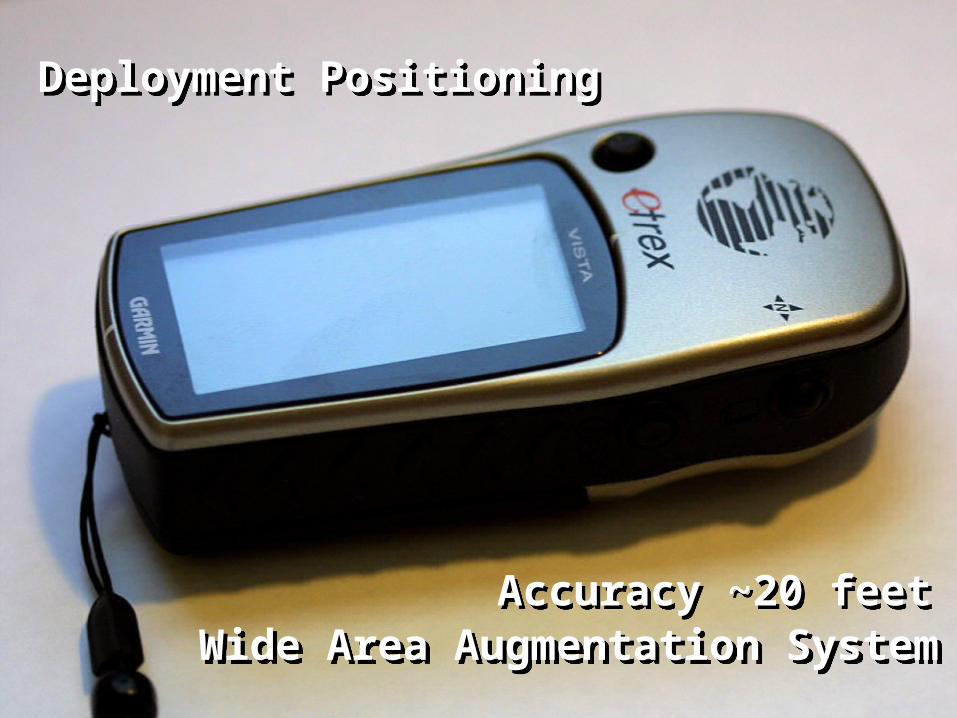
Deployment PositioningDeployment Positioning
Wide Area Augmentation SystemWide Area Augmentation SystemAccuracy ~20 feet Accuracy ~20 feet


Silenehawaiiensis
FieldDeployment
HawaiiVolcanoesObservatory


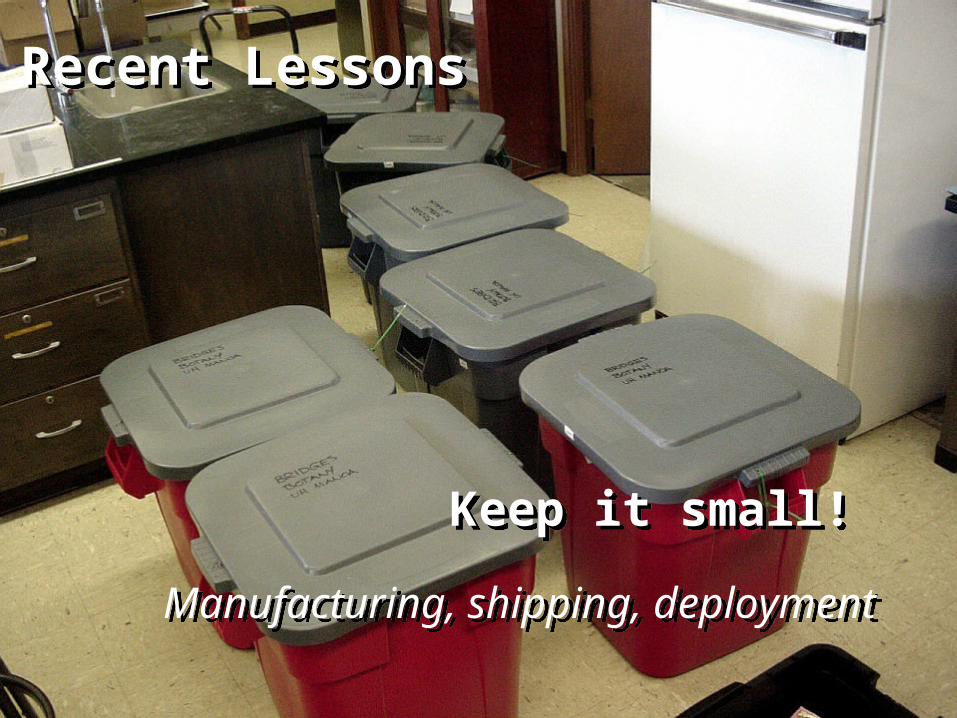
Recent LessonsRecent Lessons
Keep it small!Keep it small!
Manufacturing, shipping, deploymentManufacturing, shipping, deployment

Working against a deadline is important
1 2 3
4 5 6 7 8 9 10
11 12 13 14 15 16 17
18 19 20 21 22 23 24
25 26 27 28 29 30 31
March 2001

Multiple designs provide flexibilityMultiple designs provide flexibility

Large numbers require special planningLarge numbers require special planning

Collaboration pushed a prototype into a system
Using a real problem added great focus

University of Hawaii
Network simulations
802.11 communications
Enclosure design and fabrication
Sensor design
Camera testing and deployment
Remote node administration
Part 3: Energy Efficient Wireless Routing
• Routing
• Existing Algorithms: Geographic, Gradient
• Gradient Backtrace Routing
• Geometric Routing
Routing
• Automatically let the network discover how to get from A to B
• Assume neighbors can communicate
• Distance-Vector Routing: if I can reach B at distance d, I tell my neighbors
• If neighbor n (distance δ from me) can reach B at distance d’, and d’ + δ < d, I route packets for B via n

Distance-Vector Routing Example
• Router X has neighbors Y (distance 8) and Z (distance 5)
• Y tells X it can reach B at distance 17, so X sends to Y all packets for B
• Z now tells X it can reach B at distance 19, so X sends to Z the packets for B
X
Y
Z5
8
B
19
17

Wireless Routing
• Easy to broadcast to all our neighbors• No “networks” in the IP sense• Energy may be more important than other
considerations:– Quick convergence and few messages– Load balancing– Suboptimal routes may be OK– We can receive more than transmit, but
cannot receive for a long time

Geographic Routing
• Send to the neighbor that’s closest to the destination
• Very scalable, no global information needed
• Fails on dead ends
X
Z
YB
W HK
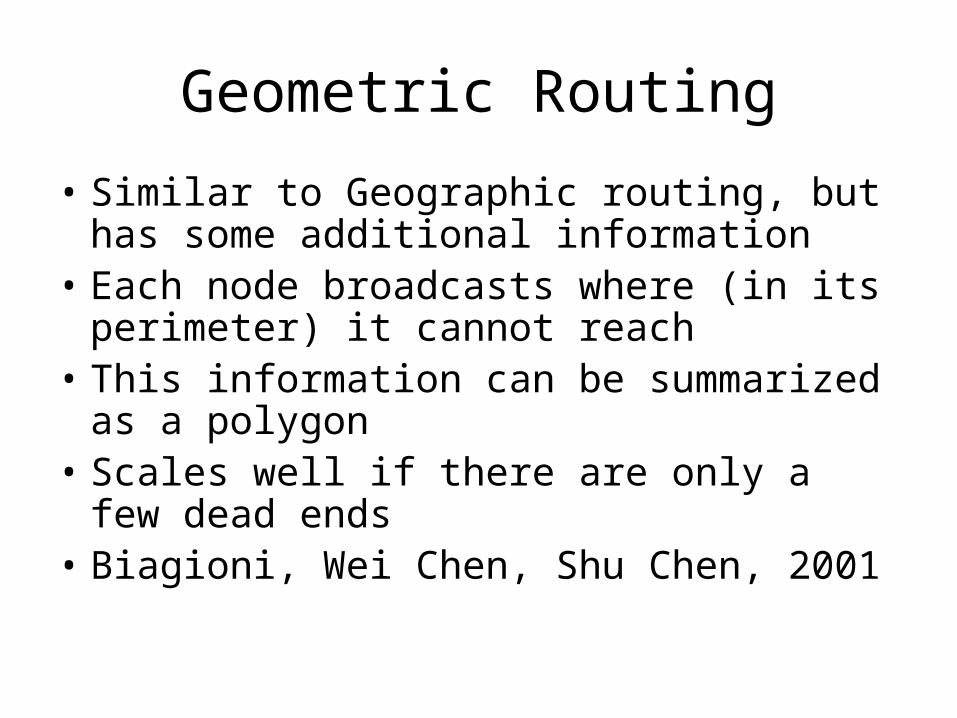
Geometric Routing
• Similar to Geographic routing, but has some additional information
• Each node broadcasts where (in its perimeter) it cannot reach
• This information can be summarized as a polygon
• Scales well if there are only a few dead ends
• Biagioni, Wei Chen, Shu Chen, 2001
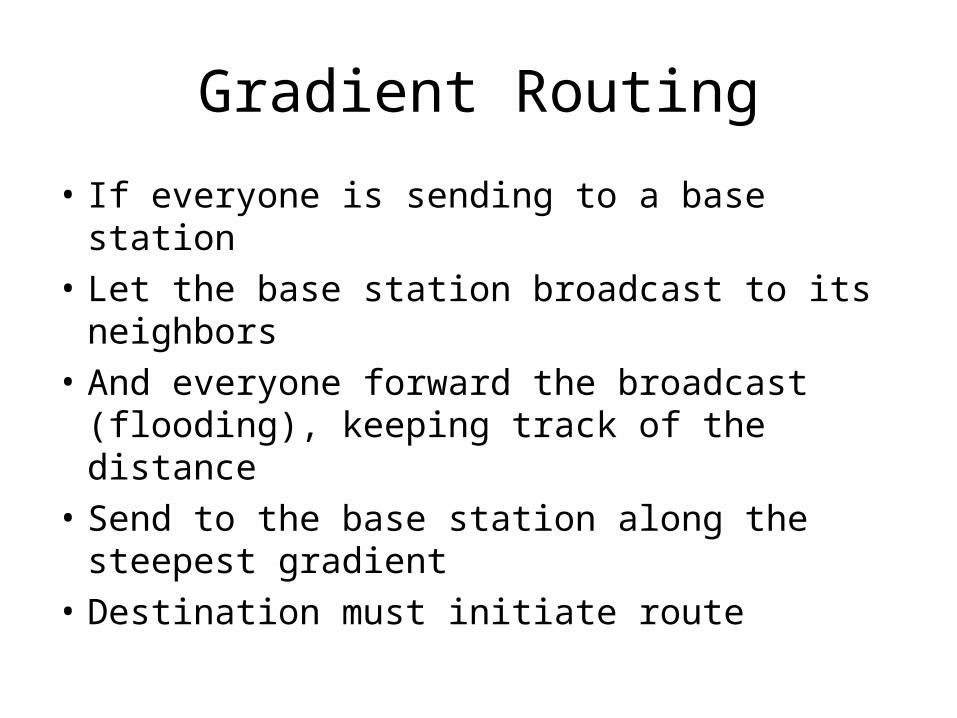
Gradient Routing
• If everyone is sending to a base station
• Let the base station broadcast to its neighbors
• And everyone forward the broadcast (flooding), keeping track of the distance
• Send to the base station along the steepest gradient
• Destination must initiate route
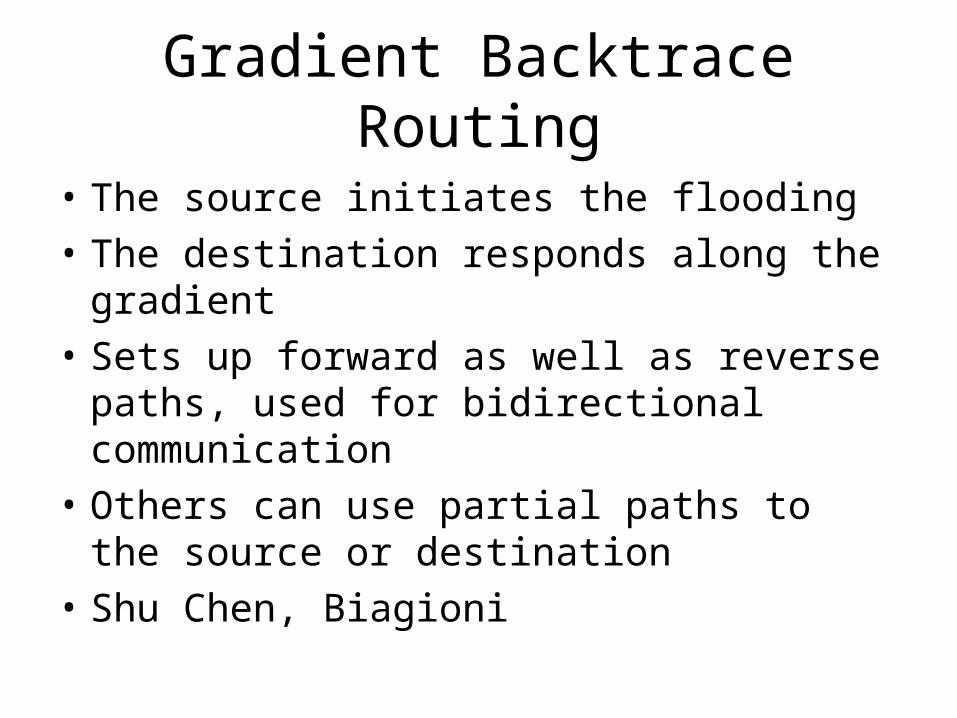
Gradient Backtrace Routing
• The source initiates the flooding
• The destination responds along the gradient
• Sets up forward as well as reverse paths, used for bidirectional communication
• Others can use partial paths to the source or destination
• Shu Chen, Biagioni

Acknowledgements and Links
• Co-Principal Investigators: Kim Bridges, Brian Chee
• Students and others: Shu Chen, Wei Chen, Michael Lurvey, Dan Morton, Bryan Norman, Fengxian Fan, and many more
• http://www.botany.hawaii.edu/pods/ pictures, data
• http://www.ics.hawaii.edu/~esb/pods/ slides, papers
Related Documents