Journal of Marine Science and Engineering Article PoC (Proof of Concept) for Performance Monitoring Platform of Container Terminals Nam Kyu Park 1, * and Jung Hun Lee 2 1 Department of International Logistics, Tongmyong University, Busan 48520, Korea 2 Busan Development Institute, 955, Jungang-dearo, Busanjin-gu, Busan 47210, Korea; [email protected] * Correspondence: [email protected]; Tel.: +82-010-3575-1004 Received: 28 October 2020; Accepted: 16 November 2020; Published: 28 November 2020 Abstract: The purpose of this study is to prove the concept of the performance monitoring system of container terminals. PoC (Proof of Concept) is a realization of a certain method or idea in order to demonstrate its feasibility. The port authorities, such as government or local authority, are continually checking the performance of the terminals they invested in and want to reflect it in the development policy. They also want to increase competitiveness by checking performance levels, such as port handling volume, calling ships, resource utilization, and congestion. PPI (Port performance indicators) are classified into four categories: output (production), productivity, utilization, and service. In this study, 15 monitoring indicators for each stage by dividing the process from the ship’s entry to departure are defined. Four indicators, such as ship waiting ratio at anchorage, berth occupancy, storage occupancy, and truck turnaround time, are selected as PoC of monitoring platform. In addition, a method of collecting, processing, and expressing data on these four indicators in real time is presented. There are three steps to create PPI on monitoring platform. The information required for PPI is to be collected from the Port-MIS (Management Information System) and TOS (Terminal Operating System) databases. Second, the collected data from external entities are stored into the database after verification and classification. Third, descriptive PPI, predictive PPI are generated based on the input data. This study provides a 4-tier framework from the conceptual platform with the key elements of data presentation, data process and data interface and middleware. As a result of the study, it is proved to select monitoring indicators, define external entities, define internal elements of the system, develop systems, and present indicator results. However, in the process of collecting data outside the system, we have found there is confidential data of individual terminals. To this end, it is important to establish a mutual cooperation system for data collection. Keywords: container terminal operation; port performance indicator; port monitoring platform 1. Introduction The characteristics of smart port is that the cycle of decision making is shortened by going through the stages of data collection, analyzing, diagnosis, prediction and prescription [1]. The port authorities have invested a large amount of investment to construct and operate a container terminal, but it has not provided the monitoring platform to evaluate the performance of the terminal in the perspective of Port Authority. This paper is to prove whether the monitoring platform is useful for performance improvement by constructing a prototype [2] of port performance monitoring system. PoC (Proof of Concept) is a realization of a certain method or idea in order to demonstrate its feasibility [3]. Port Authority including central or local government is continually checking the performance of the terminal they invested in and want to reflect it in the development policy. They also want to increase competitiveness by checking performance levels, such as cargo volume, calling ships, resource utilization, and congestion. J. Mar. Sci. Eng. 2020, 8, 971; doi:10.3390/jmse8120971 www.mdpi.com/journal/jmse

Welcome message from author
This document is posted to help you gain knowledge. Please leave a comment to let me know what you think about it! Share it to your friends and learn new things together.
Transcript
Journal of
Marine Science and Engineering
Article
PoC (Proof of Concept) for Performance MonitoringPlatform of Container Terminals
Nam Kyu Park 1,* and Jung Hun Lee 2
1 Department of International Logistics, Tongmyong University, Busan 48520, Korea2 Busan Development Institute, 955, Jungang-dearo, Busanjin-gu, Busan 47210, Korea; [email protected]* Correspondence: [email protected]; Tel.: +82-010-3575-1004
Received: 28 October 2020; Accepted: 16 November 2020; Published: 28 November 2020 �����������������
Abstract: The purpose of this study is to prove the concept of the performance monitoring system ofcontainer terminals. PoC (Proof of Concept) is a realization of a certain method or idea in order todemonstrate its feasibility. The port authorities, such as government or local authority, are continuallychecking the performance of the terminals they invested in and want to reflect it in the developmentpolicy. They also want to increase competitiveness by checking performance levels, such as porthandling volume, calling ships, resource utilization, and congestion. PPI (Port performance indicators)are classified into four categories: output (production), productivity, utilization, and service. In thisstudy, 15 monitoring indicators for each stage by dividing the process from the ship’s entry to departureare defined. Four indicators, such as ship waiting ratio at anchorage, berth occupancy, storageoccupancy, and truck turnaround time, are selected as PoC of monitoring platform. In addition,a method of collecting, processing, and expressing data on these four indicators in real time ispresented. There are three steps to create PPI on monitoring platform. The information requiredfor PPI is to be collected from the Port-MIS (Management Information System) and TOS (TerminalOperating System) databases. Second, the collected data from external entities are stored into thedatabase after verification and classification. Third, descriptive PPI, predictive PPI are generatedbased on the input data. This study provides a 4-tier framework from the conceptual platform withthe key elements of data presentation, data process and data interface and middleware. As a result ofthe study, it is proved to select monitoring indicators, define external entities, define internal elementsof the system, develop systems, and present indicator results. However, in the process of collectingdata outside the system, we have found there is confidential data of individual terminals. To this end,it is important to establish a mutual cooperation system for data collection.
Keywords: container terminal operation; port performance indicator; port monitoring platform
1. Introduction
The characteristics of smart port is that the cycle of decision making is shortened by going throughthe stages of data collection, analyzing, diagnosis, prediction and prescription [1]. The port authoritieshave invested a large amount of investment to construct and operate a container terminal, but it hasnot provided the monitoring platform to evaluate the performance of the terminal in the perspectiveof Port Authority. This paper is to prove whether the monitoring platform is useful for performanceimprovement by constructing a prototype [2] of port performance monitoring system.
PoC (Proof of Concept) is a realization of a certain method or idea in order to demonstrateits feasibility [3]. Port Authority including central or local government is continually checking theperformance of the terminal they invested in and want to reflect it in the development policy. They alsowant to increase competitiveness by checking performance levels, such as cargo volume, calling ships,resource utilization, and congestion.
J. Mar. Sci. Eng. 2020, 8, 971; doi:10.3390/jmse8120971 www.mdpi.com/journal/jmse
J. Mar. Sci. Eng. 2020, 8, 971 2 of 20
In order to immediately check the terminal performance, data must be input from individualterminals in real time. This study start defining the monitoring indicators for each stage by dividingthe process from the ship’s entry to departure. We will develop a prototype of performance monitoringplatform to conceptually prove that it works as intended.
As monitoring system is to be used by Ministry of Ocean and Fishery (MOF), Port Authority (PA)and TOC (Terminal Operating Company) [4], it is necessary to analysis the relationship between sourcedata as external entities and the system as internal system. The process, ERA (Entity RelationshipAttribute) diagram and User View for creating PPI (Port Performance Indicator) must be designedduring implementing PoC.
The definition and calculation formula of PPI has been studied by researchers and practitioners,but there is no systematic approach to creating them for Port Authority in real time as a platformtype. The contribution of this paper is that the existing PPI was systematically classified and a newPPI, such as truck turnaround time, was proposed. Furthermore, it proved a system that can producethe defined PPI in real time by linking with the existing Terminal Operating System (TOS) and PortManagement Information System (MIS).
Based on PPI, the paper discusses what data to collect, how to build a database, what type ofsystem architecture does it have as a tool of PoC. Source data is collected from MOF and TOC and theoutput of monitoring platform is provided to MOF, PA, TOC, shipping company, etc. The data used inthis study are batch data and have limitations in real-time data monitoring. This paper consists of sixsteps as follows.
(1) First step is to define a PPI to understand the container terminal’s performance. PPI is definedaccording to the criteria of output, productivity, utilization and service.
(2) Second step is to collect data from TOC. This is the data regarding to berth facility and activity,yard facility and activity during one year (refer to Appendix A Tables A1–A4). For data collection.There are 19 terminals for collecting data within Busan port, Incheon port, Gwangyang port,Pyeongtaek port, and Ulsan port.
(3) Third step is to collect data from Port-MIS of MOF. Data consists of port code, port name, call sign,number of arrivals by year, ship name, facility code, facility name, port facility use purpose code,port facility use purpose name, start date and time, end of use date and time (refer Appendix ATables A5 and A6).
(4) Fourth step is to design the architecture of the monitoring platform. In this study, four components:data presentation, data process and data interface and middleware are designed.
(5) Fifth step is to design and implement database. Then, the collected data is input into the databasein order to produce the result.
(6) Sixth step is to design the PPIs’ presentation format which is suitable for performance managementas user view.
(7) Seventh step is to create a program that connects the database and graphic tool, SQL (StructuredQuery Language), web program language.
2. Methods
To develop a PPI monitoring platform, the development methodology, such as waterfall, spiral,agile rapid development, software prototyping, and incremental, is required [5]. In this study,rapid prototyping will be used for monitoring platform development because prototyping can improvethe quality of requirements and specifications provided to developers [6]. This refers to the creation ofa model that will eventually be discarded rather than becoming part of the final delivered software.After preliminary requirements gathering is accomplished, a simple working model of the systemis constructed to visually show the users what their requirements may look like when they areimplemented into a finished system [7]. The prototype is developed through the following procedure(refer Table 1).
J. Mar. Sci. Eng. 2020, 8, 971 3 of 20
Table 1. Research steps and results.
Research Steps. Description Findings
PPI (Port PerformanceIndicator) Definition
Selected 14 PPIs for monitoring that PA (PortAuthority) are interested in
Figures 1 and 2Table 3
User Query Definition User queries are defined using PPI Table 3
Data Collection Selecting 19 terminals for collecting data,including Busan Port
Appendix A Table A1Table 4
Data Item and FormatDesign
Design of data items related to terminalspecifications, ship entry and exit, cargo
handling, utilization of equipment, and truckentry and exit records
Appendix A Tables A1–A5
Design of Business FlowDiagram
Defines external entities and internalcomponents of the system. Figure 3
Design of SystemArchitecture
Design system internal componentsconsisting of data presentation, data process
and data interface and middleware.Figure 4
Entity RelationshipDiagram Design
Design ERD (Entity Relationship Diagram)for 4 representative PPIs in the ship entry and
departure process.Figure 5, 7, 9, and 11
Programming forPrototype
Four PPIs were programmed using adatabase, graphic tool, and web
programming language.Figure 6, 8, 10 and 12
(1) First is to identify basic requirements: Determine basic requirements including the input andoutput information desired. Details, such as security, can typically be ignored. In this step,the PPIs to be monitored are defined. PPI selection is defined by referring to previous studies andthe procedure of call ship and cargo in port. After selection of PPI, they are confirmed throughconsultation with officials of PA.
(2) Second is to develop initial prototype: After the initial prototype is developed that includesonly user interfaces and database interface. In this step, the PPI defined in step (1) is created.Here, proof of concept is attempted for four of the PPIs. The four PPIs are representative ofship entry and departure processes, and consist of ship waiting ratio, berth occupancy, storageutilization, and truck turnaround time.
(3) Third is to review the prototype: The customers, including end-users, examine the prototype andprovide feedback on potential additions or changes.
(4) Fourth is to revise and enhance the prototype: Using the feedback both the specifications and theprototype can be improved. Negotiation about what is within the scope of the contract/productmay be necessary. If changes are introduced, then a repeat of steps (3) and (4) may be needed.The result is shown on confidential web address [8].
3. Results
3.1. PPI for Ship Arrival—Unloading—Stocking—Ship Depart
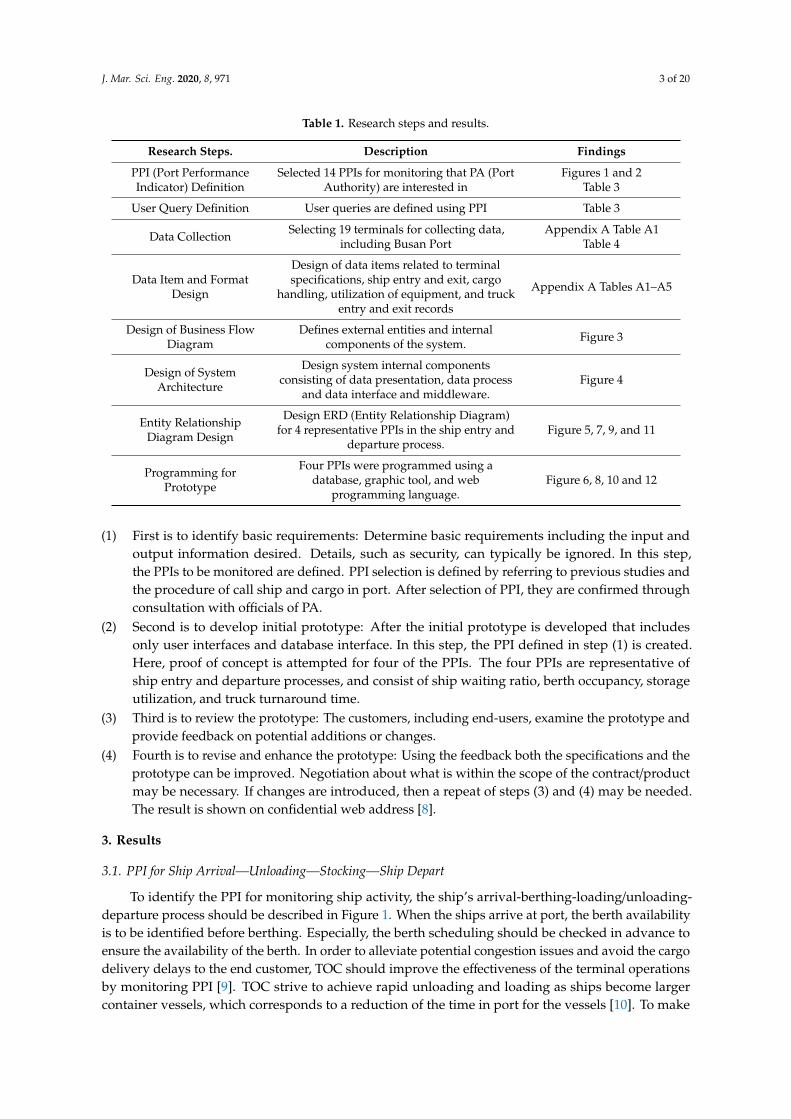
To identify the PPI for monitoring ship activity, the ship’s arrival-berthing-loading/unloading-departure process should be described in Figure 1. When the ships arrive at port, the berth availabilityis to be identified before berthing. Especially, the berth scheduling should be checked in advance toensure the availability of the berth. In order to alleviate potential congestion issues and avoid the cargodelivery delays to the end customer, TOC should improve the effectiveness of the terminal operationsby monitoring PPI [9]. TOC strive to achieve rapid unloading and loading as ships become largercontainer vessels, which corresponds to a reduction of the time in port for the vessels [10]. To make
J. Mar. Sci. Eng. 2020, 8, 971 4 of 20
ships at Yangsan Port congested and shorten unloading time, Double-Line Shipping Mooring (DLSM)mode in enforced [11]. For monitoring port capacity, BAP (Berth Allocation Problem) must be solvedin extensive simulations, needed to account for ship traffic and handling times uncertainties [12].Efficient seaside operations are critical for TOC performance, as disruptions in the seaside operationsmay significantly delay service of the arriving vessels [13]. It is an important issue to measure theperformance of the berth and prepare countermeasures due to the enlargement of ships and the increasein cargo volume. The solution affects the operational performance of the whole terminal container [14].If all berths are occupied by ships, then a ship has to wait at anchorage. When the berth is empty,the pilot will embark for berthing, i.e., POB (pilot on board). After the ship is alongside at berth,loading and unloading can be started. If the cargo handling is complete, the ship departs the port.In the ship arrival and berthing process, the indicators of ship waiting time, ship waiting rate and shipturnaround time can be generated in the category of service. The time of the ship’s anchoring and POBare recorded on Port-MIS which is managed by MOF. The berthing and departing time are recorded onTOS which is managed by TOC. Specially, ship waiting time is recorded in PFU (Port Facility Usage)entity in PORT-MIS, which is used when a ship requires a specific berth. Besides, ships’ service time,the number of containers handled and the number of equipment used are recorded in TOS (TerminalOperating System).
· Ship waiting time is defined as total hours that vessels wait for a berth [15].· Ship waiting rate is defined as ship waiting time divided by total service time at berth [15].· Ship turnaround time is defined as total time spent by a ship in port [15–17].
J. Mar. Sci. Eng. 2020, 8, x FOR PEER REVIEW 4 of 18
operations may significantly delay service of the arriving vessels [13]. It is an important issue to
measure the performance of the berth and prepare countermeasures due to the enlargement of ships
and the increase in cargo volume. The solution affects the operational performance of the whole
terminal container [14]. If all berths are occupied by ships, then a ship has to wait at anchorage. When
the berth is empty, the pilot will embark for berthing, i.e., POB (pilot on board). After the ship is
alongside at berth, loading and unloading can be started. If the cargo handling is complete, the ship
departs the port. In the ship arrival and berthing process, the indicators of ship waiting time, ship
waiting rate and ship turnaround time can be generated in the category of service. The time of the
ship’s anchoring and POB are recorded on Port-MIS which is managed by MOF. The berthing and
departing time are recorded on TOS which is managed by TOC. Specially, ship waiting time is
recorded in PFU (Port Facility Usage) entity in PORT-MIS, which is used when a ship requires a
specific berth. Besides, ships’ service time, the number of containers handled and the number of
equipment used are recorded in TOS (Terminal Operating System).
Ship waiting time is defined as total hours that vessels wait for a berth [15].
Ship waiting rate is defined as ship waiting time divided by total service time at berth [15].
Ship turnaround time is defined as total time spent by a ship in port [15–17].
Figure 1. Procedure of ship arrival-waiting-berthing-handling-departure.
3.2. Ship Berthing-Unloading-Ship Departing Process
When the ship docks, Quay Cranes (QCs) are used for unloading and loading. When the loading
and unloading work is completed, the ship departs the berth. In this process, performance indicators
of quay crane productivity, ship productivity, berth productivity, berth throughput, ship throughput,
and berth occupancy are derived with following definition.
Quay crane productivity is defined as handled containers divided by total number of crane-
hours worked [15–18].
Ship productivity is defined as handled containers divided by ship-hours worked at berth
[2,15–17].
Berth productivity is defined as handled containers divided by service-hours worked at berth
[16–18].
Berth throughput is defined as handled containers at berth in a time of period [16,18].
Ship throughput is defined as handled containers at berth and in port in a time of period
[15,16].
Berth occupancy is defined as the ratio of time that the berth is occupied by a vessel to the total
time available in that period [15,16,18].
Figure 1. Procedure of ship arrival-waiting-berthing-handling-departure.
3.2. Ship Berthing-Unloading-Ship Departing Process
When the ship docks, Quay Cranes (QCs) are used for unloading and loading. When the loadingand unloading work is completed, the ship departs the berth. In this process, performance indicatorsof quay crane productivity, ship productivity, berth productivity, berth throughput, ship throughput,and berth occupancy are derived with following definition.
· Quay crane productivity is defined as handled containers divided by total number of crane-hours worked [15–18].
· Ship productivity is defined as handled containers divided by ship-hours worked at berth [2,15–17].· Berth productivity is defined as handled containers divided by service-hours worked
at berth [16–18].· Berth throughput is defined as handled containers at berth in a time of period [16,18].· Ship throughput is defined as handled containers at berth and in port in a time of period [15,16].· Berth occupancy is defined as the ratio of time that the berth is occupied by a vessel to the total
time available in that period [15,16,18].
J. Mar. Sci. Eng. 2020, 8, 971 5 of 20
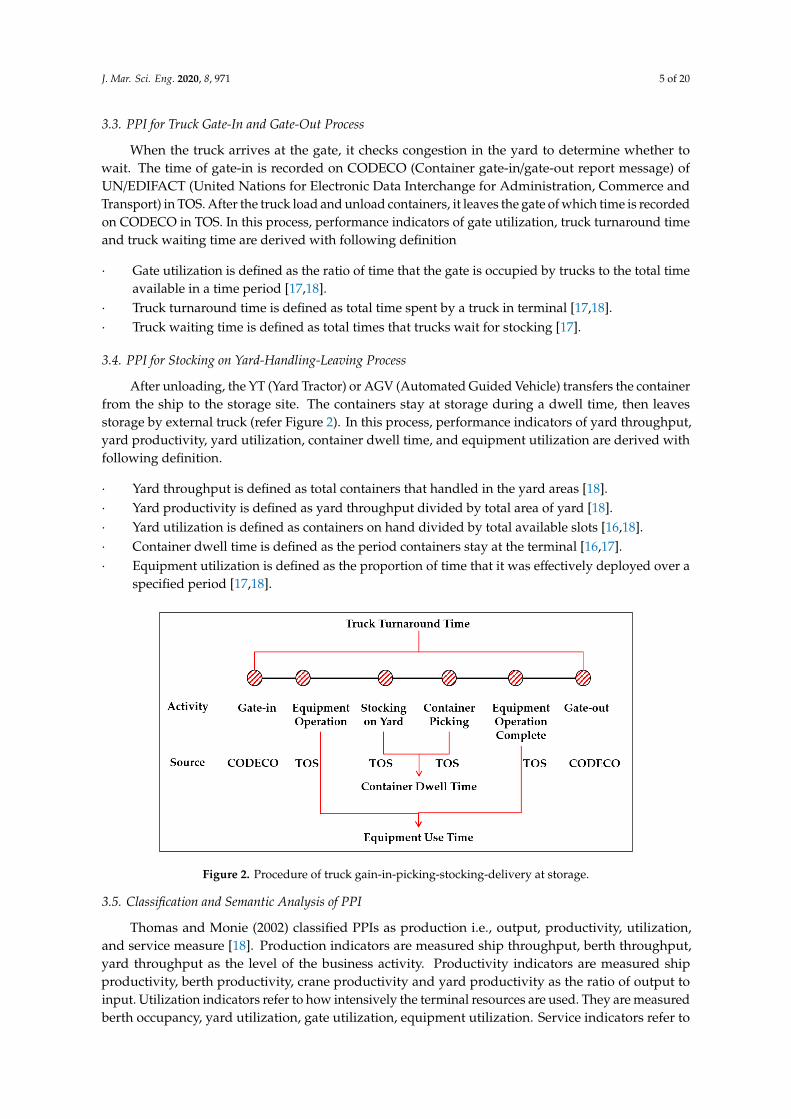
3.3. PPI for Truck Gate-In and Gate-Out Process
When the truck arrives at the gate, it checks congestion in the yard to determine whether towait. The time of gate-in is recorded on CODECO (Container gate-in/gate-out report message) ofUN/EDIFACT (United Nations for Electronic Data Interchange for Administration, Commerce andTransport) in TOS. After the truck load and unload containers, it leaves the gate of which time is recordedon CODECO in TOS. In this process, performance indicators of gate utilization, truck turnaround timeand truck waiting time are derived with following definition
· Gate utilization is defined as the ratio of time that the gate is occupied by trucks to the total timeavailable in a time period [17,18].
· Truck turnaround time is defined as total time spent by a truck in terminal [17,18].· Truck waiting time is defined as total times that trucks wait for stocking [17].
3.4. PPI for Stocking on Yard-Handling-Leaving Process
After unloading, the YT (Yard Tractor) or AGV (Automated Guided Vehicle) transfers the containerfrom the ship to the storage site. The containers stay at storage during a dwell time, then leavesstorage by external truck (refer Figure 2). In this process, performance indicators of yard throughput,yard productivity, yard utilization, container dwell time, and equipment utilization are derived withfollowing definition.
· Yard throughput is defined as total containers that handled in the yard areas [18].· Yard productivity is defined as yard throughput divided by total area of yard [18].· Yard utilization is defined as containers on hand divided by total available slots [16,18].· Container dwell time is defined as the period containers stay at the terminal [16,17].· Equipment utilization is defined as the proportion of time that it was effectively deployed over a
specified period [17,18].
J. Mar. Sci. Eng. 2020, 8, x FOR PEER REVIEW 5 of 18
3.3. PPI for Truck Gate-In and Gate-Out Process
When the truck arrives at the gate, it checks congestion in the yard to determine whether to wait.
The time of gate-in is recorded on CODECO (Container gate-in/gate-out report message) of
UN/EDIFACT (United Nations for Electronic Data Interchange for Administration, Commerce and
Transport) in TOS. After the truck load and unload containers, it leaves the gate of which time is
recorded on CODECO in TOS. In this process, performance indicators of gate utilization, truck
turnaround time and truck waiting time are derived with following definition
Gate utilization is defined as the ratio of time that the gate is occupied by trucks to the total time
available in a time period [17,18].
Truck turnaround time is defined as total time spent by a truck in terminal [17,18].
Truck waiting time is defined as total times that trucks wait for stocking [17].
3.4. PPI for Stocking on Yard-Handling-Leaving Process
After unloading, the YT (Yard Tractor) or AGV (Automated Guided Vehicle) transfers the
container from the ship to the storage site. The containers stay at storage during a dwell time, then
leaves storage by external truck (refer Figure 2). In this process, performance indicators of yard
throughput, yard productivity, yard utilization, container dwell time, and equipment utilization are
derived with following definition.
Yard throughput is defined as total containers that handled in the yard areas [18].
Yard productivity is defined as yard throughput divided by total area of yard [18].
Yard utilization is defined as containers on hand divided by total available slots [16,18].
Container dwell time is defined as the period containers stay at the terminal [16,17].
Equipment utilization is defined as the proportion of time that it was effectively deployed over
a specified period [17,18].
Figure 2. Procedure of truck gain-in-picking-stocking-delivery at storage.
3.5. Classification and Semantic Analysis of PPI
Thomas and Monie (2002) classified PPIs as production i.e., output, productivity, utilization, and
service measure [18]. Production indicators are measured ship throughput, berth throughput, yard
throughput as the level of the business activity. Productivity indicators are measured ship
productivity, berth productivity, crane productivity and yard productivity as the ratio of output to
input. Utilization indicators refer to how intensively the terminal resources are used. They are
measured berth occupancy, yard utilization, gate utilization, equipment utilization. Service
indicators refer to customer satisfaction with terminal services to customers. They include ship
turnaround time, road vehicle turnaround time. According to the same classification, World Bank
[15], Hebel Mwasengark (2012) [16] defines PPI as shown in Table 2. Amr Arisha and Amr Mahfouz
Figure 2. Procedure of truck gain-in-picking-stocking-delivery at storage.
3.5. Classification and Semantic Analysis of PPI
Thomas and Monie (2002) classified PPIs as production i.e., output, productivity, utilization,and service measure [18]. Production indicators are measured ship throughput, berth throughput,yard throughput as the level of the business activity. Productivity indicators are measured shipproductivity, berth productivity, crane productivity and yard productivity as the ratio of output toinput. Utilization indicators refer to how intensively the terminal resources are used. They are measuredberth occupancy, yard utilization, gate utilization, equipment utilization. Service indicators refer to
J. Mar. Sci. Eng. 2020, 8, 971 6 of 20
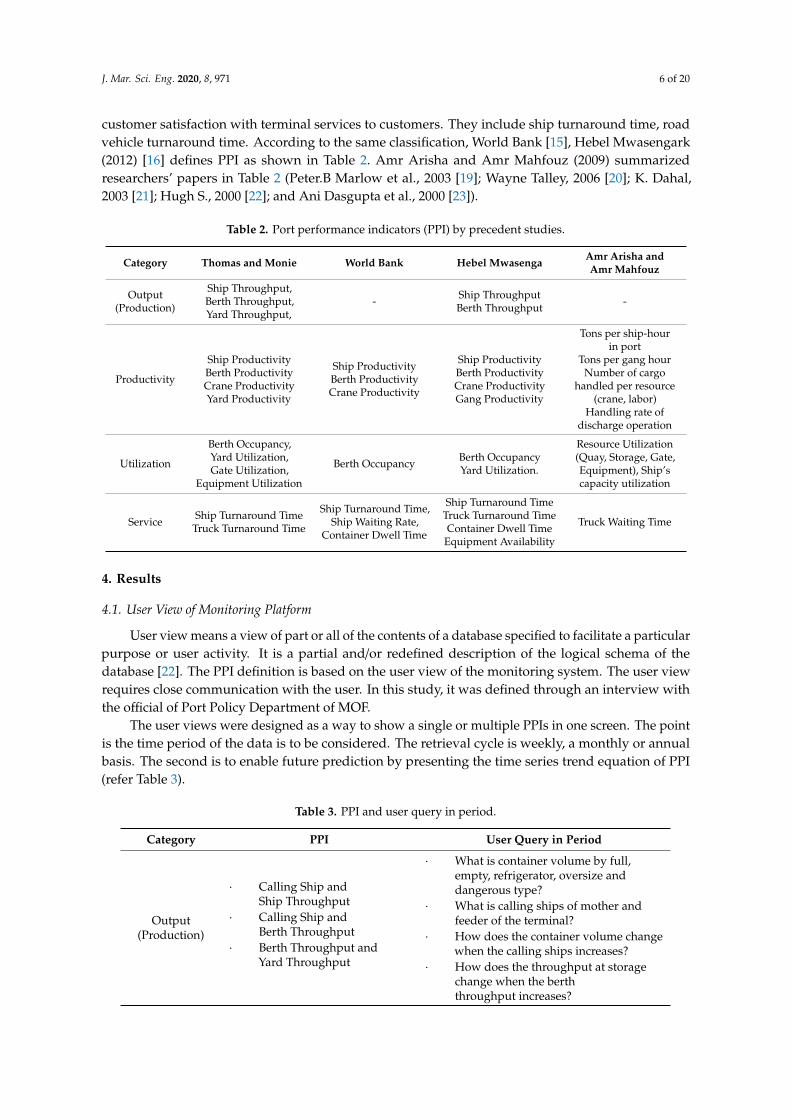
customer satisfaction with terminal services to customers. They include ship turnaround time, roadvehicle turnaround time. According to the same classification, World Bank [15], Hebel Mwasengark(2012) [16] defines PPI as shown in Table 2. Amr Arisha and Amr Mahfouz (2009) summarizedresearchers’ papers in Table 2 (Peter.B Marlow et al., 2003 [19]; Wayne Talley, 2006 [20]; K. Dahal,2003 [21]; Hugh S., 2000 [22]; and Ani Dasgupta et al., 2000 [23]).
Table 2. Port performance indicators (PPI) by precedent studies.
Category Thomas and Monie World Bank Hebel Mwasenga Amr Arisha andAmr Mahfouz
Output(Production)
Ship Throughput,Berth Throughput,Yard Throughput,
- Ship ThroughputBerth Throughput -
Productivity
Ship ProductivityBerth ProductivityCrane ProductivityYard Productivity
Ship ProductivityBerth ProductivityCrane Productivity
Ship ProductivityBerth ProductivityCrane ProductivityGang Productivity
Tons per ship-hourin port
Tons per gang hourNumber of cargo
handled per resource(crane, labor)
Handling rate ofdischarge operation
Utilization
Berth Occupancy,Yard Utilization,Gate Utilization,
Equipment Utilization
Berth Occupancy Berth OccupancyYard Utilization.
Resource Utilization(Quay, Storage, Gate,Equipment), Ship’scapacity utilization
Service Ship Turnaround TimeTruck Turnaround Time
Ship Turnaround Time,Ship Waiting Rate,
Container Dwell Time
Ship Turnaround TimeTruck Turnaround TimeContainer Dwell Time
Equipment Availability
Truck Waiting Time
4. Results
4.1. User View of Monitoring Platform
User view means a view of part or all of the contents of a database specified to facilitate a particularpurpose or user activity. It is a partial and/or redefined description of the logical schema of thedatabase [22]. The PPI definition is based on the user view of the monitoring system. The user viewrequires close communication with the user. In this study, it was defined through an interview withthe official of Port Policy Department of MOF.
The user views were designed as a way to show a single or multiple PPIs in one screen. The pointis the time period of the data is to be considered. The retrieval cycle is weekly, a monthly or annualbasis. The second is to enable future prediction by presenting the time series trend equation of PPI(refer Table 3).
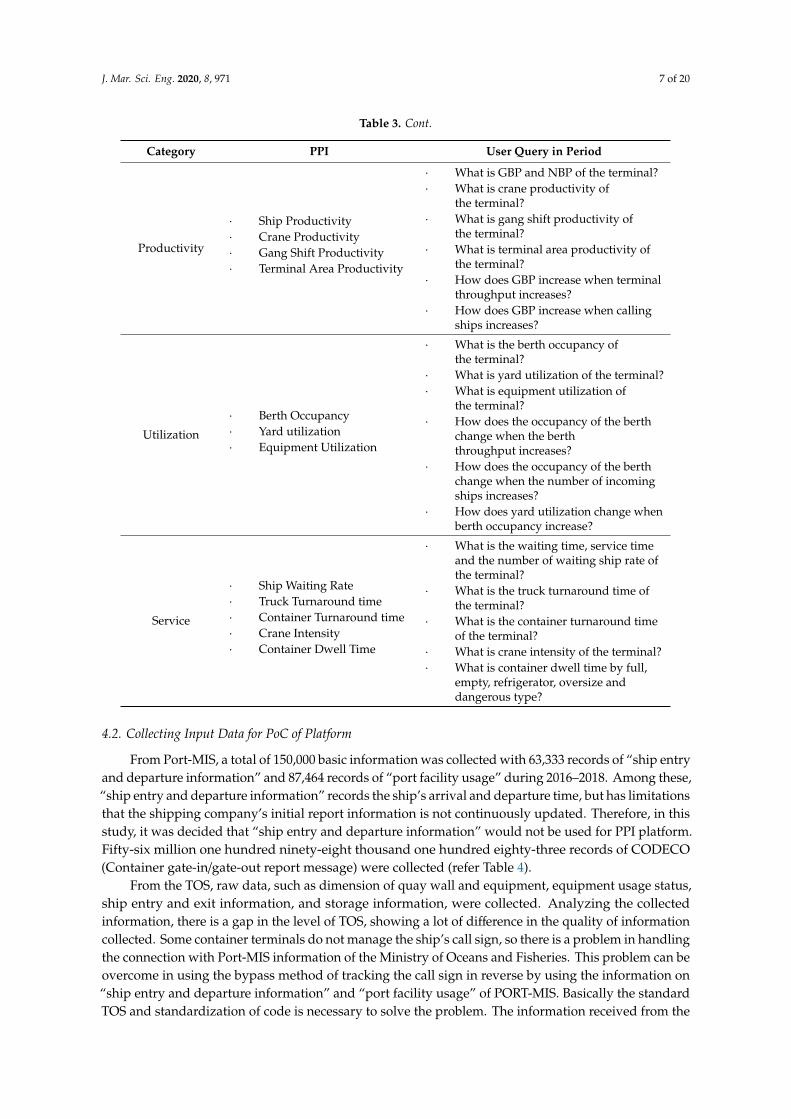
Table 3. PPI and user query in period.
Category PPI User Query in Period
Output(Production)
· Calling Ship andShip Throughput
· Calling Ship andBerth Throughput
· Berth Throughput andYard Throughput
· What is container volume by full,empty, refrigerator, oversize anddangerous type?
· What is calling ships of mother andfeeder of the terminal?
· How does the container volume changewhen the calling ships increases?
· How does the throughput at storagechange when the berththroughput increases?
J. Mar. Sci. Eng. 2020, 8, 971 7 of 20
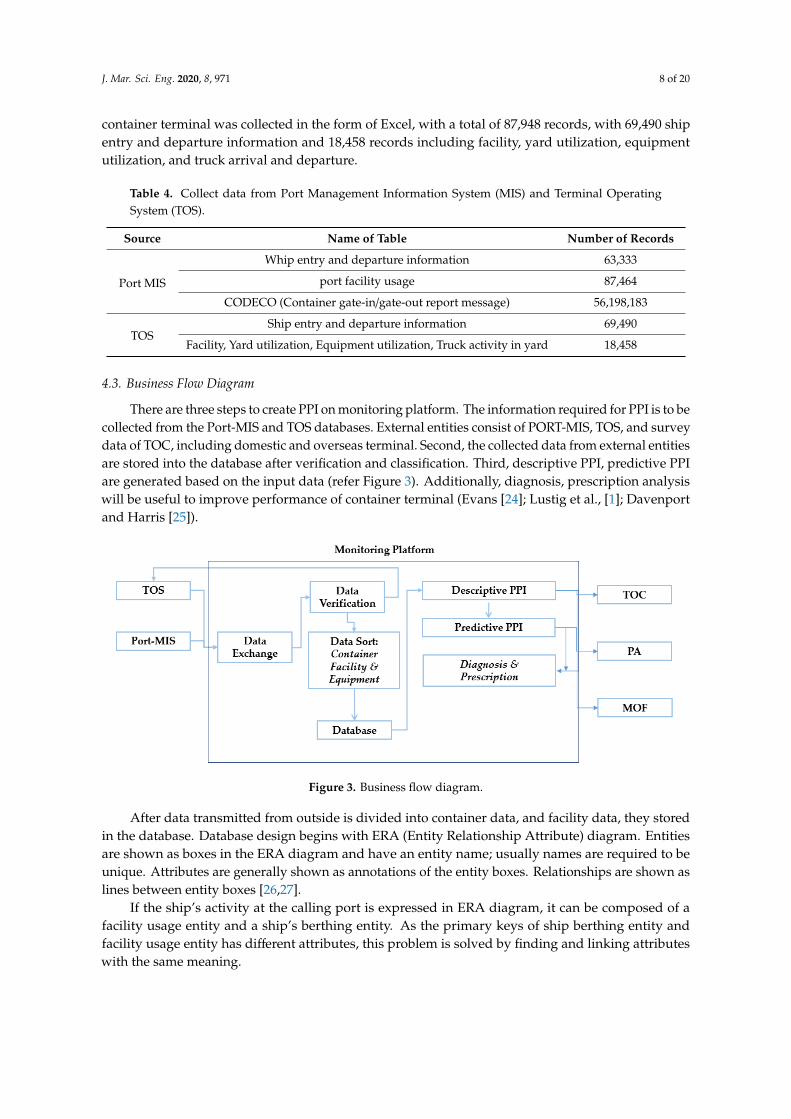
Table 3. Cont.
Category PPI User Query in Period
Productivity
· Ship Productivity· Crane Productivity· Gang Shift Productivity· Terminal Area Productivity
· What is GBP and NBP of the terminal?· What is crane productivity of
the terminal?· What is gang shift productivity of
the terminal?· What is terminal area productivity of
the terminal?· How does GBP increase when terminal
throughput increases?· How does GBP increase when calling
ships increases?
Utilization
· Berth Occupancy· Yard utilization· Equipment Utilization
· What is the berth occupancy ofthe terminal?
· What is yard utilization of the terminal?· What is equipment utilization of
the terminal?· How does the occupancy of the berth
change when the berththroughput increases?
· How does the occupancy of the berthchange when the number of incomingships increases?
· How does yard utilization change whenberth occupancy increase?
Service
· Ship Waiting Rate· Truck Turnaround time· Container Turnaround time· Crane Intensity· Container Dwell Time
· What is the waiting time, service timeand the number of waiting ship rate ofthe terminal?
· What is the truck turnaround time ofthe terminal?
· What is the container turnaround timeof the terminal?
· What is crane intensity of the terminal?· What is container dwell time by full,
empty, refrigerator, oversize anddangerous type?
4.2. Collecting Input Data for PoC of Platform
From Port-MIS, a total of 150,000 basic information was collected with 63,333 records of “ship entryand departure information” and 87,464 records of “port facility usage” during 2016–2018. Among these,“ship entry and departure information” records the ship’s arrival and departure time, but has limitationsthat the shipping company’s initial report information is not continuously updated. Therefore, in thisstudy, it was decided that “ship entry and departure information” would not be used for PPI platform.Fifty-six million one hundred ninety-eight thousand one hundred eighty-three records of CODECO(Container gate-in/gate-out report message) were collected (refer Table 4).
From the TOS, raw data, such as dimension of quay wall and equipment, equipment usage status,ship entry and exit information, and storage information, were collected. Analyzing the collectedinformation, there is a gap in the level of TOS, showing a lot of difference in the quality of informationcollected. Some container terminals do not manage the ship’s call sign, so there is a problem in handlingthe connection with Port-MIS information of the Ministry of Oceans and Fisheries. This problem can beovercome in using the bypass method of tracking the call sign in reverse by using the information on“ship entry and departure information” and “port facility usage” of PORT-MIS. Basically the standardTOS and standardization of code is necessary to solve the problem. The information received from the
J. Mar. Sci. Eng. 2020, 8, 971 8 of 20
container terminal was collected in the form of Excel, with a total of 87,948 records, with 69,490 shipentry and departure information and 18,458 records including facility, yard utilization, equipmentutilization, and truck arrival and departure.
Table 4. Collect data from Port Management Information System (MIS) and Terminal OperatingSystem (TOS).
Source Name of Table Number of Records
Port MIS
Whip entry and departure information 63,333
port facility usage 87,464
CODECO (Container gate-in/gate-out report message) 56,198,183
TOSShip entry and departure information 69,490
Facility, Yard utilization, Equipment utilization, Truck activity in yard 18,458
4.3. Business Flow Diagram
There are three steps to create PPI on monitoring platform. The information required for PPI is to becollected from the Port-MIS and TOS databases. External entities consist of PORT-MIS, TOS, and surveydata of TOC, including domestic and overseas terminal. Second, the collected data from external entitiesare stored into the database after verification and classification. Third, descriptive PPI, predictive PPIare generated based on the input data (refer Figure 3). Additionally, diagnosis, prescription analysiswill be useful to improve performance of container terminal (Evans [24]; Lustig et al., [1]; Davenportand Harris [25]).
J. Mar. Sci. Eng. 2020, 8, x FOR PEER REVIEW 8 of 18
From the TOS, raw data, such as dimension of quay wall and equipment, equipment usage
status, ship entry and exit information, and storage information, were collected. Analyzing the
collected information, there is a gap in the level of TOS, showing a lot of difference in the quality of
information collected. Some container terminals do not manage the ship’s call sign, so there is a
problem in handling the connection with Port-MIS information of the Ministry of Oceans and
Fisheries. This problem can be overcome in using the bypass method of tracking the call sign in
reverse by using the information on “ship entry and departure information” and “port facility usage”
of PORT-MIS. Basically the standard TOS and standardization of code is necessary to solve the
problem. The information received from the container terminal was collected in the form of Excel,
with a total of 87,948 records, with 69,490 ship entry and departure information and 18,458 records
including facility, yard utilization, equipment utilization, and truck arrival and departure.
Table 4. Collect data from Port Management Information System (MIS) and Terminal Operating
System (TOS).
Source Name of Table Number of Records
Port MIS
Whip entry and departure information 63,333
port facility usage 87,464
CODECO (Container gate-in/gate-out report message) 56,198,183
TOS Ship entry and departure information 69,490
Facility, Yard utilization, Equipment utilization, Truck activity in yard 18,458
4.3. Business Flow Diagram
There are three steps to create PPI on monitoring platform. The information required for PPI is
to be collected from the Port-MIS and TOS databases. External entities consist of PORT-MIS, TOS,
and survey data of TOC, including domestic and overseas terminal. Second, the collected data from
external entities are stored into the database after verification and classification. Third, descriptive
PPI, predictive PPI are generated based on the input data (refer Figure 3). Additionally, diagnosis,
prescription analysis will be useful to improve performance of container terminal (Evans [24]; Lustig
et al., [1]; Davenport and Harris [25]).
Figure 3. Business flow diagram.
After data transmitted from outside is divided into container data, and facility data, they stored
in the database. Database design begins with ERA (Entity Relationship Attribute) diagram. Entities
are shown as boxes in the ERA diagram and have an entity name; usually names are required to be
unique. Attributes are generally shown as annotations of the entity boxes. Relationships are shown
as lines between entity boxes [26,27].
If the ship’s activity at the calling port is expressed in ERA diagram, it can be composed of a
facility usage entity and a ship’s berthing entity. As the primary keys of ship berthing entity and
Figure 3. Business flow diagram.
After data transmitted from outside is divided into container data, and facility data, they storedin the database. Database design begins with ERA (Entity Relationship Attribute) diagram. Entitiesare shown as boxes in the ERA diagram and have an entity name; usually names are required to beunique. Attributes are generally shown as annotations of the entity boxes. Relationships are shown aslines between entity boxes [26,27].
If the ship’s activity at the calling port is expressed in ERA diagram, it can be composed of afacility usage entity and a ship’s berthing entity. As the primary keys of ship berthing entity andfacility usage entity has different attributes, this problem is solved by finding and linking attributeswith the same meaning.
J. Mar. Sci. Eng. 2020, 8, 971 9 of 20
4.4. System Architecture of Monitoring Platform
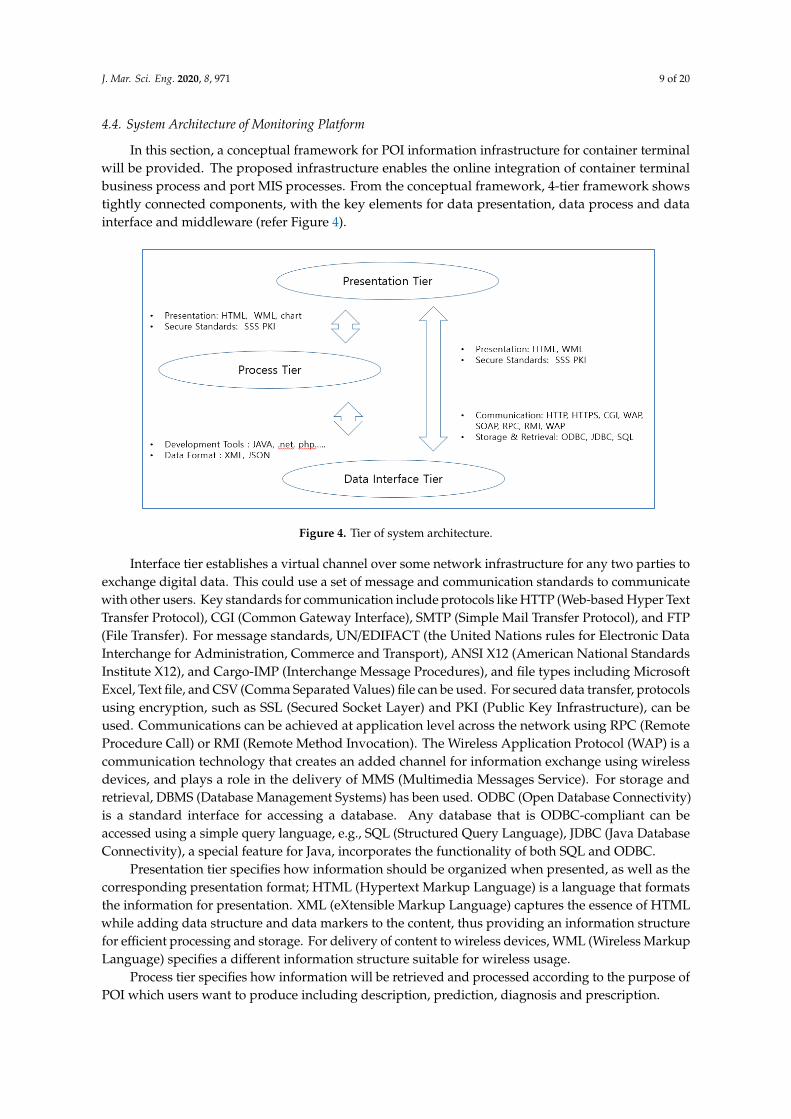
In this section, a conceptual framework for POI information infrastructure for container terminalwill be provided. The proposed infrastructure enables the online integration of container terminalbusiness process and port MIS processes. From the conceptual framework, 4-tier framework showstightly connected components, with the key elements for data presentation, data process and datainterface and middleware (refer Figure 4).
J. Mar. Sci. Eng. 2020, 8, x FOR PEER REVIEW 9 of 18
facility usage entity has different attributes, this problem is solved by finding and linking attributes
with the same meaning.
4.4. System Architecture of Monitoring Platform
In this section, a conceptual framework for POI information infrastructure for container terminal
will be provided. The proposed infrastructure enables the online integration of container terminal
business process and port MIS processes. From the conceptual framework, 4-tier framework shows
tightly connected components, with the key elements for data presentation, data process and data
interface and middleware (refer Figure 4).
Interface tier establishes a virtual channel over some network infrastructure for any two parties
to exchange digital data. This could use a set of message and communication standards to
communicate with other users. Key standards for communication include protocols like HTTP (Web-
based Hyper Text Transfer Protocol), CGI (Common Gateway Interface), SMTP (Simple Mail Transfer
Protocol), and FTP (File Transfer). For message standards, UN/EDIFACT (the United Nations rules
for Electronic Data Interchange for Administration, Commerce and Transport), ANSI X12 (American
National Standards Institute X12), and Cargo-IMP (Interchange Message Procedures), and file types
including Microsoft Excel, Text file, and CSV (Comma Separated Values) file can be used. For secured
data transfer, protocols using encryption, such as SSL (Secured Socket Layer) and PKI (Public Key
Infrastructure), can be used. Communications can be achieved at application level across the network
using RPC (Remote Procedure Call) or RMI (Remote Method Invocation). The Wireless Application
Protocol (WAP) is a communication technology that creates an added channel for information
exchange using wireless devices, and plays a role in the delivery of MMS (Multimedia Messages
Service). For storage and retrieval, DBMS (Database Management Systems) has been used. ODBC
(Open Database Connectivity) is a standard interface for accessing a database. Any database that is
ODBC-compliant can be accessed using a simple query language, e.g., SQL (Structured Query
Language), JDBC (Java Database Connectivity), a special feature for Java, incorporates the
functionality of both SQL and ODBC.
Presentation tier specifies how information should be organized when presented, as well as the
corresponding presentation format; HTML (Hypertext Markup Language) is a language that formats
the information for presentation. XML (eXtensible Markup Language) captures the essence of HTML
while adding data structure and data markers to the content, thus providing an information structure
for efficient processing and storage. For delivery of content to wireless devices, WML (Wireless
Markup Language) specifies a different information structure suitable for wireless usage.
Process tier specifies how information will be retrieved and processed according to the purpose
of POI which users want to produce including description, prediction, diagnosis and prescription.
Figure 4. Tier of system architecture. Figure 4. Tier of system architecture.
Interface tier establishes a virtual channel over some network infrastructure for any two parties toexchange digital data. This could use a set of message and communication standards to communicatewith other users. Key standards for communication include protocols like HTTP (Web-based Hyper TextTransfer Protocol), CGI (Common Gateway Interface), SMTP (Simple Mail Transfer Protocol), and FTP(File Transfer). For message standards, UN/EDIFACT (the United Nations rules for Electronic DataInterchange for Administration, Commerce and Transport), ANSI X12 (American National StandardsInstitute X12), and Cargo-IMP (Interchange Message Procedures), and file types including MicrosoftExcel, Text file, and CSV (Comma Separated Values) file can be used. For secured data transfer, protocolsusing encryption, such as SSL (Secured Socket Layer) and PKI (Public Key Infrastructure), can beused. Communications can be achieved at application level across the network using RPC (RemoteProcedure Call) or RMI (Remote Method Invocation). The Wireless Application Protocol (WAP) is acommunication technology that creates an added channel for information exchange using wirelessdevices, and plays a role in the delivery of MMS (Multimedia Messages Service). For storage andretrieval, DBMS (Database Management Systems) has been used. ODBC (Open Database Connectivity)is a standard interface for accessing a database. Any database that is ODBC-compliant can beaccessed using a simple query language, e.g., SQL (Structured Query Language), JDBC (Java DatabaseConnectivity), a special feature for Java, incorporates the functionality of both SQL and ODBC.
Presentation tier specifies how information should be organized when presented, as well as thecorresponding presentation format; HTML (Hypertext Markup Language) is a language that formatsthe information for presentation. XML (eXtensible Markup Language) captures the essence of HTMLwhile adding data structure and data markers to the content, thus providing an information structurefor efficient processing and storage. For delivery of content to wireless devices, WML (Wireless MarkupLanguage) specifies a different information structure suitable for wireless usage.
Process tier specifies how information will be retrieved and processed according to the purpose ofPOI which users want to produce including description, prediction, diagnosis and prescription.
J. Mar. Sci. Eng. 2020, 8, 971 10 of 20
5. Results
In this chapter, proof of concept will be attempted with four PPIs. Four areas consist of shipwaiting, berth occupancy, yard utilization, and truck turnaround time. To create these PPIs, the ERAdiagrams were derived and a database was created based on them. Based on the ERA, we defined analgorithm for generating PPIs.
In the process tier, we will estimate possible indicators in the future by estimating them as timeseries. In the process tier, we will estimate the indicators that can occur in the future by time seriesestimation. If problems arise in future indicators, we will find reasons to improve these indicators.The cause of the problem for prescription can be considered in various ways, but the monitoringplatform attempted to discover through the interrelationship of the indicators. When a problem-solvingmethod is found, simulation or management science is used to find and implement optimal alternatives.Proof of concept is attempted by comparing the user view designed with the graphic tool and theprototype system output.
5.1. PoC of Ship Waiting in Port
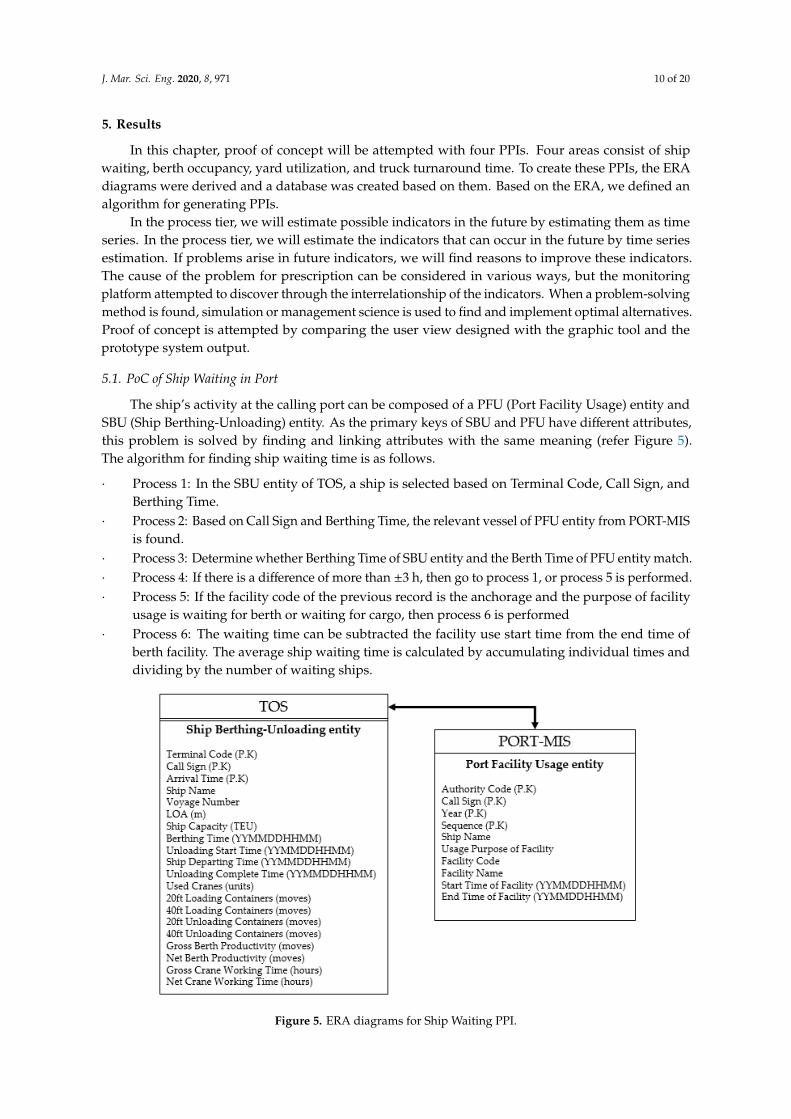
The ship’s activity at the calling port can be composed of a PFU (Port Facility Usage) entity andSBU (Ship Berthing-Unloading) entity. As the primary keys of SBU and PFU have different attributes,this problem is solved by finding and linking attributes with the same meaning (refer Figure 5).The algorithm for finding ship waiting time is as follows.
· Process 1: In the SBU entity of TOS, a ship is selected based on Terminal Code, Call Sign, andBerthing Time.
· Process 2: Based on Call Sign and Berthing Time, the relevant vessel of PFU entity from PORT-MISis found.
· Process 3: Determine whether Berthing Time of SBU entity and the Berth Time of PFU entity match.· Process 4: If there is a difference of more than ±3 h, then go to process 1, or process 5 is performed.· Process 5: If the facility code of the previous record is the anchorage and the purpose of facility
usage is waiting for berth or waiting for cargo, then process 6 is performed· Process 6: The waiting time can be subtracted the facility use start time from the end time of
berth facility. The average ship waiting time is calculated by accumulating individual times anddividing by the number of waiting ships.
J. Mar. Sci. Eng. 2020, 8, x FOR PEER REVIEW 10 of 18
5. Results
In this chapter, proof of concept will be attempted with four PPIs. Four areas consist of ship
waiting, berth occupancy, yard utilization, and truck turnaround time. To create these PPIs, the ERA
diagrams were derived and a database was created based on them. Based on the ERA, we defined an
algorithm for generating PPIs.
In the process tier, we will estimate possible indicators in the future by estimating them as time
series. In the process tier, we will estimate the indicators that can occur in the future by time series
estimation. If problems arise in future indicators, we will find reasons to improve these indicators.
The cause of the problem for prescription can be considered in various ways, but the monitoring
platform attempted to discover through the interrelationship of the indicators. When a problem-
solving method is found, simulation or management science is used to find and implement optimal
alternatives. Proof of concept is attempted by comparing the user view designed with the graphic
tool and the prototype system output.
5.1. PoC of Ship Waiting in Port
The ship’s activity at the calling port can be composed of a PFU (Port Facility Usage) entity and
SBU (Ship Berthing-Unloading) entity. As the primary keys of SBU and PFU have different attributes,
this problem is solved by finding and linking attributes with the same meaning (refer Figure 5). The
algorithm for finding ship waiting time is as follows.
Process 1: In the SBU entity of TOS, a ship is selected based on Terminal Code, Call Sign, and
Berthing Time.
Process 2: Based on Call Sign and Berthing Time, the relevant vessel of PFU entity from PORT-
MIS is found.
Process 3: Determine whether Berthing Time of SBU entity and the Berth Time of PFU entity
match.
Process 4: If there is a difference of more than ±3 h, then go to process 1, or process 5 is performed.
Process 5: If the facility code of the previous record is the anchorage and the purpose of facility
usage is waiting for berth or waiting for cargo, then process 6 is performed
Process 6: The waiting time can be subtracted the facility use start time from the end time of
berth facility. The average ship waiting time is calculated by accumulating individual times and
dividing by the number of waiting ships.
Figure 5. ERA diagrams for Ship Waiting PPI. Figure 5. ERA diagrams for Ship Waiting PPI.
J. Mar. Sci. Eng. 2020, 8, 971 11 of 20
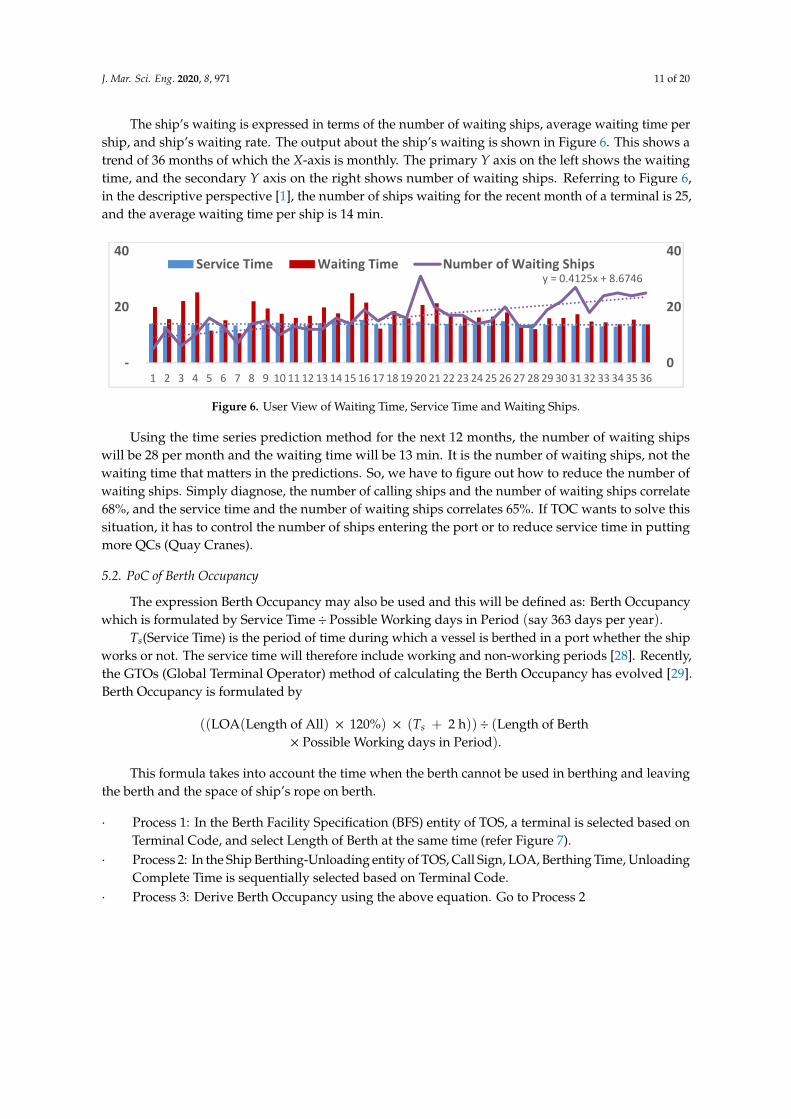
The ship’s waiting is expressed in terms of the number of waiting ships, average waiting time pership, and ship’s waiting rate. The output about the ship’s waiting is shown in Figure 6. This shows atrend of 36 months of which the X-axis is monthly. The primary Y axis on the left shows the waitingtime, and the secondary Y axis on the right shows number of waiting ships. Referring to Figure 6,in the descriptive perspective [1], the number of ships waiting for the recent month of a terminal is 25,and the average waiting time per ship is 14 min.
Figure 6. User View of Waiting Time, Service Time and Waiting Ships
4.2 Berth Occupancy
The expression Berth Occupancy may also be used and this will be defined as: Berth Occupancy = Service Time/Possible Working days in Period (say 363 days per year). Ts (Service Time) is the period of time during which a vessel is berthed in a port whether the ship works or not. The service time will therefore include working and non-working periods [19]. Recently, the GTOs’ method of calculating the Berth Occupancy has evolved [20]. This has been defined as Berth Occupancy = ((LOA x 120%) X (Ts + two hours)) / (Length of Berth X Possible Working days in Period). This is because it takes into account the time when the berth cannot be used in berthing and leaving the berth and the space of ship’s rope on berth.
Process ①: In the Berth Facility Specification(BFS) entity of TOS, a terminal is selected based on Terminal Code, and select Length of Berth at the same time.
Process ②: In the Ship Berthing-Unloading entity of TOS, Call Sign, LOA, Berthing Time, Unloading Complete Time is sequentially selected based on Terminal Code.
Process ③: LOA*120% and Ts + 2 hours are summed over a certain period of time to be a
numerator. Go to Process ②
Process ④: When processes ② and ③ for a certain period are completed, the length of the berth is multiplied by the period to obtain the denominator.
Process ⑤: Dividing the result of Process ③ by the result of the process ④ gives the occupancy of the berth over a period of time.
y = 0.4125x + 8.6746
0
20
40
-
20
40
1 2 3 4 5 6 7 8 9 10 11 12 13 14 15 16 17 18 19 20 21 22 23 24 25 26 27 28 29 30 31 32 33 34 35 36
Service Time Waiting Time Number of Waiting Ships
y = 0.4125x + 8.6746
0
20
40
-
20
40
1 2 3 4 5 6 7 8 9 10 11 12 13 14 15 16 17 18 19 20 21 22 23 24 25 26 27 28 29 30 31 32 33 34 35 36
Service Time Waiting Time Number of Waiting ShipsFigure 6. User View of Waiting Time, Service Time and Waiting Ships.
Using the time series prediction method for the next 12 months, the number of waiting shipswill be 28 per month and the waiting time will be 13 min. It is the number of waiting ships, not thewaiting time that matters in the predictions. So, we have to figure out how to reduce the number ofwaiting ships. Simply diagnose, the number of calling ships and the number of waiting ships correlate68%, and the service time and the number of waiting ships correlates 65%. If TOC wants to solve thissituation, it has to control the number of ships entering the port or to reduce service time in puttingmore QCs (Quay Cranes).
5.2. PoC of Berth Occupancy
The expression Berth Occupancy may also be used and this will be defined as: Berth Occupancywhich is formulated by Service Time÷ Possible Working days in Period (say 363 days per year).
Ts(Service Time) is the period of time during which a vessel is berthed in a port whether the shipworks or not. The service time will therefore include working and non-working periods [28]. Recently,the GTOs (Global Terminal Operator) method of calculating the Berth Occupancy has evolved [29].Berth Occupancy is formulated by
((LOA(Length of All) × 120%) × (Ts + 2 h)) ÷ (Length of Berth× Possible Working days in Period).
This formula takes into account the time when the berth cannot be used in berthing and leavingthe berth and the space of ship’s rope on berth.
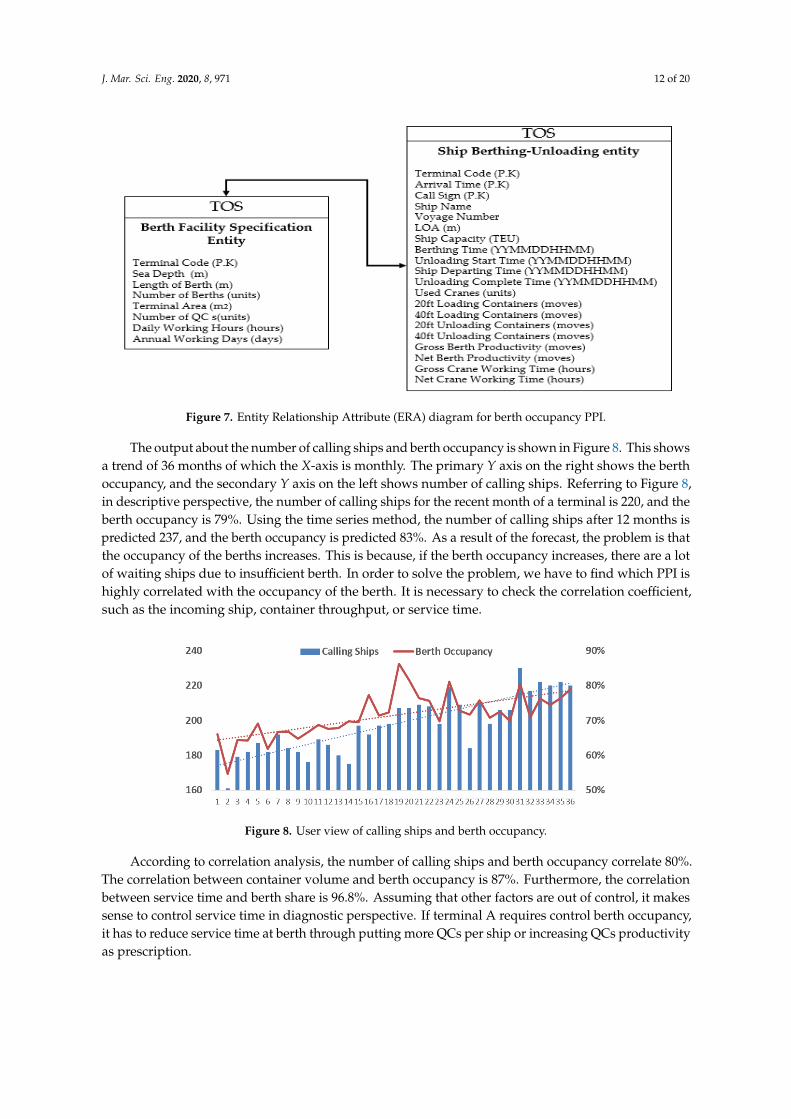
· Process 1: In the Berth Facility Specification (BFS) entity of TOS, a terminal is selected based onTerminal Code, and select Length of Berth at the same time (refer Figure 7).
· Process 2: In the Ship Berthing-Unloading entity of TOS, Call Sign, LOA, Berthing Time, UnloadingComplete Time is sequentially selected based on Terminal Code.
· Process 3: Derive Berth Occupancy using the above equation. Go to Process 2
J. Mar. Sci. Eng. 2020, 8, 971 12 of 20J. Mar. Sci. Eng. 2020, 8, x FOR PEER REVIEW 12 of 18
Figure 7. Entity Relationship Attribute (ERA) diagram for berth occupancy PPI.
The output about the number of calling ships and berth occupancy is shown in Figure 8. This
shows a trend of 36 months of which the X-axis is monthly. The primary Y axis on the right shows
the berth occupancy, and the secondary Y axis on the left shows number of calling ships. Referring
to Figure 8, in descriptive perspective, the number of calling ships for the recent month of a terminal
is 220, and the berth occupancy is 79%. Using the time series method, the number of calling ships
after 12 months is predicted 237, and the berth occupancy is predicted 83%. As a result of the forecast,
the problem is that the occupancy of the berths increases. This is because, if the berth occupancy
increases, there are a lot of waiting ships due to insufficient berth. In order to solve the problem, we
have to find which PPI is highly correlated with the occupancy of the berth. It is necessary to check
the correlation coefficient, such as the incoming ship, container throughput, or service time.
Figure 8. User view of calling ships and berth occupancy.
According to correlation analysis, the number of calling ships and berth occupancy correlate
80%. The correlation between container volume and berth occupancy is 87%. Furthermore, the
correlation between service time and berth share is 96.8%. Assuming that other factors are out of
control, it makes sense to control service time in diagnostic perspective. If terminal A requires control
berth occupancy, it has to reduce service time at berth through putting more QCs per ship or
increasing QCs productivity as prescription.
Figure 7. Entity Relationship Attribute (ERA) diagram for berth occupancy PPI.
The output about the number of calling ships and berth occupancy is shown in Figure 8. This showsa trend of 36 months of which the X-axis is monthly. The primary Y axis on the right shows the berthoccupancy, and the secondary Y axis on the left shows number of calling ships. Referring to Figure 8,in descriptive perspective, the number of calling ships for the recent month of a terminal is 220, and theberth occupancy is 79%. Using the time series method, the number of calling ships after 12 months ispredicted 237, and the berth occupancy is predicted 83%. As a result of the forecast, the problem is thatthe occupancy of the berths increases. This is because, if the berth occupancy increases, there are a lotof waiting ships due to insufficient berth. In order to solve the problem, we have to find which PPI ishighly correlated with the occupancy of the berth. It is necessary to check the correlation coefficient,such as the incoming ship, container throughput, or service time.
J. Mar. Sci. Eng. 2020, 8, x FOR PEER REVIEW 12 of 18
Figure 7. Entity Relationship Attribute (ERA) diagram for berth occupancy PPI.
The output about the number of calling ships and berth occupancy is shown in Figure 8. This
shows a trend of 36 months of which the X-axis is monthly. The primary Y axis on the right shows
the berth occupancy, and the secondary Y axis on the left shows number of calling ships. Referring
to Figure 8, in descriptive perspective, the number of calling ships for the recent month of a terminal
is 220, and the berth occupancy is 79%. Using the time series method, the number of calling ships
after 12 months is predicted 237, and the berth occupancy is predicted 83%. As a result of the forecast,
the problem is that the occupancy of the berths increases. This is because, if the berth occupancy
increases, there are a lot of waiting ships due to insufficient berth. In order to solve the problem, we
have to find which PPI is highly correlated with the occupancy of the berth. It is necessary to check
the correlation coefficient, such as the incoming ship, container throughput, or service time.
Figure 8. User view of calling ships and berth occupancy.
According to correlation analysis, the number of calling ships and berth occupancy correlate
80%. The correlation between container volume and berth occupancy is 87%. Furthermore, the
correlation between service time and berth share is 96.8%. Assuming that other factors are out of
control, it makes sense to control service time in diagnostic perspective. If terminal A requires control
berth occupancy, it has to reduce service time at berth through putting more QCs per ship or
increasing QCs productivity as prescription.
Figure 8. User view of calling ships and berth occupancy.
According to correlation analysis, the number of calling ships and berth occupancy correlate 80%.The correlation between container volume and berth occupancy is 87%. Furthermore, the correlationbetween service time and berth share is 96.8%. Assuming that other factors are out of control, it makessense to control service time in diagnostic perspective. If terminal A requires control berth occupancy,it has to reduce service time at berth through putting more QCs per ship or increasing QCs productivityas prescription.
J. Mar. Sci. Eng. 2020, 8, 971 13 of 20
5.3. PoC of Yard Utilization
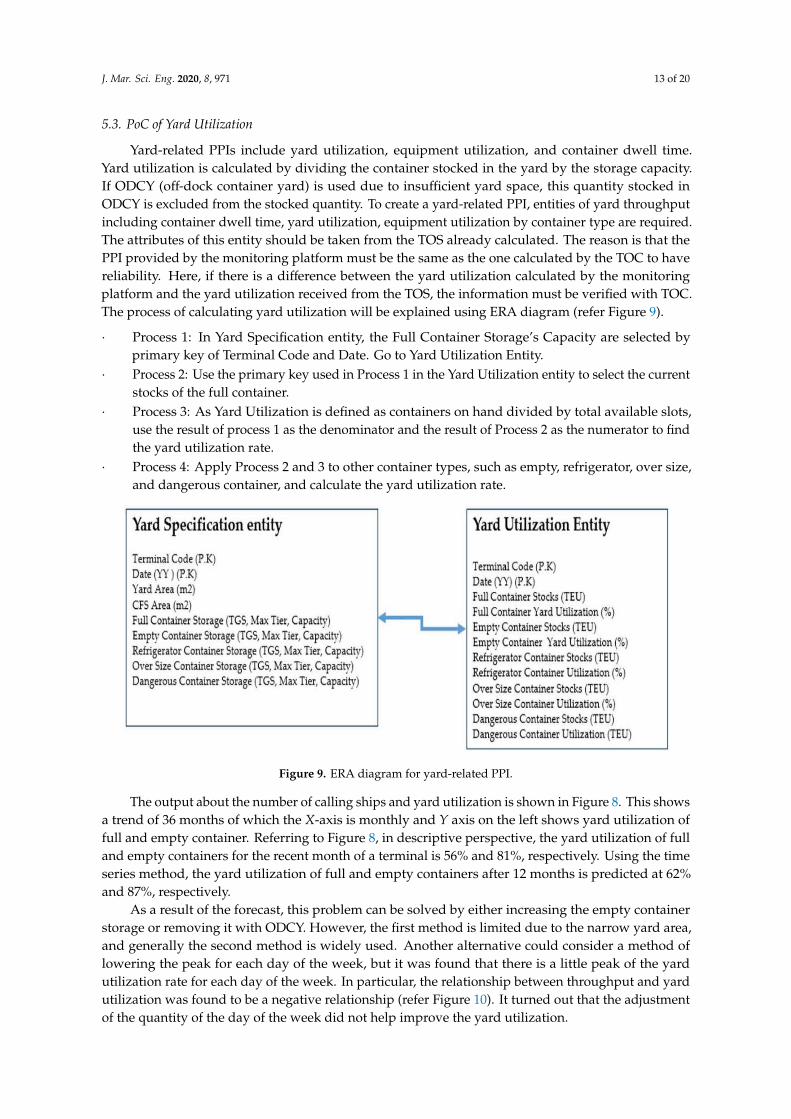
Yard-related PPIs include yard utilization, equipment utilization, and container dwell time.Yard utilization is calculated by dividing the container stocked in the yard by the storage capacity.If ODCY (off-dock container yard) is used due to insufficient yard space, this quantity stocked inODCY is excluded from the stocked quantity. To create a yard-related PPI, entities of yard throughputincluding container dwell time, yard utilization, equipment utilization by container type are required.The attributes of this entity should be taken from the TOS already calculated. The reason is that thePPI provided by the monitoring platform must be the same as the one calculated by the TOC to havereliability. Here, if there is a difference between the yard utilization calculated by the monitoringplatform and the yard utilization received from the TOS, the information must be verified with TOC.The process of calculating yard utilization will be explained using ERA diagram (refer Figure 9).
· Process 1: In Yard Specification entity, the Full Container Storage’s Capacity are selected byprimary key of Terminal Code and Date. Go to Yard Utilization Entity.
· Process 2: Use the primary key used in Process 1 in the Yard Utilization entity to select the currentstocks of the full container.
· Process 3: As Yard Utilization is defined as containers on hand divided by total available slots,use the result of process 1 as the denominator and the result of Process 2 as the numerator to findthe yard utilization rate.
· Process 4: Apply Process 2 and 3 to other container types, such as empty, refrigerator, over size,and dangerous container, and calculate the yard utilization rate.
J. Mar. Sci. Eng. 2020, 8, x FOR PEER REVIEW 13 of 18
5.3. PoC of Yard Utilization
Yard-related PPIs include yard utilization, equipment utilization, and container dwell time.
Yard utilization is calculated by dividing the container stocked in the yard by the storage capacity. If
ODCY (off-dock container yard) is used due to insufficient yard space, this quantity stocked in ODCY
is excluded from the stocked quantity. To create a yard-related PPI, entities of yard throughput
including container dwell time, yard utilization, equipment utilization by container type are
required. The attributes of this entity should be taken from the TOS already calculated. The reason is
that the PPI provided by the monitoring platform must be the same as the one calculated by the TOC
to have reliability. Here, if there is a difference between the yard utilization calculated by the
monitoring platform and the yard utilization received from the TOS, the information must be verified
with TOC. The process of calculating yard utilization will be explained using ERA diagram (refer
Figure 9).
Process 1: In Yard Specification entity, the Full Container Storage’s Capacity are selected by
primary key of Terminal Code and Date. Go to Yard Utilization Entity.
Process 2: Use the primary key used in Process 1 in the Yard Utilization entity to select the
current stocks of the full container.
Process 3: As Yard Utilization is defined as containers on hand divided by total available slots,
use the result of process 1 as the denominator and the result of Process 2 as the numerator to
find the yard utilization rate.
Process 4: Apply Process 2 and 3 to other container types, such as empty, refrigerator, over size,
and dangerous container, and calculate the yard utilization rate.
Figure 9. ERA diagram for yard-related PPI.
The output about the number of calling ships and yard utilization is shown in Figure 8. This
shows a trend of 36 months of which the X-axis is monthly and Y axis on the left shows yard
utilization of full and empty container. Referring to Figure 8, in descriptive perspective, the yard
utilization of full and empty containers for the recent month of a terminal is 56% and 81%,
respectively. Using the time series method, the yard utilization of full and empty containers after 12
months is predicted at 62% and 87%, respectively.
As a result of the forecast, this problem can be solved by either increasing the empty container
storage or removing it with ODCY. However, the first method is limited due to the narrow yard area,
and generally the second method is widely used. Another alternative could consider a method of
lowering the peak for each day of the week, but it was found that there is a little peak of the yard
utilization rate for each day of the week. In particular, the relationship between throughput and yard
utilization was found to be a negative relationship (refer Figure 10). It turned out that the adjustment
of the quantity of the day of the week did not help improve the yard utilization.
Figure 9. ERA diagram for yard-related PPI.
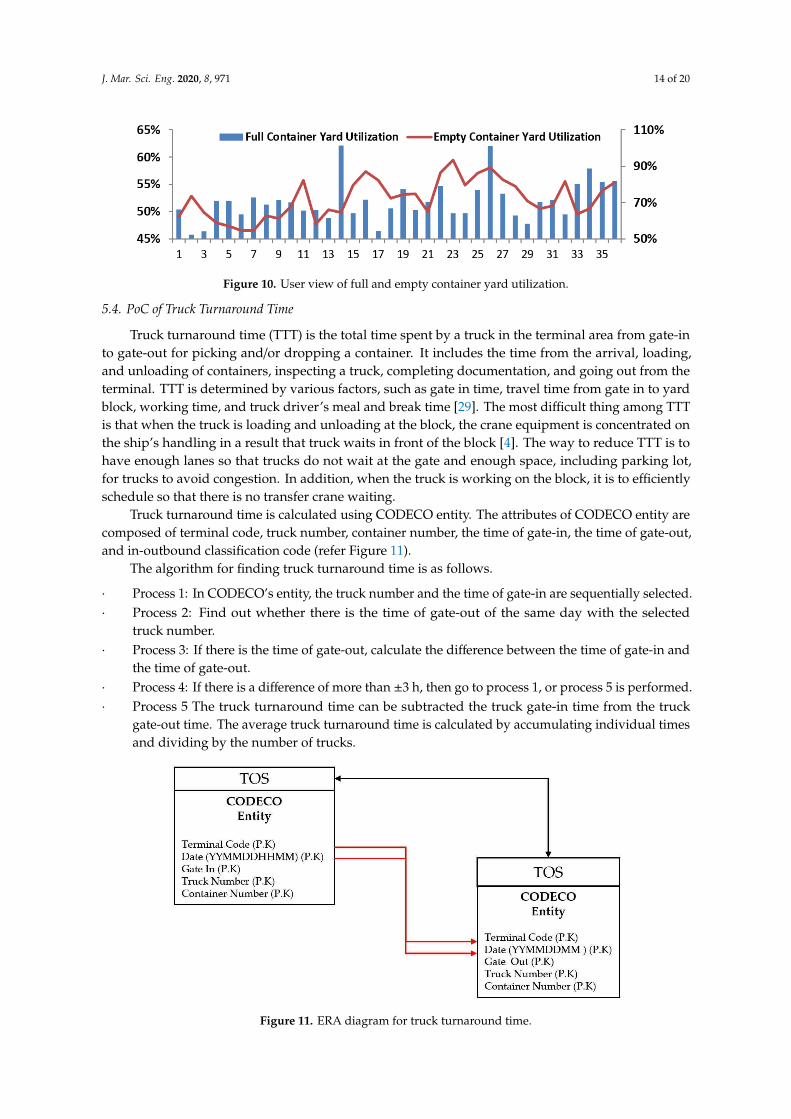
The output about the number of calling ships and yard utilization is shown in Figure 8. This showsa trend of 36 months of which the X-axis is monthly and Y axis on the left shows yard utilization offull and empty container. Referring to Figure 8, in descriptive perspective, the yard utilization of fulland empty containers for the recent month of a terminal is 56% and 81%, respectively. Using the timeseries method, the yard utilization of full and empty containers after 12 months is predicted at 62%and 87%, respectively.
As a result of the forecast, this problem can be solved by either increasing the empty containerstorage or removing it with ODCY. However, the first method is limited due to the narrow yard area,and generally the second method is widely used. Another alternative could consider a method oflowering the peak for each day of the week, but it was found that there is a little peak of the yardutilization rate for each day of the week. In particular, the relationship between throughput and yardutilization was found to be a negative relationship (refer Figure 10). It turned out that the adjustmentof the quantity of the day of the week did not help improve the yard utilization.
J. Mar. Sci. Eng. 2020, 8, 971 14 of 20
J. Mar. Sci. Eng. 2020, 8, x FOR PEER REVIEW 14 of 18
Figure 10. User view of full and empty container yard utilization.
5.4. PoC of Truck Turnaround Time
Truck turnaround time (TTT) is the total time spent by a truck in the terminal area from gate-in
to gate-out for picking and/or dropping a container. It includes the time from the arrival, loading,
and unloading of containers, inspecting a truck, completing documentation, and going out from the
terminal. TTT is determined by various factors, such as gate in time, travel time from gate in to yard
block, working time, and truck driver’s meal and break time [29]. The most difficult thing among TTT
is that when the truck is loading and unloading at the block, the crane equipment is concentrated on
the ship’s handling in a result that truck waits in front of the block [4]. The way to reduce TTT is to
have enough lanes so that trucks do not wait at the gate and enough space, including parking lot, for
trucks to avoid congestion. In addition, when the truck is working on the block, it is to efficiently
schedule so that there is no transfer crane waiting.
Truck turnaround time is calculated using CODECO entity. The attributes of CODECO entity
are composed of terminal code, truck number, container number, the time of gate-in, the time of gate-
out, and in-outbound classification code (refer Figure 11).
The algorithm for finding truck turnaround time is as follows.
Process 1: In CODECO’s entity, the truck number and the time of gate-in are sequentially
selected.
Process 2: Find out whether there is the time of gate-out of the same day with the selected truck
number.
Process 3: If there is the time of gate-out, calculate the difference between the time of gate-in and
the time of gate-out.
Process 4: If there is a difference of more than ±3 h, then go to process 1, or process 5 is performed.
Process 5 The truck turnaround time can be subtracted the truck gate-in time from the truck
gate-out time. The average truck turnaround time is calculated by accumulating individual
times and dividing by the number of trucks.
Figure 11. ERA diagram for truck turnaround time.
Figure 10. User view of full and empty container yard utilization.
5.4. PoC of Truck Turnaround Time
Truck turnaround time (TTT) is the total time spent by a truck in the terminal area from gate-into gate-out for picking and/or dropping a container. It includes the time from the arrival, loading,and unloading of containers, inspecting a truck, completing documentation, and going out from theterminal. TTT is determined by various factors, such as gate in time, travel time from gate in to yardblock, working time, and truck driver’s meal and break time [29]. The most difficult thing among TTTis that when the truck is loading and unloading at the block, the crane equipment is concentrated onthe ship’s handling in a result that truck waits in front of the block [4]. The way to reduce TTT is tohave enough lanes so that trucks do not wait at the gate and enough space, including parking lot,for trucks to avoid congestion. In addition, when the truck is working on the block, it is to efficientlyschedule so that there is no transfer crane waiting.
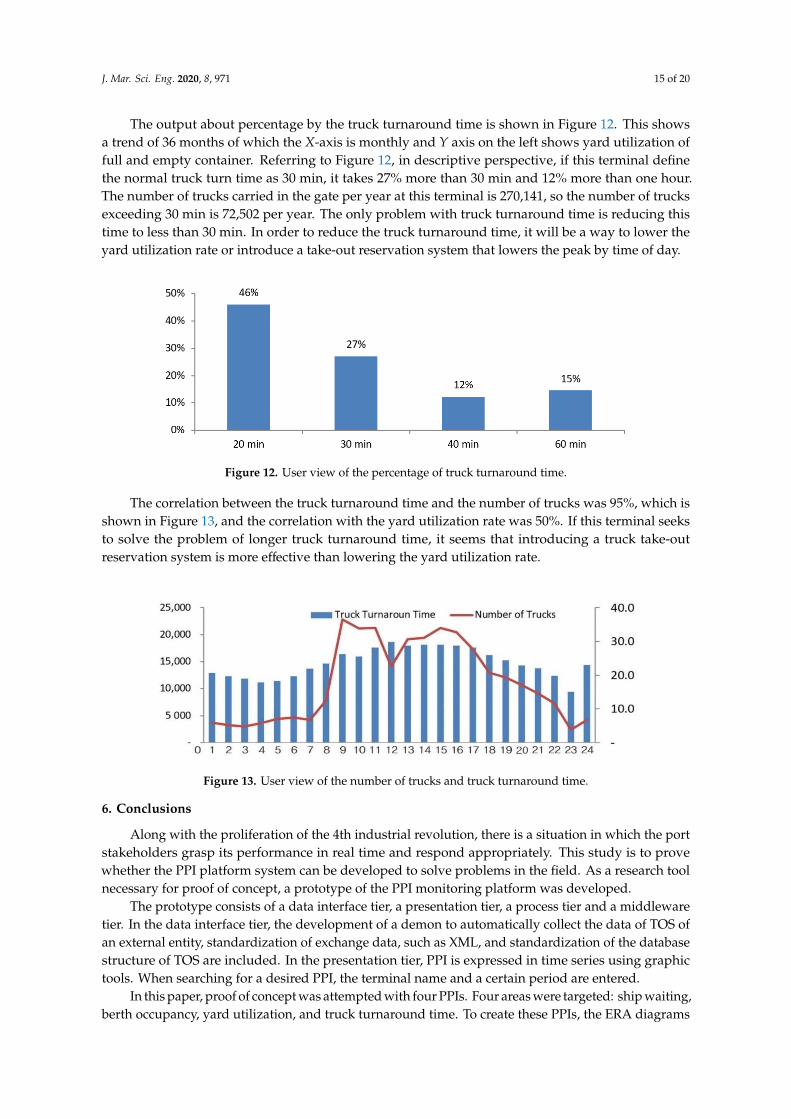
Truck turnaround time is calculated using CODECO entity. The attributes of CODECO entity arecomposed of terminal code, truck number, container number, the time of gate-in, the time of gate-out,and in-outbound classification code (refer Figure 11).
The algorithm for finding truck turnaround time is as follows.
· Process 1: In CODECO’s entity, the truck number and the time of gate-in are sequentially selected.· Process 2: Find out whether there is the time of gate-out of the same day with the selected
truck number.· Process 3: If there is the time of gate-out, calculate the difference between the time of gate-in and
the time of gate-out.· Process 4: If there is a difference of more than ±3 h, then go to process 1, or process 5 is performed.· Process 5 The truck turnaround time can be subtracted the truck gate-in time from the truck
gate-out time. The average truck turnaround time is calculated by accumulating individual timesand dividing by the number of trucks.
J. Mar. Sci. Eng. 2020, 8, x FOR PEER REVIEW 14 of 18
Figure 10. User view of full and empty container yard utilization.
5.4. PoC of Truck Turnaround Time
Truck turnaround time (TTT) is the total time spent by a truck in the terminal area from gate-in
to gate-out for picking and/or dropping a container. It includes the time from the arrival, loading,
and unloading of containers, inspecting a truck, completing documentation, and going out from the
terminal. TTT is determined by various factors, such as gate in time, travel time from gate in to yard
block, working time, and truck driver’s meal and break time [29]. The most difficult thing among TTT
is that when the truck is loading and unloading at the block, the crane equipment is concentrated on
the ship’s handling in a result that truck waits in front of the block [4]. The way to reduce TTT is to
have enough lanes so that trucks do not wait at the gate and enough space, including parking lot, for
trucks to avoid congestion. In addition, when the truck is working on the block, it is to efficiently
schedule so that there is no transfer crane waiting.
Truck turnaround time is calculated using CODECO entity. The attributes of CODECO entity
are composed of terminal code, truck number, container number, the time of gate-in, the time of gate-
out, and in-outbound classification code (refer Figure 11).
The algorithm for finding truck turnaround time is as follows.
Process 1: In CODECO’s entity, the truck number and the time of gate-in are sequentially
selected.
Process 2: Find out whether there is the time of gate-out of the same day with the selected truck
number.
Process 3: If there is the time of gate-out, calculate the difference between the time of gate-in and
the time of gate-out.
Process 4: If there is a difference of more than ±3 h, then go to process 1, or process 5 is performed.
Process 5 The truck turnaround time can be subtracted the truck gate-in time from the truck
gate-out time. The average truck turnaround time is calculated by accumulating individual
times and dividing by the number of trucks.
Figure 11. ERA diagram for truck turnaround time. Figure 11. ERA diagram for truck turnaround time.
J. Mar. Sci. Eng. 2020, 8, 971 15 of 20
The output about percentage by the truck turnaround time is shown in Figure 12. This showsa trend of 36 months of which the X-axis is monthly and Y axis on the left shows yard utilization offull and empty container. Referring to Figure 12, in descriptive perspective, if this terminal definethe normal truck turn time as 30 min, it takes 27% more than 30 min and 12% more than one hour.The number of trucks carried in the gate per year at this terminal is 270,141, so the number of trucksexceeding 30 min is 72,502 per year. The only problem with truck turnaround time is reducing thistime to less than 30 min. In order to reduce the truck turnaround time, it will be a way to lower theyard utilization rate or introduce a take-out reservation system that lowers the peak by time of day.
J. Mar. Sci. Eng. 2020, 8, x FOR PEER REVIEW 15 of 18
The output about percentage by the truck turnaround time is shown in Figure 12. This shows a
trend of 36 months of which the X-axis is monthly and Y axis on the left shows yard utilization of full
and empty container. Referring to Figure 12, in descriptive perspective, if this terminal define the
normal truck turn time as 30 min, it takes 27% more than 30 min and 12% more than one hour. The
number of trucks carried in the gate per year at this terminal is 270,141, so the number of trucks
exceeding 30 min is 72,502 per year. The only problem with truck turnaround time is reducing this
time to less than 30 min. In order to reduce the truck turnaround time, it will be a way to lower the
yard utilization rate or introduce a take-out reservation system that lowers the peak by time of day.
Figure 12. User view of the percentage of truck turnaround time.
The correlation between the truck turnaround time and the number of trucks was 95%, which is
shown in Figure 13, and the correlation with the yard utilization rate was 50%. If this terminal seeks
to solve the problem of longer truck turnaround time, it seems that introducing a truck take-out
reservation system is more effective than lowering the yard utilization rate.
Figure 13. User view of the number of trucks and truck turnaround time.
6. Conclusions
Along with the proliferation of the 4th industrial revolution, there is a situation in which the
port stakeholders grasp its performance in real time and respond appropriately. This study is to
prove whether the PPI platform system can be developed to solve problems in the field. As a research
tool necessary for proof of concept, a prototype of the PPI monitoring platform was developed.
The prototype consists of a data interface tier, a presentation tier, a process tier and a middleware
tier. In the data interface tier, the development of a demon to automatically collect the data of TOS of
an external entity, standardization of exchange data, such as XML, and standardization of the
database structure of TOS are included. In the presentation tier, PPI is expressed in time series using
graphic tools. When searching for a desired PPI, the terminal name and a certain period are entered.
In this paper, proof of concept was attempted with four PPIs. Four areas were targeted: ship
waiting, berth occupancy, yard utilization, and truck turnaround time. To create these PPIs, the ERA
diagrams were derived and a database was created based on them. Based on the created database,
we defined an algorithm for generating PPIs and user view through graphic tool of Excel spread
Figure 12. User view of the percentage of truck turnaround time.
The correlation between the truck turnaround time and the number of trucks was 95%, which isshown in Figure 13, and the correlation with the yard utilization rate was 50%. If this terminal seeksto solve the problem of longer truck turnaround time, it seems that introducing a truck take-outreservation system is more effective than lowering the yard utilization rate.
J. Mar. Sci. Eng. 2020, 8, x FOR PEER REVIEW 15 of 18
The output about percentage by the truck turnaround time is shown in Figure 12. This shows a
trend of 36 months of which the X-axis is monthly and Y axis on the left shows yard utilization of full
and empty container. Referring to Figure 12, in descriptive perspective, if this terminal define the
normal truck turn time as 30 min, it takes 27% more than 30 min and 12% more than one hour. The
number of trucks carried in the gate per year at this terminal is 270,141, so the number of trucks
exceeding 30 min is 72,502 per year. The only problem with truck turnaround time is reducing this
time to less than 30 min. In order to reduce the truck turnaround time, it will be a way to lower the
yard utilization rate or introduce a take-out reservation system that lowers the peak by time of day.
Figure 12. User view of the percentage of truck turnaround time.
The correlation between the truck turnaround time and the number of trucks was 95%, which is
shown in Figure 13, and the correlation with the yard utilization rate was 50%. If this terminal seeks
to solve the problem of longer truck turnaround time, it seems that introducing a truck take-out
reservation system is more effective than lowering the yard utilization rate.
Figure 13. User view of the number of trucks and truck turnaround time.
6. Conclusions
Along with the proliferation of the 4th industrial revolution, there is a situation in which the
port stakeholders grasp its performance in real time and respond appropriately. This study is to
prove whether the PPI platform system can be developed to solve problems in the field. As a research
tool necessary for proof of concept, a prototype of the PPI monitoring platform was developed.
The prototype consists of a data interface tier, a presentation tier, a process tier and a middleware
tier. In the data interface tier, the development of a demon to automatically collect the data of TOS of
an external entity, standardization of exchange data, such as XML, and standardization of the
database structure of TOS are included. In the presentation tier, PPI is expressed in time series using
graphic tools. When searching for a desired PPI, the terminal name and a certain period are entered.
In this paper, proof of concept was attempted with four PPIs. Four areas were targeted: ship
waiting, berth occupancy, yard utilization, and truck turnaround time. To create these PPIs, the ERA
diagrams were derived and a database was created based on them. Based on the created database,
we defined an algorithm for generating PPIs and user view through graphic tool of Excel spread
Figure 13. User view of the number of trucks and truck turnaround time.
6. Conclusions
Along with the proliferation of the 4th industrial revolution, there is a situation in which the portstakeholders grasp its performance in real time and respond appropriately. This study is to provewhether the PPI platform system can be developed to solve problems in the field. As a research toolnecessary for proof of concept, a prototype of the PPI monitoring platform was developed.
The prototype consists of a data interface tier, a presentation tier, a process tier and a middlewaretier. In the data interface tier, the development of a demon to automatically collect the data of TOS ofan external entity, standardization of exchange data, such as XML, and standardization of the databasestructure of TOS are included. In the presentation tier, PPI is expressed in time series using graphictools. When searching for a desired PPI, the terminal name and a certain period are entered.
In this paper, proof of concept was attempted with four PPIs. Four areas were targeted: ship waiting,berth occupancy, yard utilization, and truck turnaround time. To create these PPIs, the ERA diagrams
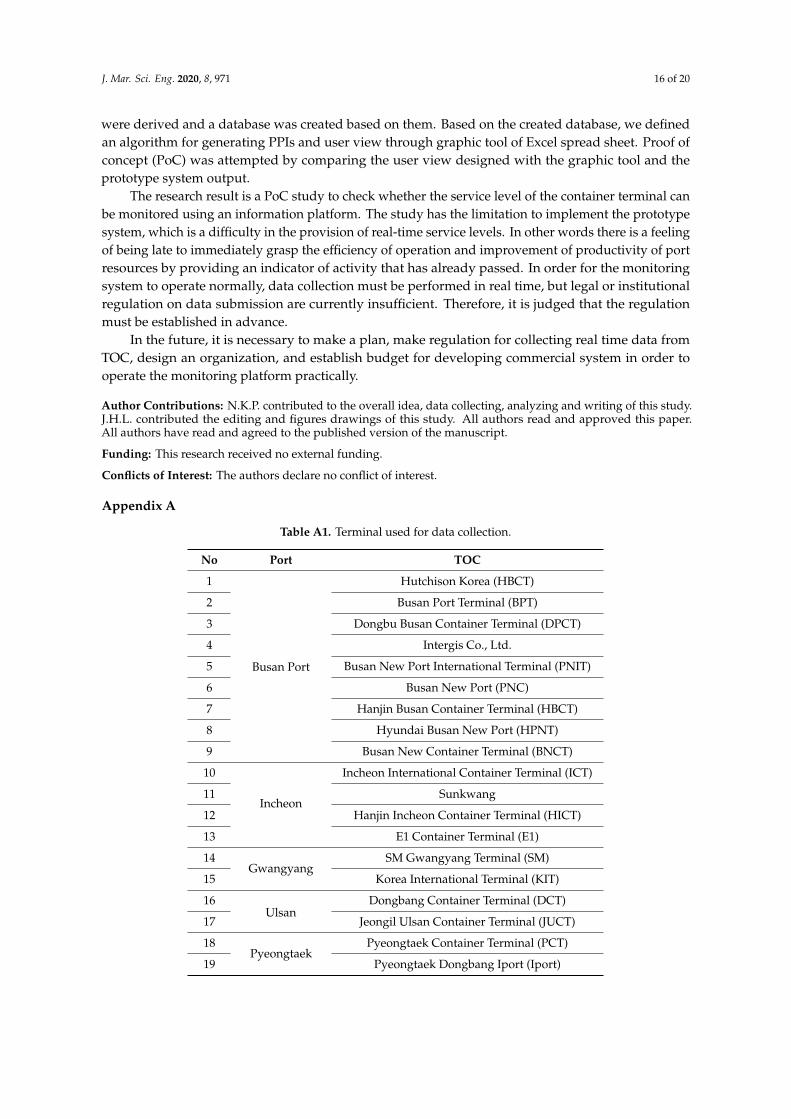
J. Mar. Sci. Eng. 2020, 8, 971 16 of 20
were derived and a database was created based on them. Based on the created database, we definedan algorithm for generating PPIs and user view through graphic tool of Excel spread sheet. Proof ofconcept (PoC) was attempted by comparing the user view designed with the graphic tool and theprototype system output.
The research result is a PoC study to check whether the service level of the container terminal canbe monitored using an information platform. The study has the limitation to implement the prototypesystem, which is a difficulty in the provision of real-time service levels. In other words there is a feelingof being late to immediately grasp the efficiency of operation and improvement of productivity of portresources by providing an indicator of activity that has already passed. In order for the monitoringsystem to operate normally, data collection must be performed in real time, but legal or institutionalregulation on data submission are currently insufficient. Therefore, it is judged that the regulationmust be established in advance.
In the future, it is necessary to make a plan, make regulation for collecting real time data fromTOC, design an organization, and establish budget for developing commercial system in order tooperate the monitoring platform practically.
Author Contributions: N.K.P. contributed to the overall idea, data collecting, analyzing and writing of this study.J.H.L. contributed the editing and figures drawings of this study. All authors read and approved this paper.All authors have read and agreed to the published version of the manuscript.
Funding: This research received no external funding.
Conflicts of Interest: The authors declare no conflict of interest.
Appendix A
Table A1. Terminal used for data collection.
No Port TOC
1
Busan Port
Hutchison Korea (HBCT)
2 Busan Port Terminal (BPT)
3 Dongbu Busan Container Terminal (DPCT)
4 Intergis Co., Ltd.
5 Busan New Port International Terminal (PNIT)
6 Busan New Port (PNC)
7 Hanjin Busan Container Terminal (HBCT)
8 Hyundai Busan New Port (HPNT)
9 Busan New Container Terminal (BNCT)
10
Incheon
Incheon International Container Terminal (ICT)
11 Sunkwang
12 Hanjin Incheon Container Terminal (HICT)
13 E1 Container Terminal (E1)
14Gwangyang
SM Gwangyang Terminal (SM)
15 Korea International Terminal (KIT)
16Ulsan
Dongbang Container Terminal (DCT)
17 Jeongil Ulsan Container Terminal (JUCT)
18Pyeongtaek
Pyeongtaek Container Terminal (PCT)
19 Pyeongtaek Dongbang Iport (Iport)
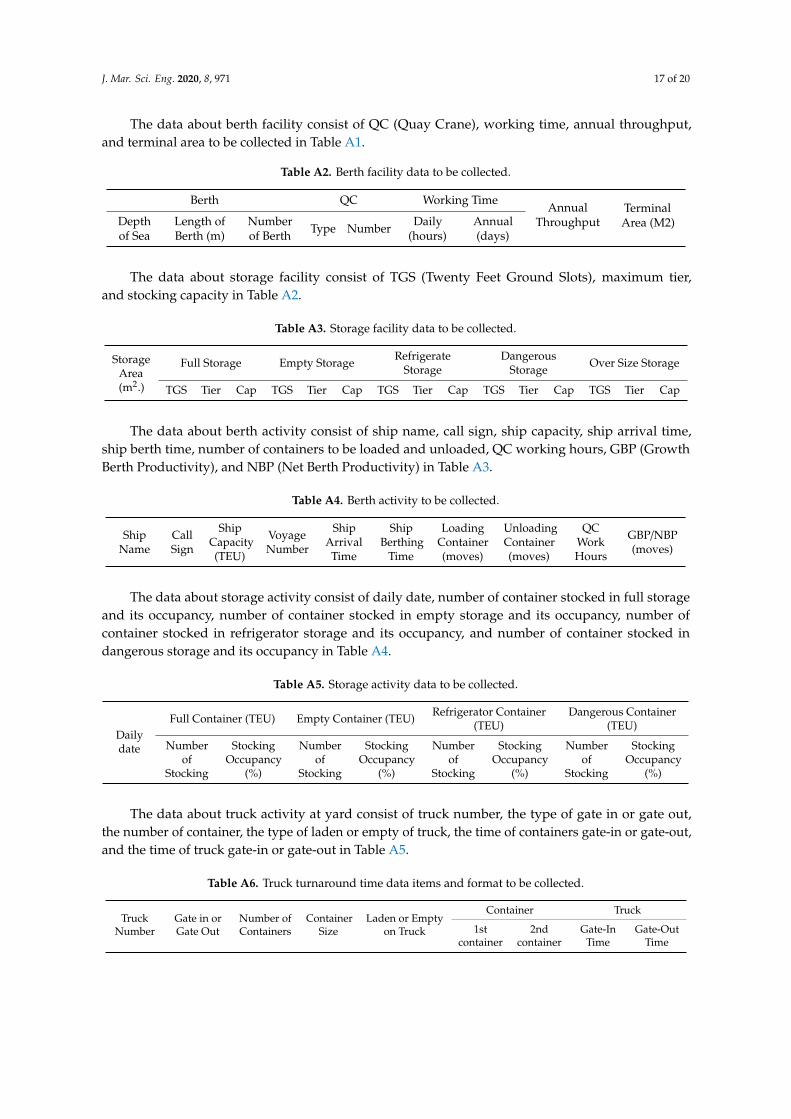
J. Mar. Sci. Eng. 2020, 8, 971 17 of 20
The data about berth facility consist of QC (Quay Crane), working time, annual throughput,and terminal area to be collected in Table A1.
Table A2. Berth facility data to be collected.
Berth QC Working TimeAnnual
ThroughputTerminalArea (M2)Depth
of SeaLength ofBerth (m)
Numberof Berth Type Number Daily
(hours)Annual(days)
The data about storage facility consist of TGS (Twenty Feet Ground Slots), maximum tier,and stocking capacity in Table A2.
Table A3. Storage facility data to be collected.
StorageArea(m2.)
Full Storage Empty Storage RefrigerateStorage
DangerousStorage Over Size Storage
TGS Tier Cap TGS Tier Cap TGS Tier Cap TGS Tier Cap TGS Tier Cap
The data about berth activity consist of ship name, call sign, ship capacity, ship arrival time,ship berth time, number of containers to be loaded and unloaded, QC working hours, GBP (GrowthBerth Productivity), and NBP (Net Berth Productivity) in Table A3.
Table A4. Berth activity to be collected.
ShipName
CallSign
ShipCapacity(TEU)
VoyageNumber
ShipArrival
Time
ShipBerthing
Time
LoadingContainer(moves)
UnloadingContainer(moves)
QCWorkHours
GBP/NBP(moves)
The data about storage activity consist of daily date, number of container stocked in full storageand its occupancy, number of container stocked in empty storage and its occupancy, number ofcontainer stocked in refrigerator storage and its occupancy, and number of container stocked indangerous storage and its occupancy in Table A4.
Table A5. Storage activity data to be collected.
Dailydate
Full Container (TEU) Empty Container (TEU) Refrigerator Container(TEU)
Dangerous Container(TEU)
Numberof
Stocking
StockingOccupancy
(%)
Numberof
Stocking
StockingOccupancy
(%)
Numberof
Stocking
StockingOccupancy
(%)
Numberof
Stocking
StockingOccupancy
(%)
The data about truck activity at yard consist of truck number, the type of gate in or gate out,the number of container, the type of laden or empty of truck, the time of containers gate-in or gate-out,and the time of truck gate-in or gate-out in Table A5.
Table A6. Truck turnaround time data items and format to be collected.
TruckNumber
Gate in orGate Out
Number ofContainers
ContainerSize
Laden or Emptyon Truck
Container Truck
1stcontainer
2ndcontainer
Gate-InTime
Gate-OutTime
J. Mar. Sci. Eng. 2020, 8, 971 18 of 20
References
1. Lustig, I.; Dietrich, B.; Johnson, C.; Dziekan, C. The Analytics Journey: An IBM View of the StructuredData Analysis Landscape: Descriptive, Predictive and Prescriptive Analytics. 2010. Available online:http://analytics-magazine.org/the-analytics-journey (accessed on 10 November 2020).
2. Available online: https://www.collinsdictionary.com/dictionary/english/prototype (accessed on 30 October 2020).3. Singaram, M.; Jain, P. What is the Difference between Proof of Concept and Prototype? 2018. Available
online: https://www.entrepreneur.com/article/307454 (accessed on 30 October 2020).4. Park, N.K. Container Terminal’s Operation Indicator Development and Monitoring Method Research; Ministry of
Maritime Affairs and Fisheries: Sejong, Korea, 2017.5. Langer, A.M. Guide to Software Development; Springer: London, UK, 2016.6. Overmyer, S.P. Revolutionary vs. Evolutionary Rapid Prototyping: Balancing Software Productivity and HCI Design
Concerns; Center of Excellence in Command, Control, Communications and Intelligence (C3I), George MasonUniversity: Fairfax, VA, USA, 1991.
7. Brooks, F. The Mythical Man-Month; Addison-Wesley: Boston, MA, USA, 1975; ISBN 0-201-00650-2.8. Prototype Address of Monitoring System. Available online: http://211.43.207.68:8080/mof/Terminal.pcl?link=
index (accessed on 30 October 2020).9. Dulebenets, M.A. An adaptive island evolutionary algorithm for the berth scheduling problem.
Memet. Comput. 2020, 12, 51–72. [CrossRef]10. Malekahmadi, A.; Alinaghian, M.; Hejazi, S.R.; Saidipour, M.A.A. Integrated continuous berth allocation
and quay crane assignment and scheduling problem with time-dependent physical constraints in containerterminals. Comput. Ind. Eng. 2020, 147, 106672. [CrossRef]
11. Luo, C.; Fei, H.; Sailike, D.; Xu, T.; Huang, F. Optimization of continuous berth scheduling by taking intoaccount double-line ship mooring. Sci. Program. 2020. [CrossRef]
12. Wawrzyniak, J.; Drozdowski, M.; Sanlaville, É. Selecting algorithms for large berth allocation problems.Eur. J. Operat. Res. 2020, 283, 844–862. [CrossRef]
13. Kavoosi, M.; Dulebenets, M.A.; Abioye, O.F.; Pasha, J.; Wang, H.; Chi, H. An augmented self-adaptiveparameter control in evolutionary computation: A case study for the berth scheduling problem. Adv. Eng. Inf.2019, 42, 100972. [CrossRef]
14. Tasoglu, G.; Yildiz, G. Simulated annealing based simulation optimization method for solving integratedberth allocation and quay crane scheduling problems. Simul. Model. Pract Theory 2019, 97, 101948. [CrossRef]
15. The World Bank. Port Reform Toolkit; The World Bank: Washington, DC, USA, 2007.16. Mwasenga, H. Port performance indicators a case of Dar es Salaam port. In UNCTAD Ad Hoc Expert Meeting
on Assessing Port Performance; UNCTAD: Geneva, Switzerland, 2012.17. Mahfouz, A.; Arisha, A. Seaport Management Aspects and Perspectives: An Overview. In Proceedings of
the 12th Annual Irish Academy of Management Conference, Galway, Ireland, 2–4 September 2009; TechnologicalUniversity Dublin: Dublin, Ireland, 2009.
18. Thomas, B.J.; Monie, G. The Measurement of Port Performance: With Particular Reference Ten Container TerminalOperations; ILO (International Labor Organization) PDP (Port Worker Development Program): Cardiff, UK;Antwerp, The Netherlands, 2000; Available online: http://www.sciepub.com/reference/44820 (accessed on29 June 2020).
19. Marlow, P.B. Measuring lean ports performance. Int. J. Transp. Manag. 2003, 1, 189–202. [CrossRef]20. Wayne, K.T. An economic theory of the port. Res. Transp. Econ. 2006, 16, 43–56.21. Dahal, K.; Galloway, S.; Burt, G.; Mcdonald, J.; Hopkins, I. A port system simulation facility with an
optimization capability. Int. J. Comput. Intell. Appl. 2003, 3, 395–410. [CrossRef]22. Turner, H.S. Evaluating seaport policy alternative: A simulation study of terminal leasing policy and system
performance. Logist. Inf. Manag. 2000, 13, 14–20. [CrossRef]23. Dasgupta, A.; Ghosh, M. Inducing performance in a queue via prices: The case of a Riverine Port. Manag. Sci.
2000, 46, 1466–1484. [CrossRef]24. Evans, J.R. Business Analytics: Methods, Models, and Decisions, 2nd ed.; Pearson: Boston, MA, USA, 2017.25. Davenport, T.H.; Harris, J.G. Competing on Analytics: The New Science of Winning; Harvard Business School
Press: Boston, MA, USA, 2007.
J. Mar. Sci. Eng. 2020, 8, 971 19 of 20
26. Peter, C. The Entity-Relationship Model - Toward a Unified View of Data. ACM Trans. Database Syst. 1976,1, 9–36.
27. Burton-Jones, A.; Weber, R. Understanding Relationships with Attributes in Entity-Relationship Diagrams.ICIS 1999 Proceedings. Available online: aisel.aisnet.org/icis1999/20 (accessed on 31 October 2020).
28. Alderton, P. Port Management and Operations, 3rd ed.; Informa: London, UK, 2008.29. Chakraborty, S.; Kumar, B.; Malguri, A. Reducing the truck turnaround time inside a heavy manufacturing
industry through Makigami analysis. Int. J. Adv. Inf. Sci. Technol. 2016, 5, 9.
Publisher’s Note: MDPI stays neutral with regard to jurisdictional claims in published maps and institutionalaffiliations.
© 2020 by the authors. Licensee MDPI, Basel, Switzerland. This article is an open accessarticle distributed under the terms and conditions of the Creative Commons Attribution(CC BY) license (http://creativecommons.org/licenses/by/4.0/).
Related Documents