
Welcome message from author
This document is posted to help you gain knowledge. Please leave a comment to let me know what you think about it! Share it to your friends and learn new things together.
Transcript


PNL- 10367 UC-606
Vapor Space Characterization of Waste Tank 241-C-111 (In Si&): Results from Samples Collected on 6/20/94
M. W. Ligotke K. H. Pool R. B. Lucke B. D. McVeety T. W. Clauss M. McCulloch J. S. Young J. S. Fruchter S. C. Goheen
October 1995
Prepared for Westinghouse Hanford Company under a Related Services Agreement with the U.S. Department of Energy Contract DE-ACO6-76RLO 1830
Pacific Northwest Laboratory Richland, Washington 99352
ASTE

DISCLAIMER
Portions of this document may be illegibie electronic image products. Images are produced from the best available original document.

Summary
This report describes inorganic and organic analyses results from in situ samples obtained from the headspace of the Hanford waste storage Tank 241-C-111 (referred to as Tank C-1 1 1). The results described here were obtained to support safety and toxicological evaluations. A summary of the results for inorganic and organic analytes is listed in Summary Table 1. Detailed descriptions of the results appear in the text.
Quantitative results were obtained for the inorganic compounds ammonia (NH,), nitrogen dioxide (NO2), nitric oxide (NO), hydrogen cyanide (HCN), and water (H20). Sampling for sulfur oxides was not requested. Organic compounds were quantitatively determined. Five organic tentatively identified compounds ("ICs) were observed above the detection limit of (ca.) 10 ppbv, but standards for most of these were not available at the time of analysis, and the reported concentrations are semiquantitative estimates. In addition, we looked for the 40 standard TO-14 analytes and observed 39. None of these compounds were above the 2-ppbv calibrated instrumental detection limit. However, it is believed that the detection of dichlorodifluoromethane and methyl benzene are real at these low concentrations. The five organic analytes with the highest estimated concentrations are listed in Summary Table 1. The five analytes account for approximately 100% of the total organic components in Tank C-1 1 1.
Summary Table 1. Summary Results of Inorganic and Organic Samples Collected from the Headspace of Tank C-1 1 1 on 6120194
Category
Inorganic
Vapor(a) Analyte Concentration Units
I f 1 I 0.04 5 0.1 I 0.01 1 7 2 3
Organic Nonanal 1,2,2-Trichlor
Acetone Octanal Hexanal
1,2-2-trifluoroethylene
0.113 0.089
0.076 0.068 0.055
mg/m3 mg/m3
(a) Vapor concentrations were determined using sample-volume data provided by Westinghouse Hanford Company and are based on averaged data.
iii


Acknowledgments
The authors gratefully acknowledge the support of other project staff at Pacific Northwest Laboratory who contributed to the successful completion of this sampling and analysis activity. Jeff Edwards served as the PNL single-point-of-contact and coordinated sample handling and communications with Westinghouse Hanford Company. Kris B. Olsen assisted in preparing the organic portion of this report. Bruce Lerner performed method development and validation work that supported the inorganic vapor sampling. Sally Slate and May-Lin Thomas analyzed inorganic samples, and Annalisa Krupsha and Gary Dennis prepared the solid-sorbent sample trains. Georgia K. Ruebsamen provided word processing support.
V

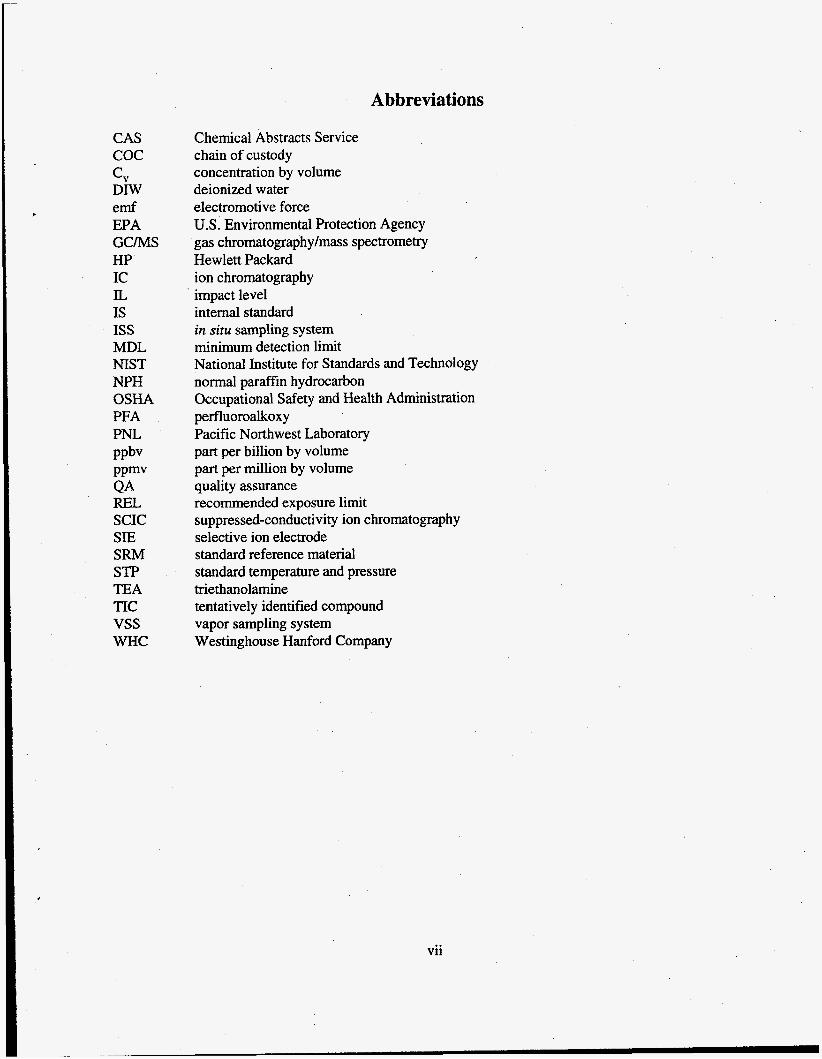
Abbreviations
CAS COC
DIW emf EPA G C M S HP IC IL IS ISS MDL NIST NPH OSHA PFA PNL PPbV PPmv QA E L SCIC SIE SRM STP TEA TIC vss WHC
C"
Chemical Abstracts Service chain of custody concentration by volume deionized water electromotive force US. Environmental Protection Agency gas chromatography/mass spectrometry Hewlett Packard ion chromatography impact level internal standard in situ sampling system minimum detection limit National Institute for Standards and Technology normal paraffin hydrocarbon Occupational Safety and Health Administration perfluoroalkoxy Pacific Northwest Laboratory part per billion by volume part per million by volume quality assurance recommended exposure limit suppressed-conductivity ion chromatography selective ion electrode standard reference material standard temperature and pressure triethanolamine tentatively identified compound vapor sampling system Westinghouse Hanford Company
vii

Contents
... summary .................................................................................................................................................. 111
Acknowledgments .................................................................................................................................... v
Abbreviations ......................................................................................................................................... vn
1.0 Introduction ....................................................................................................................................... 1
..
2.0 Inorganic Task ................................................................................................................................... 5 2.1 Standard Sampling Methodology ............................................................................................ 5 2.2 Analytical Procedures .............................................................................................................. 6 2.3 Quality Assurance/Quality Control ......................................................................................... 8 2.4 Inorganic Sample Results ........................................................................................................ 9
3.0 Organic Task .................................................................................................................................... 13 3.1 SUMMATM Canister Preparation ........................................................................................... 13 3.2 Sample Analysis Method ....................................................................................................... 13 3.3 Quality Assurance/Quality Control .......................................................................... : ............ 13 3.4 Analysis Results ..................................................................................................................... 15
4.0 Conclusions ..................................................................................................................................... 17
5.0 References ....................................................................................................................................... 17
6.0 Further Reading ............................................................................................................................... 17
ix

Tables
2.1 Analysis Procedures and Typical Detection Limits of Target Inorganic Analytes ........................ 8
2.2 List of PNL Inorganic Samples, Blanks, and Gravimetric Results from In Situ Sampling of the Headspace of Tank C-1 11 on 6/20/94 .................................................................................. 9
2.3 Inorganic Vapor Sample Results Obtained From Zn Situ Samples Inserted into the Headspace of Tank C-1 11 on 6120194 ................................. :........................................................ 11
3.1 TO-14 Analysis Results for In Situ Samples Collected from the Headspace of Tank C-1 1 1 in SUMMAm Canisters on 6/20/94 .................................... 19
3.2 Tentatively Identified Compounds and Estimated Concentrations in the Headspace of Tank 241-C-111 In Situ SUMMAW Canister Sample Collected on 6120194 ................................................................................................................... .20
Figures
1.1 Chain-of-Custody for Tank C-1 11 .................................................................................................. 2
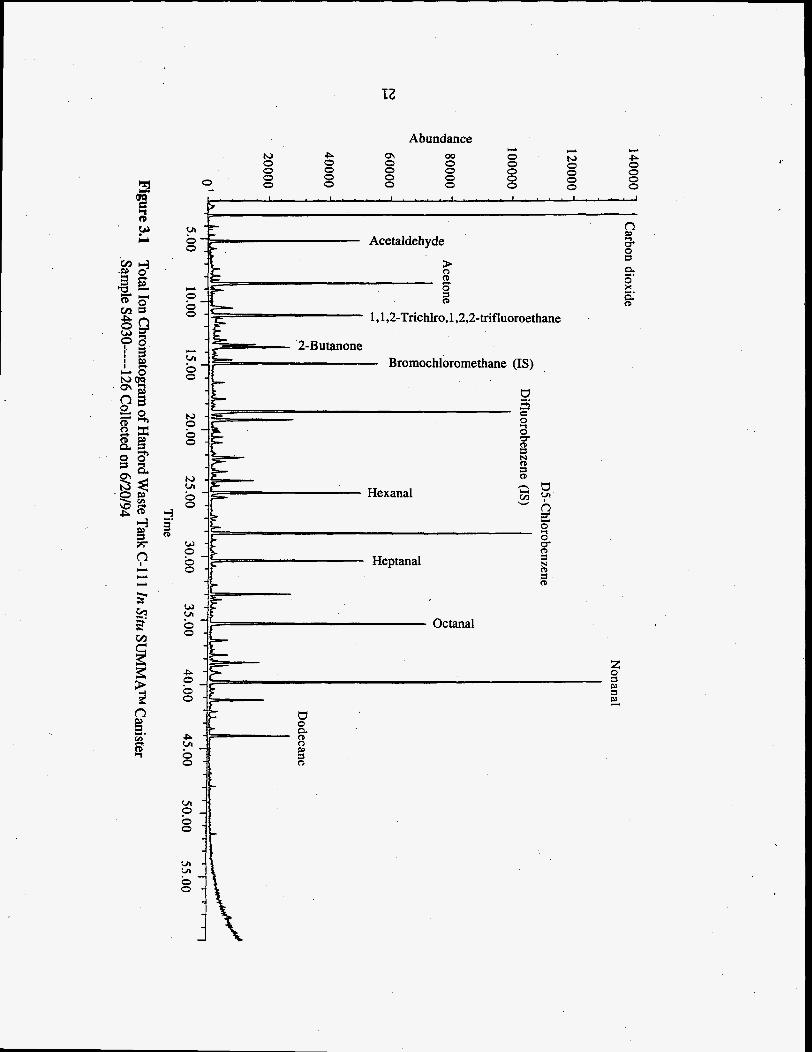
3.1 Total Ion Chromatogram of Hanford Waste Tank C- 1 1 1 In Situ SUMMATM Canister Sample S4030-----I26 Collected on 6/20/94 .................................................................. 21
X

1.0 Introduction
This report describes results of the analyses of tank-headspace samples taken from the Hanford waste Tank 241-C-111 (referred to as Tank C-111). Pacific Northwest Laboratory (PNL)(a) contracted with Westinghouse Hanford Company (WHC) to provide sampling devices and to analyze inorganic and organic analytes collected from the tank headspace. The sample job was designated S4030, and samples were collected by WHC on June 20, 1994, using the in situ sampling system (ISS). The results of the analyses are expected to be used to estimate the potential toxicity of tank- headspace gas as described in Data Quality Objectives for Generic In-Tank Health and Safety Vapor Issue Resolution, WHC-SD-WM-DQO-002, Rev. 0.
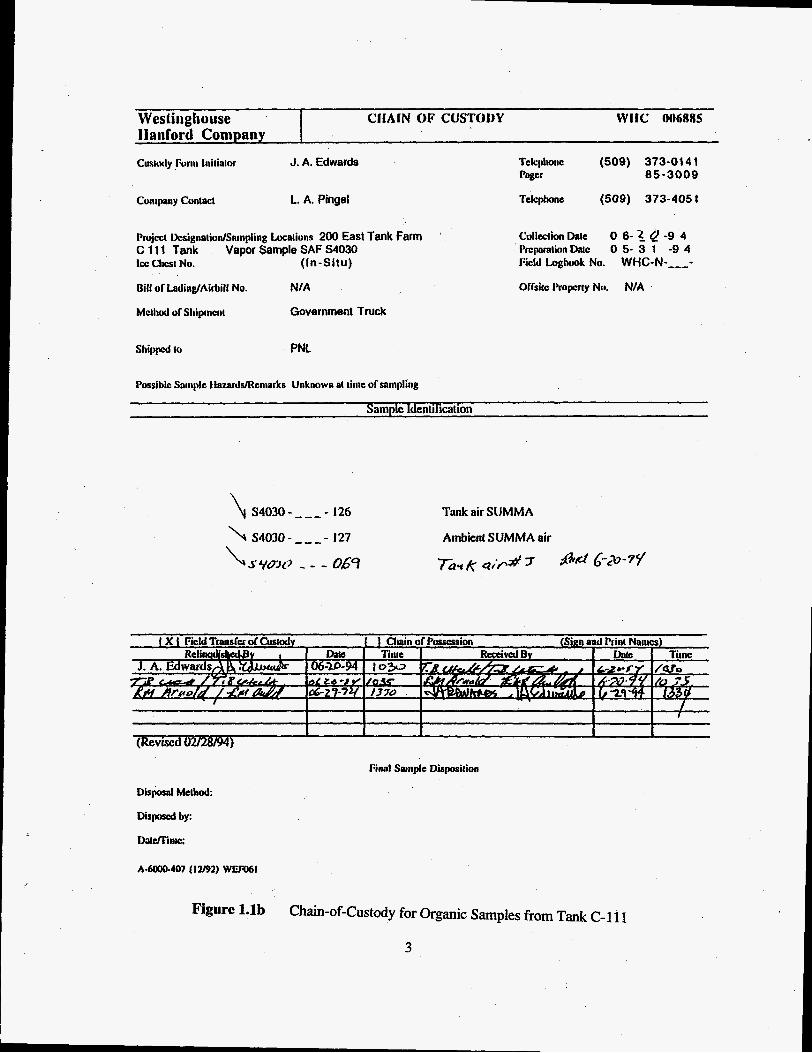
Sampling devices, including six sorbent trains (for inorganic analyses), were supplied to WHC on June 1, 1994. Two SUMMATM canisters (for organic analyses) were supplied to the WHC sampling staff on June 14 and three SUMMAW canisters were supplied on June 20. Samples were taken (by WHC) from the tank headspace on June 20 and were returned to PNL from the field on June 29. Inorganic (sorbent trap) samples were delivered to PNL on chain of custody (COC) 006884 (see Figure 1.la). The SUMMATM canisters were delivered on COCs 006885 and 006889 (see Figure 1.lb and 1.1~). SUMMATM canister sample No. S4024-----129 was taken as a surrogate sample. Westinghouse Hanford Company and PNL agreed that analysis of the surrogate sample was not required.
The samples were inspected upon delivery to the 326/23B laboratory and logged into PNL record book 55408 before implementing PNL, Technical Procedure PNL-TVP-07(b). Custody of the sorbent traps was transferred to PNL personnel performing the inorganic analysis and stored at refrigerated (I 10°C) temperature until the time of analysis. The canister was stored in the 326/23B laboratory at ambient (25OC) temperature until time of analysis. Access to the 326/23B laboratory is limited to PNL personnel working on the waste-tank safety program. Analyses described in this report were performed at PNL in the 300 area of the Hanford Reservation. Analytical methods that were used are described in the text. In summary, sorbent traps for inorganic analyses containing sample materials were either weighed (for water analysis) or desorbed with the appropriate aqueous solutions (for ammonia, nitrous oxides, or hydrogen cyanide analyses). The aqueous extracts were analyzed either by selective electrode or by ion chromatography (IC). Organic analyses were performed using cryogenic preconcentration followed by gas chromatography/mass spectrometry (GCMS).
I
(a)
(b)
Pacific Northwest Laboratory is operated for the U. S. Department of Energy by Battelle Memorial Institute under Contract DE-ACO6-76RLO 1830. PNL-TVP-07, Rev. 0, October 1994, Sample Shipping and Receiving Procedure for PNL Waste Tank Samples, PNL-Technical Procedure, Tank Vapor Project, Richland, Washington.
1

Westingliouse Iianford Company
J. A. Edwards
CIIAIN OF CUS'I'ODY WIIC (Io6ifi.-
L. A. Pingel
project ksignaiiodsatiipling Localions 200 E a t Tank Farm 241-C-111 Tank Icc Clml No.
Vapor Sample SAF S4030 (23s)
Bill of LndinglAirbill Nn.
Sliippccl lo
NIA
Government Truck
WHC
Telephone (509) 373-0141 mw 85-3009
Telepime (509) 373-405 1
PussLlc Saniplc IlazardslReinarks Unknown at tiim of snsipling
Sample Identification
S4030- _ _ _ .WIO S4030- _ _ _ . W I I S4030- -1- . W12 S4030- _ _ _ . W13 S4030- _ _ _ . W14 54030- _ _ _ . W15
tlCN/1120 (Sample # 1 ) IlCNlll20 (Sample 112) IICN/Ii20 (Sample 13)
NH3INOX1Ii20 (Sample 111) NH3/NOxlI120 (Sample #2) NII~/N0,11120 (Sample 13)
Final Sample Dispnsiliun
Disposal Methd:
Disposed by:
Coniiiicnls
A-WUU-407 (12192) w @ m t Figure l.la Chain-of-Custody for Inorganic Samples from Tank C-111
2
Weslinghouse arm OF cummy WIfC 6061185 Ilsiiford Company Cus~cxly ~ o n r Initiator J. A. Edwards Tckplione (509) 373-01 4 1
Peer 85-3009
Cwiipny Contact L. A. Pingel Teleplwnt (509) 373-405 t
Project iksigsatiodSainpiing hal ions 200 East Tank Farm 0 6- 1 &‘ -9 4 C 11 1 Tank Vapor Sample SAF S4030 PrepnrnlionDatc 0 5- 3 1 -9 4 ice chebt No. (In-Situ) Field Loghonk No. WHC-N-----
Bill or LadingIAihill No. NIA Offsicc I’ropcr~y Nit. NIA
Mclhod of Sliipnwiit Government Truck
’ Collection Dale
SliiDpcl IO PNL
Pussiblc Saniplc tiazards/Ren~arks Unknown at Lime of saiiipling
Sample Identification
A-6000-407 (12)92) WEIWI
Figure l.lb Chain-of-Custody for Organic Samples from Tank C-111
3
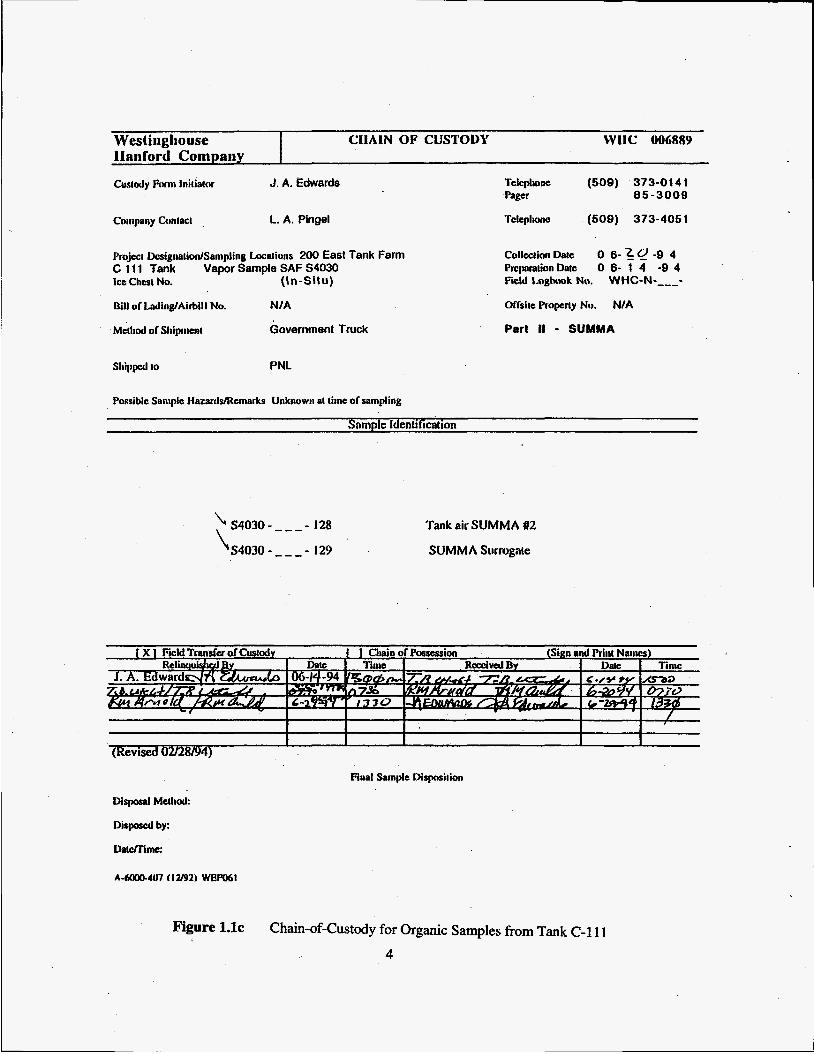
Westinghouse CIIAIN OF CUSTODY tV1lC 006889 llanford Cornparry I Custody I'rwin Initiator J. A. Edwards Tcl~~ooac (509) 373-0141
8 5 - 3 0 0 9
Conipnny Contact L. A. Pingel -rciepimc (509) 3 7 3 - 4 0 5 1
Pager
Project Dcsignalion/Sampling Locations 200 East Tank Farm C 11 1 Tank lee Chcsl No. (In-Situ)
Vapor Sample SAF 54030
Bill of LectinglAirbill No. N I A
McU~od or Sliipnicnl Government Truck
Collection Date PrqmrationDntc 0 6- 1 4 -9 4
0 6- '1 e -9 4
Ficld Imghmk No. WHC-N-----
Of'fsice Property No. N I A
Part If - SUMMA
SliippcJ IO PNL
Poksiblc Suiiipie Hazanls/Remarks Unknown PI limc of sampling
Sample Identification
Tank air SUMMA #2
SUMMA Siirrogsle
I 1 ' I
" /
I (Revised 02/28/94 1
Roal Sample Dispnsition
Disposal M~liod:
Dirposerl by:
Dalelfins:
A-fiIWl-4U7 112/92) WEFM1
Figure l.lc Chain-of-Custody for Organic Samples from Tank C-1 1 1
4
2.0 Inorganic Task
Solid sorbent traps, prepared in sampling trains, were supplied to WHC for sampling the headspace of Tank C-1 1 1. Blanks, spiked blanks (when requested), and exposed samples were returned to PNL for analysis. Analyses were performed to provide information on the tank- headspace concentration of the following analytes: ammonia (NH,), nitrogen dioxide (NO,), nitric oxide (NO), hydrogen cyanide (HCN), and water (H20). Procedures were similar to those developed previously during sample jobs performed with the vapor sampling system (VSS) connected to the headspace of Tank C-103 (Ligotke et al. 1994). Analytical accuracy was estimated based on procedures used. Sample preparation and analyses were performed following PNL quality assurance (QA) impact level (IL) I11 requirements.
2.1 Standard Sampling Methodology
Standard sorbent traps consisting of glass tubes containing sorbent materials to trap the analytes of NH,, NO,, NO, HCN, and H,O (SKC Inc., Eighty Four, Pennsylvania) were obtained, prepared, and submitted for use by WHC. The sorbent traps were selected based on their use by the Occupational Safety and Health Administration (OSHA) to perform workplace monitoring, and because of available procedures and verification results associated with that particular application. The typical sorbent traps used consisted of a glass tube containing a sorbent material specific to the compound of interest. In general, the tubes contained two sections: the first section was the primary trap, and the second section provided an indication of breakthrough. In the tubes, sorbent sections are generally held in packed layers separated by glass wool. The sorbent tubes were connected end- to-end to prepare multi-trap sorbent trains for sampling.
The type and nominal quantity of sorbent material varied by application. Sorbent traps selected for the tank sample job included the following products. The NH, sorbent traps contained carbon beads impregnated with sulfuric acid; nominally, 500 mg were contained in the primary and 250 mg in the breakthrough sections. The NH, was chemisorbed as ammonium sulfate { (NH,),SO,}. The NO, traps contained a zeolite impregnated with triethanolamine (TEA), with 400 mg in the primary and 200 mg in the breakthrough sections. The NO, was absorbed and disproportionated to equi-molar quantities of nitrite ions (NO,-) and nitrate ions (NO3-). Glass tubes containing 800 mg of an oxidant such as chromate were used to convert NO to NO,. The converted NO was then collected as nitrite and nitrate in an NO, trap. The HCN traps contained soda lime, with 600 mg in the primary and 200 mg in the breakthrough sections. A fibrous plug at the inlet end of the HCN tubes was removed during sample-train preparation. The water traps contained 300 mg of silica gel in the primary and 150 mg in the breakthrough sorbent sections.
Sample materials for inorganic analytes include some or all of the following: samples, spiked samples, spares, blanks, and spiked blanks. The samples of each type were prepared from same-lot batches, with the oxidizer sections of the NO, sorbent trains having been stored previously in a freezer. After sample preparation, all samples, spiked samples, blanks, and spiked blanks were stored in a freezer, primarily because of handling recommendations for the oxidizer tubes attached to some samples. M e r receipt of exposed and radiologically cleared samples from WHC and disassembly of the sorbent trains, samples were provided to the analytical laboratory at ambient temperature, and selected oxidizer sections were returned to a freezer until completion of analyses.
The sorbent traps were prepared in multi-trap sorbent trains configured so sample flow passed in order through the traps, targeting specific analytes, and then through a desiccant trap. The specific
5
order of traps within the various sorbent trains is described in Section 2.4. The ends of the glass-tube traps were broken, and the traps were weighed and then connected to each other using uniform lengths of 3/8-in. perfluoroalkoxy (PFA)-grade Teflon@ tubing. The tubing was heated in hot air and forced over the open ends of the traps to form a tight seal. Both the inlet and outlet ends of the sorbent trains (the downstream ends of the traps always contained silica gel) were sealed with red- plastic end caps provided by the manufacturer. The leading and trailing ends of the sorbent traps remained sealed other than during the actual sampling periods. C-Flex@ tubing was provided by WHC to connect the downstream ends of the sorbent trains to the sampling exhaust-manifold connections.
2.1.1 Concentration Calculations. The concentrations of target compounds in the tank headspace were determined from sample results, assuming effective sample transport to the sorbent traps. Concentration, in parts per million by volume (ppmv), was determined by dividing the mass of the compound, in pmol, by the volume of the dried tank air sampled in mol. The micromolar compound mass was determined by dividing the compound mass, in pg, by the molecular weight of the compound, in g/mol. The molar sample volume was determined, excluding water vapor, by dividing the standard sample volume (at the conditions used by WHC, 21.1OC and 760 torr), in L, by 24.1 L/mol. For example, the concentration (C,) of a 3.00-L sample containing 75.0 pg of ammonia equals
= 35.4ppmv 75.0pg ( ) * 17 g/mol 24.1 L/mol 3.00L - -
This calculational method produces concentration results that are slightly conservative (greater than actual) because the volume of water vapor in the sample stream is neglected. The volume of water vapor is not included in the measured sampled volume because of its removal in desiccant traps upstream of the mass flowmeters. However, the bias is generally expected to be small. For a tank- headspace temperature of 35OC, the magnitude of the bias would be about 1 to 6%, assuming tank- headspace relative humidities of 20 to loo%, respectively. The concentration of mass (determined gravimetrically) was also per dry-gas volume at standard conditions.
2.2 Analytical Procedures
The compounds of interest were trapped using solid sorbents and chemisorption (adsorption of water vapor). Analytical results were based on extraction and analysis of selected ions. Analytical procedures used are specified herein and compiled in PNL-MA-599.
2.2.1 placed into labeled 20-mL glass scintillation vials. Vials containing front-, or primary-, section sorbent material were treated with 10.0 mL of deionized water (DIW), and vials containing back-up- section sorbent material were treated with 5.0 mL of DIW. After extraction, the NH, sorbent traps were analyzed using the selective ion electrode (SIE) procedure PNL-ALO-226 {Ammonia (Nitrogen) in Aqueous Samples}. Briefly, this method includes 1) preparing a lOoO-pg/mL (ppm) NH, stock standard solution from dried reagent-grade NH,CI and DIW on the day analyses are performed; 2) preparing 0.1-, 0.5-, 1.0-, lo-, and 100-ppm NH, working calibration standards by serial dilution of the freshly made stock standard; 3) generating an initial calibration curve from the measured electromotive force (emf) signal versus NH, concentration data obtained for the set of working standards; 4) performing a calibration-verification check, using one of the midrange standards, after analyzing every four or five samples; 5) continuing this sequence until all samples of the batch have
Ammonia Analysis. The sorbent material from the ammonia-selective sorbent traps was
6

been measured, including duplicates and spiked samples; and 6) remeasuring the complete set of calibration standards at the end of the session. Emf signal measurements obtained for samples are compared to those for standards, either graphically or algebraically (using linear regression) to determine ammonia concentration in the samples.
2.2.2 Nitrite Analysis. The sorbent traps for NO, and NO were desorbed in an aqueous TEA and n-butanol solution and analyzed by suppressed-conductivity ion chromatography (SCIC) for nitrite according to PNL-ALO-212, Rev. 1 (Determination of Inorganic Anions by Ion Chromatography) and modified to obviate interferences by concentrations of non-target analytes. Specifically, the modifications used were 1) eluent 1.44 mh4 N%CO, + 1.8 mM NaHCO, at 2.0 mL/min, 2) one guard column (AG4A) and two separator columns (AS4A) in series instead of just one separator column, and 3) all standards, samples, and blanks injected into the IC sample loop through 0.45-pm syringe filters.
For the analysis, the sorbent materials were placed into labeled 20-mL glass scintillation vials. To each vial, 3.0 mL of desorbing solution (15 g TEA + 1 mL n-butanol in 1.0 L DIW) was added. Primary sorbent-tube sample materials and back-up (breakthrough) sorbent-tube materials were analyzed separately using identical procedures. Each analytical session was conducted as follows. Working nitrite standards (0, 0.1, 0.25, and 0.5 ppm) were prepared by diluting a stock nitrite standard with desorbing solution. An initial calibration curve was prepared from the instrument response (chromatographic peak height) versus nitrite standard concentration data for the set of working standards. A calibration verification check using one of the midrange standards was performed after the analysis of every six samples. If the instrument response indicated that sample nitrite concentration was outside the calibration range (> 0.5 ppm nitrite), the sample was diluted with desorbing solution and reanalyzed. After all samples of a batch were analyzed, the complete set of calibration standards was remeasured to verify consistent instrument response, and the analytical session was terminated.
Instrument responses (peak height) observed for samples were compared to those for standards to determine the nitrite concentration of the samples. Because NO, and NO converted to NO, were collected on the sorbent as equal quantities of nitrite and nitrate, and the analysis was specific for nitrite, the molar masses of NO, and NO were determined by doubling the analytically determined molar mass of nitrite.
2.2.3 and analyzed by amperometric detection IC according to PNL-ALO-271 (Procedure for Analysis of Free cyanide in Water and Soil Sample Leachates). Calibration standards, typically 0, 20, 50, and 100 ng/mL (ppb) CN-, were prepared from a stock 1000-ppm CN- standard on the day of sample analysis in 0.02 N NaOH matrix. The same analysis sequence described above in the ‘Nitrite Analysis” section was used. Instrument responses (peak height) observed for the samples were compared to those for standards to determine the CN- concentration of the samples.
2.2.4 Mass (Water) Analysis. Sorbent traps used to make each sample train were weighed using a semi-micro mass balance, after labeling and breaking the glass tube ends, without plastic end caps. After receipt of exposed samples, the sorbent traps were again weighed to determine the change in mass. Records of the measurements were documented on sample-preparation data sheets. The mass
Cyanide Analysis. The HCN samples were desorbed in 3.0 mL of 0.02 N sodium hydroxide
7
concentration, generally roughly equal to the concentration of water, was determined by dividing the combined change in mass from all traps in a sorbent train by the actual volume of gas sampled. Blanks and spiked blanks were included to provide information on uncertainty.
2.3 Quality Assurance/Quality Control
Analytical work was performed according to quality levels identified in the project QA plan and several PNL documents. The samples were analyzed following PNL IL III. The PNL documents include some or all of the following: PNL-MA-70 (Part 2), PNL-MA-599, PNL-ALO-212, PNL- ALO-226, PNL-ALO-271, and MCS-033. A summary of the analysis procedures and limits for the target inorganic compounds is provided in Table 2.1. From the table, it can be seen that the minimum detection limit (MDL) required to resolve the analyte at one-tenth of the recommended exposure limit (REL) for each of the target analytes is achieved using current procedures and with a vapor-sample volurpe of 3 L and a desorption-solution volume of 3 mL (10 mL for ammonia).
Table 2.1. Analysis Procedures and Typical Detection Limits of Target Inorganic Analytes. Not all analytes are included in every sample job.
REL(~) 0.1 x FGL(~) MDL(~) Analvte Formula Procedure IDDmv) (DDmV) 0
Ammonia NE3 Nitrogen dioxide NO, Nitric oxide NO Hydrogen cyanide HCN Mass (water)(") &a@)
PNL-ALO-226 PNL-ALO-2 1 2 PNL-ALO-2 12 PNL-ALO-27 1 n/a
25 1
25 4.8
n/a
2.5 0.1 2.5 0.48 n/a
0.5 0.02 0.02 0.01 d a
(a) (b)
Target analytical limits are equal to one-tenth of the REL. MDL is defined as the vapor concentration that can be detected with an uncertainty equal to about the magnitude of the measurement. The uncertainty is expected to reduce to about one- quarter of the magnitude of the measurement at a concentration of four times the MDL. The MDLs were based on the assumption that 3 L of vapor are sampled; if greater volumes of vapor are sampled, correspondingly smaller MDLs can be achieved. The MDLs were also based on desorbing-solution volumes of 10 mL for ammonia and 3 mL for the other analytes. The vapor-mass concentration, thought to be largely water vapor, is determined for estimates of humidity.
(c)
(d) n/a = not applicable
The accuracy of concentration measurements depends on errors associated with both sampling and analysis. Sampling information was provided by WHC. The accuracy of analytical results depends on the method used. For ammonia analyses, the accuracy of laboratory measurements by SIE was estimated to be f 5% relative, independent of concentration at 1 pg/mL or greater levels. The uncertainty includes preparation of standards, purity of the ammonium salt used to prepare standards, potential operator bias, ambient temperature variations, etc. Unfortunately, no known National Institute for Standards and Technology (N1ST)-traceable standard reference material (SRM) is available against which to compare working standards. As for ammonia, no known NIST SRM is available for nitrite analysis (for NO, and NO). Based on experience in comparing nitrite working standards prepared from several different sources and factors mentioned for ammonia above, the estimated maximum bias for samples derived from sampling for NO, is f: lo%, and for samples derived from sampling for NO, it is +, 5% relative. For HCN analyses, an NIST SRM for
8

uncomplexed cyanide is not available. The estimated bias (accuracy) of the free cyanide measurements is no more than 5% relative for the normal working range (which encompasses the concentration levels encountered in blanks and samples derived from sorbent-trap leachates). The accuracy of measurements of sample mass is f 0.05 mg, or much less than 1% of the mass changes of samples, and roughly 5% or less of the mass change of blanks.
2.4 Inorganic Sample Results
Sorbent-trap trains and controls were prepared and submitted to WHC on 6/1/94 and used by WHC to sample the headspace of Tank C-11 1 on 6/20/94 using the ISS. The sample job designation number was S4030. The exposed samples were returned to PNL on 6/29/94 and subsequently analyzed on 6/29/94 (H,O), 7/7/94 (NH3), and 7/19/94 (NO, and HCN) to provide information on the tank-headspace concentrations of selected inorganic compounds. Sampling and analysis for sulfur oxides were not requested. The sample-volume information for the current sample job was received from WHC on 8/2/94.
A list of samples, sampling information, sample volumes, and gravimetric results is shown in Table 2.2. The types of sample trains used and the order of sorbent traps within each train are also shown in the table. For example, the sorbent train NH,/NO,/H,O contained an NH, trap at the inlet end, an NO, series in the middle (Section 2.4.2), and a desiccant trap at the outlet end. Analytical mass and concentration results are shown in Table 2.3. Sample volumes were provided by WHC; sample-volume uncertainty was not provided. Tank-headspace concentration results (Table 2.3) are based on this information, and the listed uncertainties equal plus-or-minus one standard deviation of the individual results from each set of samples. Where analytical results from samples were nearly indistinguishable from those of blanks, indicating very low tank-headspace concentrations of the analyte, the concentration results (Table 2.3) are listed as “less than or equal to” a probable maximum value determined by subtracting the average of the blanks less one standard deviation from the average of the samples plus one standard deviation. Results of control samples, such as spiked blanks, are discussed in this section. Spiked blanks, when used, were transported to the field but not opened. Spiked samples, when used, were opened in the field and used to collect tank-headspace gas. Sample results were not corrected for the percentage recoveries of spiked blanks.
2.4.1 Ammonia Results. The concentration of NH, was 1 f 1 ppmv, based on all three samples. The blank-corrected NH, quantities in the sorbent traps ranged from 0.0 to 0.1 pmol. Blank corrections, 10.06 pmol in front and 10.03 pmol in back sorbent sections (Clauss et al. 1994), were significant because of the very low concentrations of NH, in the headspace. Although spiked blanks were not tested, the percentage recoveries of three sets of blanks spiked with 12.2, 22.3, and 46.4 pmol NH, were 101 f 4%, 109 k 2%, and 104 f 1%, respectively, during related sample jobs (Clauss et al. 1994; Ligotke et al. 1994). No sample analytes were duplicated, and no sample leachates were spiked to determine percentage recovery. A 5-point calibration was performed over an NH, range of 0.1 to 1000 pg/mL.
2.4.2 Nitrogen Oxides Results. Measurements of NO, and NO were made using three 5-segment NH,/NO,/H,O sorbent-trap trains (the NO, trains consisted of NO, trap, oxidizer, NO, trap). Related sample jobs, performed using the VSS in Tanks BY-104, -105, and -106 both with and without NO, trains protected by a leading NH, trap (e.g., Clauss et al. 1994), indicated that the presence of the
9
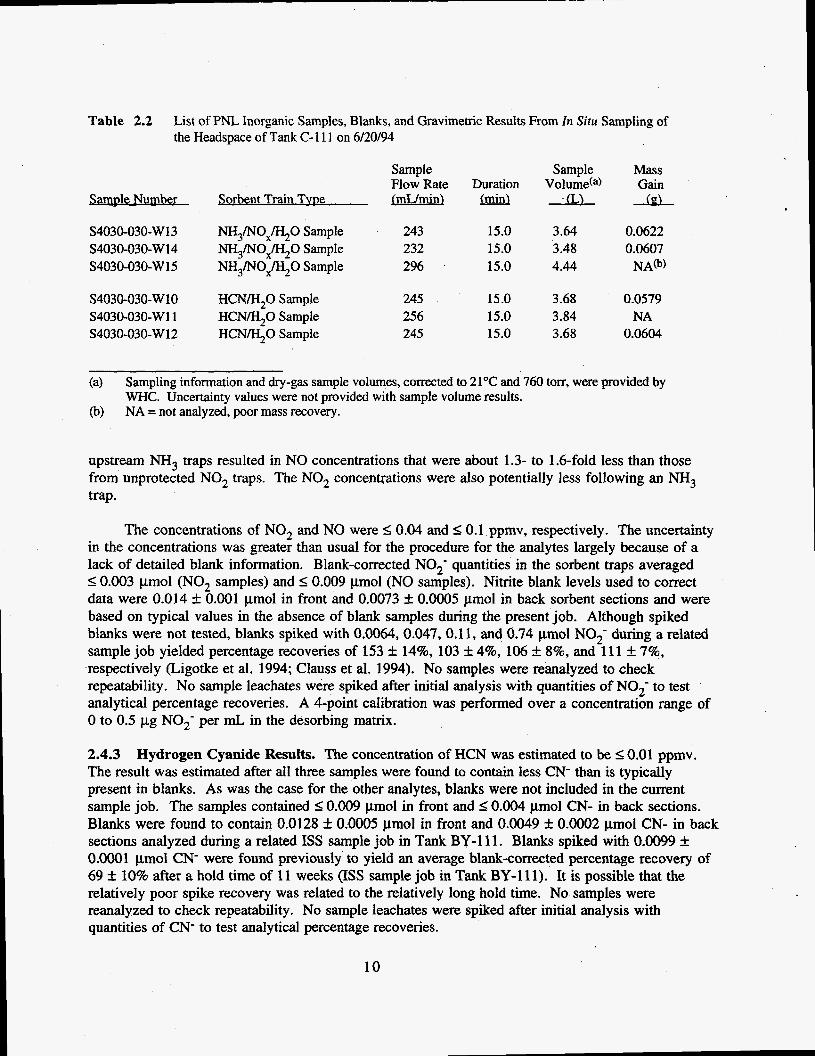
Table 2.2 List of PNL Inorganic Samples, Blanks, and Gravimetric Results From In Situ Sampling of the Headspace of Tank C-111 on 6/20/94
Sample Sample Mass Flow Rate Duration Volume(a) Gain
sawLhkL Sork nt Train Tvpe LmL/minl L
S403O-030-W 13 NH3MOx&0 Sample 243 15.0 3.64 0.0622 S4030-030-Wl4 NH,MOx/H,O Sample 232 15.0 3.48 0.0607 S403O-030-W 15 NH3/NOx/H20 Sample 296 15.0 4.44 NA*)
S4030-030-W10 HCN/H,O Sample 245 15.0 3.68 0.0579 S4030-030-W11 HCN/H,O Sample 256 15.0 3.84 NA S403O-030-W 12 H C N F O Sample 245 15.0 3.68 0.0604
(a)
(b)
Sampling information and dry-gas sample volumes, corrected to 21°C and 760 torr, were provided by WHC. Uncertainty values were not provided with sample volume results. NA = not analyzed, poor mass recovery.
upstream NH3 traps resulted in NO concentrations that were about 1.3- to 1.6-fold less than those from unprotected NO, traps. The NO, concentrations were also potentially less following an NH, trap.
The concentrations of NO, and NO were S 0.04 and 50.1 ppmv, respectively. The uncertainty in the concentrations was greater than usual for the procedure for the analytes largely because of a lack of detailed blank information. Blank-corrected NO,- quantities in the sorbent traps averaged 5 0.003 pmol (NO, samples) and I 0.009 pmol (NO samples). Nitrite blank levels used to correct data were 0.014 f 0.001 pmol in front and 0.0073 f 0.0005 pmol in back sorbent sections and were based on typical values in the absence of blank samples during the present job. Although spiked blanks were not tested, blanks spiked with 0.0064, 0.047,0.11, and 0.74 pmol NO,- during a related sample job yielded percentage recoveries of 153 f 14%, 103 -I 4%, 106 +, 8%, and 11 1 f 7%, respectively (Ligotke et al. 1994; Clauss et al. 1994). No samples were reanalyzed to check repeatability. No sample leachates were spiked after initial analysis with quantities of NO2- to test analytical percentage recoveries. A 4-point calibration was performed over a concentration range of 0 to 0.5 pg NO,- per mL in the desorbing matrix.
2.4.3 The result was estimated after all three samples were found to contain less CN- than is typically present in blanks. As was the case for the other analytes, blanks were not included in the current sample job. The samples contained 50.009 pmol in front and 5 0.004 pmol CN- in back sections. Blanks were found to contain 0.0128 k 0.0005 pmol in front and 0.0049 _+ 0.0002 pmol CN- in back sections analyzed during a related ISS sample job in Tank BY-111. Blanks spiked with 0.0099 f O.OOO1 pmol CN- were found previously to yield an average blank-corrected percentage recovery of 69 +, 10% after a hold time of 11 weeks (ISS sample job in Tank BY-111). It is possible that the relatively poor spike recovery was related to the relatively long hold time. No samples were reanalyzed to check repeatability. No sample leachates were spiked after initial analysis with quantities of CN- to test analytical percentage recoveries.
Hydrogen Cyanide Results. The concentration of HCN was estimated to be 50.01 ppmv.
10

Table 2.3 Inorganic Vapor Sample Results Obtained from In Situ Samples Inserted into the Headspace of Tank C-1 1 1 on 6/20/94
Analvtical Results (umol) Sample Vapor (a) Front Back Total(b) Volume Concentration
Section Section Blm k-corrected 0 fDDmV)
NH; Samples:
0.16 0.18 0.06
0.07 0.10
5 0.04
S4030-030-W13 S403O-030-W 14 S4030-030-W 15
0.1 0.1 0.1
3.64 3.48 4.44
5o.003 m2 Samples:
S4030-030-W 13 S4030-030-W 14 S403O-030-W 15
0.0143 0.0079 0.0150 0.0073 0.0151 0.0075
n/a(*) n/a d a
3.64 3.48 4.44
n/a n/a d a
1o.009 NO Samples:
0.0170 0.0083 0.0192 0.0085 0.0174 0.0097
. S4030-030-W 13 S4030-030-W 14 S4030-030-Wl5
d a n/a d a
3.64 3.48 4.44
n/a d a d a
10.002 HCN Samples: 10.01
S4030-030-W 10 S4030-030-W11 S4030-030-W12
0.0090 0.0034 0.0085 0.0034 0.0085 0.0039
n/a d a n/a
3.68 3.84 3.68
d a d a d a
60.3 mg 3.62 -1 les m : 17 f 3 mp/L
S4030-030-W13 S4030-03O-Wl4 S403O-030-W 15 S4030-030-W10 S4030-03O-.Wll S4030-030-Wl2
n/a n/a d a d a d a n/a
n/a d a n/a d a n/a n/a
62.2 60.7 d a
57.9 d a 0.4
3.64 3.48 d a
3.68 d a
3.68
17.1 17.4 d a
15.7 d a
16.4
(a) Blank-corrected vapor concentrations were calculated using WHC-reported air-sample volumes (corrected to 21°C and 760 torr). In the calculation for concentration, the nitrite values (listed) were doubled to account for unanalyzed nitrate. Sample results were not corrected for percentage recovery of spiked samples or spiked blanks. Total blank-corrected analyte masses were determined, when significant, by subtracting the quantity of analyte found in blanks from that found in samples. The levels of analytes found in blanks are described in Section 2.4. Underlined values represent the average of the set of samples. Concentration uncertainty equals k 1 standard deviation (absolute) for each set of samples. The use of ‘‘9 is defined in Section 2.0.
(b)
(c)
(a) d a = not applicable.
2.4.4 Gravimetric Results. The mass concentration of material collected in the sorbent-trap trains, believed to be primarily water vapor, was 17 f 3 mg/L. The result was based on an average mass gain of 60 mg from four of six sets of sample trains. Because no blanks were analyzed, no blank
1 1
corrections were made. {Based on the average of past ISS (Tank BY-Il l ) and VSS (C Tank Farm) sample jobs, such a blank correction would be expected to reduce the average mass concentration by about 1 mg/L.} The overall measurement uncertainty was estimated based on the range of past blank corrections. Although no spiked blanks were tested, the percentage recovery of mass from three blank H20 traps spiked with 51 mg water was 103 +_ 2% during a related sample job (Clauss et al. 1994).
12

3.0 Organic Task
3.1 SUMMATM Canister Preparation
Before sending SUMMATM canisters out to the field for sampling, the canisters are cleaned and verified contaminant free according to PNL Technical Procedure PNL-TVP-02(a). The cleaning procedure uses an EnTech 3000 cleaning system that controls 1) filling the canisters with purified humid air and 2) evacuating, for several cycles with applied heat, before allowing the canister to evacuate overnight. The canister is filled a final time with purified humid air for analysis by PNL Technical Procedure PNL-TVP-Ol(b), which is a modification of U.S. Environmental Protection Agency (EPA) compendium Method TO-14. If the canister is verified as clean, free of TO-14 contaminants to a level of 5 parts per billion by volume (ppbv), the canister is evacuated to 30 in. Hg, tagged, and stored for use in the field. Before sending the canisters out to the field for sampling, the canisters are prehumidified with 100 pL of distilled water and labeled with a field-sampling identification. Canisters stored more than 30 but less than 60 days are re-evacuated and rehumidified before use. If stored more than 60 days, the canisters are recleaned and validated before use.
3.2 Sample Analysis Method
The SUMMAW canister sample was analyzed according to PNL Technical Procedure PNL- TVP-03, Determination of TO-14 Volatile Organic Compounds in Hanford Waste Tank Headspace Samples Using SUMMATM Passivated Canister Sampling and Gas Chromatographic-Mass Spectrometry Analysis, which is a modified version of EPA compendium Method TO-14. The method uses an EnTech cryoconcentration system interfaced with a Hewlett Packard (HP) 5971 GC/MS. The EnTech concentrator is used to pull a metered volume of sample air from the SUMMATM canister, cryogenically concentrate the air volume, then transfer the volume to the GC/MS for analysis. A 100-mL volume of sample is measured and analyzed.from the tank headspace. The organic components in the sampled air are separated on an analytical column, J&W Scientific DB-1 phase, 60-m by 0.32-mm internal diameter with 3-pm film thickness. The GC oven is programmed to run a temperature gradient beginning at 4OoC, holding for 5 min, and ramping at 4"C/min to a final temperature of 26OoC, with a 5-min hold.
3.3 Quality Assurance/Quality Control
Before the tank sample was analyzed, a diagnostic check was performed on the G U M S instrument by running an instrument "quick tune," as described in PNL-TVP-03. Upon satisfactory completion of the instrument diagnostic check, a blank volume of purified nitrogen was analyzed to check the cleanliness of the system. The instrument was then calibrated over 6 data points ranging from 2 ppbv to 100 ppbv, using a standard gas mixture containing 40 volatile organic compounds listed in EPA compendium Method TO-14. A gas mixture containing bromochloromethane, 1,4- difluorobenzene, and chlorobenzene-d5 was used as an internal standard (IS) for all blank, calibration
(a) Pacific Northwest Laboratory. 8/94. Cleaning SUMMAm Canisters and the Validation of the Cleaning Process, PNL-TVP-02 (Rev. 0), PNL Technical Procedure, Richland, Washington.
(b) Pacific Northwest Laboratory. 8/94. Determination of 7-0-14 Volatile Organic Compounds in Ambient Air Using SUMMAm Passivated Canister Sampling and Gas Chromatographic-Mass Spectrometric Analysis, PNL-TVP-01 (Rev. 0). PNL Technical Procedure, Richland, Washington.
13
standard, and sample analyses. Analyte response from sample components, ISs, and standards were obtained from the extracted ion plot from their selected mass ion. The calibration curve was generated by calculating the relative response ratios of the IS to calibration standard responses and plotting the ratios ‘against the ratio of the calibration-standard concentration (in ppbv) to the IS concentration. A least-squares linear-regression routine was applied to the data set to generate the best-fit line for each compound. The equation for that line was then used to quantify the TO-14 compounds found in the tank samples.
3.3.1 organic compounds were calculated directly from the calibration curve generated using the IS method described above and in PNL-TVP-03. The conversion from ppmv to mg/m3 assumes standard temperature and pressure (STP) conditions of 760 torr and 273K and was calculated directly from the following equation:
Quantitation of TO-14 Results. The quantitative-analysis results for the TO-14 volatile
ppmv x g mol wt of compound 22.4 L/mole
mg/m3 = (3.1)
3.3.2 identified compounds (TICs) are determined by mass-spectral interpretation and comparison of the spectra with the EPAINISTNILEY Library, which is a part of the HP 5971 instrument operating system. Chromatographic peaks with an area count greater than, or equal to, one half of the total area count of the chlorobenzene-d5 IS peak at the 20-ppbv calibration level are tentatively identified and quantitatively estimated. This standard was chosen to determine the integration cutoff as it is in the middle of the chromatographic range and not in a region typically affected by coelution of other compounds. The quality of the mass-spectral searches was then reviewed by the principal investigators before the identification was assigned to each chromatographic peak.
Identification and Quantitation of Tentatively Identified Compounds. The tentatively
The concentration of each TIC was estimated using a relative response factor calculated using a corrected total peak area for the IS chlorobenzene-d5. Specifically, the total integrated area for the chlorobenzene-d5 peak had to be corrected for possible coeluting compounds before calculating the response factor. The corrected total peak area for the IS was calculated by multiplying the IS quantitation ion by a correction factor based on the ratio of the total integrated peak area to the quantitation ion as measured in blank runs. The corrected peak area was then used to calculate a response factor using the IS concentration in mg/m3:
IS conc. (mg/m’) IS peak area
Response Factor = (3.2)
The calculated response factor was then multiplied by the TIC peak area to give an estimated concentration for that compound. For nonanal, the total peak area was multiplied by the response factor for chlorobenzene-d5 to give an estimated concentration of 0.1 13 mg/m3 (average of two samples). Internal standards bromochloromethane and difluorobenzene were not used to quantitate the TICs because coeluting compounds appeared to have greatly altered the signal of the quantitation ions for those two 1%.
The ppmv concentrations are calculated from mg/m3 and the molecular weight of the analyte.
14

TIC (mg/m’) x 22.4 Wmole TIC g mol wt
TICinppmv = (3.3)
The IS level added to all blank, standard, and sample injections was 18.3 ppbv for bromochloromethane, 20.3 ppbv for 1 ,4-difluorobenzeneY and 18.2 ppbv for chlorobenzene-d5. The IS concentrations were converted from ppbv to mg/m3 at STP using a molecular weight of 129.39 (g/mol) for bromochloromethane, 1 14.09 for 1 ,4-difluorobenzeneY and 117.6 for chlorobenzene-d5.
3.4 Analysis Results
The results from the GC/MS analysis of the tank-headspace samples are presented in Tables 3.1 and 3.2. A representative total ion chromatogram showing the identity of major constituents is given in Figure 3.1.
Table 3.1 lists the quantitative results for compounds listed in Method TO-14. The levels of TO-14 analytes observed in the sample collected from Tank C-1 1 1 were all below the quantitation limit (2 ppbv).
Table 3.2 lists the semi-quantitative results for the TICS. The predominant species observed in this sample were acetone, hexanal, octanal, and nonanal, which were present in SUMMAW canisters S4030----126 and S4030-----128. Heptanal was also found in canister S4030-----128. The normal paraffin hydrocarbons (NPH), defined as n-alkanes from C11 to C15, were not seen in the sample. The total concentration of the TIC compounds was found to be 0.401 mg/m3.
15


4.0 Conclusions
The concentrations of selected inorganic and organic compounds were determined from in situ samples of the headspace of Tank C-1 1 1 on 6/20/94. Sample preparation and analysis methods were similar to those described by Ligotke et al. (1994) for VSS samples obtained for Tank C-103, a tank containing a relatively complex headspace composition. Method-validation measurements during that study did appear to validate the trapping and analysis of NH,, but did not eliminate the possibility of interferences that could affect NO, results. It is recommended that additional control samples be obtained if a tank is discovered, in the future, to contain significant quantities of NO,. In the current sample job, NO, samples were obtained after first passing sample flow through an NH, trap. The N H 3 concentration was found to be 1 k 1 ppmv. The concentration of NO, was I 0.04 ppmv. The concentration of NO was I 0.1 ppmv. The concentration of HCN was estimated to be I 0.01 ppmv. The mass concentration was 17 k 3 mg/mL and was expected to consist largely of water vapor. Minor differences between the individual results of the three NH, samples matched closely the differences in the quantities of dry air sampled during each sampling event.
The concentration of selected organic compounds was determined. All TO- 14 compounds were below the calibrated instrumental detection limits. Although two compounds, toluene and FREON-12, were below the detection limit, they are probably present in the tank headspace. Five TICS were found (Table 3.2). These made up more than 100% of the total organics. The compound 1,1,2-trichloro-l,l,2-trifluoroethane (FREON-113) is a contaminant in the analysis system, so it may not be present in the tank headspace.
5.0 References
Clauss, T. W., M. W. Ligotke, B. D. McVeety, K. H. Pool, R. B. Lucke, J. S. Fruchter, and S. C. Goheen. 1994. Vapor Space Characterization of Waste Tank 241 -BY-104: Results from Samples Collected on 6/24/94. PNL- 10208. Pacific Northwest Laboratory, Richland, Washington.
Ligotke, M. W., IS. H. Pool, and B. D. Lerner. 1994. Vapor Space Characterization of Waste Tank 241-C-103: Inorganic Results from Sample Job 7B (5/12/94 - 5/25/94). PNL-20172, Pacific Northwest Laboratory, Richland, Washington.
6.0 Further Reading
Pacific Northwest Laboratory. Analytical Laboratory Procedure Compendium. Procedures PNL- ALO-212, -226, -271. PNL-MA-599, Richland, Washington.
Pacific Northwest Laboratory. Quality Assurance Manual, Part 2: Good Practices Standard. PNL- MA-70, Part 2, Richland, Washington.
17

Pacific Northwest Laboratory. Quality Assurance Plan for Activities Conducted by the Analytical Chemistry Laboratory (ACL). MCS-033, Analytical Chemistry Laboratory, Richland, Washington.
Pacific Northwest Laboratory. 1994. Determination of TO-14 Volatile Organic Compounds in Hanford Waste Tank Headspace Samples Using SUMMATM Passivated Canister Sampling and Gas Chromatogruphic-Mass Spectrometry Analysis, PNL-TVP-03 (Rev. 0), PNL Technical Procedure, Richland, Washington.
18

Table 3.1 TO-14 Analysis Results for In situ Samples S4030-###-126 (a), S4030-###-128 fa), and S4030-###-069 (a) Collected from Hanford Waste Tank 241-C-111 In SUMMA Canisters on 6120194.
PNL 126 Ibl PNL 128 Ibb PNL 069(b\ Average Standard Table of TO-14 Standard Components Concentration Concentration concentration Deviation Concentration
ma1cu.m ma1cu.m 10-14 Analyte MolWt CAS# ppbv mg/cu.m ppbw mg/cu.m ppbv mg1cu.m dlchlomdifluoromethane (FREON-1 2) 120.92 75-71 -8 1.48 0.008 1.46 0.008 1.43 0.008 0.008 0.000 methyl chloride (chloromethane) l,2-dichloro-l.1,2,2,-tetrafluoroethane (FREON-1 14) chloroethene (vinyl chloride) methyl bromide (bromomethane) ethyl chloride trichlomfluommethane (FREON-1 1) 1.1-dichlomethene (1.1-dlchloroethylene) dichlommethane (methylene chloride) 1,1,2-trichloro-1.2,2-trifluomethane (FREON-1 13) 1,l -dichlomethane cis-1.2-dichlomethene (cis-1.2-dkhlomethylene) trichlommethane (chiomform) CIS 1.2-dichloroethane 1.1.1-trichloroethane benzene carbon tetrachloride 1,2-dichlompropane trichloroethylene
trans 1.3-dlchloropropene 1,1,2-trichloroethane methy! benzene (toluene) 1.2-dibmmoethane tetrachlomethene ftetrachlomethylene) chlombenzene ethylbenzene plm-xylene (1,3-dimethylbenzene) atyrene 1,1,2,2-tetrachlomethane o-xylene I1 ,2-dimethylbenzene) 1.3.5-trimethylbenzene 1.2,4-trimethylbenzene chloromethylbenzene, alpha (benzyl chloride) m-dichlorobenzene (1.3-dichlombenzene) p-dichlombenzene ( I ,4-dlchlorobenzene) 0-dichlombenzene (1.2-dichlorobenzene) 1,2.4-trichlorobenzene
w cir 1,3-dIchloropmpene
50.49 170.93 62.50 94.95 64.52 137.38 96.95 04.94 187.40 99.00 96.90 119.40 99.00 133.40 78.10 153.80 113.00 131.40 111.00 111.00 133.40 92.14 187.90 165.83 11 2.60 106.20 106.17 104.20 137.90 106.17 1 20.20 120.20 126.80 147.00 147.00 147.00 181.45
~~
74-87-3 76-14-2 75-01 -4 74-83-9 75-00-3 75-69-4 75-35-4 75-09-2 76-13-1 75-34-3 166-605 67-66-3 107-052 71-55-6 71-43-2 5523-5 78-87-5 79-01-6
10081 -01 -6 10061-02-5
79-00-5 108-88-3 10593-4 127-1 8-4 108-90-7 100-41-4 108-38-3 106-42-3 10542-3 100-42-5 79-34-5 95-47-6
95-63-6 100-44-7 641-73-1 106-46-7
10867-8
2.05 c 2 c 2 c 2 c 2
0.81 c 2 c 2 c 2 c 2 c 2 c 2 < 2 c 2 c 2 c 2 c 2 c 2 c 2 c 2 c 2
2.30 c 2 c 2 c 2 c 2 c 2 c 2 < 2 c 2 < 2 c 2 c 2 c 2 < 2 < 2 c 2
0.01 1 c .02 C ,006 c .009 C .006 c .01
c .009 < .009 c .02
c .009 c .009 c .01
< .009 c .01
c .009 < .01 c .01 c .01 c .01 c .01 c .01 0.009 c .02 < .02 c .01 c .01
c .009 c .009 < .02
c .009 c .01 c -01 c .01 c .01 c .01 < .01 c .02
c 2 c 2 c 2 c 2 c 2
0.81 c 2 c 2 < 2 c 2 c 2 c 2 c 2 'C 2 c 2 c 2 c 2 c 2 c 2 c 2 c 2
1.77 c 2 c 2 c 2 < 2 < 2 c 2 c 2 c 2 c 2 c 2 < 2 c 2 c 2 c 2 c 2
C .004 c .02 C ,006 c .009 C .006 c .01
c .009 c .009 c .02
c .009 c .009 < .01
c .009 c .01
c .009 < .01 c .01 c .01 c .01 c .01 c .01 0.007 c .02 c .02 c .01 c ,01
c .009 c .009 c .02
c .009 c .01 c .01 c .01 c .01 c .01 c .01 c .02
c 2 c 2 < 2
1.89 c 2
0.83 c 2 c 2 c 2 c 2 c 2 < 2 1 2 c 2
3.56 c 2 c 2 < 2 c 2 c 2 c 2
1.10 c 2 c 2 c 2 c 2 c 2 c 2 c 2 c 2 c 2 c 2 < 2 c 2 c 2 c 2 c 2
C .004 c .02 C .006 0.01 2 C .006 0.005
c .009 c .009 c .02
c .009 < .009 c .01
c ,009 c .01 0.022 c .01 c .01 c .01 c .01 c .01 < .01 c .01 c .02 c .02 c .01 c .01
c .009 < .009 c .02
c .009 < .01 < .01 < .01 c .01 c .01 < .01 < .02
hexachlotu-1 ,S-butadbne 260.80 95-50-1 c 2 c .02 c 2 c .02 < 2 < .02
(a) WHC sample Identification number. ,
(b) PNL canister number. IC) Average and standard deviation data is not meaningful for this analyte.

N 0
Table 3.2 Table of Tentavtively identified Compounds In-Situ and Estimated Concentrations(a) in Hanford Tank 241-c-I I I SUMMA" Canister Samples Collected on 6/20/94
S4030-###.1 26(b) S4030-###.128@) S4030-###.069(b) PNL 126@) PNL 128") PNL 069") Means and Standard Deviations
Tentatively identified Compound" CAS#(' Mo1.W. RetTirne malm3 ppmv m@m3 ppmv mg/m3 ppmv mg/m3 stdev ppmv stdev carbon dioxide 12438-9 44 3.161 e e e e e e e e acetone 67-641 58 8.524 0.076 0.029 0.076 0.030 G0.026 GO.010 0.076 0.029 1 ,1,2-trichloro I ,2,2-trifl~oroethane(~) 76-13-1 187 11.118 0.065 0.008 0.112 0.013 0.091 0.011 0.089 0.024 0.011 0.003 bromochloromethane (IS) 7497-5 128 14.895 f f f f f f 1,4difluorobenzene (IS) 540-36-3 114 18.611 f f f f f f hexanal 66-25-1 loo 25.003 0.051 0.011 0.059 0.013 dO.044 cO.010 0.055 0.005 0.012 0.001 d5-chlorobentene (IS) 311455.4 117 28.173 f f f f f f heptanal 111-71-7 114 30.34 ~0.050 ~0.010 0.050 0.010 GO.050 c0.010 0.050 0.01 0 actanal 12413-0 128 35.275 0.069 0.012 0.068 0.012 ~0.058 ~0.010 0.068 0.001 0.012 o.Oo0 nonanai 124-19-6 142 39.804 0.123 0.019 0.103 0.016 40.064 ~0.010 0.113 0.014 0.018 0.002
Semiquantitative estimate calculated using collcentration of closest elutlng internal standard. WHC sample number. PNL SUMMA^ canister number. Obtained by mass spectral interpretation amd comparison wlth the EPNNiSTMllLEY Libraly. Carbon Dioxide cannot be determined by the analytical method used. Concentration information for internal standards are determined by direct calibration.
Analytical system contaminant
Abundance L - e,
P 0 0 0 0
m 00 0 N 0 0 0 0 0 0 0 0 0 0 0 0 0 0 0
0 0 0 0 0 0
P N 0 0 0 0 -
I-" 0 0
c
9 (P
0 1,1,2-Trichlro,1,2,2-tfluoroethane 0
e,
I-" Bromochloromethane (IS) 0 0
s! N 2
3 8 0 U
2 N
2
8
0
w
0
5 (P
h
E; v / Heptanal
w cn
0 0
P 3 1 rn 0
0 a 0 E
P
0 0
I-"
D
g.
3 0 1 a I.
8

PNL-10367 UC-606
No. of Copies
Distribution
No. of Copies
Offsite Onsite
2 DOE/Office of Scientific and Technical Information
R. A. Jenkins Oak Ridge National Laboratory P.O. Box 2008 Building 4500-5, MS 6120 Oak Ridge, Tennessee 37831-6120
B. C. Kowalski CPAC University of Washington
Seattle, Washington 98195 MS BG-10
2 DOE Richland Ouerations Office
M. F. Jarvis, S7-54 C. Babel, S7-54
Corns of Engineers
T. W. Gardner-Clayson, A5-19
10 Westinghouse Hanford ComDanv
H. Babad, R2-78 D. R. Bratzel, S7-31 (2) S. J. EberIien, R2-12 T. J. Kelley, S7-30 E. R. Hewitt, €23-01 N. W. Kirch, R2-11 E. J. Lipke, S7-14 J. E. Meacham, S7-15 B. C. Simpson, R2-12
20 Pacific Northwest Laboratorv
T. W. Clauss, P8-08 K. H. Pool, P8-44
B. D. McVeety, K6-84 K. B. Olsen, K6-96 J. S. Fruchter, K6-96 S. C. Goheen, P8-08 M. W. Ligotke P7-59 (6)
K. L. Silvers, p7-27 Technical Report Files (5)
B. 'L. OW, K9-25
J. L. Huckaby, K6-55
Dist. 1
Related Documents


![PNL - Il Potere Delle Parole e Della PNL[1]](https://static.cupdf.com/doc/110x72/55cf9445550346f57ba0d428/pnl-il-potere-delle-parole-e-della-pnl1.jpg)


