Central Water Commission India Meteorological Department PMP Atlas for Mahanadi and Adjoining River Basins Final Report Volume I: Main Report February 2015 Prepared by RMSI A-8, Sector 16 Noida 201301, INDIA www.rmsi.com

Welcome message from author
This document is posted to help you gain knowledge. Please leave a comment to let me know what you think about it! Share it to your friends and learn new things together.
Transcript

Central Water Commission India Meteorological Department
PMP Atlas for Mahanadi and Adjoining River Basins
Final Report
Volume I: Main Report
February 2015
Prepared by
RMSI A-8, Sector 16
Noida 201301, INDIA www.rmsi.com

FOREWORD
I am happy that Central Water Commission in association with India Meteorological Department has prepared the PMP Atlases for various basins in the country. These PMP Atlases would be very useful not only in assessing the inflow design flood for planning of any water resources project but also in assessing the hydrologic safety of old dams many of which have aged and require periodic safety review. I am also pleased to note that these PMP Atlases have been prepared on GIS platform and cover all relevant details such as pattern of key storms along with their synoptic situations, observed rainfall statistics at various stations, return period rainfalls at various stations, spatial and temporal distribution of rainfalls etc. apart from grid wise PMP estimate for quick/direct assessment of applicable PMP/SPS for a catchment.
I compliment HSO, CWC, IMD and consultant's team for the fine efforts made in bringing this publication. I am sure that such cooperation between CWC and IMD shall continue and many more such projects shall be taken up jointly for the benefit of water sector and society.
I am sure this publication shall be of immense use to practicing engineers who have limited knowledge of storm studies, in the assessment of design storm, the key and the most influencing factor in the assessment of design flood of any water resources structure.


Preamble This PMP Atlas of Mahanadi and Adjoining River Basins has been prepared jointly by Central Water Commission and India Meteorological Department, Government of India. This Atlas is an updation of the earlier PMP Atlas prepared in nineties under Dam Safety Assurance and Rehabilitation Project(DSARP).The Atlas shall be very useful in the assessment of design storm as required in the assessment of design flood for any water resources development project.
The grid wise PMPs given in the Atlas may be used for quick/direct assessment of applicable PMP/SPS for a catchment. However, such assessment should be limited to small and medium catchments only and should not be used for large catchments. Also, the detailed and precise analysis would be desirable for taking a final decision on applicable design storm.
The Atlas also covers very useful information such as patterns of key storms along with their synoptic situations, rainfall statistics at various stations and for various river basins, temporal distribution patterns of rainfall etc. which shall be very useful even for carrying the detailed storm analysis for a project.

Contents
PMP Atlas for Mahanadi and Adjoining River Basins Page 9 of 260
Table of Contents Preamble ................................................................................................................................................ 7
Table of Contents .................................................................................................................................. 9
List of Figures ..................................................................................................................................... 13
List of Tables ....................................................................................................................................... 17
Acknowledgements ............................................................................................................................ 21
Abbreviations Used ............................................................................................................................ 23
1 Introduction ................................................................................................................................. 25
1.1 Background ......................................................................................................................................... 25 1.2 Objectives of study .............................................................................................................................. 25 1.3 Scope of work ...................................................................................................................................... 26 1.4 Work assignment ................................................................................................................................ 28 1.5 Contents of report ............................................................................................................................... 29
2 Study Area and its Climatology ................................................................................................. 31
2.1 Study area ........................................................................................................................................... 31 2.1.1 Mahanadi and adjoining rivers ....................................................................................................... 31
2.2 Topography ......................................................................................................................................... 32 2.3 Climate ................................................................................................................................................ 33 2.4 Catchments of Mahanadi and Adjoining River Basins ......................................................................... 33 2.5 Climatology ......................................................................................................................................... 33
2.5.1 Rainfall data .................................................................................................................................... 33 2.5.1.1 Rainfall Data Acquisition ........................................................................................................................ 34 2.5.1.2 Quality control and analysis of rainfall data........................................................................................... 35
2.5.2 SRRG data ....................................................................................................................................... 35 2.5.3 Dew point temperature data .......................................................................................................... 38 2.5.4 Meteorological causes of heavy rainfall over Mahanadi and Adjoining River Basins ..................... 38 2.5.5 Monthly, periodic and annual rainfall............................................................................................. 39 2.5.6 Analysis of highest rainfall .............................................................................................................. 43
3 Estimation of PMP by Physical Approach ................................................................................ 65
3.1 Details about PMP ............................................................................................................................... 65 3.1.1 Introduction .................................................................................................................................... 65 3.1.2 Theoretical Background of Physical Method .................................................................................. 65 3.1.3 Methods for Estimating PMP .......................................................................................................... 65 3.1.4 PMP by Generalized Method .......................................................................................................... 66 3.1.5 Storm Moisture Maximization ........................................................................................................ 67 3.1.6 Rainstorm Transposition Adjustments ........................................................................................... 69
3.1.6.1 Location Adjustment Factor (LAF) .......................................................................................................... 69 3.1.6.2 Barrier Adjustment Factor (BAF) ............................................................................................................ 70 3.1.6.3 Transposition Adjustment Factor (TAF) ................................................................................................. 70 3.1.6.4 Moisture Adjustment Factor (MAF) ....................................................................................................... 70
3.1.7 Limit of Transposition ..................................................................................................................... 72 3.1.8 Persisting dew points ...................................................................................................................... 72 3.1.9 Maximum persisting 24-hour 1,000 hPa dew points ...................................................................... 73
3.2 Analysis of rainstorms ......................................................................................................................... 74 3.2.1 Selection of rainstorms ................................................................................................................... 74 3.2.2 Synoptic situation of major rainstorms .......................................................................................... 84
3.2.2.1 Rainstorm of 2-4 August 1910 ............................................................................................................ 84 3.2.2.2 Rainstorm of 24-26 June 1914 ............................................................................................................ 84 3.2.2.3 Rainstorm of 27-29 June 1925 ............................................................................................................ 84 3.2.2.4 Rainstorm of 16-17 August 1926 ........................................................................................................ 85 3.2.2.5 Rainstorm of 28-30 July 1927 ............................................................................................................. 85 3.2.2.6 Rainstorm of 24 August 1929 .............................................................................................................. 85

Contents
PMP Atlas for Mahanadi and Adjoining River Basins Page 10 of 260
3.2.2.7 Rainstorm of 21 August 1931 .............................................................................................................. 85 3.2.2.8 Rainstorm of 13-15 October 1931 ...................................................................................................... 86 3.2.2.9 Rainstorm of 2-4 August 1933 ............................................................................................................ 86 3.2.2.10 Rainstorm of 13-15 June 1936 ............................................................................................................ 86 3.2.2.11 Rainstorm of 27-28 June 1937 ............................................................................................................ 87 3.2.2.12 Rainstorm of 24 July 1937 ................................................................................................................... 87 3.2.2.13 Rainstorm of 25 July 1937 ................................................................................................................... 87 3.2.2.14 Rainstorm of 17 August 1939 .............................................................................................................. 87 3.2.2.15 Rainstorm of 17-19 August 1939 ........................................................................................................ 88 3.2.2.16 Rainstorm of 24-26 June 1940 ............................................................................................................ 88 3.2.2.17 Rainstorm of 1 July 1940 ..................................................................................................................... 89 3.2.2.18 Rainstorm of 7-9 July 1940 .................................................................................................................. 89 3.2.2.19 Rainstorm of 9 July 1940 ..................................................................................................................... 89 3.2.2.20 Rainstorm of 10 July 1941 ................................................................................................................... 89 3.2.2.21 Rainstorm of 8 October 1941 .............................................................................................................. 90 3.2.2.22 Rainstorm of 1 August 1943 ................................................................................................................ 90 3.2.2.23 Rainstorm of 20 August 1944 .............................................................................................................. 90 3.2.2.24 Rainstorm of 14-16 August 1948 ........................................................................................................ 91 3.2.2.25 Rainstorm of 18-19 June 1953 ............................................................................................................ 91 3.2.2.26 Rainstorm of 4 August 1953 ................................................................................................................ 91 3.2.2.27 Rainstorm of 15 July 1958 ................................................................................................................... 92 3.2.2.28 Rainstorm of 1 July 1970 ..................................................................................................................... 92 3.2.2.29 Rainstorm of 6-8 July 1973 .................................................................................................................. 92 3.2.2.30 Rainstorm of 20-22 November 1977 .................................................................................................. 92 3.2.2.31 Rainstorm of 28-30 August 1982 ........................................................................................................ 93 3.2.2.32 Rainstorm of 22-24 July 1989 ............................................................................................................. 93 3.2.2.33 Rainstorm of 15-17 July 1991 ............................................................................................................. 94 3.2.2.34 Rainstorm of 20-22 July 1991 ............................................................................................................. 94 3.2.2.35 Rainstorm of 11-13 August 1991 ........................................................................................................ 94 3.2.2.36 Rainstorm of 14-16 June 1994 ............................................................................................................ 95 3.2.2.37 Rainstorm of 26-28 August 2003 ........................................................................................................ 95 3.2.2.38 Rainstorm of 12-14 June 2004 ............................................................................................................ 95 3.2.2.39 Rainstorm of 2-4 August 2006 ............................................................................................................ 96 3.2.2.40 Rainstorm of 4-6 August 2007 ............................................................................................................ 96 3.2.2.41 Rainstorm of 5-7 August 2007 ............................................................................................................ 96 3.2.2.42 Rainstorm of 13 August 2007 .............................................................................................................. 97 3.2.2.43 Rainstorm of 16-18 September 2008.................................................................................................. 97
3.2.3 DAD (Depth Area Duration) analysis of rainstorms ...................................................................... 108 3.2.4 Calculation of moisture maximization factor for rainstorms ........................................................ 117
3.2.4.1 Example: Calculation of MMF for rainstorm of 28-30 Aug 1982 at Bijepur ......................................... 117 3.3 Estimation of PMP over different catchments of Mahanadi and Adjoining River Basins ................. 123
3.3.1 Identification of rainstorms for DAD analysis ............................................................................... 123 3.3.2 Rainstorms contributing to DAD envelope curves of catchments ................................................ 128 3.3.3 Catchment No. 318 ....................................................................................................................... 130 3.3.4 Catchment No. 319 ....................................................................................................................... 135 3.3.5 Catchment No. 320 ....................................................................................................................... 140 3.3.6 Catchment No. 321 ....................................................................................................................... 145 3.3.7 Catchment No. 322 ....................................................................................................................... 150 3.3.8 Highest transposed 1-day, 2-day, and 3-day raindepth for various catchments .......................... 155
3.4 Computation of PMP at Grid Points .................................................................................................. 155 3.4.1 Grid point locations ...................................................................................................................... 155 3.4.2 Identifications of rainstorms ......................................................................................................... 156 3.4.3 Estimation of MAF ........................................................................................................................ 166
3.4.3.1 Calculation of MAF for rainstorm of 2830 Aug 1982 at Bijepur for Grid Point MND320-05 (210N, 84
0E)
in Catchment No 320 ............................................................................................................................................... 166 3.4.4 Rainstorms contributing to DAD envelope curves of grid points ................................................. 166 3.4.5 Estimates of areal pmp at grid points ........................................................................................... 170
3.5 Time distribution analysis ................................................................................................................. 185 3.6 Clock hour correction ........................................................................................................................ 200 3.7 Area reduction factor ........................................................................................................................ 200 3.8 Practical example .............................................................................................................................. 208

Contents
PMP Atlas for Mahanadi and Adjoining River Basins Page 11 of 260
3.8.1 Use of Grid PMP ............................................................................................................................ 208 3.8.2 Use of transposition technique ..................................................................................................... 209
3.8.2.1 Salandi Project in Brahmini Bhaitarini Basin ........................................................................................ 210 3.8.2.1 Sondur Project in Mahanadi Basin ....................................................................................................... 211
4 Statistical Estimates of PMP and Design Rainfalls for Different Return Periods ............... 217
4.1 Statistical estimates of PMP .............................................................................................................. 217 4.1.1 Introduction .................................................................................................................................. 217 4.1.2 Hershfield statistical method ........................................................................................................ 217 4.1.3 Rainfall data used ......................................................................................................................... 218 4.1.4 Homogeneity of the data series.................................................................................................... 219 4.1.5 Statistical estimates of pmp values for 1, 2 and 3-day durations ................................................. 219
4.1.5.1 Development of Km Envelope Curves ................................................................................................... 219 4.1.5.2 Derivation of Point PMP from Envelope Curves .................................................................................. 221 4.1.5.3 Preparation of Generalized Point PMP Maps....................................................................................... 227 4.1.5.4 Use of the Point PMP Maps ................................................................................................................. 228
4.2 Return Period Analysis – Mahanadi and Adjoining River Basins ....................................................... 229 4.2.1 Data series for rainfall return period analysis............................................................................... 229 4.2.2 Definitions and frequency analysis ............................................................................................... 229 4.2.3 Gumbel’s extreme value (EV1) distribution .................................................................................. 230 4.2.4 Estimation of parameters by L-Moments ..................................................................................... 231 4.2.5 Estimation of parameters by least squares .................................................................................. 232 4.2.6 95 % confidence interval for different return period values based on Gumbel distribution ....... 233
5 Annexure .................................................................................................................................... 235
References ......................................................................................................................................... 257

PMP Atlas for Mahanadi and Adjoining River Basins Page 12 of 260

List of Figures
PMP Atlas for Mahanadi and Adjoining River Basins Page 13 of 260
List of Figures Figure 1-1: River basins of India............................................................................................................................ 27
Figure 2-1: Mahanadi and adjoining River Basin .................................................................................................. 32
Figure 2-2: Locations of rainfall stations in and around the Mahanadi and Adjoining River Basins .................... 34
Figure 2-3: Data availability for stations in the Mahanadi and Adjoining River Basins ........................................ 35
Figure 2-4: Locations of SRRG rainfall stations in the Mahanadi and Adjoining River Basins .............................. 36
Figure 3-1: PMP estimation approach used in the study...................................................................................... 67
Figure 3-2: Pseudo-adiabatic diagram for dew point reduction to 1,000 hPa ..................................................... 68
Figure 3-3: Precipitable water above 1,000 hPa in saturated air mass knowing surface dew point temperature ................................................................................................................................................................ 68
Figure 3-4: Movement of storm through barrier elevations h1 and h2 ................................................................. 71
Figure 3-5: Maximum persisting 24-hour 1,000 hPa dew point temperature (oC) ............................................... 74
Figure 3-6: Locations of 1-day rainstorms ............................................................................................................ 81
Figure 3-7: Locations of 2-day rainstorms ............................................................................................................ 82
Figure 3-8: Locations of 3-day rainstorms ............................................................................................................ 83
Figure 3-9: Mahanadi and Adjoining River Basins severe rainstorm producing tracks of cyclonic disturbances (1901-1910) ............................................................................................................................................ 98
Figure 3-10: Mahanadi and Adjoining River Basins severe rainstorm producing tracks of cyclonic disturbances (1911-1920) ............................................................................................................................................ 99
Figure 3-11: Mahanadi and Adjoining River Basins severe rainstorm producing tracks of cyclonic disturbances (1921-1930) .......................................................................................................................................... 100
Figure 3-12: Mahanadi and Adjoining River Basins severe rainstorm producing tracks of cyclonic disturbances (1931-1940) .......................................................................................................................................... 101
Figure 3-13: Mahanadi and Adjoining River Basins severe rainstorm producing tracks of cyclonic disturbances (1941-1950) .......................................................................................................................................... 102
Figure 3-14: Mahanadi and Adjoining River Basins severe rainstorm producing tracks of cyclonic disturbances (1951-1960) .......................................................................................................................................... 103
Figure 3-15: Mahanadi and Adjoining River Basins severe rainstorm producing tracks of cyclonic disturbances (1961-1970) .......................................................................................................................................... 104
Figure 3-16: Mahanadi and Adjoining River Basins severe rainstorm producing tracks of cyclonic disturbances (1971-1980) .......................................................................................................................................... 105
Figure 3-17: Mahanadi and Adjoining River Basins severe rainstorm producing tracks of cyclonic disturbances (1981-1990) .......................................................................................................................................... 106
Figure 3-18: Mahanadi and Adjoining River Basins severe rainstorm producing tracks of cyclonic disturbances (2001-2010) .......................................................................................................................................... 107
Figure 3-19: Envelope DAD Curve (1-day) for Catchment-318 ........................................................................... 132
Figure 3-20: Envelope DAD Curve (2-day) for Catchment-318 ........................................................................... 132
Figure 3-21: Envelope DAD Curve (3-day) for Catchment-318 ........................................................................... 133
Figure 3-22: Envelope DAD Curve (1-day) for Catchment-319 ........................................................................... 137
Figure 3-23: Envelope DAD Curve (2-day) for Catchment-319 ........................................................................... 138
Figure 3-24: Envelope DAD Curve (3-day) for Catchment-319 ........................................................................... 138

List of Figures
PMP Atlas for Mahanadi and Adjoining River Basins Page 14 of 260
Figure 3-25: Envelope DAD Curve (1-day) for Catchment-320 ........................................................................... 142
Figure 3-26: Envelope DAD Curve (2-day) for Catchment-320 ........................................................................... 143
Figure 3-27: Envelope DAD Curve (3-day) for Catchment-320 ........................................................................... 143
Figure 3-28: Envelope DAD Curve (1-day) for Catchment-321 ........................................................................... 147
Figure 3-29: Envelope DAD Curve (2-day) for Catchment-321 ........................................................................... 148
Figure 3-30: Envelope DAD Curve (3-day) for Catchment-321 ........................................................................... 148
Figure 3-31: Envelope DAD Curve (1-day) for Catchment-322 ........................................................................... 152
Figure 3-32: Envelope DAD Curve (2-day) for Catchment-322 ........................................................................... 152
Figure 3-33: Envelope DAD Curve (3-day) for Catchment-322 ........................................................................... 153
Figure 3-34: Grid point locations, in and around, Mahanadi and Adjoining River Basins .................................. 156
Figure 3-35: Smoothened time distribution curve (12-hour) for Catchment-318 .............................................. 187
Figure 3-36: Smoothened time distribution curve (12-hour) for Catchment-319 .............................................. 187
Figure 3-37: Smoothened time distribution curve (12-hour) for Catchment-320 .............................................. 188
Figure 3-38: Smoothened time distribution curve (12-hour) for Catchment-321 .............................................. 188
Figure 3-39: Smoothened time distribution curve (12-hour) for Catchment-322 .............................................. 188
Figure 3-40: Smoothened time distribution curve (12-hour) for Mahanadi and Adjoining River Basins for all rainspells .............................................................................................................................................. 189
Figure 3-41: Smoothened time distribution curve (24-hour) for Catchment-318 .............................................. 191
Figure 3-42: Smoothened time distribution curve (24-hour) for Catchment-319 .............................................. 191
Figure 3-43: Smoothened time distribution curve (24-hour) for Catchment-320 .............................................. 191
Figure 3-44: Smoothened time distribution curve (24-hour) for Catchment-321 .............................................. 192
Figure 3-45: Smoothened time distribution curve (24-hour) for Catchment-322 .............................................. 192
Figure 3-46: Smoothened time distribution curve (24-hour) for Mahanadi and Adjoining River Basins (Rainspells < 250 mm) ............................................................................................................................................ 192
Figure 3-47: Smoothened time distribution curve (24-hour) for Mahanadi and Adjoining River Basins (Rainspells > 250 mm) ............................................................................................................................................ 193
Figure 3-48: Smoothened time distribution curve (24-hour) for Mahanadi and Adjoining River Basins for all rainspells .............................................................................................................................................. 193
Figure 3-49: Smoothened time distribution curve (48-hour) for Catchment-318 .............................................. 195
Figure 3-50: Smoothened time distribution curve (48-hour) for Catchment-319 .............................................. 195
Figure 3-51: Smoothened time distribution curve (48-hour) for Catchment-320 .............................................. 195
Figure 3-52: Smoothened time distribution curve (48-hour) for Catchment-321 .............................................. 196
Figure 3-53: Smoothened time distribution curve (48-hour) for Catchment-322 .............................................. 196
Figure 3-54: Smoothened time distribution curve (48-hour) for Mahanadi and Adjoining River Basins for all rainspells .............................................................................................................................................. 196
Figure 3-55: Smoothened time distribution curve (72-hour) for Catchment-318 .............................................. 198
Figure 3-56: Smoothened time distribution curve (72-hour) for Catchment-319 .............................................. 198
Figure 3-57: Smoothened time distribution curve (72-hour) for Catchment-320 .............................................. 198
Figure 3-58: Smoothened time distribution curve (72-hour) for Catchment-321 .............................................. 199
Figure 3-59: Smoothened time distribution curve (72-hour) for Catchment-322 .............................................. 199

List of Figures
PMP Atlas for Mahanadi and Adjoining River Basins Page 15 of 260
Figure 3-60: Smoothened time distribution curve (72-hour) for Mahanadi and Adjoining River Basins for all rainspells .............................................................................................................................................. 199
Figure 3-61: Area reduction curve (1-day) for Catchment-318 .......................................................................... 202
Figure 3-62: Area reduction curve (2-day) for Catchment-318 .......................................................................... 203
Figure 3-63: Area reduction curve (3-day) for Catchment-318 .......................................................................... 203
Figure 3-64: Area reduction curve (1-day) for Catchment-319 .......................................................................... 203
Figure 3-65: Area reduction curve (2-day) for Catchment-319 .......................................................................... 204
Figure 3-66: Area reduction curve (3-day) for Catchment-319 .......................................................................... 204
Figure 3-67: Area reduction curve (1-day) for Catchment-320 .......................................................................... 204
Figure 3-68: Area reduction curve (2-day) for Catchment-320 .......................................................................... 205
Figure 3-69: Area reduction curve (3-day) for Catchment-320 .......................................................................... 205
Figure 3-70: Area reduction curve (1-day) for Catchment-321 .......................................................................... 205
Figure 3-71: Area reduction curve (2-day) for Catchment-321 .......................................................................... 206
Figure 3-72: Area reduction curve (3-day) for Catchment-321 .......................................................................... 206
Figure 3-73: Area reduction curve (1-day) for Catchment-322 .......................................................................... 206
Figure 3-74: Area reduction curve (2-day) for Catchment-322 .......................................................................... 207
Figure 3-75: Area reduction curve (3-day) for Catchment-322 .......................................................................... 207
Figure 3-76: Location map of problem catchments............................................................................................ 208
Figure 3-77: Locations of Salandi and Sondur projects ...................................................................................... 210
Figure 3-78: Isohyetal map of 30 Jul. 1927 rainstorm where it occurred (In situ) ............................................. 212
Figure 3-79: Isohyetal map of 01 Aug. 1943 rainstorm where it occurred (In situ) ........................................... 212
Figure 3-80: Transposed storm isohyetal map of 30 Jul. 1927 over Salandi Catchment .................................... 213
Figure 3-81: Transposed storm isohyetal map of 01 Aug. 1943 over Salandi Catchment .................................. 213
Figure 3-82: Isohyetal map of 30 Aug. 1982 rainstorm where it occurred (In situ) ........................................... 214
Figure 3-83: Isohyetal map of 13 Jun. 2001 rainstorm where it occurred (In situ) ............................................ 214
Figure 3-84: Transposed storm isohyetal map of 30 Aug. 1982 over Sondur Catchment .................................. 215
Figure 3-85: Transposed storm isohyetal map of 13 Jun. 2001 over Sondur Catchment ................................... 215
Figure 4-1: Km as a function of rainfall duration and mean annual series (after Hershfield) ............................. 218
Figure 4-2: Envelope frequency factor curve for 1-day annual maximum rainfall ............................................. 220
Figure 4-3: Envelope frequency factor curve for 2-day annual maximum rainfall ............................................. 220
Figure 4-4: Envelope frequency factor curve for 3-day annual maximum rainfall ............................................. 221

PMP Atlas for Mahanadi and Adjoining River Basins Page 16 of 260

List of Tables
PMP Atlas for Mahanadi and Adjoining River Basins Page 17 of 260
List of Tables Table 2-1: Catchments of the Mahanadi and adjoining River Basin ..................................................................... 33
Table 2-2: Catchment wise number of stations .................................................................................................... 34
Table 2-3: Observed outliers in the rainfall data .................................................................................................. 35
Table 2-4: SRRG data availability .......................................................................................................................... 36
Table 2-5: Average monthly, periodic and annual rainfall over different catchments of the Mahanadi and Adjoining River Basins ............................................................................................................................ 40
Table 2-6: Highest 1, 2 and 3-day rainfalls (mm) recorded at different stations in the Mahanadi and Adjoining River Basins ............................................................................................................................................ 44
Table 2-7: Highest 1, 2 and 3-day rainfalls (mm) recorded at different stations in the adjoining catchments of Mahanadi and Adjoining River Basins .................................................................................................... 53
Table 3-1: Dew point temperatures (oC) at 24-hour interval ............................................................................... 73
Table 3-2: Rainstorms analyzed in Mahanadi and adjoining River Basin ............................................................. 75
Table 3-3: DAD Values (mm) over different standard areas (sq. km.) for 1-day duration contributed by rainstorms in and around Mahanadi and Adjoining River Basins ........................................................ 109
Table 3-4: DAD Values (mm) over different standard areas (sq. km.) for 2-day duration contributed by rainstorms in and around Mahanadi and Adjoining River Basins ........................................................ 112
Table 3-5: DAD Values (mm) over different standard areas (sq. km.) for 3-day duration contributed by rainstorms in and around Mahanadi and Adjoining River Basins ........................................................ 114
Table 3-6: Dew point stations used in the MMF estimation .............................................................................. 117
Table 3-7: Moisture maximization factors (in situ) for analyzed rainstorms ...................................................... 119
Table 3-8: Matrix showing affecting 1-day rainstorms at various catchments .................................................. 123
Table 3-9: Matrix showing affecting 2-day rainstorms at various catchments .................................................. 125
Table 3-10: Matrix showing affecting 3-day rainstorms at various catchments ................................................ 127
Table 3-11: 1-day rainstorms contributing to DAD envelope of the various catchments .................................. 129
Table 3-12: 2-day rainstorms contributing to DAD envelope of the various catchments .................................. 129
Table 3-13: 3-day rainstorms contributing to DAD envelope of the various catchments .................................. 129
Table 3-14: Rainstorms affecting Catchment-318 .............................................................................................. 130
Table 3-15: SPS (in situ) and PMP (in situ) values for Catchment-318 ............................................................... 134
Table 3-16: Rainstorms affecting Catchment-319 .............................................................................................. 135
Table 3-17: SPS (in situ) and PMP (in situ) values for Catchment-319 ............................................................... 139
Table 3-18: Rainstorms affecting Catchment-320 .............................................................................................. 140
Table 3-19: SPS (in situ) and PMP (in situ) values for Catchment-320 ............................................................... 144
Table 3-20: Rainstorms affecting Catchment-321 .............................................................................................. 145
Table 3-21: SPS (in situ) and PMP (in situ) values for Catchment-321 ............................................................... 149
Table 3-22: Rainstorms affecting Catchment-322 .............................................................................................. 150
Table 3-23: SPS (in situ) and PMP (in situ) values for Catchment-322 ............................................................... 154
Table 3-24: Highest transposed raindepth for different catchments of Mahanadi and Adjoining River Basins 155
Table 3-25: Grid point locations and the assigned codes ................................................................................... 155
Table 3-26: Matrix showing affecting 1-day rainstorms at various grid points .................................................. 157
List of Tables
PMP Atlas for Mahanadi and Adjoining River Basins Page 18 of 260
Table 3-27: Matrix showing affecting 2-day rainstorms at various grid points .................................................. 160
Table 3-28: Matrix showing affecting 3-day rainstorms at various grid points .................................................. 163
Table 3-29: 1-day rainstorms contributing to DAD envelope of the various grid points .................................... 167
Table 3-30: 2-day rainstorms contributing to DAD envelope of the various grid points .................................... 168
Table 3-31: 3-day rainstorms contributing to DAD envelope of the various grid points .................................... 169
Table 3-32: 1-day contributing storm, grid rain depth, TAF, SPS, MMF and PMP estimates at various grid points located in Mahanadi and Adjoining River Basins ................................................................................. 170
Table 3-33: 2-day contributing storm, grid rain depth, TAF, SPS, MMF and PMP estimates at various grid points located in Mahanadi and Adjoining River Basins ................................................................................. 175
Table 3-34: 3-day contributing storm, grid rain depth, TAF, SPS, MMF and PMP estimates at various grid points located in Mahanadi and Adjoining River Basins ................................................................................. 180
Table 3-35: List of rain spells used for time distribution analysis of 12-hour rainstorm .................................... 186
Table 3-36: Smoothened TD coefficients for entire Mahanadi and Adjoining River Basins and for different catchments for 12-hour rainspells ....................................................................................................... 187
Table 3-37: List of rain spells used for time distribution analysis of 24-hour rainstorm .................................... 189
Table 3-38: Smoothened TD coefficients for entire Mahanadi and Adjoining River Basins and for different catchments for 24-hour rainspells (including rainspells having rainfall greater than 250 mm and rainspells having rainfall less than 250 mm) ........................................................................................ 190
Table 3-39: List of rain spells used for time distribution analysis of 48-hour rainstorm .................................... 193
Table 3-40: Smoothened TD coefficients for entire Mahanadi and Adjoining River Basins and for different catchments for 48-hour rainspells ....................................................................................................... 194
Table 3-41: List of rain spells used for time distribution analysis of 72-hour duration ...................................... 197
Table 3-42: Smoothened TD coefficients for entire Mahanadi and Adjoining River Basins and for different catchments for 72-hour rainspells ....................................................................................................... 197
Table 3-43: Rainstorms used in estimation of selected ARF............................................................................... 201
Table 3-44: Selected area reduction factor for various catchments (1-day) ...................................................... 201
Table 3-45: Selected area reduction factor for various catchments (2-day) ...................................................... 201
Table 3-46: Selected area reduction factor for various catchments (3-day) ...................................................... 202
Table 4-1: Number of rainfall stations considered in each catchment of Mahanadi and Adjoining River Basins .............................................................................................................................................................. 219
Table 4-2: Frequency distribution of Km values for 1 to 3-day durations ........................................................... 219
Table 4-3: Point PMP estimates (station wise) for 1-day, 2-day and 3-day durations ....................................... 221
Table 4-4: Summary of maximum rainfalls, Point PMP rainfalls and their ratios obtained in the different catchments ........................................................................................................................................... 227
Table 5-1: Maximum rainfall in various sub-durations of selected 12-hour rainspells for Catchment 318 and TD coefficients ........................................................................................................................................... 235
Table 5-2: Maximum rainfall in various sub-durations of selected 12-hour rainspells for Catchment 319 and TD coefficients ........................................................................................................................................... 235
Table 5-3: Maximum rainfall in various sub-durations of selected 12-hour rainspells for Catchment 320 and TD coefficients ........................................................................................................................................... 236
Table 5-4: Maximum rainfall in various sub-durations of selected 12-hour rainspells for Catchment 321 and TD coefficients ........................................................................................................................................... 236

List of Tables
PMP Atlas for Mahanadi and Adjoining River Basins Page 19 of 260
Table 5-5: Maximum rainfall in various sub-durations of selected 12-hour rainspells for Catchment 322 and TD coefficients ........................................................................................................................................... 237
Table 5-6: Maximum rainfall in various sub-durations of selected 24-hour rainspells for Catchment 318 and TD coefficients ........................................................................................................................................... 237
Table 5-7: Maximum rainfall in various sub-durations of selected 24-hour rainspells for Catchment 319 and TD coefficients ........................................................................................................................................... 238
Table 5-8: Maximum rainfall in various sub-durations of selected 24-hour rainspells for Catchment 320 and TD coefficients ........................................................................................................................................... 239
Table 5-9: Maximum rainfall in various sub-durations of selected 24-hour rainspells for Catchment 321 and TD coefficients ........................................................................................................................................... 240
Table 5-10: Maximum rainfall in various sub-durations of selected 24-hour rainspells for Catchment 322 and TD coefficients ........................................................................................................................................... 240
Table 5-11: TD coefficients for entire Mahanadi and Adjoining River Basins for 24-hour rainspells (rainspells having rainfall greater than 250 mm and rainspells having rainfall less than 250 mm) ...................... 241
Table 5-12: Maximum rainfall in various sub-durations of selected 48-hour rainspells for Catchment 318 and TD coefficients ........................................................................................................................................... 242
Table 5-13: Maximum rainfall in various sub-durations of selected 48-hour rainspells for Catchment 319 and TD coefficients ........................................................................................................................................... 243
Table 5-14: Maximum rainfall in various sub-durations of selected 48-hour rainspells for catchment 320 and TD coefficients ........................................................................................................................................... 243
Table 5-15: Maximum rainfall in various sub-durations of selected 48-hour rainspells for Catchment 321 and TD coefficients ........................................................................................................................................... 244
Table 5-16: Maximum rainfall in various sub-durations of selected 48-hour rainspells for Catchment 322 and TD coefficients ........................................................................................................................................... 244
Table 5-17: Maximum rainfall in various sub-durations of selected 72-hour rainspells for Catchment 318 and TD coefficients ........................................................................................................................................... 245
Table 5-18: Maximum rainfall in various sub-durations of selected 72-hour rainspells for Catchment 319 and TD coefficients ........................................................................................................................................... 246
Table 5-19: Maximum rainfall in various sub-durations of selected 72-hour rainspells for Catchment 320 and TD coefficients ........................................................................................................................................... 247
Table 5-20: Maximum rainfall in various sub-durations of selected 72-hour rainspells for Catchment 321 and TD coefficients ........................................................................................................................................... 248
Table 5-21: Maximum rainfall in various sub-durations of selected 72-hour rainspells for Catchment 322 and TD coefficients ........................................................................................................................................... 248
Table 5-22: List of rainspells for clock hour for the 24-hour duration ................................................................ 250
Table 5-23: Envelope area reduction factor for various catchments (1-day) ..................................................... 252
Table 5-24: Envelope area reduction factor for various catchments (2-day) ..................................................... 253
Table 5-25: Envelope area reduction factor for various catchments (3-day) ..................................................... 253
Table 5-26: Average area reduction factor for various catchments (1-day) ....................................................... 254
Table 5-27: Average area reduction factor for various catchments (2-day) ....................................................... 254
Table 5-28: Average area reduction factor for various catchments (3-day) ....................................................... 254

PMP Atlas for Mahanadi and Adjoining River Basins Page 20 of 260

Acknowledgements
PMP Atlas for Mahanadi and Adjoining River Basins Page 21 of 260
Acknowledgements Special thanks are conveyed to Shri. A. B. Pandya, Chairman, CWC, New Delhi, Dr. L. S. Rathore, DGM, IMD, New Delhi and Shri C. K. Agrawal, Member (D&R), CWC for their all round support and guidance for preparation of this atlas.
This report was prepared with the helpful assistance of various officials in CWC and IMD. We would like to express our sincere thanks to the project team for the continuous guidance and assistance in the preparation of this Atlas:
Project Team
Shri Vinay Kumar, Chief Engineer, HSO, CWC, New Delhi;
Dr. (Mrs.) Surinder Kaur, DDGM, IMD, New Delhi;
Mr. Bhopal Singh, Director, Hydrology (South), CWC, New Delhi;
Mr. M. Raghuram, Director, Hydrology (DSR), CWC, New Delhi;
Mr. N. N. Rai, Director, Hydrology (NE), CWC, New Delhi;
Mr. S. B. Tyagi, Scientist-E, IMD, New Delhi;
Mr. Ravi Ranjan, Deputy Director, Hydrology (South), CWC, New Delhi;
Mr. P. K. Gupta, Asstt. Met-I, IMD, New Delhi;
Mr. M. S. Grover, Asstt. Met-II., IMD, New Delhi;
Mr. Ankit Dudeja, Asstt. Director, Hydrology (South), CWC, New Delhi;
Smt. Shashi Chauhan, Scientific Asstt., IMD, New Delhi;
Mr. Raju Bhargawa, Scientific Asstt., IMD, New Delhi;
Mr. Lalit Kumar Pant, Sr. Draftsman, Hydrology (South), CWC, New Delhi
Special appreciation is due to, Smt. N. R. Deshpande, Scientist-D, IITM, Pune, and all the members of TARC for their useful suggestions on our efforts during various interactions and TARC meetings.
We also express our thanks to Shri N. K. Mathur, Commissioner (Ganga), MoWR and Shri N. Y. Apte, ex-DDGM, IMD, for their useful guidance and suggestions.
We would also especially like to thank Dr. G. Krishankumar, Scientist-E, (NDC), IMD, Pune who have provided the rainfall and meteorological data required for this project work.
We would also express our thanks to Dr. Pukhraj Rakhecha, Ex. DD Hydromet., IITM Pune for his useful guidance and suggestions for finalizing the Atlas.

PMP Atlas for Mahanadi and Adjoining River Basins Page 22 of 260
Abbreviations Used
PMP Atlas for Mahanadi and Adjoining River Basins Page 23 of 260
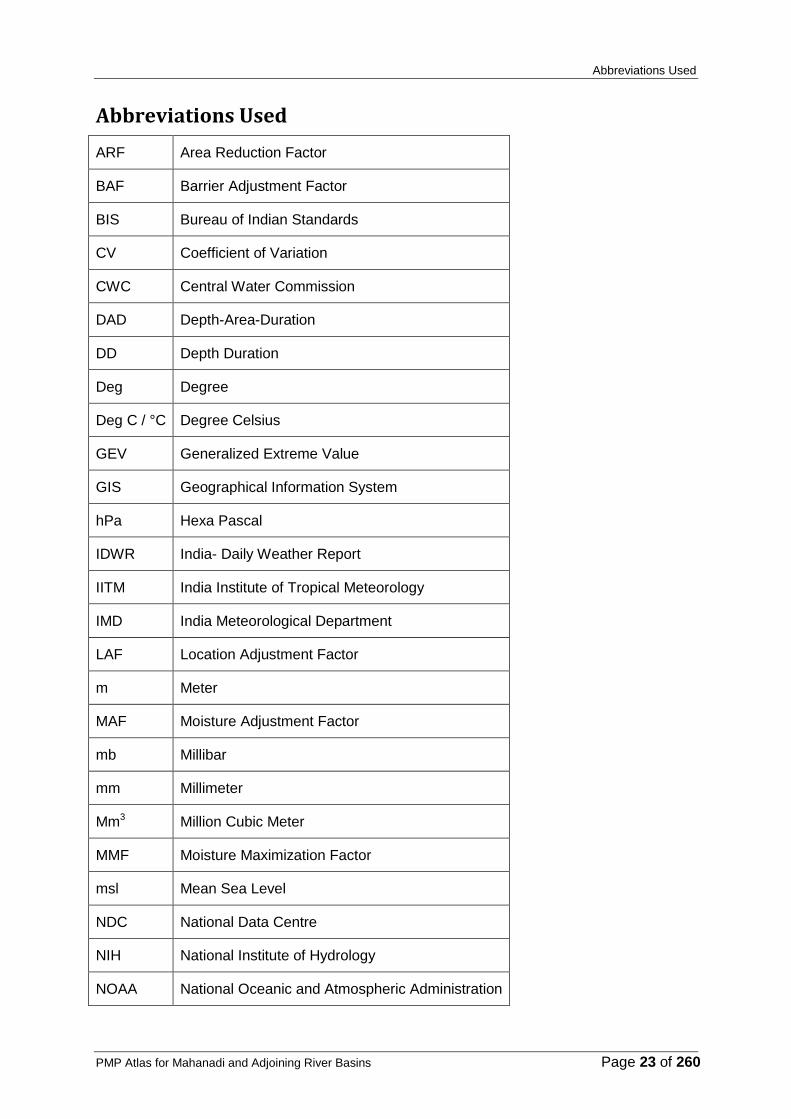
Abbreviations Used
ARF Area Reduction Factor
BAF Barrier Adjustment Factor
BIS Bureau of Indian Standards
CV Coefficient of Variation
CWC Central Water Commission
DAD Depth-Area-Duration
DD Depth Duration
Deg Degree
Deg C / °C Degree Celsius
GEV Generalized Extreme Value
GIS Geographical Information System
hPa Hexa Pascal
IDWR India- Daily Weather Report
IITM India Institute of Tropical Meteorology
IMD India Meteorological Department
LAF Location Adjustment Factor
m Meter
MAF Moisture Adjustment Factor
mb Millibar
mm Millimeter
Mm3 Million Cubic Meter
MMF Moisture Maximization Factor
msl Mean Sea Level
NDC National Data Centre
NIH National Institute of Hydrology
NOAA National Oceanic and Atmospheric Administration

Abbreviations Used
PMP Atlas for Mahanadi and Adjoining River Basins Page 24 of 260
NWS National Weather Service
OBSY Observatory
PWD Public Works Department
PMF Probable Maximum Flood
PMP Probable Maximum Precipitation
PMS Probable Maximum Storm
RDBMS Relational Data Base Management System
REV Revenue
SD Standard Deviation
SPF Standard Project Flood
SPS Standard Project Storm
Sq. km. Square Kilometer
SRRG Self Recording Rain Gauge
TAF Transposition Adjustment Factor
TD Time Distribution
USWB United States Weather Bureau
WMO World Meteorological Organization
WAPCOS Water and Power Consultancy Services

Introduction
PMP Atlas for Mahanadi and Adjoining River Basins Page 25 of 260
1 Introduction
1.1 Background
In India, important hydraulic structures for irrigation, water supply and hydropower are designed depending on the size of the structure and depending on the risk involved in an event of failure. Accordingly, BIS: 11223, 1985 prescribes the Standard Project Flood (SPF) and Probable Maximum Flood (PMF) as design flood for intermediate and large dams respectively. The PMP is defined as the greatest depth of precipitation, which is meteorologically possible for a given duration over a particular catchment area (WMO, 2009). In the design of small structures, some calculated risk is taken and for that reason, estimates of maximum point or areal rainfalls for different return periods are used. The design rainfall studies for many individual river catchments throughout India, where dams and other water resources projects were built have been carried out by a number of researchers notably from the Central Water Commission (CWC), the India Meteorological Department (IMD), the Indian Institute of Tropical Meteorology (IITM) and the National Institute of Hydrology (NIH). Further, these are published in various reports and journals.
Recognizing the importance of PMP studies in dam design works in recent years there have been major efforts by CWC, Government of India, New Delhi on the preparation of the PMP atlases for different river basins of India. The purpose is to develop standardized procedures for estimation of design rainfalls and PMP for various durations at different places in a river basin so that consistent results can be achieved and amount of subjectivity is reduced. Consequently, CWC under the Dam Safety Assurance and Rehabilitation Project conducted the study on preparation of PMP atlases for the six river basins (Cauvery, Godavari, Mahanadi, Chambal, Narmada-Tapi and the West flowing rivers of Western Ghats) through WAPCOS (I), Ltd. in 1998 (WAPCOS, 1998). Similar studies for Krishna and Indus River basins were carried out by IITM, Pune (IITM, 2007).
It is expected that some more severe storms might have occurred since the publication of PMP atlases in 1998. With reference to the above, CWC desired that all the six existing PMP atlases prepared by WAPCOS should be updated by using additional storms that have occurred since the PMP atlases were published in 1998. The work of updating the six PMP atlases together with the preparation of new PMP atlases for the Ganga and the Brahmaputra River basins was awarded to RMSI Pvt. Ltd., Noida by CWC, New Delhi.
1.2 Objectives of study
The overall objective of the present work is to prepare new PMP atlases for the Ganga and Brahmaputra River basins and to update PMP atlases of six river basins that were prepared by WAPCOS (I), Ltd. in 1998 under the Dam Safety Assurance and Rehabilitation Project. The focus is to provide improved estimates of design storm rainfalls for different return periods as well as the PMP values for durations ranging from 1 to 3 days for stations in each of the river basins using their rainfall records. It also focuses on providing generalized areal and grid point PMP maps for these three durations.
The atlases will provide a source of readily available design storm rainfalls and PMP values for different durations for any area of the river basin to design engineers.

Introduction
PMP Atlas for Mahanadi and Adjoining River Basins Page 26 of 260
1.3 Scope of work
The scope of work for the preparation of the PMP atlases has been described in the Terms of References (TOR) of the study. The study has been divided into two packages: Package A: Preparation of New PMP atlases for
1. The Ganga river basin including Chambal, Betwa and Son river basins 2. The Brahmaputra river basin
Package B: Updation of the following six existing PMP atlases for 1. The Cauvery river basin and other east flowing rivers 2. The Godavari river basin 3. The Mahanadi, Brahmani, Baitarani and other east flowing rivers between
Mahanadi and Godavari 4. The Narmada, the Tapi, the Sabarmati, the Banas and the Luni river basins and
rivers of Saurashtra and Kutch regions including Mahi 5. West flowing rivers of the Western Ghats
It may be mentioned that the updating work of the above PMP atlases will not only include analysis based on updated data. It will also cover all works as detailed below for the preparation of new atlases for the Ganga and Brahmaputra River basins. The different river basins of India are shown in Figure 1.1. This report pertains to Mahanadi, Brahmani, Baitarani and other east flowing rivers between Mahanadi and Godavari rivers.

Introduction
PMP Atlas for Mahanadi and Adjoining River Basins Page 27 of 260
Figure 1-1: River basins of India

Introduction
PMP Atlas for Mahanadi and Adjoining River Basins Page 28 of 260
1.4 Work assignment
The list of various tasks to be carried out under this study is given in the TOR. The work envisaged is as under:
i. To document all rainstorms affecting above basins and their major sub basins above
a specified threshold intensity by considering all available stations with long period
rainfall data in and around the basin. All historical data up to the current level are to
be considered.
ii. To provide synoptic situations during severe rainstorms.
iii. To prepare highest-ever recorded 1 to 3-day rainfall maps for each of the basins.
iv. To prepare mean monthly, seasonal and annual rainfall maps for all the basins.
v. To estimate point PMP for the durations of 1-day, 2-day and 3-day storms based on
analysis of maximum annual rainfall series of stations in and around the basin by
using Hershfield’s method and to prepare generalized PMP maps for the problem
basins.
vi. To prepare Tables/ generalized maps for 2.33; 5; 10; 25; 50; 100; 500; 1,000; 5,000
and 10,000 year return period rainfall estimates for all stations and to estimate
regional values/sub basin values.
vii. To prepare graphs indicating mean return period values along with 95% confidence
bands.
viii. To prepare isohyetal maps of 1, 2 and 3-day durations for each of the selected
severe rainstorms and to carry out their DAD (Depth-Area-Duration) analysis.
ix. To prepare maps showing transposition limits of severe rainstorms that contribute to
PMP estimates.
x. To estimate standard project storms (SPS) over different sub-basins/ catchments.
xi. To estimate the moisture maximization factor (MMF) using the persistent dew point
data for conversion of SPS to probable maximum storm (PMS).
xii. To prepare barrier adjustment maps showing barrier heights (say about 1,000 m)
relevant to PMP estimation including location corrections. The general guidelines for
such corrections should form part of the report.
xiii. To estimate probable maximum precipitation (PMP) magnitude for each of the basins
and its major sub basins.
xiv. To prepare maps showing PMP depths at 1 degree by 1 degree grid points for each
of the basins.
xv. To provide depth area duration curves for conversion of point PMP depths into areal
depths for small and medium basins up to 10,000 sq. km.
xvi. To obtain time-distribution of PMP magnitudes into smaller intervals based on time-
distribution analysis of self-recording rain gauges (SRRG) data of severe rainstorms.
The time distribution for various depths of storms such as up to 250 mm and more
than 250 mm are to be studied separately.
xvii. To provide clock-hour corrections based on available hourly rainfall data of SRRG
stations.
xviii. To prepare maps showing the snow fed areas and rain fed areas.
xix. To provide details on identification of permanent snow lines.
xx. To describe impact of snow fed areas on the PMP.
xxi. All the maps shall preferably be GIS compatible.
xxii. Worked out examples for each set of calculations explaining the procedures given in
the report.
Introduction
PMP Atlas for Mahanadi and Adjoining River Basins Page 29 of 260
1.5 Contents of report
The report of the Mahanadi River Basin is presented in two volumes. Volume I is the main report giving basin information, details of storms analyzed, generalized PMP estimates and statistical PMP along with the procedures. Volume I of the report is divided into four chapters. Chapter 1 provides background information on the importance of PMP and design rainfall studies, objectives of this study, activities of the assignment, scope of work and organization of the report. Chapter 2 gives a description of the Mahanadi and Adjoining River Basins and its catchments, and information on the availability of rainfall and dew point temperature data. This chapter also includes monthly, periodic and annual rainfall over the basin and catchments, meteorological causes of heavy rainfall and information on the highest recorded rainfalls. Chapter 3 gives estimation of PMP by physical method, which includes a theoretical background of physical approach, DAD analysis of severe rainstorms, synoptic situations of major rainstorms, moisture maximization computations, PMP estimates for various Catchments and areal PMP estimates at 1° x 1° grid point locations along with the sections on time distribution analysis, area reduction factors, clock hour corrections and practical examples. The PMP estimation by the statistical method and design storm rainfalls for different return periods are given in Chapter 4. Volume II comprises of maps and tables supporting the main body of the report. It comprises of eight sections. Section 1 gives location map and list of rainfall stations, climatology maps, rainfall maps of Mahanadi basin and 24-hr maximum persisting dew point maps of India. Section 2 gives topography map of Mahanadi and Adjoining River Basins. Section 3 gives location maps of storm centres of 1-day, 2-day and 3-day durations. Section 4 presents the isohyetal pattern of analyzed rainstorms. Section 5 gives the generalized grid areal PMP maps for 1-day, 2-day and 3-day durations. Section 6 gives maps and tables of return period and statistical Point PMP rainfall estimates. Section 7 gives the Depth Area Duration curves of rainstorms analyzed for the Mahanadi and Adjoining River Basins. Section 8 provides the table of precipitable water and Dew Point Temperature Compilations and Moisture Adjustment Factor calculations.

PMP Atlas for Mahanadi and Adjoining River Basins Page 30 of 260

Study Area and its Climatology
PMP Atlas for Mahanadi and Adjoining River Basins Page 31 of 260
2 Study Area and its Climatology
2.1 Study area
2.1.1 MAHANADI AND ADJOINING RIVERS
The Mahanadi is one of the major rivers in Peninsular India. In terms of the water potential and flood producing capacity, it ranks second to the Godavari. The Mahanadi basin extends over the states of Chhattisgarh and Odisha and smaller portions of Jharkhand, Maharashtra and Madhya Pradesh. The drainage area of the basin is about 1,40,000 Sq. km., which is nearly 4.3% of the total geographical area of the country. The geographical extent of the basin lies between 80°28’ and 86°43’ east longitudes and 19°8’ and 23°32’ north latitudes. The basin has a maximum length and width of 587 km and 400 km respectively. It is bounded by the Central India hills on the north, by the Eastern Ghats on the south and east and by the Maikala range on the west. The river Mahanadi originates near Farsiya village of the Dhamtari district of Chhattisgarh. The total length of the river, from origin to its outfall into the Bay of Bengal, is 851 km. The Seonath, the Hasdeo, the Mand and the Ib join Mahanadi from the left whereas the Ong, the Tel and the Jonk join it from right. Six other small streams between the Mahanadi and the Rushikulya draining directly into the Chilka Lake also form a part of the basin. A major part of the basin is covered with agricultural land accounting for 54.27% of the total area while as 4.45% of the basin is covered by water bodies.
The Brahmani-Baitarni basin consisting of Brahmani and Baitarni rivers extends over the states of Odisha, Jharkhand and Chhattisgarh with a drainage area of around 50,000 Sq. km., which is nearly 1.7% of the total geographical area of the country. The maximum length and width of the basin is 403 km and 193 km respectively. It lies between 83°55’ to 87°3’ east longitudes and 20°28’ to 23°38’ north latitudes. The basin is bounded by the Chhotanagpur Plateau on the north, by the ridge separating it from the Mahanadi basin on the west and the south and by the Bay of Bengal on the east. The Brahmani sub basin covers around 37,000 Sq. km. and has an elongated shape. The Baitarni sub basin extends around 12,500 Sq. km. and is roughly circular in shape. The Brahmani, known as South Koel in its upper reaches, rises near Nagri village in Ranchi district of Jharkhand at an elevation of about 600 m. The river has a total length of 799 km. In its tail reach, the river is known as Maipura. The Baitarni River rises near Dumuria village in the hill ranges of Kendujhar district of Odisha at an elevation of about 900 m and has a length of about 355 km. The river is known as Dhamra in its lower reaches. The important tributaries of Brahmani joining it from the left are the Karo and the Sankh whereas the Tikra joins from the right. The main tributaries of Baitarni joining from the left are the Salandi and the Matai. Brahmani and Baitarni form a common delta area before discharging into the Bay of Bengal. The major part of basin is covered with agricultural land accounting to 52.04% of the total area while as 2.95% of the basin is covered by water bodies.
The Subernarekha basin extends over States of Jharkhand, Odisha and a comparatively smaller part in West Bengal with a drainage area of around 29,000 Sq. km. The basin has a maximum length and width of about 297 km and 119 km respectively. It lies between 85°8’ to 87°32’ east longitudes and 21°15’ to 23°34’ north latitudes. Situated in the north-east corner of Peninsular India, the basin is bounded by the Chhotanagpur Plateau on the north and the west, by the ridges separating it from Baitarani basin on the south, by the Bay of Bengal on the south-east and by the Kasai Valley of Kangsabati River on the east. The Subernarekha and the Burhabalang form the major river systems in the basin. It flows for a length of 395 km before discharging into the Bay of Bengal. Its principal tributaries joining from the right are the Kanchi, the Karkari and the Kharkai. The Burhabalang rises from south of Similipal village in the Mayurbhanj district of Odisha at an elevation of about 800 m and flows for a length of 164 km and drains into the Bay of Bengal. The major part of basin is covered with agricultural land accounting to 53.76% of the total area while as 2.39% of the basin is covered by water bodies.

Study Area and its Climatology
PMP Atlas for Mahanadi and Adjoining River Basins Page 32 of 260
Figure 2-1: Mahanadi and adjoining River Basin
2.2 Topography
Mahanadi basin is bounded on the north by the Central India Hills, on the south and east by the Eastern Ghats and on the west by the Maikala range. Topographically, the basin can be divided into four regions, namely, the Northen Plateau, the Eastern Ghats, the Coastal Plain and the erosional plains of Central Table Land. The Northern Plateau and Eastern Ghat areas are hilly regions. The Coastal Plain is the fertile delta area. The Central Table Land is the central interior region of the basin, traversed by the river and its tributaries. Most of the basin is in an elevation range of 100 to 400 meters above mean sea level. The main soil types found in the basin are red and yellow soils, mixed red and black soils, laterite soils and deltaic soils.
The Brahmani and Baitarani basin is bounded on the north by the Chhotanagpur Plateau, on the west and south by the ridge separating it from Mahandi basin and on the east by the Bay of Bengal. Physiographically, there are four well-defined regions, namely, the Northern Plateau, the Eastern Ghats, the Coastal Plains and the Central Table Land. The first two regions are mostly hilly and forested. The Coastal Plains consist of fertile delta area well suited for intensive cultivation. The main soil types in the basin are red and yellow soils, red sandy and loamy soils, mixed red and black soils and coastal alluvium. Most of the area of the basin has an elevation range between 100 m to 400 m from mean sea level while up-stream areas of these basins are in an elevation range of 500 m to 800m. Both river systems outfall into the Bay of Bengal forming a common delta area.
The Subarnarekha originates near Nagri village in Ranchi district of Jharkhand at an elevation of 600 m. It is bounded on the North-West by the Chhotnagpur Plateau, in the South-West by Brahmani basin, in the South by Burhabalang basin and in the South-East by

Study Area and its Climatology
PMP Atlas for Mahanadi and Adjoining River Basins Page 33 of 260
the Bay of Bengal. Most of the area of the basin has an elevation between 0 to 400 m from mean sea level while a small up-stream area has an elevation between 400 m to 650 m from mean sea level.
2.3 Climate
The Mahanadi basin lies in Odisha, Chhattisgarh and adjoining Madhya Pradesh, which is considered as a more or less meteorologically homogenous region. The annual rainfall varies from 1,100 mm to 2,000 mm over the entire basin, the average being 1,400 mm. South-west monsoon (June to September) is the principal rainy season accounting for nearly 84% of the annual rainfall. The rainfall contribution in winter is 2.6%, summer is 5.5% and post-monsoon period is 7.9%. The annual rainy days in the basin are 70. The rainfall is more or less homogenous throughout the basin. December is the coldest month with the mean minimum temperature ranging from 100 C to 13.70 C. May is the hottest month in this region where the mean maximum temperature ranges from 380 C over the hills to 430 C in the plains. As compared to the eastern part of the basin and delta area, western parts record the lowest and highest temperatures during winter and summer respectively.
The Brahmani and Baitarani basin receive more or less homogenous rainfall throughout its catchment area. The normal annual rainfall for the basin is slightly more than 1,400 mm. South-west monsoon (June to September) is the principal rainy season accounting for around 80% of the annual rainfall. The rainfall contribution in winter is 3.4%, summer is 8.4%, and post-monsoon period is 8.7%. The basin has average annual rainy days of about 76.
The Subernarekha basin has an average annual rainfall of about around 1,500 mm. The climate in the sub-basin is tropical with hot summers and mild winters. South-west monsoon (June to September) is the principal rainy season accounting for around 76% of the annual rainfall. The rainfall contribution in winter is 3.3%, summer is 10.3%, and post-monsoon period is 10.4%. The basin has average annual rainy days of about 79.
2.4 Catchments of Mahanadi and Adjoining River Basins
The Mahanadi and Adjoining River Basins are divided into 5 catchments and their numbers are assigned from 318 to 322 by IMD. Details of the 5 catchments and areas covered by them are given in Table 2-1.
Table 2-1: Catchments of the Mahanadi and adjoining River Basin
Sr. No. Catchment No. Description
1 318 Rivers between river Mahanadi and River Godavari (excluding Mahanadi)
2 319 River Mahanadi upto Hirakud Dam site
3 320 River Mahanadi from Hirakud Dam site to its mouths
4 321 Rivers Brahmani and Baitarani combined
5 322 River Subarnarekha and streams between River Baitarani and River Subarnarekha
2.5 Climatology
2.5.1 RAINFALL DATA
Rainfall and other meteorological data are needed to estimate the PMP and design storm rainfalls for different return periods. Because of practical necessity for hydrological and agricultural studies, rainfall is measured at a number of stations in India. These rainfall stations are maintained by various official agencies such as IMD, Railways, PWD, and Agriculture and Revenue departments in the different states. IMD offers necessary

Study Area and its Climatology
PMP Atlas for Mahanadi and Adjoining River Basins Page 34 of 260
assistance and technical advice to official agencies. As a result, in India considerable data on rainfall are available for several stations with the National Data Center (NDC), IMD, Pune.
2.5.1.1 Rainfall Data Acquisition
Daily rainfall data of 673 stations in the Mahanadi and Adjoining River Basins for the period 1901- 2006 was obtained from NDC, IMD, Pune. Out of these stations, 366 stations have data for more than 20 years, which has been further used in the statistical analysis. Locations of these rainfall stations as well as adjacent rainfall stations are shown in Figure 2-2. Volume II (Table 1-1) lists these stations along with their coordinates, their period of records and their locations in the catchment number. Figure 2-3 shows the years of data availability for stations in the Mahanadi and Adjoining River Basins. The period of records for each station varies from 20 to 105 years. According to this figure, there are only 197 stations whose data are available for more than 50 years. Table 2-2 gives the number of rainfall stations in different catchments of the Mahanadi and Adjoining River Basins. As shown in Figure 2-2, data from rain gauge stations from the surrounding catchments was also used to complete the isohyetal maps of some storms.
Table 2-2: Catchment wise number of stations
Catchment No. Number of Stations
318 90
319 78
320 71
321 82
322 45
Total 366
This data has been used in the preparation of the PMP atlas for the Mahanadi and Adjoining River Basins.
Figure 2-2: Locations of rainfall stations in and around the Mahanadi and Adjoining River Basins

Study Area and its Climatology
PMP Atlas for Mahanadi and Adjoining River Basins Page 35 of 260
Figure 2-3: Data availability for stations in the Mahanadi and Adjoining River Basins
2.5.1.2 Quality control and analysis of rainfall data
The rainfall data was compiled in Relational Data Base Management System (RDBMS) using MS Access. This database consists of the name of the station, type of station, catchment no., district, date, and rainfall in mm. The entire period of records at all stations were checked for their errors in archival and formatting so that the cleaned data becomes well established for their use in the analysis. The methods used were as follows:
i. The data of each station was first rearranged from two-dimensional format to one-
dimensional format.
ii. The data were then checked for their continuity of completeness and missing dates
were flagged.
iii. Some instances may be found where the rainfall value at a particular station is far
above the majority of rainfall values over the period of the station’s record. This
situation might happen due to either human or machine error. If the value at a station
differs from its corresponding long term mean by more than 5 times standard
deviation, the value is treated as unusually high or an outlier. Statistical test, as
mentioned above, was applied to establish the presence of an outlier. These outliers
were confirmed from IMD. Thus, they have not been used further in the current study.
Observed outliers in the data are given in Table 2-3.
Table 2-3: Observed outliers in the rainfall data
Sr. No. Catchment No. District Station Type Date Rainfall (mm)
1 319 Korba Korba Others 26/07/1988 802
2 321 Simdega Bano Others 13/09/1959 807
3 322 Singbhum East Ghatsila Hydro 28/06/1997 318
2.5.2 SRRG DATA
Hourly rainfall data from 18 SRRG stations for different dates during the period of 1970-2006, as shown in Table 2-4, were obtained from NDC, IMD, Pune. This table shows the SRRG rainspells used in the Time Distribution Analysis for 12, 24, 48, and 72-hour durations. Locations of these SRRG stations are shown in Figure 2-4. These data, along
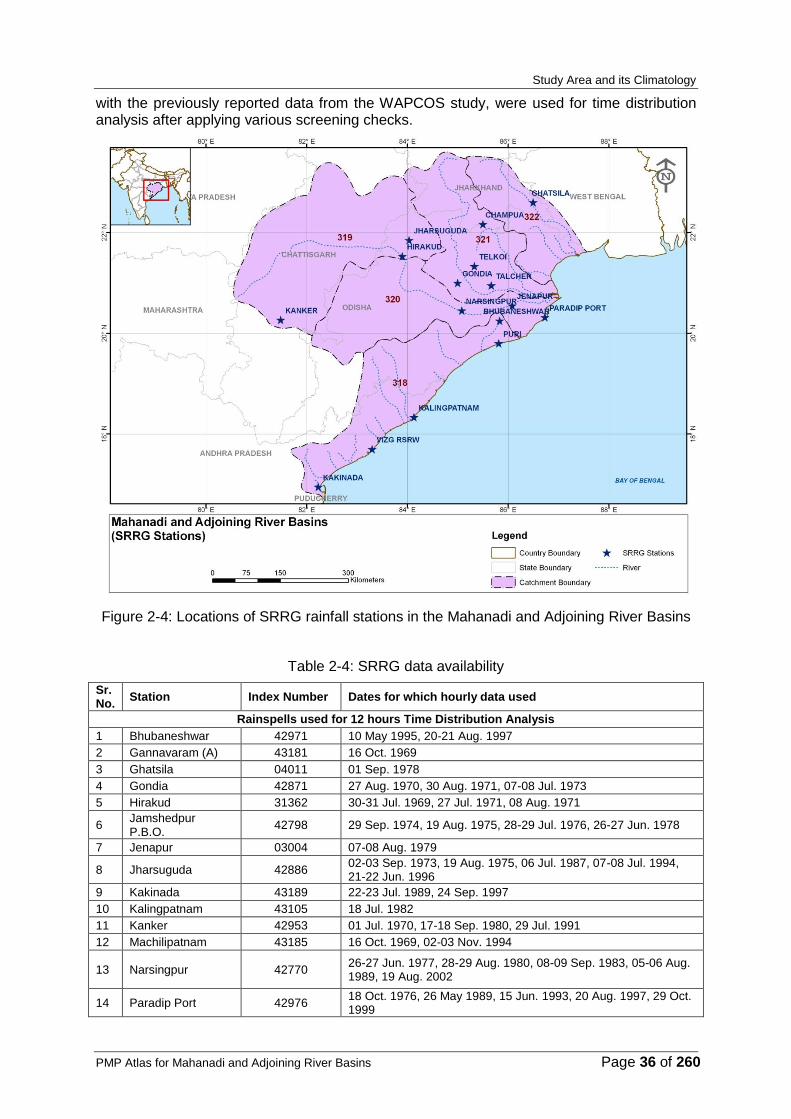
Study Area and its Climatology
PMP Atlas for Mahanadi and Adjoining River Basins Page 36 of 260
with the previously reported data from the WAPCOS study, were used for time distribution analysis after applying various screening checks.
Figure 2-4: Locations of SRRG rainfall stations in the Mahanadi and Adjoining River Basins
Table 2-4: SRRG data availability
Sr. No.
Station Index Number Dates for which hourly data used
Rainspells used for 12 hours Time Distribution Analysis
1 Bhubaneshwar 42971 10 May 1995, 20-21 Aug. 1997
2 Gannavaram (A) 43181 16 Oct. 1969
3 Ghatsila 04011 01 Sep. 1978
4 Gondia 42871 27 Aug. 1970, 30 Aug. 1971, 07-08 Jul. 1973
5 Hirakud 31362 30-31 Jul. 1969, 27 Jul. 1971, 08 Aug. 1971
6 Jamshedpur P.B.O.
42798 29 Sep. 1974, 19 Aug. 1975, 28-29 Jul. 1976, 26-27 Jun. 1978
7 Jenapur 03004 07-08 Aug. 1979
8 Jharsuguda 42886 02-03 Sep. 1973, 19 Aug. 1975, 06 Jul. 1987, 07-08 Jul. 1994, 21-22 Jun. 1996
9 Kakinada 43189 22-23 Jul. 1989, 24 Sep. 1997
10 Kalingpatnam 43105 18 Jul. 1982
11 Kanker 42953 01 Jul. 1970, 17-18 Sep. 1980, 29 Jul. 1991
12 Machilipatnam 43185 16 Oct. 1969, 02-03 Nov. 1994
13 Narsingpur 42770 26-27 Jun. 1977, 28-29 Aug. 1980, 08-09 Sep. 1983, 05-06 Aug. 1989, 19 Aug. 2002
14 Paradip Port 42976 18 Oct. 1976, 26 May 1989, 15 Jun. 1993, 20 Aug. 1997, 29 Oct. 1999

Study Area and its Climatology
PMP Atlas for Mahanadi and Adjoining River Basins Page 37 of 260
Sr. No.
Station Index Number Dates for which hourly data used
15 Puri 43053 27 Jul. 1991, 17 Aug. 1994
16 Raigarh 42884 16-17 Aug. 1974
17 Rajghat 03003 04 Oct. 1978, 29-30 Jun. 1979
18 Ranchi (A) 42701 06 Jun. 1971, 11 Jun. 1999
19 Talcher 03012 12-13 Aug. 1976
20 Telkoi 03020 02 Sep. 1978
Rainspells used for 24 hours Time Distribution Analysis
1 Bhubaneshwar 42971 10 May 1995, 20 Aug.1997, 04 Jul. 2001
2 Champua
18-19 Sep. 1980
3 Gannavaram(A) 43181 16 Oct. 1969, 01 Nov. 1994
4 Ghatsila 04011 01 Sep. 1978
5 Gondia 42871 30 Aug. 1971
6 Hirakud 31362 08 Aug. 1971, 18-19 Aug. 1982
7 Jenapur 03004 07 Aug. 1979
8 Jharsuguda 42886 19 Aug. 1975, 19-20 Aug. 1975
9 Kakinada 43189 25 Nov. 1979, 09 May 1990, 10 May 1990, 24 Sep. 1997
10 Kalingpatnam 43105 18 Jul. 1982
11 Kanker 42953 01 Jul. 1970, 07 Jul. 1973, 17-18 Sep. 1980, 18 Sep. 1980, 29 Jul. 1991
12 Machilipatnam 43185 16 Oct. 1969, 01 Nov. 1994, 02 Nov. 1984
13 Narsingpur 42770 28 Aug. 1980, 06 Aug. 1989, 19 Aug. 2002
14 Paradip Port 42976 11 Oct. 1973, 08 Dec. 1973, 26-05-1989, 20 Aug. 1997, 29 Oct. 1999, 30 Oct.1999
15 Puri 43053 28 Jul. 1991, 17 Aug. 1994, 15 May 1995, 12 Jun. 2001
16 Telkoi
01-02 Sep. 1978
17 Champua
18-19 Sep. 1980
18 Vizg RSRW 43150 16 Oct. 1982, 11 Aug. 1986
Rainspells used for 48 hours Time Distribution Analysis
1 Bhubaneshwar 42971 09-11 May 1995
2 Gannavaram (A) 43181 31 Oct. - 02 Nov. 1994
3 Ghatsila 04011 31 Aug. - 02 Sep. 1978
4 Gondia 42871 01-02 Jul. 1970, 26-28 Aug. 1970, 07-09 Jul. 1973
5 Hirakud 31362 29-31 Jul. 1969, 25-27 Jul. 1971
6 Jamshedpur P.B.O.
42798 03-05 Aug. 1977, 25-27 Jun. 1978
7 Jharsuguda 42886 13-15 Aug. 1969, 26-28 Jul. 1971, 02-04 Sep. 1973, 05-07 Jul. 1987, 07-09 Jul. 1994
8 Kakinada 43189 08-10 May 1990, 23-25 Sep. 1997
9 Kanker 42953 30 Jun. - 02 Jul. 1970, 06-08 Jul. 1973
10 Khijrawan 31504 18-20 Jul. 1976
11 Machilipatnam 43185 11-13 Aug. 1986, 01-03 Nov. 1994
12 Narsingpur 42770 25-27 Jun. 1977, 07-09 Sep. 1983, 17-19 Aug. 1984, 19-20 Aug. 2002
13 Paradip Port 42976 06-07 Aug. 1979, 24-26 May 1989, 02-04 Nov. 1990, 15-17 Jun. 1993, 19-21 Aug. 1997, 28-30 Oct. 1999
14 Puri 43053 27-29 Jul. 1991, 14-16 May 1995, 29-30 Oct. 1999
15 Raigarh 42884 16-18 Aug. 1974
16 Rajghat 03003 28-30 Jun. 1979
17 Ranchi (A) 42701 05-06 Jun. 1971, 27-29 Jun. 1997, 08-10 Sep. 1998
18 Udala 03021 29 Jun. - 01 Jul. 1979
Rainspells used for 72 hours Time Distribution Analysis
1 Bhubaneshwar 42971 09-12 May 1995
2 Gannavaram (A) 43181 31 Oct. - 03 Nov. 1994
3 Ghatsila 4011 31 Aug. - 03 Sep. 1978
4 Gondia 42871 25-28 Aug. 1970

Study Area and its Climatology
PMP Atlas for Mahanadi and Adjoining River Basins Page 38 of 260
Sr. No.
Station Index Number Dates for which hourly data used
5 Jamshedpur 42799 01-04 Sep. 1970
6 Jamshedpur P.B.O.
42798 03-06 Aug. 1977, 24-27 Jun. 1978
7 Jharsuguda 42886 01-04 Sep. 1973, 20-23 Jun. 1996
8 Kakinada 43189 08-11 May 1990
9 Kanker 42953 06-09 Jul. 1973
10 Machilipatnam 43185 31 Oct. - 03 Nov. 1994
11 Narsingpur 42770 24-27 Jun. 1977, 19-21 Aug. 2002
13 Nawapara 3030 17-20 Jul. 1976, 10-12 Sep. 1977
14 Paradip Port 42976 16-19 Aug. 1976, 15-18 Jun. 1993, 13-16 May 1995
15 Puri 43053 26-29 Jul. 1991, 29-31 Oct. 1999
16 Raigarh 42884 16-19 Aug. 1974
17 Ranchi (A) 42701 28-31 Aug. 1971
2.5.3 DEW POINT TEMPERATURE DATA
The storm dew point temperatures of stations located near the storm centre as well as along the path of moisture inflow into the storm area were manually noted from the IMD library from the Indian Daily Weather Reports (IDWR). The dew point data was collected for both the main synoptic hours (0830 and 1730 hrs) for the period of 3-4 days of the rainstorm. The compiled dew point temperature data for the Mahanadi and Adjoining River Basins collected from the IMD library have been given in Table 8-5 in Volume II. This table gives the daily dew point temperature data corresponding to storm period, representative 24-hour dew point temperatures and representative 24-hour dew point temperatures converted to 1,000 hPa for the various stations. The representative 24-hour dew point temperatures converted to 1,000 hPa from various stations were used to estimate the rainstorm persisting dew point temperature for further use in estimation of Moisture Maximization Factors (MMF).
2.5.4 METEOROLOGICAL CAUSES OF HEAVY RAINFALL OVER MAHANADI AND ADJOINING
RIVER BASINS
Most of the annual rainfall over the Mahanadi and adjoining river basins occurs during the Southwest monsoon season of June to October. The Southwest monsoon normally sets in over this area in the first week of June and withdraws in the first week of October. About 84% of the annual rainfall in the region occurs during the Southwest monsoon period of June-September, of which July and August are the rainiest months. During this season, cyclonic disturbances are important synoptic systems that cause heavy spells of rainfall in the Mahanadi River Basin. On an average, seven cyclonic disturbances (mainly depressions) form in the Bay of Bengal during the four months of June to September. These disturbances generally move in a west-northwest direction, after their formation at the head of the Bay of Bengal, up to the central parts of the country before weakening. It is well known that heavy rainfall occurs in the southwestern sector of the monsoon depressions due to strong convergence in that sector. When a depression from the head of the Bay of Bengal moves a belt of heavy rainfall spreads to the eastern part of the Ganga basin and lower Brahmaputra basin. With the further movement of the depression, the area receiving heavy rainfall extends to the Mahanadi and adjoining basins. By the time, the depression moves over central India, it is weakened due to depletion of moisture supply. Sometimes, the depressions, after reaching central India, intensify due to fresh feed of moisture from the Arabian Sea. This causes another spell of heavy rains over central and Peninsular India. However, the distribution of heavy rainfall centers is very closely related to their tracks. The main synoptic situations of the southwest monsoon system that produce heavy rainfall over the Mahanadi and Adjoining River Basin are:
1. Formation and subsequent movement of monsoon depressions and low-pressure
systems from the head of Bay of Bengal

Study Area and its Climatology
PMP Atlas for Mahanadi and Adjoining River Basins Page 39 of 260
2. Upper air cyclonic circulation over the Peninsula
2.5.5 MONTHLY, PERIODIC AND ANNUAL RAINFALL
Mean monthly, seasonal and annual rainfalls, Coefficient of Variation (CV) and Standard Deviation (SD) for each of the 5 catchments of Mahanadi and adjoining river basins and the entire study area as a whole have been worked out on basis of the data from year 1951 onward for all the rainfall stations in their catchment areas. Table 2-5 shows that mean annual rainfall of the Mahanadi and adjoining river basins is about 1,327 mm with a CV of 33%. About 80% of the annual rainfall is received during the southwest monsoon season of June to September. The bulk of the remaining 20% occurs mostly in pre-monsoon and post-monsoon periods. The mean annual rainfall is as low as 1,232 mm in the catchment no. 318. The catchment no. 321 receives rainfall as high as 1,428 mm annually. Annexure A (Figure 1-4 to Figure 1-13) shows the spatial distribution of rainfall during various rainfall periods: January-February, March-May, June-October, November–December, the annual as a whole and each heavy rainfall month (June to October).

Study Area and its Climatology
PMP Atlas for Mahanadi and Adjoining River Basins Page 40 of 260
Table 2-5: Average monthly, periodic and annual rainfall over different catchments of the Mahanadi and Adjoining River Basins
Months/Periods
Catchment No.: 318 Catchment No.: 319 Catchment No.: 320
Mean Rainfall
(mm)
Rainfall as % of Annual Rainfall
Standard Deviation
(mm)
Coefficient of
Variation (CV, %)
Mean Rainfall
(mm)
Rainfall as % of Annual Rainfall
Standard Deviation
(mm)
Coefficient of
Variation (CV, %)
Mean Rainfall
(mm)
Rainfall as % of Annual Rainfall
Standard Deviation
(mm)
Coefficient of
Variation (CV, %)
Jan 7.8 0.6 17.2 220.1 9.2 0.7 19.1 206.5 9.0 0.6 22.7 251.6
Feb 15.5 1.3 31.3 202.7 11.4 0.9 20.1 175.5 15.0 1.1 26.7 178.2
Mar 19.8 1.6 32.4 163.6 14.9 1.2 30.0 200.6 19.7 1.4 34.7 175.7
Apr 33.1 2.7 39.2 118.3 10.4 0.8 23.7 227.8 22.5 1.6 30.3 134.6
May 80.0 6.5 100.1 125.1 15.7 1.3 29.1 185.1 47.9 3.4 56.1 117.1
Jun 156.3 12.7 90.1 57.6 178.3 14.4 124.8 70.0 216.1 15.2 137.0 63.4
Jul 222.2 18.0 129.1 58.1 367.3 29.6 191.9 52.2 363.2 25.5 194.2 53.5
Aug 236.1 19.2 133.6 56.6 355.8 28.6 156.8 44.1 384.3 27.0 218.6 56.9
Sep 213.4 17.3 114.6 53.7 214.8 17.3 130.8 60.9 241.2 16.9 154.0 63.9
Oct 191.0 15.5 154.6 81.0 53.7 4.3 61.6 114.8 86.3 6.1 103.3 119.7
Nov 51.7 4.2 84.8 164.0 5.9 0.5 20.1 342.6 14.5 1.0 40.1 277.6
Dec 5.2 0.4 14.8 281.7 5.1 0.4 16.4 324.0 3.7 0.3 12.0 322.6
Period (Jan - Feb) 23.3 1.9 35.2 151.3 20.7 1.7 28.9 139.8 24.0 1.7 34.3 142.7
Period (Mar - May) 133.0 10.8 123.0 92.5 41.1 3.3 55.7 135.8 90.2 6.3 84.8 94.0
Period (Jun - Oct) 1019.1 82.7 328.4 32.2 1169.9 94.2 401.2 34.3 1291.0 90.7 466.4 36.1
Period (Nov - Dec) 57.0 4.6 85.8 150.7 10.9 0.9 27.6 252.3 18.2 1.3 42.6 234.3
Annual (Jan - Dec) 1232.3 100.0 371.9 30.2 1242.6 100.0 421.5 33.9 1423.4 100.0 497.5 35.0

Study Area and its Climatology
PMP Atlas for Mahanadi and Adjoining River Basins Page 41 of 260
Months/Periods
Catchment No.: 321 Catchment No.: 322
Mean Rainfall
(mm)
Rainfall as % of Annual Rainfall
Standard Deviation
(mm)
Coefficient of Variation (CV, %)
Mean Rainfall
(mm)
Rainfall as % of Annual Rainfall
Standard Deviation
(mm)
Coefficient of Variation (CV, %)
Jan 14.1 1 24.4 173 13.8 1 21.7 157.3
Feb 19.1 1.3 28.5 149.2 19.8 1.4 27.8 140.7
Mar 23.7 1.7 34.3 144.9 26.7 1.9 36.4 136.3
Apr 29.9 2.1 35.2 117.9 34.5 2.4 38.8 112.7
May 65.6 4.6 61.3 93.4 71.1 5 63.4 89.2
Jun 231.1 16.2 137.1 59.3 242.2 17.1 148.8 61.4
Jul 340.4 23.8 166.3 48.9 307.9 21.7 138.1 44.9
Aug 353.1 24.7 159.9 45.3 318.6 22.5 145.1 45.5
Sep 237.5 16.6 150.6 63.4 260.2 18.4 140.5 54
Oct 92.8 6.5 105.5 113.6 103 7.3 118.5 115
Nov 14.9 1 34.6 232 14.9 1 33.7 226.7
Dec 6.1 0.4 16 263.5 4.9 0.3 13.5 277.3
Period (Jan - Feb) 33.2 2.3 36.6 110.2 33.6 2.4 36.4 108.5
Period (Mar - May) 119.2 8.3 89 74.7 132.3 9.3 94.9 71.7
Period (Jun - Oct) 1254.9 87.9 395 31.5 1232.1 86.9 379.7 30.8
Period (Nov - Dec) 21 1.5 39.6 188.4 19.7 1.4 36.8 186.5
Annual (Jan - Dec) 1428.3 100 427.1 29.9 1417.7 100 437.4 30.9

Study Area and its Climatology
PMP Atlas for Mahanadi and Adjoining River Basins Page 42 of 260
Months/Periods
Mahanadi Basin Entire Study Area
Mean Rainfall
(mm)
Rainfall as % of Annual Rainfall
Standard Deviation
(mm)
Coefficient of Variation (CV,
%)
Mean Rainfall
(mm)
Rainfall as % of Annual Rainfall
Standard Deviation
(mm)
Coefficient of Variation (CV, %)
Jan 9.2 0.7 20.6 224.5 10.3 0.8 20.9 202.3
Feb 12.8 1.0 22.9 179.0 15.5 1.2 27.1 174.4
Mar 16.8 1.3 32.0 190.3 20.1 1.5 33.3 165.8
Apr 15.1 1.2 27.1 179.5 24.8 1.9 34.6 139.6
May 28.2 2.1 44.6 157.9 53.6 4 71.5 133.3
Jun 193.0 14.7 131.0 67.9 197 14.8 129 65.5
Jul 365.7 27.9 192.8 52.7 318.1 24 177.4 55.8
Aug 366.8 27.9 183.8 50.1 325.8 24.5 172 52.8
Sep 225.0 17.1 140.8 62.6 228.5 17.2 137.5 60.2
Oct 66.3 5.1 81.9 123.5 107.2 8.1 123.6 115.4
Nov 9.2 0.7 29.8 324.1 21.7 1.6 53.6 247.1
Dec 4.5 0.3 14.8 327.3 5.1 0.4 14.9 294.9
Period (Jan - Feb) 22.0 1.7 31.1 141.7 25.9 1.9 34.3 132.6
Period (Mar - May) 60.1 4.6 72.5 120.7 98.5 7.4 99.2 100.7
Period (Jun - Oct) 1216.9 92.7 431.6 35.5 1176.6 88.6 405.2 34.4
Period (Nov - Dec) 13.7 1.0 34.4 250.1 26.8 2 56.1 209.7
Annual (Jan - Dec) 1312.7 100.0 460.9 35.1 1327.7 100 436.6 32.9

Study Area and its Climatology
PMP Atlas for Mahanadi and Adjoining River Basins Page 43 of 260
2.5.6 ANALYSIS OF HIGHEST RAINFALL
Observations indicate that floods in the Mahanadi and other adjoining rivers are the result of heavy rains over the catchment areas. As discussed in the preceding section most often heavy rainfall in the Mahanadi and other adjoining river basins occurs due to depressions forming in the Bay of Bengal and moving inland in a northwesterly to westnorth-westerly direction. Apparently, information regarding the highest rainfalls that have occurred at different stations in the Mahanadi and Adjoining River Basins is of practical value to the engineers for flood computations related to the design of flood control structures. The highest rainfall values are also useful for estimation of PMP or extreme rainfall, which is possible over a given point for a given duration. It is known that the maximization and transposition of the highest rainfalls give the estimation of the PMP at any point in the basin.
In view of importance of distribution of the highest rainfalls in many types of the hydrologic analysis, this section presents the best available information on the highest rainfalls for durations of 1, 2, and 3-day at different stations in the Mahanadi and adjoining river basins. For this study, the daily rainfall data of each station of the basin was processed for the period of its record and for each year, the maximum rainfall values of 1, 2, and 3-day durations were determined. In this way, a series of 1, 2, and 3-day annual maximum rainfalls for each station were constructed. From the annual maximum rainfall series of 1 to 3 days, the highest rainfalls were selected as 1-day, 2-day, and 3-day highest ever-recorded rainfall values for the station. The highest recorded rainfall values of 1, 2, and 3-day durations with their dates of occurrence for rainfall stations within the Mahanadi and adjoining river basins during their period of records are given in Table 2-6. Similarly, the highest recorded rainfall values of 1, 2, and 3-day durations with their dates of occurrence for rainfall stations within the adjoining catchments of Mahanadi and adjoining river basins, are given in Table 2-7.
To get an over view of the spatial variation of the highest rainfalls, these values for 1, 2, and 3-day durations were plotted separately on a map of the Mahanadi and adjoining river basins and areas of homogeneous zones of heavy rainfalls are delineated. The resulting spatial patterns are shown in Annexure A (Figure 1-14 to Figure 1-16) which provides the best available information in the maps created using the highest rainfalls at a point. Interestingly, the distribution of the highest rainfalls has exhibited a definite pattern with heavy falls of rain in certain regions. Figure 1-14 shows the pattern of the highest 1-day rainfall across the Mahanadi and adjoining river basins. The highest 1-day rainfalls range from 147 mm to over 800 mm over parts of the Mahanadi and adjoining river basins. The spatial patterns of 2-day and 3-day highest rainfalls are shown in Figure 1-15 and Figure 1-16 respectively which show more or less similar features. These maps of the highest rainfalls give a good indication of the reliability of estimates of design storm rainfalls in different parts of the Mahanadi and adjoining river basins.

Study Area and its Climatology
PMP Atlas for Mahanadi and Adjoining River Basins Page 44 of 260
Table 2-6: Highest 1, 2 and 3-day rainfalls (mm) recorded at different stations in the Mahanadi and Adjoining River Basins
Sr. No.
Catchment No.
District Station Type Lat
(Deg.) Long (Deg.)
Data Length (Years)
1-Day Highest Rainfall 2-Day Highest Rainfall 3-Day Highest Rainfall
Rainfall (mm)
Date Rainfall
(mm) Date
Rainfall (mm)
Date
1 318 Boudh Parlakimedi Others 18.78 84.10 72 279 18/11/1923 363 18-19/11/1923 376 17-19/11/1923
2 318 Boudh Rambha Others 19.52 85.10 54 218 21/07/1964 325 19-20/08/1944 396 18-20/08/1944
3 318 Boudh Russelkonda Others 19.95 84.58 52 220 31/08/1913 225 30-31/08/1913 259 11-13/09/1933
4 318 East Godavari Addatigala Rev 17.42 82.00 30 321 17/06/1996 342 16-17/06/1996 345 16-18/06/1996
5 318 East Godavari Biccavole Rev 16.95 82.05 76 432 20/10/1958 813 20-21/10/1958 889 19-21/10/1958
6 318 East Godavari Chintalapudi Pwd 17.07 81.98 35 238 23/07/1989 322 02-03/11/1994 415 01-03/11/1994
7 318 East Godavari Chintapalli Pwd 16.90 82.17 40 273 05/07/1958 420 04-05/07/1958 500 03-05/07/1958
8 318 East Godavari Kakinada Pwd 16.95 82.23 51 337 11/10/1959 537 04-05/07/1958 677 09-11/05/1990
9 318 East Godavari Peddapuram Rev 17.08 82.13 105 269 11/05/1990 500 10-11/05/1990 696 09-11/05/1990
10 318 East Godavari Pithapuram Rev 17.12 82.25 105 244 25/09/1997 321 09-10/05/1995 417 09-11/05/1990
11 318 East Godavari Prathipadu Rev 17.23 82.20 105 299 10/05/1990 576 10-11/05/1990 749 09-11/05/1990
12 318 East Godavari Tuni Rev 17.35 82.55 105 355 10/05/1990 444 09-10/05/1990 451 08-10/05/1990
13 318 East Godavari Y.Ramavaram Pwd 17.68 81.97 26 281 20/09/2005 337 19-20/09/2005 389 19-21/09/2005
14 318 East Godavari Yellavaram Rev 17.43 82.03 76 327 26/09/1949 353 26-27/09/1949 398 26-28/09/1949
15 318 Gajapati Gumma Others 18.98 84.03 73 330 03/07/2006 363 02-03/07/2006 396 02-04/07/2006
16 318 Gajapati Kashinagar Hydro 18.83 83.87 24 164 31/08/1995 293 10-11/05/1995 334 09-11/05/1995
17 318 Gajapati Mohana Hydro 19.43 84.27 29 319 04/11/1990 406 03-04/11/1990 422 03-05/11/1990
18 318 Gajapati Mohana Others 19.43 84.27 48 317 10/10/1938 338 10-11/10/1938 342 09-11/10/1938
19 318 Gajapati Parlakhemundi Hydro 18.78 84.10 27 278 20/10/1994 300 02-03/11/1986 320 01-03/11/1986
20 318 Gajapati R.Udaigiri Hydro 19.15 84.15 28 252 03/07/2006 344 06-07/10/2003 364 02-04/07/2006
21 318 Gajapati Ram/Udayagiri Others 19.15 84.13 78 292 24/09/1911 344 06-07/10/2003 364 02-04/07/2006
22 318 Ganjam Aska Others 19.62 84.67 85 242 02/11/1932 320 21-22/08/1940 367 02-04/11/1932
23 318 Ganjam Berhampur Others 19.32 84.80 59 304 19/11/1923 597 18-19/11/1923 603 17-19/11/1923
24 318 Ganjam Chatrapur Others 19.35 85.00 79 238 19/11/1923 385 27-28/03/1974 446 27-29/03/1974
25 318 Ganjam Digapahandi Others 18.50 84.29 34 445 04/11/1990 554 03-04/11/1990 560 03-05/11/1990
26 318 Ganjam Jankia Others 20.05 85.52 42 279 31/08/1919 307 31/08-01/09/1919 319 30/08-01/09/1919
27 318 Ganjam Khallikote Others 19.75 85.00 23 245 03/07/2006 401 10-11/05/1995 485 10-12/05/1995
28 318 Ganjam Kodala Others 19.62 84.87 46 280 24/10/1954 361 23-24/10/1954 450 10-12/05/1995
29 318 Ganjam Madhabarida Hydro 19.92 84.63 30 244 18/10/1999 366 10-11/05/1995 385 10-12/05/1995
30 318 Ganjam Purushottampur Others 19.53 84.88 75 273 25/08/1957 408 11-12/09/1976 421 10-12/05/1995
31 318 Ganjam Saroda Hydro 19.80 84.18 30 213 10/05/1995 369 10-11/05/1995 383 10-12/05/1995
32 318 Ganjam Surada Others 19.77 84.43 80 213 20/08/1944 310 27-28/06/1925 413 27-29/06/1925
33 318 Kandhamal Dharingbadi Hydro 19.92 84.05 22 221 21/08/1997 265 21-22/08/1997 326 13-15/07/2009
34 318 Kandhamal Dharingbadi Others 19.92 84.13 78 268 14/05/1936 381 06-07/08/2007 396 05-07/08/2007
35 318 Khurda Balianta Others 20.25 85.92 34 325 07/07/1974 370 07-08/07/1974 428 05-07/07/1974
36 318 Khurda Banpur Others 19.78 85.18 88 255 03/07/2001 425 10-11/05/1995 505 10-12/05/1995

Study Area and its Climatology
PMP Atlas for Mahanadi and Adjoining River Basins Page 45 of 260
Sr. No.
Catchment No.
District Station Type Lat
(Deg.) Long (Deg.)
Data Length (Years)
1-Day Highest Rainfall 2-Day Highest Rainfall 3-Day Highest Rainfall
Rainfall (mm)
Date Rainfall
(mm) Date
Rainfall (mm)
Date
37 318 Khurda Bhubaneshwar Others 20.25 85.83 84 283 30/07/1969 364 29-30/07/1969 425 10-12/05/1995
38 318 Khurda Jatni Others 20.08 85.67 33 190 28/07/1991 321 02-03/07/2001 335 02-04/07/2001
39 318 Khurda Khurda Others 20.18 85.63 81 236 23/07/1937 352 02-03/07/2001 413 08-10/07/1941
40 318 Khurda Tangi Others 19.92 85.40 83 254 20/06/1912 342 10-11/05/1995 404 10-12/05/1995
41 318 Krishna Kamalapuram Pwd 16.84 82.06 39 279 22/10/1963 376 22-23/10/1963 376 21-23/10/1963
42 318 Nayagarh Ranpur Others 20.08 85.33 77 254 25/09/1950 298 02-03/07/2006 394 09-11/05/1995
43 318 Puri Gop Others 19.98 86.02 85 329 27/08/1947 432 28-29/07/1991 499 27-29/07/1991
44 318 Puri Kakatpur Others 20.02 86.20 75 286 28/09/1995 490 27-28/09/1995 509 26-28/09/1995
45 318 Puri Kanas Others 20.02 85.65 84 232 01/07/1946 367 02-03/07/2001 386 01-03/07/2001
46 318 Puri Krishnaprasad Others 19.63 85.27 72 250 03/11/1990 400 03-04/11/1990 415 03-05/11/1990
47 318 Puri Pipli Others 20.13 85.83 65 323 27/06/1925 493 27-28/06/1925 573 26-28/06/1925
48 318 Rayagada Ambodala Hydro 19.80 83.47 28 334 28/07/1991 370 15-16/07/1991 386 15-17/07/1991
49 318 Rayagada Bissem-Cuttack Hydro 19.52 83.50 31 313 24/07/1994 415 24-25/07/1994 419 24-26/07/1994
50 318 Rayagada Bissem-Cuttack Others 19.52 83.50 84 225 03/07/2006 351 03-04/07/2006 362 02-04/07/2006
51 318 Rayagada Gudari Hydro 19.38 83.80 31 218 03/07/2006 309 03-04/07/2006 344 02-04/07/2006
52 318 Rayagada Gunupur Hydro 19.08 83.82 31 278 13/06/1984 347 11-12/05/1990 390 10-12/05/1990
53 318 Rayagada Gunupur Others 19.08 83.82 84 321 13/07/1970 348 12-13/05/1990 508 11-13/05/1990
54 318 Rayagada Rayagada Others 19.17 83.42 83 299 03/07/2006 379 03-04/07/2006 408 02-04/07/2006
55 318 Srikakulam Gotta Hydro 18.70 83.95 25 202 17/10/1982 280 06-07/10/2003 293 06-08/10/2003
56 318 Srikakulam Itchapuram Rev 19.12 84.70 99 351 19/11/1923 657 18-19/11/1923 706 17-19/11/1923
57 318 Srikakulam Naradi Barrage Rev 18.97 83.82 27 270 13/06/1984 448 11-12/05/1990 526 10-12/05/1990
58 318 Srikakulam Narasannapeta Rev 18.42 84.05 104 363 08/09/1955 465 07-08/09/1955 472 07-09/09/1955
59 318 Srikakulam Narayanpuram Rev 18.50 83.13 25 212 17/10/1982 272 05-06/10/1986 316 04-06/10/1986
60 318 Srikakulam Palakonda Rev 18.60 83.75 104 279 18/11/1923 315 18-19/11/1923 331 17-19/11/1923
61 318 Srikakulam Palasa Rev 19.92 84.50 21 232 16/10/1987 295 06-07/10/2003 375 09-11/05/1995
62 318 Srikakulam Pathapatnam Rev 18.75 84.08 43 229 11/09/1972 299 11-12/05/1990 365 10-12/05/1990
63 318 Srikakulam Pundi Rev 18.67 84.37 82 254 01/11/1943 406 31/10-01/11/1943 406 30/10-01/11/1943
64 318 Srikakulam Ranasthalam Rev 18.25 83.75 21 156 16/10/1987 212 04-05/10/1986 309 03-05/10/1986
65 318 Srikakulam Sompeta Rev 18.93 84.60 105 286 23/09/1972 387 13-14/10/1913 434 06-08/10/2003
66 318 Srikakulam Srikakulam Rev 18.30 83.90 105 267 15/11/1901 380 24-25/10/1962 422 23-25/10/1962
67 318 Srikakulam Tekkali Rev 18.62 84.25 105 500 19/02/1990 507 18-19/02/1990 522 19-21/02/1990
68 318 Srikakulam Thotapalli Pwd 18.78 83.52 28 217 19/06/1953 262 18-19/06/1953 300 18-20/06/1953
69 318 Srikakulam Thotapalli Rev 18.78 83.52 24 217 19/06/1953 267 27-28/08/1942 384 26-28/08/1942
70 318 Visakhapatnam Anakapalli Rev 17.68 83.00 100 282 22/10/1928 507 22-23/10/1928 550 21-23/10/1928
71 318 Visakhapatnam Bhimunipatnam Rev 17.88 83.43 99 520 17/10/1982 553 16-17/10/1982 556 16-18/10/1982
72 318 Visakhapatnam Chidavaram Rev 17.83 82.93 93 323 17/10/1904 583 10-11/05/1990 610 10-12/05/1990
73 318 Visakhapatnam Chodyam Pwd 17.67 82.43 36 502 11/05/1990 782 10-11/05/1990 808 10-12/05/1990
74 318 Visakhapatnam Konda Others 18.02 83.58 76 387 18/11/1923 577 17-18/11/1923 598 16-18/11/1923

Study Area and its Climatology
PMP Atlas for Mahanadi and Adjoining River Basins Page 46 of 260
Sr. No.
Catchment No.
District Station Type Lat
(Deg.) Long (Deg.)
Data Length (Years)
1-Day Highest Rainfall 2-Day Highest Rainfall 3-Day Highest Rainfall
Rainfall (mm)
Date Rainfall
(mm) Date
Rainfall (mm)
Date
75 318 Visakhapatnam Kothakota Pwd 17.77 82.70 33 340 11/05/1990 601 10-11/05/1990 627 09-11/05/1990
76 318 Visakhapatnam Malakapuram Rev 17.62 83.20 69 335 19/10/1958 508 19-20/10/1958 559 18-20/10/1958
77 318 Visakhapatnam Narsipatnam Rev 17.67 82.62 99 443 23/09/1988 645 10-11/05/1990 683 10-12/05/1990
78 318 Visakhapatnam Palaparthi Pwd 17.42 82.58 39 323 10/05/1990 461 10-11/05/1990 527 09-11/05/1990
79 318 Visakhapatnam Polavaram Others 17.40 82.82 73 359 20/10/1958 584 16-17/11/1923 748 16-18/11/1923
80 318 Visakhapatnam Tandaya Dam Site Pwd 17.77 82.25 26 337 11/05/1990 487 10-11/05/1990 589 10-12/05/1990
81 318 Visakhapatnam Tulabada Rev 17.78 82.52 46 287 22/10/1928 388 09-10/11/1924 422 08-10/11/1924
82 318 Visakhapatnam Yellamanchili Rev 17.55 82.87 97 356 22/10/1928 412 22-23/10/1928 465 21-23/10/1928
83 318 Vizianagaram Bobbili Rev 18.57 83.37 103 282 14/10/1931 355 11-12/05/1990 413 10-12/05/1990
84 318 Vizianagaram Cheepurupalli Rev 18.30 83.57 102 354 14/10/1931 451 13-14/10/1931 463 12-14/10/1931
85 318 Vizianagaram Gajapathinagaram Rev 18.30 83.33 96 511 14/10/1931 551 13-14/10/1931 556 13-15/10/1931
86 318 Vizianagaram Parvatipuram Rev 18.78 83.43 103 274 25/06/1914 361 11-12/05/1990 462 10-12/05/1990
87 318 Vizianagaram Salur Rev 18.52 83.20 98 292 14/10/1931 403 30-31/10/1923 440 10-12/05/1990
88 318 Vizianagaram Srungavarapukota Pwd 18.12 83.13 96 263 11/05/1990 517 10-11/05/1990 575 10-12/05/1990
89 318 Vizianagaram Tatipudi Pwd 18.20 83.17 22 168 28/11/1977 214 11-12/05/1990 247 10-12/05/1990
90 318 Vizianagaram Vijayanagaram Rev 18.12 83.42 97 403 24/10/1990 603 24-25/10/1990 604 23-25/10/1990
91 319 Bargarh Ambabhona Others 21.58 83.47 69 305 31/07/2005 437 23-24/07/1937 464 22-24/07/1937
92 319 Bargarh Paikmal Others 20.92 82.75 33 338 30/08/1982 563 29-30/08/1982 604 29-31/08/1982
93 319 Bastar Khijrawan Hydro 20.30 81.77 34 292 04/04/1997 500 03-04/04/1997 524 02-04/04/1997
94 319 Bilaspur Bilaspur Others 22.08 82.13 99 272 23/08/1940 481 23-24/08/1940 496 22-24/08/1940
95 319 Bilaspur Khurai Others 22.42 81.60 44 154 08/07/1945 191 28-29/08/1963 217 08-10/07/1945
96 319 Bilaspur Kotaghat Others 22.30 82.22 57 224 01/08/1969 287 12-13/08/1968 340 12-14/08/1968
97 319 Bilaspur Mungeli Others 22.07 81.68 99 240 23/08/1940 311 23-24/08/1940 326 22-24/08/1940
98 319 Bilaspur Pandaria Others 22.22 81.42 71 402 30/06/1988 702 29-30/06/1988 712 28-30/06/1988
99 319 Bilaspur Pasan Others 22.83 82.20 49 168 07/07/1925 283 06-07/07/1925 288 05-07/07/1925
100 319 Bilaspur Pondilafa Others 22.57 82.62 55 218 11/06/1916 261 11-12/09/1998 303 10-12/08/1917
101 319 Dhamtari Dhamtari Others 20.70 81.57 93 313 05/09/1952 507 15-16/08/1948 575 11-13/06/1919
102 319 Dhamtari Kurud Others 20.83 81.72 79 381 04/08/1910 433 04-05/08/1910 461 03-05/08/1910
103 319 Durg Adamabad Others 20.68 81.25 65 437 13/09/1959 539 12-13/09/1959 551 11-13/09/1959
104 319 Durg Bemetara Others 21.72 81.53 94 217 10/07/1925 316 30-31/08/1999 359 29-31/08/1999
105 319 Durg Bhatagaon Others 20.95 81.40 63 282 15/08/1948 349 15-16/08/1948 383 07-09/07/1973
106 319 Durg Bhilai Others 21.20 81.42 65 288 19/08/1939 366 15-16/07/1958 432 15-17/07/1958
107 319 Durg Durg Others 21.22 81.28 99 300 01/08/1996 370 01-02/08/1996 388 14-16/07/1958
108 319 Durg Khamaria Others 21.80 81.33 64 298 05/07/1964 348 29-30/06/1964 544 22-24/06/1964
109 319 Durg Khapari Others 21.03 81.40 86 306 19/08/1939 423 15-16/08/1948 497 07-09/07/1973
110 319 Durg Kharra Others 21.55 81.53 64 301 12/09/1942 335 11-12/09/1942 336 10-12/09/1942
111 319 Durg Sanjari Others 20.87 81.03 52 240 19/08/1939 340 13-14/06/1919 436 12-14/06/1919
112 319 Durg Selod Others 21.08 81.43 64 260 08/07/1973 360 07-08/07/1973 460 07-09/07/1973

Study Area and its Climatology
PMP Atlas for Mahanadi and Adjoining River Basins Page 47 of 260
Sr. No.
Catchment No.
District Station Type Lat
(Deg.) Long (Deg.)
Data Length (Years)
1-Day Highest Rainfall 2-Day Highest Rainfall 3-Day Highest Rainfall
Rainfall (mm)
Date Rainfall
(mm) Date
Rainfall (mm)
Date
113 319 Janjgir Dhabara /Dabra Others 21.78 83.08 33 458 15/06/1994 544 15-16/06/1994 587 14-16/06/1994
114 319 Janjgir Janjgir Others 22.02 82.58 86 385 16/06/1994 436 16-17/06/1994 444 16-18/06/1994
115 319 Janjgir Sakti Others 22.03 82.97 95 260 15/06/1994 329 11-12/06/1961 385 11-13/06/1961
116 319 Janjgir Seorinarayan Others 21.72 82.60 22 228 31/07/1959 356 30-31/07/1959 432 29-31/07/1959
117 319 Jashpurnagar Pathalgaon Hydro 22.57 83.50 30 168 01/10/1961 265 30/09-01/10/1961 273 29/09-01/10/1961
118 319 Jharsuguda Jharsuguda Others 21.85 84.03 62 350 29/06/1925 498 28-29/06/1925 514 28-30/06/1925
119 319 Jharsuguda Laikera Bl Ii Others 21.88 84.17 29 306 07/08/2004 377 07-08/08/2004 405 07-09/08/2004
120 319 Jharsuguda Lakhanpur Others 21.58 83.58 32 159 29/06/2005 269 22-23/07/1996 338 05-07/06/1971
121 319 Korba Kathghora Others 22.50 82.55 84 434 24/11/1958 537 23-24/11/1958 584 11-13/06/1961
122 319 Korba Korba Others 22.33 82.70 73 802 26/07/1988 1603 26-27/07/1988 2404 25-27/07/1988
123 319 Kowardha Kowardha Others 22.02 81.25 92 222 13/07/1958 311 16-17/08/1974 316 15-17/08/1974
124 319 Mahasamund Mahasamund Others 21.10 82.10 87 287 28/08/1915 481 28-29/08/1915 519 13-15/07/1958
125 319 Mahasamund Saraipali Others 21.08 82.45 75 299 26/08/1920 352 25-26/08/1920 391 25-27/08/1920
126 319 Nawapara Nawapara Others 20.83 82.55 65 225 30/08/1939 332 10-11/09/1985 377 02-04/08/1937
127 319 Raigarh Dharamjaigarh Others 22.47 83.22 82 254 17/08/1923 398 17-18/08/1923 418 17-19/08/1923
128 319 Raigarh Gharghoda Hydro 22.17 83.35 28 226 30/06/1964 361 29-30/06/1964 391 29/06-01/07/1964
129 319 Raigarh Ginabahar Hydro 22.77 83.97 45 229 24/06/1953 274 23-24/06/1953 357 21-23/06/1996
130 319 Raigarh Raigarh Others 21.92 83.40 85 271 26/07/1902 364 04-05/08/1914 464 02-04/08/1914
131 319 Raigarh Sarangarh Others 21.58 83.08 91 309 28/06/1937 397 27-28/06/1937 414 28-30/06/1925
132 319 Raigarh Tapkara Hydro 22.58 83.97 39 195 08/07/1994 250 08-09/07/1994 357 21-23/06/1996
133 319 Raipur Arang Others 21.20 81.98 75 318 04/08/1910 373 18-19/08/1939 420 17-19/08/1939
134 319 Raipur Arjuni Others 21.50 82.62 38 226 24/09/1973 298 24-25/09/1973 400 13-15/07/1958
135 319 Raipur Baloda Bazar Others 21.67 82.17 94 232 02/08/1908 284 30-31/08/1955 332 14-16/07/1958
136 319 Raipur Bhatagaon Others 21.15 81.73 60 267 23/07/1986 378 15-16/08/1948 429 14-16/08/1948
137 319 Raipur Budni Others 20.92 81.83 38 238 17/08/1984 343 15-16/07/1958 523 13-15/07/1958
138 319 Raipur Gariabund Others 20.63 82.07 88 302 03/08/1942 432 14-15/08/1948 470 13-15/08/1948
139 319 Raipur Gattasilli Others 20.45 81.82 52 230 11/09/1976 375 01-02/08/1967 405 31/07-02/08/1967
140 319 Raipur Kanki Others 21.38 81.98 65 321 12/09/1942 445 15-16/07/1958 529 15-17/07/1958
141 319 Raipur Kendri Others 21.10 81.73 55 291 23/06/1986 373 15-16/07/1958 458 13-15/07/1958
142 319 Raipur Khairdatan Others 21.57 82.33 76 282 04/07/1915 304 15-16/07/1958 424 03-05/08/1933
143 319 Raipur Kondapar Others 21.72 81.98 57 304 24/06/1986 398 18-19/08/1939 423 17-19/08/1939
144 319 Raipur Kusrangi Others 21.35 82.00 46 335 12/09/1942 358 18-19/08/1939 400 17-19/08/1939
145 319 Raipur Lahood Others 21.58 82.25 38 300 07/08/1990 318 16-17/07/1958 399 15-17/07/1958
146 319 Raipur Lakholi Others 21.20 81.90 49 344 13/07/1958 506 13-14/07/1958 804 13-15/07/1958
147 319 Raipur Mainpur Hydro 20.28 82.23 33 296 28/07/1991 327 31/07-01/08/1967 375 30/07-01/08/1967
148 319 Raipur Maramsilli Others 20.55 81.67 56 280 02/08/1967 461 01-02/08/1967 491 20-22/07/1932
149 319 Raipur Pallari Others 21.53 82.17 47 341 13/07/1958 443 13-14/07/1958 595 13-15/07/1958
150 319 Raipur Pindron Others 21.67 81.87 79 326 12/09/1942 386 17-18/06/1933 437 12-14/07/1958

Study Area and its Climatology
PMP Atlas for Mahanadi and Adjoining River Basins Page 48 of 260
Sr. No.
Catchment No.
District Station Type Lat
(Deg.) Long (Deg.)
Data Length (Years)
1-Day Highest Rainfall 2-Day Highest Rainfall 3-Day Highest Rainfall
Rainfall (mm)
Date Rainfall
(mm) Date
Rainfall (mm)
Date
151 319 Raipur Pithora Others 21.27 82.52 57 222 22/08/1946 325 09-10/06/1961 361 09-11/06/1961
152 319 Raipur Rajim Others 20.97 81.88 56 255 24/11/1958 345 15-16/07/1958 413 15-17/07/1958
153 319 Raipur Rudri Others 20.67 81.57 58 346 05/09/1952 535 01-02/08/1967 596 01-03/08/1967
154 319 Raipur Sandi Others 21.50 82.50 41 354 13/07/1958 522 13-14/07/1958 720 13-15/07/1958
155 319 Raipur Simga Others 21.63 81.70 75 227 11/09/1942 235 11-12/09/1942 278 08-10/07/1994
156 319 Rajnandgaon Ambagarh Chowki Others 20.78 80.73 87 311 19/08/1939 415 19-20/08/1939 490 03-05/08/1912
157 319 Rajnandgaon Chhuikhadan Others 21.53 81.00 95 209 12/07/1942 249 11-12/07/1942 251 10-12/07/1942
158 319 Rajnandgaon Dongargarh Others 21.20 80.75 88 256 11/06/1911 322 11-12/06/1911 489 12-14/08/1975
159 319 Rajnandgaon Gondai Others 21.67 81.12 86 160 02/09/1959 251 23-24/06/1964 329 23-25/06/1964
160 319 Rajnandgaon Khairagarh Others 21.42 80.98 96 238 16/10/1904 276 11-12/07/1942 277 10-12/07/1942
161 319 Rajnandgaon Rajnandgaon Others 21.08 81.03 96 293 29/08/1908 369 13-14/07/1958 470 13-15/07/1958
162 319 Sambalpur Kuchinda Others 21.75 84.35 21 369 17/07/2001 445 03-04/09/1973 474 02-04/09/1973
163 319 Sambalpur Kusumi Hydro 21.75 84.52 52 413 18/08/1975 595 18-19/08/1975 695 17-19/08/1975
164 319 Sundargarh Hemgir Hydro 21.95 83.70 59 235 17/07/2001 330 10-11/06/1961 405 10-12/06/1961
165 319 Sundargarh Lephripara Others 22.10 83.82 25 270 20/07/1994 280 20-21/07/1994 285 20-22/07/1994
166 319 Sundargarh Sundergarh Others 22.12 84.03 32 347 20/06/2003 382 20-21/06/2003 395 18-20/06/2003
167 319 Sundargarh Ujjalpur Hydro 22.08 83.92 48 208 13/07/1994 324 26-27/07/2002 480 25-27/07/2002
168 319 Surguja Sitapur Others 22.77 83.50 29 287 19/06/1994 547 19-20/06/1994 627 19-21/06/1994
169 320 Angul Athmalik Others 20.72 84.53 85 293 13/08/1991 504 12-13/08/1991 672 11-13/08/1991
170 320 Balasore Balandapara Others 20.50 83.87 45 395 15/06/1936 733 14-15/06/1936 890 13-15/06/1936
171 320 Balasore Baudhgarh Others 20.83 84.32 42 315 22/08/1934 476 21-22/08/1934 485 21-23/08/1934
172 320 Balasore Posara Others 20.28 84.45 36 250 14/09/1933 308 13-14/09/1933 337 12-14/09/1933
173 320 Bargarh Bargarh Others 21.33 83.62 78 402 30/07/1991 413 27-28/07/1991 618 28-30/07/1991
174 320 Bargarh Bhatli Others 21.42 83.50 29 402 15/06/1994 486 15-16/06/1994 502 14-16/06/1994
175 320 Bargarh Bijepur Others 21.18 83.47 57 475 28/07/1992 520 27-28/07/1992 546 27-29/07/1992
176 320 Bargarh Padampur Others 21.00 83.00 67 368 07/09/1939 406 06-07/09/1939 418 06-08/09/1939
177 320 Bargarh Paikmal Hydro 20.93 82.83 42 290 29/08/2003 510 28-29/08/2003 510 27-29/08/2003
178 320 Bargarh Rajathgarh Others 20.57 85.75 48 262 13/06/1936 359 12-13/06/1936 373 11-13/06/1936
179 320 Bargarh Sohella Hydro 21.30 83.40 44 300 17/06/1963 402 17-18/06/1963 612 17-19/06/1963
180 320 Bhadrak Handapa Others 20.97 84.68 21 268 21/09/1933 402 10-11/07/1942 416 09-11/07/1942
181 320 Bhadrak Krishnanagar Others 20.97 84.47 22 298 28/07/1992 466 10-11/07/1942 482 10-12/07/1942
182 320 Bhadrak Purankot(Tikeapa Others 20.65 84.83 63 256 14/06/1936 394 15-16/08/1926 434 14-16/08/1926
183 320 Bolangir Belpara Others 20.58 82.98 20 240 14/06/2004 465 14-15/06/2004 545 13-15/06/2004
184 320 Bolangir Bolangir Others 20.70 83.50 74 316 06/09/2003 389 17-18/09/2008 451 15-17/06/1918
185 320 Bolangir Bungomunda Others 20.35 82.92 23 459 30/08/2006 641 29-30/08/2006 710 28-30/08/2006
186 320 Bolangir Khaparakhol Others 20.67 82.83 24 227 28/07/1992 342 14-15/06/2004 374 17-19/09/2008
187 320 Bolangir Loisingha Others 20.85 83.52 23 211 21/09/1954 253 19-20/08/1992 260 19-21/08/1992
188 320 Bolangir Patnagarh Others 20.72 83.13 27 292 23/07/1995 406 23-24/07/1995 464 17-19/09/2008

Study Area and its Climatology
PMP Atlas for Mahanadi and Adjoining River Basins Page 49 of 260
Sr. No.
Catchment No.
District Station Type Lat
(Deg.) Long (Deg.)
Data Length (Years)
1-Day Highest Rainfall 2-Day Highest Rainfall 3-Day Highest Rainfall
Rainfall (mm)
Date Rainfall
(mm) Date
Rainfall (mm)
Date
189 320 Bolangir Saintala Others 20.43 83.35 31 250 17/09/2008 475 17-18/09/2008 485 16-18/09/2008
190 320 Bolangir Titlagarh Others 20.30 83.15 39 350 13/06/2001 423 12-13/06/2001 493 12-14/06/2001
191 320 Bolangir Turekela Others 20.50 82.80 26 177 07/07/1973 249 06-07/07/1973 277 07-09/07/1973
192 320 Boudh Harabhanga Others 20.63 84.62 22 205 28/08/1994 315 27-28/08/1994 326 27-29/08/1994
193 320 Cuttack Athgarh Others 20.50 85.58 35 275 28/08/2003 378 22-23/09/2007 524 06-08/09/1973
194 320 Cuttack Banki Bankigarh Others 20.38 85.53 61 295 14/06/1936 414 13-14/06/1936 435 12-14/06/1936
195 320 Cuttack Baramba Others 20.43 85.35 78 220 27/08/1947 338 13-14/06/1936 348 12-14/06/1936
196 320 Cuttack Cuttack Others 20.47 85.87 56 417 10/08/1934 434 09-10/08/1934 452 26-28/06/1925
197 320 Cuttack Cuttack Sadar I Others 20.33 86.00 33 330 05/08/2007 559 26-27/07/1967 814 25-27/07/1967
198 320 Cuttack Mahanga Others 20.50 86.17 29 281 19/07/1987 388 22-23/09/2007 486 21-23/09/2007
199 320 Cuttack Narsingpur Others 20.45 85.08 87 274 14/06/1936 360 16-17/07/1991 367 12-14/06/1936
200 320 Cuttack Salepur Others 20.50 86.13 77 318 27/06/1925 528 27-28/06/1925 583 26-28/06/1925
201 320 Cuttack Tigiriagarh Others 20.47 85.52 51 284 30/07/2005 345 17-18/08/1975 440 16-18/08/1975
202 320 Dhenkanal Bhuban Others 20.48 84.27 30 246 20/08/1986 284 29-30/07/2005 345 11-13/05/1995
203 320 Jagatsingpur Dhama Others 21.25 83.92 37 267 26/08/1920 386 21-22/08/1934 420 23-25/07/1944
204 320 Jagatsingpur Jagatsingpur Others 20.27 86.17 83 321 03/08/1915 412 27-28/06/1925 456 26-28/06/1925
205 320 Jagatsingpur Naraj Hydro 20.42 85.68 31 304 21/07/1986 394 21-22/07/1986 430 11-13/05/1995
206 320 Jajpur Barchana Others 20.67 86.12 57 320 12/08/2007 440 27-28/06/1925 500 26-28/06/1925
207 320 Jajpur Jenapur Hydro 20.55 86.08 29 226 20/08/1986 313 17-18/06/1993 372 16-18/06/1993
208 320 Kalahandi Bhawanipatna Others 19.92 83.17 79 310 17/07/1991 538 05-06/07/2001 670 05-07/07/2001
209 320 Kalahandi Golamunda Others 20.00 82.75 32 390 04/07/2006 525 03-04/07/2006 530 03-05/07/2006
210 320 Kalahandi Jaipatna Others 19.47 82.82 39 345 22/06/1967 604 21-22/06/1967 764 20-22/06/1967
211 320 Kalahandi Junagarh Others 19.83 82.92 35 335 12/08/2007 540 03-04/07/2006 556 02-04/07/2006
212 320 Kalahandi Madanpur Rampur
Others 20.20 83.52 37 485 05/09/2003 503 05-06/09/2003 519 05-07/09/2003
213 320 Kalahandi Thuamulrampur Others 19.55 82.93 24 825 28/07/1991 1050 03-04/07/2006 1135 02-04/07/2006
214 320 Kandhamal Balliguda Others 20.20 83.92 90 701 23/08/1970 704 23-24/08/1970 1011 26-28/08/1970
215 320 Kandhamal Gudhayagiri Others 20.13 84.38 77 265 04/11/1990 388 10-11/05/1995 445 03-05/11/1990
216 320 Kandhamal Kalinga Hydro 20.20 84.40 25 351 05/08/1994 385 03-04/11/1990 415 02-04/11/1990
217 320 Kandhamal Khajuripara Others 20.43 84.42 50 218 26/07/1943 294 14-15/06/1936 351 13-15/06/1936
218 320 Kandhamal Phiringia Others 20.35 84.12 46 331 12/08/1991 616 12-13/08/1991 676 11-13/08/1991
219 320 Kandhamal Phulbani Others 20.48 84.23 81 323 28/06/1925 518 28-29/06/1925 564 27-29/06/1925
220 320 Kandhamal Tikabali Others 20.33 84.33 34 319 30/08/2006 488 29-30/08/2006 608 02-04/07/2006
221 320 Kendrapada Kendrapara Others 20.50 86.42 85 402 27/06/1925 629 27-28/06/1925 661 27-29/06/1925
222 320 Khurda Barmul Hydro 20.52 84.87 51 299 29/08/1982 456 29-30/08/1982 471 28-30/08/1982
223 320 Khurda Bolgarh Others 20.18 85.28 62 254 31/08/1919 273 07-08/10/2003 313 06-08/10/2003
224 320 Nawapara Boden Others 19.75 82.75 34 350 18/09/2008 469 17-18/09/2008 554 16-18/09/2008
225 320 Nawapara Khariar Others 20.28 82.77 75 295 18/09/2008 395 03-04/07/2006 435 16-18/09/2008

Study Area and its Climatology
PMP Atlas for Mahanadi and Adjoining River Basins Page 50 of 260
Sr. No.
Catchment No.
District Station Type Lat
(Deg.) Long (Deg.)
Data Length (Years)
1-Day Highest Rainfall 2-Day Highest Rainfall 3-Day Highest Rainfall
Rainfall (mm)
Date Rainfall
(mm) Date
Rainfall (mm)
Date
226 320 Nawapara Komna Hydro 20.50 82.70 52 832 22/08/1977 1583 21-22/08/1977 1584 21-23/08/1977
227 320 Nayagarh Daspalla Others 20.35 84.85 81 194 30/07/2005 260 10-11/05/1995 343 27-29/06/1925
228 320 Nayagarh Khandaparagarh Others 20.27 85.17 37 288 30/07/2005 361 30-31/07/2005 410 30/07-01/08/2005
229 320 Nayagarh Nayagarh Others 20.13 85.10 66 214 13/09/2005 266 13-14/06/1936 309 27-29/06/1925
230 320 Raipur Bhalukona Others 20.60 82.75 38 192 13/07/1958 326 13-14/07/1958 504 13-15/07/1958
231 320 Raipur Deobhog Others 19.90 82.67 80 308 01/09/1995 382 20-21/09/1961 460 20-22/09/1961
232 320 Raipur Urmal Hydro 19.75 82.55 42 212 22/08/1990 297 03-04/07/2006 300 02-04/07/2006
233 320 Sambalpur Hirakud Hydro 21.53 83.90 54 284 03/09/1973 368 03-04/09/1955 389 03-05/09/1955
234 320 Sambalpur R.Pur/Rairakhol Others 21.07 84.35 70 445 05/07/1952 559 04-05/08/1950 577 03-05/08/1950
235 320 Sonepur Binka Others 21.03 83.80 60 402 13/08/2006 652 12-13/08/2006 655 11-13/08/2006
236 320 Sonepur Dunguripalli Others 21.03 83.55 26 253 20/08/1992 344 12-13/08/2006 411 22-24/07/1995
237 320 Sonepur Sonepur Hydro 20.85 83.98 47 600 10/09/1971 601 09-10/09/1971 612 08-10/09/1971
238 320 Sonepur Sonepur Others 20.83 83.90 66 366 16/06/1918 511 15-16/06/1918 573 15-17/06/1918
239 320 Sundargarh Bargaon Others 22.18 84.30 24 238 02/06/1957 260 02-03/06/1957 269 21-23/06/1996
240 321 Angul Chendipada Others 21.10 84.87 94 241 28/06/1925 334 28-29/06/1925 380 27-29/06/1925
241 321 Angul Pallahara Hydro 21.43 85.18 29 340 28/06/2005 639 28-29/06/2005 757 27-29/06/2005
242 321 Angul Pal-Lahara Others 21.43 85.18 90 340 28/06/2005 639 28-29/06/2005 757 27-29/06/2005
243 321 Angul Rajkishorengr Hydro 20.97 84.47 32 339 12/08/1991 519 12-13/08/1991 532 11-13/08/1991
244 321 Angul Rengali Hydro 21.25 85.02 30 289 27/07/1989 386 30-31/07/2005 400 29-31/07/2005
245 321 Angul Talcher Hydro 20.95 85.67 31 308 14/10/1990 321 13-14/10/1990 375 12-14/10/1990
246 321 Angul Talcher Others 20.95 85.22 88 255 20/07/1973 416 12-13/09/1943 424 12-14/09/1943
247 321 Bhadrak Akhuapada Hydro 20.92 86.28 29 361 30/10/1999 528 30-31/10/1999 554 29-31/10/1999
248 321 Bhadrak Akhuapada Others 20.93 86.28 60 343 09/07/1941 473 09-10/07/1941 509 09-11/07/1941
249 321 Bhadrak Bantala Others 20.75 85.07 25 262 28/07/1974 304 27-28/07/1974 507 26-28/07/1974
250 321 Bhadrak Bhadrak Others 21.07 86.50 69 429 20/08/1907 543 19-20/08/1907 558 18-20/08/1907
251 321 Bhadrak Bhandari Pokhari Others 20.92 86.33 34 210 16/10/1985 308 29-30/07/2005 345 29-31/07/2005
252 321 Bhadrak Jarpara Others 20.88 84.90 46 180 14/06/1936 306 03-04/09/1955 320 27-29/06/1925
253 321 Bokaro Kasmar Others 22.92 85.08 33 185 23/07/1997 225 01-02/09/1978 247 22-24/06/1996
254 321 Deogarh Barkote Others 21.55 85.02 20 337 19/08/1975 440 18-19/08/1975 528 18-20/08/1975
255 321 Deogarh Deogarh /Bamra Others 21.55 84.73 60 330 01/08/1943 399 01-02/08/1943 432 31/07-02/08/1943
256 321 Dhenkanal Dhenkanal Others 20.67 85.60 90 231 24/06/1908 345 13-14/06/1936 363 12-14/06/1936
257 321 Dhenkanal Gondia Others 21.00 85.00 26 223 20/08/1986 283 29-30/07/2005 301 29-31/07/2005
258 321 Dhenkanal Hindol Others 20.62 85.20 91 305 17/07/1991 382 30-31/07/2005 400 29-31/07/2005
259 321 Dhenkanal Kamakhyanagar Others 20.93 85.55 86 234 17/08/1926 324 16-17/08/1926 372 15-17/08/1926
260 321 Dhenkanal Kamkhyanagar Hydro 20.93 85.55 30 202 02/07/1995 285 30-31/10/1999 338 11-13/05/1995
261 321 Dhenkanal Parjanga Others 20.92 85.32 30 221 30/07/2005 426 30-31/07/2005 459 29-31/07/2005
262 321 Gumla Bharno Others 23.23 84.88 58 224 06/09/1965 280 05-06/09/1965 282 05-07/09/1965
263 321 Gumla Chainpur Others 23.13 84.23 94 261 06/10/1936 286 20-21/07/1921 370 11-13/09/1987

Study Area and its Climatology
PMP Atlas for Mahanadi and Adjoining River Basins Page 51 of 260
Sr. No.
Catchment No.
District Station Type Lat
(Deg.) Long (Deg.)
Data Length (Years)
1-Day Highest Rainfall 2-Day Highest Rainfall 3-Day Highest Rainfall
Rainfall (mm)
Date Rainfall
(mm) Date
Rainfall (mm)
Date
264 321 Gumla Gumla Others 23.03 84.55 86 239 31/08/1925 288 21-22/07/1920 346 21-23/07/1920
265 321 Gumla Palkot Others 22.88 84.65 87 207 01/09/1914 311 31/08-01/09/1914 363 07-09/07/1930
266 321 Gumla Raidih Others 22.95 84.43 36 147 10/09/1998 208 10-11/09/1998 242 08-10/09/1998
267 321 Jajpur Binjharpur Others 20.73 86.40 63 300 21/07/1991 520 20-21/07/1991 520 19-21/07/1991
268 321 Jajpur Dharmasala Others 20.78 86.15 70 350 11/08/1992 400 10-11/08/1992 560 09-11/08/1992
269 321 Jajpur Jajpur Others 20.83 86.33 89 304 20/08/1907 426 09-10/07/1941 472 09-11/07/1941
270 321 Jajpur Korai Others 20.97 86.17 57 301 17/09/2008 391 16-17/09/2008 443 16-18/09/2008
271 321 Jajpur Sukinda Others 20.97 85.92 65 350 16/10/1985 384 29-30/07/2005 465 29-31/07/2005
272 321 Jashpurnagar Jashpurnagar Others 22.88 84.13 89 210 09/10/1941 297 22-23/09/1933 355 27-29/07/1952
273 321 Kendrapada Aul Others 20.70 86.65 76 381 02/09/1967 746 01-02/09/1967 852 01-03/09/1967
274 321 Kendrapada Pattamundai Others 20.58 86.57 53 370 30/07/1997 540 29-30/07/1997 645 29-31/07/1997
275 321 Kendrapada Rajkanika Others 20.73 86.70 73 327 15/08/1984 416 29-30/07/2005 445 29-31/07/2005
276 321 Keonjhar Anandpur Hydro 21.22 86.12 23 397 30/10/1999 697 30-31/10/1999 711 29-31/10/1999
277 321 Keonjhar Anandpur Others 21.22 86.12 57 225 24/08/1920 308 07-08/07/1940 325 07-09/07/1940
278 321 Keonjhar Champua Hydro 22.17 85.50 30 169 15/06/1985 290 22-23/06/1996 319 21-23/06/1996
279 321 Keonjhar Champua Others 22.08 85.67 50 565 30/07/1927 709 29-30/07/1927 739 28-30/07/1927
280 321 Keonjhar Daitari Hydro 21.10 85.77 23 202 10/05/1995 297 10-11/05/1995 327 10-12/05/1995
281 321 Keonjhar Ghatgaon Others 21.40 85.90 38 275 16/10/1985 305 23-24/09/2007 335 22-24/09/2007
282 321 Keonjhar Harichandpur Others 21.33 85.75 35 220 01/09/1973 260 01-02/09/1973 276 17-19/08/1975
283 321 Keonjhar Joda Others 22.00 85.42 32 304 06/07/2007 564 06-07/07/2007 579 05-07/07/2007
284 321 Keonjhar Keonjhargarh Others 21.63 85.58 76 273 03/07/1945 481 29-30/07/1927 488 28-30/07/1927
285 321 Keonjhar Patna Others 21.63 85.90 27 211 07/07/2007 296 06-07/07/2007 312 06-08/07/2007
286 321 Keonjhar Swam-Patna Hydro 21.62 85.82 30 182 28/06/2005 277 28-29/06/2005 294 21-23/06/1996
287 321 Keonjhar Telkoi Hydro 21.33 85.33 30 358 28/06/2005 490 28-29/06/2005 518 27-29/06/2005
288 321 Keonjhar Telkoi Others 21.33 85.33 26 358 28/06/2005 490 28-29/06/2005 518 27-29/06/2005
289 321 Lohardaga Lohar-Daga Others 23.43 84.68 95 249 26/09/1906 258 26-27/09/1906 295 16-18/09/1976
290 321 Lohardaga Senha Others 23.58 84.75 25 161 06/08/1997 208 23-24/06/1996 214 22-24/06/1996
291 321 Mayurbhanj Joshipur Hydro 21.83 86.08 26 208 06/07/2007 386 22-23/06/1996 406 21-23/06/1996
292 321 Mayurbhanj Joshipur Others 21.98 86.08 28 208 06/07/2007 386 22-23/06/1996 406 21-23/06/1996
293 321 Mayurbhanj Karanjia Hydro 21.77 85.98 76 363 30/07/1927 718 29-30/07/1927 746 28-30/07/1927
294 321 Mayurbhanj Raruan Others 21.97 85.87 25 260 09/07/1976 285 17-18/06/2008 335 30/07-01/08/1952
295 321 Mayurbhanj Thakurmunda Hydro 21.52 86.15 30 377 28/06/2005 430 28-29/06/2005 454 27-29/06/2005
296 321 Mayurbhanj Thakurmunda Others 21.53 86.15 37 327 10/06/1988 361 28-29/06/2005 394 04-06/08/1997
297 321 Mayurbhanj Tiring Hydro 21.52 86.07 21 360 18/06/2008 445 17-18/06/2008 506 17-19/06/2008
298 321 Ranchi Bandu Others 22.75 84.92 29 165 25/06/1962 206 22-23/06/1962 229 23-25/06/1962
299 321 Ranchi Itki Others 23.33 85.08 35 203 03/06/1956 222 02-03/06/1956 263 11-13/10/1958
300 321 Ranchi Mandar Hydro 23.43 85.13 47 382 11/07/1990 642 10-11/07/1990 824 09-11/07/1990
301 321 Ranchi Mandar Others 23.47 85.10 39 300 02/07/1983 414 17-18/09/1976 515 16-18/09/1976

Study Area and its Climatology
PMP Atlas for Mahanadi and Adjoining River Basins Page 52 of 260
Sr. No.
Catchment No.
District Station Type Lat
(Deg.) Long (Deg.)
Data Length (Years)
1-Day Highest Rainfall 2-Day Highest Rainfall 3-Day Highest Rainfall
Rainfall (mm)
Date Rainfall
(mm) Date
Rainfall (mm)
Date
302 321 Ranchi Piska Others 23.33 85.20 31 254 19/08/1951 266 19-20/08/1951 278 17-19/08/1951
303 321 Sambalpur Bamra Others 21.50 84.67 32 280 22/06/1996 369 21-22/06/1996 479 16-18/07/2001
304 321 Sambalpur Batagaon Hydro 21.23 84.65 33 200 17/07/2001 382 13-14/08/1991 477 12-14/08/1991
305 321 Simdega Bano Others 22.67 84.93 84 807 13/09/1959 1097 12-13/09/1959 1742 11-13/09/1959
306 321 Simdega Kolebira Others 22.67 84.67 30 209 31/07/1986 219 21-22/06/1989 275 16-18/07/1975
307 321 Simdega Kurdege Others 22.57 84.13 92 238 18/09/1994 348 07-08/08/1907 461 06-08/08/1907
308 321 Simdega Simdega Others 22.62 84.57 80 288 26/07/1996 334 25-26/07/1996 380 24-26/07/1996
309 321 Simdega Thaitanagar Others 23.05 84.52 35 190 18/09/1994 235 17-18/09/1994 242 16-18/09/1994
310 321 Singbhum West Goilkera Others 22.53 85.38 93 304 07/08/1920 345 20-21/07/1920 439 20-22/07/1920
311 321 Singbhum West Jagnathpur Others 22.25 85.65 82 298 30/07/1927 392 29-30/07/1927 401 28-30/07/1927
312 321 Singbhum West Majhgaon Others 22.12 85.88 73 357 30/07/1927 458 29-30/07/1927 494 28-30/07/1927
313 321 Singbhum West Manoharpur Others 22.38 85.22 87 337 30/07/1927 433 20-21/07/1920 497 20-22/07/1920
314 321 Sundargarh Bisra/Bishra Others 22.27 85.00 31 248 27/07/1971 301 13-14/08/2007 387 12-14/08/2007
315 321 Sundargarh Bonai Others 21.83 84.97 52 334 20/07/1920 465 20-21/07/1920 576 20-22/07/1920
316 321 Sundargarh Kuarmunda Others 22.28 84.78 36 233 20/07/1994 305 21-22/07/2001 368 20-22/07/2001
317 321 Sundargarh Lahunipara Hydro 21.88 84.95 22 280 29/06/2005 396 28-29/06/2005 437 27-29/06/2005
318 321 Sundargarh Mandira Dam Hydro 22.27 84.67 30 226 20/08/2007 272 17-18/09/1994 366 16-18/09/1994
319 321 Sundargarh Pamposh Hydro 22.17 84.83 31 305 20/07/1994 312 20-21/07/1994 332 13-15/08/1993
320 321 Sundargarh Rajgangpur Others 22.18 84.60 64 310 09/07/1987 510 11-12/07/1987 560 09-11/07/1987
321 321 Sundargarh Tensa Hydro 21.87 85.15 28 601 10/08/1995 634 28-29/06/2005 711 28-30/06/2005
322 322 Angul Rajghat Hydro 21.78 87.17 28 304 20/10/2005 529 17-18/06/2008 606 16-18/06/2008
323 322 Angul Turigaria /Kaira Others 21.28 86.47 55 254 03/05/1917 307 30/06-01/07/1940 363 30/06-02/07/1940
324 322 Balasore Bahanaga Others 21.33 86.75 34 740 03/09/1992 745 02-03/09/1992 750 12-14/09/1982
325 322 Balasore Baliapal Others 21.67 87.28 77 700 30/08/1973 940 30-31/08/1973 1035 29-31/08/1973
326 322 Balasore Bhograi Others 21.67 87.37 41 335 30/10/1971 450 20-21/10/2005 690 19-21/10/2005
327 322 Balasore Jallesore Others 21.82 87.22 80 367 17/10/1942 537 17-18/06/2008 575 16-18/06/2008
328 322 Balasore Raj-Nilgiri Others 21.45 86.77 70 349 11/10/1973 376 19-20/10/1945 446 24-26/06/1952
329 322 Balasore Soro Others 21.28 86.70 77 479 01/08/1943 652 19-20/10/1945 878 18-20/10/1945
330 322 Bhadrak Basudevpur /Eram Others 21.13 86.73 75 285 07/10/2003 418 07-08/10/2003 493 06-08/10/2003
331 322 Bhadrak Bonth Others 21.50 86.50 63 229 17/11/1915 404 17-18/11/1915 531 16-18/11/1915
332 322 Manbhum Purulia
Bagmandi Others 23.20 86.03 27 239 21/06/1946 344 20-21/06/1946 377 20-22/06/1946
333 322 Manbhum Purulia
Jhaldah/Jhalda Others 23.37 85.98 73 250 27/09/1992 340 26-27/09/1992 340 25-27/09/1992
334 322 Mayurbhanj Bahalda Others 22.40 86.08 24 424 18/06/2008 762 17-18/06/2008 831 17-19/06/2008
335 322 Mayurbhanj Bangiriposi Others 22.17 86.53 24 197 18/06/2008 305 17-18/06/2008 381 16-18/06/2008
336 322 Mayurbhanj Bangripashi Hydro 22.17 86.53 30 225 21/06/1981 344 21-22/06/1981 381 16-18/06/2008
337 322 Mayurbhanj Baripada Others 21.95 86.73 79 467 12/10/1973 600 11-12/10/1973 635 16-18/06/2008

Study Area and its Climatology
PMP Atlas for Mahanadi and Adjoining River Basins Page 53 of 260
Sr. No.
Catchment No.
District Station Type Lat
(Deg.) Long (Deg.)
Data Length (Years)
1-Day Highest Rainfall 2-Day Highest Rainfall 3-Day Highest Rainfall
Rainfall (mm)
Date Rainfall
(mm) Date
Rainfall (mm)
Date
338 322 Mayurbhanj Jamsolaghat Hydro 22.22 86.72 30 267 06/07/2007 318 28-29/06/1994 356 27-29/06/1994
339 322 Mayurbhanj Murda Others 21.85 86.98 27 325 07/06/1978 371 01-02/06/1956 450 16-18/06/2008
340 322 Mayurbhanj Rairangpur Hydro 22.28 86.17 30 322 17/06/2008 641 17-18/06/2008 669 17-19/06/2008
341 322 Mayurbhanj Rairangpur Others 22.28 86.17 47 322 17/06/2008 641 17-18/06/2008 669 17-19/06/2008
342 322 Mayurbhanj Udala Hydro 21.57 86.60 30 315 30/10/1999 442 30-31/10/1999 477 30/10-01/11/1999
343 322 Mayurbhanj Udala Others 21.58 86.57 27 315 30/10/1999 442 30-31/10/1999 477 30/10-01/11/1999
344 322 Ranchi Angara Others 23.33 85.50 24 300 29/06/1994 325 28-29/06/1994 390 27-29/06/1994
345 322 Ranchi Kankey Others 23.50 85.30 82 333 05/07/1998 336 05-06/07/1998 368 03-05/07/1998
346 322 Ranchi Namkum Others 23.33 85.33 30 222 28/06/1994 249 27-28/06/1994 284 16-18/09/1976
347 322 Ranchi Ormangi/Ormang Others 23.50 85.47 28 173 01/10/1959 263 01-02/10/1959 263 30/09-02/10/1959
348 322 Ranchi Palandu Others 23.30 85.50 52 238 11/06/1918 284 01-02/10/1959 323 11-13/06/1918
349 322 Ranchi Ranchi Obsy 23.38 85.33 68 231 09/10/1941 253 08-09/10/1941 279 25-27/07/1915
350 322 Ranchi Ranchi/Ratu Others 23.43 85.22 36 207 03/07/1990 268 17-18/09/1976 362 16-18/09/1976
351 322 Ranchi Silli Others 23.37 85.83 96 211 22/06/1996 308 22-23/06/1996 350 21-23/06/1996
352 322 Ranchi Sonahatu Others 23.20 85.72 58 178 24/09/1931 228 27-28/06/1965 285 12-14/09/1950
353 322 Ranchi Tamar Others 23.07 85.63 90 330 15/07/1901 330 14-15/07/1901 346 15-17/07/1901
354 322 Seraikela Chandil Others 22.97 86.07 63 269 02/09/1978 302 01-02/09/1978 339 10-12/08/1950
355 322 Seraikela Kharsawan Others 22.80 85.83 91 286 01/09/1957 363 01-02/09/1957 384 31/08-02/09/1957
356 322 Seraikela Nimdih Others 22.83 85.58 30 216 01/09/1978 260 12-13/06/1999 318 22-24/07/1999
357 322 Seraikela Seraikela Others 22.72 85.95 99 232 13/09/1953 246 09-10/07/1942 319 09-11/07/1942
358 322 Singbhum East Bahragora Others 22.28 86.70 94 216 01/09/1907 380 01-02/09/1907 413 06-08/07/1904
359 322 Singbhum East Chakulia Others 22.42 86.67 30 210 27/06/1988 226 11-12/08/1968 281 10-12/08/1968
360 322 Singbhum East Ghatsila Hydro 22.60 86.50 23 318 28/06/1997 359 27-28/06/1997 374 27-29/06/1997
361 322 Singbhum East Ghatsila Others 22.60 86.50 79 193 02/09/1907 347 26-27/07/1906 379 04-06/08/1943
362 322 Singbhum East Patamada Others 22.83 86.33 39 224 31/08/2001 315 28-29/06/1997 333 27-29/06/1997
363 322 Singbhum East Potka Others 22.60 86.25 60 297 31/08/2001 402 21-22/06/1996 542 21-23/06/1996
364 322 Singbhum West Chakradhanpur Others 22.70 85.63 87 208 22/06/1981 290 23-24/06/1984 361 26-28/07/1952
365 322 Singbhum West Katbari Others 22.37 86.02 66 266 29/07/1927 431 28-29/07/1927 478 27-29/07/1927
366 322 Singbhum West Sonua Others 22.60 85.47 69 216 27/07/1952 292 27-28/07/1952 375 09-11/07/1942
Table 2-7: Highest 1, 2 and 3-day rainfalls (mm) recorded at different stations in the adjoining catchments of Mahanadi and Adjoining River Basins
Sr. No.
Catchment No.
District Station Type Lat
(Deg) Long (Deg)
Data Length (Years)
1-Day Highest Rainfall 2-Day Highest Rainfall 3-Day Highest Rainfall
Rainfall (mm)
Date Rainfall
(mm) Date
Rainfall (mm)
Date
1 104 Alirajpur Alirajpur Obsy 22.30 74.37 40 331 21/07/1971 357 9-10/7/1958 379 20-22/7/1971
2 104 Alirajpur Alirajpur Others 22.30 74.37 103 600 25/08/1983 1200 25-26/8/1983 1600 24-26/8/1983
3 104 Balaghat Baihar Obsy 22.10 80.55 22 315 25/07/1997 348 24-25/7/1997 417 17-19/9/1999

Study Area and its Climatology
PMP Atlas for Mahanadi and Adjoining River Basins Page 54 of 260
Sr. No.
Catchment No.
District Station Type Lat
(Deg) Long (Deg)
Data Length (Years)
1-Day Highest Rainfall 2-Day Highest Rainfall 3-Day Highest Rainfall
Rainfall (mm)
Date Rainfall
(mm) Date
Rainfall (mm)
Date
4 104 Balaghat Baihar Others 22.10 80.57 97 315 25/07/1997 382 17-18/7/1994 429 16-18/7/1994
5 104 Balaghat Palhera Others 22.05 80.77 52 571 30/06/1961 575 29-30/6/1961 609 30/6-2/7/1961
6 104 Balaghat Paraswada Others 22.18 80.32 51 254 14/08/1968 307 14-15/8/1968 358 14-16/8/1968
7 104 Balaghat Saleteka Others 21.78 80.83 59 350 16/07/1939 514 15-16/7/1939 591 14-16/7/1939
8 104 Baroda Bhilpur Others 22.45 73.97 21 480 7/9/1994 562 7-8/9/1994 583 7-9/9/1994
9 104 Baroda Chhota-Udepur Others 22.30 74.02 100 286 5/9/1959 430 22-23/7/1905 490 22-24/9/1945
10 104 Baroda Dabhoi Others 22.12 73.43 70 348 24/09/1945 522 23-24/9/1945 607 22-24/9/1945
11 104 Baroda Jambugam Others 22.28 73.77 31 305 31/08/1990 455 31/8-1/9/1990 570 6-8/6/1976
12 104 Baroda Jetpur Others 22.33 73.85 38 340 5/9/1959 479 12-13/7/1950 555 12-14/7/1950
13 104 Baroda Kawant Others 22.08 74.05 24 272 28/07/1996 472 27-28/7/1996 482 26-28/7/1996
14 104 Baroda Naswadi Others 22.05 73.72 45 360 7/9/1970 371 7-8/9/1970 424 5-7/9/1970
15 104 Baroda Sankheda Others 22.17 73.58 46 331 17/08/1981 500 6-7/9/1994 540 9-11/9/1969
16 104 Baroda Sinor Others 21.92 73.33 46 266 6/8/1968 342 6-7/9/1970 371 5-7/9/1970
17 104 Baroda Tilakwada Others 21.88 73.58 41 364 17/08/1981 466 10-11/9/1969 655 9-11/9/1969
18 104 Barwani Barwani Others 22.03 74.88 98 254 6/9/1970 318 5-6/9/1970 325 5-7/9/1970
19 104 Barwani Barwani(Med.) Others 22.03 74.88 20 134 21/09/1973 198 4-5/8/1968 224 18-20/7/1968
20 104 Barwani Barwani(Rajghat) Hydro 22.03 74.88 27 800 3/8/1997 806 2-3/8/1997 872 1-3/8/1997
21 104 Barwani Rajpur Others 21.95 75.13 70 274 15/09/1959 283 14-15/9/1959 290 14-16/9/1959
22 104 Barwani Sendhwa(Med.) Others 21.68 75.10 41 294 25/07/1990 334 24-25/7/1990 350 3-5/9/2002
23 104 Barwani Thikri Hydro 22.07 75.40 44 254 29/07/1967 313 13-14/6/1970 338 5-7/8/2006
24 104 Betul Betul Obsy 21.92 77.90 59 361 30/07/1991 591 14-15/9/1998 599 14-16/9/1998
25 104 Betul Betul/Badnur Others 21.92 77.90 96 361 30/07/1991 591 14-15/9/1998 599 14-16/9/1998
26 104 Betul Chicholi Others 22.02 77.67 92 295 13/09/1998 504 13-14/9/1998 536 12-14/9/1998
27 104 Betul Khedi Hydro 21.83 77.87 23 326 8/7/2007 531 14-15/9/1998 567 13-15/9/1998
28 104 Betul Sarani Dam Hydro 22.17 78.08 28 466 3/8/1984 645 14-15/9/1998 665 13-15/9/1998
29 104 Betul Shahpur Others 22.20 77.92 89 302 14/09/1998 502 14-15/9/1998 557 14-16/9/1998
30 104 Broach Ankleshwar Others 21.63 73.00 97 335 17/07/1902 432 16-17/7/1902 518 5-7/6/1976
31 104 Broach Bhalod Others 21.80 73.17 31 381 5/8/1942 548 23-24/9/1944 699 22-24/9/1944
32 104 Broach Broach Obsy 21.70 72.97 25 460 5/8/1976 475 5-6/8/1976 482 4-6/8/1976
33 104 Broach Broach Others 21.70 72.97 90 350 6/6/1976 506 5-6/6/1976 649 4-6/6/1976
34 104 Broach Hansot Others 21.58 72.82 98 308 4/8/1946 426 25-26/8/1939 535 4-6/6/1976
35 104 Broach Ilav Others 21.45 72.80 93 319 7/8/1968 469 6-7/8/1968 494 29/6-1/7/1930
36 104 Broach Jhagadia Others 21.72 73.18 44 470 24/07/1996 470 23-24/7/1996 473 22-24/7/1996
37 104 Broach Panoli Others 21.55 72.97 22 243 17/08/1990 331 3-4/8/1985 336 3-5/8/1985
38 104 Broach Valia Others 21.55 73.15 64 401 23/09/1945 733 23-24/9/1945 883 22-24/9/1945
39 104 Chindwara Harrai Hydro 22.62 79.23 20 216 15/09/1999 398 15-16/9/1999 483 15-17/9/1999
40 104 Chindwara Harrai Others 22.62 79.23 100 249 8/9/1904 398 15-16/9/1999 503 30/7-1/8/1969
41 104 Chindwara Tamia Others 22.35 78.68 91 395 12/7/1942 623 12-13/7/1942 674 11-13/7/1942

Study Area and its Climatology
PMP Atlas for Mahanadi and Adjoining River Basins Page 55 of 260
Sr. No.
Catchment No.
District Station Type Lat
(Deg) Long (Deg)
Data Length (Years)
1-Day Highest Rainfall 2-Day Highest Rainfall 3-Day Highest Rainfall
Rainfall (mm)
Date Rainfall
(mm) Date
Rainfall (mm)
Date
42 104 Dewas Kannod Obsy 22.67 76.73 27 277 12/9/1975 355 17-18/8/1972 423 17-19/8/1972
43 104 Dewas Kannod Others 22.67 76.73 74 273 30/08/1939 355 17-18/8/1972 423 17-19/8/1972
44 104 Dewas Khategaon Others 22.60 76.92 41 312 12/9/1975 414 17-18/8/1972 487 17-19/8/1972
45 104 Dewas Udainagar(Med.) Others 22.55 76.20 36 211 26/07/1997 383 27-28/7/1996 444 26-28/7/1996
46 104 Dhar Dhar Obsy 22.60 75.30 31 287 26/07/1997 297 25-26/7/1997 303 25-27/7/1997
47 104 Dhar Dhar Others 22.60 75.30 101 297 14/09/1959 352 15-16/9/1933 392 14-16/9/1933
48 104 Dhar Dharampuri Others 22.15 75.35 73 210 31/07/1991 239 3-4/7/1969 265 3-5/7/1969
49 104 Dhar Manawar Others 22.23 75.08 97 384 15/09/1959 394 14-15/9/1959 394 13-15/9/1959
50 104 Dindori Dindori Others 22.93 81.08 102 318 25/06/1946 561 19-20/9/1926 819 19-21/9/1926
51 104 Harda Harda Others 22.35 77.08 99 296 2/7/1930 382 15-16/7/1944 448 16-18/8/1972
52 104 Hoshangabad Bagratawa Hydro 22.63 77.98 44 281 13/07/1959 353 12-13/7/1959 382 16-18/8/1972
53 104 Hoshangabad Hoshangabad Obsy 22.26 71.19 107 380 14/08/2006 405 14-15/8/2006 413 27-29/7/1965
54 104 Hoshangabad Makrai Others 22.08 77.08 81 367 3/7/1930 450 15-16/7/1944 586 17-19/8/1972
55 104 Hoshangabad Pachmarhi Obsy 22.47 78.43 92 459 2/8/1913 523 18-19/8/1974 630 18-20/8/1974
56 104 Hoshangabad Power Kheda Others 22.67 77.75 23 306 30/08/1973 429 29-30/8/1973 453 29-31/8/1973
57 104 Hoshangabad Seoni Others 22.45 77.48 99 380 27/06/2003 484 7-8/7/1905 800 25-27/6/2003
58 104 Hoshangabad Shivpar Hydro 22.52 77.32 24 255 23/08/2004 360 22-23/8/2004 392 22-24/8/2004
59 104 Hoshangabad Sohagpur Others 22.70 78.20 101 450 5/7/1969 527 5-6/7/1969 658 5-7/7/1969
60 104 Hoshangabad T.Dam(Hosh.Bad) Hydro 22.58 77.92 30 201 7/8/1989 281 7-8/8/1989 326 17-19/8/1984
61 104 Indore Manpur(Tappa) Others 22.43 75.63 73 224 30/08/1906 305 26-27/7/1946 355 26-28/7/1946
62 104 Jabalpur Adhartal Others 23.17 79.92 23 251 29/08/1980 350 28-29/8/1980 406 10-12/7/1994
63 104 Jabalpur Barerakalan Others 23.10 80.03 49 310 18/07/1950 325 18-19/7/1950 350 27-29/7/1971
64 104 Jabalpur Jamtara Hydro 23.07 79.95 25 286 28/07/1999 439 28-29/7/1999 450 27-29/7/1999
65 104 Jabalpur Pariat Others 23.25 80.15 52 391 25/08/1952 475 25-26/8/1952 487 25-27/8/1952
66 104 Jabalpur Patan Others 23.30 79.70 79 276 20/08/1923 349 20-21/8/1923 382 19-21/8/1923
67 104 Jabalpur Sehora Others 23.48 80.10 92 337 6/8/1961 398 5-6/8/1961 447 29-31/7/1915
68 104 Jhabua Jabat Others 22.42 74.57 22 800 10/8/1983 1400 9-10/8/1983 1406 8-10/8/1983
69 104 Jhabua Thandla Others 22.03 73.05 22 217 6/9/1973 261 1-2/8/1997 292 5-7/9/1973
70 104 Katni Bohoribund Others 23.67 80.07 61 432 14/07/1988 610 13-14/7/1988 712 12-14/7/1988
71 104 Khandwa Harsud Others 22.12 76.73 103 372 10/8/1981 426 21-22/8/1944 472 20-22/8/1944
72 104 Khandwa Mandhata Others 22.25 76.15 77 255 27/07/1913 309 30-31/8/1906 318 30/8-1/9/1906
73 104 Khandwa Punasa Hydro 22.23 76.40 44 215 27/07/1997 310 26-27/7/1997 379 25-27/7/1997
74 104 Khargone Bhikangaon Hydro 21.87 75.97 30 233 18/08/1972 313 17-18/8/1972 376 16-18/8/1972
75 104 Khargone Burwaha Others 22.27 76.03 74 276 25/07/1937 318 27-28/7/1946 356 27-29/7/1946
76 104 Khargone Kasrawad Others 22.13 75.60 22 176 24/08/2003 229 23-24/8/2003 255 6-8/6/1976
77 104 Khargone Khargone Obsy 21.82 75.62 32 291 16/08/1981 341 16-17/8/1981 348 15-17/8/1981
78 104 Khargone Khargone Others 21.82 75.62 74 400 20/06/1938 462 19-20/6/1938 462 18-20/6/1938
79 104 Khargone Khargone(Med.) Others 21.82 75.62 25 291 16/08/1981 341 16-17/8/1981 364 4-6/8/1968

Study Area and its Climatology
PMP Atlas for Mahanadi and Adjoining River Basins Page 56 of 260
Sr. No.
Catchment No.
District Station Type Lat
(Deg) Long (Deg)
Data Length (Years)
1-Day Highest Rainfall 2-Day Highest Rainfall 3-Day Highest Rainfall
Rainfall (mm)
Date Rainfall
(mm) Date
Rainfall (mm)
Date
80 104 Khargone Maheshwar Others 22.20 75.58 73 318 26/07/1997 390 5-6/9/1970 415 4-6/9/1970
81 104 Khargone Mandaleswar Hydro 22.20 75.48 25 280 8/8/2007 286 8-9/8/2007 295 8-10/8/2007
82 104 Khargone Mortakka Hydro 22.23 76.03 32 220 26/07/1997 316 27-28/7/1996 359 26-28/7/1996
83 104 Khargone Mortakka Others 22.23 76.03 24 220 26/07/1997 299 6-7/9/1994 309 26-28/7/1996
84 104 Mandla Bajag Others 22.67 81.37 49 245 21/09/1926 442 20-21/9/1926 555 19-21/9/1926
85 104 Mandla Bichhia Others 22.45 80.72 73 359 21/09/1926 650 20-21/9/1926 809 19-21/9/1926
86 104 Mandla Mandla Obsy 22.60 80.38 54 261 17/08/2001 293 14-15/8/1968 386 15-17/8/2001
87 104 Mandla Mandla Others 22.60 80.38 98 212 13/08/1968 357 20-21/9/1926 470 19-21/9/1926
88 104 Mandla Narayanganj Others 22.83 80.25 79 462 31/08/1959 478 30-31/8/1959 583 19-21/9/1926
89 104 Mandla Niwas Others 23.05 80.45 88 260 1/9/1970 482 20-21/9/1926 662 19-21/9/1926
90 104 Nandurbar Akkalkuwa Others 21.75 74.00 47 218 7/6/1976 389 7-8/6/1976 516 6-8/6/1976
91 104 Narmada Dediapada Others 21.63 73.58 66 334 6/8/1968 410 6-7/9/1970 468 22-24/9/1945
92 104 Narmada Gardeshwar Others 21.88 73.70 36 297 5/8/1942 516 23-24/9/1945 605 22-24/9/1945
93 104 Narmada Rajpipala/Nandod Others 21.87 73.50 90 517 28/06/1913 637 28-29/6/1913 742 27-29/6/1913
94 104 Narsinghpur Barmanghat Hydro 23.00 79.00 30 283 9/9/2009 393 9-10/9/2009 397 9-11/9/2009
95 104 Narsinghpur Chindwara Others 23.05 79.48 87 285 22/07/1947 412 25-26/6/1977 476 24-26/6/1977
96 104 Narsinghpur Gadarwah Hydro 22.92 78.80 20 298 20/08/1982 374 13-14/7/1998 464 15-17/9/1999
97 104 Narsinghpur Gadarwara Others 22.92 78.80 98 309 4/8/1912 372 29-30/8/1973 464 15-17/9/1999
98 104 Narsinghpur Mohpani Others 22.73 78.82 83 460 31/08/1976 584 28-29/8/1973 673 27-29/8/1973
99 104 Narsinghpur Narsinghpur Obsy 22.95 79.20 43 271 15/09/1999 384 15-16/9/1999 452 14-16/9/1999
100 104 Narsinghpur Narsinghpur Others 22.95 79.20 101 239 26/08/1994 310 24-25/7/1927 375 24-26/7/1927
101 104 Narsinghpur Tendukhera Others 23.17 78.88 78 270 7/8/1912 404 18-19/6/2004 409 17-19/6/2004
102 104 Panch-Mahals Jambughoda Others 22.38 73.73 100 420 24/09/1945 573 23-24/9/1945 766 4-6/6/1976
103 104 Raisen Bareli Others 23.00 77.23 80 244 31/08/1955 374 30-31/8/1955 418 29-31/8/1955
104 104 Raisen Barna Dam Hydro 23.13 78.07 30 270 24/08/1991 454 18-19/8/1984 496 17-19/8/1984
105 104 Raisen Salwani(Silvani) Others 23.30 78.45 78 480 9/9/1983 531 8-9/9/1983 554 8-10/9/1983
106 104 Raisen Silwani Hydro 23.30 78.45 20 480 9/9/1983 531 8-9/9/1983 554 8-10/9/1983
107 104 Raisen Udaipura Others 23.08 78.50 69 340 11/7/1998 349 11-12/7/1998 474 11-13/7/1998
108 104 Sehore Budhni Others 22.78 77.68 49 290 28/06/1994 401 22-23/8/2004 466 22-24/8/2004
109 104 Sehore Nasrullaganj Others 22.68 77.27 79 253 26/08/1987 378 31/8-1/9/1939 393 14-16/7/1944
110 104 Seoni Ghansore Others 22.63 79.95 69 304 18/08/2002 371 17-18/8/2002 412 16-18/8/2002
111 104 Seoni Lakhandon Hydro 22.60 79.60 24 256 15/09/1999 358 15-16/9/1999 394 14-16/9/1999
112 104 Seoni Lakhnadon Others 22.60 79.60 99 256 21/06/1990 358 15-16/9/1999 394 14-16/9/1999
113 104 Surat Kim Hydro 21.40 72.97 34 378 5/6/1976 651 5-6/6/1976 801 5-7/6/1976
114 104 Surat Mangrol Others 21.47 73.13 72 386 23/09/1945 650 23-24/9/1945 751 22-24/9/1945
115 104 Surat Olpad Others 21.35 72.75 99 383 11/7/1929 601 23-24/9/1945 664 22-24/9/1945
116 315 Balaghat Balaghat Others 21.80 80.20 99 281 12/7/1914 441 25-26/6/1906 482 17-19/6/1918
117 315 Balaghat Dhuti Others 22.12 80.07 62 296 1/8/1967 374 31/7-1/8/1967 396 14-16/7/1939
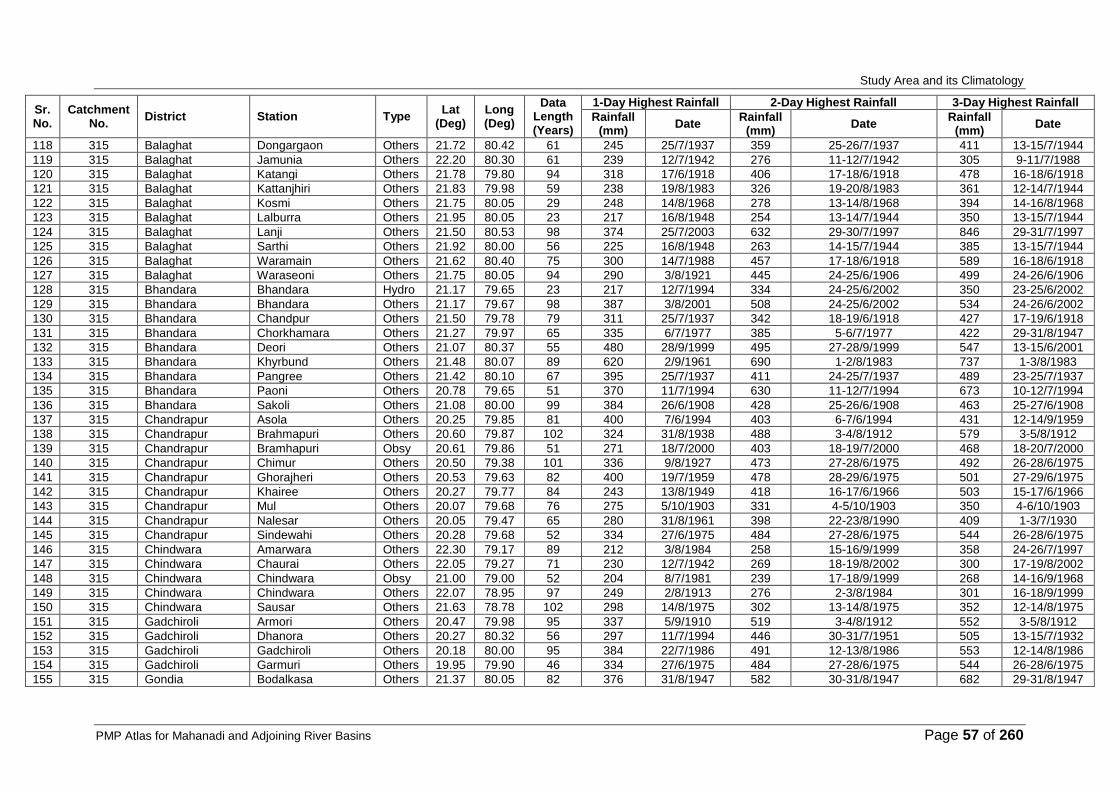
Study Area and its Climatology
PMP Atlas for Mahanadi and Adjoining River Basins Page 57 of 260
Sr. No.
Catchment No.
District Station Type Lat
(Deg) Long (Deg)
Data Length (Years)
1-Day Highest Rainfall 2-Day Highest Rainfall 3-Day Highest Rainfall
Rainfall (mm)
Date Rainfall
(mm) Date
Rainfall (mm)
Date
118 315 Balaghat Dongargaon Others 21.72 80.42 61 245 25/7/1937 359 25-26/7/1937 411 13-15/7/1944
119 315 Balaghat Jamunia Others 22.20 80.30 61 239 12/7/1942 276 11-12/7/1942 305 9-11/7/1988
120 315 Balaghat Katangi Others 21.78 79.80 94 318 17/6/1918 406 17-18/6/1918 478 16-18/6/1918
121 315 Balaghat Kattanjhiri Others 21.83 79.98 59 238 19/8/1983 326 19-20/8/1983 361 12-14/7/1944
122 315 Balaghat Kosmi Others 21.75 80.05 29 248 14/8/1968 278 13-14/8/1968 394 14-16/8/1968
123 315 Balaghat Lalburra Others 21.95 80.05 23 217 16/8/1948 254 13-14/7/1944 350 13-15/7/1944
124 315 Balaghat Lanji Others 21.50 80.53 98 374 25/7/2003 632 29-30/7/1997 846 29-31/7/1997
125 315 Balaghat Sarthi Others 21.92 80.00 56 225 16/8/1948 263 14-15/7/1944 385 13-15/7/1944
126 315 Balaghat Waramain Others 21.62 80.40 75 300 14/7/1988 457 17-18/6/1918 589 16-18/6/1918
127 315 Balaghat Waraseoni Others 21.75 80.05 94 290 3/8/1921 445 24-25/6/1906 499 24-26/6/1906
128 315 Bhandara Bhandara Hydro 21.17 79.65 23 217 12/7/1994 334 24-25/6/2002 350 23-25/6/2002
129 315 Bhandara Bhandara Others 21.17 79.67 98 387 3/8/2001 508 24-25/6/2002 534 24-26/6/2002
130 315 Bhandara Chandpur Others 21.50 79.78 79 311 25/7/1937 342 18-19/6/1918 427 17-19/6/1918
131 315 Bhandara Chorkhamara Others 21.27 79.97 65 335 6/7/1977 385 5-6/7/1977 422 29-31/8/1947
132 315 Bhandara Deori Others 21.07 80.37 55 480 28/9/1999 495 27-28/9/1999 547 13-15/6/2001
133 315 Bhandara Khyrbund Others 21.48 80.07 89 620 2/9/1961 690 1-2/8/1983 737 1-3/8/1983
134 315 Bhandara Pangree Others 21.42 80.10 67 395 25/7/1937 411 24-25/7/1937 489 23-25/7/1937
135 315 Bhandara Paoni Others 20.78 79.65 51 370 11/7/1994 630 11-12/7/1994 673 10-12/7/1994
136 315 Bhandara Sakoli Others 21.08 80.00 99 384 26/6/1908 428 25-26/6/1908 463 25-27/6/1908
137 315 Chandrapur Asola Others 20.25 79.85 81 400 7/6/1994 403 6-7/6/1994 431 12-14/9/1959
138 315 Chandrapur Brahmapuri Others 20.60 79.87 102 324 31/8/1938 488 3-4/8/1912 579 3-5/8/1912
139 315 Chandrapur Bramhapuri Obsy 20.61 79.86 51 271 18/7/2000 403 18-19/7/2000 468 18-20/7/2000
140 315 Chandrapur Chimur Others 20.50 79.38 101 336 9/8/1927 473 27-28/6/1975 492 26-28/6/1975
141 315 Chandrapur Ghorajheri Others 20.53 79.63 82 400 19/7/1959 478 28-29/6/1975 501 27-29/6/1975
142 315 Chandrapur Khairee Others 20.27 79.77 84 243 13/8/1949 418 16-17/6/1966 503 15-17/6/1966
143 315 Chandrapur Mul Others 20.07 79.68 76 275 5/10/1903 331 4-5/10/1903 350 4-6/10/1903
144 315 Chandrapur Nalesar Others 20.05 79.47 65 280 31/8/1961 398 22-23/8/1990 409 1-3/7/1930
145 315 Chandrapur Sindewahi Others 20.28 79.68 52 334 27/6/1975 484 27-28/6/1975 544 26-28/6/1975
146 315 Chindwara Amarwara Others 22.30 79.17 89 212 3/8/1984 258 15-16/9/1999 358 24-26/7/1997
147 315 Chindwara Chaurai Others 22.05 79.27 71 230 12/7/1942 269 18-19/8/2002 300 17-19/8/2002
148 315 Chindwara Chindwara Obsy 21.00 79.00 52 204 8/7/1981 239 17-18/9/1999 268 14-16/9/1968
149 315 Chindwara Chindwara Others 22.07 78.95 97 249 2/8/1913 276 2-3/8/1984 301 16-18/9/1999
150 315 Chindwara Sausar Others 21.63 78.78 102 298 14/8/1975 302 13-14/8/1975 352 12-14/8/1975
151 315 Gadchiroli Armori Others 20.47 79.98 95 337 5/9/1910 519 3-4/8/1912 552 3-5/8/1912
152 315 Gadchiroli Dhanora Others 20.27 80.32 56 297 11/7/1994 446 30-31/7/1951 505 13-15/7/1932
153 315 Gadchiroli Gadchiroli Others 20.18 80.00 95 384 22/7/1986 491 12-13/8/1986 553 12-14/8/1986
154 315 Gadchiroli Garmuri Others 19.95 79.90 46 334 27/6/1975 484 27-28/6/1975 544 26-28/6/1975
155 315 Gondia Bodalkasa Others 21.37 80.05 82 376 31/8/1947 582 30-31/8/1947 682 29-31/8/1947

Study Area and its Climatology
PMP Atlas for Mahanadi and Adjoining River Basins Page 58 of 260
Sr. No.
Catchment No.
District Station Type Lat
(Deg) Long (Deg)
Data Length (Years)
1-Day Highest Rainfall 2-Day Highest Rainfall 3-Day Highest Rainfall
Rainfall (mm)
Date Rainfall
(mm) Date
Rainfall (mm)
Date
156 315 Gondia Gondia Obsy 21.46 80.20 56 281 2/9/1961 358 2-3/9/1961 403 13-15/9/2005
157 315 Gondia Gondia Others 21.45 80.20 60 347 18/6/1918 477 18-19/6/1918 602 17-19/6/1918
158 315 Gondia Tirora Others 21.41 79.93 87 354 14/6/2001 402 13-14/6/2001 537 17-19/6/1918
159 315 Nagpur Deolapur Others 21.58 79.38 56 316 12/8/1986 325 12-13/8/1986 381 23-25/8/1952
160 315 Nagpur Kindsi Others 21.38 79.40 70 279 12/7/1942 304 12-13/7/1942 311 11-13/7/1942
161 315 Nagpur Nagpur Aerodrome Obsy 21.09 79.05 61 304 12/7/1994 394 12-13/7/1994 427 11-13/7/1994
162 315 Nagpur Nagpur Govt.Farm Others 21.15 79.07 38 304 12/7/1994 394 12-13/7/1994 427 11-13/7/1994
163 315 Nagpur Nagpur Meyo Hosp Obsy 21.10 79.12 101 315 12/6/1911 402 12-13/6/1911 412 11-13/6/1911
164 315 Nagpur Perseoni Others 21.37 79.15 78 319 12/7/1942 491 18-19/7/2000 559 18-20/7/2000
165 315 Nagpur Ramtek Others 21.40 79.33 100 288 17/7/1985 370 28-29/8/1906 419 17-19/7/2000
166 315 Nagpur Saoner Others 21.38 78.92 96 239 9/8/1999 264 5-6/9/1994 277 8-10/7/1973
167 315 Nagpur Tharsa Others 21.23 79.38 73 222 7/9/1937 233 6-7/9/1937 264 17-19/6/1927
168 315 Nagpur Umrer Others 20.85 79.33 102 330 14/8/1953 346 4-5/8/1953 403 14-16/8/1953
169 315 Seoni Ari Tank Others 21.95 79.72 27 327 30/7/1968 339 29-30/7/1968 343 29-31/7/1968
170 315 Seoni Bori Others 22.07 79.70 53 295 9/8/1979 341 9-10/8/1979 354 8-10/8/1979
171 315 Seoni Chinchbund Others 21.93 79.73 28 220 9/8/1979 302 9-10/8/1979 312 8-10/8/1979
172 315 Seoni Keolari Others 22.38 79.90 77 266 19/8/2002 394 18-19/8/2002 464 18-20/8/2002
173 315 Seoni Roomal Others 22.32 80.07 76 298 14/8/1968 416 14-15/8/1968 475 24-26/7/1927
174 315 Seoni Seoni Obsy 22.08 79.55 107 282 2/8/1913 351 1-2/8/1913 352 1-3/8/1913
175 315 Wardha Kharangha Others 20.90 78.48 24 213 30/7/1991 247 30-31/7/1991 247 30/7-1/8/1991
176 316 Bastar Gidem Hydro 19.00 81.40 23 164 11/7/1998 206 26-27/7/1992 259 24-26/6/1983
177 316 Bastar Jagdalpur Obsy 19.08 82.03 98 260 17/6/1974 344 24-25/7/1929 362 22-24/8/1929
178 316 Bastar Keskal Others 20.08 81.60 57 260 9/8/1981 330 1-2/8/1942 385 1-3/8/1942
179 316 Bastar Kondagaon Hydro 19.60 81.65 26 248 23/7/1995 302 22-23/7/1995 327 21-23/7/1995
180 316 Bastar Kondagaon Others 19.60 81.65 57 248 24/7/1995 303 23-24/7/1995 333 19-21/9/1945
181 316 Bastar Narayanpur Others 19.72 81.25 58 254 12/8/1945 304 27-28/7/1992 343 26-28/7/1992
182 316 Dantewara Bhopalpatnam Others 18.87 80.38 56 275 28/6/1975 363 30-31/8/1958 406 29-31/8/1958
183 316 Dantewara Bijapur Others 18.78 80.82 55 362 26/7/1988 612 25-26/7/1988 792 24-26/7/1988
184 316 Dantewara Dantewara Others 18.88 81.35 50 355 21/7/1976 704 20-21/7/1976 805 19-21/7/1976
185 316 Kanker Antagarh Others 20.10 81.17 49 342 9/8/1981 433 10-11/7/1994 481 9-11/7/1994
186 316 Kanker Bhanupratappur Others 20.32 81.08 56 291 4/8/1981 404 27-28/7/1992 461 26-28/7/1992
187 316 Koraput Koraput Obsy 18.81 82.71 39 235 30/6/1959 359 29-30/6/1959 410 28-30/6/1959
188 316 Koraput Koraput Others 18.82 82.72 86 337 25/6/1914 504 24-25/6/1914 582 24-26/6/1914
189 316 Nowrangapur Dabugaon Farm Others 19.45 82.40 32 350 1/10/1973 625 1-2/10/1973 650 1-3/10/1973
190 316 Nowrangapur Nawarangpur Others 19.23 82.55 88 384 3/7/2006 638 3-4/7/2006 653 2-4/7/2006
191 316 Nowrangapur Nowrangpur Hydro 19.22 82.58 24 384 3/7/2006 638 3-4/7/2006 653 2-4/7/2006
192 317 Bastar Bailadila Obsy 18.63 81.27 23 292 19/6/1999 571 17-18/6/1996 575 17-19/6/1996
193 317 Dantewara Konta Others 17.80 81.38 56 275 19/8/1981 357 3-4/8/1981 366 3-5/8/1981

Study Area and its Climatology
PMP Atlas for Mahanadi and Adjoining River Basins Page 59 of 260
Sr. No.
Catchment No.
District Station Type Lat
(Deg) Long (Deg)
Data Length (Years)
1-Day Highest Rainfall 2-Day Highest Rainfall 3-Day Highest Rainfall
Rainfall (mm)
Date Rainfall
(mm) Date
Rainfall (mm)
Date
194 317 Dantewara Sukma Others 18.38 81.67 56 267 19/6/1996 402 24-25/9/1990 405 23-25/9/1990
195 317 Dhenkanal Padwa Others 18.38 82.67 56 249 19/9/1911 296 24-25/6/1914 362 24-26/6/1914
196 317 East Godavari Alamur/Alamar Rev 16.77 81.88 94 388 19/9/1908 458 25-26/9/1908 468 24-26/9/1908
197 317 East Godavari Alamuru Pwd 16.77 81.88 50 281 19/7/1989 369 24-25/9/1979 394 23-25/9/1979
198 317 East Godavari Amalapuram Rev 16.57 82.00 105 386 19/11/1996 425 10-11/9/1950 456 9-11/9/1950
199 317 East Godavari Annampally Pwd 16.67 82.08 38 321 19/10/1958 384 18-19/10/1958 422 18-20/10/1958
200 317 East Godavari Bobberlanka Pwd 16.92 81.75 33 251 19/11/1977 294 12-13/8/1986 294 12-14/8/1986
201 317 East Godavari Coringa/Corinza Rev 16.80 82.23 83 398 19/10/1902 590 29-30/10/1902 731 29-31/10/1902
202 317 East Godavari Dowleshwaram Pwd 16.92 81.78 35 257 19/6/1996 389 10-11/5/1990 447 9-11/5/1990
203 317 East Godavari Gopalapuram Pwd 17.08 81.55 39 358 19/7/1989 373 22-23/7/1989 424 28-30/8/1962
204 317 East Godavari Kothapeta Rev 16.72 81.90 92 360 19/7/1989 492 15-16/6/1907 543 15-17/6/1907
205 317 East Godavari Kulla Pwd 16.67 81.92 40 248 19/7/1989 334 23-24/9/1979 351 3-5/7/1958
206 317 East Godavari Mondepulanka Pwd 16.57 81.88 39 225 19/11/1976 415 26-27/11/1976 440 26-28/11/1976
207 317 East Godavari Mukkamala Pwd 16.75 81.80 38 266 19/7/1989 300 16-17/10/1962 311 16-18/10/1962
208 317 East Godavari Mummidivaram Rev 16.65 82.12 102 414 19/10/1995 523 2-3/6/1941 575 1-3/6/1941
209 317 East Godavari R.Chodavaram Rev 17.45 81.78 86 258 19/10/1933 410 12-13/8/1986 421 12-14/8/1986
210 317 East Godavari Rajahmundry Rev 17.00 81.77 100 334 19/9/1908 380 25-26/9/1908 428 9-11/5/1990
211 317 East Godavari Ralli Pwd 16.82 81.82 38 630 19/9/1988 655 23-24/7/1989 675 22-24/7/1989
212 317 East Godavari Ramachandrapuram Rev 16.83 82.03 88 369 19/9/1908 441 26-27/9/1908 454 26-28/9/1908
213 317 East Godavari Razole/Rajole Rev 16.47 81.83 94 271 19/11/1923 392 29-30/10/1902 418 29-31/10/1902
214 317 East Godavari Sakhinetipalli Pwd 16.33 81.73 39 300 19/7/1989 350 1-2/11/1994 426 1-3/11/1994
215 317 East Godavari Vella Pwd 16.75 82.00 40 287 19/7/1989 390 10-11/5/1990 495 9-11/5/1990
216 317 East Godavari Yerrapothavaram Pwd 16.77 82.10 40 278 19/5/1990 451 10-11/5/1990 586 9-11/5/1990
217 317 Khammam Allipalli Pwd 17.50 80.50 27 152 19/8/1986 231 12-13/8/1986 246 12-14/8/1986
218 317 Khammam B'Chalam/Kothagu Obsy 17.67 80.73 55 231 19/9/2005 342 12-13/8/1986 369 11-13/5/1990
219 317 Khammam Bhadrachalam Hydro 17.67 80.88 24 285 19/10/1983 410 11-12/8/1986 421 10-12/8/1986
220 317 Khammam Bhadrachalam Rev 17.67 80.90 103 314 19/6/1996 413 12-13/8/1986 425 11-13/8/1986
221 317 Khammam Burgampad Rev 17.63 80.87 49 287 19/9/2005 370 12-13/8/1986 382 11-13/8/1986
222 317 Khammam Dummugudem Pwd 17.83 80.90 45 230 19/6/1996 387 12-13/8/1986 405 11-13/8/1986
223 317 Khammam Edira/Cherla Pwd 18.08 80.82 25 234 19/6/1953 301 19-20/6/1953 311 18-20/6/1953
224 317 Khammam Gundala Pwd 17.33 80.67 37 165 19/6/1996 221 24-25/7/1977 239 23-25/7/1977
225 317 Khammam Kinnerasami/Pjt Pwd 17.72 80.67 21 209 19/8/1986 364 12-13/8/1986 376 12-14/8/1986
226 317 Khammam Kothagudem Rev 17.55 80.63 38 217 19/9/2005 326 12-13/8/1986 352 12-14/8/1986
227 317 Khammam Nuguru/Venkitapu Rev 18.33 80.55 72 442 19/7/1988 645 29-30/7/1988 753 29-31/7/1988
228 317 Khammam Palancha/Kotncha Pwd 17.58 80.70 34 206 19/8/1981 313 12-13/8/1986 324 12-14/8/1986
229 317 Khammam Perur Hydro 18.55 80.38 28 356 19/7/2000 544 29-30/7/1988 589 29-31/7/1988
230 317 Khammam Singabupalayam Pwd 17.47 80.57 49 286 19/10/1983 343 3-4/8/1981 365 2-4/8/1981
231 317 Khammam Thanikalla Pwd 18.25 80.23 37 301 19/5/1969 401 19-20/5/1969 451 18-20/5/1969

Study Area and its Climatology
PMP Atlas for Mahanadi and Adjoining River Basins Page 60 of 260
Sr. No.
Catchment No.
District Station Type Lat
(Deg) Long (Deg)
Data Length (Years)
1-Day Highest Rainfall 2-Day Highest Rainfall 3-Day Highest Rainfall
Rainfall (mm)
Date Rainfall
(mm) Date
Rainfall (mm)
Date
232 317 Koraput Jeypore Others 18.85 82.57 85 327 19/8/1910 478 28-29/6/2007 618 27-29/6/2007
233 317 Koraput Pottangi Others 18.57 82.97 84 546 19/10/1931 570 13-14/10/1931 605 12-14/10/1931
234 317 Koraput Similaguda Others 18.70 82.86 32 241 19/8/2006 428 3-4/8/2006 493 2-4/8/2006
235 317 Malkangiri Malkangiri Others 18.35 81.90 92 306 19/6/1907 424 3-4/8/2006 505 3-5/8/2006
236 317 Visakhapatnam Araku Vally Rev 18.33 82.85 38 229 19/7/1960 349 30/6-1/7/1960 366 29/6-1/7/1960
237 317 Visakhapatnam Chintapalli Rev 17.87 82.35 70 380 5/11/1990 659 10-11/5/1990 741 10-12/5/1990
238 317 Visakhapatnam Paderu Rev 18.08 82.67 40 357 5/11/1990 694 10-11/5/1990 838 10-12/5/1990
239 317 Warangal Kothagudem Pwd 18.07 80.40 25 226 19/7/1976 287 21-22/7/1976 313 20-22/7/1976
240 317 Warangal Laknavaram Pwd 18.20 80.10 30 270 19/8/1986 354 12-13/8/1986 378 12-14/8/1986
241 317 West Godavari Chettipeta Pwd 16.87 81.67 38 390 19/7/1989 405 22-23/7/1989 425 9-11/5/1990
242 317 West Godavari Koderu Pwd 16.58 81.87 46 422 19/7/1989 484 12-13/8/1986 633 9-11/5/1990
243 317 West Godavari Kovvur Rev 17.02 81.73 93 248 19/7/1989 372 10-11/5/1990 418 9-11/5/1990
244 317 West Godavari Lakshmipalem Pwd 16.48 81.82 40 325 19/7/1989 500 12-13/8/1986 547 11-13/8/1986
245 317 West Godavari Narsapur Rev 16.43 81.70 99 280 19/10/1944 363 12-13/8/1986 391 11-13/8/1986
246 317 West Godavari Nidadavole Obsy 16.90 81.67 45 390 19/7/1989 408 23-24/7/1989 424 22-24/7/1989
247 317 West Godavari Palakole Rev 16.52 81.73 35 190 19/11/1977 228 5-6/10/1972 298 4-6/10/1972
248 317 West Godavari Penugonda Rev 16.65 81.75 91 325 19/7/1989 345 22-23/7/1989 354 21-23/7/1989
249 317 West Godavari Polavaram Rev 17.25 81.65 104 259 19/10/1933 353 10-11/5/1990 403 10-12/5/1990
250 317 West Godavari Sidhantam Pwd 16.67 81.80 40 450 19/7/1989 467 22-23/7/1989 472 9-11/5/1990
251 317 West Godavari Tanuku Rev 16.75 81.72 95 321 19/7/1989 405 12-13/8/1986 438 9-11/5/1990
252 317 West Godavari Vijjeshwaram Pwd 16.92 81.70 27 191 19/7/1989 210 7-8/10/1972, 23-
24/7/1989 236 5-7/10/1972
253 323 Bankura Ambikanagar Others 22.93 86.77 24 150 9/8/1929 209 8-9/8/1929 225 24-26/8/1944
254 323 Bankura Bankura Obsy 23.23 87.07 96 292 22/06/1922 452 23-24/6/1992 709 23-25/6/1992
255 323 Bankura Chatna Others 23.30 86.97 44 295 22/06/1922 305 22-23/6/1922 470 20-22/6/1922
256 323 Bankura Indas Others 23.15 87.63 73 330 25/09/1956 394 29-30/9/1978 414 29/9-
1/10/1978
257 323 Bankura Indpur Others 23.17 86.93 49 308 3/8/1922 351 2-3/8/1922 479 19-21/6/1922
258 323 Bankura Joypur Others 23.07 87.45 54 191 30/09/1959 268 2-3/8/1922 317 1-3/8/1922
259 323 Bankura Khatra Others 22.98 86.85 63 292 1/9/1907 404 1-2/9/1907 416 1-3/9/1907
260 323 Bankura Kotalpur Others 23.02 87.60 58 290 28/07/1905 339 28-29/7/1905 372 27-29/7/1905
261 323 Bankura Onda Others 23.13 87.20 57 239 26/07/1951 243 26-27/7/1951 243 25-27/7/1951
262 323 Bankura Patrasayar Others 23.20 87.53 24 234 10/8/1950 391 10-11/8/1950 391 9-11/8/1950
263 323 Bankura Ranibandh Others 22.88 86.78 59 200 23/07/1998 257 1-2/8/1968 330 1-3/8/1968
264 323 Bankura Salbundh/J.Puri Others 23.13 87.25 41 202 30/06/1936 233 29-30/6/1936 292 6-8/7/1930
265 323 Bankura Saranga Others 22.75 87.03 42 335 9/8/1929 350 9-10/8/1929 387 9-11/8/1929
266 323 Bankura Simlapal Others 22.92 87.07 49 403 7/8/1969 577 8-9/7/1968 591 7-9/7/1968
267 323 Bankura Taldangra Others 23.03 87.10 53 597 10/8/1950 749 9-10/8/1950 820 9-11/8/1950

Study Area and its Climatology
PMP Atlas for Mahanadi and Adjoining River Basins Page 61 of 260
Sr. No.
Catchment No.
District Station Type Lat
(Deg) Long (Deg)
Data Length (Years)
1-Day Highest Rainfall 2-Day Highest Rainfall 3-Day Highest Rainfall
Rainfall (mm)
Date Rainfall
(mm) Date
Rainfall (mm)
Date
268 323 Bankura Vishnupur Others 23.08 87.32 63 344 30/08/1909 520 29-30/8/1909 530 29-31/8/1909
269 323 Hoogly Arambagh Others 22.88 87.78 83 290 3/9/1991 400 24-25/7/1995 442 27-29/7/1905
270 323 Hoogly Khanakul Others 22.72 87.83 34 236 11/5/1931 324 22-23/6/1933 390 15-17/9/1959
271 323 Hoogly Tentulia Others 22.78 87.83 26 288 25/09/1956 376 25-26/9/1956 398 24-26/9/1956
272 323 Manbhum Purulia Bandwan Others 22.88 86.50 50 245 17/09/1959 344 28-29/6/1953 363 28-30/6/1953
273 323 Manbhum Purulia Barabazar Others 23.03 86.42 66 245 19/08/1944 412 29-30/6/1953 433 29/6-1/7/1953
274 323 Manbhum Purulia Manbazar Others 23.07 86.65 58 242 11/7/1942 350 25-26/7/1924 384 9-11/7/1942
275 323 Manbhum Purulia Purulia Obsy 23.33 86.42 54 191 19/10/1999 298 26-27/9/1992 328 31/8-2/9/1978
276 323 Manbhum Purulia Purulia Others 23.33 86.38 55 259 10/11/1953 296 10-11/11/1953 301 10-12/11/1953
277 323 Midnapore Amlagora Others 22.77 87.33 52 262 30/08/1909 367 29-30/8/1909 372 29-31/8/1909
278 323 Midnapore Balichak Others 22.37 87.55 38 267 5/6/1927 321 14-15/8/1926 357 14-16/8/1926
279 323 Midnapore Bhagwanpur Others 22.12 87.75 60 297 22/10/1945 318 21-22/10/1945 400 20-22/10/1945
280 323 Midnapore Chandrakona Others 22.73 87.52 53 222 25/06/1907 319 18-19/6/1908 363 18-20/6/1908
281 323 Midnapore Contai Obsy 21.78 87.75 55 447 3/9/1967 474 2-3/9/1967 564 24-26/9/1986
282 323 Midnapore Contai Others 21.78 87.75 49 318 29/06/1945 520 8-9/10/1941 573 8-10/10/1941
283 323 Midnapore Digha Obsy 21.83 87.78 24 400 18/06/1996 441 24-25/9/1986 524 24-26/9/1986
284 323 Midnapore Ghatal Others 22.65 87.72 60 252 2/8/1922 281 1-2/8/1922 324 18-20/6/1908
285 323 Midnapore Goalfore Others 22.70 87.18 39 291 28/08/1940 318 27-28/8/1940 335 27-29/8/1940
286 323 Midnapore Haldia Obsy 22.07 88.07 25 295 5/6/1984 475 25-26/9/1986 552 24-26/9/1986
287 323 Midnapore Henria Others 21.98 87.80 34 317 13/09/1958 338 27-28/5/1960 348 26-28/5/1960
288 323 Midnapore Kharagpore Others 22.33 87.33 47 291 16/10/1942 302 13-14/9/1958 329 2-4/8/1969
289 323 Midnapore Kharagpore I.I.T Hydro 22.33 87.32 21 314 27/08/1972 324 26-27/8/1972 330 26-28/8/1972
290 323 Midnapore Kolaghat Others 22.43 87.87 48 241 25/08/1968 331 17-18/8/1941 364 9-11/9/1959
291 323 Midnapore Kukrahati Others 22.12 88.10 60 293 30/09/1959 337 18-19/7/1933 465 17-19/7/1933
292 323 Midnapore Midnapore Obsy 22.42 87.32 105 325 17/10/1942 343 16-17/10/1942 371 14-16/8/1974
293 323 Midnapore Mohanpur Others 21.87 87.43 45 262 11/8/1993 406 8-9/10/1941 495 7-9/10/1941
294 323 Midnapore Moyna Others 22.23 87.80 42 241 10/6/1950 277 10-11/6/1950 327 10-12/6/1950
295 323 Midnapore Nandigram Others 22.03 87.97 53 262 28/06/1994 293 4-5/6/1913 394 4-6/6/1913
296 323 Midnapore Narajole Others 22.57 87.60 37 193 1/7/1928 279 20-21/7/1926 320 19-21/7/1926
297 323 Midnapore Narayangarh Others 22.17 87.37 48 335 19/08/1953 344 19-20/8/1953 410 26-28/5/1911
298 323 Midnapore Pachet/Kharai Others 22.03 87.30 52 267 29/07/1927 445 27-28/8/1940 447 26-28/8/1940
299 323 Midnapore Panskura Others 22.42 87.72 67 250 30/09/1971 266 29-30/9/1971 340 1-3/6/1956
300 323 Midnapore Pingla Others 22.25 87.58 48 205 6/8/1997 258 21-22/7/1991 330 20-22/7/1991
301 323 Midnapore Ramnagar Others 21.70 87.55 50 279 9/7/1942 423 7-8/10/1941 472 7-9/10/1941
302 323 Midnapore Tamluk Others 22.30 87.92 71 480 9/7/1964 831 9-10/7/1964 851 9-11/7/1964
303 324 Bankura Barjora Others 23.43 87.30 46 178 26/08/1944 282 25-26/8/1944 293 25-27/8/1944
304 324 Bankura Gangajalghati Others 23.43 87.12 60 276 30/07/1937 304 25-26/8/1944 367 20-22/6/1922
305 324 Bankura Majhia Others 23.57 87.12 38 177 17/09/1946 257 17-18/9/1946 280 14-16/7/1943

Study Area and its Climatology
PMP Atlas for Mahanadi and Adjoining River Basins Page 62 of 260
Sr. No.
Catchment No.
District Station Type Lat
(Deg) Long (Deg)
Data Length (Years)
1-Day Highest Rainfall 2-Day Highest Rainfall 3-Day Highest Rainfall
Rainfall (mm)
Date Rainfall
(mm) Date
Rainfall (mm)
Date
306 324 Bankura Maliara Others 23.42 87.17 46 218 2/7/1931 246 2-3/7/1931 352 20-22/6/1922
307 324 Bankura Palasdanga Others 23.40 87.38 44 277 17/09/1946 420 26-27/9/1956 439 25-27/9/1956
308 324 Bankura Raipur Others 22.80 86.95 43 222 18/08/1941 286 17-18/8/1941 302 16-18/8/1941
309 324 Bankura Saltora Others 23.53 86.93 47 267 8/7/1928 327 8-9/7/1928 383 19-21/6/1922
310 324 Bankura Sonamukhi Others 23.30 87.42 64 225 28/09/1978 400 27-28/9/1978 454 27-29/9/1978
311 324 Bokaro Chandankiary Others 23.58 86.37 33 325 26/07/1968 335 25-26/7/1968 347 14-16/7/1994
312 324 Bokaro Chas Others 23.63 86.17 94 232 12/8/1935 259 25-26/9/1902 313 4-6/9/1970
313 324 Bokaro Gomia Others 23.78 85.83 40 240 24/06/1996 273 1-2/9/1978 311 22-24/6/1996
314 324 Bokaro Jaridih Others 23.58 86.00 26 156 10/7/1987 184 26-27/9/1978 189 26-28/9/1978
315 324 Bokaro Peterbar Hydro 23.58 85.82 47 374 18/07/1957 576 18-19/7/1957 576 17-19/7/1957
316 324 Burdwan Asansol Obsy 23.68 86.98 71 270 16/07/1943 355 26-27/9/1956 366 25-27/9/1956
317 324 Burdwan Burdwan Obsy 23.23 87.85 87 305 26/09/1956 426 29-30/8/1909 457 20-22/6/1922
318 324 Burdwan Rendia Hydro 23.43 87.37 33 283 28/09/1978 515 27-28/9/1978 541 27-29/9/1978
319 324 Chatra Itkhori Others 24.30 85.17 40 221 16/09/1976 365 16-17/9/1976 403 16-18/9/1976
320 324 Chatra Tandwa Others 23.87 85.03 74 259 9/9/1925 412 9-10/9/1925 437 16-18/9/1976
321 324 Dhanbad Bliapur Others 23.67 86.50 27 608 27/09/1995 639 26-27/9/1995 645 25-27/9/1995
322 324 Dhanbad Dhanbad Obsy 23.78 86.43 56 234 27/09/1978 278 26-27/9/1978 327 12-14/8/1935
323 324 Dhanbad Dhanbad Others 23.80 86.43 81 272 8/8/1913 374 7-8/8/1913 463 7-9/8/1913
324 324 Dhanbad Gobindpur Others 23.83 86.53 94 287 27/08/1980 310 7-8/8/1913 366 6-8/8/1913
325 324 Dhanbad Jharia Others 23.67 86.42 27 195 27/09/1995 237 26-27/9/1995 256 26-28/9/1995
326 324 Dhanbad Nirsa Others 23.78 86.72 49 212 28/09/1978 277 10-11/9/1951 292 8-10/8/1969
327 324 Dhanbad Pokhuria Others 23.92 86.62 27 115 8/8/1942 200 22-23/9/1916 245 11-13/8/1935
328 324 Dhanbad Topchanchi Others 23.92 86.20 85 274 27/09/1995 316 17-18/7/1975 340 23-25/9/1999
329 324 Dhanbad Tundi Others 23.98 86.45 81 270 2/7/2002 291 1-2/7/2002 318 23-25/9/1999
330 324 Giridih Bagodar I Others 24.08 85.83 92 254 19/07/1943 300 19-20/7/1943 380 10-12/7/1974
331 324 Giridih Birni Others 24.25 85.92 29 375 21/09/2000 456 20-21/9/2000 504 26-28/7/1986
332 324 Giridih Deori Others 24.50 86.17 31 397 1/7/1985 471 1-2/7/1985 484 1-3/7/1985
333 324 Giridih Dhanwar Others 24.42 85.98 78 232 8/6/1941 345 16-17/7/1975 390 16-18/7/1975
334 324 Giridih Dumri Others 23.98 86.02 64 403 18/07/1975 682 18-19/7/1975 767 17-19/7/1975
335 324 Giridih Gandey Others 24.15 86.45 38 307 3/10/1963 864 28-29/6/1980 878 28-30/6/1980
336 324 Giridih Giridih Others 24.17 86.30 28 403 27/08/1980 431 26-27/8/1980 532 24-26/6/1984
337 324 Giridih Jamua Others 24.17 86.05 26 260 22/09/2000 458 21-22/9/2000 501 20-22/9/2000
338 324 Hazaribagh Barhi Others 24.30 85.42 100 295 4/8/1943 372 4-5/8/1943 441 30/7-1/8/1917
339 324 Hazaribagh Barkagaon I Others 23.87 85.22 33 316 16/09/1976 450 16-17/9/1976 481 16-18/9/1976
340 324 Hazaribagh Barkatha Others 24.17 85.63 32 940 6/10/1978 1100 6-7/10/1978 1199 5-7/10/1978
341 324 Hazaribagh Bishungarh Others 24.03 85.75 32 241 5/10/1978 327 4-5/10/1978 333 17-19/7/1969
342 324 Hazaribagh Chauparan Others 24.38 85.25 30 238 16/06/1968 376 15-16/6/1968 473 15-17/6/1968
343 324 Hazaribagh Gola Others 23.55 85.72 80 245 11/6/1946 348 9-10/6/1947 370 9-11/6/1947

Study Area and its Climatology
PMP Atlas for Mahanadi and Adjoining River Basins Page 63 of 260
Sr. No.
Catchment No.
District Station Type Lat
(Deg) Long (Deg)
Data Length (Years)
1-Day Highest Rainfall 2-Day Highest Rainfall 3-Day Highest Rainfall
Rainfall (mm)
Date Rainfall
(mm) Date
Rainfall (mm)
Date
344 324 Hazaribagh Hazaribagh Obsy 23.98 85.37 105 249 24/06/1911 317 1-2/8/1917 358 2-4/8/1943
345 324 Hazaribagh Ichak Others 24.42 85.75 30 226 6/7/1986 335 29-30/6/1986 477 28-30/6/1986
346 324 Hazaribagh Mandu Others 23.80 85.47 34 261 6/7/1986 306 23-24/6/1996 358 6-8/7/1986
347 324 Hazaribagh Pachamba Others 24.20 86.30 73 301 12/6/1949 326 11-12/6/1949 327 10-12/6/1949
348 324 Hazaribagh Ramgarh Others 23.63 85.52 83 229 6/10/1917 356 5-6/10/1917 381 4-6/10/1917
349 324 Howrah Amta Others 22.58 88.02 71 305 2/8/1922 401 6-7/7/1926 449 5-7/7/1926
350 324 Kodarma Kodarma Others 24.45 85.53 83 313 1/8/1947 332 31/7-1/8/1947 347 1-3/9/1907
351 324 Latehar Chandwa Others 23.68 84.73 77 225 23/07/1991 281 5-6/8/1997 332 29-31/7/1937
352 324 Lohardaga Kuru Others 23.55 84.82 41 252 18/07/1975 357 17-18/7/1975 432 17-19/7/1975
353 324 Manbhum Purulia Jaipur Others 23.43 86.13 20 195 25/09/1936 200 25-26/9/1936 209 18-20/7/1943
354 324 Manbhum Purulia Para Others 23.53 86.52 33 168 14/09/1958 191 14-15/9/1958 246 2-4/7/1953
355 324 Manbhum Purulia Raghunathpur Others 23.55 86.67 69 269 7/9/1954 280 7-8/9/1954 307 7-9/8/1913
356 414 Arwal Arwal Others 25.23 84.68 90 267 22/07/1919 336 11-12/7/1997 471 11-13/7/1997
357 414 Aurangabad Barun Others 24.83 84.17 33 300 9/7/1976 382 12-13/9/1987 490 11-13/9/1987
358 414 Aurangabad Daudnagar(Haspu) Others 25.05 84.40 98 252 11/9/1987 429 9-10/8/1913 533 8-10/8/1913
359 414 Bilaspur Pendra Road Obsy 22.77 81.90 101 262 18/08/1953 285 17-18/8/1953 344 8-10/7/1961
360 414 Chatra Simaria Others 24.07 84.92 29 238 10/7/1968 337 9-10/7/1968 361 9-11/7/1968
361 414 Dindori Shahpura Others 23.18 80.70 85 279 25/06/1946 443 20-21/9/1926 702 19-21/9/1926
362 414 Garhwa Bhandaria Others 23.72 83.83 77 250 18/06/1994 462 17-18/6/1994 517 17-19/6/1994
363 414 Garhwa Bhavnathpur Others 24.38 83.58 79 500 11/2/1990 501 10-11/2/1990 508 11-13/2/1990
364 414 Garhwa Garhwa Others 24.17 83.80 86 229 28/07/1906 306 27-28/7/1906 396 30/7-1/8/1913
365 414 Garhwa Nagerutari Others 24.28 83.50 82 217 22/08/1933 333 20-21/6/1911 349 20-22/6/1911
366 414 Garhwa Ranka Others 24.00 83.83 83 307 7/8/1920 331 18-19/6/1994 374 1-3/9/2000
367 414 Gumla Bishnupur Others 23.38 84.38 64 259 30/08/1944 278 29-30/8/1944 295 16-18/9/1976
368 414 Gumla Ghaghra Others 23.42 84.50 38 228 24/10/2003 345 16-17/7/1975 390 16-18/7/1975
369 414 Jabalpur Amari Others 23.82 80.55 58 211 16/07/1961 273 24-25/8/1937 318 24-26/6/1946
370 414 Jabalpur Khitoli Others 23.72 80.83 58 217 11/7/1959 304 18-19/8/1953 351 23-25/8/1937
371 414 Jabalpur Murwara(Kathi) Others 23.85 80.40 84 280 25/06/1982 410 25-26/6/1982 410 24-26/6/1982
372 414 Jabalpur Niwar(Amehta) Others 23.72 80.38 59 317 27/07/1983 358 27-28/7/1983 371 26-28/7/1983
373 414 Katni Bijeraghogarh Others 23.98 80.60 69 365 1/9/1926 460 31/8-1/9/1926 496 31/8-2/9/1926
374 414 Korea Janakpur Others 23.72 81.82 42 248 15/09/1993 322 11-12/7/1998 360 10-12/7/1998
375 414 Latehar Balumath Others 23.83 84.78 96 316 19/07/1949 368 24-25/8/1907 400 20-22/7/1920
376 414 Latehar Barwadih Others 23.85 84.12 58 235 15/09/1993 324 9-10/9/1956 393 9-11/9/1956
377 414 Latehar Latehar Hydro 23.75 84.50 24 193 26/06/1993 800 27-28/5/1997 800 26-28/5/1997
378 414 Latehar Latehar Others 23.75 84.50 87 333 28/07/1953 353 28-29/7/1953 381 16-18/7/1975
379 414 Latehar Mahuadaur Others 23.40 84.13 96 364 27/06/1923 405 26-27/6/1923 405 25-27/6/1923
380 414 Mirzapur Chopan Hydro 24.48 83.00 24 200 2/2/2004 285 11-12/7/1999 325 1-3/9/2000
381 414 Nawadah Sirdala Others 24.10 84.08 29 299 8/7/1968 310 8-9/7/1968 335 8-10/7/1968

Study Area and its Climatology
PMP Atlas for Mahanadi and Adjoining River Basins Page 64 of 260
Sr. No.
Catchment No.
District Station Type Lat
(Deg) Long (Deg)
Data Length (Years)
1-Day Highest Rainfall 2-Day Highest Rainfall 3-Day Highest Rainfall
Rainfall (mm)
Date Rainfall
(mm) Date
Rainfall (mm)
Date
382 414 Palamau Bishrampur Others 24.25 83.93 84 238 28/08/1991 310 17-18/6/1994 365 1-3/8/1917
383 414 Palamau Daltonganj Obsy 24.05 84.07 104 291 23/07/1920 507 22-23/7/1920 541 22-24/7/1920
384 414 Palamau Garu Others 23.67 84.23 79 356 20/06/1911 402 29-30/7/1927 476 29-31/7/1927
385 414 Palamau Hussainabad Others 24.53 84.02 78 227 23/09/1962 336 23-24/9/1962 358 14-16/9/1905
386 414 Palamau Japla Hydro 24.58 83.97 28 181 11/9/1987 298 11-12/9/1987 448 11-13/9/1987
387 414 Palamau Lesliganj Others 24.05 84.22 91 255 10/8/1991 333 16-17/9/1976 453 16-18/9/1976
388 414 Palamau Netarhat Others 23.48 84.27 55 429 19/07/1964 436 19-20/7/1964 441 19-21/7/1964
389 414 Palamau Panki Others 24.05 84.47 79 322 2/8/1917 405 1-2/8/1917 459 1-3/8/1917
390 414 Palamau Patan Others 24.22 84.18 83 324 19/08/1907 371 25-26/6/1945 444 15-17/9/1976
391 414 Rohtas Akbarpur Others 24.63 83.97 62 217 14/08/1935 320 10-11/9/1936 355 11-13/8/1950
392 414 Rohtas Dehri Obsy 24.92 84.18 89 255 14/08/1910 436 13-14/6/1961 518 8-10/8/1913
393 414 Rohtas Inderpuri Hydro 24.92 84.12 26 165 15/07/1977 280 12-13/9/1987 390 11-13/9/1987
394 414 Rohtas Nauhatta Others 24.50 83.75 31 300 9/8/1988 310 8-9/8/1988 402 9-11/8/1982
395 414 Rohtas Nauka Others 24.08 82.75 30 381 2/7/1983 610 2-3/7/1983 762 2-4/7/1983
396 414 Rohtas Rohtas Others 24.58 83.92 31 211 25/09/1978 415 25-26/9/1978 488 11-13/9/1987
397 414 Shahdol Anuppur Others 23.12 81.70 22 263 25/07/1996 351 25-26/7/1996 351 24-26/7/1996
398 414 Shahdol Beohari Others 24.03 81.37 62 250 10/8/1975 370 19-20/8/1975 550 20-22/8/1975
399 414 Shahdol Pushparajgarh Others 22.90 81.55 57 419 25/06/1946 514 24-25/6/1946 523 23-25/6/1946
400 414 Shahdol Sohagpur Others 23.32 81.35 99 307 18/08/1923 556 18-19/8/1923 597 19-21/9/1926
401 414 Sidhi Jaiwan Others 24.33 82.27 41 239 24/09/1962 352 31/8-1/9/1997 437 23-25/9/1962
402 414 Sidhi Sidhi Obsy 24.42 81.87 46 308 1/9/1997 352 7-8/6/1971 421 7-9/6/1971
403 414 Sidhi Sidhi Others 24.40 81.88 97 308 1/9/1997 474 1-2/8/1917 563 31/7-2/8/1917
404 414 Sidhi Singrauli Others 24.02 82.58 34 187 18/09/1994 212 17-18/9/1994 310 31/7-2/8/1996
405 414 Sonbhadra Dudhi Others 24.22 83.25 102 193 12/8/1910 293 20-21/6/1911 381 20-22/6/1911
406 414 Surguja Ambikapur Obsy 23.17 83.25 52 457 24/07/1991 631 23-24/7/1991 694 23-25/7/1991
407 414 Surguja Ambikapur Others 23.12 83.20 85 342 27/06/1945 405 26-27/6/1945 435 21-23/8/1934
408 414 Surguja Kusami Others 23.27 83.92 37 229 23/07/1991 296 23-24/7/1991 355 22-24/7/1991
409 414 Surguja Ramanujganj Others 23.80 83.70 46 320 11/9/1987 398 11-12/9/1987 550 11-13/9/1987
410 414 Surguja Surajpur Others 23.22 82.87 40 248 7/7/1993 355 13-14/8/1968 430 12-14/8/1968
411 414 Umaria Umaria Obsy 23.53 80.88 72 305 9/9/1983 418 21-22/8/1975 513 21-23/8/1975

Estimation of PMP by Physical Approach
PMP Atlas for Mahanadi and Adjoining River Basins Page 65 of 260
3 Estimation of PMP by Physical Approach
3.1 Details about PMP
3.1.1 INTRODUCTION
It has been recognized that there is a physical upper limit to the amount of precipitation that can fall over a specified area in a given time. This precipitation, associated with the physical upper limit, is known as the Probable Maximum Precipitation (PMP). The dams which require a high degree of safety are needed to be designed to pass the flood resulting from
the upper limit to precipitation. WMO (2009) defined PMP as the depth of precipitation for a
given duration that is meteorologically possible for a design watershed or a given size storm area at a particular location at a certain time of year. Such is the conceptual definition of PMP. The values derived as PMP under this definition with no allowance made for long-term climatic trends are subject to change as knowledge of the physics of atmospheric processes increases. They are also subject to change with long-term climatic variations.
Probable Maximum Precipitation (PMP) was once known as Maximum Possible Precipitation (MPP), and this latter term is found in most reports on estimates of extreme precipitation made prior to about 1950. The main reason for the name change to PMP was that MPP carried a stronger implication of physical upper limit of precipitation than does PMP, which is preferred because of the uncertainty surrounding any estimate of maximum precipitation. Procedures for estimating PMP, whether physical or statistical, are admittedly inexact, and the results are approximations.
3.1.2 THEORETICAL BACKGROUND OF PHYSICAL METHOD
There are two main approaches to estimate the PMP. The first is the physical or meteorological approach, which involves the identification of the maximum rainfall produced by severe rainstorms over the specific catchment and from other neighbouring area. Having obtained a suitable severe storm database, the process of PMP estimation involves working out Depth Area Duration (DAD), Depth Duration (DD), envelope/transposed depth, their temporal and areal distribution, and moisture adjustment parameters. The second is the statistical approach where the estimates of PMP at a particular location or point are determined from the frequency analysis of annual maximum rainfall data. This method is useful when the meteorological data for moisture maximization are not available but where there is a large amount of rainfall data.
The main assumption in the physical method is that the PMP will result from a rainstorm in which there is the optimum combination of the available moisture in the atmosphere and the efficiency of the rainstorm mechanism. Factors, which influence the rainstorm efficiency, include horizontal mass convergence, topography, induced lifting, vertical motion and the rate of condensation. Efficiency is the ability of a rainstorm to convert moisture into precipitation. The extreme observed rainfall values are then maximized by Moisture Maximization Factor (MMF) to estimate PMP. When the record of rainstorm rainfall over relatively plain area catchment is not adequate, severe rainstorms are transposed from other areas, which are meteorologically homogeneous.
3.1.3 METHODS FOR ESTIMATING PMP
As per WMO (2009), there are six methods of PMP estimation currently being used:
(a) The local method (local storm maximization or local model); (b) The transposition method (storm transposition or transposition model); (c) The combination method (temporal and spatial maximization of storm or storm
combination or combination model); (d) The inferential method (theoretical model or ratiocination model);

Estimation of PMP by Physical Approach
PMP Atlas for Mahanadi and Adjoining River Basins Page 66 of 260
(e) The generalized method (generalized estimation); (f) The statistical method (statistical estimation).
Most of these methods can be used in medium- or low-latitude areas. In the current study, primarily two methods; 1) Generalized estimation and 2) Statistical estimation have been used. The sections below give the details of the generalized method. The other associated details (storm moisture maximization, rainstorm transposition adjustments, persisting dew point temperature and maximum persisting dew temperature) with generalized method are also included in the subsequent sections. The description pertaining to statistical estimation has been covered in Chapter 4 of this report.
3.1.4 PMP BY GENERALIZED METHOD
The generalized method is used to estimate PMP for a large, meteorologically homogeneous region. The procedure involves compilation and use of observed storm rainfalls for various major events over the catchment or region. It also includes adjustments for moisture availability and topographic effects. The storm rain depths are enveloped by smoothing over a range of areas and durations. This method requires a large amount of long-term data obtained by rainfall self-recorders in the study area. This is a time-consuming and expensive process. However, the method can lead to high accuracy and easy application of PMP results. This method is applicable to watersheds under 13,000 sq. km in orographic regions
and 52,000 sq. km in non‑orographic regions, and rainfall durations up to 72 hours or less
(WMO 2009).
Approach followed in the current study is given in Figure 3-1. The procedure starts with the acquisition of daily rainfall for various rain gauge stations in and around basin/region under consideration. The rainfall data is processed to develop the relational database to facilitate queries, look ups and joining with the other data bases. The comprehensive search for medium and major storms is conducted based on the defined threshold. This gives the initial list of the storms. The storm list is finalized based on initial spatial overview, review of historical records and other factors. All the listed storms are subjected to rainstorm analysis, which includes isohyets generation and Depth- Area-Duration (DAD) analysis. In the next step, the dew point temperature data for listed storms is acquired and the storm wise persisting dew point temperatures are estimated. Using the persisting storm dew point, maximum persisting dew point, barrier elevations, a Moisture Maximization Factors (MMF) are estimated all the listed storms.
This study provides the PMP estimates for 1) various catchments in the basin and 2) grid point placed at regular intervals. These estimates are provided for the range of areas in the catchment and at the grid points for 1-day, 2-day and 3-day durations.
In case of PMP estimation for various catchments pertaining to non orographic areas, the in-situ rainstorm analysis using DAD approach and moisture maximization is applied. The rainstorm maximization includes the estimation of envelope rain depth for range of areas from all listed storms in and around the catchment. These envelope rain depths are considered as in-situ Standard Project Storm (SPS) values. The SPS values are then multiplied by the MMF of storm contributing to envelope curve for the respective area and duration to the get the PMP estimate. In case of the orographic areas, the rainstorm analysis is done using Depth-Duration (DD) analysis instead of DAD analysis before the moisture maximization.
In case of grid point PMP estimation, a grid system is constructed at 1 Degree resolution of latitudes and longitudes for non-orographic areas. In case of orographic areas, the grid system of 0.25-0.5 degrees is considered. The rainstorm maximization is done by using the DAD analysis to estimate the enveloping rain depths at each grid point for range of the areas and durations (1-3 days). Since, a rainstorm transposition is assumed in this case, the SPS values are estimated by multiplying the grid rain depths with the Transposition Adjustment Factors, TAF, (which considered the impact of location adjustment and barrier adjustments).

Estimation of PMP by Physical Approach
PMP Atlas for Mahanadi and Adjoining River Basins Page 67 of 260
Finally, the PMP estimates at each grid point are derived by multiplication of grid SPS and MMF.
Figure 3-1: PMP estimation approach used in the study
3.1.5 STORM MOISTURE MAXIMIZATION
The PMP for different durations over an area is derived by maximizing the highest rainfalls obtained from major historical rainstorms that have occurred over the area under study. This maximization consists of simply multiplying the highest rainfall values by the moisture maximization factor (MMF). The MMF for a rainstorm in a place is the ratio of precipitable water corresponding to the maximum persisting dew point temperature on record at the original location of the rainstorm in the same fortnight of the month in which the rainstorm occurred to the precipitable water corresponding to the maximum persisting dew point temperature of rainstorm. The objective of maximization is to determine the physical upper limit of rainfall, which would result if the moisture available to the storm were at maximum. Obviously, the most important factor in the moisture maximization is the estimation of moisture or precipitable water available in the atmosphere. U.S. Weather Bureau (USWB) (1960), now National Weather Service (NWS) and Reitan (1963) showed that the precipitable water or moisture in the air mass from which large precipitation occurs can be estimated from the surface dew point temperatures when saturation and pseudo-adiabatic conditions are assumed. The MMF, therefore, is determined based on 12-hour or 24-hour persisting storm dew point temperature and the maximum ever-recorded persisting dew point temperature for the area under study. The meaning and the method of determining the 12-hour or 24-hour persisting dew point temperature have been discussed in another section. Both storm dew point temperature and dew point temperature are reduced to the 1,000 hPa level (mean sea level) by using Figure 3-2, so that dew points obtained at different elevations are comparable. Figure 3-3 gives values of precipitable water (mm) between 1,000 hPa surface and various pressure levels up to 200 hPa in a saturated pseudo-adiabatic atmosphere as a function of the 1,000 hPa dew point. The dew points are converted to precipitable water by the use of Figure 3-3 or from the table (Table 8-1 in Volume II) such as those given in WMO (2009).

Estimation of PMP by Physical Approach
PMP Atlas for Mahanadi and Adjoining River Basins Page 68 of 260
Figure 3-2: Pseudo-adiabatic diagram for dew point reduction to 1,000 hPa
(Source – National Weather Service (NWS) and Reitan (1963))
Figure 3-3: Precipitable water above 1,000 hPa in saturated air mass knowing surface dew point temperature
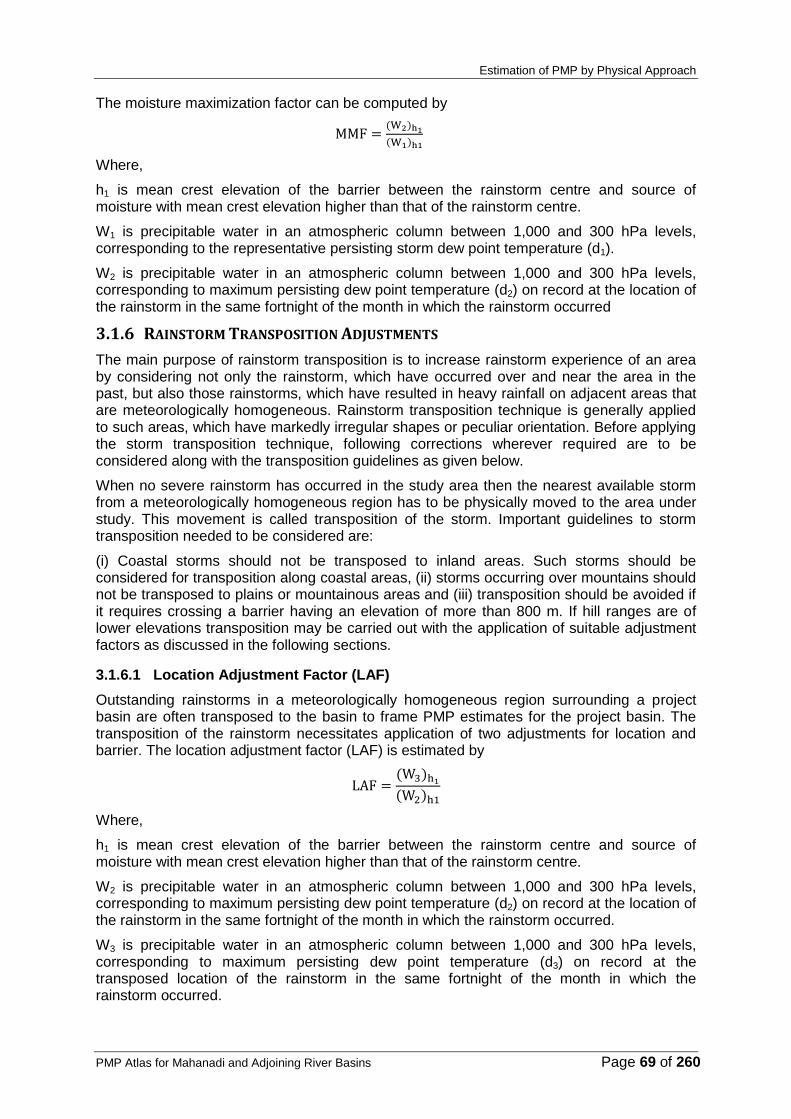
Estimation of PMP by Physical Approach
PMP Atlas for Mahanadi and Adjoining River Basins Page 69 of 260
The moisture maximization factor can be computed by
Where,
h1 is mean crest elevation of the barrier between the rainstorm centre and source of moisture with mean crest elevation higher than that of the rainstorm centre.
W1 is precipitable water in an atmospheric column between 1,000 and 300 hPa levels, corresponding to the representative persisting storm dew point temperature (d1).
W2 is precipitable water in an atmospheric column between 1,000 and 300 hPa levels, corresponding to maximum persisting dew point temperature (d2) on record at the location of the rainstorm in the same fortnight of the month in which the rainstorm occurred
3.1.6 RAINSTORM TRANSPOSITION ADJUSTMENTS
The main purpose of rainstorm transposition is to increase rainstorm experience of an area by considering not only the rainstorm, which have occurred over and near the area in the past, but also those rainstorms, which have resulted in heavy rainfall on adjacent areas that are meteorologically homogeneous. Rainstorm transposition technique is generally applied to such areas, which have markedly irregular shapes or peculiar orientation. Before applying the storm transposition technique, following corrections wherever required are to be considered along with the transposition guidelines as given below.
When no severe rainstorm has occurred in the study area then the nearest available storm from a meteorologically homogeneous region has to be physically moved to the area under study. This movement is called transposition of the storm. Important guidelines to storm transposition needed to be considered are:
(i) Coastal storms should not be transposed to inland areas. Such storms should be considered for transposition along coastal areas, (ii) storms occurring over mountains should not be transposed to plains or mountainous areas and (iii) transposition should be avoided if it requires crossing a barrier having an elevation of more than 800 m. If hill ranges are of lower elevations transposition may be carried out with the application of suitable adjustment factors as discussed in the following sections.
3.1.6.1 Location Adjustment Factor (LAF)
Outstanding rainstorms in a meteorologically homogeneous region surrounding a project basin are often transposed to the basin to frame PMP estimates for the project basin. The transposition of the rainstorm necessitates application of two adjustments for location and barrier. The location adjustment factor (LAF) is estimated by
Where,
h1 is mean crest elevation of the barrier between the rainstorm centre and source of moisture with mean crest elevation higher than that of the rainstorm centre.
W2 is precipitable water in an atmospheric column between 1,000 and 300 hPa levels, corresponding to maximum persisting dew point temperature (d2) on record at the location of the rainstorm in the same fortnight of the month in which the rainstorm occurred.
W3 is precipitable water in an atmospheric column between 1,000 and 300 hPa levels, corresponding to maximum persisting dew point temperature (d3) on record at the transposed location of the rainstorm in the same fortnight of the month in which the rainstorm occurred.

Estimation of PMP by Physical Approach
PMP Atlas for Mahanadi and Adjoining River Basins Page 70 of 260
3.1.6.2 Barrier Adjustment Factor (BAF)
The barrier adjustment factor (BAF) is estimated by
Where,
h1 is mean crest elevation of the barrier between the rainstorm centre and source of moisture with mean crest elevation higher than that of the rainstorm centre.
h2 is mean crest elevation of the barrier between the original location of rainstorm and the transposed location with mean crest elevation higher than mean elevation of original and transposed locations of rainstorm.
W3 is precipitable water in an atmospheric column between 1,000 and 300 hPa levels, corresponding to maximum persisting dew point temperature (d3) on record at the transposed location of the rainstorm in the same fortnight of the month in which the rainstorm occurred.
3.1.6.3 Transposition Adjustment Factor (TAF)
The combined effect of location adjustment factor (LAF) and barrier adjustment factors (BAF) is called the transposition adjustment factor (TAF), thus
Where,
h1 is mean crest elevation of the barrier between the rainstorm centre and source of moisture with mean crest elevation higher than that of the rainstorm centre.
h2 is mean crest elevation of the barrier between the original location of rainstorm and the transposed location with mean crest elevation higher than mean elevation of original and transposed locations of rainstorm.
W2 is precipitable water in an atmospheric column between 1,000 and 300 hPa levels, corresponding to maximum persisting dew point temperature (d2) on record at the location of the rainstorm in the same fortnight of the month in which the rainstorm occurred
W3 is precipitable water in an atmospheric column between 1,000 and 300 hPa levels, corresponding to maximum persisting dew point temperature (d3) on record at the transposed location of the rainstorm in the same fortnight of the month in which the rainstorm occurred.
3.1.6.4 Moisture Adjustment Factor (MAF)
The combined effect of MMF, LAF and BAF is expressed by a single term known as Moisture Adjustment Factor (MAF) and is expressed by the following relation.
MAF can be computed directly by using the following formula:
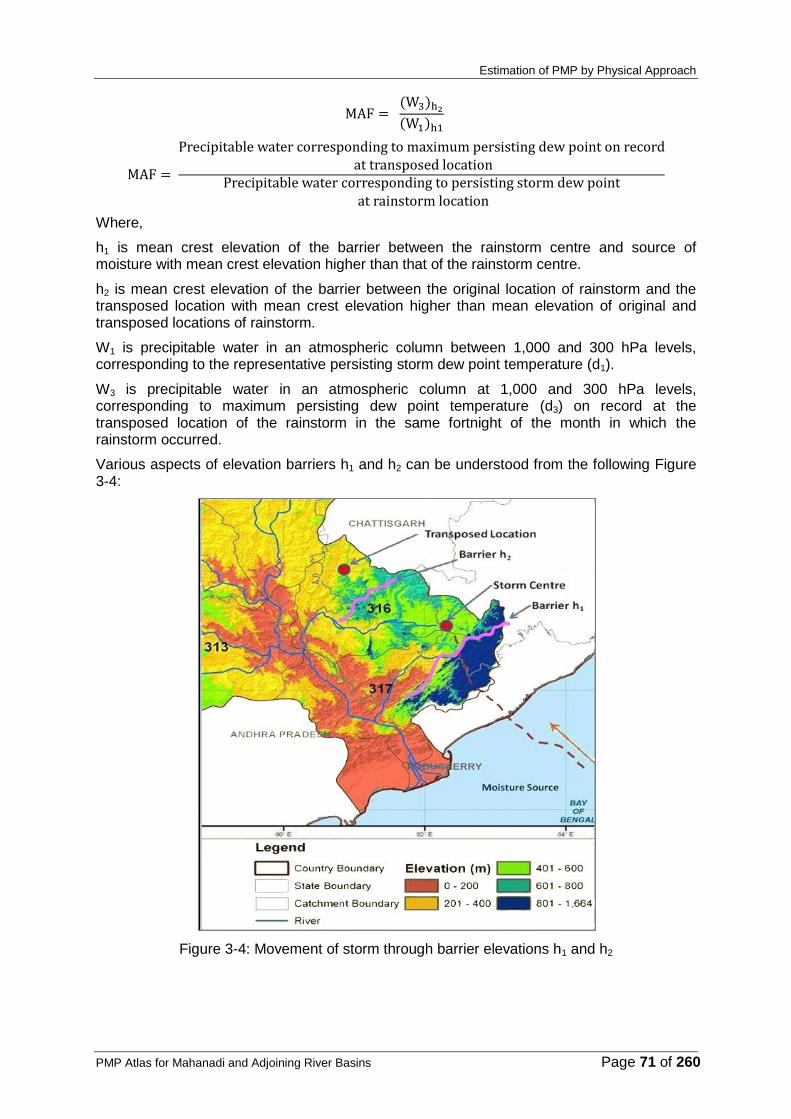
Estimation of PMP by Physical Approach
PMP Atlas for Mahanadi and Adjoining River Basins Page 71 of 260
Where,
h1 is mean crest elevation of the barrier between the rainstorm centre and source of moisture with mean crest elevation higher than that of the rainstorm centre.
h2 is mean crest elevation of the barrier between the original location of rainstorm and the transposed location with mean crest elevation higher than mean elevation of original and transposed locations of rainstorm.
W1 is precipitable water in an atmospheric column between 1,000 and 300 hPa levels, corresponding to the representative persisting storm dew point temperature (d1).
W3 is precipitable water in an atmospheric column at 1,000 and 300 hPa levels, corresponding to maximum persisting dew point temperature (d3) on record at the transposed location of the rainstorm in the same fortnight of the month in which the rainstorm occurred.
Various aspects of elevation barriers h1 and h2 can be understood from the following Figure 3-4:
Figure 3-4: Movement of storm through barrier elevations h1 and h2

Estimation of PMP by Physical Approach
PMP Atlas for Mahanadi and Adjoining River Basins Page 72 of 260
3.1.7 LIMIT OF TRANSPOSITION
The transfer of storm parameters identified at their places of occurrence to the places where they could occur is known as storm transposition. The storm transposition is limited to meteorologically homogeneous regions. There are many areas that have not experienced severe storms as observed in the vicinity and hence transposition of severe storms is done to supplement the inadequate records.
Fixing limits to storms for their transposition is one of the most important aspects in a design storm study. The guide to hydro-meteorological practice (WMO-332) suggests that:
i. The area within the transposable limits may have similar, but not identical, topographic and climatic characteristics throughout (Para 2.5.1).
ii. It is essential to determine maximum limits of seasonal transposition along with geographical limits since the storm mechanism may be changing beyond 15 days on either side of the storm period (Para 2.3.1).
iii. In temperate latitudes several lakh sq. km. can be meteorologically homogeneous. Contiguous homogeneity of such large areas are not possible in tropical regions (Para 6.1.5).
iv. Series of depths duration values over a catchment for a long period may form part of the historical evidences to avoid unrealistic exposure to certain parts of the catchments and help in obtaining realistic estimates of SPS/PMS for large catchments.
v. Transposition involving elevation differences of more than 800 m are generally avoided. Regardless an elevation adjustment is used (Para 2.6.2 and 2.6.3) because of their dynamic influences on storms.
vi. Limitation is placed on the rotation of displacement of an isohyetal pattern (Para 2.11.2).
The area for transposition is considered as 2° latitude x 2° longitude for a nearly flat region and 1/2° x 1/2° to 1° x 1° in a mountainous region WMO (1986). Mohile, et al. (1983), while studying the 1982 storm of coastal Odisha, had also verified it to be adequate.
Coastal storms (storms having centered west of the Western Ghat and east of the Eastern Ghat) were not transposed to catchments located far inland.
Storms that occurred in Orographic regions were not transposed to plain areas and vice versa.
Transposition to catchment larger than 50,000 sq.km may result in unrealistically excessive PMP estimates (Para 1.3.2). This may result in a severe unrealistic situation of flooding that is not experienced by the catchment.
Thus, transposability and limits of transposition of an individual rainstorm are governed by the meteorological conditions associated with the rainstorm, climatic, topographic characteristic depending upon the type of weather systems which cause rainstorm, and the direction of movement of these systems. Historical records show the characteristic behaviour of these weather systems.
3.1.8 PERSISTING DEW POINTS
The concept of persisting dew point has been developed by the USWB (1948) and is explained in the WMO (2009).
In order to obtain the storm moisture, dew points in respect of stations located in the warm air flowing into the storm are identified from the surface weather map. While selecting the stations, care should be taken such that the storm centre should invariably fall close to the stations. In addition, dew points between the rain area and moisture source have to be given prime consideration. Dew points in the rain area may be too high because of precipitation, but they need not be discarded if they appear to agree with dew points outside the rain area.

Estimation of PMP by Physical Approach
PMP Atlas for Mahanadi and Adjoining River Basins Page 73 of 260
Of course, one station is inside the heavy rainfall area and the other three in the path of moisture inflow. The storm dew point is then determined by averaging these four stations. Before averaging, the dew point values are reduced pseudo-adiabatically to the 1,000 hPa level, so that dew points for stations at different elevations are comparable. The amount of moisture in the air can be obtained from the single observation of dew point temperature, but these have certain synoptic limitations and are also susceptible to observational error. The moisture itself must be such that it persists for a period of several hours rather than minutes. Thus, the dew point values used to estimate moisture during the storm as well as over the specific area is based on three or more consecutive dew point values over a reasonable time interval. The value of the dew point so obtained is called the persisting dew point. Various meteorological departments worldwide publish the daily dew point data for meteorological stations. The daily dew point data during a storm period can be collected from such publications. The general practice is to use the 12-hour or 24-hour persisting dew point. The maximum persisting 24-hour dew point can be obtained from the series of dew point temperatures on days as shown in Table 3-1.
Table 3-1: Dew point temperatures (oC) at 24-hour interval
Details Day 1 Day 2 Day 3 Day 4
Time (IST) 0830 1730 0830 1730 0830 1730 0830 1730
Dew point (oC) 22 22 23 24 26 24 20 21
Persisting dew point (oC) at 0830 hrs 22 23 20
Maximum Persisting dew point (oC) at 0830 hrs 23
Persisting dew point (oC) at 1730 hrs 22 24 21
Maximum Persisting dew point (oC) at 1730 hrs 24
Maximum 24 hr Persisting dew point (oC) 24
In determining the persisting dew point, the consecutive dew points during a 24-hour period are examined for their reliability and the lowest of these values is selected. The highest persisting 24-hour dew point for the above series is 24°C.
3.1.9 MAXIMUM PERSISTING 24-HOUR 1,000 HPA DEW POINTS
For obtaining the maximum persisting dew point for any specific area, the long period (say, 20 to 30 years) dew points at several stations within the study area are scanned for a period of 15 days during which the storm has occurred. For example, if the storm has occurred during the period August 10-12, the data for the period of August 3 to August 17 is scanned and the highest persisting dew point for each year for each station is determined. From these values, the maximum dew point is selected.
Most recently in 2000, India Meteorological Department (IMD) has published fortnightly maps of the maximum persisting dew point temperatures (for 24 hrs and at 1,000 hPa) for entire India (IMD, 2000). These maps are based on long-term dew point temperature data. Total twenty four maps are available corresponding to every fortnight of twelve months of the year. Prior to these maps, the monthly time step maps were available from various sources (such as Rakhecha and Kennedy (1985) and Rakhecha et al. (1990)). Because of the recent publication and availability at fortnight level, fortnightly maps have been used in the current study for estimating maximum persisting dew point temperature at rainstorm centers and transposed locations. The map for the first fortnight of June is shown in Figure 3-5. The maximum persisting dew point temperature maps for 24 hr corresponding to 1,000 hPa for

Estimation of PMP by Physical Approach
PMP Atlas for Mahanadi and Adjoining River Basins Page 74 of 260
every fortnight for the months of May to November are shown in Figure 1-17 to Figure 1-30 of Volume II.
Source – IMD (2000)
Figure 3-5: Maximum persisting 24-hour 1,000 hPa dew point temperature (oC)
3.2 Analysis of rainstorms
The first requirement for estimating PMP by the hydro meteorological method is to build an adequate database of severe rainstorms in and around the Mahanadi and adjoining River Basin. In the basin, meteorological situations as explained in Section 3.2.2 produce the heaviest widespread rainfalls.
3.2.1 SELECTION OF RAINSTORMS
For the Mahanadi and adjoining River Basin, PMP values were derived by WAPCOS in 1998 using the rainfall data from 1901 to 1989. In this updation study to increase the basket of storms, the daily rainfall data for the period 1901-2006 were surveyed to determine the rainstorms over the Mahanadi and adjoining River Basin. Using below mentioned criteria, major storms (area up to 1,00,000 sq. km.) and medium storms (area of about and more than 20,000 sq. km.) were selected. The criteria of rain spells having recorded rainfall of 200 mm or more in 1-day, 250 mm or more in 2-day and 300 mm or more in 3-day duration at the center of the storm was applied to select the rainstorms. For the rain shadow area, threshold limits have been lowered down, below 200 mm, to get some rainstorm coverage. In addition, rainstorms given in isopluvial maps of India, IITM Pune and PMP atlas prepared by WAPCOS (1998) were adopted. A list of rainstorms selected using the above criteria has been prepared. The updated list (Table 3-2) includes 126 rainstorms for 1-day, 85 rainstorms for 2-day and 69 rainstorms for 3-day. Selected rainstorms were checked from various published sources such as Ramaswamy 1987, Dhar and Nandargi 1993, CBIP 1993, Dhar and Nandargi 1995, Dhar and Nandargi 1998, Dube and Rao 2005, Rakhecha and Singh
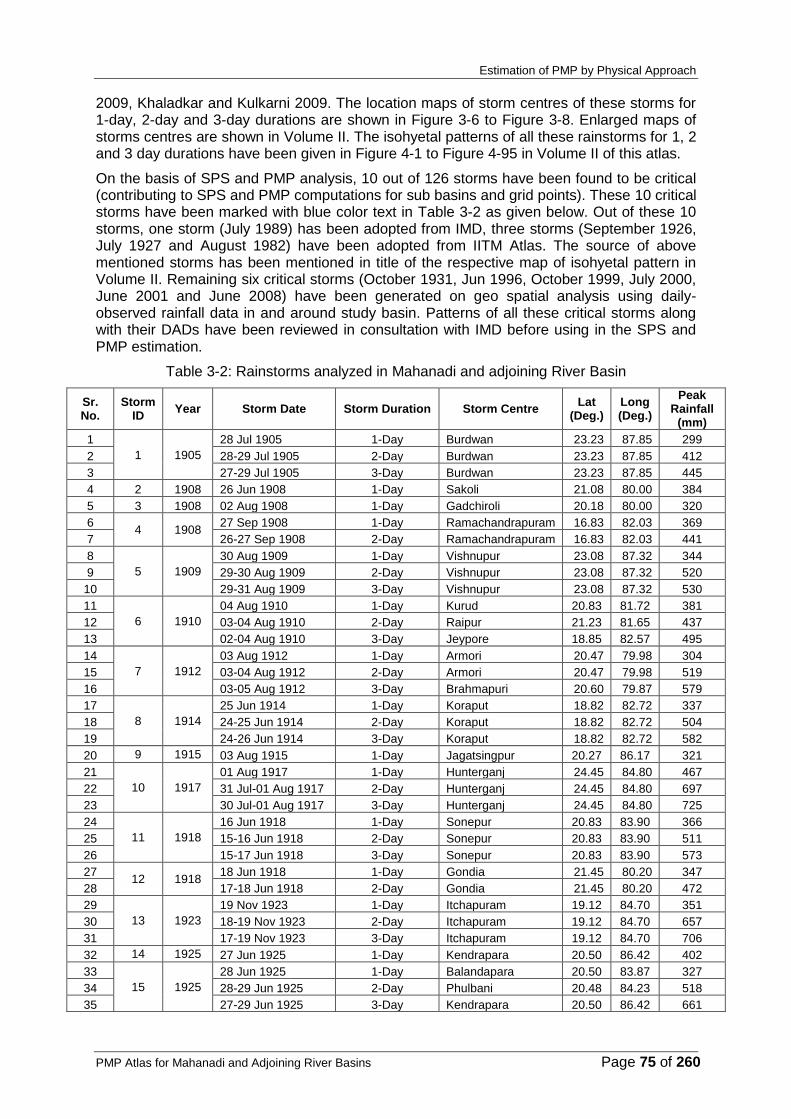
Estimation of PMP by Physical Approach
PMP Atlas for Mahanadi and Adjoining River Basins Page 75 of 260
2009, Khaladkar and Kulkarni 2009. The location maps of storm centres of these storms for 1-day, 2-day and 3-day durations are shown in Figure 3-6 to Figure 3-8. Enlarged maps of storms centres are shown in Volume II. The isohyetal patterns of all these rainstorms for 1, 2 and 3 day durations have been given in Figure 4-1 to Figure 4-95 in Volume II of this atlas.
On the basis of SPS and PMP analysis, 10 out of 126 storms have been found to be critical (contributing to SPS and PMP computations for sub basins and grid points). These 10 critical storms have been marked with blue color text in Table 3-2 as given below. Out of these 10 storms, one storm (July 1989) has been adopted from IMD, three storms (September 1926, July 1927 and August 1982) have been adopted from IITM Atlas. The source of above mentioned storms has been mentioned in title of the respective map of isohyetal pattern in Volume II. Remaining six critical storms (October 1931, Jun 1996, October 1999, July 2000, June 2001 and June 2008) have been generated on geo spatial analysis using daily-observed rainfall data in and around study basin. Patterns of all these critical storms along with their DADs have been reviewed in consultation with IMD before using in the SPS and PMP estimation.
Table 3-2: Rainstorms analyzed in Mahanadi and adjoining River Basin
Sr. No.
Storm ID
Year Storm Date Storm Duration Storm Centre Lat
(Deg.) Long (Deg.)
Peak Rainfall
(mm)
1
1 1905
28 Jul 1905 1-Day Burdwan 23.23 87.85 299
2 28-29 Jul 1905 2-Day Burdwan 23.23 87.85 412
3 27-29 Jul 1905 3-Day Burdwan 23.23 87.85 445
4 2 1908 26 Jun 1908 1-Day Sakoli 21.08 80.00 384
5 3 1908 02 Aug 1908 1-Day Gadchiroli 20.18 80.00 320
6 4 1908
27 Sep 1908 1-Day Ramachandrapuram 16.83 82.03 369
7 26-27 Sep 1908 2-Day Ramachandrapuram 16.83 82.03 441
8
5 1909
30 Aug 1909 1-Day Vishnupur 23.08 87.32 344
9 29-30 Aug 1909 2-Day Vishnupur 23.08 87.32 520
10 29-31 Aug 1909 3-Day Vishnupur 23.08 87.32 530
11
6 1910
04 Aug 1910 1-Day Kurud 20.83 81.72 381
12 03-04 Aug 1910 2-Day Raipur 21.23 81.65 437
13 02-04 Aug 1910 3-Day Jeypore 18.85 82.57 495
14
7 1912
03 Aug 1912 1-Day Armori 20.47 79.98 304
15 03-04 Aug 1912 2-Day Armori 20.47 79.98 519
16 03-05 Aug 1912 3-Day Brahmapuri 20.60 79.87 579
17
8 1914
25 Jun 1914 1-Day Koraput 18.82 82.72 337
18 24-25 Jun 1914 2-Day Koraput 18.82 82.72 504
19 24-26 Jun 1914 3-Day Koraput 18.82 82.72 582
20 9 1915 03 Aug 1915 1-Day Jagatsingpur 20.27 86.17 321
21
10 1917
01 Aug 1917 1-Day Hunterganj 24.45 84.80 467
22 31 Jul-01 Aug 1917 2-Day Hunterganj 24.45 84.80 697
23 30 Jul-01 Aug 1917 3-Day Hunterganj 24.45 84.80 725
24
11 1918
16 Jun 1918 1-Day Sonepur 20.83 83.90 366
25 15-16 Jun 1918 2-Day Sonepur 20.83 83.90 511
26 15-17 Jun 1918 3-Day Sonepur 20.83 83.90 573
27 12 1918
18 Jun 1918 1-Day Gondia 21.45 80.20 347
28 17-18 Jun 1918 2-Day Gondia 21.45 80.20 472
29
13 1923
19 Nov 1923 1-Day Itchapuram 19.12 84.70 351
30 18-19 Nov 1923 2-Day Itchapuram 19.12 84.70 657
31 17-19 Nov 1923 3-Day Itchapuram 19.12 84.70 706
32 14 1925 27 Jun 1925 1-Day Kendrapara 20.50 86.42 402
33
15 1925
28 Jun 1925 1-Day Balandapara 20.50 83.87 327
34 28-29 Jun 1925 2-Day Phulbani 20.48 84.23 518
35 27-29 Jun 1925 3-Day Kendrapara 20.50 86.42 661

Estimation of PMP by Physical Approach
PMP Atlas for Mahanadi and Adjoining River Basins Page 76 of 260
Sr. No.
Storm ID
Year Storm Date Storm Duration Storm Centre Lat
(Deg.) Long (Deg.)
Peak Rainfall
(mm)
36 16 1925 29 Jun 1925 1-Day Jharsuguda 21.85 84.03 350
37 17 1926
17 Aug 1926 1-Day Phulbani 20.48 84.23 320
38 16-17 Aug 1926 2-Day Phulbani 20.48 84.23 513
39
18 1926
21 Sep 1926 1-Day Bichhia 22.45 80.72 359
40 20-21 Sep 1926 2-Day Bichhia 22.45 80.72 650
41 19-21 Sep 1926 3-Day Dindori 22.93 81.08 819
42
19 1927
30 Jul 1927 1-Day Champua 22.08 85.67 565
43 29-30 Jul 1927 2-Day Karanjia 21.77 85.98 717
44 28-30 Jul 1927 3-Day Karanjia 21.77 85.98 745
45 20 1929 24 Aug 1929 1-Day Sarangarh 21.58 83.08 210
46 21 1931
15 Aug 1931 1-Day Jeypore 18.85 82.57 275
47 15-16 Aug 1931 2-Day Nawarangpur 19.23 82.55 366
48 22 1931 21 Aug 1931 1-Day Angul 20.83 85.10 257
49
23 1931
14 Oct 1931 1-Day Pottangi 18.57 82.97 546
50 13-14 Oct 1931 2-Day Pottangi 18.57 82.97 570
51 13-15 Oct 1931 3-Day Pottangi 18.57 82.97 585
52
24 1933
04 Aug 1933 1-Day Cuttak 20.46 85.88 321
53 03-04 Aug 1933 2-Day Balandapara 20.50 83.87 463
54 02-04 Aug 1933 3-Day Balandapara 20.50 83.87 468
55 25 1933 19 Oct 1933 1-Day Polavaram 17.25 81.65 259
56
26 1934
22 Aug 1934 1-Day Mahuadaur 23.40 84.13 293
57 22-23 Aug 1934 2-Day Ambikapur 23.12 83.20 360
58 21-23 Aug 1934 3-Day Ambikapur 23.12 83.20 435
59 27 1936
14 Jun 1936 1-Day Balandapara 20.50 83.87 338
60 13-14 Jun 1936 2-Day Balandapara 20.50 83.87 495
61
28 1936
15 Jun 1936 1-Day Balandapara 20.50 83.87 395
62 14-15 Jun 1936 2-Day Balandapara 20.50 83.87 733
63 13-15 Jun 1936 3-Day Balandapara 20.50 83.87 890
64 29 1937
28 Jun 1937 1-Day Sarangarh 21.58 83.08 309
65 27-28 Jun 1937 2-Day Sarangarh 21.58 83.08 397
66 30 1937 24 Jul 1937 1-Day Jagatsingpur 20.27 86.17 301
67 31 1937 25 Jul 1937 1-Day Pangree 21.42 80.10 395
68 32 1939 17 Aug 1939 1-Day Krishnanagar 20.97 84.47 203
69
33 1939
19 Aug 1939 1-Day Ambagarh chowki 20.78 80.73 311
70 18-19 Aug 1939 2-Day Kondapar 21.72 81.98 398
71 17-19 Aug 1939 3-Day Mahasamund 21.10 82.10 437
72
34 1940
26 Jun 1940 1-Day Maramsilli 20.55 81.67 258
73 25-26 Jun 1940 2-Day Balandapara 20.50 83.87 383
74 24-26 Jun 1940 3-Day Balandapara 20.50 83.87 458
75 35 1940 01 Jul 1940 1-Day Balasore 21.49 86.93 347
76
36 1940
08 Jul 1940 1-Day Bhograi 21.67 87.37 244
77 08-09 Jul 1940 2-Day Athmalik 20.72 84.53 374
78 07-09 Jul 1940 3-Day Barchana 20.67 86.12 400
79 37 1940 09 Jul 1940 1-Day Sarangarh 21.58 83.08 225
80 38 1941 10 Jul 1941 1-Day Chandbali 20.78 86.75 322
81 39 1941 08 Oct 1941 1-Day Balasore 21.49 86.93 323
82 40 1942 10 Jul 1942 1-Day Gopiballabhpur 22.21 86.89 339
83
41 1942
03 Aug 1942 1-Day Antagarh 20.10 81.17 244
84 02-03 Aug 1942 2-Day Antagarh 20.10 81.17 315
85 02-04 Aug 1942 3-Day Antagarh 20.10 81.17 371
86 42 1943 01 Aug 1943 1-Day Soro 21.28 86.70 479
87 43 1944 20 Aug 1944 1-Day Phiringia 20.35 84.12 254
88 44 1947 31 Aug 1947 1-Day Bodalkasa 21.37 80.05 376

Estimation of PMP by Physical Approach
PMP Atlas for Mahanadi and Adjoining River Basins Page 77 of 260
Sr. No.
Storm ID
Year Storm Date Storm Duration Storm Centre Lat
(Deg.) Long (Deg.)
Peak Rainfall
(mm)
89 45 1947 27 Sep 1947 1-Day Konta 17.80 81.38 252
90
46 1948
15 Aug 1948 1-Day Dhamtari 20.70 81.57 308
91 15-16 Aug 1948 2-Day Dhamtari 20.70 81.57 507
92 14-16 Aug 1948 3-Day Dhamtari 20.70 81.57 512
93 47 1951 31 Jul 1951 1-Day Dhanora 20.27 80.32 286
94
48 1953
19 Jun 1953 1-Day Thotapalli 18.78 83.52 217
95 18-19 Jun 1953 2-Day Narasannapeta 18.42 84.05 312
96 18-20 Jun 1953 3-Day Sompeta 18.93 84.60 349
97 49 1953 04 Aug 1953 1-Day Ambagarh chowki 20.78 80.73 301
98
50 1955
04 Sep 1955 1-Day Sonepur 20.85 83.98 288
99 03-04 Sep 1955 2-Day Hirakud 21.53 83.90 368
100 02-04 Sep 1955 3-Day Dhama 21.25 83.92 389
101 51 1958 15 Jul 1958 1-Day Bolangir 20.72 83.48 326
102 52 1959
30 Jun 1959 1-Day Antagarh 20.10 81.17 307
103 29-30 Jun 1959 2-Day Antagarh 20.10 81.17 337
104 53 1960 03 Jul 1960 1-Day Paoni 20.78 79.65 318
105
54 1960
15 Aug 1960 1-Day Kusumi 21.75 84.52 296
106 15-16 Aug 1960 2-Day Kusumi 21.75 84.52 339
107 14-16 Aug 1960 3-Day Kusumi 21.75 84.52 379
108 55 1961 02 Sep 1961 1-Day Pangree 21.42 80.10 344
109
56 1964
09 Jul 1964 1-Day Tamluk 22.30 87.92 480
110 09-10 Jul 1964 2-Day Tamluk 22.30 87.92 831
111 09-11 Jul 1964 3-Day Tamluk 22.30 87.92 851
112
57 1967
02 Aug 1967 1-Day Arkambali farm 19.90 83.17 320
113 01-02 Aug 1967 2-Day Rudri 20.67 81.57 535
114 01-03 Aug 1967 3-Day Rudri 20.67 81.57 596
115 58 1970 01 Jul 1970 1-Day Sonepur 20.85 83.98 328
116 59 1973 08 Jul 1973 1-Day Brahmapuri 20.60 79.87 297
117
60 1973
08 Jul 1973 1-Day Madanpur rampur 20.20 83.52 295
118 07-08 Jul 1973 2-Day Madanpur rampur 20.20 83.52 495
119 06-08 Jul 1973 3-Day Thuamulrampur 19.55 82.93 521
120
61 1975
28 Jun 1975 1-Day Kunghari 19.58 79.83 315
121 27-28 Jun 1975 2-Day Sindewahi 20.28 79.68 484
122 27-29 Jun 1975 3-Day Kunghari 19.58 79.83 517
123
62 1975
18 Jul 1975 1-Day Dumri 23.98 86.02 403
124 18-19 Jul 1975 2-Day Dumri 23.98 86.02 682
125 17-19 Jul 1975 3-Day Dumri 23.98 86.02 767
126
63 1977
21 Nov 1977 1-Day Salur 18.52 83.20 181
127 20-21 Nov 1977 2-Day Narsipatnam 17.67 82.62 325
128 20-22 Nov 1977 3-Day Narsipatnam 17.67 82.62 328
129 64 1978 29 Aug 1978 1-Day Paoni 20.78 79.65 286
130 65 1978
27 Sep 1978 1-Day Shamsundar royna 23.88 87.53 400
131 27-28 Sep 1978 2-Day Pangarh aero 23.47 87.43 610
132 66 1981 09 Aug 1981 1-Day Antagarh 20.10 81.17 342
133 67 1982
04 Jun 1982 1-Day Kendrapara 20.50 86.42 387
134 03-04 Jun 1982 2-Day Kendrapara 20.50 86.42 404
135
68 1982
30 Aug 1982 1-Day Bijepur 21.18 83.47 520
136 29-30 Aug 1982 2-Day Phulbani 20.48 84.23 700
137 28-30 Aug 1982 3-Day Dunguripalli 21.03 83.55 890
138 69 1984 01 Aug 1984 1-Day Jeypore 18.85 82.57 295
139
70 1984
16 Aug 1984 1-Day Kendrapara 20.50 86.42 325
140 16-17 Aug 1984 2-Day Kendrapara 20.50 86.42 348
141 15-17 Aug 1984 3-Day Mahanga 20.50 86.17 369

Estimation of PMP by Physical Approach
PMP Atlas for Mahanadi and Adjoining River Basins Page 78 of 260
Sr. No.
Storm ID
Year Storm Date Storm Duration Storm Centre Lat
(Deg.) Long (Deg.)
Peak Rainfall
(mm)
142 71 1985
16 Oct 1985 1-Day Sukinda 20.97 85.92 350
143 15-16 Oct 1985 2-Day Akhuapada 20.92 86.28 378
144 72 1986 22 Jul 1986 1-Day Gadchiroli 20.18 80.00 384
145 73 1988
03 Aug 1988 1-Day Telkoi 21.33 85.33 321
146 03-04 Aug 1988 2-Day Telkoi 21.33 85.33 337
147
74 1989
23 Jul 1989 1-Day Kodur 16.52 81.98 422
148 23-24 Jul 1989 2-Day Tiruvur 17.11 80.62 450
149 22-24 Jul 1989 3-Day Tiruvur 17.11 80.62 469
150 75 1990 22 Aug 1990 1-Day Armori 20.47 79.98 302
151
76 1990
04 Nov 1990 1-Day Digapahandi 18.50 84.29 445
152 03-04 Nov 1990 2-Day Digapahandi 18.50 84.29 554
153 03-05 Nov 1990 3-Day Digapahandi 18.50 84.29 560
154
77 1991
17 Jul 1991 1-Day Tentalkhunti 20.92 83.42 347
155 16-17 Jul 1991 2-Day Thuamulrampur 19.55 82.93 510
156 15-17 Jul 1991 3-Day Thuamulrampur 19.55 82.93 595
157
78 1991
21 Jul 1991 1-Day Binjharpur 20.73 86.40 300
158 20-21 Jul 1991 2-Day Binjharpur 20.73 86.40 520
159 20-22 Jul 1991 3-Day Binjharpur 20.73 86.40 521
160
79 1991
12 Aug 1991 1-Day Rajkishorengr 20.97 84.47 339
161 12-13 Aug 1991 2-Day Phiringia 20.35 84.12 616
162 11-13 Aug 1991 3-Day Phiringia 20.35 84.12 676
163 80 1991 16 Aug 1991 1-Day Gadchiroli 20.18 80.00 285
164 81 1992 27 Jul 1992 1-Day Tumudibandh 19.92 83.67 301
165
82 1992
28 Jul 1992 1-Day Bijepur 21.18 83.47 475
166 27-28 Jul 1992 2-Day Bijepur 21.18 83.47 520
167 27-29 Jul 1992 3-Day Bijepur 21.18 83.47 546
168 83 1992 15 Aug 1992 1-Day Korukonda 18.25 81.92 261
169
84 1992
20 Aug 1992 1-Day Gaisilet 20.92 83.25 285
170 19-20 Aug 1992 2-Day Gaisilet 20.92 83.25 425
171 18-20 Aug 1992 3-Day Gaisilet 20.92 83.25 433
172
85 1994
15 Jun 1994 1-Day Dhabara /dabra 21.78 83.08 458
173 15-16 Jun 1994 2-Day Dhabara /dabra 21.78 83.08 544
174 14-16 Jun 1994 3-Day Dhabara /dabra 21.78 83.08 587
175
86 1994
28 Jun 1994 1-Day Jamsolaghat 22.22 86.72 264
176 27-28 Jun 1994 2-Day Jamsolaghat 22.22 86.72 302
177 27-29 Jun 1994 3-Day Goilkera 22.53 85.38 396
178 87 1994 29 Jun 1994 1-Day Angara 23.33 85.50 300
179
88 1994
12 Jul 1994 1-Day Chandur railway 20.82 77.97 468
180 11-12 Jul 1994 2-Day Paoni 20.78 79.65 630
181 10-12 Jul 1994 3-Day Paoni 20.78 79.65 673
182 89 1994 13 Jul 1994 1-Day Sundergarh 22.12 84.03 253
183 90 1994 20 Jul 1994 1-Day Pamposh 22.17 84.83 305
184
91 1994
18 Aug 1994 1-Day Balliguda 20.20 83.92 290
185 17-18 Aug 1994 2-Day Balliguda 20.20 83.92 354
186 17-19 Aug 1994 3-Day Balliguda 20.20 83.92 374
187 92 1994
29 Aug 1994 1-Day Bari 20.67 86.33 270
188 28-29 Aug 1994 2-Day Bari 20.67 86.33 380
189 93 1994 30 Aug 1994 1-Day Nagbhir 20.60 79.65 365
190
94 1995
10 May 1995 1-Day Nuagada 19.10 84.05 350
191 10-11 May 1995 2-Day Nuagada 19.10 84.05 610
192 09-11 May 1995 3-Day Nuagada 19.10 84.05 710
193 95 1995
16 May 1995 1-Day Pattamundai 20.58 86.57 300
194 15-16 May 1995 2-Day Bari 20.67 86.33 353
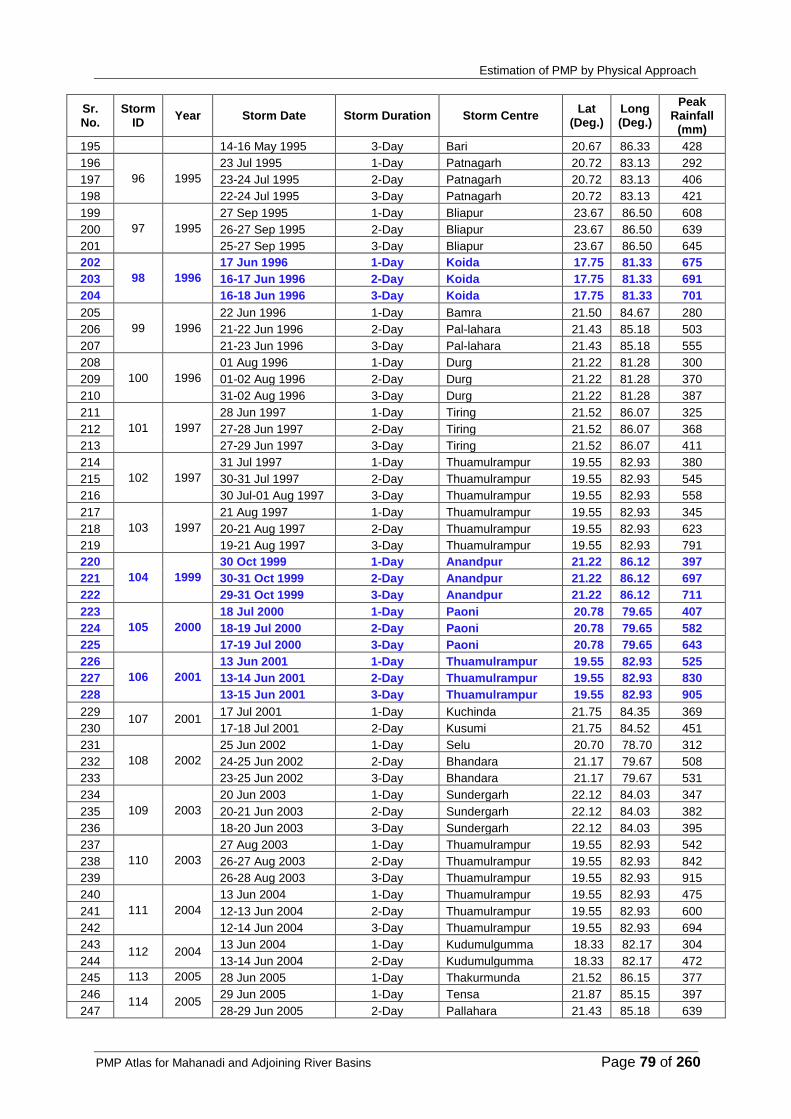
Estimation of PMP by Physical Approach
PMP Atlas for Mahanadi and Adjoining River Basins Page 79 of 260
Sr. No.
Storm ID
Year Storm Date Storm Duration Storm Centre Lat
(Deg.) Long (Deg.)
Peak Rainfall
(mm)
195 14-16 May 1995 3-Day Bari 20.67 86.33 428
196
96 1995
23 Jul 1995 1-Day Patnagarh 20.72 83.13 292
197 23-24 Jul 1995 2-Day Patnagarh 20.72 83.13 406
198 22-24 Jul 1995 3-Day Patnagarh 20.72 83.13 421
199
97 1995
27 Sep 1995 1-Day Bliapur 23.67 86.50 608
200 26-27 Sep 1995 2-Day Bliapur 23.67 86.50 639
201 25-27 Sep 1995 3-Day Bliapur 23.67 86.50 645
202
98 1996
17 Jun 1996 1-Day Koida 17.75 81.33 675
203 16-17 Jun 1996 2-Day Koida 17.75 81.33 691
204 16-18 Jun 1996 3-Day Koida 17.75 81.33 701
205
99 1996
22 Jun 1996 1-Day Bamra 21.50 84.67 280
206 21-22 Jun 1996 2-Day Pal-lahara 21.43 85.18 503
207 21-23 Jun 1996 3-Day Pal-lahara 21.43 85.18 555
208
100 1996
01 Aug 1996 1-Day Durg 21.22 81.28 300
209 01-02 Aug 1996 2-Day Durg 21.22 81.28 370
210 31-02 Aug 1996 3-Day Durg 21.22 81.28 387
211
101 1997
28 Jun 1997 1-Day Tiring 21.52 86.07 325
212 27-28 Jun 1997 2-Day Tiring 21.52 86.07 368
213 27-29 Jun 1997 3-Day Tiring 21.52 86.07 411
214
102 1997
31 Jul 1997 1-Day Thuamulrampur 19.55 82.93 380
215 30-31 Jul 1997 2-Day Thuamulrampur 19.55 82.93 545
216 30 Jul-01 Aug 1997 3-Day Thuamulrampur 19.55 82.93 558
217
103 1997
21 Aug 1997 1-Day Thuamulrampur 19.55 82.93 345
218 20-21 Aug 1997 2-Day Thuamulrampur 19.55 82.93 623
219 19-21 Aug 1997 3-Day Thuamulrampur 19.55 82.93 791
220
104 1999
30 Oct 1999 1-Day Anandpur 21.22 86.12 397
221 30-31 Oct 1999 2-Day Anandpur 21.22 86.12 697
222 29-31 Oct 1999 3-Day Anandpur 21.22 86.12 711
223
105 2000
18 Jul 2000 1-Day Paoni 20.78 79.65 407
224 18-19 Jul 2000 2-Day Paoni 20.78 79.65 582
225 17-19 Jul 2000 3-Day Paoni 20.78 79.65 643
226
106 2001
13 Jun 2001 1-Day Thuamulrampur 19.55 82.93 525
227 13-14 Jun 2001 2-Day Thuamulrampur 19.55 82.93 830
228 13-15 Jun 2001 3-Day Thuamulrampur 19.55 82.93 905
229 107 2001
17 Jul 2001 1-Day Kuchinda 21.75 84.35 369
230 17-18 Jul 2001 2-Day Kusumi 21.75 84.52 451
231
108 2002
25 Jun 2002 1-Day Selu 20.70 78.70 312
232 24-25 Jun 2002 2-Day Bhandara 21.17 79.67 508
233 23-25 Jun 2002 3-Day Bhandara 21.17 79.67 531
234
109 2003
20 Jun 2003 1-Day Sundergarh 22.12 84.03 347
235 20-21 Jun 2003 2-Day Sundergarh 22.12 84.03 382
236 18-20 Jun 2003 3-Day Sundergarh 22.12 84.03 395
237
110 2003
27 Aug 2003 1-Day Thuamulrampur 19.55 82.93 542
238 26-27 Aug 2003 2-Day Thuamulrampur 19.55 82.93 842
239 26-28 Aug 2003 3-Day Thuamulrampur 19.55 82.93 915
240
111 2004
13 Jun 2004 1-Day Thuamulrampur 19.55 82.93 475
241 12-13 Jun 2004 2-Day Thuamulrampur 19.55 82.93 600
242 12-14 Jun 2004 3-Day Thuamulrampur 19.55 82.93 694
243 112 2004
13 Jun 2004 1-Day Kudumulgumma 18.33 82.17 304
244 13-14 Jun 2004 2-Day Kudumulgumma 18.33 82.17 472
245 113 2005 28 Jun 2005 1-Day Thakurmunda 21.52 86.15 377
246 114 2005
29 Jun 2005 1-Day Tensa 21.87 85.15 397
247 28-29 Jun 2005 2-Day Pallahara 21.43 85.18 639

Estimation of PMP by Physical Approach
PMP Atlas for Mahanadi and Adjoining River Basins Page 80 of 260
Sr. No.
Storm ID
Year Storm Date Storm Duration Storm Centre Lat
(Deg.) Long (Deg.)
Peak Rainfall
(mm)
248 27-29 Jun 2005 3-Day Pallahara 21.43 85.18 757
249
115 2005
30 Jul 2005 1-Day R.pur/rairakhol 21.07 84.35 310
250 30-31 Jul 2005 2-Day Jujomura 21.17 84.08 573
251 29-31 Jul 2005 3-Day Jujomura 21.17 84.08 578
252
116 2005
13 Sep 2005 1-Day Thuamulrampur 19.55 82.93 320
253 12-13 Sep 2005 2-Day Thuamulrampur 19.55 82.93 480
254 12-14 Sep 2005 3-Day Thuamulrampur 19.55 82.93 560
255 117 2005
20 Sep 2005 1-Day Kunavaram 17.60 81.23 487
256 20-21 Sep 2005 2-Day Kunavaram 17.60 81.23 561
257
118 2006
03 Aug 2006 1-Day Thuamulrampur 19.55 82.93 450
258 02-03 Aug 2006 2-Day Thuamulrampur 19.55 82.93 600
259 02-04 Aug 2006 3-Day Thuamulrampur 19.55 82.93 734
260 119 2006
04 Aug 2006 1-Day Nandapur 19.50 82.25 341
261 04-05 Aug 2006 2-Day Sukma 18.38 81.67 497
262
120 2007
06 Jul 2007 1-Day Bahalda 22.40 86.08 310
263 06-07 Jul 2007 2-Day Joda 22.00 85.42 564
264 05-07 Jul 2007 3-Day Joda 22.00 85.42 579
265
121 2007
05 Aug 2007 1-Day Kantapara 20.25 85.92 335
266 05-06 Aug 2007 2-Day Naugaon 20.25 85.17 565
267 04-06 Aug 2007 3-Day Naugaon 20.25 85.17 575
268
122 2007
07 Aug 2007 1-Day Thuamulrampur 19.55 82.93 430
269 06-07 Aug 2007 2-Day Thuamulrampur 19.55 82.93 665
270 05-07 Aug 2007 3-Day Thuamulrampur 19.55 82.93 765
271 123 2007 13 Aug 2007 1-Day Bijatala 22.17 86.25 375
272
124 2007
23 Sep 2007 1-Day Athgarh 20.50 85.58 268
273 22-23 Sep 2007 2-Day Mahanga 20.50 86.17 388
274 21-23 Sep 2007 3-Day Mahanga 20.50 86.17 486
275
125 2008
18 Jun 2008 1-Day Bahalda 22.40 86.08 424
276 17-18 Jun 2008 2-Day Bahalda 22.40 86.08 762
277 17-19 Jun 2008 3-Day Bahalda 22.40 86.08 831
278
126 2008
18 Sep 2008 1-Day Jujomura 21.17 84.08 355
279 17-18 Sep 2008 2-Day Jujomura 21.17 84.08 506
280 16-18 Sep 2008 3-Day Jujomura 21.17 84.08 529

Estimation of PMP by Physical Approach
PMP Atlas for Mahanadi and Adjoining River Basins Page 81 of 260
Figure 3-6: Locations of 1-day rainstorms

Estimation of PMP by Physical Approach
PMP Atlas for Mahanadi and Adjoining River Basins Page 82 of 260
Figure 3-7: Locations of 2-day rainstorms

Estimation of PMP by Physical Approach
PMP Atlas for Mahanadi and Adjoining River Basins Page 83 of 260
Figure 3-8: Locations of 3-day rainstorms

Estimation of PMP by Physical Approach
PMP Atlas for Mahanadi and Adjoining River Basins Page 84 of 260
3.2.2 SYNOPTIC SITUATION OF MAJOR RAINSTORMS
3.2.2.1 Rainstorm of 2-4 August 1910
The rainstorm of 2-4 August 1910 was caused by the depression formed off the Odisha coast on 1 August. On 2 August, the depression has developed into a cyclonic storm and caused rough seas with moderately heavy rain in its neighbourhood. On 3 August, the cyclonic storm has caused moderately heavy rain in Odisha and the monsoon was active in the central parts of the country. On 4 August, the cyclonic storm has crossed the Odisha coast and lay centered near Bilaspur in Chhattisgarh. On 5 August, the cyclonic storm has moved in a west-northwesterly direction and lay centered over Sagar in Madhya Pradesh. The cyclonic storm has caused nearly general rainfall in Chhattisgarh with the principal amount of rainfall reported from Kurud, Raipur, Jagdalpur and Pendra (Figure 3-9).
Under its influence, a very heavy rainfall occurred in almost entire Chhattisgarh with a few adjoining areas of Madhya Pradesh and Odisha during 2-4 August. The area under the storm recorded 1-day maximum rainfall on 4 August, 2-day maximum rainfall for 3-4 August and 3-day maximum rainfall for 2-4 August. The center of the rainstorm for 1-day duration was located at Kurud (20.830 N, 81.720 E) in Chhattisgarh which recorded 381 mm of rainfall. The center of the 2-day rainstorm was located at Raipur (21.230 N, 81.650 E) in Chhattisgarh which recorded 437 mm of rainfall. The center of the 3-day rainstorm was located at Jeypore (18.850 N, 82.570 E) in Odisha which recorded 495 mm of rainfall.
3.2.2.2 Rainstorm of 24-26 June 1914
The rainstorm of 24-26 June 1914 was caused by the disturbance formed in the Bay of Bengal which later developed into a storm on 24 June. The Bay storm has crossed the Odisha coast on the night of 24 June and lay centered over Madhya Pradesh on 25 and 26 June. The Bay storm has caused heavy and widespread rainfall over Odisha and Madhya Pradesh (Figure 3-10).
Under its influence, a very heavy rainfall occurred in almost entire Odisha with a few adjoining areas of Madhya Pradesh during 24-26 June. The area under the storm recorded 1-day maximum rainfall on 25 June, 2-day maximum rainfall for 24-25 June and 3-day maximum rainfall for 24-26 June. The center of the rainstorm was located at Koraput (18.820 N, 82.720 E) in Odisha which recorded 337 mm, 504 mm and 582 mm of rainfall in 1, 2 and 3 days respectively.
3.2.2.3 Rainstorm of 27-29 June 1925
The rainstorm of 27-29 June 1925 was caused by the cyclonic storm formed over the head Bay of Bengal on 26 June. The cyclonic storm has further intensified on 27 June and crossed the Odisha coast in the morning of 28 June. On 29 June, the cyclonic storm has weakened into a depression and lay centered over Bihar Plateau. The Bay storm has caused heavy to very heavy and widespread rainfall over whole of Mahanadi catchment from 27 to 29 June (Figure 3-11).
Under its influence, a very heavy rainfall occurred in almost entire Odisha with a few adjoining areas of Bihar Plateau during 27-29 June. The area under the storm recorded 1-day maximum rainfall on 28 June, 2-day maximum rainfall for 28-29 June and 3-day maximum rainfall for 27-29 June. The center of the rainstorm for 1-day duration was located at Balandapara (20.500 N, 83.870 E) in Odisha which recorded 327 mm of rainfall. The center of the 2-day rainstorm was located at Phulbani (20.480 N, 84.230 E) in Odisha which recorded 518 mm of rainfall. The center of the 3-day rainstorm was located at Kendrapara (20.500 N, 86.420 E) in Odisha which recorded 661 mm of rainfall.

Estimation of PMP by Physical Approach
PMP Atlas for Mahanadi and Adjoining River Basins Page 85 of 260
3.2.2.4 Rainstorm of 16-17 August 1926
The rainstorm of 16-17 August 1926 was caused by the depression formed near Burdwan in West Bengal on 15 August. On 16 August, the depression has intensified into a deep depression and lay centered near Balasore in Odisha. On 17 August, the deep depression has moved in a westward direction and lay centered near Sambalpur in Odisha. On 18 August, the deep depression has weakened slightly and moved into the Central Provinces. The deep depression has caused very heavy rainfall in Odisha and West Bengal with the principal amount of rainfall reported from Phulbani, Balasore, Cuttack and Sambalpur in Odisha (Figure 3-11).
Under its influence, a very heavy rainfall occurred in almost entire Odisha with a few adjoining areas of West Bengal during 16-17 August. The area under the storm recorded 1-day maximum rainfall on 17 August and 2-day maximum rainfall for 16-17 August. The center of the rainstorm was located at Phulbani (20.480 N, 84.230 E) in Odisha which recorded 320 mm and 513 mm of rainfall in 1 and 2 days respectively.
3.2.2.5 Rainstorm of 28-30 July 1927
The rainstorm of 28-30 July 1927 was caused by the deep depression formed over the head Bay of Bengal on 28 July. On 29 July, the Bay depression has intensified into a cyclonic storm, which later crossed the West Bengal coast. On 30 July, the deep depression has weakened into a depression and lay centered over Bihar Plateau. The Bay depression has caused heavy to very heavy rain over Odisha and adjoining Bihar Plateau (Figure 3-11).
Under its influence, a very heavy rainfall occurred in almost entire Odisha with a few adjoining areas of Bihar Plateau during 28-30 July. The area under the storm recorded 1-day maximum rainfall on 30 July, 2-day maximum rainfall for 29-30 July and 3-day maximum rainfall for 28-30 July. The center of the rainstorm for 1-day duration was located at Champua (22.080 N, 85.670 E) in Odisha which recorded 565 mm of rainfall. The center of the 2-day and 3-day rainstorm was located at Karanjia (21.770 N, 85.980 E) in Odisha which recorded 717 and 745 mm of rainfall respectively.
3.2.2.6 Rainstorm of 24 August 1929
The rainstorm of 24 August 1929 was caused by the Bay depression which was centered near Lat. 190 N and Lon. 870 E on 22 August. On 23 August, the Bay depression has developed into a storm and lay centered near Lat. 200 N and Lat. 880 E. On 24 August, the Bay storm has crossed the coast near Chandbali and lay centered as a deep depression over the east Central Provinces. On 25 August, the deep depression has moved in a north-westward direction and lay centered near Sagar in Madhya Pradesh. The Bay storm has caused nearly general rainfall in the Central Provinces with the principal amount of rainfall reported from Sarangarh, Raipur, Jagdalpur, Kanker and Pendra in Chhattisgarh (Figure 3-11).
Under its influence, a very heavy rainfall occurred in almost entire Chhattisgarh with a few adjoining areas of Odisha and Madhya Pradesh on 24 August. The area under the storm recorded 1-day maximum rainfall on 24 August and the center of the rainstorm was located at Sarangarh (21.580 N, 83.080 E) in Chhattisgarh which recorded 210 mm of rainfall in 1-day.
3.2.2.7 Rainstorm of 21 August 1931
The rainstorm of 21 August 1931 was caused by the shallow low formed over the Bay of Bengal which has intensified into a depression and lay centered about 80 miles to the southeast of Sagar Island on 19 August. On 20 August, the Bay depression has intensified into a storm of small diameter and lay centered between the Sandheads and Sagar Island. On 21 August, the Bay storm has crossed the Odisha coast near Balasore and lay centered as a depression over Chota Nagpur. On 22 August, the depression lay centered over the

Estimation of PMP by Physical Approach
PMP Atlas for Mahanadi and Adjoining River Basins Page 86 of 260
east Central Provinces. The Bay storm has caused general rainfall in Odisha and Chhattisgarh with the principal amount of rainfall reported from Angul, Sambalpur, Chandbali, Cuttack and Balasore (Figure 3-12).
Under its influence, a very heavy rainfall occurred in almost entire Odisha with a few adjoining areas of Chhattisgarh on 21 August. The area under the storm recorded 1-day maximum rainfall on 21 August and the center of the rainstorm was located at Angul (20.830
N, 85.100 E) in Odisha which recorded 257 mm of rainfall in 1-day.
3.2.2.8 Rainstorm of 13-15 October 1931
The rainstorm of 13-15 October 1931 was caused by the Bay depression which has intensified into a storm and lay centered within a degree of Lat. 180 N and Lon. 870 E on 12 October. On 13 October, the Bay storm has moved in a westward direction and lay centered about 60 miles to the east of Kalingapatnam in Andhra Pradesh. On 14 October, the Bay storm has crossed the coast near Kalingapatnam and lay centered as a deep depression about 60 miles to the east of Jagdalpur in Chhattisgarh. On 15 October, the Bay storm has moved in a northwesterly direction and lay centered near Raipur in Chhattisgarh. The Bay storm has caused fairly widespread rainfall in the east Central Provinces and the north Madras Coast with the principal amount of rainfall reported from Gajapathinagaram, Kalingapatnam and Visakhapatnam in Andhra Pradesh and Jagdalpur and Raipur in Chhattisgarh (Figure 3-12).
Under its influence, a very heavy rainfall occurred in almost entire Andhra Pradesh with a few adjoining areas of Chhattisgarh during 13-15 October. The area under the storm recorded 1-day maximum rainfall on 14 October, 2-day maximum rainfall for 13-14 October and 3-day maximum rainfall for 13-15 October. The center of the rainstorm was located at Pottangi (18.570 N, 82.970 E) in Odisha which recorded 546 mm, 570 mm and 585 mm of rainfall in 1, 2 and 3 days respectively.
3.2.2.9 Rainstorm of 2-4 August 1933
The rainstorm of 2-4 August 1933 was caused by the depression formed in the Bay of Bengal on 2 August. On 3 August, the Bay depression has intensified into a storm and lay centered about 60 miles to the southeast of Chandbali which later crossed the coast between Balasore and Chandbali. On 4 August, the Bay storm lay centered as a deep depression near Sambalpur. The Bay storm has caused nearly general rain in Odisha and West Bengal with the principal amount of rainfall reported from Cuttack, Balandapara, Sambalpur, Balasore and Chandbali (Figure 3-12).
Under its influence, a very heavy rainfall occurred in almost entire Odisha with a few adjoining areas of West Bengal during 2-4 August. The area under the storm recorded 1-day maximum rainfall on 4 August, 2-day maximum rainfall for 3-4 August and 3-day maximum rainfall for 2-4 August. The center of the 1-day rainstorm was located at Cuttack (20.460 N, 85.880 E) in Odisha which recorded 321 mm of rainfall. The center of the 2-day and 3-day rainstorm was located at Balandapara (20.500 N, 83.870 E) in Odisha which recorded 463 and 468 mm of rainfall respectively.
3.2.2.10 Rainstorm of 13-15 June 1936
The rainstorm of 13-15 June 1936 was caused by the depression formed over North Bay of Bengal on 11 June. On 12 June, the Bay depression has developed into a cyclonic storm. On 13 June, the cyclonic storm has crossed the Odisha coast and lay centered as a deep depression near Balasore. The deep depression has lay centered near Sambalpur on 14 June and near Raipur on 15 June. The Bay storm has caused heavy to very heavy and widespread rainfall over Odisha, Madhya Pradesh and Bihar Plateau between 13 to 15 June (Figure 3-12).

Estimation of PMP by Physical Approach
PMP Atlas for Mahanadi and Adjoining River Basins Page 87 of 260
Under its influence, a very heavy rainfall occurred in almost entire Odisha with a few adjoining areas of Madhya Pradesh and Bihar Plateau during 13-15 June. The area under the storm recorded 1-day maximum rainfall on 15 June, 2-day maximum rainfall for 14-15 June and 3-day maximum rainfall for 13-15 June. The center of the rainstorm was located at Balandapara (20.500 N, 83.870 E) in Odisha which recorded 395 mm, 733 mm and 890 mm of rainfall in 1, 2 and 3 days respectively.
3.2.2.11 Rainstorm of 27-28 June 1937
The rainstorm of 27-28 June 1937 was caused by the depression formed over east Bengal on 26 June. On 27 June, the Bay depression has moved in a westward direction and lay centered near Calcutta. On 28 June, the depression has moved westwards and lay centered near Pendra in Chhattisgarh. On 29 June, the depression has further moved westwards and lay centered near Jubbulpore in Madhya Pradesh. The depression has caused vigorous monsoon in Chhattisgarh and Odisha with the principal amount of rainfall reported from Sarangarh, Raipur, Pendra and Kanker in Chhattisgarh and Sambalpur and Cuttack in Odisha (Figure 3-12).
Under its influence, a very heavy rainfall occurred in almost entire Chhattisgarh with a few adjoining areas of Odisha during 27-28 June. The area under the storm recorded 1-day maximum rainfall on 28 June and 2-day maximum rainfall for 27-28 June. The center of the rainstorm was located at Sarangarh (21.580 N, 83.080 E) in Chhattisgarh which recorded 309 mm and 397 mm of rainfall in 1 and 2 days respectively.
3.2.2.12 Rainstorm of 24 July 1937
The rainstorm of 24 July 1937 was caused by the depression formed in the northwest angle of the Bay of Bengal on 22 July. On 23 July, the Bay depression has intensified into a cyclonic storm of small extent and lay centered near Lat. 20.50 and Lon. 880 E. On 24 July, the Bay storm has moved in a northwestward direction and crossed the coast between Balasore and Chandbali. Later, it has weakened into a deep depression and lay centered between Balasore and Chaibasa. The Bay storm has caused vigorous monsoon in Odisha with the principal amount of rainfall reported from Jagatsingpur, Chandbali, Cuttack and Chandbali (Figure 3-12).
Under its influence, a very heavy rainfall occurred in almost entire Odisha with a few adjoining areas of Jharkhand on 24 July. The area under the storm recorded 1-day maximum rainfall on 24 July and the center of the rainstorm was located at Jagatsingpur (20.270 N, 86.170 E) in Odisha which recorded 301 mm of rainfall in 1-day.
3.2.2.13 Rainstorm of 25 July 1937
The rainstorm of 25 July 1937 was caused by the depression formed in the northwest angle of the Bay of Bengal on 22 July. The Bay depression has intensified into a cyclonic storm on 23 July and has weakened into a deep depression on 24 July near Balasore and Chandbali. On 25 July, the deep depression has moved in a western direction and lay centered over the east Central Provinces. The Bay depression has caused nearly general rainfall in eastern Maharashtra with the principal amount of rainfall reported from Pangree, Chandrapur and Amravati (Figure 3-12).
Under its influence, a very heavy rainfall occurred in almost entire eastern Maharashtra on 25 July. The area under the storm recorded 1-day maximum rainfall on 25 July and the center of the rainstorm was located at Pangree (21.420 N, 80.100 E) in Maharashtra which recorded 395 mm of rainfall in 1-day.
3.2.2.14 Rainstorm of 17 August 1939
The rainstorm of 17 August 1939 was caused by the unsettled conditions formed in the North Bay of Bengal on 15 August. On 16 August, the unsettled condition in the North Bay of

Estimation of PMP by Physical Approach
PMP Atlas for Mahanadi and Adjoining River Basins Page 88 of 260
Bengal has intensified into a storm and lay centered about 80 miles to the southeast of Calcutta. On 17 August, the Bay storm has crossed the coast and lay centered as a deep depression about 40 miles to the southeast of Chaibasa. On 18 August, the deep depression has moved westward and lay centered about 50 miles to the north-northwest of Sambalpur. The Bay depression has caused general rainfall in Odisha, West Bengal and Jharkhand with the principal amount of rainfall reported from Krishnanagar, Sambalpur and Balasore in Odisha, Chaibasa in Jharkhand and Calcutta in West Bengal (Figure 3-12).
Under its influence, a very heavy rainfall occurred in almost entire Odisha with a few adjoining areas of Jharkhand and West Bengal on 17 August. The area under the storm recorded 1-day maximum rainfall on 17 August and the center of the rainstorm was located at Krishnanagar (20.970 N, 84.470 E) in Odisha which recorded 203 mm of rainfall in 1-day.
3.2.2.15 Rainstorm of 17-19 August 1939
The rainstorm of 17-19 August 1939 was caused by the storm formed in the North Bay of Bengal on 16 August which lay centered to the southeast of Calcutta. On 17 August, the Bay storm has crossed the coast and lay centered as a deep depression about 40 miles to the southeast of Chaibasa in Jharkhand. On 18 August, the deep depression has moved westward and lay centered about 50 miles to the north-northwest of Sambalpur in Odisha. On 19 August, the deep depression has further moved in a westward direction and lay centered near Pendra in Chhattisgarh. On 20 August, the deep depression has weakened and moved in a westward direction which lay centered near Jabalpur in Madhya Pradesh. The Bay depression has caused general rainfall in the Central Provinces with the principal amount of rainfall reported from Ambagarh chowki, Kondapar, Mahasamund, Kanker, Pendra and Jagdalpur in Chhattisgarh, Chaibasa in Jharkhand and Sambalpur and Balasore in Odisha (Figure 3-12).
Under its influence, a very heavy rainfall occurred in almost entire Chhattisgarh with a few adjoining areas of Jharkhand and Odisha during 17-19 August. The area under the storm recorded 1-day maximum rainfall on 19 August, 2-day maximum rainfall for 18-19 August and 3-day maximum rainfall for 17-19 August. The center of the 1-day rainstorm was located at Ambagarh chowki (20.780 N, 80.730 E), 2-day rainstorm at Kondapar (21.720 N, 81.980 E) and 3-day rainstorm at Mahasamund (21.100 N, 82.100 E) in Chhattisgarh which recorded 311, 398 and 437 mm of rainfall respectively.
3.2.2.16 Rainstorm of 24-26 June 1940
The rainstorm of 24-26 June 1940 was caused by the unsettled conditions in the northwest Bay of Bengal which has developed into a depression and lay centered about 30 miles to the east of Chandbali on 24 June. On 25 June, the Bay depression has intensified into a cyclonic storm and lay centered about 60 miles to the west of the Sandheads. The cyclonic storm in the northwest Bay of Bengal has crossed the coast near Chandbali and lay centered as a depression near Raipur on 26 June. On 27 June, the depression has moved in a west-northwest direction and lay centered over the northwest Central Provinces. The monsoon has been vigorous in the east Central provinces and Odisha and strong in the west Central Provinces. The principal amount of rainfall was reported from Balandapara, Cuttack, Sambalpur and Gopalpur in Odisha, Chaibasa in Jharkhand and Calcutta in West Bengal (Figure 3-12).
Under its influence, a very heavy rainfall occurred in almost entire Odisha with a few adjoining areas of Jharkhand and West Bengal during 24-26 June. The area under the storm recorded 1-day maximum rainfall on 26 June, 2-day maximum rainfall for 25-26 June and 3-day maximum rainfall for 24-26 June. The center of the 1-day rainstorm was located at Maramsilli (20.550 N, 81.670 E) in Chhattisgarh which recorded 258 mm of rainfall. The center of the 2-day and 3-day rainstorm was located at Balandapara (20.500 N, 83.870 E) in Odisha which recorded 383 mm and 458 mm of rainfall in 2 and 3 days respectively.

Estimation of PMP by Physical Approach
PMP Atlas for Mahanadi and Adjoining River Basins Page 89 of 260
3.2.2.17 Rainstorm of 1 July 1940
The rainstorm of 1 July 1940 was caused by the deep depression formed on 30 June at the head of the Bay of Bengal with centre about 50 miles to the southeast of Sagar Island. On 1 July, the deep depression at the head of the Bay of Bengal has developed into a severe cyclonic storm and lay centered near Calcutta. On 2 July, the cyclonic storm has moved in a westward direction and lay centered as a depression near Ranchi. The monsoon has been vigorous in Odisha and strong in West Bengal with the principal amount of rainfall reported from Balasore, Chandbali, Cuttack and Sambalpur in Odisha, Chaibasa in Jharkhand and Calcutta in West Bengal (Figure 3-12).
Under its influence, a very heavy rainfall occurred in almost entire Odisha with a few adjoining areas of Jharkhand and West Bengal on 1 July. The area under the storm recorded 1-day maximum rainfall on 1 July and the center of the rainstorm was located at Balasore (21.490 N, 86.930 E) in Odisha which recorded 347 mm of rainfall in 1-day.
3.2.2.18 Rainstorm of 7-9 July 1940
The rainstorm of 7-9 July 1940 was caused by the unsettled conditions at the head of the Bay of Bengal which was formed on 6 July. On 7 July, it has developed into a cyclonic storm and lay centered about 70 miles to the southeast of Calcutta. On 8 July, the cyclonic storm has moved in a northwest direction and lay centered close to Calcutta. On 9 July, the cyclonic storm has weakened into a depression and lay centered about 50 miles to the east of Pendra in Chhattisgarh. On 10 July, the depression has slightly moved westward and lay centered about 50 miles to the west of Pendra. The Bay storm has caused vigorous monsoon in Odisha with the principal amount of rainfall reported from Bhograi, Athmalik, Barchana, Sambalpur, Cuttack and Gopalpur (Figure 3-12).
Under its influence, a very heavy rainfall occurred in almost entire Odisha with a few adjoining areas of Chhattisgarh and Jharkhand during 7-9 July. The area under the storm recorded 1-day maximum rainfall on 8 July, 2-day maximum rainfall for 8-9 July and 3-day maximum rainfall for 7-9 July. The center of the 1-day rainstorm was located at Bhograi (21.670 N, 87.370 E), 2-day rainstorm at Athmalik (20.720 N, 84.530 E) and 3-day rainstorm at Barchana (20.670 N, 86.120 E) in Odisha which recorded 244, 374 and 400 mm of rainfall respectively.
3.2.2.19 Rainstorm of 9 July 1940
The rainstorm of 9 July 1940 was caused by the cyclonic storm formed at the head of the Bay of Bengal on 7 July. On 8 July, the Bay storm lay centered close to southeast of Calcutta. On 9 July, the cyclonic storm has weakened into a depression and lay centered about 50 miles to the east of Pendra in Chhattisgarh. On 10 July, the depression has slightly moved westward and lay centered about 50 miles to the west of Pendra. The Bay storm has caused nearly general rainfall in Chhattisgarh with the principal amount of rainfall reported from Sarangarh, Pendra, Raipur and Kanker (Figure 3-12).
Under its influence, a very heavy rainfall occurred in almost entire Chhattisgarh on 9 July. The area under the storm recorded 1-day maximum rainfall on 9 July and the center of the rainstorm was located at Sarangarh (21.580 N, 83.080 E) in Chhattisgarh which recorded 225 mm of rainfall in 1-day.
3.2.2.20 Rainstorm of 10 July 1941
The rainstorm of 10 July 1941 was caused by the depression formed over the Sundarbans which lay centered near Calcutta on 8 July. On 9 July, the depression has moved in a southward direction into the head of the Bay of Bengal and lay centered about 30 miles to the east-southeast of Sagar Island. On 10 July, the Bay depression has intensified into a severe cyclonic storm and lay centered about 40 miles south of Sagar Island. On 11 July, the cyclonic storm has crossed the Odisha coast and lay centered as a deep depression

Estimation of PMP by Physical Approach
PMP Atlas for Mahanadi and Adjoining River Basins Page 90 of 260
over the east Central Provinces between Pendra and Raipur. The Bay storm has caused widespread rainfall in Odisha and the east Central Provinces with the principal amount of rainfall reported from Chandbali, Cuttack and Sambalpur in Odisha and Chaibasa in Jharkhand (Figure 3-13).
Under its influence, a very heavy rainfall occurred in almost entire Odisha with a few adjoining areas of Jharkhand and West Bengal on 10 July. The area under the storm recorded 1-day maximum rainfall on 10 July and the center of the rainstorm was located at Chandbali (20.780 N, 86.750 E) in Odisha which recorded 322 mm of rainfall in 1-day.
3.2.2.21 Rainstorm of 8 October 1941
The rainstorm of 8 October 1941 was caused by the deep depression formed in the southwest Bay of Bengal on 6 October which is centered within half a degree of Lat. 12.50 N and Lon. 81.50 E. On 7 October, the Bay depression has intensified into a cyclonic storm and lay centered close to the coast between Machilipatnam and Kakinada in Andhra Pradesh. On 8 October, the cyclonic storm has passed inland near Kakinada and lay centered as a deep depression near Jagdalpur in Chhattisgarh. On 9 October, the depression has moved in a northeastward direction and lay centered near Chota Nagpur. The Bay storm has caused widespread rainfall over the region extending from east Hyderabad and the north Madras coats to Bengal. The principal amount of rainfall was reported from Balasore, Chandbali, Cuttack and Gopalpur in Odisha, Jagdalpur, Kanker and Pendra in Chhattisgarh and Calcutta in West Bengal (Figure 3-13).
Under its influence, a very heavy rainfall occurred in almost entire Odisha with a few adjoining areas of Chhattisgarh and West Bengal on 8 October. The area under the storm recorded 1-day maximum rainfall on 8 October and the center of the rainstorm was located at Balasore (21.490 N, 86.930 E) in Odisha which recorded 323 mm of rainfall in 1-day.
3.2.2.22 Rainstorm of 1 August 1943
The rainstorm of 1 August 1943 was caused by the unsettled conditions formed at the head of the Bay of Bengal which has developed into a depression on 31July and lay centered near Lat. 200 N and Lon. 900 E. On 1 August, the depression has moved in a northwesterly direction and lay centered near Lat. 21.50 N and Lon. 87.50 E. On 2 August, the Bay depression has crossed the coast and lay centered over Chota Nagpur in Chhattisgarh. The Bay storm has caused widespread rainfall in Odisha with the principal amount of rainfall reported from Soro, Sambalpur and Cuttack (Figure 3-13).
Under its influence, a very heavy rainfall occurred in almost entire Odisha with adjoining areas of Chhattisgarh on 1 August. The area under the storm recorded 1-day maximum rainfall on 1 August and the center of the rainstorm was located at Soro (21.280 N, 86.700 E) in Odisha which recorded 479 mm of rainfall in 1-day.
3.2.2.23 Rainstorm of 20 August 1944
The rainstorm of 20 August 1944 was caused by the depression formed in the Bay of Bengal on 18 August which was centered at Lat. 200 N and Lon. 88.50 E. On 19 August, the Bay depression has intensified into a cyclonic storm and lay centered within half a degree of Lat. 200 N and Lon. 87.50 E. On 20 August, the depression over Odisha has moved in a westward direction and lay centered near Raipur in Chhattisgarh. On 21 August, the depression has further moved in a northwest direction and lay centered between Jabalpur and Seoni in Madhya Pradesh. The Bay storm has caused widespread rainfall in Odisha, the west Central Provinces and Chhattisgarh with the principal amount of rainfall reported from Phiringia, Raipur, Sambalpur and Cuttack in Odisha (Figure 3-13).
Under its influence, a very heavy rainfall occurred in almost entire Odisha with adjoining areas of Chhattisgarh and Madhya Pradesh on 20 August. The area under the storm

Estimation of PMP by Physical Approach
PMP Atlas for Mahanadi and Adjoining River Basins Page 91 of 260
recorded 1-day maximum rainfall on 20 August and the center of the rainstorm was located at Phiringia (20.350 N, 84.120 E) in Odisha which recorded 254 mm of rainfall in 1-day.
3.2.2.24 Rainstorm of 14-16 August 1948
The rainstorm of 14-16 August 1948 was caused by the depression formed in the Bay of Bengal on 13 August which lay centered near Lat. 190 N and Lon. 860 E. On 14 August, the Bay depression has intensified into a cyclonic storm and lay centered about 150 miles southwest of Calcutta. On 15 August, the Bay storm has crossed the coast near Chandbali and lay centered as a deep depression near Sambalpur in Odisha. On 16 August, the deep depression has moved in a northwest direction and lay centered near Pendra in Chhattisgarh. The Bay storm has caused very heavy rainfall in east central Provinces and Odisha with the principal amount of rainfall reported from Dhamtari, Raipur and Kanker in Chhattisgarh and Titilagarh and Puri in Odisha (Figure 3-13).
Under its influence, a very heavy rainfall occurred in almost entire Chhattisgarh with a few adjoining areas of Odisha during 14-16 August. The area under the storm recorded 1-day maximum rainfall on 15 August, 2-day maximum rainfall for 15-16 August and 3-day maximum rainfall for 14-16 August. The center of the rainstorm was located at Dhamtari (20.700 N, 81.570 E) in Chhattisgarh which recorded 308 mm, 507 mm and 512 mm of rainfall in 1, 2 and 3 days respectively.
3.2.2.25 Rainstorm of 18-19 June 1953
The rainstorm of 18-19 June 1953 was caused by the depression formed in the northwest Bay of Bengal on 17 June which was centered to the southeast of Puri. On 18 June, the Bay depression has intensified into a deep depression and lay centered about 50 miles east of Puri. On 19 June, the deep depression has intensified into a cyclonic storm and lay centered within half a degree of Lat. 19.50 N and Lon. 860 E. On 20 June, the cyclonic storm has crossed the Odisha coast and weakened into a depression. The Bay storm has caused widespread rainfall in coastal Andhra Pradesh and Odisha with the principal amount of rainfall reported from Thotapalli, Narasannapeta and Kalingapatnam in coastal Andhra Pradesh and Gopalpur and Koraput in Odisha (Figure 3-14).
Under its influence, a very heavy rainfall occurred in almost entire coastal Andhra Pradesh with a few adjoining areas of Odisha during 18-19 June. The area under the storm recorded 1-day maximum rainfall on 19 June and 2-day maximum rainfall for 18-19 June. The center of the rainstorm for 1-day duration was located at Thotapalli (18.780 N, 83.520 E) in Andhra Pradesh which recorded 217 mm of rainfall and the center of the rainstorm for 2-day duration was located at Narasannapeta (18.420 N, 84.050 E) in Andhra Pradesh which recorded 312 mm of rainfall.
3.2.2.26 Rainstorm of 4 August 1953
The rainstorm of 4 August 1953 was caused by the depression formed in the northwest angle of the Bay of Bengal on 3 August, which later intensified into a cyclonic storm about 100 miles south of Calcutta. On 3 August, the depression has moved in a northwest direction and crossed the coast near Balasore and lay centered as a deep depression near Sambalpur in Odisha. On 4 August, the deep depression has moved in a west-northwestward direction and lay centered as a depression about 80 miles southeast of Jabalpur in Madhya Pradesh. The Bay depression has caused widespread rainfall in Chhattisgarh, Odisha and Gangetic West Bengal with the principal amount of rainfall reported from Ambagarh chowki, Kanker and Raipur in Chhattisgarh and Balasore and Sambalpur in Odisha (Figure 3-14).
Under its influence, a very heavy rainfall occurred in almost entire Chhattisgarh with a few adjoining areas of Odisha on 4 August. The area under the storm recorded 1-day maximum

Estimation of PMP by Physical Approach
PMP Atlas for Mahanadi and Adjoining River Basins Page 92 of 260
rainfall on 4 August and the center of the rainstorm was located at Ambagarh chowki (20.780
N, 80.730 E) in Chhattisgarh which recorded 301 mm of rainfall in 1-day.
3.2.2.27 Rainstorm of 15 July 1958
The rainstorm of 15 July 1958 was caused by the unsettled conditions formed at the head of the Bay of Bengal on 13 July. On 14 July, the unsettled condition at the head of the Bay of Bengal becomes well marked and it has persisted until 15 July. In the evening of 15 July, a shallow depression was formed in the northwest angle of the Bay of Bengal with its centre close to coast near Contai in West Bengal. On 16 July, the shallow depression has crossed the coast between Balasore and Contai. The Bay depression has caused widespread rainfall in Chhattisgarh, Odisha and West Bengal with the principal amount of rainfall reported from Lakholi in Chhattisgarh and Sambalpur in Odisha.
Under its influence, a very heavy rainfall occurred in almost entire Chhattisgarh with a few adjoining areas of Odisha and West Bengal on 15 July. The area under the storm recorded 1-day maximum rainfall on 15 July and the center of the rainstorm was located at Bolangir (20.720 N, 83.480 E) in Chhattisgarh which recorded 326 mm of rainfall in 1-day.
3.2.2.28 Rainstorm of 1 July 1970
The rainstorm of 1 July 1970 was caused by the deep depression formed over the Bay of Bengal which crossed the north Odisha coast on 30 June. On 1 July, the deep depression has moved in a northwest direction and lay centered close to Jharsuguda in Odisha. On 2 July, the deep depression has weakened into a depression and lay centered between Umaria and Pendra. The monsoon was vigorous in Odisha and active in Chhattisgarh with the principal amount of rainfall was reported from Sonepur, Balangir, Angul, Titilagarh and Phulbani in Odisha and Pendra, Kanker and Durg in Chhattisgarh (Figure 3-15).
Under its influence, a very heavy rainfall occurred in almost entire Odisha with a few adjoining areas of Chhattisgarh on 1 July. The area under the storm recorded 1-day maximum rainfall on 1 July and the center of the rainstorm was located at Sonepur (20.850 N, 83.980 E) in Odisha which recorded 328 mm of rainfall in 1-day.
3.2.2.29 Rainstorm of 6-8 July 1973
The rainstorm of 6-8 July 1973 was caused by the depression formed over the Bay of Bengal on 5 July. On 6 July, the Bay depression lay centered within a half degree of Lat. 19.50 N and Lon. 86.50 E. On 7 July, the Bay depression has moved in a northwest direction and intensified into a deep depression which lay centered close to Odisha coast between Puri and Paradip. On 8 July, the deep depression has crossed the coast and lay centered over Chhattisgarh near Champa. On 9 July, the deep depression has weakened into a depression and lay centered near Narsinghpur in Madhya Pradesh. The Bay depression has caused widespread rainfall in Odisha and Chhattisgarh with the principal amount of rainfall reported from Madanpur rampur, Thuamulrampur, Sambalpur, Titilagarh and Cuttack in Odisha, Kanker, Raipur and Durg in Chhattisgarh (Figure 3-16).
Under its influence, a very heavy rainfall occurred in almost entire Odisha with a few adjoining areas of during 6-8 July. The area under the storm recorded 1-day maximum rainfall on 8 July, 2-day maximum rainfall for 7-8 July and 3-day maximum rainfall for 6-8 July. The center of the rainstorm for 1-day and 2-day duration was located at Madanpur rampur (20.200 N, 83.520 E) in Odisha which recorded 295 mm and 495 mm of rainfall respectively. The center of the rainstorm for 3-day duration was located at Thuamulrampur (19.550 N, 82.930 E) in Odisha which recorded 521 mm of rainfall.
3.2.2.30 Rainstorm of 20-22 November 1977
The rainstorm of 20-22 November 1977 was caused by the severe cyclonic storm with the core of hurricane winds in southwest Bay which lay centered at Lat. 12.600 N and Lon.

Estimation of PMP by Physical Approach
PMP Atlas for Mahanadi and Adjoining River Basins Page 93 of 260
82.500 E on 18 November. On 19 November, the severe cyclonic storm has moved in a northwesterly direction and lay centered near Lat. 15.200 N and Lon. 810 E. On 20 November, the severe storm has crossed the south Andhra coast near Chirala and lay centered as a deep depression over Telangana near Hanamkonda. On 21 November, the deep depression has weakened into a depression and lay centered over southeast Madhya Pradesh and adjoining interior Odisha with its centre near Jagdalpur. On 22 November, the depression has weakened into a trough. The Bay storm has caused widespread rainfall in coastal Andhra Pradesh and Odisha with the principal amount of rainfall reported from Salur, Makkuva, Bobbili, Guntur and Bhadrachalam in Andhra Pradesh and Phulbani and Gopalpur in Odisha.
Under its influence, a very heavy rainfall occurred in almost entire coastal Andhra Pradesh with a few adjoining areas of Odisha during 20-22 November. The area under the storm recorded 1-day maximum rainfall on 21 November, 2-day maximum rainfall for 20-21 November and 3-day maximum rainfall for 20-22 November. The center of the 1-day rainstorm was located at Salur (18.520 N, 83.200 E) in Andhra Pradesh, which recorded 181 mm of rainfall. The center of the 2-day and 3-day rainstorm was located at Narsipatnam (17.670 N, 82.620 E) in Andhra Pradesh, which recorded 325 and 328 mm of rainfall respectively.
3.2.2.31 Rainstorm of 28-30 August 1982
The rainstorm of 28-30 August 1982 was caused by the depression formed over northwest Bay of Bengal on 27 August. On 28 August, the Bay depression has crossed the Odisha coast. On 29 August, the depression has lay centered over north Odisha and adjoining Bihar Plateau. On 30, the depression has moved over west Bihar. The Bay depression has caused heavy to very heavy and widespread rainfall over and adjoining Bihar Plateau during 28-30 August (Figure 3-17).
Under its influence, a very heavy rainfall occurred in almost entire Odisha with a few adjoining areas of Bihar Plateau during 28-30 August. The area under the storm recorded 1-day maximum rainfall on 30 August, 2-day maximum rainfall for 29-30 August and 3-day maximum rainfall for 28-30 August. The center of the 1-day rainstorm was located at Bijepur (21.180 N, 83.470 E) which recorded 520 mm of rainfall. The center of the 2-day rainstorm was located at Phulbani (20.480 N, 84.230 E) which recorded 700 mm of rainfall. The center of the 3-day rainstorm was located at Dunguripalli (21.030 N, 83.550 E) which recorded 890 mm of rainfall.
3.2.2.32 Rainstorm of 22-24 July 1989
A deep depression was formed off the Andhra coast on 22 morning and moving westward it intensified into a cyclonic storm in the evening. It crossed the coast near Kalingapatnam in the early hours of 23 July and was centered 50 km southwest of Jagdalpur. It weakened into a deep depression in the evening of 23 July and lay close to Pusad. It then took a northwesterly course and weakened further into a depression on 25 July over north Gujarat (Figure 3-17).
The depression brought heavy and continuous rainfall to the lower portion of the Godavari River Basin for a period of 3 days. The area under the rainstorm recorded maximum 1-day rainfall on 23 July, 2-day maximum rainfall for 23-24 July and 3-day maximum rainfall for 22-24 July. Many stations recorded more than 250 mm of rainfall in 3 days during 22-24 July. The isohyetal patterns show that the centre of rainstorm was located at Kodur (16.52° N, 81.98° E), which recorded the highest rainfall of 422 mm. However, the centre of the rainstorm for 2 and 3-day durations was located at Tiruvur (17.11° E, 80.62° N), which recorded rainfall of 450 mm and 469 mm 2-day and 3-day respectively. The centre of this storm is close to the coast. Hence, due care should be taken while transposing this storm or using it in the hydro meteorological analysis.

Estimation of PMP by Physical Approach
PMP Atlas for Mahanadi and Adjoining River Basins Page 94 of 260
3.2.2.33 Rainstorm of 15-17 July 1991
The rainstorm of 15-17 July 1991 was caused by the low pressure area formed over the northwest Bay and neighbourhood on 14 July. On 15 July, the low pressure area becomes well marked with associated cyclonic circulation extending up to mid tropospheric levels and it has persisted till 16 July. On 17 July, the low pressure area has moved in a northwestward direction and lay centered over north Odisha and adjoining parts of Bihar Plateau. On 18 July, the low pressure area lay centered over northeast Madhya Pradesh and neighbourhood. The monsoon was active in Odisha and Gangetic West Bengal with the principal amount of rainfall reported from Tentalkhunti, Thuamulrampur and Phulbani in Odisha, Digha and Bankura in West Bengal and Jagdalpur in Chhattisgarh.
Under its influence, a very heavy rainfall occurred in almost entire Odisha with a few adjoining areas of West Bengal and Chhattisgarh during 15-17 July. The area under the storm recorded 1-day maximum rainfall on 17 July, 2-day maximum rainfall for 16-17 July and 3-day maximum rainfall for 15-17 July. The center of the 1-day rainstorm was located at Tentalkhunti (20.920 N, 83.420 E) in Odisha which recorded 347 mm of rainfall. The center of the 2-day and 3-day rainstorm was located at Thuamulrampur (19.550 N, 82.930 E) in Odisha which recorded 510 and 595 mm of rainfall respectively.
3.2.2.34 Rainstorm of 20-22 July 1991
The rainstorm of 20-22 July 1991 was caused by the cyclonic circulation over North Bay on 20 July. Under the influence of the cyclonic circulation, a low pressure area has been formed over the North Bay on 21 July. On 22 July, the low pressure area over the North Bay lay centered over Gangetic west Bengal and adjoining Bihar Plateau with associated cyclonic circulation. It has caused active monsoon over Odisha, Gangetic West Bengal and west Madhya Pradesh with the principal amount of rainfall reported from Binjharpur, Paradip, Phulbani and Balasore in Odisha, Chaibasa in Jharkhand and Medinipur in West Bengal.
Under its influence, a very heavy rainfall occurred in almost entire Odisha with a few adjoining areas of Jharkhand and West Bengal during 20-22 July. The area under the storm recorded 1-day maximum rainfall on 21 July, 2-day maximum rainfall for 20-21 July and 3-day maximum rainfall for 20-22 July. The center of the rainstorm was located at Binjharpur (20.730 N, 86.400 E) in Odisha which recorded 300 mm, 520 mm and 521 mm of rainfall in 1, 2 and 3 days respectively.
3.2.2.35 Rainstorm of 11-13 August 1991
The rainstorm of 11-13 August 1991 was caused by the low pressure area formed over northwest Bay and neighbourhood on 10 August. On 11 August, the low pressure area lay centered over northwest Bay and adjoining land areas of Odisha and Gangetic West Bengal with associated cyclonic circulation. On 12 August, the low pressure area persisted and becomes well marked. On 13 August, the low pressure area lay centered over north Odisha and adjoining Gangetic West Bengal and sea areas. The monsoon was vigorous in Odisha, Gangetic West Bengal and east Madhya Pradesh with the principal amount of rainfall reported from Rajkishorengr, Phiringia, Phulbani, Puri and Chandbali in Odisha.
Under its influence, a very heavy rainfall occurred in almost entire Odisha with a few adjoining areas of Chhattisgarh and West Bengal during 11-13 August. The area under the storm recorded 1-day maximum rainfall on 12 August, 2-day maximum rainfall for 12-13 August and 3-day maximum rainfall for 11-13 August. The center of the 1-day rainstorm was located at Rajkishorengr (20.970 N, 84.470 E) in Odisha which recorded 339 mm of rainfall. The center of the 2-day and 3-day rainstorm was located at Phiringia (20.350 N, 84.120 E) in Odisha which recorded 616 and 676 mm of rainfall respectively.

Estimation of PMP by Physical Approach
PMP Atlas for Mahanadi and Adjoining River Basins Page 95 of 260
3.2.2.36 Rainstorm of 14-16 June 1994
The rainstorm of 14-16 June 1994 was caused by the cyclonic circulation over north Odisha and neighbourhood in the lower tropospheric levels on 13 June. On 14 June, the cyclonic circulation over north Odisha and neighbourhood has lay centered as a low pressure area over Bihar Plateau and neighbourhood with associated cyclonic circulation extending up to mid-tropospheric levels. On 15 June, the low pressure area lay centered over the Gangetic west Bengal and the adjoining parts of Bihar Plateau. On 16 June, the low pressure area over the Gangetic West Bengal persisted and has caused vigorous monsoon in Chhattisgarh, Odisha and Gangetic west Bengal. The principal amount of rainfall was reported from Dhabara, Raipur and Pendra in Chhattisgarh, Sambalpur and Jharsuguda in Odisha and Jalpaiguri in West Bengal.
Under its influence, a very heavy rainfall occurred in almost entire Chhattisgarh with a few adjoining areas of Odisha and West Bengal during 14-16 June. The area under the storm recorded 1-day maximum rainfall on 15 June, 2-day maximum rainfall for 15-16 June and 3-day maximum rainfall for 14-16 June. The center of the rainstorm was located at Dhabara/dabra (21.780 N, 83.080 E) in Chhattisgarh which recorded 458 mm, 544 mm and 587 mm of rainfall in 1, 2 and 3 days respectively.
3.2.2.37 Rainstorm of 26-28 August 2003
The rainstorm of 26-28 August 2003 was caused by the feeble low pressure area formed over central and adjoining North Bay on 25 August. On 26 August, the feeble low pressure area over North Bay lay centered as a low pressure area over northwest Bay with associated cyclonic circulation. On 27 August, the low pressure area becomes well marked and concentrated into a depression which lay centered within half a degree of Lat. 20.50 N and Lon. 88.50 E. On 28 August, the depression has moved in a west-northwesterly direction and crossed the coast north of Chandbali and lay centered within half a degree of Lat. 210 N and Lon. 85.50 E. The monsoon was vigorous in Odisha and active in Chhattisgarh with the principal amount of rainfall reported from Thuamulrampur, Balangir, Paradip and Angul in Odisha (Figure 3-18).
Under its influence, a very heavy rainfall occurred in almost entire Odisha with a few adjoining areas of West Bengal and Chhattisgarh during 26-28 August. The area under the storm recorded 1-day maximum rainfall on 27 August, 2-day maximum rainfall for 26-27 August and 3-day maximum rainfall for 26-28 August. The center of the rainstorm was located at Thuamulrampur (19.550 N, 82.930 E) in Odisha which recorded 542 mm, 842 mm and 915 mm of rainfall in 1, 2 and 3 days respectively.
3.2.2.38 Rainstorm of 12-14 June 2004
The rainstorm of 12-14 June 2004 was caused by the depression formed in the east central Bay which moved slightly in a westward direction and lay centered about 650 km southeast of Bhubaneshwar on 11 June. On 12 June, the depression has moved in a northwest direction and intensified into a deep depression which lay centered about 300 km southeast of Gopalpur. On 13 June, the deep depression has further moved in a northwest direction and crossed the south Odisha coast which lay centered close to Puri. On 14 June, the deep depression lay centered close to Jharsuguda in Odisha. The southwest monsoon has been active in Odisha and Gangetic West Bengal with the principal amount of rainfall reported from Thuamulrampur, Balasore, Chandbali and Keonjhargarh in Odisha and Digha in West Bengal (Figure 3-18).
Under its influence, a very heavy rainfall occurred in almost entire Odisha with a few adjoining areas of West Bengal during 12-14 June. The area under the storm recorded 1-day maximum rainfall on 13 June, 2-day maximum rainfall for 12-13 June and 3-day maximum rainfall for 12-14 June. The center of the rainstorm was located at Thuamulrampur (19.550 N,

Estimation of PMP by Physical Approach
PMP Atlas for Mahanadi and Adjoining River Basins Page 96 of 260
82.930 E) in Odisha which recorded 475 mm, 600 mm and 694 mm of rainfall in 1, 2 and 3 days respectively.
3.2.2.39 Rainstorm of 2-4 August 2006
The rainstorm of 2-4 August 2006 was caused by the low pressure area formed over North Bay off West Bengal-Odisha coast on 1 August. On 2 August, the low pressure area becomes well marked and concentrated into a depression which lay centered about 100 km east-southeast of Chandbali. On 3 August, the depression further intensified into a deep depression and crossed the south Odisha coast between Puri and Gopalpur which lay centered about 50 km north-northeast of Gopalpur. On 4 August, the deep depression has moved in a west-northwestward direction and lay centered over Chhattisgarh and adjoining Odisha about 100 km northeast of Jagdalpur. The southwest monsoon has been active over Odisha and coastal Andhra Pradesh with the principal amount of rainfall reported from Thuamulrampur, Jagdalpur, Gopalpur, Chandbali and Balasore in Odisha and Kalingapatnam and Kakinada in coastal Andhra Pradesh.
Under its influence, a very heavy rainfall occurred in almost entire Odisha with a few adjoining areas of coastal Andhra Pradesh during 2-4 August. The area under the storm recorded 1-day maximum rainfall on 3 August, 2-day maximum rainfall for 2-3 August and 3-day maximum rainfall for 2-4 August. The center of the rainstorm was located at Thuamulrampur (19.550 N, 82.930 E) in Odisha which recorded 450 mm, 600 mm and 734 mm of rainfall in 1, 2 and 3 days respectively.
3.2.2.40 Rainstorm of 4-6 August 2007
The rainstorm of 4-6 August 2007 was caused by the cyclonic circulation formed over northwest and adjoining west central Bay off West Bengal-Odisha coast on 3 August. Under the influence of the cyclonic circulation, a low pressure area was formed over the same area on 4 August. On 5 August, the low pressure area has concentrated into a depression and lay centered about 230 km southeast of Balasore. It later moved in a westward direction and concentrated into a deep depression which lay centered about 100 km southeast of Chandbali. On 6 August, the depression has moved northwestward and lay centered close to Paradip. It further moved in a west-northwestward direction and crossed the Odisha coast to the north of Paradip and it then moved in a westward direction which lay centered over interior Odisha close to Phulbani on the same day. The southwest monsoon was vigorous in Odisha with the principal amount of rainfall reported from Kantapara, Naugaon, Paradip, Puri, Chandbali and Bhubaneshwar in Odisha (Figure 3-18).
Under its influence, a very heavy rainfall occurred in almost entire Odisha during 4-6 August. The area under the storm recorded 1-day maximum rainfall on 5 August, 2-day maximum rainfall for 5-6 August and 3-day maximum rainfall for 4-6 August. The center of the 1-day rainstorm was located at Kantapara (20.250 N, 85.920 E) in Odisha which recorded 335 mm of rainfall. The center of the 2-day and 3-day rainstorm was located at Naugaon (20.250 N, 85.170 E) in Odisha which recorded 565 and 575 mm of rainfall respectively.
3.2.2.41 Rainstorm of 5-7 August 2007
The rainstorm of 5-7 August 2007 was caused by the low pressure area formed over northwest Bay off West Bengal-Odisha coast on 4 August. On 5 August, the low pressure area has concentrated into a depression and lay centered about 230 km southeast of Balasore, which later moved in a westward direction and lay centered about 150 km southeast of Chandbali. On 6 August, the depression has moved northwestward and lay centered close to Paradip. It further moved in a west-northwestward direction and crossed the Odisha coast to the north of Paradip and it then moved in a westward direction which lay centered over interior Odisha close to Phulbani on the same day. On 7 August, the deep depression has moved in a west-northwesterly direction and weakened into a depression which lay centered over Chhattisgarh close to Raipur. The southwest monsoon was vigorous

Estimation of PMP by Physical Approach
PMP Atlas for Mahanadi and Adjoining River Basins Page 97 of 260
in Odisha with the principal amount of rainfall reported from Thuamulrampur, Umerkote, Kosagumuda, Titilagarh and Koraput in Odisha and Jagdalpur in Chhattisgarh (Figure 3-18).
Under its influence, a very heavy rainfall occurred in almost entire Odisha with a few adjoining areas of Chhattisgarh during 5-7 August. The area under the storm recorded 1-day maximum rainfall on 7 August, 2-day maximum rainfall for 6-7 August and 3-day maximum rainfall for 5-7 August. The center of the rainstorm was located at Thuamulrampur (19.550 N, 82.930 E) in Odisha which recorded 430 mm, 665 mm and 765 mm of rainfall in 1, 2 and 3 days respectively.
3.2.2.42 Rainstorm of 13 August 2007
The rainstorm of 13 August 2007 was caused by the low pressure area formed over northwest Bay off West Bengal-Odisha coast on 10 August. On 11 August, the low pressure area persisted over the same area with associated cyclonic circulation. On 12 August, the low pressure area becomes well marked over the same area. On 13 August, the low pressure area over northwest Bay off West Bengal-Odisha coast has lay centered over Gangetic West Bengal and neighbourhood with associated cyclonic circulation extending up to mid-tropospheric levels. It has caused widespread rainfall in Odisha, Gangetic West Bengal, Chhattisgarh and Jharkhand. The principal amount of rainfall was reported from Bijatala, Bhograi, Thakurmunda, Jashipur, Balasore and Chandbali in Odisha, Jamshedpur in Jharkhand, Jagdalpur in Chhattisgarh and Digha in West Bengal.
Under its influence, a very heavy rainfall occurred in almost entire Odisha with a few adjoining areas of Chhattisgarh, Gangetic West Bengal and Jharkhand on 13 August. The area under the storm recorded 1-day maximum rainfall on 13 August and the center of the rainstorm was located at Bijatala (22.170 N, 86.250 E) in Odisha which recorded 375 mm of rainfall in 1-day.
3.2.2.43 Rainstorm of 16-18 September 2008
The rainstorm of 16-18 September 2008 was caused by the low pressure area formed over North Bay of Bengal on 15 September, which later concentrated into a depression and lay centered about 250 km east-southeast of Paradip. On 16 September, it moved in a northwestward direction and further intensified into a deep depression which lay centered about 130 km southeast of Chandbali. On 17 September, it moved in a west-northwestward direction and crossed the Odisha coast near Chandbali and lay centered over north Odisha near Keonjhargarh. In the evening of 17 September, the deep depression has moved slightly northwestwards and lay centered over north Odisha close to Jharsuguda. On 18 September, it further moved west-northwestward and lay centered over north Chhattisgarh about 50 km north of Champa. The southwest monsoon was vigorous in Odisha and active in Gangetic West Bengal with the principal amount of rainfall reported from Jujomura, Titilagarh, Jharsuguda and Phulbani in Odisha, Raipur in Chhattisgarh and Digha in West Bengal (Figure 3-18).
Under its influence, a very heavy rainfall occurred in almost entire Odisha with a few adjoining areas of Chhattisgarh and Gangetic West Bengal during 16-18 September. The area under the storm recorded 1-day maximum rainfall on 18 September, 2-day maximum rainfall for 17-18 September and 3-day maximum rainfall for 16-18 September. The center of the rainstorm was located at Jujomura (21.170 N, 84.080 E) in Odisha which recorded 355 mm, 506 mm and 529 mm of rainfall in 1, 2 and 3 days respectively.
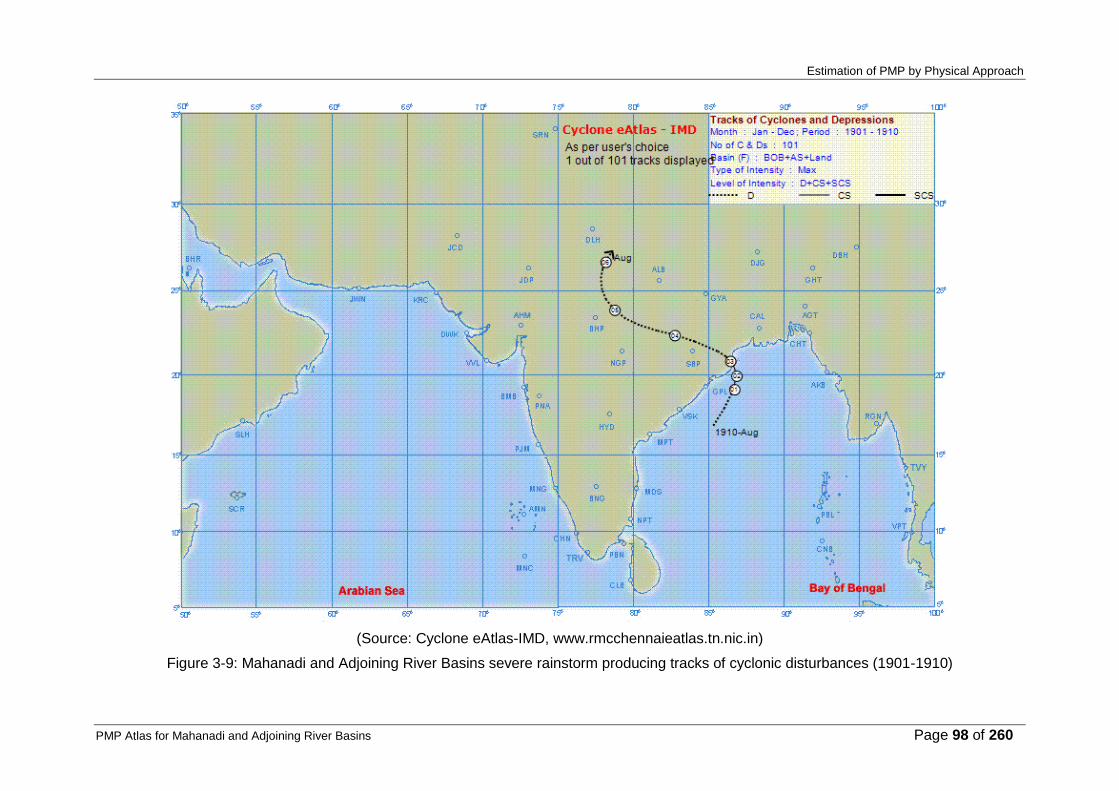
Estimation of PMP by Physical Approach
PMP Atlas for Mahanadi and Adjoining River Basins Page 98 of 260
(Source: Cyclone eAtlas-IMD, www.rmcchennaieatlas.tn.nic.in)
Figure 3-9: Mahanadi and Adjoining River Basins severe rainstorm producing tracks of cyclonic disturbances (1901-1910)

Estimation of PMP by Physical Approach
PMP Atlas for Mahanadi and Adjoining River Basins Page 99 of 260
(Source: Cyclone eAtlas-IMD, www.rmcchennaieatlas.tn.nic.in)
Figure 3-10: Mahanadi and Adjoining River Basins severe rainstorm producing tracks of cyclonic disturbances (1911-1920)

Estimation of PMP by Physical Approach
PMP Atlas for Mahanadi and Adjoining River Basins Page 100 of 260
(Source: Cyclone eAtlas-IMD, www.rmcchennaieatlas.tn.nic.in)
Figure 3-11: Mahanadi and Adjoining River Basins severe rainstorm producing tracks of cyclonic disturbances (1921-1930)

Estimation of PMP by Physical Approach
PMP Atlas for Mahanadi and Adjoining River Basins Page 101 of 260
(Source: Cyclone eAtlas-IMD, www.rmcchennaieatlas.tn.nic.in)
Figure 3-12: Mahanadi and Adjoining River Basins severe rainstorm producing tracks of cyclonic disturbances (1931-1940)

Estimation of PMP by Physical Approach
PMP Atlas for Mahanadi and Adjoining River Basins Page 102 of 260
(Source: Cyclone eAtlas-IMD, www.rmcchennaieatlas.tn.nic.in)
Figure 3-13: Mahanadi and Adjoining River Basins severe rainstorm producing tracks of cyclonic disturbances (1941-1950)

Estimation of PMP by Physical Approach
PMP Atlas for Mahanadi and Adjoining River Basins Page 103 of 260
(Source: Cyclone eAtlas-IMD, www.rmcchennaieatlas.tn.nic.in)
Figure 3-14: Mahanadi and Adjoining River Basins severe rainstorm producing tracks of cyclonic disturbances (1951-1960)

Estimation of PMP by Physical Approach
PMP Atlas for Mahanadi and Adjoining River Basins Page 104 of 260
(Source: Cyclone eAtlas-IMD, www.rmcchennaieatlas.tn.nic.in)
Figure 3-15: Mahanadi and Adjoining River Basins severe rainstorm producing tracks of cyclonic disturbances (1961-1970)

Estimation of PMP by Physical Approach
PMP Atlas for Mahanadi and Adjoining River Basins Page 105 of 260
(Source: Cyclone eAtlas-IMD, www.rmcchennaieatlas.tn.nic.in)
Figure 3-16: Mahanadi and Adjoining River Basins severe rainstorm producing tracks of cyclonic disturbances (1971-1980)

Estimation of PMP by Physical Approach
PMP Atlas for Mahanadi and Adjoining River Basins Page 106 of 260
(Source: Cyclone eAtlas-IMD, www.rmcchennaieatlas.tn.nic.in)
Figure 3-17: Mahanadi and Adjoining River Basins severe rainstorm producing tracks of cyclonic disturbances (1981-1990)

Estimation of PMP by Physical Approach
PMP Atlas for Mahanadi and Adjoining River Basins Page 107 of 260
(Source: Cyclone eAtlas-IMD, www.rmcchennaieatlas.tn.nic.in)
Figure 3-18: Mahanadi and Adjoining River Basins severe rainstorm producing tracks of cyclonic disturbances (2001-2010)

Estimation of PMP by Physical Approach
PMP Atlas for Mahanadi and Adjoining River Basins Page 108 of 260
3.2.3 DAD (DEPTH AREA DURATION) ANALYSIS OF RAINSTORMS
Rainstorm analysis considers the rainstorm as a unit of the study. In the DAD analysis of rainstorms, the greatest depth of precipitation experienced over various areas and durations were determined. Considering the orography of the basin, rainstorm analysis has been confined mostly to plain areas of the basin. Preparation of isohyetal maps for selected rainstorms is the first step in the DAD analysis. This study considers 126 rainstorms for 1-day, 85 rainstorms for 2-day and 69 rainstorms for 3-day. Out of these storms, isohyetal patterns for 1926-Bichhia, 1927-Champua, 1989-Kodur and 1982-Bijepur storms were available from isopluvial maps of India, IITM Pune and IMD and the same were adopted. These published isohyetal maps were digitized and georeferenced in GIS software for further use. Isohyetal maps for other storms were prepared by using geospatial techniques. Rainfall data for the duration of storms within the basin and adjoining areas was considered in the preparation of isohyetal maps. In the next step of DAD analysis, the area between successive isohyets was estimated by using GIS software. The average rain depths were then estimated by applying the area-volume method. The average rain depths were plotted against the accumulated area and smooth DAD curves were drawn. The starting point in the curve was taken as the peak rainfall of the storm. Such curves were drawn for considered rainstorms individually for 1-day, 2-day and 3-day durations. Using DAD curves, rainfall values for standard areas such as 100; 500; 1,000; 10,000 sq. km. for 1-day, 2-day and 3-day durations for each analyzed rainstorm were estimated and are given in Table 3-3 to Table 3-5. Isohyetal patterns of these rainstorms are shown in Volume II. DAD curves for each storm and duration have been provided in Volume II. While using the DAD values from the table, user may avoid linear interpolation for any intermediate area. It is suggested to fit the equation using the DAD curve upto 10 times the required area to estimate the required rainfall depth.

Estimation of PMP by Physical Approach
PMP Atlas for Mahanadi and Adjoining River Basins Page 109 of 260
Table 3-3: DAD Values (mm) over different standard areas (sq. km.) for 1-day duration contributed by rainstorms in and around Mahanadi and Adjoining River Basins
Sr. No.
Storm Date Storm Centre Peak
Rainfall (mm)
Area in sq. km. (All rainfall values are in mm) (k = 1000)
100 200 500 1k 1.5k 2k 3k 4k 5k 7.5k 10k 20k 30k 40k 50k 60k 70k 80k 90k 100k
1 28 Jul 1905 Burdwan 299 293 287 278 274 267 260 249 240 234 223 214 194 178 163 149
2 26 Jun 1908 Sakoli 384 362 350 332 314 300 289 270 255 242 218 203 175 160
3 02 Aug 1908 Gadchiroli 320 309 303 291 281 273 267 258 251 244 231 221 195 178 164 153
4 27 Sep 1908 Ramachandrapuram 369 280 243 193 147 125 110
5 30 Aug 1909 Vishnupur 344 312 302 288 273 265 257 247 239 231 217 210 187 171 159 147
6 04 Aug 1910 Kurud 381 357 345 324 307 296 288 275 267 260 250 239 214 198 186 174 166 158 151 144 138
7 03 Aug 1912 Armori 304 274 263 243 223 208 200 185 172 165 146 133 98
8 25 Jun 1914 Koraput 337 330 325 311 294 281 270 249 230 212 180 156
9 03 Aug 1915 Jagatsingpur 321 309 301 284 266 253 242 228 218 213 205 197 173 154 138 125 115 109 104 100 97
10 01 Aug 1917 Hunterganj 467 448 437 414 388 370 356 333 315 301 272 248 193 164 145 131
11 16 Jun 1918 Sonepur 366 335 325 313 298 288 280 267 256 247 230 218 189 176 164 154 146 139 131 125 119
12 18 Jun 1918 Gondia 347 323 312 288 267 250 236 214 196 184 160 144 110
13 19 Nov 1923 Itchapuram 351 345 341 329 313 299 286 262 241 223 190 167 121 99 83
14 27 Jun 1925 Kendrapara 402 394 388 374 357 343 331 311 295 281 252 228 176 154 138 128
15 28 Jun 1925 Balandapara 327 326 325 321 316 311 306 297 292 284 272 264 235 212 196 187 182 176 168 160 153
16 29 Jun 1925 Jharsuguda 350 347 342 338 330 323 317 306 297 290 274 262 232 214 201 190 180 172 164 157 150
17 17 Aug 1926 Phulbani 320 306 298 293 286 279 273 263 256 251 241 233 209 191 177 164 154 145 136 128 121
18 21 Sep 1926 Bichhia 359 359 359 357 355 352 350 345 337 330 312 300 262 239 220 202 188 173 160 151 141
19 30 Jul 1927 Champua 565 558 551 531 503 479 457 427 410 398 364 339 271 232 210 189 172 158 146 135 124
20 24 Aug 1929 Sarangarh 210 206 204 201 195 193 190 186 184 181 177 172 156 142 131 123 117 111 106 102 98
21 15 Aug 1931 Jeypore 275 248 232 212 192 177 166 149 135 123 101 86
22 21 Aug 1931 Angul 257 243 234 227 222 220 218 214 212 210 205 201 185 173 163 153 146 139 133 128 123
23 14 Oct 1931 Pottangi 546 521 504 488 473 461 449 430 414 397 360 331 252 202 169
24 04 Aug 1933 Cuttak 321 308 300 289 275 263 251 238 227 220 204 193 168 153 142 132 125 121 116 111 107
25 19 Oct 1933 Polavaram 259 257 254 245 233 223 215 202 191 181 161 146 110
26 22 Aug 1934 Mahuadaur 293 281 275 262 248 237 228 214 203 195 181 173 153 139 132 124
27 14 Jun 1936 Balandapara 338 334 330 320 308 298 291 280 272 269 259 251 221 200 183 171 160 151 143 135 129
28 15 Jun 1936 Balandapara 395 379 358 322 288 272 262 248 238 236 228 222 209 192 177 164 154 146 138 131 124
29 28 Jun 1937 Sarangarh 309 300 291 278 265 254 245 236 226 219 206 197 176 161 152 143 138 132 127 123 119
30 24 Jul 1937 Jagatsingpur 301 299 296 292 286 277 270 256 244 234 216 205 174 158 144 133 123 116 109 103 97
31 25 Jul 1937 Pangree 395 330 312 296 279 265 252 233 220 207 183 165 114
32 17 Aug 1939 Krishnanagar 203 195 188 177 166 159 156 150 145 142 138 134 122 116 108 102 97 92 87 83 80
33 19 Aug 1939 Ambagarh chowki 311 309 307 302 294 288 283 275 268 264 253 245 219 200 184 171 159 149 139 130
34 26 Jun 1940 Maramsilli 258 251 244 231 217 211 209 206 204 201 198 195 179 169 160 155 148 143 139 135 131
35 01 Jul 1940 Balasore 347 337 330 314 294 279 267 251 240 230 217 206 178 160 145 132 120 110 101 93 86
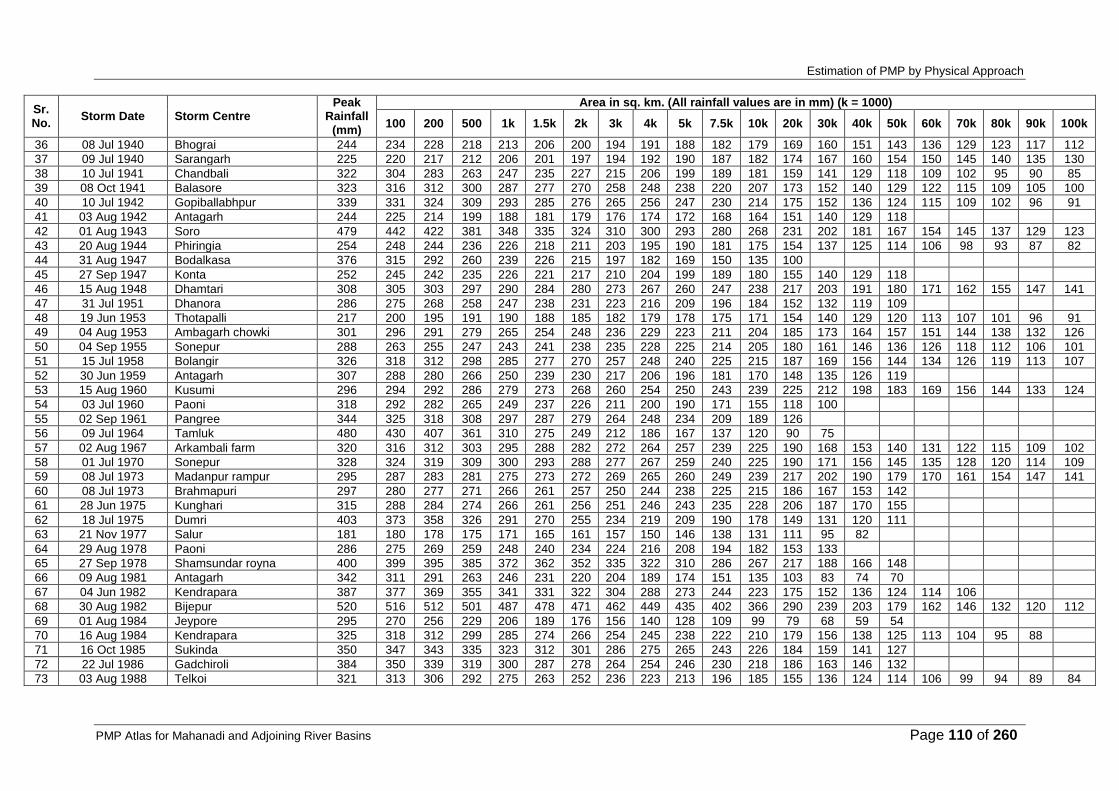
Estimation of PMP by Physical Approach
PMP Atlas for Mahanadi and Adjoining River Basins Page 110 of 260
Sr. No.
Storm Date Storm Centre Peak
Rainfall (mm)
Area in sq. km. (All rainfall values are in mm) (k = 1000)
100 200 500 1k 1.5k 2k 3k 4k 5k 7.5k 10k 20k 30k 40k 50k 60k 70k 80k 90k 100k
36 08 Jul 1940 Bhograi 244 234 228 218 213 206 200 194 191 188 182 179 169 160 151 143 136 129 123 117 112
37 09 Jul 1940 Sarangarh 225 220 217 212 206 201 197 194 192 190 187 182 174 167 160 154 150 145 140 135 130
38 10 Jul 1941 Chandbali 322 304 283 263 247 235 227 215 206 199 189 181 159 141 129 118 109 102 95 90 85
39 08 Oct 1941 Balasore 323 316 312 300 287 277 270 258 248 238 220 207 173 152 140 129 122 115 109 105 100
40 10 Jul 1942 Gopiballabhpur 339 331 324 309 293 285 276 265 256 247 230 214 175 152 136 124 115 109 102 96 91
41 03 Aug 1942 Antagarh 244 225 214 199 188 181 179 176 174 172 168 164 151 140 129 118
42 01 Aug 1943 Soro 479 442 422 381 348 335 324 310 300 293 280 268 231 202 181 167 154 145 137 129 123
43 20 Aug 1944 Phiringia 254 248 244 236 226 218 211 203 195 190 181 175 154 137 125 114 106 98 93 87 82
44 31 Aug 1947 Bodalkasa 376 315 292 260 239 226 215 197 182 169 150 135 100
45 27 Sep 1947 Konta 252 245 242 235 226 221 217 210 204 199 189 180 155 140 129 118
46 15 Aug 1948 Dhamtari 308 305 303 297 290 284 280 273 267 260 247 238 217 203 191 180 171 162 155 147 141
47 31 Jul 1951 Dhanora 286 275 268 258 247 238 231 223 216 209 196 184 152 132 119 109
48 19 Jun 1953 Thotapalli 217 200 195 191 190 188 185 182 179 178 175 171 154 140 129 120 113 107 101 96 91
49 04 Aug 1953 Ambagarh chowki 301 296 291 279 265 254 248 236 229 223 211 204 185 173 164 157 151 144 138 132 126
50 04 Sep 1955 Sonepur 288 263 255 247 243 241 238 235 228 225 214 205 180 161 146 136 126 118 112 106 101
51 15 Jul 1958 Bolangir 326 318 312 298 285 277 270 257 248 240 225 215 187 169 156 144 134 126 119 113 107
52 30 Jun 1959 Antagarh 307 288 280 266 250 239 230 217 206 196 181 170 148 135 126 119
53 15 Aug 1960 Kusumi 296 294 292 286 279 273 268 260 254 250 243 239 225 212 198 183 169 156 144 133 124
54 03 Jul 1960 Paoni 318 292 282 265 249 237 226 211 200 190 171 155 118 100
55 02 Sep 1961 Pangree 344 325 318 308 297 287 279 264 248 234 209 189 126
56 09 Jul 1964 Tamluk 480 430 407 361 310 275 249 212 186 167 137 120 90 75
57 02 Aug 1967 Arkambali farm 320 316 312 303 295 288 282 272 264 257 239 225 190 168 153 140 131 122 115 109 102
58 01 Jul 1970 Sonepur 328 324 319 309 300 293 288 277 267 259 240 225 190 171 156 145 135 128 120 114 109
59 08 Jul 1973 Madanpur rampur 295 287 283 281 275 273 272 269 265 260 249 239 217 202 190 179 170 161 154 147 141
60 08 Jul 1973 Brahmapuri 297 280 277 271 266 261 257 250 244 238 225 215 186 167 153 142
61 28 Jun 1975 Kunghari 315 288 284 274 266 261 256 251 246 243 235 228 206 187 170 155
62 18 Jul 1975 Dumri 403 373 358 326 291 270 255 234 219 209 190 178 149 131 120 111
63 21 Nov 1977 Salur 181 180 178 175 171 165 161 157 150 146 138 131 111 95 82
64 29 Aug 1978 Paoni 286 275 269 259 248 240 234 224 216 208 194 182 153 133
65 27 Sep 1978 Shamsundar royna 400 399 395 385 372 362 352 335 322 310 286 267 217 188 166 148
66 09 Aug 1981 Antagarh 342 311 291 263 246 231 220 204 189 174 151 135 103 83 74 70
67 04 Jun 1982 Kendrapara 387 377 369 355 341 331 322 304 288 273 244 223 175 152 136 124 114 106
68 30 Aug 1982 Bijepur 520 516 512 501 487 478 471 462 449 435 402 366 290 239 203 179 162 146 132 120 112
69 01 Aug 1984 Jeypore 295 270 256 229 206 189 176 156 140 128 109 99 79 68 59 54
70 16 Aug 1984 Kendrapara 325 318 312 299 285 274 266 254 245 238 222 210 179 156 138 125 113 104 95 88
71 16 Oct 1985 Sukinda 350 347 343 335 323 312 301 286 275 265 243 226 184 159 141 127
72 22 Jul 1986 Gadchiroli 384 350 339 319 300 287 278 264 254 246 230 218 186 163 146 132
73 03 Aug 1988 Telkoi 321 313 306 292 275 263 252 236 223 213 196 185 155 136 124 114 106 99 94 89 84

Estimation of PMP by Physical Approach
PMP Atlas for Mahanadi and Adjoining River Basins Page 111 of 260
Sr. No.
Storm Date Storm Centre Peak
Rainfall (mm)
Area in sq. km. (All rainfall values are in mm) (k = 1000)
100 200 500 1k 1.5k 2k 3k 4k 5k 7.5k 10k 20k 30k 40k 50k 60k 70k 80k 90k 100k
74 23 Jul 1989 Kodur 422 421 420 417 412 407 403 394 386 378 361 345 310 283 258 238 221 205 191 179 170
75 22 Aug 1990 Armori 302 288 284 274 263 256 250 241 234 229 220 213 193 176 161 148
76 04 Nov 1990 Digapahandi 445 366 337 311 291 278 270 261 251 246 230 217 184 161 142 125
77 17 Jul 1991 Tentalkhunti 347 315 301 293 281 271 265 254 246 238 222 208 169 147 133 123 113 107 100 94
78 21 Jul 1991 Binjharpur 300 270 255 244 229 217 208 196 188 180 167 157 130 112
79 12 Aug 1991 Rajkishorengr 339 321 313 303 286 272 262 243 230 218 199 187 155 138 126 116 108 102 96
80 16 Aug 1991 Gadchiroli 285 274 267 248 221 201 190 179 172 167 156 148 127 114 105 97
81 27 Jul 1992 Tumudibandh 301 291 282 264 246 234 227 214 204 197 187 179 164 159 151 144 137 130 125 119 114
82 28 Jul 1992 Bijepur 475 448 432 398 363 339 324 307 298 289 276 264 238 218 202 189 179 170 163 156 150
83 15 Aug 1992 Korukonda 261 256 252 243 231 223 217 208 199 192 173 159 132 117 107 98
84 20 Aug 1992 Gaisilet 285 275 265 258 253 250 246 238 232 225 210 195 152 124
85 15 Jun 1994 Dhabara /dabra 458 440 428 406 384 368 355 335 321 310 286 270 215 182 157 139
86 28 Jun 1994 Jamsolaghat 264 232 221 209 199 191 186 175 168 160 148 137 119 109 101 93 84
87 29 Jun 1994 Angara 300 296 290 278 264 253 243 227 214 205 185 176 148 130 118 108 98 90
88 12 Jul 1994 Chandur railway 468 415 399 361 339 329 323 312 303 297 286 278 251 225 204 187
89 13 Jul 1994 Sundergarh 253 245 239 224 205 193 183 169 159 151 138 130 112 101 93 85 77
90 20 Jul 1994 Pamposh 305 291 282 268 250 238 227 211 199 189 168 154 123 106 92 81
91 18 Aug 1994 Balliguda 290 287 284 277 266 257 249 235 224 217 201 192 164 144 127 112
92 29 Aug 1994 Bari 270 260 252 232 214 205 201 190 185 180 170 165 144 128 117 106 97
93 30 Aug 1994 Nagbhir 365 337 323 301 285 273 264 251 241 234 221 213 190 174 159 149
94 10 May 1995 Nuagada 350 317 299 268 253 249 245 239 235 229 220 212 193 177 162 146 132 119
95 16 May 1995 Pattamundai 300 285 277 267 250 239 230 217 208 200 186 176 147 129 118 109 101 94 88 84 79
96 23 Jul 1995 Patnagarh 292 282 271 259 247 240 232 218 207 200 183 170 138 119 107 100 92 86 82 78 75
97 27 Sep 1995 Bliapur 608 488 456 418 395 380 366 347 332 322 301 286 246 218
98 17 Jun 1996 Koida 675 645 627 592 555 529 508 475 449 429 390 362 297 261 232 207
99 22 Jun 1996 Bamra 280 274 270 261 252 244 239 227 218 212 199 190 165 152 140 130 123 115 110 105 100
100 01 Aug 1996 Durg 300 276 274 262 253 247 243 234 227 219 202 187 144 122 109 97 90 83 77 72 68
101 28 Jun 1997 Tiring 325 315 311 305 301 296 290 277 266 256 233 214 174 152 137 125 116 110 104 98 93
102 31 Jul 1997 Thuamulrampur 380 328 313 286 268 256 250 238 226 219 202 190 163 143 130 120 111 106 100 95 91
103 21 Aug 1997 Thuamulrampur 345 313 292 274 256 245 236 226 218 210 194 183 153 134 123 113 106 101 96 91 87
104 30 Oct 1999 Anandpur 397 391 387 376 363 354 347 338 333 326 312 300 263 226 195
105 18 Jul 2000 Paoni 407 403 399 387 371 360 355 354 350 344 327 313 268 240 217 203
106 13 Jun 2001 Thuamulrampur 525 490 472 447 416 392 374 347 333 320 296 281 254 233 222 210 207 198 190 183 176
107 17 Jul 2001 Kuchinda 369 366 362 351 335 322 312 296 285 275 253 233 178 143
108 25 Jun 2002 Selu 312 280 272 258 243 236 230 223 216 212 204 197 174 159 148
109 20 Jun 2003 Sundergarh 347 331 319 293 262 239 221 197 181 169 148 134 102 84
110 27 Aug 2003 Thuamulrampur 542 462 439 397 352 324 304 276 257 241 209 184
111 13 Jun 2004 Thuamulrampur 475 440 420 391 359 335 317 287 264 245 208 180

Estimation of PMP by Physical Approach
PMP Atlas for Mahanadi and Adjoining River Basins Page 112 of 260
Sr. No.
Storm Date Storm Centre Peak
Rainfall (mm)
Area in sq. km. (All rainfall values are in mm) (k = 1000)
100 200 500 1k 1.5k 2k 3k 4k 5k 7.5k 10k 20k 30k 40k 50k 60k 70k 80k 90k 100k
112 13 Jun 2004 Kudumulgumma 304 295 290 282 274 269 264 255 246 238 223 210 176
113 28 Jun 2005 Thakurmunda 377 340 325 313 300 291 280 262 247 235 209 192 146
114 29 Jun 2005 Tensa 397 365 348 325 304 292 282 266 252 241 219 201 152
115 30 Jul 2005 R.pur/rairakhol 310 309 308 302 296 292 285 273 262 254 234 217 165 136
116 13 Sep 2005 Thuamulrampur 320 308 301 287 279 271 265 254 244 237 223 214 193 179 167 157
117 20 Sep 2005 Kunavaram 487 437 416 382 347 322 301 268 242 222 188 165 112 84 69
118 03 Aug 2006 Thuamulrampur 450 379 356 314 271 242 221 191 172 159 136 122
119 04 Aug 2006 Nandapur 341 290 280 265 252 240 229 215 203 193 173 157 113
120 06 Jul 2007 Bahalda 310 307 305 299 294 288 284 280 277 273 266 259 234 215 199 184 169 155
121 05 Aug 2007 Kantapara 335 329 321 300 277 259 242 213 191 172 137 114
122 07 Aug 2007 Thuamulrampur 430 410 393 365 334 315 301 281 265 251 224 202
123 13 Aug 2007 Bijatala 375 353 339 312 288 275 265 253 243 235 222 210 176 152
124 23 Sep 2007 Athgarh 268 238 223 204 187 175 168 163 155 150 140 132 110 92
125 18 Jun 2008 Bahalda 424 408 399 386 376 369 359 343 331 320 299 284 247 220 197 177 160
126 18 Sep 2008 Jujomura 355 350 345 332 316 303 295 281 273 267 254 243 219 201 186 173 162 152 144 136 129
Table 3-4: DAD Values (mm) over different standard areas (sq. km.) for 2-day duration contributed by rainstorms in and around Mahanadi and Adjoining River Basins
Sr. No.
Storm Date Storm Centre Peak
Rainfall (mm)
Area in sq. km. (All rainfall values are in mm) (k = 1000)
100 200 500 1k 1.5k 2k 3k 4k 5k 7.5k 10k 20k 30k 40k 50k 60k 70k 80k 90k 100k
1 28-29 Jul 1905 Burdwan 412 411 409 405 399 395 390 384 378 373 359 346 299 269 248 232
2 26-27 Sep 1908 Ramachandrapuram 441 367 344 311 272 237 205
3 29-30 Aug 1909 Vishnupur 520 470 456 452 442 434 427 413 399 385 356 340 298 271 249 229
4 03-04 Aug 1910 Raipur 437 428 422 406 392 385 377 365 357 348 336 327 303 283 267 253 242 231 221 213 205
5 03-04 Aug 1912 Armori 519 498 486 463 433 410 390 357 335 315 275 245 180
6 24-25 Jun 1914 Koraput 504 482 465 439 412 393 376 346 319 295 248 211
7 31 Jul-01 Aug 1917 Hunterganj 697 652 630 588 541 509 484 445 416 394 354 327 271 241 221 206
8 15-16 Jun 1918 Sonepur 511 499 492 476 457 443 430 411 395 383 362 347 316 293 273 255 239 225 213 202 192
9 17-18 Jun 1918 Gondia 472 468 464 452 433 417 402 377 353 331 289 256
10 18-19 Nov 1923 Itchapuram 657 644 635 615 587 562 541 506 475 454 419 396 335 290 255 226 201
11 28-29 Jun 1925 Phulbani 518 517 515 512 505 499 492 481 468 458 431 412 376 360 348 337 324 312 302 291 281
12 16-17 Aug 1926 Phulbani 513 495 486 472 458 446 435 414 397 383 359 346 315 298 284 271 259 247 235 224 214
13 20-21 Sep 1926 Bichhia 650 650 648 645 639 631 623 606 594 580 553 530 474 422 381 347 317 295 275 258 244
14 29-30 Jul 1927 Karanjia 717 717 717 717 715 709 699 669 639 615 562 524 431 365 320 288 265 247 230 215 202
15 15-16 Aug 1931 Nawarangpur 366 282 264 247 230 215 202 180 162 148 122 105
16 13-14 Oct 1931 Pottangi 570 544 534 524 511 500 492 480 467 454 425 396 309 254 216 187
17 03-04 Aug 1933 Balandapara 463 457 453 442 427 415 408 395 384 374 355 343 306 278 257 241 227 216 207 198 192

Estimation of PMP by Physical Approach
PMP Atlas for Mahanadi and Adjoining River Basins Page 113 of 260
Sr. No.
Storm Date Storm Centre Peak
Rainfall (mm)
Area in sq. km. (All rainfall values are in mm) (k = 1000)
100 200 500 1k 1.5k 2k 3k 4k 5k 7.5k 10k 20k 30k 40k 50k 60k 70k 80k 90k 100k
18 22-23 Aug 1934 Ambikapur 360 360 360 359 355 351 348 344 341 338 328 318 281 253 235 222
19 13-14 Jun 1936 Balandapara 495 488 481 467 448 435 424 408 395 386 370 361 331 308 288 271 257 245 234 224 215
20 14-15 Jun 1936 Balandapara 733 724 715 692 662 634 610 565 527 498 458 436 388 361 338 319 298 278 263 251 242
21 27-28 Jun 1937 Sarangarh 397 392 387 377 364 355 348 341 333 328 315 306 278 259 243 229 217 208 199 192 185
22 18-19 Aug 1939 Kondapar 398 380 370 365 362 358 356 352 347 343 338 330 305 286 270 257 245 235 225 216 207
23 25-26 Jun 1940 Balandapara 383 378 374 364 350 341 334 325 322 316 307 301 278 261 247 236 226 218 209 203 196
24 08-09 Jul 1940 Athmalik 374 364 357 341 329 321 318 314 314 312 305 297 277 260 247 236 226 219 212 205 198
25 02-03 Aug 1942 Antagarh 315 303 298 289 281 276 272 265 260 255 245 238 215 199 189 182
26 15-16 Aug 1948 Dhamtari 507 440 425 406 394 385 379 369 358 348 324 305 269 250 237 227 218 208 200 193 185
27 18-19 Jun 1953 Narasannapeta 312 311 309 306 300 294 289 280 272 264 250 238 207 187 171 159 148 139 131
28 03-04 Sep 1955 Hirakud 368 362 358 348 338 332 329 324 321 318 308 299 270 250 235 222 210 200 191 182 175
29 29-30 Jun 1959 Antagarh 337 304 296 279 262 250 240 225 213 205 193 184 160 145 136 129
30 15-16 Aug 1960 Kusumi 339 338 338 336 333 330 328 323 319 315 306 299 280 267 254 241 229 217 205 194 184
31 09-10 Jul 1964 Tamluk 831 710 669 588 501 441 395 332 293 266 223 196 148 126 111
32 01-02 Aug 1967 Rudri 535 505 486 463 434 417 405 387 373 361 340 325 285 259 238 221 207 194 183 174 166
33 07-08 Jul 1973 Madanpur rampur 495 476 465 444 422 407 396 379 371 367 360 354 329 307 288 272 258 247 237 228 220
34 27-28 Jun 1975 Sindewahi 484 470 460 439 420 402 387 364 344 329 302 281 228 197 178 165
35 18-19 Jul 1975 Dumri 682 604 570 506 440 397 368 331 306 290 263 244 205 187 175 165
36 20-21 Nov 1977 Narsipatnam 325 311 306 299 294 289 285 280 275 272 265 256 234 214 195 178 162
37 27-28 Sep 1978 Pangarh aero 610 599 592 578 562 551 541 525 512 501 478 455 383 332 294 261
38 03-04 Jun 1982 Kendrapara 404 395 388 376 362 352 344 330 319 308 285 266 214 184 166 153 143 133 125 117
39 29-30 Aug 1982 Phulbani 700 700 700 700 697 693 687 673 658 644 607 575 485 416 360 321 292 267 243 224 209
40 16-17 Aug 1984 Kendrapara 348 343 339 332 329 322 319 309 302 296 282 272 244 223 209 195 182 170 159 149 139
41 15-16 Oct 1985 Akhuapada 378 360 355 348 336 328 320 306 295 286 270 260 228 205 189 177 166 155 144 134
42 03-04 Aug 1988 Telkoi 337 330 324 310 295 282 274 262 253 244 230 220 197 178 166 155 147 139 132 125 119
43 23-24 Jul 1989 Kodur 450 449 449 446 443 439 435 428 421 414 396 381 340 310 290 280 277 277 276 270 263
44 03-04 Nov 1990 Digapahandi 554 459 429 407 396 387 381 370 362 355 341 328 285 254 227 203 183
45 16-17 Jul 1991 Thuamulrampur 510 434 418 396 383 377 369 359 349 341 321 304 256 229 209 195 184 176 171 164 156
46 20-21 Jul 1991 Binjharpur 520 429 393 331 292 273 261 246 237 228 212 201 170 151 135 121
47 12-13 Aug 1991 Phiringia 616 587 570 540 521 507 495 475 458 444 415 392 333 296 270 250 233 218 205 192 181
48 27-28 Jul 1992 Bijepur 520 468 451 421 405 396 389 379 372 365 352 342 315 298 285 274 263 254 246 239 232
49 19-20 Aug 1992 Gaisilet 425 410 402 387 379 374 369 359 351 344 327 311 259 218 187
50 15-16 Jun 1994 Dhabara /dabra 544 525 514 492 470 454 444 429 416 405 382 362 306 268 240 218 201 186 174 163
51 27-28 Jun 1994 Jamsolaghat 302 290 281 264 249 239 231 222 214 208 195 185 160 145 135 126 118 109
52 11-12 Jul 1994 Paoni 630 589 574 539 518 505 494 480 470 460 438 421 377 350 331 317
53 17-18 Aug 1994 Balliguda 354 348 344 333 319 307 298 283 272 263 249 239 208 185 166 151 137
54 28-29 Aug 1994 Bari 380 361 350 335 319 307 294 273 257 245 226 212 183 163 149 138 128
55 10-11 May 1995 Nuagada 610 550 521 470 442 431 421 410 400 394 380 370 342 322 301 281 262 244 226 209

Estimation of PMP by Physical Approach
PMP Atlas for Mahanadi and Adjoining River Basins Page 114 of 260
Sr. No.
Storm Date Storm Centre Peak
Rainfall (mm)
Area in sq. km. (All rainfall values are in mm) (k = 1000)
100 200 500 1k 1.5k 2k 3k 4k 5k 7.5k 10k 20k 30k 40k 50k 60k 70k 80k 90k 100k
56 15-16 May 1995 Bari 353 331 319 303 290 279 272 258 251 243 229 219 196 179 167 155 147 139 132 126 120
57 23-24 Jul 1995 Patnagarh 406 383 369 342 324 313 306 294 284 277 262 250 223 206 195 186 177 170 163 157 151
58 26-27 Sep 1995 Bliapur 639 581 552 498 449 429 414 392 375 362 341 324 282 252 229 208
59 16-17 Jun 1996 Koida 691 658 643 609 574 549 529 498 474 456 425 405 345 303 270 242
60 21-22 Jun 1996 Pal-lahara 503 498 492 477 458 443 432 415 403 391 366 344 287 253 231 215 202 190 180 172 163
61 01-02 Aug 1996 Durg 370 349 340 321 304 295 290 282 274 266 247 231 189 166 150 138 127 119 112 106 100
62 27-28 Jun 1997 Tiring 368 345 335 325 321 319 314 306 298 293 279 267 236 218 205 194 184 176 167 161 155
63 30-31 Jul 1997 Thuamulrampur 545 490 481 455 429 410 397 378 362 348 319 296 242 214 196 183 173 164 157 150 144
64 20-21 Aug 1997 Thuamulrampur 623 550 519 467 410 373 349 318 296 281 254 237 198 177 165 155 147 142 138 132 128
65 30-31 Oct 1999 Anandpur 697 690 683 665 636 612 598 582 570 556 532 511 433 376 329 291 257
66 18-19 Jul 2000 Paoni 582 578 574 566 558 556 554 543 534 525 506 489 433 389 355 332
67 13-14 Jun 2001 Thuamulrampur 830 785 760 717 665 625 591 540 511 489 450 430 421 398 386 368 364 355 343 334 326
68 17-18 Jul 2001 Kusumi 451 446 442 432 423 414 407 396 385 377 349 322 249 203
69 24-25 Jun 2002 Bhandara 508 475 446 382 335 302 286 268 253 243 227 217 194 176 162 149
70 20-21 Jun 2003 Sundergarh 382 368 357 330 300 280 260 235 213 205 182 165 125 101
71 26-27 Aug 2003 Thuamulrampur 842 742 708 642 570 517 475 415 374 344 290 251
72 12-13 Jun 2004 Thuamulrampur 600 565 547 511 470 439 415 377 347 321 270 233
73 13-14 Jun 2004 Kudumulgumma 472 455 441 418 403 395 389 377 367 358 342 326 272 228 192 163
74 28-29 Jun 2005 Pallahara 639 604 589 567 544 526 509 477 451 429 387 354 267 216
75 30-31 Jul 2005 Jujomura 573 568 563 551 534 520 508 485 465 449 417 389 311 264 227
76 12-13 Sep 2005 Thuamulrampur 480 470 466 458 447 439 433 426 418 411 394 379 328 295 270 255
77 20-21 Sep 2005 Kunavaram 561 539 519 469 422 394 364 327 299 271 230 203 160 138 121 110
78 02-03 Aug 2006 Thuamulrampur 600 507 477 423 388 370 356 341 328 316 290 267 209
79 04-05 Aug 2006 Sukma 497 477 463 438 415 399 386 362 341 322 290 265 199 159
80 06-07 Jul 2007 Joda 564 537 520 486 449 425 410 390 375 367 349 337 308 288 271 255 240 225 210
81 05-06 Aug 2007 Naugaon 565 503 490 464 439 422 408 384 363 343 302 269 187
82 06-07 Aug 2007 Thuamulrampur 665 605 584 542 496 462 438 405 382 363 327 299 219
83 22-23 Sep 2007 Mahanga 388 360 342 335 318 305 293 276 265 254 237 223 185 158
84 17-18 Jun 2008 Bahalda 762 742 724 697 678 664 648 617 589 567 530 502 429 377 340 308 280
85 17-18 Sep 2008 Jujomura 506 498 492 476 467 461 458 454 447 442 428 415 367 331 302 280 262 246 232 220 208
Table 3-5: DAD Values (mm) over different standard areas (sq. km.) for 3-day duration contributed by rainstorms in and around Mahanadi and Adjoining River Basins
Sr. No.
Storm Date Storm Centre Peak
Rainfall (mm)
Area in sq. km. (All rainfall values are in mm) (k = 1000)
100 200 500 1k 1.5k 2k 3k 4k 5k 7.5k 10k 20k 30k 40k 50k 60k 70k 80k 90k 100k
1 27-29 Jul 1905 Burdwan 445 445 445 444 443 440 436 426 417 410 395 382 341 311 289 270
2 29-31 Aug 1909 Vishnupur 530 519 514 499 482 470 461 445 430 418 394 378 342 312 286 264

Estimation of PMP by Physical Approach
PMP Atlas for Mahanadi and Adjoining River Basins Page 115 of 260
Sr. No.
Storm Date Storm Centre Peak
Rainfall (mm)
Area in sq. km. (All rainfall values are in mm) (k = 1000)
100 200 500 1k 1.5k 2k 3k 4k 5k 7.5k 10k 20k 30k 40k 50k 60k 70k 80k 90k 100k
3 02-04 Aug 1910 Jeypore 495 489 484 472 461 454 447 437 428 420 404 392 363 343 328 315 303 292 282 272 262
4 03-05 Aug 1912 Brahmapuri 579 564 549 520 485 460 442 414 391 370 329 296 212
5 24-26 Jun 1914 Koraput 582 555 540 510 479 457 437 403 370 344 288 247
6 30 Jul-01 Aug 1917 Hunterganj 725 683 662 618 570 535 509 474 449 430 394 370 311 277 253 235
7 15-17 Jun 1918 Sonepur 573 553 543 525 507 494 486 472 461 455 440 428 395 374 355 338 323 309 295 283 271
8 17-19 Nov 1923 Itchapuram 706 691 680 656 627 605 589 563 541 524 494 474 426 394 364 334 304 275 251 230
9 27-29 Jun 1925 Kendrapara 660 649 639 613 586 570 560 545 532 519 498 480 438 415 398 385 368 353 342 331 322
10 19-21 Sep 1926 Dindori 819 819 819 817 815 810 807 796 782 769 740 713 630 562 506 461 427 397 371 350 332
11 28-30 Jul 1927 Karanjia 745 744 744 741 735 728 719 696 671 645 593 556 457 390 347 311 285 266 250 236 222
12 13-15 Oct 1931 Pottangi 585 568 556 544 532 520 510 495 482 466 439 412 338 289 261 236
13 02-04 Aug 1933 Balandapara 468 463 460 452 441 433 427 418 412 404 393 382 349 321 299 281 266 254 244 235 227
14 21-23 Aug 1934 Ambikapur 435 434 433 430 426 421 417 410 403 398 386 374 329 300 279 262
15 13-15 Jun 1936 Balandapara 890 872 855 810 762 740 726 695 668 643 592 550 460 419 390 366 348 334 322 311 300
16 17-19 Aug 1939 Mahasamund 437 420 415 408 401 400 399 396 395 392 385 376 352 335 321 309 299 289 280 272 264
17 24-26 Jun 1940 Balandapara 458 455 452 449 440 433 427 412 398 387 367 353 317 293 275 262 250 240 232 225 218
18 07-09 Jul 1940 Barchana 400 388 376 365 350 343 340 336 333 331 325 321 310 299 289 280 273 264 255 248 240
19 02-04 Aug 1942 Antagarh 371 357 349 337 328 322 317 308 302 297 288 281 264 251 239 229
20 14-16 Aug 1948 Dhamtari 512 460 440 423 413 405 400 389 383 376 362 352 326 307 291 277 264 253 243 234 226
21 18-20 Jun 1953 Sompeta 349 349 348 347 344 341 338 333 327 321 308 298 268 249 234 222 213 205 198 191 185
22 02-04 Sep 1955 Dhama 389 388 387 386 385 381 378 374 369 362 347 332 296 276 261 250 241 231 223 215 207
23 14-16 Aug 1960 Kusumi 379 378 376 373 369 364 361 354 349 344 333 323 301 288 275 262 249 237 226 215 205
24 09-11 Jul 1964 Tamluk 851 760 715 626 533 469 421 357 317 289 243 218 172 148
25 01-03 Aug 1967 Rudri 596 540 516 484 460 450 442 428 418 409 390 373 326 295 271 252 236 223 211 201 192
26 06-08 Jul 1973 Thuamulrampur 521 505 495 482 477 468 463 453 445 438 426 416 384 357 336 319 304 293 282 273 264
27 27-29 Jun 1975 Kunghari 517 506 499 483 466 453 442 420 400 382 351 328 270 234 210 191
28 17-19 Jul 1975 Dumri 767 692 656 589 519 477 448 412 388 370 339 321 280 259 245 235
29 20-22 Nov 1977 Narsipatnam 328 320 320 314 308 303 300 296 292 287 279 272 247 228 214 199 186 174 163 153
30 28-30 Aug 1982 Dunguripalli 890 878 868 846 825 809 798 782 767 749 703 666 547 462 396 348 313 287 267 247 229
31 15-17 Aug 1984 Mahanga 369 360 350 345 340 337 335 332 326 323 315 309 286 267 250 235 222 210 198 187 177
32 22-24 Jul 1989 Kodur 469 469 468 467 465 463 461 457 453 449 439 430 403 383 369 356 343 331 320 311 303
33 03-05 Nov 1990 Digapahandi 560 493 465 435 423 412 407 398 391 387 377 369 334 305 280 257 236 217 200
34 15-17 Jul 1991 Thuamulrampur 595 500 467 432 411 400 393 379 368 358 336 318 270 241 222 208 196 187 180 174 166
35 20-22 Jul 1991 Binjharpur 520 442 408 367 343 332 322 310 299 292 276 265 235 211 194 177 162
36 11-13 Aug 1991 Phiringia 676 655 645 627 603 587 573 551 533 517 485 459 383 336 306 283 264 249 235 223 212
37 27-29 Jul 1992 Bijepur 546 490 467 441 426 417 410 399 392 384 369 356 328 309 295 284 275 266 258 250 244
38 18-20 Aug 1992 Gaisilet 433 418 409 394 383 379 373 365 357 350 335 320 271 237 209
39 14-16 Jun 1994 Dhabara /dabra 587 566 552 525 497 478 463 446 433 422 401 381 326 291 264 243 226 213 202 192 183
40 27-29 Jun 1994 Goilkera 396 378 368 356 342 332 323 309 298 288 269 255 222 201 186 174 164 155 147 138

Estimation of PMP by Physical Approach
PMP Atlas for Mahanadi and Adjoining River Basins Page 116 of 260
Sr. No.
Storm Date Storm Centre Peak
Rainfall (mm)
Area in sq. km. (All rainfall values are in mm) (k = 1000)
100 200 500 1k 1.5k 2k 3k 4k 5k 7.5k 10k 20k 30k 40k 50k 60k 70k 80k 90k 100k
41 10-12 Jul 1994 Paoni 673 642 626 589 566 553 545 534 526 520 506 491 454 427 403 388
42 17-19 Aug 1994 Balliguda 374 369 365 355 341 330 321 305 292 283 265 252 219 198 181 165 151
43 09-11 May 1995 Nuagada 710 640 606 543 499 482 469 455 443 437 424 415 387 367 347 328 309 290 272 254 237
44 14-16 May 1995 Bari 428 405 391 366 346 334 327 315 309 302 288 276 248 228 212 200 189 180 171 164 158
45 22-24 Jul 1995 Patnagarh 421 410 395 377 368 362 359 350 344 337 324 314 286 267 252 241 233 225 219 212 206
46 25-27 Sep 1995 Bliapur 645 590 566 521 474 452 437 415 399 385 361 344 301 272 248 227
47 16-18 Jun 1996 Koida 701 678 662 631 595 568 547 514 489 469 435 413 353 316 285 255
48 21-23 Jun 1996 Pal-lahara 555 552 548 542 527 515 506 489 475 463 438 417 362 330 306 287 271 257 244 234 224
49 31 Jul-02 Aug 1996 Durg 387 373 363 345 329 317 311 302 295 287 271 259 221 196 178 164 151 140 131 125 119
50 27-29 Jun 1997 Tiring 411 390 380 365 359 355 350 341 334 327 313 301 268 247 233 223 214 207 200 195 189
51 30 Jul-01 Aug 1997 Thuamulrampur 558 515 495 470 440 424 411 393 376 362 331 310 261 235 219 206 197 188 181 175 168
52 19-21 Aug 1997 Thuamulrampur 791 684 647 578 508 460 428 386 360 342 311 293 253 229 212 200 189 180 174 168 162
53 29-31 Oct 1999 Anandpur 711 705 700 692 680 672 666 654 640 628 603 579 486 417 368 327 291
54 17-19 Jul 2000 Paoni 643 639 636 627 617 614 612 604 594 585 566 549 493 450 413 382
55 13-15 Jun 2001 Thuamulrampur 905 861 839 786 726 680 644 602 576 562 543 535 497 471 453 434 422 407 394 384 375
56 23-25 Jun 2002 Bhandara 531 488 476 441 409 387 374 354 341 331 314 302 270 247 230 216
57 18-20 Jun 2003 Sundergarh 395 380 365 335 310 290 270 242 222 210 190 175 135 105
58 26-28 Aug 2003 Thuamulrampur 915 817 781 711 633 576 531 477 445 422 381 353 272
59 12-14 Jun 2004 Thuamulrampur 694 662 643 600 550 514 488 452 426 406 363 328
60 27-29 Jun 2005 Pallahara 757 696 674 633 601 579 558 519 489 465 420 386 296 245
61 29-31 Jul 2005 Jujomura 578 573 568 556 541 527 515 493 474 458 426 399 317 267 229
62 12-14 Sep 2005 Thuamulrampur 560 546 534 510 493 481 470 456 447 440 424 410 367 332 308 285
63 02-04 Aug 2006 Thuamulrampur 734 639 608 550 508 481 461 430 407 391 358 333 265
64 05-07 Jul 2007 Joda 579 555 540 510 490 477 465 450 439 429 411 399 367 343 322 303 286 270 256 242
65 04-06 Aug 2007 Naugaon 575 520 505 479 456 439 425 400 378 359 315 282 206
66 05-07 Aug 2007 Thuamulrampur 765 713 683 622 558 514 480 436 406 383 340 310 228
67 21-23 Sep 2007 Mahanga 486 440 422 407 385 368 354 331 315 302 280 264 221 192
68 17-19 Jun 2008 Bahalda 831 808 792 770 748 729 708 674 642 615 573 540 464 411 371 337 308 282
69 16-18 Sep 2008 Jujomura 529 523 517 510 506 503 500 496 491 486 471 457 405 364 331 306 286 269 255 242 230

Estimation of PMP by Physical Approach
PMP Atlas for Mahanadi and Adjoining River Basins Page 117 of 260
3.2.4 CALCULATION OF MOISTURE MAXIMIZATION FACTOR FOR RAINSTORMS
The purpose of moisture maximization is to determine Moisture Maximization Factor (MMF) of a rainstorm, defined as the ratio of the maximum total moisture in an atmospheric column of unit cross-section in the region to the total moisture in a similar column that prevailed during the rainstorm period. Therefore, the moisture maximization of a rainstorm required the estimation of two moisture contents – one corresponding to the highest value on record at the location and the other one prevailing moisture during the rainstorm period. The details of MMF are given in Section 3.1.5. An example of MMF calculation from observed data for one of the storms is given below. MMF thus obtained is applicable uniformly for all areas and duration of the rainstorm. The rainfall depth for any specified duration and area as read from the envelope DAD curve of area or basin, when multiplied by MMF gives in situ PMP estimates. Table 3-7 gives the estimated MMF values for all 126 storms analyzed in this study along with the barrier elevation (h1), rainstorm persisting dew point (d1), maximum persisting dew point (d2) and precipitable water corresponding to d1 and d2 at h1. Out of 126 storms, dew point temperature was not available for eight storms (Sakoli-1908, Vishnupur-1909, Sarangarh-1929, Gopiballabhpur-1942, Tumudibandh-1992, Bijepur-1992, Korukonda-1992, and Gaisilet-1992). Recommendations of the workshop on rationalization of design storm parameters for design flood estimation (Central Water Commission, 1993) suggests that where the dew point data is not available for base estimation of moisture maximization, a value of 25% for inland areas and relatively lesser values of 10% for coastal areas may be adopted. In the case of above-mentioned eight storms, a maximization factor of 20% was assumed. Dew point stations along with their elevations, used in the MMF estimation, have been given in Table 3-6.
Table 3-6: Dew point stations used in the MMF estimation
Sr. No. Dew Point Stations Elevation (m)
1 Balasore 0
2 Bhubaneswar 0
3 Calcutta / Dum Dum 0
4 Chandbali 0
5 Contai 0
6 Gopalpur 0
7 Midnapore 0
8 Puri 0
9 Sagar Island 0
10 Vishakhapatnam 0
11 Jamshedpur 100
12 Daltonganj 200
13 Dhanbad 200
14 Jharsuguda 200
15 Sambalpur 200
16 Titlagarh 200
17 Pbo Raipur 300
18 Jagdalpur 500
19 Ambikapur 600
20 Hazaribagh 600
3.2.4.1 Example: Calculation of MMF for rainstorm of 28-30 Aug 1982 at Bijepur
1) Observed Dew Point Temperature, 0C
Date/Station Jharsuguda Sambalpur Titlagarh
Time, Hrs 830 1730 830 1730 830 1730
27-Aug-1982 25.9 25.2 25.5 25.1
23.4
28-Aug-1982 23.9 23.5 24.9 24.1 24.4 23.6
29-Aug-1982 24.9 23.7 27.5 23.9 24.4
30-Aug-1982 26.9 24.4 25.8
26.5
2) Persisting Dew Point Temperature, 0C of Observation Series

Estimation of PMP by Physical Approach
PMP Atlas for Mahanadi and Adjoining River Basins Page 118 of 260
Date/Station Jharsuguda Sambalpur Titlagarh
Time, Hrs 830 1730 830 1730 830 1730
27-28 Aug 1982 23.9 23.5 24.9 24.1 24.4 23.4
28-29 Aug 1982 23.9 23.5 24.9 23.9 24.4 23.6
29-30 Aug 1982 24.9 23.7 25.8 23.9 24.4 0.0
3) Maximum Persisting Storm Dew Point at 0830 hours and 1730 Hours
Date/Station Jharsuguda Sambalpur Titlagarh
Time, Hrs 830 1730 830 1730 830 1730
Maximum Persisting dew point at 0830 Hrs 24.9
25.8
24.4
Maximum Persisting dew point at 1730 Hrs
23.7
24.1
23.6
4) Maximum 24 Hour Persisting Dew Point Temperature
Date/Station Jharsuguda Sambalpur Titlagarh
Time, Hrs 830 1730 830 1730 830 1730
Maximum 24 Hr Persisting dew point
24.9 25.8 24.4
5) Maximum 24 Hour Persisting Dew Point Temperature reduced to 1000 hPa using Figure 3-1.
Date/Station Jharsuguda Sambalpur Titlagarh
Time, Hrs 830 1730 830 1730 830 1730
Maximum 24 Hr Persisting dew point reduced to 1000
hPa 25.7 26.5 25.1
6) Representative Dew Point temperature (0C) of the rainstorm at 1000 hPa (average of above stations)
d1 = 25.80 0C
7) Mean Barrier Elevation (h1)
h1 = 200 m
Maximum Persisting Dew Point (d2) at rainstorm centre in second fortnight of June as read from Figure 1-20 in Volume II.
d2 = 28.4 0C
9) MMF = (W2)h1 / (W1)h1
= 102.7/81.8
= 1.26
(W2)h1 and (W1)h1 are values of precipitable water (mm) read from Table 8-1 and Table 8-2 given in Volume II corresponding to d2 and d1 at 200 m.

Estimation of PMP by Physical Approach
PMP Atlas for Mahanadi and Adjoining River Basins Page 119 of 260
Table 3-7: Moisture maximization factors (in situ) for analyzed rainstorms
Sr. No.
Storm Centre Storm Date Barrier
Elevation (h1),m
Rainstorm Persisting Dew Point
(d1),°C
Maximum Persisting Dew Point
(d2),°C
Precipitable Water (mm) for d1 at h1 (W1)h1
Precipitable Water (mm) for d2 at h1 (W2)h1
Moisture Max. Factor (MMF)
1 Burdwan 27-29 Jul 1905 0 25.2 28.4 82.2 108.2 1.32
2 Sakoli 26 Jun 1908 300
26.0
80.9 1.20*
3 Gadchiroli 02 Aug 1908 200 24.1 27.0 70.4 90.9 1.29
4 Ramachandrapuram 26-27 Sep 1908 0 25.0 28.5 80.8 109.1 1.35
5 Vishnupur 29-31 Aug 1909 100
28.7
108.2 1.20*
6 Kurud 02-04 Aug 1910 300 24.4 27.3 70.1 90.9 1.30
7 Armori 03-05 Aug 1912 200 23.1 27.0 64.4 90.9 1.41
8 Koraput 24-26 Jun 1914 900 24.5 28.0 59.1 82.3 1.39
9 Jagatsingpur 03 Aug 1915 0 25.4 29.0 83.6 113.9 1.36
10 Hunterganj 30 Jul-01 Aug 1917 200 25.6 28.8 80.4 106.4 1.32
11 Sonepur 15-17 Jun 1918 100 24.2 28.4 73.3 105.4 1.44
12 Gondia 17-18 Jun 1918 300 22.4 26.0 58.6 80.9 1.38
13 Itchapuram 17-19 Nov 1923 0 24.5 28.7 77.5 111.0 1.43
14 Kendrapara 27-29 Jun 1925 0 26.0 30.0 88.0 124.2 1.41
15 Balandapara 28-29 Jun 1925 400 25.8 30.0 77.3 112.1 1.45
16 Jharsuguda 29 Jun 1925 200 24.3 27.8 71.6 97.5 1.36
17 Phulbani 16-17 Aug 1926 500 25.4 29.5 72.5 104.6 1.44
18 Bichhia 19-21 Sep 1926 600 24.7 26.0 66.0 74.6 1.13
19 Champua/Karanjia 28-30 Jul 1927 500 25.4 28.8 72.5 98.4 1.36
20 Sarangarh 24 Aug 1929 200
27.8
97.5 1.20*
21 Jeypore 15-16 Aug 1931 600 24.2 28.0 62.9 89.4 1.42
22 Angul 21 Aug 1931 100 25.3 29.7 80.6 117.8 1.46
23 Gajapathinagaram 13-15 Oct 1931 100 24.9 29.0 77.9 111.1 1.43
24 Cuttak 02-04 Aug 1933 0 25.8 29.0 86.5 113.9 1.32
25 Polavaram 19 Oct 1933 0 24.1 27.4 74.9 99.2 1.32
26 Mahuadaur 21-23 Aug 1934 600 25.4 28.3 70.6 91.8 1.30
27 Balandapara 13-15 Jun 1936 400 25.7 29.2 76.6 104.5 1.36
28 Balandapara 14-15 Jun 1936 400 25.2 29.0 73.3 102.7 1.40
29 Sarangarh 27-28 Jun 1937 200 24.6 27.9 73.6 98.3 1.34
30 Jagatsingpur 24 Jul 1937 0 24.9 29.2 80.1 115.9 1.45
31 Pangree 25 Jul 1937 400 24.2 27.0 66.9 86.2 1.29
32 Krishnanagar 17 Aug 1939 100 25.7 29.4 83.4 114.8 1.38
33 Ambagarh chowki 17-19 Aug 1939 400 24.2 27.4 66.9 89.3 1.34
34 Balandapara 24-26 Jun 1940 400 25.9 30.0 78.0 112.1 1.44
35 Balasore 01 Jul 1940 0 25.0 29.0 80.8 113.9 1.41

Estimation of PMP by Physical Approach
PMP Atlas for Mahanadi and Adjoining River Basins Page 120 of 260
Sr. No.
Storm Centre Storm Date Barrier
Elevation (h1),m
Rainstorm Persisting Dew Point
(d1),°C
Maximum Persisting Dew Point
(d2),°C
Precipitable Water (mm) for d1 at h1 (W1)h1
Precipitable Water (mm) for d2 at h1 (W2)h1
Moisture Max. Factor (MMF)
36 Bhograi 07-09 Jul 1940 0 25.6 28.8 85.0 112.0 1.32
37 Sarangarh 09 Jul 1940 200 23.9 28.0 69.2 99.2 1.43
38 Chandbali 10 Jul 1941 0 25.2 29.6 82.2 119.9 1.46
39 Balasore 08 Oct 1941 0 24.6 28.9 78.2 112.9 1.44
40 Gopiballabhpur 10 Jul 1942 0
28.3
107.2 1.20*
41 Antagarh 02-04 Aug 1942 400 23.9 27.4 65.1 89.3 1.37
42 Soro 01 Aug 1943 0 25.2 28.6 82.2 110.0 1.34
43 Phiringia 20 Aug 1944 700 25.6 29.5 70.0 99.6 1.42
44 Bodalkasa 31 Aug 1947 300 26.2 27.0 82.4 88.5 1.07
45 Konta 27 Sep 1947 0 24.2 28.2 75.6 106.3 1.41
46 Dhamtari 14-16 Aug 1948 300 25.5 27.3 77.5 90.9 1.17
47 Dhanora 31 Jul 1951 200 25.3 27.1 78.3 91.7 1.17
48 Thotapalli 18-20 Jun 1953 100 25.7 30.0 83.4 121.0 1.45
49 Ambagarh chowki 04 Aug 1953 400 24.2 27.1 66.9 87.0 1.30
50 Sonepur 02-04 Sep 1955 100 25.1 28.5 79.3 106.3 1.34
51 Lakholi 15 Jul 1958 300 24.3 27.7 69.5 94.2 1.36
52 Antagarh 29-30 Jun 1959 400 25.2 26.6 73.3 83.1 1.13
53 Paoni 03 Jul 1960 200 26.2 27.0 84.7 90.9 1.07
54 Kusumi 14-16 Aug 1960 300 26.1 28.0 81.6 96.7 1.18
55 Pangree 02 Sep 1961 400 25.2 26.0 73.3 78.7 1.07
56 Tamluk 09-11 Jul 1964 0 27.0 29.1 95.9 114.9 1.20
57 Arkambali farm 01-03 Aug 1967 300 25.8 27.9 79.5 95.9 1.21
58 Sonepur 01 Jul 1970 100 26.0 28.7 85.6 108.2 1.26
59 Madanpur rampur 06-08 Jul 1973 200 25.1 28.9 77.0 107.3 1.39
60 Brahmapuri 08 Jul 1973 200 24.6 27.1 73.6 91.7 1.25
61 Kunghari 27-29 Jun 1975 200 24.4 26.0 72.3 83.2 1.15
62 Dumri 17-19 Jul 1975 300 25.5 28.2 77.5 98.4 1.27
63 Salur 20-22 Nov 1977 200 24.0 27.9 69.8 98.3 1.41
64 Paoni 29 Aug 1978 200 25.0 27.0 76.3 90.9 1.19
65 Shamsundar royna 27-28 Sep 1978 100 25.6 27.7 82.7 99.2 1.20
66 Antagarh 09 Aug 1981 400 25.2 27.4 73.3 89.3 1.22
67 Kendrapara 03-04 Jun 1982 0 25.4 29.8 83.6 122.0 1.46
68 Bijepur 28-30 Aug 1982 200 25.8 28.4 81.8 102.7 1.26
69 Jeypore 01 Aug 1984 600 25.0 28.4 68.0 92.6 1.36
70 Chandbali 15-17 Aug 1984 0 25.3 29.0 82.9 113.9 1.37
71 Sukinda 15-16 Oct 1985 100 25.0 29.3 78.6 113.9 1.45
72 Gadchiroli 22 Jul 1986 200 24.2 27.0 71.0 90.9 1.28

Estimation of PMP by Physical Approach
PMP Atlas for Mahanadi and Adjoining River Basins Page 121 of 260
Sr. No.
Storm Centre Storm Date Barrier
Elevation (h1),m
Rainstorm Persisting Dew Point
(d1),°C
Maximum Persisting Dew Point
(d2),°C
Precipitable Water (mm) for d1 at h1 (W1)h1
Precipitable Water (mm) for d2 at h1 (W2)h1
Moisture Max. Factor (MMF)
73 Telkoi 03-04 Aug 1988 100 26.3 28.6 87.9 107.2 1.22
74 Kodur 22-24 Jul 1989 0 25.5 28.5 84.3 109.1 1.29
75 Armori 22 Aug 1990 200 26.0 27.1 83.2 91.7 1.10
76 Digapahandi 03-05 Nov 1990 0 24.2 28.2 75.6 106.3 1.41
77 Tentalkhunti 15-17 Jul 1991 200 25.9 28.4 82.5 102.7 1.25
78 Binjharpur 20-22 Jul 1991 0 25.9 29.4 87.2 117.9 1.35
79 Rajkishorengr 11-13 Aug 1991 100 26.2 28.3 87.1 104.5 1.20
80 Gadchiroli 16 Aug 1991 200 24.4 27.1 72.3 91.7 1.27
81 Tumudibandh 27 Jul 1992 800
29.6
98.1 1.20*
82 Bijepur 27-29 Jul 1992 200
27.9
98.3 1.20*
83 Korukonda 15 Aug 1992 200
27.9
98.3 1.20*
84 Gaisilet 18-20 Aug 1992 200
28.4
102.7 1.20*
85 Dhabara /dabra 14-16 Jun 1994 200 25.4 27.7 79.0 96.6 1.22
86 Jamsolaghat 27-29 Jun 1994 100 26.1 28.0 86.3 101.8 1.18
87 Angara 29 Jun 1994 500 25.5 27.0 73.2 84.0 1.15
88 Chandur railway 10-12 Jul 1994 300 24.1 27.0 68.3 88.5 1.30
89 Sundergarh 13 Jul 1994 200 26.4 28.0 86.1 99.2 1.15
90 Pamposh 20 Jul 1994 200 25.7 28.0 81.1 99.2 1.22
91 Balliguda 17-19 Aug 1994 500 26.0 29.2 76.6 101.9 1.33
92 Bari 28-29 Aug 1994 0 25.6 30.0 85.0 124.2 1.46
93 Nagbhir 30 Aug 1994 300 24.8 27.0 72.9 88.5 1.21
94 Nuagada 09-11 May 1995 400 25.5 29.2 75.3 104.5 1.39
95 Pattamundai 14-16 May 1995 0 25.8 30.0 86.5 124.2 1.44
96 Patnagarh 22-24 Jul 1995 200 25.3 28.5 78.3 103.6 1.32
97 Bliapur 25-27 Sep 1995 200 26.5 27.7 86.9 96.6 1.11
98 Koida 16-18 Jun 1996 100 25.4 27.8 81.3 100.1 1.23
99 Bamra 21-23 Jun 1996 400 24.8 28.4 70.7 97.6 1.38
100 Durg 31 Jul-02 Aug 1996 300 25.0 27.1 74.4 89.3 1.20
101 Tiring 27-29 Jun 1997 300 25.7 28.4 78.8 100.0 1.27
102 Thuamulrampur 30 Jul-01 Aug 1997 700 26.0 29.4 72.6 98.7 1.36
103 Thuamulrampur 19-21 Aug 1997 700 25.5 28.8 69.3 93.4 1.35
104 Anandpur 29-31 Oct 1999 0 24.3 27.8 76.2 102.7 1.35
105 Paoni 17-19 Jul 2000 200 24.1 27.0 70.4 90.9 1.29
106 Thuamulrampur 13-15 Jun 2001 700 25.0 27.2 66.1 81.1 1.23
107 Kuchinda 17-18 Jul 2001 200 25.8 28.0 81.8 99.2 1.21
108 Selu 23-25 Jun 2002 300 24.9 26.0 73.7 80.9 1.10
109 Sundergarh 18-20 Jun 2003 200 26.4 27.4 86.1 94.1 1.09
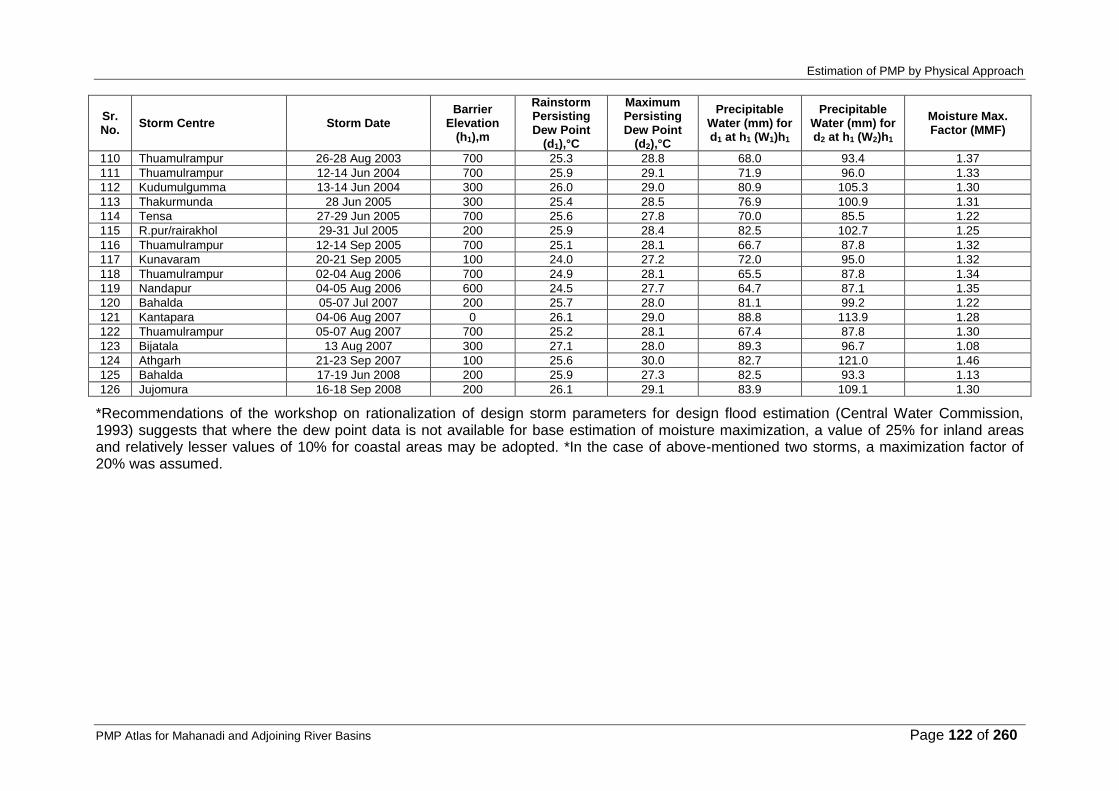
Estimation of PMP by Physical Approach
PMP Atlas for Mahanadi and Adjoining River Basins Page 122 of 260
Sr. No.
Storm Centre Storm Date Barrier
Elevation (h1),m
Rainstorm Persisting Dew Point
(d1),°C
Maximum Persisting Dew Point
(d2),°C
Precipitable Water (mm) for d1 at h1 (W1)h1
Precipitable Water (mm) for d2 at h1 (W2)h1
Moisture Max. Factor (MMF)
110 Thuamulrampur 26-28 Aug 2003 700 25.3 28.8 68.0 93.4 1.37
111 Thuamulrampur 12-14 Jun 2004 700 25.9 29.1 71.9 96.0 1.33
112 Kudumulgumma 13-14 Jun 2004 300 26.0 29.0 80.9 105.3 1.30
113 Thakurmunda 28 Jun 2005 300 25.4 28.5 76.9 100.9 1.31
114 Tensa 27-29 Jun 2005 700 25.6 27.8 70.0 85.5 1.22
115 R.pur/rairakhol 29-31 Jul 2005 200 25.9 28.4 82.5 102.7 1.25
116 Thuamulrampur 12-14 Sep 2005 700 25.1 28.1 66.7 87.8 1.32
117 Kunavaram 20-21 Sep 2005 100 24.0 27.2 72.0 95.0 1.32
118 Thuamulrampur 02-04 Aug 2006 700 24.9 28.1 65.5 87.8 1.34
119 Nandapur 04-05 Aug 2006 600 24.5 27.7 64.7 87.1 1.35
120 Bahalda 05-07 Jul 2007 200 25.7 28.0 81.1 99.2 1.22
121 Kantapara 04-06 Aug 2007 0 26.1 29.0 88.8 113.9 1.28
122 Thuamulrampur 05-07 Aug 2007 700 25.2 28.1 67.4 87.8 1.30
123 Bijatala 13 Aug 2007 300 27.1 28.0 89.3 96.7 1.08
124 Athgarh 21-23 Sep 2007 100 25.6 30.0 82.7 121.0 1.46
125 Bahalda 17-19 Jun 2008 200 25.9 27.3 82.5 93.3 1.13
126 Jujomura 16-18 Sep 2008 200 26.1 29.1 83.9 109.1 1.30
*Recommendations of the workshop on rationalization of design storm parameters for design flood estimation (Central Water Commission, 1993) suggests that where the dew point data is not available for base estimation of moisture maximization, a value of 25% for inland areas and relatively lesser values of 10% for coastal areas may be adopted. *In the case of above-mentioned two storms, a maximization factor of 20% was assumed.
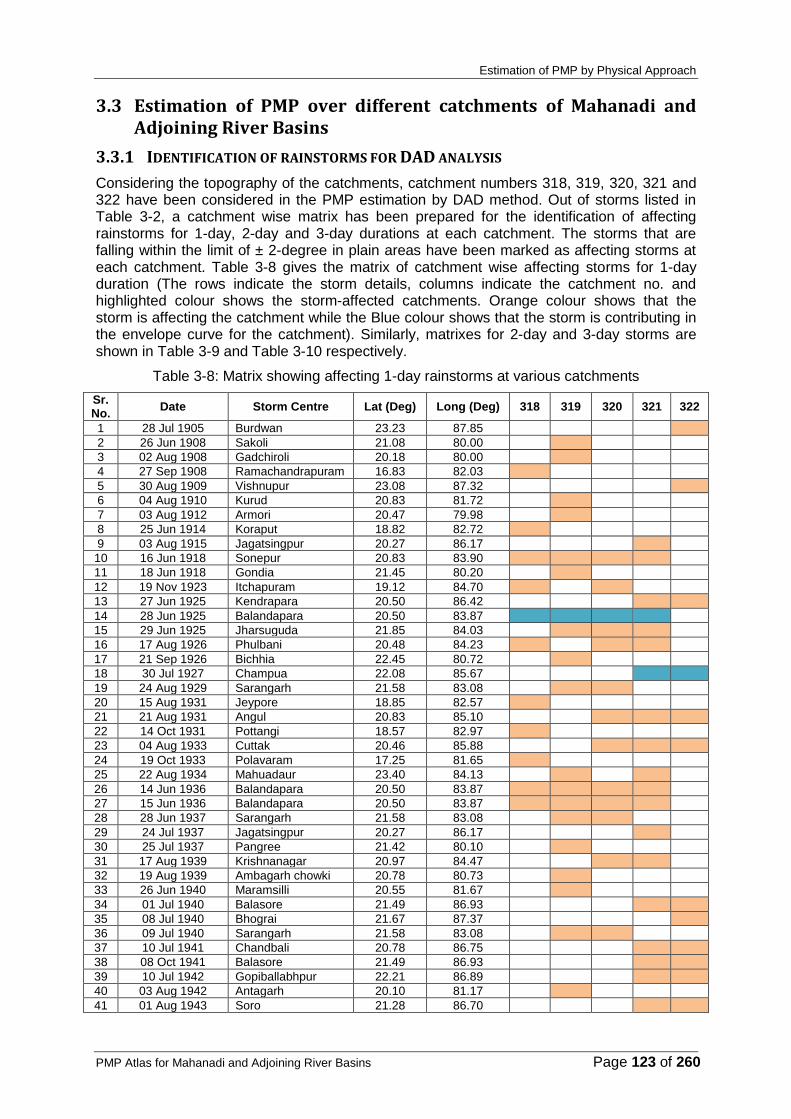
Estimation of PMP by Physical Approach
PMP Atlas for Mahanadi and Adjoining River Basins Page 123 of 260
3.3 Estimation of PMP over different catchments of Mahanadi and Adjoining River Basins
3.3.1 IDENTIFICATION OF RAINSTORMS FOR DAD ANALYSIS
Considering the topography of the catchments, catchment numbers 318, 319, 320, 321 and 322 have been considered in the PMP estimation by DAD method. Out of storms listed in Table 3-2, a catchment wise matrix has been prepared for the identification of affecting rainstorms for 1-day, 2-day and 3-day durations at each catchment. The storms that are falling within the limit of ± 2-degree in plain areas have been marked as affecting storms at each catchment. Table 3-8 gives the matrix of catchment wise affecting storms for 1-day duration (The rows indicate the storm details, columns indicate the catchment no. and highlighted colour shows the storm-affected catchments. Orange colour shows that the storm is affecting the catchment while the Blue colour shows that the storm is contributing in the envelope curve for the catchment). Similarly, matrixes for 2-day and 3-day storms are shown in Table 3-9 and Table 3-10 respectively.
Table 3-8: Matrix showing affecting 1-day rainstorms at various catchments
Sr. No.
Date Storm Centre Lat (Deg) Long (Deg) 318 319 320 321 322
1 28 Jul 1905 Burdwan 23.23 87.85
2 26 Jun 1908 Sakoli 21.08 80.00
3 02 Aug 1908 Gadchiroli 20.18 80.00
4 27 Sep 1908 Ramachandrapuram 16.83 82.03
5 30 Aug 1909 Vishnupur 23.08 87.32
6 04 Aug 1910 Kurud 20.83 81.72
7 03 Aug 1912 Armori 20.47 79.98
8 25 Jun 1914 Koraput 18.82 82.72
9 03 Aug 1915 Jagatsingpur 20.27 86.17
10 16 Jun 1918 Sonepur 20.83 83.90
11 18 Jun 1918 Gondia 21.45 80.20
12 19 Nov 1923 Itchapuram 19.12 84.70
13 27 Jun 1925 Kendrapara 20.50 86.42
14 28 Jun 1925 Balandapara 20.50 83.87
15 29 Jun 1925 Jharsuguda 21.85 84.03
16 17 Aug 1926 Phulbani 20.48 84.23
17 21 Sep 1926 Bichhia 22.45 80.72
18 30 Jul 1927 Champua 22.08 85.67
19 24 Aug 1929 Sarangarh 21.58 83.08
20 15 Aug 1931 Jeypore 18.85 82.57
21 21 Aug 1931 Angul 20.83 85.10
22 14 Oct 1931 Pottangi 18.57 82.97
23 04 Aug 1933 Cuttak 20.46 85.88
24 19 Oct 1933 Polavaram 17.25 81.65
25 22 Aug 1934 Mahuadaur 23.40 84.13
26 14 Jun 1936 Balandapara 20.50 83.87
27 15 Jun 1936 Balandapara 20.50 83.87
28 28 Jun 1937 Sarangarh 21.58 83.08
29 24 Jul 1937 Jagatsingpur 20.27 86.17
30 25 Jul 1937 Pangree 21.42 80.10
31 17 Aug 1939 Krishnanagar 20.97 84.47
32 19 Aug 1939 Ambagarh chowki 20.78 80.73
33 26 Jun 1940 Maramsilli 20.55 81.67
34 01 Jul 1940 Balasore 21.49 86.93
35 08 Jul 1940 Bhograi 21.67 87.37
36 09 Jul 1940 Sarangarh 21.58 83.08
37 10 Jul 1941 Chandbali 20.78 86.75
38 08 Oct 1941 Balasore 21.49 86.93
39 10 Jul 1942 Gopiballabhpur 22.21 86.89
40 03 Aug 1942 Antagarh 20.10 81.17
41 01 Aug 1943 Soro 21.28 86.70

Estimation of PMP by Physical Approach
PMP Atlas for Mahanadi and Adjoining River Basins Page 124 of 260
Sr. No.
Date Storm Centre Lat (Deg) Long (Deg) 318 319 320 321 322
42 20 Aug 1944 Phiringia 20.35 84.12
43 31 Aug 1947 Bodalkasa 21.37 80.05
44 27 Sep 1947 Konta 17.80 81.38
45 15 Aug 1948 Dhamtari 20.70 81.57
46 31 Jul 1951 Dhanora 20.27 80.32
47 19 Jun 1953 Thotapalli 18.78 83.52
48 04 Aug 1953 Ambagarh chowki 20.78 80.73
49 04 Sep 1955 Sonepur 20.85 83.98
50 15 Jul 1958 Bolangir 20.72 83.48
51 30 Jun 1959 Antagarh 20.10 81.17
52 03 Jul 1960 Paoni 20.78 79.65
53 15 Aug 1960 Kusumi 21.75 84.52
54 02 Sep 1961 Pangree 21.42 80.10
55 09 Jul 1964 Tamluk 22.30 87.92
56 02 Aug 1967 Arkambali farm 19.90 83.17
57 01 Jul 1970 Sonepur 20.85 83.98
58 08 Jul 1973 Madanpur rampur 20.20 83.52
59 18 Jul 1975 Dumri 23.98 86.02
60 21 Nov 1977 Salur 18.52 83.20
61 29 Aug 1978 Paoni 20.78 79.65
62 27 Sep 1978 Shamsundar royna 23.88 87.53
63 09 Aug 1981 Antagarh 20.10 81.17
64 04 Jun 1982 Kendrapara 20.50 86.42
65 30 Aug 1982 Bijepur 21.18 83.47
66 01 Aug 1984 Jeypore 18.85 82.57
67 16 Aug 1984 Kendrapara 20.50 86.42
68 16 Oct 1985 Sukinda 20.97 85.92
69 22 Jul 1986 Gadchiroli 20.18 80.00
70 03 Aug 1988 Telkoi 21.33 85.33
71 23 Jul 1989 Kodur 16.52 81.98
72 22 Aug 1990 Armori 20.47 79.98
73 04 Nov 1990 Digapahandi 18.50 84.29
74 17 Jul 1991 Tentalkhunti 20.92 83.42
75 21 Jul 1991 Binjharpur 20.73 86.40
76 12 Aug 1991 Rajkishorengr 20.97 84.47
77 16 Aug 1991 Gadchiroli 20.18 80.00
78 27 Jul 1992 Tumudibandh 19.92 83.67
79 28 Jul 1992 Bijepur 21.18 83.47
80 15 Aug 1992 Korukonda 18.25 81.92
81 20 Aug 1992 Gaisilet 20.92 83.25
82 15 Jun 1994 Dhabara /dabra 21.78 83.08
83 28 Jun 1994 Jamsolaghat 22.22 86.72
84 29 Jun 1994 Angara 23.33 85.50
85 13 Jul 1994 Sundergarh 22.12 84.03
86 20 Jul 1994 Pamposh 22.17 84.83
87 18 Aug 1994 Balliguda 20.20 83.92
88 29 Aug 1994 Bari 20.67 86.33
89 30 Aug 1994 Nagbhir 20.60 79.65
90 10 May 1995 Nuagada 19.10 84.05
91 16 May 1995 Pattamundai 20.58 86.57
92 23 Jul 1995 Patnagarh 20.72 83.13
93 27 Sep 1995 Bliapur 23.67 86.50
94 17 Jun 1996 Koida 17.75 81.33
95 22 Jun 1996 Bamra 21.50 84.67
96 01 Aug 1996 Durg 21.22 81.28
97 28 Jun 1997 Tiring 21.52 86.07
98 31 Jul 1997 Thuamulrampur 19.55 82.93
99 21 Aug 1997 Thuamulrampur 19.55 82.93
100 30 Oct 1999 Anandpur 21.22 86.12
101 18 Jul 2000 Paoni 20.78 79.65
102 13 Jun 2001 Thuamulrampur 19.55 82.93
103 17 Jul 2001 Kuchinda 21.75 84.35

Estimation of PMP by Physical Approach
PMP Atlas for Mahanadi and Adjoining River Basins Page 125 of 260
Sr. No.
Date Storm Centre Lat (Deg) Long (Deg) 318 319 320 321 322
104 20 Jun 2003 Sundergarh 22.12 84.03
105 27 Aug 2003 Thuamulrampur 19.55 82.93
106 13 Jun 2004 Thuamulrampur 19.55 82.93
107 28 Jun 2005 Thakurmunda 21.52 86.15
108 29 Jun 2005 Tensa 21.87 85.15
109 30 Jul 2005 R.pur/rairakhol 21.07 84.35
110 13 Sep 2005 Thuamulrampur 19.55 82.93
111 20 Sep 2005 Kunavaram 17.60 81.23
112 03 Aug 2006 Thuamulrampur 19.55 82.93
113 04 Aug 2006 Nandapur 19.50 82.25
114 06 Jul 2007 Bahalda 22.40 86.08
115 05 Aug 2007 Kantapara 20.25 85.92
116 07 Aug 2007 Thuamulrampur 19.55 82.93
117 13 Aug 2007 Bijatala 22.17 86.25
118 23 Sep 2007 Athgarh 20.50 85.58
119 18 Jun 2008 Bahalda 22.40 86.08
120 18 Sep 2008 Jujomura 21.17 84.08
Total 1-day storms at each catchment 36 50 52 53 37
Storm is affecting the catchment storm is contributing in the envelope curve for the catchment
Table 3-9: Matrix showing affecting 2-day rainstorms at various catchments
Sr. No.
Date Storm Centre Lat (Deg) Long (Deg) 318 319 320 321 322
1 28-29 Jul 1905 Burdwan 23.23 87.85
2 26-27 Sep 1908 Ramachandrapuram 16.83 82.03
3 29-30 Aug 1909 Vishnupur 23.08 87.32
4 03-04 Aug 1910 Raipur 21.23 81.65
5 03-04 Aug 1912 Armori 20.47 79.98
6 24-25 Jun 1914 Koraput 18.82 82.72
7 15-16 Jun 1918 Sonepur 20.83 83.90
8 17-18 Jun 1918 Gondia 21.45 80.20
9 18-19 Nov 1923 Itchapuram 19.12 84.70
10 28-29 Jun 1925 Phulbani 20.48 84.23
11 16-17 Aug 1926 Phulbani 20.48 84.23
12 20-21 Sep 1926 Bichhia 22.45 80.72
13 29-30 Jul 1927 Karanjia 21.77 85.98
14 15-16 Aug 1931 Nawarangpur 19.23 82.55
15 13-14 Oct 1931 Pottangi 18.57 82.97
16 03-04 Aug 1933 Balandapara 20.50 83.87
17 22-23 Aug 1934 Ambikapur 23.12 83.20
18 13-14 Jun 1936 Balandapara 20.50 83.87
19 14-15 Jun 1936 Balandapara 20.50 83.87
20 27-28 Jun 1937 Sarangarh 21.58 83.08
21 18-19 Aug 1939 Kondapar 21.72 81.98
22 25-26 Jun 1940 Balandapara 20.50 83.87
23 08-09 Jul 1940 Athmalik 20.72 84.53
24 02-03 Aug 1942 Antagarh 20.10 81.17
25 15-16 Aug 1948 Dhamtari 20.70 81.57
26 18-19 Jun 1953 Narasannapeta 18.42 84.05
27 03-04 Sep 1955 Hirakud 21.53 83.90
28 29-30 Jun 1959 Antagarh 20.10 81.17
29 15-16 Aug 1960 Kusumi 21.75 84.52
30 09-10 Jul 1964 Tamluk 22.30 87.92
31 01-02 Aug 1967 Rudri 20.67 81.57
32 07-08 Jul 1973 Madanpur rampur 20.20 83.52
33 18-19 Jul 1975 Dumri 23.98 86.02
34 20-21 Nov 1977 Narsipatnam 17.67 82.62
35 27-28 Sep 1978 Pangarh aero 23.47 87.43

Estimation of PMP by Physical Approach
PMP Atlas for Mahanadi and Adjoining River Basins Page 126 of 260
Sr. No.
Date Storm Centre Lat (Deg) Long (Deg) 318 319 320 321 322
36 03-04 Jun 1982 Kendrapara 20.50 86.42
37 29-30 Aug 1982 Phulbani 20.48 84.23
38 16-17 Aug 1984 Kendrapara 20.50 86.42
39 15-16 Oct 1985 Akhuapada 20.92 86.28
40 03-04 Aug 1988 Telkoi 21.33 85.33
41 23-24 Jul 1989 Kodur 16.52 81.98
42 03-04 Nov 1990 Digapahandi 18.50 84.29
43 16-17 Jul 1991 Thuamulrampur 19.55 82.93
44 20-21 Jul 1991 Binjharpur 20.73 86.40
45 12-13 Aug 1991 Phiringia 20.35 84.12
46 27-28 Jul 1992 Bijepur 21.18 83.47
47 19-20 Aug 1992 Gaisilet 20.92 83.25
48 15-16 Jun 1994 Dhabara /dabra 21.78 83.08
49 27-28 Jun 1994 Jamsolaghat 22.22 86.72
50 11-12 Jul 1994 Paoni 20.78 79.65
51 17-18 Aug 1994 Balliguda 20.20 83.92
52 28-29 Aug 1994 Bari 20.67 86.33
53 10-11 May 1995 Nuagada 19.10 84.05
54 15-16 May 1995 Bari 20.67 86.33
55 23-24 Jul 1995 Patnagarh 20.72 83.13
56 26-27 Sep 1995 Bliapur 23.67 86.50
57 16-17 Jun 1996 Koida 17.75 81.33
58 21-22 Jun 1996 Pal-lahara 21.43 85.18
59 01-02 Aug 1996 Durg 21.22 81.28
60 27-28 Jun 1997 Tiring 21.52 86.07
61 30-31 Jul 1997 Thuamulrampur 19.55 82.93
62 20-21 Aug 1997 Thuamulrampur 19.55 82.93
63 30-31 Oct 1999 Anandpur 21.22 86.12
64 18-19 Jul 2000 Paoni 20.78 79.65
65 13-14 Jun 2001 Thuamulrampur 19.55 82.93
66 17-18 Jul 2001 Kusumi 21.75 84.52
67 20-21 Jun 2003 Sundergarh 22.12 84.03
68 26-27 Aug 2003 Thuamulrampur 19.55 82.93
69 12-13 Jun 2004 Thuamulrampur 19.55 82.93
70 13-14 Jun 2004 Kudumulgumma 18.33 82.17
71 28-29 Jun 2005 Pallahara 21.43 85.18
72 30-31 Jul 2005 Jujomura 21.17 84.08
73 12-13 Sep 2005 Thuamulrampur 19.55 82.93
74 20-21 Sep 2005 Kunavaram 17.60 81.23
75 02-03 Aug 2006 Thuamulrampur 19.55 82.93
76 04-05 Aug 2006 Sukma 18.38 81.67
77 06-07 Jul 2007 Joda 22.00 85.42
78 05-06 Aug 2007 Naugaon 20.25 85.17
79 06-07 Aug 2007 Thuamulrampur 19.55 82.93
80 22-23 Sep 2007 Mahanga 20.50 86.17
81 17-18 Jun 2008 Bahalda 22.40 86.08
82 17-18 Sep 2008 Jujomura 21.17 84.08
Total 2-day storms at each catchment 37 30 40 36 25
Storm is affecting the catchment storm is contributing in the envelope curve for the catchment

Estimation of PMP by Physical Approach
PMP Atlas for Mahanadi and Adjoining River Basins Page 127 of 260
Table 3-10: Matrix showing affecting 3-day rainstorms at various catchments
Sr. No.
Date Storm Centre Lat (Deg) Long (Deg) 318 319 320 321 322
1 27-29 Jul 1905 Burdwan 23.23 87.85
2 29-31 Aug 1909 Vishnupur 23.08 87.32
3 02-04 Aug 1910 Jeypore 18.85 82.57
4 03-05 Aug 1912 Brahmapuri 20.60 79.87
5 24-26 Jun 1914 Koraput 18.82 82.72
6 15-17 Jun 1918 Sonepur 20.83 83.90
7 17-19 Nov 1923 Itchapuram 19.12 84.70
8 27-29 Jun 1925 Kendrapara 20.50 86.42
9 19-21 Sep 1926 Dindori 22.93 81.08
10 28-30 Jul 1927 Karanjia 21.77 85.98
11 13-15 Oct 1931 Pottangi 18.57 82.97
12 02-04 Aug 1933 Balandapara 20.50 83.87
13 21-23 Aug 1934 Ambikapur 23.12 83.20
14 13-15 Jun 1936 Balandapara 20.50 83.87
15 17-19 Aug 1939 Mahasamund 21.10 82.10
16 24-26 Jun 1940 Balandapara 20.50 83.87
17 07-09 Jul 1940 Barchana 20.67 86.12
18 02-04 Aug 1942 Antagarh 20.10 81.17
19 14-16 Aug 1948 Dhamtari 20.70 81.57
20 18-20 Jun 1953 Sompeta 18.93 84.60
21 02-04 Sep 1955 Dhama 21.25 83.92
22 14-16 Aug 1960 Kusumi 21.75 84.52
23 09-11 Jul 1964 Tamluk 22.30 87.92
24 01-03 Aug 1967 Rudri 20.67 81.57
25 06-08 Jul 1973 Thuamulrampur 19.55 82.93
26 17-19 Jul 1975 Dumri 23.98 86.02
27 20-22 Nov 1977 Narsipatnam 17.67 82.62
28 28-30 Aug 1982 Dunguripalli 21.03 83.55
29 15-17 Aug 1984 Mahanga 20.50 86.17
30 22-24 Jul 1989 Kodur 16.52 81.98
31 03-05 Nov 1990 Digapahandi 18.50 84.29
32 15-17 Jul 1991 Thuamulrampur 19.55 82.93
33 20-22 Jul 1991 Binjharpur 20.73 86.40
34 11-13 Aug 1991 Phiringia 20.35 84.12
35 27-29 Jul 1992 Bijepur 21.18 83.47
36 18-20 Aug 1992 Gaisilet 20.92 83.25
37 14-16 Jun 1994 Dhabara /dabra 21.78 83.08
38 27-29 Jun 1994 Goilkera 22.53 85.38
39 10-12 Jul 1994 Paoni 20.78 79.65
40 17-19 Aug 1994 Balliguda 20.20 83.92
41 09-11 May 1995 Nuagada 19.10 84.05
42 14-16 May 1995 Bari 20.67 86.33
43 22-24 Jul 1995 Patnagarh 20.72 83.13
44 25-27 Sep 1995 Bliapur 23.67 86.50
45 16-18 Jun 1996 Koida 17.75 81.33
46 21-23 Jun 1996 Pal-lahara 21.43 85.18
47 31-02 Aug 1996 Durg 21.22 81.28
48 27-29 Jun 1997 Tiring 21.52 86.07
49 30-01 Aug 1997 Thuamulrampur 19.55 82.93
50 19-21 Aug 1997 Thuamulrampur 19.55 82.93
51 29-31 Oct 1999 Anandpur 21.22 86.12
52 17-19 Jul 2000 Paoni 20.78 79.65
53 13-15 Jun 2001 Thuamulrampur 19.55 82.93
54 18-20 Jun 2003 Sundergarh 22.12 84.03
55 26-28 Aug 2003 Thuamulrampur 19.55 82.93
56 12-14 Jun 2004 Thuamulrampur 19.55 82.93
57 27-29 Jun 2005 Pallahara 21.43 85.18
58 29-31 Jul 2005 Jujomura 21.17 84.08
59 12-14 Sep 2005 Thuamulrampur 19.55 82.93
60 02-04 Aug 2006 Thuamulrampur 19.55 82.93

Estimation of PMP by Physical Approach
PMP Atlas for Mahanadi and Adjoining River Basins Page 128 of 260
Sr. No.
Date Storm Centre Lat (Deg) Long (Deg) 318 319 320 321 322
61 05-07 Jul 2007 Joda 22.00 85.42
62 04-06 Aug 2007 Naugaon 20.25 85.17
63 05-07 Aug 2007 Thuamulrampur 19.55 82.93
64 21-23 Sep 2007 Mahanga 20.50 86.17
65 17-19 Jun 2008 Bahalda 22.40 86.08
66 16-18 Sep 2008 Jujomura 21.17 84.08
Total 3-day storms at each catchment 29 24 35 29 20
Storm is affecting the catchment storm is contributing in the envelope curve for the catchment
3.3.2 RAINSTORMS CONTRIBUTING TO DAD ENVELOPE CURVES OF CATCHMENTS
After preparing the matrix of 1-day, 2-day and 3-day storms affecting the various catchments, a DAD envelope curve for each catchment was prepared for 1-day, 2-day and 3-day durations. While deciding the storms that can contribute to the DAD envelope curve of each catchment, limits of transposition as described in Section 3.1.7 were followed. Catchment and area wise contributing storms to the DAD enveloping curves for 1-day, 2-day and 3-day durations are given in Table 3-11 to Table 3-13.

Estimation of PMP by Physical Approach
PMP Atlas for Mahanadi and Adjoining River Basins Page 129 of 260
Table 3-11: 1-day rainstorms contributing to DAD envelope of the various catchments
Catchment No.
Area (sq. km.)
25 100 200 500 1,000 1,500 2,000 3,000 4,000 5,000 7,500 10,000 20,000 30,000 40,000 50,000 60,000 70,000 80,000 90,000 1,00,000
318 17 Jun 1996 (Koida) 23 Jul 1989 (Kodur) 28 Jun 1925
319 30 Aug 1982 (Bijepur) 28 Jun 1925
320 30 Aug 1982 (Bijepur) 28 Jun 1925
321 30 Jul 1927 (Champua) 30 Aug 1982 (Bijepur) 29 Jun 1925 (Jharsuguda)
322 30 Jul 1927 (Champua)
Table 3-12: 2-day rainstorms contributing to DAD envelope of the various catchments
Catchment No.
Area (sq. km.)
25 100 200 500 1,000 1,500 2,000 3,000 4,000 5,000 7,500 10,000 20,000 30,000 40,000 50,000 60,000 70,000 80,000 90,000 1,00,000
318 13-14 Jun 2001
(Thuamulrampur) 29-30 Aug 1982 (Phulbani) 28-29 Jun 1925 (Phulbani)
319 14-15 Jun 1936 (Balandapara) 20-21 Sep 1926 (Bichhia)
320 13-14 Jun 2001 29-30 Aug 1982 (Phulbani) 28-29 Jun 1925 (Phulbani)
321 29-30 Jul 1927 (Karanjia) 29-30 Aug 1982 (Phulbani) 28-29 Jun 1925 (Phulbani)
322 29-30 Jul 1927 (Karanjia)
Table 3-13: 3-day rainstorms contributing to DAD envelope of the various catchments
Catchment No.
Area (sq. km.)
25 100 200 500 1,000 1,500 2,000 3,000 4,000 5,000 7,500 10,000 20,000 30,000 40,000 50,000 60,000 70,000 80,000 90,000 1,00,000
318 28-30 Aug 1982 (Dunguripalli) 13-15 Jun 1936 (Balandapara)
319 28-30 Aug 1982 (Dunguripalli) 19-21 Sep 1926 (Dindori)
320 28-30 Aug 1982 (Dunguripalli) 13-15 Jun 1936 (Balandapara)
321 28-30 Aug 1982 (Dunguripalli) 27-29 Jun 1925 (Kendrapara)
322 28-30 Jul 1927 (Karanjia) 29-31 Oct 1999 (Anandpur) 27-29 Jun 1925 (Kendrapara)

Estimation of PMP by Physical Approach
PMP Atlas for Mahanadi and Adjoining River Basins Page 130 of 260
3.3.3 CATCHMENT NO. 318
Considering the orography and location of the catchment, rainstorms that can affect this catchment have been analyzed using the DAD method. Out of the storms listed in Table 3-2, storms for 1-day, 2-day and 3-day durations that are transposable (linear transposition within the limit of ± 2 degree in flat region and ± 0.5 degree in orographic and coastal region) to the catchment have been listed in Table 3-8 to Table 3-10 respectively. Table 3-14 shows a list of rainstorms, which affected the catchment-318.
Table 3-14: Rainstorms affecting Catchment-318
Sr. No. Date Storm Duration Peak (mm) Storm Centre Lat
(Deg) Long (Deg)
1 27 Sep 1908 1-Day 369 Ramachandrapuram 16.83 82.03
2 25 Jun 1914 1-Day 337 Koraput 18.82 82.72
3 16 Jun 1918 1-Day 366 Sonepur 20.83 83.90
4 19 Nov 1923 1-Day 351 Itchapuram 19.12 84.70
5 28 Jun 1925 1-Day 327 Balandapara 20.50 83.87
6 17 Aug 1926 1-Day 320 Phulbani 20.48 84.23
7 15 Aug 1931 1-Day 275 Jeypore 18.85 82.57
8 14 Oct 1931 1-Day 546 Pottangi 18.57 82.97
9 19 Oct 1933 1-Day 259 Polavaram 17.25 81.65
10 14 Jun 1936 1-Day 338 Balandapara 20.50 83.87
11 15 Jun 1936 1-Day 395 Balandapara 20.50 83.87
12 20 Aug 1944 1-Day 254 Phiringia 20.35 84.12
13 27 Sep 1947 1-Day 252 Konta 17.80 81.38
14 19 Jun 1953 1-Day 217 Thotapalli 18.78 83.52
15 15 Jul 1958 1-Day 326 Bolangir 20.72 83.48
16 02 Aug 1967 1-Day 320 Arkambali farm 19.90 83.17
17 08 Jul 1973 1-Day 295 Madanpur rampur 20.20 83.52
18 21 Nov 1977 1-Day 181 Salur 18.52 83.20
19 01 Aug 1984 1-Day 295 Jeypore 18.85 82.57
20 23 Jul 1989 1-Day 422 Kodur 16.52 81.98
21 04 Nov 1990 1-Day 445 Digapahandi 18.50 84.29
22 27 Jul 1992 1-Day 301 Tumudibandh 19.92 83.67
23 15 Aug 1992 1-Day 261 Korukonda 18.25 81.92
24 18 Aug 1994 1-Day 290 Balliguda 20.20 83.92
25 10 May 1995 1-Day 350 Nuagada 19.10 84.05
26 23 Jul 1995 1-Day 292 Patnagarh 20.72 83.13
27 17 Jun 1996 1-Day 675 Koida 17.75 81.33
28 31 Jul 1997 1-Day 380 Thuamulrampur 19.55 82.93
29 21 Aug 1997 1-Day 345 Thuamulrampur 19.55 82.93
30 13 Jun 2001 1-Day 525 Thuamulrampur 19.55 82.93
31 27 Aug 2003 1-Day 542 Thuamulrampur 19.55 82.93
32 13 Sep 2005 1-Day 320 Thuamulrampur 19.55 82.93
33 20 Sep 2005 1-Day 487 Kunavaram 17.60 81.23
34 03 Aug 2006 1-Day 450 Thuamulrampur 19.55 82.93
35 04 Aug 2006 1-Day 341 Nandapur 19.50 82.25
36 07 Aug 2007 1-Day 430 Thuamulrampur 19.55 82.93
37 26-27 Sep 1908 2-Day 441 Ramachandrapuram 16.83 82.03
38 24-25 Jun 1914 2-Day 504 Koraput 18.82 82.72
39 15-16 Jun 1918 2-Day 511 Sonepur 20.83 83.90
40 18-19 Nov 1923 2-Day 657 Itchapuram 19.12 84.70
41 28-29 Jun 1925 2-Day 518 Phulbani 20.48 84.23
42 16-17 Aug 1926 2-Day 513 Phulbani 20.48 84.23
43 15-16 Aug 1931 2-Day 366 Nawarangpur 19.23 82.55
44 13-14 Oct 1931 2-Day 570 Pottangi 18.57 82.97
45 03-04 Aug 1933 2-Day 463 Balandapara 20.50 83.87
46 13-14 Jun 1936 2-Day 495 Balandapara 20.50 83.87
47 14-15 Jun 1936 2-Day 733 Balandapara 20.50 83.87
48 25-26 Jun 1940 2-Day 383 Balandapara 20.50 83.87
49 08-09 Jul 1940 2-Day 374 Athmalik 20.72 84.53
50 18-19 Jun 1953 2-Day 312 Narasannapeta 18.42 84.05
51 07-08 Jul 1973 2-Day 495 Madanpur rampur 20.20 83.52
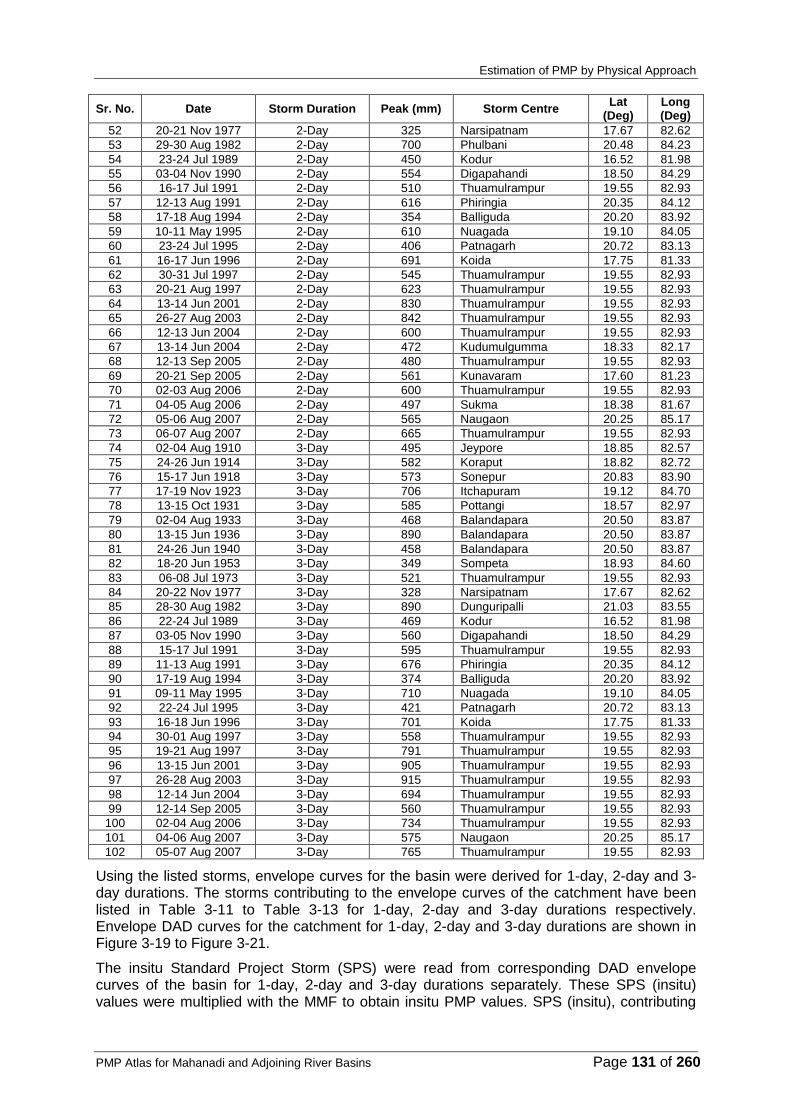
Estimation of PMP by Physical Approach
PMP Atlas for Mahanadi and Adjoining River Basins Page 131 of 260
Sr. No. Date Storm Duration Peak (mm) Storm Centre Lat
(Deg) Long (Deg)
52 20-21 Nov 1977 2-Day 325 Narsipatnam 17.67 82.62
53 29-30 Aug 1982 2-Day 700 Phulbani 20.48 84.23
54 23-24 Jul 1989 2-Day 450 Kodur 16.52 81.98
55 03-04 Nov 1990 2-Day 554 Digapahandi 18.50 84.29
56 16-17 Jul 1991 2-Day 510 Thuamulrampur 19.55 82.93
57 12-13 Aug 1991 2-Day 616 Phiringia 20.35 84.12
58 17-18 Aug 1994 2-Day 354 Balliguda 20.20 83.92
59 10-11 May 1995 2-Day 610 Nuagada 19.10 84.05
60 23-24 Jul 1995 2-Day 406 Patnagarh 20.72 83.13
61 16-17 Jun 1996 2-Day 691 Koida 17.75 81.33
62 30-31 Jul 1997 2-Day 545 Thuamulrampur 19.55 82.93
63 20-21 Aug 1997 2-Day 623 Thuamulrampur 19.55 82.93
64 13-14 Jun 2001 2-Day 830 Thuamulrampur 19.55 82.93
65 26-27 Aug 2003 2-Day 842 Thuamulrampur 19.55 82.93
66 12-13 Jun 2004 2-Day 600 Thuamulrampur 19.55 82.93
67 13-14 Jun 2004 2-Day 472 Kudumulgumma 18.33 82.17
68 12-13 Sep 2005 2-Day 480 Thuamulrampur 19.55 82.93
69 20-21 Sep 2005 2-Day 561 Kunavaram 17.60 81.23
70 02-03 Aug 2006 2-Day 600 Thuamulrampur 19.55 82.93
71 04-05 Aug 2006 2-Day 497 Sukma 18.38 81.67
72 05-06 Aug 2007 2-Day 565 Naugaon 20.25 85.17
73 06-07 Aug 2007 2-Day 665 Thuamulrampur 19.55 82.93
74 02-04 Aug 1910 3-Day 495 Jeypore 18.85 82.57
75 24-26 Jun 1914 3-Day 582 Koraput 18.82 82.72
76 15-17 Jun 1918 3-Day 573 Sonepur 20.83 83.90
77 17-19 Nov 1923 3-Day 706 Itchapuram 19.12 84.70
78 13-15 Oct 1931 3-Day 585 Pottangi 18.57 82.97
79 02-04 Aug 1933 3-Day 468 Balandapara 20.50 83.87
80 13-15 Jun 1936 3-Day 890 Balandapara 20.50 83.87
81 24-26 Jun 1940 3-Day 458 Balandapara 20.50 83.87
82 18-20 Jun 1953 3-Day 349 Sompeta 18.93 84.60
83 06-08 Jul 1973 3-Day 521 Thuamulrampur 19.55 82.93
84 20-22 Nov 1977 3-Day 328 Narsipatnam 17.67 82.62
85 28-30 Aug 1982 3-Day 890 Dunguripalli 21.03 83.55
86 22-24 Jul 1989 3-Day 469 Kodur 16.52 81.98
87 03-05 Nov 1990 3-Day 560 Digapahandi 18.50 84.29
88 15-17 Jul 1991 3-Day 595 Thuamulrampur 19.55 82.93
89 11-13 Aug 1991 3-Day 676 Phiringia 20.35 84.12
90 17-19 Aug 1994 3-Day 374 Balliguda 20.20 83.92
91 09-11 May 1995 3-Day 710 Nuagada 19.10 84.05
92 22-24 Jul 1995 3-Day 421 Patnagarh 20.72 83.13
93 16-18 Jun 1996 3-Day 701 Koida 17.75 81.33
94 30-01 Aug 1997 3-Day 558 Thuamulrampur 19.55 82.93
95 19-21 Aug 1997 3-Day 791 Thuamulrampur 19.55 82.93
96 13-15 Jun 2001 3-Day 905 Thuamulrampur 19.55 82.93
97 26-28 Aug 2003 3-Day 915 Thuamulrampur 19.55 82.93
98 12-14 Jun 2004 3-Day 694 Thuamulrampur 19.55 82.93
99 12-14 Sep 2005 3-Day 560 Thuamulrampur 19.55 82.93
100 02-04 Aug 2006 3-Day 734 Thuamulrampur 19.55 82.93
101 04-06 Aug 2007 3-Day 575 Naugaon 20.25 85.17
102 05-07 Aug 2007 3-Day 765 Thuamulrampur 19.55 82.93
Using the listed storms, envelope curves for the basin were derived for 1-day, 2-day and 3-day durations. The storms contributing to the envelope curves of the catchment have been listed in Table 3-11 to Table 3-13 for 1-day, 2-day and 3-day durations respectively. Envelope DAD curves for the catchment for 1-day, 2-day and 3-day durations are shown in Figure 3-19 to Figure 3-21.
The insitu Standard Project Storm (SPS) were read from corresponding DAD envelope curves of the basin for 1-day, 2-day and 3-day durations separately. These SPS (insitu) values were multiplied with the MMF to obtain insitu PMP values. SPS (insitu), contributing
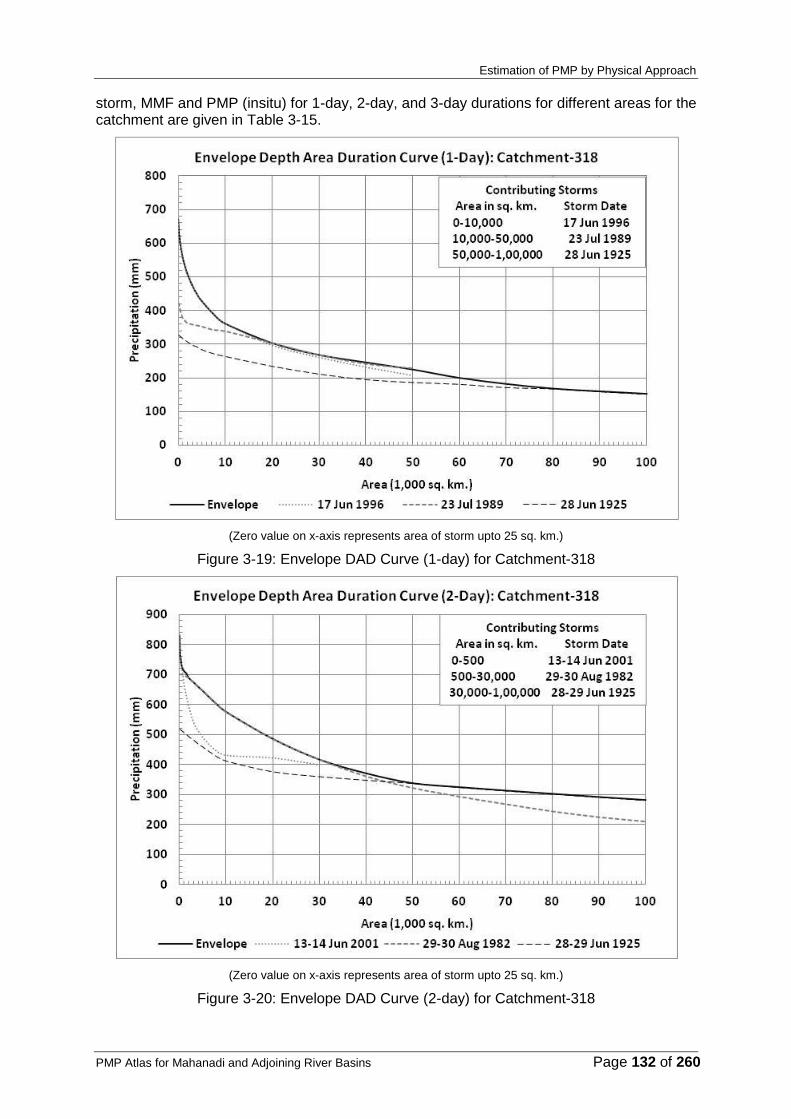
Estimation of PMP by Physical Approach
PMP Atlas for Mahanadi and Adjoining River Basins Page 132 of 260
storm, MMF and PMP (insitu) for 1-day, 2-day, and 3-day durations for different areas for the catchment are given in Table 3-15.
(Zero value on x-axis represents area of storm upto 25 sq. km.)
Figure 3-19: Envelope DAD Curve (1-day) for Catchment-318
(Zero value on x-axis represents area of storm upto 25 sq. km.)
Figure 3-20: Envelope DAD Curve (2-day) for Catchment-318

Estimation of PMP by Physical Approach
PMP Atlas for Mahanadi and Adjoining River Basins Page 133 of 260
(Zero value on x-axis represents area of storm upto 25 sq. km.)
Figure 3-21: Envelope DAD Curve (3-day) for Catchment-318

Estimation of PMP by Physical Approach
PMP Atlas for Mahanadi and Adjoining River Basins Page 134 of 260
Table 3-15: SPS (in situ) and PMP (in situ) values for Catchment-318
Area, sq. km.
1-Day 2-Day 3-Day
Storm In-situ
SPS (mm) MMF
PMP (mm)
Storm In-situ
SPS (mm) MMF
PMP (mm)
Storm In-situ
SPS (mm) MMF
PMP (mm)
25 17 Jun 1996 675 1.23 830 13-14 Jun 2001 830 1.23 1021 28-30 Aug 1982 890 1.26 1121
100 17 Jun 1996 645 1.23 793 13-14 Jun 2001 785 1.23 966 28-30 Aug 1982 878 1.26 1106
200 17 Jun 1996 627 1.23 771 13-14 Jun 2001 760 1.23 935 28-30 Aug 1982 868 1.26 1094
500 17 Jun 1996 592 1.23 728 13-14 Jun 2001 717 1.23 882 28-30 Aug 1982 846 1.26 1066
1,000 17 Jun 1996 555 1.23 683 29-30 Aug 1982 697 1.26 878 28-30 Aug 1982 825 1.26 1040
1,500 17 Jun 1996 529 1.23 651 29-30 Aug 1982 693 1.26 873 28-30 Aug 1982 809 1.26 1019
2,000 17 Jun 1996 508 1.23 625 29-30 Aug 1982 687 1.26 866 28-30 Aug 1982 798 1.26 1005
3,000 17 Jun 1996 475 1.23 584 29-30 Aug 1982 673 1.26 848 28-30 Aug 1982 782 1.26 985
4,000 17 Jun 1996 449 1.23 552 29-30 Aug 1982 658 1.26 829 28-30 Aug 1982 767 1.26 966
5,000 17 Jun 1996 429 1.23 528 29-30 Aug 1982 644 1.26 811 28-30 Aug 1982 749 1.26 944
7,500 17 Jun 1996 390 1.23 480 29-30 Aug 1982 607 1.26 765 28-30 Aug 1982 703 1.26 886
10,000 17 Jun 1996 362 1.23 445 29-30 Aug 1982 575 1.26 725 28-30 Aug 1982 666 1.26 839
20,000 23 Jul 1989 304 1.29 392 29-30 Aug 1982 485 1.26 611 28-30 Aug 1982 547 1.26 689
30,000 23 Jul 1989 268 1.29 346 29-30 Aug 1982 416 1.26 524 13-15 Jun 2001 471 1.23 579
40,000 23 Jul 1989 246 1.29 317 28-29 Jun 1925 348 1.45 505 13-15 Jun 2001 453 1.23 557
50,000 23 Jul 1989 229 1.29 295 28-29 Jun 1925 337 1.45 489 13-15 Jun 2001 434 1.23 534
60,000 28 Jun 1925 182 1.45 264 28-29 Jun 1925 324 1.45 470 13-15 Jun 2001 422 1.23 519
70,000 28 Jun 1925 176 1.45 255 28-29 Jun 1925 312 1.45 452 13-15 Jun 2001 407 1.23 501
80,000 28 Jun 1925 168 1.45 244 28-29 Jun 1925 302 1.45 438 13-15 Jun 2001 394 1.23 485
90,000 28 Jun 1925 160 1.45 232 28-29 Jun 1925 291 1.45 422 13-15 Jun 2001 384 1.23 472
1,00,000 28 Jun 1925 153 1.45 222 28-29 Jun 1925 281 1.45 407 13-15 Jun 2001 375 1.23 461

Estimation of PMP by Physical Approach
PMP Atlas for Mahanadi and Adjoining River Basins Page 135 of 260
3.3.4 CATCHMENT NO. 319
Considering the orography and location of the catchment, rainstorms that can affect this catchment have been analyzed using the DAD method. Out of storms listed in Table 3-2, storms for 1-day, 2-day and 3-day durations that are transposable (linear transposition within the limit of ± 2 degree in flat region) to the catchment have been listed in Table 3-8 to Table 3-10 respectively. Table 3-16 shows a list of rainstorms, which affected the catchment-319.
Table 3-16: Rainstorms affecting Catchment-319
Sr. No.
Date Storm Duration Peak (mm) Storm Centre Lat
(Deg) Long (Deg)
1 26 Jun 1908 1-Day 384 Sakoli 21.08 80.00
2 02 Aug 1908 1-Day 320 Gadchiroli 20.18 80.00
3 04 Aug 1910 1-Day 381 Kurud 20.83 81.72
4 03 Aug 1912 1-Day 304 Armori 20.47 79.98
5 16 Jun 1918 1-Day 366 Sonepur 20.83 83.90
6 18 Jun 1918 1-Day 347 Gondia 21.45 80.20
7 28 Jun 1925 1-Day 327 Balandapara 20.50 83.87
8 29 Jun 1925 1-Day 350 Jharsuguda 21.85 84.03
9 21 Sep 1926 1-Day 359 Bichhia 22.45 80.72
10 24 Aug 1929 1-Day 210 Sarangarh 21.58 83.08
11 22 Aug 1934 1-Day 293 Mahuadaur 23.40 84.13
12 14 Jun 1936 1-Day 338 Balandapara 20.50 83.87
13 15 Jun 1936 1-Day 395 Balandapara 20.50 83.87
14 28 Jun 1937 1-Day 309 Sarangarh 21.58 83.08
15 25 Jul 1937 1-Day 395 Pangree 21.42 80.10
16 19 Aug 1939 1-Day 311 Ambagarh chowki 20.78 80.73
17 26 Jun 1940 1-Day 258 Maramsilli 20.55 81.67
18 09 Jul 1940 1-Day 225 Sarangarh 21.58 83.08
19 03 Aug 1942 1-Day 244 Antagarh 20.10 81.17
20 31 Aug 1947 1-Day 376 Bodalkasa 21.37 80.05
21 15 Aug 1948 1-Day 308 Dhamtari 20.70 81.57
22 31 Jul 1951 1-Day 286 Dhanora 20.27 80.32
23 04 Aug 1953 1-Day 301 Ambagarh chowki 20.78 80.73
24 04 Sep 1955 1-Day 288 Sonepur 20.85 83.98
25 15 Jul 1958 1-Day 326 Bolangir 20.72 83.48
26 30 Jun 1959 1-Day 307 Antagarh 20.10 81.17
27 03 Jul 1960 1-Day 318 Paoni 20.78 79.65
28 15 Aug 1960 1-Day 296 Kusumi 21.75 84.52
29 02 Sep 1961 1-Day 344 Pangree 21.42 80.10
30 02 Aug 1967 1-Day 320 Arkambali farm 19.90 83.17
31 01 Jul 1970 1-Day 328 Sonepur 20.85 83.98
32 29 Aug 1978 1-Day 286 Paoni 20.78 79.65
33 09 Aug 1981 1-Day 342 Antagarh 20.10 81.17
34 30 Aug 1982 1-Day 520 Bijepur 21.18 83.47
35 22 Jul 1986 1-Day 384 Gadchiroli 20.18 80.00
36 22 Aug 1990 1-Day 302 Armori 20.47 79.98
37 17 Jul 1991 1-Day 347 Tentalkhunti 20.92 83.42
38 16 Aug 1991 1-Day 285 Gadchiroli 20.18 80.00
39 28 Jul 1992 1-Day 475 Bijepur 21.18 83.47
40 20 Aug 1992 1-Day 285 Gaisilet 20.92 83.25
41 15 Jun 1994 1-Day 458 Dhabara /dabra 21.78 83.08
42 13 Jul 1994 1-Day 253 Sundergarh 22.12 84.03
43 30 Aug 1994 1-Day 365 Nagbhir 20.60 79.65
44 23 Jul 1995 1-Day 292 Patnagarh 20.72 83.13
45 01 Aug 1996 1-Day 300 Durg 21.22 81.28
46 18 Jul 2000 1-Day 407 Paoni 20.78 79.65
47 17 Jul 2001 1-Day 369 Kuchinda 21.75 84.35
48 20 Jun 2003 1-Day 347 Sundergarh 22.12 84.03
49 30 Jul 2005 1-Day 310 R.pur/rairakhol 21.07 84.35
50 18 Sep 2008 1-Day 355 Jujomura 21.17 84.08
51 03-04 Aug 1910 2-Day 437 Raipur 21.23 81.65
52 03-04 Aug 1912 2-Day 519 Armori 20.47 79.98
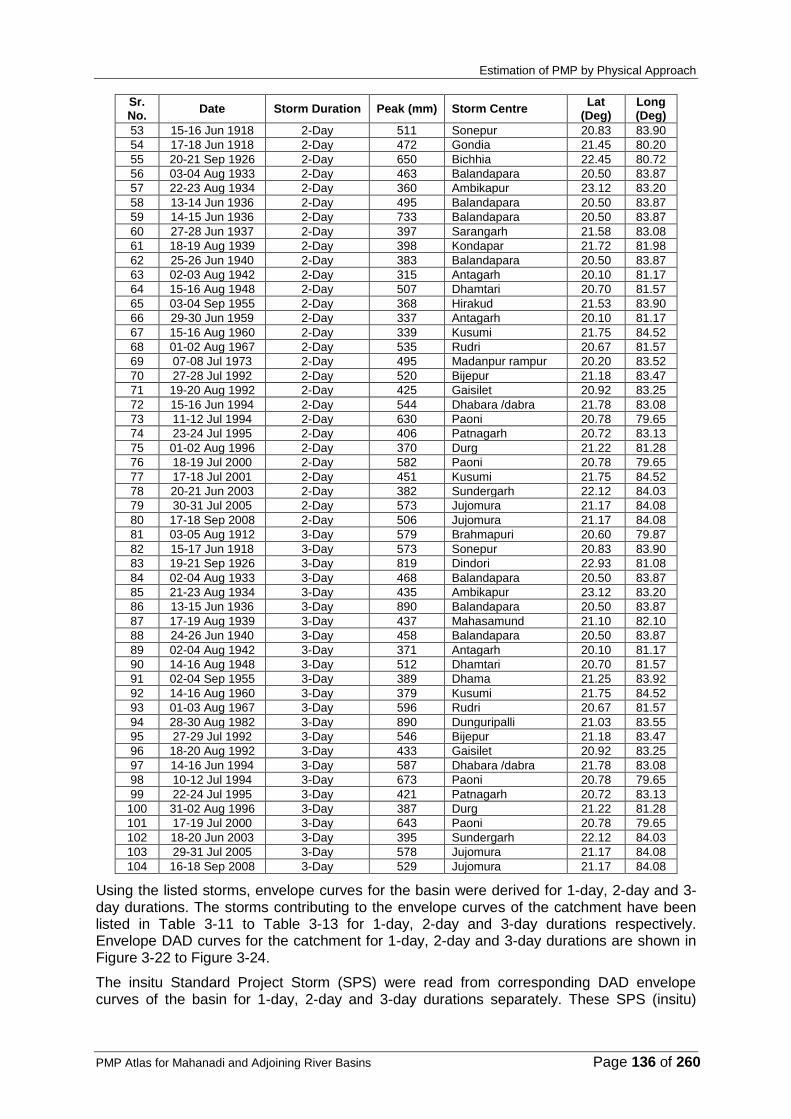
Estimation of PMP by Physical Approach
PMP Atlas for Mahanadi and Adjoining River Basins Page 136 of 260
Sr. No.
Date Storm Duration Peak (mm) Storm Centre Lat
(Deg) Long (Deg)
53 15-16 Jun 1918 2-Day 511 Sonepur 20.83 83.90
54 17-18 Jun 1918 2-Day 472 Gondia 21.45 80.20
55 20-21 Sep 1926 2-Day 650 Bichhia 22.45 80.72
56 03-04 Aug 1933 2-Day 463 Balandapara 20.50 83.87
57 22-23 Aug 1934 2-Day 360 Ambikapur 23.12 83.20
58 13-14 Jun 1936 2-Day 495 Balandapara 20.50 83.87
59 14-15 Jun 1936 2-Day 733 Balandapara 20.50 83.87
60 27-28 Jun 1937 2-Day 397 Sarangarh 21.58 83.08
61 18-19 Aug 1939 2-Day 398 Kondapar 21.72 81.98
62 25-26 Jun 1940 2-Day 383 Balandapara 20.50 83.87
63 02-03 Aug 1942 2-Day 315 Antagarh 20.10 81.17
64 15-16 Aug 1948 2-Day 507 Dhamtari 20.70 81.57
65 03-04 Sep 1955 2-Day 368 Hirakud 21.53 83.90
66 29-30 Jun 1959 2-Day 337 Antagarh 20.10 81.17
67 15-16 Aug 1960 2-Day 339 Kusumi 21.75 84.52
68 01-02 Aug 1967 2-Day 535 Rudri 20.67 81.57
69 07-08 Jul 1973 2-Day 495 Madanpur rampur 20.20 83.52
70 27-28 Jul 1992 2-Day 520 Bijepur 21.18 83.47
71 19-20 Aug 1992 2-Day 425 Gaisilet 20.92 83.25
72 15-16 Jun 1994 2-Day 544 Dhabara /dabra 21.78 83.08
73 11-12 Jul 1994 2-Day 630 Paoni 20.78 79.65
74 23-24 Jul 1995 2-Day 406 Patnagarh 20.72 83.13
75 01-02 Aug 1996 2-Day 370 Durg 21.22 81.28
76 18-19 Jul 2000 2-Day 582 Paoni 20.78 79.65
77 17-18 Jul 2001 2-Day 451 Kusumi 21.75 84.52
78 20-21 Jun 2003 2-Day 382 Sundergarh 22.12 84.03
79 30-31 Jul 2005 2-Day 573 Jujomura 21.17 84.08
80 17-18 Sep 2008 2-Day 506 Jujomura 21.17 84.08
81 03-05 Aug 1912 3-Day 579 Brahmapuri 20.60 79.87
82 15-17 Jun 1918 3-Day 573 Sonepur 20.83 83.90
83 19-21 Sep 1926 3-Day 819 Dindori 22.93 81.08
84 02-04 Aug 1933 3-Day 468 Balandapara 20.50 83.87
85 21-23 Aug 1934 3-Day 435 Ambikapur 23.12 83.20
86 13-15 Jun 1936 3-Day 890 Balandapara 20.50 83.87
87 17-19 Aug 1939 3-Day 437 Mahasamund 21.10 82.10
88 24-26 Jun 1940 3-Day 458 Balandapara 20.50 83.87
89 02-04 Aug 1942 3-Day 371 Antagarh 20.10 81.17
90 14-16 Aug 1948 3-Day 512 Dhamtari 20.70 81.57
91 02-04 Sep 1955 3-Day 389 Dhama 21.25 83.92
92 14-16 Aug 1960 3-Day 379 Kusumi 21.75 84.52
93 01-03 Aug 1967 3-Day 596 Rudri 20.67 81.57
94 28-30 Aug 1982 3-Day 890 Dunguripalli 21.03 83.55
95 27-29 Jul 1992 3-Day 546 Bijepur 21.18 83.47
96 18-20 Aug 1992 3-Day 433 Gaisilet 20.92 83.25
97 14-16 Jun 1994 3-Day 587 Dhabara /dabra 21.78 83.08
98 10-12 Jul 1994 3-Day 673 Paoni 20.78 79.65
99 22-24 Jul 1995 3-Day 421 Patnagarh 20.72 83.13
100 31-02 Aug 1996 3-Day 387 Durg 21.22 81.28
101 17-19 Jul 2000 3-Day 643 Paoni 20.78 79.65
102 18-20 Jun 2003 3-Day 395 Sundergarh 22.12 84.03
103 29-31 Jul 2005 3-Day 578 Jujomura 21.17 84.08
104 16-18 Sep 2008 3-Day 529 Jujomura 21.17 84.08
Using the listed storms, envelope curves for the basin were derived for 1-day, 2-day and 3-day durations. The storms contributing to the envelope curves of the catchment have been listed in Table 3-11 to Table 3-13 for 1-day, 2-day and 3-day durations respectively. Envelope DAD curves for the catchment for 1-day, 2-day and 3-day durations are shown in Figure 3-22 to Figure 3-24.
The insitu Standard Project Storm (SPS) were read from corresponding DAD envelope curves of the basin for 1-day, 2-day and 3-day durations separately. These SPS (insitu)

Estimation of PMP by Physical Approach
PMP Atlas for Mahanadi and Adjoining River Basins Page 137 of 260
values were multiplied with the MMF to obtain insitu PMP values. SPS (insitu), contributing storm, MMF and PMP (insitu) for 1-day, 2-day, and 3-day durations for different areas for the catchment are given in Table 3-17.
(Zero value on x-axis represents area of storm upto 25 sq. km.)
Figure 3-22: Envelope DAD Curve (1-day) for Catchment-319
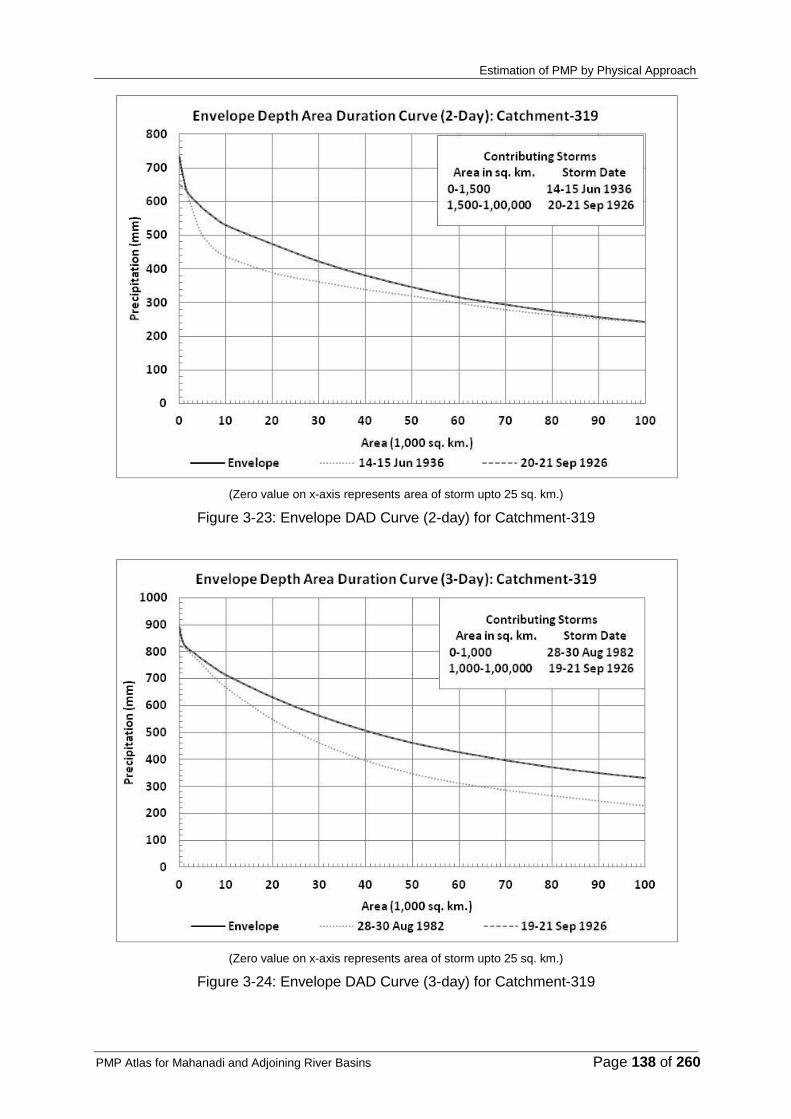
Estimation of PMP by Physical Approach
PMP Atlas for Mahanadi and Adjoining River Basins Page 138 of 260
(Zero value on x-axis represents area of storm upto 25 sq. km.)
Figure 3-23: Envelope DAD Curve (2-day) for Catchment-319
(Zero value on x-axis represents area of storm upto 25 sq. km.)
Figure 3-24: Envelope DAD Curve (3-day) for Catchment-319

Estimation of PMP by Physical Approach
PMP Atlas for Mahanadi and Adjoining River Basins Page 139 of 260
Table 3-17: SPS (in situ) and PMP (in situ) values for Catchment-319
Area, sq. km.
1-Day 2-Day 3-Day
Storm In-situ
SPS (mm) MMF
PMP (mm)
Storm In-situ
SPS (mm) MMF
PMP (mm)
Storm In-situ
SPS (mm) MMF
PMP (mm)
25 30 Aug 1982 520 1.26 655 14-15 Jun 1936 733 1.40 1026 28-30 Aug 1982 890 1.26 1121
100 30 Aug 1982 516 1.26 650 14-15 Jun 1936 724 1.40 1014 28-30 Aug 1982 878 1.26 1106
200 30 Aug 1982 512 1.26 645 14-15 Jun 1936 715 1.40 1001 28-30 Aug 1982 868 1.26 1094
500 30 Aug 1982 501 1.26 631 14-15 Jun 1936 692 1.40 969 28-30 Aug 1982 846 1.26 1066
1,000 30 Aug 1982 487 1.26 614 14-15 Jun 1936 662 1.40 927 28-30 Aug 1982 825 1.26 1040
1,500 30 Aug 1982 478 1.26 602 14-15 Jun 1936 634 1.40 888 19-21 Sep 1926 810 1.13 915
2,000 30 Aug 1982 471 1.26 593 20-21 Sep 1926 623 1.13 704 19-21 Sep 1926 807 1.13 912
3,000 30 Aug 1982 462 1.26 582 20-21 Sep 1926 606 1.13 685 19-21 Sep 1926 796 1.13 899
4,000 30 Aug 1982 449 1.26 566 20-21 Sep 1926 594 1.13 671 19-21 Sep 1926 782 1.13 884
5,000 30 Aug 1982 435 1.26 548 20-21 Sep 1926 580 1.13 655 19-21 Sep 1926 769 1.13 869
7,500 30 Aug 1982 402 1.26 507 20-21 Sep 1926 553 1.13 625 19-21 Sep 1926 740 1.13 836
10,000 30 Aug 1982 366 1.26 461 20-21 Sep 1926 530 1.13 599 19-21 Sep 1926 713 1.13 806
20,000 30 Aug 1982 290 1.26 365 20-21 Sep 1926 474 1.13 536 19-21 Sep 1926 630 1.13 712
30,000 30 Aug 1982 239 1.26 301 20-21 Sep 1926 422 1.13 477 19-21 Sep 1926 562 1.13 635
40,000 28 Jun 1925 196 1.45 284 20-21 Sep 1926 381 1.13 431 19-21 Sep 1926 506 1.13 572
50,000 28 Jun 1925 187 1.45 271 20-21 Sep 1926 347 1.13 392 19-21 Sep 1926 461 1.13 521
60,000 28 Jun 1925 182 1.45 264 20-21 Sep 1926 317 1.13 358 19-21 Sep 1926 427 1.13 483
70,000 28 Jun 1925 176 1.45 255 20-21 Sep 1926 295 1.13 333 19-21 Sep 1926 397 1.13 449
80,000 28 Jun 1925 168 1.45 244 20-21 Sep 1926 275 1.13 311 19-21 Sep 1926 371 1.13 419
90,000 28 Jun 1925 160 1.45 232 20-21 Sep 1926 258 1.13 292 19-21 Sep 1926 350 1.13 396
1,00,000 28 Jun 1925 153 1.45 222 20-21 Sep 1926 244 1.13 276 19-21 Sep 1926 332 1.13 375
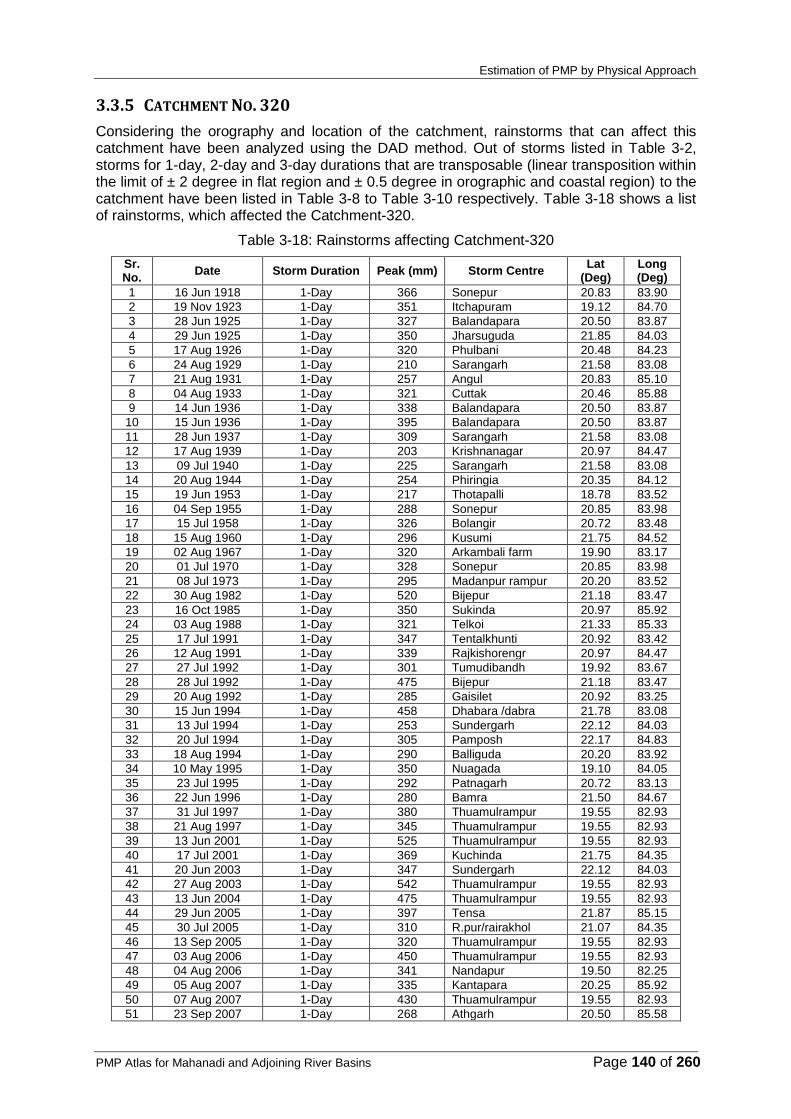
Estimation of PMP by Physical Approach
PMP Atlas for Mahanadi and Adjoining River Basins Page 140 of 260
3.3.5 CATCHMENT NO. 320
Considering the orography and location of the catchment, rainstorms that can affect this catchment have been analyzed using the DAD method. Out of storms listed in Table 3-2, storms for 1-day, 2-day and 3-day durations that are transposable (linear transposition within the limit of ± 2 degree in flat region and ± 0.5 degree in orographic and coastal region) to the catchment have been listed in Table 3-8 to Table 3-10 respectively. Table 3-18 shows a list of rainstorms, which affected the Catchment-320.
Table 3-18: Rainstorms affecting Catchment-320
Sr. No.
Date Storm Duration Peak (mm) Storm Centre Lat
(Deg) Long (Deg)
1 16 Jun 1918 1-Day 366 Sonepur 20.83 83.90
2 19 Nov 1923 1-Day 351 Itchapuram 19.12 84.70
3 28 Jun 1925 1-Day 327 Balandapara 20.50 83.87
4 29 Jun 1925 1-Day 350 Jharsuguda 21.85 84.03
5 17 Aug 1926 1-Day 320 Phulbani 20.48 84.23
6 24 Aug 1929 1-Day 210 Sarangarh 21.58 83.08
7 21 Aug 1931 1-Day 257 Angul 20.83 85.10
8 04 Aug 1933 1-Day 321 Cuttak 20.46 85.88
9 14 Jun 1936 1-Day 338 Balandapara 20.50 83.87
10 15 Jun 1936 1-Day 395 Balandapara 20.50 83.87
11 28 Jun 1937 1-Day 309 Sarangarh 21.58 83.08
12 17 Aug 1939 1-Day 203 Krishnanagar 20.97 84.47
13 09 Jul 1940 1-Day 225 Sarangarh 21.58 83.08
14 20 Aug 1944 1-Day 254 Phiringia 20.35 84.12
15 19 Jun 1953 1-Day 217 Thotapalli 18.78 83.52
16 04 Sep 1955 1-Day 288 Sonepur 20.85 83.98
17 15 Jul 1958 1-Day 326 Bolangir 20.72 83.48
18 15 Aug 1960 1-Day 296 Kusumi 21.75 84.52
19 02 Aug 1967 1-Day 320 Arkambali farm 19.90 83.17
20 01 Jul 1970 1-Day 328 Sonepur 20.85 83.98
21 08 Jul 1973 1-Day 295 Madanpur rampur 20.20 83.52
22 30 Aug 1982 1-Day 520 Bijepur 21.18 83.47
23 16 Oct 1985 1-Day 350 Sukinda 20.97 85.92
24 03 Aug 1988 1-Day 321 Telkoi 21.33 85.33
25 17 Jul 1991 1-Day 347 Tentalkhunti 20.92 83.42
26 12 Aug 1991 1-Day 339 Rajkishorengr 20.97 84.47
27 27 Jul 1992 1-Day 301 Tumudibandh 19.92 83.67
28 28 Jul 1992 1-Day 475 Bijepur 21.18 83.47
29 20 Aug 1992 1-Day 285 Gaisilet 20.92 83.25
30 15 Jun 1994 1-Day 458 Dhabara /dabra 21.78 83.08
31 13 Jul 1994 1-Day 253 Sundergarh 22.12 84.03
32 20 Jul 1994 1-Day 305 Pamposh 22.17 84.83
33 18 Aug 1994 1-Day 290 Balliguda 20.20 83.92
34 10 May 1995 1-Day 350 Nuagada 19.10 84.05
35 23 Jul 1995 1-Day 292 Patnagarh 20.72 83.13
36 22 Jun 1996 1-Day 280 Bamra 21.50 84.67
37 31 Jul 1997 1-Day 380 Thuamulrampur 19.55 82.93
38 21 Aug 1997 1-Day 345 Thuamulrampur 19.55 82.93
39 13 Jun 2001 1-Day 525 Thuamulrampur 19.55 82.93
40 17 Jul 2001 1-Day 369 Kuchinda 21.75 84.35
41 20 Jun 2003 1-Day 347 Sundergarh 22.12 84.03
42 27 Aug 2003 1-Day 542 Thuamulrampur 19.55 82.93
43 13 Jun 2004 1-Day 475 Thuamulrampur 19.55 82.93
44 29 Jun 2005 1-Day 397 Tensa 21.87 85.15
45 30 Jul 2005 1-Day 310 R.pur/rairakhol 21.07 84.35
46 13 Sep 2005 1-Day 320 Thuamulrampur 19.55 82.93
47 03 Aug 2006 1-Day 450 Thuamulrampur 19.55 82.93
48 04 Aug 2006 1-Day 341 Nandapur 19.50 82.25
49 05 Aug 2007 1-Day 335 Kantapara 20.25 85.92
50 07 Aug 2007 1-Day 430 Thuamulrampur 19.55 82.93
51 23 Sep 2007 1-Day 268 Athgarh 20.50 85.58

Estimation of PMP by Physical Approach
PMP Atlas for Mahanadi and Adjoining River Basins Page 141 of 260
Sr. No.
Date Storm Duration Peak (mm) Storm Centre Lat
(Deg) Long (Deg)
52 18 Sep 2008 1-Day 355 Jujomura 21.17 84.08
53 15-16 Jun 1918 2-Day 511 Sonepur 20.83 83.90
54 18-19 Nov 1923 2-Day 657 Itchapuram 19.12 84.70
55 28-29 Jun 1925 2-Day 518 Phulbani 20.48 84.23
56 16-17 Aug 1926 2-Day 513 Phulbani 20.48 84.23
57 15-16 Aug 1931 2-Day 366 Nawarangpur 19.23 82.55
58 03-04 Aug 1933 2-Day 463 Balandapara 20.50 83.87
59 13-14 Jun 1936 2-Day 495 Balandapara 20.50 83.87
60 14-15 Jun 1936 2-Day 733 Balandapara 20.50 83.87
61 27-28 Jun 1937 2-Day 397 Sarangarh 21.58 83.08
62 25-26 Jun 1940 2-Day 383 Balandapara 20.50 83.87
63 08-09 Jul 1940 2-Day 374 Athmalik 20.72 84.53
64 03-04 Sep 1955 2-Day 368 Hirakud 21.53 83.90
65 15-16 Aug 1960 2-Day 339 Kusumi 21.75 84.52
66 07-08 Jul 1973 2-Day 495 Madanpur rampur 20.20 83.52
67 29-30 Aug 1982 2-Day 700 Phulbani 20.48 84.23
68 03-04 Aug 1988 2-Day 337 Telkoi 21.33 85.33
69 16-17 Jul 1991 2-Day 510 Thuamulrampur 19.55 82.93
70 12-13 Aug 1991 2-Day 616 Phiringia 20.35 84.12
71 27-28 Jul 1992 2-Day 520 Bijepur 21.18 83.47
72 19-20 Aug 1992 2-Day 425 Gaisilet 20.92 83.25
73 15-16 Jun 1994 2-Day 544 Dhabara /dabra 21.78 83.08
74 17-18 Aug 1994 2-Day 354 Balliguda 20.20 83.92
75 10-11 May 1995 2-Day 610 Nuagada 19.10 84.05
76 23-24 Jul 1995 2-Day 406 Patnagarh 20.72 83.13
77 21-22 Jun 1996 2-Day 503 Pal-lahara 21.43 85.18
78 30-31 Jul 1997 2-Day 545 Thuamulrampur 19.55 82.93
79 20-21 Aug 1997 2-Day 623 Thuamulrampur 19.55 82.93
80 13-14 Jun 2001 2-Day 830 Thuamulrampur 19.55 82.93
81 17-18 Jul 2001 2-Day 451 Kusumi 21.75 84.52
82 20-21 Jun 2003 2-Day 382 Sundergarh 22.12 84.03
83 26-27 Aug 2003 2-Day 842 Thuamulrampur 19.55 82.93
84 12-13 Jun 2004 2-Day 600 Thuamulrampur 19.55 82.93
85 28-29 Jun 2005 2-Day 639 Pallahara 21.43 85.18
86 30-31 Jul 2005 2-Day 573 Jujomura 21.17 84.08
87 12-13 Sep 2005 2-Day 480 Thuamulrampur 19.55 82.93
88 02-03 Aug 2006 2-Day 600 Thuamulrampur 19.55 82.93
89 06-07 Jul 2007 2-Day 564 Joda 22.00 85.42
90 05-06 Aug 2007 2-Day 565 Naugaon 20.25 85.17
91 06-07 Aug 2007 2-Day 665 Thuamulrampur 19.55 82.93
92 17-18 Sep 2008 2-Day 506 Jujomura 21.17 84.08
93 15-17 Jun 1918 3-Day 573 Sonepur 20.83 83.90
94 17-19 Nov 1923 3-Day 706 Itchapuram 19.12 84.70
95 02-04 Aug 1933 3-Day 468 Balandapara 20.50 83.87
96 13-15 Jun 1936 3-Day 890 Balandapara 20.50 83.87
97 17-19 Aug 1939 3-Day 437 Mahasamund 21.10 82.10
98 24-26 Jun 1940 3-Day 458 Balandapara 20.50 83.87
99 07-09 Jul 1940 3-Day 400 Barchana 20.67 86.12
100 18-20 Jun 1953 3-Day 349 Sompeta 18.93 84.60
101 02-04 Sep 1955 3-Day 389 Dhama 21.25 83.92
102 14-16 Aug 1960 3-Day 379 Kusumi 21.75 84.52
103 06-08 Jul 1973 3-Day 521 Thuamulrampur 19.55 82.93
104 28-30 Aug 1982 3-Day 890 Dunguripalli 21.03 83.55
105 15-17 Jul 1991 3-Day 595 Thuamulrampur 19.55 82.93
106 11-13 Aug 1991 3-Day 676 Phiringia 20.35 84.12
107 27-29 Jul 1992 3-Day 546 Bijepur 21.18 83.47
108 18-20 Aug 1992 3-Day 433 Gaisilet 20.92 83.25
109 14-16 Jun 1994 3-Day 587 Dhabara /dabra 21.78 83.08
110 17-19 Aug 1994 3-Day 374 Balliguda 20.20 83.92
111 09-11 May 1995 3-Day 710 Nuagada 19.10 84.05
112 22-24 Jul 1995 3-Day 421 Patnagarh 20.72 83.13
113 21-23 Jun 1996 3-Day 555 Pal-lahara 21.43 85.18
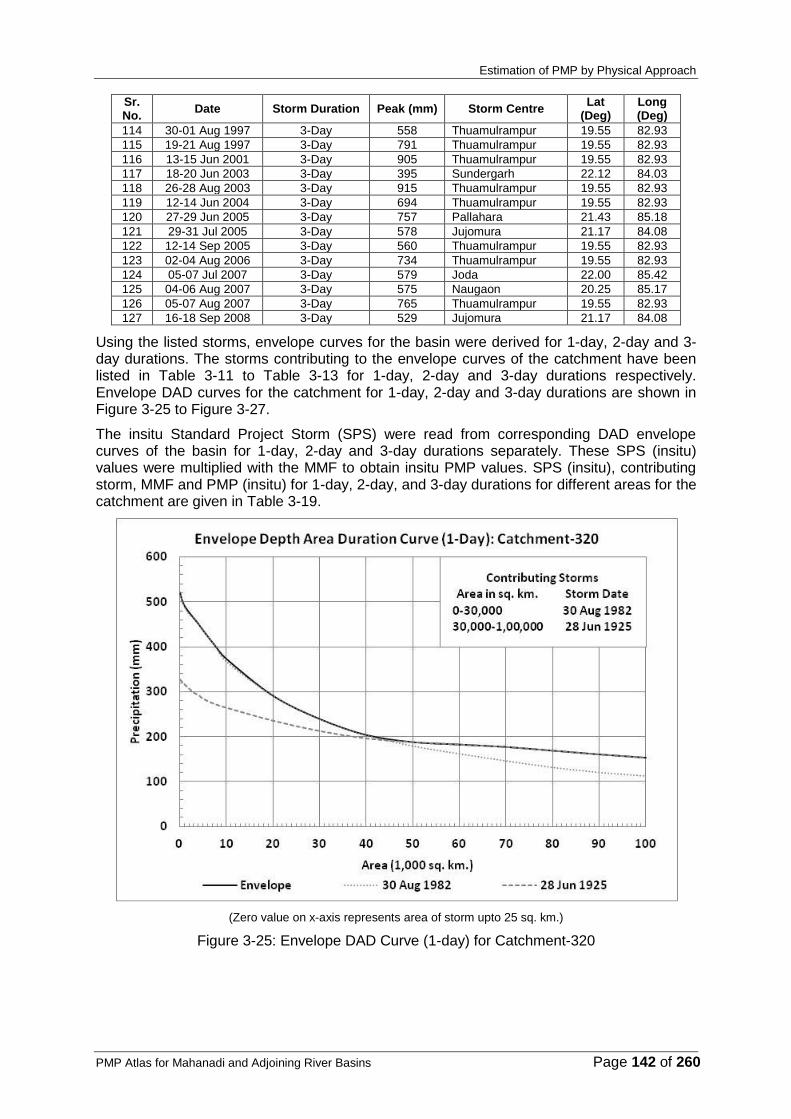
Estimation of PMP by Physical Approach
PMP Atlas for Mahanadi and Adjoining River Basins Page 142 of 260
Sr. No.
Date Storm Duration Peak (mm) Storm Centre Lat
(Deg) Long (Deg)
114 30-01 Aug 1997 3-Day 558 Thuamulrampur 19.55 82.93
115 19-21 Aug 1997 3-Day 791 Thuamulrampur 19.55 82.93
116 13-15 Jun 2001 3-Day 905 Thuamulrampur 19.55 82.93
117 18-20 Jun 2003 3-Day 395 Sundergarh 22.12 84.03
118 26-28 Aug 2003 3-Day 915 Thuamulrampur 19.55 82.93
119 12-14 Jun 2004 3-Day 694 Thuamulrampur 19.55 82.93
120 27-29 Jun 2005 3-Day 757 Pallahara 21.43 85.18
121 29-31 Jul 2005 3-Day 578 Jujomura 21.17 84.08
122 12-14 Sep 2005 3-Day 560 Thuamulrampur 19.55 82.93
123 02-04 Aug 2006 3-Day 734 Thuamulrampur 19.55 82.93
124 05-07 Jul 2007 3-Day 579 Joda 22.00 85.42
125 04-06 Aug 2007 3-Day 575 Naugaon 20.25 85.17
126 05-07 Aug 2007 3-Day 765 Thuamulrampur 19.55 82.93
127 16-18 Sep 2008 3-Day 529 Jujomura 21.17 84.08
Using the listed storms, envelope curves for the basin were derived for 1-day, 2-day and 3-day durations. The storms contributing to the envelope curves of the catchment have been listed in Table 3-11 to Table 3-13 for 1-day, 2-day and 3-day durations respectively. Envelope DAD curves for the catchment for 1-day, 2-day and 3-day durations are shown in Figure 3-25 to Figure 3-27.
The insitu Standard Project Storm (SPS) were read from corresponding DAD envelope curves of the basin for 1-day, 2-day and 3-day durations separately. These SPS (insitu) values were multiplied with the MMF to obtain insitu PMP values. SPS (insitu), contributing storm, MMF and PMP (insitu) for 1-day, 2-day, and 3-day durations for different areas for the catchment are given in Table 3-19.
(Zero value on x-axis represents area of storm upto 25 sq. km.)
Figure 3-25: Envelope DAD Curve (1-day) for Catchment-320

Estimation of PMP by Physical Approach
PMP Atlas for Mahanadi and Adjoining River Basins Page 143 of 260
(Zero value on x-axis represents area of storm upto 25 sq. km.)
Figure 3-26: Envelope DAD Curve (2-day) for Catchment-320
(Zero value on x-axis represents area of storm upto 25 sq. km.)
Figure 3-27: Envelope DAD Curve (3-day) for Catchment-320

Estimation of PMP by Physical Approach
PMP Atlas for Mahanadi and Adjoining River Basins Page 144 of 260
Table 3-19: SPS (in situ) and PMP (in situ) values for Catchment-320
Area, sq. km.
1-Day 2-Day 3-Day
Storm In-situ
SPS (mm) MMF
PMP (mm)
Storm In-situ
SPS (mm) MMF
PMP (mm)
Storm In-situ
SPS (mm) MMF
PMP (mm)
25 30 Aug 1982 520 1.26 655 13-14 Jun 2001 830 1.23 1021 28-30 Aug 1982 890 1.26 1121
100 30 Aug 1982 516 1.26 650 13-14 Jun 2001 785 1.23 966 28-30 Aug 1982 878 1.26 1106
200 30 Aug 1982 512 1.26 645 13-14 Jun 2001 760 1.23 935 28-30 Aug 1982 868 1.26 1094
500 30 Aug 1982 501 1.26 631 13-14 Jun 2001 717 1.23 882 28-30 Aug 1982 846 1.26 1066
1,000 30 Aug 1982 487 1.26 614 29-30 Aug 1982 697 1.26 878 28-30 Aug 1982 825 1.26 1040
1,500 30 Aug 1982 478 1.26 602 29-30 Aug 1982 693 1.26 873 28-30 Aug 1982 809 1.26 1019
2,000 30 Aug 1982 471 1.26 593 29-30 Aug 1982 687 1.26 866 28-30 Aug 1982 798 1.26 1005
3,000 30 Aug 1982 462 1.26 582 29-30 Aug 1982 673 1.26 848 28-30 Aug 1982 782 1.26 985
4,000 30 Aug 1982 449 1.26 566 29-30 Aug 1982 658 1.26 829 28-30 Aug 1982 767 1.26 966
5,000 30 Aug 1982 435 1.26 548 29-30 Aug 1982 644 1.26 811 28-30 Aug 1982 749 1.26 944
7,500 30 Aug 1982 402 1.26 507 29-30 Aug 1982 607 1.26 765 28-30 Aug 1982 703 1.26 886
10,000 30 Aug 1982 366 1.26 461 29-30 Aug 1982 575 1.26 725 28-30 Aug 1982 666 1.26 839
20,000 30 Aug 1982 290 1.26 365 29-30 Aug 1982 485 1.26 611 28-30 Aug 1982 547 1.26 689
30,000 30 Aug 1982 239 1.26 301 29-30 Aug 1982 416 1.26 524 13-15 Jun 2001 471 1.23 579
40,000 28 Jun 1925 196 1.45 284 28-29 Jun 1925 348 1.45 505 13-15 Jun 2001 453 1.23 557
50,000 28 Jun 1925 187 1.45 271 28-29 Jun 1925 337 1.45 489 13-15 Jun 2001 434 1.23 534
60,000 28 Jun 1925 182 1.45 264 28-29 Jun 1925 324 1.45 470 13-15 Jun 2001 422 1.23 519
70,000 28 Jun 1925 176 1.45 255 28-29 Jun 1925 312 1.45 452 13-15 Jun 2001 407 1.23 501
80,000 28 Jun 1925 168 1.45 244 28-29 Jun 1925 302 1.45 438 13-15 Jun 2001 394 1.23 485
90,000 28 Jun 1925 160 1.45 232 28-29 Jun 1925 291 1.45 422 13-15 Jun 2001 384 1.23 472
1,00,000 28 Jun 1925 153 1.45 222 28-29 Jun 1925 281 1.45 407 13-15 Jun 2001 375 1.23 461

Estimation of PMP by Physical Approach
PMP Atlas for Mahanadi and Adjoining River Basins Page 145 of 260
3.3.6 CATCHMENT NO. 321
Considering the orography and location of the catchment, rainstorms that can affect this catchment have been analyzed using the DAD method. Out of storms listed in Table 3-2, storms for 1-day, 2-day and 3-day durations that are transposable (linear transposition within the limit of ± 2 degree in flat region and ± 0.5 degree in orographic and coastal region) to the catchment have been listed in Table 3-8 to Table 3-10 respectively. Table 3-20 shows a list of rainstorms, which affected the Catchment-321.
Table 3-20: Rainstorms affecting Catchment-321
Sr. No.
Date Storm Duration Peak (mm) Storm Centre Lat
(Deg) Long (Deg)
1 03 Aug 1915 1-Day 321 Jagatsingpur 20.27 86.17
2 16 Jun 1918 1-Day 366 Sonepur 20.83 83.90
3 27 Jun 1925 1-Day 402 Kendrapara 20.50 86.42
4 28 Jun 1925 1-Day 327 Balandapara 20.50 83.87
5 29 Jun 1925 1-Day 350 Jharsuguda 21.85 84.03
6 17 Aug 1926 1-Day 320 Phulbani 20.48 84.23
7 30 Jul 1927 1-Day 565 Champua 22.08 85.67
8 21 Aug 1931 1-Day 257 Angul 20.83 85.10
9 04 Aug 1933 1-Day 321 Cuttak 20.46 85.88
10 22 Aug 1934 1-Day 293 Mahuadaur 23.40 84.13
11 14 Jun 1936 1-Day 338 Balandapara 20.50 83.87
12 15 Jun 1936 1-Day 395 Balandapara 20.50 83.87
13 24 Jul 1937 1-Day 301 Jagatsingpur 20.27 86.17
14 17 Aug 1939 1-Day 203 Krishnanagar 20.97 84.47
15 01 Jul 1940 1-Day 347 Balasore 21.49 86.93
16 10 Jul 1941 1-Day 322 Chandbali 20.78 86.75
17 08 Oct 1941 1-Day 323 Balasore 21.49 86.93
18 10 Jul 1942 1-Day 339 Gopiballabhpur 22.21 86.89
19 01 Aug 1943 1-Day 479 Soro 21.28 86.70
20 20 Aug 1944 1-Day 254 Phiringia 20.35 84.12
21 04 Sep 1955 1-Day 288 Sonepur 20.85 83.98
22 15 Aug 1960 1-Day 296 Kusumi 21.75 84.52
23 01 Jul 1970 1-Day 328 Sonepur 20.85 83.98
24 04 Jun 1982 1-Day 387 Kendrapara 20.50 86.42
25 30 Aug 1982 1-Day 520 Bijepur 21.18 83.47
26 16 Aug 1984 1-Day 325 Kendrapara 20.50 86.42
27 16 Oct 1985 1-Day 350 Sukinda 20.97 85.92
28 03 Aug 1988 1-Day 321 Telkoi 21.33 85.33
29 17 Jul 1991 1-Day 347 Tentalkhunti 20.92 83.42
30 21 Jul 1991 1-Day 300 Binjharpur 20.73 86.40
31 12 Aug 1991 1-Day 339 Rajkishorengr 20.97 84.47
32 28 Jul 1992 1-Day 475 Bijepur 21.18 83.47
33 15 Jun 1994 1-Day 458 Dhabara /dabra 21.78 83.08
34 28 Jun 1994 1-Day 264 Jamsolaghat 22.22 86.72
35 29 Jun 1994 1-Day 300 Angara 23.33 85.50
36 13 Jul 1994 1-Day 253 Sundergarh 22.12 84.03
37 20 Jul 1994 1-Day 305 Pamposh 22.17 84.83
38 29 Aug 1994 1-Day 270 Bari 20.67 86.33
39 16 May 1995 1-Day 300 Pattamundai 20.58 86.57
40 22 Jun 1996 1-Day 280 Bamra 21.50 84.67
41 28 Jun 1997 1-Day 325 Tiring 21.52 86.07
42 30 Oct 1999 1-Day 397 Anandpur 21.22 86.12
43 17 Jul 2001 1-Day 369 Kuchinda 21.75 84.35
44 20 Jun 2003 1-Day 347 Sundergarh 22.12 84.03
45 28 Jun 2005 1-Day 377 Thakurmunda 21.52 86.15
46 29 Jun 2005 1-Day 397 Tensa 21.87 85.15
47 30 Jul 2005 1-Day 310 R.pur/rairakhol 21.07 84.35
48 06 Jul 2007 1-Day 310 Bahalda 22.40 86.08
49 05 Aug 2007 1-Day 335 Kantapara 20.25 85.92
50 13 Aug 2007 1-Day 375 Bijatala 22.17 86.25
51 23 Sep 2007 1-Day 268 Athgarh 20.50 85.58

Estimation of PMP by Physical Approach
PMP Atlas for Mahanadi and Adjoining River Basins Page 146 of 260
Sr. No.
Date Storm Duration Peak (mm) Storm Centre Lat
(Deg) Long (Deg)
52 18 Jun 2008 1-Day 424 Bahalda 22.40 86.08
53 18 Sep 2008 1-Day 355 Jujomura 21.17 84.08
54 15-16 Jun 1918 2-Day 511 Sonepur 20.83 83.90
55 28-29 Jun 1925 2-Day 518 Phulbani 20.48 84.23
56 16-17 Aug 1926 2-Day 513 Phulbani 20.48 84.23
57 29-30 Jul 1927 2-Day 717 Karanjia 21.77 85.98
58 03-04 Aug 1933 2-Day 463 Balandapara 20.50 83.87
59 22-23 Aug 1934 2-Day 360 Ambikapur 23.12 83.20
60 13-14 Jun 1936 2-Day 495 Balandapara 20.50 83.87
61 14-15 Jun 1936 2-Day 733 Balandapara 20.50 83.87
62 25-26 Jun 1940 2-Day 383 Balandapara 20.50 83.87
63 08-09 Jul 1940 2-Day 374 Athmalik 20.72 84.53
64 03-04 Sep 1955 2-Day 368 Hirakud 21.53 83.90
65 15-16 Aug 1960 2-Day 339 Kusumi 21.75 84.52
66 03-04 Jun 1982 2-Day 404 Kendrapara 20.50 86.42
67 29-30 Aug 1982 2-Day 700 Phulbani 20.48 84.23
68 16-17 Aug 1984 2-Day 348 Kendrapara 20.50 86.42
69 15-16 Oct 1985 2-Day 378 Akhuapada 20.92 86.28
70 03-04 Aug 1988 2-Day 337 Telkoi 21.33 85.33
71 20-21 Jul 1991 2-Day 520 Binjharpur 20.73 86.40
72 12-13 Aug 1991 2-Day 616 Phiringia 20.35 84.12
73 27-28 Jul 1992 2-Day 520 Bijepur 21.18 83.47
74 15-16 Jun 1994 2-Day 544 Dhabara /dabra 21.78 83.08
75 27-28 Jun 1994 2-Day 302 Jamsolaghat 22.22 86.72
76 28-29 Aug 1994 2-Day 380 Bari 20.67 86.33
77 15-16 May 1995 2-Day 353 Bari 20.67 86.33
78 21-22 Jun 1996 2-Day 503 Pal-lahara 21.43 85.18
79 27-28 Jun 1997 2-Day 368 Tiring 21.52 86.07
80 30-31 Oct 1999 2-Day 697 Anandpur 21.22 86.12
81 17-18 Jul 2001 2-Day 451 Kusumi 21.75 84.52
82 20-21 Jun 2003 2-Day 382 Sundergarh 22.12 84.03
83 28-29 Jun 2005 2-Day 639 Pallahara 21.43 85.18
84 30-31 Jul 2005 2-Day 573 Jujomura 21.17 84.08
85 06-07 Jul 2007 2-Day 564 Joda 22.00 85.42
86 05-06 Aug 2007 2-Day 565 Naugaon 20.25 85.17
87 22-23 Sep 2007 2-Day 388 Mahanga 20.50 86.17
88 17-18 Jun 2008 2-Day 762 Bahalda 22.40 86.08
89 17-18 Sep 2008 2-Day 506 Jujomura 21.17 84.08
90 15-17 Jun 1918 3-Day 573 Sonepur 20.83 83.90
91 27-29 Jun 1925 3-Day 661 Kendrapara 20.50 86.42
92 28-30 Jul 1927 3-Day 745 Karanjia 21.77 85.98
93 02-04 Aug 1933 3-Day 468 Balandapara 20.50 83.87
94 21-23 Aug 1934 3-Day 435 Ambikapur 23.12 83.20
95 13-15 Jun 1936 3-Day 890 Balandapara 20.50 83.87
96 24-26 Jun 1940 3-Day 458 Balandapara 20.50 83.87
97 07-09 Jul 1940 3-Day 400 Barchana 20.67 86.12
98 02-04 Sep 1955 3-Day 389 Dhama 21.25 83.92
99 14-16 Aug 1960 3-Day 379 Kusumi 21.75 84.52
100 28-30 Aug 1982 3-Day 890 Dunguripalli 21.03 83.55
101 15-17 Aug 1984 3-Day 369 Mahanga 20.50 86.17
102 20-22 Jul 1991 3-Day 521 Binjharpur 20.73 86.40
103 11-13 Aug 1991 3-Day 676 Phiringia 20.35 84.12
104 27-29 Jul 1992 3-Day 546 Bijepur 21.18 83.47
105 14-16 Jun 1994 3-Day 587 Dhabara /dabra 21.78 83.08
106 27-29 Jun 1994 3-Day 396 Goilkera 22.53 85.38
107 14-16 May 1995 3-Day 428 Bari 20.67 86.33
108 21-23 Jun 1996 3-Day 555 Pal-lahara 21.43 85.18
109 27-29 Jun 1997 3-Day 411 Tiring 21.52 86.07
110 29-31 Oct 1999 3-Day 711 Anandpur 21.22 86.12
111 18-20 Jun 2003 3-Day 395 Sundergarh 22.12 84.03
112 27-29 Jun 2005 3-Day 757 Pallahara 21.43 85.18
113 29-31 Jul 2005 3-Day 578 Jujomura 21.17 84.08
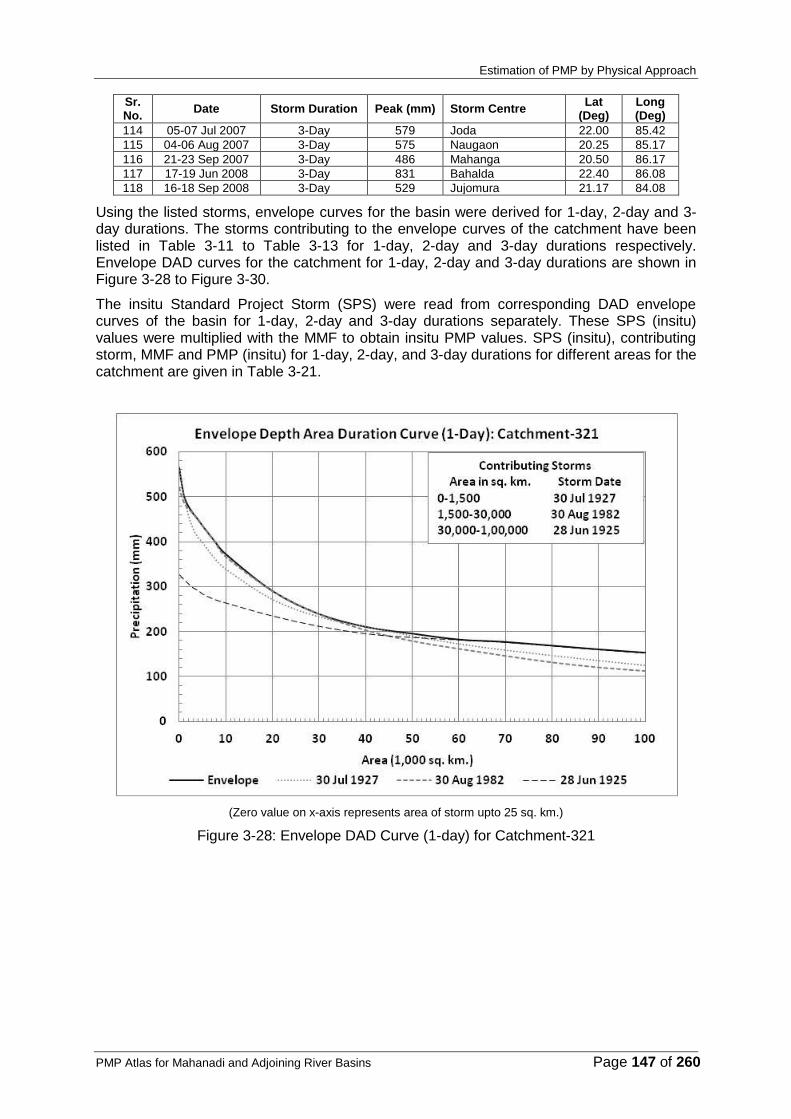
Estimation of PMP by Physical Approach
PMP Atlas for Mahanadi and Adjoining River Basins Page 147 of 260
Sr. No.
Date Storm Duration Peak (mm) Storm Centre Lat
(Deg) Long (Deg)
114 05-07 Jul 2007 3-Day 579 Joda 22.00 85.42
115 04-06 Aug 2007 3-Day 575 Naugaon 20.25 85.17
116 21-23 Sep 2007 3-Day 486 Mahanga 20.50 86.17
117 17-19 Jun 2008 3-Day 831 Bahalda 22.40 86.08
118 16-18 Sep 2008 3-Day 529 Jujomura 21.17 84.08
Using the listed storms, envelope curves for the basin were derived for 1-day, 2-day and 3-day durations. The storms contributing to the envelope curves of the catchment have been listed in Table 3-11 to Table 3-13 for 1-day, 2-day and 3-day durations respectively. Envelope DAD curves for the catchment for 1-day, 2-day and 3-day durations are shown in Figure 3-28 to Figure 3-30.
The insitu Standard Project Storm (SPS) were read from corresponding DAD envelope curves of the basin for 1-day, 2-day and 3-day durations separately. These SPS (insitu) values were multiplied with the MMF to obtain insitu PMP values. SPS (insitu), contributing storm, MMF and PMP (insitu) for 1-day, 2-day, and 3-day durations for different areas for the catchment are given in Table 3-21.
(Zero value on x-axis represents area of storm upto 25 sq. km.)
Figure 3-28: Envelope DAD Curve (1-day) for Catchment-321

Estimation of PMP by Physical Approach
PMP Atlas for Mahanadi and Adjoining River Basins Page 148 of 260
(Zero value on x-axis represents area of storm upto 25 sq. km.)
Figure 3-29: Envelope DAD Curve (2-day) for Catchment-321
(Zero value on x-axis represents area of storm upto 25 sq. km.)
Figure 3-30: Envelope DAD Curve (3-day) for Catchment-321
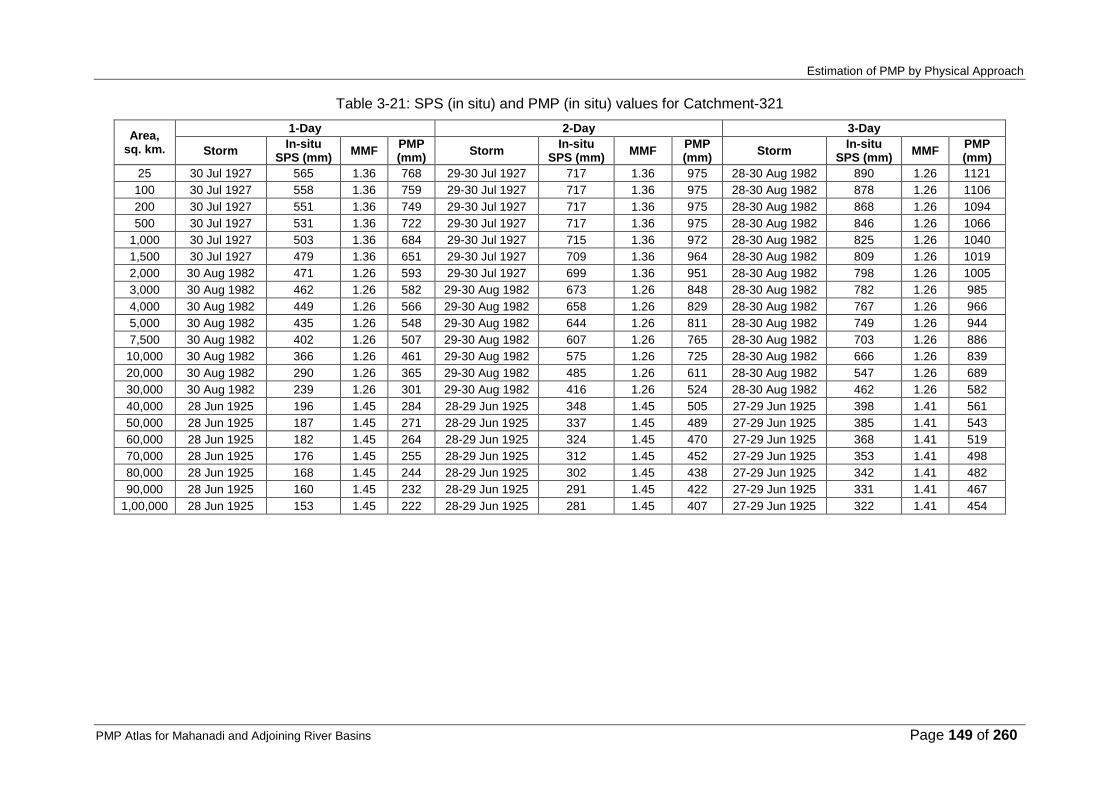
Estimation of PMP by Physical Approach
PMP Atlas for Mahanadi and Adjoining River Basins Page 149 of 260
Table 3-21: SPS (in situ) and PMP (in situ) values for Catchment-321
Area, sq. km.
1-Day 2-Day 3-Day
Storm In-situ
SPS (mm) MMF
PMP (mm)
Storm In-situ
SPS (mm) MMF
PMP (mm)
Storm In-situ
SPS (mm) MMF
PMP (mm)
25 30 Jul 1927 565 1.36 768 29-30 Jul 1927 717 1.36 975 28-30 Aug 1982 890 1.26 1121
100 30 Jul 1927 558 1.36 759 29-30 Jul 1927 717 1.36 975 28-30 Aug 1982 878 1.26 1106
200 30 Jul 1927 551 1.36 749 29-30 Jul 1927 717 1.36 975 28-30 Aug 1982 868 1.26 1094
500 30 Jul 1927 531 1.36 722 29-30 Jul 1927 717 1.36 975 28-30 Aug 1982 846 1.26 1066
1,000 30 Jul 1927 503 1.36 684 29-30 Jul 1927 715 1.36 972 28-30 Aug 1982 825 1.26 1040
1,500 30 Jul 1927 479 1.36 651 29-30 Jul 1927 709 1.36 964 28-30 Aug 1982 809 1.26 1019
2,000 30 Aug 1982 471 1.26 593 29-30 Jul 1927 699 1.36 951 28-30 Aug 1982 798 1.26 1005
3,000 30 Aug 1982 462 1.26 582 29-30 Aug 1982 673 1.26 848 28-30 Aug 1982 782 1.26 985
4,000 30 Aug 1982 449 1.26 566 29-30 Aug 1982 658 1.26 829 28-30 Aug 1982 767 1.26 966
5,000 30 Aug 1982 435 1.26 548 29-30 Aug 1982 644 1.26 811 28-30 Aug 1982 749 1.26 944
7,500 30 Aug 1982 402 1.26 507 29-30 Aug 1982 607 1.26 765 28-30 Aug 1982 703 1.26 886
10,000 30 Aug 1982 366 1.26 461 29-30 Aug 1982 575 1.26 725 28-30 Aug 1982 666 1.26 839
20,000 30 Aug 1982 290 1.26 365 29-30 Aug 1982 485 1.26 611 28-30 Aug 1982 547 1.26 689
30,000 30 Aug 1982 239 1.26 301 29-30 Aug 1982 416 1.26 524 28-30 Aug 1982 462 1.26 582
40,000 28 Jun 1925 196 1.45 284 28-29 Jun 1925 348 1.45 505 27-29 Jun 1925 398 1.41 561
50,000 28 Jun 1925 187 1.45 271 28-29 Jun 1925 337 1.45 489 27-29 Jun 1925 385 1.41 543
60,000 28 Jun 1925 182 1.45 264 28-29 Jun 1925 324 1.45 470 27-29 Jun 1925 368 1.41 519
70,000 28 Jun 1925 176 1.45 255 28-29 Jun 1925 312 1.45 452 27-29 Jun 1925 353 1.41 498
80,000 28 Jun 1925 168 1.45 244 28-29 Jun 1925 302 1.45 438 27-29 Jun 1925 342 1.41 482
90,000 28 Jun 1925 160 1.45 232 28-29 Jun 1925 291 1.45 422 27-29 Jun 1925 331 1.41 467
1,00,000 28 Jun 1925 153 1.45 222 28-29 Jun 1925 281 1.45 407 27-29 Jun 1925 322 1.41 454

Estimation of PMP by Physical Approach
PMP Atlas for Mahanadi and Adjoining River Basins Page 150 of 260
3.3.7 CATCHMENT NO. 322
Considering the orography and location of the catchment, rainstorms that can affect this catchment have been analyzed using the DAD method. Out of storms listed in Table 3-2, storms for 1-day, 2-day and 3-day durations that are transposable (linear transposition within the limit of ± 2 degree in flat region and ± 0.5 degree in orographic and coastal region) to the catchment have been listed in Table 3-8 to Table 3-10 respectively. Table 3-22 shows a list of rainstorms, which affected the Catchment-322.
Table 3-22: Rainstorms affecting Catchment-322
Sr. No.
Date Storm Duration Peak (mm) Storm Centre Lat
(Deg) Long (Deg)
1 28 Jul 1905 1-Day 299 Burdwan 23.23 87.85
2 30 Aug 1909 1-Day 344 Vishnupur 23.08 87.32
3 27 Jun 1925 1-Day 402 Kendrapara 20.50 86.42
4 30 Jul 1927 1-Day 565 Champua 22.08 85.67
5 21 Aug 1931 1-Day 257 Angul 20.83 85.10
6 04 Aug 1933 1-Day 321 Cuttak 20.46 85.88
7 01 Jul 1940 1-Day 347 Balasore 21.49 86.93
8 08 Jul 1940 1-Day 244 Bhograi 21.67 87.37
9 10 Jul 1941 1-Day 322 Chandbali 20.78 86.75
10 08 Oct 1941 1-Day 323 Balasore 21.49 86.93
11 10 Jul 1942 1-Day 339 Gopiballabhpur 22.21 86.89
12 01 Aug 1943 1-Day 479 Soro 21.28 86.70
13 15 Aug 1960 1-Day 296 Kusumi 21.75 84.52
14 09 Jul 1964 1-Day 480 Tamluk 22.30 87.92
15 18 Jul 1975 1-Day 403 Dumri 23.98 86.02
16 27 Sep 1978 1-Day 400 Shamsundar royna 23.88 87.53
17 04 Jun 1982 1-Day 387 Kendrapara 20.50 86.42
18 16 Aug 1984 1-Day 325 Kendrapara 20.50 86.42
19 16 Oct 1985 1-Day 350 Sukinda 20.97 85.92
20 03 Aug 1988 1-Day 321 Telkoi 21.33 85.33
21 21 Jul 1991 1-Day 300 Binjharpur 20.73 86.40
22 28 Jun 1994 1-Day 264 Jamsolaghat 22.22 86.72
23 29 Jun 1994 1-Day 300 Angara 23.33 85.50
24 20 Jul 1994 1-Day 305 Pamposh 22.17 84.83
25 29 Aug 1994 1-Day 270 Bari 20.67 86.33
26 16 May 1995 1-Day 300 Pattamundai 20.58 86.57
27 27 Sep 1995 1-Day 608 Bliapur 23.67 86.50
28 22 Jun 1996 1-Day 280 Bamra 21.50 84.67
29 28 Jun 1997 1-Day 325 Tiring 21.52 86.07
30 30 Oct 1999 1-Day 397 Anandpur 21.22 86.12
31 17 Jul 2001 1-Day 369 Kuchinda 21.75 84.35
32 28 Jun 2005 1-Day 377 Thakurmunda 21.52 86.15
33 29 Jun 2005 1-Day 397 Tensa 21.87 85.15
34 06 Jul 2007 1-Day 310 Bahalda 22.40 86.08
35 13 Aug 2007 1-Day 375 Bijatala 22.17 86.25
36 23 Sep 2007 1-Day 268 Athgarh 20.50 85.58
37 18 Jun 2008 1-Day 424 Bahalda 22.40 86.08
38 28-29 Jul 1905 2-Day 412 Burdwan 23.23 87.85
39 29-30 Aug 1909 2-Day 520 Vishnupur 23.08 87.32
40 29-30 Jul 1927 2-Day 717 Karanjia 21.77 85.98
41 15-16 Aug 1960 2-Day 339 Kusumi 21.75 84.52
42 09-10 Jul 1964 2-Day 831 Tamluk 22.30 87.92
43 18-19 Jul 1975 2-Day 682 Dumri 23.98 86.02
44 27-28 Sep 1978 2-Day 610 Pangarh aero 23.47 87.43
45 03-04 Jun 1982 2-Day 404 Kendrapara 20.50 86.42
46 16-17 Aug 1984 2-Day 348 Kendrapara 20.50 86.42
47 15-16 Oct 1985 2-Day 378 Akhuapada 20.92 86.28
48 03-04 Aug 1988 2-Day 337 Telkoi 21.33 85.33
49 20-21 Jul 1991 2-Day 520 Binjharpur 20.73 86.40
50 27-28 Jun 1994 2-Day 302 Jamsolaghat 22.22 86.72
51 28-29 Aug 1994 2-Day 380 Bari 20.67 86.33
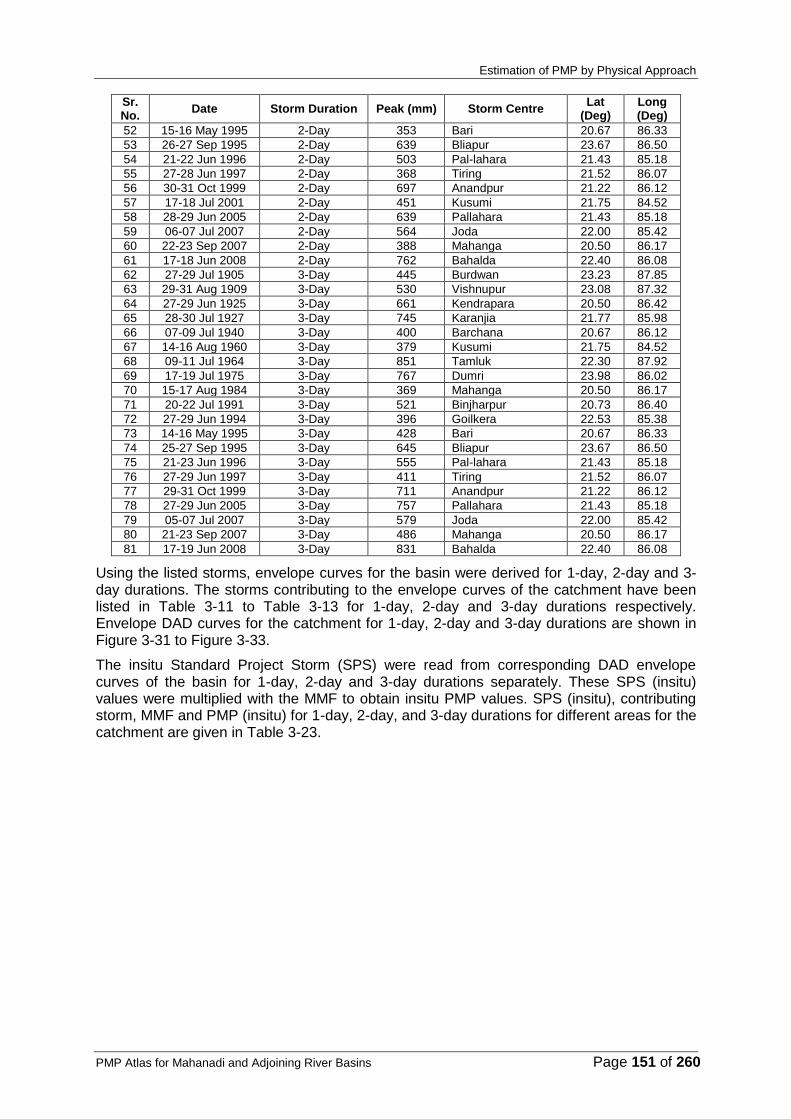
Estimation of PMP by Physical Approach
PMP Atlas for Mahanadi and Adjoining River Basins Page 151 of 260
Sr. No.
Date Storm Duration Peak (mm) Storm Centre Lat
(Deg) Long (Deg)
52 15-16 May 1995 2-Day 353 Bari 20.67 86.33
53 26-27 Sep 1995 2-Day 639 Bliapur 23.67 86.50
54 21-22 Jun 1996 2-Day 503 Pal-lahara 21.43 85.18
55 27-28 Jun 1997 2-Day 368 Tiring 21.52 86.07
56 30-31 Oct 1999 2-Day 697 Anandpur 21.22 86.12
57 17-18 Jul 2001 2-Day 451 Kusumi 21.75 84.52
58 28-29 Jun 2005 2-Day 639 Pallahara 21.43 85.18
59 06-07 Jul 2007 2-Day 564 Joda 22.00 85.42
60 22-23 Sep 2007 2-Day 388 Mahanga 20.50 86.17
61 17-18 Jun 2008 2-Day 762 Bahalda 22.40 86.08
62 27-29 Jul 1905 3-Day 445 Burdwan 23.23 87.85
63 29-31 Aug 1909 3-Day 530 Vishnupur 23.08 87.32
64 27-29 Jun 1925 3-Day 661 Kendrapara 20.50 86.42
65 28-30 Jul 1927 3-Day 745 Karanjia 21.77 85.98
66 07-09 Jul 1940 3-Day 400 Barchana 20.67 86.12
67 14-16 Aug 1960 3-Day 379 Kusumi 21.75 84.52
68 09-11 Jul 1964 3-Day 851 Tamluk 22.30 87.92
69 17-19 Jul 1975 3-Day 767 Dumri 23.98 86.02
70 15-17 Aug 1984 3-Day 369 Mahanga 20.50 86.17
71 20-22 Jul 1991 3-Day 521 Binjharpur 20.73 86.40
72 27-29 Jun 1994 3-Day 396 Goilkera 22.53 85.38
73 14-16 May 1995 3-Day 428 Bari 20.67 86.33
74 25-27 Sep 1995 3-Day 645 Bliapur 23.67 86.50
75 21-23 Jun 1996 3-Day 555 Pal-lahara 21.43 85.18
76 27-29 Jun 1997 3-Day 411 Tiring 21.52 86.07
77 29-31 Oct 1999 3-Day 711 Anandpur 21.22 86.12
78 27-29 Jun 2005 3-Day 757 Pallahara 21.43 85.18
79 05-07 Jul 2007 3-Day 579 Joda 22.00 85.42
80 21-23 Sep 2007 3-Day 486 Mahanga 20.50 86.17
81 17-19 Jun 2008 3-Day 831 Bahalda 22.40 86.08
Using the listed storms, envelope curves for the basin were derived for 1-day, 2-day and 3-day durations. The storms contributing to the envelope curves of the catchment have been listed in Table 3-11 to Table 3-13 for 1-day, 2-day and 3-day durations respectively. Envelope DAD curves for the catchment for 1-day, 2-day and 3-day durations are shown in Figure 3-31 to Figure 3-33.
The insitu Standard Project Storm (SPS) were read from corresponding DAD envelope curves of the basin for 1-day, 2-day and 3-day durations separately. These SPS (insitu) values were multiplied with the MMF to obtain insitu PMP values. SPS (insitu), contributing storm, MMF and PMP (insitu) for 1-day, 2-day, and 3-day durations for different areas for the catchment are given in Table 3-23.

Estimation of PMP by Physical Approach
PMP Atlas for Mahanadi and Adjoining River Basins Page 152 of 260
(Zero value on x-axis represents area of storm upto 25 sq. km.)
Figure 3-31: Envelope DAD Curve (1-day) for Catchment-322
(Zero value on x-axis represents area of storm upto 25 sq. km.)
Figure 3-32: Envelope DAD Curve (2-day) for Catchment-322

Estimation of PMP by Physical Approach
PMP Atlas for Mahanadi and Adjoining River Basins Page 153 of 260
(Zero value on x-axis represents area of storm upto 25 sq. km.)
Figure 3-33: Envelope DAD Curve (3-day) for Catchment-322

Estimation of PMP by Physical Approach
PMP Atlas for Mahanadi and Adjoining River Basins Page 154 of 260
Table 3-23: SPS (in situ) and PMP (in situ) values for Catchment-322
Area, sq. km.
1-Day 2-Day 3-Day
Storm In-situ
SPS (mm) MMF
PMP (mm)
Storm In-situ
SPS (mm) MMF
PMP (mm)
Storm In-situ
SPS (mm) MMF
PMP (mm)
25 30 Jul 1927 565 1.36 768 29-30 Jul 1927 717 1.36 975 28-30 Jul 1927 745 1.36 1013
100 30 Jul 1927 558 1.36 759 29-30 Jul 1927 717 1.36 975 28-30 Jul 1927 744 1.36 1012
200 30 Jul 1927 551 1.36 749 29-30 Jul 1927 717 1.36 975 28-30 Jul 1927 744 1.36 1012
500 30 Jul 1927 531 1.36 722 29-30 Jul 1927 717 1.36 975 28-30 Jul 1927 741 1.36 1008
1,000 30 Jul 1927 503 1.36 684 29-30 Jul 1927 715 1.36 972 28-30 Jul 1927 735 1.36 1000
1,500 30 Jul 1927 479 1.36 651 29-30 Jul 1927 709 1.36 964 28-30 Jul 1927 728 1.36 990
2,000 30 Jul 1927 457 1.36 622 29-30 Jul 1927 699 1.36 951 28-30 Jul 1927 719 1.36 978
3,000 30 Jul 1927 427 1.36 581 29-30 Jul 1927 669 1.36 910 28-30 Jul 1927 696 1.36 947
4,000 30 Jul 1927 410 1.36 558 29-30 Jul 1927 639 1.36 869 28-30 Jul 1927 671 1.36 913
5,000 30 Jul 1927 398 1.36 541 29-30 Jul 1927 615 1.36 836 28-30 Jul 1927 645 1.36 877
7,500 30 Jul 1927 364 1.36 495 29-30 Jul 1927 562 1.36 764 29-31 Oct 1999 603 1.35 814
10,000 30 Jul 1927 339 1.36 461 29-30 Jul 1927 524 1.36 713 29-31 Oct 1999 579 1.35 782
20,000 30 Jul 1927 271 1.36 369 29-30 Jul 1927 431 1.36 586 29-31 Oct 1999 486 1.35 656
30,000 30 Jul 1927 232 1.36 316 29-30 Jul 1927 365 1.36 496 27-29 Jun 1925 415 1.41 585
40,000 30 Jul 1927 210 1.36 286 29-30 Jul 1927 320 1.36 435 27-29 Jun 1925 398 1.41 561
50,000 30 Jul 1927 189 1.36 257 29-30 Jul 1927 288 1.36 392 27-29 Jun 1925 385 1.41 543
60,000 30 Jul 1927 172 1.36 234 29-30 Jul 1927 265 1.36 360 27-29 Jun 1925 368 1.41 519
70,000 30 Jul 1927 158 1.36 215 29-30 Jul 1927 247 1.36 336 27-29 Jun 1925 353 1.41 498
80,000 30 Jul 1927 146 1.36 199 29-30 Jul 1927 230 1.36 313 27-29 Jun 1925 342 1.41 482
90,000 30 Jul 1927 135 1.36 184 29-30 Jul 1927 215 1.36 292 27-29 Jun 1925 331 1.41 467
1,00,000 30 Jul 1927 124 1.36 169 29-30 Jul 1927 202 1.36 275 27-29 Jun 1925 322 1.41 454

Estimation of PMP by Physical Approach
PMP Atlas for Mahanadi and Adjoining River Basins Page 155 of 260
3.3.8 HIGHEST TRANSPOSED 1-DAY, 2-DAY, AND 3-DAY RAINDEPTH FOR VARIOUS
CATCHMENTS
Severe rainstorms contributing to the DAD envelope curves for five catchments of the Mahanadi and Adjoining River Basins have been physically transposed to estimate the highest raindepths over the respective catchments. The estimated transposed raindepths are given in Table 3-24.
Table 3-24: Highest transposed raindepth for different catchments of Mahanadi and Adjoining River Basins
Catchment No.
Area (sq. km.)
1-Day 2-Day 3-Day
Storm Date Highest
Raindepth, mm Storm Date
Highest Raindepth, mm
Storm Date Highest
Raindepth, mm
318 54,769 23-Jul-1989 141 23-24 Jul 1989 199 22-24 Jul 1989 208
319 84,277 28-Jul-1992 134 27-28 Jul 1992 157 27-29 Jul 1992 173
320 55,549 30-Aug-1982 141 29-30 Aug 1982 264 28-30 Aug 1982 271
321 49,448 30-Jul-1927 151 29-30 Jul 1927 222 28-30 Jul 1927 243
322 29,459 30-Jul-1927 196 29-30 Jul 1927 291 28-30 Jul 1927 317
3.4 Computation of PMP at Grid Points
Areal PMP values are estimated for 1-day, 2-day and 3-day durations for standard areas of 100; 200; 500; 1,000; 1,500; 2,000; 3,000; 4,000; 5,000; 7,500; 10,000; and 20,000 sq. km. centered at fixed locations (i.e. the point of intersection in a 1° latitude X 1° longitude grid network termed as grid points) for the 5 catchments of the Mahanadi and Adjoining River Basins. A systematic approach to achieve the desired areal PMP estimates involved the following steps:
3.4.1 GRID POINT LOCATIONS
Grid points were constructed for areal PMP estimation at fixed locations. The grid point locations in each of the five catchments were assigned alphanumeric codes as given in Table 3-25. The alphabetic part of code MND stands for Mahanadi and Adjoining River Basins, 318 for catchment number 318 and 01 stands for Grid Point Number 01 in respective catchment. The Location map of grid points for the Mahanadi and Adjoining River Basins is shown in Figure 3-34.
Table 3-25: Grid point locations and the assigned codes
Catchment No. GridID Latitude (Deg) Longitude(Deg)
318
MND318-01 18 83
MND318-02 19 84
MND318-03 20 86
319
MND319-01 20 82
MND319-02 21 81
MND319-03 21 82
MND319-04 22 82
MND319-05 22 83
MND319-06 22 84
320
MND320-01 20 83
MND320-02 20 84
MND320-03 20 85
MND320-04 21 83
MND320-05 21 84
321
MND321-01 21 85
MND321-02 21 86
MND321-03 22 85
MND321-04 22 86
MND321-05 23 84
322
MND321-06 23 85
MND322-01 23 86
MND322-02 22 87

Estimation of PMP by Physical Approach
PMP Atlas for Mahanadi and Adjoining River Basins Page 156 of 260
Catchment No. GridID Latitude (Deg) Longitude(Deg)
MND322-03 21 87
Figure 3-34: Grid point locations, in and around, Mahanadi and Adjoining River Basins
3.4.2 IDENTIFICATIONS OF RAINSTORMS
Out of the storms listed in Table 3-2, a grid point wise matrix was prepared for identification of affecting rainstorms for 1-day, 2-day and 3-day durations at each location. The storms that are falling within the limit of ± 2-degree in plain areas and + 0.5 degree in the coastal areas have been marked as affecting storms at each location. Table 3-26 gives the matrix of grid wise affecting storms for 1-day duration (The rows indicate the storm details, columns indicate the grid ID and highlighted color shows the storm affecting particular grids). Similarly, the matrixes for 2-day and 3-day storms are shown in Table 3-27 and Table 3-28 respectively.

Estimation of PMP by Physical Approach
PMP Atlas for Mahanadi and Adjoining River Basins Page 157 of 260
Table 3-26: Matrix showing affecting 1-day rainstorms at various grid points
Sr. No.
Storm Centre Grid ID
Event Date
MN
D3
18
-01
MN
D3
18
-02
MN
D3
18
-03
MN
D3
19
-01
MN
D3
19
-02
MN
D3
19
-03
MN
D3
19
-04
MN
D3
19
-05
MN
D3
19
-06
MN
D3
20
-01
MN
D3
20
-02
MN
D3
20
-03
MN
D3
20
-04
MN
D3
20
-05
MN
D3
21
-01
MN
D3
21
-02
MN
D3
21
-03
MN
D3
21
-04
MN
D3
21
-05
MN
D3
21
-06
MN
D3
22
-01
MN
D3
22
-02
MN
D3
22
-03
1 Burdwan 28 Jul 1905
2 Sakoli 26 Jun 1908
3 Gadchiroli 02 Aug 1908
4 Ramachandrapuram 27 Sep 1908
5 Vishnupur 30 Aug 1909
6 Kurud 04 Aug 1910
7 Armori 03 Aug 1912
8 Koraput 25 Jun 1914
9 Jagatsingpur 03 Aug 1915
10 Hunterganj 01 Aug 1917
11 Sonepur 16 Jun 1918
12 Gondia 18 Jun 1918
13 Itchapuram 19 Nov 1923
14 Kendrapara 27 Jun 1925
15 Balandapara 28 Jun 1925
16 Jharsuguda 29 Jun 1925
17 Phulbani 17 Aug 1926
18 Bichhia 21 Sep 1926
19 Champua 30 Jul 1927
20 Sarangarh 24 Aug 1929
21 Jeypore 15 Aug 1931
22 Angul 21 Aug 1931
23 Pottangi 14 Oct 1931
24 Cuttak 04 Aug 1933
25 Polavaram 19 Oct 1933
26 Mahuadaur 22 Aug 1934
27 Balandapara 14 Jun 1936
28 Balandapara 15 Jun 1936
29 Sarangarh 28 Jun 1937
30 Jagatsingpur 24 Jul 1937
31 Pangree 25 Jul 1937
32 Krishnanagar 17 Aug 1939
33 Ambagarh chowki 19 Aug 1939
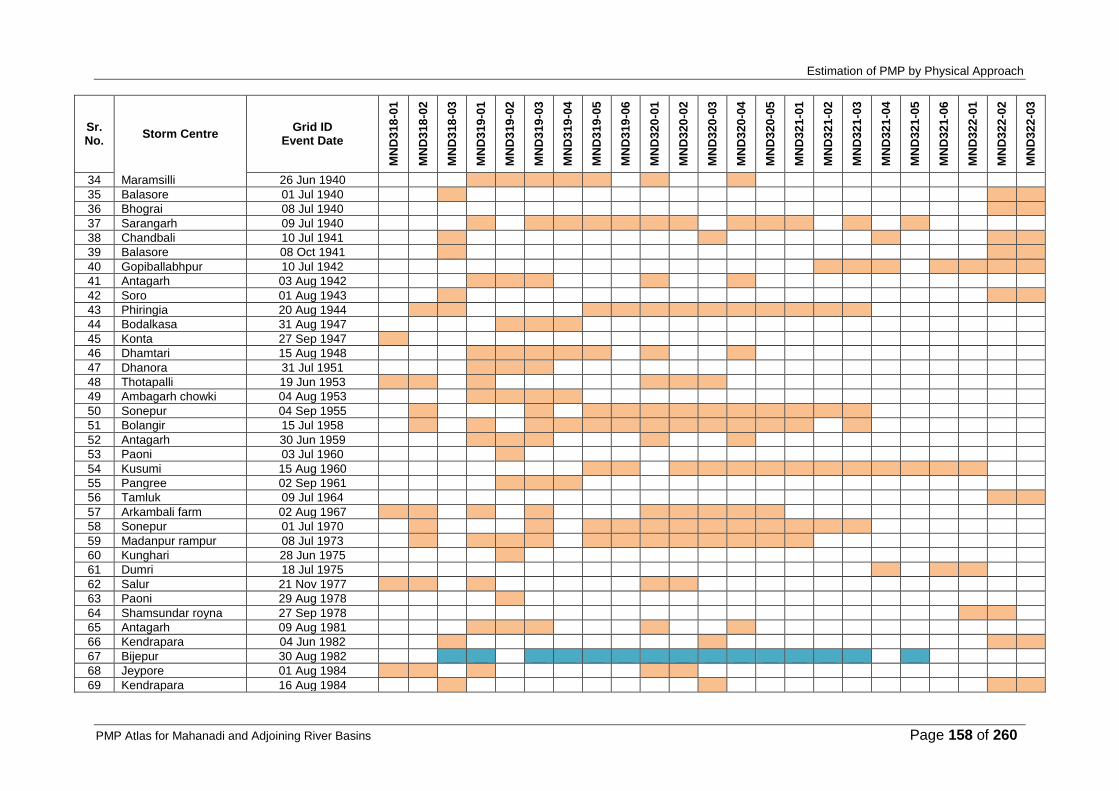
Estimation of PMP by Physical Approach
PMP Atlas for Mahanadi and Adjoining River Basins Page 158 of 260
Sr. No.
Storm Centre Grid ID
Event Date
MN
D3
18
-01
MN
D3
18
-02
MN
D3
18
-03
MN
D3
19
-01
MN
D3
19
-02
MN
D3
19
-03
MN
D3
19
-04
MN
D3
19
-05
MN
D3
19
-06
MN
D3
20
-01
MN
D3
20
-02
MN
D3
20
-03
MN
D3
20
-04
MN
D3
20
-05
MN
D3
21
-01
MN
D3
21
-02
MN
D3
21
-03
MN
D3
21
-04
MN
D3
21
-05
MN
D3
21
-06
MN
D3
22
-01
MN
D3
22
-02
MN
D3
22
-03
34 Maramsilli 26 Jun 1940
35 Balasore 01 Jul 1940
36 Bhograi 08 Jul 1940
37 Sarangarh 09 Jul 1940
38 Chandbali 10 Jul 1941
39 Balasore 08 Oct 1941
40 Gopiballabhpur 10 Jul 1942
41 Antagarh 03 Aug 1942
42 Soro 01 Aug 1943
43 Phiringia 20 Aug 1944
44 Bodalkasa 31 Aug 1947
45 Konta 27 Sep 1947
46 Dhamtari 15 Aug 1948
47 Dhanora 31 Jul 1951
48 Thotapalli 19 Jun 1953
49 Ambagarh chowki 04 Aug 1953
50 Sonepur 04 Sep 1955
51 Bolangir 15 Jul 1958
52 Antagarh 30 Jun 1959
53 Paoni 03 Jul 1960
54 Kusumi 15 Aug 1960
55 Pangree 02 Sep 1961
56 Tamluk 09 Jul 1964
57 Arkambali farm 02 Aug 1967
58 Sonepur 01 Jul 1970
59 Madanpur rampur 08 Jul 1973
60 Kunghari 28 Jun 1975
61 Dumri 18 Jul 1975
62 Salur 21 Nov 1977
63 Paoni 29 Aug 1978
64 Shamsundar royna 27 Sep 1978
65 Antagarh 09 Aug 1981
66 Kendrapara 04 Jun 1982
67 Bijepur 30 Aug 1982
68 Jeypore 01 Aug 1984
69 Kendrapara 16 Aug 1984
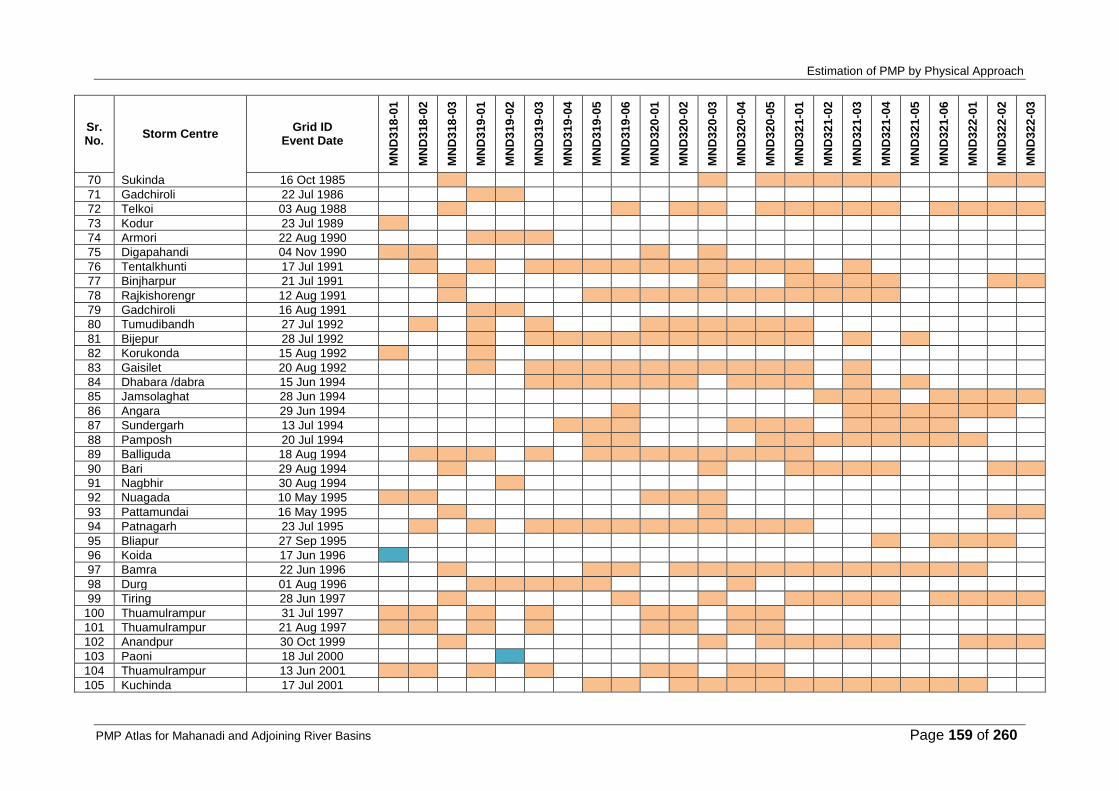
Estimation of PMP by Physical Approach
PMP Atlas for Mahanadi and Adjoining River Basins Page 159 of 260
Sr. No.
Storm Centre Grid ID
Event Date
MN
D3
18
-01
MN
D3
18
-02
MN
D3
18
-03
MN
D3
19
-01
MN
D3
19
-02
MN
D3
19
-03
MN
D3
19
-04
MN
D3
19
-05
MN
D3
19
-06
MN
D3
20
-01
MN
D3
20
-02
MN
D3
20
-03
MN
D3
20
-04
MN
D3
20
-05
MN
D3
21
-01
MN
D3
21
-02
MN
D3
21
-03
MN
D3
21
-04
MN
D3
21
-05
MN
D3
21
-06
MN
D3
22
-01
MN
D3
22
-02
MN
D3
22
-03
70 Sukinda 16 Oct 1985
71 Gadchiroli 22 Jul 1986
72 Telkoi 03 Aug 1988
73 Kodur 23 Jul 1989
74 Armori 22 Aug 1990
75 Digapahandi 04 Nov 1990
76 Tentalkhunti 17 Jul 1991
77 Binjharpur 21 Jul 1991
78 Rajkishorengr 12 Aug 1991
79 Gadchiroli 16 Aug 1991
80 Tumudibandh 27 Jul 1992
81 Bijepur 28 Jul 1992
82 Korukonda 15 Aug 1992
83 Gaisilet 20 Aug 1992
84 Dhabara /dabra 15 Jun 1994
85 Jamsolaghat 28 Jun 1994
86 Angara 29 Jun 1994
87 Sundergarh 13 Jul 1994
88 Pamposh 20 Jul 1994
89 Balliguda 18 Aug 1994
90 Bari 29 Aug 1994
91 Nagbhir 30 Aug 1994
92 Nuagada 10 May 1995
93 Pattamundai 16 May 1995
94 Patnagarh 23 Jul 1995
95 Bliapur 27 Sep 1995
96 Koida 17 Jun 1996
97 Bamra 22 Jun 1996
98 Durg 01 Aug 1996
99 Tiring 28 Jun 1997
100 Thuamulrampur 31 Jul 1997
101 Thuamulrampur 21 Aug 1997
102 Anandpur 30 Oct 1999
103 Paoni 18 Jul 2000
104 Thuamulrampur 13 Jun 2001
105 Kuchinda 17 Jul 2001

Estimation of PMP by Physical Approach
PMP Atlas for Mahanadi and Adjoining River Basins Page 160 of 260
Sr. No.
Storm Centre Grid ID
Event Date
MN
D3
18
-01
MN
D3
18
-02
MN
D3
18
-03
MN
D3
19
-01
MN
D3
19
-02
MN
D3
19
-03
MN
D3
19
-04
MN
D3
19
-05
MN
D3
19
-06
MN
D3
20
-01
MN
D3
20
-02
MN
D3
20
-03
MN
D3
20
-04
MN
D3
20
-05
MN
D3
21
-01
MN
D3
21
-02
MN
D3
21
-03
MN
D3
21
-04
MN
D3
21
-05
MN
D3
21
-06
MN
D3
22
-01
MN
D3
22
-02
MN
D3
22
-03
106 Sundergarh 20 Jun 2003
107 Thuamulrampur 27 Aug 2003
108 Thuamulrampur 13 Jun 2004
109 Thakurmunda 28 Jun 2005
110 Tensa 29 Jun 2005
111 R.pur/rairakhol 30 Jul 2005
112 Thuamulrampur 13 Sep 2005
113 Kunavaram 20 Sep 2005
114 Thuamulrampur 03 Aug 2006
115 Nandapur 04 Aug 2006
116 Bahalda 06 Jul 2007
117 Kantapara 05 Aug 2007
118 Thuamulrampur 07 Aug 2007
119 Bijatala 13 Aug 2007
120 Athgarh 23 Sep 2007
121 Bahalda 18 Jun 2008
122 Jujomura 18 Sep 2008
Total 1-day storms at each grid point 25
32
31
47
28
48
24
36
40
49
51
48
49
50
50
34
48
34
20
22
23
32
30
Storm is affecting the grid point storm is contributing in the envelope curve for the grid point
Table 3-27: Matrix showing affecting 2-day rainstorms at various grid points
Sr. No.
Storm Centre Grid ID
Event Date
MN
D3
18
-01
MN
D3
18
-02
MN
D3
18
-03
MN
D3
19
-01
MN
D3
19
-02
MN
D3
19
-03
MN
D3
19
-04
MN
D3
19
-05
MN
D3
19
-06
MN
D3
20
-01
MN
D3
20
-02
MN
D3
20
-03
MN
D3
20
-04
MN
D3
20
-05
MN
D3
21
-01
MN
D3
21
-02
MN
D3
21
-03
MN
D3
21
-04
MN
D3
21
-05
MN
D3
21
-06
MN
D3
22
-01
MN
D3
22
-02
MN
D3
22
-03
1 Burdwan 28-29 Jul 1905
2 Ramachandrapuram 26-27 Sep 1908
3 Vishnupur 29-30 Aug 1909
4 Raipur 03-04 Aug 1910
5 Armori 03-04 Aug 1912
6 Koraput 24-25 Jun 1914

Estimation of PMP by Physical Approach
PMP Atlas for Mahanadi and Adjoining River Basins Page 161 of 260
Sr. No.
Storm Centre Grid ID
Event Date
MN
D3
18
-01
MN
D3
18
-02
MN
D3
18
-03
MN
D3
19
-01
MN
D3
19
-02
MN
D3
19
-03
MN
D3
19
-04
MN
D3
19
-05
MN
D3
19
-06
MN
D3
20
-01
MN
D3
20
-02
MN
D3
20
-03
MN
D3
20
-04
MN
D3
20
-05
MN
D3
21
-01
MN
D3
21
-02
MN
D3
21
-03
MN
D3
21
-04
MN
D3
21
-05
MN
D3
21
-06
MN
D3
22
-01
MN
D3
22
-02
MN
D3
22
-03
7 Hunterganj 31 Jul-01 Aug 1917
8 Sonepur 15-16 Jun 1918
9 Gondia 17-18 Jun 1918
10 Itchapuram 18-19 Nov 1923
11 Phulbani 28-29 Jun 1925
12 Phulbani 16-17 Aug 1926
13 Bichhia 20-21 Sep 1926
14 Karanjia 29-30 Jul 1927
15 Nawarangpur 15-16 Aug 1931
16 Pottangi 13-14 Oct 1931
17 Balandapara 03-04 Aug 1933
18 Ambikapur 22-23 Aug 1934
19 Balandapara 13-14 Jun 1936
20 Balandapara 14-15 Jun 1936
21 Sarangarh 27-28 Jun 1937
22 Kondapar 18-19 Aug 1939
23 Balandapara 25-26 Jun 1940
24 Athmalik 08-09 Jul 1940
25 Antagarh 02-03 Aug 1942
26 Dhamtari 15-16 Aug 1948
27 Narasannapeta 18-19 Jun 1953
28 Hirakud 03-04 Sep 1955
29 Antagarh 29-30 Jun 1959
30 Kusumi 15-16 Aug 1960
31 Tamluk 09-10 Jul 1964
32 Rudri 01-02 Aug 1967
33 Madanpur rampur 07-08 Jul 1973
34 Sindewahi 27-28 Jun 1975
35 Dumri 18-19 Jul 1975
36 Narsipatnam 20-21 Nov 1977
37 Pangarh aero 27-28 Sep 1978
38 Kendrapara 03-04 Jun 1982
39 Phulbani 29-30 Aug 1982
40 Kendrapara 16-17 Aug 1984
41 Akhuapada 15-16 Oct 1985
42 Telkoi 03-04 Aug 1988

Estimation of PMP by Physical Approach
PMP Atlas for Mahanadi and Adjoining River Basins Page 162 of 260
Sr. No.
Storm Centre Grid ID
Event Date
MN
D3
18
-01
MN
D3
18
-02
MN
D3
18
-03
MN
D3
19
-01
MN
D3
19
-02
MN
D3
19
-03
MN
D3
19
-04
MN
D3
19
-05
MN
D3
19
-06
MN
D3
20
-01
MN
D3
20
-02
MN
D3
20
-03
MN
D3
20
-04
MN
D3
20
-05
MN
D3
21
-01
MN
D3
21
-02
MN
D3
21
-03
MN
D3
21
-04
MN
D3
21
-05
MN
D3
21
-06
MN
D3
22
-01
MN
D3
22
-02
MN
D3
22
-03
43 Tiruvur 23-24 Jul 1989
44 Digapahandi 03-04 Nov 1990
45 Thuamulrampur 16-17 Jul 1991
46 Binjharpur 20-21 Jul 1991
47 Phiringia 12-13 Aug 1991
48 Bijepur 27-28 Jul 1992
49 Gaisilet 19-20 Aug 1992
50 Dhabara /dabra 15-16 Jun 1994
51 Jamsolaghat 27-28 Jun 1994
52 Paoni 11-12 Jul 1994
53 Balliguda 17-18 Aug 1994
54 Bari 28-29 Aug 1994
55 Nuagada 10-11 May 1995
56 Bari 15-16 May 1995
57 Patnagarh 23-24 Jul 1995
58 Bliapur 26-27 Sep 1995
59 Koida 16-17 Jun 1996
60 Pal-lahara 21-22 Jun 1996
61 Durg 01-02 Aug 1996
62 Tiring 27-28 Jun 1997
63 Thuamulrampur 30-31 Jul 1997
64 Thuamulrampur 20-21 Aug 1997
65 Anandpur 30-31 Oct 1999
66 Paoni 18-19 Jul 2000
67 Thuamulrampur 13-14 Jun 2001
68 Kusumi 17-18 Jul 2001
69 Bhandara 24-25 Jun 2002
70 Sundergarh 20-21 Jun 2003
71 Thuamulrampur 26-27 Aug 2003
72 Thuamulrampur 12-13 Jun 2004
73 Kudumulgumma 13-14 Jun 2004
74 Pallahara 28-29 Jun 2005
75 Jujomura 30-31 Jul 2005
76 Thuamulrampur 12-13 Sep 2005
77 Kunavaram 20-21 Sep 2005
78 Thuamulrampur 02-03 Aug 2006
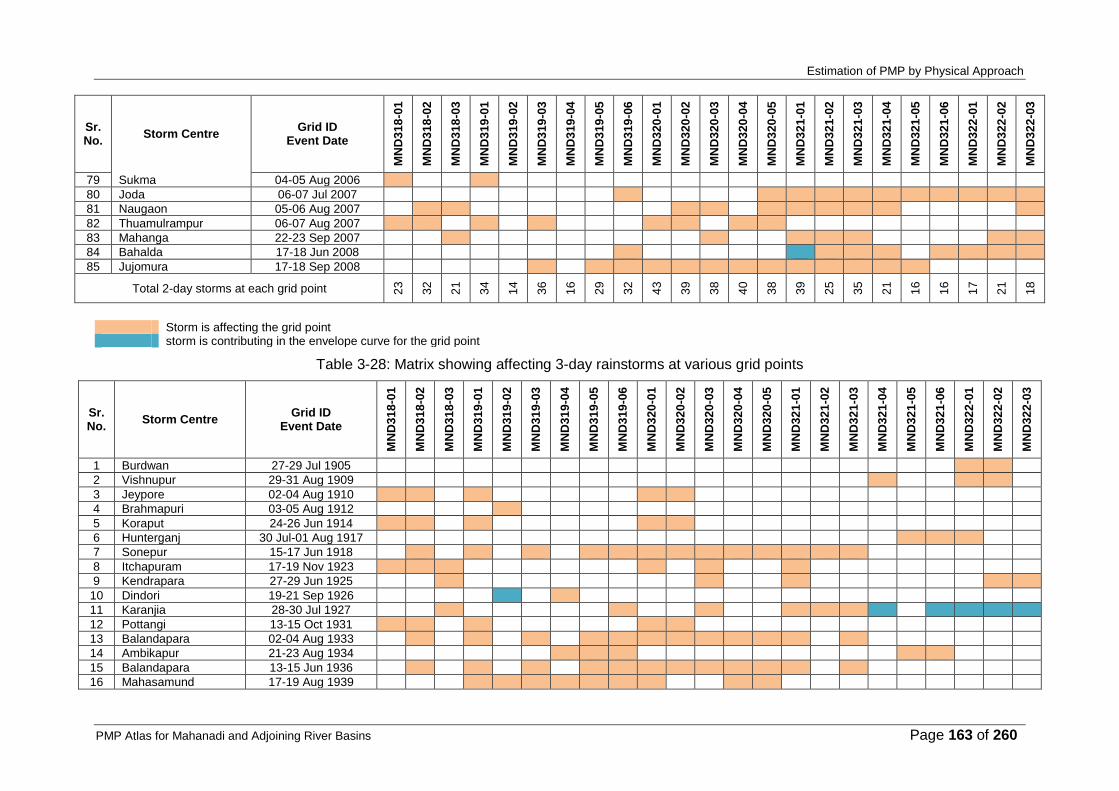
Estimation of PMP by Physical Approach
PMP Atlas for Mahanadi and Adjoining River Basins Page 163 of 260
Sr. No.
Storm Centre Grid ID
Event Date
MN
D3
18
-01
MN
D3
18
-02
MN
D3
18
-03
MN
D3
19
-01
MN
D3
19
-02
MN
D3
19
-03
MN
D3
19
-04
MN
D3
19
-05
MN
D3
19
-06
MN
D3
20
-01
MN
D3
20
-02
MN
D3
20
-03
MN
D3
20
-04
MN
D3
20
-05
MN
D3
21
-01
MN
D3
21
-02
MN
D3
21
-03
MN
D3
21
-04
MN
D3
21
-05
MN
D3
21
-06
MN
D3
22
-01
MN
D3
22
-02
MN
D3
22
-03
79 Sukma 04-05 Aug 2006
80 Joda 06-07 Jul 2007
81 Naugaon 05-06 Aug 2007
82 Thuamulrampur 06-07 Aug 2007
83 Mahanga 22-23 Sep 2007
84 Bahalda 17-18 Jun 2008
85 Jujomura 17-18 Sep 2008
Total 2-day storms at each grid point 23
32
21
34
14
36
16
29
32
43
39
38
40
38
39
25
35
21
16
16
17
21
18
Storm is affecting the grid point storm is contributing in the envelope curve for the grid point
Table 3-28: Matrix showing affecting 3-day rainstorms at various grid points
Sr. No.
Storm Centre Grid ID
Event Date
MN
D3
18
-01
MN
D3
18
-02
MN
D3
18
-03
MN
D3
19
-01
MN
D3
19
-02
MN
D3
19
-03
MN
D3
19
-04
MN
D3
19
-05
MN
D3
19
-06
MN
D3
20
-01
MN
D3
20
-02
MN
D3
20
-03
MN
D3
20
-04
MN
D3
20
-05
MN
D3
21
-01
MN
D3
21
-02
MN
D3
21
-03
MN
D3
21
-04
MN
D3
21
-05
MN
D3
21
-06
MN
D3
22
-01
MN
D3
22
-02
MN
D3
22
-03
1 Burdwan 27-29 Jul 1905
2 Vishnupur 29-31 Aug 1909
3 Jeypore 02-04 Aug 1910
4 Brahmapuri 03-05 Aug 1912
5 Koraput 24-26 Jun 1914
6 Hunterganj 30 Jul-01 Aug 1917
7 Sonepur 15-17 Jun 1918
8 Itchapuram 17-19 Nov 1923
9 Kendrapara 27-29 Jun 1925
10 Dindori 19-21 Sep 1926
11 Karanjia 28-30 Jul 1927
12 Pottangi 13-15 Oct 1931
13 Balandapara 02-04 Aug 1933
14 Ambikapur 21-23 Aug 1934
15 Balandapara 13-15 Jun 1936
16 Mahasamund 17-19 Aug 1939

Estimation of PMP by Physical Approach
PMP Atlas for Mahanadi and Adjoining River Basins Page 164 of 260
Sr. No.
Storm Centre Grid ID
Event Date
MN
D3
18
-01
MN
D3
18
-02
MN
D3
18
-03
MN
D3
19
-01
MN
D3
19
-02
MN
D3
19
-03
MN
D3
19
-04
MN
D3
19
-05
MN
D3
19
-06
MN
D3
20
-01
MN
D3
20
-02
MN
D3
20
-03
MN
D3
20
-04
MN
D3
20
-05
MN
D3
21
-01
MN
D3
21
-02
MN
D3
21
-03
MN
D3
21
-04
MN
D3
21
-05
MN
D3
21
-06
MN
D3
22
-01
MN
D3
22
-02
MN
D3
22
-03
17 Balandapara 24-26 Jun 1940
18 Barchana 07-09 Jul 1940
19 Antagarh 02-04 Aug 1942
20 Dhamtari 14-16 Aug 1948
21 Sompeta 18-20 Jun 1953
22 Dhama 02-04 Sep 1955
23 Kusumi 14-16 Aug 1960
24 Tamluk 09-11 Jul 1964
25 Rudri 01-03 Aug 1967
26 Thuamulrampur 06-08 Jul 1973
27 Kunghari 27-29 Jun 1975
28 Dumri 17-19 Jul 1975
29 Narsipatnam 20-22 Nov 1977
30 Dunguripalli 28-30 Aug 1982
31 Mahanga 15-17 Aug 1984
32 Tiruvur 22-24 Jul 1989
33 Digapahandi 03-05 Nov 1990
34 Thuamulrampur 15-17 Jul 1991
35 Binjharpur 20-22 Jul 1991
36 Phiringia 11-13 Aug 1991
37 Bijepur 27-29 Jul 1992
38 Gaisilet 18-20 Aug 1992
39 Dhabara /dabra 14-16 Jun 1994
40 Goilkera 27-29 Jun 1994
41 Paoni 10-12 Jul 1994
42 Balliguda 17-19 Aug 1994
43 Nuagada 09-11 May 1995
44 Bari 14-16 May 1995
45 Patnagarh 22-24 Jul 1995
46 Bliapur 25-27 Sep 1995
47 Koida 16-18 Jun 1996
48 Pal-lahara 21-23 Jun 1996
49 Durg 31 Jul-02 Aug 1996
50 Tiring 27-29 Jun 1997
51 Thuamulrampur 30 Jul-01 Aug 1997
52 Thuamulrampur 19-21 Aug 1997

Estimation of PMP by Physical Approach
PMP Atlas for Mahanadi and Adjoining River Basins Page 165 of 260
Sr. No.
Storm Centre Grid ID
Event Date
MN
D3
18
-01
MN
D3
18
-02
MN
D3
18
-03
MN
D3
19
-01
MN
D3
19
-02
MN
D3
19
-03
MN
D3
19
-04
MN
D3
19
-05
MN
D3
19
-06
MN
D3
20
-01
MN
D3
20
-02
MN
D3
20
-03
MN
D3
20
-04
MN
D3
20
-05
MN
D3
21
-01
MN
D3
21
-02
MN
D3
21
-03
MN
D3
21
-04
MN
D3
21
-05
MN
D3
21
-06
MN
D3
22
-01
MN
D3
22
-02
MN
D3
22
-03
53 Anandpur 29-31 Oct 1999
54 Paoni 17-19 Jul 2000
55 Thuamulrampur 13-15 Jun 2001
56 Bhandara 23-25 Jun 2002
57 Sundergarh 18-20 Jun 2003
58 Thuamulrampur 26-28 Aug 2003
59 Thuamulrampur 12-14 Jun 2004
60 Pallahara 27-29 Jun 2005
61 Jujomura 29-31 Jul 2005
62 Thuamulrampur 12-14 Sep 2005
63 Thuamulrampur 02-04 Aug 2006
64 Joda 05-07 Jul 2007
65 Naugaon 04-06 Aug 2007
66 Thuamulrampur 05-07 Aug 2007
67 Mahanga 21-23 Sep 2007
68 Bahalda 17-19 Jun 2008
69 Jujomura 16-18 Sep 2008
Total 3-day storms at each grid point 20
27
17
28
11
28
13
21
25
36
33
30
31
33
32
21
28
17
14
13
14
18
15
Storm is affecting the grid point storm is contributing in the envelope curve for the grid point

Estimation of PMP by Physical Approach
PMP Atlas for Mahanadi and Adjoining River Basins Page 166 of 260
3.4.3 ESTIMATION OF MAF
The MAF values are estimated for all storms at grid points as given in the example below. These MAF values were used in the estimation of PMP at grid points. Computation of MAF factors for the major contributing rainstorms are given in Table 8-4 of Volume II.
3.4.3.1 Calculation of MAF for rainstorm of 2830 Aug 1982 at Bijepur for Grid Point MND320-05 (210N, 840E) in Catchment No 320
The MAF is estimated as
As given in detailed example in Section 3.2.4 the MMF for this storm is 1.26
The LAF is computed by
(W3)h1 and (W2)h1 are values of precipitable water (mm) read from Table 8-1 given in Volume II corresponding to d3 and d2 at h1.
h1 = 200 m
Maximum Persisting Dew Point (d2) at rain storm centre in second fortnight of June as read from Figure 1-20 in Volume II.
d2 = 28.4 0C
Maximum Persisting Dew Point (d3) at transposed location in second fortnight of June as read from Figure 1-20 in Volume II.
d3 = 29.1 0C
LAF = (W3)h1 /(W2)h1
= 109.1/ 102.7
= 1.06
The BAF is computed by
(W3)h2 and (W3)h1 are values of precipitable water (mm) read from Table 8-1 given in Volume II corresponding to d3 at h2 and h1 respectively.
h1 = 200m
Since there is no major barrier between storm centre and transposed location,
h2 = 200m
BAF = (W3)h2 / (W3)h1
= 109.1/109.1
= 1.00
As given above the MAF for this storm at MND320-05 is computed as = 1.26 X 1.06 X 1.00
= 1.34
3.4.4 RAINSTORMS CONTRIBUTING TO DAD ENVELOPE CURVES OF GRID POINTS
After preparing the matrixes of 1-day, 2-day and 3-day storms affecting the various grid points, a DAD envelope curve for each grid point was prepared for 1-day, 2-day and 3-day durations separately. While deciding the storms that can contribute to the DAD envelope curve of each grid point, limits of transposition as described in Section 3.1.7 were followed. Grid point wise and area wise contributing storms for 1, 2 and 3-day durations are given in Table 3-29 to Table 3-31.
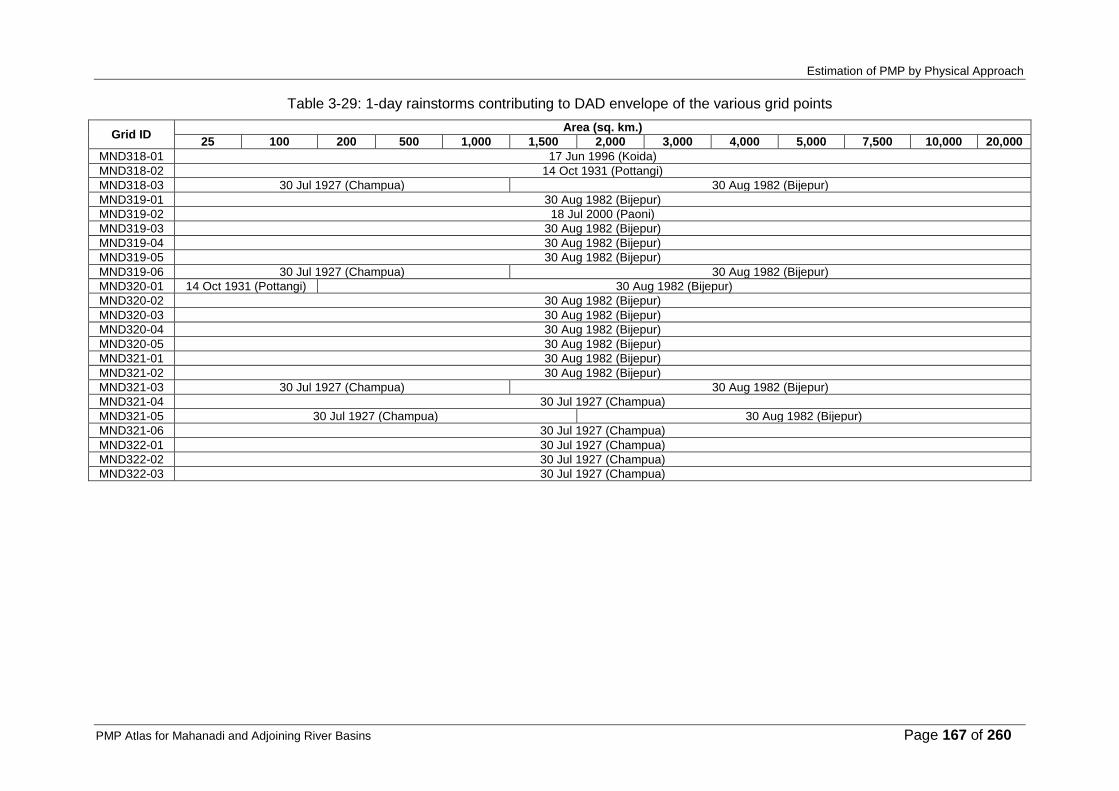
Estimation of PMP by Physical Approach
PMP Atlas for Mahanadi and Adjoining River Basins Page 167 of 260
Table 3-29: 1-day rainstorms contributing to DAD envelope of the various grid points
Grid ID Area (sq. km.)
25 100 200 500 1,000 1,500 2,000 3,000 4,000 5,000 7,500 10,000 20,000
MND318-01 17 Jun 1996 (Koida)
MND318-02 14 Oct 1931 (Pottangi)
MND318-03 30 Jul 1927 (Champua) 30 Aug 1982 (Bijepur)
MND319-01 30 Aug 1982 (Bijepur)
MND319-02 18 Jul 2000 (Paoni)
MND319-03 30 Aug 1982 (Bijepur)
MND319-04 30 Aug 1982 (Bijepur)
MND319-05 30 Aug 1982 (Bijepur)
MND319-06 30 Jul 1927 (Champua) 30 Aug 1982 (Bijepur)
MND320-01 14 Oct 1931 (Pottangi) 30 Aug 1982 (Bijepur)
MND320-02 30 Aug 1982 (Bijepur)
MND320-03 30 Aug 1982 (Bijepur)
MND320-04 30 Aug 1982 (Bijepur)
MND320-05 30 Aug 1982 (Bijepur)
MND321-01 30 Aug 1982 (Bijepur)
MND321-02 30 Aug 1982 (Bijepur)
MND321-03 30 Jul 1927 (Champua) 30 Aug 1982 (Bijepur)
MND321-04 30 Jul 1927 (Champua)
MND321-05 30 Jul 1927 (Champua) 30 Aug 1982 (Bijepur)
MND321-06 30 Jul 1927 (Champua)
MND322-01 30 Jul 1927 (Champua)
MND322-02 30 Jul 1927 (Champua)
MND322-03 30 Jul 1927 (Champua)

Estimation of PMP by Physical Approach
PMP Atlas for Mahanadi and Adjoining River Basins Page 168 of 260
Table 3-30: 2-day rainstorms contributing to DAD envelope of the various grid points
Grid ID Area (sq. km.)
25 100 200 500 1,000 1,500 2,000 3,000 4,000 5,000 7,500 10,000 20,000
MND318-01 13-14 Jun 2001 (Thuamulrampur)
MND318-02 29-30 Aug 1982 (Phulbani)
MND318-03 29-30 Jul 1927 (Karanjia) 29-30 Aug 1982 (Phulbani)
MND319-01 29-30 Aug 1982 (Phulbani)
MND319-02 20-21 Sep 1926 (Bichhia)
MND319-03 29-30 Aug 1982 (Phulbani)
MND319-04 29-30 Aug 1982 (Phulbani)
MND319-05 29-30 Aug 1982 (Phulbani)
MND319-06 29-30 Jul 1927 (Karanjia) 29-30 Aug 1982 (Phulbani)
MND320-01 29-30 Aug 1982 (Phulbani)
MND320-02 29-30 Aug 1982 (Phulbani)
MND320-03 29-30 Aug 1982 (Phulbani)
MND320-04 29-30 Aug 1982 (Phulbani)
MND320-05 29-30 Aug 1982 (Phulbani)
MND321-01 17-18 Jun 2008 (Bahalda) 29-30 Aug 1982 (Phulbani)
MND321-02 29-30 Aug 1982 (Phulbani)
MND321-03 29-30 Aug 1982 (Phulbani)
MND321-04 29-30 Jul 1927 (Karanjia)
MND321-05 29-30 Jul 1927 (Karanjia) 29-30 Aug 1982 (Phulbani)
MND321-06 29-30 Jul 1927 (Karanjia)
MND322-01 29-30 Jul 1927 (Karanjia)
MND322-02 29-30 Jul 1927 (Karanjia)
MND322-03 29-30 Jul 1927 (Karanjia)

Estimation of PMP by Physical Approach
PMP Atlas for Mahanadi and Adjoining River Basins Page 169 of 260
Table 3-31: 3-day rainstorms contributing to DAD envelope of the various grid points
Grid ID Area (sq. km.)
25 100 200 500 1,000 1,500 2,000 3,000 4,000 5,000 7,500 10,000 20,000
MND318-01 13-15 Jun 2001 (Thuamulrampur)
MND318-02 28-30 Aug 1982 (Dunguripalli)
MND318-03 28-30 Aug 1982 (Dunguripalli)
MND319-01 28-30 Aug 1982 (Dunguripalli)
MND319-02 19-21 Sep 1926 (Dindori)
MND319-03 28-30 Aug 1982 (Dunguripalli)
MND319-04 28-30 Aug 1982 (Dunguripalli)
MND319-05 28-30 Aug 1982 (Dunguripalli)
MND319-06 28-30 Aug 1982 (Dunguripalli)
MND320-01 28-30 Aug 1982 (Dunguripalli)
MND320-02 28-30 Aug 1982 (Dunguripalli)
MND320-03 28-30 Aug 1982 (Dunguripalli)
MND320-04 28-30 Aug 1982 (Dunguripalli)
MND320-05 28-30 Aug 1982 (Dunguripalli)
MND321-01 28-30 Aug 1982 (Dunguripalli)
MND321-02 28-30 Aug 1982 (Dunguripalli)
MND321-03 28-30 Aug 1982 (Dunguripalli)
MND321-04 28-30 Jul 1927 (Karanjia) 29-31 Oct 1999 (Anandpur)
MND321-05 28-30 Aug 1982 (Dunguripalli)
MND321-06 28-30 Jul 1927 (Karanjia)
MND322-01 28-30 Jul 1927 (Karanjia) 29-31 Oct 1999 (Anandpur)
MND322-02 28-30 Jul 1927 (Karanjia) 29-31 Oct 1999 (Anandpur)
MND322-03 17-19 Jun 2008 (Bahalda) 28-30 Jul 1927 (Karanjia) 29-31 Oct 1999 (Anandpur)

Estimation of PMP by Physical Approach
PMP Atlas for Mahanadi and Adjoining River Basins Page 170 of 260
3.4.5 ESTIMATES OF AREAL PMP AT GRID POINTS
From the DAD envelope curves of each grid point and duration (1-day, 2-day and 3-day), Grid Rain Depth values were read at standard areas. These areas include 100; 200; 500; 1,000; 1,500; 2,000; 3,000; 4,000; 5,000; 7,500; 10,000; and 20,000 sq. km. Grid Rain Depth values for different areas were multiplied by the corresponding values of TAF to obtain 1-day, 2-day and 3-day areal SPS values at various grid points corresponding to specified areas. The SPS values were further multiplied by the MMF to obtain the PMP values at each grid point for standard areas and durations. For 1-day duration, area wise grid rain depths, contributing storms, TAF, SPS, MMF and PMP estimates at various grid points is given in Table 3-32. Similarly Table 3-33 and Table 3-34 gives the details of grid PMP estimates for 2-day and 3-day durations. PMP maps for the 1-day duration for 100; 500; and 1,000 sq. km. areas are given in Volume II (Figure 5-2 to Figure 5-6) along with the 2-day and 3-day duration PMP maps for 1,000 sq. km. area.
Table 3-32: 1-day contributing storm, grid rain depth, TAF, SPS, MMF and PMP estimates at various grid points located in Mahanadi and Adjoining River Basins
Grid Id Area, sq. km. Grid Rain
Depth (mm) Storm
TAF (LAF*BAF)
SPS (mm)
MMF PMP (mm)
MND318-01
25 675 17 Jun 1996 1.21 817 1.23 1005
100 645 17 Jun 1996 1.21 780 1.23 959
200 627 17 Jun 1996 1.21 759 1.23 934
500 592 17 Jun 1996 1.21 716 1.23 881
1,000 555 17 Jun 1996 1.21 672 1.23 827
1,500 529 17 Jun 1996 1.21 640 1.23 787
2,000 508 17 Jun 1996 1.21 615 1.23 756
3,000 475 17 Jun 1996 1.21 575 1.23 707
4,000 449 17 Jun 1996 1.21 543 1.23 668
5,000 429 17 Jun 1996 1.21 519 1.23 638
7,500 390 17 Jun 1996 1.21 472 1.23 581
10,000 362 17 Jun 1996 1.21 438 1.23 539
20,000 297 17 Jun 1996 1.21 359 1.23 442
MND318-02
25 546 14 Oct 1931 0.96 524 1.43 749
100 521 14 Oct 1931 0.96 500 1.43 715
200 504 14 Oct 1931 0.96 484 1.43 692
500 488 14 Oct 1931 0.96 468 1.43 669
1,000 473 14 Oct 1931 0.96 454 1.43 649
1,500 461 14 Oct 1931 0.96 443 1.43 633
2,000 449 14 Oct 1931 0.96 431 1.43 616
3,000 430 14 Oct 1931 0.96 413 1.43 591
4,000 414 14 Oct 1931 0.96 397 1.43 568
5,000 397 14 Oct 1931 0.96 381 1.43 545
7,500 360 14 Oct 1931 0.96 346 1.43 495
10,000 331 14 Oct 1931 0.96 318 1.43 455
20,000 252 14 Oct 1931 0.96 242 1.43 346
MND318-03
25 565 30 Jul 1927 1.11 627 1.36 853
100 558 30 Jul 1927 1.11 619 1.36 842
200 551 30 Jul 1927 1.11 612 1.36 832
500 531 30 Jul 1927 1.11 589 1.36 801
1,000 503 30 Jul 1927 1.11 558 1.36 759
1,500 478 30 Aug 1982 1.15 550 1.26 693
2,000 471 30 Aug 1982 1.15 542 1.26 683
3,000 462 30 Aug 1982 1.15 531 1.26 669
4,000 449 30 Aug 1982 1.15 516 1.26 650
5,000 435 30 Aug 1982 1.15 500 1.26 630
7,500 402 30 Aug 1982 1.15 462 1.26 582
10,000 366 30 Aug 1982 1.15 421 1.26 530
20,000 290 30 Aug 1982 1.15 334 1.26 421
MND319-01
25 520 30 Aug 1982 0.85 442 1.26 557
100 516 30 Aug 1982 0.85 439 1.26 553
200 512 30 Aug 1982 0.85 435 1.26 548

Estimation of PMP by Physical Approach
PMP Atlas for Mahanadi and Adjoining River Basins Page 171 of 260
Grid Id Area, sq. km. Grid Rain
Depth (mm) Storm
TAF (LAF*BAF)
SPS (mm)
MMF PMP (mm)
500 501 30 Aug 1982 0.85 426 1.26 537
1,000 487 30 Aug 1982 0.85 414 1.26 522
1,500 478 30 Aug 1982 0.85 406 1.26 512
2,000 471 30 Aug 1982 0.85 400 1.26 504
3,000 462 30 Aug 1982 0.85 393 1.26 495
4,000 449 30 Aug 1982 0.85 382 1.26 481
5,000 435 30 Aug 1982 0.85 370 1.26 466
7,500 402 30 Aug 1982 0.85 342 1.26 431
10,000 366 30 Aug 1982 0.85 311 1.26 392
20,000 290 30 Aug 1982 0.85 247 1.26 311
MND319-02
25 407 18 Jul 2000 0.99 403 1.29 520
100 403 18 Jul 2000 0.99 399 1.29 515
200 399 18 Jul 2000 0.99 395 1.29 510
500 387 18 Jul 2000 0.99 383 1.29 494
1,000 371 18 Jul 2000 0.99 367 1.29 473
1,500 360 18 Jul 2000 0.99 356 1.29 459
2,000 355 18 Jul 2000 0.99 351 1.29 453
3,000 354 18 Jul 2000 0.99 350 1.29 452
4,000 350 18 Jul 2000 0.99 347 1.29 448
5,000 344 18 Jul 2000 0.99 341 1.29 440
7,500 327 18 Jul 2000 0.99 324 1.29 418
10,000 313 18 Jul 2000 0.99 310 1.29 400
20,000 268 18 Jul 2000 0.99 265 1.29 342
MND319-03
25 520 30 Aug 1982 0.90 468 1.26 590
100 516 30 Aug 1982 0.90 464 1.26 585
200 512 30 Aug 1982 0.90 461 1.26 581
500 501 30 Aug 1982 0.90 451 1.26 568
1,000 487 30 Aug 1982 0.90 438 1.26 552
1,500 478 30 Aug 1982 0.90 430 1.26 542
2,000 471 30 Aug 1982 0.90 424 1.26 534
3,000 462 30 Aug 1982 0.90 416 1.26 524
4,000 449 30 Aug 1982 0.90 404 1.26 509
5,000 435 30 Aug 1982 0.90 392 1.26 494
7,500 402 30 Aug 1982 0.90 362 1.26 456
10,000 366 30 Aug 1982 0.90 329 1.26 415
20,000 290 30 Aug 1982 0.90 261 1.26 329
MND319-04
25 520 30 Aug 1982 0.89 463 1.26 583
100 516 30 Aug 1982 0.89 459 1.26 578
200 512 30 Aug 1982 0.89 456 1.26 575
500 501 30 Aug 1982 0.89 446 1.26 562
1,000 487 30 Aug 1982 0.89 433 1.26 546
1,500 478 30 Aug 1982 0.89 425 1.26 536
2,000 471 30 Aug 1982 0.89 419 1.26 528
3,000 462 30 Aug 1982 0.89 411 1.26 518
4,000 449 30 Aug 1982 0.89 400 1.26 504
5,000 435 30 Aug 1982 0.89 387 1.26 488
7,500 402 30 Aug 1982 0.89 358 1.26 451
10,000 366 30 Aug 1982 0.89 326 1.26 411
20,000 290 30 Aug 1982 0.89 258 1.26 325
MND319-05
25 520 30 Aug 1982 0.92 478 1.26 602
100 516 30 Aug 1982 0.92 475 1.26 599
200 512 30 Aug 1982 0.92 471 1.26 593
500 501 30 Aug 1982 0.92 461 1.26 581
1,000 487 30 Aug 1982 0.92 448 1.26 564
1,500 478 30 Aug 1982 0.92 440 1.26 554
2,000 471 30 Aug 1982 0.92 433 1.26 546
3,000 462 30 Aug 1982 0.92 425 1.26 536
4,000 449 30 Aug 1982 0.92 413 1.26 520
5,000 435 30 Aug 1982 0.92 400 1.26 504
7,500 402 30 Aug 1982 0.92 370 1.26 466
10,000 366 30 Aug 1982 0.92 337 1.26 425
20,000 290 30 Aug 1982 0.92 267 1.26 336

Estimation of PMP by Physical Approach
PMP Atlas for Mahanadi and Adjoining River Basins Page 172 of 260
Grid Id Area, sq. km. Grid Rain
Depth (mm) Storm
TAF (LAF*BAF)
SPS (mm)
MMF PMP (mm)
MND319-06
25 565 30 Jul 1927 0.92 520 1.36 707
100 558 30 Jul 1927 0.92 513 1.36 698
200 551 30 Jul 1927 0.92 507 1.36 690
500 531 30 Jul 1927 0.92 489 1.36 665
1,000 503 30 Jul 1927 0.92 463 1.36 630
1,500 478 30 Aug 1982 0.95 454 1.26 572
2,000 471 30 Aug 1982 0.95 447 1.26 563
3,000 462 30 Aug 1982 0.95 439 1.26 553
4,000 449 30 Aug 1982 0.95 427 1.26 538
5,000 435 30 Aug 1982 0.95 413 1.26 520
7,500 402 30 Aug 1982 0.95 382 1.26 481
10,000 366 30 Aug 1982 0.95 348 1.26 438
20,000 290 30 Aug 1982 0.95 276 1.26 348
MND320-01
25 546 14 Oct 1931 1.00 546 1.43 781
100 521 14 Oct 1931 1.00 521 1.43 745
200 512 30 Aug 1982 0.99 507 1.26 639
500 501 30 Aug 1982 0.99 496 1.26 625
1,000 487 30 Aug 1982 0.99 482 1.26 607
1,500 478 30 Aug 1982 0.99 473 1.26 596
2,000 471 30 Aug 1982 0.99 466 1.26 587
3,000 462 30 Aug 1982 0.99 457 1.26 576
4,000 449 30 Aug 1982 0.99 445 1.26 561
5,000 435 30 Aug 1982 0.99 431 1.26 543
7,500 402 30 Aug 1982 0.99 398 1.26 501
10,000 366 30 Aug 1982 0.99 362 1.26 456
20,000 290 30 Aug 1982 0.99 287 1.26 362
MND320-02
25 520 30 Aug 1982 0.96 499 1.26 629
100 516 30 Aug 1982 0.96 495 1.26 624
200 512 30 Aug 1982 0.96 492 1.26 620
500 501 30 Aug 1982 0.96 481 1.26 606
1,000 487 30 Aug 1982 0.96 468 1.26 590
1,500 478 30 Aug 1982 0.96 459 1.26 578
2,000 471 30 Aug 1982 0.96 452 1.26 570
3,000 462 30 Aug 1982 0.96 444 1.26 559
4,000 449 30 Aug 1982 0.96 431 1.26 543
5,000 435 30 Aug 1982 0.96 418 1.26 527
7,500 402 30 Aug 1982 0.96 386 1.26 486
10,000 366 30 Aug 1982 0.96 351 1.26 442
20,000 290 30 Aug 1982 0.96 278 1.26 350
MND320-03
25 520 30 Aug 1982 1.15 598 1.26 753
100 516 30 Aug 1982 1.15 593 1.26 747
200 512 30 Aug 1982 1.15 589 1.26 742
500 501 30 Aug 1982 1.15 576 1.26 726
1,000 487 30 Aug 1982 1.15 560 1.26 706
1,500 478 30 Aug 1982 1.15 550 1.26 693
2,000 471 30 Aug 1982 1.15 542 1.26 683
3,000 462 30 Aug 1982 1.15 531 1.26 669
4,000 449 30 Aug 1982 1.15 516 1.26 650
5,000 435 30 Aug 1982 1.15 500 1.26 630
7,500 402 30 Aug 1982 1.15 462 1.26 582
10,000 366 30 Aug 1982 1.15 421 1.26 530
20,000 290 30 Aug 1982 1.15 334 1.26 421
MND320-04
25 520 30 Aug 1982 0.97 504 1.26 635
100 516 30 Aug 1982 0.97 501 1.26 631
200 512 30 Aug 1982 0.97 497 1.26 626
500 501 30 Aug 1982 0.97 486 1.26 612
1,000 487 30 Aug 1982 0.97 472 1.26 595
1,500 478 30 Aug 1982 0.97 464 1.26 585
2,000 471 30 Aug 1982 0.97 457 1.26 576
3,000 462 30 Aug 1982 0.97 448 1.26 564
4,000 449 30 Aug 1982 0.97 436 1.26 549
5,000 435 30 Aug 1982 0.97 422 1.26 532

Estimation of PMP by Physical Approach
PMP Atlas for Mahanadi and Adjoining River Basins Page 173 of 260
Grid Id Area, sq. km. Grid Rain
Depth (mm) Storm
TAF (LAF*BAF)
SPS (mm)
MMF PMP (mm)
7,500 402 30 Aug 1982 0.97 390 1.26 491
10,000 366 30 Aug 1982 0.97 355 1.26 447
20,000 290 30 Aug 1982 0.97 281 1.26 354
MND320-05
25 520 30 Aug 1982 1.06 551 1.26 694
100 516 30 Aug 1982 1.06 547 1.26 689
200 512 30 Aug 1982 1.06 543 1.26 684
500 501 30 Aug 1982 1.06 531 1.26 669
1,000 487 30 Aug 1982 1.06 516 1.26 650
1,500 478 30 Aug 1982 1.06 507 1.26 639
2,000 471 30 Aug 1982 1.06 499 1.26 629
3,000 462 30 Aug 1982 1.06 490 1.26 617
4,000 449 30 Aug 1982 1.06 476 1.26 600
5,000 435 30 Aug 1982 1.06 461 1.26 581
7,500 402 30 Aug 1982 1.06 426 1.26 537
10,000 366 30 Aug 1982 1.06 388 1.26 489
20,000 290 30 Aug 1982 1.06 307 1.26 387
MND321-01
25 520 30 Aug 1982 1.10 572 1.26 721
100 516 30 Aug 1982 1.10 568 1.26 716
200 512 30 Aug 1982 1.10 563 1.26 709
500 501 30 Aug 1982 1.10 551 1.26 694
1,000 487 30 Aug 1982 1.10 536 1.26 675
1,500 478 30 Aug 1982 1.10 526 1.26 663
2,000 471 30 Aug 1982 1.10 518 1.26 653
3,000 462 30 Aug 1982 1.10 508 1.26 640
4,000 449 30 Aug 1982 1.10 494 1.26 622
5,000 435 30 Aug 1982 1.10 479 1.26 604
7,500 402 30 Aug 1982 1.10 442 1.26 557
10,000 366 30 Aug 1982 1.10 403 1.26 508
20,000 290 30 Aug 1982 1.10 319 1.26 402
MND321-02
25 520 30 Aug 1982 1.14 593 1.26 747
100 516 30 Aug 1982 1.14 588 1.26 741
200 512 30 Aug 1982 1.14 584 1.26 736
500 501 30 Aug 1982 1.14 571 1.26 719
1,000 487 30 Aug 1982 1.14 555 1.26 699
1,500 478 30 Aug 1982 1.14 545 1.26 687
2,000 471 30 Aug 1982 1.14 537 1.26 677
3,000 462 30 Aug 1982 1.14 527 1.26 664
4,000 449 30 Aug 1982 1.14 512 1.26 645
5,000 435 30 Aug 1982 1.14 496 1.26 625
7,500 402 30 Aug 1982 1.14 458 1.26 577
10,000 366 30 Aug 1982 1.14 417 1.26 525
20,000 290 30 Aug 1982 1.14 331 1.26 417
MND321-03
25 565 30 Jul 1927 0.93 525 1.36 714
100 558 30 Jul 1927 0.93 519 1.36 706
200 551 30 Jul 1927 0.93 512 1.36 696
500 531 30 Jul 1927 0.93 494 1.36 672
1,000 503 30 Jul 1927 0.93 468 1.36 636
1,500 478 30 Aug 1982 0.97 464 1.26 585
2,000 471 30 Aug 1982 0.97 457 1.26 576
3,000 462 30 Aug 1982 0.97 448 1.26 564
4,000 449 30 Aug 1982 0.97 436 1.26 549
5,000 435 30 Aug 1982 0.97 422 1.26 532
7,500 402 30 Aug 1982 0.97 390 1.26 491
10,000 366 30 Aug 1982 0.97 355 1.26 447
20,000 290 30 Aug 1982 0.97 281 1.26 354
MND321-04
25 565 30 Jul 1927 0.95 537 1.36 730
100 558 30 Jul 1927 0.95 530 1.36 721
200 551 30 Jul 1927 0.95 523 1.36 711
500 531 30 Jul 1927 0.95 504 1.36 685
1,000 503 30 Jul 1927 0.95 478 1.36 650
1,500 479 30 Jul 1927 0.95 455 1.36 619
2,000 457 30 Jul 1927 0.95 434 1.36 590
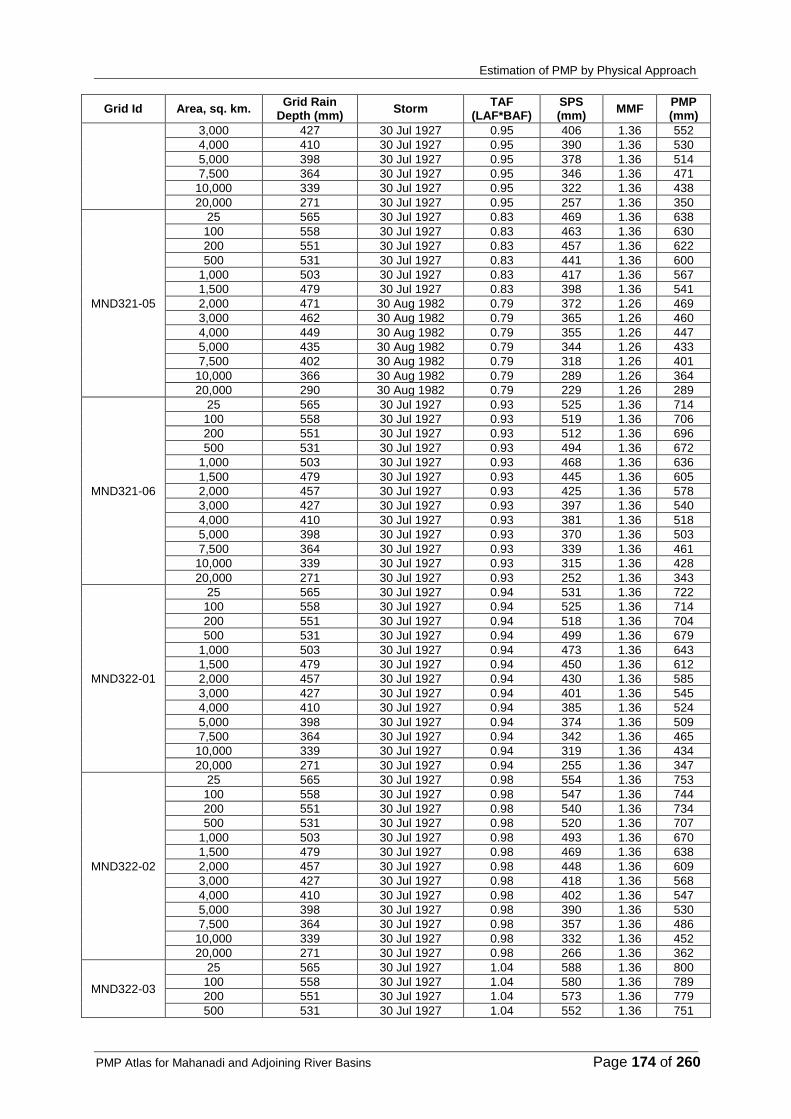
Estimation of PMP by Physical Approach
PMP Atlas for Mahanadi and Adjoining River Basins Page 174 of 260
Grid Id Area, sq. km. Grid Rain
Depth (mm) Storm
TAF (LAF*BAF)
SPS (mm)
MMF PMP (mm)
3,000 427 30 Jul 1927 0.95 406 1.36 552
4,000 410 30 Jul 1927 0.95 390 1.36 530
5,000 398 30 Jul 1927 0.95 378 1.36 514
7,500 364 30 Jul 1927 0.95 346 1.36 471
10,000 339 30 Jul 1927 0.95 322 1.36 438
20,000 271 30 Jul 1927 0.95 257 1.36 350
MND321-05
25 565 30 Jul 1927 0.83 469 1.36 638
100 558 30 Jul 1927 0.83 463 1.36 630
200 551 30 Jul 1927 0.83 457 1.36 622
500 531 30 Jul 1927 0.83 441 1.36 600
1,000 503 30 Jul 1927 0.83 417 1.36 567
1,500 479 30 Jul 1927 0.83 398 1.36 541
2,000 471 30 Aug 1982 0.79 372 1.26 469
3,000 462 30 Aug 1982 0.79 365 1.26 460
4,000 449 30 Aug 1982 0.79 355 1.26 447
5,000 435 30 Aug 1982 0.79 344 1.26 433
7,500 402 30 Aug 1982 0.79 318 1.26 401
10,000 366 30 Aug 1982 0.79 289 1.26 364
20,000 290 30 Aug 1982 0.79 229 1.26 289
MND321-06
25 565 30 Jul 1927 0.93 525 1.36 714
100 558 30 Jul 1927 0.93 519 1.36 706
200 551 30 Jul 1927 0.93 512 1.36 696
500 531 30 Jul 1927 0.93 494 1.36 672
1,000 503 30 Jul 1927 0.93 468 1.36 636
1,500 479 30 Jul 1927 0.93 445 1.36 605
2,000 457 30 Jul 1927 0.93 425 1.36 578
3,000 427 30 Jul 1927 0.93 397 1.36 540
4,000 410 30 Jul 1927 0.93 381 1.36 518
5,000 398 30 Jul 1927 0.93 370 1.36 503
7,500 364 30 Jul 1927 0.93 339 1.36 461
10,000 339 30 Jul 1927 0.93 315 1.36 428
20,000 271 30 Jul 1927 0.93 252 1.36 343
MND322-01
25 565 30 Jul 1927 0.94 531 1.36 722
100 558 30 Jul 1927 0.94 525 1.36 714
200 551 30 Jul 1927 0.94 518 1.36 704
500 531 30 Jul 1927 0.94 499 1.36 679
1,000 503 30 Jul 1927 0.94 473 1.36 643
1,500 479 30 Jul 1927 0.94 450 1.36 612
2,000 457 30 Jul 1927 0.94 430 1.36 585
3,000 427 30 Jul 1927 0.94 401 1.36 545
4,000 410 30 Jul 1927 0.94 385 1.36 524
5,000 398 30 Jul 1927 0.94 374 1.36 509
7,500 364 30 Jul 1927 0.94 342 1.36 465
10,000 339 30 Jul 1927 0.94 319 1.36 434
20,000 271 30 Jul 1927 0.94 255 1.36 347
MND322-02
25 565 30 Jul 1927 0.98 554 1.36 753
100 558 30 Jul 1927 0.98 547 1.36 744
200 551 30 Jul 1927 0.98 540 1.36 734
500 531 30 Jul 1927 0.98 520 1.36 707
1,000 503 30 Jul 1927 0.98 493 1.36 670
1,500 479 30 Jul 1927 0.98 469 1.36 638
2,000 457 30 Jul 1927 0.98 448 1.36 609
3,000 427 30 Jul 1927 0.98 418 1.36 568
4,000 410 30 Jul 1927 0.98 402 1.36 547
5,000 398 30 Jul 1927 0.98 390 1.36 530
7,500 364 30 Jul 1927 0.98 357 1.36 486
10,000 339 30 Jul 1927 0.98 332 1.36 452
20,000 271 30 Jul 1927 0.98 266 1.36 362
MND322-03
25 565 30 Jul 1927 1.04 588 1.36 800
100 558 30 Jul 1927 1.04 580 1.36 789
200 551 30 Jul 1927 1.04 573 1.36 779
500 531 30 Jul 1927 1.04 552 1.36 751
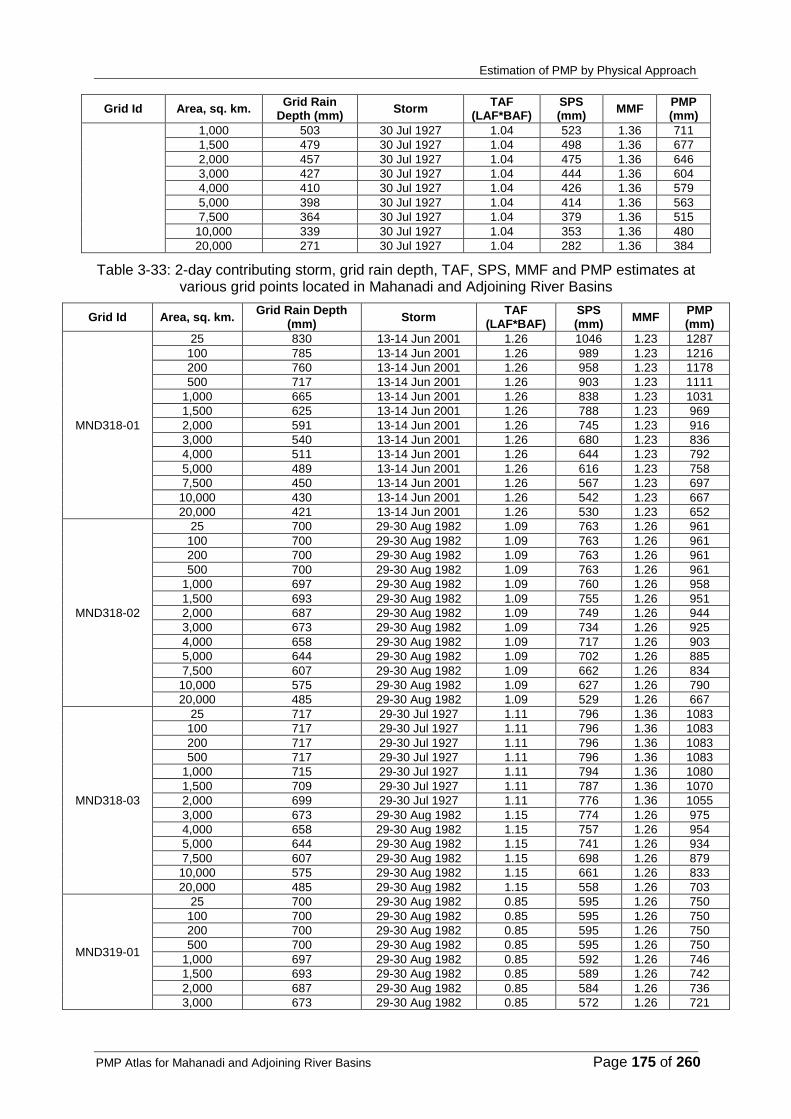
Estimation of PMP by Physical Approach
PMP Atlas for Mahanadi and Adjoining River Basins Page 175 of 260
Grid Id Area, sq. km. Grid Rain
Depth (mm) Storm
TAF (LAF*BAF)
SPS (mm)
MMF PMP (mm)
1,000 503 30 Jul 1927 1.04 523 1.36 711
1,500 479 30 Jul 1927 1.04 498 1.36 677
2,000 457 30 Jul 1927 1.04 475 1.36 646
3,000 427 30 Jul 1927 1.04 444 1.36 604
4,000 410 30 Jul 1927 1.04 426 1.36 579
5,000 398 30 Jul 1927 1.04 414 1.36 563
7,500 364 30 Jul 1927 1.04 379 1.36 515
10,000 339 30 Jul 1927 1.04 353 1.36 480
20,000 271 30 Jul 1927 1.04 282 1.36 384
Table 3-33: 2-day contributing storm, grid rain depth, TAF, SPS, MMF and PMP estimates at various grid points located in Mahanadi and Adjoining River Basins
Grid Id Area, sq. km. Grid Rain Depth
(mm) Storm
TAF (LAF*BAF)
SPS (mm)
MMF PMP (mm)
MND318-01
25 830 13-14 Jun 2001 1.26 1046 1.23 1287
100 785 13-14 Jun 2001 1.26 989 1.23 1216
200 760 13-14 Jun 2001 1.26 958 1.23 1178
500 717 13-14 Jun 2001 1.26 903 1.23 1111
1,000 665 13-14 Jun 2001 1.26 838 1.23 1031
1,500 625 13-14 Jun 2001 1.26 788 1.23 969
2,000 591 13-14 Jun 2001 1.26 745 1.23 916
3,000 540 13-14 Jun 2001 1.26 680 1.23 836
4,000 511 13-14 Jun 2001 1.26 644 1.23 792
5,000 489 13-14 Jun 2001 1.26 616 1.23 758
7,500 450 13-14 Jun 2001 1.26 567 1.23 697
10,000 430 13-14 Jun 2001 1.26 542 1.23 667
20,000 421 13-14 Jun 2001 1.26 530 1.23 652
MND318-02
25 700 29-30 Aug 1982 1.09 763 1.26 961
100 700 29-30 Aug 1982 1.09 763 1.26 961
200 700 29-30 Aug 1982 1.09 763 1.26 961
500 700 29-30 Aug 1982 1.09 763 1.26 961
1,000 697 29-30 Aug 1982 1.09 760 1.26 958
1,500 693 29-30 Aug 1982 1.09 755 1.26 951
2,000 687 29-30 Aug 1982 1.09 749 1.26 944
3,000 673 29-30 Aug 1982 1.09 734 1.26 925
4,000 658 29-30 Aug 1982 1.09 717 1.26 903
5,000 644 29-30 Aug 1982 1.09 702 1.26 885
7,500 607 29-30 Aug 1982 1.09 662 1.26 834
10,000 575 29-30 Aug 1982 1.09 627 1.26 790
20,000 485 29-30 Aug 1982 1.09 529 1.26 667
MND318-03
25 717 29-30 Jul 1927 1.11 796 1.36 1083
100 717 29-30 Jul 1927 1.11 796 1.36 1083
200 717 29-30 Jul 1927 1.11 796 1.36 1083
500 717 29-30 Jul 1927 1.11 796 1.36 1083
1,000 715 29-30 Jul 1927 1.11 794 1.36 1080
1,500 709 29-30 Jul 1927 1.11 787 1.36 1070
2,000 699 29-30 Jul 1927 1.11 776 1.36 1055
3,000 673 29-30 Aug 1982 1.15 774 1.26 975
4,000 658 29-30 Aug 1982 1.15 757 1.26 954
5,000 644 29-30 Aug 1982 1.15 741 1.26 934
7,500 607 29-30 Aug 1982 1.15 698 1.26 879
10,000 575 29-30 Aug 1982 1.15 661 1.26 833
20,000 485 29-30 Aug 1982 1.15 558 1.26 703
MND319-01
25 700 29-30 Aug 1982 0.85 595 1.26 750
100 700 29-30 Aug 1982 0.85 595 1.26 750
200 700 29-30 Aug 1982 0.85 595 1.26 750
500 700 29-30 Aug 1982 0.85 595 1.26 750
1,000 697 29-30 Aug 1982 0.85 592 1.26 746
1,500 693 29-30 Aug 1982 0.85 589 1.26 742
2,000 687 29-30 Aug 1982 0.85 584 1.26 736
3,000 673 29-30 Aug 1982 0.85 572 1.26 721
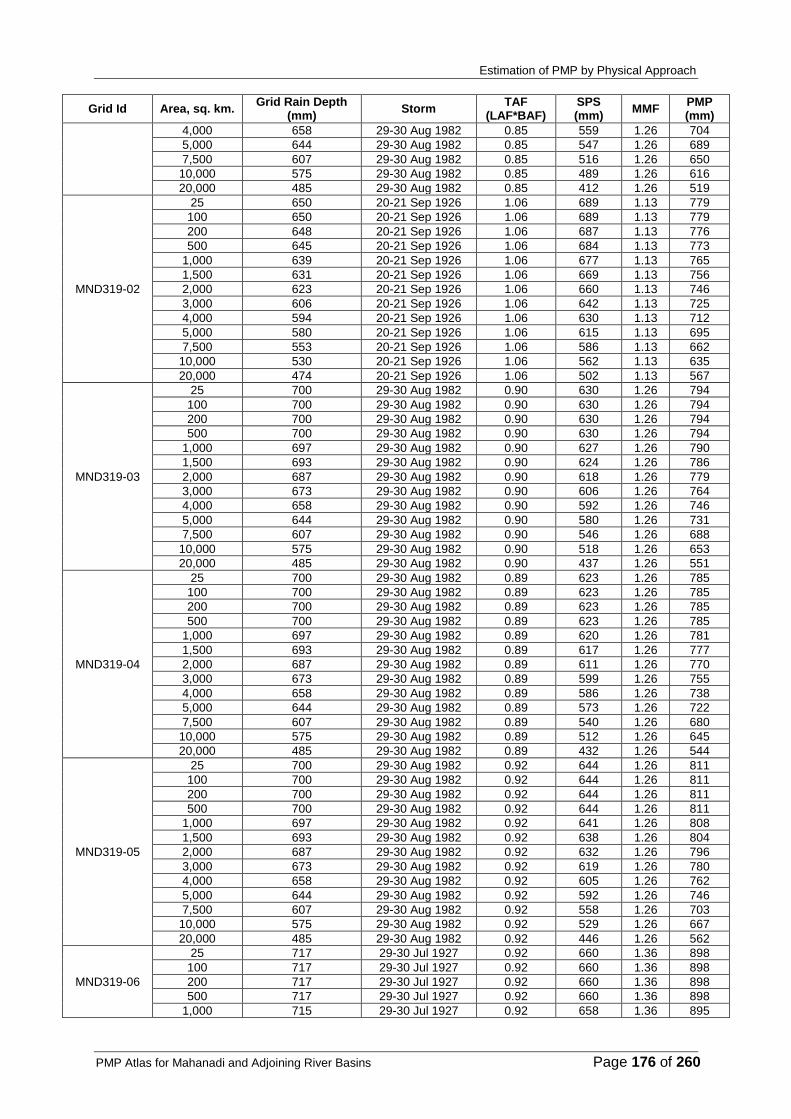
Estimation of PMP by Physical Approach
PMP Atlas for Mahanadi and Adjoining River Basins Page 176 of 260
Grid Id Area, sq. km. Grid Rain Depth
(mm) Storm
TAF (LAF*BAF)
SPS (mm)
MMF PMP (mm)
4,000 658 29-30 Aug 1982 0.85 559 1.26 704
5,000 644 29-30 Aug 1982 0.85 547 1.26 689
7,500 607 29-30 Aug 1982 0.85 516 1.26 650
10,000 575 29-30 Aug 1982 0.85 489 1.26 616
20,000 485 29-30 Aug 1982 0.85 412 1.26 519
MND319-02
25 650 20-21 Sep 1926 1.06 689 1.13 779
100 650 20-21 Sep 1926 1.06 689 1.13 779
200 648 20-21 Sep 1926 1.06 687 1.13 776
500 645 20-21 Sep 1926 1.06 684 1.13 773
1,000 639 20-21 Sep 1926 1.06 677 1.13 765
1,500 631 20-21 Sep 1926 1.06 669 1.13 756
2,000 623 20-21 Sep 1926 1.06 660 1.13 746
3,000 606 20-21 Sep 1926 1.06 642 1.13 725
4,000 594 20-21 Sep 1926 1.06 630 1.13 712
5,000 580 20-21 Sep 1926 1.06 615 1.13 695
7,500 553 20-21 Sep 1926 1.06 586 1.13 662
10,000 530 20-21 Sep 1926 1.06 562 1.13 635
20,000 474 20-21 Sep 1926 1.06 502 1.13 567
MND319-03
25 700 29-30 Aug 1982 0.90 630 1.26 794
100 700 29-30 Aug 1982 0.90 630 1.26 794
200 700 29-30 Aug 1982 0.90 630 1.26 794
500 700 29-30 Aug 1982 0.90 630 1.26 794
1,000 697 29-30 Aug 1982 0.90 627 1.26 790
1,500 693 29-30 Aug 1982 0.90 624 1.26 786
2,000 687 29-30 Aug 1982 0.90 618 1.26 779
3,000 673 29-30 Aug 1982 0.90 606 1.26 764
4,000 658 29-30 Aug 1982 0.90 592 1.26 746
5,000 644 29-30 Aug 1982 0.90 580 1.26 731
7,500 607 29-30 Aug 1982 0.90 546 1.26 688
10,000 575 29-30 Aug 1982 0.90 518 1.26 653
20,000 485 29-30 Aug 1982 0.90 437 1.26 551
MND319-04
25 700 29-30 Aug 1982 0.89 623 1.26 785
100 700 29-30 Aug 1982 0.89 623 1.26 785
200 700 29-30 Aug 1982 0.89 623 1.26 785
500 700 29-30 Aug 1982 0.89 623 1.26 785
1,000 697 29-30 Aug 1982 0.89 620 1.26 781
1,500 693 29-30 Aug 1982 0.89 617 1.26 777
2,000 687 29-30 Aug 1982 0.89 611 1.26 770
3,000 673 29-30 Aug 1982 0.89 599 1.26 755
4,000 658 29-30 Aug 1982 0.89 586 1.26 738
5,000 644 29-30 Aug 1982 0.89 573 1.26 722
7,500 607 29-30 Aug 1982 0.89 540 1.26 680
10,000 575 29-30 Aug 1982 0.89 512 1.26 645
20,000 485 29-30 Aug 1982 0.89 432 1.26 544
MND319-05
25 700 29-30 Aug 1982 0.92 644 1.26 811
100 700 29-30 Aug 1982 0.92 644 1.26 811
200 700 29-30 Aug 1982 0.92 644 1.26 811
500 700 29-30 Aug 1982 0.92 644 1.26 811
1,000 697 29-30 Aug 1982 0.92 641 1.26 808
1,500 693 29-30 Aug 1982 0.92 638 1.26 804
2,000 687 29-30 Aug 1982 0.92 632 1.26 796
3,000 673 29-30 Aug 1982 0.92 619 1.26 780
4,000 658 29-30 Aug 1982 0.92 605 1.26 762
5,000 644 29-30 Aug 1982 0.92 592 1.26 746
7,500 607 29-30 Aug 1982 0.92 558 1.26 703
10,000 575 29-30 Aug 1982 0.92 529 1.26 667
20,000 485 29-30 Aug 1982 0.92 446 1.26 562
MND319-06
25 717 29-30 Jul 1927 0.92 660 1.36 898
100 717 29-30 Jul 1927 0.92 660 1.36 898
200 717 29-30 Jul 1927 0.92 660 1.36 898
500 717 29-30 Jul 1927 0.92 660 1.36 898
1,000 715 29-30 Jul 1927 0.92 658 1.36 895

Estimation of PMP by Physical Approach
PMP Atlas for Mahanadi and Adjoining River Basins Page 177 of 260
Grid Id Area, sq. km. Grid Rain Depth
(mm) Storm
TAF (LAF*BAF)
SPS (mm)
MMF PMP (mm)
1,500 709 29-30 Jul 1927 0.92 652 1.36 887
2,000 699 29-30 Jul 1927 0.92 643 1.36 874
3,000 673 29-30 Aug 1982 0.95 639 1.26 805
4,000 658 29-30 Aug 1982 0.95 625 1.26 788
5,000 644 29-30 Aug 1982 0.95 612 1.26 771
7,500 607 29-30 Aug 1982 0.95 577 1.26 727
10,000 575 29-30 Aug 1982 0.95 546 1.26 688
20,000 485 29-30 Aug 1982 0.95 461 1.26 581
MND320-01
25 700 29-30 Aug 1982 0.99 693 1.26 873
100 700 29-30 Aug 1982 0.99 693 1.26 873
200 700 29-30 Aug 1982 0.99 693 1.26 873
500 700 29-30 Aug 1982 0.99 693 1.26 873
1,000 697 29-30 Aug 1982 0.99 690 1.26 869
1,500 693 29-30 Aug 1982 0.99 686 1.26 864
2,000 687 29-30 Aug 1982 0.99 680 1.26 857
3,000 673 29-30 Aug 1982 0.99 666 1.26 839
4,000 658 29-30 Aug 1982 0.99 651 1.26 820
5,000 644 29-30 Aug 1982 0.99 638 1.26 804
7,500 607 29-30 Aug 1982 0.99 601 1.26 757
10,000 575 29-30 Aug 1982 0.99 569 1.26 717
20,000 485 29-30 Aug 1982 0.99 480 1.26 605
MND320-02
25 700 29-30 Aug 1982 0.96 672 1.26 847
100 700 29-30 Aug 1982 0.96 672 1.26 847
200 700 29-30 Aug 1982 0.96 672 1.26 847
500 700 29-30 Aug 1982 0.96 672 1.26 847
1,000 697 29-30 Aug 1982 0.96 669 1.26 843
1,500 693 29-30 Aug 1982 0.96 665 1.26 838
2,000 687 29-30 Aug 1982 0.96 660 1.26 832
3,000 673 29-30 Aug 1982 0.96 646 1.26 814
4,000 658 29-30 Aug 1982 0.96 632 1.26 796
5,000 644 29-30 Aug 1982 0.96 618 1.26 779
7,500 607 29-30 Aug 1982 0.96 583 1.26 735
10,000 575 29-30 Aug 1982 0.96 552 1.26 696
20,000 485 29-30 Aug 1982 0.96 466 1.26 587
MND320-03
25 700 29-30 Aug 1982 1.15 805 1.26 1014
100 700 29-30 Aug 1982 1.15 805 1.26 1014
200 700 29-30 Aug 1982 1.15 805 1.26 1014
500 700 29-30 Aug 1982 1.15 805 1.26 1014
1,000 697 29-30 Aug 1982 1.15 802 1.26 1011
1,500 693 29-30 Aug 1982 1.15 797 1.26 1004
2,000 687 29-30 Aug 1982 1.15 790 1.26 995
3,000 673 29-30 Aug 1982 1.15 774 1.26 975
4,000 658 29-30 Aug 1982 1.15 757 1.26 954
5,000 644 29-30 Aug 1982 1.15 741 1.26 934
7,500 607 29-30 Aug 1982 1.15 698 1.26 879
10,000 575 29-30 Aug 1982 1.15 661 1.26 833
20,000 485 29-30 Aug 1982 1.15 558 1.26 703
MND320-04
25 700 29-30 Aug 1982 0.97 679 1.26 856
100 700 29-30 Aug 1982 0.97 679 1.26 856
200 700 29-30 Aug 1982 0.97 679 1.26 856
500 700 29-30 Aug 1982 0.97 679 1.26 856
1,000 697 29-30 Aug 1982 0.97 676 1.26 852
1,500 693 29-30 Aug 1982 0.97 672 1.26 847
2,000 687 29-30 Aug 1982 0.97 666 1.26 839
3,000 673 29-30 Aug 1982 0.97 653 1.26 823
4,000 658 29-30 Aug 1982 0.97 638 1.26 804
5,000 644 29-30 Aug 1982 0.97 625 1.26 788
7,500 607 29-30 Aug 1982 0.97 589 1.26 742
10,000 575 29-30 Aug 1982 0.97 558 1.26 703
20,000 485 29-30 Aug 1982 0.97 470 1.26 592
MND320-05 25 700 29-30 Aug 1982 1.06 742 1.26 935
100 700 29-30 Aug 1982 1.06 742 1.26 935
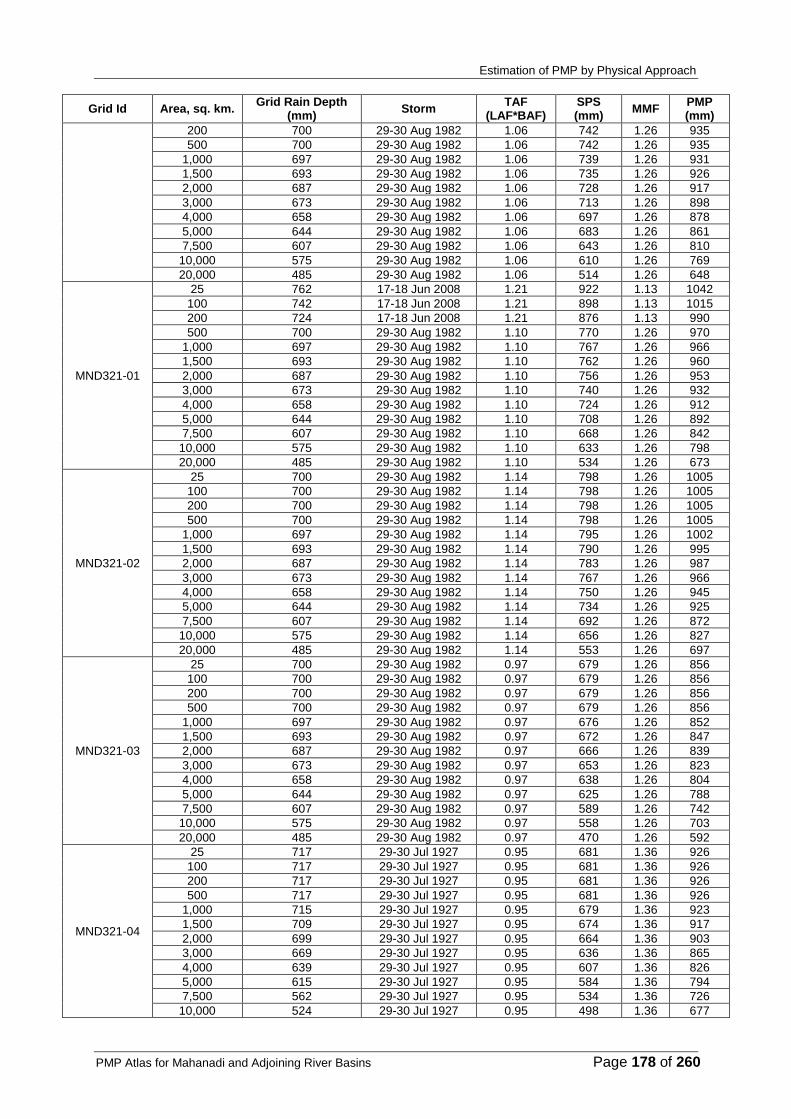
Estimation of PMP by Physical Approach
PMP Atlas for Mahanadi and Adjoining River Basins Page 178 of 260
Grid Id Area, sq. km. Grid Rain Depth
(mm) Storm
TAF (LAF*BAF)
SPS (mm)
MMF PMP (mm)
200 700 29-30 Aug 1982 1.06 742 1.26 935
500 700 29-30 Aug 1982 1.06 742 1.26 935
1,000 697 29-30 Aug 1982 1.06 739 1.26 931
1,500 693 29-30 Aug 1982 1.06 735 1.26 926
2,000 687 29-30 Aug 1982 1.06 728 1.26 917
3,000 673 29-30 Aug 1982 1.06 713 1.26 898
4,000 658 29-30 Aug 1982 1.06 697 1.26 878
5,000 644 29-30 Aug 1982 1.06 683 1.26 861
7,500 607 29-30 Aug 1982 1.06 643 1.26 810
10,000 575 29-30 Aug 1982 1.06 610 1.26 769
20,000 485 29-30 Aug 1982 1.06 514 1.26 648
MND321-01
25 762 17-18 Jun 2008 1.21 922 1.13 1042
100 742 17-18 Jun 2008 1.21 898 1.13 1015
200 724 17-18 Jun 2008 1.21 876 1.13 990
500 700 29-30 Aug 1982 1.10 770 1.26 970
1,000 697 29-30 Aug 1982 1.10 767 1.26 966
1,500 693 29-30 Aug 1982 1.10 762 1.26 960
2,000 687 29-30 Aug 1982 1.10 756 1.26 953
3,000 673 29-30 Aug 1982 1.10 740 1.26 932
4,000 658 29-30 Aug 1982 1.10 724 1.26 912
5,000 644 29-30 Aug 1982 1.10 708 1.26 892
7,500 607 29-30 Aug 1982 1.10 668 1.26 842
10,000 575 29-30 Aug 1982 1.10 633 1.26 798
20,000 485 29-30 Aug 1982 1.10 534 1.26 673
MND321-02
25 700 29-30 Aug 1982 1.14 798 1.26 1005
100 700 29-30 Aug 1982 1.14 798 1.26 1005
200 700 29-30 Aug 1982 1.14 798 1.26 1005
500 700 29-30 Aug 1982 1.14 798 1.26 1005
1,000 697 29-30 Aug 1982 1.14 795 1.26 1002
1,500 693 29-30 Aug 1982 1.14 790 1.26 995
2,000 687 29-30 Aug 1982 1.14 783 1.26 987
3,000 673 29-30 Aug 1982 1.14 767 1.26 966
4,000 658 29-30 Aug 1982 1.14 750 1.26 945
5,000 644 29-30 Aug 1982 1.14 734 1.26 925
7,500 607 29-30 Aug 1982 1.14 692 1.26 872
10,000 575 29-30 Aug 1982 1.14 656 1.26 827
20,000 485 29-30 Aug 1982 1.14 553 1.26 697
MND321-03
25 700 29-30 Aug 1982 0.97 679 1.26 856
100 700 29-30 Aug 1982 0.97 679 1.26 856
200 700 29-30 Aug 1982 0.97 679 1.26 856
500 700 29-30 Aug 1982 0.97 679 1.26 856
1,000 697 29-30 Aug 1982 0.97 676 1.26 852
1,500 693 29-30 Aug 1982 0.97 672 1.26 847
2,000 687 29-30 Aug 1982 0.97 666 1.26 839
3,000 673 29-30 Aug 1982 0.97 653 1.26 823
4,000 658 29-30 Aug 1982 0.97 638 1.26 804
5,000 644 29-30 Aug 1982 0.97 625 1.26 788
7,500 607 29-30 Aug 1982 0.97 589 1.26 742
10,000 575 29-30 Aug 1982 0.97 558 1.26 703
20,000 485 29-30 Aug 1982 0.97 470 1.26 592
MND321-04
25 717 29-30 Jul 1927 0.95 681 1.36 926
100 717 29-30 Jul 1927 0.95 681 1.36 926
200 717 29-30 Jul 1927 0.95 681 1.36 926
500 717 29-30 Jul 1927 0.95 681 1.36 926
1,000 715 29-30 Jul 1927 0.95 679 1.36 923
1,500 709 29-30 Jul 1927 0.95 674 1.36 917
2,000 699 29-30 Jul 1927 0.95 664 1.36 903
3,000 669 29-30 Jul 1927 0.95 636 1.36 865
4,000 639 29-30 Jul 1927 0.95 607 1.36 826
5,000 615 29-30 Jul 1927 0.95 584 1.36 794
7,500 562 29-30 Jul 1927 0.95 534 1.36 726
10,000 524 29-30 Jul 1927 0.95 498 1.36 677

Estimation of PMP by Physical Approach
PMP Atlas for Mahanadi and Adjoining River Basins Page 179 of 260
Grid Id Area, sq. km. Grid Rain Depth
(mm) Storm
TAF (LAF*BAF)
SPS (mm)
MMF PMP (mm)
20,000 431 29-30 Jul 1927 0.95 409 1.36 556
MND321-05
25 717 29-30 Jul 1927 0.83 595 1.36 809
100 717 29-30 Jul 1927 0.83 595 1.36 809
200 717 29-30 Jul 1927 0.83 595 1.36 809
500 717 29-30 Jul 1927 0.83 595 1.36 809
1,000 715 29-30 Jul 1927 0.83 593 1.36 806
1,500 709 29-30 Jul 1927 0.83 588 1.36 800
2,000 699 29-30 Jul 1927 0.83 580 1.36 789
3,000 673 29-30 Aug 1982 0.79 532 1.26 670
4,000 658 29-30 Aug 1982 0.79 520 1.26 655
5,000 644 29-30 Aug 1982 0.79 509 1.26 641
7,500 607 29-30 Aug 1982 0.79 480 1.26 605
10,000 575 29-30 Aug 1982 0.79 454 1.26 572
20,000 485 29-30 Aug 1982 0.79 383 1.26 483
MND321-06
25 717 29-30 Jul 1927 0.93 667 1.36 907
100 717 29-30 Jul 1927 0.93 667 1.36 907
200 717 29-30 Jul 1927 0.93 667 1.36 907
500 717 29-30 Jul 1927 0.93 667 1.36 907
1,000 715 29-30 Jul 1927 0.93 665 1.36 904
1,500 709 29-30 Jul 1927 0.93 659 1.36 896
2,000 699 29-30 Jul 1927 0.93 650 1.36 884
3,000 669 29-30 Jul 1927 0.93 622 1.36 846
4,000 639 29-30 Jul 1927 0.93 594 1.36 808
5,000 615 29-30 Jul 1927 0.93 572 1.36 778
7,500 562 29-30 Jul 1927 0.93 523 1.36 711
10,000 524 29-30 Jul 1927 0.93 487 1.36 662
20,000 431 29-30 Jul 1927 0.93 401 1.36 545
MND322-01
25 717 29-30 Jul 1927 0.94 674 1.36 917
100 717 29-30 Jul 1927 0.94 674 1.36 917
200 717 29-30 Jul 1927 0.94 674 1.36 917
500 717 29-30 Jul 1927 0.94 674 1.36 917
1,000 715 29-30 Jul 1927 0.94 672 1.36 914
1,500 709 29-30 Jul 1927 0.94 666 1.36 906
2,000 699 29-30 Jul 1927 0.94 657 1.36 894
3,000 669 29-30 Jul 1927 0.94 629 1.36 855
4,000 639 29-30 Jul 1927 0.94 601 1.36 817
5,000 615 29-30 Jul 1927 0.94 578 1.36 786
7,500 562 29-30 Jul 1927 0.94 528 1.36 718
10,000 524 29-30 Jul 1927 0.94 493 1.36 670
20,000 431 29-30 Jul 1927 0.94 405 1.36 551
MND322-02
25 717 29-30 Jul 1927 0.98 703 1.36 956
100 717 29-30 Jul 1927 0.98 703 1.36 956
200 717 29-30 Jul 1927 0.98 703 1.36 956
500 717 29-30 Jul 1927 0.98 703 1.36 956
1,000 715 29-30 Jul 1927 0.98 701 1.36 953
1,500 709 29-30 Jul 1927 0.98 695 1.36 945
2,000 699 29-30 Jul 1927 0.98 685 1.36 932
3,000 669 29-30 Jul 1927 0.98 656 1.36 892
4,000 639 29-30 Jul 1927 0.98 626 1.36 851
5,000 615 29-30 Jul 1927 0.98 603 1.36 820
7,500 562 29-30 Jul 1927 0.98 551 1.36 749
10,000 524 29-30 Jul 1927 0.98 514 1.36 699
20,000 431 29-30 Jul 1927 0.98 422 1.36 574
MND322-03
25 717 29-30 Jul 1927 1.04 746 1.36 1015
100 717 29-30 Jul 1927 1.04 746 1.36 1015
200 717 29-30 Jul 1927 1.04 746 1.36 1015
500 717 29-30 Jul 1927 1.04 746 1.36 1015
1,000 715 29-30 Jul 1927 1.04 744 1.36 1012
1,500 709 29-30 Jul 1927 1.04 737 1.36 1002
2,000 699 29-30 Jul 1927 1.04 727 1.36 989
3,000 669 29-30 Jul 1927 1.04 696 1.36 947
4,000 639 29-30 Jul 1927 1.04 665 1.36 904

Estimation of PMP by Physical Approach
PMP Atlas for Mahanadi and Adjoining River Basins Page 180 of 260
Grid Id Area, sq. km. Grid Rain Depth
(mm) Storm
TAF (LAF*BAF)
SPS (mm)
MMF PMP (mm)
5,000 615 29-30 Jul 1927 1.04 640 1.36 870
7,500 562 29-30 Jul 1927 1.04 584 1.36 794
10,000 524 29-30 Jul 1927 1.04 545 1.36 741
20,000 431 29-30 Jul 1927 1.04 448 1.36 609
Table 3-34: 3-day contributing storm, grid rain depth, TAF, SPS, MMF and PMP estimates at various grid points located in Mahanadi and Adjoining River Basins
Grid Id Area, sq.
km. Grid Rain
Depth (mm) Storm
TAF (LAF*BAF)
SPS (mm)
MMF PMP (mm)
MND318-01
25 905 13-15 Jun 2001 1.26 1140 1.23 1402
100 861 13-15 Jun 2001 1.26 1085 1.23 1335
200 839 13-15 Jun 2001 1.26 1057 1.23 1300
500 786 13-15 Jun 2001 1.26 990 1.23 1218
1,000 726 13-15 Jun 2001 1.26 915 1.23 1125
1,500 680 13-15 Jun 2001 1.26 857 1.23 1054
2,000 644 13-15 Jun 2001 1.26 811 1.23 998
3,000 602 13-15 Jun 2001 1.26 759 1.23 934
4,000 576 13-15 Jun 2001 1.26 726 1.23 893
5,000 562 13-15 Jun 2001 1.26 708 1.23 871
7,500 543 13-15 Jun 2001 1.26 684 1.23 841
10,000 535 13-15 Jun 2001 1.26 674 1.23 829
20,000 497 13-15 Jun 2001 1.26 626 1.23 770
MND318-02
25 890 28-30 Aug 1982 1.09 970 1.26 1222
100 878 28-30 Aug 1982 1.09 957 1.26 1206
200 868 28-30 Aug 1982 1.09 946 1.26 1192
500 846 28-30 Aug 1982 1.09 922 1.26 1162
1,000 825 28-30 Aug 1982 1.09 899 1.26 1133
1,500 809 28-30 Aug 1982 1.09 882 1.26 1111
2,000 798 28-30 Aug 1982 1.09 870 1.26 1096
3,000 782 28-30 Aug 1982 1.09 852 1.26 1074
4,000 767 28-30 Aug 1982 1.09 836 1.26 1053
5,000 749 28-30 Aug 1982 1.09 816 1.26 1028
7,500 703 28-30 Aug 1982 1.09 766 1.26 965
10,000 666 28-30 Aug 1982 1.09 726 1.26 915
20,000 547 28-30 Aug 1982 1.09 596 1.26 751
MND318-03
25 890 28-30 Aug 1982 1.15 1024 1.26 1290
100 878 28-30 Aug 1982 1.15 1010 1.26 1273
200 868 28-30 Aug 1982 1.15 998 1.26 1257
500 846 28-30 Aug 1982 1.15 973 1.26 1226
1,000 825 28-30 Aug 1982 1.15 949 1.26 1196
1,500 809 28-30 Aug 1982 1.15 930 1.26 1172
2,000 798 28-30 Aug 1982 1.15 918 1.26 1157
3,000 782 28-30 Aug 1982 1.15 899 1.26 1133
4,000 767 28-30 Aug 1982 1.15 882 1.26 1111
5,000 749 28-30 Aug 1982 1.15 861 1.26 1085
7,500 703 28-30 Aug 1982 1.15 808 1.26 1018
10,000 666 28-30 Aug 1982 1.15 766 1.26 965
20,000 547 28-30 Aug 1982 1.15 629 1.26 793
MND319-01
25 890 28-30 Aug 1982 0.85 757 1.26 954
100 878 28-30 Aug 1982 0.85 746 1.26 940
200 868 28-30 Aug 1982 0.85 738 1.26 930
500 846 28-30 Aug 1982 0.85 719 1.26 906
1,000 825 28-30 Aug 1982 0.85 701 1.26 883
1,500 809 28-30 Aug 1982 0.85 688 1.26 867
2,000 798 28-30 Aug 1982 0.85 678 1.26 854
3,000 782 28-30 Aug 1982 0.85 665 1.26 838
4,000 767 28-30 Aug 1982 0.85 652 1.26 822
5,000 749 28-30 Aug 1982 0.85 637 1.26 803
7,500 703 28-30 Aug 1982 0.85 598 1.26 753
10,000 666 28-30 Aug 1982 0.85 566 1.26 713
20,000 547 28-30 Aug 1982 0.85 465 1.26 586

Estimation of PMP by Physical Approach
PMP Atlas for Mahanadi and Adjoining River Basins Page 181 of 260
Grid Id Area, sq.
km. Grid Rain
Depth (mm) Storm
TAF (LAF*BAF)
SPS (mm)
MMF PMP (mm)
MND319-02
25 819 19-21 Sep 1926 1.06 868 1.13 981
100 819 19-21 Sep 1926 1.06 868 1.13 981
200 819 19-21 Sep 1926 1.06 868 1.13 981
500 817 19-21 Sep 1926 1.06 866 1.13 979
1,000 815 19-21 Sep 1926 1.06 864 1.13 976
1,500 810 19-21 Sep 1926 1.06 859 1.13 971
2,000 807 19-21 Sep 1926 1.06 855 1.13 966
3,000 796 19-21 Sep 1926 1.06 844 1.13 954
4,000 782 19-21 Sep 1926 1.06 829 1.13 937
5,000 769 19-21 Sep 1926 1.06 815 1.13 921
7,500 740 19-21 Sep 1926 1.06 784 1.13 886
10,000 713 19-21 Sep 1926 1.06 756 1.13 854
20,000 630 19-21 Sep 1926 1.06 668 1.13 755
MND319-03
25 890 28-30 Aug 1982 0.90 801 1.26 1009
100 878 28-30 Aug 1982 0.90 790 1.26 995
200 868 28-30 Aug 1982 0.90 781 1.26 984
500 846 28-30 Aug 1982 0.90 761 1.26 959
1,000 825 28-30 Aug 1982 0.90 743 1.26 936
1,500 809 28-30 Aug 1982 0.90 728 1.26 917
2,000 798 28-30 Aug 1982 0.90 718 1.26 905
3,000 782 28-30 Aug 1982 0.90 704 1.26 887
4,000 767 28-30 Aug 1982 0.90 690 1.26 869
5,000 749 28-30 Aug 1982 0.90 674 1.26 849
7,500 703 28-30 Aug 1982 0.90 633 1.26 798
10,000 666 28-30 Aug 1982 0.90 599 1.26 755
20,000 547 28-30 Aug 1982 0.90 492 1.26 620
MND319-04
25 890 28-30 Aug 1982 0.89 792 1.26 998
100 878 28-30 Aug 1982 0.89 781 1.26 984
200 868 28-30 Aug 1982 0.89 773 1.26 974
500 846 28-30 Aug 1982 0.89 753 1.26 949
1,000 825 28-30 Aug 1982 0.89 734 1.26 925
1,500 809 28-30 Aug 1982 0.89 720 1.26 907
2,000 798 28-30 Aug 1982 0.89 710 1.26 895
3,000 782 28-30 Aug 1982 0.89 696 1.26 877
4,000 767 28-30 Aug 1982 0.89 683 1.26 861
5,000 749 28-30 Aug 1982 0.89 667 1.26 840
7,500 703 28-30 Aug 1982 0.89 626 1.26 789
10,000 666 28-30 Aug 1982 0.89 593 1.26 747
20,000 547 28-30 Aug 1982 0.89 487 1.26 614
MND319-05
25 890 28-30 Aug 1982 0.92 819 1.26 1032
100 878 28-30 Aug 1982 0.92 808 1.26 1018
200 868 28-30 Aug 1982 0.92 799 1.26 1007
500 846 28-30 Aug 1982 0.92 778 1.26 980
1,000 825 28-30 Aug 1982 0.92 759 1.26 956
1,500 809 28-30 Aug 1982 0.92 744 1.26 937
2,000 798 28-30 Aug 1982 0.92 734 1.26 925
3,000 782 28-30 Aug 1982 0.92 719 1.26 906
4,000 767 28-30 Aug 1982 0.92 706 1.26 890
5,000 749 28-30 Aug 1982 0.92 689 1.26 868
7,500 703 28-30 Aug 1982 0.92 647 1.26 815
10,000 666 28-30 Aug 1982 0.92 613 1.26 772
20,000 547 28-30 Aug 1982 0.92 503 1.26 634
MND319-06
25 890 28-30 Aug 1982 0.95 846 1.26 1066
100 878 28-30 Aug 1982 0.95 834 1.26 1051
200 868 28-30 Aug 1982 0.95 825 1.26 1040
500 846 28-30 Aug 1982 0.95 804 1.26 1013
1,000 825 28-30 Aug 1982 0.95 784 1.26 988
1,500 809 28-30 Aug 1982 0.95 769 1.26 969
2,000 798 28-30 Aug 1982 0.95 758 1.26 955
3,000 782 28-30 Aug 1982 0.95 743 1.26 936
4,000 767 28-30 Aug 1982 0.95 729 1.26 919
5,000 749 28-30 Aug 1982 0.95 712 1.26 897

Estimation of PMP by Physical Approach
PMP Atlas for Mahanadi and Adjoining River Basins Page 182 of 260
Grid Id Area, sq.
km. Grid Rain
Depth (mm) Storm
TAF (LAF*BAF)
SPS (mm)
MMF PMP (mm)
7,500 703 28-30 Aug 1982 0.95 668 1.26 842
10,000 666 28-30 Aug 1982 0.95 633 1.26 798
20,000 547 28-30 Aug 1982 0.95 520 1.26 655
MND320-01
25 890 28-30 Aug 1982 0.99 881 1.26 1110
100 878 28-30 Aug 1982 0.99 869 1.26 1095
200 868 28-30 Aug 1982 0.99 859 1.26 1082
500 846 28-30 Aug 1982 0.99 838 1.26 1056
1,000 825 28-30 Aug 1982 0.99 817 1.26 1029
1,500 809 28-30 Aug 1982 0.99 801 1.26 1009
2,000 798 28-30 Aug 1982 0.99 790 1.26 995
3,000 782 28-30 Aug 1982 0.99 774 1.26 975
4,000 767 28-30 Aug 1982 0.99 759 1.26 956
5,000 749 28-30 Aug 1982 0.99 742 1.26 935
7,500 703 28-30 Aug 1982 0.99 696 1.26 877
10,000 666 28-30 Aug 1982 0.99 659 1.26 830
20,000 547 28-30 Aug 1982 0.99 542 1.26 683
MND320-02
25 890 28-30 Aug 1982 0.96 854 1.26 1076
100 878 28-30 Aug 1982 0.96 843 1.26 1062
200 868 28-30 Aug 1982 0.96 833 1.26 1050
500 846 28-30 Aug 1982 0.96 812 1.26 1023
1,000 825 28-30 Aug 1982 0.96 792 1.26 998
1,500 809 28-30 Aug 1982 0.96 777 1.26 979
2,000 798 28-30 Aug 1982 0.96 766 1.26 965
3,000 782 28-30 Aug 1982 0.96 751 1.26 946
4,000 767 28-30 Aug 1982 0.96 736 1.26 927
5,000 749 28-30 Aug 1982 0.96 719 1.26 906
7,500 703 28-30 Aug 1982 0.96 675 1.26 851
10,000 666 28-30 Aug 1982 0.96 639 1.26 805
20,000 547 28-30 Aug 1982 0.96 525 1.26 662
MND320-03
25 890 28-30 Aug 1982 1.15 1024 1.26 1290
100 878 28-30 Aug 1982 1.15 1010 1.26 1273
200 868 28-30 Aug 1982 1.15 998 1.26 1257
500 846 28-30 Aug 1982 1.15 973 1.26 1226
1,000 825 28-30 Aug 1982 1.15 949 1.26 1196
1,500 809 28-30 Aug 1982 1.15 930 1.26 1172
2,000 798 28-30 Aug 1982 1.15 918 1.26 1157
3,000 782 28-30 Aug 1982 1.15 899 1.26 1133
4,000 767 28-30 Aug 1982 1.15 882 1.26 1111
5,000 749 28-30 Aug 1982 1.15 861 1.26 1085
7,500 703 28-30 Aug 1982 1.15 808 1.26 1018
10,000 666 28-30 Aug 1982 1.15 766 1.26 965
20,000 547 28-30 Aug 1982 1.15 629 1.26 793
MND320-04
25 890 28-30 Aug 1982 0.97 863 1.26 1087
100 878 28-30 Aug 1982 0.97 852 1.26 1074
200 868 28-30 Aug 1982 0.97 842 1.26 1061
500 846 28-30 Aug 1982 0.97 821 1.26 1034
1,000 825 28-30 Aug 1982 0.97 800 1.26 1008
1,500 809 28-30 Aug 1982 0.97 785 1.26 989
2,000 798 28-30 Aug 1982 0.97 774 1.26 975
3,000 782 28-30 Aug 1982 0.97 759 1.26 956
4,000 767 28-30 Aug 1982 0.97 744 1.26 937
5,000 749 28-30 Aug 1982 0.97 727 1.26 916
7,500 703 28-30 Aug 1982 0.97 682 1.26 859
10,000 666 28-30 Aug 1982 0.97 646 1.26 814
20,000 547 28-30 Aug 1982 0.97 531 1.26 669
MND320-05
25 890 28-30 Aug 1982 1.06 943 1.26 1188
100 878 28-30 Aug 1982 1.06 931 1.26 1173
200 868 28-30 Aug 1982 1.06 920 1.26 1159
500 846 28-30 Aug 1982 1.06 897 1.26 1130
1,000 825 28-30 Aug 1982 1.06 875 1.26 1103
1,500 809 28-30 Aug 1982 1.06 858 1.26 1081
2,000 798 28-30 Aug 1982 1.06 846 1.26 1066

Estimation of PMP by Physical Approach
PMP Atlas for Mahanadi and Adjoining River Basins Page 183 of 260
Grid Id Area, sq.
km. Grid Rain
Depth (mm) Storm
TAF (LAF*BAF)
SPS (mm)
MMF PMP (mm)
3,000 782 28-30 Aug 1982 1.06 829 1.26 1045
4,000 767 28-30 Aug 1982 1.06 813 1.26 1024
5,000 749 28-30 Aug 1982 1.06 794 1.26 1000
7,500 703 28-30 Aug 1982 1.06 745 1.26 939
10,000 666 28-30 Aug 1982 1.06 706 1.26 890
20,000 547 28-30 Aug 1982 1.06 580 1.26 731
MND321-01
25 890 28-30 Aug 1982 1.10 979 1.26 1234
100 878 28-30 Aug 1982 1.10 966 1.26 1217
200 868 28-30 Aug 1982 1.10 955 1.26 1203
500 846 28-30 Aug 1982 1.10 931 1.26 1173
1,000 825 28-30 Aug 1982 1.10 908 1.26 1144
1,500 809 28-30 Aug 1982 1.10 890 1.26 1121
2,000 798 28-30 Aug 1982 1.10 878 1.26 1106
3,000 782 28-30 Aug 1982 1.10 860 1.26 1084
4,000 767 28-30 Aug 1982 1.10 844 1.26 1063
5,000 749 28-30 Aug 1982 1.10 824 1.26 1038
7,500 703 28-30 Aug 1982 1.10 773 1.26 974
10,000 666 28-30 Aug 1982 1.10 733 1.26 924
20,000 547 28-30 Aug 1982 1.10 602 1.26 759
MND321-02
25 890 28-30 Aug 1982 1.14 1015 1.26 1279
100 878 28-30 Aug 1982 1.14 1001 1.26 1261
200 868 28-30 Aug 1982 1.14 990 1.26 1247
500 846 28-30 Aug 1982 1.14 964 1.26 1215
1,000 825 28-30 Aug 1982 1.14 941 1.26 1186
1,500 809 28-30 Aug 1982 1.14 922 1.26 1162
2,000 798 28-30 Aug 1982 1.14 910 1.26 1147
3,000 782 28-30 Aug 1982 1.14 891 1.26 1123
4,000 767 28-30 Aug 1982 1.14 874 1.26 1101
5,000 749 28-30 Aug 1982 1.14 854 1.26 1076
7,500 703 28-30 Aug 1982 1.14 801 1.26 1009
10,000 666 28-30 Aug 1982 1.14 759 1.26 956
20,000 547 28-30 Aug 1982 1.14 624 1.26 786
MND321-03
25 890 28-30 Aug 1982 0.97 863 1.26 1087
100 878 28-30 Aug 1982 0.97 852 1.26 1074
200 868 28-30 Aug 1982 0.97 842 1.26 1061
500 846 28-30 Aug 1982 0.97 821 1.26 1034
1,000 825 28-30 Aug 1982 0.97 800 1.26 1008
1,500 809 28-30 Aug 1982 0.97 785 1.26 989
2,000 798 28-30 Aug 1982 0.97 774 1.26 975
3,000 782 28-30 Aug 1982 0.97 759 1.26 956
4,000 767 28-30 Aug 1982 0.97 744 1.26 937
5,000 749 28-30 Aug 1982 0.97 727 1.26 916
7,500 703 28-30 Aug 1982 0.97 682 1.26 859
10,000 666 28-30 Aug 1982 0.97 646 1.26 814
20,000 547 28-30 Aug 1982 0.97 531 1.26 669
MND321-04
25 745 28-30 Jul 1927 0.95 708 1.36 963
100 744 28-30 Jul 1927 0.95 707 1.36 962
200 744 28-30 Jul 1927 0.95 707 1.36 962
500 741 28-30 Jul 1927 0.95 704 1.36 957
1,000 735 28-30 Jul 1927 0.95 698 1.36 949
1,500 728 28-30 Jul 1927 0.95 692 1.36 941
2,000 719 28-30 Jul 1927 0.95 683 1.36 929
3,000 696 28-30 Jul 1927 0.95 661 1.36 899
4,000 671 28-30 Jul 1927 0.95 637 1.36 866
5,000 645 28-30 Jul 1927 0.95 613 1.36 834
7,500 593 28-30 Jul 1927 0.95 563 1.36 766
10,000 579 29-31 Oct 1999 0.87 504 1.35 680
20,000 486 29-31 Oct 1999 0.87 423 1.35 571
MND321-05
25 890 28-30 Aug 1982 0.79 703 1.26 886
100 878 28-30 Aug 1982 0.79 694 1.26 874
200 868 28-30 Aug 1982 0.79 686 1.26 864
500 846 28-30 Aug 1982 0.79 668 1.26 842
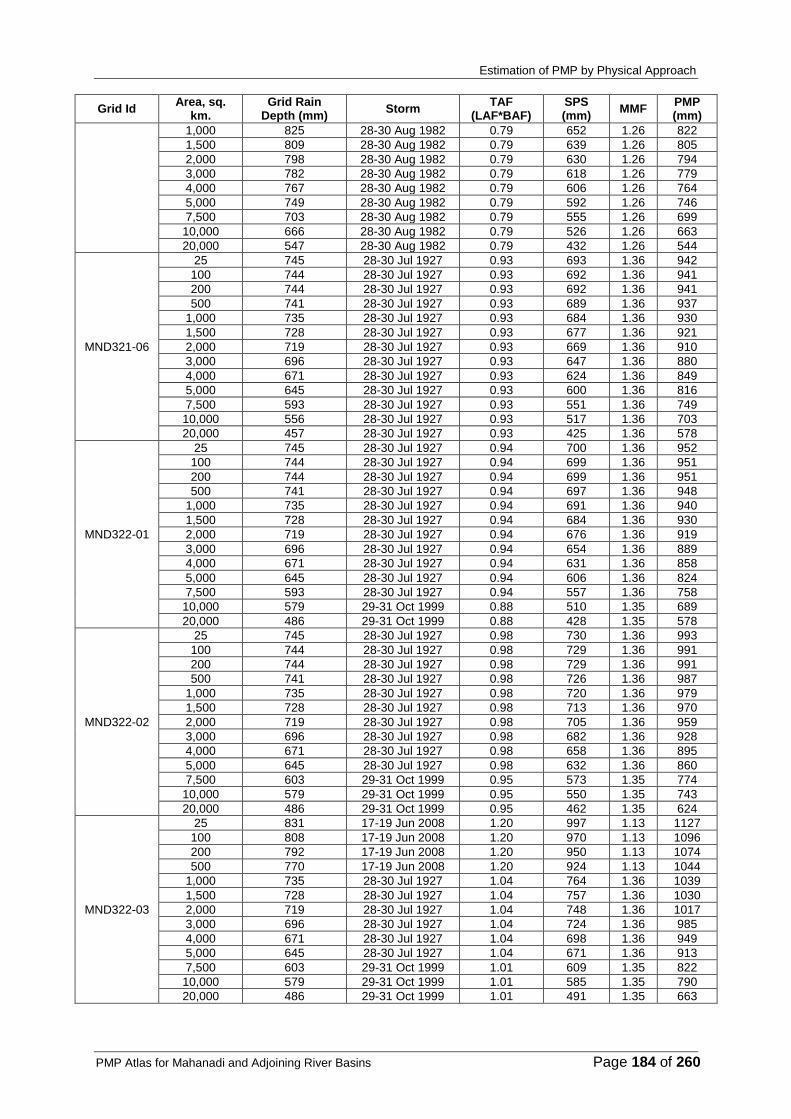
Estimation of PMP by Physical Approach
PMP Atlas for Mahanadi and Adjoining River Basins Page 184 of 260
Grid Id Area, sq.
km. Grid Rain
Depth (mm) Storm
TAF (LAF*BAF)
SPS (mm)
MMF PMP (mm)
1,000 825 28-30 Aug 1982 0.79 652 1.26 822
1,500 809 28-30 Aug 1982 0.79 639 1.26 805
2,000 798 28-30 Aug 1982 0.79 630 1.26 794
3,000 782 28-30 Aug 1982 0.79 618 1.26 779
4,000 767 28-30 Aug 1982 0.79 606 1.26 764
5,000 749 28-30 Aug 1982 0.79 592 1.26 746
7,500 703 28-30 Aug 1982 0.79 555 1.26 699
10,000 666 28-30 Aug 1982 0.79 526 1.26 663
20,000 547 28-30 Aug 1982 0.79 432 1.26 544
MND321-06
25 745 28-30 Jul 1927 0.93 693 1.36 942
100 744 28-30 Jul 1927 0.93 692 1.36 941
200 744 28-30 Jul 1927 0.93 692 1.36 941
500 741 28-30 Jul 1927 0.93 689 1.36 937
1,000 735 28-30 Jul 1927 0.93 684 1.36 930
1,500 728 28-30 Jul 1927 0.93 677 1.36 921
2,000 719 28-30 Jul 1927 0.93 669 1.36 910
3,000 696 28-30 Jul 1927 0.93 647 1.36 880
4,000 671 28-30 Jul 1927 0.93 624 1.36 849
5,000 645 28-30 Jul 1927 0.93 600 1.36 816
7,500 593 28-30 Jul 1927 0.93 551 1.36 749
10,000 556 28-30 Jul 1927 0.93 517 1.36 703
20,000 457 28-30 Jul 1927 0.93 425 1.36 578
MND322-01
25 745 28-30 Jul 1927 0.94 700 1.36 952
100 744 28-30 Jul 1927 0.94 699 1.36 951
200 744 28-30 Jul 1927 0.94 699 1.36 951
500 741 28-30 Jul 1927 0.94 697 1.36 948
1,000 735 28-30 Jul 1927 0.94 691 1.36 940
1,500 728 28-30 Jul 1927 0.94 684 1.36 930
2,000 719 28-30 Jul 1927 0.94 676 1.36 919
3,000 696 28-30 Jul 1927 0.94 654 1.36 889
4,000 671 28-30 Jul 1927 0.94 631 1.36 858
5,000 645 28-30 Jul 1927 0.94 606 1.36 824
7,500 593 28-30 Jul 1927 0.94 557 1.36 758
10,000 579 29-31 Oct 1999 0.88 510 1.35 689
20,000 486 29-31 Oct 1999 0.88 428 1.35 578
MND322-02
25 745 28-30 Jul 1927 0.98 730 1.36 993
100 744 28-30 Jul 1927 0.98 729 1.36 991
200 744 28-30 Jul 1927 0.98 729 1.36 991
500 741 28-30 Jul 1927 0.98 726 1.36 987
1,000 735 28-30 Jul 1927 0.98 720 1.36 979
1,500 728 28-30 Jul 1927 0.98 713 1.36 970
2,000 719 28-30 Jul 1927 0.98 705 1.36 959
3,000 696 28-30 Jul 1927 0.98 682 1.36 928
4,000 671 28-30 Jul 1927 0.98 658 1.36 895
5,000 645 28-30 Jul 1927 0.98 632 1.36 860
7,500 603 29-31 Oct 1999 0.95 573 1.35 774
10,000 579 29-31 Oct 1999 0.95 550 1.35 743
20,000 486 29-31 Oct 1999 0.95 462 1.35 624
MND322-03
25 831 17-19 Jun 2008 1.20 997 1.13 1127
100 808 17-19 Jun 2008 1.20 970 1.13 1096
200 792 17-19 Jun 2008 1.20 950 1.13 1074
500 770 17-19 Jun 2008 1.20 924 1.13 1044
1,000 735 28-30 Jul 1927 1.04 764 1.36 1039
1,500 728 28-30 Jul 1927 1.04 757 1.36 1030
2,000 719 28-30 Jul 1927 1.04 748 1.36 1017
3,000 696 28-30 Jul 1927 1.04 724 1.36 985
4,000 671 28-30 Jul 1927 1.04 698 1.36 949
5,000 645 28-30 Jul 1927 1.04 671 1.36 913
7,500 603 29-31 Oct 1999 1.01 609 1.35 822
10,000 579 29-31 Oct 1999 1.01 585 1.35 790
20,000 486 29-31 Oct 1999 1.01 491 1.35 663

Estimation of PMP by Physical Approach
PMP Atlas for Mahanadi and Adjoining River Basins Page 185 of 260
3.5 Time distribution analysis
The PMP estimates have been calculated for the durations of 1-day, 2-day and 3-day that are for 24-hr intervals. It is known that one of the most important factors affecting the peak flood discharge is the variability of rainfall in time. If rainfall has occurred uniformly over a period of say 24-hr, the value of the peak flood discharge will be much less than if the same rain occurs during 2 or 3 hours of 24-hour period. Therefore, to compute flood runoff, it becomes necessary to know what proportion of 24-hr rain usually fell in the heaviest 2-hr, in the heaviest 3-hr and so forth. It is also necessary to know whether this proportion varies with the magnitude of 24-hr rainfall. In fact, the 1-day, 2-day and 3-day PMP rainfalls need to be split into PMP rainfalls of short durations of say 2, 3, 4 hours called unit time intervals. The short duration storm rainfall values can be determined by applying the Time Distributions (TD) of rainfall obtained from the analysis of hourly rainfall data of some known major storms in the catchments under study. For an individual storm, the time distribution of rainfall is generally presented as a mass curve that shows the accumulated depth as a function of time. This section gives the estimates of average time distributions for range of storm durations in five catchments of Mahanadi and Adjoining River Basins using hourly rainfall data from SRRG stations.
SRRG station rainfall data, as described in Section 2.5.2, has been used in the TD analysis. Based on data availability, 12, 24, 48, and 72 hour TD analysis was carried out. Rain spells having 24-hour total rainfall of 60 mm or more were considered in the analysis. Similarly, rainspells having 12-hour, 48-hour, and 72-hour total rainfall values of 40 mm, 80 mm, and 100 mm or more have been used. An hourly rainfall data of each station in a particular catchment were first arranged in a chronological order. After this, the maximum hourly rainfall totals for each hour in considered durations (12, 24, 48, and 72 hours) were computed. The averages of hourly rainfalls were then obtained from number of stations in the respective catchment. These average values were further expressed as a percentage of total storm rainfall amount for duration considered (12, 24, 48, and 72 hours). Finally, percent values were adjusted to derive a smoothened TD curve for each catchment and duration considered (12, 24, 48, and 72 hours).
As described above the TD analysis was performed for 12-hour duration. Table 3-35 presents the catchment and station wise list of rain spells used in the analysis. The smoothened time distribution coefficients for entire Mahanadi and Adjoining River Basins and various catchments have been given in Table 3-36. The relevant smoothened TD curves are shown in Figure 3-35 to Figure 3-40. The hourly rainfall distribution for each of the considered rainspells, average rainfall distribution and average TD coefficients for various catchments are given in Table 5-1 to Table 5-5 in Annexure (at the end of this report).
For 24-hour duration, Table 3-37 presents the catchment and station wise list of rain spells used in the analysis. The smoothened time distribution coefficients for entire Mahanadi and Adjoining River Basins and various catchments have been given in Table 3-38. This table also gives the TD coefficients for rainspells less than 250 mm and more than 250 mm at entire Mahanadi and Adjoining River Basins level. The relevant smoothened TD curves are shown in Figure 3-41 to Figure 3-48. The hourly rainfall distribution for each of the considered rainspells, average rainfall distribution and average TD coefficients for various catchments are given in Table 5-6 to Table 5-11 in Annexure (at the end of this report).
As described above the TD analysis was performed for 48-hour duration. Table 3-39 presents the catchment and station wise list of rain spells used in the analysis. The smoothened time distribution coefficients for entire Mahanadi and Adjoining River Basins and various catchments have been given in Table 3-40. The relevant smoothened TD curves are shown in Figure 3-49 to Figure 3-54. The hourly rainfall distribution for each of the considered rainspells, average rainfall distribution and average TD coefficients for various catchments are given in Table 5-12 to Table 5-16 in Annexure (at the end of this report).

Estimation of PMP by Physical Approach
PMP Atlas for Mahanadi and Adjoining River Basins Page 186 of 260
For 72-hour duration, Table 3-41 presents the catchment and station wise list of rain spells used in the analysis. The smoothened time distribution coefficients for entire Mahanadi and Adjoining River Basins and various catchments have been given in Table 3-42. The relevant smoothened TD curves are shown in Figure 3-55 to Figure 3-60. The hourly rainfall distribution for each of the considered rainspells, average rainfall distribution and average TD coefficients for various catchments are given in Table 5-17 to Table 5-21 in Annexure (at the end of this report).
Table 3-35: List of rain spells used for time distribution analysis of 12-hour rainstorm
Catchment No. SRRG Station Dates of Rainspell (s) Maximum 12-hour
Rainfall (mm)
Commencement of Max. 12-hour
Rainspell (Hr. of Day)
318
Bhubaneshwar 10 May 1995 246.2 0600
Bhubaneshwar 20-21 Aug. 1997 203.1 1500
Gannavaram (A) 16 Oct. 1969 183.4 0500
Kakinada 22-23 Jul. 1989 245.5 1900
Kakinada 24 Sep. 1997 302.5 1300
Kalingpatnam 18 Jul. 1982 235 0600
Machilipatnam 16 Oct. 1969 221.2 0200
Machilipatnam 02-03 Nov. 1994 201.5 1700
Puri 27 Jul. 1991 177.1 0800
Puri 17 Aug. 1994 506.9 0800
319
Jharsuguda 02-03 Sep. 1973 165.2 2200
Jharsuguda 19 Aug. 1975 179.1 1200
Jharsuguda 06 Jul. 1987 126.7 0200
Jharsuguda 07-08 Jul. 1994 76.2 2300
Jharsuguda 21-22 Jun. 1996 80.6 2200
Kanker 01 Jul. 1970 176 0100
Kanker 17-18 Sep. 1980 147.4 2300
Kanker 29 Jul. 1991 176 0300
Raigarh 16-17 Aug. 1974 118.3 1600
320
Hirakud 30-31 Jul. 1969 101.8 1600
Hirakud 27 Jul. 1971 101.2 0400
Hirakud 08 Aug. 1971 113.4 0500
Jenapur 07-08 Aug. 1979 145.5 1400
Narsingpur 26-27 Jun. 1977 184.2 1400
Narsingpur 28-29 Aug. 1980 120.6 2100
Narsingpur 08-09 Sep. 1983 107.1 2000
Narsingpur 05-06 Aug. 1989 189.4 2300
Narsingpur 19 Aug. 2002 94.1 0100
321
Gondia 27 Aug. 1970 124.8 0500
Gondia 30 Aug. 1971 235.4 0100
Gondia 07-08 Jul. 1973 120.8 1400
Paradip Port 18 Oct. 1976 129.9 0600
Paradip Port 26 May 1989 201.1 0100
Paradip Port 15 Jun. 1993 141.2 0900
Paradip Port 20 Aug. 1997 224 1200
Paradip Port 29 Oct. 1999 370 1000
Talcher 12-13 Aug. 1976 183.2 2000
Telkoi 02 Sep. 1978 202.4 0100
322
Ghatsila 01 Sep. 1978 115.7 0800
Jamshedpur P.B.O. 29 Sep. 1974 162.1 0600
Jamshedpur P.B.O. 19 Aug. 1975 131.1 0700
Jamshedpur P.B.O. 28-29 Jul. 1976 85.3 1900
Jamshedpur P.B.O. 26-27 Jun. 1978 82 1500
Rajghat 04 Oct. 1978 105.4 0000
Rajghat 29-30 Jun. 1979 71.5 2300
Ranchi (A) 06 Jun. 1971 131.1 0200
Ranchi (A) 11 Jun. 1999 83.7 0600

Estimation of PMP by Physical Approach
PMP Atlas for Mahanadi and Adjoining River Basins Page 187 of 260
Table 3-36: Smoothened TD coefficients for entire Mahanadi and Adjoining River Basins and for different catchments for 12-hour rainspells
Sub-durations (hours) Catchment Wise Smoothened TD Coefficient All Rainspells
318 319 320 321 322 Entire Basin
1 22.5 22.1 18.1 24.7 22.5 22.3
2 36.9 37.8 29.9 39.0 38.1 36.7
3 48.9 48.0 40.6 50.8 49.5 47.9
4 59.0 56.9 49.2 59.7 58.6 57.4
5 66.8 63.6 56.6 66.5 67.5 64.8
6 73.0 69.8 63.1 73.2 75.2 71.0
7 78.9 75.5 69.6 79.4 80.3 76.8
8 84.0 80.8 76.0 84.4 85.0 82.0
9 88.8 86.0 82.0 89.2 89.5 87.1
10 93.1 91.0 88.0 93.3 93.5 91.6
11 96.7 95.7 94.0 96.7 96.8 96.0
12 100.0 100.0 100.0 100.0 100.0 100.0
Figure 3-35: Smoothened time distribution curve (12-hour) for Catchment-318
Figure 3-36: Smoothened time distribution curve (12-hour) for Catchment-319
0
20
40
60
80
100
0 3 6 9 12
Tim
e D
istr
ibu
tio
n C
oe
ffic
ien
t (%
)
Duration (Hours)
Smoothened Time Distribution Curve (12 hr): Catchment - 318
0
20
40
60
80
100
0 3 6 9 12
Tim
e D
istr
ibu
tio
n C
oe
ffic
ien
t (%
)
Duration (Hours)
Smoothened Time Distribution Curve (12 hr): Catchment - 319
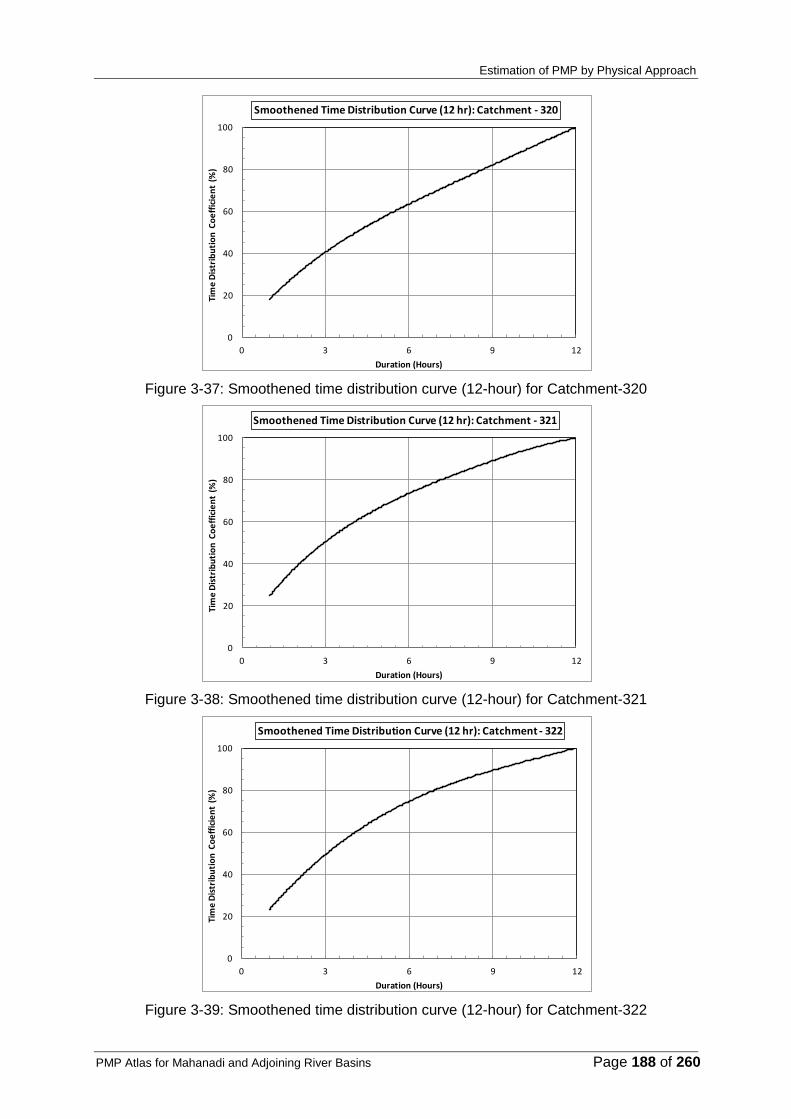
Estimation of PMP by Physical Approach
PMP Atlas for Mahanadi and Adjoining River Basins Page 188 of 260
Figure 3-37: Smoothened time distribution curve (12-hour) for Catchment-320
Figure 3-38: Smoothened time distribution curve (12-hour) for Catchment-321
Figure 3-39: Smoothened time distribution curve (12-hour) for Catchment-322
0
20
40
60
80
100
0 3 6 9 12
Tim
e D
istr
ibu
tio
n C
oe
ffic
ien
t (%
)
Duration (Hours)
Smoothened Time Distribution Curve (12 hr): Catchment - 320
0
20
40
60
80
100
0 3 6 9 12
Tim
e D
istr
ibu
tio
n C
oe
ffic
ien
t (%
)
Duration (Hours)
Smoothened Time Distribution Curve (12 hr): Catchment - 321
0
20
40
60
80
100
0 3 6 9 12
Tim
e D
istr
ibu
tio
n C
oe
ffic
ien
t (%
)
Duration (Hours)
Smoothened Time Distribution Curve (12 hr): Catchment - 322

Estimation of PMP by Physical Approach
PMP Atlas for Mahanadi and Adjoining River Basins Page 189 of 260
Figure 3-40: Smoothened time distribution curve (12-hour) for Mahanadi and Adjoining River Basins for all rainspells
Table 3-37: List of rain spells used for time distribution analysis of 24-hour rainstorm
Catchment SRRG Station Dates of rainspell
(s) Maximum 24
hour rainfall (mm) Commencement of Max. 24 hr
rainspell (Hr. of day)
318
Puri 28 Jul. 1991 244.6 0100
Puri 17 Aug. 1994 534.4 0100
Puri 15 May 1995 212.3 0100
Puri 12 Jun. 2001 266 0100
Kalingpatnam 18 Jul. 1982 259.2 0100
Vizg RSRW 16 Oct. 1982 294.2 0100
Vizg RSRW 11 Aug. 1986 223.5 0100
Gannavaram(A) 16 Oct. 1969 206.8 0100
Gannavaram(A) 01 Nov. 1994 150.2 0100
Machilipatnam 16 Oct. 1969 257.6 0100
Machilipatnam 01 Nov. 1994 207.6 0100
Machilipatnam 02 Nov. 1984 211.6 0100
Bhubaneshwar 10 May 1995 279.8 0100
Bhubaneshwar 20 Aug.1997 258.6 0100
Bhubaneshwar 04 Jul. 2001 208.9 0100
Kakinada 25 Nov. 1979 285.3 0100
Kakinada 09 May 1990 268.2 0100
Kakinada 10 May 1990 261.1 0100
Kakinada 24 Sep. 1997 409 0100
319
Kanker 01 Jul. 1970 179.2 0100
Kanker 07 Jul. 1973 157.8 0100
Kanker 18 Sep. 1980 189.3 0100
Kanker 29 Jul. 1991 165.4 0100
Kanker 17-18 Sep. 1980 235.4 0100
Jharsuguda 19 Aug. 1975 211.7 0100
Jharsuguda 19-20 Aug. 1975 212.6 0100
320
Jenapur 07 Aug. 1979 165.6 0100
Hirakud 08 Aug. 1971 156.4 0100
Hirakud 18-19 Aug. 1982 389.8 0100
Narsingpur 28 Aug. 1980 156.8 0100
0
20
40
60
80
100
0 3 6 9 12
Tim
e D
istr
ibu
tio
n C
oe
ffic
ien
t (%
)
Duration (Hours)
Smoothened Time Distribution Curve (12 hr): Mahanadi and Adjoining River Basins

Estimation of PMP by Physical Approach
PMP Atlas for Mahanadi and Adjoining River Basins Page 190 of 260
Catchment SRRG Station Dates of rainspell
(s) Maximum 24
hour rainfall (mm) Commencement of Max. 24 hr
rainspell (Hr. of day)
Narsingpur 06 Aug. 1989 177.6 0100
Narsingpur 19 Aug. 2002 183 0100
321
Gondia 30 Aug. 1971 251.4 0100
Paradip Port 11 Oct. 1973 190.7 0100
Paradip Port 08 Dec. 1973 161.1 0100
Paradip Port 26 May 1989 235.9 0100
Paradip Port 20 Aug. 1997 273.3 0100
Paradip Port 29 Oct. 1999 433.1 0100
Paradip Port 30 Oct.1999 292.9 0100
Talcher 12-13 Aug. 1976 236.3 0100
Telkoi 01-02 Sep. 1978 244.9 0100
Champua 18-19 Sep. 1980 210.4 0100
322 Ghatsila 01 Sep. 1978 157.2 0100
Table 3-38: Smoothened TD coefficients for entire Mahanadi and Adjoining River Basins and for different catchments for 24-hour rainspells (including rainspells having rainfall greater
than 250 mm and rainspells having rainfall less than 250 mm)
Sub-durations
(hours)
Catchment Wise Smoothened TD Coefficient (%)
Rainspells (< 250 mm)
Rainspells (> 250 mm)
All Rainspells
318 319 320 321 322 Entire Mahanadi and Adjoining River Basins
1 17.7 17.5 14.3 17.3 13.1 16.9 17.6 17.2
2 28.9 32.0 26.9 27.7 24.7 28.0 29.7 28.7
3 36.7 40.2 38.2 37.6 36.1 35.3 40.3 37.4
4 44.1 44.7 45.6 45.5 41.5 41.5 48.8 44.6
5 50.0 49.1 50.6 51.3 46.6 46.7 54.9 50.1
6 54.8 53.5 55.4 57.0 49.6 51.5 59.7 54.9
7 59.1 57.9 59.7 62.4 53.6 56.0 64.5 59.4
8 63.3 62.0 63.9 66.7 57.0 60.2 69.1 63.6
9 67.5 66.1 67.6 70.7 60.4 64.3 73.2 67.7
10 70.6 70.2 71.2 74.2 63.5 68.0 76.3 71.2
11 73.7 74.3 74.4 77.6 66.5 71.7 78.9 74.7
12 76.8 77.9 77.1 81.0 69.5 75.3 81.4 77.8
13 79.7 80.5 79.6 84.4 72.5 78.7 83.8 80.7
14 82.3 83.0 81.8 87.0 75.5 81.5 85.9 83.3
15 84.7 85.5 84.0 89.5 78.5 84.2 88.0 85.7
16 87.0 87.9 86.2 92.0 81.5 86.6 90.1 88.0
17 89.2 90.2 88.2 94.4 84.5 88.9 92.2 90.2
18 91.4 92.5 90.2 96.4 87.5 90.9 94.2 92.3
19 93.3 93.9 92.2 97.3 90.0 92.9 95.5 94.0
20 95.2 95.2 94.1 98.2 92.0 94.9 96.6 95.6
21 96.8 96.6 95.8 98.8 94.0 96.7 97.5 97.0
22 98.0 97.9 97.4 99.2 96.0 97.9 98.4 98.1
23 99.1 99.1 98.7 99.6 98.0 99.1 99.2 99.1
24 100.0 100.0 100.0 100.0 100.0 100.0 100.0 100.0
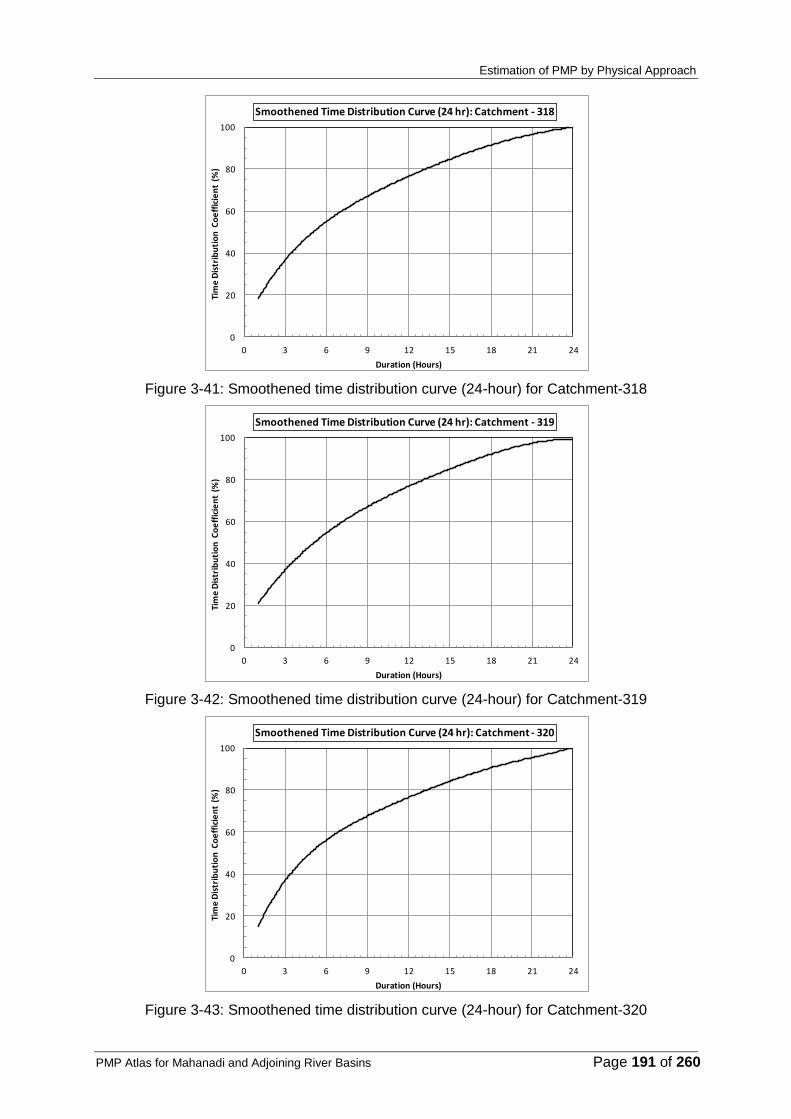
Estimation of PMP by Physical Approach
PMP Atlas for Mahanadi and Adjoining River Basins Page 191 of 260
Figure 3-41: Smoothened time distribution curve (24-hour) for Catchment-318
Figure 3-42: Smoothened time distribution curve (24-hour) for Catchment-319
Figure 3-43: Smoothened time distribution curve (24-hour) for Catchment-320
0
20
40
60
80
100
0 3 6 9 12 15 18 21 24
Tim
e D
istr
ibu
tio
n C
oe
ffic
ien
t (%
)
Duration (Hours)
Smoothened Time Distribution Curve (24 hr): Catchment - 318
0
20
40
60
80
100
0 3 6 9 12 15 18 21 24
Tim
e D
istr
ibu
tio
n C
oe
ffic
ien
t (%
)
Duration (Hours)
Smoothened Time Distribution Curve (24 hr): Catchment - 319
0
20
40
60
80
100
0 3 6 9 12 15 18 21 24
Tim
e D
istr
ibu
tio
n C
oe
ffic
ien
t (%
)
Duration (Hours)
Smoothened Time Distribution Curve (24 hr): Catchment - 320

Estimation of PMP by Physical Approach
PMP Atlas for Mahanadi and Adjoining River Basins Page 192 of 260
Figure 3-44: Smoothened time distribution curve (24-hour) for Catchment-321
Figure 3-45: Smoothened time distribution curve (24-hour) for Catchment-322
Figure 3-46: Smoothened time distribution curve (24-hour) for Mahanadi and Adjoining River Basins (Rainspells < 250 mm)
0
20
40
60
80
100
0 3 6 9 12 15 18 21 24
Tim
e D
istr
ibu
tio
n C
oe
ffic
ien
t (%
)
Duration (Hours)
Smoothened Time Distribution Curve (24 hr): Catchment - 321
0
20
40
60
80
100
0 3 6 9 12 15 18 21 24
Tim
e D
istr
ibu
tio
n C
oe
ffic
ien
t (%
)
Duration (Hours)
Smoothened Time Distribution Curve (24 hr): Catchment - 322
0
20
40
60
80
100
0 3 6 9 12 15 18 21 24
Tim
e D
istr
ibu
tio
n C
oe
ffic
ien
t (%
)
Duration (Hours)
Smoothened Time Distribution Curve (24 hr): Mahanadi and
Adjoining River Basins (Rainspells<250 mm)

Estimation of PMP by Physical Approach
PMP Atlas for Mahanadi and Adjoining River Basins Page 193 of 260
Figure 3-47: Smoothened time distribution curve (24-hour) for Mahanadi and Adjoining River Basins (Rainspells > 250 mm)
Figure 3-48: Smoothened time distribution curve (24-hour) for Mahanadi and Adjoining River Basins for all rainspells
Table 3-39: List of rain spells used for time distribution analysis of 48-hour rainstorm
Catchment SRRG Station Dates of rainspell (s) Maximum 48 hour
rainfall (mm)
Commencement of Max. 48 hr rainspell
(Hr. of day)
318
Bhubaneshwar 09-11 May 1995 380.2 1700
Gannavaram (A) 31 Oct. - 02 Nov. 1994 196.5 0800
Kakinada 08-10 May 1990 610.2 2200
Kakinada 23-25 Sep. 1997 473.2 2200
Machilipatnam 11-13 Aug. 1986 236.1 0400
Machilipatnam 01-03 Nov. 1994 436.7 0300
Puri 27-29 Jul. 1991 476.2 0600
Puri 14-16 May 1995 304.1 1200
Puri 29-30 Oct. 1999 320.8 0100
319
Jharsuguda 13-15 Aug. 1969 226.8 1200
Jharsuguda 26-28 Jul. 1971 181.9 0700
Jharsuguda 02-04 Sep. 1973 217 0400
0
20
40
60
80
100
0 3 6 9 12 15 18 21 24
Tim
e D
istr
ibu
tio
n C
oe
ffic
ien
t (%
)
Duration (Hours)
Smoothened Time Distribution Curve (24 hr) : Mahanadi and
Adjoining River Basins (Rainspells>250 mm)
0
20
40
60
80
100
0 3 6 9 12 15 18 21 24
Tim
e D
istr
ibu
tio
n C
oe
ffic
ien
t (%
)
Duration (Hours)
Smoothened Time Distribution Curve (24 hr) : Mahanadi and
Adjoining River Basins

Estimation of PMP by Physical Approach
PMP Atlas for Mahanadi and Adjoining River Basins Page 194 of 260
Catchment SRRG Station Dates of rainspell (s) Maximum 48 hour
rainfall (mm)
Commencement of Max. 48 hr rainspell
(Hr. of day)
Jharsuguda 05-07 Jul. 1987 171.2 0400
Jharsuguda 07-09 Jul. 1994 172.1 1200
Kanker 30 Jun. - 02 Jul. 1970 204.5 1000
Kanker 06-08 Jul. 1973 237.5 1000
Khijrawan 18-20 Jul. 1976 327.5 1200
Raigarh 16-18 Aug. 1974 174.3 0400
320
Hirakud 29-31 Jul. 1969 162.3 1900
Hirakud 25-27 Jul. 1971 191.5 2300
Narsingpur 25-27 Jun. 1977 305.8 0800
Narsingpur 07-09 Sep. 1983 280.8 1200
Narsingpur 17-19 Aug. 1984 181.8 0100
Narsingpur 19-20 Aug. 2002 239.6 0100
321
Gondia 01- 02 Jul. 1970 199.2 0000
Gondia 26-28 Aug. 1970 201.8 1600
Gondia 07-09 Jul. 1973 225.6 1400
Paradip Port 06-07 Aug. 1979 205.2 0100
Paradip Port 24-26 May 1989 349.2 2000
Paradip Port 02-04 Nov. 1990 237.7 1200
Paradip Port 15-17 Jun. 1993 228.4 0600
Paradip Port 19-21 Aug. 1997 297.4 1300
Paradip Port 28-30 Oct. 1999 739.9 2100
322
Ghatsila 31 Aug. - 02 Sep. 1978 184.3 0800
Jamshedpur P.B.O. 03-05 Aug. 1977 238.2 2200
Jamshedpur P.B.O. 25-27 Jun. 1978 163.8 0700
Rajghat 28-30 Jun. 1979 222.9 1300
Ranchi (A) 05-06 Jun. 1971 158.5 0100
Ranchi (A) 27-29 Jun. 1997 159.7 0700
Ranchi (A) 08-10 Sep. 1998 150.6 1900
Udala 29 Jun. - 01 Jul. 1979 195.4 0500
Table 3-40: Smoothened TD coefficients for entire Mahanadi and Adjoining River Basins and for different catchments for 48-hour rainspells
Sub-durations (hours)
Catchment Wise Smoothened TD Coefficient (%)
All Rainspells
318 319 320 321 322 Entire Mahanadi and Adjoining River Basins
1 11.5 15.4 12.4 14.6 15.5 13.6
3 21.9 33.0 24.3 29.0 34.9 27.7
6 32.4 48.0 34.1 39.8 44.7 38.9
9 40.5 54.4 42.9 48.2 51.3 46.7
12 47.8 60.0 51.2 54.2 57.3 53.0
15 53.7 65.5 58.5 60.1 62.2 58.8
18 59.2 71.0 64.8 65.8 66.5 64.2
21 64.1 76.3 70.6 71.0 70.9 69.2
24 69.0 81.5 75.8 75.6 75.3 73.9
27 73.7 86.5 79.8 80.4 79.6 78.6
30 78.3 90.8 83.5 84.9 83.1 83.2
33 82.8 92.8 87.0 89.4 86.6 87.7
36 87.2 94.8 90.4 92.2 90.1 90.4
39 91.3 96.7 93.3 94.9 93.5 93.1
42 95.0 98.5 96.1 96.7 96.0 95.6
45 98.0 99.3 98.8 98.3 98.0 98.0
48 100.0 100.0 100.0 100.0 100.0 100.0

Estimation of PMP by Physical Approach
PMP Atlas for Mahanadi and Adjoining River Basins Page 195 of 260
Figure 3-49: Smoothened time distribution curve (48-hour) for Catchment-318
Figure 3-50: Smoothened time distribution curve (48-hour) for Catchment-319
Figure 3-51: Smoothened time distribution curve (48-hour) for Catchment-320
0
20
40
60
80
100
0 6 12 18 24 30 36 42 48
Tim
e D
istr
ibu
tio
n C
oe
ffic
ien
t (%
)
Duration (Hours)
Smoothened Time Distribution Curve (48 hr): Catchment - 318
0
20
40
60
80
100
0 6 12 18 24 30 36 42 48
Tim
e D
istr
ibu
tio
n C
oe
ffic
ien
t (%
)
Duration (Hours)
Smoothened Time Distribution Curve (48 hr): Catchment - 319
0
20
40
60
80
100
0 6 12 18 24 30 36 42 48
Tim
e D
istr
ibu
tio
n C
oe
ffic
ien
t (%
)
Duration (Hours)
Smoothened Time Distribution Curve (48 hr): Catchment - 320

Estimation of PMP by Physical Approach
PMP Atlas for Mahanadi and Adjoining River Basins Page 196 of 260
Figure 3-52: Smoothened time distribution curve (48-hour) for Catchment-321
Figure 3-53: Smoothened time distribution curve (48-hour) for Catchment-322
Figure 3-54: Smoothened time distribution curve (48-hour) for Mahanadi and Adjoining River Basins for all rainspells
0
20
40
60
80
100
0 6 12 18 24 30 36 42 48
Tim
e D
istr
ibu
tio
n C
oe
ffic
ien
t (%
)
Duration (Hours)
Smoothened Time Distribution Curve (48 hr): Catchment - 321
0
20
40
60
80
100
0 6 12 18 24 30 36 42 48
Tim
e D
istr
ibu
tio
n C
oe
ffic
ien
t (%
)
Duration (Hours)
Smoothened Time Distribution Curve (48 hr): Catchment - 322
0
20
40
60
80
100
0 6 12 18 24 30 36 42 48
Tim
e D
istr
ibu
tio
n C
oe
ffic
ien
t (%
)
Duration (Hours)
Smoothened Time Distribution Curve (48 hr): Mahanadi and
Adjoining River Basins

Estimation of PMP by Physical Approach
PMP Atlas for Mahanadi and Adjoining River Basins Page 197 of 260
Table 3-41: List of rain spells used for time distribution analysis of 72-hour duration
Catchment SRRG Station Dates of rainspell (s) Maximum 72 hour rainfall
(mm)
Commencement of Max. 72 hr rainspell (Hr. of day)
318
Bhubaneshwar 09-12 May 1995 459.8 1700
Gannavaram (A) 31 Oct. - 03 Nov. 1994 209.5 0700
Kakinada 08-11 May 1990 641.8 0200
Machilipatnam 31 Oct. - 03 Nov. 1994 537.8 0700
Puri 26-29 Jul. 1991 496.5 1200
Puri 29-31 Oct. 1999 331.4 0000
319
Jharsuguda 01-04 Sep. 1973 220.8 1700
Jharsuguda 20-23 Jun. 1996 154.8 0300
Kanker 06-09 Jul. 1973 244.5 0800
Nawapara 17-20 Jul. 1976 271.8 1900
Nawapara 10-12 Sep. 1977 259.5 0100
Raigarh 16-19 Aug. 1974 180.7 0400
320 Narsingpur 24-27 Jun. 1977 330.3 1100
Narsingpur 19-21 Aug. 2002 250.6 0100
321
Gondia 25-28 Aug. 1970 251.1 1700
Paradip Port 16-19 Aug. 1976 375.4 2300
Paradip Port 15-18 Jun. 1993 297.1 0400
Paradip Port 13-16 May 1995 221.9 1200
322
Ghatsila 31 Aug. - 03 Sep. 1978 187.2 0400
Jamshedpur 01-04 Sep. 1970 188.1 0200
Jamshedpur P.B.O. 03-06 Aug. 1977 278.4 2200
Jamshedpur P.B.O. 24-27 Jun. 1978 190.0 1200
Ranchi (A) 28-31 Aug. 1971 117.9 0300
Table 3-42: Smoothened TD coefficients for entire Mahanadi and Adjoining River Basins and for different catchments for 72-hour rainspells
Sub-durations
(hours)
Catchment Wise Smoothened TD Coefficient (%)
All Rainspells
318 319 320 321 322 Entire Mahanadi and Adjoining River Basins
1 11.1 14.8 8.1 12.1 13.5 12.1
3 20.0 29.4 22.1 26.3 30.3 24.6
6 28.2 41.7 31.2 34.1 38.3 33.6
9 36.1 51.1 40.0 40.6 45.2 39.8
12 42.5 57.6 47.9 46.3 50.5 45.1
15 48.2 63.5 54.4 51.3 55.2 50.3
18 53.6 68.8 60.0 56.1 59.6 54.9
21 58.2 73.9 65.0 60.5 63.8 59.4
24 62.7 78.3 69.0 64.5 67.6 63.9
27 67.1 82.7 72.0 68.5 71.0 67.9
30 71.4 86.1 74.0 72.2 74.1 71.8
33 75.7 88.7 76.0 75.5 77.2 75.2
36 79.5 90.2 78.0 78.3 79.7 78.3
39 82.6 91.4 80.0 81.0 82.2 81.5
42 85.7 92.5 82.0 83.3 84.5 84.2
45 88.3 93.6 84.0 85.5 86.7 86.9
48 90.4 94.6 86.0 87.6 88.8 89.4
51 92.0 95.5 88.0 89.6 90.5 91.2
54 93.5 96.4 90.0 91.6 92.1 92.8
57 94.9 97.1 92.0 93.5 93.7 94.2
60 96.2 97.8 94.0 95.1 95.2 95.6
63 97.5 98.4 96.0 96.6 96.6 96.9
66 98.5 98.9 98.0 98.0 97.8 98.1
69 99.3 99.5 99.0 99.3 99.0 99.3
72 100.0 100.0 100.0 100.0 100.0 100.0

Estimation of PMP by Physical Approach
PMP Atlas for Mahanadi and Adjoining River Basins Page 198 of 260
Figure 3-55: Smoothened time distribution curve (72-hour) for Catchment-318
Figure 3-56: Smoothened time distribution curve (72-hour) for Catchment-319
Figure 3-57: Smoothened time distribution curve (72-hour) for Catchment-320
0
20
40
60
80
100
0 12 24 36 48 60 72
Tim
e D
istr
ibu
tio
n C
oe
ffic
ien
t (%
)
Duration (Hours)
Smoothened Time Distribution Curve (72 hr): Catchment - 318
0
20
40
60
80
100
0 12 24 36 48 60 72
Tim
e D
istr
ibu
tio
n C
oe
ffic
ien
t (%
)
Duration (Hours)
Smoothened Time Distribution Curve (72 hr): Catchment - 319
0
20
40
60
80
100
0 12 24 36 48 60 72
Tim
e D
istr
ibu
tio
n C
oe
ffic
ien
t (%
)
Duration (Hours)
Smoothened Time Distribution Curve (72 hr): Catchment - 320

Estimation of PMP by Physical Approach
PMP Atlas for Mahanadi and Adjoining River Basins Page 199 of 260
Figure 3-58: Smoothened time distribution curve (72-hour) for Catchment-321
Figure 3-59: Smoothened time distribution curve (72-hour) for Catchment-322
Figure 3-60: Smoothened time distribution curve (72-hour) for Mahanadi and Adjoining River Basins for all rainspells
0
20
40
60
80
100
0 12 24 36 48 60 72
Tim
e D
istr
ibu
tio
n C
oe
ffic
ien
t (%
)
Duration (Hours)
Smoothened Time Distribution Curve (72 hr): Catchment - 321
0
20
40
60
80
100
0 12 24 36 48 60 72
Tim
e D
istr
ibu
tio
n C
oe
ffic
ien
t (%
)
Duration (Hours)
Smoothened Time Distribution Curve (72 hr): Catchment - 322
0
20
40
60
80
100
0 12 24 36 48 60 72
Tim
e D
istr
ibu
tio
n C
oe
ffic
ien
t (%
)
Duration (Hours)
Smoothened Time Distribution Curve (72 hr): Mahanadi and Adjoining River Basins

Estimation of PMP by Physical Approach
PMP Atlas for Mahanadi and Adjoining River Basins Page 200 of 260
3.6 Clock hour correction
Rainfall observations in India for different stations are taken daily for fixed time at 8.30 AM. As such, rainfall of a particular day is the total amount of rainfall in mm from 8.30 in the morning of the previous day to 8.30 morning of date. It should be noted that rainfall at any station is unlikely to commence at exactly the time of the daily reading. For example, the rainfall may commence at 11 am and continue till 11 am of the next day. This rainfall amount, therefore, gets divided into two parts. First between 11 AM to 08:30 AM and the second between 08:30 AM of next day to 11 AM. It is thus obvious that 1 day observed rainfall could be appreciably less than that of 24 hours rainfall measured between 11 am to 11 am unrestricted by any particular observation time. Similarly, the 2-day and 3-day rainfalls obtained from daily rainfalls at fixed time would be less than 48 and 72 hour rainfalls. The design rainfalls to be used in the unit hydrograph or other method of estimating the design floods should, however, be for durations not fixed by observation times. It has, therefore, been necessary to use the design rainfalls for 24 hours, 48 hours and 72 hours periods. Empirical multiplication factors for the conversion of 1-day, 2-day and 3-day rainfalls to 24, 48 and 72 hours are determined by several researchers using continuously recorded rainfall data from the self-recording rain gauges (SRRG). Harihara Ayyar and Tripathi (1973), using SRRG data from 67 stations in India, have determined the average ratio of 24-hour rainfall to 1-day rainfall (which is termed as clock hour correction factor) to be of the order of 1.15. On the basis of this study, IMD has recommended for the entire Indian region a ratio of 1.15 to convert 1-day rainfall to 24-hour rainfall. Due to unavailability of comprehensive storm data, this factor could not be estimated in the current study. Hence, a ratio of 1.15 recommended by IMD for entire Indian region is suggested to convert 1-day rainfall to 24-hour rainfall. Further, Table 5-22 in Annexure (at the end of this report) gives the 1-day rainfall and 24-hour rainfall for some of the stations and selected rainspells.
3.7 Area reduction factor
The Area Reduction Factors (ARF) are used to reduce the point rainfall values to average areal rain depths over the different areas of the catchment. ARFs have been derived using DAD statistics of analyzed rainstorms for various catchments of the Mahanadi and Adjoining River Basins. A ratio was calculated between the areal raindepth over different areas from 25 to 10,000 sq. km and the raindepth at the center of storm. The ARFs have been estimated for 1-day, 2-day and 3-day durations. Curves were then constructed by plotting area reduction factors against area in sq. km. for 1-day, 2-day and 3-day durations at a catchment level. As suggested by CWC and IMD three different types ARFs have been estimated in this study. These include 1) selected ARF, 2) envelope ARF, and 3) average ARF. The selected ARF is average of ratios estimated from severe storms (storms having a ratio more than 0.65 at 10,000 sq.km.) in the catchment. The envelope ARF is maximum value of ratio for corresponding area using all storms in the catchment. The average ARF is average value of ratio for corresponding area using all storms in the catchment. For example, a catchment has total 25 storms, out of which 7 are severe storms (storms having a ratio more than 0.65 at 10,000 sq.km.). The envelope and average ARFs are estimated using ratios of all 25 storms. The selected ARF is estimated using average of 7 severe storms. For seven catchments of the basin, all three types of ARF curves for 1-day, 2-day and 3-day durations are shown in Figure 3-61 to Figure 3-75. Table 3-43 gives the catchment wise list of rainstorms used in the estimation of selected area reduction factors. The selected area reduction factors for the 1-day, 2-day and 3-day durations, for the various catchments are given in Table 3-44 to Table 3-46. Additionally, envelope and average ARFs for the 1-day, 2-day and 3-day durations, for the various catchments are given in Table 5-23 to Table 5-28 in Annexure (at the end of this report).
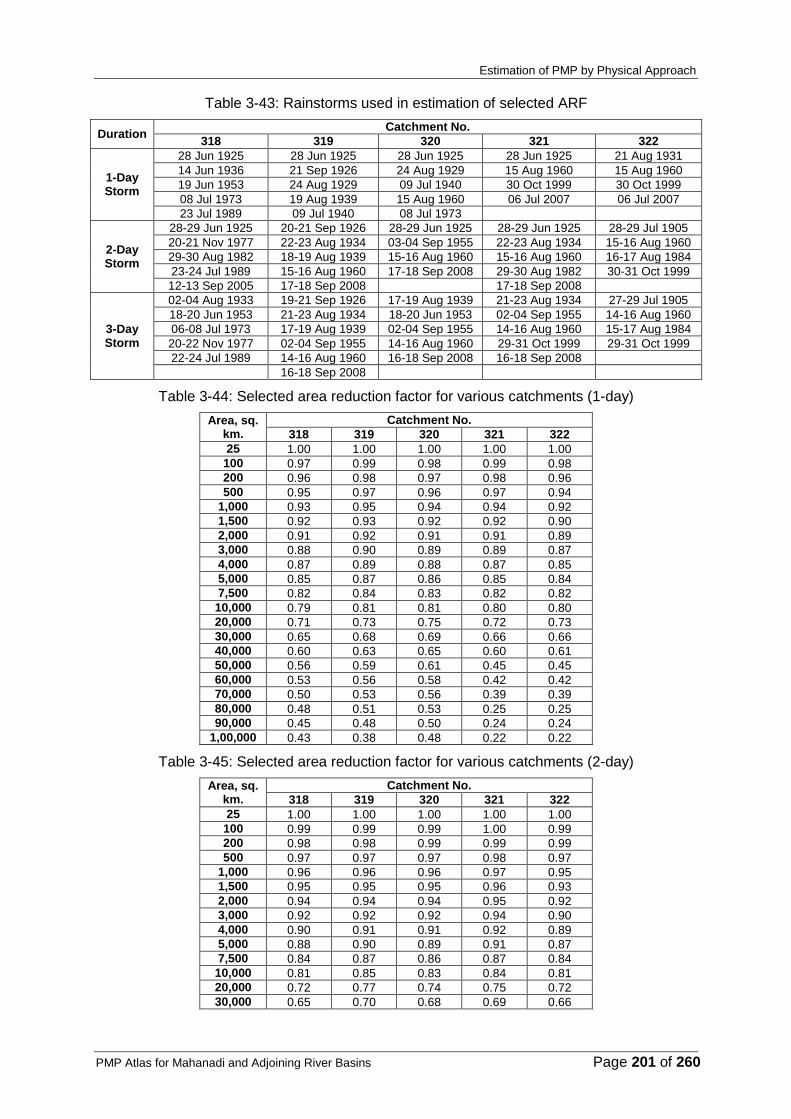
Estimation of PMP by Physical Approach
PMP Atlas for Mahanadi and Adjoining River Basins Page 201 of 260
Table 3-43: Rainstorms used in estimation of selected ARF
Duration Catchment No.
318 319 320 321 322
1-Day Storm
28 Jun 1925 28 Jun 1925 28 Jun 1925 28 Jun 1925 21 Aug 1931
14 Jun 1936 21 Sep 1926 24 Aug 1929 15 Aug 1960 15 Aug 1960
19 Jun 1953 24 Aug 1929 09 Jul 1940 30 Oct 1999 30 Oct 1999
08 Jul 1973 19 Aug 1939 15 Aug 1960 06 Jul 2007 06 Jul 2007
23 Jul 1989 09 Jul 1940 08 Jul 1973
2-Day Storm
28-29 Jun 1925 20-21 Sep 1926 28-29 Jun 1925 28-29 Jun 1925 28-29 Jul 1905
20-21 Nov 1977 22-23 Aug 1934 03-04 Sep 1955 22-23 Aug 1934 15-16 Aug 1960
29-30 Aug 1982 18-19 Aug 1939 15-16 Aug 1960 15-16 Aug 1960 16-17 Aug 1984
23-24 Jul 1989 15-16 Aug 1960 17-18 Sep 2008 29-30 Aug 1982 30-31 Oct 1999
12-13 Sep 2005 17-18 Sep 2008
17-18 Sep 2008
3-Day Storm
02-04 Aug 1933 19-21 Sep 1926 17-19 Aug 1939 21-23 Aug 1934 27-29 Jul 1905
18-20 Jun 1953 21-23 Aug 1934 18-20 Jun 1953 02-04 Sep 1955 14-16 Aug 1960
06-08 Jul 1973 17-19 Aug 1939 02-04 Sep 1955 14-16 Aug 1960 15-17 Aug 1984
20-22 Nov 1977 02-04 Sep 1955 14-16 Aug 1960 29-31 Oct 1999 29-31 Oct 1999
22-24 Jul 1989 14-16 Aug 1960 16-18 Sep 2008 16-18 Sep 2008
16-18 Sep 2008
Table 3-44: Selected area reduction factor for various catchments (1-day)
Area, sq. km.
Catchment No.
318 319 320 321 322
25 1.00 1.00 1.00 1.00 1.00
100 0.97 0.99 0.98 0.99 0.98
200 0.96 0.98 0.97 0.98 0.96
500 0.95 0.97 0.96 0.97 0.94
1,000 0.93 0.95 0.94 0.94 0.92
1,500 0.92 0.93 0.92 0.92 0.90
2,000 0.91 0.92 0.91 0.91 0.89
3,000 0.88 0.90 0.89 0.89 0.87
4,000 0.87 0.89 0.88 0.87 0.85
5,000 0.85 0.87 0.86 0.85 0.84
7,500 0.82 0.84 0.83 0.82 0.82
10,000 0.79 0.81 0.81 0.80 0.80
20,000 0.71 0.73 0.75 0.72 0.73
30,000 0.65 0.68 0.69 0.66 0.66
40,000 0.60 0.63 0.65 0.60 0.61
50,000 0.56 0.59 0.61 0.45 0.45
60,000 0.53 0.56 0.58 0.42 0.42
70,000 0.50 0.53 0.56 0.39 0.39
80,000 0.48 0.51 0.53 0.25 0.25
90,000 0.45 0.48 0.50 0.24 0.24
1,00,000 0.43 0.38 0.48 0.22 0.22
Table 3-45: Selected area reduction factor for various catchments (2-day)
Area, sq. km.
Catchment No.
318 319 320 321 322
25 1.00 1.00 1.00 1.00 1.00
100 0.99 0.99 0.99 1.00 0.99
200 0.98 0.98 0.99 0.99 0.99
500 0.97 0.97 0.97 0.98 0.97
1,000 0.96 0.96 0.96 0.97 0.95
1,500 0.95 0.95 0.95 0.96 0.93
2,000 0.94 0.94 0.94 0.95 0.92
3,000 0.92 0.92 0.92 0.94 0.90
4,000 0.90 0.91 0.91 0.92 0.89
5,000 0.88 0.90 0.89 0.91 0.87
7,500 0.84 0.87 0.86 0.87 0.84
10,000 0.81 0.85 0.83 0.84 0.81
20,000 0.72 0.77 0.74 0.75 0.72
30,000 0.65 0.70 0.68 0.69 0.66
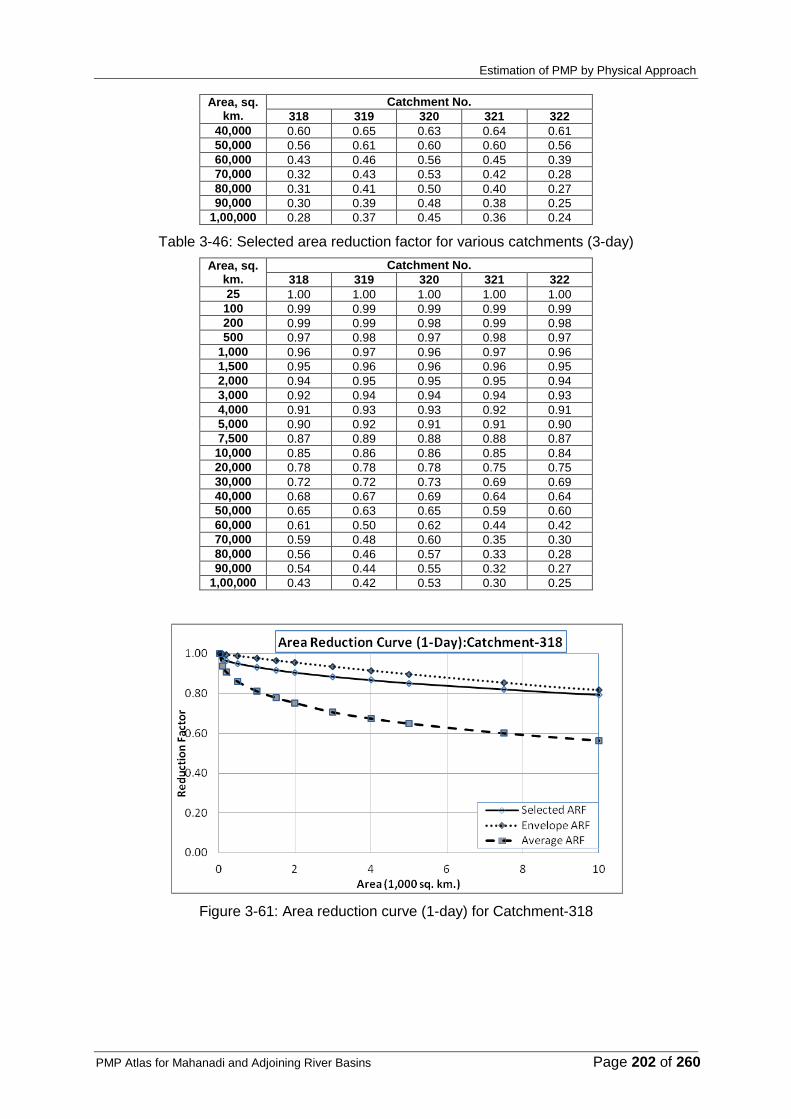
Estimation of PMP by Physical Approach
PMP Atlas for Mahanadi and Adjoining River Basins Page 202 of 260
Area, sq. km.
Catchment No.
318 319 320 321 322
40,000 0.60 0.65 0.63 0.64 0.61
50,000 0.56 0.61 0.60 0.60 0.56
60,000 0.43 0.46 0.56 0.45 0.39
70,000 0.32 0.43 0.53 0.42 0.28
80,000 0.31 0.41 0.50 0.40 0.27
90,000 0.30 0.39 0.48 0.38 0.25
1,00,000 0.28 0.37 0.45 0.36 0.24
Table 3-46: Selected area reduction factor for various catchments (3-day)
Area, sq. km.
Catchment No.
318 319 320 321 322
25 1.00 1.00 1.00 1.00 1.00
100 0.99 0.99 0.99 0.99 0.99
200 0.99 0.99 0.98 0.99 0.98
500 0.97 0.98 0.97 0.98 0.97
1,000 0.96 0.97 0.96 0.97 0.96
1,500 0.95 0.96 0.96 0.96 0.95
2,000 0.94 0.95 0.95 0.95 0.94
3,000 0.92 0.94 0.94 0.94 0.93
4,000 0.91 0.93 0.93 0.92 0.91
5,000 0.90 0.92 0.91 0.91 0.90
7,500 0.87 0.89 0.88 0.88 0.87
10,000 0.85 0.86 0.86 0.85 0.84
20,000 0.78 0.78 0.78 0.75 0.75
30,000 0.72 0.72 0.73 0.69 0.69
40,000 0.68 0.67 0.69 0.64 0.64
50,000 0.65 0.63 0.65 0.59 0.60
60,000 0.61 0.50 0.62 0.44 0.42
70,000 0.59 0.48 0.60 0.35 0.30
80,000 0.56 0.46 0.57 0.33 0.28
90,000 0.54 0.44 0.55 0.32 0.27
1,00,000 0.43 0.42 0.53 0.30 0.25
Figure 3-61: Area reduction curve (1-day) for Catchment-318

Estimation of PMP by Physical Approach
PMP Atlas for Mahanadi and Adjoining River Basins Page 203 of 260
Figure 3-62: Area reduction curve (2-day) for Catchment-318
Figure 3-63: Area reduction curve (3-day) for Catchment-318
Figure 3-64: Area reduction curve (1-day) for Catchment-319

Estimation of PMP by Physical Approach
PMP Atlas for Mahanadi and Adjoining River Basins Page 204 of 260
Figure 3-65: Area reduction curve (2-day) for Catchment-319
Figure 3-66: Area reduction curve (3-day) for Catchment-319
Figure 3-67: Area reduction curve (1-day) for Catchment-320

Estimation of PMP by Physical Approach
PMP Atlas for Mahanadi and Adjoining River Basins Page 205 of 260
Figure 3-68: Area reduction curve (2-day) for Catchment-320
Figure 3-69: Area reduction curve (3-day) for Catchment-320
Figure 3-70: Area reduction curve (1-day) for Catchment-321

Estimation of PMP by Physical Approach
PMP Atlas for Mahanadi and Adjoining River Basins Page 206 of 260
Figure 3-71: Area reduction curve (2-day) for Catchment-321
Figure 3-72: Area reduction curve (3-day) for Catchment-321
Figure 3-73: Area reduction curve (1-day) for Catchment-322

Estimation of PMP by Physical Approach
PMP Atlas for Mahanadi and Adjoining River Basins Page 207 of 260
Figure 3-74: Area reduction curve (2-day) for Catchment-322
Figure 3-75: Area reduction curve (3-day) for Catchment-322

Estimation of PMP by Physical Approach
PMP Atlas for Mahanadi and Adjoining River Basins Page 208 of 260
3.8 Practical example
3.8.1 USE OF GRID PMP
The readymade statistics of areal PMP by the physical method presented in the above section are ideally suited only for projects on medium size river basins with a drainage area matching with one of the standard areas adopted in the atlas with further restriction that the project basin should have one of the grid points close to its centre. In this case, we need to pick up a suitable areal PMP value from one of the tables presented above. Such an ideal condition can rarely exist. The data presented in this atlas has to be used appropriately for their correct application. A practical example of using grid PMP estimates is given below:
Problem: To obtain an estimate of one day areal PMP for a project (having an area of 687 sq. km) on Salandi river
Figure 3-76: Location map of problem catchments
Solution: To arrive at the 1-day PMP estimate for the given project site using PMP values obtained for nearest grid points, following steps are required. Figure 3-76 shows the location of the Salandi and Sondur project sites and neighbouring 1-degree grid points in the Mahanadi basin.
None of the standard grid points as indicated above lie near the centre of the project basin. The drainage area of the project basin is 687 sq. km, which also does not match the standard area projected in the atlas. In such cases, the estimation of PMP value can be done by following method:

Estimation of PMP by Physical Approach
PMP Atlas for Mahanadi and Adjoining River Basins Page 209 of 260
The PMP values at the 4 grid points identified above corresponding to 500 sq. km., 1,000 sq. km. and the interpolated value for 687 sq. km. are as given below:
Neighboring Grids
MND321-02 (mm)
MND321-04 (mm)
MND322-02 (mm)
MND322-03 (mm)
PMP for 500 sq. km. 720 686 708 751
PMP for 1,000 sq. km. 700 650 670 711
Interpolated PMP for 687 sq. km. 713 673 694 736
Average of the areal one day PMP for 687 sq. km = (713+673+694+736)/4
= 704 mm
Problem 2: To obtain and estimate of one day areal PMP for Sondur project (having area 562 sq. km)
Solution: To arrive at one-day PMP estimate for the given project site using PMP values obtained for nearest grid points.
None of the standard grid point as indicated above lies near the centre of the project basin. The drainage area of the project basin is 562 sq. km, which also does not match with the standard area projected in the atlas. The estimation of PMP value can be done by any of the following method:
The PMP values at the three grid points identified above corresponding to 500 sq. km, 1,000 sq. km, and the interpolated value for 562 sq. km., are as given below:
Neighboring Grids MND319-01
(mm) MND319-03
(mm) MND320-01
(mm)
PMP for 500 sq. km. 537 568 625
PMP for 1,000 sq. km. 522 552 608
Interpolated PMP for 562 sq. km. 535 566 623
Average of the areal one day PMP for 562 sq. km. = (535+566+623)/3
= 575 mm
3.8.2 USE OF TRANSPOSITION TECHNIQUE
Problem: To obtain an estimate of 24 hour PMP at Salandi and Sondur Project sites by the Storm Transposition Technique as given in Figure 3-77.
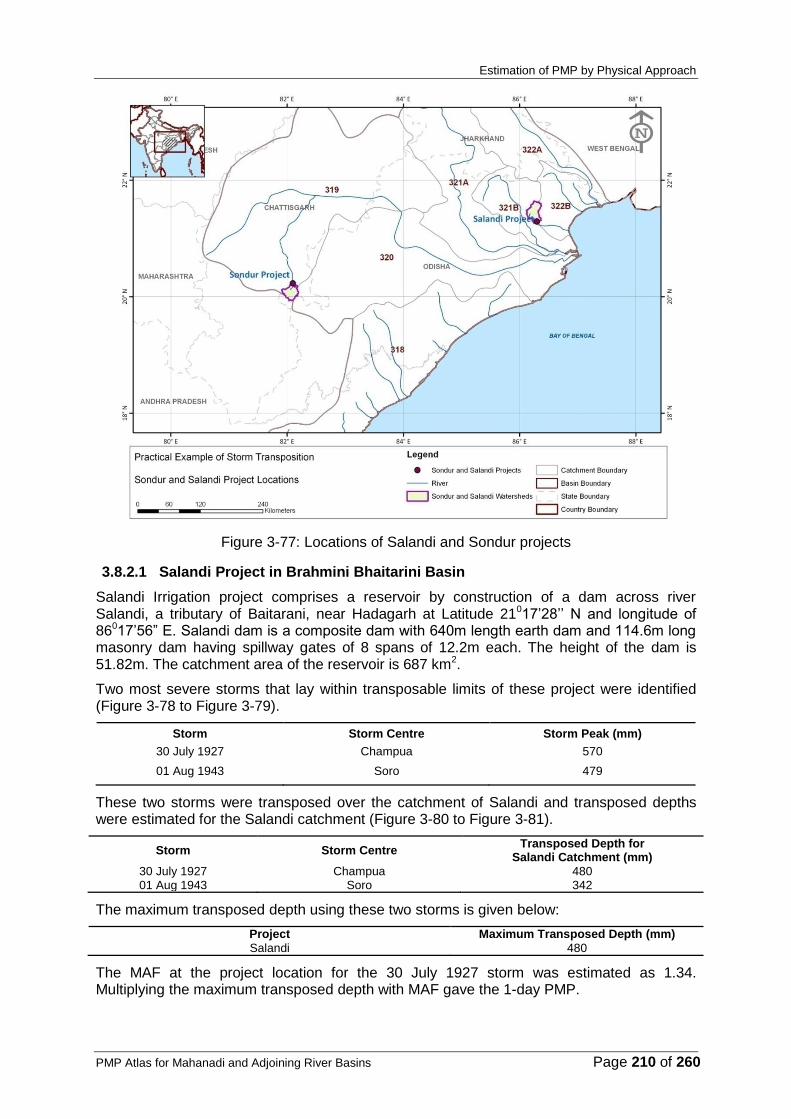
Estimation of PMP by Physical Approach
PMP Atlas for Mahanadi and Adjoining River Basins Page 210 of 260
Figure 3-77: Locations of Salandi and Sondur projects
3.8.2.1 Salandi Project in Brahmini Bhaitarini Basin
Salandi Irrigation project comprises a reservoir by construction of a dam across river Salandi, a tributary of Baitarani, near Hadagarh at Latitude 21017’28’’ N and longitude of 86017’56” E. Salandi dam is a composite dam with 640m length earth dam and 114.6m long masonry dam having spillway gates of 8 spans of 12.2m each. The height of the dam is 51.82m. The catchment area of the reservoir is 687 km2.
Two most severe storms that lay within transposable limits of these project were identified (Figure 3-78 to Figure 3-79).
Storm Storm Centre Storm Peak (mm)
30 July 1927 Champua 570
01 Aug 1943 Soro 479
These two storms were transposed over the catchment of Salandi and transposed depths were estimated for the Salandi catchment (Figure 3-80 to Figure 3-81).
Storm Storm Centre Transposed Depth for
Salandi Catchment (mm)
30 July 1927 Champua 480 01 Aug 1943 Soro 342
The maximum transposed depth using these two storms is given below:
Project Maximum Transposed Depth (mm)
Salandi 480
The MAF at the project location for the 30 July 1927 storm was estimated as 1.34. Multiplying the maximum transposed depth with MAF gave the 1-day PMP.

Estimation of PMP by Physical Approach
PMP Atlas for Mahanadi and Adjoining River Basins Page 211 of 260
Project 1-day PMP (mm)
Salandi 643
Apply clock hour correction 1.15 to convert 1-day PMP to 24-hour PMP values.
Project 24 hour PMP (mm)
Salandi 739
3.8.2.1 Sondur Project in Mahanadi Basin
The Sondur reservoir is constructed at 82°05’52'’ E longitude and 20°13’46’’ N latitude across Sondur River a tributary of Mahanadi. Located near Gram Machka, Nagri block, Dhamtari district of Chhattisgarh state, the dam was constructed in the year 1988. The catchment area of Sondur River up to the dam site is 562 km2. Major portion of the catchment lies in Dhamtari district of Chhattisgarh and Koraput district of Odisha state.
Two most severe storms that lay within transposable limits of these project were identified (Figure 3-82 to Figure 3-83).
Storm Storm Centre Storm Peak (mm)
30 Aug 1982 Bijepur 520
13 Jun 2001 Thuamulrampur 525
These two storms were transposed over the catchment of Sondur and transposed depths were estimated for the Sondur catchment (Figure 3-84 to Figure 3-85).
Storm Storm Centre Transposed Depth for
Sondur Catchment (mm)
30 Aug 1982 Bijepur 475 13 Jun 2001 Thuamulrampur 437
The maximum transposed depth using these two storms is given below:
Project Maximum Transposed Depth (mm)
Sondur 475
The MAF at the project location for the 30 Aug 1982 storm was estimated as 1.10. Multiplying the maximum transposed depth with MAF gave the 1-day PMP.
Project 1-day PMP (mm)
Sondur 523
Apply clock hour correction 1.15 to convert 1-day PMP to 24-hour PMP values.
Project 24 hour PMP (mm)
Sondur 601

Estimation of PMP by Physical Approach
PMP Atlas for Mahanadi and Adjoining River Basins Page 212 of 260
Figure 3-78: Isohyetal map of 30 Jul. 1927 rainstorm where it occurred (In situ)
Figure 3-79: Isohyetal map of 01 Aug. 1943 rainstorm where it occurred (In situ)

Estimation of PMP by Physical Approach
PMP Atlas for Mahanadi and Adjoining River Basins Page 213 of 260
Figure 3-80: Transposed storm isohyetal map of 30 Jul. 1927 over Salandi Catchment
Figure 3-81: Transposed storm isohyetal map of 01 Aug. 1943 over Salandi Catchment

Estimation of PMP by Physical Approach
PMP Atlas for Mahanadi and Adjoining River Basins Page 214 of 260
Figure 3-82: Isohyetal map of 30 Aug. 1982 rainstorm where it occurred (In situ)
Figure 3-83: Isohyetal map of 13 Jun. 2001 rainstorm where it occurred (In situ)
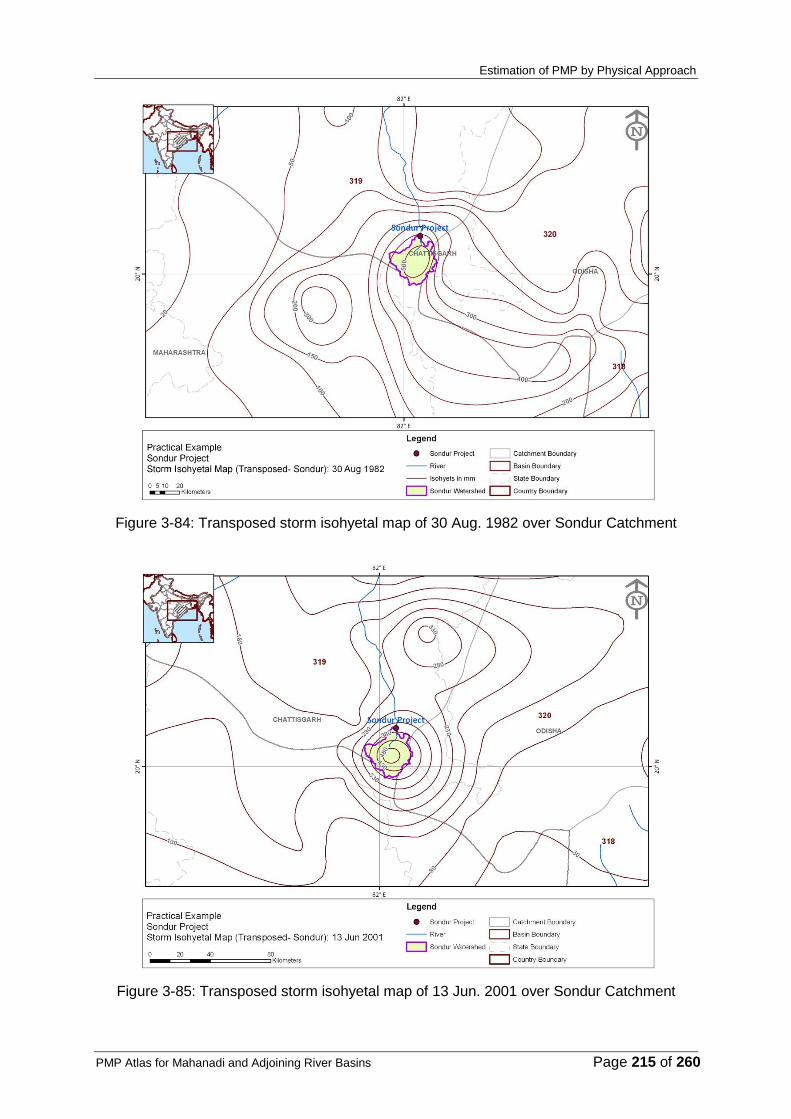
Estimation of PMP by Physical Approach
PMP Atlas for Mahanadi and Adjoining River Basins Page 215 of 260
Figure 3-84: Transposed storm isohyetal map of 30 Aug. 1982 over Sondur Catchment
Figure 3-85: Transposed storm isohyetal map of 13 Jun. 2001 over Sondur Catchment

PMP Atlas for Mahanadi and Adjoining River Basins Page 216 of 260
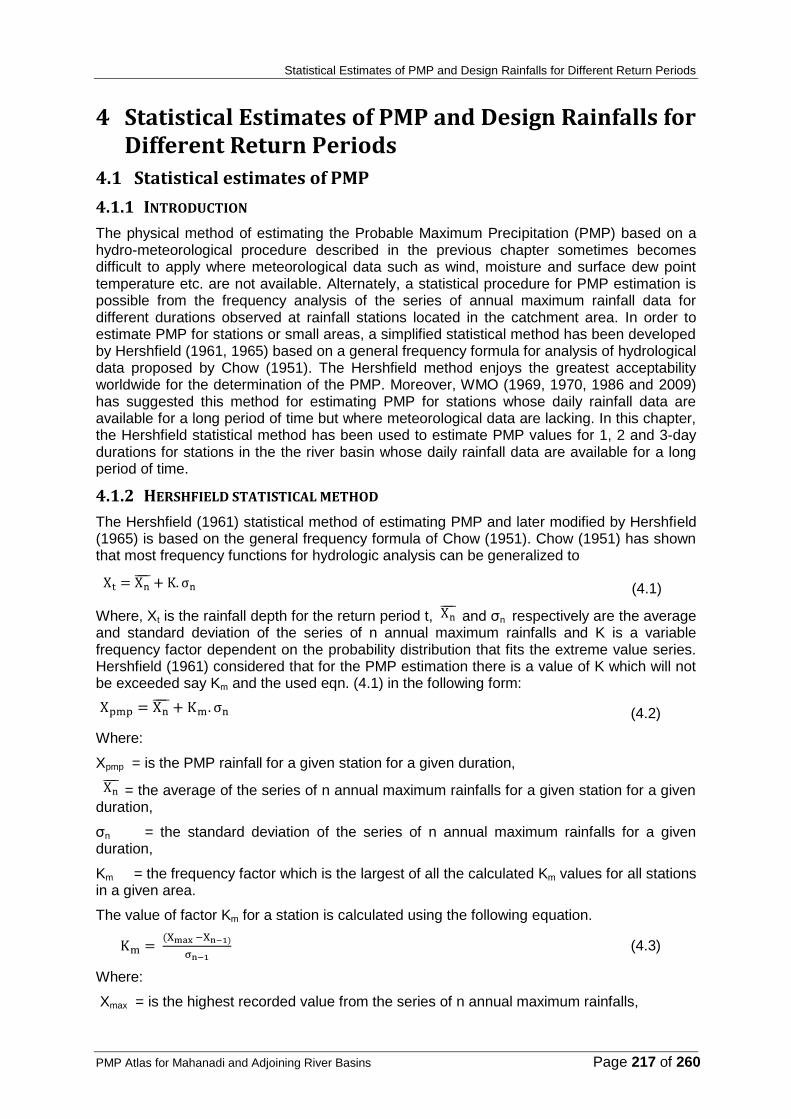
Statistical Estimates of PMP and Design Rainfalls for Different Return Periods
PMP Atlas for Mahanadi and Adjoining River Basins Page 217 of 260
4 Statistical Estimates of PMP and Design Rainfalls for Different Return Periods
4.1 Statistical estimates of PMP
4.1.1 INTRODUCTION
The physical method of estimating the Probable Maximum Precipitation (PMP) based on a hydro-meteorological procedure described in the previous chapter sometimes becomes difficult to apply where meteorological data such as wind, moisture and surface dew point temperature etc. are not available. Alternately, a statistical procedure for PMP estimation is possible from the frequency analysis of the series of annual maximum rainfall data for different durations observed at rainfall stations located in the catchment area. In order to estimate PMP for stations or small areas, a simplified statistical method has been developed by Hershfield (1961, 1965) based on a general frequency formula for analysis of hydrological data proposed by Chow (1951). The Hershfield method enjoys the greatest acceptability worldwide for the determination of the PMP. Moreover, WMO (1969, 1970, 1986 and 2009) has suggested this method for estimating PMP for stations whose daily rainfall data are available for a long period of time but where meteorological data are lacking. In this chapter, the Hershfield statistical method has been used to estimate PMP values for 1, 2 and 3-day durations for stations in the the river basin whose daily rainfall data are available for a long period of time.
4.1.2 HERSHFIELD STATISTICAL METHOD
The Hershfield (1961) statistical method of estimating PMP and later modified by Hershfield (1965) is based on the general frequency formula of Chow (1951). Chow (1951) has shown that most frequency functions for hydrologic analysis can be generalized to
(4.1)
Where, Xt is the rainfall depth for the return period t, and σn respectively are the average and standard deviation of the series of n annual maximum rainfalls and K is a variable frequency factor dependent on the probability distribution that fits the extreme value series. Hershfield (1961) considered that for the PMP estimation there is a value of K which will not be exceeded say Km and the used eqn. (4.1) in the following form:
(4.2)
Where:
Xpmp = is the PMP rainfall for a given station for a given duration,
= the average of the series of n annual maximum rainfalls for a given station for a given duration,
σn = the standard deviation of the series of n annual maximum rainfalls for a given duration,
Km = the frequency factor which is the largest of all the calculated Km values for all stations in a given area.
The value of factor Km for a station is calculated using the following equation.
(4.3)
Where:
Xmax = is the highest recorded value from the series of n annual maximum rainfalls,

Statistical Estimates of PMP and Design Rainfalls for Different Return Periods
PMP Atlas for Mahanadi and Adjoining River Basins Page 218 of 260
= the average value of n-1 annual maximum rainfalls excluding the highest value of Xmax and
σn-1 = the standard deviation of n-1 annual maximum rainfalls excluding the highest value of Xmax
Hershfield (1961) used 1-day rainfall data from about 2,700 stations in many countries and found that K values as calculated from eqn. 4.3 ranged from less than 3 to a highest value of 15. Hershfield used the highest value of 15 to estimate PMP for 1 day duration for different stations in the world by adopting the formula:
(4.4)
Several investigators questioned the universal applicability of Km = 15 for the calculation of the PMP because of the fact that unusually high values of PMP were obtained on using the highest value of 15. Hershfield (1965) himself found that use of the common value of Km =
15 was not appropriate because on representing graphically Km as a function of for various durations (5 min, 1, 6,12 hours) and the wrapping of the frequency factors as shown
in Figure 4-1, he noted that as the average of the series ( ) increased in magnitude, K Km values had a tendency to decrease. Thus, each station has its own Km value depending
upon its magnitude of . Subsequently, Hershfield (1965) used the enveloping Km curve
for obtaining Km values for different values of .
Figure 4-1: Km as a function of rainfall duration and mean annual series (after Hershfield)
The above mentioned statistical estimation procedure of the PMP can be used where sufficient rainfall data is available and in particular to make rapid estimates or where other meteorological data (dew point, wind records etc.) are missing.
4.1.3 RAINFALL DATA USED
Daily rainfall data of 366 rainfall stations distributed over different catchments of the Mahanadi and Adjoining River Basins were used (see Table 4-1). The names of the stations and their length of record are listed in Table 1-1 in Volume II and their geographical locations are shown in Figure 2-2. Data required for the PMP estimation is the series comprising of annual maximum rainfalls for a given duration at an observing rainfall station. This consists of a sequence of rainfalls formed by selecting the highest of the 365 daily rainfall values for a

Statistical Estimates of PMP and Design Rainfalls for Different Return Periods
PMP Atlas for Mahanadi and Adjoining River Basins Page 219 of 260
given duration for each year of record. Thus for n years of data the annual maximum series will consist of n rainfall values. As such, the annual maximum rainfall values for 1, 2 and 3-day durations for each year were selected for all stations and arrays of annual maximum values of rainfall were formed for these three durations for each station to estimate PMP for 1 to 3-day durations following the method discussed in Section 4.2.
Table 4-1: Number of rainfall stations considered in each catchment of Mahanadi and Adjoining River Basins
Catchment No. Area (sq. km.) Number of Stations Density (sq. km./Station)
318 54,769 90 609
319 84,277 78 1,080
320 55,549 71 782
321 49,448 82 603
322 29,459 45 655
4.1.4 HOMOGENEITY OF THE DATA SERIES
The use of long series in the estimation of PMP is only useful if they show no long-term changes in their behaviour. As such, the annual maximum rainfall series of 1, 2 and 3-day durations in respect of 366 stations were tested for such in homogeneities by applying the Mann Kendal rank test (WMO, 1966). We note a few stations indicated in homogeneities over the period of record at the 5% level of significance.
4.1.5 STATISTICAL ESTIMATES OF PMP VALUES FOR 1, 2 AND 3-DAY DURATIONS
The data of yearly observed maximum rainfall series for durations of 1, 2 and 3 days for 366 stations in the Mahanadi and Adjoining River Basins were analyzed to obtain estimates of
PMP. For this purpose, the values of , , σn, σn-1 and the coefficients of variation (CV) were calculated for each annual maximum rainfall series for each station by conventional procedures. The frequency factor (Km) for each of the durations and for each station was determined by using eqn. 4.3. The frequency distribution of Km values for 1, 2 and 3-day durations for the 366 stations in the Mahanadi and Adjoining River Basins are given in Table 4-2. The highest values of Km were found to be 10.75, 11.89 and 11.95 for 1, 2 and 3-day respectively.
Table 4-2: Frequency distribution of Km values for 1 to 3-day durations
Km Range 1-Day 2-Day 3-Day
6.1 - 7.0 4 9 9
7.1 - 8.0 3 8 11
8.1 - 9.0 8 16 29
9.1 - 10.0 41 26 57
10.1 - 11.0 310 65 159
11.1 - 12.0 - 242 101
Km Max 10.75 11.89 11.95
4.1.5.1 Development of Km Envelope Curves
The values of Km obtained for all the stations for 1 to 3-day durations showed no
geographical pattern but when plotted against the mean of the annual maximum series ( )
they showed a decrease in Km with increase in . Thus each station has its own Km value
depending upon its magnitude of . It was, therefore, considered that an appropriate enveloping Km curve based upon the values of stations in the Mahanadi and Adjoining River

Statistical Estimates of PMP and Design Rainfalls for Different Return Periods
PMP Atlas for Mahanadi and Adjoining River Basins Page 220 of 260
Basins would give realistic estimates of PMP for different durations. As such, appropriate enveloping Km curves showing the relationship between Km and the average annual maximum rainfalls for 1, 2, and 3-day durations were determined.
The values of Km for all the stations in the Mahanadi and Adjoining River Basins were plotted
separately against for 1, 2 and 3-day durations. The enveloping curves were then drawn with the help of the upper most points, which are shown in Figures 4-2 to 4-4. These enveloping curves were used to obtain Km values corresponding to the average of annual
maximum rainfall series ( ) for 1, 2 and 3-day durations for PMP computations for different stations to compute the PMP values.
Figure 4-2: Envelope frequency factor curve for 1-day annual maximum rainfall
Figure 4-3: Envelope frequency factor curve for 2-day annual maximum rainfall
0.00
2.00
4.00
6.00
8.00
10.00
12.00
70 90 110 130 150 170 190 210
Km
Mean Rainfall (mm)
Km - Curve for 1-Day PMP
0.00
2.00
4.00
6.00
8.00
10.00
12.00
14.00
90 140 190 240 290
Km
Mean Rainfall (mm)
Km - Curve for 2-Day PMP
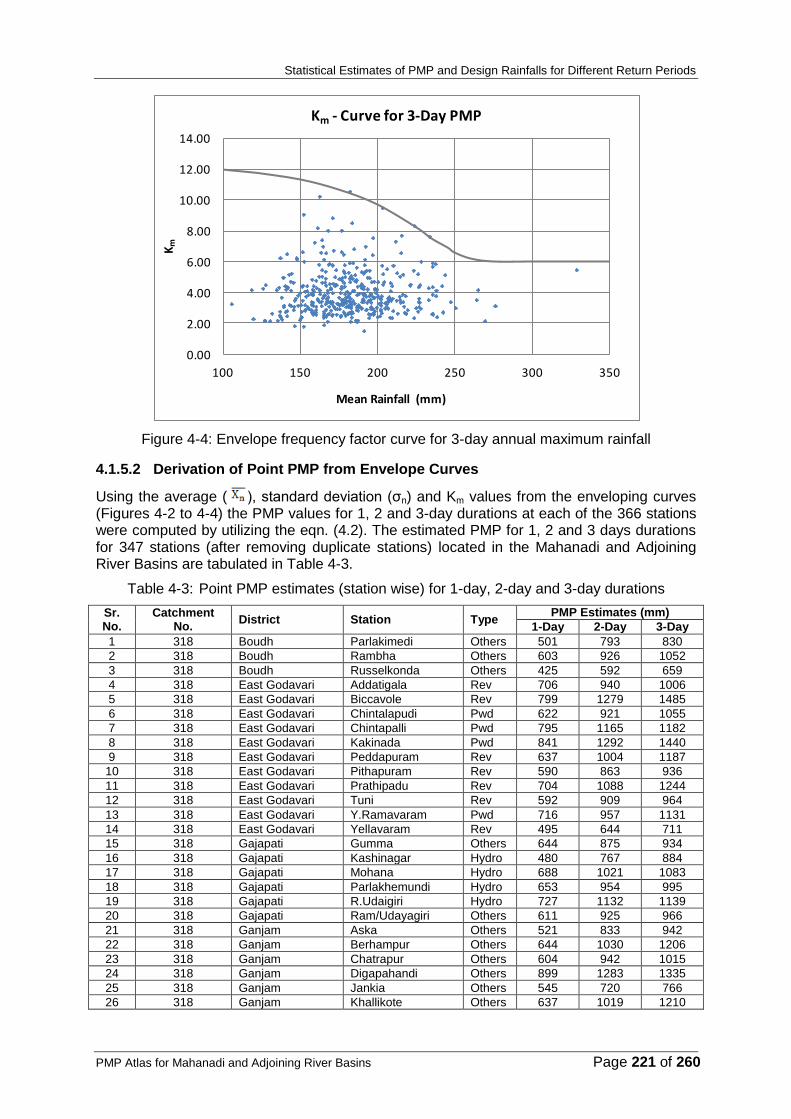
Statistical Estimates of PMP and Design Rainfalls for Different Return Periods
PMP Atlas for Mahanadi and Adjoining River Basins Page 221 of 260
Figure 4-4: Envelope frequency factor curve for 3-day annual maximum rainfall
4.1.5.2 Derivation of Point PMP from Envelope Curves
Using the average ( ), standard deviation (σn) and Km values from the enveloping curves (Figures 4-2 to 4-4) the PMP values for 1, 2 and 3-day durations at each of the 366 stations were computed by utilizing the eqn. (4.2). The estimated PMP for 1, 2 and 3 days durations for 347 stations (after removing duplicate stations) located in the Mahanadi and Adjoining River Basins are tabulated in Table 4-3.
Table 4-3: Point PMP estimates (station wise) for 1-day, 2-day and 3-day durations
Sr. No.
Catchment No.
District Station Type PMP Estimates (mm)
1-Day 2-Day 3-Day
1 318 Boudh Parlakimedi Others 501 793 830
2 318 Boudh Rambha Others 603 926 1052
3 318 Boudh Russelkonda Others 425 592 659
4 318 East Godavari Addatigala Rev 706 940 1006
5 318 East Godavari Biccavole Rev 799 1279 1485
6 318 East Godavari Chintalapudi Pwd 622 921 1055
7 318 East Godavari Chintapalli Pwd 795 1165 1182
8 318 East Godavari Kakinada Pwd 841 1292 1440
9 318 East Godavari Peddapuram Rev 637 1004 1187
10 318 East Godavari Pithapuram Rev 590 863 936
11 318 East Godavari Prathipadu Rev 704 1088 1244
12 318 East Godavari Tuni Rev 592 909 964
13 318 East Godavari Y.Ramavaram Pwd 716 957 1131
14 318 East Godavari Yellavaram Rev 495 644 711
15 318 Gajapati Gumma Others 644 875 934
16 318 Gajapati Kashinagar Hydro 480 767 884
17 318 Gajapati Mohana Hydro 688 1021 1083
18 318 Gajapati Parlakhemundi Hydro 653 954 995
19 318 Gajapati R.Udaigiri Hydro 727 1132 1139
20 318 Gajapati Ram/Udayagiri Others 611 925 966
21 318 Ganjam Aska Others 521 833 942
22 318 Ganjam Berhampur Others 644 1030 1206
23 318 Ganjam Chatrapur Others 604 942 1015
24 318 Ganjam Digapahandi Others 899 1283 1335
25 318 Ganjam Jankia Others 545 720 766
26 318 Ganjam Khallikote Others 637 1019 1210
0.00
2.00
4.00
6.00
8.00
10.00
12.00
14.00
100 150 200 250 300 350
Km
Mean Rainfall (mm)
Km - Curve for 3-Day PMP

Statistical Estimates of PMP and Design Rainfalls for Different Return Periods
PMP Atlas for Mahanadi and Adjoining River Basins Page 222 of 260
Sr. No.
Catchment No.
District Station Type PMP Estimates (mm)
1-Day 2-Day 3-Day
27 318 Ganjam Kodala Others 543 869 1017
28 318 Ganjam Madhabarida Hydro 622 938 1019
29 318 Ganjam Purushottampur Others 548 876 984
30 318 Ganjam Saroda Hydro 547 875 876
31 318 Ganjam Surada Others 543 798 901
32 318 Kandhamal Dharingbadi Others 649 941 958
33 318 Khurda Balianta Others 627 920 987
34 318 Khurda Banpur Others 627 963 993
35 318 Khurda Bhubaneshwar Others 624 878 936
36 318 Khurda Jatni Others 538 862 996
37 318 Khurda Khurda Others 660 1037 1081
38 318 Khurda Tangi Others 590 839 896
39 318 Krishna Kamalapuram Pwd 669 952 1024
40 318 Nayagarh Ranpur Others 596 888 922
41 318 Puri Gop Others 756 1023 1094
42 318 Puri Kakatpur Others 687 1099 1208
43 318 Puri Kanas Others 516 825 921
44 318 Puri Krishnaprasad Others 562 880 949
45 318 Puri Pipli Others 735 1006 1074
46 318 Rayagada Ambodala Hydro 773 1061 1193
47 318 Rayagada Bissem-Cuttack Hydro 671 1041 1151
48 318 Rayagada Gudari Hydro 506 810 857
49 318 Rayagada Gunupur Hydro 709 1022 1069
50 318 Rayagada Rayagada Others 513 781 852
51 318 Srikakulam Gotta Hydro 505 754 762
52 318 Srikakulam Itchapuram Rev 766 1128 1169
53 318 Srikakulam Naradi Barrage Rev 760 1157 1252
54 318 Srikakulam Narasannapeta Rev 721 979 1016
55 318 Srikakulam Narayanpuram Rev 593 774 832
56 318 Srikakulam Palakonda Rev 516 714 765
57 318 Srikakulam Palasa Rev 671 991 1048
58 318 Srikakulam Pathapatnam Rev 567 824 997
59 318 Srikakulam Pundi Rev 594 951 1039
60 318 Srikakulam Ranasthalam Rev 395 588 750
61 318 Srikakulam Sompeta Rev 695 997 1057
62 318 Srikakulam Srikakulam Rev 589 851 908
63 318 Srikakulam Tekkali Rev 726 994 1047
64 318 Srikakulam Thotapalli Rev 572 893 1087
65 318 Visakhapatnam Anakapalli Rev 638 1021 1172
66 318 Visakhapatnam Bhimunipatnam Rev 876 1170 1204
67 318 Visakhapatnam Chidavaram Rev 664 1063 1136
68 318 Visakhapatnam Chodyam Pwd 913 1460 1542
69 318 Visakhapatnam Konda Others 760 1174 1278
70 318 Visakhapatnam Kothakota Pwd 801 1281 1436
71 318 Visakhapatnam Malakapuram Rev 631 1005 1123
72 318 Visakhapatnam Narsipatnam Rev 772 1163 1205
73 318 Visakhapatnam Palaparthi Pwd 811 1145 1222
74 318 Visakhapatnam Polavaram Others 744 1191 1364
75 318 Visakhapatnam Tandaya Dam Site Pwd 754 1190 1271
76 318 Visakhapatnam Tulabada Rev 732 1169 1280
77 318 Visakhapatnam Yellamanchili Rev 602 854 974
78 318 Vizianagaram Bobbili Rev 518 756 864
79 318 Vizianagaram Cheepurupalli Rev 570 863 940
80 318 Vizianagaram Gajapathinagaram Rev 718 1004 1046
81 318 Vizianagaram Parvatipuram Rev 466 715 830
82 318 Vizianagaram Salur Rev 572 881 946
83 318 Vizianagaram Srungavarapukota Pwd 556 890 1036
84 318 Vizianagaram Tatipudi Pwd 485 731 839
85 318 Vizianagaram Vijayanagaram Rev 797 1212 1240
86 319 Bargarh Ambabhona Others 758 1075 1125
87 319 Bargarh Paikmal Others 816 1163 1286
88 319 Bastar Khijrawan Hydro 713 1140 1240

Statistical Estimates of PMP and Design Rainfalls for Different Return Periods
PMP Atlas for Mahanadi and Adjoining River Basins Page 223 of 260
Sr. No.
Catchment No.
District Station Type PMP Estimates (mm)
1-Day 2-Day 3-Day
89 319 Bilaspur Bilaspur Others 488 750 801
90 319 Bilaspur Khurai Others 361 480 522
91 319 Bilaspur Kotaghat Others 454 727 822
92 319 Bilaspur Mungeli Others 388 535 552
93 319 Bilaspur Pandaria Others 404 583 606
94 319 Bilaspur Pasan Others 382 611 652
95 319 Bilaspur Pondilafa Others 480 691 749
96 319 Dhamtari Dhamtari Others 674 1010 1063
97 319 Dhamtari Kurud Others 659 919 985
98 319 Durg Adamabad Others 741 1025 1072
99 319 Durg Bemetara Others 492 689 740
100 319 Durg Bhatagaon Others 609 870 934
101 319 Durg Bhilai Others 544 840 889
102 319 Durg Durg Others 577 857 921
103 319 Durg Khamaria Others 571 711 898
104 319 Durg Khapari Others 612 938 1027
105 319 Durg Kharra Others 588 750 783
106 319 Durg Sanjari Others 508 798 922
107 319 Durg Selod Others 585 883 961
108 319 Janjgir Dhabara /Dabra Others 1025 1269 1274
109 319 Janjgir Janjgir Others 608 830 842
110 319 Janjgir Sakti Others 578 832 890
111 319 Janjgir Seorinarayan Others 629 910 983
112 319 Jashpurnagar Pathalgaon Hydro 407 651 676
113 319 Jharsuguda Jharsuguda Others 750 1027 1084
114 319 Jharsuguda Laikera Bl Ii Others 796 1081 1090
115 319 Jharsuguda Lakhanpur Others 452 722 858
116 319 Korba Kathghora Others 728 982 1029
117 319 Korba Korba Others 632 912 917
118 319 Kowardha Kowardha Others 506 647 684
119 319 Mahasamund Mahasamund Others 716 1079 1173
120 319 Mahasamund Saraipali Others 646 858 886
121 319 Nawapara Nawapara Others 640 928 952
122 319 Raigarh Dharamjaigarh Others 602 805 833
123 319 Raigarh Gharghoda Hydro 514 808 897
124 319 Raigarh Ginabahar Hydro 558 705 857
125 319 Raigarh Raigarh Others 605 843 903
126 319 Raigarh Sarangarh Others 743 962 976
127 319 Raigarh Tapkara Hydro 475 698 840
128 319 Raipur Arang Others 639 839 844
129 319 Raipur Arjuni Others 608 888 1003
130 319 Raipur Baloda Bazar Others 523 806 852
131 319 Raipur Bhatagaon Others 639 919 947
132 319 Raipur Budni Others 620 895 1042
133 319 Raipur Gariabund Others 661 859 934
134 319 Raipur Gattasilli Others 595 823 904
135 319 Raipur Kanki Others 688 955 990
136 319 Raipur Kendri Others 596 870 976
137 319 Raipur Khairdatan Others 542 748 867
138 319 Raipur Kondapar Others 710 1023 1046
139 319 Raipur Kusrangi Others 696 882 940
140 319 Raipur Lahood Others 707 949 1029
141 319 Raipur Lakholi Others 678 994 1244
142 319 Raipur Mainpur Hydro 701 892 953
143 319 Raipur Maramsilli Others 645 978 1017
144 319 Raipur Pallari Others 745 960 1153
145 319 Raipur Pindron Others 660 928 983
146 319 Raipur Pithora Others 518 750 808
147 319 Raipur Rajim Others 614 900 961
148 319 Raipur Rudri Others 756 1014 1044
149 319 Raipur Sandi Others 659 1054 1252
150 319 Raipur Simga Others 466 612 674

Statistical Estimates of PMP and Design Rainfalls for Different Return Periods
PMP Atlas for Mahanadi and Adjoining River Basins Page 224 of 260
Sr. No.
Catchment No.
District Station Type PMP Estimates (mm)
1-Day 2-Day 3-Day
151 319 Rajnandgaon Ambagarh Chowki Others 608 886 947
152 319 Rajnandgaon Chhuikhadan Others 423 595 620
153 319 Rajnandgaon Dongargarh Others 530 848 974
154 319 Rajnandgaon Gondai Others 423 580 706
155 319 Rajnandgaon Khairagarh Others 480 634 655
156 319 Rajnandgaon Rajnandgaon Others 693 931 996
157 319 Sambalpur Kuchinda Others 1027 1409 1500
158 319 Sambalpur Kusumi Hydro 744 835 991
159 319 Sundargarh Hemgir Hydro 650 976 999
160 319 Sundargarh Lephripara Others 644 867 916
161 319 Sundargarh Sundergarh Others 802 1042 1183
162 319 Sundargarh Ujjalpur Hydro 500 714 950
163 319 Surguja Sitapur Others 644 1031 1224
164 320 Angul Athmalik Others 734 1057 1174
165 320 Balasore Balandapara Others 635 994 1134
166 320 Balasore Baudhgarh Others 715 920 992
167 320 Balasore Posara Others 627 887 985
168 320 Bargarh Bargarh Others 684 922 989
169 320 Bargarh Bhatli Others 792 1080 1099
170 320 Bargarh Bijepur Others 892 1097 1166
171 320 Bargarh Padampur Others 696 997 1032
172 320 Bargarh Paikmal Hydro 671 960 1000
173 320 Bargarh Rajathgarh Others 620 895 912
174 320 Bargarh Sohella Hydro 687 992 1183
175 320 Bhadrak Handapa Others 766 933 1006
176 320 Bhadrak Krishnanagar Others 717 849 990
177 320 Bhadrak Purankot(Tikeapa Others 698 975 976
178 320 Bolangir Belpara Others 776 1242 1475
179 320 Bolangir Bolangir Others 738 999 1058
180 320 Bolangir Bungomunda Others 1115 1587 1624
181 320 Bolangir Khaparakhol Others 680 1067 1083
182 320 Bolangir Loisingha Others 542 826 880
183 320 Bolangir Patnagarh Others 813 1245 1247
184 320 Bolangir Saintala Others 797 1269 1295
185 320 Bolangir Titlagarh Others 802 938 1033
186 320 Bolangir Turekela Others 539 830 868
187 320 Boudh Harabhanga Others 474 758 900
188 320 Cuttack Athgarh Others 763 1018 1147
189 320 Cuttack Banki Bankigarh Others 634 928 1007
190 320 Cuttack Baramba Others 511 773 781
191 320 Cuttack Cuttack Others 783 984 1007
192 320 Cuttack Cuttack Sadar I Others 807 1202 1447
193 320 Cuttack Mahanga Others 762 979 1094
194 320 Cuttack Narsingpur Others 527 830 862
195 320 Cuttack Salepur Others 718 1050 1118
196 320 Cuttack Tigiriagarh Others 719 1029 1148
197 320 Dhenkanal Bhuban Others 607 773 897
198 320 Jagatsingpur Dhama Others 595 800 822
199 320 Jagatsingpur Jagatsingpur Others 805 947 1019
200 320 Jagatsingpur Naraj Hydro 779 1023 1024
201 320 Jajpur Barchana Others 736 1024 1099
202 320 Jajpur Jenapur Hydro 586 781 863
203 320 Kalahandi Bhawanipatna Others 797 1046 1153
204 320 Kalahandi Golamunda Others 906 1206 1238
205 320 Kalahandi Jaipatna Others 889 1281 1347
206 320 Kalahandi Junagarh Others 877 1172 1256
207 320 Kalahandi Madanpur Rampur Others 794 929 1024
208 320 Kalahandi Thuamulrampur Others 1439 1950 2215
209 320 Kandhamal Balliguda Others 919 1055 1237
210 320 Kandhamal Gudhayagiri Others 611 916 972
211 320 Kandhamal Kalinga Hydro 908 1277 1324
212 320 Kandhamal Khajuripara Others 564 811 896

Statistical Estimates of PMP and Design Rainfalls for Different Return Periods
PMP Atlas for Mahanadi and Adjoining River Basins Page 225 of 260
Sr. No.
Catchment No.
District Station Type PMP Estimates (mm)
1-Day 2-Day 3-Day
213 320 Kandhamal Phiringia Others 865 1067 1217
214 320 Kandhamal Phulbani Others 771 1072 1165
215 320 Kandhamal Tikabali Others 865 1225 1308
216 320 Kendrapada Kendrapara Others 816 1030 1083
217 320 Khurda Barmul Hydro 661 921 940
218 320 Khurda Bolgarh Others 527 771 813
219 320 Nawapara Boden Others 808 1171 1223
220 320 Nawapara Khariar Others 716 1013 1056
221 320 Nawapara Komna Hydro 580 751 768
222 320 Nayagarh Daspalla Others 607 910 1041
223 320 Nayagarh Khandaparagarh Others 566 795 843
224 320 Nayagarh Nayagarh Others 499 733 759
225 320 Raipur Bhalukona Others 497 755 945
226 320 Raipur Deobhog Others 587 876 953
227 320 Raipur Urmal Hydro 523 772 777
228 320 Sambalpur Hirakud Hydro 682 912 946
229 320 Sambalpur R.Pur/Rairakhol Others 791 916 1016
230 320 Sonepur Binka Others 810 991 1071
231 320 Sonepur Dunguripalli Others 677 998 1044
232 320 Sonepur Sonepur Hydro 947 985 1088
233 320 Sundargarh Bargaon Others 639 815 829
234 321 Angul Chendipada Others 493 777 802
235 321 Angul Pallahara Hydro 779 1166 1231
236 321 Angul Pal-Lahara Others 745 968 1043
237 321 Angul Rajkishorengr Hydro 797 942 1013
238 321 Angul Rengali Hydro 702 1046 1052
239 321 Angul Talcher Hydro 685 855 893
240 321 Bhadrak Akhuapada Hydro 801 1119 1140
241 321 Bhadrak Bantala Others 599 788 1072
242 321 Bhadrak Bhadrak Others 711 1012 1019
243 321 Bhadrak Bhandari Pokhari Others 564 790 835
244 321 Bhadrak Jarpara Others 474 758 846
245 321 Bokaro Kasmar Others 503 699 780
246 321 Deogarh Barkote Others 800 1280 1467
247 321 Deogarh Deogarh /Bamra Others 769 1016 1052
248 321 Dhenkanal Dhenkanal Others 583 801 921
249 321 Dhenkanal Gondia Others 580 801 909
250 321 Dhenkanal Hindol Others 703 941 1011
251 321 Dhenkanal Kamakhyanagar Others 530 825 877
252 321 Dhenkanal Parjanga Others 566 906 1025
253 321 Gumla Bharno Others 477 700 727
254 321 Gumla Chainpur Others 563 734 816
255 321 Gumla Gumla Others 498 682 759
256 321 Gumla Palkot Others 491 752 847
257 321 Gumla Raidih Others 402 591 763
258 321 Jajpur Binjharpur Others 735 1062 1086
259 321 Jajpur Dharmasala Others 757 1016 1135
260 321 Jajpur Jajpur Others 714 949 976
261 321 Jajpur Korai Others 551 808 909
262 321 Jajpur Sukinda Others 848 1028 1069
263 321 Jashpurnagar Jashpurnagar Others 515 743 804
264 321 Kendrapada Aul Others 720 1083 1193
265 321 Kendrapada Pattamundai Others 768 958 1078
266 321 Kendrapada Rajkanika Others 748 960 998
267 321 Keonjhar Anandpur Hydro 910 1457 1617
268 321 Keonjhar Champua Others 1027 1324 1411
269 321 Keonjhar Daitari Hydro 489 782 785
270 321 Keonjhar Ghatgaon Others 681 961 989
271 321 Keonjhar Harichandpur Others 520 691 724
272 321 Keonjhar Joda Others 686 1097 1233
273 321 Keonjhar Keonjhargarh Others 645 1031 1142
274 321 Keonjhar Patna Others 554 816 876
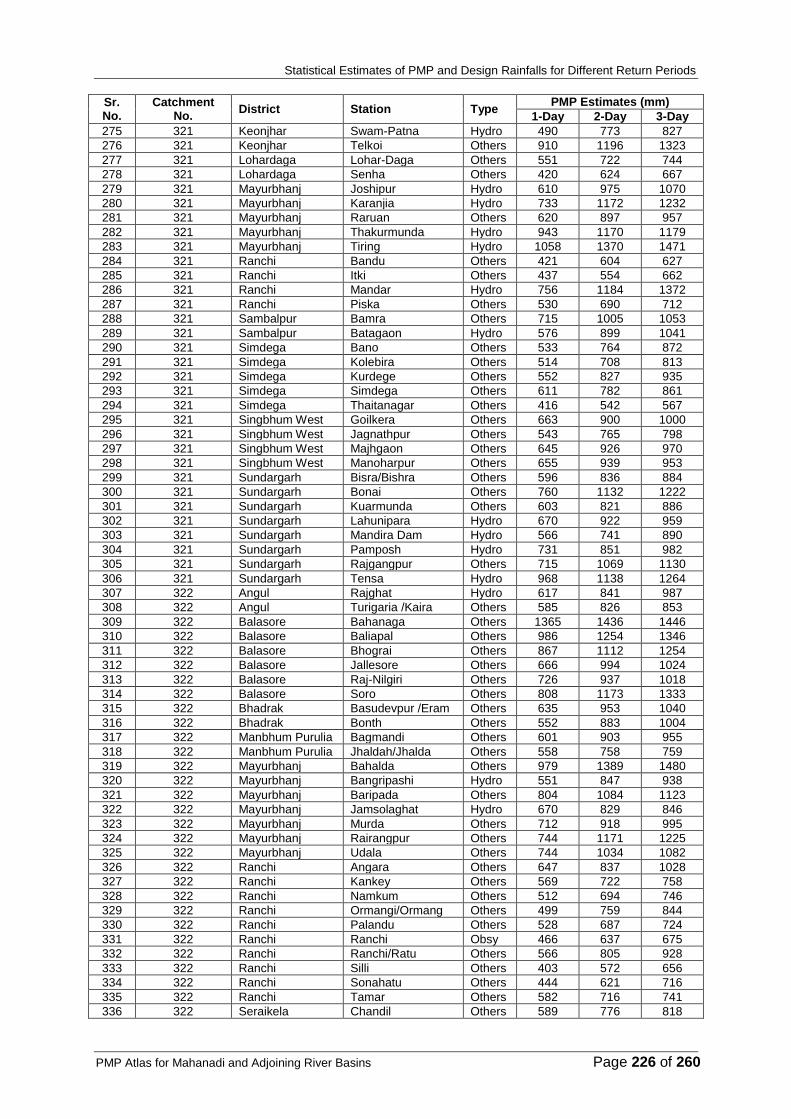
Statistical Estimates of PMP and Design Rainfalls for Different Return Periods
PMP Atlas for Mahanadi and Adjoining River Basins Page 226 of 260
Sr. No.
Catchment No.
District Station Type PMP Estimates (mm)
1-Day 2-Day 3-Day
275 321 Keonjhar Swam-Patna Hydro 490 773 827
276 321 Keonjhar Telkoi Others 910 1196 1323
277 321 Lohardaga Lohar-Daga Others 551 722 744
278 321 Lohardaga Senha Others 420 624 667
279 321 Mayurbhanj Joshipur Hydro 610 975 1070
280 321 Mayurbhanj Karanjia Hydro 733 1172 1232
281 321 Mayurbhanj Raruan Others 620 897 957
282 321 Mayurbhanj Thakurmunda Hydro 943 1170 1179
283 321 Mayurbhanj Tiring Hydro 1058 1370 1471
284 321 Ranchi Bandu Others 421 604 627
285 321 Ranchi Itki Others 437 554 662
286 321 Ranchi Mandar Hydro 756 1184 1372
287 321 Ranchi Piska Others 530 690 712
288 321 Sambalpur Bamra Others 715 1005 1053
289 321 Sambalpur Batagaon Hydro 576 899 1041
290 321 Simdega Bano Others 533 764 872
291 321 Simdega Kolebira Others 514 708 813
292 321 Simdega Kurdege Others 552 827 935
293 321 Simdega Simdega Others 611 782 861
294 321 Simdega Thaitanagar Others 416 542 567
295 321 Singbhum West Goilkera Others 663 900 1000
296 321 Singbhum West Jagnathpur Others 543 765 798
297 321 Singbhum West Majhgaon Others 645 926 970
298 321 Singbhum West Manoharpur Others 655 939 953
299 321 Sundargarh Bisra/Bishra Others 596 836 884
300 321 Sundargarh Bonai Others 760 1132 1222
301 321 Sundargarh Kuarmunda Others 603 821 886
302 321 Sundargarh Lahunipara Hydro 670 922 959
303 321 Sundargarh Mandira Dam Hydro 566 741 890
304 321 Sundargarh Pamposh Hydro 731 851 982
305 321 Sundargarh Rajgangpur Others 715 1069 1130
306 321 Sundargarh Tensa Hydro 968 1138 1264
307 322 Angul Rajghat Hydro 617 841 987
308 322 Angul Turigaria /Kaira Others 585 826 853
309 322 Balasore Bahanaga Others 1365 1436 1446
310 322 Balasore Baliapal Others 986 1254 1346
311 322 Balasore Bhograi Others 867 1112 1254
312 322 Balasore Jallesore Others 666 994 1024
313 322 Balasore Raj-Nilgiri Others 726 937 1018
314 322 Balasore Soro Others 808 1173 1333
315 322 Bhadrak Basudevpur /Eram Others 635 953 1040
316 322 Bhadrak Bonth Others 552 883 1004
317 322 Manbhum Purulia Bagmandi Others 601 903 955
318 322 Manbhum Purulia Jhaldah/Jhalda Others 558 758 759
319 322 Mayurbhanj Bahalda Others 979 1389 1480
320 322 Mayurbhanj Bangripashi Hydro 551 847 938
321 322 Mayurbhanj Baripada Others 804 1084 1123
322 322 Mayurbhanj Jamsolaghat Hydro 670 829 846
323 322 Mayurbhanj Murda Others 712 918 995
324 322 Mayurbhanj Rairangpur Others 744 1171 1225
325 322 Mayurbhanj Udala Others 744 1034 1082
326 322 Ranchi Angara Others 647 837 1028
327 322 Ranchi Kankey Others 569 722 758
328 322 Ranchi Namkum Others 512 694 746
329 322 Ranchi Ormangi/Ormang Others 499 759 844
330 322 Ranchi Palandu Others 528 687 724
331 322 Ranchi Ranchi Obsy 466 637 675
332 322 Ranchi Ranchi/Ratu Others 566 805 928
333 322 Ranchi Silli Others 403 572 656
334 322 Ranchi Sonahatu Others 444 621 716
335 322 Ranchi Tamar Others 582 716 741
336 322 Seraikela Chandil Others 589 776 818

Statistical Estimates of PMP and Design Rainfalls for Different Return Periods
PMP Atlas for Mahanadi and Adjoining River Basins Page 227 of 260
Sr. No.
Catchment No.
District Station Type PMP Estimates (mm)
1-Day 2-Day 3-Day
337 322 Seraikela Kharsawan Others 579 743 817
338 322 Seraikela Nimdih Others 552 750 860
339 322 Seraikela Seraikela Others 538 677 746
340 322 Singbhum East Bahragora Others 527 835 883
341 322 Singbhum East Chakulia Others 539 721 826
342 322 Singbhum East Ghatsila Others 490 784 870
343 322 Singbhum East Patamada Others 537 844 923
344 322 Singbhum East Potka Others 720 1094 1218
345 322 Singbhum West Chakradhanpur Others 493 733 793
346 322 Singbhum West Katbari Others 443 709 842
347 322 Singbhum West Sonua Others 541 716 796
To see the extent of variations in the magnitudes of point PMP values with reference to the highest observed rainfalls recorded at the station, a summary table (Table 4-4) has been prepared. This table gives the minimum, maximum and average values of highest observed rainfall (Pmax), point PMP estimate and ratio of PMP/Pmax for various catchments and durations. To elaborate more, if a catchment has 25 stations, the point PMP and highest rainfall are tabulated for each station and minimum, maximum and average values are picked for a catchment from 25 stations. A ratio (PMP/Pmax) is estimated for each station individually. The minimum, maximum and average values of PMP/Pmax from 25 individual stations are picked up for deriving catchment summary.
Table 4-4: Summary of maximum rainfalls, Point PMP rainfalls and their ratios obtained in the different catchments
Catchment No. Duration PMP (mm) Pmax (mm) PMP/PMax (mm)
Min Max Avg Min Max Avg Min Max Avg
318
1-Day 395 913 638 156 520 293 1.41 2.99 2.24
2-Day 588 1460 952 212 813 409 1.57 3.41 2.41
3-Day 659 1542 1036 247 889 458 1.66 3.40 2.34
319
1-Day 361 1027 613 154 458 280 1.58 2.85 2.22
2-Day 480 1409 865 191 595 376 1.40 3.17 2.35
3-Day 522 1500 940 217 804 436 1.43 3.21 2.20
320
1-Day 474 1439 725 177 825 320 1.31 3.24 2.35
2-Day 733 1950 994 249 1050 439 1.36 3.50 2.36
3-Day 759 2215 1071 260 1135 499 1.22 3.38 2.25
321
1-Day 402 1058 639 147 601 279 1.61 2.94 2.33
2-Day 542 1457 898 206 746 387 1.45 3.24 2.42
3-Day 567 1617 974 214 852 436 1.38 3.15 2.33
322
1-Day 286 1365 625 118 740 291 1.41 2.89 2.24
2-Day 422 1436 870 179 940 395 1.33 3.19 2.33
3-Day 534 1480 949 194 1035 453 1.30 3.20 2.21
4.1.5.3 Preparation of Generalized Point PMP Maps
In order to make available these PMP estimates for the use of design engineers, generalized point PMP maps for 1, 2 and 3-day durations have been prepared. The purpose of these maps is to eliminate the amount of subjectivity in PMP estimation so that uniform practices and consistent results can be achieved. The PMP estimates for 1, 2 and 3-day durations for all stations were first plotted on separate base maps of the Mahanadi and Adjoining River Basins. Isopleths of suitable intervals were then drawn taking into account the topography of the basin. Before drawing the isopleths of PMP, the CV values for all stations were plotted on separate base maps for 1, 2 and 3-day durations to see whether the CV value for a station was abnormally different from nearby stations. This is required for smoothing the inherent errors indicated by large standard deviations. As an example, if in a certain area, the CV values of different stations were of the order of say 40 to 45 % while an odd station in the area has its CV value of 60% then its CV value was adjusted to 45 %. Using this revised
value of CV the standard deviation (σn) was recalculated using the original value of for that station. The revised σn value was then used to re-compute PMP estimates for those

Statistical Estimates of PMP and Design Rainfalls for Different Return Periods
PMP Atlas for Mahanadi and Adjoining River Basins Page 228 of 260
stations whose σn values were adjusted. The resulting maps for 1 to 3-day durations are shown in Volume II (Figure 6-31 to Figure 6-33).
4.1.5.4 Use of the Point PMP Maps
The generalized maps of point PMP are useful for obtaining PMP values for durations of 1 to 3 days at any location in the Mahanadi and Adjoining River Basins without undertaking detailed statistical analysis of rainfall data. The point estimates can be converted to areal PMP estimates by using areal reduction factors. Two methods, as described below, may be used to obtain areal average PMP for any catchment area.
- Calculate the average PMP value over the catchment area and then apply areal
reduction factors: or
- Use the highest PMP in the catchment and then apply the areal reduction factors.

Statistical Estimates of PMP and Design Rainfalls for Different Return Periods
PMP Atlas for Mahanadi and Adjoining River Basins Page 229 of 260
4.2 Return Period Analysis – Mahanadi and Adjoining River Basins
As a part of the project assignment, this section is devoted to determine the point maximum rainfalls that recur on the average once in 2.33; 5; 25; 50; 100; 500; 1,000; 5,000 and 10,000 years at each of the 347 stations in the Mahanadi and Adjoining River Basins. The values may serve as a guide in hydrologic design projects in the river basin.
4.2.1 DATA SERIES FOR RAINFALL RETURN PERIOD ANALYSIS
In design problems, usually extreme values are used in frequency analysis. This is based on the philosophy that if the designed structure can withstand the highest value in a year, it can withstand all other values. Two types of data are generally selected: (1) the annual maximum series and (2) the partial duration series.
The highest observed value (daily rainfall) at any rainfall station during a year is called the annual maximum value. The annual maximum series, therefore, consists of only one highest value for each year of record. Thus, for N years of data an annual maximum series will consist of N values, one for each year.
The annual maximum series ignores the second and third highest values of a year, which may be higher than the maximum of other years in the series. This type of situation is overcome by selecting all the values above an arbitrary threshold value. The series obtained in this manner is known as a partial duration series. Therefore, a partial duration series contains the largest values greater than a base value. The lowest value is generally chosen as a base value in the annual maximum series. In a complete partial duration series, if the lowest values are truncated so that the number of values in the series is equal to the number of years of record then this truncated series is called the annual exceedance series.
Both these types of series are used in frequency analysis. It is important to mention that if the time interval between the two values is less than a year, the seasonal variation may introduce inhomogeneities in the data series. However, if the data are selected only from a particular season or month, the homogeneity may largely be maintained. Since the partial series is not a true series, the values selected may not be independent of each other and as a result such a series cannot be considered completely homogeneous and independent. Nevertheless, the use of both types of selected data for frequency analysis gives almost similar estimates for return periods of more than 10 years. The difference is significant in the lower return period values Langbein (1949).
Empirical factors have been determined for the Indian region to enable the conversion of values of an annual series to those of a partial series. The factors for conversing 2, 5 and 10-year annual values to those of partial series are 1.13, 1.04 and 1.02 respectively. For example, if 2, 5 and 10-year annual values are 5.0, 6.0 and 7.0 respectively; then 2, 5 and 10-year values based on partial series are: 5 x 1.13 = 5.65, 6.0 x 1.04 = 6.24 and 7.0 x 1.02 = 7.14.
4.2.2 DEFINITIONS AND FREQUENCY ANALYSIS
The main objective of frequency analysis of a variable (X), say rainfall, is to estimate the recurrence interval or return period (T) of a given magnitude x of a variable (X), that is, how often does the given magnitude x of the variable occur? The average interval of time within which the value x of variable X will be equaled or exceeded once is called the recurrence interval or return period. The return period is a measure of the probable time interval between the occurrence of a given event and that of an equal or greater event. If the basic data are truly representative, then, for example, a rainfall having a return period of 100 years will be equaled or exceeded, on an average, once in 100 years over a great length of time. Thus, if we have 10,000 years of record, there will be 100 such values.

Statistical Estimates of PMP and Design Rainfalls for Different Return Periods
PMP Atlas for Mahanadi and Adjoining River Basins Page 230 of 260
If a hydro meteorological variable (X) equal to or greater than x occurs on the average once in T years, then the probability of occurrence P(X ≥ x) of such a variable is
T
xXP1
)( (4.4)
)(
1
xXPT
(4.5)
The probability that x will not occur is
)(1)( xXPxXP (4.6)
T
xXP1
1)( (4.7)
)(1
1
xXPT
(4.8)
The concept of a return period does not imply that an event of a determined value occurs at regular intervals of T years or that having occurred once, it will not occur again for the next T years. It means that when calculated over a long period of record the probable mean interval between two events of the determined magnitude is equal to the return period T. For example, a rainfall value of the 30-year return period over a long period of record, say 600 years, will occur 20 times or in any one year there is a 3.3 percent chance that a rainfall of this value will occur P = 1/T= 1/30= 3.3%. Furthermore, it says nothing as to by what amount and how many times can this rainfall value be exceeded during a period of 30 years?
The standard method for estimation of rainfalls for different return periods is to fit a theoretical frequency distribution to the annual maximum rainfall data series and estimate parameters by the statistical methods. The choice of an appropriate distribution is often difficult because of the many distributions in use. Of the many existing theoretical distributions amongst these include, lognormal, Gumbel, log Gumbel, Pearson type III, log Pearson type III, Weibull, GEV and so on. Huff and Neill (1959) compared several frequency distributions for the determination of rainfall frequency relations using rainfall data of stations in Illinois in the USA and found that none of the distributions had any marked superiority over the other. Therefore, the questions of better fit among these several distributions is always an alternative one and many studies with this theme have been reported. Hershfield and Kohlar (1960) and Reich (1963) after comparing several distributions concluded that the Gumbel extreme value distribution fits the data reasonably well. As such the fitting of Gumbel extreme value distribution has been used to determine the point maximum rainfall for different return periods.
The fitted distribution can be used not only to interpolate, but also to extrapolate; that is to find return periods of maximum rainfalls that were not apparent during the relative short periods of records.
4.2.3 GUMBEL’S EXTREME VALUE (EV1) DISTRIBUTION
According to Gumbel (1958), the cumulative probability that any extreme value of a variable X will be equal to or less than x for Gumbel distribution is given by:

Statistical Estimates of PMP and Design Rainfalls for Different Return Periods
PMP Atlas for Mahanadi and Adjoining River Basins Page 231 of 260
,
Then, yux
1 . Parameters and u are evaluated by the method of moments as:
78.061
(4.10)
cxu (4.11)
c = Euler’s constant = 0.58. Therefore,
45.0 xu
yxx .78.045.0
By definition,
x and are the mean and the SD of a given series of data and then parameters (scale
parameter) and u( location parameter) can be obtained. Thus, for any value of X, T can be calculated. The fitted distribution can be used not only to interpolate but also extrapolate i.e., to find return periods of extreme values that were not apparent during the relatively short periods of records.
4.2.4 ESTIMATION OF PARAMETERS BY L-MOMENTS
L-Moments are based on probability-weighted moments (PWMs), however provide a greater degree of accuracy and ease. L-Moments are a modification of the PWMs, as they use the PWMs to calculate parameters that are easier to interpret and that can be used in the calculation of parameters for statistical distributions. L-Moments are based on linear combinations of data. They provide an advantage, as they are easy to work with, and more reliable as they are less sensitive to outliers. The method of L-Moments calculates more accurate parameters than the Method of Moments (MoM) technique (Kochanek, 2010). The MoM techniques only apply to a limited range of parameters, whereas L-Moments can be
more widely used, and are nearly unbiased (Rowinski, 2001). The four L-Moments (λ1, λ2,
λ3, λ4) are derived using the four PWMs.
(4.15)
(4.16)
(4.17)
(4.18)

Statistical Estimates of PMP and Design Rainfalls for Different Return Periods
PMP Atlas for Mahanadi and Adjoining River Basins Page 232 of 260
Where M100, M110, M120, and M130 are the four probability-weighted moments, which are defined as
(4.19)
(4.20)
(4.21)
(4.22)
in which N is the sample size, Q is the data value, and i is the rank of the value in ascending order. After Estimating the 4 L- Moments ((λ1, λ2, λ3, λ4), the Gumbel parameters α (scale parameter) and u (location parameter) can be obtained as
λ
(4.23)
(4.24)
in which c=0.58 (Euler’s Constant). In addition to above four movements, L-CV, L-Skewness and L-Kurtosis are used for the distribution fitting.
L-CV is similar to the normal coefficient of variation (CV). The larger the CV value, the larger the variation of the data set from the mean. For example, in arid regions that receive few storm events, the variation will be large, as one storm will deviate greatly from the low mean.
(4.25)
L-Skewness is a measure of the lack of symmetry in a distribution. If the value is negative, the left tail is long compared with the right tail, and if the value is positive, the right tail is longer. For GEV frequency analysis, a positive L-Skewness value is desired, as we are interested in the extreme events that occur in the right side tail of the distribution.
(4.26)
L-Kurtosis is difficult to interpret, however is often described as the measure of “peakedness” of the distribution (Hosking, 1997). L-kurtosis is much less biased than ordinary kurtosis.
(4.27)
4.2.5 ESTIMATION OF PARAMETERS BY LEAST SQUARES
The Gumbel method provides a straight-line fit in the x and y plane. It has been pointed out by several researchers that estimating the Gumbel distribution parameters by the method of moments may sometimes not be satisfactory. It has also been found that the method of moments does not give as good a fit as does the method of least squares. The use of the least square method was, therefore, recommended by Chow (1953). One can write:
ByAx (4.28)
Where, A and B are parameters which are given by the least square method as:
]1
[loglog
T
Ty ee (4.29)

Statistical Estimates of PMP and Design Rainfalls for Different Return Periods
PMP Atlas for Mahanadi and Adjoining River Basins Page 233 of 260
n
yB
n
xA
(4.30)
22 yny
yxn
yxnxy
B (4.31)
The value of T can be obtained by the use of a plotting position formula. For the Gumbel model, the Weibull formula is most appropriate.
4.2.6 95 % CONFIDENCE INTERVAL FOR DIFFERENT RETURN PERIOD VALUES BASED ON
GUMBEL DISTRIBUTION
The return periods calculated by the Gumbel method are subject to statistical error because the estimation is made on the basis of a limited data series. Therefore, there is a change that the estimated value will be too high or too low. It is necessary to calculate confidence limits between which the estimated value can be said to lie with a certain probability. To obtain confidence limits of an estimated rainfall value at any desired level, an estimate of the standard error of the distribution of parameters is required.
A confidence interval gives an estimated range of values, which is likely to include an unknown population parameter. The 95% confidence intervals for different return periods have been computed using Se of estimates.
Return period value for any period can be estimated using the following equation
TT KuX^^
(4.32)
Lowery and Nash (1972) derived the expression for standard error (s.e) for the estimated
parameters of ^^
,u
)/2(168.1)var( nu
(4.33)
)/2(10.1)var( n
(4.34)
)/2(096.0),cov( nu
(4.35)
Where n is the sample size. Using the above values eq. 4.33 can be written as
),cov(.2)var()var()var(2
uKKuX TTT
(4.36)
) (Xvar )(X se TT
(4.37)
Therefore, confidence limits at 95% confidence level are given as,
)(X 1.96seX(LL)Limit Lower TT
(4.38)
)(X 1.96seX(UL)Limit Upper TT
(4.39)
Using 4.38 and 4.39 confidence limits were calculated.
Goodness of fit of Gumbel distribution was tested by Chi-square and Kolmogorov-Smironov (K-S) tests at 5% level of significance. Chi-square test resulted in acceptance for 318
Statistical Estimates of PMP and Design Rainfalls for Different Return Periods
PMP Atlas for Mahanadi and Adjoining River Basins Page 234 of 260
stations and rejection of 48 stations, whereas K-S test resulted in acceptance for 362 stations and rejection of four stations. Out of 366 stations, four stations were rejected by both tests.
The data of annual maximum rainfall series for durations of 1, 2 and 3 days for each of the 347 stations were subjected to Gumbel’s distribution and estimates of maximum 1, 2 and 3 day rainfalls for the return periods of 2.33; 5; 10; 25; 50; 100; 500; 1,000; 5,000 and 10,000 were determined. The design rainfalls for different return periods together with their confidence limits are given Volume II (Table 6-1 to Table 6-3) for 1-day, 2-day and 3-day respectively.
The maximum 1-day, 2-day and 3-day rainfall values for all stations were plotted for each return period on separate maps of the Mahanadi and Adjoining River Basins and smooth isohyets of rainfall were then drawn at appropriate intervals so as to prepare generalized maps. The spatial distribution of the point values of maximum rainfall values for return periods of 2.33; 5; 10; 25; 50; 100; 500; 1,000; 5,000 and 10,000 years are shown in Volume II (Figure 6-1 to Figure 6-30).

Annexure
PMP Atlas for Mahanadi and Adjoining River Basins Page 235 of 260
5 Annexure Table 5-1: Maximum rainfall in various sub-durations of selected 12-hour rainspells for Catchment 318 and TD coefficients
Catchment No. 318 Average Rainfall
(mm) TD Coefficient
(%) Sub-durations
(hours)
Maximum Rainfall (mm)
Bhubaneshwar Gannavaram (A) Kakinada Kalingpatnam Machilipatnam Puri
1 90.0 53.5 26.0 45.5 42.0 61.0 48.5 30.0 80.0 90.0 56.7 22.5
2 140.5 104.5 460.0 76.0 73.0 91.0 80.5 57.9 111.5 150.0 93.1 36.9
3 180.5 144.0 63.0 110.5 100.0 119.8 95.5 82.4 121.5 217.0 123.4 48.9
4 185.5 163.0 83.0 128.4 140.0 169.8 104.2 106.5 130.5 277.0 148.8 59.0
5 193.5 173.5 102.0 147.7 159.3 197.8 110.7 128.5 136.7 335.0 168.5 66.8
6 202.5 180.0 108.8 165.6 183.5 209.8 113.7 149.0 145.7 372.0 183.1 72.6
7 212.5 184.0 118.5 179.3 202.0 215.3 130.2 169.5 148.0 430.0 198.9 78.9
8 217.5 187.2 127.0 192.9 219.5 227.3 138.9 178.3 158.0 462.0 210.9 83.6
9 218.5 193.1 145.0 211.2 235.3 230.5 179.2 185.3 164.0 479.0 224.1 88.8
10 221.0 199.6 165.0 224.9 251.6 231.1 200.7 190.9 173.2 490.6 234.9 93.1
11 241.2 202.8 175.2 235.2 264.6 234.3 212.5 196.3 176.2 499.7 243.8 96.7
12 246.2 203.1 183.4 245.5 302.5 235.0 221.2 201.5 177.1 506.9 252.2 100.0
Table 5-2: Maximum rainfall in various sub-durations of selected 12-hour rainspells for Catchment 319 and TD coefficients
Catchment No. 319 Average Rainfall
(mm) TD Coefficient
(%) Sub-durations (hours) Maximum Rainfall (mm)
Jharsuguda Kanker Raigarh
1 31.7 26.5 30.5 27.9 12.6 16.7 52.0 36.1 29.0 29.2 22.1
2 63.2 47.8 50.5 31.9 20.6 30.0 97.5 64.2 44.0 50.0 37.8
3 72.5 65.1 70.0 33.2 24.9 40.5 114.7 79.6 59.0 62.2 47.0
4 94.5 75.1 83.5 57.7 32.4 50.5 125.5 84.6 74.0 75.3 56.9
5 106.7 85.1 95.0 62.4 39.0 60.5 135.2 88.2 85.2 84.1 63.6
6 117.0 93.8 108.5 63.9 44.6 72.0 139.8 96.6 94.2 92.3 69.8
7 131.0 105.3 113.5 65.4 49.0 82.5 146.6 101.6 98.2 99.2 75.0
8 131.7 123.4 120.0 66.9 54.6 89.5 152.0 105.5 106.2 105.5 79.8
9 132.7 141.8 125.0 68.1 59.9 94.8 162.7 110.6 108.7 111.6 84.4
10 142.0 159.1 126.0 69.1 69.6 97.8 165.2 129.6 112.5 119.0 90.0
11 151.2 169.1 126.4 73.4 77.1 110.2 171.9 136.6 115.8 125.7 95.1
12 165.2 179.1 126.7 76.2 80.6 120.7 176.0 147.4 118.3 132.2 100.0

Annexure
PMP Atlas for Mahanadi and Adjoining River Basins Page 236 of 260
Table 5-3: Maximum rainfall in various sub-durations of selected 12-hour rainspells for Catchment 320 and TD coefficients
Catchment No. 320 Average Rainfall
(mm) TD Coefficient
(%) Sub-durations (hours) Maximum Rainfall (mm)
Hirakud Jenapur Narsingpur
1 43.8 15.5 16.0 26.0 27.2 19.0 16.8 27.5 18.0 23.3 18.1
2 44.7 25.2 30.5 51.4 54.2 32.5 26.8 45.5 35.7 38.5 29.9
3 46.4 38.5 44.5 65.4 77.2 45.4 34.7 66.5 51.3 52.2 40.6
4 52.6 47.5 56.5 78.2 95.7 56.0 42.1 82.4 58.4 63.3 49.2
5 55.0 56.4 69.9 85.4 108.2 72.0 52.1 92.4 63.1 72.7 56.6
6 58.9 67.5 75.9 85.7 112.4 82.0 59.7 102.4 69.0 79.3 61.7
7 76.4 69.3 76.8 87.0 115.5 90.5 66.6 117.5 84.8 87.2 67.8
8 88.9 76.5 82.4 94.2 123.2 101.0 75.0 136.5 90.1 96.4 75.0
9 90.9 87.6 91.9 107.1 132.7 106.0 78.0 156.5 91.1 104.6 81.4
10 92.5 89.2 99.1 124.3 147.2 111.9 84.1 172.4 91.4 112.5 87.5
11 96.8 94.7 104.9 138.3 163.2 115.9 97.1 183.4 91.7 120.7 93.8
12 101.8 101.2 113.4 145.5 184.2 120.6 107.1 189.4 94.1 128.6 100.0
Table 5-4: Maximum rainfall in various sub-durations of selected 12-hour rainspells for Catchment 321 and TD coefficients
Catchment No. 321 Average Rainfall
(mm)
TD Coefficient
(%) Sub-durations (hours)
Maximum Rainfall (mm)
Gondia Paradip Port Talcher Telkoi
1 32 50.4 65.4 35.5 37.2 40 84 60 33.5 39 47.7 24.7
2 56.5 97.4 80.7 67.5 42.7 77 119.5 100 53.5 59 75.4 39.0
3 76.5 134.9 89.3 84 57 87 164 130 73.5 85 98.1 50.8
4 85.7 172.4 90.7 89.5 72.1 101 184 170 84.5 105 115.5 59.7
5 94.6 186.5 96.1 96.5 86.1 106 197 200 101.5 121 128.5 66.5
6 100.3 205.9 97.6 111.4 107.6 112 207.8 230 112.5 130 141.5 73.2
7 109.2 218.4 99.9 116.9 122.1 120 216.5 270 128 134 153.5 79.4
8 114.7 224.4 102.6 121.2 129.6 131 220.8 310 135.8 141.9 163.2 84.4
9 117.4 229.9 106.5 126.7 150.5 136 221.6 332 141.5 161.9 172.4 89.2
10 121.3 234 115.1 128.2 158.6 138 223.3 350 156.7 177.9 180.3 93.3
11 124 234.8 119.4 128.9 172.6 139 223.9 366 168 189.9 186.7 96.6
12 124.8 235.4 120.8 129.9 201.1 141 224 370 183.2 202.4 193.3 100.0

Annexure
PMP Atlas for Mahanadi and Adjoining River Basins Page 237 of 260
Table 5-5: Maximum rainfall in various sub-durations of selected 12-hour rainspells for Catchment 322 and TD coefficients
Catchment No. 322
Average Rainfall (mm) TD Coefficient (%) Sub-durations (hours)
Maximum Rainfall (mm)
Ghatsila Jamshedpur P.B.O. Rajghat Ranchi (A)
1 20.6 28.8 23.3 28 14 29.5 18 33.5 22.5 24.2 22.5
2 38.8 46.1 44.3 43.5 27.3 56.2 24 56.4 32.5 41.0 38.1
3 56.8 56 64.3 55 35.5 76.7 29.5 68.3 37 53.2 49.5
4 65.3 67.3 75.8 70.5 42.5 94.2 35 75.3 41.5 63.0 58.6
5 73.3 86.9 88.1 74.5 50.7 96.7 40 87.1 56 72.6 67.5
6 75.3 104.3 99.6 76 56.9 99.1 51 99.8 66 80.9 75.2
7 77.3 109.9 111.1 78.7 58.2 100.3 56.5 104.9 70.5 85.3 79.3
8 79.4 124.8 116.4 80 59.7 100.8 62 115.1 74.5 90.3 84.0
9 89.4 130.6 123.1 80.4 64 102.1 65.5 119.8 79 94.9 88.2
10 97.9 136.2 126.3 81.5 68 103.8 67.9 123.6 79.7 98.3 91.4
11 107.2 156.5 129.3 84 75.9 104.9 69.1 128 81.7 104.1 96.8
12 115.7 162.1 131.1 85.3 82 105.4 71.5 131.1 83.7 107.5 100.0
Table 5-6: Maximum rainfall in various sub-durations of selected 24-hour rainspells for Catchment 318 and TD coefficients
Catchment No. 318 Average Rainfall
(mm)
TD Coefficient
(%) Sub-durations
(hours)
Maximum Rainfall (mm)
Puri Kalingpatnam Vizg Rsrw Gannavaram (A) Machilipatnam Bhubaneshwar Kakinada
1 49.0 90.0 34.4 44.2 61.0 34.2 29.5 26.0 14.0 48.5 33.5 30.0 90.0 53.5 48.0 30.0 45.5 32.2 42.0 42.2 17.7
2 87.5 150.0 59.3 70.0 91.0 64.2 56.0 46.0 19.0 80.5 57.5 57.9 140.5 104.5 86.0 59.0 74.5 63.7 73.0 68.8 28.9
3 101.8 217.0 66.4 98.5 119.8 94.2 73.5 63.0 27.5 95.5 72.8 82.0 180.5 144.0 95.2 70.0 81.6 86.2 100.0 87.3 36.7
4 112.4 277.0 74.2 127.0 169.8 118.0 88.0 83.0 36.5 104.2 85.3 104.0 185.5 163.0 126.2 86.3 88.1 87.2 140.0 104.9 44.1
5 119.3 335.0 82.7 138.5 197.8 146.0 104.0 102.0 42.2 110.7 92.8 124.5 193.5 173.5 147.2 96.3 106.4 93.7 159.3 119.0 50.0
6 129.9 372.0 98.8 146.0 209.8 166.2 126.5 108.8 52.0 113.7 101.6 145.0 202.5 177.5 156.7 102.2 112.4 111.6 183.5 130.5 54.8
7 133.1 430.0 123.7 151.3 215.3 186.2 137.7 118.5 61.0 130.2 105.3 153.8 212.5 178.7 157.9 109.0 128.3 121.3 202.0 140.3 58.9
8 135.7 462.0 135.2 172.0 227.3 206.0 148.7 127.0 69.0 138.9 111.6 159.0 217.5 182.6 157.9 121.6 141.5 134.7 219.5 150.1 63.1
9 139.2 479.0 142.3 203.0 230.5 214.5 158.2 145.0 74.5 179.2 122.3 160.9 218.5 193.1 158.7 136.3 161.7 138.1 235.3 160.2 67.3
10 142.4 490.6 148.3 214.5 231.1 219.0 162.7 165.0 80.5 200.7 136.8 160.9 221.0 193.4 158.7 146.8 188.3 146.1 251.6 167.5 70.4
11 156.2 499.7 153.5 222.0 234.3 231.7 175.9 175.2 87.5 212.5 145.3 161.0 241.2 194.4 159.3 158.0 195.4 148.1 264.6 174.4 73.3
12 168.2 506.9 156.8 224.5 235.0 251.7 192.6 183.4 91.5 221.2 149.0 163.7 246.2 195.1 159.8 171.6 201.9 148.5 302.5 182.8 76.8
13 178.8 507.7 164.0 228.5 235.6 259.8 203.8 188.9 99.5 221.6 154.8 165.5 251.0 195.9 160.9 185.3 206.6 153.0 316.5 189.6 79.7
14 188.3 507.9 171.1 244.4 246.3 265.4 207.8 192.4 102.8 225.4 155.5 167.5 253.3 198.9 161.9 198.9 208.0 169.0 334.5 195.8 82.3

Annexure
PMP Atlas for Mahanadi and Adjoining River Basins Page 238 of 260
Catchment No. 318 Average Rainfall
(mm)
TD Coefficient
(%) Sub-durations
(hours)
Maximum Rainfall (mm)
Puri Kalingpatnam Vizg Rsrw Gannavaram (A) Machilipatnam Bhubaneshwar Kakinada
15 190.9 514.0 175.3 255.9 246.6 267.1 211.8 195.7 105.8 235.8 158.3 169.6 259.5 202.9 162.4 200.6 212.0 188.6 358.7 201.6 84.7
16 194.0 521.2 179.8 263.4 250.1 270.1 215.8 196.9 110.0 236.2 162.0 170.0 264.5 205.4 162.4 203.3 224.5 196.5 360.7 205.7 86.4
17 197.6 522.0 183.0 263.9 250.8 271.9 217.2 198.6 115.5 236.8 170.0 173.9 267.8 222.2 163.9 215.0 242.2 224.0 371.8 212.2 89.2
18 199.1 522.2 184.6 264.5 250.8 277.1 220.3 201.6 121.5 239.4 173.0 183.5 268.3 232.7 177.9 228.6 247.5 235.5 393.4 217.5 91.4
19 200.2 522.8 188.8 264.7 251.2 279.9 221.5 203.9 128.5 244.1 182.5 185.7 268.3 236.8 191.9 242.1 252.0 248.9 398.2 222.1 93.3
20 221.5 523.0 190.5 264.9 252.8 282.7 222.2 204.4 133.2 246.3 193.5 194.3 271.0 247.3 208.2 248.6 253.2 252.3 403.1 226.7 95.2
21 233.5 523.1 196.3 265.1 253.8 285.2 223.3 204.8 140.5 248.0 199.5 195.5 274.3 247.6 208.2 257.6 253.8 260.3 404.5 229.7 96.5
22 243.0 526.3 201.7 265.6 256.3 288.7 223.3 205.9 145.2 253.9 207.5 210.0 274.3 247.6 208.4 269.1 254.5 261.0 405.3 233.2 98.0
23 244.5 534.2 207.9 266.0 256.8 294.1 223.5 206.2 148.5 257.2 207.5 211.2 276.5 251.6 208.9 279.4 256.6 261.1 405.9 235.9 99.1
24 244.6 534.4 212.3 266.0 259.2 294.2 223.5 206.8 150.2 257.6 207.6 211.6 279.8 258.6 208.9 285.3 268.2 261.1 409.0 238.0 100.0
Table 5-7: Maximum rainfall in various sub-durations of selected 24-hour rainspells for Catchment 319 and TD coefficients
Catchment No. 319 Average Rainfall
(mm) TD Coefficient
(%) Sub-durations (hours) Maximum Rainfall (mm)
Kanker Jharsuguda
1 16.7 26.5 52.0 36.1 52.0 26.5 26.5 33.8 17.5
2 30.0 48.0 97.5 64.2 97.5 47.8 47.8 61.8 32.0
3 40.5 63.5 114.7 79.6 114.7 65.1 65.1 77.6 40.2
4 50.5 67.7 125.5 84.6 125.5 75.1 75.1 86.3 44.7
5 60.5 71.3 135.2 88.2 135.2 85.1 85.1 94.4 48.9
6 72.0 74.4 139.8 96.6 139.8 93.8 93.8 101.5 52.6
7 82.5 74.6 146.6 101.6 146.6 105.3 105.3 108.9 56.4
8 89.5 74.7 152.0 105.5 152.0 123.4 123.4 117.2 60.7
9 96.0 74.8 162.7 110.6 162.7 141.8 141.8 127.2 65.9
10 101.3 75.8 165.2 129.6 165.2 159.1 159.1 136.5 70.7
11 110.2 78.5 166.3 136.6 171.9 169.1 169.1 143.1 74.1
12 120.7 83.2 167.3 147.4 176.0 179.1 179.1 150.4 77.9
13 127.2 91.0 173.5 150.6 183.5 186.1 186.1 156.9 81.2
14 132.5 100.0 178.9 154.5 190.8 188.9 188.9 162.1 83.9
15 137.8 104.2 181.4 157.0 191.9 191.4 191.4 165.0 85.5
16 146.7 107.6 182.0 159.2 198.1 195.3 195.3 169.2 87.6
17 154.2 110.7 184.5 161.0 203.5 202.5 202.5 174.1 90.2
18 163.7 114.2 186.0 161.8 214.2 205.3 205.3 178.6 92.5

Annexure
PMP Atlas for Mahanadi and Adjoining River Basins Page 239 of 260
Catchment No. 319 Average Rainfall
(mm) TD Coefficient
(%) Sub-durations (hours) Maximum Rainfall (mm)
Kanker Jharsuguda
19 168.2 118.5 186.3 162.1 219.2 207.0 207.0 181.2 93.9
20 170.7 128.0 186.5 162.1 220.3 209.5 209.5 183.8 95.2
21 172.5 135.5 187.3 162.1 221.3 209.8 210.5 185.6 96.1
22 175.0 150.5 188.7 162.4 225.0 210.8 210.8 189.0 97.9
23 177.0 154.7 189.1 164.6 230.4 211.6 211.8 191.3 99.1
24 179.2 157.8 189.3 165.4 235.4 211.7 212.6 193.1 100.0
Table 5-8: Maximum rainfall in various sub-durations of selected 24-hour rainspells for Catchment 320 and TD coefficients
Catchment No. 320 Average Rainfall
(mm) TD Coefficient
(%) Sub-durations (hours) Maximum Rainfall (mm)
Jenapur Hirakud Narsingpur
1 26.0 16.0 74.0 12.9 27.5 19.6 29.3 14.3
2 51.4 30.5 140.0 25.3 45.5 37.6 55.1 26.9
3 65.4 44.5 212.0 34.0 62.3 51.3 78.3 38.2
4 78.2 56.5 256.0 38.0 73.3 58.4 93.4 45.6
5 78.5 69.9 281.0 46.0 81.0 63.1 103.3 50.4
6 79.5 75.9 297.0 53.5 97.5 69.0 112.1 54.7
7 87.0 77.4 304.0 63.0 117.5 84.8 122.3 59.7
8 93.5 82.4 311.3 70.6 130.0 90.1 129.7 63.3
9 107.1 91.9 316.0 76.9 141.0 91.1 137.3 67.0
10 124.3 99.1 332.0 81.6 147.0 91.4 145.9 71.2
11 138.3 104.9 340.5 85.6 154.0 91.7 152.5 74.4
12 138.3 113.4 347.5 91.5 157.2 94.1 157.0 76.6
13 138.3 122.1 354.8 96.5 158.0 96.5 161.0 78.6
14 141.3 131.4 358.3 100.5 160.5 101.1 165.5 80.8
15 142.0 134.9 359.8 104.0 160.7 115.2 169.4 82.7
16 142.7 140.9 363.3 108.0 161.2 133.2 174.9 85.4
17 142.7 143.4 364.3 117.5 161.4 150.9 180.0 87.9
18 142.7 145.0 366.3 125.1 163.5 154.0 182.8 89.2
19 142.8 146.5 371.8 131.4 172.3 157.1 187.0 91.3
20 143.4 154.7 374.8 137.2 173.3 159.8 190.5 93.0
21 143.4 156.2 381.8 141.9 175.3 160.0 193.1 94.3
22 143.4 156.2 385.3 146.0 176.2 176.2 197.2 96.3
23 155.6 156.2 388.8 151.8 176.7 180.7 201.6 98.4
24 165.6 156.4 389.8 156.8 177.6 183.0 204.9 100.0

Annexure
PMP Atlas for Mahanadi and Adjoining River Basins Page 240 of 260
Table 5-9: Maximum rainfall in various sub-durations of selected 24-hour rainspells for Catchment 321 and TD coefficients
Catchment No. 321 Average
Rainfall (mm)
TD Coefficient
(%) Sub-durations (hours)
Maximum Rainfall (mm)
Gondia Paradip Port Talcher Telkoi Champua
1 50.4 35.5 17.0 37.2 84.0 60.0 42.0 33.5 39.0 40.0 43.9 17.3
2 97.4 68.5 31.0 42.7 119.5 100.0 62.0 53.5 59.0 66.0 70.0 27.7
3 134.9 86.5 42.0 57.0 164.0 130.0 92.0 73.5 85.0 85.5 95.0 37.6
4 172.4 98.5 49.5 72.1 184.0 170.0 117.5 84.5 105.0 98.0 115.2 45.5
5 186.5 105.0 60.0 86.1 197.0 200.0 136.5 101.5 121.0 105.0 129.9 51.3
6 205.9 111.0 68.0 107.6 207.8 230.0 149.5 112.5 130.0 119.9 144.2 57.0
7 218.4 115.5 75.0 122.1 216.5 270.0 161.0 128.0 134.0 139.4 158.0 62.4
8 224.4 120.5 83.5 129.6 220.8 310.0 174.0 135.8 138.0 150.9 168.8 66.7
9 229.9 122.5 91.5 150.5 221.6 332.0 179.5 140.3 161.9 160.0 179.0 70.7
10 234.0 127.5 98.5 158.6 223.3 350.0 182.9 156.7 177.9 164.7 187.4 74.1
11 234.8 137.8 105.5 172.6 223.9 366.0 190.0 167.7 189.9 169.1 195.7 77.4
12 235.4 149.8 113.5 201.1 224.0 371.5 195.5 183.2 202.4 172.6 204.9 81.0
13 235.7 156.8 120.5 208.1 224.5 387.5 217.7 189.5 214.4 180.4 213.5 84.4
14 238.7 162.8 127.5 211.6 224.5 395.0 231.7 194.0 225.4 189.5 220.1 87.0
15 244.7 165.8 135.5 214.6 228.5 404.0 244.7 197.5 229.4 191.0 225.6 89.2
16 246.0 167.3 143.0 220.6 241.2 411.5 256.7 214.0 233.4 192.0 232.6 91.9
17 246.8 171.9 150.0 225.1 254.2 419.3 263.2 229.5 235.9 192.9 238.9 94.4
18 247.0 182.9 154.8 227.6 262.9 422.7 266.6 234.0 236.7 202.5 243.8 96.4
19 247.4 188.9 155.8 231.1 263.7 425.2 272.7 234.7 236.9 205.0 246.1 97.3
20 247.9 188.9 156.8 233.6 270.2 426.6 279.2 236.3 236.9 208.4 248.5 98.2
21 248.7 189.2 157.3 234.1 271.0 427.6 281.7 236.3 236.9 209.9 249.3 98.5
22 249.3 190.7 159.3 234.5 272.7 429.7 287.7 236.3 238.2 210.3 250.9 99.2
23 250.6 190.7 160.8 235.7 272.8 432.1 289.4 236.3 239.2 210.4 251.8 99.5
24 251.4 190.7 161.1 235.9 273.3 433.1 292.9 236.3 244.9 210.4 253.0 100.0
Table 5-10: Maximum rainfall in various sub-durations of selected 24-hour rainspells for Catchment 322 and TD coefficients
Catchment No. 322
Average Rainfall (mm) TD Coefficient (%) Sub-durations (hours)
Maximum Rainfall (mm)
Ghatsila
1 20.6 20.6 13.1
2 38.8 38.8 24.7
3 56.8 56.8 36.1
4 65.3 65.3 41.5
5 73.3 73.3 46.6

Annexure
PMP Atlas for Mahanadi and Adjoining River Basins Page 241 of 260
Catchment No. 322
Average Rainfall (mm) TD Coefficient (%) Sub-durations (hours)
Maximum Rainfall (mm)
Ghatsila
6 76.5 76.5 48.7
7 78.5 78.5 49.9
8 80.5 80.5 51.2
9 89.4 89.4 56.9
10 97.9 97.9 62.3
11 107.2 107.2 68.2
12 115.7 115.7 73.6
13 121.7 121.7 77.4
14 124.9 124.9 79.5
15 126.9 126.9 80.7
16 127.7 127.7 81.2
17 129.2 129.2 82.2
18 141.7 141.7 90.1
19 147.7 147.7 94.0
20 149.7 149.7 95.2
21 149.7 149.7 95.2
22 150.7 150.7 95.9
23 155.2 155.2 98.7
24 157.2 157.2 100.0
Table 5-11: TD coefficients for entire Mahanadi and Adjoining River Basins for 24-hour rainspells (rainspells having rainfall greater than 250 mm and rainspells having rainfall less than 250 mm)
Sub-durations (hours) Rainspells less than 250 mm Rainspells greater than 250 mm All Rainspells
Average Rainfall, mm TD Coefficient (%) Average Rainfall, mm TD Coefficient (%) Average Rainfall, mm TD Coefficient (%)
1 32.5 16.9 55.1 17.6 39.5 17.2
2 53.8 28.0 93.1 29.7 65.9 28.7
3 67.9 35.3 126.3 40.3 85.9 37.4
4 79.8 41.5 152.9 48.8 102.3 44.6
5 89.8 46.7 172.0 54.9 115.1 50.1
6 99.1 51.5 186.7 59.6 126.0 54.9
7 106.9 55.6 202.2 64.5 136.2 59.4
8 114.1 59.3 216.5 69.1 145.6 63.4
9 122.6 63.8 229.3 73.2 155.4 67.7
10 129.7 67.5 239.1 76.3 163.3 71.2
11 136.3 70.9 247.3 78.9 170.5 74.3
12 144.4 75.1 254.9 81.4 178.4 77.8

Annexure
PMP Atlas for Mahanadi and Adjoining River Basins Page 242 of 260
Sub-durations (hours) Rainspells less than 250 mm Rainspells greater than 250 mm All Rainspells
Average Rainfall, mm TD Coefficient (%) Average Rainfall, mm TD Coefficient (%) Average Rainfall, mm TD Coefficient (%)
13 151.3 78.7 261.4 83.4 185.2 80.7
14 156.5 81.4 268.8 85.8 191.1 83.3
15 160.4 83.5 276.5 88.2 196.1 85.5
16 164.7 85.7 282.2 90.0 200.9 87.5
17 170.1 88.5 289.8 92.5 206.9 90.2
18 174.7 90.9 295.3 94.2 211.8 92.3
19 178.5 92.9 299.4 95.5 215.7 94.0
20 182.4 94.9 302.7 96.6 219.5 95.6
21 184.7 96.1 305.3 97.4 221.8 96.6
22 188.0 97.8 308.0 98.3 224.9 98.0
23 190.4 99.1 310.8 99.2 227.5 99.1
24 192.2 100.0 313.4 100.0 229.5 100.0
Table 5-12: Maximum rainfall in various sub-durations of selected 48-hour rainspells for Catchment 318 and TD coefficients
Catchment No. 318 Average
Rainfall (mm)
TD Coefficient
(%) Sub-durations (hours)
Maximum Rainfall (mm)
Bhubaneshwar Gannavaram (A) Kakinada Machilipatnam Puri
1 90.0 14.0 66.7 42.0 20.0 33.5 80.0 34.4 13.0 43.7 11.5
3 180.5 27.5 86.2 100.0 51.0 82.4 121.5 66.4 37.8 83.7 21.9
6 202.5 52.0 141.7 183.5 73.9 149.0 145.7 98.8 65.0 123.6 32.4
9 218.5 74.5 194.1 235.3 91.0 185.3 164.0 142.3 87.0 154.7 40.5
12 246.2 91.5 224.5 302.5 109.5 192.4 177.1 156.8 105.0 178.4 46.8
15 259.5 105.8 283.6 358.7 128.0 197.0 205.1 175.3 132.5 205.1 53.7
18 270.4 121.5 293.7 393.4 153.1 201.5 221.1 197.6 156.5 223.2 58.5
21 274.3 140.5 329.2 422.1 170.6 218.8 259.8 214.2 170.3 244.4 64.1
24 302.2 150.5 335.5 435.5 181.0 241.5 277.0 231.8 185.8 260.1 68.2
27 303.8 162.8 349.9 443.1 186.9 243.2 287.9 243.7 199.8 269.0 70.5
30 309.8 175.0 374.7 450.8 198.9 309.0 385.0 251.6 218.0 297.0 77.8
33 320.4 179.8 421.6 460.5 210.3 337.8 410.2 268.6 242.5 316.9 83.0
36 338.9 182.7 476.0 464.9 220.7 358.5 419.5 283.7 263.8 334.3 87.6
39 344.3 184.7 498.4 470.8 224.4 388.5 449.7 298.1 277.1 348.4 91.3
42 347.6 188.0 498.6 472.6 230.4 398.7 470.0 301.7 300.1 356.4 93.4
45 374.3 193.9 528.5 473.2 234.5 413.2 475.3 303.7 313.1 367.7 96.4
48 380.2 196.5 610.2 473.2 236.1 436.7 476.2 304.1 320.8 381.6 100.0
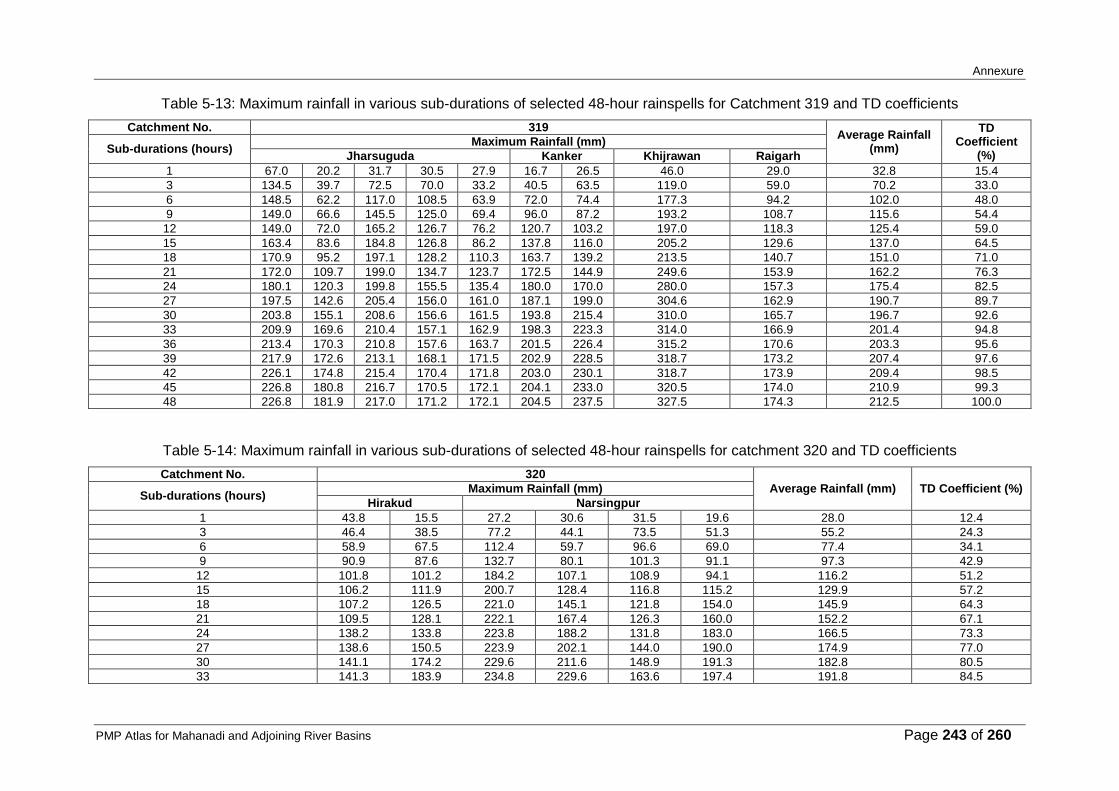
Annexure
PMP Atlas for Mahanadi and Adjoining River Basins Page 243 of 260
Table 5-13: Maximum rainfall in various sub-durations of selected 48-hour rainspells for Catchment 319 and TD coefficients
Catchment No. 319 Average Rainfall
(mm)
TD Coefficient
(%) Sub-durations (hours)
Maximum Rainfall (mm)
Jharsuguda Kanker Khijrawan Raigarh
1 67.0 20.2 31.7 30.5 27.9 16.7 26.5 46.0 29.0 32.8 15.4
3 134.5 39.7 72.5 70.0 33.2 40.5 63.5 119.0 59.0 70.2 33.0
6 148.5 62.2 117.0 108.5 63.9 72.0 74.4 177.3 94.2 102.0 48.0
9 149.0 66.6 145.5 125.0 69.4 96.0 87.2 193.2 108.7 115.6 54.4
12 149.0 72.0 165.2 126.7 76.2 120.7 103.2 197.0 118.3 125.4 59.0
15 163.4 83.6 184.8 126.8 86.2 137.8 116.0 205.2 129.6 137.0 64.5
18 170.9 95.2 197.1 128.2 110.3 163.7 139.2 213.5 140.7 151.0 71.0
21 172.0 109.7 199.0 134.7 123.7 172.5 144.9 249.6 153.9 162.2 76.3
24 180.1 120.3 199.8 155.5 135.4 180.0 170.0 280.0 157.3 175.4 82.5
27 197.5 142.6 205.4 156.0 161.0 187.1 199.0 304.6 162.9 190.7 89.7
30 203.8 155.1 208.6 156.6 161.5 193.8 215.4 310.0 165.7 196.7 92.6
33 209.9 169.6 210.4 157.1 162.9 198.3 223.3 314.0 166.9 201.4 94.8
36 213.4 170.3 210.8 157.6 163.7 201.5 226.4 315.2 170.6 203.3 95.6
39 217.9 172.6 213.1 168.1 171.5 202.9 228.5 318.7 173.2 207.4 97.6
42 226.1 174.8 215.4 170.4 171.8 203.0 230.1 318.7 173.9 209.4 98.5
45 226.8 180.8 216.7 170.5 172.1 204.1 233.0 320.5 174.0 210.9 99.3
48 226.8 181.9 217.0 171.2 172.1 204.5 237.5 327.5 174.3 212.5 100.0
Table 5-14: Maximum rainfall in various sub-durations of selected 48-hour rainspells for catchment 320 and TD coefficients
Catchment No. 320
Average Rainfall (mm) TD Coefficient (%) Sub-durations (hours)
Maximum Rainfall (mm)
Hirakud Narsingpur
1 43.8 15.5 27.2 30.6 31.5 19.6 28.0 12.4
3 46.4 38.5 77.2 44.1 73.5 51.3 55.2 24.3
6 58.9 67.5 112.4 59.7 96.6 69.0 77.4 34.1
9 90.9 87.6 132.7 80.1 101.3 91.1 97.3 42.9
12 101.8 101.2 184.2 107.1 108.9 94.1 116.2 51.2
15 106.2 111.9 200.7 128.4 116.8 115.2 129.9 57.2
18 107.2 126.5 221.0 145.1 121.8 154.0 145.9 64.3
21 109.5 128.1 222.1 167.4 126.3 160.0 152.2 67.1
24 138.2 133.8 223.8 188.2 131.8 183.0 166.5 73.3
27 138.6 150.5 223.9 202.1 144.0 190.0 174.9 77.0
30 141.1 174.2 229.6 211.6 148.9 191.3 182.8 80.5
33 141.3 183.9 234.8 229.6 163.6 197.4 191.8 84.5
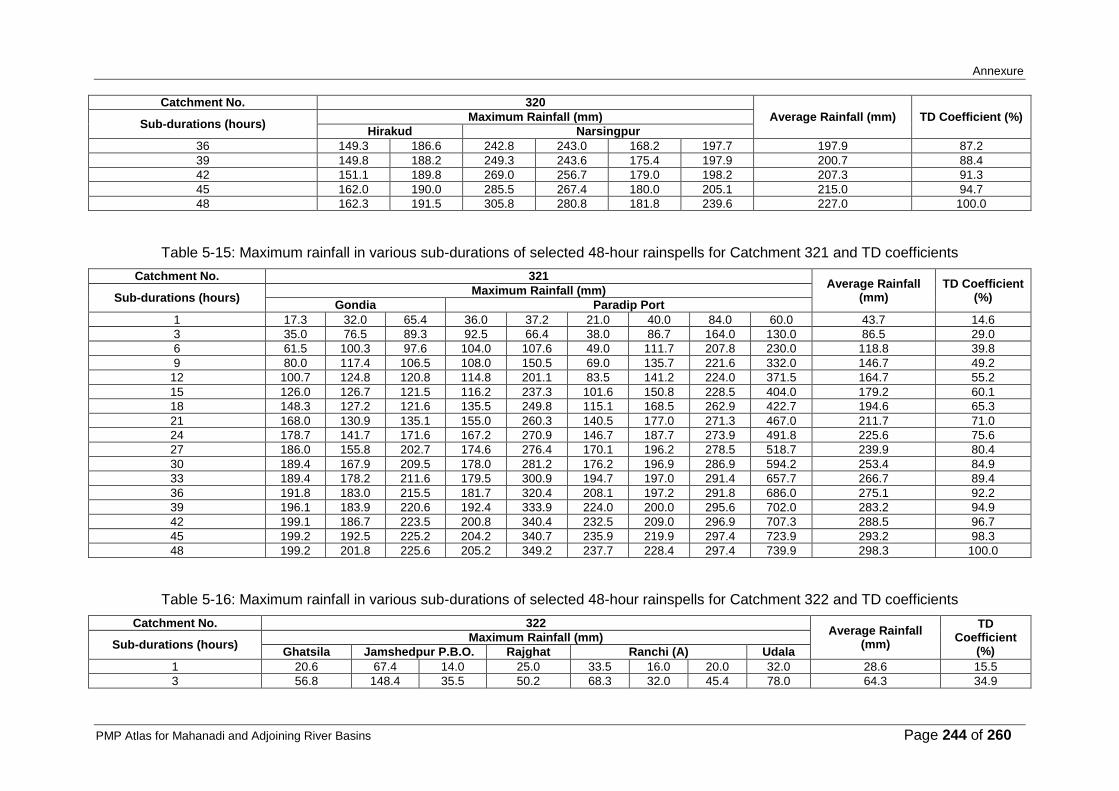
Annexure
PMP Atlas for Mahanadi and Adjoining River Basins Page 244 of 260
Catchment No. 320
Average Rainfall (mm) TD Coefficient (%) Sub-durations (hours)
Maximum Rainfall (mm)
Hirakud Narsingpur
36 149.3 186.6 242.8 243.0 168.2 197.7 197.9 87.2
39 149.8 188.2 249.3 243.6 175.4 197.9 200.7 88.4
42 151.1 189.8 269.0 256.7 179.0 198.2 207.3 91.3
45 162.0 190.0 285.5 267.4 180.0 205.1 215.0 94.7
48 162.3 191.5 305.8 280.8 181.8 239.6 227.0 100.0
Table 5-15: Maximum rainfall in various sub-durations of selected 48-hour rainspells for Catchment 321 and TD coefficients
Catchment No. 321 Average Rainfall
(mm) TD Coefficient
(%) Sub-durations (hours) Maximum Rainfall (mm)
Gondia Paradip Port
1 17.3 32.0 65.4 36.0 37.2 21.0 40.0 84.0 60.0 43.7 14.6
3 35.0 76.5 89.3 92.5 66.4 38.0 86.7 164.0 130.0 86.5 29.0
6 61.5 100.3 97.6 104.0 107.6 49.0 111.7 207.8 230.0 118.8 39.8
9 80.0 117.4 106.5 108.0 150.5 69.0 135.7 221.6 332.0 146.7 49.2
12 100.7 124.8 120.8 114.8 201.1 83.5 141.2 224.0 371.5 164.7 55.2
15 126.0 126.7 121.5 116.2 237.3 101.6 150.8 228.5 404.0 179.2 60.1
18 148.3 127.2 121.6 135.5 249.8 115.1 168.5 262.9 422.7 194.6 65.3
21 168.0 130.9 135.1 155.0 260.3 140.5 177.0 271.3 467.0 211.7 71.0
24 178.7 141.7 171.6 167.2 270.9 146.7 187.7 273.9 491.8 225.6 75.6
27 186.0 155.8 202.7 174.6 276.4 170.1 196.2 278.5 518.7 239.9 80.4
30 189.4 167.9 209.5 178.0 281.2 176.2 196.9 286.9 594.2 253.4 84.9
33 189.4 178.2 211.6 179.5 300.9 194.7 197.0 291.4 657.7 266.7 89.4
36 191.8 183.0 215.5 181.7 320.4 208.1 197.2 291.8 686.0 275.1 92.2
39 196.1 183.9 220.6 192.4 333.9 224.0 200.0 295.6 702.0 283.2 94.9
42 199.1 186.7 223.5 200.8 340.4 232.5 209.0 296.9 707.3 288.5 96.7
45 199.2 192.5 225.2 204.2 340.7 235.9 219.9 297.4 723.9 293.2 98.3
48 199.2 201.8 225.6 205.2 349.2 237.7 228.4 297.4 739.9 298.3 100.0
Table 5-16: Maximum rainfall in various sub-durations of selected 48-hour rainspells for Catchment 322 and TD coefficients
Catchment No. 322 Average Rainfall
(mm)
TD Coefficient
(%) Sub-durations (hours)
Maximum Rainfall (mm)
Ghatsila Jamshedpur P.B.O. Rajghat Ranchi (A) Udala
1 20.6 67.4 14.0 25.0 33.5 16.0 20.0 32.0 28.6 15.5
3 56.8 148.4 35.5 50.2 68.3 32.0 45.4 78.0 64.3 34.9

Annexure
PMP Atlas for Mahanadi and Adjoining River Basins Page 245 of 260
Catchment No. 322 Average Rainfall
(mm)
TD Coefficient
(%) Sub-durations (hours)
Maximum Rainfall (mm)
Ghatsila Jamshedpur P.B.O. Rajghat Ranchi (A) Udala
6 76.5 168.9 56.9 63.9 99.8 44.3 51.4 96.9 82.3 44.7
9 89.4 175.2 69.3 66.1 119.8 60.2 58.6 103.2 92.7 50.3
12 115.7 176.4 82.0 85.0 131.1 66.2 73.2 114.4 105.5 57.3
15 126.9 182.3 94.4 100.8 136.5 75.5 81.2 118.5 114.5 62.2
18 141.7 187.8 101.9 121.5 138.8 80.7 82.9 125.0 122.5 66.5
21 149.7 190.5 104.1 135.2 139.6 85.5 99.7 136.0 130.0 70.6
24 158.2 193.0 110.6 138.8 140.0 91.9 101.2 151.5 135.7 73.7
27 169.7 201.2 119.8 145.5 148.8 112.0 108.0 167.1 146.5 79.6
30 172.2 202.0 123.7 162.4 152.3 123.7 115.3 172.3 153.0 83.1
33 172.7 207.0 127.4 163.6 153.2 141.4 133.5 175.8 159.3 86.5
36 172.9 227.5 129.0 179.3 154.2 144.2 135.3 180.0 165.3 89.8
39 176.8 227.6 130.7 195.8 156.3 148.2 139.8 183.3 169.8 92.2
42 180.3 234.6 144.1 215.8 157.2 155.6 149.1 189.0 178.2 96.8
45 183.8 238.2 156.5 221.7 158.2 158.9 150.6 194.2 182.8 99.2
48 184.3 238.2 163.8 222.9 158.5 159.7 150.6 195.4 184.2 100.0
Table 5-17: Maximum rainfall in various sub-durations of selected 72-hour rainspells for Catchment 318 and TD coefficients
Catchment No. 318 Average Rainfall
(mm)
TD Coefficient
(%) Sub-durations (hours)
Maximum Rainfall (mm)
Bhubaneshwar Gannavaram (A) Kakinada Machilipatnam Puri
1 90.0 14.0 66.7 33.5 80.0 13.0 49.5 11.1
3 180.5 27.5 86.2 82.4 121.5 37.8 89.3 20.0
6 202.5 52.0 141.7 149.0 145.7 65.0 126.0 28.2
9 218.5 74.5 199.4 185.3 164.0 87.0 154.8 34.7
12 246.2 91.5 224.5 201.5 177.1 105.0 174.3 39.1
15 259.5 105.8 288.4 206.7 205.1 132.5 199.7 44.8
18 270.4 121.5 301.0 210.5 221.1 156.5 213.5 47.9
21 274.3 140.5 335.2 220.6 259.8 170.3 233.5 52.3
24 302.2 150.5 346.2 241.5 277.0 185.8 250.5 56.2
27 303.8 162.8 352.2 255.0 287.9 199.8 260.3 58.3
30 309.8 175.0 374.7 309.0 385.0 218.0 295.3 66.2
33 320.4 179.8 425.0 337.8 410.2 242.5 319.3 71.6
36 338.9 182.7 476.0 358.5 419.5 263.8 339.9 76.2
39 344.3 184.7 509.3 388.5 449.7 277.1 358.9 80.5
42 347.6 188.0 512.3 403.6 470.0 300.1 370.3 83.0
45 374.3 193.9 534.3 413.2 475.3 313.1 384.0 86.1
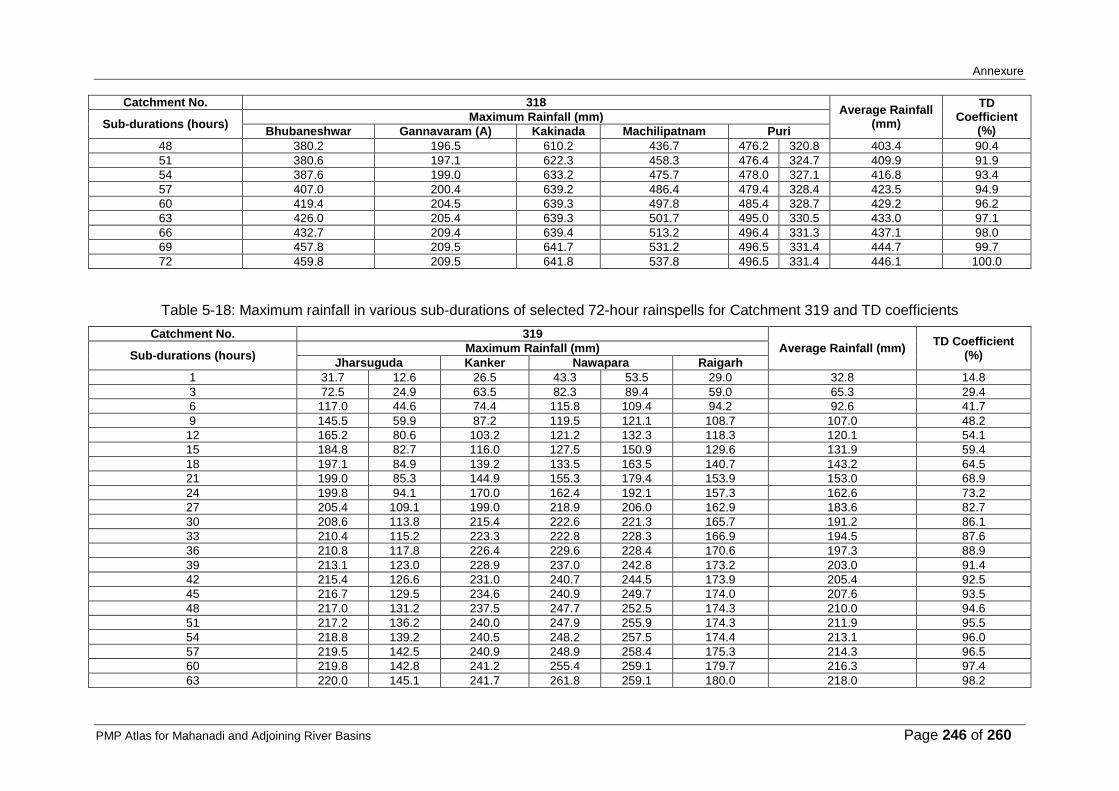
Annexure
PMP Atlas for Mahanadi and Adjoining River Basins Page 246 of 260
Catchment No. 318 Average Rainfall
(mm)
TD Coefficient
(%) Sub-durations (hours)
Maximum Rainfall (mm)
Bhubaneshwar Gannavaram (A) Kakinada Machilipatnam Puri
48 380.2 196.5 610.2 436.7 476.2 320.8 403.4 90.4
51 380.6 197.1 622.3 458.3 476.4 324.7 409.9 91.9
54 387.6 199.0 633.2 475.7 478.0 327.1 416.8 93.4
57 407.0 200.4 639.2 486.4 479.4 328.4 423.5 94.9
60 419.4 204.5 639.3 497.8 485.4 328.7 429.2 96.2
63 426.0 205.4 639.3 501.7 495.0 330.5 433.0 97.1
66 432.7 209.4 639.4 513.2 496.4 331.3 437.1 98.0
69 457.8 209.5 641.7 531.2 496.5 331.4 444.7 99.7
72 459.8 209.5 641.8 537.8 496.5 331.4 446.1 100.0
Table 5-18: Maximum rainfall in various sub-durations of selected 72-hour rainspells for Catchment 319 and TD coefficients
Catchment No. 319
Average Rainfall (mm) TD Coefficient
(%) Sub-durations (hours) Maximum Rainfall (mm)
Jharsuguda Kanker Nawapara Raigarh
1 31.7 12.6 26.5 43.3 53.5 29.0 32.8 14.8
3 72.5 24.9 63.5 82.3 89.4 59.0 65.3 29.4
6 117.0 44.6 74.4 115.8 109.4 94.2 92.6 41.7
9 145.5 59.9 87.2 119.5 121.1 108.7 107.0 48.2
12 165.2 80.6 103.2 121.2 132.3 118.3 120.1 54.1
15 184.8 82.7 116.0 127.5 150.9 129.6 131.9 59.4
18 197.1 84.9 139.2 133.5 163.5 140.7 143.2 64.5
21 199.0 85.3 144.9 155.3 179.4 153.9 153.0 68.9
24 199.8 94.1 170.0 162.4 192.1 157.3 162.6 73.2
27 205.4 109.1 199.0 218.9 206.0 162.9 183.6 82.7
30 208.6 113.8 215.4 222.6 221.3 165.7 191.2 86.1
33 210.4 115.2 223.3 222.8 228.3 166.9 194.5 87.6
36 210.8 117.8 226.4 229.6 228.4 170.6 197.3 88.9
39 213.1 123.0 228.9 237.0 242.8 173.2 203.0 91.4
42 215.4 126.6 231.0 240.7 244.5 173.9 205.4 92.5
45 216.7 129.5 234.6 240.9 249.7 174.0 207.6 93.5
48 217.0 131.2 237.5 247.7 252.5 174.3 210.0 94.6
51 217.2 136.2 240.0 247.9 255.9 174.3 211.9 95.5
54 218.8 139.2 240.5 248.2 257.5 174.4 213.1 96.0
57 219.5 142.5 240.9 248.9 258.4 175.3 214.3 96.5
60 219.8 142.8 241.2 255.4 259.1 179.7 216.3 97.4
63 220.0 145.1 241.7 261.8 259.1 180.0 218.0 98.2

Annexure
PMP Atlas for Mahanadi and Adjoining River Basins Page 247 of 260
Catchment No. 319
Average Rainfall (mm) TD Coefficient
(%) Sub-durations (hours) Maximum Rainfall (mm)
Jharsuguda Kanker Nawapara Raigarh
66 220.8 149.1 241.9 264.8 259.1 180.3 219.3 98.8
69 220.8 152.4 243.7 266.2 259.4 180.7 220.5 99.3
72 220.8 154.8 244.5 271.8 259.5 180.7 222.0 100.0
Table 5-19: Maximum rainfall in various sub-durations of selected 72-hour rainspells for Catchment 320 and TD coefficients
Catchment No. 320
Average Rainfall (mm) TD Coefficient (%) Sub-durations (hours)
Maximum Rainfall (mm)
Narsingpur
1 27.2 19.6 23.4 8.1
3 77.2 51.3 64.3 22.1
6 112.4 69.0 90.7 31.2
9 132.7 91.1 111.9 38.5
12 184.2 94.1 139.2 47.9
15 200.7 115.2 158.0 54.4
18 221.0 154.0 187.5 64.6
21 224.4 160.0 192.2 66.2
24 226.1 183.0 204.6 70.4
27 226.1 190.0 208.1 71.6
30 229.6 191.3 210.5 72.5
33 234.8 197.4 216.1 74.4
36 242.8 197.7 220.3 75.8
39 250.6 197.9 224.3 77.2
42 269.0 198.2 233.6 80.4
45 285.5 205.1 245.3 84.5
48 305.8 239.6 272.7 93.9
51 309.4 240.2 274.8 94.6
54 312.1 240.9 276.5 95.2
57 317.3 241.5 279.4 96.2
60 319.6 242.5 281.1 96.8
63 328.1 243.6 285.9 98.4
66 328.1 244.6 286.4 98.6
69 328.3 247.2 287.8 99.1
72 330.3 250.6 290.5 100.0

Annexure
PMP Atlas for Mahanadi and Adjoining River Basins Page 248 of 260
Table 5-20: Maximum rainfall in various sub-durations of selected 72-hour rainspells for Catchment 321 and TD coefficients
Catchment No. 321
Average Rainfall (mm) TD Coefficient (%) Sub-durations (hours)
Maximum Rainfall (mm)
Gondia Paradip Port
1 32.0 38.6 40.0 28.5 34.8 12.1
3 76.5 84.0 86.7 54.5 75.4 26.3
6 100.3 111.4 111.7 67.2 97.7 34.1
9 117.4 126.7 135.7 76.0 114.0 39.8
12 124.8 129.9 141.2 97.0 123.2 43.0
15 126.7 131.4 150.8 130.5 134.9 47.1
18 127.2 146.3 168.5 142.8 146.2 51.1
21 130.9 168.0 177.0 163.0 159.7 55.8
24 141.7 198.8 187.7 168.5 174.2 60.8
27 155.8 244.4 196.2 174.7 192.8 67.3
30 167.9 247.6 199.5 181.9 199.2 69.6
33 178.2 250.1 199.5 181.9 202.4 70.7
36 183.0 264.0 199.6 185.9 208.1 72.7
39 184.3 270.9 200.8 193.1 212.3 74.1
42 186.7 310.4 209.0 193.4 224.9 78.5
45 192.5 316.1 219.9 193.4 230.5 80.5
48 201.8 323.6 228.4 193.7 236.9 82.7
51 208.3 329.9 234.9 197.2 242.6 84.7
54 212.0 362.0 239.7 199.4 253.3 88.4
57 212.5 365.0 260.5 199.4 259.4 90.6
60 213.7 367.7 268.0 199.9 262.3 91.6
63 220.0 370.8 276.1 200.6 266.9 93.2
66 232.0 371.2 284.6 210.2 274.5 95.9
69 243.7 375.0 292.7 219.7 282.8 98.7
72 251.1 375.4 297.1 221.9 286.4 100.0
Table 5-21: Maximum rainfall in various sub-durations of selected 72-hour rainspells for Catchment 322 and TD coefficients
Catchment No. 322 Average Rainfall
(mm) TD Coefficient
(%) Sub-durations (hours) Maximum Rainfall (mm)
Ghatsila Jamshedpur Jamshedpur P.B.O. Ranchi (A)
1 20.6 15.8 67.4 14.0 11.8 25.9 13.5
3 56.8 31.3 148.4 35.5 19.3 58.3 30.3
6 76.5 39.3 168.9 56.9 26.6 73.6 38.3
9 89.4 48.0 175.2 69.3 31.3 82.6 43.0

Annexure
PMP Atlas for Mahanadi and Adjoining River Basins Page 249 of 260
Catchment No. 322 Average Rainfall
(mm) TD Coefficient
(%) Sub-durations (hours) Maximum Rainfall (mm)
Ghatsila Jamshedpur Jamshedpur P.B.O. Ranchi (A)
12 115.7 62.7 176.4 82.0 43.3 96.0 49.9
15 126.9 72.8 182.3 94.4 45.8 104.4 54.3
18 141.7 88.2 187.8 101.9 53.3 114.6 59.6
21 149.7 88.8 190.5 104.1 61.0 118.8 61.8
24 158.2 91.8 193.0 110.6 62.8 123.3 64.1
27 169.7 95.6 201.2 119.8 66.4 130.5 67.9
30 172.2 104.5 202.0 123.7 70.3 134.5 70.0
33 172.7 117.4 207.0 127.4 72.3 139.4 72.5
36 173.2 129.9 227.5 130.0 77.1 147.5 76.7
39 176.8 132.4 227.6 133.7 78.5 149.8 77.9
42 180.3 132.6 234.6 144.1 81.2 154.6 80.4
45 183.8 139.9 238.2 156.5 84.6 160.6 83.5
48 184.3 140.5 238.2 163.8 88.2 163.0 84.8
51 184.8 143.5 238.4 164.7 99.3 166.1 86.4
54 185.3 147.3 241.4 169.5 100.3 168.8 87.7
57 185.7 154.5 242.2 170.3 105.7 171.7 89.3
60 185.7 163.2 242.8 172.0 109.6 174.7 90.8
63 185.9 181.6 253.1 175.4 109.6 181.1 94.2
66 186.7 184.1 253.1 183.7 114.6 184.4 95.9
69 187.2 184.3 277.8 185.2 117.3 190.4 99.0
72 187.2 188.1 278.4 190.0 117.9 192.3 100.0

Annexure
PMP Atlas for Mahanadi and Adjoining River Basins Page 250 of 260
Table 5-22: List of rainspells for clock hour for the 24-hour duration
SRRG Station SRRG Index
Dates of rainspell (s)
Maximum 24 Hour Rainfall (mm)
1 Day Rainfall (mm)
Baripada 42894 04 Aug 1976 66.0 63.3
Batagaon 3026 29 Aug 1978 73.0 49.6
Bhubaneshwar 42971 29 Jul 1969 82.3 81.0
Bhubaneshwar 42971 14 Aug 1969 115.3 110.0
Bhubaneshwar 42971 16 Jun 1970 91.2 88.4
Bhubaneshwar 42971 30 Jun 1970 73.5 73.4
Bhubaneshwar 42971 08 Jul 1970 65.3 60.0
Bhubaneshwar 42971 24 Aug 1970 103.0 99.2
Bhubaneshwar 42971 18 Aug 1975 63.1 53.0
Bhubaneshwar 42971 13 Aug 1976 66.7 52.0
Bhubaneshwar 42971 27 Aug 1978 77.0 65.0
Bhubaneshwar 42971 24 Jun 1979 154.9 125.0
Bhubaneshwar 42971 26 Sep 1981 102.3 66.0
Bhubaneshwar 42971 16 Aug 1982 60.5 50.0
Bhubaneshwar 42971 28 Aug 1982 65.5 58.0
Bhubaneshwar 42971 20 Jun 1983 74.7 47.2
Bhubaneshwar 42971 08 Aug 1984 66.2 65.5
Bhubaneshwar 42971 16 Aug 1984 144.5 125.0
Bhubaneshwar 42971 15 Oct 1985 70.2 67.0
Bhubaneshwar 42971 22 Jul 1986 79.6 71.0
Bhubaneshwar 42971 25 Sep 1986 67.1 45.6
Bhubaneshwar 42971 08 Nov 1986 61.2 58.0
Bhubaneshwar 42971 22 Jun 1988 67.7 49.0
Bhubaneshwar 42971 29 Jul 1988 82.8 73.0
Bhubaneshwar 42971 19 May 1989 80.0 60.0
Bhubaneshwar 42971 14 Jun 1989 148.7 148.0
Bhubaneshwar 42971 18 Jun 1989 68.1 67.0
Bhubaneshwar 42971 12 Jul 1990 75.0 58.0
Bhubaneshwar 42971 17 Jul 1991 115.4 112.0
Bhubaneshwar 42971 28 Jul 1991 160.3 146.0
Bhubaneshwar 42971 29 Jul 1991 65.5 57.0
Bhubaneshwar 42971 10 Aug 1991 62.2 51.2
Bhubaneshwar 42971 22 Aug 1991 106.7 106.0
Bhubaneshwar 42971 17 Jul 1992 117.2 97.0
Bhubaneshwar 42971 27 Jul 1992 122.2 113.0
Bhubaneshwar 42971 01 Aug 1992 74.5 52.0
Bhubaneshwar 42971 17 Aug 1992 102.2 96.0
Bhubaneshwar 42971 02 Oct 1992 81.3 69.0
Bhubaneshwar 42971 15 Jul 1994 61.0 55.0
Bhubaneshwar 42971 07 Aug 1994 62.3 43.0
Bhubaneshwar 42971 18 Aug 1994 173.2 170.0
Bhubaneshwar 42971 17 Sep 1994 101.0 86.0
Bhubaneshwar 42971 10 May 1995 98.6 80.0
Bhubaneshwar 42971 11 May 1995 254.7 245.0
Bhubaneshwar 42971 15 May 1995 110.4 93.0
Bhubaneshwar 42971 16 May 1995 95.7 90.0
Bhubaneshwar 42971 22 Jul 1996 90.4 60.0
Bhubaneshwar 42971 30 Jul 1997 174.6 164.0
Bhubaneshwar 42971 05 Aug 1997 135.7 120.0
Bhubaneshwar 42971 20 Aug 1997 99.4 98.0
Bhubaneshwar 42971 21 Aug 1997 215.9 200.0
Bhubaneshwar 42971 26 Sep 1997 77.0 72.0
Chandbali 42973 18 Aug 1975 125.2 123.8
Ghatsila 4011 02 Sep 1978 134.7 118.1
Gondia 42871 28 Aug 1970 124.1 117.2
Gondia 42871 26 Aug 1971 62.5 61.8
Gondia 42871 08 Jul 1973 121.6 112.0
Gondia 42871 09 Jul 1973 103.0 94.0
Gondia 42871 18 Jul 1973 134.2 129.7

Annexure
PMP Atlas for Mahanadi and Adjoining River Basins Page 251 of 260
SRRG Station SRRG Index
Dates of rainspell (s)
Maximum 24 Hour Rainfall (mm)
1 Day Rainfall (mm)
Hirakud 31362 09 Aug 1971 118.6 109.3
Jamshedpur 42799 09 Aug 1971 74.1 72.4
Jharsuguda 42886 27 Aug 1984 81.4 54.0
Jharsuguda 42886 28 Jun 1988 90.0 75.0
Jharsuguda 42886 04 Aug 1988 72.2 49.0
Jharsuguda 42886 14 Jun 1994 70.5 68.0
Jharsuguda 42886 16 Jun 1994 64.7 62.0
Jharsuguda 42886 13 Jul 1994 125.6 112.0
Jharsuguda 42886 20 Jul 1994 178.0 120.0
Jharsuguda 42886 08 Aug 1995 97.8 82.0
Jharsuguda 42886 07 Sep 1995 67.4 65.0
Jharsuguda 42886 05 Aug 1997 63.1 45.0
Jharsuguda 42886 20 Aug 1997 69.5 57.0
Kakinada 43189 17 May 1969 75.0 70.2
Kakinada 43189 11 Oct 1970 120.5 115.8
Kakinada 43189 20 Jun 1972 66.8 48.2
Kakinada 43189 15 Sep 1973 70.5 70.1
Kakinada 43189 21 Oct 1974 130.0 107.7
Kakinada 43189 27 Jun 1975 87.0 82.3
Kakinada 43189 12 Aug 1975 99.6 97.3
Kakinada 43189 18 Oct 1975 70.6 70.4
Kakinada 43189 17 Oct 1976 71.1 68.4
Kakinada 43189 18 Oct 1976 64.9 63.8
Kakinada 43189 05 Nov 1976 90.9 89.6
Kakinada 43189 19 Nov 1976 97.4 88.6
Kakinada 43189 06 Jun 1977 108.8 107.3
Kakinada 43189 20 Nov 1977 167.1 160.2
Kakinada 43189 13 May 1979 166.1 153.8
Kakinada 43189 26 Nov 1979 247.0 246.7
Kakinada 43189 14 Nov 1980 68.8 59.9
Kakinada 43189 03 Oct 1985 63.9 58.7
Kakinada 43189 13 Aug 1986 92.0 91.9
Kakinada 43189 16 Nov 1992 75.0 74.8
Kakinada 43189 05 Oct 1994 72.7 72.4
Kakinada 43189 02 Nov 1994 85.7 81.9
Kakinada 43189 09 Oct 1995 127.8 86.0
Kakinada 43189 17 Jun 1996 67.5 66.0
Kakinada 43189 25 Sep 1997 403.2 398.9
Kakinada 43189 14 Oct 1998 60.6 60.3
Kakinada 43189 31 Oct 1998 103.5 103.4
Kanker 42953 28 Aug 1971 65.8 65.2
Kanker 42953 26 Aug 1973 100.4 99.4
Keonjhargarh 42891 19 Aug 1975 162.5 162.3
Khijrawan 31504 21 Jul 1976 119.0 83.0
Khijrawan 31504 22 Aug 1977 83.5 82.5
Mandar 32712 11 Sep 1970 124.9 102.0
Mandar 32712 03 Sep 1973 70.6 65.5
Mandar 32712 17 Aug 1974 66.1 62.6
Narsingpur 42770 28 Jul 1992 91.0 74.0
Paradip Port 42976 12 Oct 1973 134.0 114.8
Puri 43053 13 Aug 1978 74.7 74.5
Puri 43053 24 Jun 1979 92.3 85.4
Puri 43053 08 Jul 1979 77.7 74.3
Puri 43053 13 Jul 1979 63.5 62.2
Puri 43053 17 Jun 1980 67.2 62.0
Puri 43053 18 Jun 1980 106.1 98.7
Puri 43053 19 Jun 1980 62.3 57.0
Puri 43053 18 Oct 1980 117.1 113.8
Puri 43053 19 Jun 1981 116.2 112.8
Puri 43053 03 Aug 1981 97.6 85.7

Annexure
PMP Atlas for Mahanadi and Adjoining River Basins Page 252 of 260
SRRG Station SRRG Index
Dates of rainspell (s)
Maximum 24 Hour Rainfall (mm)
1 Day Rainfall (mm)
Puri 43053 08 Aug 1981 140.0 129.0
Puri 43053 26 Sep 1981 79.6 75.3
Puri 43053 04 Jun 1982 186.0 163.8
Puri 43053 01 Aug 1982 121.3 116.5
Puri 43053 12 Aug 1982 103.7 94.3
Puri 43053 28 Aug 1982 91.9 82.3
Puri 43053 09 Sep 1982 159.0 142.7
Puri 43053 15 Aug 1983 74.3 70.3
Puri 43053 18 Jul 1984 64.2 58.3
Puri 43053 01 Aug 1984 64.3 59.3
Puri 43053 07 Aug 1992 95.9 95.4
Puri 43053 16 Jun 1993 70.0 65.5
Puri 43053 10 Aug 1994 96.5 89.8
Puri 43053 04 Sep 1994 113.4 106.2
Puri 43053 16 Sep 1994 153.5 109.5
Puri 43053 17 Sep 1994 111.2 107.3
Puri 43053 06 Oct 1994 66.0 65.9
Puri 43053 11 May 1995 84.9 80.2
Puri 43053 13 May 1995 126.0 99.2
Puri 43053 16 May 1995 108.6 103.0
Puri 43053 17 Aug 1995 63.0 62.5
Puri 43053 19 Aug 1996 80.4 78.8
Puri 43053 20 Aug 1996 78.5 77.0
Puri 43053 21 Aug 1997 131.6 126.5
Puri 43053 07 Sep 1998 90.0 88.8
Puri 43053 15 Oct 1998 133.5 132.8
Puri 43053 31 Oct 1999 122.2 118.4
Raigarh 42884 17 Aug 1974 149.8 146.0
Telkoi 3020 02 Sep 1978 162.6 154.0
Titlagarh 42961 02 Aug 1976 145.7 144.5
Tuni 43147 17 Jun 1996 202.8 196.3
Tuni 43147 19 Aug 1996 100.0 97.6
Tuni 43147 03 Oct 1996 109.7 109.2
Tuni 43147 25 Sep 1997 165.7 161.9
Tuni 43147 26 Sep 1997 68.6 66.9
Tuni 43147 15 Jun 1998 70.0 68.4
Table 5-23: Envelope area reduction factor for various catchments (1-day)
Area, sq. km.
Catchment No.
318 319 320 321 322
25 1.00 1.00 1.00 1.00 1.00
100 1.00 1.00 1.00 1.00 1.00
200 1.00 1.00 0.99 0.99 0.99
500 0.99 0.99 0.98 0.98 0.97
1,000 0.98 0.99 0.97 0.97 0.95
1,500 0.97 0.98 0.95 0.95 0.93
2,000 0.95 0.97 0.94 0.94 0.92
3,000 0.93 0.96 0.91 0.91 0.90
4,000 0.91 0.94 0.90 0.89 0.89
5,000 0.90 0.92 0.88 0.88 0.88
7,500 0.85 0.87 0.84 0.86 0.86
10,000 0.82 0.84 0.82 0.84 0.84
20,000 0.74 0.77 0.77 0.76 0.76
30,000 0.69 0.74 0.74 0.72 0.72
40,000 0.64 0.71 0.71 0.67 0.67
50,000 0.61 0.69 0.69 0.62 0.62
60,000 0.57 0.67 0.67 0.57 0.57
70,000 0.55 0.64 0.64 0.54 0.54
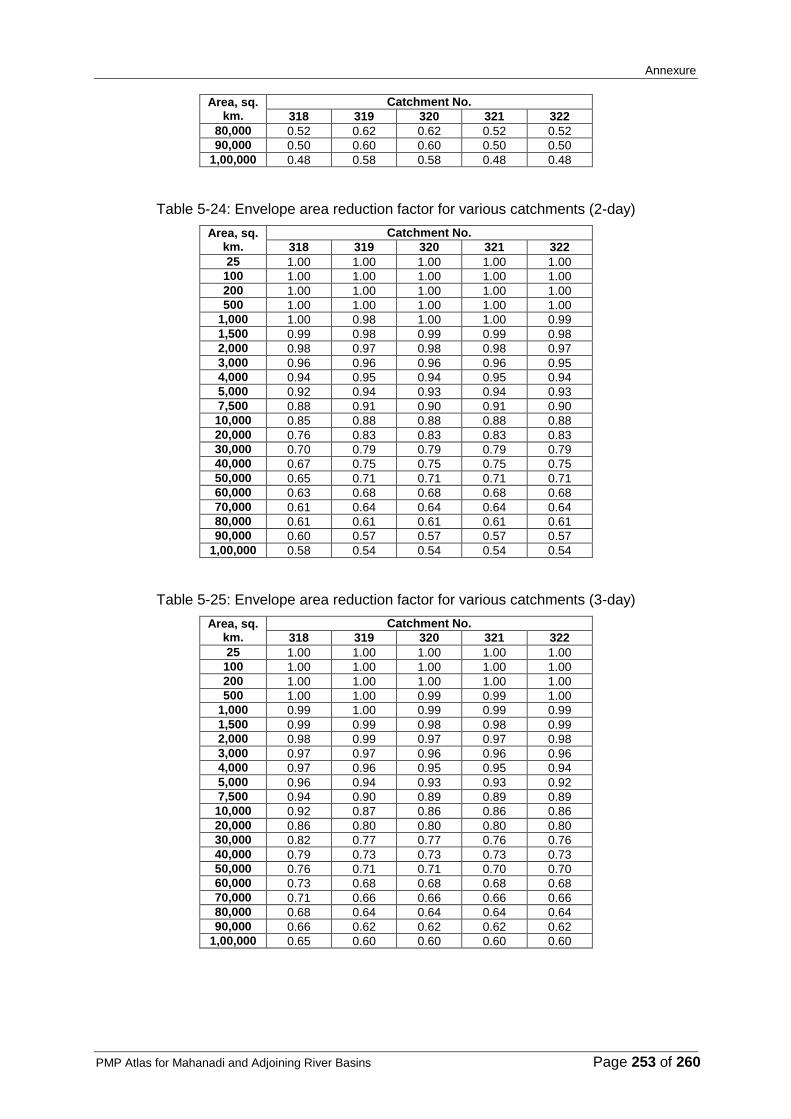
Annexure
PMP Atlas for Mahanadi and Adjoining River Basins Page 253 of 260
Area, sq. km.
Catchment No.
318 319 320 321 322
80,000 0.52 0.62 0.62 0.52 0.52
90,000 0.50 0.60 0.60 0.50 0.50
1,00,000 0.48 0.58 0.58 0.48 0.48
Table 5-24: Envelope area reduction factor for various catchments (2-day)
Area, sq. km.
Catchment No.
318 319 320 321 322
25 1.00 1.00 1.00 1.00 1.00
100 1.00 1.00 1.00 1.00 1.00
200 1.00 1.00 1.00 1.00 1.00
500 1.00 1.00 1.00 1.00 1.00
1,000 1.00 0.98 1.00 1.00 0.99
1,500 0.99 0.98 0.99 0.99 0.98
2,000 0.98 0.97 0.98 0.98 0.97
3,000 0.96 0.96 0.96 0.96 0.95
4,000 0.94 0.95 0.94 0.95 0.94
5,000 0.92 0.94 0.93 0.94 0.93
7,500 0.88 0.91 0.90 0.91 0.90
10,000 0.85 0.88 0.88 0.88 0.88
20,000 0.76 0.83 0.83 0.83 0.83
30,000 0.70 0.79 0.79 0.79 0.79
40,000 0.67 0.75 0.75 0.75 0.75
50,000 0.65 0.71 0.71 0.71 0.71
60,000 0.63 0.68 0.68 0.68 0.68
70,000 0.61 0.64 0.64 0.64 0.64
80,000 0.61 0.61 0.61 0.61 0.61
90,000 0.60 0.57 0.57 0.57 0.57
1,00,000 0.58 0.54 0.54 0.54 0.54
Table 5-25: Envelope area reduction factor for various catchments (3-day)
Area, sq. km.
Catchment No.
318 319 320 321 322
25 1.00 1.00 1.00 1.00 1.00
100 1.00 1.00 1.00 1.00 1.00
200 1.00 1.00 1.00 1.00 1.00
500 1.00 1.00 0.99 0.99 1.00
1,000 0.99 1.00 0.99 0.99 0.99
1,500 0.99 0.99 0.98 0.98 0.99
2,000 0.98 0.99 0.97 0.97 0.98
3,000 0.97 0.97 0.96 0.96 0.96
4,000 0.97 0.96 0.95 0.95 0.94
5,000 0.96 0.94 0.93 0.93 0.92
7,500 0.94 0.90 0.89 0.89 0.89
10,000 0.92 0.87 0.86 0.86 0.86
20,000 0.86 0.80 0.80 0.80 0.80
30,000 0.82 0.77 0.77 0.76 0.76
40,000 0.79 0.73 0.73 0.73 0.73
50,000 0.76 0.71 0.71 0.70 0.70
60,000 0.73 0.68 0.68 0.68 0.68
70,000 0.71 0.66 0.66 0.66 0.66
80,000 0.68 0.64 0.64 0.64 0.64
90,000 0.66 0.62 0.62 0.62 0.62
1,00,000 0.65 0.60 0.60 0.60 0.60

Annexure
PMP Atlas for Mahanadi and Adjoining River Basins Page 254 of 260
Table 5-26: Average area reduction factor for various catchments (1-day)
Area, sq. km.
Catchment No.
318 319 320 321 322
25 1.00 1.00 1.00 1.00 1.00
100 0.94 0.95 0.95 0.96 0.95
200 0.91 0.93 0.93 0.94 0.92
500 0.86 0.89 0.88 0.90 0.88
1,000 0.81 0.85 0.84 0.85 0.84
1,500 0.78 0.82 0.81 0.82 0.80
2,000 0.75 0.80 0.78 0.80 0.78
3,000 0.71 0.76 0.75 0.76 0.74
4,000 0.67 0.73 0.72 0.73 0.71
5,000 0.65 0.71 0.69 0.70 0.69
7,500 0.60 0.67 0.65 0.66 0.64
10,000 0.56 0.63 0.61 0.62 0.60
20,000 0.44 0.54 0.50 0.52 0.51
30,000 0.37 0.46 0.43 0.45 0.44
40,000 0.34 0.37 0.36 0.37 0.36
50,000 0.28 0.34 0.33 0.34 0.31
60,000 0.20 0.23 0.28 0.28 0.22
70,000 0.19 0.22 0.26 0.24 0.18
80,000 0.17 0.20 0.24 0.21 0.14
90,000 0.16 0.19 0.22 0.19 0.13
1,00,000 0.16 0.17 0.21 0.17 0.12
Table 5-27: Average area reduction factor for various catchments (2-day)
Area, sq. km.
Catchment No.
318 319 320 321 322
25 1.00 1.00 1.00 1.00 1.00
100 0.94 0.97 0.95 0.97 0.95
200 0.91 0.95 0.93 0.95 0.93
500 0.87 0.92 0.89 0.91 0.89
1,000 0.83 0.88 0.85 0.88 0.85
1,500 0.80 0.86 0.82 0.86 0.82
2,000 0.77 0.84 0.79 0.84 0.80
3,000 0.72 0.81 0.76 0.80 0.76
4,000 0.70 0.79 0.73 0.78 0.73
5,000 0.67 0.77 0.71 0.76 0.71
7,500 0.63 0.73 0.67 0.71 0.67
10,000 0.59 0.70 0.63 0.68 0.63
20,000 0.48 0.60 0.53 0.59 0.54
30,000 0.41 0.54 0.46 0.52 0.48
40,000 0.37 0.47 0.40 0.45 0.40
50,000 0.34 0.42 0.35 0.41 0.36
60,000 0.28 0.31 0.32 0.36 0.26
70,000 0.23 0.30 0.29 0.31 0.20
80,000 0.22 0.28 0.28 0.29 0.18
90,000 0.20 0.27 0.25 0.27 0.15
1,00,000 0.18 0.25 0.23 0.23 0.12
Table 5-28: Average area reduction factor for various catchments (3-day)
Area, sq. km.
Catchment No.
318 319 320 321 322
25 1.00 1.00 1.00 1.00 1.00
100 0.95 0.97 0.95 0.96 0.95
200 0.93 0.95 0.93 0.94 0.93
500 0.88 0.92 0.89 0.91 0.89
1,000 0.84 0.89 0.85 0.88 0.85
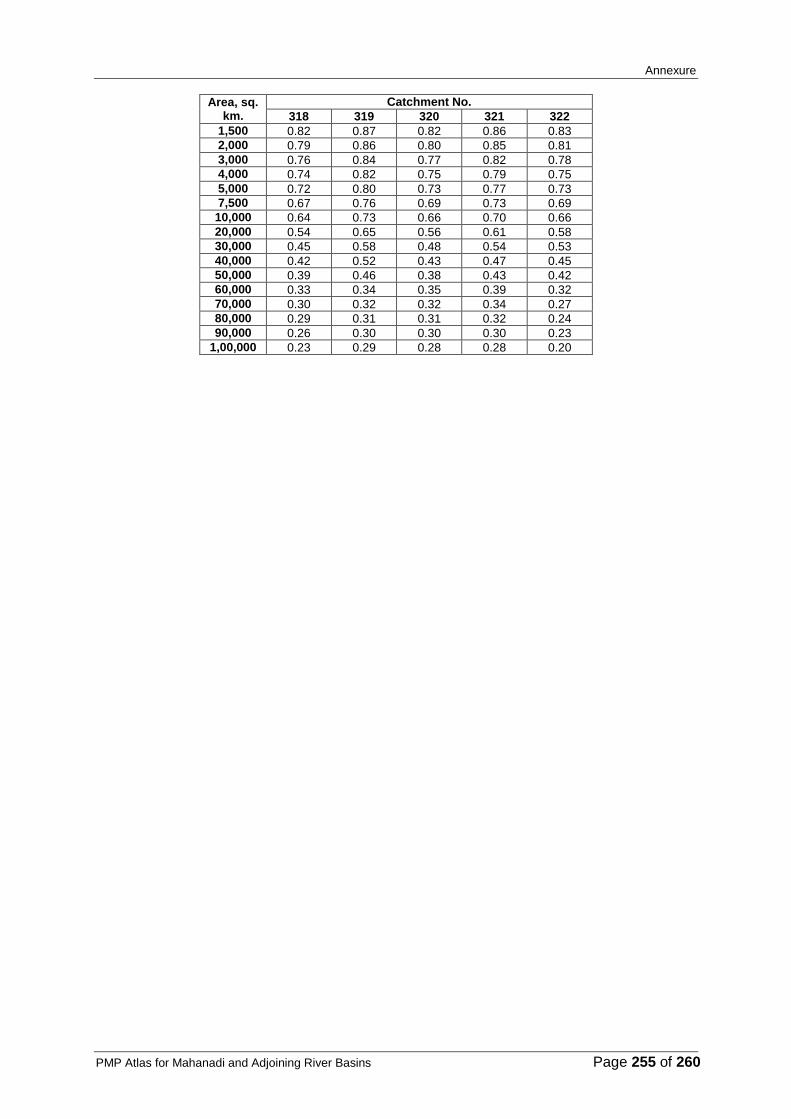
Annexure
PMP Atlas for Mahanadi and Adjoining River Basins Page 255 of 260
Area, sq. km.
Catchment No.
318 319 320 321 322
1,500 0.82 0.87 0.82 0.86 0.83
2,000 0.79 0.86 0.80 0.85 0.81
3,000 0.76 0.84 0.77 0.82 0.78
4,000 0.74 0.82 0.75 0.79 0.75
5,000 0.72 0.80 0.73 0.77 0.73
7,500 0.67 0.76 0.69 0.73 0.69
10,000 0.64 0.73 0.66 0.70 0.66
20,000 0.54 0.65 0.56 0.61 0.58
30,000 0.45 0.58 0.48 0.54 0.53
40,000 0.42 0.52 0.43 0.47 0.45
50,000 0.39 0.46 0.38 0.43 0.42
60,000 0.33 0.34 0.35 0.39 0.32
70,000 0.30 0.32 0.32 0.34 0.27
80,000 0.29 0.31 0.31 0.32 0.24
90,000 0.26 0.30 0.30 0.30 0.23
1,00,000 0.23 0.29 0.28 0.28 0.20

PMP Atlas for Mahanadi and Adjoining River Basins Page 256 of 260

References
PMP Atlas for Mahanadi and Adjoining River Basins Page 257 of 260
References
Bao, C.L., 1987: Synoptic Meteorology in China, Springer, Berlin, 269 p.
Bruce, J. P, Clark, R.H., 1966: Introduction to Hydrometeorology, Pergamon, New York, 319 p.
B. D. Kulkarni and S. Nandargi, 1996: Severe rainstorms in the Vidarbha subdivision of Maharashtra State, India, Climate Res, Vol.6:275-281.
B. D. Kulkarni, 2002: Generalized physical approach of estimating areal probable maximum precipitation (PMP for plain region of the Godavari River Basin (India), Journal of Spatial Hydrology, Vol. 2, No.2, pp:1-16.
B. D. Kulkarni, S. Nandargi and S.S.Mulye, 2010: Analysis of severe rainstorm characteristics of the Godavari Basin in Peninsular India, Journal Hydrometeorology, Vol. 11, pp: 542-552.
Central Water Commission, 1972: Estimation of design flood. Recommended procedures, Government of India Publ. New Delhi, pp:130.
Central Water Commission, 1993: Recommondations of workshop on rationalization of design storm parameters for design flood estimation, Hydrological Studies Organization, Central Water Commission, Government of India, New Delhi.
Chow, V.T., 1951: A general formula for hydrologic frequency analysis. Trans. Am Geophys. Union, 32, pp: 231-237.
Chow, V.T., 1953: Frequency analysis of hydrologic data. Bulletin No. 414, Univ. of Illinois, Urbana, Illinois, pp: 80.
Dhar, O. N., Kulkarni, A.K., Rakhecha, P.R., 1981: Probable maximum point rainfall estimations for the Southern half of the Indian Peninsula, Proc. Ind. Acad. Sci (Earth Planet. Sci.), 90, pp: 39-46.
Dhar, O.N., Nandargi,S., (1993), The zones of severe rainstorms activity over India, International Journal of Climatology, Vol. 13, 301-311.
Dube, R.K., De,U.S., Prakasa Rao, G.S., (2005), Extreme weather events over India in the last 100 years, J. Ind. Geophys. Union, Vol. 9, No.3, pp. 173-187.
Generalised Maps of 1-Day Point Maximum Persisting Dew Point Tempereture, Met Monograph No. (Hyd) 13/200
Gumbel, E. J., 1958: Statistics of extreme, Columbia University Press, New York.
Harihara Ayyar, P. S., Tripathi, N., 1973: Relationship of the clock-hour to 60-min and the observational day to 1440-min rainfall. Indian Journal of Meteorology and Geophysics 24, 279-282.
Hershfield, D.M., Kohler, M.A., 1960: "An Empirical Appraisal of the Gumbel Extreme-Value Procedure," Journal of Geophysical Research, 65, pp. 1737-1746.
Hershfield, D.M., Wilson, W.T., 1960: A comparison of extreme rainfall depths from tropical and non-tropical storms. Journal of Geophysical Research, 65(3): pp. 959–982.
Hershfield. D.M., 1961: Estimating the probable maximum precipitation, J. Hyd. Div. ASEC, 87, Hy5, pp: 99-116.
Hershfield. D.M., 1965: Method for estimating probable maximum precipitation, J. Am. Water Works Assoc., 57, pp: 965-972.
Horton, R.E., 1924: Discussion of the distribution of intense rainfall and some other factors in the design of storm water drains. Proc. Amer. Meteor. Civil Engineers, 50, pp: 660-667.
Hydrology Studies Organization (1993), Workshop on Rationalization of Design Storm Parameters for Design Flood Estimation, Central water commission, New Delhi, India.

References
PMP Atlas for Mahanadi and Adjoining River Basins Page 258 of 260
Huff, F. A., Neill, J. C., 1959: Frequency relations for storm rainfall in Illinois. Illinois State Water Survey Bulletin 46. 65 p.
IMD 2000: Generalized maps of 1-day point maximum persisting dew point temperature. Meteorological Monograph, Hydrology No. 13/2000.
IITM, 1994: Isopluvial Atlas of India, Pune.
IITM, 2007: Generalized probable maximum precipitation (PMP) atlas of the Krishna River Basin. Central Water Commission, New Delhi, India.
IITM, 2007: Generalized probable maximum precipitation (PMP) atlas of the Indus River Basin. Central Water Commission, New Delhi, India
Khathuria, S. N., Kulkarni, S.D., 1993: Design storm studies of medium irrigation projects in Odisha. Proc. Unusual storm events and their relevance to dam safety and snow hydrology, CBIP Publ. No. 234, New Delhi, pp: 11-16.
Kendall, M.G., Stuart, A., 1961: The Advanced theory of statistics, Vol. 2, Griffin, London, U.K. pp: 676
Kennedy, M.R., 1982:The estimation of probable maximum precipitation in Australia – past and current practice, Proc. Workshop on Spillway Designs, AWRC Conf. Ser. No. 6, AGPS, Canberra, pp: 26-52.
Langbein, W.B., 1949: Annual floods and the partial duration flood series. Trans. Amer. Geophys. Union, 30, 6, pp: 879-881.
Lowery, M. D., Nash, J.E., 1970: A comparison of method of fitting the double exponential distribution. Journal of Hydrology, Vol. 10
Mayers, V.A., 1967: Meteorological estimation of extreme precipitation for spillway design floods, U.S Weather Bureau, WBTM, Hydro., 5, pp: 1-39.
Mohile et al., 1983: Hydro meteorological aspects of August 1982 storm over Odisha, Unusual storm events and their relevance to dam safety and snow hydrology, CBIP Publication, pp. 21-32
Pisharoty, P.R, Asnani, G.C., 1957: Rainfall around monsoon depressions over India. IJMG, 8, pp:1-8.
Ramaswamy, C., (1987), Meteorological Aspects of Severe Floods in India, 1923-1979. India Meteorological Department, New Delhi.
Rakhecha, P.R., Kulkarni, A.K., Mandal, B.N., Sangam, R.B., 1990: Design storm estimation of Ponnaiyar river catchment above Sathnur dam site, Hydrology J. IAH, 13(4), pp: 229-240.
Rakhecha, P.R., Deshpande, N.R., Kulkarni., A.K., Mandal, B.N., Sangam, R.B.,1995: Design storm studies for the Upper Krishna River catchment upstream of the Almatti dam site. Theor. Appl. Climatology, 52, pp: 211-216.
Rakhecha, P.R., Kulkarni, A.K., Mandal, B.N., Sangam, R.B., Deshpande, N.R.,1998: Probable maximum precipitation for the catchment of Koyna dam. Mausam, 49,2, pp: 211-216.
Rakhecha, P.R., Kennedy, M.R., 1985: A generalized technique for the estimation of probable maximum precipitation in India. J. Hydrology, 78, pp: 345-359.
Rakhecha, P.R., Pisharoty, P.R., 1996: Heavy rainfall during monsoon season: Point and Spatial distribution, Current Science, 71, pp: 177-186.
Rakhecha, P.R., Deshpande, N.R., Nandargi, S.S., 1990: Maximum persisting dew points during the southwest monsoon season over India, Mausam, 41, 1, pp: 140-142.
Rakhecha, P.R., Mandal, B.N., Kulkarni, A.K., Deshpande, N.R., 1995: Estimation of probable maximum precipitation for catchments in Eastern India by a generalized method. Theor. Appl. Climatol. 51, pp: 67-74.
Rakhecha, P.R., Soman, M.K., 1994: Estimation of Probable Maximum Precipitation for a 2-day duration: Part2- North Indian Region. Tehor. Appl. Climatol. 49, pp: 77-84.

References
PMP Atlas for Mahanadi and Adjoining River Basins Page 259 of 260
Rakhecha, P.R., Deshpande, N.R., Soman, M.K., 1992: Probable Maximum Precipitation for 2-day duration over the Indian Peninsula. Tehor. Appl. Aclimatol. 45, pp: 277-283.
Rakhecha P.R. and Vijay P. Singh, 2009. Applied Hydrometeorology, Capital Pub Company, 2009, xvi, 384 p, tables, figs, ISBN : 81-85589-63-1
Reitan, C.H., 1963: Surface dew point and water vapor aloft. J. Appl. Meteor. 9, pp: 776-779.
Reich, B. M., 1963: Short duration rainfall intensity estimates and other design aids for regions of sparse data. Journal of Hydrology. Vol. 1, No. 1
Schreiner, L.C., Riedcl, J.T., 1978: Probable maximum precipitation estimates. United States east of 105th
meridian. Hydro-meteorological Report No. 51, NWS, NOAA, US Dept. of Commerce, Washington D.C.
Schnoy, R.C., Chopra, S.D., 1966: Time distribution of storm rainfall for design flood. IJMG, 17, pp: 3-8.
Schwarz, F.K., 1972: A proposal for estimating tropical storm Probable Maximum Precipitation (PMP) for data – sparse regions. Proc. 2
nd Intl. Symp. On Hydrology, Fort Collins, Colorado, pp: 62-82.
Sharad K. Jain, Pushpendra K. Agarwal and Vijay P. Singh, 2007: Hydrology and Water Resources of India, Springer publication, The Netherlands.
U.S.W.B., 1970: Probable maximum precipitation, Mekong River basin, USWB, Hydrometeorol. Rep. No. 46, Silver Spring, Md.
USWB, 1960: Generalized estimates of probable maximum precipitation for the United States West of the 105th
meridian. USWB Tech. Pap. No. 38, Washington D.C.
WAPCOS (1998), Report for Godavari and other East Flowing Rivers, Dam Safety and Rehabilitation Project Generalized PMP Atlas-Phase-1, Central water commission, New Delhi, India.
WMO, 1969: Estimation of maximum floods. Tech Note No. 98, WMO No. 233. TP. 126.
WMO, 1970: Guide to hydro meteorological practices, WMO No. 168. TP. 82.
World Meteorological Organization (WMO), 1986: Manual for estimation of probable maximum precipitation. WMO operational hydrology report No. 1, WMO-No. 332, (Second Edition).
World Meteorological Organization (WMO), 2009: Manual for estimation of probable maximum precipitation (PMP). WMO-No. 1045.

PMP Atlas for Mahanadi and Adjoining River Basins Page 260 of 260
End of Volume I
Related Documents