PM2.5 Interpolation and Visualization based on Wind Fields ked 2016/05/15 2016/06/13 update

Welcome message from author
This document is posted to help you gain knowledge. Please leave a comment to let me know what you think about it! Share it to your friends and learn new things together.
Transcript

PM2.5 Interpolation andVisualization based on Wind Fields
ked2016/05/152016/06/13 update

Our system
PM2.5 http://www.cmlab.csie.ntu.edu.tw/~ked/pm25.htm
PM2.5 + radar http://www.cmlab.csie.ntu.edu.tw/~ked/
pm25_4.htm

Why a different PM2.5 vis. system
2016/04/12

The visualization of
PSI result
2016/04/12
The visualization of
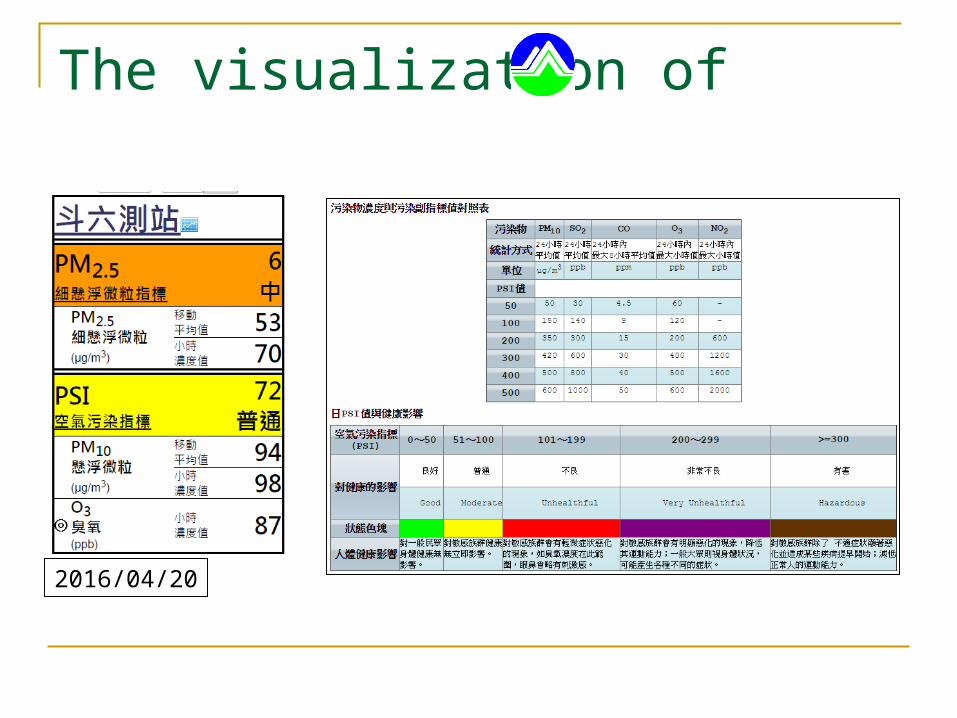
2016/04/20

The visualization of
PSI result Averaged index
2016/04/12
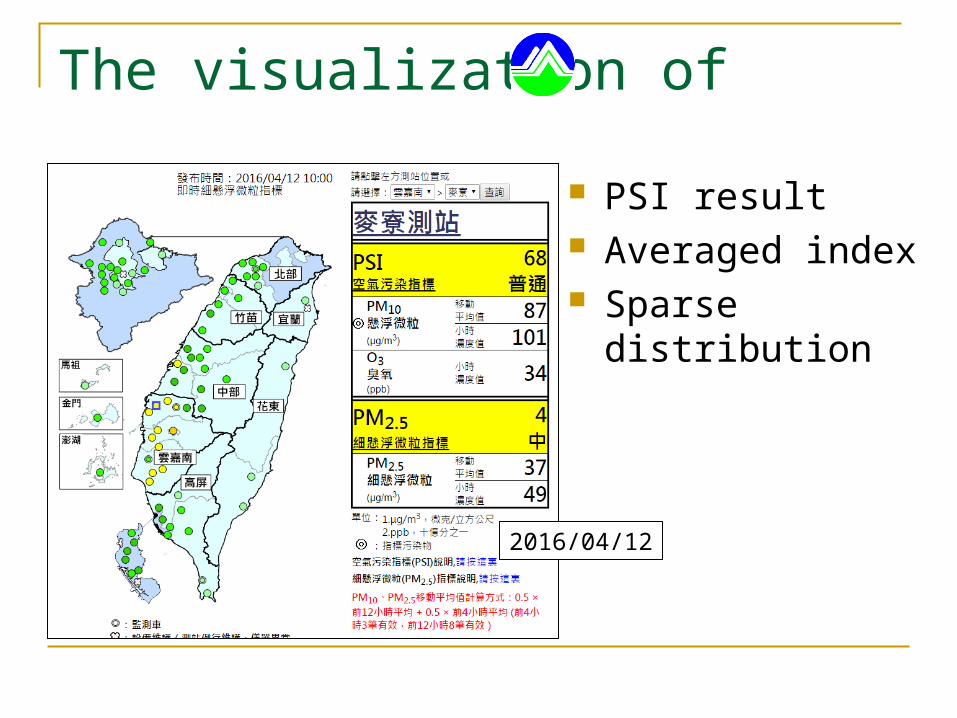
The visualization of
PSI result Averaged index Sparse distribution
2016/04/12

Other systems for PM2.5
http://env.g0v.tw/air/
2016/04/15

Other systems for PM2.5
http://env.g0v.tw/air/ http://env.childgrowth.info/air/
2016/04/15

Other systems for PM2.5
http://env.childgrowth.info/air/
天下雜誌 2015.03.17

How to interpolate the sparse data

Wind & PM2.5
天下雜誌 2015.03.17

Wind & PM2.5
東森新聞 2016.01.01

Our system
2016/04/15

Our system
2016/04/22

Outline
System description Data capture Interpolation Rendering Conclusions

Outline
System description Data capture Interpolation Rendering Conclusions

Features
Interpolation based on winds x 3D interaction
x Auto-renewal

Architecture
Our server
環保署
NCEP
Capture PM 2.5
Interpolate
Capture wind field & height field

Architecture
Web browserOur server
環保署
NCEP
Capture PM 2.5
Interpolate
Get data
Visualize &update
Capture wind field & height field

Outline
System description Data capture Interpolation Rendering Conclusions

PM2.5 data
Location ?

PM2.5 data + coordinate

Data of NCEP

.grib2 format – records

How to read .grib2 file
Refer to https://www.google.com.tw/url?
sa=t&rct=j&q=&esrc=s&source=web&cd=1&cad=rja&uact=8&ved=0ahUKEwjCvc7I2Y3MAhVKGJQKHVC4AxgQFgglMAA&url=http%3A%2F%2Fjou-p3.as.ntu.edu.tw%2FP3%2Ffile%2Fteaching%2Ff1386923093.pdf&usg=AFQjCNF0Z5dLY08WxC5pl_0BUxfTvxUvuQ&sig2=eLDe7X0wv0Ol1KG_Dnr9YQ

.grib2 format – regular data
https://www.google.com.tw/url?sa=t&rct=j&q=&esrc=s&source=web&cd=1&cad=rja&uact=8&ved=0ahUKEwjCvc7I2Y3MAhVKGJQKHVC4AxgQFgglMAA&url=http%3A%2F%2Fjou-p3.as.ntu.edu.tw%2FP3%2Ffile%2Fteaching%2Ff1386923093.pdf&usg=AFQjCNF0Z5dLY08WxC5pl_0BUxfTvxUvuQ&sig2=eLDe7X0wv0Ol1KG_Dnr9YQ

Outline
System description Data capture Interpolation Rendering Conclusions

Vector field

Streamline

Streamlines

Flow in the field

Flow in the field

Transition
1/3
5/9
1/9

Transition – intensity decay
1/3 x 1/2
5/9 x 1/2
1/9 x 1/2
1/2

Transition matrix
Refers to the stochastic process in which the transition probabilities depend only on the current state
1/3 x 1/2
5/9 x 1/2
1/9 x 1/2
1/2

Irreducible, aperiodic, recurrent
Stationary Markov chain

Stationary Markov chain

Outline
System description Data capture Interpolation Rendering Conclusions

Implementation
Javascript + webgl

Rendering
Taiwan
PM2.5
Wind vector

Scientific visualization
"it’s infovis when the spatial representation is chosen, and it’s scivis when the spatial representation is given“
-- wikipedia

Volume rendering
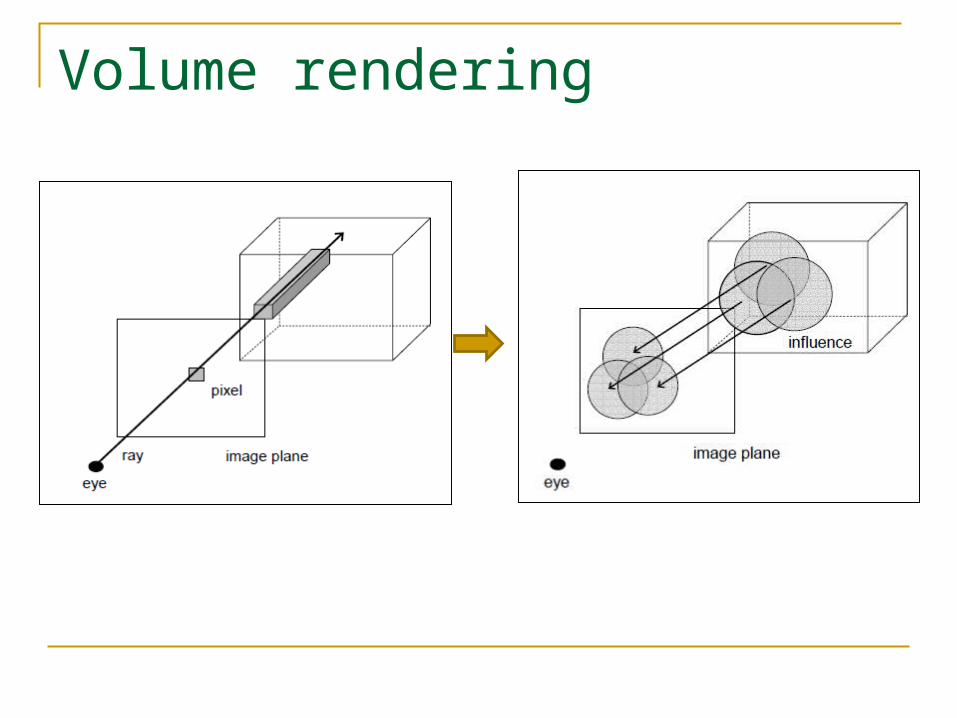
Volume rendering

Billboard
http://www.markmark.net/clouds/

Outline
System description Data capture Interpolation Rendering Conclusions
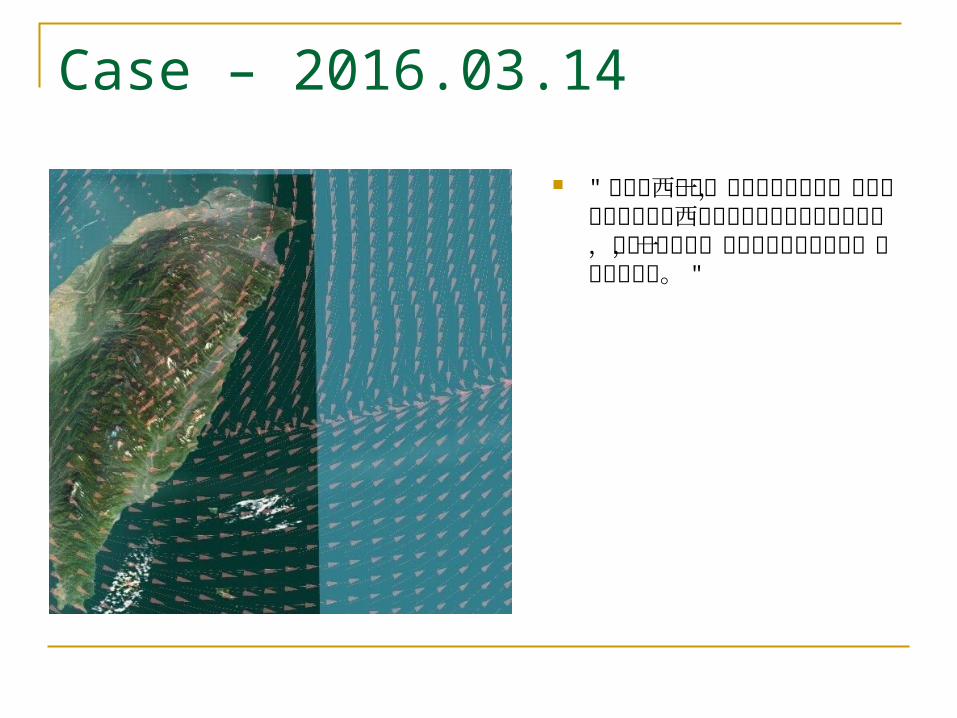
Case – 2016.03.14 " 在臺灣西南側一條繩索狀的白雲,那是南海吹過來微弱西南風和東側高壓迴流的交界面,因為大氣穩定,所以只在海面上形成一長條的索狀雲。 "

Case – 2016.04.08

Thx.
站在推廣環保和教育的立場,我從電腦圖學的角度出發,做了一個互動系統,希望民眾可以重視 PM2.5 的問題,更希望的是,我們的下一代,可以因為我們的覺醒,而呼吸到更好的空氣。

Update Streamlines for wind field Weather radar for rainfall
Anaglyph 3D

Streamline placement
Refer to

Weather radar data
Download from

Thx.
Related Documents