Pliocene colonization and adaptive radiations in Australia and New Guinea (Sahul): Multilocus systematics of the old endemic rodents (Muroidea: Murinae) Kevin C. Rowe a,b, * , Michael L. Reno b , Daniel M. Richmond b , Ronald M. Adkins c , Scott J. Steppan b a Museum of Vertebrate Zoology, University of California, 3101 Valley Life Sciences Building, Berkeley, CA 94720-3160, USA b Department of Biological Science, The Florida State University, Tallahassee, FL 32306-1100, USA c Children’s Foundation Research Center and Center of Genomics and Bioinformatics, University of Tennessee Health Science Center, Memphis, TN 38103, USA Received 19 April 2007; revised 27 December 2007; accepted 3 January 2008 Available online 11 January 2008 Abstract The old endemic rodents of Australia and New Guinea (Sahul) represent one or more large adaptive radiations including novel mor- phological adaptations to aquatic, arboreal, hopping, and arid ecologies. Four tribes recognized among the Sahulian old endemics (Hydromini, Conilurini, Anisomyini, and Uromyini) reflect distinct biogeographic and ecomorphological hypotheses about diversifica- tion within the Old Endemics. We present the first character-based phylogeny of the Sahulian Old Endemic rodents with broad sampling, nested within a broader phylogeny of the Murinae. We estimated phylogenies from >2500 nucleotides of mtDNA sequence and >9500 nucleotides from six autosomal nuclear loci, for individual genes and for the full concatenated data using parsimony, likelihood, and Bayesian methods. Our results strongly supported monophyly of the group and its sister relationship to the Philippine old endemics of the Chrotomys division. Most striking was the rapid diversification after the Late Miocene or Early Pliocene colonization of New Gui- nea from the west, consistent with a single colonization of the Sahulian continent. That was followed 2–3 My later by a second adaptive radiation resulting from one or more colonizations of Australia. Monophyly was not supported for the Anisomyini or the Conilurini but was for the Uromyini nested within the Conilurini and for the Hydromyini. Conflict among gene phylogenies was weak, and support for the consensus topology increased with more (even conflicting) data. Ó 2008 Elsevier Inc. All rights reserved. Keywords: Mammalia; Muridae; Phylogeny; Biogeography; DNA 1. Introduction Australia, New Guinea, and nearby islands have been exemplary subjects for studies of biogeographic patterns and radiations of endemic flora and fauna throughout much of modern biology (e.g., Wallace, 1860; Mayr, 1944; Simpson 1961, 1977; Raven and Axelrod, 1972). Most of the interest in endemic clades has focused on the relatively ancient groups whose origins date back to the break up of Gondwana (e.g. Ratites, Haddrath and Baker, 2001; and marsupials: Springer et al., 1998) or other clades with Cretaceous or early Tertiary origins (e.g., eucalypts, Ladiges et al., 2003; see also Woodburne and Case, 1996; and Sanmartin and Ronquist, 2004 for review). Other research has focused on the biogeographic consequences of faunal interchange between Oriental and Australasian groups for biodiversity of the Indonesian Archipelago and on such demarcations as Wallace’s, Weber’s and Lyd- ekker’s lines (Fig. 1; Whitten et al., 1987; Moss and Wilson, 1055-7903/$ - see front matter Ó 2008 Elsevier Inc. All rights reserved. doi:10.1016/j.ympev.2008.01.001 * Corresponding author. Address: Museum of Vertebrate Zoology, University of California, 3101 Valley Life Sciences Building, Berkeley, CA 94720-3160, USA. Fax: +1 510 643 8238. E-mail address: [email protected] (K.C. Rowe). www.elsevier.com/locate/ympev Available online at www.sciencedirect.com Molecular Phylogenetics and Evolution 47 (2008) 84–101

Welcome message from author
This document is posted to help you gain knowledge. Please leave a comment to let me know what you think about it! Share it to your friends and learn new things together.
Transcript
Available online at www.sciencedirect.com
www.elsevier.com/locate/ympev
Molecular Phylogenetics and Evolution 47 (2008) 84–101
Pliocene colonization and adaptive radiations in Australiaand New Guinea (Sahul): Multilocus systematics of the
old endemic rodents (Muroidea: Murinae)
Kevin C. Rowe a,b,*, Michael L. Reno b, Daniel M. Richmond b,Ronald M. Adkins c, Scott J. Steppan b
a Museum of Vertebrate Zoology, University of California, 3101 Valley Life Sciences Building, Berkeley, CA 94720-3160, USAb Department of Biological Science, The Florida State University, Tallahassee, FL 32306-1100, USA
c Children’s Foundation Research Center and Center of Genomics and Bioinformatics,
University of Tennessee Health Science Center, Memphis, TN 38103, USA
Received 19 April 2007; revised 27 December 2007; accepted 3 January 2008Available online 11 January 2008
Abstract
The old endemic rodents of Australia and New Guinea (Sahul) represent one or more large adaptive radiations including novel mor-phological adaptations to aquatic, arboreal, hopping, and arid ecologies. Four tribes recognized among the Sahulian old endemics(Hydromini, Conilurini, Anisomyini, and Uromyini) reflect distinct biogeographic and ecomorphological hypotheses about diversifica-tion within the Old Endemics. We present the first character-based phylogeny of the Sahulian Old Endemic rodents with broad sampling,nested within a broader phylogeny of the Murinae. We estimated phylogenies from >2500 nucleotides of mtDNA sequence and >9500nucleotides from six autosomal nuclear loci, for individual genes and for the full concatenated data using parsimony, likelihood, andBayesian methods. Our results strongly supported monophyly of the group and its sister relationship to the Philippine old endemicsof the Chrotomys division. Most striking was the rapid diversification after the Late Miocene or Early Pliocene colonization of New Gui-nea from the west, consistent with a single colonization of the Sahulian continent. That was followed 2–3 My later by a second adaptiveradiation resulting from one or more colonizations of Australia. Monophyly was not supported for the Anisomyini or the Conilurini butwas for the Uromyini nested within the Conilurini and for the Hydromyini. Conflict among gene phylogenies was weak, and support forthe consensus topology increased with more (even conflicting) data.� 2008 Elsevier Inc. All rights reserved.
Keywords: Mammalia; Muridae; Phylogeny; Biogeography; DNA
1. Introduction
Australia, New Guinea, and nearby islands have beenexemplary subjects for studies of biogeographic patternsand radiations of endemic flora and fauna throughoutmuch of modern biology (e.g., Wallace, 1860; Mayr,1944; Simpson 1961, 1977; Raven and Axelrod, 1972).
1055-7903/$ - see front matter � 2008 Elsevier Inc. All rights reserved.
doi:10.1016/j.ympev.2008.01.001
* Corresponding author. Address: Museum of Vertebrate Zoology,University of California, 3101 Valley Life Sciences Building, Berkeley, CA94720-3160, USA. Fax: +1 510 643 8238.
E-mail address: [email protected] (K.C. Rowe).
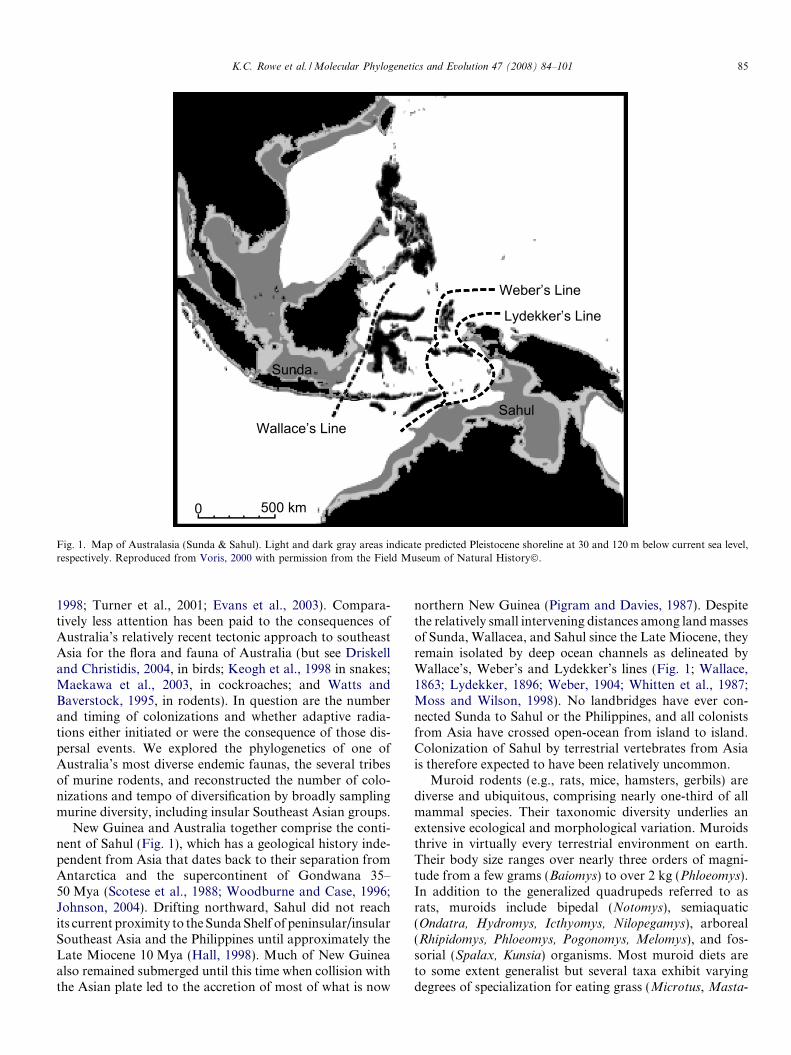
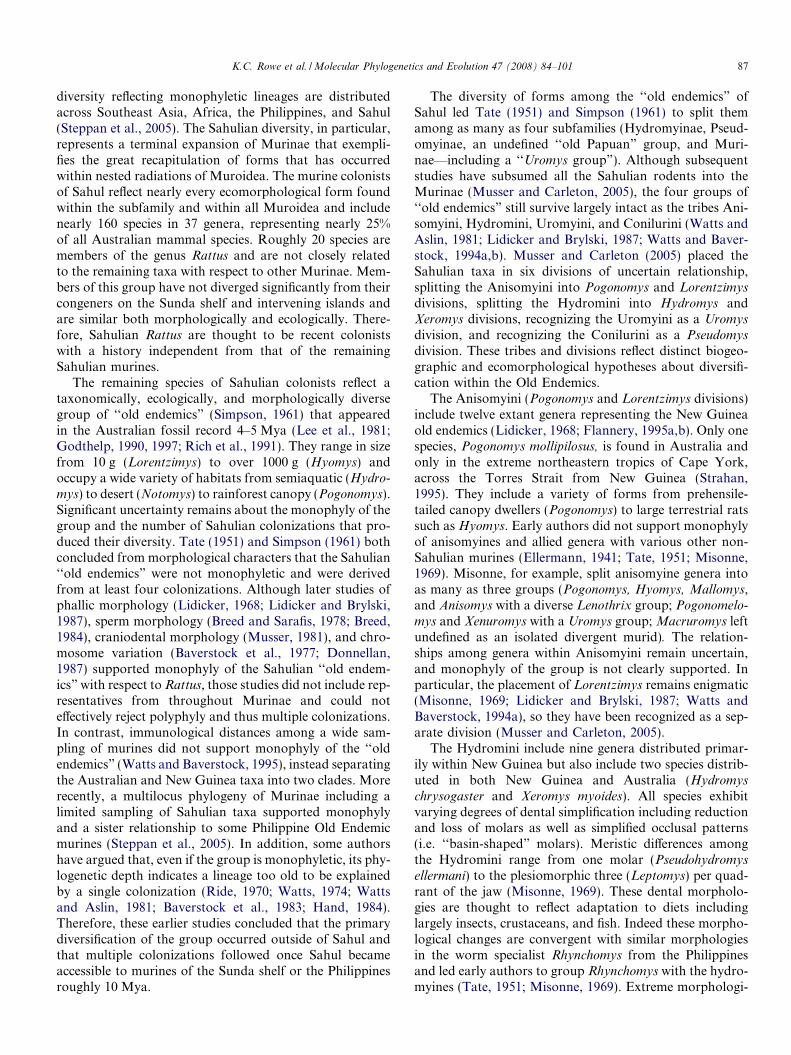
Most of the interest in endemic clades has focused on therelatively ancient groups whose origins date back to thebreak up of Gondwana (e.g. Ratites, Haddrath and Baker,2001; and marsupials: Springer et al., 1998) or other cladeswith Cretaceous or early Tertiary origins (e.g., eucalypts,Ladiges et al., 2003; see also Woodburne and Case, 1996;and Sanmartin and Ronquist, 2004 for review). Otherresearch has focused on the biogeographic consequencesof faunal interchange between Oriental and Australasiangroups for biodiversity of the Indonesian Archipelagoand on such demarcations as Wallace’s, Weber’s and Lyd-ekker’s lines (Fig. 1; Whitten et al., 1987; Moss and Wilson,
0 500 km
Sahul
Sunda
Wallace’s Line
Weber’s Line
Lydekker’s Line
Fig. 1. Map of Australasia (Sunda & Sahul). Light and dark gray areas indicate predicted Pleistocene shoreline at 30 and 120 m below current sea level,respectively. Reproduced from Voris, 2000 with permission from the Field Museum of Natural History�.
K.C. Rowe et al. / Molecular Phylogenetics and Evolution 47 (2008) 84–101 85
1998; Turner et al., 2001; Evans et al., 2003). Compara-tively less attention has been paid to the consequences ofAustralia’s relatively recent tectonic approach to southeastAsia for the flora and fauna of Australia (but see Driskelland Christidis, 2004, in birds; Keogh et al., 1998 in snakes;Maekawa et al., 2003, in cockroaches; and Watts andBaverstock, 1995, in rodents). In question are the numberand timing of colonizations and whether adaptive radia-tions either initiated or were the consequence of those dis-persal events. We explored the phylogenetics of one ofAustralia’s most diverse endemic faunas, the several tribesof murine rodents, and reconstructed the number of colo-nizations and tempo of diversification by broadly samplingmurine diversity, including insular Southeast Asian groups.
New Guinea and Australia together comprise the conti-nent of Sahul (Fig. 1), which has a geological history inde-pendent from Asia that dates back to their separation fromAntarctica and the supercontinent of Gondwana 35–50 Mya (Scotese et al., 1988; Woodburne and Case, 1996;Johnson, 2004). Drifting northward, Sahul did not reachits current proximity to the Sunda Shelf of peninsular/insularSoutheast Asia and the Philippines until approximately theLate Miocene 10 Mya (Hall, 1998). Much of New Guineaalso remained submerged until this time when collision withthe Asian plate led to the accretion of most of what is now
northern New Guinea (Pigram and Davies, 1987). Despitethe relatively small intervening distances among land massesof Sunda, Wallacea, and Sahul since the Late Miocene, theyremain isolated by deep ocean channels as delineated byWallace’s, Weber’s and Lydekker’s lines (Fig. 1; Wallace,1863; Lydekker, 1896; Weber, 1904; Whitten et al., 1987;Moss and Wilson, 1998). No landbridges have ever con-nected Sunda to Sahul or the Philippines, and all colonistsfrom Asia have crossed open-ocean from island to island.Colonization of Sahul by terrestrial vertebrates from Asiais therefore expected to have been relatively uncommon.
Muroid rodents (e.g., rats, mice, hamsters, gerbils) arediverse and ubiquitous, comprising nearly one-third of allmammal species. Their taxonomic diversity underlies anextensive ecological and morphological variation. Muroidsthrive in virtually every terrestrial environment on earth.Their body size ranges over nearly three orders of magni-tude from a few grams (Baiomys) to over 2 kg (Phloeomys).In addition to the generalized quadrupeds referred to asrats, muroids include bipedal (Notomys), semiaquatic(Ondatra, Hydromys, Icthyomys, Nilopegamys), arboreal(Rhipidomys, Phloeomys, Pogonomys, Melomys), and fos-sorial (Spalax, Kunsia) organisms. Most muroid diets areto some extent generalist but several taxa exhibit varyingdegrees of specialization for eating grass (Microtus, Masta-
86 K.C. Rowe et al. / Molecular Phylogenetics and Evolution 47 (2008) 84–101
comys), bamboo (Hapalomys, Mallomys), seeds, fruit,insects (Acomys), earthworms (Rhynchomys), or crusta-ceans and fish (Ichthyomys, Hydromys). This great surfeitof diversity has emerged in a relatively young lineage ofmammals, in which most diversity is contained in the cladeEumuroidea, whose origins in North America have beendated by fossil and molecular genetic studies to roughly25 Mya in the Oligocene (Wood, 1980; Emry, 1981; Step-pan et al., 2004a).
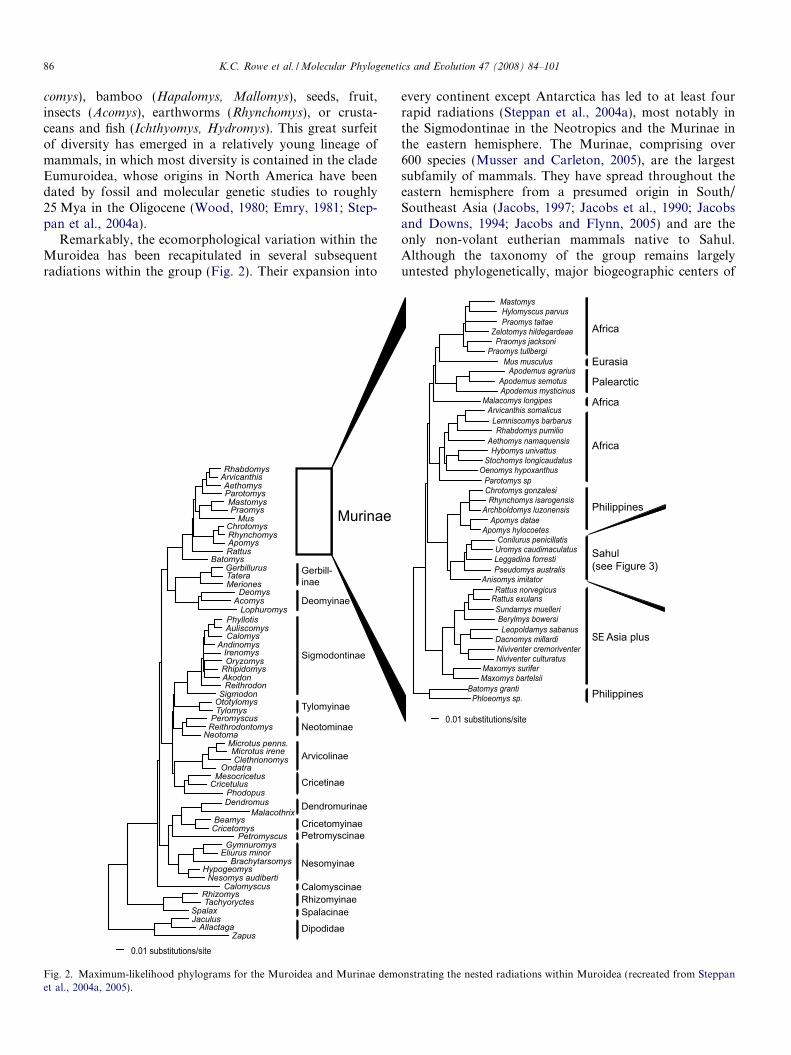
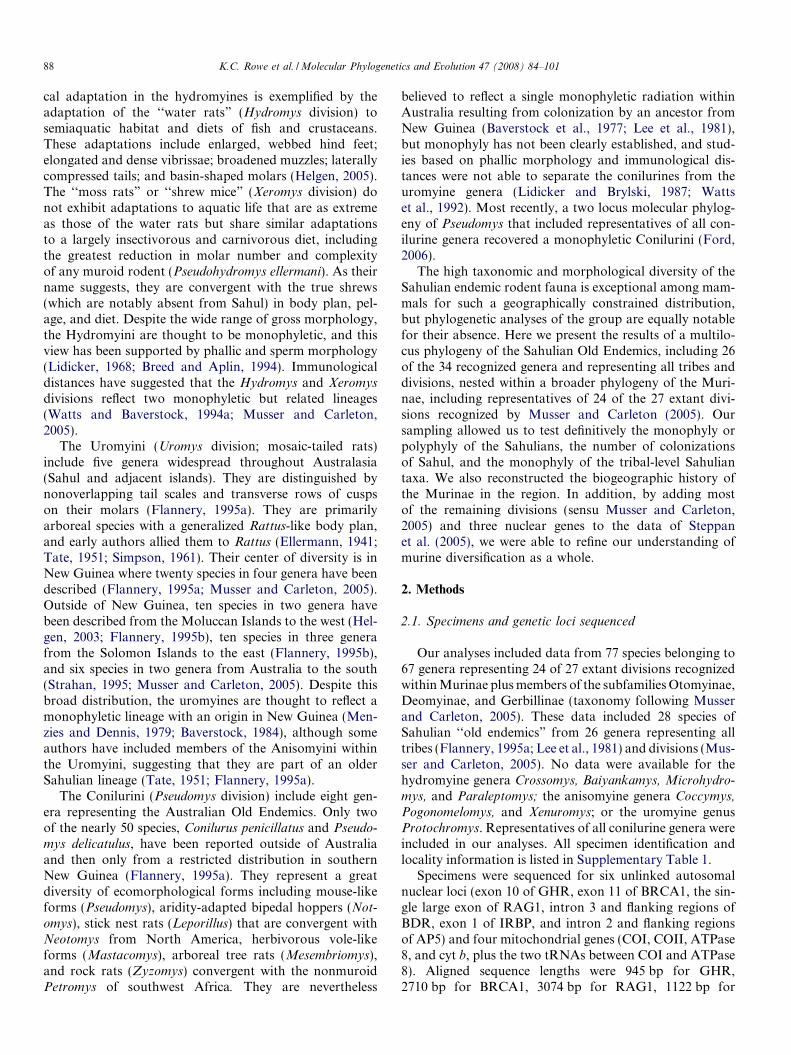
Remarkably, the ecomorphological variation within theMuroidea has been recapitulated in several subsequentradiations within the group (Fig. 2). Their expansion into
PhyllotisAuliscomysCalomys
AndinomysIrenomysOryzomys
RhipidomysAkodonReithrodon
SigmodonOtotylomysTylomys
PeromyscusReithrodontomys
NeotomaMicrotus penns.Microtus ireneClethrionomys
OndatraMesocricetus
CricetulusPhodopus
RhabdomysArvicanthisAethomysParotomysMastomysPraomys
MusChrotomysRhynchomysApomysRattus
BatomysGerbillurusTateraMeriones
DeomysAcomys
Lophuromys
DendromusMalacothrix
BeamysCricetomys
PetromyscusGymnuromys
Eliurus minorBrachytarsomys
HypogeomysNesomys audiberti
CalomyscusRhizomysTachyoryctes
SpalaxJaculus
AllactagaZapus
0.01 substitutions/site
Murinae
Gerbill-inae
Deomyinae
Sigmodontinae
Tylomyinae
Neotominae
Arvicolinae
Cricetinae
Dendromurinae
CricetomyinaePetromyscinae
Nesomyinae
CalomyscinaeRhizomyinaeSpalacinae
Dipodidae
Fig. 2. Maximum-likelihood phylograms for the Muroidea and Murinae demet al., 2004a, 2005).
every continent except Antarctica has led to at least fourrapid radiations (Steppan et al., 2004a), most notably inthe Sigmodontinae in the Neotropics and the Murinae inthe eastern hemisphere. The Murinae, comprising over600 species (Musser and Carleton, 2005), are the largestsubfamily of mammals. They have spread throughout theeastern hemisphere from a presumed origin in South/Southeast Asia (Jacobs, 1997; Jacobs et al., 1990; Jacobsand Downs, 1994; Jacobs and Flynn, 2005) and are theonly non-volant eutherian mammals native to Sahul.Although the taxonomy of the group remains largelyuntested phylogenetically, major biogeographic centers of
MastomysHylomyscus parvus Praomys taitae
Zelotomys hildegardeae Praomys jacksoni
Praomys tullbergi Mus musculus
Apodemus agrarius Apodemus semotusApodemus mysticinus
Malacomys longipes Arvicanthis somalicus
Lemniscomys barbarus Rhabdomys pumilio
Aethomys namaquensisHybomys univattus
Stochomys longicaudatus Oenomys hypoxanthus
Parotomys spChrotomys gonzalesi Rhynchomys isarogensis
Archboldomys luzonensisApomys datae
Apomys hylocoetes Conilurus penicillatis
Uromys caudimaculatus Leggadina forresti Pseudomys australis
Anisomys imitatorRattus norvegicus
Rattus exulans Sundamys muelleri Berylmys bowersi Leopoldamys sabanus
Dacnomys millardi Niviventer cremoriventerNiviventer culturatus
Maxomys suriferMaxomys bartelsii
Batomys granti Phloeomys sp.
0.01 substitutions/site
Africa
Eurasia
Palearctic
Africa
Philippines
Sahul(see Figure 3)
SE Asia plus
Philippines
Africa
onstrating the nested radiations within Muroidea (recreated from Steppan
K.C. Rowe et al. / Molecular Phylogenetics and Evolution 47 (2008) 84–101 87
diversity reflecting monophyletic lineages are distributedacross Southeast Asia, Africa, the Philippines, and Sahul(Steppan et al., 2005). The Sahulian diversity, in particular,represents a terminal expansion of Murinae that exempli-fies the great recapitulation of forms that has occurredwithin nested radiations of Muroidea. The murine colonistsof Sahul reflect nearly every ecomorphological form foundwithin the subfamily and within all Muroidea and includenearly 160 species in 37 genera, representing nearly 25%of all Australian mammal species. Roughly 20 species aremembers of the genus Rattus and are not closely relatedto the remaining taxa with respect to other Murinae. Mem-bers of this group have not diverged significantly from theircongeners on the Sunda shelf and intervening islands andare similar both morphologically and ecologically. There-fore, Sahulian Rattus are thought to be recent colonistswith a history independent from that of the remainingSahulian murines.
The remaining species of Sahulian colonists reflect ataxonomically, ecologically, and morphologically diversegroup of ‘‘old endemics” (Simpson, 1961) that appearedin the Australian fossil record 4–5 Mya (Lee et al., 1981;Godthelp, 1990, 1997; Rich et al., 1991). They range in sizefrom 10 g (Lorentzimys) to over 1000 g (Hyomys) andoccupy a wide variety of habitats from semiaquatic (Hydro-
mys) to desert (Notomys) to rainforest canopy (Pogonomys).Significant uncertainty remains about the monophyly of thegroup and the number of Sahulian colonizations that pro-duced their diversity. Tate (1951) and Simpson (1961) bothconcluded from morphological characters that the Sahulian‘‘old endemics” were not monophyletic and were derivedfrom at least four colonizations. Although later studies ofphallic morphology (Lidicker, 1968; Lidicker and Brylski,1987), sperm morphology (Breed and Sarafis, 1978; Breed,1984), craniodental morphology (Musser, 1981), and chro-mosome variation (Baverstock et al., 1977; Donnellan,1987) supported monophyly of the Sahulian ‘‘old endem-ics” with respect to Rattus, those studies did not include rep-resentatives from throughout Murinae and could noteffectively reject polyphyly and thus multiple colonizations.In contrast, immunological distances among a wide sam-pling of murines did not support monophyly of the ‘‘oldendemics” (Watts and Baverstock, 1995), instead separatingthe Australian and New Guinea taxa into two clades. Morerecently, a multilocus phylogeny of Murinae including alimited sampling of Sahulian taxa supported monophylyand a sister relationship to some Philippine Old Endemicmurines (Steppan et al., 2005). In addition, some authorshave argued that, even if the group is monophyletic, its phy-logenetic depth indicates a lineage too old to be explainedby a single colonization (Ride, 1970; Watts, 1974; Wattsand Aslin, 1981; Baverstock et al., 1983; Hand, 1984).Therefore, these earlier studies concluded that the primarydiversification of the group occurred outside of Sahul andthat multiple colonizations followed once Sahul becameaccessible to murines of the Sunda shelf or the Philippinesroughly 10 Mya.
The diversity of forms among the ‘‘old endemics” ofSahul led Tate (1951) and Simpson (1961) to split themamong as many as four subfamilies (Hydromyinae, Pseud-omyinae, an undefined ‘‘old Papuan” group, and Muri-nae—including a ‘‘Uromys group”). Although subsequentstudies have subsumed all the Sahulian rodents into theMurinae (Musser and Carleton, 2005), the four groups of‘‘old endemics” still survive largely intact as the tribes Ani-somyini, Hydromini, Uromyini, and Conilurini (Watts andAslin, 1981; Lidicker and Brylski, 1987; Watts and Baver-stock, 1994a,b). Musser and Carleton (2005) placed theSahulian taxa in six divisions of uncertain relationship,splitting the Anisomyini into Pogonomys and Lorentzimys
divisions, splitting the Hydromini into Hydromys andXeromys divisions, recognizing the Uromyini as a Uromys
division, and recognizing the Conilurini as a Pseudomys
division. These tribes and divisions reflect distinct biogeo-graphic and ecomorphological hypotheses about diversifi-cation within the Old Endemics.
The Anisomyini (Pogonomys and Lorentzimys divisions)include twelve extant genera representing the New Guineaold endemics (Lidicker, 1968; Flannery, 1995a,b). Only onespecies, Pogonomys mollipilosus, is found in Australia andonly in the extreme northeastern tropics of Cape York,across the Torres Strait from New Guinea (Strahan,1995). They include a variety of forms from prehensile-tailed canopy dwellers (Pogonomys) to large terrestrial ratssuch as Hyomys. Early authors did not support monophylyof anisomyines and allied genera with various other non-Sahulian murines (Ellermann, 1941; Tate, 1951; Misonne,1969). Misonne, for example, split anisomyine genera intoas many as three groups (Pogonomys, Hyomys, Mallomys,and Anisomys with a diverse Lenothrix group; Pogonomelo-
mys and Xenuromys with a Uromys group; Macruromys leftundefined as an isolated divergent murid). The relation-ships among genera within Anisomyini remain uncertain,and monophyly of the group is not clearly supported. Inparticular, the placement of Lorentzimys remains enigmatic(Misonne, 1969; Lidicker and Brylski, 1987; Watts andBaverstock, 1994a), so they have been recognized as a sep-arate division (Musser and Carleton, 2005).
The Hydromini include nine genera distributed primar-ily within New Guinea but also include two species distrib-uted in both New Guinea and Australia (Hydromys
chrysogaster and Xeromys myoides). All species exhibitvarying degrees of dental simplification including reductionand loss of molars as well as simplified occlusal patterns(i.e. ‘‘basin-shaped” molars). Meristic differences amongthe Hydromini range from one molar (Pseudohydromys
ellermani) to the plesiomorphic three (Leptomys) per quad-rant of the jaw (Misonne, 1969). These dental morpholo-gies are thought to reflect adaptation to diets includinglargely insects, crustaceans, and fish. Indeed these morpho-logical changes are convergent with similar morphologiesin the worm specialist Rhynchomys from the Philippinesand led early authors to group Rhynchomys with the hydro-myines (Tate, 1951; Misonne, 1969). Extreme morphologi-
88 K.C. Rowe et al. / Molecular Phylogenetics and Evolution 47 (2008) 84–101
cal adaptation in the hydromyines is exemplified by theadaptation of the ‘‘water rats” (Hydromys division) tosemiaquatic habitat and diets of fish and crustaceans.These adaptations include enlarged, webbed hind feet;elongated and dense vibrissae; broadened muzzles; laterallycompressed tails; and basin-shaped molars (Helgen, 2005).The ‘‘moss rats” or ‘‘shrew mice” (Xeromys division) donot exhibit adaptations to aquatic life that are as extremeas those of the water rats but share similar adaptationsto a largely insectivorous and carnivorous diet, includingthe greatest reduction in molar number and complexityof any muroid rodent (Pseudohydromys ellermani). As theirname suggests, they are convergent with the true shrews(which are notably absent from Sahul) in body plan, pel-age, and diet. Despite the wide range of gross morphology,the Hydromyini are thought to be monophyletic, and thisview has been supported by phallic and sperm morphology(Lidicker, 1968; Breed and Aplin, 1994). Immunologicaldistances have suggested that the Hydromys and Xeromys
divisions reflect two monophyletic but related lineages(Watts and Baverstock, 1994a; Musser and Carleton,2005).
The Uromyini (Uromys division; mosaic-tailed rats)include five genera widespread throughout Australasia(Sahul and adjacent islands). They are distinguished bynonoverlapping tail scales and transverse rows of cuspson their molars (Flannery, 1995a). They are primarilyarboreal species with a generalized Rattus-like body plan,and early authors allied them to Rattus (Ellermann, 1941;Tate, 1951; Simpson, 1961). Their center of diversity is inNew Guinea where twenty species in four genera have beendescribed (Flannery, 1995a; Musser and Carleton, 2005).Outside of New Guinea, ten species in two genera havebeen described from the Moluccan Islands to the west (Hel-gen, 2003; Flannery, 1995b), ten species in three generafrom the Solomon Islands to the east (Flannery, 1995b),and six species in two genera from Australia to the south(Strahan, 1995; Musser and Carleton, 2005). Despite thisbroad distribution, the uromyines are thought to reflect amonophyletic lineage with an origin in New Guinea (Men-zies and Dennis, 1979; Baverstock, 1984), although someauthors have included members of the Anisomyini withinthe Uromyini, suggesting that they are part of an olderSahulian lineage (Tate, 1951; Flannery, 1995a).
The Conilurini (Pseudomys division) include eight gen-era representing the Australian Old Endemics. Only twoof the nearly 50 species, Conilurus penicillatus and Pseudo-
mys delicatulus, have been reported outside of Australiaand then only from a restricted distribution in southernNew Guinea (Flannery, 1995a). They represent a greatdiversity of ecomorphological forms including mouse-likeforms (Pseudomys), aridity-adapted bipedal hoppers (Not-
omys), stick nest rats (Leporillus) that are convergent withNeotomys from North America, herbivorous vole-likeforms (Mastacomys), arboreal tree rats (Mesembriomys),and rock rats (Zyzomys) convergent with the nonmuroidPetromys of southwest Africa. They are nevertheless
believed to reflect a single monophyletic radiation withinAustralia resulting from colonization by an ancestor fromNew Guinea (Baverstock et al., 1977; Lee et al., 1981),but monophyly has not been clearly established, and stud-ies based on phallic morphology and immunological dis-tances were not able to separate the conilurines from theuromyine genera (Lidicker and Brylski, 1987; Wattset al., 1992). Most recently, a two locus molecular phylog-eny of Pseudomys that included representatives of all con-ilurine genera recovered a monophyletic Conilurini (Ford,2006).
The high taxonomic and morphological diversity of theSahulian endemic rodent fauna is exceptional among mam-mals for such a geographically constrained distribution,but phylogenetic analyses of the group are equally notablefor their absence. Here we present the results of a multilo-cus phylogeny of the Sahulian Old Endemics, including 26of the 34 recognized genera and representing all tribes anddivisions, nested within a broader phylogeny of the Muri-nae, including representatives of 24 of the 27 extant divi-sions recognized by Musser and Carleton (2005). Oursampling allowed us to test definitively the monophyly orpolyphyly of the Sahulians, the number of colonizationsof Sahul, and the monophyly of the tribal-level Sahuliantaxa. We also reconstructed the biogeographic history ofthe Murinae in the region. In addition, by adding mostof the remaining divisions (sensu Musser and Carleton,2005) and three nuclear genes to the data of Steppanet al. (2005), we were able to refine our understanding ofmurine diversification as a whole.
2. Methods
2.1. Specimens and genetic loci sequenced
Our analyses included data from 77 species belonging to67 genera representing 24 of 27 extant divisions recognizedwithin Murinae plus members of the subfamilies Otomyinae,Deomyinae, and Gerbillinae (taxonomy following Musserand Carleton, 2005). These data included 28 species ofSahulian ‘‘old endemics” from 26 genera representing alltribes (Flannery, 1995a; Lee et al., 1981) and divisions (Mus-ser and Carleton, 2005). No data were available for thehydromyine genera Crossomys, Baiyankamys, Microhydro-
mys, and Paraleptomys; the anisomyine genera Coccymys,
Pogonomelomys, and Xenuromys; or the uromyine genusProtochromys. Representatives of all conilurine genera wereincluded in our analyses. All specimen identification andlocality information is listed in Supplementary Table 1.
Specimens were sequenced for six unlinked autosomalnuclear loci (exon 10 of GHR, exon 11 of BRCA1, the sin-gle large exon of RAG1, intron 3 and flanking regions ofBDR, exon 1 of IRBP, and intron 2 and flanking regionsof AP5) and four mitochondrial genes (COI, COII, ATPase8, and cyt b, plus the two tRNAs between COI and ATPase8). Aligned sequence lengths were 945 bp for GHR,2710 bp for BRCA1, 3074 bp for RAG1, 1122 bp for
K.C. Rowe et al. / Molecular Phylogenetics and Evolution 47 (2008) 84–101 89
BDR, 1316 bp for IRBP, 435 bp for AP5, and 2499 bp formtDNA, for a total of 12,101 bp of aligned and analyzeddata. IRBP sequences for 23 species were obtained fromGenBank (Jansa and Weksler, 2004; Lecompte et al.,2005). BDR sequence was obtained for Rattus norvegicus
by a Blast-N comparison of BDR sequence from Rattusleucopus to the Rattus norvegicus genome on GenBank.
All new sequences were submitted to GenBank with acces-sion numbers listed in Supplementary Table 2. Sequenceswere not available for all loci for all specimens as identifiedin Supplementary Table 2. For the concatenated dataanalyses, the genera Gerbillurus, Meriones, Phloeomys,
Vandeleuria, Millardia, Otomys, Parotomys, Dasymys,
Arvicanthis, Aethomys, and Apomys resulted from chimerasof species. In most cases these chimeras were produced byincorporation of IRBP sequences from GenBank. The spe-cies Hydromys chysogaster, Pogonomys loriae, Rattus leuc-
opus and Uranomys ruddi resulted from chimeras ofspecimens with identical localities and collection dates.The species Stochomys longicaudatus and Tatera robusta
resulted from chimeras of specimens from different locali-ties and collection dates. The identity or near identity ofeach of these species chimeras was confirmed with at leastone locus with overlapping sequence data (data notshown).
2.2. DNA extraction and sequencing
Total genomic DNA was extracted from liver or muscletissue with PCI (phenol/chloroform/isopropanol)/CI (chlo-roform/isopropanol) ‘‘hot” extractions as described bySambrook et al. (1989). Amplification of all loci followedsimilar protocols. All PCR reactions included a negativecontrol (no template DNA), intended to identify anyinstances of contamination of reagents, and were visualizedon agarose gels with ethidium bromide. Successful reac-tions were prepared directly by enzymatic digestion withExo-SAP-IT (USP, USA) or isolated from a low-melting-point gel with Wizard PCR prep reagents (Promega,USA). Both strands of each PCR product were completelysequenced with PCR primers and internal primers opti-mized to specific taxa. Products were sequenced by auto-mated DNA sequencing on an ABI 3100 using big-dyeterminator chemistry (Applied Biosystems, USA).
Amplification and sequencing of GHR, BRCA1,RAG1, AP5, COI, COII, IRBP, and ATPase were com-pleted with primers under reaction conditions describedpreviously (Jansa and Voss, 2000; Adkins et al., 2001;DeBry and Seshadri, 2001; Steppan et al., 2004a,b, 2005).Additional primer sequences were used for specific taxafor RAG1 and AP5 (RAG1-S211 (GGGTGMGATCYTTTGAAAA) and S212 (CVGTYCTGTACATCTTRTGRTA); AP5-S223 (CAGCCMGSGAARTDGCSAAYGC)).All BDR amplifications were performed at annealing tem-perature of 64 �C for 40 cycles using primer sequences S221(CAGCTYTCRGGARGYTGAAG) and S222 (CARA-CTTAACAGMAATYCTCCTRCC). Cyt b amplifications
were performed at annealing temperature of 58 �C for 40cycles using a combination of the primer sequences S199(CCTCARAATGATATTTGTCCTCA), P484 (TGAAAAAYCATCGTTGT), and P485 (TYTYCWTYTTNGGTTTACAARAC) depending on specific taxa.
2.3. Phylogenetic analyses
Results of individual sequencing runs for each specieswere combined into contiguous sequences with Sequencher4.5 (GeneCodes Corp., Ann Arbor, MI), and regions ofambiguity or disagreement resolved through manualinspection of sequence traces. Manual refinement consoli-dated for a small number of noncoding indels and broughtcoding-region indels into the coding frame. Alignment ofall protein-coding regions was trivial because amino-acidindels were rare and unequivocal. Sequences for the geneswere concatenated for each taxon.
Heterogeneity of nucleotide composition among infor-mative sites was determined with PAUP* version 4.0b10(Swofford, 2002). Phylogenetic analyses were conductedfor each gene separately by maximum-parsimony (MP),maximum-likelihood (ML) and Bayesian methods asimplemented in PAUP* 4.0b10 (Swofford, 2002) andMrBayes ver. 3.1.2 (Huelsenbeck and Ronquist, 2005).All MP analyses used heuristic searches with tree bisec-tion-reconnection (TBR) branch swapping and 500 ran-dom-addition replicates. All substitutions were weightedequally; gaps were treated as missing data. A sequentialoptimization approach (Swofford et al., 1996; Frattiet al., 1997; Steppan et al., 2004a) was used to estimatethe ML phylogeny. Initial trees were generated underMP. ML parameter values were estimated under a nestedarray of substitution models for the MP trees as imple-mented in Modeltest 3.04 (Posada and Crandall, 1998).The GTR+I+C model was selected by Akaike’s Informa-tion Criterion for all loci and the concatenated data exceptBRCA1, for which a GTR+C model was selected. An MLsearch was then conducted under the preferred model withparameters fixed to the values estimated on the MP tree.Model parameters were reestimated from the initial MLtree and the process repeated until the topology remainedconstant. Heuristic searches were conducted with 20 ran-dom-addition replicates and TBR branch swapping. Theoptimal phylogeny was found on the first search exceptfor AP5, where it was found on the second search.
Nonparametric bootstrapping (Felsenstein, 1985) wasperformed on all data partitions: 200 replicates for ML,500 replicates for MP. Bootstrap analyses for MP andML used 20 random-sequence addition replicates per boot-strap replicate. Likelihood bootstrap analyses were limitedto 2000–4000 rearrangements for individual genes and thecombined data. The ML bootstrapping was performedwith PAUP* (Swofford, 2002) on a 200-processor clusterusing Condor job management.
Analyses were performed on individual genes and on aconcatenation. A partition-homogeneity test (200 repli-
90 K.C. Rowe et al. / Molecular Phylogenetics and Evolution 47 (2008) 84–101
cates) (Farris et al., 1994, 1995) indicated no significantheterogeneity in phylogenetic signal (P = 0.87) among theseven loci.
Bayesian analysis of the total data used the GTR+I+Cmodel with the addition of partitioning by codon positionin each genome separately. The result was eight partitions:the three nuclear codon positions, the three mitochondrialcodon positions, intron, and the tRNA regions. Parameterswere estimated for each partition separately (‘unlinked’).For all data, two independent sets of four chains wererun for 2 million (GHR) to 15 million (total) generations;trees and parameters were recorded every 500 generations.Each individual gene was partitioned similarly except thatBDR had too few exon sites to subdivide further, so twopartitions were used, exon and intron. Convergence wasestimated by means of diagnostics from AWTY (Wil-genbusch et al., 2004) as well as by examination of likeli-hood plots and posterior probabilities of individualclades for subsets of the runs. The data all converged rela-tively quickly, yielding burn-in periods of 10% or less.
2.4. Divergence-date estimation
We have previously argued (Steppan et al., 2004a) thatthe age of the transition from Antemus to Progonomys at12.1 Mya should be assigned to the divergence of Phloeo-
mys/Batomys from the remainder of Murinae (the ‘‘core”
murine taxa), rather than to the younger Mus/Rattus splitto which it is usually assigned, because the transitional fos-sils described by Jacobs and Downs (1994) document theacquisition of the key synapomorphy (full fusion of lingualcusps with medial and labial) for core murine taxa. Becausethis date is narrowly constrained by detailed fossil evidenceon both sides of the evolutionary transformation (Jacobsand Flynn, 2005) and not merely the earliest appearanceof a lineage, we set the date to range from 10 to 14 Myarather than use a minimum age. Despite the small uncer-tainty in the timing of the transition (approximately±0.5 My), we conservatively designated the range to±2 My to account for the uncertainty regarding the precisephylogenetic placement of the fossil taxa. In addition, weplaced a lower limit on the divergence of Otomys/Paroto-
mys (Otomyinae of Musser and Carleton, 2005) from theArvicanthis clade of 6 Mya in recognition of the earliestappearance of extant taxa clearly assignable to the AfricanArvicanthis lineage (Winkler, 2002).
Divergence-dates were estimated by the method ofThorne and Kishino (2002) with the multidistribute pro-gram package (25 September 2003 release). From theBayesian estimate of relationships derived from the multi-gene concatenation, the transition/transversion ratio andshape parameter of the gamma distribution of rates amongthe sites were estimated for each locus by PAUP* (Swof-ford, 2002). Then, under the F84 model (Felsenstein,1984), evolutionary parameters for each gene were esti-mated by the program baseml 3.15 (Yang, 2000). The pro-gram paml2modelinf within the multidistribute package
was used to prepare input for the program estbranches,which estimated branch lengths for each gene and derivedthe variance–covariance structure of the branch lengths.Finally, the program multidivtime was used to estimatethe divergence-dates from the multilocus data and diver-gence-date constraints described above. Settings suggestedin the documentation for the program were used for multi-divtime. To provide a broad, but reasonable, prior estimateof the rate of substitution (Thorne, pers. comm.), wedivided the average root-to-tip length of the phylogenybased on the multigene concatenation by the estimatedage of the root (12 Mya), and both the point estimate ofthe rate and its standard deviation were set to this number.Two independent runs of the multidivtime program wereperformed with different random seeds. The two runs pro-duced divergence-date estimates within a few thousandyears of each other, indicating that the Markov chainhad been run for a sufficient number of cycles.
2.5. Colonization and diversification
To reconstruct the minimum number of dispersal eventsinto Sahul and between New Guinea and Australia, wecoded the geographic distributions (non-Sahulian, NewGuinea, Australia, or New Guinea and Australia) of allSahulian and Philippine Old Endemic taxa in MacClade4.08 (Maddison and Maddison, 2000). We then mappedthese characters onto the phylogeny resulting from theconcatenated data. We included in these analyses theunsampled taxa Pseudomys delicatulus and Pogonomys
mollipilosus, as they each extend the distributions of theirgenera and their placement in the phylogeny is likely to bewith other members of their respective genera. The ancestraldistributions for all clades were estimated under a parsimonycriterion. Dispersal events were identified along branchesthat indicated a switch from one geographic distribution toanother. In addition, we reconstructed the number ofdispersal events using an explicit biogeographic model, thedispersal-vicariance approach of Ronquist (1997) usingDIVA (Ronquist, 1996). Taxa were coded as to presence inone or more of nine areas (Palearctic, Africa, Mediterraneanregion/Asian deserts, India, mainland SE Asia, Wallacea,Philippines, New Guinea, Australia). Optimizations werethen run in which ancestors were constrained to occupy nomore than two, three, or four areas. Because no extant spe-cies currently occupy more than two areas, we report resultsprimarily from the three-area restriction as a compromisebetween conservatism and biological realism. Constrainingto fewer areas reduces the number of equally parsimonioussolutions.
3. Results
3.1. Phylogenetic analyses: Murinae
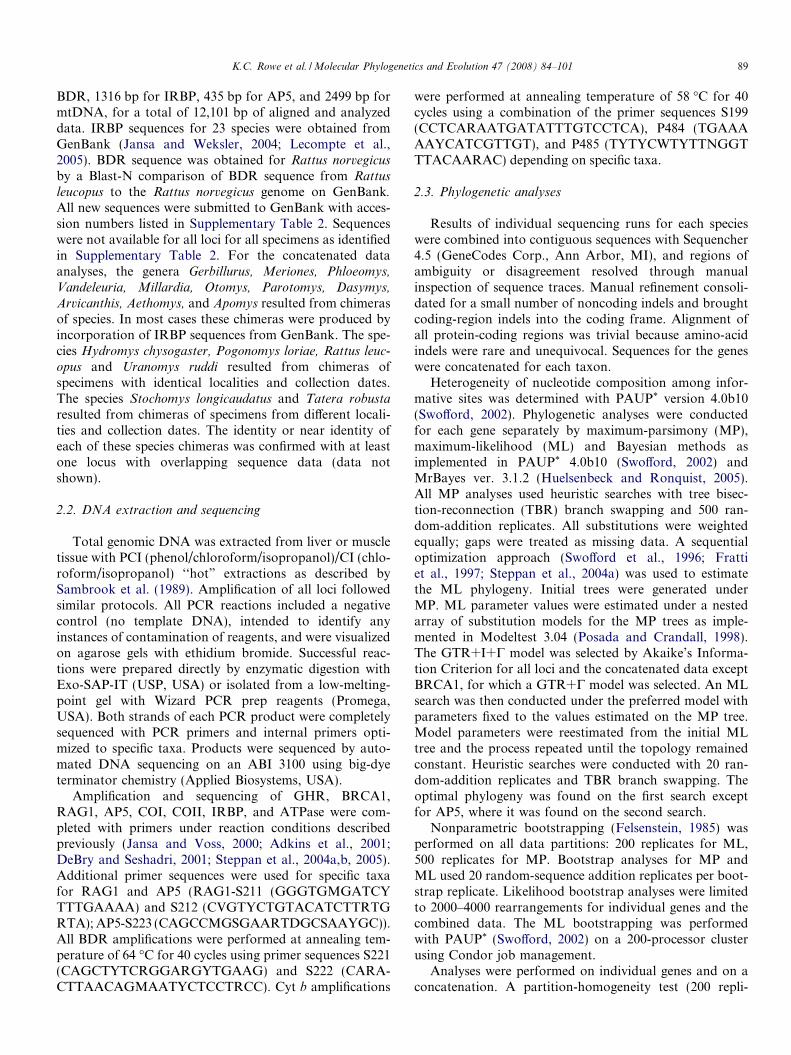
The concatenated data produced a highly resolved,robust phylogeny (Fig. 3). The optimized ML tree and
S
X
Melomys cervinipesMelomys rufescens
Solomys salebrosusParamelomys levipes
Uromys caudimaculatusConilurus penicillatus
Mesembriomys gouldiiLeporillus conditor
Pseudomys australisMastacomys fuscus
Notomys fuscusZyzomys argurus
Leggadina forrestiParahydromys asper
Hydromys chrysogaster1Hydromys chrysogaster2
Xeromys myoidesPseudohydromys ellermani
Leptomys elegansMallomys rothschildi
Abeomelomys seviaMammelomys lanosus
Pogonomys loriaePogonomys macrourus
Hyomys goliathChiruromys vates
Macruromys majorLorentzimys nouhuysi
Anisomys imitatorChrotomys gonzalesi
Rhynchomys isarogensisArchboldomys luzonensis
ApomysChiropodomys gliroides
Grammomys surdasterGrammomys macmillani
Grammomys ibeanusGrammomys dolichurus
AethomysArvicanthis
Rhabdomys pumilioDasymys
Stochomys longicaudatusOenomys hypoxanthus
ParotomysOtomys
MillardiaPraomys jacksoni
Praomys tullbergiMastomys
Zelotomys hildegardeaeMus musculus
Mus pahariApodemus agrarius
Apodemus semotusTokudaia osimensis
Malacomys longipesVandeleuria
Rattus villosissimusRattus leucopus
Rattus norvegicusDiplothrix legata
Paruromys dominatorBunomys adspersa
Sundamys muelleriChiromyscus chiropus
Melasmothrix nasoMaxomys bartelsii
Micromys minutusBatomys granti
PhloeomysGerbillurus
Tatera robustaMeriones
Gerbillus gerbillusLophuromys flavopunctatus
Deomys ferrugineusUranomys ruddi
0.01 substitutions/site
82/*/53
hydromyines
conilurines
conilurines
anisomyines
Sahul
Philippines
Africa
SE Asia plus
Gerbillinae(Asia/Africa)
Deomyinae(Africa)
SE Asia
Philippines
SE Asia
Asia (Japan)
anisomyines
uromyines
Africa/Eurasia
Palearctic
Africa
SE AsiaAfrica
*/*/*89/*/57
*/*/*
*/*/*
91/.97/98*/*/*
98 /*/70
79/*/--
*/*/56
57/--/*
62/.90/--*/*/97
69 /*/--*/* /*
68 /.96/--
65/*/--
44/.90/--64/.71/--
97/*/98
*/*/**/*/9958/*/--
34/.80/--
71/*/--
*/*/*
*/*/*
44/.82/--
*/*/98
*/*/56*/*/*
52/.99/--
*/*/*
69 /*/82
*/*/*
*/*/*
*/*/*
*/*/**/*/--
*/*/*
*/*/*
99/*/*
*/*/*89/*/78
99/*/95
86/.89/80
*/*/*99/*/--
88/.97/--
*/*/*
Y
Z
V
WT
UR
P
QN
OF
D
LH
E
IK
B
GJ
M
A
C
Z : 94/*/61X : */*/91Y : */*/97V : */*/99W: */*/98T : */*/*U : */*/*R : */*/79S : */*/95P : 99/*/62N : */*/*Q : 96/*/--F : 98/*/*O : */*/*D : 68/.93/--L : */*/99H : 91/*/74E : 90/*/--I : */*/87
B : */*/*K : */*/*J : 47/.98/75G : 80/*/--M : */*/*C : */*/93A : */*/*
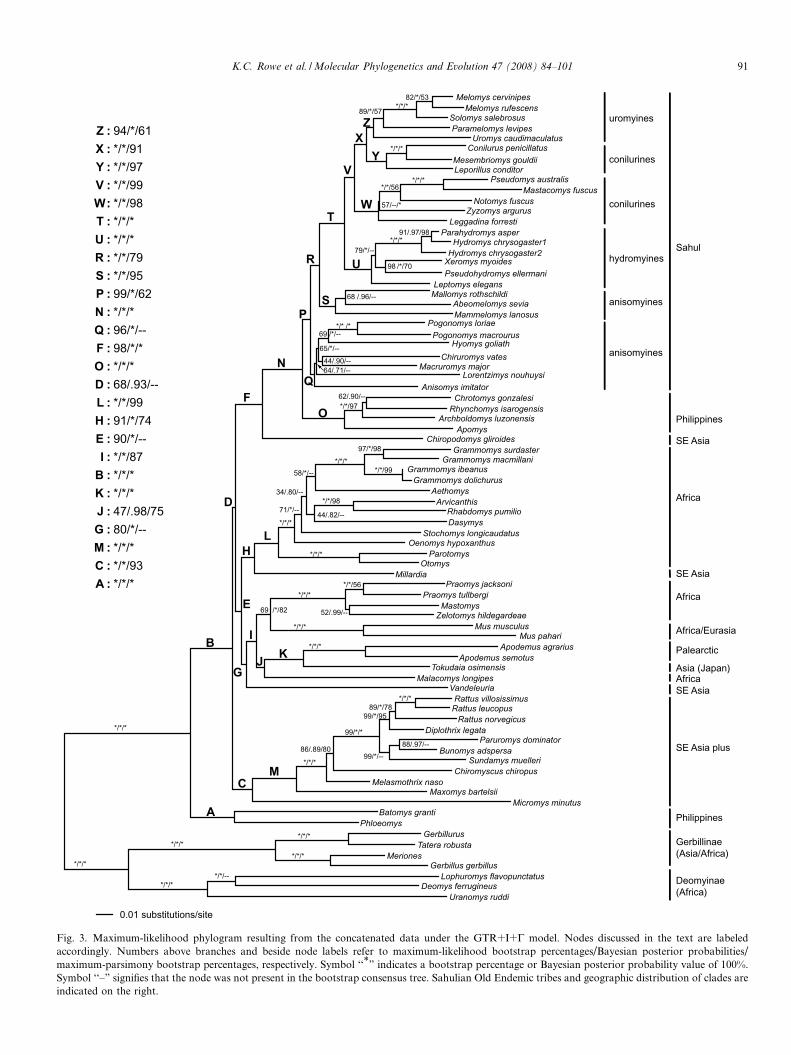
Fig. 3. Maximum-likelihood phylogram resulting from the concatenated data under the GTR+I+C model. Nodes discussed in the text are labeledaccordingly. Numbers above branches and beside node labels refer to maximum-likelihood bootstrap percentages/Bayesian posterior probabilities/maximum-parsimony bootstrap percentages, respectively. Symbol ‘‘*” indicates a bootstrap percentage or Bayesian posterior probability value of 100%.Symbol ‘‘–” signifies that the node was not present in the bootstrap consensus tree. Sahulian Old Endemic tribes and geographic distribution of clades areindicated on the right.
K.C. Rowe et al. / Molecular Phylogenetics and Evolution 47 (2008) 84–101 91
92 K.C. Rowe et al. / Molecular Phylogenetics and Evolution 47 (2008) 84–101
the Bayesian tree for the concatenated data agreed at allnodes except that the placements of Zyzomys and Leggadi-
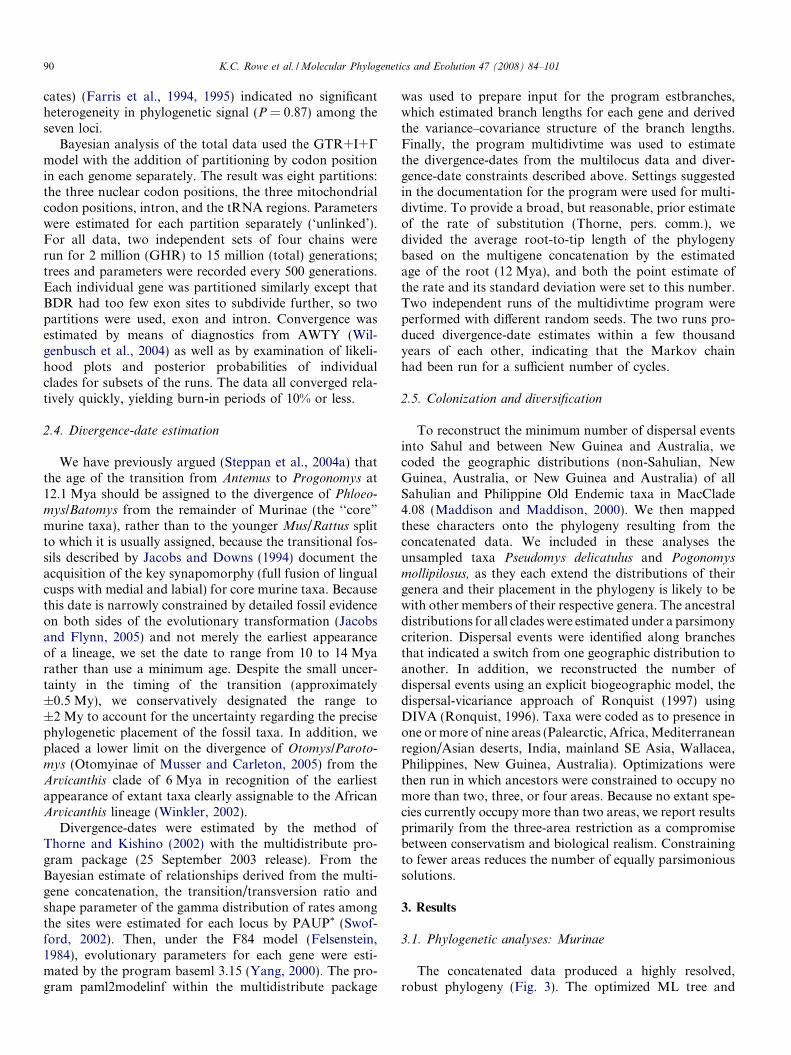
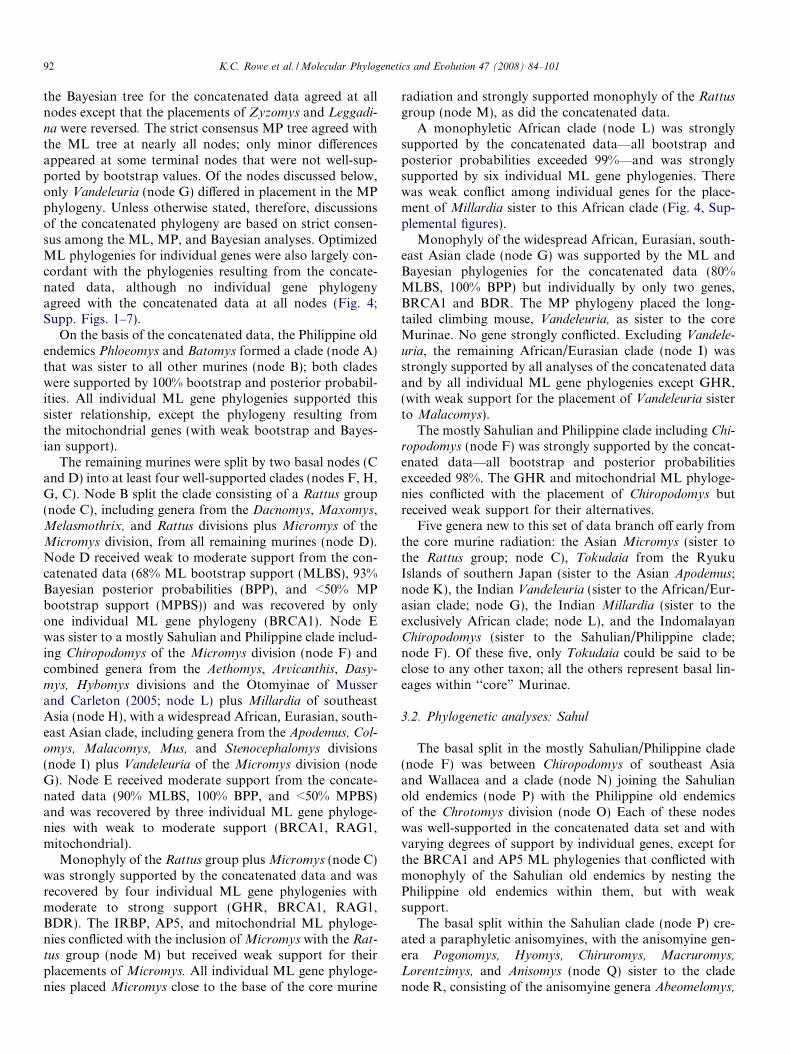
na were reversed. The strict consensus MP tree agreed withthe ML tree at nearly all nodes; only minor differencesappeared at some terminal nodes that were not well-sup-ported by bootstrap values. Of the nodes discussed below,only Vandeleuria (node G) differed in placement in the MPphylogeny. Unless otherwise stated, therefore, discussionsof the concatenated phylogeny are based on strict consen-sus among the ML, MP, and Bayesian analyses. OptimizedML phylogenies for individual genes were also largely con-cordant with the phylogenies resulting from the concate-nated data, although no individual gene phylogenyagreed with the concatenated data at all nodes (Fig. 4;Supp. Figs. 1–7).
On the basis of the concatenated data, the Philippine oldendemics Phloeomys and Batomys formed a clade (node A)that was sister to all other murines (node B); both cladeswere supported by 100% bootstrap and posterior probabil-ities. All individual ML gene phylogenies supported thissister relationship, except the phylogeny resulting fromthe mitochondrial genes (with weak bootstrap and Bayes-ian support).
The remaining murines were split by two basal nodes (Cand D) into at least four well-supported clades (nodes F, H,G, C). Node B split the clade consisting of a Rattus group(node C), including genera from the Dacnomys, Maxomys,Melasmothrix, and Rattus divisions plus Micromys of theMicromys division, from all remaining murines (node D).Node D received weak to moderate support from the con-catenated data (68% ML bootstrap support (MLBS), 93%Bayesian posterior probabilities (BPP), and <50% MPbootstrap support (MPBS)) and was recovered by onlyone individual ML gene phylogeny (BRCA1). Node Ewas sister to a mostly Sahulian and Philippine clade includ-ing Chiropodomys of the Micromys division (node F) andcombined genera from the Aethomys, Arvicanthis, Dasy-
mys, Hybomys divisions and the Otomyinae of Musserand Carleton (2005; node L) plus Millardia of southeastAsia (node H), with a widespread African, Eurasian, south-east Asian clade, including genera from the Apodemus, Col-
omys, Malacomys, Mus, and Stenocephalomys divisions(node I) plus Vandeleuria of the Micromys division (nodeG). Node E received moderate support from the concate-nated data (90% MLBS, 100% BPP, and <50% MPBS)and was recovered by three individual ML gene phyloge-nies with weak to moderate support (BRCA1, RAG1,mitochondrial).
Monophyly of the Rattus group plus Micromys (node C)was strongly supported by the concatenated data and wasrecovered by four individual ML gene phylogenies withmoderate to strong support (GHR, BRCA1, RAG1,BDR). The IRBP, AP5, and mitochondrial ML phyloge-nies conflicted with the inclusion of Micromys with the Rat-tus group (node M) but received weak support for theirplacements of Micromys. All individual ML gene phyloge-nies placed Micromys close to the base of the core murine
radiation and strongly supported monophyly of the Rattus
group (node M), as did the concatenated data.A monophyletic African clade (node L) was strongly
supported by the concatenated data—all bootstrap andposterior probabilities exceeded 99%—and was stronglysupported by six individual ML gene phylogenies. Therewas weak conflict among individual genes for the place-ment of Millardia sister to this African clade (Fig. 4, Sup-plemental figures).
Monophyly of the widespread African, Eurasian, south-east Asian clade (node G) was supported by the ML andBayesian phylogenies for the concatenated data (80%MLBS, 100% BPP) but individually by only two genes,BRCA1 and BDR. The MP phylogeny placed the long-tailed climbing mouse, Vandeleuria, as sister to the coreMurinae. No gene strongly conflicted. Excluding Vandele-
uria, the remaining African/Eurasian clade (node I) wasstrongly supported by all analyses of the concatenated dataand by all individual ML gene phylogenies except GHR,(with weak support for the placement of Vandeleuria sisterto Malacomys).
The mostly Sahulian and Philippine clade including Chi-ropodomys (node F) was strongly supported by the concat-enated data—all bootstrap and posterior probabilitiesexceeded 98%. The GHR and mitochondrial ML phyloge-nies conflicted with the placement of Chiropodomys butreceived weak support for their alternatives.
Five genera new to this set of data branch off early fromthe core murine radiation: the Asian Micromys (sister tothe Rattus group; node C), Tokudaia from the RyukuIslands of southern Japan (sister to the Asian Apodemus;node K), the Indian Vandeleuria (sister to the African/Eur-asian clade; node G), the Indian Millardia (sister to theexclusively African clade; node L), and the IndomalayanChiropodomys (sister to the Sahulian/Philippine clade;node F). Of these five, only Tokudaia could be said to beclose to any other taxon; all the others represent basal lin-eages within ‘‘core” Murinae.
3.2. Phylogenetic analyses: Sahul
The basal split in the mostly Sahulian/Philippine clade(node F) was between Chiropodomys of southeast Asiaand Wallacea and a clade (node N) joining the Sahulianold endemics (node P) with the Philippine old endemicsof the Chrotomys division (node O) Each of these nodeswas well-supported in the concatenated data set and withvarying degrees of support by individual genes, except forthe BRCA1 and AP5 ML phylogenies that conflicted withmonophyly of the Sahulian old endemics by nesting thePhilippine old endemics within them, but with weaksupport.
The basal split within the Sahulian clade (node P) cre-ated a paraphyletic anisomyines, with the anisomyine gen-era Pogonomys, Hyomys, Chiruromys, Macruromys,Lorentzimys, and Anisomys (node Q) sister to the cladenode R, consisting of the anisomyine genera Abeomelomys,
Melomys cervinipesMelomys rufescens
Solomys salebrosusParamelomys levipes
Uromys caudimaculatusConilurus penicillatus
Mesembriomys gouldiiLeporillus conditor
Pseudomys australisMastacomys fuscus
Notomys fuscusZyzomys argurus
Leggadina forrestiParahydromys asper
Hydromys chrysogaster1Hydromys chrysogaster2
Xeromys myoidesPseudohydromys ellermani
Leptomys elegansMallomys rothschildi
Abeomelomys seviaMammelomys lanosus
Pogonomys loriaePogonomys macrourus
Hyomys goliathChiruromys vates
Macruromys majorLorentzimys nouhuysi
Anisomys imitatorChrotomys gonzalesi
Rhynchomys isarogensisArchboldomys luzonensis
ApomysChiropodomys gliroides
Grammomys surdasterGrammomys macmillani
Grammomys ibeanusGrammomys dolichurus
AethomysArvicanthis
Rhabdomys pumilioDasymys
Stochomys longicaudatusOenomys hypoxanthus
Parotomys sp.Otomys
MillardiaPraomys jacksoni
Praomys tullbergiMastomys
Zelotomys hildegardeaeMus musculus
Mus pahariApodemus agrarius
Apodemus semotusTokudaia osimensis
Malacomys longipesVandeleuria sp.
Rattus villosissimusRattus leucopus
Rattus norvegicusDiplothrix legata
Paruromys dominatorBunomys adspersa
Sundamys muelleriChiromyscus chiropus
Melasmothrix nasoMaxomys bartelsii
Micromys minutusBatomys granti
PhloeomysGerbillurus
Tatera robustaMeriones
Gerbillus gerbillusLophuromys flavopunctatus
Deomys ferrugineusUranomys ruddi
0.01 substitutions/site
YX
Z
V
WT
UR
SP
QN
OF
D
LH
E
IK
B
GJ
M
A
C
Z : 2:3 (g_RdIAM)X : 4:2 (gBRDiAM)Y : 6:1 (GBRDIAm)V : 3:3 (gBRdIAM)W: 5:1 (GBRDIAm)T : 6:0 (GBRDIAM)U : 7:0 (GBRDIAM)R : 4:1 (GbRDIAM)S : 6:1 (GBRDiAM)P : 4:2 (GbRDIaM)N : 6:1 (GBRDiAM)Q : 3:2 (GbRDiAM)F : 4:2 (gBRDIAm)O : 7:0 (GBRDIAM)D : 1:5 (gBrdIam)L : 6:1 (GBRDIaM)H : 1:2 (__r_Ia_)E : 3:4 (gBRdiaM)I : 6:1 (gBRDIAM)
B : 6:1 (GBRDIAm)K : 4:0 (GBRDIA_)J : 3:4 (GbrDIam)G : 2:5 (gBrDiam)M : 7:0 (GBRDIAM)C : 4:3 (GBRDiam)A : 7:0 (GBRDIAM)
Fig. 4. Agreement of maximum-likelihood phylogenies for individual genes with the maximum-likelihood phylogeny resulting from the concatenated dataat nodes discussed in the text. Node labels are the same as those in Fig. 3. Ratios indicate the number of gene phylogenies that support and conflict withthe concatenated phylogeny at that node. Individual genes are represented by single letters (G, GHR; B, BRCA1; R, RAG1; D, BDR; I, IRBP; A, AP5;M, mitochondrial loci). Black upper-case letters indicate gene phylogenies that supported monophyly at the node. Black lower-case letters indicate genephylogenies that conflicted with monophyly at the node. Gray letters indicate gene phylogenies that were equivocal with respect to monophyly at the node.Genes for which monophyly of the node could not be evaluated because sequence data were not available for relevant taxa are not included and areindicated by underscores.
K.C. Rowe et al. / Molecular Phylogenetics and Evolution 47 (2008) 84–101 93
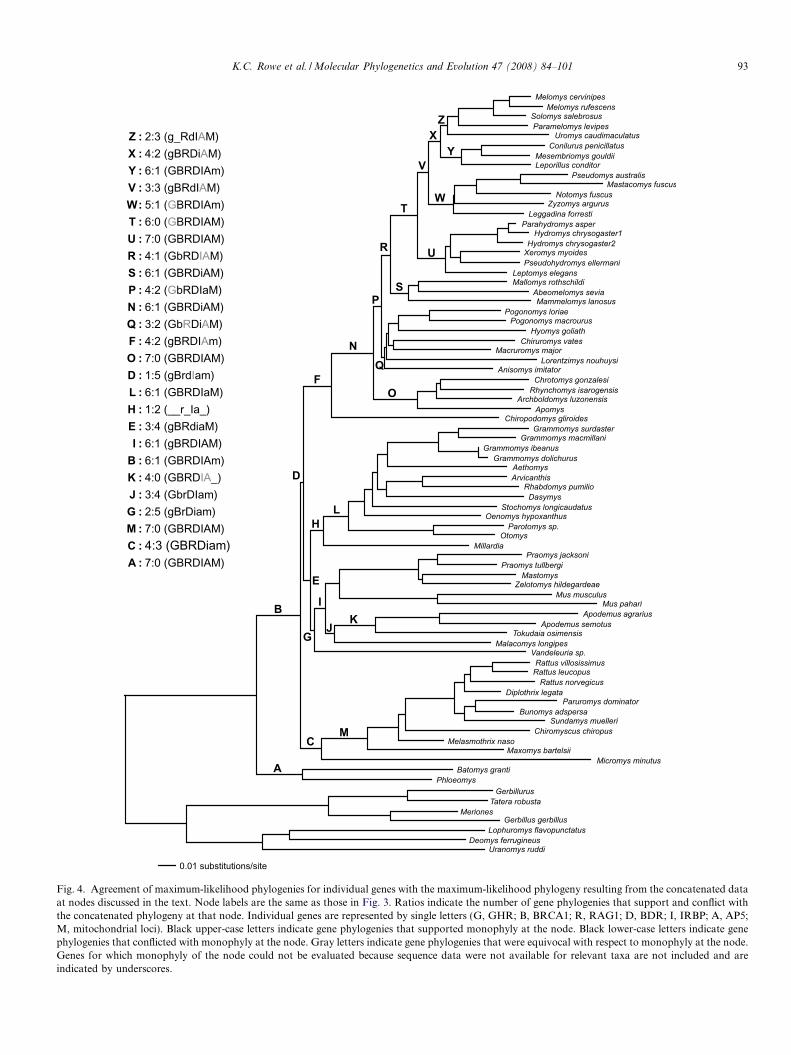
Table 1Estimated dates of divergence (Mya) for selected nodes in Fig. 3 based onBayesian approximation from a concatenation of all gene regions
Node Bayesian estimate of divergence-dates
Date SD Credibility interval
B 9.7 0.52 8.7–10.8F 7.8 0.51 6.8–8.8N 5.5 0.45 4.7–6.4P 5.1 0.43 4.3–6.0Q 4.6 0.44 3.9–5.6R 4.7 0.43 3.9–5.6T 3.7 0.38 3.0–4.5U 2.3 0.31 1.8–3.0V 3.4 0.36 2.7–4.1W 2.7 0.32 2.1–3.4X 3.0 0.34 2.4–3.7Y 2.0 0.27 1.5–2.6Z 2.8 0.34 2.1–3.5
94 K.C. Rowe et al. / Molecular Phylogenetics and Evolution 47 (2008) 84–101
Mammelomys, and Mallomys (node S) plus the remainingSahulian old endemics (node T). Monophyly of each ofthese nodes was moderately to strongly supported in theconcatenated data. Monophyly of node Q was recoveredin three individual ML gene phylogenies with weak tomoderate support (GHR, BDR, mitochondrial), RAG1and AP5 yielded a basal polytomy, and IRBP conflictedweakly (<50% MLBS/BPP/MPBS). Monophyly of theremaining Sahulian old endemics (node R) was supportedby four individual ML gene phylogenies with moderateto strong support (GHR, RAG1, BDR, mitochondrial),whereas the IRBP and AP5 ML phylogenies were equivo-cal with respect to this node. The BRCA1 ML phylogenyconflicted with monophyly of node R in placing the Philip-pine old endemics within the Sahulian Old Endemics.
Within the diverse clade T the hydromyine genera (nodeU) were sister to all conilurine and uromyine genera (nodeV). Bootstrap and posterior probabilities for these nodesall exceeded 99% for the concatenated data. All individualML gene phylogenies strongly supported monophyly ofthese nodes except AP5 that was equivocal for monophylyof node V, GHR, which allied Uromys with the hydromy-ine genera but with little support, and BDR which joined Uand W as sister-groups.
The predominantly Australian clade V contained theconilurine genera Pseudomys, Mastacomys, Notomys,
Zyzomys, and Leggadina (node W) and a clade includingall uromyine genera plus the conilurine genera Conilurus,
Mesembriomys, and Leporillus (node X). Monophyly ofeach of these nodes was strongly supported by the concat-enated data. Monophyly of node W was strongly sup-ported by all individual ML gene phylogenies except theGHR phylogeny, which was equivocal, and the mitochon-drial phylogeny (weak support). Monophyly of node X wasrecovered by four individual ML gene phylogenies withmoderate to strong support (BRCA1, RAG1, BDR, mito-chondrial). The GHR and IRBP ML phylogenies con-flicted with monophyly of node X, supporting amonophyletic conilurine clade to the exclusion of theuromyines but with weak support.
Node X joined a clade containing the conilurine generaConilurus, Mesembriomys, and Leporillus (node Y) with aclade including all uromyine genera (node Z). Monophylyof nodes Y and Z were strongly supported by the concate-nated data, and like many of the other nodes, the few con-flicting individual gene phylogenies were not stronglysupported.
Within the Sahulian Old Endemics, therefore, the phy-logeny resulting from the concatenated data did not sup-port monophyly of either Anisomyini or Conilurini butsupported monophyly of both Hydromini and Uromyini.No individual ML gene phylogenies supported a monophy-letic Anisomyini. Only the GHR and IRBP ML phyloge-nies produced limited support for a monophyleticConilurini. The AP5 phylogeny was equivocal. All individ-ual ML gene phylogenies supported a monophyleticHydromini. All individual ML gene phylogenies except
for GHR, BDR, and AP5 supported a monophyleticUromyini (the AP5 phylogeny was equivocal, and the con-flict from the GHR and BDR phylogenies resulted fromthe placement of Uromys).
3.3. Divergence-date estimation
The results of divergence-date estimation are presentedin Table 1. Using the calibrations of the Batomys/Phloeo-
mys-‘‘core” Murinae split and the Arvicanthis-Otomys split,we were able to estimate dates for several key phylogeneticevents in the diversification of the Sahulian Old Endemicmurines. The basal radiation of the ‘‘core” Murinae (nodeB), subtending the split between Mus and Rattus, was esti-mated to have occurred 9.7 Mya (credibility interval [CI]8.7–10.8). The Sahulian and Philippine old endemics wereestimated to have split from Chiropodomys and the restof the Murinae (node F) 7.8 Mya (CI 6.8–8.8) and theSahulian old endemics to have split subsequently fromthe Philippine old endemics (node N) 5.5 Mya (CI 4.7–6.4). The primary diversification of the Sahulian oldendemics (among anisomyine genera and between ani-somyines and remaining taxa; nodes P, Q, and R) was esti-mated to have occurred between 4.7 and 5.1 Mya (CI 3.9–6.0). Secondary diversification of the Sahulian old endem-ics was estimated to have begun between 3.0 and 3.7 Mya(CI 2.4–4.5), including diversification among the remainingSahulian ‘‘tribes” (Hydromini, Conilurini, and Uromyini;nodes T, V, and X) and among genera within these tribes(nodes U, W, Y, and Z).
3.4. Colonization and biogeography
Our analyses reconstructed a single colonization ofSahul estimated to have occurred between 5.1 and5.5 Mya (nodes N and P; CI 4.3–6.4). New Guinea wasthe center of diversification of the Sahulian Old Endemics;all Australian taxa were clustered near the tips of the phy-logeny. Using parsimony and geography as a single, multi-
K.C. Rowe et al. / Molecular Phylogenetics and Evolution 47 (2008) 84–101 95
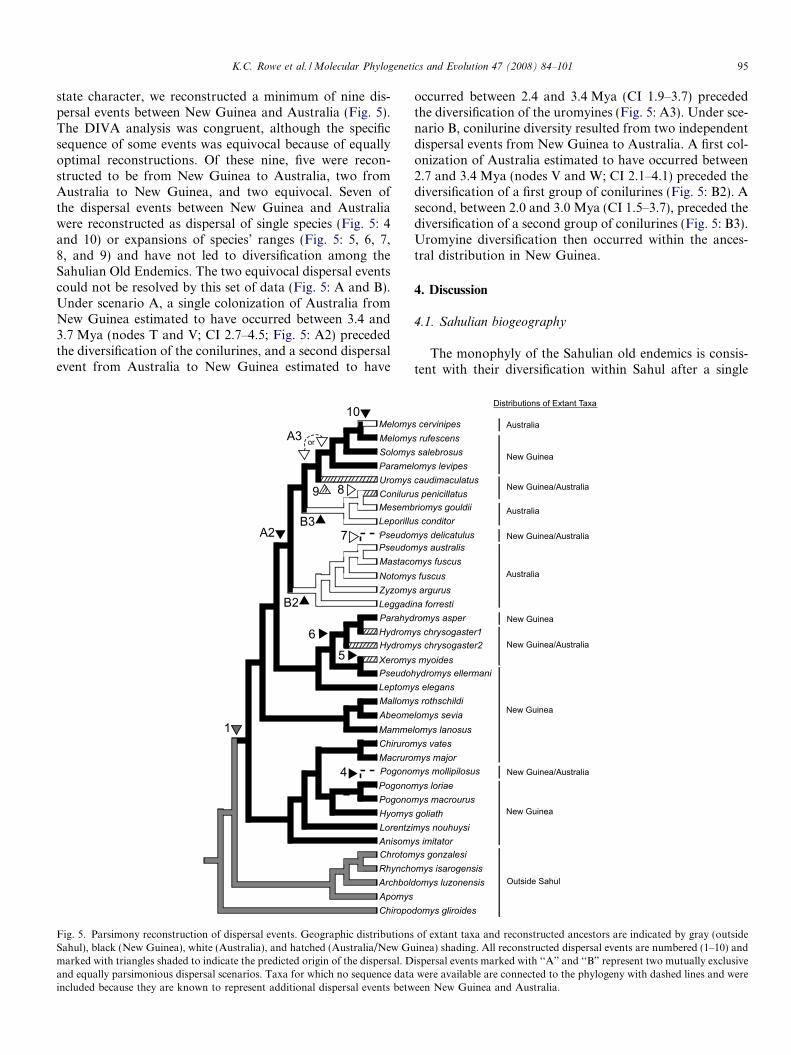
state character, we reconstructed a minimum of nine dis-persal events between New Guinea and Australia (Fig. 5).The DIVA analysis was congruent, although the specificsequence of some events was equivocal because of equallyoptimal reconstructions. Of these nine, five were recon-structed to be from New Guinea to Australia, two fromAustralia to New Guinea, and two equivocal. Seven ofthe dispersal events between New Guinea and Australiawere reconstructed as dispersal of single species (Fig. 5: 4and 10) or expansions of species’ ranges (Fig. 5: 5, 6, 7,8, and 9) and have not led to diversification among theSahulian Old Endemics. The two equivocal dispersal eventscould not be resolved by this set of data (Fig. 5: A and B).Under scenario A, a single colonization of Australia fromNew Guinea estimated to have occurred between 3.4 and3.7 Mya (nodes T and V; CI 2.7–4.5; Fig. 5: A2) precededthe diversification of the conilurines, and a second dispersalevent from Australia to New Guinea estimated to have
Fig. 5. Parsimony reconstruction of dispersal events. Geographic distributionsSahul), black (New Guinea), white (Australia), and hatched (Australia/New Gumarked with triangles shaded to indicate the predicted origin of the dispersal. Dand equally parsimonious dispersal scenarios. Taxa for which no sequence dataincluded because they are known to represent additional dispersal events betw
occurred between 2.4 and 3.4 Mya (CI 1.9–3.7) precededthe diversification of the uromyines (Fig. 5: A3). Under sce-nario B, conilurine diversity resulted from two independentdispersal events from New Guinea to Australia. A first col-onization of Australia estimated to have occurred between2.7 and 3.4 Mya (nodes V and W; CI 2.1–4.1) preceded thediversification of a first group of conilurines (Fig. 5: B2). Asecond, between 2.0 and 3.0 Mya (CI 1.5–3.7), preceded thediversification of a second group of conilurines (Fig. 5: B3).Uromyine diversification then occurred within the ances-tral distribution in New Guinea.
4. Discussion
4.1. Sahulian biogeography
The monophyly of the Sahulian old endemics is consis-tent with their diversification within Sahul after a single
of extant taxa and reconstructed ancestors are indicated by gray (outsideinea) shading. All reconstructed dispersal events are numbered (1–10) andispersal events marked with ‘‘A” and ‘‘B” represent two mutually exclusivewere available are connected to the phylogeny with dashed lines and wereeen New Guinea and Australia.
96 K.C. Rowe et al. / Molecular Phylogenetics and Evolution 47 (2008) 84–101
colonization of the continent. Molecular dating estimatedthat diversification of the Sahulian old endemics beganno earlier than between 5.1 and 5.5 Mya (CI 4.3–6.4).These dates are consistent with the earliest fossil appear-ance of murines in Australia 4–5 Mya (Lee et al., 1981;Godthelp, 1990, 1997; Rich et al., 1991) and well withinthe time since Sahul reached its current proximity to thePhilippines and the Sunda shelf. Therefore, contrary tothe 15–20 Mya diversification date estimated from albuminvariation (Watts and Aslin, 1981), dates estimated fromour phylogeny do not imply that diversification of theSahulian old endemics occurred outside of the Sahuliancontinent.
Molecular clock studies that sample Rodentia or Mam-malia broadly and rely primarily on non-Muroid calibra-tions tend to give much earlier estimates of divergence-dates within Muroidea. For example, the Mus/Rattus
divergence estimate has ranged from 12 to 43 Mya (Kumarand Hedges, 1998; Cao et al., 2000; Huchon et al., 2000;Adkins et al., 2003; Jansa et al., 2006). In general, olderestimates are also associated with simpler models of molec-ular evolution and strict molecular clocks. We favor usingrelatively well-constrained internal calibrations over exter-nal ones from clades with significantly slower molecularevolution (Wu and Li, 1985; Adkins et al., 2001), but actualdivergence-dates could be earlier if the external calibrationsare not overestimating dates as much as we suspect.
The sister relationship of the Sahulian old endemics andthe Philippine old endemics of the Chrotomys divisionimplies two possible biogeographic scenarios: independentcolonization of the Philippines and Sahul by two closelyrelated murines from the Sunda shelf and colonization ofeither the Philippines or Sahul from the other, after oneof them was colonized from the Sunda shelf. The first sce-nario could have produced the sister relationship pattern if(1) we have not yet sampled the closest relatives of the Phil-ippine and Sahulian colonists, (2) these closest relatives areextinct, or (3) the two colonizations occurred within a veryshort evolutionary interval without diversification amongthe source populations. The second scenario could haveproduced reciprocal monophyly of the Philippine andSahulian old endemics if (1) no diversification occurredon the first landmass before colonization of the second or(2) only one lineage extant at the time of the second colo-nization has survived to the present. Additional sampling,particularly of genera from the Sunda shelf discussedabove, could help resolve these colonization scenarios,but clearly the Philippine old endemics of the Chrotomys
division and the Sahulian old endemics share a recent evo-lutionary origin within the Murinae.
Within the Sahulian Old Endemics, monophyly of theAnisomyini (Pogonomys and Lorentzimys divisions) wasnot supported. They were paraphyletic; Mallomys, Abeo-
melomys, and Mammelomys formed a sister clade to theremaining Sahulian Old Endemics. These results demon-strate that the remaining Sahulian tribes were derived froman anisomyine ancestor and that the New Guinea ‘‘old
endemics” reflect the earliest colonists of Sahul. Notably,diversification among most anisomyine genera occurredbetween 4.7 and 5.1 Mya (CI 3.9–6.0), whereas the originof all other Sahulian tribes occurred later, between 3.0 and3.7 Mya (CI 2.4–4.5). Lorentzimys (sole member of the Lore-
ntzimys division) was nested within the basal anisomyineradiation and is no more divergent phyletically from otherSahulian old endemics than are the other basal anisomyines.
The remaining Sahulian Old Endemics, including allhydromyines, uromyines, and conilurines, formed a cladederived from the anisomyines. The Hydromyini were sisterto the remaining tribes. The Xeromys division was para-phyletic, however; Xeromys and Pseudohydromys formeda clade with genera of the Hydromys division to the exclu-sion of Leptomys. The nested radiation of the Hydromys
division would imply that the water rats (Hydromys divi-sion) were derived from a shrew-mouse (Xeromys division)progenitor and that carnivorous dietary habits precededadaptations to semiaquatic habitats, but the relationshipis supported by a single node, and broader sampling ofthe hydromyines would be necessary to confirm it.
All uromyine and conilurine genera formed a clade sisterto the Hydromyini. The conilurine genera were paraphylet-ic; Conilurus, Mesembriomys, and Leporillus formed a cladesister to a uromyine clade. The remaining conilurine generaPseudomys, Mastacomys, Notomys, Zyzomys and Leggadi-
na formed a clade sister to the conilurine/uromyine clade.Paraphyly of Conilurini was strongly supported by boot-strapping and Bayesian analyses of the concatenated dataand by most individual gene phylogenies. A previous phy-logenetic hypothesis based on phallic morphology pro-posed a paraphyletic Conilurini (Lidicker and Brylski,1987); however, in that study, the conilurines were splitby inclusion of both uromyines and anisomyines. Notably,a recent molecular systematic study of the genus Pseudo-
mys (Ford, 2006), that included all conilurine genera,found a monophyletic Conilurini to the exclusion of theuromyines. These results, however, were not supportedby bootstrap analyses and were not consistent amongmethodologies (i.e. distance trees supported parphyly ofthe Conilurini), suggesting that this data set lacked suffi-cient characters to adequately test monophyly. Our results,based on considerably more molecular characters andincluding a much broader sampling of Murinae, werestrongly supported by bootstrap and posterior probabili-ties. In addition, forcing our data to support a monophy-letic Conilurini would significantly reduce the loglikelihood of the concatenated phylogeny as evaluated bya Shimodaira–Hasegawa test (�DlnL = 44.13, 1000 RELLreplicates, p = 0.001; Shimodaira and Hasegawa, 1999).Thus, we conclude that our data has sufficient power toreject a monophyletic Conilurini. This conclusion wouldsuggest a more complex biogeographic history thanexpected, indicating either that conilurine diversity hasemerged from two separate colonizations of Australia orthat the uromyines are derived from a single conilurineradiation.
K.C. Rowe et al. / Molecular Phylogenetics and Evolution 47 (2008) 84–101 97
Reconstruction of dispersal events between New Guineaand Australia recovered a minimum of nine events. Notsurprisingly, such dispersal appears to have been relativelycommon, but only two dispersal events have precededmajor diversifications in rodents. The first was the earliestcolonization of Australia by non-volant terrestrial eutheri-ans, which preceded the diversification of a first conilurineclade. The second resulted either in diversification of a sec-ond conilurine clade after a second colonization of Austra-lia or in diversification of the uromyine clade afterrecolonization of New Guinea by a conilurine ancestor.The first scenario would indicate that Conilurus, Mesemb-
riomys, and Leporillus would be better considered basalmembers of a uromyine clade that has colonized Australiathree times or more (the conilurines, probably Uromys, andMelomys at least once). The second scenario would indi-cate that diversification of the conilurines in Australia ledto a recolonization of New Guinea and greater Wallaceaand diversification of a uromyine clade that would betterbe considered a derived member of the conilurines. Unlessthe topology of the phylogeny is changed, more geneticdata are unlikely to resolve these two scenarios.
The pattern that emerges from these phylogenies is ofrapid and probably adaptive radiations after colonizationof landmasses previously unoccupied by muroidlikerodents. Keogh et al. (1998) reached a similar conclusionfor elapid snakes—that they underwent a rapid radiationaround 5 Mya after colonizing Sahul. Two such geographicradiations seem to have occurred in murines, the first inNew Guinea (‘‘anisomyines”) and a second smaller one(but with greater ecological disparity) in Australia (‘‘conil-urines”). The same pattern appears to an even greaterdegree with the colonization of South America by othermuroids (Sigmodontinae) at about the same time (6–7 Mya; Steppan et al., 2004b, unpublished data). Together,these very recent radiations account for nearly 10% of allmammalian diversity and therefore the geographic expan-sions of these groups represent a significant amount ofrodent and mammal macroevolution.
Our data support multiple dispersal events betweenAustralia and New Guinea, consistent with expectationsgiven their close proximity and frequent coalescence dur-ing the Pleistocene. A sea-level drop of as little as 10 mwould expose a land bridge (Voris, 2000). Avian honeyeat-ers show no evidence of endemic radiations on the twoland masses, instead indicating frequent dispersals(Driskell and Christidis, 2004), as did several elapid snakeclades (Scanlon and Lee, 2004; Wuster et al., 2005). Theinitial and sustained diversification on New Guinea thatour data reveal, which lasted approximately 1.7 (timebetween nodes P and V) to 2.5 (N–X) My before the firstevidence of a colonization of Australia, is thereforeremarkable. The Pliocene time frame of the New Guineaanisomyine radiation predates the large sea-level fluctua-tions of the Pleistocene, perhaps explaining why most ofthe reconstructed dispersal events were near the tips ofthe tree (events 4, 5, 7, 8, 10).
4.2. Murine systematics
Our results confirm and build upon recent molecularphylogenies of Murinae (Steppan et al., 2005; Jansaet al., 2006). Our analyses strongly supported Phloeomys
and Batomys (Phloeomys division) as the most divergentmembers of Murinae. Early diversification of the remaining‘‘core” Murinae produced at least four large, geographi-cally delineated radiations that are strongly supported byour data (nodes I, L, M, and N). As in Steppan et al.(2005), three of the four main radiations were associatedwith diversification in Africa (node L), Southeast Asia(node M), and the Philippines/Sahul (node N), and thefourth radiation, distributed throughout Africa, Europe,and Asia lacked a clear center of diversification (node I).The relationships among these clades (nodes D and E),although moderately to strongly supported by the concat-enated data, were not consistently supported by individualgene phylogenies, consistent with expectations for rapidformation of these lineages during an early murine radia-tion. Four additional taxa (Millardia, node H; Micromys,
node C; Chiropodomys, node F; and Vandeleuria, nodeG) each recovered a sister relationship to one of these basalradiations of the core Murinae. Although these associa-tions were largely supported by bootstrap and Bayesianposterior probabilities based on the concatenated data,individual ML gene phylogenies were inconsistent withthese relationships and lacked strong support as evidencedby bootstrap proportions and posterior probabilities. Forexample, the sister relationship of the Southeast Asian Mil-lardia to the African radiation (node L) was only supportedby a single gene phylogeny. We interpret these patterns toreflect the rapid diversification at the base of the core Muri-nae, and disagreement among individual gene phylogeniesmay stem from a combination of insufficient data withingenes and lineage sorting among genes. Therefore, thesetaxa represent additional basal divergence within the coreMurinae, and their exact placement within the Murinaeshould be considered cautiously. Our robust results formost nodes, however, indicate that we do not lack powerand allow us to reject a close relationship with other tri-bal-level clades.
Our results support monophyly of most divisions ofMusser and Carleton (2005), but our results conflict withmonophyly of the Oenomys and Micromys divisions. Mem-bers of the former (Oenomys and Grammomys) did notform a monophyletic group except when genera from theAethomys, Arvicanthis, Dasymys, and Hybomys divisionswere included. Together with Otomys and Parotomys, thesedivisions form an exclusively African clade that may reflecta single colonization of the continent. As has been reportedelsewhere (Chevret et al., 1993; Watts and Baverstock,1995; Senegas and Avery, 1998; Michaux et al., 2001; Jansaet al., 2006), our data also did not support the elevation ofOtomys and Parotomys to the subfamilial rank (Otomyi-nae), as they are deeply nested within the core Murinaewith close associations with other exclusively African taxa.
98 K.C. Rowe et al. / Molecular Phylogenetics and Evolution 47 (2008) 84–101
Members of the Micromys division (Chiropodomys, Micro-
mys, and Vandeleuria) were scattered across the phylogenyand did not form a clade in any of the phylogenies. Chirop-
odomys grouped with the Sahulian and Philippine oldendemics (node F), Micromys grouped with a largelySoutheast Asian ‘‘Rattus” group (node M, Dacnomys,Maxomys, Melasmothrix, and Rattus divisions), and Van-
deleuria grouped with a largely African/Eurasian group(node I, Apodemus, Colomys, Mus, and Stenocephalemys
divisions). As discussed above, each of these generadiverged early from the core Murinae. They are thereforeunlikely to share many synapomorphies with other lineageswithin the Murinae, and their grouping by Musser andCarleton (2005) as the Micromys division may haveresulted from plesiomorphic similarities in morphologicaland immunological characters (Ellermann, 1941; Misonne,1969; Watts and Baverstock, 1995).
Our data strongly supported monophyly of the Sahu-lian old endemics with respect to all other Murinae sam-pled. Although this result supports those of previousstudies based on phallic morphology (Lidicker, 1968;Lidicker and Brylski, 1987), sperm morphology (Breedand Sarafis, 1978; Breed, 1984), craniodental morphology(Musser, 1981), and chromosome variation (Baverstocket al., 1977; Donnellan, 1987), our study includes a muchbroader sampling of murine diversity, providing a morepowerful test. Most murine genera not represented inour data are well-supported members of clades/divisionswithin our data and unlikely to bear on monophyly ofthe Sahulian Old Endemics, but monophyly of other divi-sions is not certain. For example, the polyphyletic condi-tion of the Micromys division, as evidenced by our data,may bear on monophyly of the Sahulian Old Endemics,as it includes genera from the geographically proximateSunda shelf. In particular, the placement of Chiropodomys
as sister to the Philippine/Sahulian Old Endemic cladesuggests that further sampling within this group is war-ranted, including the genera Haeromys, Hapalomys, andVernaya and additional species of Chiropodomys. Of thethree divisions of Murinae not represented in our data,only the Crunomys division (Crunomys and Sommeromys)could be reliably placed within our phylogeny (nearMaxomys) and should have no bearing on monophylyof the Sahulian old endemics (Jansa et al., 2006). Theplacement of Echiothrix (Sulawesi spiny rat, Echiothrix
division) and members of the Pithecheir division (Erople-pus, Lenomys, Lenothrix, Margaretamys, Pithecheir, andPithecheirops) within the Murinae remains uncertain.Their distributions on the island of Sulawesi and ingreater southeast Asia suggest that they could bear onmonophyly of the Sahulian old endemics and should besampled in further studies, but the Sahulian old endemicsare all very closely related, having very short branchesamong basal lineages, and therefore seem unlikely to beparaphyletic. If they are not monophyletic, then anymember outside of Sahul would probably be the resultof a back-dispersal event.
4.3. Correction of Thallomys sequence
Steppan et al. (2005) included two samples identified asThallomys paedulcus from the Carnegie Museum that fellout within the Arvicanthine group. Those authors notedthat these samples were nearly identical to a Grammomyssurdaster from the same expedition and, given the uncer-tainty, excluded all three from the combined analyses; theyincluded the two ‘‘Thallomys” sequences in an expandedsampling of AP5, tentatively concluding that the ‘Grammo-
mys’ sample was misidentified. Since that time, cyt b
sequences for various Thallomys and Grammomys havebecome available (Thallomys paedulcus, DQ381927; Thallo-
mys loringi, DQ381928; Thallomys nigricauda, DQ381925;Grammomys sp., AF141218), and we sequenced three addi-tional species of Grammomys from the Field Museum (seeAppendices). The three Carnegie samples all fell into aGrammomys clade in the concatenated analyses. In addi-tion, separate analysis of our cyt b data combined withthe published sequences confirmed the result: our ‘‘Thallo-
mys” samples fell out with all the Grammomys and not withthe published Thallomys. We therefore conclude that theCarnegie Thallomys were actually Grammomys and thatthe earlier published AP5 sequences (Steppan et al., 2005)were thus misattributed.
Acknowledgments
We thank the many individuals and institutions whograciously loaned tissues or DNA samples: the TexasCooperative Wildlife Collection (R.L. Honeycutt), the Mu-seum of Vertebrate Zoology (J.L. Patton, C. Cicero), theField Museum of Natural History (B.D. Patterson, L.R.Heaney, W.S. Stanley, J. Kerbis-Perterhans), the CarnegieMuseum of Natural History (S. McLaren), the Smithso-nian’s Natural History Museum (M.D. Carleton, J. Ja-cobs), the Wildlife Conservation Society at the BronxZoo (C. Lehn), H. Suzuki (Hokkaido University), K.P.Aplin (CSIRO Sustainable Ecosystems, Canberra), andespecially the South Australian Museum (S. Donnellan).Fieldwork was supported by grants from the David Klin-gener Fund of the University of Massachusetts to J. Ander-son, the National Geographic Society to W.S. Stanley; theBarbara Brown Fund, the Marshall Field II, and the JohnD. and Catherine T. MacArthur Foundation (Chicago) toL.R. Heaney; and the Institute of Tropical Forest Conser-vation (Ruhija, Uganda) to J. Kerbis-Peterhans. M. Ra-mirez contributed to the sequencing effort. This researchwas partially funded by National Science FoundationGrants DEB–0238837 to RMA and SJS, DEB-0454616to RMA, and DEB-0454673 to SJS. P. Valencia and M.Ramirez contributed to the sequencing. We are gratefulto the Field Museum of Natural History for use of themap presented in Fig. 1. We thank A.B. Thistle for exten-sive editorial assistance on the manuscript. J. Wilgenbuschand D.L. Swofford provided access to a 200-processor clus-ter at the FSU School of Computational Science.
K.C. Rowe et al. / Molecular Phylogenetics and Evolution 47 (2008) 84–101 99
Appendix A. Supplementary data
Supplementary data associated with this article can befound, in the online version, at doi:10.1016/j.ympev.2008.01.001.
References
Adkins, R.M., Gelke, E.L., Rowe, D., Honeycutt, R.L., 2001. Molecularphylogeny and divergence time estimates for major rodent groups:evidence from multiple genes. Mol. Biol. Evol. 18, 777–791.
Adkins, R.M., Walton, A.H., Honeycutt, R.L., 2003. Higher-levelsystematics of rodents and divergence time estimates based on twocongruent nuclear genes. Mol. Phylogenet. Evol. 26, 409–420.
Baverstock, P.R., 1984. Australia’s living rodents: a restrained explosion.In: Archer, M., Clayton, G. (Eds.), Vertebrate Zoogeography andEvolution in Australia. Hesperian Press, Perth, pp. 913–919.
Baverstock, P.R., Watts, C.H.S., Hogarth, J.T., 1977. Chromosomeevolution in Australian rodents. I. The Pseudomyinae, the Hydromyi-nae and the Uromys/Melomys group. Chromosoma 61, 95–125.
Baverstock, P.R., Watts, C.H.S., Gelder, M., Jahnke, A., 1983. G-bandinghomologies of some Australian rodents. Genetica 60, 105–117.
Breed, W.G., 1984. Sperm head structure in the Hydrominae (Rodentia:Muridae): a further evolutionary development of the subacrosomalspace in mammals. Gamete Res. 10, 31–44.
Breed, W.G., Aplin, K.P., 1994. Sperm morphology of murid rodentsfrom New Guinea and the Solomon islands: phylogenetic implications.Aust. J. Sci. 43, 17–30.
Breed, W.G., Sarafis, V., 1978. On the phylogenetic significance ofspermatozoal morphology and male reproductive tract anatomy inAustralian rodents. Trans. R. Soc. South Australia 103, 127–135.
Cao, Y., Fujiwara, M., Nikaido, M., Okada, N., Hasegawa, M., 2000.Interordinal relationships and timescale of eutherian evolution asinferred from mitochondrial genome data. Gene 259, 149–158.
Chevret, P., Denys, C., Jaeger, J.J., Michaux, J., Catzeflis, F., 1993.Molecular and paleontological aspects of the tempo and mode ofevolution in Otomys (Otomyinae: Muridae: Mammalia). Biochem.Syst. Evol. 21, 123–131.
DeBry, R.W., Seshadri, S., 2001. Nuclear intron sequences fro phylog-enetics of closely related mammals: an example using the phylogeny ofMus. J. Mammal. 82, 280–288.
Donnellan, S.C., 1987. Phylogenetic relationships of New Guinea rodents(Rodentia, Muridae) based on chromosomes. Aust. Mammal. 12, 61–67.
Driskell, A.C., Christidis, L., 2004. Phylogeny and evolution of theAustralo-Papuan honeyeaters (Passeriformes, Meliphagidae). Mol.Phylogenet. Evol. 31, 943–960.
Ellermann, J.R., 1941. The families and genera of living rodentsFamilyMuridae, vol. II. British Museum (Natural History), London.
Emry, R.J., 1981. New material of the Oligocene muroid rodent Nonomys
and its bearing on muroid origins. Am. Mus. Nov. 2712, 1–14.Evans, B.J., Brown, R.M., McGuire, J.A., Supiatna, J., Andayani, N.,
Diesmos, A., Iskandar, D., Melnick, D.J., Cannatella, D.C., 2003.Phylogenetics of fanged frogs: Testing biogeographical hypotheses atthe interface of the Asian and Australian faunal zones. Syst. Biol. 52(6), 794–819.
Farris, J.S., Kallersjo, M., Kluge, A.G., Bult, C., 1994. Testing signifi-cance of incongruence. Cladistics 10, 315–319.
Farris, J.S., Kallersjo, M., Kluge, A.G., Bult, C., 1995. Constructing asignificance test for incongruence. Syst. Biol. 44, 570–572.
Felsenstein, J., 1984. Distance methods for inferring phylogenies: ajustification. Evolution 38, 16–24.
Felsenstein, J., 1985. Confidence limits on phylogenies: an approach usingthe bootstrap. Evolution 39, 783–791.
Flannery, T.F., 1995a. Mammals of New Guinea Revised and updatededition. Comstock/Cornell, Ithaca, NY.
Flannery, T.F., 1995b. Mammals of the Southwest Pacific and MoluccanIslands. Comstock/Cornell, Ithaca, NY, 464 pp.
Ford, F., 2006. A splitting headache: relationships and generic boundariesamong Australian murids. Biol. J. Linnean Soc. 89, 117–138.
Fratti, F., Simon, C., Sullivan, J., Swofford, D.L., 1997. Evolution of themitochondrial cytochrome oxidase II gene in Collembola. J. Mol. Evol.44, 145–158.
Godthelp, H., 1990. Pseudomys vandycki, a tertiary murid from Australia.Mem. Queensland Mus. 28, 171–173.
Godthelp, H., 1997. Zyzomys rackhami sp. nov. (Rodentia, Muridae) arockrat from Pliocene Rackham’s roost site, Riversleigh, NorthwesternQueensland. Mem. Queensland Mus. 41, 329–333.
Haddrath, O., Baker, A.J., 2001. Complete mitochondrial DNA genomesequences of extinct birds: ratite phylogenetics and the vicariancebiogeography hypothesis. Proc. R. Soc. Lond. Ser. B 268, 939–945.
Hall, R., 1998. The plate tectonics of Cenozoic SE Asia and thedistribution of land and sea. In: Hall, R., Holloway, J.D. (Eds.),Biogeography and geological evolution of SE Asia. Backhuys Pub-lishers, Leiden, pp. 99–131.
Hand, S., 1984. Australia’s oldest rodents—master mariners fromMalaysia. In: Archer, M., Clayton, G. (Eds.), VertebrateZoogeography and Evolution in Australia. Hesperian Press, Perth,pp. 905–912.
Helgen, K.M., 2003. A review of the rodent fauna of Seram, Moluccas,with the description of a new subspecies of mosaic-tailed rat, Melomys
rufescens paveli. J. Zool., Lond. 261, 165–172.Helgen, K.M., 2005. A new species of murid rodent (genus Mayermys)
from south-eastern New Guinea. Mammal. Biol. 70, 61–67.Huchon, D., Catzeflis, F.M., Douzery, E.J.P., 2000. Variance of molecular
datings, evolution of rodents and the phylogenetic affinities betweenCtenodactylidae and Hystricognathi. Proc. R. Soc. Lond. Ser. B 267,393–402.
Huelsenbeck, J. P., Ronquist, F., 2005. MrBayes: a program for theBayesian inference of phylogeny, 3.1.2. Rochester, NewYork.
Jacobs, L.L., 1997. A new genus of murid rodent from the Miocene ofPakistan and comments on the origin of the Muridae. Paleobios 25, 1–11.
Jacobs, L.L., Downs, W.R., 1994. The evolution of murine rodents inAsia. In: Tomida, Y., Li, C.K., Setoguchi, T. (Eds.), Rodent andlagomorph families of Asian origins and diversification. NationalScience Museum Monograph 8. National Science Museum, Tokyo, pp.149–156.
Jacobs, L.L., Flynn, L.J., 2005. Of mice ... again: the Siwalik rodentrecord, murine distribution, and molecular clocks.. In: Lieberman,D.E., Smith, R.J., Kelley, J. (Eds.), Interpreting the Past: Essays onHuman, Primate, and Mammal Evolution in Honor of David Pilbeam.Brill Academic, Boston, pp. 63–80.
Jacobs, L.L., Flynn, L.J., Downs, W.R., Barry, J.C., 1990. Quo vadis,
Antemus? The Siwalik muroid record. In: Lindsay, E.H., Fahlbusch,V., Mein, P. (Eds.), European Neogene Mammal Chronology. PlenumPress, New York, pp. 573–586.
Jansa, S.A., Barker, F.K., Heaney, L.R., 2006. The pattern and timing ofdiversification of Philippine endemic rodents: evidence from mito-chondrial and nuclear gene sequences. Syst. Biol. 55, 73–88.
Jansa, S.A., Weksler, M., 2004. Phylogeny of muroid rodents: relation-ships within and among major lineages as determined by IRBP genesequences. Mol. Phylogenet. Evol. 31, 256–276.
Jansa, S.A., Voss, R.S., 2000. Phylogenetic studies on didelphid marsu-pials. 1. Introduction and preliminary results from nuclear IRBP genesequences. J. Mammal. Evol. 7, 43–77.
Johnson, D., 2004. The Geology of Australia. Cambridge UniversityPress, Cambridge, UK.
Keogh, J.S., Shine, R., Donnellan, S., 1998. Phylogenetic relationships ofterrestrial Australo-Papuan elapid snakes (subfamily Hydrophiinae)based on cytochrome b and 16S rRNA sequences. Mol. Phylogenet.Evol. 10, 67–81.
Kumar, S., Hedges, S.B., 1998. A molecular timescale for vertebrateevolution. Nature 392, 917–920.
100 K.C. Rowe et al. / Molecular Phylogenetics and Evolution 47 (2008) 84–101
Ladiges, P.Y., Udovicic, F., Nelson, G., 2003. Australian biogeographicalconnections and the phylogeny of large genera in the plant familyMyrtaceae. J. Biogeogr. 30, 989–998.
Lecompte, E., Denys, C., Granjon, L., 2005. Confrontation of morpho-logical and molecular data: The Praomys group (Rodentia, Murinae)as a case of adaptive convergences and morphological stasis. Mol.Phyl. Evol. 37 (3), 899–919.
Lee, A.K., Baverstock, P.R., Watts, C.H.S., 1981. Rodents—the lateinvaders. In: Keast, A. (Ed.), Ecological Biogeography of Australia.Junk, The Hague, pp. 521–554.
Lidicker Jr., W.Z., 1968. A phylogeny of New Guinea rodent genera basedon phallic morphology. J. Mammal. 49, 609–643.
Lidicker Jr., W.Z., Brylski, P.V., 1987. The conilurine rodent radiation ofAustralia, analyzed on the basis of phallic morphology. J. Mammal.68, 617–641.
Lydekker, R. 1896. A Geographical History of Mammals. Cambridge,UK, pp. 400.
Maddison, D.R., Maddison, W.P., 2000. MacClade 4: Analysis of Phylog-eny and Character Evolution. Sinauer Associates, Sunderland, Mass.
Maekawa, K., Lo, N., Rose, H.A., Matsumoto, T., 2003. The evolution ofsoil-burrowing cockroaches (Blattaria: Blaberidae) from wood-bur-rowing ancestors following an invasion of the latter from Asia intoAustralia. Proc. R. Soc. Lond. Ser. B 270, 1301–1307.
Mayr, E., 1944. Wallace’s line in the light of recent zoogeographic studies.Quart. Rev. Biol. 19 (1), 1–14.
Menzies, J. I., Dennis, E. 1979. Handbook of New Guinea Rodents. WauEcology Institute No. 6, Wing Tai Cheung Printing Co., Hong Kong.
Michaux, J., Reeves, A., Catzeflis, F., 2001. Evolutionary history of themost speciose mammals: molecular phylogeny of muroid rodents. Mol.Biol. Evol. 18, 2017–2031.
Misonne, X. 1969. African and Indo-Australian Muridae, evolutionarytrends. Musee Royal de l’Afrique Centrale Tervuren, Zoologiques 172.
Moss, S.J., Wilson, M.E.J., 1998. Biogeographic implications of theTertiary palaeogeographic evolution of Sulawesi and Borneo. In: Hall,R., Holloway, J.D. (Eds.), Biogeography and Geological Evolution ofSE Asia. Backhuys Publishers, Leiden, pp. 99–131.
Musser, G.M., 1981. Results of Archbold expeditions. No. 105. Notes onthe systematics of Indo-Malayan murid rodents, and descriptions ofnew genera and species from Ceylon, Sulawesi, and the Philippines.Bull. Am. Mus. Nat. Hist. 168, 225–334.
Musser, G.M., Carleton, M.D., 2005. Superfamily Muroidea. In: Wilson,D.E., Reeder, D.M. (Eds.), Mammal Species of the World: ATaxonomic and Geographic Reference, third ed. The Johns HopkinsUniversity Press, Baltimore, pp. 894–1531.
Pigram, C.J., Davies, H.L., 1987. Terranes and the accretion history of theNew Guinean orogen. Bur. Miner. Resour. J. Aust. Geol. Geophys.10, 193–211.
Posada, D., Crandall, K.A., 1998. Modeltest: testing the model of DNAsubstitution. Bioinformatics 14, 817–818.
Raven, P.H., Axelrod, D.I., 1972. Plate tectonics and Australasianpaleobiogeography. Science 176, 1379–1386.
Rich, T.H., Archer, M., Hand, S.J., Godthelp, H., Muirhead, J., Pledge,N.S., Flannery, T.F., Woodburne, M.O., Case, J.A., Tedford, R.H.,Turnbull, W.D., Lundelius Jr., E.L., Rich, L.S.V., Whitelaw, M.J.,Kemp, A., Vickers-Rich, P., 1991. Australian mesozoic and tertiaryterrestrial mammal localities. In: Vickers-Rich, P., Monaghan, J.M.,Baird, R.F., Rich, T.H. (Eds.), Vertebrate Palaeontology of Austral-asia. Pioneer Design Studio Pty Ltd., Victoria, pp. 1005–1070.
Ride, W.D.L., 1970. A Guide to the Native Mammals of Australia.Oxford University Press, Melbourne.
Sambrook, E., Fritsch, F., Maniatis, T., 1989. Molecular Cloning. ColdSpring Harbor Laboratory Press, Cold Spring Harbor, NY.
Sanmartin, I., Ronquist, F., 2004. Southern hemisphere biogeographyinferred by event-based models: plant versus animal patterns. Syst.Biol 53 (2), 216–243.
Scanlon, J.D., Lee, M.S.Y., 2004. Phylogeny of Australasian venomoussnakes (Colubroidea, Elapidae, Hydrophiinae) based on phenotypicand molecular evidence. Zool. Scripta 33, 335–366.
Scotese, C.R., Gahagan, L.M., Larson, R.L., 1988. Plate tectonicreconstructions of the Cretaceous and Cenozoic ocean basins.Tectonophysics 155, 27–48.
Senegas, F., Avery, D.M., 1998. New evidence for the murine origins ofthe Otomyinae (Mammalia, Rodentia) and the age of Bolt’s Farm(South Africa). S. Afr. J. Sci. 94, 503–507.
Shimodaira, H., Hasegawa, M., 1999. Multiple comparisons of log-likelihoods with applications to phylogenetic inference. Mol. Biol.Evol. 16, 1114–1116.
Simpson, G.G., 1961. Historical zoogeography of Australian mammals.Evolution 15, 431–446.
Simpson, G.G., 1977. Too many lines; the limits of the Oriental andAustralian zoogeographic regions. Proc. Amer. Phil. Soc. 121 (2), 107–120.
Springer, M.S., Westerman, M., Kavanagh, J.R., Burk, A., Woodburne,M.O., Kao, D.J., Krajewski, C., 1998. The origin of the Australasianmarsupial fauna and the phylogenetic affinities of the enigmaticmonito del monte and marsupial mole. Proc. Roy. Soc. B. 265,2381–2386.
Steppan, S.J., Adkins, R.M., Anderson, J., 2004a. Phylogeny anddivergence-date estimates of rapid radiations in muroid rodents basedon multiple nuclear genes. Syst. Biol. 53, 533–553.
Steppan, S.J., Adkins, R.M., Spinks, P.Q., Hale, C., 2005. Multigenephylogeny of the Old World mice, Murinae, reveals distinct geographiclineages and the declining utility of mitochondrial genes compared tonuclear genes. Mol. Phylogenet. Evol. 37, 370–388.
Steppan, S.J., Storz, B.L., Hoffmann, R.S., 2004b. Nuclear DNAphylogeny of the squirrels (Mammalia: Rodentia) and the evolutionof arboreality from c-myc and RAG1. Mol. Phylogenet. Evol. 30, 703–719.
Strahan, R. (Ed.), 1995. Mammals of Australia. Reed Books, Sydney, pp.548–665.
Swofford, D.L., 2002. PAUP*: Phylogenetic Analysis Using Parsimony(and Other Methods) 4.0 Beta. Sinauer Associates, Sunderland, Mass.
Swofford, D.L., Olsen, G.J., Waddell, P.J., Hillis, D.M., 1996. Phyloge-netic inference. In: Hillis, D.M., Moritz, C., Mable, B.K. (Eds.),Molecular Systematics. Sinauer Associates, Sunderland, Mass, pp.407–514.
Tate, G.H.H., 1951. Results of the archbold expeditions. No. 65. Therodents of Australia and New Guinea.. Bull. Am. Mus. Nat. Hist. 97,183–430.
Thorne, J.L., Kishino, H., 2002. Divergence time and evolutionary rateestimation with multilocus data. Syst. Biol. 51, 689–702.
Voris, H.K., 2000. Maps of Pleistocene sea levels in Southeast Asia:shorelines, river systems and time durations. J. Biogeogr. 27, 1153–1167.
Wallace, A.R., 1860. On the zoological geography of the Malayarchipelago. J. Linnean Soc. Lond. IV, 172–184.
Wallace, A.R., 1863. On the physical geography of the Malay archipelago.J. R. Geogr. Soc. 33, 217–234.
Watts, C.H.S., 1974. The native rodents of Australia: a personal view.Aust. Mammal. 1, 109–115.
Watts, C.H.S., Aslin, H.J., 1981. The rodents of Australia. Angus andRobertson, Sydney.
Watts, C.H.S., Baverstock, P.R., 1994a. Evolution in New-GuineanMuridae (Rodentia) assessed by microcomplement fixation of albu-min. Aust. J. Zool. 42, 295–306.
Watts, C.H.S., Baverstock, P.R., 1994b. Evolution in some South-EastAsian Murinae (Rodentia) as assessed by microcomplement fixation ofalbumin and their relationship to Australian murines. Aust. J. Zool.42, 711–722.
Watts, C.H.S., Baverstock, P.R., 1995. Evolution in the Murinae(Rodentia) assessed by microcomplement fixation of albumin. Aust.J. Zool. 43, 105–118.
Watts, C.H.S., Baverstock, P.R., Birrell, J., Krieg, M., 1992.Phylogeny of the Australian rodents (Muridae): a molecular approachusing microcomplement fixation of albumin. Aust. J. Zool. 40,81–90.
K.C. Rowe et al. / Molecular Phylogenetics and Evolution 47 (2008) 84–101 101
Weber, M., 1904. Die saugetiereEinfuhrung in die anatomie undsystematik der rezenten und fossilen Mammalia. Fischer, Jena,Germany.
Whitten, A.J., Mustafa, M., Henderson, G.S., 1987. The Ecology ofSulawesi. Gadjah Mada University Press, Yogyakarta, Indonesia.
Wilgenbusch, J. C., Warren, D.L., Swofford, D.L. 2004. AWTY: a systemfor graphical exploration of MCMC convergence in Bayesian phylo-genetic inference. Available from: <http://ceb.csit.fsu.edu/awty>.
Winkler, A.J., 2002. Neogene paleobiogeography and East Africanpaleoenvironments: contributions from the Tugen Hills rodents andlagomorphs. J. Human Evol. 42, 237–256.
Wood, A.E., 1980. The Oligocene rodents of North America. Trans. Am.Philos. Soc. 70 (5), 3–68.
Woodburne, M.O., Case, J.A., 1996. Dispersal, vicariance, and the LateCretaceous to Early Tertiary land Mammal biogeography from SouthAmerica to Australia. J. Mamm. Evol. 3, 121–161.
Wu, C.-I., Li, W.-H.., 1985. Evidence for higher rates of nucleotidesubstitution in rodents than in man. Proc. Nat. Acad. Sci., USA 82,1741–1745.
Wuster, W., Dumbrell, A.J., Hay, C., Pook, C.E., Williams, D.J., Fry,B.G., 2005. Snakes across the strait: trans– torresian phylogeographicrelationships in three genera of Australasian snakes (Serpentes:Elapidae: Acanthophis, Oxyuranus, and Pseudechis). Mol. Phylogenet.Evol. 34, 1–14.
Yang, Z. 2000. Phylogenetic analysis by maximum likelihood (PAML),version 3.0. University College of London, London.
Related Documents