Please see slides 9 -14 for Disclosures. April 2015 Market Overview

Please see slides 9 -14 for Disclosures. April 2015 Market Overview.
Dec 16, 2015
Welcome message from author
This document is posted to help you gain knowledge. Please leave a comment to let me know what you think about it! Share it to your friends and learn new things together.
Transcript

Please see slides 9 -14 for Disclosures.
April 2015
Market Overview
2
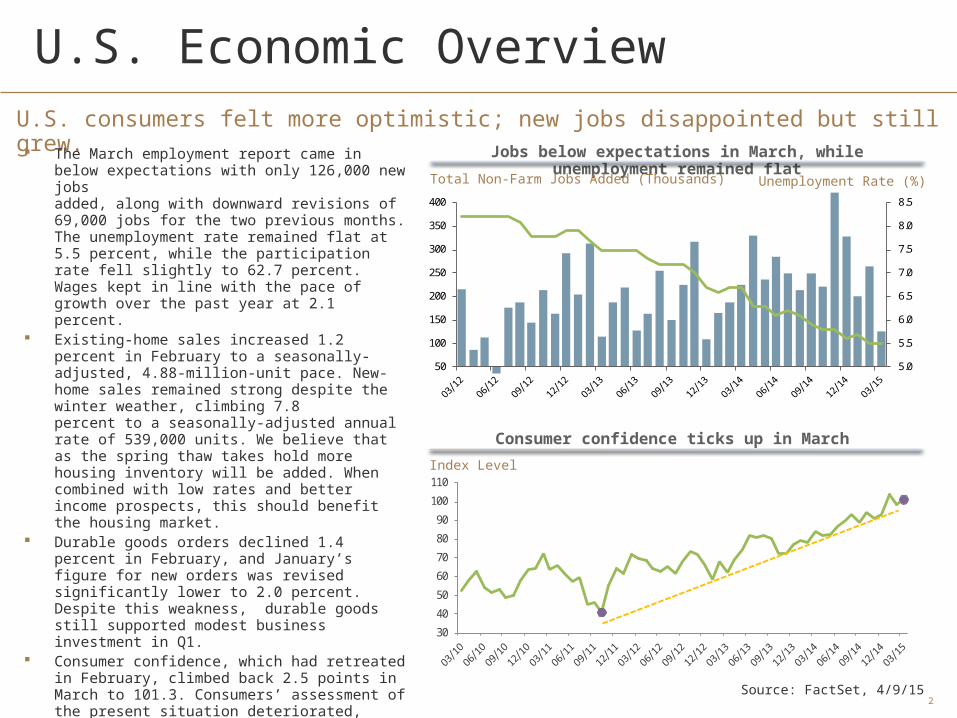
U.S. Economic OverviewU.S. consumers felt more optimistic; new jobs disappointed but still grew. The March employment report came in below
expectations with only 126,000 new jobs added, along with downward revisions of 69,000 jobs for the two previous months. The unemployment rate remained flat at 5.5 percent, while the participation rate fell slightly to 62.7 percent. Wages kept in line with the pace of growth over the past year at 2.1 percent.
Existing-home sales increased 1.2 percent in February to a seasonally-adjusted, 4.88-million-unit pace. New-home sales remained strong despite the winter weather, climbing 7.8 percent to a seasonally-adjusted annual rate of 539,000 units. We believe that as the spring thaw takes hold more housing inventory will be added. When combined with low rates and better income prospects, this should benefit the housing market.
Durable goods orders declined 1.4 percent in February, and January’s figure for new orders was revised significantly lower to 2.0 percent. Despite this weakness, durable goods still supported modest business investment in Q1.
Consumer confidence, which had retreated in February, climbed back 2.5 points in March to 101.3. Consumers’ assessment of the present situation deteriorated, however, the expectations index improved, with consumers being more optimistic about employment and income prospects. We believe that this bodes well for an increase in consumer spending this spring.
Jobs below expectations in March, while unemployment remained flat
Consumer confidence ticks up in March
Total Non-Farm Jobs Added (Thousands)
5.0
5.5
6.0
6.5
7.0
7.5
8.0
8.5
50
100
150
200
250
300
350
400
30
40
50
60
70
80
90
100
110Index Level
Source: FactSet, 4/9/15
Unemployment Rate (%)

3
U.S. Economic Outlook Leading indicators and manufacturing suggest a U.S. growth slowdown in Q1. The U.S. economy grew at an annualized rate
of 2.4 percent in 2014. While fourth-quarter GDP growth was 2.2 percent, growth in the first quarter of 2015 will likely slow due to the cold weather and effects of the West coast port “strike.” Yet the second quarter may experience a rebound. We expect the U.S. economy to grow 3 percent for all of 2015.
The Index of Leading Economic Indicators rose by 0.2 percent in both January and February of 2015. The softening activity in the manufacturing sector continued to weigh on the index, suggesting a growth slowdown in the first quarter.
Inflation rose by 0.2 percent month-over-month in February primarily due to the rise in gasoline prices. This was the first increase in four months. While further declines are possible, we expect consumer inflation to begin firming in the second half of the year.
The Institute for Supply Management (ISM) Manufacturing survey declined by 1.4 points to 51.5 in March. The services survey was little changed, falling only 0.4 points to 56.4. Within the Manufacturing survey, production held steady while new orders declined, while in the services survey, business activity declined but new orders gained traction. A slowdown was evident in both measures throughout the first quarter.
GDP Growth expected to slowdown in the 1Q of 2015
Both surveys remain on expansion territory, but a slowdown is evident
Real GDP (QoQ% SAAR)
ISM Surveys
48
50
52
54
56
58
60
62 ISM ManufacturingISM Non-ManufacturingExpansion/Contraction
Source: Bloomberg, 4/9/15
2.70
1.80
4.50
3.50
-2.10
4.605.00
2.201.40
3.05 3.00 2.90
-3
-2
-1
0
1
2
3
4
5
1Q13 2Q13 3Q13 4Q13 1Q14 2Q14 3Q14 4Q14 1Q15 2Q15 3Q15 4Q15
Actual
Estimate
4
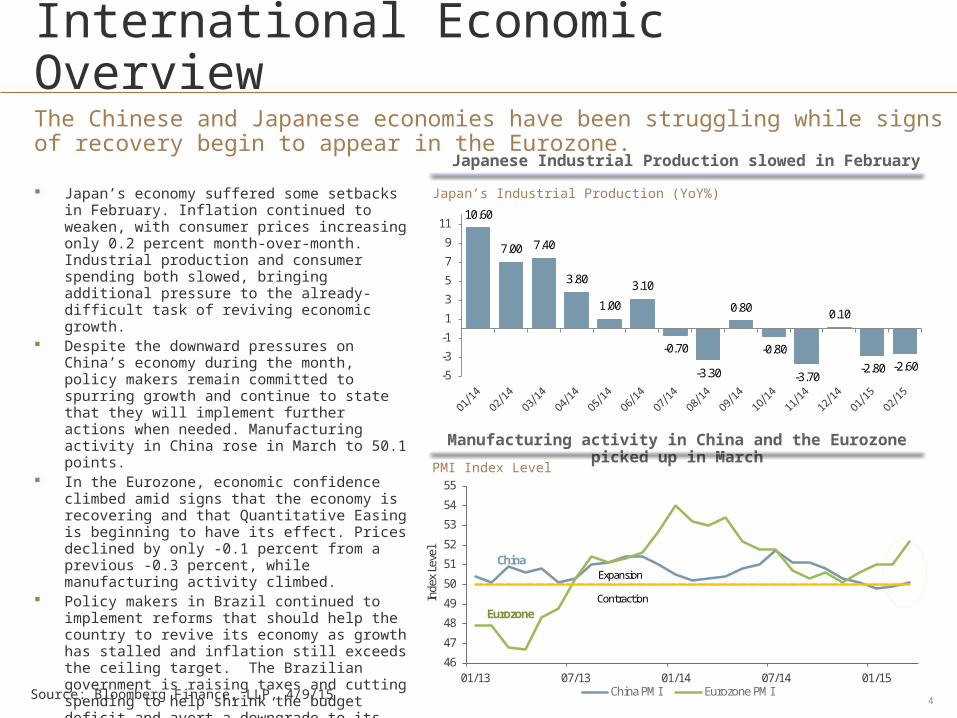
International Economic OverviewThe Chinese and Japanese economies have been struggling while signs of recovery begin to appear in the Eurozone.
Japan’s economy suffered some setbacks in February. Inflation continued to weaken, with consumer prices increasing only 0.2 percent month-over-month. Industrial production and consumer spending both slowed, bringing additional pressure to the already-difficult task of reviving economic growth.
Despite the downward pressures on China’s economy during the month, policy makers remain committed to spurring growth and continue to state that they will implement further actions when needed. Manufacturing activity in China rose in March to 50.1 points.
In the Eurozone, economic confidence climbed amid signs that the economy is recovering and that Quantitative Easing is beginning to have its effect. Prices declined by only -0.1 percent from a previous -0.3 percent, while manufacturing activity climbed.
Policy makers in Brazil continued to implement reforms that should help the country to revive its economy as growth has stalled and inflation still exceeds the ceiling target. The Brazilian government is raising taxes and cutting spending to help shrink the budget deficit and avert a downgrade to its sovereign credit rating.
Japanese Industrial Production slowed in February
Manufacturing activity in China and the Eurozone picked up in March
Japan’s Industrial Production (YoY%)
PMI Index Level
Source: Bloomberg Finance, LLP, 4/9/15
46
47
48
49
50
51
52
53
54
55
01/13 07/13 01/14 07/14 01/15
Inde
x Le
vel
China PMI Eurozone PMI
Expansion
Contraction
China
Eurozone
10.60
7.00 7.40
3.80
1.00
3.10
-0.70
-3.30
0.80
-0.80
-3.70
0.10
-2.80 -2.60-5
-3
-1
1
3
5
7
9
11
5
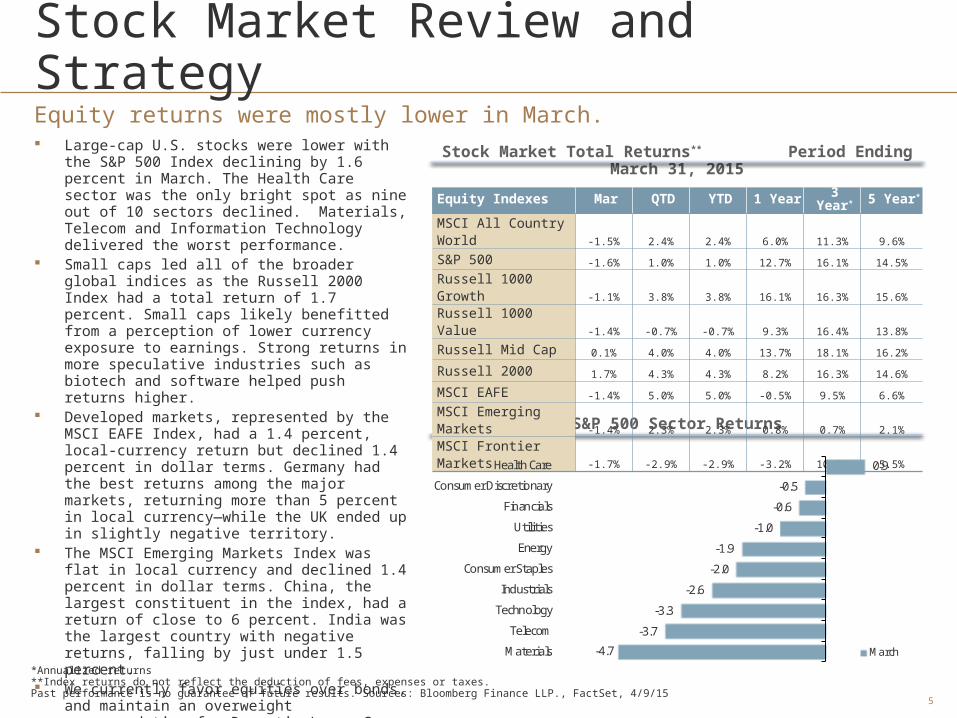
Stock Market Review and StrategyEquity returns were mostly lower in March. Large-cap U.S. stocks were lower with the S&P
500 Index declining by 1.6 percent in March. The Health Care sector was the only bright spot as nine out of 10 sectors declined. Materials, Telecom and Information Technology delivered the worst performance.
Small caps led all of the broader global indices as the Russell 2000 Index had a total return of 1.7 percent. Small caps likely benefitted from a perception of lower currency exposure to earnings. Strong returns in more speculative industries such as biotech and software helped push returns higher.
Developed markets, represented by the MSCI EAFE Index, had a 1.4 percent, local-currency return but declined 1.4 percent in dollar terms. Germany had the best returns among the major markets, returning more than 5 percent in local currency—while the UK ended up in slightly negative territory.
The MSCI Emerging Markets Index was flat in local currency and declined 1.4 percent in dollar terms. China, the largest constituent in the index, had a return of close to 6 percent. India was the largest country with negative returns, falling by just under 1.5 percent.
We currently favor equities over bonds, and maintain an overweight recommendation for Domestic Large Cap and Developed International Equity.
Stock Market Total Returns** Period Ending March 31, 2015
S&P 500 Sector Returns
Equity Indexes Mar QTD YTD 1 Year 3 Year* 5 Year*
MSCI All Country World -1.5% 2.4% 2.4% 6.0% 11.3% 9.6%
S&P 500 -1.6% 1.0% 1.0% 12.7% 16.1% 14.5%
Russell 1000 Growth -1.1% 3.8% 3.8% 16.1% 16.3% 15.6%
Russell 1000 Value -1.4% -0.7% -0.7% 9.3% 16.4% 13.8%
Russell Mid Cap 0.1% 4.0% 4.0% 13.7% 18.1% 16.2%
Russell 2000 1.7% 4.3% 4.3% 8.2% 16.3% 14.6%
MSCI EAFE -1.4% 5.0% 5.0% -0.5% 9.5% 6.6%
MSCI Emerging Markets -1.4% 2.3% 2.3% 0.8% 0.7% 2.1%
MSCI Frontier Markets -1.7% -2.9% -2.9% -3.2% 10.8% 5.5%
-4.7
-3.7
-3.3
-2.6
-2.0
-1.9
-1.0
-0.6
-0.5
0.9
Materials
Telecom
Technology
Industrials
Consumer Staples
Energy
Utilities
Financials
Consumer Discretionary
Health Care
March
*Annualized returns**Index returns do not reflect the deduction of fees, expenses or taxes. Past performance is no guarantee of future results. Sources: Bloomberg Finance LLP., FactSet, 4/9/15

6
Bond Market Review and StrategyBond prices were mixed in March. March was a volatile month for fixed income. U.S.
rates initially rose in anticipation of the Federal Reserve’s (Fed) removal of the word “patience” relative to rate liftoff. Yet Treasury securities rallied late in the month after the Fed lowered its “dot- plot” rate forecast and clarified policy direction.
The other significant contributor to volatility was the U.S. dollar (USD) rally, especially vs. the euro. The euro weakened as European Central Bank (ECB) quantitative easing (QE) began on March 9.
Investment-grade corporate bonds performed well in March climbing 0.5 percent. Corporate performance was led by Financials.
High-yield (both corporate and municipal) bonds sustained losses. High-yield (HY) corporates fell as a result of the volatile energy sector due to oil-price swings.
Municipals were strongest in the intermediate range, with 8-10-year maturities outperforming shorter and longer maturities.
Unhedged developed-market (DM) bonds delivered negative returns while USD returns for DM bonds were positive. USD-denominated emerging-market bonds also significantly outperformed local-currency holdings.
We are slightly underweight Treasury securities and advocate shortening maturities. We also remain underweight DM debt as many international yields remain below Treasury yields despite often-weaker fundamentals.
Bond Market Total Returns** Period Ending March 31, 2015
Credit Spreads to Treasuries
*Annualized returns**Index returns do not reflect the deduction of fees, expenses or taxes. Past performance is no guarantee of future results. Sources: Bloomberg Finance LLP., Barclays Capital, 4/9/15
Bond Indexes Mar QTD YTD 1 Year 3 Year* 5 Year*
Global Multiverse -1.0% -1.9% -1.9% -3.8% 0.0% 2.5%
U.S. Aggregate Bond 0.5% 1.6% 1.6% 5.7% 3.1% 4.4%
U.S. Short-Term Taxable 0.2% 0.6% 0.6% 1.1% 1.0% 1.4%
U.S. Interm-Term Taxable 0.6% 1.4% 1.4% 5.0% 2.9% 4.5%
U.S Long-Term Taxable 0.5% 3.4% 3.4% 15.5% 7.3% 9.7%
U.S. Treasury 0.6% 1.6% 1.6% 5.4% 2.4% 4.0%
U.S. Corporate 0.3% 2.3% 2.3% 6.8% 5.2% 6.5%
U.S. Municipal 0.3% 1.0% 1.0% 6.6% 4.1% 5.1%
U.S. TIPS -0.5% 1.4% 1.4% 3.1% 0.6% 4.3%
U.S. High Yield -0.5% 2.5% 2.5% 2.0% 7.5% 8.6%
Foreign Bond -1.8% -4.1% -4.1% -9.5% -3.4% 0.6%
EM Debt 0.5% 2.1% 2.1% 4.1% 4.4% 6.8%
Yield Spread (%)
0.00
5.00
10.00
15.00
20.00
Mar-05 Mar-06 Mar-07 Mar-08 Mar-09 Mar-10 Mar-11 Mar-12 Mar-13 Mar-14 Mar-15
Investment Grade CorporateHigh YieldEmerging Markets Debt
7
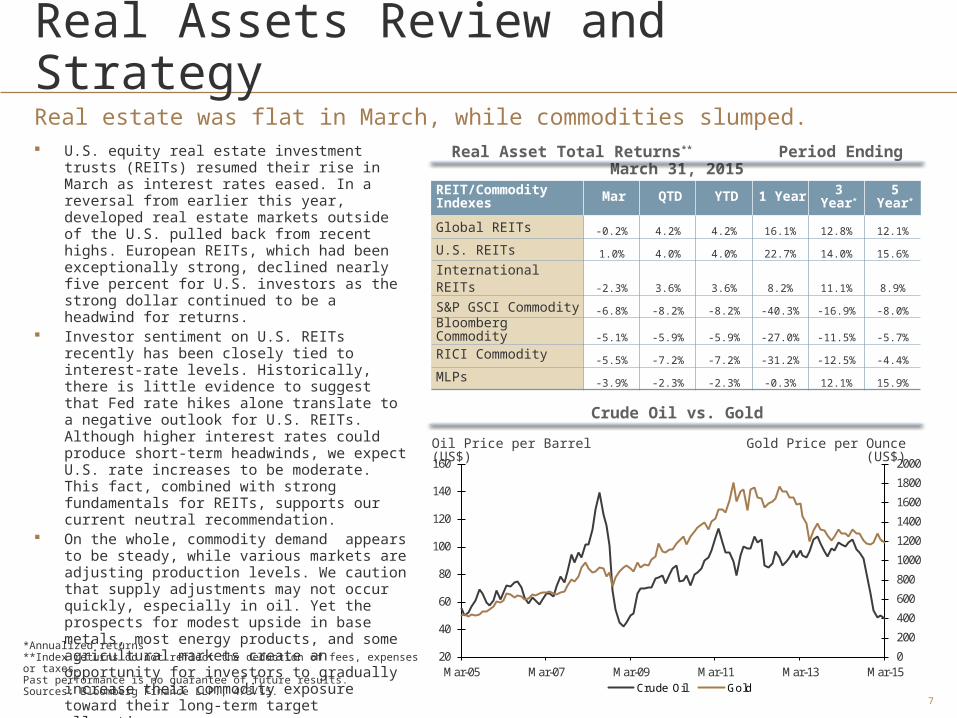
Real Assets Review and StrategyReal estate was flat in March, while commodities slumped. U.S. equity real estate investment trusts
(REITs) resumed their rise in March as interest rates eased. In a reversal from earlier this year, developed real estate markets outside of the U.S. pulled back from recent highs. European REITs, which had been exceptionally strong, declined nearly five percent for U.S. investors as the strong dollar continued to be a headwind for returns.
Investor sentiment on U.S. REITs recently has been closely tied to interest-rate levels. Historically, there is little evidence to suggest that Fed rate hikes alone translate to a negative outlook for U.S. REITs. Although higher interest rates could produce short-term headwinds, we expect U.S. rate increases to be moderate. This fact, combined with strong fundamentals for REITs, supports our current neutral recommendation.
On the whole, commodity demand appears to be steady, while various markets are adjusting production levels. We caution that supply adjustments may not occur quickly, especially in oil. Yet the prospects for modest upside in base metals, most energy products, and some agricultural markets create an opportunity for investors to gradually increase their commodity exposure toward their long-term target allocations.
Real Asset Total Returns** Period Ending March 31, 2015
Crude Oil vs. Gold
*Annualized returns **Index returns do not reflect the deduction of fees, expenses or taxes. Past performance is no guarantee of future results. Sources: Bloomberg Finance LLP., 4/3/15.
REIT/Commodity Indexes Mar QTD YTD 1 Year 3 Year* 5 Year*
Global REITs -0.2% 4.2% 4.2% 16.1% 12.8% 12.1%
U.S. REITs 1.0% 4.0% 4.0% 22.7% 14.0% 15.6%
International REITs -2.3% 3.6% 3.6% 8.2% 11.1% 8.9%
S&P GSCI Commodity -6.8% -8.2% -8.2% -40.3% -16.9% -8.0%
Bloomberg Commodity -5.1% -5.9% -5.9% -27.0% -11.5% -5.7%
RICI Commodity -5.5% -7.2% -7.2% -31.2% -12.5% -4.4%
MLPs -3.9% -2.3% -2.3% -0.3% 12.1% 15.9%
0
200
400
600
800
1000
1200
1400
1600
1800
2000
20
40
60
80
100
120
140
160
Mar-05 Mar-07 Mar-09 Mar-11 Mar-13 Mar-15Crude Oil Gold
Oil Price per Barrel (US$) Gold Price per Ounce (US$)
8
Alternatives Review and Strategy
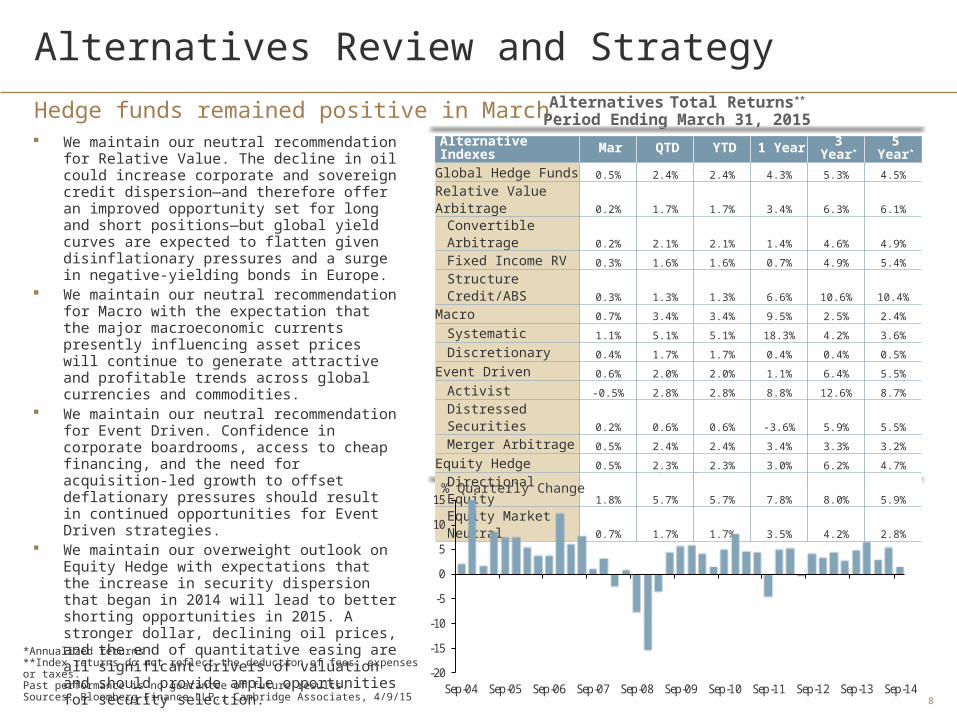
Hedge funds remained positive in March. We maintain our neutral recommendation for
Relative Value. The decline in oil could increase corporate and sovereign credit dispersion—and therefore offer an improved opportunity set for long and short positions—but global yield curves are expected to flatten given disinflationary pressures and a surge in negative-yielding bonds in Europe.
We maintain our neutral recommendation for Macro with the expectation that the major macroeconomic currents presently influencing asset prices will continue to generate attractive and profitable trends across global currencies and commodities.
We maintain our neutral recommendation for Event Driven. Confidence in corporate boardrooms, access to cheap financing, and the need for acquisition-led growth to offset deflationary pressures should result in continued opportunities for Event Driven strategies.
We maintain our overweight outlook on Equity Hedge with expectations that the increase in security dispersion that began in 2014 will lead to better shorting opportunities in 2015. A stronger dollar, declining oil prices, and the end of quantitative easing are all significant drivers of valuation and should provide ample opportunities for security selection.
Alternatives Total Returns**
Period Ending March 31, 2015
U.S. Private Equity Index Returns
*Annualized returns**Index returns do not reflect the deduction of fees, expenses or taxes. Past performance is no guarantee of future results. Sources: Bloomberg Finance LLP., Cambridge Associates, 4/9/15
-20
-15
-10
-5
0
5
10
15
Sep-04 Sep-05 Sep-06 Sep-07 Sep-08 Sep-09 Sep-10 Sep-11 Sep-12 Sep-13 Sep-14
Alternative Indexes Mar QTD YTD 1 Year 3 Year* 5 Year*
Global Hedge Funds 0.5% 2.4% 2.4% 4.3% 5.3% 4.5%
Relative Value Arbitrage 0.2% 1.7% 1.7% 3.4% 6.3% 6.1%
Convertible Arbitrage 0.2% 2.1% 2.1% 1.4% 4.6% 4.9%
Fixed Income RV 0.3% 1.6% 1.6% 0.7% 4.9% 5.4%
Structure Credit/ABS 0.3% 1.3% 1.3% 6.6% 10.6% 10.4%
Macro 0.7% 3.4% 3.4% 9.5% 2.5% 2.4%
Systematic 1.1% 5.1% 5.1% 18.3% 4.2% 3.6%
Discretionary 0.4% 1.7% 1.7% 0.4% 0.4% 0.5%
Event Driven 0.6% 2.0% 2.0% 1.1% 6.4% 5.5%
Activist -0.5% 2.8% 2.8% 8.8% 12.6% 8.7%
Distressed Securities 0.2% 0.6% 0.6% -3.6% 5.9% 5.5%
Merger Arbitrage 0.5% 2.4% 2.4% 3.4% 3.3% 3.2%
Equity Hedge 0.5% 2.3% 2.3% 3.0% 6.2% 4.7%
Directional Equity 1.8% 5.7% 5.7% 7.8% 8.0% 5.9%
Equity Market Neutral 0.7% 1.7% 1.7% 3.5% 4.2% 2.8%
% Quarterly Change
9
DisclosuresAsset Class Risk Information
Alternative investments are not suitable for all investors. Any offer to purchase or sell a specific alternative investment product will be made by the product’s official offering documents. Investors could lose all or a substantial amount investing in Alternative Investments.
Hedge funds are generally only available to persons who are “accredited investors” or “qualified purchasers” within the meaning of U.S. securities laws. Hedge funds are not required to provide investors with periodic pricing or valuation and are not subject to the same regulatory requirements as mutual funds. An investment in a hedge fund involves the risks inherent in an investment in securities, as well as specific risks associated with limited liquidity, the use of leverage, short sales, options, futures, derivative instruments, investments in non-U.S. securities, “junk” bonds and illiquid investments.
Private Equity funds are complex, speculative investment vehicles and are not suitable for all investors. They are generally open to qualified investors only and carry high costs, substantial risks, and may be highly volatile. There is often limited (or even non-existent) liquidity and a lack of transparency regarding the underlying assets. They do not represent a complete investment program. Investors in funds of private equity funds will incur asset-based fees and expenses at the fund level and indirect fees, expenses and asset-based compensation of investment funds in which these funds invest. An investment in a private equity fund involves the risks inherent in an investment in securities, as well as specific risks associated with limited liquidity, the use of leverage and illiquid investments. There can be no assurances that a manager’s strategy will be successful or that a manager will use these strategies with respect to all or any portion of a portfolio.
Stocks offer long-term growth potential but may fluctuate more and provide less current income than other investments. An investment in the stock market should be made with an understanding of the risks associated with common stocks, including market fluctuations. The prices of small- and mid-company stocks are generally more volatile than large company stocks. They often involve higher risks because smaller companies may lack the management expertise, financial resources, product diversification and competitive strengths to endure adverse economic conditions.
Investing in foreign securities presents certain risks not associated with domestic investments, such as currency fluctuation, political and economic instability, and different accounting standards. This may result in greater share price volatility. These risks are heightened in emerging markets.
There are special risks associated with an investment in real estate, including the possible illiquidity of the underlying properties, credit risk, interest rate fluctuations and the impact of varied economic conditions.
Exposure to the commodities markets may subject an investment to greater share price volatility than an investment in traditional equity or debt securities. Investments in commodities may be affected by changes in overall market movements, commodity index volatility, changes in interest rates or factors affecting a particular industry or commodity. Products that invest in commodities may employ more complex strategies which may expose investors to additional risks.
Investing in fixed income securities involves certain risks such as markets risk if sold prior to maturity and credit risk especially if investing in high yield bonds, which have lower ratings and are subject to greater volatility. Bond prices fluctuate inversely to changes in interest rates. Therefore, a general rise in interest rates can result in the decline of the value of your investment. All fixed income investments may be worth less than original cost upon redemption or maturity.
Treasury Inflation-Protected Securities (TIPS) are subject to interest rate risk, especially when real interest rates rise. This may cause the underlying value of the bond to fluctuate more than other fixed income securities. TIPS have special tax consequences, generating phantom income on the “inflation compensation” component of the principal. A holder of TIPS may be required to report this income annually although no income related to “inflation compensation” is received until maturity.
An index is unmanaged and not available for direct investment.
Economic Indices (Slides 2-3)The Conference Board Consumer Confidence Index® (CCI) is a barometer of the health of the U.S. economy from the perspective of the consumer. The index is based on consumers’ perceptions of current business and employment conditions, as well as their expectations for six months hence regarding business conditions, employment, and income.

10
The Conference Board U.S Leading Economic Index® is a composite economic index designed to signal peaks and troughs in the business cycle. The leading economic index is essentially a composite averages of several individual leading indicators. They are constructed to summarize and reveal common turning point patterns in economic data in a clearer and more convincing manner than any individual component – primarily because they smooth out some of the volatility of individual components.
The Institute of Supply Management (ISM) Purchasing Manager’s Index® is a composite index based on the diffusion indexes of five of the indexes with equal weights: New Orders (seasonally adjusted), Production (seasonally adjusted), Employment (seasonally adjusted), Supplier Deliveries (seasonally adjusted), and Inventories. An Index values over 50 indicate expansion; below 50 indicates contraction. The values for the index can be between 0 and 100.
The Institute of Supply Management (ISM) Non-Manufacturing Index® is a composite index based on the diffusion indexes for four of the indicators with equal weights: Business Activity (seasonally adjusted), New Orders (seasonally adjusted), Employment (seasonally adjusted) and Supplier Deliveries. An Index values over 50 indicate expansion; below 50 indicates contraction. The values for the index can be between 0 and 100.
Equities (Slide 5)MSCI AC World ex USA Index is a free float-adjusted market capitalization weighted index that is designed to measure the equity market performance of developed and emerging markets, excluding the USA. The Index consists of 45 country indices comprising 22 developed and 23 emerging market country indices. The developed market country indices included are: Australia, Austria, Belgium, Canada, Denmark, Finland, France, Germany, Greece, Hong Kong, Ireland, Italy, Japan, Netherlands, New Zealand, Norway, Portugal, Singapore, Spain, Sweden, Switzerland, and the United Kingdom. The emerging market country indices included are: Argentina, Brazil, Chile, China, Colombia, Czech Republic, Egypt, Hungary, India, Indonesia, Israel, Korea, Malaysia, Mexico, Morocco, Peru, Philippines, Poland, Russia, South Africa, Taiwan, Thailand, and Turkey.
S&P 500 Index is a capitalization-weighted index calculated on a total-return basis with dividends reinvested. The index includes 500 widely held U.S. market industrial, utility, transportation and financial companies.
Russell 1000® Growth Index measures the performance of those Russell 1000 companies with higher price-to-book ratios and higher forecasted growth values.
Russell 1000® Value Index measures the performance of those Russell 1000 companies with lower price-to-book ratios and lower forecasted growth values.
Russell Midcap® Index measures the performance of the 800 smallest companies in the Russell 1000 Index, which represent approximately 25% of the total market capitalization of the Russell 1000® Index.
Russell 2000® Index measures the performance of the 2,000 smallest companies in the Russell 3000® Index, which represents approximately 8% of the total market capitalization of the Russell 3000 Index.
MSCI EAFE Index (Europe, Australasia, Far East) is a free float-adjusted market capitalization index that is designed to measure the equity market performance of developed markets, excluding the US & Canada. The Index consists of the following 21 developed market country indexes: Australia, Austria, Belgium, Denmark, Finland, France, Germany, Hong Kong, Ireland, Israel, Italy, Japan, the Netherlands, New Zealand, Norway, Portugal, Singapore, Spain, Sweden, Switzerland, and the United Kingdom.
MSCI Emerging Markets Index is a free float-adjusted market capitalization index that is designed to measure equity market performance of emerging markets. The MSCI Emerging Markets Index consists of the following 23 emerging market country indexes: Brazil, Chile, China, Colombia, Czech Republic, Egypt, Greece, Hungary, India, Indonesia, Korea, Malaysia, Mexico, Peru, Philippines, Poland, Qatar, Russia, South Africa, Taiwan, Thailand, Turkey and United Arab Emirates.
MSCI Frontier Markets Index is a free float-adjusted market capitalization index that is designed to measure equity market performance of frontier markets. The MSCI Frontier Markets Index consists of the following 24 frontier market country indexes: Argentina, Bahrain, Bangladesh, Bulgaria, Croatia, Estonia, Jordan, Kenya, Kuwait, Lebanon, Lithuania, Morocco, Kazakhstan, Mauritius, Nigeria, Oman, Pakistan, Romania, Serbia, Slovenia, Sri Lanka, Tunisia, Ukraine, and Vietnam. The MSCI Saudi Arabia Index is currently not included in the MSCI Frontier Markets Index but is part of the MSCI Gulf Cooperation Council (GCC) Countries Index. The MSCI Bosnia Herzegovina Index, the MSCI Botswana Index, the MSCI Ghana Index, the MSCI Jamaica Index, the MSCI Palestine IMI, the MSCI Trinidad & Tobago Index and the MSCI Zimbabwe Index are currently stand-alone country indexes and are not included in the MSCI Frontier Markets Index. The addition of these country indexes to the MSCI Frontier Markets Index is under consideration.
Disclosures (continued)

11
Fixed Income (Slide 6)Barclays Multiverse Index provides a broad-based measure of the global fixed-income bond market. The index represents the union of the Global Aggregate Index and the Global High-Yield Index and captures investment grade and high yield securities in all eligible currencies. Standalone indices such as the Euro Floating-Rate ABS Index and the Chinese Aggregate Index are excluded. The Multiverse Index family includes a wide range of standard and customized sub-indices by sector, quality, maturity, and country. JP Morgan Global Ex United States bond Index is a total return, market capitalization weighted index, rebalanced monthly consisting of the following countries: Australia, Germany, Spain, Belgium, Italy, Sweden, Canada, Japan, United Kingdom, Denmark, Netherlands, and France.
Barclays U.S. Aggregate Bond Index is composed of the Barclays Capital U.S. Government/Credit Index and the Barclays Capital U.S. Mortgage-Backed Securities Index, and includes Treasury issues, agency issues, corporate bond issues, and mortgage-backed securities.
Barclays U.S. Treasury Index includes public obligations of the U.S. Treasury with a remaining maturity of one year or more.
Barclays U.S. Corporate Bond Index includes publicly issued U.S. corporate and Yankee debentures and secured notes that meet specified maturity, liquidity, and quality requirements.
Barclays U.S. Municipal Bond Index represents municipal bonds with a minimum credit rating of at least Baa, an outstanding par value of at least $3 million, and a remaining maturity of at least one year. The Index excludes taxable municipal bonds, bonds with floating rates, derivatives, and certificates of participation.
Barclays Treasury Inflation Protected Securities (TIPS) Index includes all publically issued, investment-grade U.S. TIPS with an outstanding face value of more than $250 million and that have at least one year to maturity.
Barclays U.S. High Yield Bond Index is an unmanaged index that tracks the performance of below investment grade U.S. dollar-denominated corporate bonds publicly issued in the U.S. domestic market.
Foreign Bond (Unhedged). JPMorgan GBI Global ex-US (Unhedged) in USD is an unmanaged index market representative of the total return performance in U.S. dollars on an unhedged basis of major non-U.S. bond markets.
JP Morgan Emerging Markets Bond Index Global (EMBI Global), which currently covers 27 emerging market countries. Included in the EMBI Global are U.S.-dollar-denominated Brady bonds, Eurobonds, traded loans, and local market debt instruments issued by sovereign and quasi-sovereign entities.
Real Assets (Slide 7)Global REITs. FTSE/EPRA NAREIT Developed Index is designed to track the performance of listed real estate companies and REITs worldwide.
Domestic REITs. FTSE NAREIT US All Equity REITs Index is designed to track the performance of REITs representing equity interests in (as opposed to mortgages )on properties. It represents all tax-qualified REITs with more than 50 percent of total assets in qualifying real estate assets, other than mortgages secured by real property that also meet minimum size and liquidity criteria.
International REITs. FTSE EPRA/NAREIT Developed ex US Index is designed to track the performance of listed real estate companies in developed countries worldwide other than the U.S.
S&P Goldman Sachs Commodity Index (GSCI) is a composite index of commodity sector returns representing unleveraged, long-only investment in commodity futures that is broadly diversified across the spectrum of commodities. The index is includes futures contracts on 24 physical commodities of which Energy represents nearly 70%.
Bloomberg Commodity Index is designed to be a highly liquid and diversified benchmark for commodities as an asset class. The index is composed of futures contracts on 22 physical commodities. No related group of commodities (e.g., energy, precious metals, livestock and grains) may constitute more than 33% of the index as of the annual re-weightings of the components. No single commodity may constitute less than 2% of the index.
Disclosures (continued)
12
Commodities (RICI). The Rogers International Commodity Index is a U.S. dollar based index representing the value of a basket of commodities consumed in the global economy. Representing futures contracts on 37 physical commodities, it is designed to track prices of raw materials not just in the U.S. but around the world.
Wells Fargo Securities MLP Index is a float-adjusted, capitalization weighted index of energy master limited partnerships (MLP) with a market capitalization of at least $200 million at the time of inclusion.
Alternative Assets (Slide 8)
Global Hedge Funds: The HFRI Fund Weighted Composite Index is a global, equal-weighted index of over 2,000 single-manager funds that report to HFR Database. Constituent funds report monthly net-of-all-fees performance in U.S. dollars and have a minimum of $50 million under management or a 12-month track record of active performance. The HFRI Fund Weighted Composite Index does not include Funds of Hedge Funds.
Relative Value Arbitrage: The HFRI Relative Value Index: maintains positions in which the investment thesis is predicated on realization of a valuation discrepancy in the relationship between multiple securities. Managers employ a variety of fundamental and quantitative techniques to establish investment theses, and security types range broadly across equity, fixed income, derivative or other security types. Fixed income strategies are typically quantitatively driven to measure the existing relationship between instruments and, in some cases, identify attractive positions in which the risk adjusted spread between these instruments represents an attractive opportunity for the investment manager. RV position may be involved in corporate transactions also, but as opposed to ED exposures, the investment thesis is predicated on realization of a pricing discrepancy between related securities, as opposed to the outcome of the corporate transaction.
Convertible Arbitrage: The HFRI RV: Fixed Income-Convertible Arbitrage Index, includes strategies in which the investment thesis is predicated on realization of a spread between related instruments in which one or multiple components of the spread is a convertible fixed income instrument. Strategies employ an investment process designed to isolate attractive opportunities between the price of a convertible security and the price of a nonconvertible security, typically of the same issuer. Convertible arbitrage positions maintain characteristic sensitivities to credit quality the issuer, implied and realized volatility of the underlying instruments, levels of interest rates and the valuation of the issuer's equity, among other more general market and idiosyncratic sensitivities. Fixed Income Relative Value: The HFRI RV: Fixed Income—Corporate Index, includes strategies predicated on realization of a spread between related instruments in which one or multiple components of the spread is a corporate fixed-income instrument. Strategies are designed to isolate attractive opportunities between a variety of fixed income instruments, typically realizing an attractive spread between multiple corporate bonds or between a corporate and risk free government bond. They typically involve arbitrage positions with little or no net credit market exposure, but are predicated on specific, anticipated idiosyncratic developments.
Structured Credit/Asset Backed. The HFRI RV: Fixed Income-Asset Backed Index. includes strategies predicated on realization of a spread between related instruments in which one or multiple components of the spread is a fixed-income instrument backed by physical collateral or other financial obligations (loans, credit cards) other than those of a specific corporation. Strategies are designed to isolate attractive opportunities between a variety of fixed income instruments specifically securitized by collateral commitments, which frequently include loans, pools and portfolios of loans, receivables, real estate, machinery or other tangible financial commitments. Investment thesis may be predicated on an attractive spread given the nature and quality of the collateral, the liquidity characteristics of the underlying instruments and on issuance and trends in collateralized fixed-income instruments, broadly speaking. In many cases, investment managers hedge, limit, or offset interest-rate exposure in the interest of isolating the risk of the position to strictly the disparity between the yield of the instrument and that of the lower-risk instruments.
Macro: The HFRI Macro Index: Macro: Investment Managers which trade a broad range of strategies in which the investment process is predicated on movements in underlying economic variables and the impact these have on equity, fixed income, hard currency and commodity markets. Managers employ a variety of techniques, both discretionary and systematic analysis, combinations of top down and bottom up theses, quantitative and fundamental approaches and long and short term holding periods. Although some strategies employ RV techniques, Macro strategies are distinct from RV strategies in that the primary investment thesis is predicated on predicted or future movements in the underlying instruments, rather than realization of a valuation discrepancy between securities. In a similar way, while both Macro and equity hedge managers may hold equity securities, the overriding investment thesis is predicated on the impact movements in underlying macroeconomic variables may have on security prices, as opposes to EH, in which the fundamental characteristics on the company are the most significant are integral to investment thesis.
Disclosures (continued)
13
Systematic Macro. HFRI Macro: Systematic Diversified Index. Diversified strategies employing mathematical, algorithmic and technical models, with little or no influence of individuals over the portfolio positioning. Strategies are designed to identify opportunities in markets exhibiting trending or momentum characteristics across individual instruments or asset classes. Strategies typically employ quantitative processes which focus on statistically robust or technical patterns in the return series of the asset, and they typically focus on highly liquid instruments and maintain shorter holding periods than either discretionary or mean-reverting strategies. Although some strategies seek to employ counter-trend models, strategies benefit most from an environment characterized by persistent, discernible trending behavior. Typically have no greater than 35 percent of portfolio in either dedicated currency or commodity exposures over a given market cycle.
Discretionary Macro. HFRI Macro: Discretionary Thematic Index. Strategies primarily rely on the evaluation of market data, relationships and influences, as interpreted by individuals who make decisions on portfolio positions; strategies employ an investment process most heavily influenced by top-down analysis of macroeconomic variables. Investment Managers may trade actively in developed and emerging markets, focusing on both absolute and relative levels on equity markets, interest rates/fixed income markets, currency and commodity markets; they frequently employ spread trades to isolate a differential between instrument identified by the Investment Manager as being inconsistent with expected value. Portfolio positions typically are predicated on the evolution of investment themes the Manager expects to develop over a relevant time frame, which in many cases contain contrarian or volatility-focused components.
Event Driven: The HFRI Event Driven Index: Event-Driven: Investment Managers who maintain positions in companies currently or prospectively involved in corporate transactions of a wide variety including but not limited to mergers, restructurings, financial distress, tender offers, shareholder buybacks, debt exchanges, security issuance or other capital structure adjustments. Security types can range from most senior in the capital structure to most junior or subordinated, and frequently involve additional derivative securities. Event Driven exposure includes a combination of sensitivities to equity markets, credit markets and idiosyncratic, company specific developments. Investment theses are typically predicated on fundamental characteristics (as opposed to quantitative), with the realization of the thesis predicated on a specific development exogenous to the existing capital structure.
Activist. HFRI ED: Activist Index. Strategies may obtain or attempt to obtain representation on the company’s board of directors in an effort to impact the firm’s policies or strategic direction and in some cases may advocate activities such as division or asset sales, partial or complete corporate divestiture, dividends or share buybacks, and changes in management. Strategies employ an investment process primarily focused on opportunities in equity and equity-related instruments of companies that are currently or prospectively engaged in a corporate transaction, security issuance/repurchase, asset sales, division spin-off or other catalyst-oriented situation. These involve both announced transactions and situations in which no formal announcement is expected to occur. Activist strategies would expect to have greater than 50 percent of the portfolio in activist positions, as described.Distressed Credit. HFRI ED: Distressed/Restructuring Index. Strategies focus on corporate fixed-income instruments, primarily corporate credit instruments of companies trading at significant discounts to their value at issuance or obliged (par value) at maturity as a result of either formal bankruptcy proceedings or financial-market perception of near-term proceedings. Managers are typically actively involved with the management of these companies; they are frequently involved on creditors’ committees in negotiating the exchange of securities for alternative obligations, either swaps of debt, equity or hybrid securities. Managers employ fundamental credit processes focused on valuation and asset coverage of securities of distressed firms; in most cases portfolio exposures are concentrated in instruments that are publicly traded, in some cases actively and in others under reduced liquidity but in general for which a reasonable public market exists. Strategies employ primarily debt (greater than 60 percent) but also may maintain related equity exposure.
Merger Arbitrage. HFRI ED: Merger Arbitrage Index. Strategies primarily focus on opportunities in equity and equity-related instruments of companies that are currently engaged in a corporate transaction. Merger Arbitrage involves primarily announced transactions, typically with limited or no exposure to situations in which no formal announcement is expected to occur. Opportunities are frequently presented in cross-border, collared, and international transactions that incorporate multiple geographic regulatory institutions, typically with minimal exposure to corporate credits. Strategies typically have over 75 percent of positions in announced transactions over a given market cycle.
Equity Hedge. HFRI Equity Hedge (Total) Index. Equity Hedge: Investment Managers who maintain positions both long and short in primarily equity and equity derivative securities. A wide variety of investment processes can be employed to arrive at an investment decision, including both quantitative and fundamental techniques; strategies can be broadly diversified or narrowly focused on specific sectors and can range broadly in terms of levels of net exposure, leverage employed, holding period, concentrations of market capitalizations and valuation ranges of typical portfolios. EH managers would typically maintain at least 50 percent exposure to, and may in some cases be entirely invested in, equities, both long and short.
Disclosures (continued)
14
Directional Equity. HFRX EH: Multi-Strategy Index. Managers maintain positions both long and short in primarily equity and equity-derivative securities. A wide variety of investment processes can be employed to arrive at an investment decision, including both quantitative and fundamental techniques; strategies can be broadly diversified or narrowly focused on specific sectors and can range broadly in terms of levels of net exposure, leverage, holding period, concentrations of market capitalizations, and valuation ranges of typical portfolios. Managers typically do not maintain more than 50 percent exposure to any one Equity Hedge sub-strategy.
Equity Market Neutral. HFRI EH: Equity Market Neutral Index. Strategies employ sophisticated quantitative techniques to analyze price data to ascertain information about future price movement and relationships between securities. These can include both Factor-based and Statistical Arbitrage/Trading strategies. Factor-based investment strategies include strategies predicated on the systematic analysis of common relationships between securities. In many cases, portfolios are constructed to be neutral to one or multiple variables, such as broader equity markets in dollar or beta terms, and leverage is frequently employed to enhance the return profile of the positions identified. Statistical Arbitrage/Trading strategies consist of strategies predicated on exploiting pricing anomalies which may occur as a function of expected mean reversion inherent in security prices; high-frequency techniques may be employed; trading strategies may also be based on technical analysis or designed opportunistically to exploit new information that the investment manager believes has not been fully, completely, or accurately discounted into current security prices. Strategies typically maintain characteristic net equity market exposure no greater than 10 percent long or short.
The Cambridge Associates LLC U.S. Private Equity Index® is an end-to-end calculation based on data compiled from 1,152 U.S. private equity funds (buyout, growth equity, private equity energy and mezzanine funds), including fully liquidated partnerships, formed between 1986 and 2014. Pooled end-to-end return, net of fees, expenses, and carried interest. The latest published returns data are as of September 30, 2014.
Note: While the HFRI Indices are frequently used, they have limitations (some of which are typical of other widely used indices). These limitations include survivorship bias (the returns of the indices may not be representative of all the hedge funds in the universe because of the tendency of lower performing funds to leave the index); heterogeneity (not all hedge funds are alike or comparable to one another, and the index may not accurately reflect the performance of a described style); and limited data (many hedge funds do not report to indices, and, therefore, the index may omit funds, the inclusion of which might significantly affect the performance shown. The HFRI Indices are based on information self‐reported by hedge fund managers that decide on their own, at any time, whether or not they want to provide, or continue to provide, information to HFR Asset Management, L.L.C. Results for funds that go out of business are included in the index until the date that they cease operations. Therefore, these indices may not be complete or accurate representations of the hedge fund universe, and may be biased in several ways. Returns of the underlying hedge funds are net of fees and are denominated in USD.
Global Investment Strategy (GIS) is a division of Wells Fargo Investment Institute, Inc. (WFII). WFII is a registered investment adviser and wholly-owned subsidiary of Wells Fargo & Company and provides investment advice to Wells Fargo Bank, N.A., Wells Fargo Advisors and other Wells Fargo affiliates. Wells Fargo Bank, N.A. is a bank affiliate of Wells Fargo & Company.
The information in this report was prepared by Global Investment Strategy. Opinions represent GIS’ opinion as of the date of this report and are for general information purposes only and are not intended to predict or guarantee the future performance of any individual security, market sector or the markets generally. GIS does not undertake to advise you of any change in its opinions or the information contained in this report. Wells Fargo & Company affiliates may issue reports or have opinions that are inconsistent with, and reach different conclusions from, this report.
This report is not intended to be a client‐specific suitability analysis or recommendation, an offer to participate in any investment, or a recommendation to buy, hold or sell securities. Do not use this report as the sole basis for investment decisions. Do not select an asset class or investment product based on performance alone. Consider all relevant information, including your existing portfolio, investment objectives, risk tolerance, liquidity needs and investment time horizon.
Brokerage products and services are offered through Wells Fargo Advisors. Wells Fargo Advisors is the trade name used by two separate registered broker-dealers: Wells Fargo Advisors, LLC and Wells Fargo Advisors Financial Network, LLC, Members SIPC, non-bank affiliates of Wells Fargo & Company. First Clearing, LLC, Member SIPC, is a registered broker-dealer and non-bank affiliate of Wells Fargo & Company. CAR 0415-01902
© 2015 Wells Fargo Investment Institute. All rights reserved.
Disclosures (continued)
Related Documents