This is an Open Access document downloaded from ORCA, Cardiff University's institutional repository: http://orca.cf.ac.uk/79544/ This is the author’s version of a work that was submitted to / accepted for publication. Citation for final published version: Bott, Lewis, Rees, Alice and Frisson, Steven 2016. The time course of familiar metonymy. Journal of Experimental Psychology: Learning, Memory, and Cognition 42 (7) , pp. 1160-1170. 10.1037/xlm0000218 file Publishers page: http://dx.doi.org/10.1037/xlm0000218 <http://dx.doi.org/10.1037/xlm0000218> Please note: Changes made as a result of publishing processes such as copy-editing, formatting and page numbers may not be reflected in this version. For the definitive version of this publication, please refer to the published source. You are advised to consult the publisher’s version if you wish to cite this paper. This version is being made available in accordance with publisher policies. See http://orca.cf.ac.uk/policies.html for usage policies. Copyright and moral rights for publications made available in ORCA are retained by the copyright holders.

Welcome message from author
This document is posted to help you gain knowledge. Please leave a comment to let me know what you think about it! Share it to your friends and learn new things together.
Transcript

This is an Open Access document downloaded from ORCA, Cardiff University's institutional
repository: http://orca.cf.ac.uk/79544/
This is the author’s version of a work that was submitted to / accepted for publication.
Citation for final published version:
Bott, Lewis, Rees, Alice and Frisson, Steven 2016. The time course of familiar metonymy. Journal
of Experimental Psychology: Learning, Memory, and Cognition 42 (7) , pp. 1160-1170.
10.1037/xlm0000218 file
Publishers page: http://dx.doi.org/10.1037/xlm0000218 <http://dx.doi.org/10.1037/xlm0000218>
Please note:
Changes made as a result of publishing processes such as copy-editing, formatting and page
numbers may not be reflected in this version. For the definitive version of this publication, please
refer to the published source. You are advised to consult the publisher’s version if you wish to cite
this paper.
This version is being made available in accordance with publisher policies. See
http://orca.cf.ac.uk/policies.html for usage policies. Copyright and moral rights for publications
made available in ORCA are retained by the copyright holders.
RESEARCH REPORT
The Time Course of Familiar Metonymy
Lewis Bott and Alice ReesCardiff University
Steven FrissonBirmingham University
Metonymic words have multiple related meanings, such as college, as in the building (“John walked into
the college”) or the educational institution (“John was promoted by the college”). Most researchers have
found support for direct access models of metonymy but one recent study, Lowder and Gordon (2013),
found delayed reading times for metonymic sentences relative to literal controls, in support of an indirect
access account. We conducted a speed-accuracy-tradeoff experiment to test whether their result was
caused by lower retrieval probabilities, consistent with direct or indirect access models of metonymy, or
slower retrieval dynamics, consistent only with indirect access accounts. We found lower retrieval
probabilities for the metonymic sentences but no difference in the dynamics parameters. These results
therefore suggest that literal senses do not have priority during processing and that established met-
onymic senses can be accessed directly.
Keywords: metonymy, pragmatics, sentence comprehension
Most words have multiple but related senses. For example, one
can refer to a hospital to mean a building in which people are
medically treated, as in “Dave was taken to the hospital,” but also
to an institution that governs the people who work in the building,
as in “Dave sued the hospital.” People are remarkably proficient at
understanding the intended sense of such sense-ambiguous words,
but it is not clear how. Here, we consider a particular category of
sense ambiguity, classed as metonymy, which is a form of figura-
tive language in which people refer to an entity (e.g., the institution
governing a hospital) by a salient property of the entity (e.g., a
hospital). More specifically, we tested how the processor accesses
the intended sense of a metonymic expression relative to its literal
alternative.
There are two broad classes of psycholinguistic models pro-
posed to explain comprehension of figurative language. We refer
to the first group as indirect access. In these models, the literal
sense is retrieved prior to the retrieval of the metonymic sense. For
example, in the literal-first model (Grice, 1975; Searle, 1975), the
figurative sense is derived only after the literal sense has proved to
be a poor fit with the general context. The second group can be
classified as direct access models.1 These assume that neither the
metonymic nor the literal sense takes priority, but instead, contex-
tual and lexical information combine to determine the intended
meaning rapidly (e.g., Frisson & Pickering, 1999; Gibbs, 1994;
Gibbs & Gerrig, 1989; Glucksberg, 2001, 2003). For our purposes,
the fundamental difference between the two categories of models
is that under an indirect account, the figurative sense requires more
serial processing stages than the literal sense, whereas under a
direct account it does not.
The majority of research has found evidence in favor of some
form of direct access model (e.g., Gerrig & Healy, 1983; Gildea &
Glucksberg, 1983; Glucksberg, Gildea & Bookin, 1982; Inhoff,
Lima & Carroll, 1984; Keysar, 1989; McElree & Nordlie, 1999).
However, these experiments have been conducted using metaphor
rather than metonymy and processing of metaphor may differ from
processing of metonymy in important ways. Indeed, experiments
testing metonymy are far less consistent in their conclusions. In
particular, Frisson and Pickering (1999) and McElree, Frisson, and
Pickering (2006), using eye-tracking, found evidence that familiar
metonymies were processed just as quickly as literal meanings—
thereby supporting direct access models of metonymy—whereas
Lowder and Gordon (2013) found that familiar metonymies were
processed more slowly than literal meanings—thereby supporting
indirect models. In this study we seek to identify why Lowder and
Gordon found slower reading times for metonymic sentences and
consequently to resolve the apparent conflict about how metonymy
is processed.
Lowder and Gordon (2013) conducted an eye-tracking while
reading study. The relevant conditions are the familiar metonymy
and literal sentences from their Experiment 1:
1 This is not to be confused with Gibbs’s direct access model (e.g.,Gibbs, 1994), according to which a specific figurative sense can be ac-cessed directly in appropriate contexts. In addition to this view, we alsoinclude models such as the underspecification hypothesis (Frisson & Pick-ering, 1999) that do not distinguish between literal and figurative senses inearly processing (for a discussion, see Frisson & Pickering, 2001).
Lewis Bott and Alice Rees, School of Psychology, Cardiff University;
Steven Frisson, School of Psychology, Birmingham University.
Correspondence concerning this article should be addressed to Lewis
Bott, School of Psychology, Cardiff University, Tower Building, Park
Place, Cardiff, CF10 3AT, United Kingdom. E-mail: [email protected]
This
docu
men
tis
copyri
ghte
dby
the
Am
eric
anP
sych
olo
gic
alA
ssoci
atio
nor
one
of
its
alli
edpubli
sher
s.
This
arti
cle
isin
tended
sole
lyfo
rth
eper
sonal
use
of
the
indiv
idual
use
ran
dis
not
tobe
dis
sem
inat
edbro
adly
.
Journal of Experimental Psychology:Learning, Memory, and Cognition
© 2015 American Psychological Association
2015, Vol. 41, No. 6, 0000278-7393/15/$12.00 http://dx.doi.org/10.1037/xlm0000218
1
AQ: au
Fn1
tapraid5/zfv-xlm/zfv-xlm/zfv00615/zfv3319d15z xppws S�1 11/14/15 10:49 Art: 2014-1856
APA NLM
1a. Sometime in August, the journalist photographed the
college after he had received an official invitation. (literal–
familiar)
1b. Sometime in August, the journalist offended the col-
lege after he had bribed some crooked officials.
(metonymic–familiar)
In (1a), college is used literally to refer to a building in which
education occurs, whereas in (1b), it is used metonymically to
refer to the governing body associated with an education estab-
lishment. Lowder and Gordon (2013) observed longer reading
times (gaze duration, right-bounded reading time and
regression-path duration) when the critical noun phrase (college
in [1]) was used metonymically compared to when it was used
literally, consistent with indirect access models. Lowder and
Gordon explained the difference between their results and those
of Frisson and Pickering (1999), who did not observe delayed
metonymic reading times with similar items, as being due to an
interaction between the sentence structure and the positioning
of the metonymy.
Our experiment was conducted to explain what caused the
increased reading times in the metonymic condition of Lowder
and Gordon (2013). One possibility, favored by Lowder and
Gordon, was that participants needed to reject the literal mean-
ing in the metonymic condition but not in the literal condition.
Thus, there were additional processing stages for the met-
onymic interpretation compared to the literal interpretation.
There are other explanations for this delay, however. One of
these is that participants made more errors of interpretation in
the metonymic condition than the literal condition. This would
have meant more repair work, such as backtracking to reread
earlier words in the metonymic condition, and consequently
more regressions or longer fixations. Some support for this
hypothesis is given by the results of Lowder and Gordon’s
(Experiment 1) norming study: They demonstrated significantly
lower plausibility ratings for the metonymic sentences than the
literal sentences.
The distinction between these explanations is important be-
cause an account based on additional serial processing supports
an indirect model of figurative language processing, whereas an
account based on overall accuracy rates does not (which will be
explained in more detail). In our experiment we measured the
time course profile of metonymy by using a speed–accuracy
trade-off (SAT) design (developed for psycholinguistics by
McElree and colleagues, e.g., McElree, 1993; McElree & Nor-
dlie, 1999; Martin & McElree, 2008). The SAT is capable of
distinguishing between slower processing caused by additional
processing stages or slower processing caused by lower accu-
racy, and hence is well suited to distinguish between the direct
and indirect model explanations for Lowder and Gordon’s
(2013) findings.
Experiment Overview
Participants made binary sensicality judgments to literal and
metonymic sentences and to nonsense sentences. However,
instead of a single response per trial, they made 16 successive
responses, timed so that they coincided with 16 deadlines
(beeps) spaced at 250-ms intervals (the multiple response SAT,
see, e.g., McElree, 1993; Martin & McElree, 2008). We then
combined responses to sense and nonsense stimuli to obtain a d=
measure for each of the 16 time points. The resulting sequence
indicates how accuracy varies as a function of time and can be
converted into separate retrieval dynamics and probability mea-
sures, as we will describe.
Following standard SAT procedure (e.g., Bott, Bailey, & Grod-
ner, 2012; McElree, 1993; McElree & Nordlie, 1999), we opti-
mized the SAT function in Equation 1 to each participant’s re-
sponses and the averaged data.
d�(t) � �(1 � e�(t��)), for t � �, else 0. (1)
Equation 1 contains three parameters. The asymptote, �, reflects
the overall accuracy of responses with maximum processing
time (3.75 s, in our experiment). The intercept, �, identifies the
earliest point at which accuracy departs from chance. The rate,
�, determines the steepness of the accuracy curve and indexes
the rate at which information is accrued. The asymptote mea-
sures the retrieval probability, because it measures the proba-
bility of accurately retrieving an interpretation on any given
trial, and the intercept and rate measure the retrieval dynamics,
because they determine how quickly a given interpretation can
be retrieved.
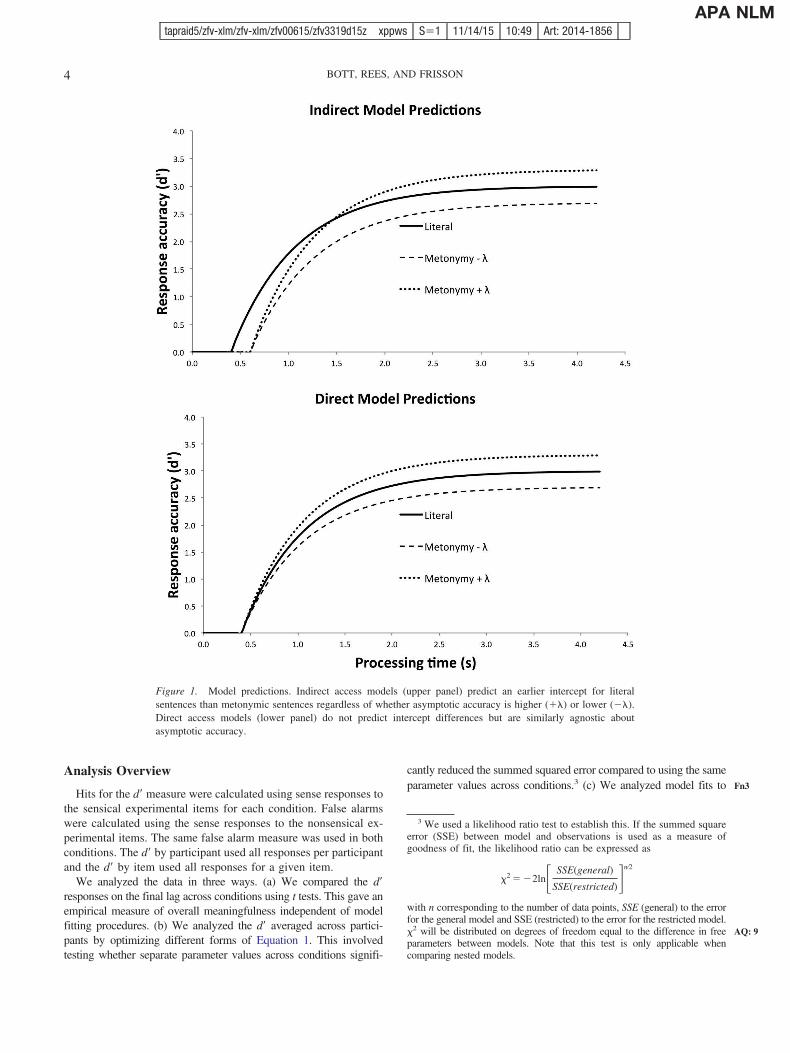
Indirect access models predict that participants cannot derive
a sensible metonymic interpretation until an anomalous literal
interpretation has been computed (see Figure 1, upper panel).
This means that the earliest time at which metonymic interpre-
tations can be derived will be later than the earliest time that
literal sentences can be derived. In other words, the intercept
will be delayed for metonymic sentences. In contrast, direct
access models predict that participants can directly access met-
onymic interpretations (see Figure 1, lower panel). Because
there is no extra processing stage for the metonymic interpre-
tations, these models do not predict different intercepts across
conditions. Both direct and indirect models can explain differ-
ences in retrieval probability (asymptotic accuracy), however.
For example, both models are consistent with a metonymic
retrieval process that has a higher error rate than the literal
retrieval process, predicting lower asymptotic accuracy for met-
onymic sentences. Similarly, both models predict that if the
metonymic sentences were less meaningful than the literal
sentences, such as if they were less plausible, metonymic sen-
tences would also have a lower asymptotic accuracy than literal
sentences. Importantly, the retrieval probability (asymptotic
accuracy) and the retrieval dynamics (intercept and rate) are
orthogonal parameters of the SAT function and so predictions
about retrieval dynamics can be assessed independently of the
contribution of retrieval probability.
We used a combination of Lowder and Gordon’s (2013)
sentences (themselves based on Frisson & Pickering, 1999) and
those we constructed ourselves. The sentences were formed by
combining a target word with either a literal, metonymic, or
nonsense sentence frame (see Table 1). We used the frames
from Lowder and Gordon (2013) and constructed novel frames
for our own target words, but made no attempt to control for
plausibility, cloze probability, or other factors that might affect
This
docu
men
tis
copyri
ghte
dby
the
Am
eric
anP
sych
olo
gic
alA
ssoci
atio
nor
one
of
its
alli
edpubli
sher
s.
This
arti
cle
isin
tended
sole
lyfo
rth
eper
sonal
use
of
the
indiv
idual
use
ran
dis
not
tobe
dis
sem
inat
edbro
adly
.
2 BOTT, REES, AND FRISSON
AQ: 1
AQ: 2
F1
T1
tapraid5/zfv-xlm/zfv-xlm/zfv00615/zfv3319d15z xppws S�1 11/14/15 10:49 Art: 2014-1856
APA NLM
asymptotic accuracy.2 All of the sentences were eight words
long. The target word was always in the argument of the verb
and was always the last word of the sentence. The sentence
frame for the nonsense sentences were chosen so that the target
word was semantically incongruent with the main verb (see
Method for more details).
According to Lowder and Gordon (2013) and indirect models of
metonymy, placing the metonymy in the argument should engen-
der slower retrieval dynamics for the metonymic sentences relative
to the literal controls. Although retrieval probability does not
distinguish between direct and indirect models, differences be-
tween literal and metonymic conditions might explain why
Lowder and Gordon observed reaction time differences in their
study. We therefore analyzed retrieval probability (asymptotic
accuracy) as well as retrieval dynamics (the rate and intercept).
Method
Participants
Thirty-two Cardiff University students participated for course
credit.
Stimuli and Design
We used the same 16 target words as Lowder and Gordon
(2013) as well as 24 novel target words, to make 40 in total (see
Appendix). Six experimental sentences were generated from each
target: two metonymic, two literal, and two nonsense versions (see
Table 1). All sentences were eight words long and ended with the
target word. The target word was always in the argument of the
verb. Our versions of Lowder and Gordon’s sentences were iden-
tical to the originals except that they were cut short to end with the
target word.
The target word in the nonsense sentences violated the subcat-
egorization constraints of the main verb but made sense up until
the target word. More specifically, the nonsense strings were
unacceptable because of the incompatibility between the thematic
role associated with the verb and the thematic role of the target
word. For example, “One Friday morning, the students down-
loaded the garage,” was unacceptable because “garage” does not
fit the thematic role associated with “download.”
All participants saw each target word in the literal and the
metonymic condition, but different frames were used for a single
participant. Participants also saw each target word in the two
nonsense conditions. Participants thus saw each target word four
times, once in a literal sense, once in a metonymic sense and twice
in the nonsense form. The assignment of item to frame was
counterbalanced across participants in two lists.
The sentences were presented in a different random order for
each participant with the constraint that they saw a sense and a
nonsense version of each target within each half of the experiment.
For half the items, the literal sentence appeared first and the
metonymic sentence second, and for the other half, the metonymic
sentence appeared first and the literal sentence second. The as-
signment of item to order of appearance was counterbalanced so
that across participants, the literal and the metonymic version of
each item appeared in the first half of the experiment equally often.
In addition to the 160 experimental sentences, there were 180
filler sentences, half of which were sensical and half nonsensical,
randomly interspersed with the experimental sentences. These
were from an unrelated experiment. Finally, there were 200 prac-
tice sentences that participants completed before progressing onto
the main experiment. The practice sentences were needed to fa-
miliarize the participant with the SAT procedure.
Procedure
Sentences were presented one word at a time at a rate of 300 ms
per word. Starting at 250 ms prior to the onset of the final word,
16 consecutive beeps were played, 250 ms apart. Participants had
to respond to each of the beeps by pressing either a sense key or
a nonsense key on a standard keyboard. This generated a sequence
of 16 responses per trial. If a participant failed to respond enough
times on a given trial, or if they did not respond before the second
beep of the series, they received feedback instructing them to change
their behavior. Otherwise they received a message saying, “Perfect
timing.” Trials were separated by a fixation cross lasting 1 s.
Participants were instructed to start by pressing either the sense
key or the nonsense key before the presentation of each sentence
(see, e.g., Foraker & McElree, 2007). The assignment of sentence
to start key was randomized. If participants started with the incor-
rect key they received corrective feedback.
Participants completed a practice phase and a test phase. In the
practice phase (45 min), they received feedback on their accuracy
and their timing. In the subsequent test phase (1 h 15 min), the
accuracy feedback was removed.
Results
Data Cleaning
Two participants were removed because their asymptotic d=
scores were lower than 1. We also removed one item for the same
reasons (closer inspection revealed that this was because of a
typographic error, as shown in Item 15, Appendix).
2 One of the advantages of SAT is that it is not necessary to equatesentence meaningfulness across conditions in order to make claims aboutretrieval dynamics, and so we did not try to do so here (see McElree &Nordlie, 1999, Footnote 2, for a similar point). In SAT, differences inmeaningfulness would be reflected in retrieval probability and not in theretrieval dynamics. To see this, consider the following two scenarios. In thefirst, assume that metonymic sentences are 10% less plausible than literalcontrols but there are no other processing differences. This would meanthat interpretation judgments would be 10% less accurate for the met-onymic sentences than the literal sentences at the maximum time delay, sayd= � 4.5 versus d= � 5 (� would be 10% lower). At smaller time intervals,there would still be a 10% difference in plausibility but the absolutedifference in d= would drop, say to d= � 2.7 versus d= � 3 at half themaximum time delay, and continue dropping until the curve hits the x-axis,at which point there would be no absolute difference between the twoconditions (because 10% of zero is zero). Even though there is a 10%difference in asymptotic accuracy, there would be no difference at theintercept. Thus, the drop in accuracy between conditions would be propor-tional with time. In the second scenario, assume that metonymic sentencesare also 10% less plausible, but moreover, assume that there is an extraprocessing stage for metonymic sentences lasting 200 ms. In this situation,there would still be 10% lower accuracy rates at the maximum time delaybut the intercept would be 200 ms earlier in the literal condition.
This
docu
men
tis
copyri
ghte
dby
the
Am
eric
anP
sych
olo
gic
alA
ssoci
atio
nor
one
of
its
alli
edpubli
sher
s.
This
arti
cle
isin
tended
sole
lyfo
rth
eper
sonal
use
of
the
indiv
idual
use
ran
dis
not
tobe
dis
sem
inat
edbro
adly
.
3TIME COURSE OF FAMILIAR METONYMY
Fn2
AQ: 3
tapraid5/zfv-xlm/zfv-xlm/zfv00615/zfv3319d15z xppws S�1 11/14/15 10:49 Art: 2014-1856
APA NLM
Analysis Overview
Hits for the d= measure were calculated using sense responses to
the sensical experimental items for each condition. False alarms
were calculated using the sense responses to the nonsensical ex-
perimental items. The same false alarm measure was used in both
conditions. The d= by participant used all responses per participant
and the d= by item used all responses for a given item.
We analyzed the data in three ways. (a) We compared the d=
responses on the final lag across conditions using t tests. This gave an
empirical measure of overall meaningfulness independent of model
fitting procedures. (b) We analyzed the d= averaged across partici-
pants by optimizing different forms of Equation 1. This involved
testing whether separate parameter values across conditions signifi-
cantly reduced the summed squared error compared to using the same
parameter values across conditions.3 (c) We analyzed model fits to
3 We used a likelihood ratio test to establish this. If the summed squareerror (SSE) between model and observations is used as a measure ofgoodness of fit, the likelihood ratio can be expressed as
�2 � �2ln� SSE(general)
SSE(restricted)�n⁄2
with n corresponding to the number of data points, SSE (general) to the errorfor the general model and SSE (restricted) to the error for the restricted model.�2 will be distributed on degrees of freedom equal to the difference in freeparameters between models. Note that this test is only applicable whencomparing nested models.
Figure 1. Model predictions. Indirect access models (upper panel) predict an earlier intercept for literal
sentences than metonymic sentences regardless of whether asymptotic accuracy is higher (��) or lower (��).
Direct access models (lower panel) do not predict intercept differences but are similarly agnostic about
asymptotic accuracy.
This
docu
men
tis
copyri
ghte
dby
the
Am
eric
anP
sych
olo
gic
alA
ssoci
atio
nor
one
of
its
alli
edpubli
sher
s.
This
arti
cle
isin
tended
sole
lyfo
rth
eper
sonal
use
of
the
indiv
idual
use
ran
dis
not
tobe
dis
sem
inat
edbro
adly
.
4 BOTT, REES, AND FRISSON
Fn3
AQ: 9
tapraid5/zfv-xlm/zfv-xlm/zfv00615/zfv3319d15z xppws S�1 11/14/15 10:49 Art: 2014-1856
APA NLM
individual participants. Here, we optimized Equation 1 to each par-
ticipant’s responses and tested the mean parameter values across
conditions using inferential statistics. Because analyses (a) and (b)
revealed that d= differed significantly across conditions, we restricted
ourselves to models in which two � parameters were needed (i.e.,
2�-1�-1�, 2�-1�-2�, 2�-2�-1�, and 2�-2�-2�). We applied these
three analyses to the combined set of items, the Lowder and Gordon
(2013) items alone, and the novel items alone.
Analysis
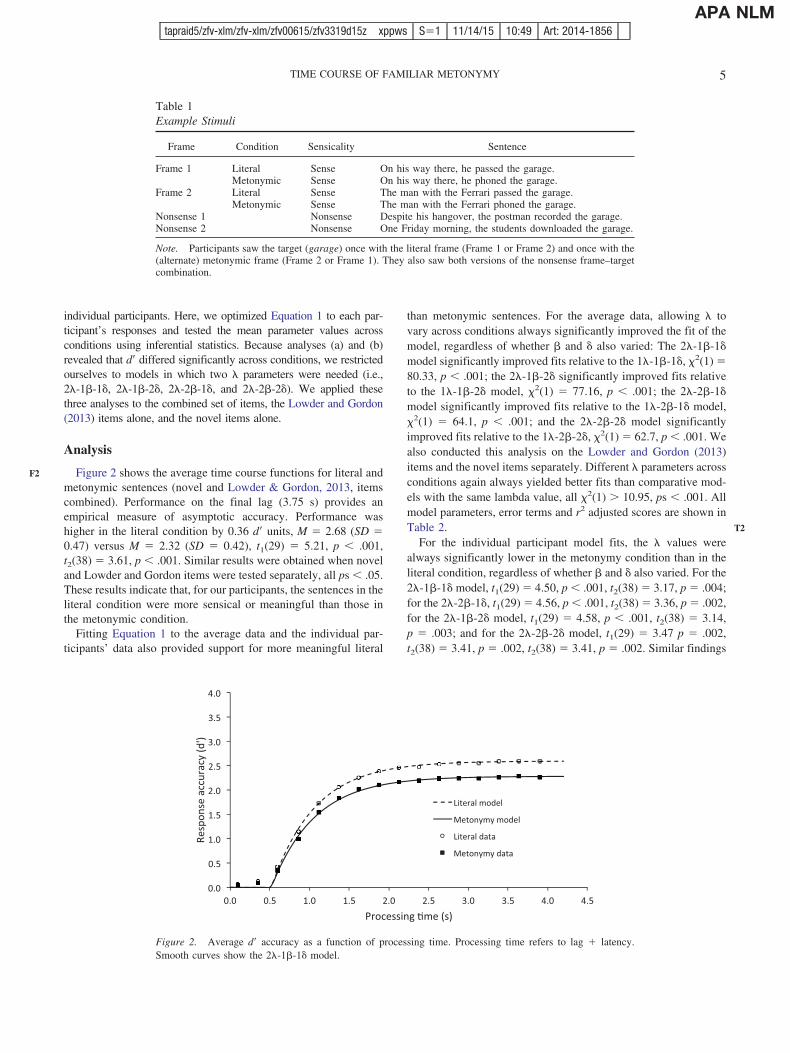
Figure 2 shows the average time course functions for literal and
metonymic sentences (novel and Lowder & Gordon, 2013, items
combined). Performance on the final lag (3.75 s) provides an
empirical measure of asymptotic accuracy. Performance was
higher in the literal condition by 0.36 d= units, M � 2.68 (SD �
0.47) versus M � 2.32 (SD � 0.42), t1(29) � 5.21, p .001,
t2(38) � 3.61, p .001. Similar results were obtained when novel
and Lowder and Gordon items were tested separately, all ps .05.
These results indicate that, for our participants, the sentences in the
literal condition were more sensical or meaningful than those in
the metonymic condition.
Fitting Equation 1 to the average data and the individual par-
ticipants’ data also provided support for more meaningful literal
than metonymic sentences. For the average data, allowing � to
vary across conditions always significantly improved the fit of the
model, regardless of whether � and � also varied: The 2�-1�-1�
model significantly improved fits relative to the 1�-1�-1�, �2(1) �
80.33, p .001; the 2�-1�-2� significantly improved fits relative
to the 1�-1�-2� model, �2(1) � 77.16, p .001; the 2�-2�-1�
model significantly improved fits relative to the 1�-2�-1� model,
�2(1) � 64.1, p .001; and the 2�-2�-2� model significantly
improved fits relative to the 1�-2�-2�, �2(1) � 62.7, p .001. We
also conducted this analysis on the Lowder and Gordon (2013)
items and the novel items separately. Different � parameters across
conditions again always yielded better fits than comparative mod-
els with the same lambda value, all �2(1) 10.95, ps .001. All
model parameters, error terms and r2 adjusted scores are shown in
Table 2.
For the individual participant model fits, the � values were
always significantly lower in the metonymy condition than in the
literal condition, regardless of whether � and � also varied. For the
2�-1�-1� model, t1(29) � 4.50, p .001, t2(38) � 3.17, p � .004;
for the 2�-2�-1�, t1(29) � 4.56, p .001, t2(38) � 3.36, p � .002,
for the 2�-1�-2� model, t1(29) � 4.58, p .001, t2(38) � 3.14,
p � .003; and for the 2�-2�-2� model, t1(29) � 3.47 p � .002,
t2(38) � 3.41, p � .002, t2(38) � 3.41, p � .002. Similar findings
Table 1
Example Stimuli
Frame Condition Sensicality Sentence
Frame 1 Literal Sense On his way there, he passed the garage.Metonymic Sense On his way there, he phoned the garage.
Frame 2 Literal Sense The man with the Ferrari passed the garage.Metonymic Sense The man with the Ferrari phoned the garage.
Nonsense 1 Nonsense Despite his hangover, the postman recorded the garage.Nonsense 2 Nonsense One Friday morning, the students downloaded the garage.
Note. Participants saw the target (garage) once with the literal frame (Frame 1 or Frame 2) and once with the(alternate) metonymic frame (Frame 2 or Frame 1). They also saw both versions of the nonsense frame–targetcombination.
0.0
0.5
1.0
1.5
2.0
2.5
3.0
3.5
4.0
0.0 0.5 1.0 1.5 2.0 2.5 3.0 3.5 4.0 4.5
Response
accuracy
(d')
Processing me (s)
Literal model
Metonymy model
Literal data
Metonymy data
Figure 2. Average d= accuracy as a function of processing time. Processing time refers to lag � latency.
Smooth curves show the 2�-1�-1� model.
This
docu
men
tis
copyri
ghte
dby
the
Am
eric
anP
sych
olo
gic
alA
ssoci
atio
nor
one
of
its
alli
edpubli
sher
s.
This
arti
cle
isin
tended
sole
lyfo
rth
eper
sonal
use
of
the
indiv
idual
use
ran
dis
not
tobe
dis
sem
inat
edbro
adly
.
5TIME COURSE OF FAMILIAR METONYMY
F2
T2
tapraid5/zfv-xlm/zfv-xlm/zfv00615/zfv3319d15z xppws S�1 11/14/15 10:49 Art: 2014-1856
APA NLM
obtained when we conducted the analysis on the novel and Lowder
and Gordon (2013) items separately, all ts 2.33, all ps .05.
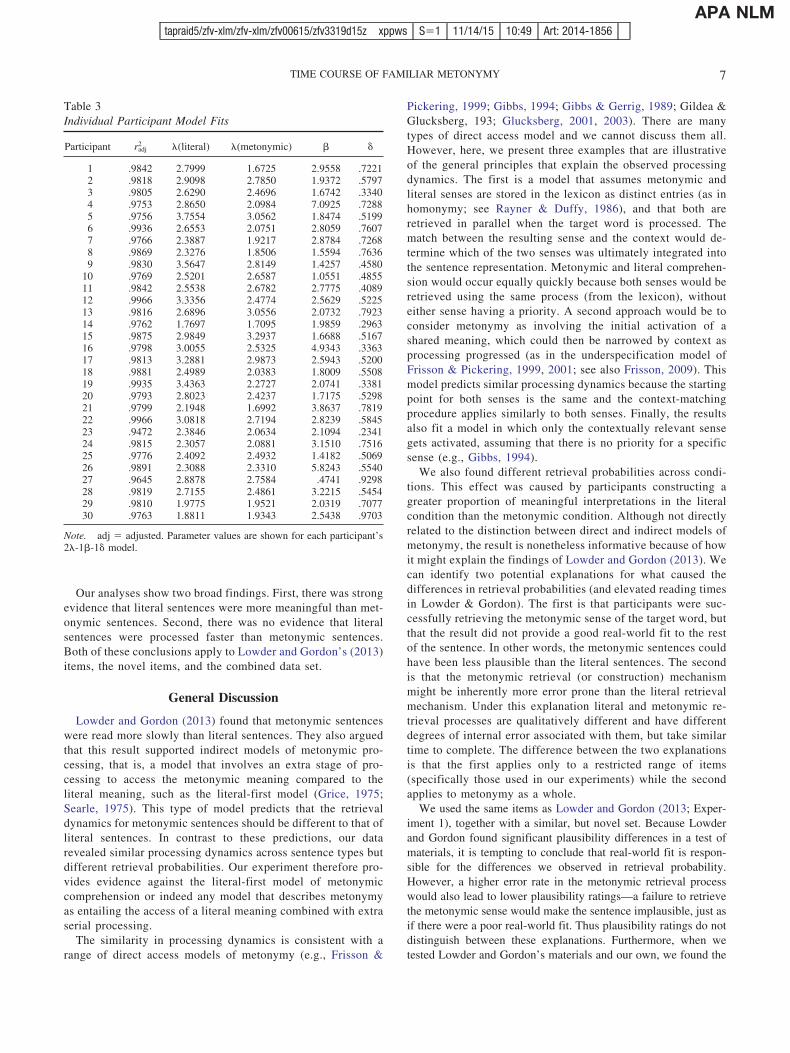
Table 3 shows parameter values for the individual participant
2�-1�-1� models.
In summary, analysis of the empirical d=, the average data model
fits, and the individual participant model fits all indicate that the
literal sentences were more meaningful than the metonymic sen-
tences. Furthermore, we found these effects both when we ana-
lyzed the novel and Lowder and Gordon (2013) items combined,
and when we analyzed the item sets separately.
These analyses indicate that the retrieval function for literal and
metonymic sentences requires different asymptotic accuracy pa-
rameters. In contrast, there was no evidence of other differences in
the retrieval function. For the average data, there were no 2�
models for which the addition of varying � or � parameters
improved model fits. Neither the 2�-1�-2� nor the 2�-2�-1�
models significantly reduced error relative to the 2�-1�-1� model,
�2 1, nor did the 2�-2�-2� model significantly reduce error
relative to the 2�-2�-1� or the 2�-1�-2� model, �2 1. The same
results were observed when considering the novel and Lowder and
Gordon (2013) items separately, all �2 1. Overall then, there was
no evidence that different � or � parameters across conditions were
needed to model the average data (a similar conclusion can be
reached by considering the r2-adjusted scores shown in Table 2).
For the individual participant data fits, neither intercept nor rate
varied systematically across conditions (for models in which �
varied). For the 2�-2�-1� and the 2�-1�-2� models, all ts 1. For
2�-2�-2�, rates were slightly slower in the literal condition than
the metonymic condition, with average 1/� rates of 666 � 189 ms
(M � SE) for the literal condition and 458 � 43 ms in the
metonymic condition, t1(29) � 1.27, p � .21, t2 1, but intercepts
were somewhat earlier, 567 � 28 ms versus 595 � 37 ms, t1(29) �
1.57, p � .13, t2 1. When rate and intercept were combined to
form a composite measure of processing speed to avoid parameter
tradeoffs (� � 1/ �) processing was nonsignificantly slower for the
literal sentences, 1,233 � 198 ms versus 1,053 � 59 ms, t1(29) �
1.16, p � .26, t2 1.
The same general pattern was observed for the novel and
Lowder and Gordon (2013) items. For the novel items, there were
no significant differences in rate or intercept for the 2�-2�-1�,
2�-2�-1�, and 2�-2�-2� fits, all ts 1. For the Lowder and
Gordon items, there were no significant rate differences, ts 1,
but there was some evidence of later intercepts for the literal
sentences. The 2�-1�-2� fits resulted in significantly later inter-
cepts in the items analysis, t2(15) � 2.19, p � .045, but not the
subjects analysis, t1 1, and for the 2�-2�-2� fits, the intercept
effect was significant in both analyses, 427 � 66 ms versus 286 �
61 ms, t1(29) � 2.11, p � .044, t2(15) � 3.52, p � .003.
Importantly, the intercept differences were in the opposite direc-
tion to the predictions of indirect models. Moreover, when the
composite measure of processing speed was considered, these
differences disappeared, ts 1.
Table 2
Averaged Participants Model Fits
Literal Metonymic
Model r2(adj) � � � � � � SSE
All items1�-1�-1� .9746 2.4373 1.8343 .5180 2.4373 1.8343 .5180 .56382�-1�-1� .9979 2.5939 1.8309 .5176 2.2817 1.8309 .5176 .04581�-2�-1� .9843 2.4693 2.0506 .5077 2.4693 1.4139 .5077 .33661�-1�-2� .9763 2.4445 1.7874 .4764 2.4445 1.7874 .5469 .50832�-2�-1� .9978 2.5975 1.8142 .5176 2.2777 1.8523 .5176 .04542�-1�-2� .9978 2.5930 1.8311 .5159 2.2826 1.8311 .5198 .04561�-2�-2� .9849 2.4808 2.1139 .5290 2.4808 1.2841 .4547 .31292�-2�-2� .9978 2.6005 1.7853 .5107 2.2747 1.8892 .5258 .0441
L&G only1�-1�-1� .9283 2.2973 1.8942 .4581 2.2973 1.8942 .4581 1.16552�-1�-1� .9759 2.4870 1.8933 .4584 2.1082 1.8933 .4584 .37851�-2�-1� .9534 2.4205 1.5296 .2813 2.4205 .9730 .2813 .73041�-1�-2� .9339 2.3374 1.5468 .2916 2.3374 1.5468 .4568 1.03632�-2�-1� .9750 2.4916 1.8694 .4586 2.1026 1.9302 .4586 .37772�-1�-2� .9750 2.4892 1.8932 .4631 2.1056 1.8932 .4519 .37751�-2�-2� .9618 2.4063 2.1630 .4816 2.4063 .8972 .1868 .57832�-2�-2� .9754 2.4903 1.8843 .4619 2.1576 1.3640 .2821 .3583
Novel only1�-1�-1� .9840 2.5337 1.7962 .5522 2.5337 1.7962 .5522 .42932�-1�-1� .9973 2.6655 1.7924 .5516 2.4029 1.7924 .5516 .06981�-2�-1� .9893 2.5529 1.9944 .5471 2.5529 1.4916 .5471 .27771�-1�-2� .9851 2.5381 1.7710 .5210 2.5381 1.7710 .5772 .38582�-2�-1� .9972 2.6710 1.7692 .5516 2.3972 1.8198 .5516 .06902�-1�-2� .9973 2.6632 1.7931 .5473 2.4052 1.7931 .5569 .06861�-2�-2� .9890 2.5557 2.0182 .5550 2.5557 1.4504 .5322 .27402�-2�-2� .9973 2.6762 1.7247 .5404 2.3928 1.8711 .5638 .0646
Note. L&G � Lowder and Gordon (2013); adj � adjusted; SSE � summed squared error. The three sectionsof the table refer to the analysis based on the combined items, L&G items only, and the novel items only.Parameter values are shown for each model type. Where the model assigns only one parameter across twoconditions, the same parameter value is shown in both cells of the table.
This
docu
men
tis
copyri
ghte
dby
the
Am
eric
anP
sych
olo
gic
alA
ssoci
atio
nor
one
of
its
alli
edpubli
sher
s.
This
arti
cle
isin
tended
sole
lyfo
rth
eper
sonal
use
of
the
indiv
idual
use
ran
dis
not
tobe
dis
sem
inat
edbro
adly
.
6 BOTT, REES, AND FRISSON
T3
tapraid5/zfv-xlm/zfv-xlm/zfv00615/zfv3319d15z xppws S�1 11/14/15 10:49 Art: 2014-1856
APA NLM
Our analyses show two broad findings. First, there was strong
evidence that literal sentences were more meaningful than met-
onymic sentences. Second, there was no evidence that literal
sentences were processed faster than metonymic sentences.
Both of these conclusions apply to Lowder and Gordon’s (2013)
items, the novel items, and the combined data set.
General Discussion
Lowder and Gordon (2013) found that metonymic sentences
were read more slowly than literal sentences. They also argued
that this result supported indirect models of metonymic pro-
cessing, that is, a model that involves an extra stage of pro-
cessing to access the metonymic meaning compared to the
literal meaning, such as the literal-first model (Grice, 1975;
Searle, 1975). This type of model predicts that the retrieval
dynamics for metonymic sentences should be different to that of
literal sentences. In contrast to these predictions, our data
revealed similar processing dynamics across sentence types but
different retrieval probabilities. Our experiment therefore pro-
vides evidence against the literal-first model of metonymic
comprehension or indeed any model that describes metonymy
as entailing the access of a literal meaning combined with extra
serial processing.
The similarity in processing dynamics is consistent with a
range of direct access models of metonymy (e.g., Frisson &
Pickering, 1999; Gibbs, 1994; Gibbs & Gerrig, 1989; Gildea &
Glucksberg, 193; Glucksberg, 2001, 2003). There are many
types of direct access model and we cannot discuss them all.
However, here, we present three examples that are illustrative
of the general principles that explain the observed processing
dynamics. The first is a model that assumes metonymic and
literal senses are stored in the lexicon as distinct entries (as in
homonymy; see Rayner & Duffy, 1986), and that both are
retrieved in parallel when the target word is processed. The
match between the resulting sense and the context would de-
termine which of the two senses was ultimately integrated into
the sentence representation. Metonymic and literal comprehen-
sion would occur equally quickly because both senses would be
retrieved using the same process (from the lexicon), without
either sense having a priority. A second approach would be to
consider metonymy as involving the initial activation of a
shared meaning, which could then be narrowed by context as
processing progressed (as in the underspecification model of
Frisson & Pickering, 1999, 2001; see also Frisson, 2009). This
model predicts similar processing dynamics because the starting
point for both senses is the same and the context-matching
procedure applies similarly to both senses. Finally, the results
also fit a model in which only the contextually relevant sense
gets activated, assuming that there is no priority for a specific
sense (e.g., Gibbs, 1994).
We also found different retrieval probabilities across condi-
tions. This effect was caused by participants constructing a
greater proportion of meaningful interpretations in the literal
condition than the metonymic condition. Although not directly
related to the distinction between direct and indirect models of
metonymy, the result is nonetheless informative because of how
it might explain the findings of Lowder and Gordon (2013). We
can identify two potential explanations for what caused the
differences in retrieval probabilities (and elevated reading times
in Lowder & Gordon). The first is that participants were suc-
cessfully retrieving the metonymic sense of the target word, but
that the result did not provide a good real-world fit to the rest
of the sentence. In other words, the metonymic sentences could
have been less plausible than the literal sentences. The second
is that the metonymic retrieval (or construction) mechanism
might be inherently more error prone than the literal retrieval
mechanism. Under this explanation literal and metonymic re-
trieval processes are qualitatively different and have different
degrees of internal error associated with them, but take similar
time to complete. The difference between the two explanations
is that the first applies only to a restricted range of items
(specifically those used in our experiments) while the second
applies to metonymy as a whole.
We used the same items as Lowder and Gordon (2013; Exper-
iment 1), together with a similar, but novel set. Because Lowder
and Gordon found significant plausibility differences in a test of
materials, it is tempting to conclude that real-world fit is respon-
sible for the differences we observed in retrieval probability.
However, a higher error rate in the metonymic retrieval process
would also lead to lower plausibility ratings—a failure to retrieve
the metonymic sense would make the sentence implausible, just as
if there were a poor real-world fit. Thus plausibility ratings do not
distinguish between these explanations. Furthermore, when we
tested Lowder and Gordon’s materials and our own, we found the
Table 3
Individual Participant Model Fits
Participant radj2 �(literal) �(metonymic) � �
1 .9842 2.7999 1.6725 2.9558 .72212 .9818 2.9098 2.7850 1.9372 .57973 .9805 2.6290 2.4696 1.6742 .33404 .9753 2.8650 2.0984 7.0925 .72885 .9756 3.7554 3.0562 1.8474 .51996 .9936 2.6553 2.0751 2.8059 .76077 .9766 2.3887 1.9217 2.8784 .72688 .9869 2.3276 1.8506 1.5594 .76369 .9830 3.5647 2.8149 1.4257 .4580
10 .9769 2.5201 2.6587 1.0551 .485511 .9842 2.5538 2.6782 2.7775 .408912 .9966 3.3356 2.4774 2.5629 .522513 .9816 2.6896 3.0556 2.0732 .792314 .9762 1.7697 1.7095 1.9859 .296315 .9875 2.9849 3.2937 1.6688 .516716 .9798 3.0055 2.5325 4.9343 .336317 .9813 3.2881 2.9873 2.5943 .520018 .9881 2.4989 2.0383 1.8009 .550819 .9935 3.4363 2.2727 2.0741 .338120 .9793 2.8023 2.4237 1.7175 .529821 .9799 2.1948 1.6992 3.8637 .781922 .9966 3.0818 2.7194 2.8239 .584523 .9472 2.3846 2.0634 2.1094 .234124 .9815 2.3057 2.0881 3.1510 .751625 .9776 2.4092 2.4932 1.4182 .506926 .9891 2.3088 2.3310 5.8243 .554027 .9645 2.8878 2.7584 .4741 .929828 .9819 2.7155 2.4861 3.2215 .545429 .9810 1.9775 1.9521 2.0319 .707730 .9763 1.8811 1.9343 2.5438 .9703
Note. adj � adjusted. Parameter values are shown for each participant’s2�-1�-1� model.
This
docu
men
tis
copyri
ghte
dby
the
Am
eric
anP
sych
olo
gic
alA
ssoci
atio
nor
one
of
its
alli
edpubli
sher
s.
This
arti
cle
isin
tended
sole
lyfo
rth
eper
sonal
use
of
the
indiv
idual
use
ran
dis
not
tobe
dis
sem
inat
edbro
adly
.
7TIME COURSE OF FAMILIAR METONYMY
tapraid5/zfv-xlm/zfv-xlm/zfv00615/zfv3319d15z xppws S�1 11/14/15 10:49 Art: 2014-1856
APA NLM
reverse result to Lowder and Gordon: Metonymic items were
judged as more plausible than the literal items.4 Thus, attempts to
separate metonymic error from plausibility would have to involve
a series of carefully designed interpretation questions all con-
ducted on the same participants.
Lowder and Gordon (2013) argued that sentence structure
affects the processing of metonymy. Although our results do not
directly address this issue, they are nonetheless informative. In
their Experiment 1, Lowder and Gordon used sentences like
those in (a), in which the critical noun phrase (the college) was
an argument of the verb (photographed/offended) and observed
longer reading times for metonymic sentences compared to
literal sentences. They contrasted these results with those of
Frisson and Pickering (1999), who sometimes placed the criti-
cal noun phrase in an adjunct (e.g., “The bright boy was
rejected by the college”) or a prepositional phrase, rather than
in the argument of the verb, and who did not observe extensive
early reading time delays. Lowder and Gordon (2013) argued
that the discrepant results were because Frisson and Pickering’s
(1999) sentence structure did not encourage deep enough pro-
cessing of the metonymy. Their Experiment 2 produced further
evidence that the sentence structure affects the depth of meton-
ymy processing.
Our results suggest that sentence structure does not affect
speed of metonymy processing. If it did, we would have ob-
served retrieval processing delays for metonymic sentences,
because according to Lowder and Gordon (2013), greater depth
of processing leads to slower processing of the metonymy.
However, it is possible that sentence structure alters the prob-
ability that a sensible interpretation of the metonymy is re-
trieved. This prediction would be consistent with Lowder and
Gordon’s data and our own. However, further experiments
directly comparing sentence structure using SAT would be
required to address this issue.
Conclusion
Our data have demonstrated that while there are significant
retrieval probability differences between metonymic and literal
sentences, there are no dynamics differences, contrary to recent
claims by Lowder and Gordon (2013) in support of indirect access
models of metonymy. More generally, our findings add to a
growing body of work suggesting that deferred interpretations,
such as metonymy, are not computationally costly per se (cf.
Nunberg, 2004); differences in processing time, where they are
found, reflect either a difficulty in retrieving an appropriate
interpretation or additional compositional work unrelated to the
deferred interpretation itself (as in the logical metonymies of
McElree et al., 2006).
4 We asked 50 participants to rate the plausibility of our novel items andthose of Lowder and Gordon (2013). The items were counterbalancedacross two lists and we included implausible filler sentences. We used thesame question as Lowder and Gordon, “How likely are the events shownin the sentence?” and the same 1–7 ratings scale. Each item was presentedon a separate screen and in a different random order for each participant.Participants were recruited online using Prolific Academic, and were paid($1.5). We found significantly greater plausibility for the metonymic itemsthan the literal items, novel: Mmet � 5.48 (SD � 0.77) versus Mlit � 5.13(SD � 0.73) versus Mfiller � 2.52 (SD � 0.50), all pairwise ps .001;
Lowder and Gordon: Mmet � 5.08 (SD � 0.75) versus Mlit � 4.53 (SD �
0.76) versus Mfiller � 2.33 (SD � 0.56), all pairwise ps .001. This effectis in the reverse direction to Lowder and Gordon. We were so surprised bythis that we conducted another ratings experiment, with a different set of 50participants, in which we asked participants to make sensicality judgments,mirroring the question asked in the SAT, together with the SAT filleritems. Our findings were consistent with those of the plausibility experi-ment: metonymic sentences were rated as being more sensible than literalsentences, novel: Mmet� 6.02 (SD � 0.81) versus Mlit� 5.57 (SD � 0.74)versus Mfiller � 2.04 (SD � 0.95), all pairwise ps .001; Lowder andGordon: Mmet� 5.82 (SD � 0.81) versus Mlit� 5.03 (SD � 0.73) versusMfiller � 1.90 (SD � 1.11), all pairwise ps .001. Our conclusion from thedisparity in results is that the meaningfulness of these materials variesgreatly with the particular sample being tested. Fortunately, overall mean-ingfulness and retrieval dynamics are measured within the same participantin SAT and so conclusions about retrieval dynamics can be made withoutfear of the sampling difficulties highlighted here.
References
Bott, L., Bailey, T. M., & Grodner, D. (2012). Distinguishing speed from
accuracy in scalar implicatures. Journal of Memory and Language, 66,
123–142. http://dx.doi.org/10.1016/j.jml.2011.09.005
Foraker, S., & McElree, B. (2007). The role of prominence in pronoun
resolution: Availability versus accessibility. Journal of Memory and
Language, 56, 357–383. http://dx.doi.org/10.1016/j.jml.2006.07.004
Frisson, S. (2009). Semantic underspecification in language processing.
Language and Linguistics Compass, 3, 111–127. http://dx.doi.org/10
.1111/j.1749-818X.2008.00104.x
Frisson, S., & Pickering, M. J. (1999). The processing of metonymy:
Evidence from eye movements. Journal of Experimental Psychology:
Learning, Memory, and Cognition, 25, 1366–1383. http://dx.doi.org/10
.1037/0278-7393.25.6.1366
Frisson, S., & Pickering, M. J. (2001). Figurative language processing in
the underspecification model. Metaphor and Symbol, 16, 149–171.
http://dx.doi.org/10.1080/10926488.2001.9678893
Gerrig, R. J., & Healy, A. (1983). Dual process in metaphor understanding:
Comprehension and appreciation. Journal of Experimental Psychology:
Learning, Memory, and Cognition, 9, 667–675. http://dx.doi.org/10
.1037/0278-7393.9.4.667
Gibbs, R. W. (1994). The poetics of mind: Figurative thought, language,
and understanding. New York, NY: Cambridge University Press.
Gibbs, R. W., Jr., & Gerrig, R. J. (1989). How context makes metaphor
comprehension seem “special.” Metaphor & Symbolic Activity, 4, 145–
158. http://dx.doi.org/10.1207/s15327868ms0403_3
Gildea, P., & Glucksberg, S. (1983). On understanding metaphor: The role
of context. Journal of Verbal Learning & Verbal Behavior, 22, 577–590.
http://dx.doi.org/10.1016/S0022-5371(83)90355-9
Glucksberg, S. (2001). Understanding figurative language: From meta-
phors to idioms. New York, NY: Oxford University Press. http://dx.doi
.org/10.1093/acprof:oso/9780195111095.001.0001
Glucksberg, S. (2003). The psycholinguistics of metaphor. Trends in
Cognitive Sciences, 7, 92–96. http://dx.doi.org/10.1016/S1364-
6613(02)00040-2
Glucksberg, S., Gildea, P., & Bookin, H. B. (1982). On understanding
nonliteral speech: Can people ignore metaphors? Journal of Verbal
Learning & Verbal Behavior, 21, 85–98. http://dx.doi.org/10.1016/
S0022-5371(82)90467-4
Grice, H. P. (1975). Logic and conversation. In P. Cole & J. L. Morgan
(Eds.), Syntax and semantics (Vol. 3, pp. 41–58). New York, NY:
Academic Press.
Inhoff, A. W., Lima, S. D., & Carroll, P. J. (1984). Contextual effects on
metaphor comprehension in reading. Memory & Cognition, 12, 558–
567. http://dx.doi.org/10.3758/BF03213344
This
docu
men
tis
copyri
ghte
dby
the
Am
eric
anP
sych
olo
gic
alA
ssoci
atio
nor
one
of
its
alli
edpubli
sher
s.
This
arti
cle
isin
tended
sole
lyfo
rth
eper
sonal
use
of
the
indiv
idual
use
ran
dis
not
tobe
dis
sem
inat
edbro
adly
.
8 BOTT, REES, AND FRISSON
Fn4
AQ: 10
tapraid5/zfv-xlm/zfv-xlm/zfv00615/zfv3319d15z xppws S�1 11/14/15 10:49 Art: 2014-1856
APA NLM
Keysar, B. (1989). On the functional equivalence of literal and metaphor-
ical interpretations in discourse. Journal of Memory and Language, 28,
375–385. http://dx.doi.org/10.1016/0749-596X(89)90017-X
Lowder, M. W., & Gordon, P. C. (2013). It’s hard to offend the college:
Effects of sentence structure on figurative-language processing. Journal
of Experimental Psychology: Learning, Memory, and Cognition, 39,
993–1011. http://dx.doi.org/10.1037/a0031671
Martin, A. E., & McElree, B. (2008). A content-addressable pointer un-
derlies comprehension of verb-phrase ellipsis. Journal of Memory and
Language, 58, 879–906. http://dx.doi.org/10.1016/j.jml.2007.06.010
McElree, B. (1993). The locus of lexical preference effects in sentence
comprehension: A time-course analysis. Journal of Memory and Lan-
guage, 32, 536–571. http://dx.doi.org/10.1006/jmla.1993.1028
McElree, B., Frisson, S., & Pickering, M. J. (2006). Deferred interpre-
tations: Why starting Dickens is taxing but reading Dickens isn’t.
Cognitive Science, 30, 181–192. http://dx.doi.org/10.1207/
s15516709cog0000_49
McElree, B., & Nordlie, J. (1999). Literal and figurative interpretations are
computed in equal time. Psychonomic Bulletin & Review, 6, 486–494.
http://dx.doi.org/10.3758/BF03210839
Nunberg, G. (2004). The pragmatics of deferred interpretation. In L. Horn
& G. Ward (Eds.), Handbook of pragmatics (pp. 344–364). Oxford,
England: Blackwell.
Rayner, K., & Duffy, S. A. (1986). Lexical complexity and fixation times
in reading: Effects of word frequency, verb complexity, and lexical
ambiguity. Memory & Cognition, 14, 191–201. http://dx.doi.org/10
.3758/BF03197692
Searle, J. R. (1975). Indirect speech acts. In P. Cole & J. L. Morgan (Eds.),
Syntax and semantics (Vol. 3, pp. 59–82). New York, NY: Academic
Press.
Appendix
Experimental Materials
Items used in Experiment 2 (in addition to those used by Lowder
& Gordon, 2013). Lines 1 and 3 of each item are the metonymic
sentences and 2 and 4 are the literal sentences. Lines 5 and 6 are
nonsense sentences.
1. Last week, the elderly man upset the monastery.
Last week, the elderly man locked the monastery.
Swearing loudly, the drunken soldier upset the monas-
tery.
Swearing loudly, the drunken soldier locked the mon-
astery.
One Tuesday morning, the Russian pulled the monas-
tery.
After his dinner, the snake digested the monastery.
2. This morning, the distressed parent hassled the nursery.
This morning, the distressed parent searched the nurs-
ery.
The mother of the twins hassled the nursery.
The mother of the twins searched the nursery.
With skill, the new waitress carved the nursery.
At the factory, the accountant calculated the nursery.
3. The company based in Bristol prosecuted the resort.
The company based in Bristol designed the resort.
Last year, the young architects prosecuted the resort.
Last year, the young architects designed the resort.
Early one morning, the hunter plucked the resort.
The French ambassador one day dressed the resort.
4. In the summer, the diners applauded the restaurant.
In the summer, the diners flooded the restaurant.
Its top chef ensured reviewers applauded the restaurant.
Its top chef ensured reviewers flooded the restaurant.
That group of new pilots flew the restaurant.
All last night, the pigeon flapped the restaurant.
5. Bad service meant the customer boycotted the shop.
Bad service meant the customer vacated the shop.
At last, the disgruntled clients boycotted the shop.
At last, the disgruntled clients vacated the shop.
During his classes, the pupil graphed the shop.
At the Olympics, the swimmer floated the shop.
6. That group of bulky men terrorized the station.
The group of bulky men flattened the station.
Last Wednesday, the horrible gang terrorized the sta-
tion.
Last Wednesday, the horrible gang flattened the station.
At the sunset, the blind assassin knifed the station.
After lecturers, the arts student jiggled the station.
(Appendix continues)
This
docu
men
tis
copyri
ghte
dby
the
Am
eric
anP
sych
olo
gic
alA
ssoci
atio
nor
one
of
its
alli
edpubli
sher
s.
This
arti
cle
isin
tended
sole
lyfo
rth
eper
sonal
use
of
the
indiv
idual
use
ran
dis
not
tobe
dis
sem
inat
edbro
adly
.
9TIME COURSE OF FAMILIAR METONYMY
AQ: 5
tapraid5/zfv-xlm/zfv-xlm/zfv00615/zfv3319d15z S�1 11/14/15 10:49 Art: 2014-1856
APA NLM
7. Last Tuesday, the discontented employee quit the su-
permarket.
Last Tuesday, the discontented employee burgled the
supermarket.
Apparently, the troubled floor manager quit the super-
market.
Apparently, the troubled floor manager burgled the su-
permarket.
On Sunday, the elderly man grated the supermarket.
At work, the new roofer generated the supermarket.
8. The men in firefighting gear shocked the theater.
The men in firefighting gear evacuated the theater.
Two doctors in bloodied gowns shocked the theater.
Two doctors in bloodied gowns evacuated the theater.
The plumber bent down and unclogged the theater.
A week last may, he scooped the theater.
9. Having waited so long, Harry nagged the warehouse.
Having waited so long, Harry rebuilt the warehouse.
After waiting months, the distributor nagged the ware-
house.
After waiting months, the distributor rebuilt the ware-
house.
During his long shower, he shaved the warehouse.
With panache, the Spanish professor implied the
warehouse.
10. After a week, the manager criticized the bank.
After a week, the manager visited the bank.
Months later, the new attorney criticized the bank.
Months later, the new attorney visited the bank.
After the slaughter, the butchers froze the bank.
At the nursery, Jimmy’s mother bit the bank.
11. Last week, the French patient praised the clinic.
Last week, the French patient left the clinic.
On Friday evening, the family praised the clinic.
On Friday evening, the family left the clinic.
Quite deliberately, the evil priests bathed the clinic.
Not surprisingly, the sensible barber injected the clinic.
12. Last Tuesday night the officer forewarned the café.
Last Tuesday night the officer inspected the café.
Early Monday morning, the police forewarned the café.
Early Monday morning, the police inspected the café.
With his machine, the baker sliced the café.
To her disgust, the policeman hit the café.
13. Because of illegal dealings, they fined the casino.
Because of illegal dealings, they shut the casino.
Yesterday, the secret police officers fined the casino.
Yesterday, the secret police officers shut the casino.
One February evening, the nurses cut the casino.
Eventually one of the children baked the casino.
14. The Health and Safety officers censured the cinema.
The Health and Safety officers emptied the cinema.
A week ago, the police censured the cinema.
A week ago, the police emptied the cinema.
One time last summer, James melted the cinema.
Late last year, the engineers levered the cinema.
15. I’m aware that the worker advised the factory.
I’m aware that the worker exited the factory.
This afternoon, the the manager advised the factory.
This afternoon, the the manager exited the factory.
On Saturday, the fragile businessman peeled the factory.
Last Sunday evening, my husband fished the factory.
16. On his way there, he phoned the garage.
On his way there, he passed the garage.
The man with the Ferrari phoned the garage.
The man with the Ferrari passed the garage.
Despite his hangover the postman recorded the garage.
One Friday morning, the students downloaded the
garage.
17. Apparently, the muscular young man joined the gym.
Apparently, the muscular young man trashed the gym.
I heard that some bodybuilders joined the gym.
I heard that some body builder trashed the gym.
In the winter, the hunters tracked the gym.
While very drunk, the groom stripped the gym.
18. Last year, the religious community aided the synagogue.
Last year, the religious community built the synagogue.
Ages ago, some devout residents aided the synagogue.
Ages ago, some devout residents built the synagogue.
With vigour, the young cook simmered the synagogue.
Despite her anger, the maid fetched the synagogue.
(Appendix continues)
This
docu
men
tis
copyri
ghte
dby
the
Am
eric
anP
sych
olo
gic
alA
ssoci
atio
nor
one
of
its
alli
edpubli
sher
s.
This
arti
cle
isin
tended
sole
lyfo
rth
eper
sonal
use
of
the
indiv
idual
use
ran
dis
not
tobe
dis
sem
inat
edbro
adly
.
10 BOTT, REES, AND FRISSON
AQ: 6
AQ: 7
tapraid5/zfv-xlm/zfv-xlm/zfv00615/zfv3319d15z S�1 11/14/15 10:49 Art: 2014-1856
APA NLM
19. On their way back, they congratulated the hostel.
On their way back, they noticed the hostel.
This morning, the friendly couple congratulated the hostel.
This morning, the friendly couple noticed the hostel.
To my dismay, the hairdresser tinted the hostel.
Because he was bored, Henry tickled the hostel.
20. In the end, the workmen asked the hotel.
In the end, the workmen constructed the hotel.
Paul said that the men asked the hotel.
Paul said that the men constructed the hotel.
In the desert, the cowboy rode the hotel.
Every Thursday afternoon, the cleaner bleached the hotel.
21. Last weekend, the famous player angered the club.
Last weekend, the famous player reached the club.
After two hours, the player angered the club.
After two hours, the player reached the club.
To my surprise, the doctor read the club.
Week ago, my nursed severed the club.
22. After a while, the madman blamed the asylum.
After a while, the madman fled the asylum.
Feeling totally isolated, the maniac blamed the asylum.
Feeling totally isolated, the maniac fled the asylum.
Every Tuesday night, the chef fried the asylum.
Although very tried, the waiters steamed the asylum.
23. The man in camouflage gear called the jail.
The man in camouflage gear circled the jail.
Last night, a suspicious man called the jail.
Last night, a suspicious man circled the jail.
Although frightened, the little girl uploaded the jail.
Within one week, the baby sucked the jail.
24. Last summer, the eager volunteers helped the library.
Last summer, the eager volunteers decorated the library.
Last August, the scout’s troop helped the library.
Last August, the scout’s troop decorated the library.
After class, the yoga teacher rolled the library.
Interestingly, several of the administrators printed the
library.
Received December 19, 2014
Revision received September 25, 2015
Accepted October 9, 2015 �
This
docu
men
tis
copyri
ghte
dby
the
Am
eric
anP
sych
olo
gic
alA
ssoci
atio
nor
one
of
its
alli
edpubli
sher
s.
This
arti
cle
isin
tended
sole
lyfo
rth
eper
sonal
use
of
the
indiv
idual
use
ran
dis
not
tobe
dis
sem
inat
edbro
adly
.
11TIME COURSE OF FAMILIAR METONYMY
AQ: 8
tapraid5/zfv-xlm/zfv-xlm/zfv00615/zfv3319d15z S�1 11/14/15 10:49 Art: 2014-1856
APA NLM
Related Documents


![Cardiff Universityorca.cf.ac.uk/130044/2/1804.11145.pdf · 2020. 3. 10. · arXiv:1804.11145v1 [math.QA] 30 Apr 2018 ReconstructionandLocalExtensionsforTwisted GroupDoubles,andPermutationOrbifolds](https://static.cupdf.com/doc/110x72/6106910edf2811256170bdc9/cardiff-2020-3-10-arxiv180411145v1-mathqa-30-apr-2018-reconstructionandlocalextensionsfortwisted.jpg)

