Please click only the green blocks and other buttons that have words on them. Xavier Virt Period 1

Please click only the green blocks and other buttons that have words on them. Xavier Virt Period 1.
Dec 24, 2015
Welcome message from author
This document is posted to help you gain knowledge. Please leave a comment to let me know what you think about it! Share it to your friends and learn new things together.
Transcript
Please click only the green blocks and other buttons that have words on them.
Xavier Virt
Period 1

Problem/Question Results
Conclusion(read last)
Hypothesis Data
Choose an option
Experiment
Bibliography
I thought that if we poured vinegar and salt water on a
plant then it would die. I also thought that if we
poured sugar water and milk on a plant then it
would grow better.
Click it!
Back Next

NextBack
How would using other liquids instead of water affect plant growth?
Problem
Back Next
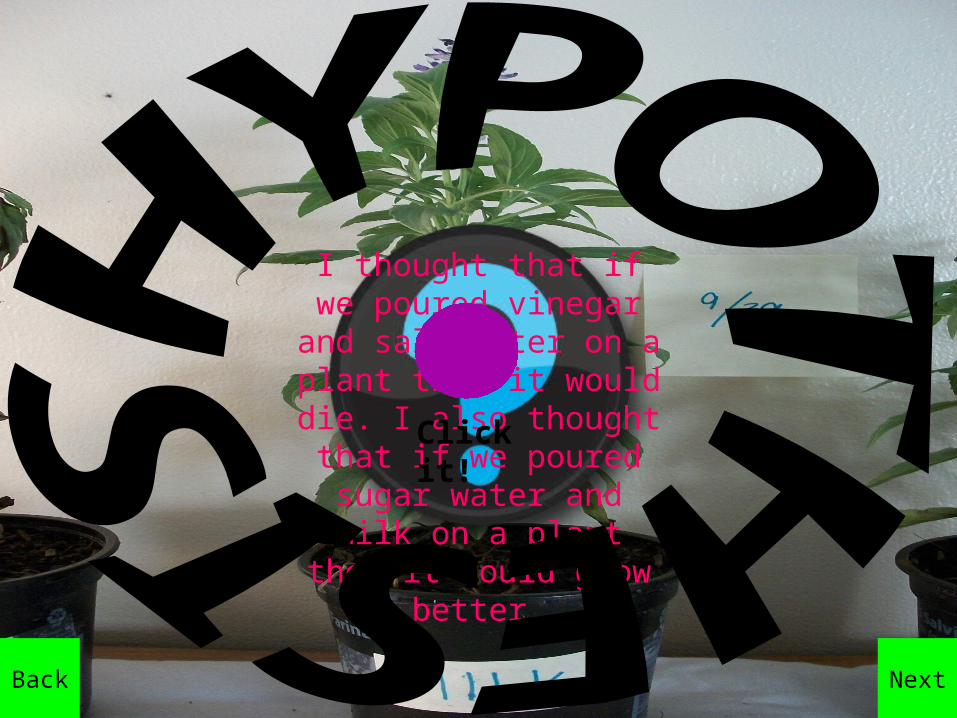
Materials:Water, Five small plants of about equal height, sucrose (table sugar), sodium chloride (table salt), vinegar, and measuring cups.PROCEDURE:1. Find a good place to put the plants. Put them there. Label plants by the solution they will be given. (Water, sugar water, salt water, vinegar water, and milk.)2.Take height measurements and record status of plants.3. Pour solutions into plants. (Recipes—sugar water- 1 tsp of sugar + 1 cup of water salt water- 1 tsp of salt + 1 cup of water vinegar water- ¼ a cup of vinegar + ¼ a cup of water milk- ½ milk)4. Repeat step 2 every day possible. Repeat step 3 every other day or as possible. Perform the experiment as long as you want or until all but one of the plants dies. You can keep that last plant.

Back Next
In the end, only the plant being given water survived. Milk may have survived if maggots didn’t attack the innocent thing, but we didn’t get to see what happened. Perhaps we could use the results of this experiment and apply what we have learned to human nutrition. Water is good, Vinegar is deadly, too much sugar and salt is a bad thing, milk spoils, and spoiled milk ruins you.
QuestionAnswers
1. Uncontrolled variables affected the results because they affected how the plants grew.2. Independent: The watering solutions Dependent: The growth of the plants.3. I would use more plants next time for each watering solution.4. It helps people learn which chemicals are best for growing plants.5. The maggots attacked the milk plant and we couldn’t see how it would grow entirely.6. See conclusion. (This was copied from the lab report.)

Back Next
DataThis is the data page. Click the buttons below to switch items. This graph displays the height of the plants. The chart shows the status of them also.
Chart
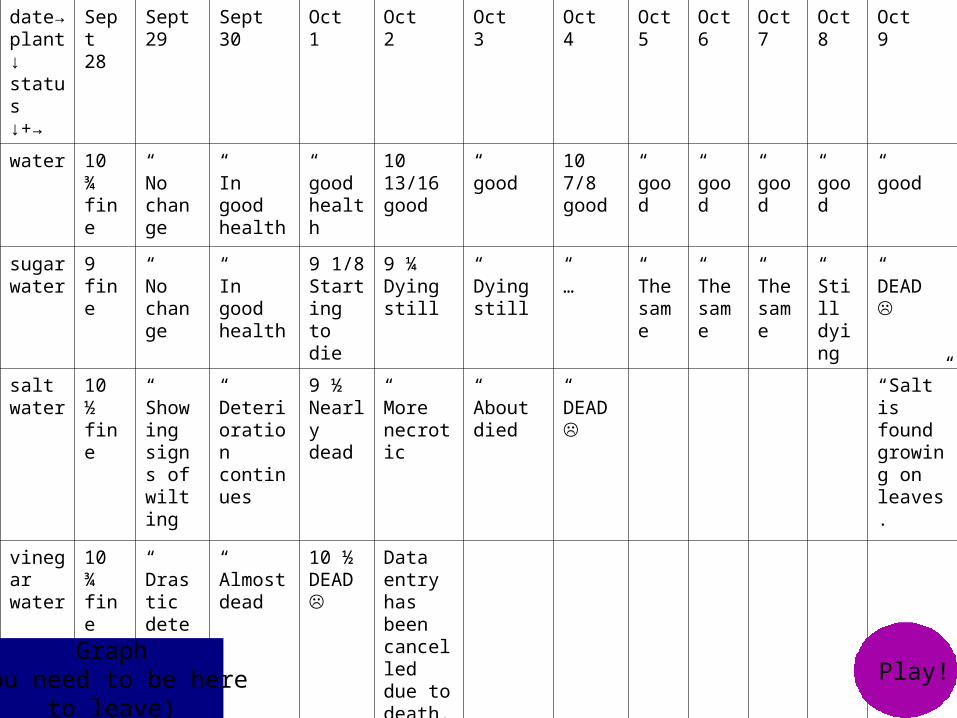
date→plant↓status↓+→
Sept28
Sept29
Sept30
Oct1
Oct2
Oct3
Oct4
Oct5
Oct6
Oct7
Oct8
Oct9
water 10 ¾ fine
“No change
“In good health
“good health
10 13/16good
“good
10 7/8good
“good
“good
“good
“good
“good
sugarwater
9fine
“No change
“In good health
9 1/8Starting to die
9 ¼ Dying still
“Dying still
“…
“The same
“The same
“The same
“Still dying
“DEAD
saltwater
10 ½ fine
“Showing signs of wilting
“Deterioration continues
9 ½ Nearly dead
“More necrotic
“About died
“ DEAD
“Salt” is found growing on leaves.
vinegarwater
10 ¾ fine
“Drastic deterioration
“Almost dead
10 ½ DEAD
Data entry has been cancelled due to death.
milk 10 ¼ fine
“The healthiest appearance
“Very good still
“Good health
“Lower leaves browning
“Infested with maggots!Killed more…
“Maggots keep on killing the plant
The innocent plant…
Killed by the parasite, or,DEAD.
Graph(you need to be here
to leave)
Play!

Back Next
BibliographySlide one background and slide 3 background: photographs taken by my mom
Slide two background from the game Insaniquairium
Sounds and slide 4 and 10 backgrounds from the secret drive C files ( on MY computer)
All other objects created with Microsoft office tools
Made on Microsoft PowerPoint by Xavier Virt
Original project concept by Xavier Virt
Back
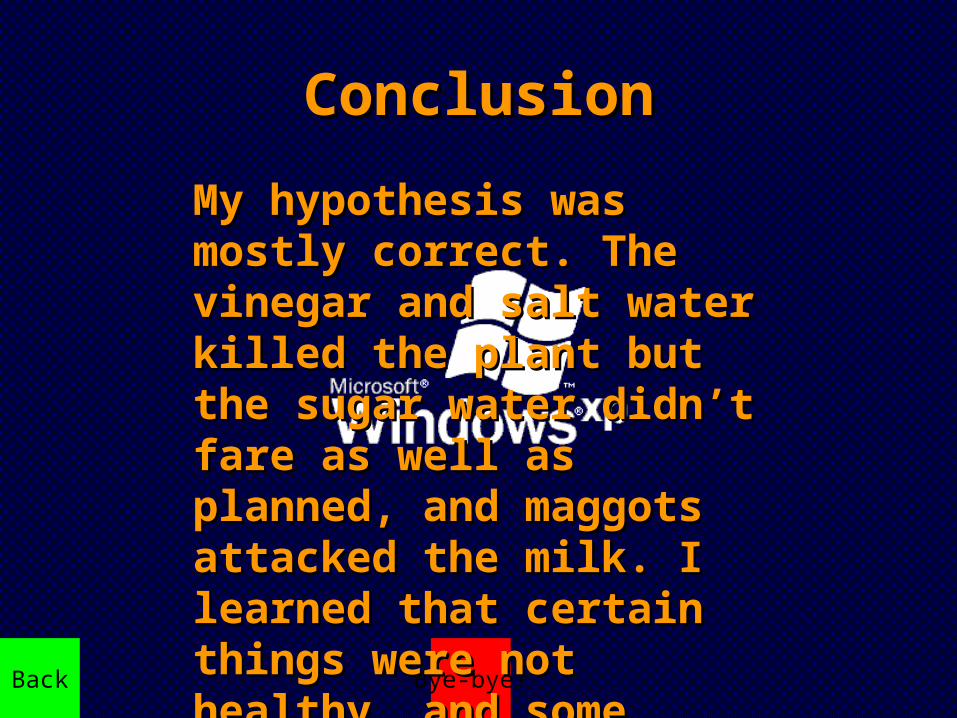
ConclusionConclusion
Bye-bye!
My hypothesis was mostly My hypothesis was mostly correct. The vinegar and salt correct. The vinegar and salt water killed the plant but the water killed the plant but the sugar water didn’t fare as well sugar water didn’t fare as well as planned, and maggots as planned, and maggots attacked the milk. I learned that attacked the milk. I learned that certain things were not healthy, certain things were not healthy, and some were.and some were.
Related Documents