A comparative analysis of Russian Premier League matches played on football turf and natural grass surfaces during 2011 Playing Surface Technical Analysis 3

Welcome message from author
This document is posted to help you gain knowledge. Please leave a comment to let me know what you think about it! Share it to your friends and learn new things together.
Transcript

A comparative analysis of Russian Premier League matches played on football turf and natural grass surfaces during 2011
Playing Surface Technical Analysis 3

2 Playing surface technical analysis 3
Contents
Page Chapter
3 1.0 Introduction
3 1.1 Aim
3 1.2 Keywords
4 2.0 Methods
4 2.1 Sample
4 2.2 Data collection
4 2.3 Data analysis
6 3.0 Results
13 4.0 Discussion
13 4.1 Effective playing time
13 4.2 Physical analysis
13 4.2.1 Overview
13 4.2.2 Total distance covered
14 4.2.3 High intensity activity
14 4.2.4 Accelerations
15 4.2.5 High intensity movement profi les
15 4.2.6 Physical endurance: Breaking the game down
17 4.2.7 Cross season trend
18 5.0 Technical overview
18 5.1 Tactical analysis
18 5.2 Passing analysis
19 5.3 Attacking analysis
20 6.0 Possible study limitations
21 7.0 Conclusions
22 8.0 References
23 Appendix

3
1.0 Introduction
In 2004, the use of football turf pitches in competition was approved by both FIFA and UEFA.
Since then, many competitive games at all levels have taken place on FIFA RECOMMENDED 2 STAR
football turf. A number of studies – including medical, biomechanical, and psychological – have
since been conducted to provide a comprehensive assessment of performance on the relative
playing surfaces.
Over the last fi ve years, Prozone Sports Ltd have provided FIFA with in-depth technical performance
analysis from over 100 competitive football matches across a number of independent studies using
the MATCHVIEWER® analysis system. These studies found that no signifi cant differences exist
between team and player performance on football turf and natural grass.
Prior to this study, however, information relating to the physical performance of players of varying
playing surfaces had not been reported. Subsequently, the Prozone tracking solution (PROZONE3®)
was installed at two stadiums in Moscow – the Luzhniki Stadium (football turf surface) and the
Khimki Arena (natural grass surface) – and the physical performance of players could be analysed
throughout the 2011 Russian Premier League season. This provided a unique opportunity to assess
whether the playing surface has an effect on physical performance, whilst also adding to the
previous studies on technical performance.
1.1 Aim
The aim of this study was to analyse and compare team and player performance on football turf
and natural grass to assess if the playing surface has an impact on physical and technical output. It
was hoped that further objective analysis could provide important information to key stakeholders
in the game looking to make decisions around the introduction of football turf pitches to enhance
participation levels and grow revenue streams.
1.2 Keywords
Football turf, natural grass, artifi cial turf, FIFA, playing surface, Prozone, physical data, performance
analysis, tracking technology, objective feedback.

4 Playing surface technical analysis 3
2.0 Methods
2.1 Sample
Data was collated from 30 Russian Premier League games from the 2011 season. Fifteen of these
games were played at Spartak Moscow’s home stadium, the Luzhniki Stadium, which uses a FIFA
RECOMMENDED 2 STAR football turf playing surface, while the other 15 games were played at
Dinamo Moscow’s home stadium, the Khimki Arena, which has a top-quality natural grass surface.
With both stadiums located in Moscow, limitations relating to climatic differences and weather
conditions were reduced, thus providing a good basis for direct comparison.
Only the away team data from each match was included in the study in an attempt to eliminate
any perceived home team bias or learned effect. In addition, only players who competed for >90
minutes were included for the individual and positional average data. In total, therefore, 30 team
performances and 215 player performances (109 on football turf and 106 on natural grass) were
available for analysis.
The study allowed us to compare the same away teams on each playing surface; an additional
“constant” helping to further enhance the consistency and fairness of the study.
2.2 Data collection
Matches were captured and analysed at both the Luzhniki Stadium and Khimki Arena using the
patented tracking and coding system PROZONE3®, which has been independently validated for
reliability of output by Di Salvo et al. (2007). PROZONE3® is a computerised video system that
allows the tracking of every player during a game. The capture system incorporates eight digital IP
cameras strategically positioned throughout the stadium to capture player movements and actions
every tenth of a second. Comprehensive positional and physical information is therefore the main
outcome of the tracking system. In addition, the system enables a range of tactical and technical
information to be extracted through plotting every on-the-ball action that occurs in a game.
Around 2000-2500 Prozone “events” were analysed per game using the PROZONE3® system,
providing a comprehensive range of technical match data for comparison.
All data was then imported into Prozone’s TREND® database application, which allowed for the
multi-game comparative analysis of the dataset. Other matches played in Russia were also added to
the overall dataset to produce a Russian League average for benchmarking purposes.
2.3 Data analysis
Mean averages were collated for the physical and technical parameters and compared across two
surfaces. Standard deviations and standard error fi gures for the same variables were also recorded
for analysis. The standard deviation fi gures allow us to assess how much variation from the mean
exists within the data, while the standard error indicates the potential variance in the mean and

5
therefore how much the mean might vary from sample to sample or study to study or indeed
league to league. Within the Prozone TREND® database application, match data could also be
broken down into team, player and positional datasets, and further broken down into different
time segments for deeper analysis: half-by-half, 15-minute periods, and fi ve-minute periods. The
mean average data was therefore also compared across these different time segments.
Match-by-match information was also analysed in chronological order to assess potential climate
change effects during the season from March through to November, and the effect that this may
have on the playing surface and consequently the performance data. For this, per-match data was
plotted onto a line graph to allow for clear identifi cation of trends and patterns in the performance
data.
Within the dataset, there were pairs of observations for each Russian team; i.e. their away
performance against Spartak Moscow on football turf and then away at Dinamo Moscow on
natural grass. The “paired-tests” method was used to assess whether the mean differences
between the two surfaces were large enough to be statistically signifi cant. If a statistical
signifi cance was shown, this would mean that one could confi dently dismiss the idea that the
observed differences occurred by chance and accept that the differences represented real or true
differences that exist in the larger population of teams in all leagues.
Using the statistical analysis package, SPSS, paired t-tests were performed on the dataset.
Paired t-tests assume that the differences can be understood to come from a normal probability
distribution. This assumption was assessed by “eyeballing” histograms of the differences (FT –NG)
and using a Shapiro-Wilks test of normality. The paired t-tests therefore only performed on those
variables that satisfi ed the assumption of normal distribution (the Shapiro-Wilks “Sig” value was
more than 0.05). As these statistical tests required pairs of data, the data for the two games in
which Spartak Moscow and Dinamo Moscow played against each other were discounted at this
stage of analysis as only one half of the “pair” was available for these teams owing to the other
half being their home performance.
In addition to the signifi cance tests, using the statistical package SPSS, correlation coeffi cients were
produced to measure the strength of the linear relationship between the two sets of data from the
two surfaces for each variable.
Results have been presented in a combination of data tables, line and bar graphs and dot plots to
allow for a full examination of the trends and fi ndings.

6 Playing surface technical analysis 3
3.0 Results
Table 1: Physical (fi tness) data table comparing the average per game player and team outputs on
natural grass and football turf.
Natural grass Football turfPlayer Team Team Player
Physical overviewTotal distance 11.124 112.06 113.93 11.128HI distance 1.169 12.13 11.81 1.082Number HI activities 171 1756 1738 161Sprint distance 0.342 3.56 3.35 0.307Number of sprints 55.9 575 542 49.5HSR distance 0.827 8.57 8.46 0.775Number HS runs 179 1841 1830 168HI distance with poss 0.441 4.92 4.90 0.410HI distance without poss 0.648 6.39 6.03 0.593HI distance ball out of play 0.080 8.2 8.15 0.075Avg. sprint distance (m) 5.80 5.98 5.87 5.90
Natural grass Football turfPlayer Team Team Player
Speed changesNo. high accelerations 24.2 243 232 21.9No. medium accelerations 149.6 1517 1488 143.5No. low accelerations 795.6 7981 8267 811.2No. high decelerations 13.9 141 135 12.8No. medium decelerations 123.3 1259 1249 119.4No. low decelerations 793.2 7949 8238 807.2

7
Table 2: Technical data table comparing the average per game player and team outputs on natural
grass turf and football turf.
Natural grass Football turfPlayer Team Team Player
Tactical overviewTotal headers 5.36 52.73 55.2 5.83Tackles 3.20 31.4 39.2 3.90Fouls 1.35 14.67 13.53 1.07Blocks 1.74 17.73 15.67 1.67Interceptions 10.66 98.67 100.73 11.09Clearances 2.28 21.07 22.6 2.59Possession won 15.59 158.3 164.07 16.66Possession lost 18.98 205.6 215.2 19.83Average number touches 2.06 NA NA 2.01Dribbles 0.60 7.47 4.13 0.34
Natural grass Football turfPlayer Team Team Player
Passing overviewTotal passes 31.99 315.7 273 27.45Successful passes 26.00 256.9 214.5 21.27Unsuccessful passes 5.99 58.8 58.5 5.73Total pass completion % 79.90% 80.70% 77.50% 76.20%Balls received 33.17 343.9 304.9 29.11Passes forwards 15.05 144 129.1 13.64Passes backwards 5.92 63.2 55.4 4.99Passes sideways 11.03 108.5 88.5 8.82Pass attempted own half 17.76 167.5 156.7 17.15Passes attempted in opp half 14.23 148.2 116.3 10.30Total no. short passes 7.80 81.4 72.7 6.55Total no. medium passes 18.26 177.7 142.5 14.68Total no. long passes 5.92 56.7 57.8 6.22
Natural grass Football turfPlayer Team Team Player
Attacking overviewGoals 0.05 0.73 0.87 0.10Goals inside the area 0.04 0.67 0.60 0.07Goals outside the area 0.01 0.07 0.27 0.04Total number of shots 0.94 11.73 12.00 1.13Headers at goal 0.15 2.07 1.00 0.08Shooting accuracy 49.50% 47.70% 53.90% 54.20%Final third entries 5.08 53.67 52.07 4.97Penalty area entries 2.85 28.00 26.07 2.57Total corners 0.42 4.67 4.33 0.50Crosses 0.83 8.60 11.00 0.93Offsides 0.20 2.73 2.67 0.19

8 Playing surface technical analysis 3
Fig. 1: Total distance and high intensity distance comparison; football turf, natural grass and
Russian league average.
Fig. 2: High-intensity activity broken down into high-speed runs (HSR) and sprints. A comparison
between average fi gures on football turf, natural grass and Russian league.
113.93
112.06
113.17
11.85
12.13
11.81
100
102
104
106
108
110
112
114
116
118
120
Football turf Natural Grass League average
Tota
l dis
tanc
e co
vere
d (k
m) (
Avg
. per
gam
e)
10.0
10.5
11.0
11.5
12.0
12.5
13.0
13.5
14.0
14.5
15.0
HI d
ista
nce
cove
red
(km
) (A
vg. p
er g
ame)
Total distanceHI distance
11.81
8.46
3.35
12.13
8.57
3.56
11.85
8.47
3.38
0
2
4
6
8
10
12
14
HI distance HSR distance Sprint distance
Dis
tanc
e co
vere
d (k
m) (
Avg
. per
gam
e)
Football turf Natural Grass League average

9
Dot plots allow you to assess the variance in the data as they plot data for each individual game. Figure 3 shows that the
mean average for total distance is higher on football turf than natural grass; however the range of fi gures shown on football
turf is greater than on natural grass. The lowest fi gure in a single game was also recorded on football turf. Figure 3 shows
that although high-intensity distance fi gures are generally higher on natural grass, the range of fi gures from games played on
football turf is again greater than on natural grass. With less variance in the data, this fi nding could suggest a greater level of
consistency in physical performance on the more traditional surface, possibly owing to greater familiarity. See Appendix 1 for
more dot plots on other variables, both technical and physical.
Fig. 3: Dot plot showing the variance in results for total
distance from games played on football turf and natural
grass.
Fig. 4: Dot plot showing the variance in results for high
intensity distance from games played on football turf and
natural grass.
Fig. 5: Plot showing the correlation between fi gures for
average sprint distance recorded on the two surfaces
Fig. 6: Plot showing the correlation between fi gures for
number of high accelerations recorded on the two surfaces
Football Turf
125,
000
120,
000
115,
000
Tota
l Dis
tanc
e (m
)
Total DistanceObserved Values (c) and Means (*)
110,
000
105,
000
Natural Grass Football Turf
16,0
0014
,000
12,0
00
Tota
l Dis
tanc
e (m
)
HI DistanceObserved Values (o) and Means (*)
10,0
008,
000
Natural Grass
5.5
5.5
6.0
6.5
7.0
6.0 6.5 7.0
Natural Grass
Foot
ball
Turf
Average Sprint Distance
150
200
150
250
300
350
250200 300 350
Natural Grass
Foot
ball
Turf
High Accelerations

10 Playing surface technical analysis 3
Figures 5 and 6 show the potential correlation between the two surfaces across the different
performance variables captured. The closer the dots are to the 45-degree line, the stronger the
relationship is between the two surfaces. A perfect positive correlation (signifi cance of 1.0) would
mean than all dots sit on the line, meaning that there were identical data on both surfaces. We can
see a strong relationship that was close to signifi cance (correlation coeffi cient of 0.06) for average
sprint distance. This suggests that teams performed relatively similarly on both surfaces for this
variable. See Appendix 2 for a full breakdown of correlation coeffi cients for the tested variables.
Table 3: Paired samples t-test results for the physical (fi tness) variables. There were no signifi cant
differences.
Paired Differences
t dfSig. (2-tailed)Mean Std. Deviation
Std. Error Mean
95% Confi dence Interval of the Difference
Lower Upper
Pair 1Total Distance_FT – Total Distance_NG
1817.571 5977.397 1597.527 -1633.675 5268.818 1.138 13 .276
Pair 2HS Run Distance_FT – HS Run Distance_NG
-117.000 1200.011 320.716 -809.866 575.866 -.365 13 .721
Pair 3Num HS Runs_FT – Num HS Runs_NG
-12.714 260.176 69.535 -162.935 137.507 -.183 13 .858
Pair 4Sprint Distance_FT – Sprint Distance_NG
-184.071 657.771 175.797 -563.857 195.714 -1.047 13 .314
Pair 5Num Sprints_FT – Num Sprints_NG
-31.214 112.643 30.105 -96.252 33.824 -1.037 13 .319
Pair 6HI Distance_FT – HI Distance_NG
-301.143 1806.054 482.688 -1343.927 741.642 -.624 13 .543
Pair 7HI Number_FT – HI Number_NG
-17.214 270.493 72.292 -173.392 138.964 -.238 13 .815
Pair 8Recovery Time_FT - Recovery Time_NG
.000 5.738 1.534 -3.313 3.313 .000 13 1.000
Pair 9Avg Sprint Dist_FT – Avg Sprint Dist_NG
-.098786 .405860 .108471 -.333122 .135551 -.911 13 .379
Pair 10
HighAccelerations_FT - HighAccelerations_NG
-.06117 .27228 .07277 -.21838 .09604 -.841 13 .416
Pair 11
High Decelerations_FT - High Decelerations_NG
-8.071 42.059 11.241 -32.356 16.213 -.718 13 .485
Pair 12
Medium Accelerations_FT - Medium Accelerations_NG
-31.786 223.082 59.621 -160.589 97.018 -.533 13 .603
Pair 13
Medium Decelerations_FT - Medium Decelerations_NG
-13.571 194.006 51.850 -125.587 98.444 -.262 13 .798
Pair 14
Low Accelerations_FT – Low Accelerations_NG
258.571 704.957 188.408 -148.459 665.601 1.372 13 .193
Pair 15
Low Decelerations_FT –Low Decelerations_NG
262.143 754.342 201.606 -173.401 697.687 1.300 13 .216

11
57.41 56.65 56.9456.52 55.41 56.24
0
10
20
30
40
50
60
70
Football turf Natural grass League average
Dis
tanc
e co
vere
d (k
m) (
Avg
. per
gam
e)
1st half
2nd half
0
500
1,000
1,500
2,000
2,500
0-15
15-3
0
30-4
5 45+
45-6
060
-75
75-9
0 90+
Time period
Dis
tanc
e (m
)
Natural grassFootball turf
Fig. 7: Half-by-half breakdown showing the average total distances covered by teams on the two
surfaces and across the league as a whole.
Fig. 8: 15-minute breakdown; average high intensity distances covered on the two surfaces and
across the league as a whole.

12 Playing surface technical analysis 3
0
1,000
2,000
3,000
4,000
5,000
6,000
7,000
8,000
0-5
5-10
10-1
5
15-2
0
20-2
525
-30
30-3
5
35-4
0
40-4
5 45+
45-5
050
-55
55-6
060
-65
65-7
070
-75
75-8
080
-85
85-9
0 90+
Time period
Dis
tanc
e (m
)
Natural grass
Football turf
Fig. 9: 5-minute breakdown; average total distances covered on the two surfaces and across the
league as a whole.
Fig. 10: Chronological game by game fi gures for high intensity (HI) distance covered by the home
team on the two different surfaces.
0
2000
4000
6000
8000
10000
12000
14000
16000
1 2 3 4 5 6 7 8 9 10 11 12 13 14 15
Game number
Dis
tanc
e pe
r te
am p
er g
ame
(m)
Natural grassFootball turfLinear trend (Natural grass)Linear trend (Football turf)

13
4.0 Discussion
4.1 Effective playing time
The average effective playing time [duration of ball in play] during all matches was 54 minutes
17 seconds [60.3%], which is similar to fi gures reported in the previous studies (Wooster, 2006-
8). Overall analysis of the data shows that effective playing time was not affected by the playing
surface [53 minutes 29 seconds – 59.4% – on football turf versus 55 minutes 05 seconds – 61.2%
– on natural grass]. This data, coupled with the fi ndings from the previous studies demonstrates
that the effective playing time is not affected by playing surface and that the ball is in play, on
average, for the same duration on football turf and natural grass.
4.2 Physical analysis
4.2.1 Overview
When assessing the physical variables collectively, it can be concluded that no signifi cant differences
were observed in the data collected on natural grass and football turf, thus suggesting that playing
surface does not affect physical performance during a football match. There are, however, some
subtle differences in the data between the two surfaces that will be discussed in more detail.
4.2.2 Total distance covered
The average total distance covered on natural grass and football turf was 112.1km versus 113.9km,
respectively. The difference observed was not signifi cant [p= .276]. One main fi nding, however, was
that there was more variance in the data from game to game on football turf than on natural grass
Fig. 12: Plot showing the correlation between fi gures for high
intensity distance covered recorded on the two surfaces.
Fig. 11: Plot showing the correlation between fi gures for total
distance covered recorded on the two surfaces.
Total Distance
105,000
105,
000
110,
000
115,
000
120,
000
110,000 115,000 120,000
Natural Grass
Foot
ball
Turf
9,000
9,00
013
,000
14,0
0015
,000
10,000 13,000 14,000
Natural Grass
Foot
ball
Turf
11,000 12,000 15,000
12,0
0011
,000
10,0
00
HI Distance

14 Playing surface technical analysis 3
[see Fig. 3]. Although the mean average for total distance is higher on football turf, the lowest fi gure
for this variable was also observed during a game on this surface. The range of fi gures is nearly 28%
higher on football turf than on natural grass [a range of 16,062m on football turf from highest
to lowest versus 12,122m on natural grass – a difference of 3940m on both surfaces]. It could be
suggested that this fi nding may be linked to an increased consistency in performance on the more
traditional grass surface and perhaps indicates unfamiliarity for away teams on football turf. It may
also be owing to the varying nature of playing style from game to game by the home team (Spartak
Moscow) on football turf and the effect of this on the opposing team. The correlation plot graph
for total distance (see Fig. 11) further demonstrates the variance or “noise” within the data for this
variable. The plots are very sporadic, indicating a high level of variance is inherent within the dataset.
4.2.3 High-intensity activity
Although the mean average total distance was reported to be higher on football turf, distance
covered at high intensity (HI) was higher on natural grass than football turf [12.13km versus
11.81km]. This fi nding is further supported when the number of HI activities is considered, with
1,841 observed on natural grass and the slightly lower fi gure of 1,830 on football turf. These
differences, however, were again not highlighted as signifi cant [p= .543 for HI distance covered,
p= .815 for total number of HI activities]. Regardless of these differences, data for high-intensity
distance covered showed less variance in the data than was observed for total distance, and a
stronger correlation between fi gures on the two surfaces can be identifi ed (see Fig. 10).
When high-intensity activity is broken down further into sprints and high-speed runs (HSR), a
similar trend is observed with both sprint distance and HSR distance being slightly higher on natural
grass than on football turf (see Fig. 2 for breakdown). Of particular interest within this study was
the players’ ability to perform the HI activity in the same manner without being infl uenced by
the playing surface. It is useful at this point, therefore, to consider the fi nding for average sprint
distance – that is the average length of each sprint. Interestingly, the average length of sprint
showed a strong correlation between each surface (see Fig. 5) and it was this variable that was
in fact closest to signifi cance [correlation coeffi cient of 0.06]. This suggests that teams are likely
to show similar results for sprinting patterns on natural grass and football turf, thus suggesting
with high confi dence that the surface had very little effect on this important area of elite physical
performance.
4.2.4 Accelerations
The ability of a player to accelerate and decelerate at the same rate on both playing surfaces is
of great importance. Due to the unpredictable nature of the game, a player is required to make
many changes of direction and changes to travelling speed through the game, and actually an
entire football performance is made up of this type of explosive intermittent activity at different
intensities. Information regarding the number of accelerations and decelerations at low, medium
and high intensities on both surfaces is available for comparison. In line with the fi ndings relating
the high-intensity activity, greater numbers of high accelerations on average were performed on
natural grass than on football turf [243 versus 232 per team per game]. The fi nding is again not
signifi cant [p= .416] and as so it would be unreasonable to suggest that this fi nding is due to a
reduced ability to perform these activities on football turf, but rather that there was perhaps just a
reduced demand for high accelerations during the games played on that surface.

15
Despite the differences observed, the correlation plot for high accelerations (see Fig. 6) shows
a strong correlation for this variable, with the plots relatively close to the 45-degree line. This
suggests that the same teams performed a similar number of high accelerations on both surfaces
(home and away performances). It is, however, useful to further interpret this plot graph slightly
differently. If more data points are located above the 45-degree line, this would suggest a greater
tendency of the variable in question to occur on football turf. In this case, more data plots were
located below the 45-degree line, indicating a greater tendency for high accelerations to occur
on natural grass as the mean average suggests, but we can begin to observe this fi nding in more
detail.
Conversely, there were a greater number of low accelerations on football turf than on natural grass
[7,981 versus 8,267], which is in line with the fi nding that greater total distance was covered on
this surface on average. This again could suggest how the physical demands and movement profi les
varied against the different home teams on the two surfaces. The games on football turf demanded
fewer quick, short bursts of movement at high intensities than the games on natural grass. Further
work would need to be done to establish what proportion of the differences can be attributed to
the effect of the playing surface.
4.2.5 High-intensity movement profi les
Figures 13 and 14 show the movement profi les of one particular player (player X) on the two
different playing surfaces. It can be seen that, although the player played in the same position in
both games (central midfi eld) and the team played with the same formation in both games, the
physical demands and the type of runs required in the two game are somewhat different.
The general positioning of the player in question is reactively similar on both surfaces, however the
make-up of the type of runs is not quite as consistent. The “hotter” the colour of the arrow on the
movement profi les, the greater the velocity of that particular movement. The movement profi le on
natural grass (see Fig. 14) shows a greater number of runs hitting the sprint threshold (red) and, in
addition, and possibly more insightful, more recovery-type runs against the direction of play can be
viewed on the illustration for this surface. See Appendix 4 for a detailed positional breakdown of
the physical data.
4.2.6 Physical endurance: breaking the game down
When breaking the game down into smaller segments (for example, half-by-half or by 15- and
5-minute periods), it is possible to begin to assess whether playing surface affects the physical
endurance of players – i.e. their ability to sustain their physical output throughout the game. This
data can also be used as an indicator of fatigue during matches.
Half-by-half
As expected, on average there is a slight decline in physical output from fi gures in the fi rst to
the second half on both surfaces. When looking at total distance in particular (see Fig. 7), the
decrease from fi rst to second half is consistent across both surfaces. The percentage decrease is also
comparable [1.72% versus 2.19% on football turf and natural grass, respectively].

16 Playing surface technical analysis 3
Fig. 13: Player X 1st half high intensity movement profi le on football turf versus Spartak Moscow.
Fig. 14: Player X 1st half high intensity movement profi le on natural grass versus Dinamo Moscow.
Direction of attack
Direction of attack

17
By 15-minute segments
When the game is broken down into the even smaller segments of 15-minute periods, a similar
trend can be observed for total distance covered – i.e. there is a gradual decline throughout the
game from the fi rst 15 minutes to the last on both surfaces. This fi nding supports the notion that
playing surface does not affect the physical endurance trends and therefore the capabilities of the
players. When considering average HI distance across the 15-minute segments, some interesting
fi ndings arise. On average, the fi gures suggest that teams began the games at a higher intensity
on natural grass with greater HI distance covered during the fi rst 15 minutes of the game on this
surface. During the time between 15 and 30 minutes, however, a relatively steep decline of this
HI distance covered is observed on natural grass in comparison to the more conservative decline
on football turf over the same time period (see Fig. 6). This graph also highlights that, although HI
distance is generally greater on natural grass than on football turf during the second half, there is
actually a slight incline in this statistic on average in the fi nal 15-minute segment of the game on
football turf. This fi nding can help dispel the potential preconception that football turf has a limiting
effect on the physical endurance capabilities of players who are unfamiliar with this playing surface.
By 5-minute segments
Breaking the physical parameters down into 5-minute segments provides a greater level of
granularity and allows for a more thorough assessment of the physical output throughout the
game. Figure 7 shows how, for total distance covered, the trends are in many ways mirrored from
one surface to the other. This provides further evidence to suggest that the effect of playing surface
on physical output is limited. This graph also, however, shows in more detail the increase in physical
output and therefore perhaps “work rate” on football turf towards the end of the game. A marked
increase in total distance covered can be observed from 80 minutes onwards on football turf, while
fi gures for the fi nal fi ve minutes actually show a decline on natural grass.
4.2.7 Cross-season trend
In order to assess whether playing conditions and therefore performance statistics were affected
throughout the season by changing weather conditions, it was useful to consider the home team
data in isolation and in chronological order across the season (from March to November 2011). By
using only the home team data for this particular trend analysis, the personnel, playing styles and
team capabilities were relatively consistent from game to game. The data should be assessed with
some caution as the home team’s approach to the game may have varied slightly from game to
game depending on the opposition, although the analysis is still interesting. As the data was being
assessed across the season on the same surface rather than a comparison of the two, familiarisation
or the potential habituation process regarding the playing surface was not a factor.
Figure 8 shows the two sets of home data from the start to the end of the season for HI distance
covered. The linear trend lines show that HI distance covered is maintained throughout the season
on football turf, while a slight decline is observed in the data from games played on natural grass.
Of course, this could be owing to squad rotation and relative squad fi tness of these two teams,
but it also highlights an important message that player perform similarly on both playing surfaces.
In this specifi c case, it could be contended that football turf actually enhances a player’s ability to
perform consistently throughout the season as the playing surface is not affected by changing or
adverse weather conditions.

18 Playing surface technical analysis 3
5.0 Technical overview
Technical data was collected alongside the physical data in order to add to previous research and
provide further depth to the overall analysis. As with the previous studies, only a few differences
were reported for the frequency of player and team events from games played on natural grass and
football turf (See Table 2).
5.1 Tactical analysis
Objective match data regarding the relative frequency of tackles in games played on football turf
and natural grass surfaces is vital given the perceived relationship with the incidence of injury in
games played on the newer surface. Consistent with the fi ndings from the previous study (U-20
World Cup), more tackles per game were performed by teams on football turf than natural
grass [39 versus 31] suggesting that players are required to make more tackles on football turf.
However, across all 130 games analysed in each study, the tackle data is very similar (28 natural
grass per team per match on average versus 30 on football turf), suggesting that this was a specifi c
competition-related fi nding as opposed to being related to playing surface.
As in previous studies, the frequency of interceptions [99 versus 101 per team per match] and
incidence of blocks [1.74 versus 1.67 on average per player per game] reported on natural grass
and football turf were very similar. Regardless of this fi nding, a greater number of possession
transitions per game (possession won and lost) were observed on football turf than on natural
grass, although this was not statistically signifi cant. The number of possession losses per team per
game equated to 215.2 on football turf and just 205.6 on natural grass. This fi nding will, of course,
be linked to the reduced pass success rate on football turf and may therefore be related in large
part to playing style rather than the actual effect of playing surface.
One of the key performance indicators analysed across all the previous technical research studies
has been the players’ average number of touches per possession per game. It has been contended
that this data will provide crucial information on player-ball interaction (for example, a player’s
ability to control the ball) on natural grass and football turf playing surfaces. The average number
of touches per possession per player was almost identical on grass and football turf [2.06 versus
2.01]. Coupled with the fi ndings from the previous studies that are consistent with this, we can
conclude that players are equally comfortable with the ball at their feet on both playing surfaces.
5.2 Passing analysis
This study saw a greater frequency of passes attempted on natural grass than football turf [316
versus 273]. This fi nding is inconsistent with previous studies of this type. It had previously been
suggested that due to the consistently higher average number of total passes per game on football
turf, this surface encourages teams to attempt more passes. Findings from this study would oppose
that notion and thus suggest that this statistic is more related to the playing style of the home
team.

19
Arguably more important is the fact that the quality of passing and success rates was similar
on both surfaces [80.7% on natural grass versus 77.5% on football turf]. It could be suggested
that the playing surface may have an effect on accuracy, although when looking closer at the
breakdown of passes and assessing in more depth the length and direction of passes, this pass
success rate can be better understood. A greater percentage of total passes on football turf were
long (>25m) [21.2% versus 17.9%]. The reduced accuracy associated with the increased number of
long passes on football turf will inevitably lower the overall total pass success rate on this surface.
Furthermore, there were more forwards (144 versus 129), backwards (63 versus 55) and sideways
(109 versus 89) passes on natural grass, which is a refl ection of the greater frequency of passes
reported generally on this surface. However, when these fi gures are viewed as a percentage of
the total number of passes on football turf and natural grass, a greater proportion of passes are
directed forwards on football turf. This fi nding, alongside the greater proportion of long passes on
football turf, may indicate a more direct style of play on this surface and hence another reason why
the overall pass success rate is slightly lower on this surface.
One signifi cant result that is again contradictory to previous study fi ndings was the fi gure for the
number of passes attempted in the opposition’s half. In the current study, a larger proportion of
total passes were performed in the opposition’s half on natural grass as opposed to football turf
[46.9% versus 42.6%]. This result was found to be signifi cant [p= .032]. This could suggest that
football turf encourages teams to defend deeper in their own half, although it is also necessary to
consider the effect of playing styles.
5.3 Attacking analysis
Attacking statistics were generally higher on football turf than natural grass, with more shots [12.0
versus 11.7], crosses [11.0 versus 8.6] and goals [0.87 versus 0.73] reported. The difference for
the average number of crosses per game was found to be signifi cant [p= .016]. Studies 1, 2 and 4
found the inverse to be true with more crosses on average being performed on natural grass (see
Appendix 3 for a technical overview from past studies). This had led to the contention that football
turf may lead to a narrower style of play. The technical research conducted on Dutch football
games (Study 3), however, also reported a higher number of crosses on football turf [12 versus 11].
Given that no continuity seems to have emerged across each of the fi ve studies, we can therefore
assume that the type of competition (rather than playing surface) is more likely to be the cause of
the difference observed.
Considering the above fi nding, it was surprising that the frequency of attacking entries was higher
on natural grass than on football turf [fi nal third entries: 53.7 versus 52.1; penalty area entries:
28.0 versus 26.1]. This may suggest that when playing on natural grass, teams are less effi cient
with their attacking play once the ball has been delivered into the attacking area. In addition, the
higher fi gures for attacking entries on natural grass may also just be a refl ection of the increased
possession by the teams on this surface.

20 Playing surface technical analysis 3
6.0 Possible study limitations
Throughout the study, only the away team data was included within the data comparison analysis.
Eliminating the home team’s data removed any perceived bias or learned effect resulting from
regular experience of playing on football turf or natural grass, and therefore, a habituation process.
The home teams’ playing styles, standards and general approach to games, however, will have had
an inevitable consequential effect on the away team performance data. It can be noted, however,
that the two home teams were not dissimilar in terms of standard of play, with both teams
occupying 3rd and 4th position at the end of the 2011 season.
The same away teams played on both surfaces owing to the Russian League format – i.e. all teams
that played on natural grass also played on football turf. Despite this fact, differences in team
line-ups due to squad rotation, injuries, or adapted approach to the games may have reduced the
consistency in the sample from one surface to the other.
Other possible limitations include the different offi cials used in the games and potential incidents
in the game (e.g. dismissals, injuries, etc.), the standard and adopted approach of the opposition
(including formation utilised) and the timing of the matches (kick-off time and rest in between
matches). In addition, it was impossible to control the players’ footwear, game preparation and
psychological mindset to ensure consistency on both surfaces.
With both stadiums located in the same city (Moscow), it is possible to suggest that climate change
was consistent on both surfaces. Weather conditions, on the other hand, could not be controlled;
therefore, this was a possible limitation of the study.

21
7.0 Conclusions
This study aimed to assess the impact of different playing surfaces, natural grass and football turf,
on the physical (fi tness) performance of the teams and players, while adding to the existing body of
technical data research. Thirty games from the 2011 Russian Premier League were analysed using
Prozone Sports’ PROZONE3® tracking technology, (15 games on natural grass and 15 games on
football turf). Direct comparison and advanced statistical analysis of the objective information from
both surfaces was conducted to ascertain whether the game changes on football turf.
In conclusion, the current fi ndings reveal that:
• Football turf does not affect the physical performance trends and capabilities of teams
and players during a football match. There were some subtle differences in the data when
comparing physical performances on football turf to natural grass, yet none of these were
statistically signifi cant.
• Greater total distance and physical outputs at lower intensities were reported on football turf,
while a higher mean average for HI distance covered per team per game was reported on
natural grass [Total distance: 113.9km versus 112.1km; HI distance: 11.8km versus 12.1km
on football turf and natural grass, respectively]. Following the assessment of the home team
technical data, it was concluded that this slight difference could most likely be attributed to the
different demands within the games on the two surfaces as a direct effect of the home teams’
contrasting playing styles rather than a direct effect of the differing playing surfaces.
• Greater variability in the physical data (range of results) was observed in the information
captured on football turf than on natural grass. It could be suggested that this variability in the
data indicates a potential inconsistency of physical output on this newer, perhaps less familiar
surface.
• No difference was found for effective (ball in play) playing time on football turf and grass [on
average, 54-55mins, approximately 60%, on both surfaces].
• Although subtle differences were observed with certain variables within the “tactical analysis”
(for example, frequency of tackles and possession transitions), the majority of variables
(including the players’ average number of touches per possession) reported comparable
fi ndings.
• Contrary to previous study results, a higher frequency of passes was attempted on natural
grass than on football turf, although this fi nding is more likely linked to playing styles rather
than surface owing to the lack of continuity in this fi nding with other studies.
• Attacking statistics were generally higher on football turf than on natural grass, with more
shots, crosses, and goals reported on this surface. Attacking entries, however, that is fi nal third
entries and penalty area entries, were higher on natural grass than on football turf.
Overall, from this study, we can conclude that, in terms of the physical (fi tness) performance, the
game does not change when played on football turf.

22 Playing surface technical analysis 3
8.0 References
Wooster, B., (2006) A comparative performance analysis of a single match played on artifi cial turf to
a series of games played on natural surface. ProZone Sports Ltd, 2006.
Wooster, B., (2007) A comparative performance analysis of games played on artifi cial and grass turf
from the evaluation of UEFA Champions League and UEFA Cup football. ProZone Sports Ltd, 2007.
Wooster, B. & Stafford, K., (2007) A comparative performance analysis of games played on football
turf and natural grass surfaces from the evaluation of games played in the Dutch Eredivisie. ProZone
Sports Ltd, 2007.
Wooster, B. & Stafford, K., (2008) A comparative performance analysis of games played on football
turf and natural grass surfaces from the evaluation of games played during the 2007 FIFA U-20
World Cup. ProZone Sports Ltd, 2008.
O’Donoghue, P., Bradley, P., Tordoff, P. and Wooster, B., (2007) The reliability of ProZone
MatchViewer: A video-based technical performance analysis system. International Journal of
Performance Analysis in Sport. 7 (3): 117-129
Di Salvo, V., Collins, A. et al. (2007) Validation of Prozone ® A new video-based performance
analysis system. International Journal of Performance Analysis in Sport, 6 (1): 108-119

23
Football Turf
125,
000
120,
000
115,
000
Tota
l Dis
tanc
e (m
)
Total DistanceObserved Values (c) and Means (*)
110,
000
105,
000
Natural Grass
Football Turf
16,0
0014
,000
12,0
00
Tota
l Dis
tanc
e (m
)
HI DistanceObserved Values (o) and Means (*)
10,0
008,
000
Natural Grass
Football Turf
5,00
04,
500
4,00
03,
500
3,00
02,
500
2,00
01,
500
Tota
l Dis
tanc
e (m
)Sprint Distance
Observed Values (o) and Means (*)
Natural Grass
Football Turf
5045
4035
3025
20
Reco
very
Tim
e (s
econ
ds)
Natural Grass
Recovery TimeObserved Values (o) and Means (*)
Appendix 1Technical and physical dot plots
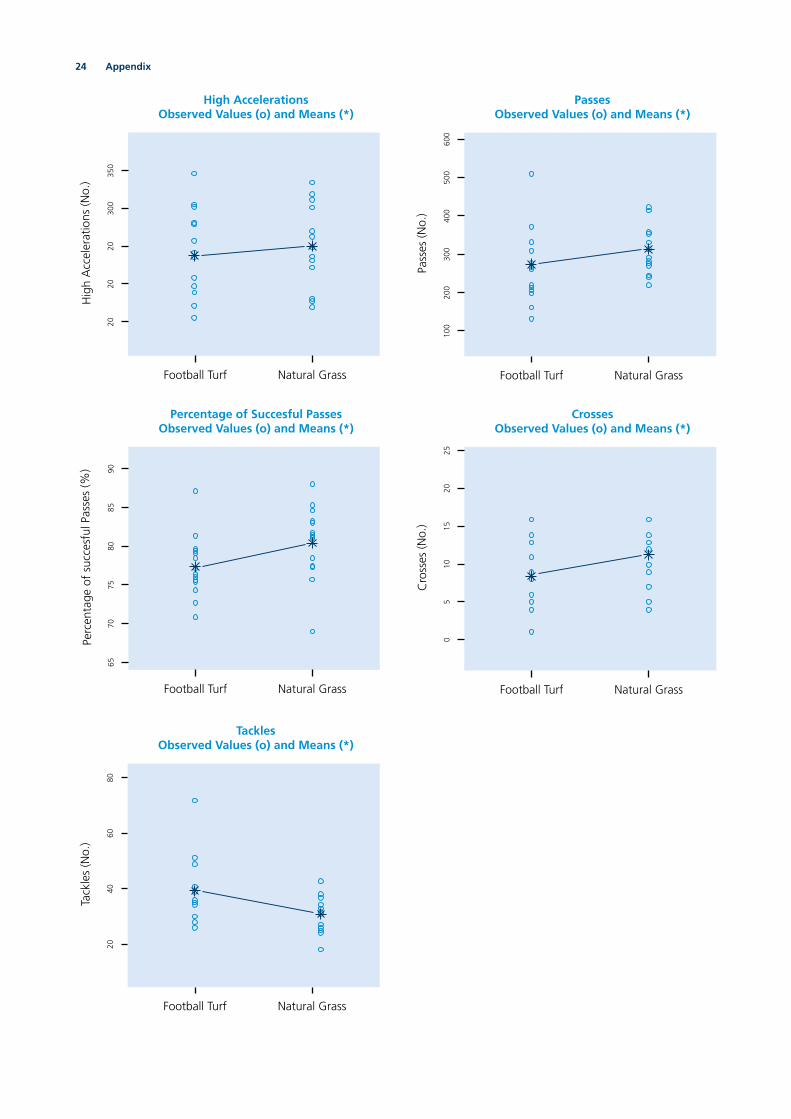
24 Appendix
Football Turf
2020
2030
035
0
Hig
h A
ccel
erat
ions
(No.
)High Accelerations
Observed Values (o) and Means (*)
Natural Grass Football Turf
100
200
300
400
500
600
Pass
es (N
o.)
Natural Grass
PassesObserved Values (o) and Means (*)
Football Turf
6570
7580
8590
Perc
enta
ge o
f su
cces
ful P
asse
s (%
)
Natural Grass
Percentage of Succesful PassesObserved Values (o) and Means (*)
Football Turf
05
1015
2025
Cro
sses
(No.
)
Natural Grass
CrossesObserved Values (o) and Means (*)
Football Turf
2040
6080
Tack
les
(No.
)
Natural Grass
TacklesObserved Values (o) and Means (*)

25
Appendix 2Paired statistics and correlation coeffi cients
Paired Samples Statistics
Mean N Std. Deviation Std. Error Mean
Pair 1Total Distance_FT 114116.86 14 4266.941 1140.388
Total Distance_NG 112299.29 14 3363.455 898.921
Pair 2HS Run Distance_FT 8509.57 14 1161.053 310.304
HS Run Distance_NG 8626.57 14 684.858 183.036
Pair 3Num HS Runs_FT 1843.64 14 249.591 66.706
Num HS Runs_NG 1856.36 14 187.917 50.223
Pair 4Sprint Distance_FT 3397.79 14 635.720 169.903
Sprint Distance_NG 3581.86 14 550.245 147.059
Pair 5Num Sprints_FT 548.64 14 104.787 28.005
Num Sprints_NG 579.86 14 89.529 23.928
Pair 6HI Distance_FT 11907.86 14 1753.527 468.650
HI Distance_NG 12209.00 14 1170.504 312.830
Pair 7HI Number_FT 1756.86 14 254.314 67.968
HI Number_NG 1774.07 14 209.767 56.063
Pair 8Recovery Time_FT 33.21 14 5.807 1.552
Recovery Time_NG 33.21 14 3.906 1.044
Pair 9Avg Sprint Dist_FT 5.88600 14 .359178 .095994
Avg Sprint Dist_NG 5.98479 14 .449187 .120050
Pair 10High Accelerations_FT 236.86 14 60.365 16.133
High Accelerations_NG 249.43 14 52.824 14.118
Pair 11ln_HighAccelerations_FT 5.4364 14 .26125 .06982
ln_HighAccelerations_NG 5.4975 14 .21838 .05837
Pair 12High Decelerations_FT 136.71 14 37.745 10.088
High Decelerations_NG 144.79 14 39.029 10.431
Pair 13Medium Accelerations_FT 1503.57 14 204.001 54.521
Medium Accelerations_NG 1535.36 14 173.687 46.420
Pair 14Medium Decelerations_FT 1260.93 14 197.019 52.655
Medium Decelerations_NG 1274.50 14 173.964 46.494
Pair 15Low Accelerations_FT 8278.93 14 565.026 151.010
Low Accelerations_NG 8020.36 14 484.512 129.491
Pair 16Low Decelerations_FT 8260.36 14 605.219 161.751
Low Decelerations_NG 7998.21 14 546.153 145.965
Paired statistics

26 Appendix
Paired Samples Correlations
N Correlation Sig.
Pair 1Total Distance_FT & Total Distance_NG
14 -.216 .458
Pair 2HS Run Distance_FT &HS Run Distance_NG
14 .237 .414
Pair 3Num HS Runs_FT & Num HS Runs_NG
14 .319 .266
Pair 4Sprint Distance_FT & Sprint Distance_NG
14 .392 .166
Pair 5Num Sprints_FT &Num Sprints_NG
14 .336 .240
Pair 6HI Distance_FT & HI Distance_NG
14 .288 .318
Pair 7HI Number_FT & HI Number_NG
14 .333 .245
Pair 8Recovery Time_FT & Recovery Time_NG
14 .354 .214
Pair 9Avg Sprint Dist_FT & Avg Sprint Dist_NG
14 .515 .060
Pair 10High Accelerations_FT & High Accelerations_NG
14 .352 .217
Pair 11ln_HighAccelerations_FT & ln_HighAccelerations_NG
14 .366 .198
Pair 12High Decelerations_FT & High Decelerations_NG
14 .400 .156
Pair 13Medium Accelerations_FT & Medium Accelerations_NG
14 .311 .280
Pair 14Medium Decelerations_FT & Medium Decelerations_NG
14 .459 .099
Pair 15Low Accelerations_FT & Low Accelerations_NG
14 .104 .723
Pair 16Low Decelerations_FT & Low Decelerations_NG
14 .145 .622
Correlation coeffi cients

27
Appendix 35-Study Technical Overview
Study 1 - UEFA Cup
Study 2 - Champions League
& UEFA Cup
Study 3 - Dutch Football
Study 4 - U’20s World Cup
Study 5 - Russian League
Natural grass
Football Turf
UEFA Average
Natural grass
Football Turf
CL & UEFA Average
Natural grass
Football Turf
Dutch Eredivise Average
Natural grass
Football Turf
U’20s Tournament
Average
Natural grass
Football Turf
Russian League Average
No. of Performances 2 2 28 20 8 80 17 17 68 46 58 104 15 15 62
Passes 360 352 339 336 341 353 270 308 274 282 296 291 315 273 319
Successful Passes 301 280 267 275 268 290 204 237 208 220 231 227 257 215 258
Success Pass % 84% 80% 79% 82% 79% 82% 76% 77% 76% 78% 78% 78% 81% 76% 80%
Passes forward 162 164 155 152 159 154 135 147 136 134 140 137 144 129 146
Balls received 417 396 368 373 374 388 310 349 316 319 330 327 344 305 350
Headers 72 59 67 56 68 57 76 76 76 64 60 62 53 55 52
Tackles 22 22 28 28 28 30 34 30 33 27 32 30 31 39 31
Interceptions 117 120 136 110 130 115 138 141 139 128 131 130 99 101 101
Crosses 19 16 15 13 12 13 11 12 13 13 10 12 9 11 12
Shots 12 15 13 13 14 13 12 13 13 14 15 15 12 12 12
Overall average
Natural grass Football turf
Passes 313 314
Successful Passes 251 246
Passes forward 145 148
Success Pass % 80 78
Balls received 353 351
Headers 64 64
Interceptions 118 125
Tackles 28 30
Crosses 13 12
Shots 13 14
Distribution analysis
313
251
145
314
246
148
0
50
100
150
200
250
300
350
Passes Successful Passes Passes forward
Avg
. num
ber
per
team
per
gam
e
Natural grass
Football turf

28 Appendix
Appendix 4Performance BenchmarkNatural grass vs. Football Turf Physical Benchmarking
KeyH.I. = High Intensity - > 5.5 m/sWP = With PossessionWOP = Without PossessionBOP = Ball out of PlayHSR = High Speed Run - 5.5 - 7 m/s Delivering Performance Insights
Attacker Grass Turf
Dist. Covered 11184 11006
H.I. Dist Coverd 1280 1223
H.I. Dist Coverd WP 767 729
H.I. Dist Coverd WOP 437 400
H.I. Dist Coverd BOP 75 94
No. H.I. Activities 177 169
Sprint Dist. 389 367
HSR Dist. 891 856
No. of Sprints 60 56
Recovery Time 32 35
Left Back Grass Turf
Dist. Covered 10952 11330
H.I. Dist Coverd 1208 1163
H.I. Dist Coverd WP 386 382
H.I. Dist Coverd WOP 745 705
H.I. Dist Coverd BOP 76 75
No. H.I. Activities 164 165
Sprint Dist. 396 353
HSR Dist. 812 810
No. of Sprints 59 54
Recovery Time 34 35
Left Midfi eld Grass Turf
Dist. Covered 11742 11942
H.I. Dist Coverd 1375 1448
H.I. Dist Coverd WP 639 701
H.I. Dist Coverd WOP 664 638
H.I. Dist Coverd BOP 71 107
No. H.I. Activities 199 216
Sprint Dist. 394 411
HSR Dist. 981 1036
No. of Sprints 67 67
Recovery Time 29 26
Centre Back Grass Turf
Dist. Covered 10038 10240
H.I. Dist Coverd 772 714
H.I. Dist Coverd WP 137 160
H.I. Dist Coverd WOP 558 482
H.I. Dist Coverd BOP 75 59
No. H.I. Activities 117 112
Sprint Dist. 209 188
HSR Dist. 562 526
No. of Sprints 35 32
Recovery Time 49 54
Team Total Analysis (excluding GK)
Grass Turf Grass Turf
Total Distance (km) 112.1 113.9 No. of H.I. Activities 1756 1738
H.I. Distance 12127 11813 Sprint Distance 3561 3355
H.I. Dist Coverd WP 4917 4897 HSR distance 8565 8458
H.I. Dist Coverd WOP 6390 6032 No. of Sprints 575 542
H.I. Dist Coverd BOP 820 815 Recovery Time (secs) 34 34
Centre Midfi eld Grass Turf
Dist. Covered 11766 11740
H.I. Dist Coverd 1257 1205
H.I. Dist Coverd WP 460 412
H.I. Dist Coverd WOP 723 724
H.I. Dist Coverd BOP 73 68
No. H.I. Activities 197 194
Sprint Dist. 335 318
HSR Dist. 922 886
No. of Sprints 59 55
Recovery Time 29 30
Right Back Grass Turf
Dist. Covered 11321 11104
H.I. Dist Coverd 1342 1113
H.I. Dist Coverd WP 456 415
H.I. Dist Coverd WOP 783 617
H.I. Dist Coverd BOP 101 80
No. H.I. Activities 187 156
Sprint Dist. 432 324
HSR Dist. 910 788
No. of Sprints 68 52
Recovery Time 30 38
Right Midfi eld Grass Turf
Dist. Covered 12386 11933
H.I. Dist Coverd 1629 1418
H.I. Dist Coverd WP 740 691
H.I. Dist Coverd WOP 771 627
H.I. Dist Coverd BOP 117 98
No. H.I. Activities 235 195
Sprint Dist. 496 431
HSR Dist. 1133 986
No. of Sprints 83 64
Recovery Time 23 28

29

30 Appendix

President: Joseph S. Blatter
Secretary General: Jérôme Valcke
Address: Fédération Internationale de Football Association
FIFA-Strasse 20
P.O. Box
8044 Zurich
Switzerland
Telephone: +41-(0)43-222 7777
Fax: +41-(0)43-222 7878
Internet: www.FIFA.com
Related Documents


