For professional investors only @ldaalder LUKAS DAALDER CIO ROBECO INVESTMENT SOLUTIONS OUTLOOK 2018 PLAYING IN EXTRA TIME

Welcome message from author
This document is posted to help you gain knowledge. Please leave a comment to let me know what you think about it! Share it to your friends and learn new things together.
Transcript

For professional investors only @ldaalderLUKAS DAALDERC I O R O B E C O I N V E S T M E N T S O L U T I O N S
OUTLOOK 2018
PLAYING IN EXTRA TIME

TERUGBLIK OP VORIG JAAR
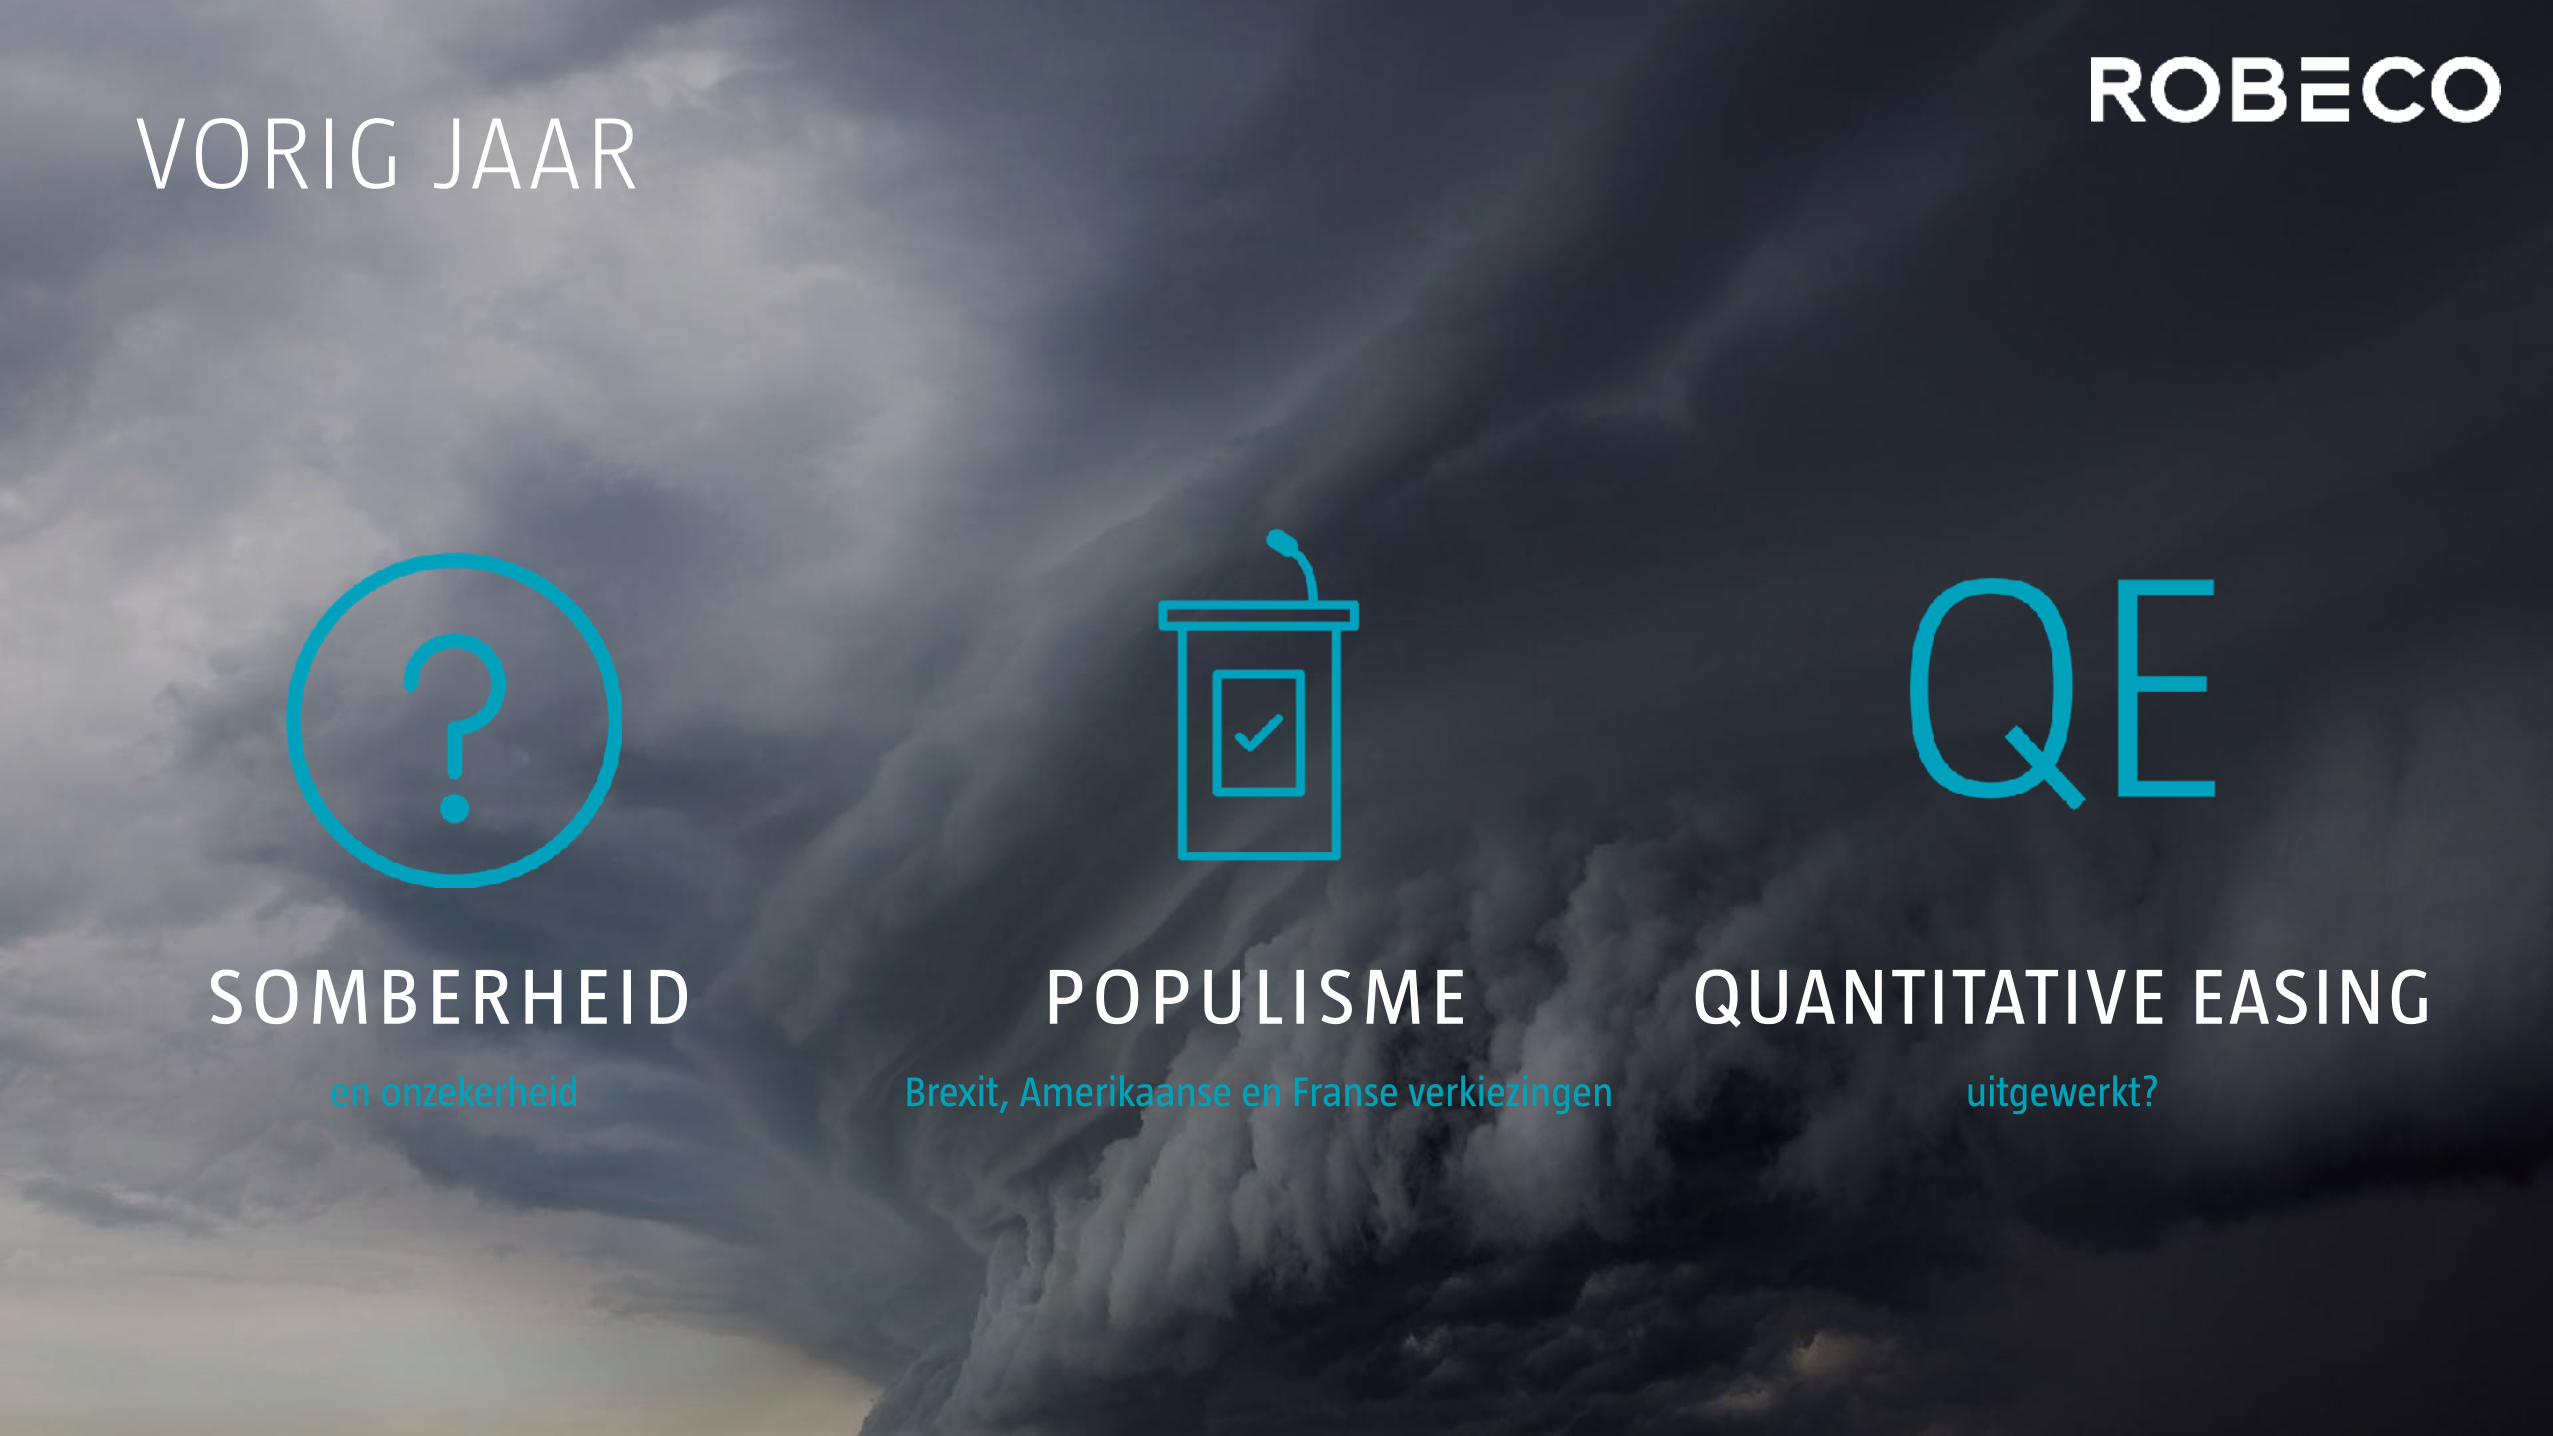
Brexit, Amerikaanse en Franse verkiezingen
POPULISMEuitgewerkt?
QUANTITATIVE EASINGen onzekerheid
SOMBERHEID
VORIG JAAR

WAT IS ER VERANDERD?IMF World Economic Outlook
Tijd
Opt
imis
me
‘Too slow for too long’
‘Uncertainty aftermath U.K. Referendum’
‘Gaining Momentum?’
‘A Firming Recovery’
‘Seeking Sustainable Growth’
July ‘16 April ‘17 July ‘17 Oktober ‘172016 2017
?
April ‘16source: IMF, World Economic Outlook

18,8%
1 YR 3 YR 5 YR
1 YR 3 YR 5 YR
Fixed Income EMD Hard Currency (unh. in EUR) German Government Bonds EMD Local Currency (unh. in EUR) Japan Government Bonds Global Government Bonds US Government Bonds Italy Government Bonds France Government Bonds Spain Government Bonds Investment Grade Europe Global Investment Grade Bonds Global High Yield Investment Grade US
Global real estate Oil Index Gold Emerging Markets (in EUR) Global Equities (local)
6,1%
hoog risico
AANDELEN & CREDITS
MARKT IN LIJN MET OPTIMISME
source: Bloomberg, Robeco
17,9%
6,4%
3,7%
2,6%

1 YR 3 YR 5 YR
1 YR 3 YR 5 YR
Fixed Income EMD Hard Currency (unh. in EUR) German Government Bonds EMD Local Currency (unh. in EUR) Japan Government Bonds Global Government Bonds US Government Bonds Italy Government Bonds France Government Bonds Spain Government Bonds Investment Grade Europe Global Investment Grade Bonds Global High Yield Investment Grade US
Global real estate Oil Index Gold Emerging Markets (in EUR) Global Equities (local)
MARKT IN LIJN MET OPTIMISME
hoog risico
AANDELEN & CREDITS
de daling lijkt eindelijk ten einde
OBLIGATIEMARKTEN
1,4%
1,2%
1,1%
0,7%
0,7%
0,0%
-0,9%
source: Bloomberg, Robeco

2018HET NIEUWE JAAR

OVERWAARDERING
RISICO IN DE MARKT

RISICO 1: OVERWAARDERINGS&P 500240
220
200
180
160
140
120
100
802011 2012 2013 2014 2015 2016
source: Bloomberg, Robeco
S&P 500 earningsS&P 500
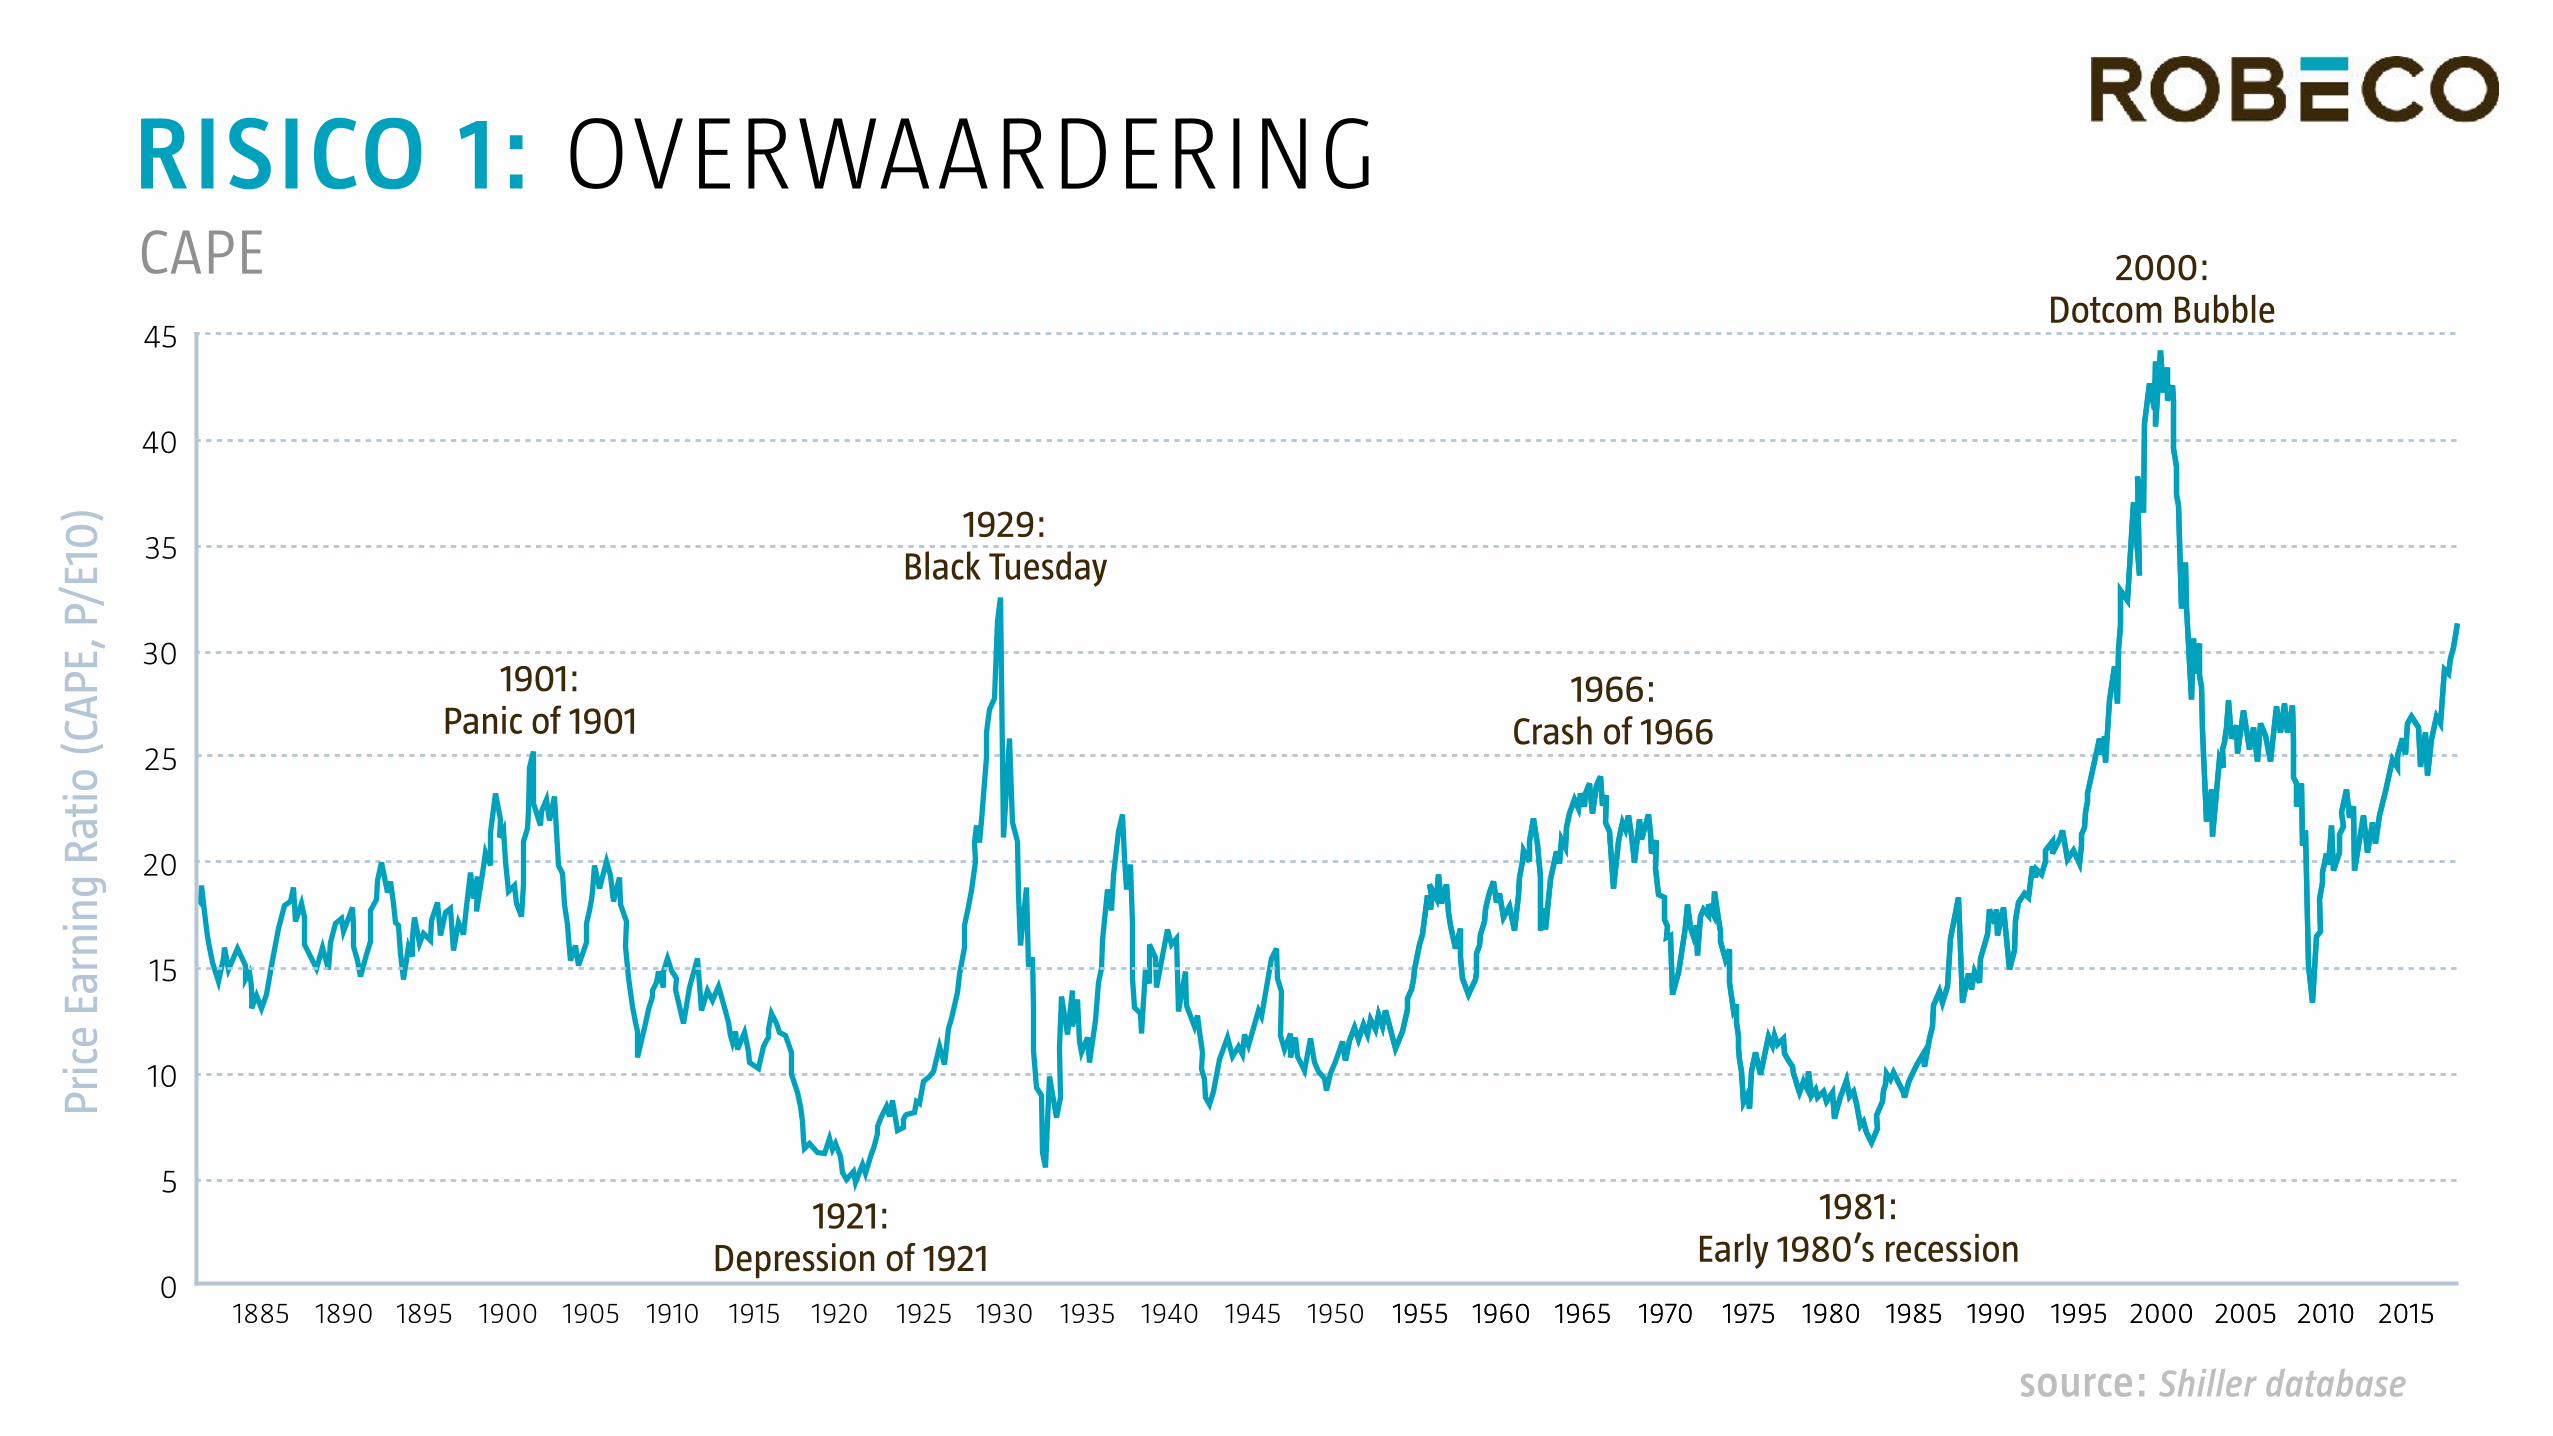
RISICO 1: OVERWAARDERINGCAPE45
40
35
30
25
20
15
10
5
01885 1890 1895 1900 1905 1910 1915 1920 1925 1930 1935 1940 1945 1950 1955 1960 1965 1970 1975 1980 1985 1990 1995 2000 2005 2010 2015
1901:Panic of 1901
1921:Depression of 1921
1929:Black Tuesday
1966:Crash of 1966
1981:Early 1980’s recession
2000:Dotcom Bubble
1955 1960 1965 1970 1975 1980 1985 1990 1995 2000 2005 2010 2015
source: Shiller database
Pric
e Ea
rnin
g Ra
tio (
CAPE
, P/E
10)

RISICO 1: OVERWAARDERINGCAPE
1955 1960 1965 1970 1975 1980 1985 1990 1995 2000 2005 2010 2015
45
40
35
30
25
20
15
10
5
0
1.6
1.4
1.2
1.0
0.8
0.6
0.4
0.2
Shiller CAPE
Q Ratio (RH)
Buffett Indicator (RH)
source: Shiller database

RISICO 1: OVERWAARDERINGEuropese obligaties markt nog steeds overgewaardeerd
14
-2
0
2
4
6
8
10
12
1970 1975 1980 1985 1990 1995 2000 2005 2010 2015
German 10Y bond yield (actual)10Y fair value estimate
source: Thomson Reuters Datastream, Robeco
Draghi: “whatever it takes”

RISICO 1: OVERWAARDERINGGlobal Credit Spread
0
1
2
3
4
6
5
2000 2002 2004 2006 2008 2010 2012 2014 2016
lang termijn gemiddelde
source: Bloomberg, Robeco

RISICO 1: OVERWAARDERINGGlobal High Yield Spread
0
4
8
12
16
20
2000 2002 2004 2006 2008 2010 2012 2014 2016
lang termijn gemiddelde
source: Bloomberg, Robeco
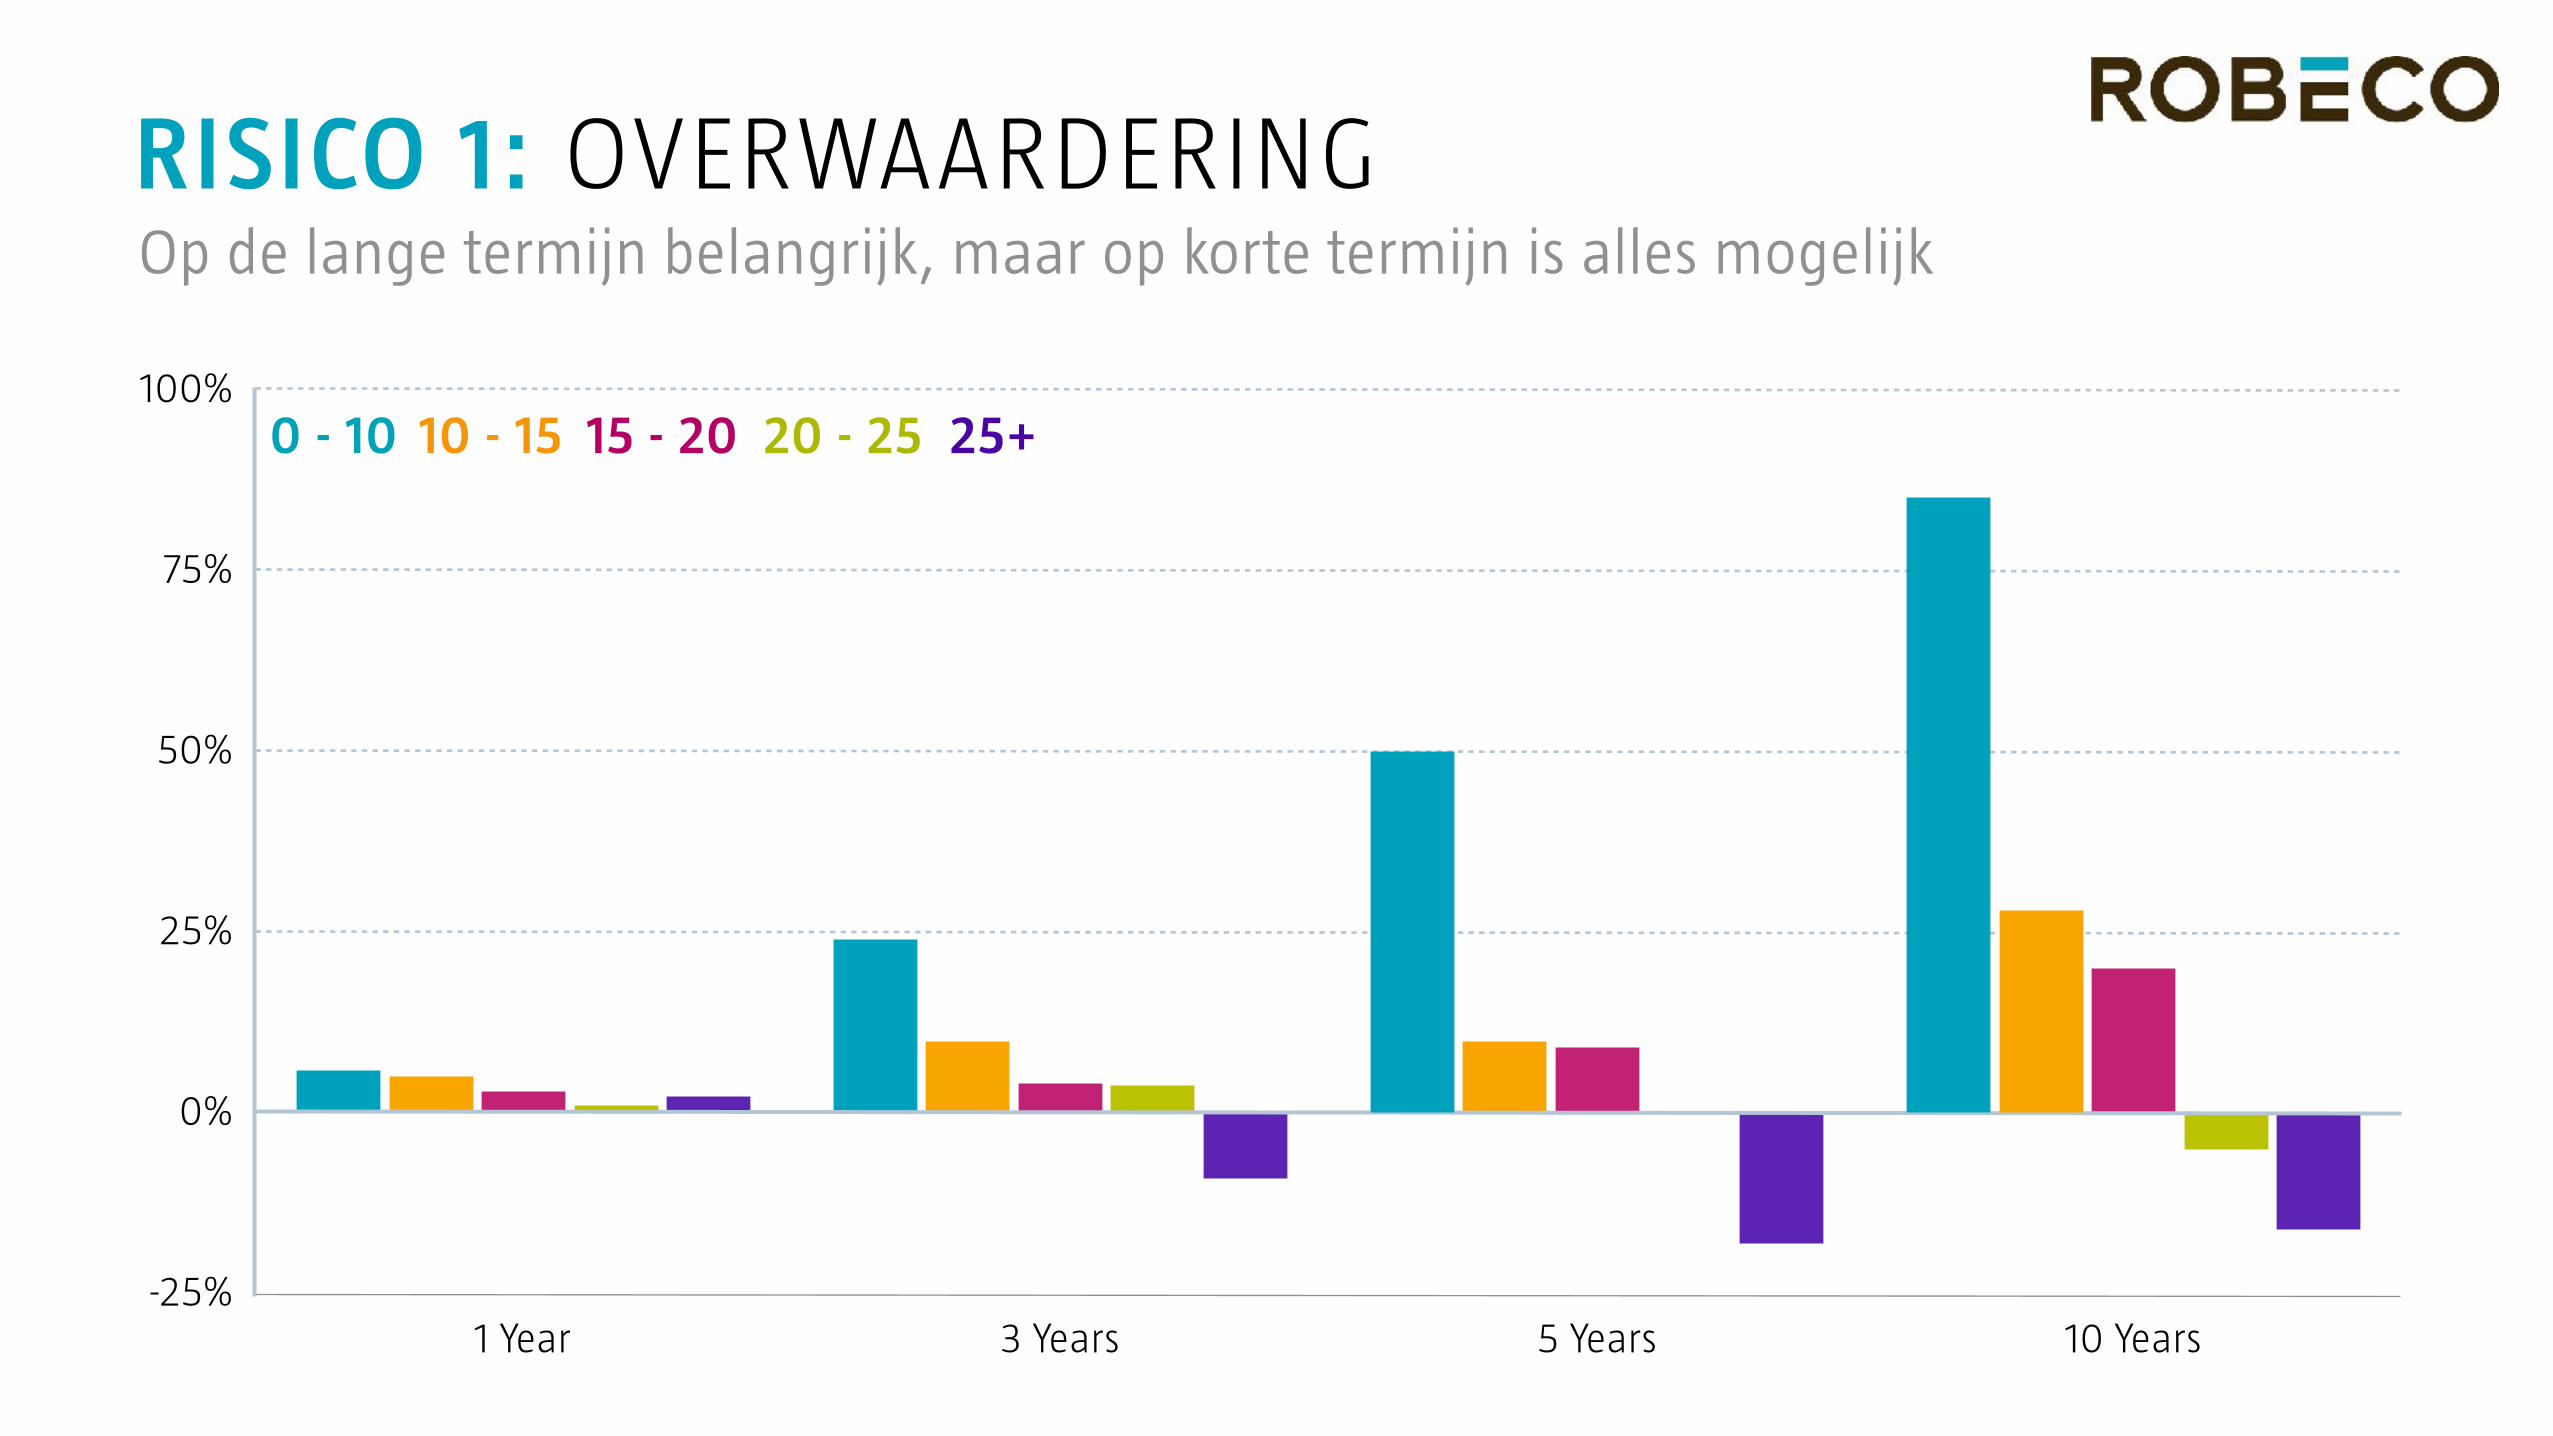
RISICO 1: OVERWAARDERINGOp de lange termijn belangrijk, maar op korte termijn is alles mogelijk
100%
75%
50%
0%
25%
-25%1 Year 3 Years 5 Years 10 Years
0 - 10 10 - 15 15 - 20 20 - 25 25+

OVERWAARDERING LATE CYCLE
RISICO IN DE MARKT

RISICO 2: LATE CYCLE FOR CREDIT CYCLEVerslechterde kredietkwaliteit
20%Improving but ignored
20%Attractive, but no takers
60%Exhaustion, disbelief and
demorilization
30%Solid underlying performance
50%Abundant bargains
20%Doubt, reflection and conversion
40%Sweet summer of growth
30%Willingness to pay up
30%Faith, hope and charity
20%Optimistic, long-
duration projections
20%Revised models justify stretching
60%Euphoria, greed
and extrapolation
30%Over-awareness of
deteriorating conditions
20%Shocked recognition of outlandish prices paid
50%Fear, panic and
loathing
Fundamentals
Valuation
Psychology, Technical and Liquidity
Market Phase Bottom Early Stage Recovery Mid Stage Bull Market Peak of Bull Market Bear Market
EMERGING CREDITS
INVESTMENT GRADE
EUROPEAN HIGH Y IELD
GLOBAL HIGH Y IELD
source: Robeco, Morgan Stanley, June 2017

RISICO 2: VERSLECHTERDE KREDIETKWALITEITLate cycle for credit cycle2.40
5.40
4.90
4.40
3.90
3.40
2.90
2011 201720162015201420132012
BBa Caa/Ca
source: Moody’s
OVERWAARDERING LATE CYCLE CHINESE SCHULD
RISICO IN DE MARKT
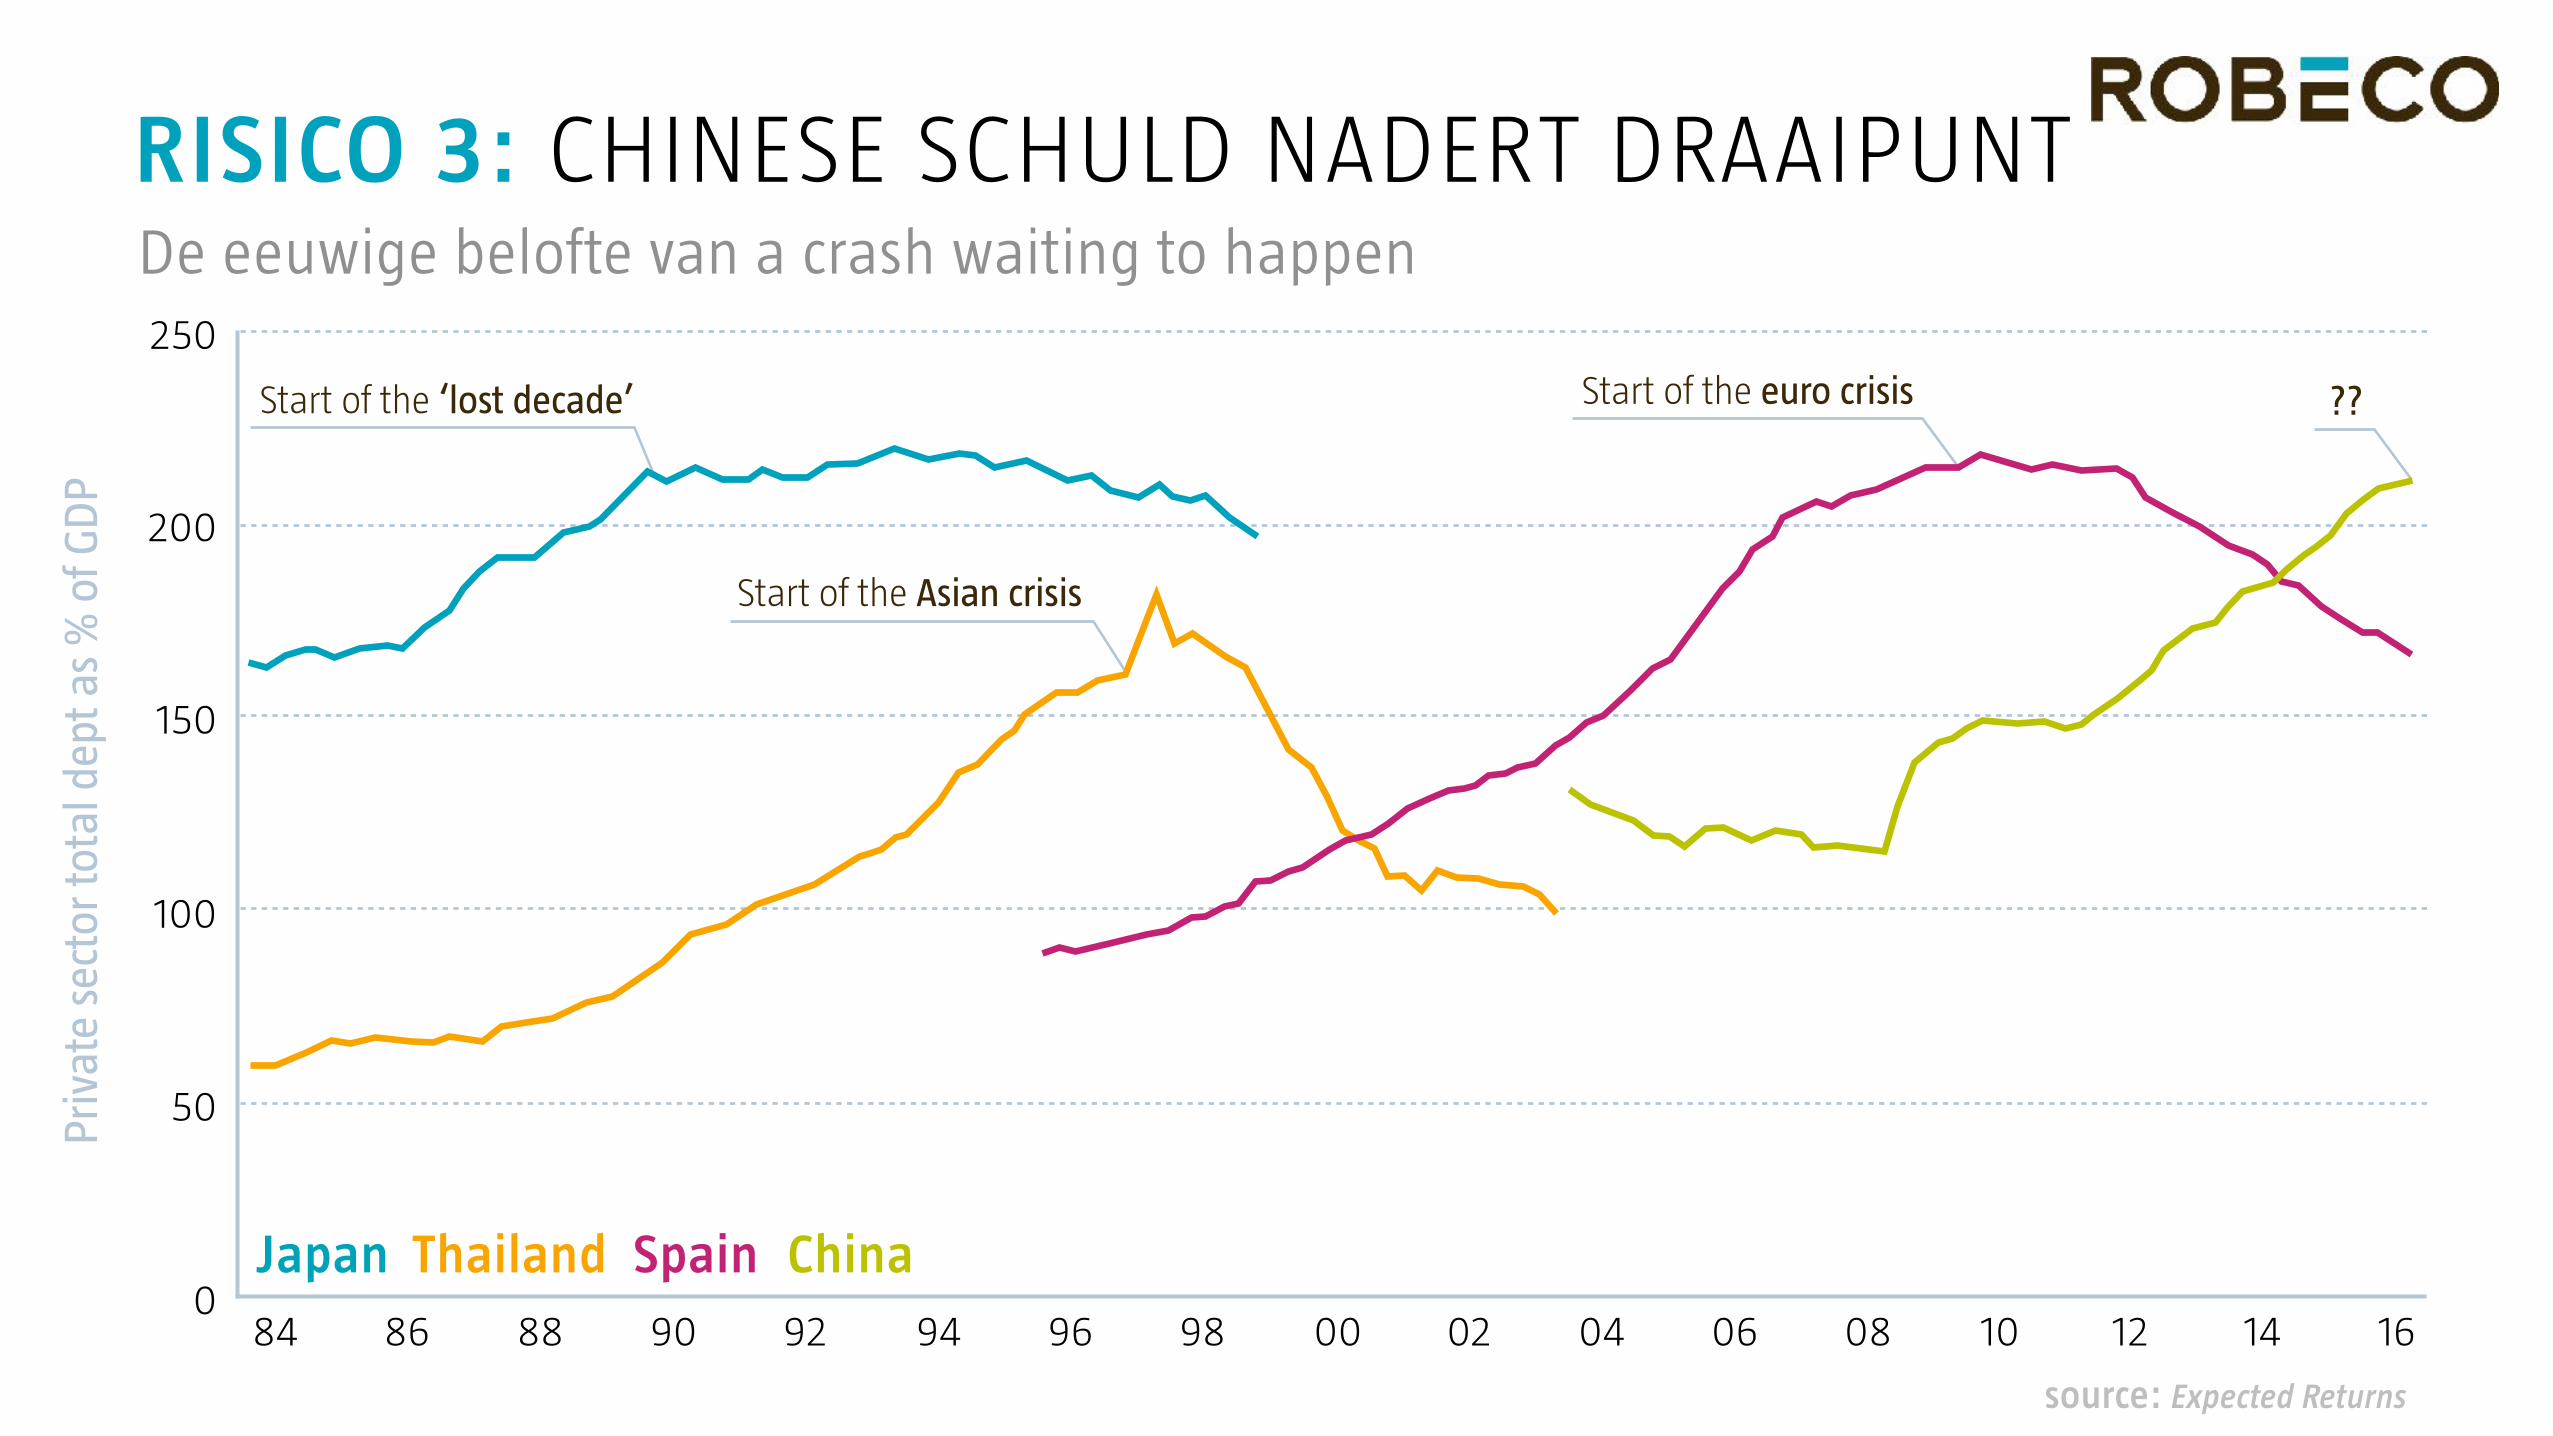
Start of the euro crisis
Start of the Asian crisis
RISICO 3: CHINESE SCHULD NADERT DRAAIPUNTDe eeuwige belofte van a crash waiting to happen
??
84 86 88 90 92 94 96 98 00 02 04 06 08 10 12 14 160
50
100
150
200
250
Start of the ‘lost decade’
Japan Thailand Spain China
source: Expected Returns
Priv
ate
sect
or to
tal d
ept a
s %
of G
DP
OVERWAARDERING LATE CYCLE CHINESE SCHULD MONETAIR BELEID
RISICO IN DE MARKT

RISICO 4: DRAAI IN MONETAIR BELEID Van quantitive easing naar quantitive tightening
752008
95
115
135
155
175
195
215
235
255
2009 2010 2011 2012 2013 2014 2015 2016 2017 2018
S&P 500 (r)Fed balance sheet (l)
2008 = 100
75
125
175
225
275
source: Bloomberg, Robeco
OVERWAARDERING LATE CYCLE CHINESE SCHULD MONETAIR BELEID
RISICO IN DE MARKT

OVERWAARDERING LATE CYCLE CHINESE SCHULD MONETAIR BELE ID
MAAR OOK RUIMTE VOOR OPTIMISME
RISICO IN DE MARKT
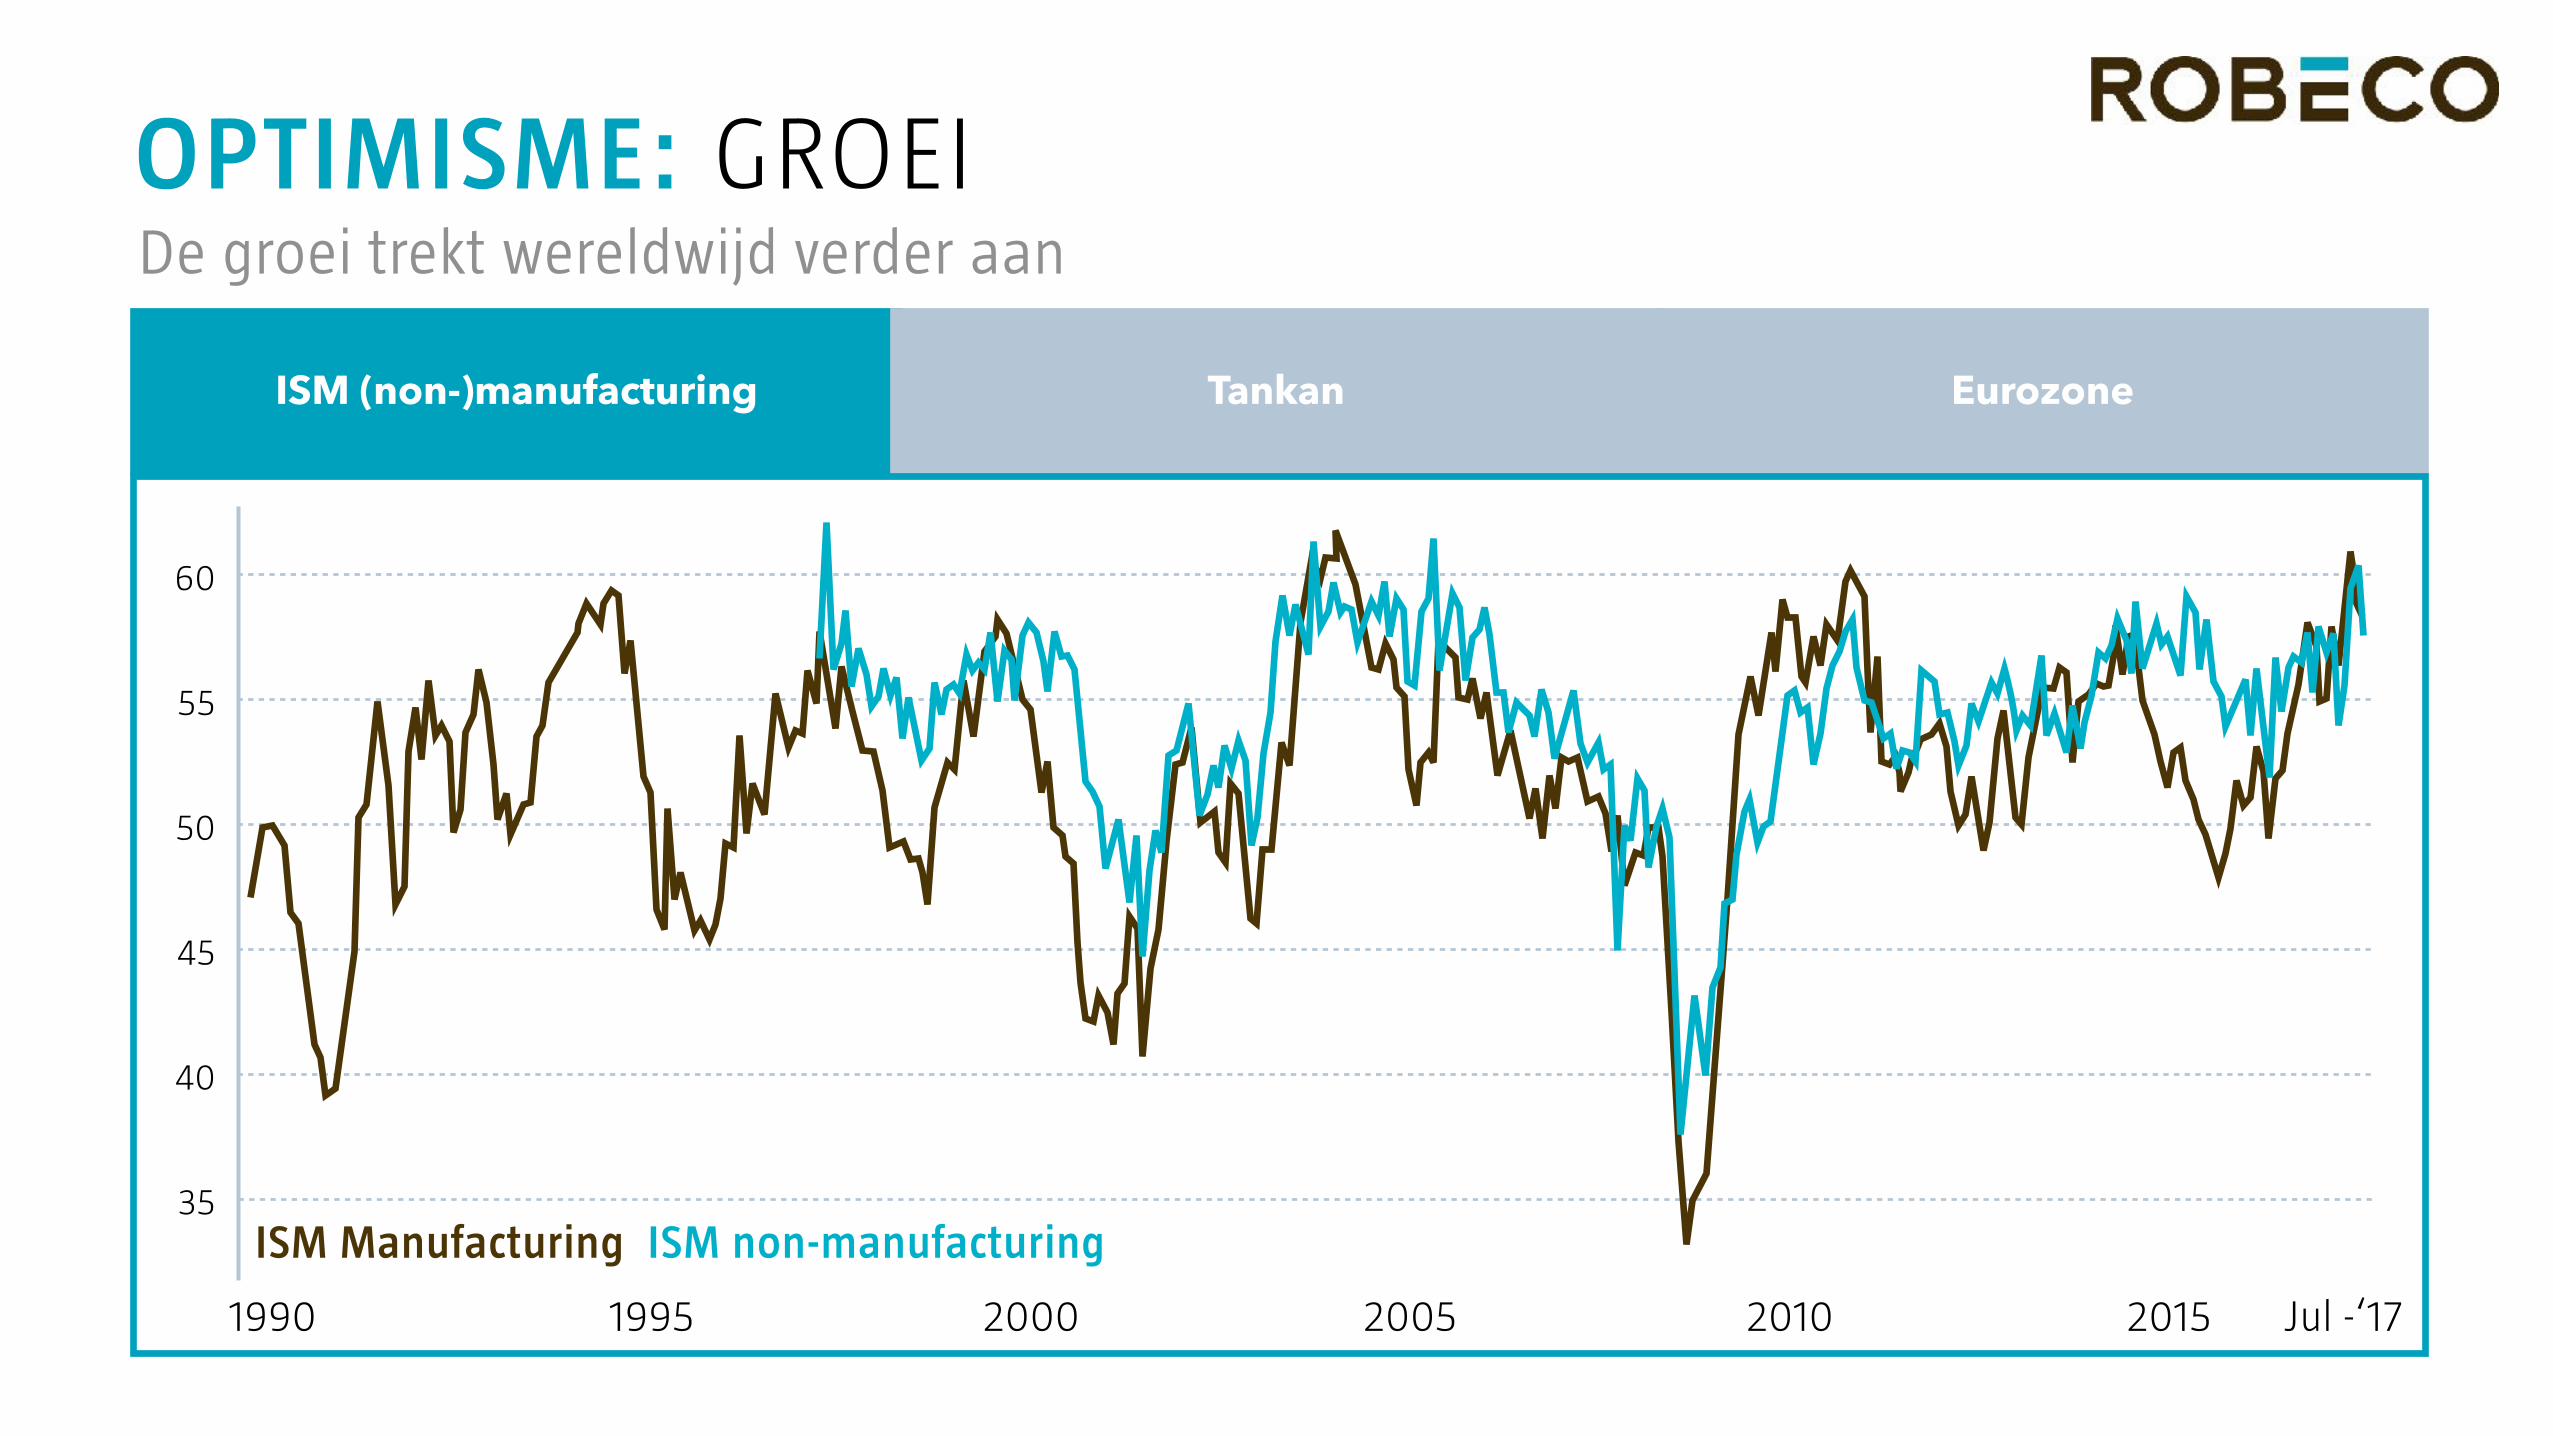
OPTIMISME: GROEI De groei trekt wereldwijd verder aan
ISM (non-)manufacturing Tankan Eurozone
ISM Manufacturing35
40
45
50
55
1990 1995 2000 2005 2010 2015
60
Jul -‘17
ISM non-manufacturing

OPTIMISME: GROEI De groei trekt wereldwijd verder aan
source: Thomson Reuters Datastream
Large manufacturers actual-60
-40
-20
0
20
2000 2002 2004 2006 2008 2010 2012 2014 2016
40
ISM (non-)manufacturing Tankan Eurozone

OPTIMISME: GROEI De groei trekt wereldwijd verder aan
PMI Output Index25
30
35
40
45
50
55
60
’98
65
-6
-5
-4
-3
-2
-1
0
1
3
2
’99 ’00 ’01 ’02 ’03 ’04 ’05 ’06 ’07 ’08 ’09 ’10 ’11 ’12 ’13 ’14 ’15 ’16 ’17
Eurozone PMI Output Index, sa, 50 = no change Eurostat, 3m/3m % change
Industrial Production (excluding construction)
ISM (non-)manufacturing Tankan Eurozone

Duitse kapitaalmarkt rente
FAVORIETE UITKOMST
5
4
3
2
1
0
-12007 2008 2009 2010 2011 2012 2013 2014 2015 2016 2017 2018
source: Bloomberg, Robeco

Aandelenmarkten
FAVORIETE UITKOMST
2007 2008 2009 2010 2011 2012 2013 2014 2015 2016 2017 2018source: Bloomberg, Robeco

OVERWAARDERING LATE CYCLE CHINESE SCHULD MONETAIR BELE ID
MOMENTUM STERK INFLATIE AFWEZIG CENTRALE BANKEN
RISICO’S
OPTIMISME
DISCLAIMER
DisclaimerRobeco Institutional Asset Management B.V., hereafter Robeco, has a license as manager of UCITS and AIFs from the Netherlands Authority for the Financial Markets in Amsterdam. This statement is intended for professional investors. Therefore, the information set forth herein is not addressed and must not be made available, in whole or in part, to other parties, such as retail clients. Robeco disclaims all liability arising from uses other than those specified herein. Without further explanation this presentation cannot be considered complete. It is intended to provide the professional investor with general information on Robeco’s specific capabilities, but does not constitute a recommendation or an advice to buy or sell certain securities or investment products. All rights relating to the information in this presentation are and will remain the property of Robeco. No part of this presentation may be reproduced, saved in an automated data file or published in any form or by any means, either electronically, mechanically, by photocopy, recording or in any other way, without Robeco's prior written permission. The information contained in this publication is not intended for users from other countries, such as US citizens and residents, where the offering of foreign financial services is not permitted, or where Robeco's services are not available. The prospectus and the Key Investor Information Document for the Robeco Funds can all be obtained free of charge at www.robeco.com. Investment involves risks. Before investing, please note the initial capital is not guaranteed. The value of the investments may fluctuate. Past performance is no guarantee of future results. Historical returns are provided for illustrative purposes only. The price of units may go down as well as up and the past performance is not indicative of future performance. If the currency in which the past performance is displayed differs from the currency of the country in which you reside, then you should be aware that due to exchange rate fluctuations the performance shown may increase or decrease if converted into your local currency.

Related Documents


