Plastics – the Facts 2017 An analysis of European plastics production, demand and waste data

Welcome message from author
This document is posted to help you gain knowledge. Please leave a comment to let me know what you think about it! Share it to your friends and learn new things together.
Transcript
Plastics – the Facts 2017
An analysis of European plastics production, demand and waste data

Plastics – the Facts is an analysis
of the data related to the
production, demand and waste
management of plastic materials.
It provides the latest business
information on production and
demand, trade, recovery as well
as employment and turnover in
the plastics industry. In short,
this report gives an insight into
the industry’s contribution to
European economic growth and
prosperity throughout the life
cycle of the material.

The data presented in this report was collected by PlasticsEurope
(the Association of Plastics Manufacturers in Europe) and
EPRO (the European Association of Plastics Recycling and
Recovery Organisations). PlasticsEurope’s Market Research
and Statistics Group (PEMRG) provided input on the production
and the demand of plastic raw materials. Conversio Market &
Strategy GmbH helped assess waste collection and recovery
data. Official statistics from European or national authorities
and waste management organisations have been used for
recovery and trade data, where available. Research or expertise
from consultants completed gaps.
Figures cannot always be directly compared with those of
previous years due to changes in estimates. Some estimates
from previous years have been revised in order to track
progress, e.g. for use and recovery of plastics across Europe
over the past decade.
All figures and graphs in this report show data for EU-28 plus
Norway and Switzerland, which is referred to as Europe for the
purposes of abbreviation – other country groups are explicitly
listed.
3
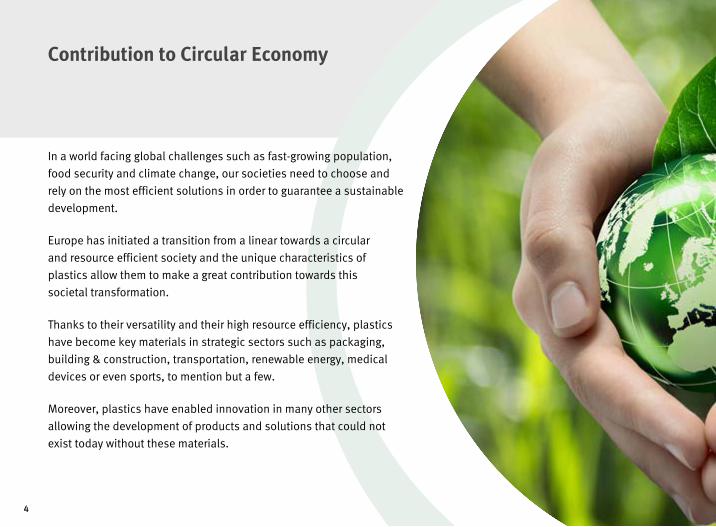
In a world facing global challenges such as fast-growing population,
food security and climate change, our societies need to choose and
rely on the most efficient solutions in order to guarantee a sustainable
development.
Europe has initiated a transition from a linear towards a circular
and resource efficient society and the unique characteristics of
plastics allow them to make a great contribution towards this
societal transformation.
Thanks to their versatility and their high resource efficiency, plastics
have become key materials in strategic sectors such as packaging,
building & construction, transportation, renewable energy, medical
devices or even sports, to mention but a few.
Moreover, plastics have enabled innovation in many other sectors
allowing the development of products and solutions that could not
exist today without these materials.
Contribution to Circular Economy
4

Plastics materials and plastic products are extremely resource efficient along their service life, helping us to avoid food waste, to save energy and to decrease CO
2 emissions.
At the end of their use life they can be repaired or re-used, but ultimately, they will become waste, and this waste is actually a new resource that needs to be placed back in the life cycle of plastics, closing thus the loop of Circular Economy.
However, to benefit from the full potential of plastics at the end of their first life, we need to push for the most sustainable option of waste management, fostering recycling, using energy recovery as a complementary option and restricting the landfill deposit of any recoverable plastic waste.
Improving Europe’s competitiveness and resource efficiency should be what we are striving for.
Plastics materials and the plastics industry can definitively make a significant contribution in this overarching goal.
5

Plastic materials are key for the transition towards a more resource
efficient and circular economy as they can help us to preserve
resources in every single step of a product.
For every product, solutions need to have a general overview
of the different stages over the life cycle of that specific product
and innovations need to be tailor-made based on that general
overview. That is where “Full Life Cycle Thinking” turns out to be
“Smart Thinking”.
In the production phase, resources are saved through the
diversification of feedstocks and process optimisations. During
the use phase, plastics offer the biggest resource savings. For
example, plastic insulation saves 250 times the energy used for it
production; thanks to plastic components, cars have 4 times lower
environmental impact and plastic packaging extend significantly
the shelve life of food reducing spoilage and waste.
Plastics save resources at each single step
6

At the end of their life, plastics are still very valuable resources that can be transformed into new feedstock or into energy.
Full life cycle thinking is smart thinking
Feedstock Use
Post - UseEN
ERGY
Plasticproduction
Productmanufacturing
REUSEREPAIR
Mechanicalrecycling
Energy recovery
Chemicalrecycling
7
Plastics
Others
Transport
Electricityand heating
4-6
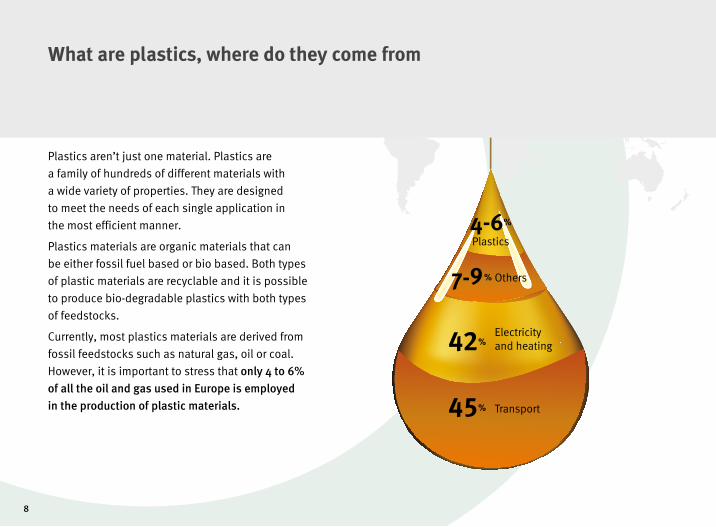
What are plastics, where do they come from
Plastics aren’t just one material. Plastics are
a family of hundreds of different materials with
a wide variety of properties. They are designed
to meet the needs of each single application in
the most efficient manner.
Plastics materials are organic materials that can
be either fossil fuel based or bio based. Both types
of plastic materials are recyclable and it is possible
to produce bio-degradable plastics with both types
of feedstocks.
Currently, most plastics materials are derived from
fossil feedstocks such as natural gas, oil or coal.
However, it is important to stress that only 4 to 6%
of all the oil and gas used in Europe is employed
in the production of plastic materials.
8
Plastics
Others
Transport
Electricityand heating
4-6
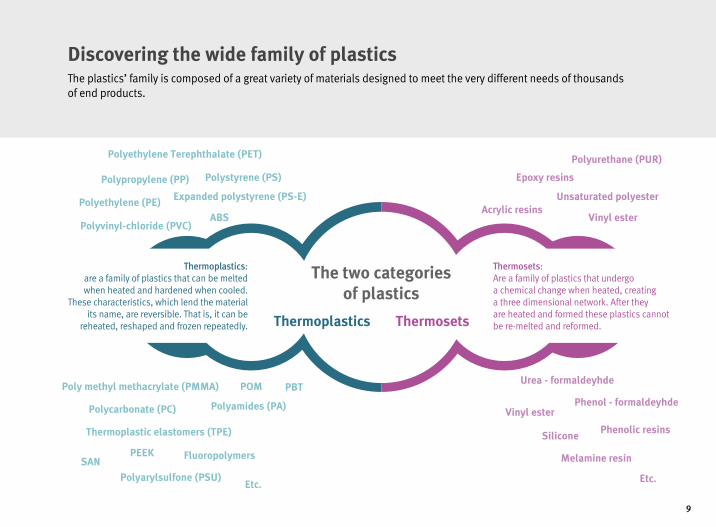
Discovering the wide family of plastics
Phenol - formaldeyhde
Epoxy resins
Vinyl ester
Vinyl ester
Silicone
Melamine resin
Unsaturated polyester
Phenolic resins
Etc.
Polyurethane (PUR)
Urea - formaldeyhde
Acrylic resinsPolyethylene (PE)
Polyamides (PA)
Polypropylene (PP)
Polycarbonate (PC)
ABS
Etc.
SANPEEK
POM PBT
Expanded polystyrene (PS-E)
Polyarylsulfone (PSU)
Polystyrene (PS)
Thermoplastic elastomers (TPE)
Polyethylene Terephthalate (PET)
Poly methyl methacrylate (PMMA)
Polyvinyl-chloride (PVC)
Fluoropolymers
The plastics’ family is composed of a great variety of materials designed to meet the very different needs of thousands of end products.
Thermoplastics:are a family of plastics that can be melted when heated and hardened when cooled.
These characteristics, which lend the material its name, are reversible. That is, it can be
reheated, reshaped and frozen repeatedly. Thermoplastics
Thermosets: Are a family of plastics that undergo a chemical change when heated, creating a three dimensional network. After they are heated and formed these plastics cannot be re-melted and reformed.
The two categories of plastics
Thermosets
9

PLAS TICS
PLAS TICSA key contributor
to European society
PLASTICS

The European plastics industry includes plastics raw materials producers, plastics converters, plastics recyclers
and plastics machinery manufacturers in the EU28 Member States.
Key figures of the European plastics industry
Close to 15 billion euros
The European plastics industry had a trade balance
of close 15 billion euros in 2016*
* Data including only plastics raw materials producers and
plastics converters
COMPANIES TURNOVERTRADE
BALANCE
Close to 60,000 companies
An industry in which close to 60,000 companies operate,
most of them SME’s
Close to 350 billion euros
The European plastics industry had a turnover
close to 350 billion euros in 2016
Over 1.5 million
The plastics industry gives direct employment
to over 1.5 million people in Europe
JOBS
12
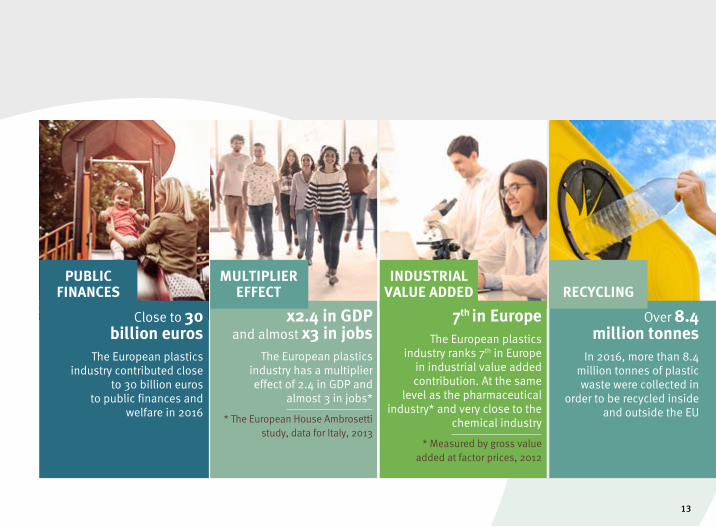
Close to 30 billion euros
The European plastics industry contributed close
to 30 billion euros to public finances and
welfare in 2016
Over 8.4 million tonnes
In 2016, more than 8.4 million tonnes of plastic waste were collected in
order to be recycled inside and outside the EU
7th in EuropeThe European plastics
industry ranks 7th in Europe in industrial value added contribution. At the same
level as the pharmaceutical industry* and very close to the
chemical industry
* Measured by gross value added at factor prices, 2012
x2.4 in GDP and almost x3 in jobs
The European plastics industry has a multiplier effect of 2.4 in GDP and
almost 3 in jobs*
* The European House Ambrosetti study, data for Italy, 2013
PUBLIC FINANCES
INDUSTRIAL VALUE ADDED
MULTIPLIER EFFECT RECYCLING
13

PLAS TICS

PLAS TICSMarket data
PLASTICS
2015
2015
2016
2016
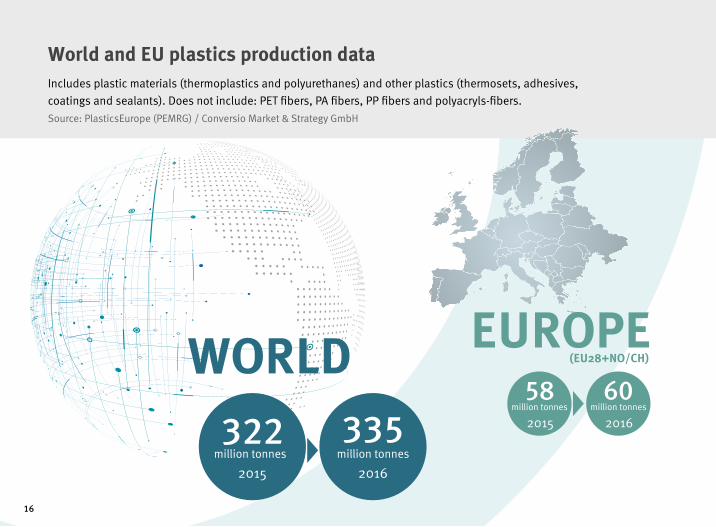
World and EU plastics production data
WORLD322
58
33560
Includes plastic materials (thermoplastics and polyurethanes) and other plastics (thermosets, adhesives,
coatings and sealants). Does not include: PET fibers, PA fibers, PP fibers and polyacryls-fibers.
Source: PlasticsEurope (PEMRG) / Conversio Market & Strategy GmbH
EUROPE(EU28+NO/CH)
million tonnes
million tonnes million tonnes
million tonnes
16
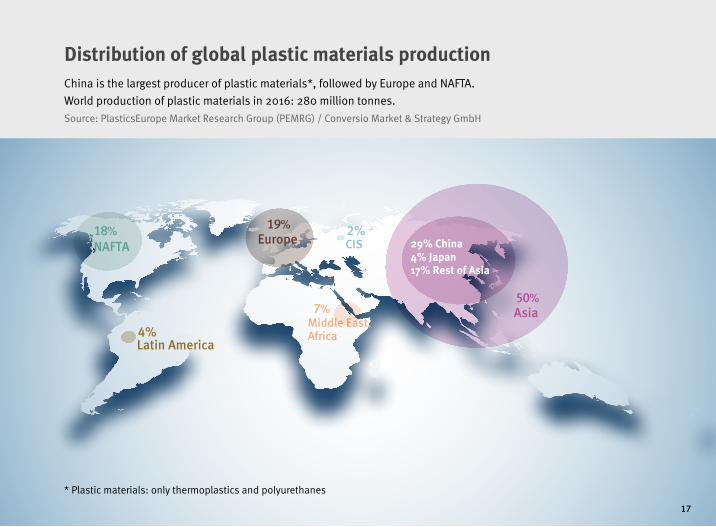
Distribution of global plastic materials productionChina is the largest producer of plastic materials*, followed by Europe and NAFTA.
World production of plastic materials in 2016: 280 million tonnes.
Source: PlasticsEurope Market Research Group (PEMRG) / Conversio Market & Strategy GmbH
* Plastic materials: only thermoplastics and polyurethanes
2%
4%Latin America
Middle East, Africa
CIS
Asia
18%
50%
19%
7%
NAFTA Europe 29% China 4% Japan17% Rest of Asia
17

Trade balance
Plastics processing extra EU28
A positive trade balance of around 15 billion euros in 2016.
Source: Eurostat
Extra-EU exports
Extra-EU trade balance
Extra-EU imports
Extra-EU exports
Extra-EU trade balance
Extra-EU imports
2012 2013 2014 2015 2016
bn€
14
12
10
8
6
4
2
0
5.2
2012 2013 2014 2015 2016
30
25
20
15
10
5
0
bn€
9.7
Plastics manufacturing extra EU28
18
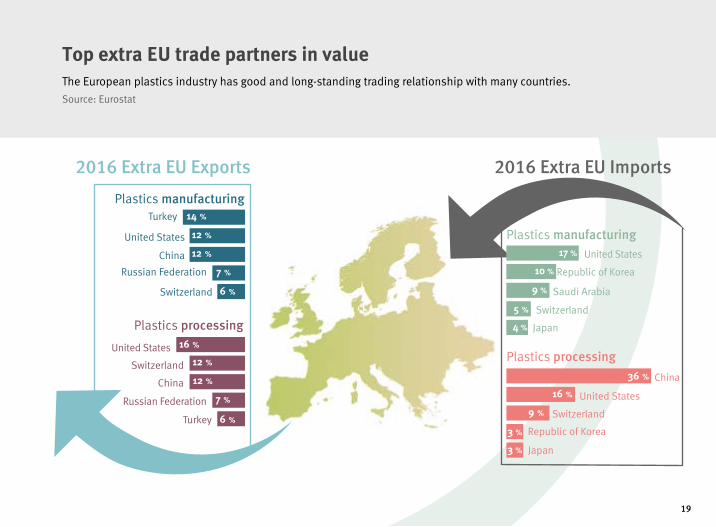
Top extra EU trade partners in valueThe European plastics industry has good and long-standing trading relationship with many countries.
Source: Eurostat
2016 Extra EU Imports2016 Extra EU Exports
Plastics processing
Turkey
China
Russian Federation
Switzerland
United States 16 %
12 %12 %
6 %
7 %
Plastics manufacturingTurkey
United States
China
Russian Federation
Switzerland 6 %
12 %12 %
7 %
14 %
Plastics manufacturingUnited States
Republic of Korea
Saudi Arabia
Switzerland
Japan
10 %
9 %
5 %
17 %
4 %
Plastics processing
China
United States
Switzerland
Republic of Korea
Japan
16 %9 %
36 %
3 %3 %
19

20
Hungary
United Kingdom
Sweden
Spain
Portugal
Poland
Netherlands
Italy
Switzerland
Germany
France
Czech Republic
Belgium & Lux.
Austria
Romania
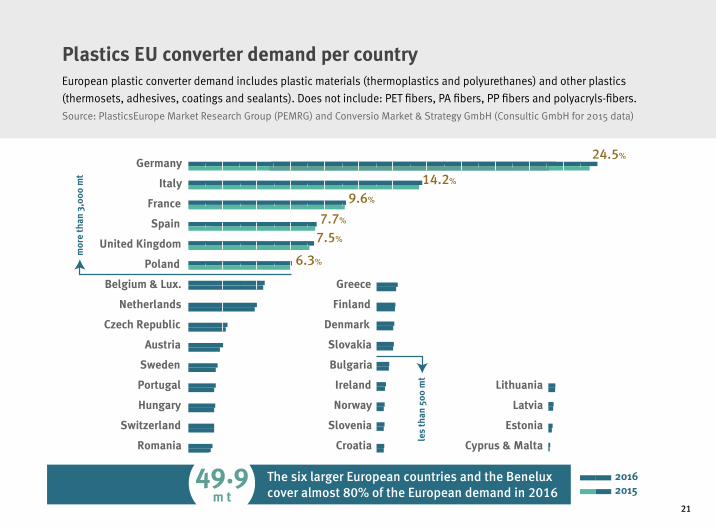
The six larger European countries and the Benelux cover almost 80% of the European demand in 2016
49.9 m t
Lithuania
Latvia
Estonia
Cyprus & Malta
Norway
Croatia
Slovakia
Ireland
Greece
Finland
Denmark
Slovenia
Bulgaria
mor
e th
an 3
,000
mt
les
than
500
mt
20162015
24.5%
14.2%
9.6%
7.5%
7.7%
6.3%
Plastics EU converter demand per country European plastic converter demand includes plastic materials (thermoplastics and polyurethanes) and other plastics
(thermosets, adhesives, coatings and sealants). Does not include: PET fibers, PA fibers, PP fibers and polyacryls-fibers.
Source: PlasticsEurope Market Research Group (PEMRG) and Conversio Market & Strategy GmbH (Consultic GmbH for 2015 data)
21
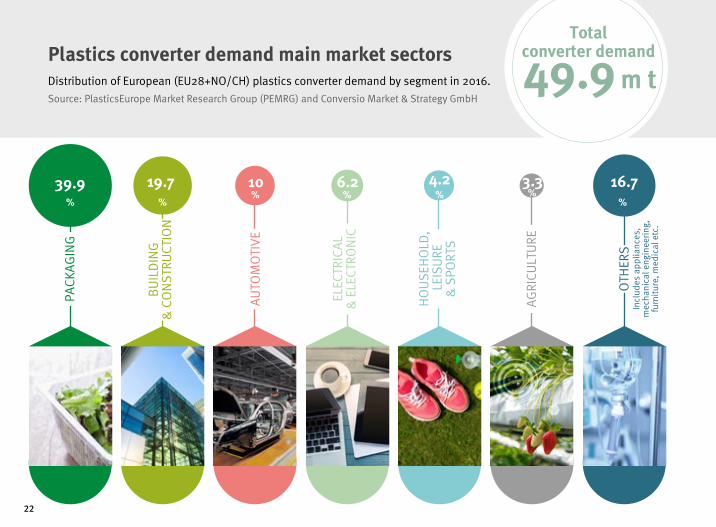
16.7%
OTH
ERS
Incl
udes
app
lianc
es,
mec
hani
cal e
ngin
eeri
ng,
furn
itur
e, m
edic
al e
tc.
Plastics converter demand main market sectorsDistribution of European (EU28+NO/CH) plastics converter demand by segment in 2016.
Source: PlasticsEurope Market Research Group (PEMRG) and Conversio Market & Strategy GmbH49.9 m t
39.9%
PACK
AG
ING
4.2%
HO
US
EHO
LD,
LEI
SU
RE
& S
PORT
S
10%
AU
TOM
OTI
VE
6.2%
ELEC
TRIC
AL
&
ELE
CTRO
NIC
3.3%
AG
RICU
LTU
RE
19.7%
BU
ILD
ING
&
CO
NS
TRU
CTIO
N
Total converter demand
22
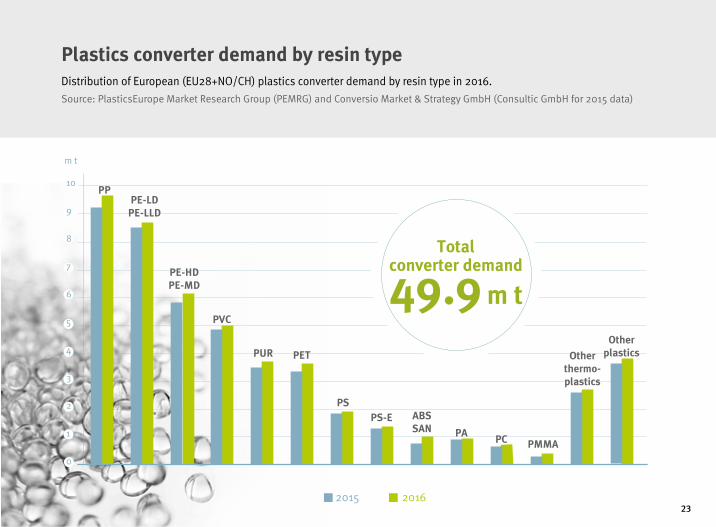
20162015
m t
PE-LDPE-LLD
PE-HDPE-MD
PVC
OtherplasticsPUR PET
PSABSSAN PA
PC PMMA
Otherthermo-plastics
PP10
9
8
7
6
5
4
3
2
1
0
PS-E
Plastics converter demand by resin typeDistribution of European (EU28+NO/CH) plastics converter demand by resin type in 2016.
Source: PlasticsEurope Market Research Group (PEMRG) and Conversio Market & Strategy GmbH (Consultic GmbH for 2015 data)
49.9 m t
Total converter demand
23

6.7% 7.4% 7.5% 10%12.3%
17.5% 19.3% 19.3%
Eyeglasses frames, plastic cups, egg trays
(PS); packaging, building insulation
(PS-E), etc.
Bottles for water, soft drinks,
juices, cleaners, etc.
Building insulation, pillows and mattresses,
insulating foams for fridges, etc.
Window frames, profiles, floor
and wall covering, pipes, cable
insulation, garden hoses, inflatable
pools, etc.
Toys, (PE-HD, PE-MD), milk bottles, shampoo bottles, pipes, houseware
(PE-HD), etc.
Reusable bags, trays and
containers, agricultural film
(PE-LD), food packaging film (PE-LLD), etc.
Food packaging, sweet and snack wrappers, hinged caps, microwave - proof containers, pipes, automotive parts, bank notes,
etc.
Hub caps (ABS); optical fibres (PBT); eyeglasses lenses,
roofing sheets (PC); Touch
screens (PMMA); cable coating in
telecommunications (PTFE); and many
others in aerospace, medical implants, surgical devices,
membranes, valves & seals, protective
coatings, etc.
PS, PS-E PET PUR PVCPE-HD, PE-MD
PE-LD PE-LLD
PP OTHERS
European plastics converter demand by polymer types in 2016Data for EU28+NO/CH
Source: PlasticsEurope Market Research Group (PEMRG) and Conversio Market & Strategy GmbH
24

PE-LD, P
E-LLD
PE-HD, P
E-MD PP PS
PS-EPVC
ABS, SAN
PMM
A PAPET
Other
ETP PUROth
er
plastics
PC
Packaging
Building & Construction
Automotive
Electrical &Electronic
Others
39.9%
19.7%
10%
6.2%
16.7%
Agriculture
Household,Leisure
& Sports
3.3%
4.2%
European plastics converter demand by segments and polymer types in 2016Data for EU28+NO/CH
Source: PlasticsEurope Market Research Group (PEMRG) and Conversio Market & Strategy GmbH
25

From waste to resource
PLASTICS
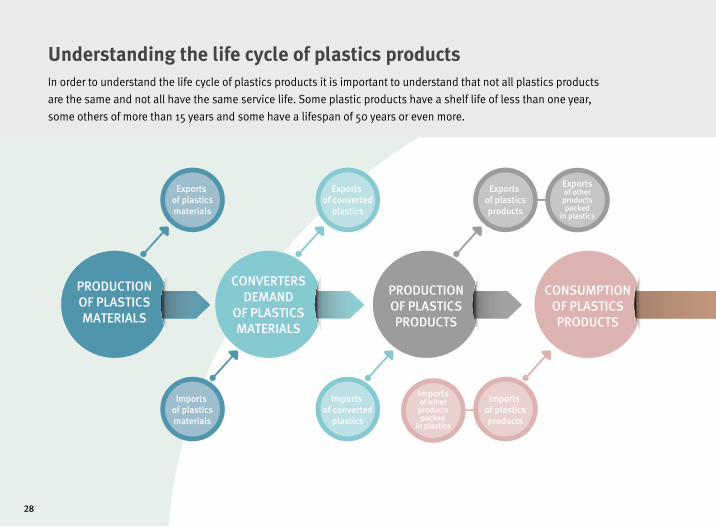
Understanding the life cycle of plastics productsIn order to understand the life cycle of plastics products it is important to understand that not all plastics products
are the same and not all have the same service life. Some plastic products have a shelf life of less than one year,
some others of more than 15 years and some have a lifespan of 50 years or even more.
PRODUCTIONOF PLASTICSMATERIALS
CONVERTERSDEMAND
OF PLASTICSMATERIALS
Exports of plasticsmaterials
Imports of plasticsmaterials
Exports of converted
plastics
Imports of converted
plastics
PRODUCTIONOF PLASTICSPRODUCTS
Importsof otherproductspacked
in plastics
CONSUMPTIONOF PLASTICSPRODUCTS
Imports of plasticsproducts
Exportsof otherproductspacked
in plastics
Exports of plasticsproducts
28

Thus, from production to waste, different plastic products have different life cycles and this is why the volume
of collected waste cannot match, in a single year, the volume of production or consumption.
PRODUCTIONOF PLASTICSMATERIALS
CONVERTERSDEMAND
OF PLASTICSMATERIALS
Exports of plasticsmaterials
Imports of plasticsmaterials
Exports of converted
plastics
Imports of converted
plastics
PRODUCTIONOF PLASTICSPRODUCTS
Importsof otherproductspacked
in plastics
CONSUMPTIONOF PLASTICSPRODUCTS
Imports of plasticsproducts
Exportsof otherproductspacked
in plastics
Exports of plasticsproducts
COLLECTEDWASTE
LIFE SERVICE OF PLASTICS PRODUCTS
27.3% 31.1%
LANDFILL RECYCLING
41.6%
ENERGYRECOVERY
NONCOLLECTED
WASTE
PLASTICWASTE
GENERATION
The service life of plastics products goes from less than 1 year to 50 years or more
Plastics become waste at the end of their service life
29
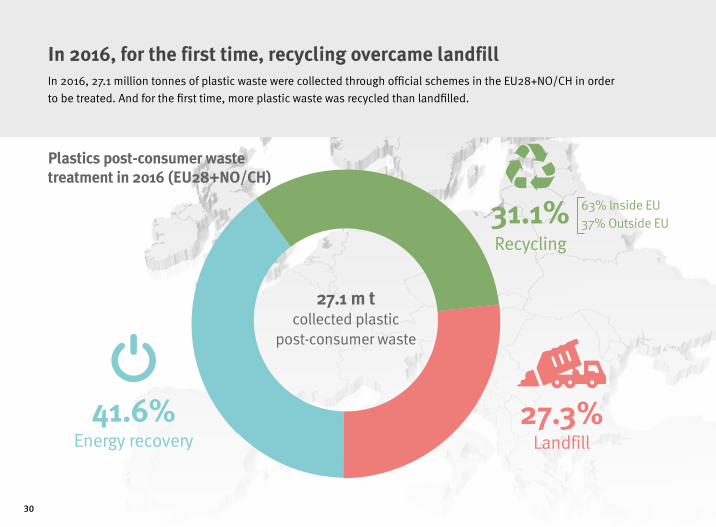
In 2016, for the first time, recycling overcame landfill
Recycling
27.1 m t collected plastic
post-consumer waste
31.1% 63% Inside EU37% Outside EU
41.6% 27.3%Energy recovery Landfill
In 2016, 27.1 million tonnes of plastic waste were collected through official schemes in the EU28+NO/CH in order
to be treated. And for the first time, more plastic waste was recycled than landfilled.
Plastics post-consumer waste treatment in 2016 (EU28+NO/CH)
30

Energyrecovery
+61%
In ten years, plastic waste recycling has increased by almost 80%
Recycling +79%
Landfill -43%
Total wastecollected
+11%
From 2006 to 2016 the volumes of plastic waste collected for recycling increased by 79%, energy recovery
increased by 61% and landfill decreased by 43%.
2006-2016 evolution of plastics waste treatment (EU28+NO/CH)
2006 2007 2008 2009 2010 2011 2012 2014 2016
30
25
20
15
10
5
0
m t
7.4
12.9
8.4
4.7
11.3
7.0
27.1
24.5
31

more than 50%
Countries with landfillrestrictions implemented
up to 50%
up to 30%
10% or less
Plastics waste going to landfill in 2016
Plastic waste recovery is still very uneven in Europe Although the total EU situation is improving, in many countries, landfill is still the first or second option of treatment
for plastic post-consumer waste.
Source: Conversio Market & Strategy GmbH
Plastics post-consumer waste landfill rate across Europe
32
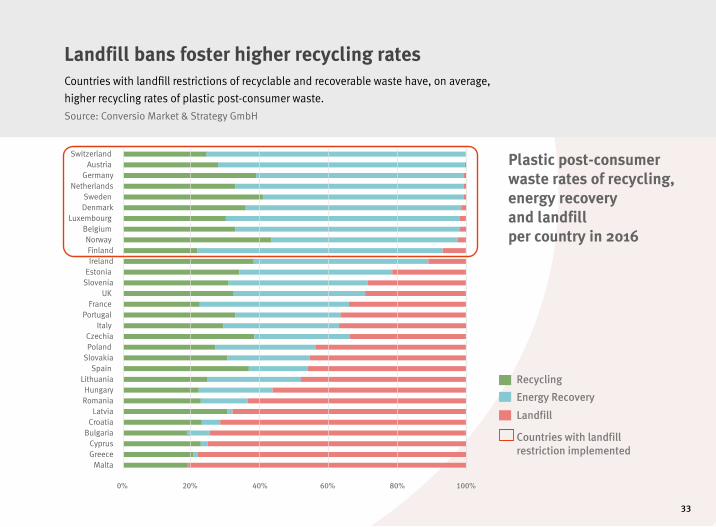
Landfill bans foster higher recycling ratesCountries with landfill restrictions of recyclable and recoverable waste have, on average,
higher recycling rates of plastic post-consumer waste.
Source: Conversio Market & Strategy GmbH
0% 20% 40% 60% 80% 100%
Recycling
Energy Recovery
Landfill
Countries with landfillrestriction implemented
MaltaGreeceCyprus
BulgariaCroatia
LatviaRomaniaHungary
LithuaniaSpain
SlovakiaPoland Czechia
Italy Portugal
France UK
SloveniaEstonia IrelandFinland
Norway Belgium
Luxembourg DenmarkSweden
NetherlandsGermany
Austria Switzerland Plastic post-consumer
waste rates of recycling, energy recovery and landfill per country in 2016
33
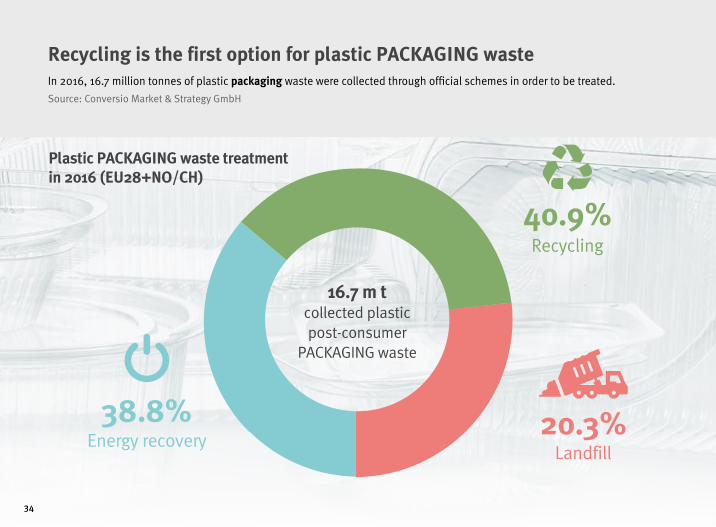
Recycling is the first option for plastic PACKAGING waste
Recycling
40.9%
38.8% 20.3%Energy recovery
Landfill
16.7 m t collected plastic post-consumer
PACKAGING waste
In 2016, 16.7 million tonnes of plastic packaging waste were collected through official schemes in order to be treated.
Source: Conversio Market & Strategy GmbH
Plastic PACKAGING waste treatment in 2016 (EU28+NO/CH)
34

In ten years, plastic PACKAGING recycling has increased by almost 75% From 2006 to 2016, the volume of plastic packaging waste collected for recycling increased by 74%, energy recovery
increased by 71% and landfill decrease by 53%.
Source: Conversio Market & Strategy GmbH
2007 2009 2010 2011 2012 2014 2012006 2008 6
20
15
10
5
0
m t
Recycling +74%
Energyrecovery
+71%
Landfill -53%
Total wastecollected +12%
2006-2016 evolution of plastic PACKAGING waste treatment (EU28+NO/CH)
7.2
3.4
3.9
6.8
3.8
6.5
14.9
16.7
35
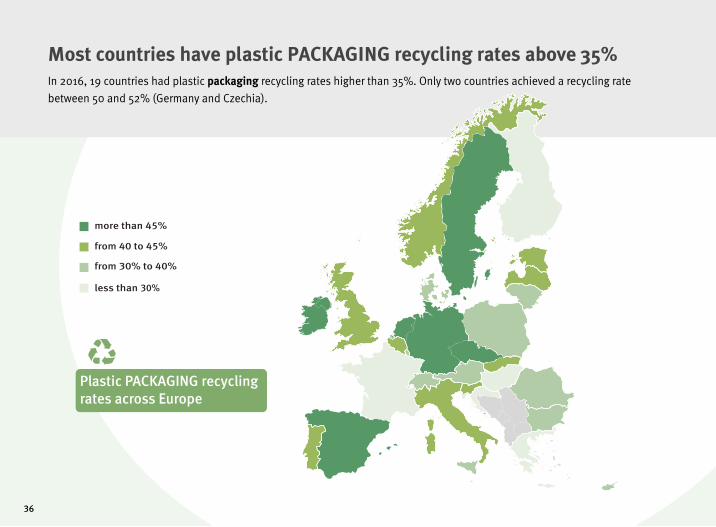
Most countries have plastic PACKAGING recycling rates above 35%In 2016, 19 countries had plastic packaging recycling rates higher than 35%. Only two countries achieved a recycling rate
between 50 and 52% (Germany and Czechia).
less than 30%
from 30% to 40%
from 40 to 45%
more than 45%
Plastic PACKAGING recycling rates across Europe
36
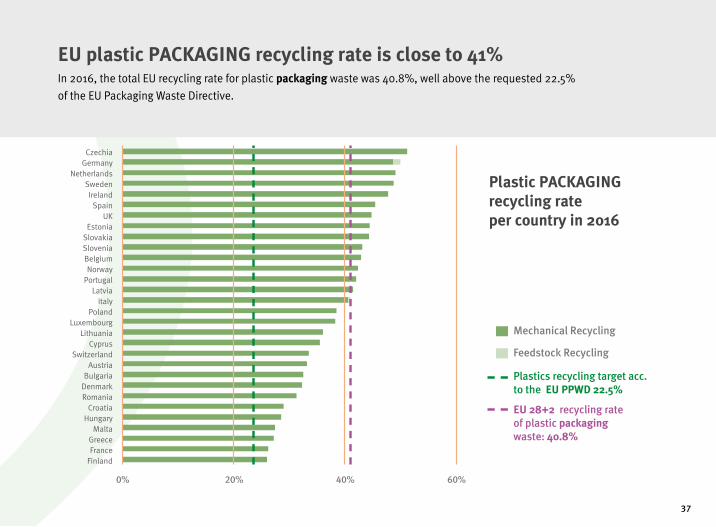
0% 20% 40% 60%
FinlandFranceGreece
MaltaHungary
CroatiaRomaniaDenmarkBulgaria
AustriaSwitzerland
CyprusLithuania
LuxembourgPoland
ItalyLatvia
PortugalNorway
BelgiumSloveniaSlovakia
EstoniaUK
SpainIreland
SwedenNetherlands
GermanyCzechia
Mechanical Recycling
Feedstock Recycling
Plastics recycling target acc.to the EU PPWD 22.5%
EU 28+2 recycling rateof plastic packagingwaste: 40.8%
EU plastic PACKAGING recycling rate is close to 41%In 2016, the total EU recycling rate for plastic packaging waste was 40.8%, well above the requested 22.5%
of the EU Packaging Waste Directive.
Plastic PACKAGING recycling rate per country in 2016
37

PLAS TICS

PLAS TICSSnapshot
and outlooks
PLASTICS

Plastics industry production in EU28 index (2010=100, trend cycle & seasonally adjusted data).
60
70
80
90
100
110
120
130
140
Manufacture of plastic and rubber machinery
Manufacture of plastics in primary forms
Manufacture of plastics products
1992 1993 1994 1995 1996 1997 1998 1999 2000 2001 2002 2003 2004 2005 2006 2007 2008 2009 2010 2011 2012 2013 2014 2015 2016 2017
year
Index
In 2017, all the sectors of the plastic value chain grew dynamically
All plastic sectors could grow dynamically in 2017
40
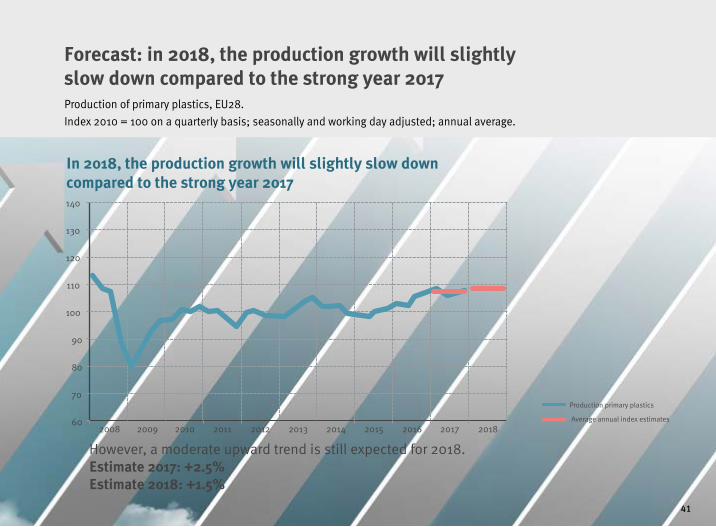
Forecast: in 2018, the production growth will slightly slow down compared to the strong year 2017Production of primary plastics, EU28.
Index 2010 = 100 on a quarterly basis; seasonally and working day adjusted; annual average.
In 2018, the production growth will slightly slow down compared to the strong year 2017
Production primary plastics
Average annual index estimates
However, a moderate upward trend is still expected for 2018. Estimate 2017: +2.5%Estimate 2018: +1.5%
60
70
80
90
100
110
120
130
140
2008 2009 2010 2011 2012 2013 2014 2015 2016 2017 2018
41

Glossary of terms
ABS Acrylonitrile butadiene styrene resin
ASA Acrylonitrile styrene acrylate resin
bn billion
CH Switzerland
CIS Commonwealth of Independent States
Conversio Conversio Market & Strategy GmbH
EU European Union
EPRO European Association of Plastics Recycling and Recovery Organisations
ETP Engineering Thermoplastics
GDP Gross domestic product
m t Million tonnes
NAFTA North American Free Trade Agreement
NO Norway
Other plastics Thermosets, adhesives, coatings and sealants
PA Polyamides
PBT Polybutylene terephthalate
PC Polycarbonate
PE Polyethylene
PEEK Polyetheretherketone
PE-HD Polyethylene, high density
PE-LD Polyethylene, low density
PE-LLD Polyethylene, linear low density
PE-MD Polyethylene, medium density
PEMRG PlasticsEurope Market Research Group
PET Polyethylene terephthalate
Plastic materials Thermoplastics + Polyurethanes
PMMA Polymethyl methacrylate
POM Polyoxymethylene
PP Polypropylene
PS Polystyrene
PS-E Polystyrene, expandable
PTFE Polytetrafluoroethylene
PUR Polyurethane
PVC Polyvinyl chloride
SAN Styrene-acrylonitrile copolymer
Thermoplastics Standard plastics (PE, PP, PVC, PS, EPS, PET (bottle grade)) + Engineering plastics (ABS, SAN, PA, PC, PBT, POM, PMMA, Blends, and others including High Performance Polymers)
Thermosets Urea-formaldehyde foam, melamine resin, polyester resins, epoxy resins, etc.
PlasticsEurope
PlasticsEurope is one of the leading European trade associations with centres in Brussels, Frankfurt, London, Madrid,
Milan and Paris. We are networking with European and national plastics associations and have more than 100 member
companies, producing over 90% of all polymers across the EU28 member states plus Norway, Switzerland and Turkey.
The European plastics industry makes a significant contribution to the welfare in Europe by enabling innovation,
creating quality of life to citizens and facilitating resource efficiency and climate protection. More than 1.45 million
people are working in more than 60,000 companies (mainly small and medium sized companies in the converting
sector) to create a turnover around 350 bn EUR per year.
www.plasticseurope.org
EPRO (European Association of Plastics Recycling and Recovery Organisations)
EPRO is a pan-European partnership of specialist organisations that are able to develop and deliver efficient solutions
for the sustainable management of plastic waste, now and for the future. EPRO members are working to optimise
national effectiveness through international co-operation: by studying successful approaches, evaluating different
solutions and examining obstacles to progress. By working together EPRO members can achieve synergies that will
increase efficient plastics recycling and recovery. Currently 19 organisations in 14 European countries, South Africa
and Canada are represented in EPRO.
www.epro-plasticsrecycling.org

© 2018 PlasticsEurope. All rights reserved.
01-
2018
Avenue E. van Nieuwenhuyse 4/3
1160 Brussels – Belgium
Phone +32 (0)2 675 32 97
www.plasticseurope.org
www.plastics-themag.com
@PlasticsEurope
/plasticseurope
Konigin Astridlaan 59
1780 Wemmel – Belgium
Phone +32 (0)2 456 84 49
Fax +32 (0)2 456 83 39
www.epro-plasticsrecycling.org
Related Documents