Plastic Waste Recycling and Greenhouse Gas Reduction Taking Copenhagen as an example from life cycle assessment perspective Hong Ren Master Thesis Department of Development and Planning Aalborg University, Denmark June 2012

Welcome message from author
This document is posted to help you gain knowledge. Please leave a comment to let me know what you think about it! Share it to your friends and learn new things together.
Transcript

Plastic Waste Recycling and
Greenhouse Gas Reduction
Taking Copenhagen as an example from life cycle
assessment perspective
Hong Ren
Master Thesis
Department of Development and Planning
Aalborg University, Denmark
June 2012


Plastic Waste Recycling and
Greenhouse Gas Reduction
Taking Copenhagen as an example from life cycle assessment
perspective
Master Thesis
Hong Ren
MSc in Environmental Management
Department of Development and Planning
Aalborg University, Denmark
Supervisor
Assoc. Prof. Søren Løkke
External Examiner
Henrik Wenzel
June 2012
Cover picture source: http://jiaju.sina.com.cn/news/153048347.html


Acknowledgements
This thesis preparation started from Feb 2012 and finished in June 2012. I would like
to compare it to a journey, departing from the dock with the initial plan, discovering
solutions for the encountered problems on the way and finally stepping out with
gains.
Therefore, I would like to express my deepest gratitude to my supervisor Prof. Søren
Løkke for his persistent guidance and help during the whole process from topic
selection to data and material communication, and also for his patience on my
various questions and detailed explains on the use of Sima Pro software. I am very
grateful for his professional support, comments and inspirations.
I would also thank Matthew Cashmore and Ole Busck as well as my classmates for
their kindly advices and suggestions on dissertation progress review seminar.
Finally, I wish to thank my parents for their support and encouragements. And also
thank everyone who has helped me out of frustration times!


- 1 -
Table of Contents
ACRONYMS ........................................................................................................ - 3 -
ABSTRACT ......................................................................................................... - 4 -
1. INTRODUCTION ............................................................................................... - 5 -
1.1 Plastic waste management in EU ..................................................................- 7 -
1.2 Research question ...................................................................................... - 11 -
2. PLASTIC WASTE MANAGEMENT IN COPENHAGEN ..................................................... - 12 -
2.1 Regulation on plastic waste ....................................................................... - 12 -
2.2 Current plastic waste stream figures ......................................................... - 14 -
3. LITERATURE REVIEW ........................................................................................ - 18 -
3.1 Development of LCA in plastic waste management ................................... - 18 -
3.2 Different options for plastic waste recycling .............................................. - 20 -
3.3 Mixed plastic sorting method..................................................................... - 20 -
4. METHODOLOGY ............................................................................................. - 25 -
4.1 Life cycle assessment in waste management ............................................ - 25 -
4.2 Consequential LCA ...................................................................................... - 26 -
4.3 Tool—Sima Pro 7.3 ..................................................................................... - 27 -
5. LCA ON PLASTIC WASTE TREATMENT .................................................................. - 28 -
5.1 Goal and Scope ........................................................................................... - 28 -
5.2 Life Cycle Inventory .................................................................................... - 36 -

- 2 -
5.3 Life Cycle Impact Assessment ..................................................................... - 44 -
5.4 Interpretation ............................................................................................. - 57 -
6. CONCLUSIONS ............................................................................................... - 64 -
6.1 General conclusion ..................................................................................... - 64 -
6.2 Conclusion on LCA study ............................................................................. - 65 -
7. FURTHER CONSIDERATIONS ............................................................................... - 67 -
REFERENCES ..................................................................................................... - 69 -
APPENDIXⅠ DATA COLLECTION ............................................................................ - 75 -
NIR sorting (Titech) .......................................................................................... - 75 -
Pyrolysis (BP) .................................................................................................... - 75 -
Gasification (SVZ) ............................................................................................. - 76 -
Hydrogenation (Veba Oel) ................................................................................ - 77 -
Electricity .......................................................................................................... - 78 -
APPENDIXⅡ UNIT PROCESS USED IN ECOINVENT ...................................................... - 80 -
Incineration ...................................................................................................... - 80 -
Mechanical recycling ........................................................................................ - 80 -
Electricity and heat in Denmark ....................................................................... - 80 -
Electricity in Europe .......................................................................................... - 81 -
Transport .......................................................................................................... - 81 -
Others ............................................................................................................... - 81 -
APPENDIXⅢ CHEMICAL RECYCLING TECHNOLOGIES .................................................... - 82 -
- 3 -
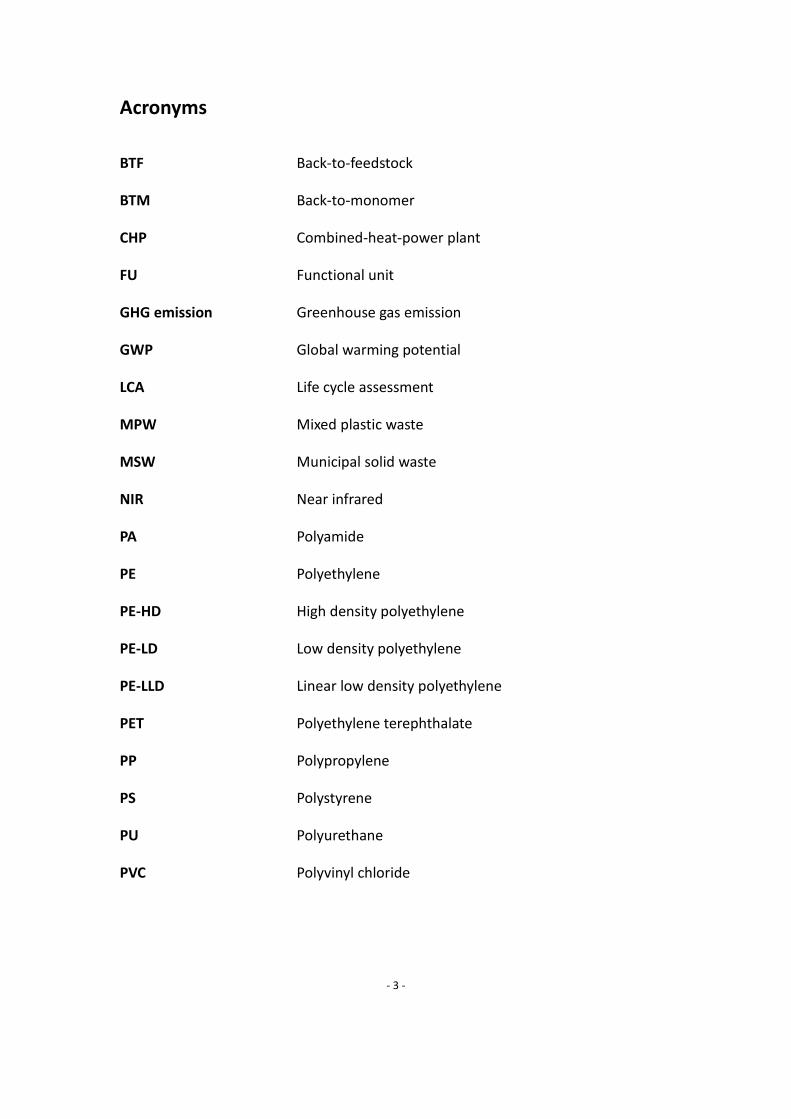
Acronyms
BTF Back-to-feedstock
BTM Back-to-monomer
CHP Combined-heat-power plant
FU Functional unit
GHG emission Greenhouse gas emission
GWP Global warming potential
LCA Life cycle assessment
MPW Mixed plastic waste
MSW Municipal solid waste
NIR Near infrared
PA Polyamide
PE Polyethylene
PE-HD High density polyethylene
PE-LD Low density polyethylene
PE-LLD Linear low density polyethylene
PET Polyethylene terephthalate
PP Polypropylene
PS Polystyrene
PU Polyurethane
PVC Polyvinyl chloride
- 4 -
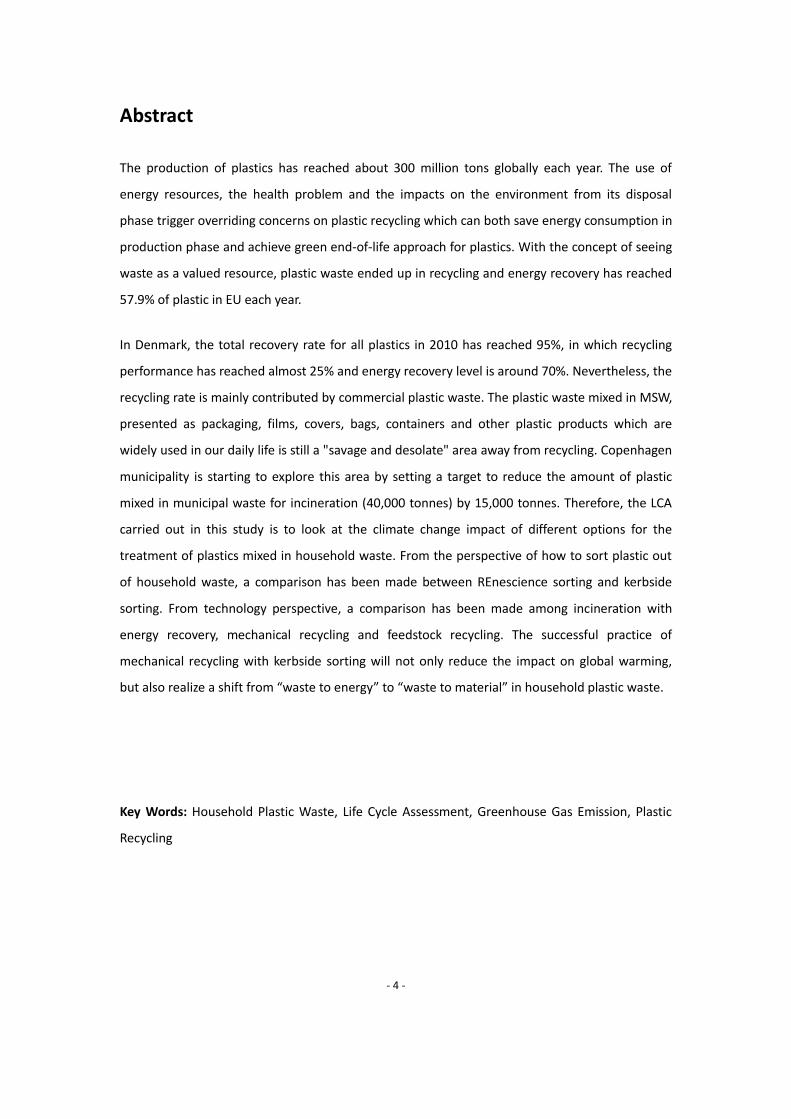
Abstract
The production of plastics has reached about 300 million tons globally each year. The use of
energy resources, the health problem and the impacts on the environment from its disposal
phase trigger overriding concerns on plastic recycling which can both save energy consumption in
production phase and achieve green end-of-life approach for plastics. With the concept of seeing
waste as a valued resource, plastic waste ended up in recycling and energy recovery has reached
57.9% of plastic in EU each year.
In Denmark, the total recovery rate for all plastics in 2010 has reached 95%, in which recycling
performance has reached almost 25% and energy recovery level is around 70%. Nevertheless, the
recycling rate is mainly contributed by commercial plastic waste. The plastic waste mixed in MSW,
presented as packaging, films, covers, bags, containers and other plastic products which are
widely used in our daily life is still a "savage and desolate" area away from recycling. Copenhagen
municipality is starting to explore this area by setting a target to reduce the amount of plastic
mixed in municipal waste for incineration (40,000 tonnes) by 15,000 tonnes. Therefore, the LCA
carried out in this study is to look at the climate change impact of different options for the
treatment of plastics mixed in household waste. From the perspective of how to sort plastic out
of household waste, a comparison has been made between REnescience sorting and kerbside
sorting. From technology perspective, a comparison has been made among incineration with
energy recovery, mechanical recycling and feedstock recycling. The successful practice of
mechanical recycling with kerbside sorting will not only reduce the impact on global warming,
but also realize a shift from “waste to energy” to “waste to material” in household plastic waste.
Key Words: Household Plastic Waste, Life Cycle Assessment, Greenhouse Gas Emission, Plastic
Recycling

- 5 -
1. Introduction
The industrial scale production of plastics since the 1940s has transformed our everyday life
(Al-Salem, Lettieri and Baeyens 2009). Given the versatile properties of plastics, such as it being
inexpensive, lightweight, durable and strong, the production and usage of plastics has increased
sharply ever since 1950 (Thompson, et al. 2009). In 2007, the production of plastics had reached
260 million tonnes per year all over the world and the turnover of European plastic industry had
been in excess of 300 million euros with employment of 1.6 million people (PlasticsEurope 2008).
During the “plastic age”, plastics have been substantially involved in all aspects of daily life and
have been considerably spreading their application potentials in scientific and medical advances
(Thompson, et al. 2009) (Figure 1.1).
Figure 1.1: Global plastic production (Mt) with historical stages in the development, production and use of
plastics, and associated concerns and legislative measures (European Commission DG ENV 2011)

- 6 -
However, plastics, as materials, are generating environmental and health problems considerably.
One disadvantage is that plastic production relies heavily on the use of finite resources—fossil
fuels. With the increasing demand of plastics around the world, huge amount of finite energy
resources will be used up rapidly in current linear consumption of fossil fuels, “from oil to waste
via plastics” (Thompson, et al. 2009). In addition, additives used to mix polymer resins and
optimize the performance of materials are the cause of concerns on health issues. On the one
side, the toxicity of some additive chemicals may have negative effects in animal or human
populations; on the other side, mixed polymers are much more difficult and complicated to
recycle than products made of a single polymer (Hopewell, Dvorak and Kosior 2009).
Another crucial problem comes from the end-of–life phase of plastic materials. Considerable
accumulation of plastic wastes in the natural environment and in landfills “contaminates a wide
range of natural terrestrial, freshwater and marine habitats, with newspaper accounts of plastic
debris on even some of the highest mountains” (Thompson, et al. 2009). In terms of marine
environment, the buoyant nature of plastics makes substantial quantities of cartons, bottles and
bags floating on the sea surface. In addition to the visual disturbance, it also causes extremely
high incidence of ingestion and entanglement by marine life (R. Thompson, et al. 2005, Cole, et al.
2011). To step further, there is speculation on the transferable potential of toxic chemicals from
plastics in the food chain (Holmes, Turner, and Thompson 2012). Secondly, Landfill of plastic
waste also attracts most attention. On the one side, landfill requires large area of land and causes
aesthetic problems. On the other side, it is also under the risk that leachate of hazardous
chemicals may lead to inadvertent soils contamination and be carried into streams, rivers and
ultimately the sea (European Commission DG ENV 2011).
As a consequence, both of the use of resources and the impacts on the environment and health
trigger overriding concerns about how to find and build a sustainable way which can both save
energy consumption in production phase and achieve green end-of-life approach for plastics in
face of the increasing demanding on plastics. Hence, considerable concern has been focused on
plastic waste management. It ranges from evolution of broadly strategic frameworks to more
detailed perspectives of behavioural guidance, from basic landfill treatment to energy recovery,
recycling and environmental footprint of plastics, and prevention.
Prevention, advocated in the new Waste Framework Directive (WFD-2008/98/EC), is the best
option to prevent waste generation in the first place; while recycling is positioned as the second

- 7 -
priority. Specifically on plastic waste, in some cases the negative impacts brought by plastics can
be alleviated or even eliminated if we are to simply reduce the production of plastics or
substitute them by alternative materials. For example, in 1994, Denmark started to impose a tax
on plastic bags for retailers to advocate reusable bags (CleanUp Australia 2010). This tax reduced
plastic bag use by one-third (CleanUp Australia 2010). However, in some other fields the markets
of plastic products are in expansion, such as in medical, wind power and construction industries
(Pilz, Brandt and Fehringer 2010, R. C. Thompson, et al. 2009). In these cases, recycling can be
regard as another way to achieve prevention. By transforming wastes into resources, huge
amount of plastic waste find its outlet, at the same time, virginal plastic production will be
reduced as certain amount of virginal plastic can be substituted by recovered materials
correspondingly.
Therefore, this study is going to focus on carbon footprint analysis of plastic waste recycling and
take Copenhagen municipality as an example. Before venturing to that, the next parts will
present an overview of the history development of plastic treatment in EU countries and in
Copenhagen, Denmark.
1.1 Plastic waste management in EU
In the EU scope, up to 3 billion tonnes of waste is produced every year, which imposes huge
impact on the environment bringing about pollution and greenhouse gas (GHG) emissions that
contribute to climate change, as well as significant losses of raw materials and energy (European
Commission 2010). Plastic waste has been involved in the municipal solid waste (MSW)
considerably, concentrated in packaging, films, covers, bags, containers and so on with widely
used in our daily life (Al-Salem, Lettieri and Baeyens 2009). Over the past 30 years, MSW
management has been driven by European waste policy which has evolved through
“environmental action plans and a framework of legislation” (European Commission 2010) with
the awareness of importance of reducing waste negative impacts. In 2005, a long-term strategy
on waste brought a modernised approach to waste management which started a new era of EU
waste policy. The new strategy originated from the EU’s Sixth Environment Action Programme has
been reflected in the Waste Framework Directive (WFD-2008/98/EC). With a focus on waste
prevention, it marks “a shift away from thinking about waste as an unwanted burden to seeing it
as a valued resource” (European Commission 2010). The new Waste Framework Directive

- 8 -
(WFD-2008/98/EC) aims to help EU move towards a recycling society with the targets for “EU
Member States to recycle 50% of their municipal waste and 70% of construction waste by 2020”
(Vasiljevic, et al. 2011). The Directive (WFD-2008/98/EC) also put forward a five-step waste
hierarchy for waste management (see Figure 2.1b). This hierarchy establishes an order of
priorities of varies waste treatment approaches, in which prevention is the best option with
landfill as the last resort measured by the impact on the environment. The aim is to move waste
management as high up as possible in the hierarchy. Plastic waste as one of the important parts
in waste management has undoubtedly raised much attention.
Compared with the oldest form of waste treatment—landfill and the modern waste incineration
with energy recovery, recycling has its unique advantage in saving energy needed to make new
products as well as the amount of material needed from the natural environment. This is
important due to the situation that Europe relies upon imports of scarce raw materials and
recycling can provide EU industries with essential supplies recovered from waste in which plastic
is one of the categories (European Commission 2010). Meanwhile, with more waste going to
recycling, less amount of waste will end up in landfill sites and incineration plants.
Relating to plastic recycling specifically, a more detailed classification among different options has
been described as Table 1.1. The primary recycling often refers to closed loop recycling using
mechanical reprocessing and the new products have equivalent properties with the former ones
(Hopewell, Dvorak and Kosior 2009). This technique has been mostly applied in the recycling of
process scrap from industry. According to Parfitt (2002), 95% of process scrap representing
237,500 tonnes of the plastic waste is primary recycled in UK (cited in Al-Salem, Lettieri and
Baeyens 2009). However, primary recycling has its limitation to involve post-consumer plastics.
This kind of recycling requires highly on the range of polymer grades in plastic waste. However,
plastic packaging or products usually consist of different polymers and other materials which
make them difficult to end up with the primary recycling. It is because of this, at present, the only
part of the post-consumer plastic waste stream that has been recycled in the primary recycling is
the deposited PET bottles which are made from similar grades of PET. While under certain
circumstances, recovered plastic has to be put into other applications because of the
downgrading of properties, this is secondary recycling which also belongs to mechanical recycling.
Mechanical recycling reprocesses plastic waste without breaking the material’s chemical
structure by physical means of grinding, shredding or melting (IPTS 2011). It is mainly applied on
thermoplastic recycling, namely the five predominant plastic families (see Table 1.2).

- 9 -
Tertiary recycling is also called chemical or feedstock recycling and refers to the recovery of the
petrochemical constituents of the polymer by cracking plastics into its monomers or into its oil
and gas components (Hopewell, Dvorak and Kosior 2009, IPTS 2011). Therefore, chemical
recycling can be distinguished in back-to-monomer (BTM) and back-to-feedstock (BTF) Recycling.
The products from BTM processing can be used as raw chemicals and the products from BTF can
be used as fuels (Broek 1997). The main advantage of chemical recycling is its lower requirement
for the input quality of waste plastic, especially treating heterogeneous and contaminated
polymers and higher quality of output compared with mechanical recycling (Al-Salem, Lettieri
and Baeyens 2009). However, plastic recycling has still been dominated by mechanical recycling
so far. Chemical recycling only takes place to a very small extent processing only 0.3% (0.07Mt) of
the total plastic waste in Europe (EU-27 plus Norway and Switzerland) in the year 2008, while
mechanical recycling representing 21.3% (5.3 Mt) (European Commission DG ENV 2011). The
application limitation of chemical recycling mainly exists in both technical reasons and economic
concerns. For example, BTM recycling (also called chemical depolymerisation) is “very sensitive to
the presence of impurities in raw plastics” (Aguado, Serrano and Miguel 2006), it is so far only
operational for certain types of polymers (PU, PA and PET) and cannot be used with the polymers
like polyethylene, polypropylene or polyvinyl chloride (Wollny and Schmie 2000, IPTS 2011). This
study focuses on both mechanical and feedstock recycling for the five predominant plastic
families (see Table 1.2).
Quaternary recycling means energy recovery, which is not generally considered recycling in the
EU context (European Commission DG ENV 2011). In Denmark, energy recovery has been widely
employed in the form of incineration with heat and power generation.
Table 1.1: Plastic recycling ‘cascade’ terminology
(Hopewell, Dvorak and Kosior 2009, European Commission DG ENV 2011)
ASTM D7209 – 06 standard
definitions
Equivalent ISO 15270
standard definitions
Other equivalent terms
Primary recycling Mechanical recycling Closed-loop recycling
Secondary recycling Mechanical recycling Downgrading
Tertiary recycling Chemical recycling Feedstock recycling
Quaternary recycling Energy recovery Valorisation
Currently, the best practice of waste plastic management in European countries is a combination
of both recycling and energy recovery. The latest statistics published by PlaticsEurope shows that
plastic waste reached 24.7 million tonnes in EU27+ Norway and Switzerland in 2010, in which

- 10 -
57.9% of plastic ended up in recycling and energy recovery (PlasticsEurope 2011). From the year
2006 to 2010, the total plastic waste generation had fluctuated slightly in EU27+ Norway and
Switzerland, but there is an obvious trend in increasing recycling and energy recovery with annual
growth rate of 4.3%, 4.1%, 3.1%, and 9.2% in 2007, 2008, 2009 and 2010 respectively as well as a
total growth rate of 22.22% during 5years (calculated based on the data in Figure 1.2).
Figure 1.2: Total plastics waste recycling and recovery 2006 – 2010 (PlasticsEurope 2011)
There are various types of plastics, in which the five predominant plastic families account for the
major market share among the total waste plastic. They are listed as follows (PlasticsEurope
2011):
Table 1.2: Plastic consumption in Europe by resin type in 2007 and 2010 (after PlasticsEurope 2008,
PlasticsEurope 2011)
Plastic types Abbreviations Distribution (%)
In 2007 In 2010
polyethylene low density (PE-LD),
linear low density (PE-LLD), high density (PE-HD) 29% 29%
Polypropylene PP 18% 19%
Polyvinyl chloride PVC 12% 12%
Polystyrene PS and EPS 8% 8%
Polyethylene terephthalate PET 7% 6%
Others 26% 26%
Statistics shows that LDPE/LLDPE and HDPE constituted 29% of the plastics consumed in Europe
(EU-27 plus Norway and Switzerland) in 2010, while PP and PVC account for 19% and 12%
respectively, making them the first three most applied plastic types (PlasticsEurope 2011). And

- 11 -
the distribution stays almost the same compared with that of in 2007 (PlasticsEurope 2008). The
rest types of plastics together account for 26%, and each type of plastics in this category only
contributes a small proportion. This study will focus on the five main types of plastic to look at
their GHG emission from different treatment options individually.
1.2 Research question
The research question of the report is:
How is the global warming potential from possible technical options of household plastic waste
treatment in Copenhagen?
The research focuses on the different outlets of plastic waste and tries to look at their influence
on climate change. Based on the research question, three working steps are formulated with
specific working questions as following:
Research steps Sub-working questions Outcomes
System
description
What is the current scheme for plastic
waste treatment?
Understanding of current plastic waste
treatment situation in Denmark;
Regulations about plastic waste;
What are the possible end-of-life
methods for plastic waste?
Operational or most realistic technologies
regarding to energy recovery, mechanical
recycling, chemical recycling;
Establishing scenario models
Data collection
What is the amount of household
plastic waste generated in
Copenhagen and its composition?
Fraction composition and the amount of
household plastic waste in Copenhagen;
What’s the data required for
computing GHG emission
Estimation on transport, substitution ratio,
etc. for calculation
Software
application
(Sima pro)
How to model in Sima Pro Assessment results

- 12 -
2. Plastic waste management in Copenhagen
2.1 Regulation on plastic waste
Under the framework of EU regulations on waste and the new targets for recycling and
incineration with energy recovery setting up in EU waste directive, Copenhagen has been
committed to treating the waste correctly to reduce environmental impacts as much as possible
and takes these developments in
the waste management filed into
consideration, which is shown in
Copenhagen Waste Management
Plan 2012. Copenhagen waste
management system builds on a
five-step waste hierarchy (see
Figure 2.1a) in accordance with the
EU Waste Framework Directive
mentioned above (see Figure 2.1b).
From figure 2.1a, it is obvious that
in Copenhagen waste management
system, more than half of the
waste is recycled, and the second major part of waste ends up in recovery for heat and power
(Technical and Environmental Administration 2008). Besides, the Copenhagen Carbon Neutral
Facts about City of Copenhagen:
Area: 89.8 sq.km (Environmental Protection Agency 2006)
Inhabitants: 549050 (Copenhagen Municipality 2012)
Households: 336390 (Copenhagen Municipality 2011)
Workplaces: 355257 (Copenhagen Municipality 2009)
Waste treatment sites (Environmental Protection Agency 2006):
Vestforbræ nding Incineration plant (Glostrup, 10 km away from City Hall)
Amagerforbræ nding Incineration plant (4km east away from City Hall)
Composting plant (5km south away from City Hall)
Construction & Demolition waste recycling (5km south away from City Hall)
Contamin. Soil landfill (5km south away from City Hall)
Controlled landfill (10km southwest away from City Hall)
Figure 2.1a: Copenhagen waste hierarchy
(Technical and Environmental Administration
2008)
Figure 2.1b: Waste hierarchy
in WFD-2008/98/EC
(European Commission 2010)

- 13 -
Plastics waste from
commercial
end-user collection
Plastic waste from
private end-user
collection
Figure 2.2 Different qualities of waste (Sartorius and Wuttke 2010)
Plan by 2025 (2009) describes an initiative aiming at separation of plastic from the waste stream
and minimization of waste generation (City of Copenhagen—the Technical and Environmental
Administration 2009). A target has been set up to reduce the amount of waste plastic mixed in
municipal waste for incineration (40,000 tonnes) by 15,000 tonnes (Skovgaard 2012).
In order to regulate the handling of municipal waste from all citizens and businesses,
Copenhagen municipal waste regulation was formulated in line with applicable environmental
legislation, namely Environmental Protection Act, Waste Order, WEEE Order, Battery Order and
Packaging Order. It consists of the rules for both households and commercial waste.
In commercial waste regulation, plastic waste is only mentioned in terms of handling
non-recyclable PVC (polyvinyl chloride) waste. Specifically, it clarifies what types of products are
to be attributed to non-recyclable PVC waste, such as discarded office equipment and furniture,
discarded building materials which cannot be recycled at the plant and so on. And the scheme is
to assign these non-recyclable PVC waste to landfilling. (Regulative for erhvervsaffald 2012).
There are two main rules regarding plastic waste mentioned in households’ waste regulation, one
is for PVC waste, the other is for recyclable plastic packaging waste. Firstly, PVC waste should be
sorted from other waste and must be
submitted separately from other bulky
waste. The regulation also provides the
defined types of PVC products ending
up with recycling and landfill
respectively. The products made of PVC
going to recycling include: sewer pipes
including joints and bends, water pipes
and indoor drain systems, electric wires
and cable trays, other products made of
hard PVC and so on. PVC to landfill
includes products like: soft panels and
baseboards, blinds, ventilation tubes,
suitcases, backpacks and bags, cables and wires, and so on. As for recyclable plastic packaging
waste, the scheme mainly applies to multi-storey buildings in the municipality. It is required that
all types of packaging of hard plastic that appear in households shall be collected in the

- 14 -
designated containers emptied after fixed intervals or delivered to recycling sites (bulky ones).
(Regulative for husholdningsaffald 2012). This new kerbside collection scheme will start in late
2012 (Larsen and Skovgaard 2012).
PVC has received much attention in Danish waste stream ever since 1991 when a voluntary
agreement was made by Ministry of Environment, the Danish plastics industry and other trade
organisations with one of the goals to “keep PVC away from ordinary waste incineration, where
technically and economically justifiable”. Later, a mandatory PVC strategy has taken the place of
the voluntary agreement aiming at “keeping PVC wastes out of waste incineration plants, where
possible as well as collecting and recycling recyclable PVC”. In the governmental waste
management plan 1998-2004 it is stated that PVC waste has been required to be separated from
other kinds of waste in order to be recycled or landfilled. (Pllinke, et al. 2000)
2.2 Current plastic waste stream figures
According to the latest report of PlasticsEurope, from the year 2006 to 2010, Denmark’s
improvement in recovery rate has been less than 5% but there is a change from energy recovery
to recycling in Denmark with the recycling rate of total plastic waste improved by nearly 10%
(PlasticsEurope 2011). In the year 2010, Denmark’s recycling performance has reached almost 25%
and energy recovery level is around 70%. As a result, the total recovery rate for all plastics in
Denmark in 2010 reached 95% which is ranked 5th in EU27+N/CH (see Figure 2.2). Statistics from
Danish EPA shows that from 2004 to 2009, Denmark’s recycling rate of plastic packaging waste
has been steadily increasing, and exceeded the target of 22.5% (European Commission 2011)
indicated in EU Packaging Directive since 2008 (see Table 2.1).
Table 2.1: Plastic packaging and collection for recycling in Denmark (Tonnes) (Kaysen and Tønning 2010, Kaysen
and Tønning 2011)
2004 2005 2006 2007 2008 2009
Potential 174,273 182,789 190,792 191,978 164,838 165,449
Collection 28,439 34,863 38,695 41,787 41,951 43,681
Collection percentage 16.3 19.1 20.3 21.8 25.4 26.4
Export of plastic packaging waste 17,131 26,274 28,948 42,309 44,050 43,860

- 15 -
Figure 2.2: Total Recovery Rate for all plastics by Country 2010 (PlasticsEurope 2011)
At present, the best practice relating plastic waste disposal lies in the following two aspects.
Firstly, from the Copenhagen municipal waste regulation mentioned above we can see that the
collection and recycling of PVC has received much attention in both commercial and household
waste. For instance, rigid PVC wastes are delivered to “WUPPI scheme” for recycling which is not
only for private persons but also for municipality and waste companies. The scheme focuses on
collection and recycling for construction waste of hard PVC (WUPPI A/S n.d.). WUPPI gets PVC
from the recycling station where PVC waste has been sorted exclusively based on certain
categories. Then the materials are transported for further processing that grind and wash PVC.
After that, the materials are returned to WUPPI again for making new products (WUPPI A/S n.d.).
In 2007, 3500 tonnes of hard PVC construction waste were gathered and recycled in new building
products by the ‘WUPPI scheme’.
Another part of plastic reuse has taken place mainly in (1) refillable PET-bottles (estimate of 1126
tonnes in 2009); (2) plastic pallets (estimates of 960 tonnes in 2009) and plastic crates (estimate
of 7500 tonnes in 2009) used for transport or containing of food products (such as milk, bread,
fish and beer). (Larsen and Skovgaard 2012)
In Copenhagen, municipal wastes are collected by both kerbside collection schemes and bring
systems (Larsen and Skovgaard 2012) Households waste is equivalent to 25% of total waste,
corresponding to 209,432 tonnes in 2009 (Veksebo 2010, cited in Larsen and Skovgaard 2012). So

- 16 -
far, compared with the figure existing in recycling fraction, the majority of plastic waste ends up
in the incineration furnace in the city of Copenhagen (see Table 2.2). Around 73%-74% of all
household rubbish is incinerated, which involves a large amount of plastics that could be recycled
(Buley 2011). According to an estimation on the composition from the Plastic Zero project team
based on a range of surveys, the potential amount of plastic waste is estimated around 39,000
tonnes, wherein approximately 4000 tonnes of plastics are recycled, leaving 35,000 tonnes
plastics in the combustible waste which account for 10% of total waste incinerated in
Copenhagen in 2009 (Larsen and Skovgaard 2012) (see Figure 2.3). As a result, it is not only a loss
of resources but also a contribution to large CO2 emissions (Technical and Environmental
Administration 2008). If more plastics are put into appropriate recycling procedures they will
become more raw materials entering a new production cycle and thus reducing resource use.
Table 2.2: Data on plastic waste in the city of Copenhagen (Larsen and Skovgaard 2012)
Data category Waste quantity (tonnes)
Total amounts of household waste (in 2009) 209,432
Households waste Collected for recycling
Drop-off containers, commingled glass packaging, plastic, metal Plastic: 27
Bulky waste collection PVC:9
Recycling stations Plastic:26
PVC: 73
WEEE: 1914
Clothing: 145
Collection of clothing, bring banks Clothing:124
Collection of WEEE WEEE-collection: 2437
Figure 2.3: plastic waste in municipal waste and household waste in Copenhagen (Data source: (Larsen and
Skovgaard 2012, Skovgaard 2012))
0
5000
10000
15000
20000
25000
30000
35000
40000
45000
Municipal plasticwaste
Household plasticwaste
Segregated plasticwaste (recycled)
Mixed plastic waste(incinerated)
Ton
ne

- 17 -
Particularly on plastic packaging waste, according to the statistics from Danish EPA
(Miljøstyrelsen), polyethylene (PE) makes up the main part of the consumption of plastic
packaging. Consequently, this type of plastic accounts for the largest part of the collected plastic
material. Currently, it is the collection from commercial enterprises that contributes a very large
part of the collection instead of households’ part. (Kaysen and Tønning 2010). Table 2.3 shows
the amount of different types of plastics generated and collected in packaging waste stream in
Denmark. The data related with Copenhagen are estimated by the population ratio.
Table 2.3 Total supply of plastic packaging and PVC in Denmark in 2009. Tonnes.
Plastic
types
Potential
supply[1]
Proportion
[1]
Collection[1] Collection
rate [1]
Potential supply[3]
(Copenhagen)
Collection[3]
(Copenhagen)
PE 115503 69,80% 24189 20,9% 10868 2276
PP 17708 10,70% 4216 23,8% 1666 397
PS (EPS) 12774 7,70% 1541 12,1% 1202 145
PET 10590 6,40% 10719 101,2% 996 1009
PVC[2] Households:82;
Commercial:228
Other
plastics
8874 5,40% 5272 59,4% 835
Total 165449 100% 45937 27,8% 15567 4328
Data source: [1] (Kaysen and Tønning 2011) [2] (Larsen and Skovgaard 2012) [3] Estimation based on the
population ratio in 2009. According to the official publication by Copenhagen Municipality, there are 518,574
inhabitants in Copenhagen city while 5,511,451 in Denmark in 2009 (Copenhagen Municipality 2012).

- 18 -
3. Literature review
Chapter 1.1 has provided a review of the approaches for plastic waste treatment on different
level—landfill, energy recovery, mechanical recycling, chemical recycling. It shows that the
combination of recycling and energy recovery is the most prevailing option in European countries
with even an increasing trend in recent years. In this chapter, the review mainly focuses on:
1. The development of application of LCA in plastic waste management research;
2. Different options for plastic waste recycling;
3. Mixed plastic sorting method
The researches and studies mentioned here are on the basis of relevant literature searched
mainly from “Scopus” database provided by Aalborg University library. The searching fields
include both “plastic recycling” and “LCA”. Some other fields have been tried as well, such as
“plastic waste mechanical recycling”, “plastic waste chemical recycling” and so on. In order to get
an overall view of the development in plastic waste recycling from life cycle perspective, the
reviewed literature are selected to cover the last two decades, that is starting from 1990s.
3.1 Development of LCA in plastic waste management
Starting in the 1980s, life cycle perspective became a new approach applied in waste
management (Christensen 2010). Within the past decades, life cycle assessment (LCA) has been
applied widely in examination of the environmental burden of various disposal methods for
different wastes. Particularly in the issue of plastic waste, plenty of studies focus on the
comparison of different methods for disposal of plastic waste. Singer (1994) pointed out in his
article that (1) recycling post-consumption plastic waste can significantly contribute to energy
saving; (2) thermoplastics are preferable for recycling compared with the other
type—thermosetting plastics which are molecular structured. It is because thermoplastics
(including polyethylene, polyethylene terephthalate, polypropylene, polystyrene and polyvinyl
chloride) break down when they are heated; (3) materials recycling would be some sort of
optimal option but should be combined with social economic factors. Hunt (1995) made an LCA

- 19 -
study for paper and plastics waste disposal based on different alternatives—combustion, landfill
or compost. The result showed that significant CO2 equivalents emissions can be made by
incineration of plastics, while composting and landfilling only create negligible global warming.
Further, the comparisons among plastic recycling approaches specifically break down to chemical
recycling and mechanical recycling. Patel et al. (1999) compared the plastic waste disposal
methods in Germany (including landfill, incineration, mechanical recycling and chemical recycling)
in environmental terms. The result showed that (1) recycling clearly contributes to energy
reduction and curbing CO2 emission, in which mechanical recycling yields higher environmental
benefit than feedstock recycling technologies for bulk waste plastics. (2) Feedstock recycling is
preferable to an average waste incinerator in Germany in the mid-1990s. More specifically,
Wollny, et al. (2001) examined the potential environmental impacts (mainly on climate change) of
several chemical recycling approaches—reducing agent in blast furnace, BASF pyrolysis process
and SVZ gasification process respectively, and made a comparison with that of energy recovery.
They also pointed out that due to the situation of immature sorting and recycling technology and
lack of developed markets for secondary materials, chemical recycling held a dominant position
in 1990s in Germany.
Within recent decade, studies have been emerged with focusing on particular type of plastic
waste. For example, a LCA on polyethylene (PE)/ expanded polystyrene (EPS) packaging recycling
in Australia was conducted by Ross and Evans (2003) and the result showed that recycling can
largely reduce the environmental burden of plastic packaging and “the energy consumption by
transportation is negligible when compared to the overall energy consumption of the system”.
Lindahl and Winsnes (2005) carried out LCA calculation on recycling of cable plastics (mainly PE
and PVC) where Vinyloop process and Stigsnaes process have been applied as mechanical
recycling and Chemical recycling respectively based in Sweden. The comparison showed that the
Vinyloop process is preferable to the Stigsnaes process, but the later has priority in its location (in
Denmark) than Vinyloop plant in Italy. Perugini, Mastellone and Arena (2005) carried out LCA for
mechanical and feedstock recycling of PE and PP in Italy, the feedstock recycyling focuses on BP
pyrolysis process and Veba Oel hydrocracking process. The result showed that mechanical
reycyling option presented as the most envrionemtnlly preferable one and the feed stock
recycling had some valuable environemtal indices. Dodbiba, et al. (2007) calculated global
warming potential by LCA for energy recovery and mechanical recycling of plastic waste from
discarded television sets (mainly PE, PVC, PS). The result verified again that mechanical recycling

- 20 -
saves resources utilization and reduces greenhouse gases emission in comparison with energy
recovery. Lazarevic, et al. (2010) reviewed extensive LCA of plastic waste and sorted out the key
parameters and assumptions for the final selected studies (see Table 3.1).
3.2 Different options for plastic waste recycling
Singer (1994), Tukker, et al. (1999), Al-Salem, Lettieri and Baeyens (2009) and IPTS (2011)
systematically introduced the recycling schemes for plastic waste and the corresponding
technologies. Figure 3.1 builds an overall recycling structure on the basis of summarizing the
processes and main technologies mentioned in the literatures. The LCA carried out in the current
study only focus on the options in the real-line boxes. The BTM recycling (also called chemical
depolymerisation) is exclude because it is only operational for certain types of polymers (PU, PA
and PET) and cannot be used with the polymers like polyethylene, polypropylene or polyvinyl
chloride (Wollny and Schmie 2000, IPTS 2011) due to its high sensitivity to the presence of
impurities in raw plastics (Aguado, Serrano and Miguel 2006).
Regarding the chemical recycling technologies, the development of BTM and BTF recycling
technologies during the 1990s has not resulted in any major applications (Gielen, Bennaceur and
Tam 2006). Plenty of initiatives launched or stopped in the past decades. This study firstly
selected several processes as the most realistic ones shown in Figure 3.1. The background, inputs,
outputs of these chemical processes are described in AppendixⅢ. After further selection based
on the consideration of transport distance, three best known processes are selected to be
assessed in the scenarios of current project which are regarded as the most realistic ones for
Copenhagen. These concerns:
1. Pyrolysis (BP polymer cracking process), in UK
2. Gasification (SVZ), in Germany
3. Hydrogenation (Veba Oel), in Germany
3.3 Mixed plastic sorting method
Compared with chemical processes mechanical path is only viable for single polymer recycling
(Singer 1994). In this situation, proper sorting technologies should not be neglected when it
comes to mechanical recycling. Broek (1997), with an overview of existing separation technoogies

- 21 -
and identification technologies for mixed waste based on the properties of various type plastic,
pointed out that the mostly applied separation technology was based on density differences
which can be used for the separation of plastic from non-plastics and sink-float method can be
further applied to separte PE and PP from other plastics. Dodbiba and Fujita (2004) reviewed
various techniques for separating mixed plastic waste (MPW) in terms of wet and dry separating
approaches. The available techniques were presented in the perspective of the operation
rationale with the purity of sorted single plastic and the schematic design of each machine was
showed. Among these approaches, near-infrared (NIR) sorting approach is common used in
automatic plastics sorting system. As a conventional approach, sink-float princple of densisty
sepoaration in water has proved effective in separating some type of plastics (Plastics Technology
2005). The advantage exists in its low cost as the separation tanks were simple and inexpensive
to build. However, the disadvatage of wet separation technology is that drying the mixture after
separation cannot be avoided and the waste water increases the loads to wate treametn plants,
thus increasing electricity demand and related enviroenmtnal impacts (Dodbiba and Fujita 2004).
Besides the contents discussed above, there are also theoretical discussions on methodological
aspect of LCA system, for example, the issues on LCA application in solid waste management,
including system boundaries, multi-input allocation, time horizon (Finnveden 1999), the
variations between original LCA system boundary on a product and on waste management
system (Schmidt 2005) and so on. Because these issues are related with practical application of
LCA method in this study, chapter 4.1—LCA in waste management provides more specific
description and explanation.

- 22 -
Table3.1 Overview of LCA studies in Europe (Lazarevic, et al. 2010)
Reference Waste stream Polymers Treatment
technologies
Avoided
material
Virgin material
substitution
ratio considered
Avoided
electricity
Avoided heat Transport Geographical
scope
Carlsson
(2002)
Household plastic
packaging waste
HDPE, LDPE MR
MSWI
Virgin PE, PET 1:1
1:0.8 for HDPE
1:0.7 for LDPE
n.a. Biomass coal Collection
excluded
Sweden
(National)
Eriksson and
Finnveden
(2009)
(1) Non-recyclable
plastic
(2) Mixed plastic
Not clear MSWI
LF n.a. n.a. Wind coal Oil Biomass
CHP
Collection
excluded
Sweden and
European (n.a.)
Frees (2002) (1) Transport packaging
(2) plastic bottles and
cans from households
and businesses
HDPE, LDPE,
PP
MR
MSWI
Virgin HDPE,
LDPE, PP
1:0.9 Danish
average
natural gas
Danish
average
(natural gas)
(oil and gas)
Collection
included
Denmark
(National)
Jenseit et al.
(2003)
ELV plastic components PP, PE, PC,
PU, ABS, PA
MR
MSWI
SRF in a cement kiln
FR-gasification
FR-reduction agent in
a blast furnace
LF
Virgin PP 1:1
n.a. Not clear
coal: SRF –
cement kiln
Collection
excluded
European (Data:
DE)
Kreißig et al.
(2003)
PVC cable waste PVC MR– Vinyloop
FR – Stigsneas
FR–Watech PVC
MSWI
LF
Virgin PVC 1:1
n.a. n.a. Collection
excluded
European (Data:
DE/DK)
Perugini et al.
(2005)
Household plastic
packaging waste
PET, PE MR
MSWI
LF
FR–low temp. pyrolysis
&MR
FR-hydrocracking &
Virgin PET, PE 1:1
n.a. n.a. Collection
included
Italy (National)

- 23 -
MR
Raadal et
al.(2008)
Household plastic
packaging waste
HDPE, LDPE,
PP, PET, PS
MR
MSWI
LF
Virgin
HDPE,LDPE,
PP, PET,PS
1:0.95 n.a. Oil and
electricity
Collection
included
Norway
(National)
RDC and
Coopers&
Lybrand
(1997)
Plastic packaging waste PET, PVC,
HDPE, LPDE
MR
MSWI
Virgin PET,
PVC,HDPE,
LPDE
1:1
1:0.5
n.a. n.a. Collection
included
European (Data:
CH/DE)
Shonfield
(2008)
Mixed post-consumer
plastic waste
HDPE, LDPE,
PP, PET,
PVC, PS
MR
MSWI
SRF in cement a kiln
FR– pyrolysis
FR–reduction agent in
a blast furnace
LF
Virgin
HDPE,LDPE,
PP, PET,PVC,
PS (wood)
(concrete)
1:1
Natural gas Coal:
SRF-cement
kiln
Collection
excluded
UK (National)
Von Krogh et
al. (2001)
Plastic bottles for
foodstuffs
HDPE MR
MSWI
LF
HDPE 1:1
n.a. Oil Collection
included
Norway
(Regional)
MR – mechanical, FR – feedstock recycling, MSWI – municipal solid waste incineration, SRF – incinerated as a solid recovered fuel, LF – landfill

- 24 -
Figure 3.1: Different recycling schemes with reference to the main technologies (after Singer 1994, Tukker, et al. 1999, Al-Salem, Lettieri and Baeyens 2009 and IPTS 2011)
Note: the processes represented in solid blocks will be assessed in this report while the ones in dashed boxes will not.
Material recycling
Chemical recycling
Pyrolysis
BP, BASF, NRC
Naphtha & High Boiling Oil
Gasification
SVZ,Texaco
Oil
Hydrogenation
VEBA Oel
Oil
Blast furnace reducing agent:
Cement kilns reducing fuel
Chemical depolymerisation
Monomers
Mechanical recycling
Polymers

- 25 -
4. Methodology
4.1 Life cycle assessment in waste management
Life cycle assessment (LCA) is the concept that considers all processes from raw material
extraction (“cradle”) to final use and disposal phase (“grave”) (ISO 14040 2006). LCA studies
started in the late 1960s and early 1970s, when Coca Cola Company used environmental
assessments to estimate the environmental pollution from beverage containers (Curran 2006).
The long-anticipated LCA standards were developed in International Standards Organization (ISO)
14000 series from 1997 to 2002. These standards were further revised in 2006 putting forward
two documents ISO 14040 describing the principles for LCA and ISO 14044 describing
requirements and guidelines for LCA.
LCA approach began to emerge in solid waste management since 1988 (Christensen 2010). Waste
management system is largely contingent on the local conditions, criteria and preferences of
approaches applied by decision makers (Christensen 2010). Christensen (2010) classified five
main types of approaches have been used extensively or emerging on the scene in waste
management, therein Life cycle assessment, as a comprehensive accounting system, is a common
tool used to evaluate the environmental impact of products by computing the emissions and
resources used and aggregating them into agreed impact categories, such as global warming. The
EU waste directive, (cited in Christensen 2010) suggests that “life cycle thinking should be
introduced in all waste management decision-making, and derogation from the waste hierarchy
should be based on life cycle thinking”.
Nowadays, LCA has been increasingly applied in the field of waste management. However, there
are two differences between a traditional LCA of products and an LCA of a waste system (Schmidt
2005):
Functional unit formulation
System description
The following figure illustrates the comparison of a product-oriented LCA system and a waste
system's LCA (cited in Schmidt 2005). Therefore, the waste management system usually includes
four steps: waste collection, sorting, recycling, incineration and landfilling.

- 26 -
Figure 4.1: Difference in limits for calculation of data for a product-LCA and LCA of waste management systems.
(Translated from Coleman et al, 2003 p. 178, cited in Schmidt 2005)
This study complies with the ISO 14040 and ISO 14044 of standards governing the use of LCA and
follows four phases as suggested by the standards. Those phases are: Goal and scope definition,
Life cycle inventory, Life cycle impact assessment and Interpretation (specific analyses on the four
phases see Chapter 5).
4.2 Consequential LCA
Consequential LCA and Attributional LCA are two approaches which can be used for defining
system boundaries. The attributional approach strives to identify the processes that are involved
in the physical flows and allocate the environmental impacts to the primary and secondary
services by allocation factors (Thrane and Schmidt 2007, Wenzel, Wesnæ s and Dall 2009). While
in consequential modelling, the marginal concept is widely used to predict the change in supply
responding to a change in demand. Wenzel, Wesnæ s and Dall (2009) gives a definition of
marginal supply as the following:
Marginal supply = the response to a marginal change in demand on the market in question
By using concequential approach, there is no considertion needed on the cut of criteria anymore
as the co-product allocation is avoided by system expansion. The comparision between the two
methods are shown in Table 4.1
In the current study, consequential LCA method has been applied. The system boundary shows in
Figure 5.1. As the most important products, the marginal energy supply has been discussed in
Chapter 5.2.1. For other products, the marginal supply has been considered as the same products
Extraction
Production
Distribution
Use
System Boundary for
inventory Data for products
Extraction
Production
Distribution
Use
System Boundary for
inventory Data for waste
system

- 27 -
themselves. For example, the output of methanol in SVZ gasification put on the market may lead
to reduce the production of methanol industry. That is to say it is affected by the market change.
Therefore the marginal methanol is still considered as the methanol from plant. Other marginal
products are also considered in the same way.
Table 4.1: Main characteristics of and differences between consequential and attributional modelling in life cycle
inventory (based on Weidema 2003; Schmidt and Weidema 2007, cited in Schmidt 2007)
Feature Consequential modelling Attributional modelling
Nature Attempts to predict to responses to a
change in demand
Describes how existing production is
taking place
Included
processes/suppliers
Marginal Average
Co-product allocation Co-product allocation is avoided by
system expansion
Co-product allocation is treated by using
allocation factors
4.3 Tool—Sima Pro 7.3
SimaPro is a software tool for Life Cycle Assessments that calculates environmental impacts
associated to a product or services. It follows the ISO standards 14040 and 14044 (Goedkoop, et
al. 2010). SimaPro was developed by the Dutch consultancy company Pré. As the most widely
used LCA software, it is used in more than 80 countries by industries, consultancies and
universities worldwide (PRé Consultants n.d.).
When applying SimaPro into assessing the environmental impact of described systems or
scenarios, it is important to choose appropriate method and database. In this study ReCiPe
Midpoint method is employed to quantitatively analyse the life cycle of households’ plastic waste
treatment (mainly on recycling and incineration). ReCiPe method, as an advanced version of
widely-used Ecoindicator 99 method, consists of 18 impact categories at the midpoint level
(Goedkoop, Oele, et al. 2010). Although global warming (expressed by CO2-eq) is the only one
impact category assessed in this study, the result of other impact categories can also be reflected
by this method, which provides a chance to have an overview of total impacts. Besides, Ecoinvent
unit process is chosen as the database here.

- 28 -
5. LCA on Plastic Waste treatment
5.1 Goal and Scope
5.1.1 Goal
The purpose of the study is to identify the amount of climate change contribution from plastic
waste treatment options in Copenhagen municipality, Denmark. Through the comparison of
possible recovery schemes (incineration, recycling on different levels), this study tries to figure
out a better solution for plastic waste treatment. The plastic waste mentioned in the study mainly
refers to the amount of plastics which exists in and could be extracted from household waste.
Household refuse together with the similar waste from businesses or industry constitute the
concept of “municipal waste”, which includes kitchen waste (biomass), paper, plastics, metals,
and glass (Doka 2009). Compared with the long history of paper and glass specifications for
recycling, plastic waste collection for recycling are of more recent date and almost all of the
collected plastics are from businesses (Kaysen and Tønning 2011). Therefore, by assessing the
impacts from different schemes of households’ plastic waste treatment, it is possible to locate
the hotspot(s) and investigate scheme(s) of great advantage with GHG reduction potential in
order to facilitate the Copenhagen “Plastic Zero” project aiming at reducing the amount of plastic
waste (Københavns kommune–Teknik og Miljøforvaltningen n.d.).
5.1.2 Functional unit (FU)
In order to compare the various outlets of household plastic waste, the same amount of waste is
considered in all analysed scenarios. The functional unit is defined as incinerating or recycling of
the potential plastic waste (12,460tonne) from Copenhagen households. This includes:

- 29 -
Table 5.1: Potential plastic waste and its composition
Fraction Potential in Copenhagen (tonne)
PE 2100
PP 5600
PS (EPS) 840
PET 2380
Other plastics 1540
Total 12,460
Note: 1) composition is estimated based on Shonfield (2008); 2)PVC content in the household waste is assumed
to be negligible and kept in allowable range for incineration and other recycling operations due to Danish long
history practice of keeping PVC waste out of household waste (detailed description see Chapter 2.1 and 2.2). Thus,
the total amount is 14,000t (Larsen and Skovgaard 2012) minus the amount of PVC (1540t).
5.1.3 System boundary
Plastic waste is widespread on various fields of our daily life, it can be found from private
households, industrial and commercial packaging, WEEE, agriculture, automotive to construction
and demolition (Goodship 2007, IPTS 2011). But typically the main sources of post-consumer
waste plastic are municipal solid waste, construction and demolition waste, automotive waste,
and waste from electric and electronic equipment (IPTS 2011). The assessing scope of this study
specifically focuses on the energy recovery and recycling of potential plastic waste from
household waste.
There are other categories of waste that may also involve with plastic waste (Christensen 2010)
but usually are unstable and difficult to track and not dealt with in this report:
Commercial waste
Construction and demolition waste
Agricultural waste
Waste from warfare
Waste from natural disasters

- 30 -
Figure 5.1: A general system scenarios description
Generally speaking, the life-cycle of plastics starts with the energy consumption needed for
production of plastics. Then, the plastics enter into use stage as products or part of the products.
The end-of –life issues arise when plastic products reaching to the end of their life span. As
illustrated in Figure 5.1, the processes covered by LCA of the waste management system in this
study will only include disposal phase starting from household waste, including transportation
factor. The modelled schemes shown in Figure5.1 indicate the system boundary and describe the
simplified relation between processes. Two main possible outlets for plastic waste are presented
in the model represented by the scenarios (see detailed scenarios in next section 5.1.4).
One option describes more or less the current situation in Copenhagen, which shows that most
plastic wastes are mixed with other residues in household waste and then end up in incineration
for energy recovery to produce district heating or power.
The other option is recycling, which are further divided into 2 possible routes. One way is that
household waste goes into REnescience and NIR sorting for separation of individual type of
plastic waste and then enters into mechanical or chemical recycling. The second route is to collect
well-separated plastic waste directly from houses under the assumption that plastic waste could
be segregated by household in a designated trash bin when discarding. As such, the mixed plastic
waste could be transported directly to NIR sorting and enter into different recycling processes
Recycling
Recycling
Sorting
Incineration Household
waste
Plastic
waste
Virgin plastic
Transport
Tran
spo
rt
Transport Sorting
Recycling
Avoided production processes
PET
PE
PP
PS Recycling
Electricity Heat

- 31 -
with less washing compared with that of in the first path..
Regarding to recycling scenarios, the consumption of a certain amount and types of virginal
plastic can be avoided by using recovered materials. Here, in the detailed scenarios, the recycling
can be further divided into mechanical and chemical recycling focus on major plastic families (PE,
PP, PS, and PET) respectively. PVC is out of assessment in this study as PVC content in the
household waste is assumed to be negligible and kept in allowable range for incineration and
other recycling operations due to Danish long history practice of keeping PVC waste out of
household waste since 1991 (detailed description see Chapter 2.1 and 2.2). Currently, mechanical
recycling is significantly used to treat plastic packaging waste. The mechanical recycling includes
serious of operations. Briefly, the plastics are first shipped to reprocessors to chop into flakes and
remove contaminants, and then the washed flakes is further extruded into strands and cut into
pellets. Finally, the pellets come to the market again to substitute virgin plastics used for new
polymer products manufacturing. The main processes—shredding and extrusion are involved in
the calculation.
5.1.4 Scenarios
The following table shows the key processes included in the modelled scenarios. The process
diagram, specific description and assessment result for each scenario are presented in Chapter
5.3.

- 32 -
Table5.2: Key processes included in the scenarios
Scenario Key processes
Scenario 1 Municipal incineration with energy recovery (all plastic waste from household waste)
Scenario 2 REnescience sorting (to get plastic waste);
Pre-treatment Washing
Near infra-red (NIR) sorting (to get individual type of plastic);
Mechanical recycling of PVC, PET, PE, PP, PS fractions
Scenario 3 REnescience sorting (to get plastic waste);
Pre-treatment Washing
Near infra-red (NIR) sorting to get PET fraction
Mechanical recycling of PET fractions;
Pre-treatment shredding
Pyrolysis of PP, PE, PS fractions (BP polymer cracking process)
Scenario 4a REnescience sorting (to get plastic waste);
Pre-treatment Washing
Pre-treatment shredding
Gasification of plastics (mainly PET, PP, PE, PS fractions) (SVZ)
Scenario 4b REnescience sorting (to get plastic waste);
Pre-treatment Washing
Near infra-red (NIR) sorting to get PET fraction
Mechanical recycling of PET fraction;
Pre-treatment shredding
Gasification of PP, PE, PS fractions (SVZ)
Scenario 5a REnescience sorting (to get plastic waste);
Pre-treatment Washing
Pre-treatment shredding
Hydrogenation of plastics (mainly PET, PP, PE, PS fractions) (VEBA Oel)
Scenario 5b REnescience sorting (to get plastic waste);
Pre-treatment Washing
Near infra-red (NIR) sorting to get PET fraction
Mechanical recycling of PET fraction;
Pre-treatment shredding
Hydrogenation of PP, PE, PS fractions (VEBA Oel)
Scenario 6 Near infra-red (NIR) sorting (to get individual type of plastic);
Mechanical recycling of PET, PE, PP, PS fractions
Note: Transport consideration is also included in the assessment
5.1.5 Impact categories and method for impact assessment
Method for impact assessment used in Life Cycle Impact Assessment (LCIA) is important as it
transforms the input data into environmental output as impact potentials. ReCiPe is one of the

- 33 -
important methods in SimaPro. ReCiPe 2008 method consists of two sets of impact categories
related to midpoint and endpoint level. Climate change as one of the eighteen impact categories
is addressed at midpoint level (Goedkoop, Oele, et al. 2010). The purpose of present study is to
identify the possible treatment methods of household plastic waste in term of global warming
potentials. Thus, the method of ReCiPe Midpoint (H) has been selected with a focus on climate
change.
5.1.6 Data quality requirement
Geographical scope and technological scope
This LCA study aims to present different schemes and technologies for household plastic waste
treatment in terms of global warming potential. The geographical scope of household waste is
confined in Copenhagen municipality, Denmark. The analysed system includes waste collection,
sorting and incineration/recycling.
Collection process takes place in Copenhagen without question. Separation of plastic from
household waste either by REnescience (scenario 2-5) or households themselves (scenario 6) also
happens in Copenhagen. It should be mentioned that REnescience is still a trial plant rather than a
mature technology, so the LCA study uses the current performance data provided by DONG Energy.
Mechanical recycling and various chemical recycling of plastic waste are located in other European
countries (Germany, UK), which is shown in Table 5.4. It is expected that the Near infra-red (NIR)
sorting for individual type of plastic and pre-treatment processes before recycling are located near
the recycling facility.
Temporal scope and data sources
The research and practice of chemical recycling for plastic waste had boomed in 1990s but without
resulting in many applications up to now. This LCA study chooses 3 most realistic technologies for
Copenhagen municipality based on current conditions. Besides, the impact assessment of climate
change expressed by CO2-eq is assessed in 100-year time horizon in ReCiPe Midpoint (H) method.
The amount of households plastic waste employed in current study is estimated by Plastic Zero
project team in Copenhagen based on preliminary surveys. The composition ratio from a UK report

- 34 -
is employed here to estimate different plastic fractions in household waste, where the Danish data
is not available. Thus, the effect of a different composition in mixed plastics will be illustrated in a
sensitivity analysis. Data regarding to REnescience sorting and NIR sorting as well as alternative
disposal options are taken either from published literature or from Ecoinvent database.
5.1.7 Key assumptions and uncertainties
Composition of household plastic waste
As stated in the above section, due to the lack of composition of household plastic waste in
Copenhagen, the following composition ratio is applied in this study to estimate the amount of
plastic waste in different types in household plastic. However, the proportion of PP and PE
fractions in plastic packaging waste from Danish household, illustrated in Table 2.3, shows a
significant difference compared with the composition employed here. Although the differences
may be caused by the existence of other plastic products with longer life-span than packaging in
household waste and different packaging waste in commercial waste, the assumption might risk
the calculation result if the real situation altered. Therefore, sensitivity analysis will be carried out
examining the effect of variation in the composition with higher level of PE fraction and lower
level of PP and PET fraction (sensitivity analysis see chapter 5.4.1).
Table 5.3: Default composition of input plastic waste (Shonfield 2008)
Material type Default composition, %
PE 15
PP 40
PET 17
PS 6
PVC 11
Others 11
Another important assumption related with the composition is that PVC content in the collected
household waste in Copenhagen is negligible and kept in allowable range for incineration and
other recycling operations due to Danish long history practice of keeping PVC waste out of
household waste since 1991 (detailed description see Chapter 2.1 and 2.2).

- 35 -
REnescience sorting
This study only focuses on taking plastics out by using REnescience technology. For that reason
the consumption of water, enzymes and heat for processing organic fraction is not included in the
calculation (Schmidt and Løkke 2012). Similarly, the energy consumption for the separation of
recyclable materials is divided and allocated on plastic segregation by weight. Chapter 5.2.1
provides detailed description about REnescience and the calculation.
Besides, prior to NIR sorting, the mixed plastic as one of the outputs from REnescience machine
is assumed to be washed in consideration of the acceptance of NIR sorting machine (Løkke 2012).
The electricity utilization is estimated about 0.5 kwh/tonne (Løkke 2012).The water and energy
consumption associated with washing is estimated based on the figure in a project report from
Danish EPA (Frees 2002). The report offers consumption of water and energy (for warming the
water) in washing plastic package of various kinds of products by warm water (40 °C). And a
medium figure of 78L/kg and 10.9MJ/kg has been used in the LCA models. To examine the effect
of variation in the consumption two alternatives with lower and higher consumption will be
assessed in the sensitivity analysis (see chapter 5.4.2).
Substitution ratio from mechanical recycling
It is assumed that recycled plastic obtained from the mechanical recycling processes is of high
quality and substitutes directly for virginal plastic on a 1:1 basis.
Transport
In this study, the consideration for transport can be divided into two processes—one for
municipal collection system, the other for overseas recycling. Therefore, transport in the former
process is assumed to be by 21-tonne lorries with outward and return trip; while the later one is
assumed to be by >32 tonne lorries. For the recycling scenarios, it is assumed that NIR sorting
and all required pre-treatment processes are co-located with the recycling facilities so there is no
need to consider the transport between process stages. The distance for municipal collection and
transporting to recycling are estimated by using Google map (see Table 5.4).
- 36 -
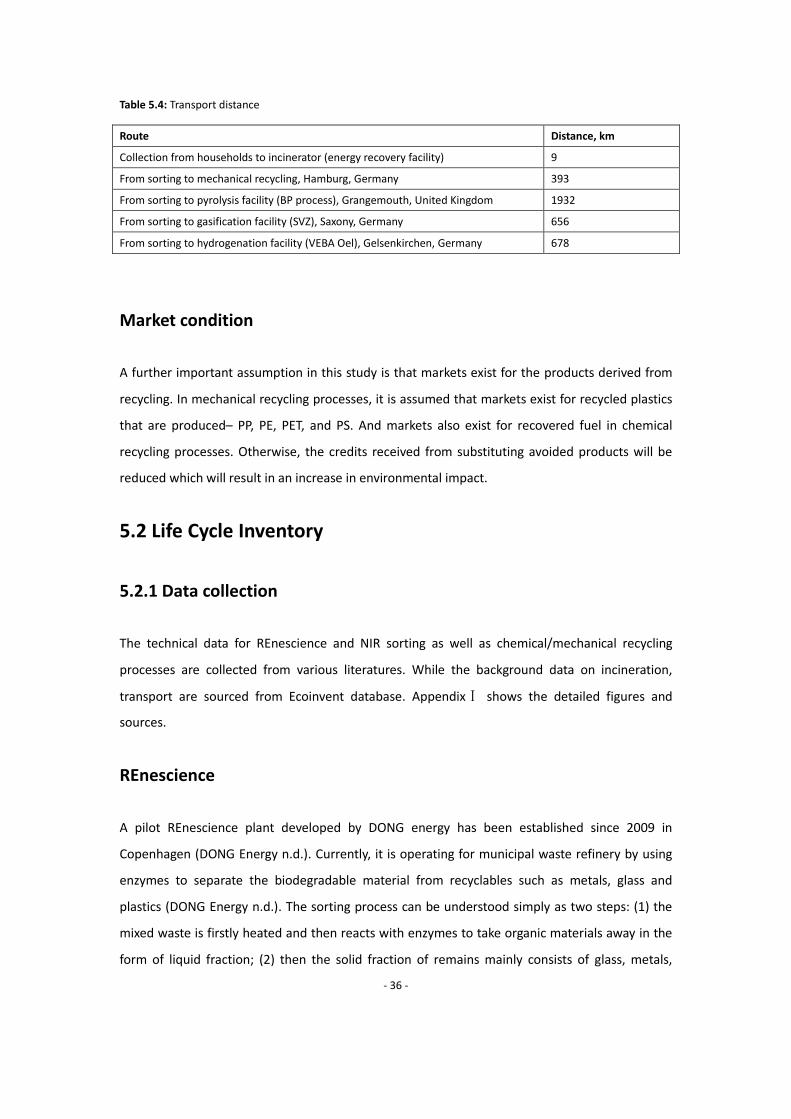
Table 5.4: Transport distance
Market condition
A further important assumption in this study is that markets exist for the products derived from
recycling. In mechanical recycling processes, it is assumed that markets exist for recycled plastics
that are produced– PP, PE, PET, and PS. And markets also exist for recovered fuel in chemical
recycling processes. Otherwise, the credits received from substituting avoided products will be
reduced which will result in an increase in environmental impact.
5.2 Life Cycle Inventory
5.2.1 Data collection
The technical data for REnescience and NIR sorting as well as chemical/mechanical recycling
processes are collected from various literatures. While the background data on incineration,
transport are sourced from Ecoinvent database. AppendixⅠ shows the detailed figures and
sources.
REnescience
A pilot REnescience plant developed by DONG energy has been established since 2009 in
Copenhagen (DONG Energy n.d.). Currently, it is operating for municipal waste refinery by using
enzymes to separate the biodegradable material from recyclables such as metals, glass and
plastics (DONG Energy n.d.). The sorting process can be understood simply as two steps: (1) the
mixed waste is firstly heated and then reacts with enzymes to take organic materials away in the
form of liquid fraction; (2) then the solid fraction of remains mainly consists of glass, metals,
Route Distance, km
Collection from households to incinerator (energy recovery facility) 9
From sorting to mechanical recycling, Hamburg, Germany 393
From sorting to pyrolysis facility (BP process), Grangemouth, United Kingdom 1932
From sorting to gasification facility (SVZ), Saxony, Germany 656
From sorting to hydrogenation facility (VEBA Oel), Gelsenkirchen, Germany 678

- 37 -
plastics, textiles are exposed to further sorting to get recyclables.
This study only focuses on taking plastics out by using REnescience technology. For that reason
the consumption of water, enzymes and heat for processing organic fraction is not included in the
calculation (Schmidt and Løkke 2012). Similarly, the energy consumption for the separation of
recyclable materials is divided and allocated on plastic segregation by weight. According to Riber
et al. (2009) cited by Tonini and Astrup (2012), the proportions of plastic, glass, metal and textile
in average Danish residual waste are 9.2%, 2.9%, 3.5% and 1.9% respectively. While the electricity
consumed to separate recyclables was estimated at 18kwh/tonne waste treated (Tonini and
Astrup 2012). Therefore, the energy allocation for plastic treatment is 9.5 kwh/tonne plastic
treated.
Besides, prior to NIR sorting, the mixed plastic as one of the outputs from REnescience machine
is assumed to be washed in consideration of the acceptance of NIR sorting machine (Løkke 2012).
The water and energy consumption associated with washing is estimated based on the figure in a
project report from Danish EPA (Frees 2002). A medium figure of 78L/kg and 10.9MJ/kg has been
used in the LCA models. The electricity utilization is estimated by personal experience about 0.5
kwh/tonne (Løkke 2012). Finally, it is estimated that there is 10% material loss in REnescience
(Tonini and Astrup 2012).
NIR sorting and mechanical recycling
Near infra-red sorting (NIR) is commonly used in the automatic plastic sorting (Dodbiba and Fujita
2004). The data used for NIR (Titech) sorting process is based on Shonfield (2008). AppendixⅠ
illustrates the separaion effiencecy of different plastics and energy consumption.
The mechanical recycling process was considered mainly including shredding and extrusion in LCA
models. The estimations of energy consumption in shredding (to cut the product less than 80 mm
in diameter) and extrusion are 24kwh/tonne and 270kwh/tonne respectively with 2% material
loss during this process based on Shonfield (2008).

- 38 -
Pyrolysis (BP), gasification (SVZ) and hydrogenation (Veba Oel)
recycling
Before entering into feedstock recycling, a treatment of size reduction is needed for the sorted
plastic mixture. The data for pre-shredding treatment is estimated based on the same process in
mechanical recycling (24kwh/tonne).
The inventory data related to the pyrolysis (BP) recycling and hydrogenation (Veba Oel) recycling
are collected from their official documents (Bez and Nürrenbach 2001, Dijkema and Stougie
1994), cited in Perugini, Mastellone and Arena (2005). The inventory data describing gasification
(SVZ) recycling is collected from Tukker, et al. (1999). AppendixⅠ gives the original data and
the corresponding equivalent products used in LCA. The description on different technologies is
shown in AppendixⅢ.
Incineration
Incineration process happens in Copenhagen, Denmark. The environmental benefits accrues from
incineration with energy recovery, which in Copenhagen avoid the requirement to obtain
electricity and heating from other sources. According to Schmidt (2005), the electricity and
heating efficiency for waste incineration in Copenhagen is 14% and 71% respectively. Data
regarding to the energy which can be recovered from different types of plastic waste is based on
Ecoinvent datasets in Sima Pro: 42.74 MJ/kg for PE, 32.78 MJ/kg for PP, 22.95 MJ/kg for PET and
38.67 MJ/kg for PS.
Table 5.5: Applied efficiencies for waste incineration Copenhagen (Schmidt 2005)
Power efficiency 14%
Heating Efficiency 71%
Total efficiency 85%
Marginal energy production
The energy recovery derived from incineration has potential effect on the energy supply system
in the future. It is necessary to identify the energy suppliers that are actually affected by the
system changes, so that the input and output/avoided energy can be presented by the mixture of
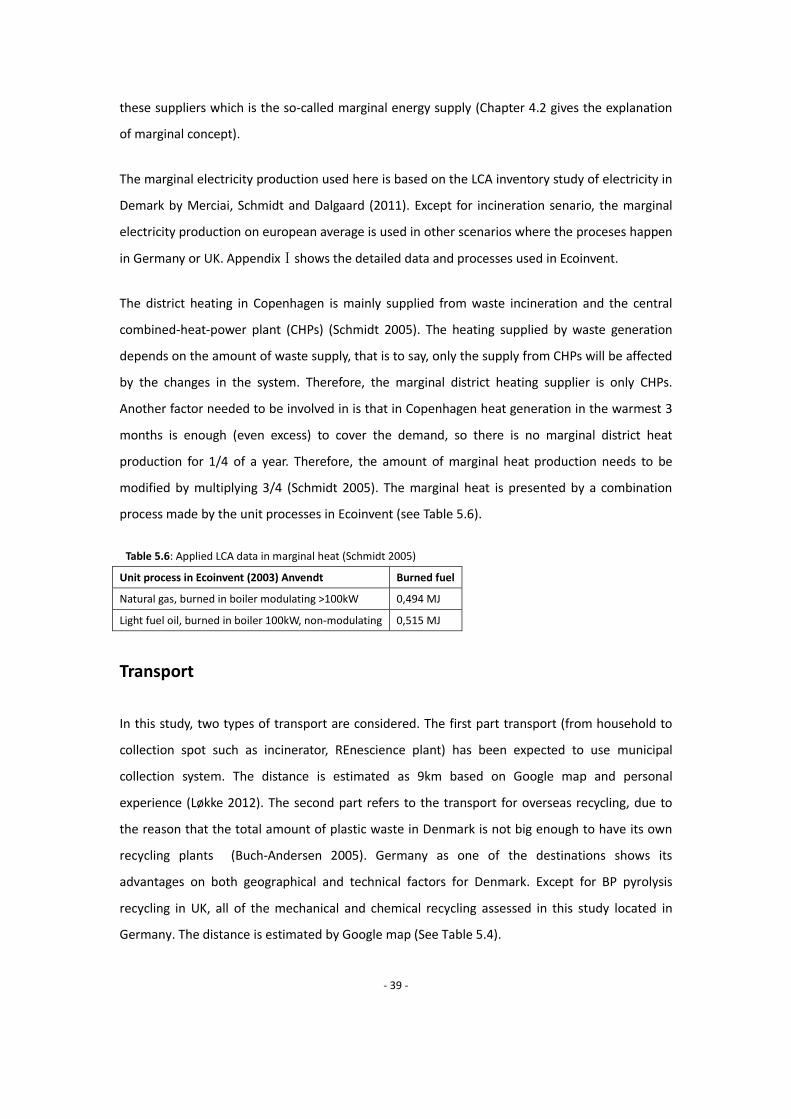
- 39 -
these suppliers which is the so-called marginal energy supply (Chapter 4.2 gives the explanation
of marginal concept).
The marginal electricity production used here is based on the LCA inventory study of electricity in
Demark by Merciai, Schmidt and Dalgaard (2011). Except for incineration senario, the marginal
electricity production on european average is used in other scenarios where the proceses happen
in Germany or UK. AppendixⅠshows the detailed data and processes used in Ecoinvent.
The district heating in Copenhagen is mainly supplied from waste incineration and the central
combined-heat-power plant (CHPs) (Schmidt 2005). The heating supplied by waste generation
depends on the amount of waste supply, that is to say, only the supply from CHPs will be affected
by the changes in the system. Therefore, the marginal district heating supplier is only CHPs.
Another factor needed to be involved in is that in Copenhagen heat generation in the warmest 3
months is enough (even excess) to cover the demand, so there is no marginal district heat
production for 1/4 of a year. Therefore, the amount of marginal heat production needs to be
modified by multiplying 3/4 (Schmidt 2005). The marginal heat is presented by a combination
process made by the unit processes in Ecoinvent (see Table 5.6).
Table 5.6: Applied LCA data in marginal heat (Schmidt 2005)
Unit process in Ecoinvent (2003) Anvendt Burned fuel
Natural gas, burned in boiler modulating >100kW 0,494 MJ
Light fuel oil, burned in boiler 100kW, non-modulating 0,515 MJ
Transport
In this study, two types of transport are considered. The first part transport (from household to
collection spot such as incinerator, REnescience plant) has been expected to use municipal
collection system. The distance is estimated as 9km based on Google map and personal
experience (Løkke 2012). The second part refers to the transport for overseas recycling, due to
the reason that the total amount of plastic waste in Denmark is not big enough to have its own
recycling plants (Buch-Andersen 2005). Germany as one of the destinations shows its
advantages on both geographical and technical factors for Denmark. Except for BP pyrolysis
recycling in UK, all of the mechanical and chemical recycling assessed in this study located in
Germany. The distance is estimated by Google map (See Table 5.4).

- 40 -
5.2.2 Relating data to functional unit
Some of the data collected above are expressed in different functional unit, therefore
transformation of all the data into unified functional unit defined in this study is shown in the
following tables. Table 5.7-5.10 show the data related with scenario1, 2, 6 respectively. Because
of the several same processes possessed by scenario 3-5, the relevant data has been shown in
table. The outputs in bold and italic form present the avoided products. The original data sources
have been showed in AppendixⅠ.
Table 5.7: Inventory data related to scenario 1—incineration
Input Output
Collection (municipal collection system)
Plastic waste (t) 1,25E+04 Plastic waste (t) 1,25E+04
Transport (km) 9,00E+00
Incineration
Plastic waste (t) 1,25E+04 Electricity (14%) (MJ) 5,05E+07
Heating (71%*0,75) (MJ) 1,92E+08

- 41 -
Table 5.8: Inventory data related to scenario 2—mechanical recycling
Input Output
collection (municipal collection system)
Plastic waste (t) 1,25E+04 Plastic waste (t) 1,25E+04
Transport (km) 9,00E+00
REnescience sorting
Plastic waste (t) 1,25E+04 Plastic waste (t) 1,12E+04
Electricity energy (kwh) 1,18E+05
Pre-washing
Plastic waste (t) 1,12E+04 Plastic waste (t) 1,12E+04
Electricity energy(kwh) 5,61E+03
Cold water (t) 8,75E+05
Heat energy (MJ) 1,22E+08
Transport:393km
NIR sorting (Titech)
Plastic waste (t) 1,12E+04 PE (t) 1,48E+03
Electricity energy (kwh) 3,01E+05 PP (t) 4,44E+03
PS (t) 4,59E+02
PET (t) 1,65E+03
Mechanical recycling
Sorted PE (t) 1,48E+03 Recycled PE (t) 1,45E+03
Electricity energy (kwh) 4,36E+05
Sorted PP (t) 4,44E+03 Recycled PP (t) 4,35E+03
Electricity energy (kwh) 1,31E+06
Sorted PS (t) 4,59E+02 Recycled PS (t) 4,50E+02
Electricity energy(kwh) 1,35E+05
Sorted PET (t) 1,65E+03 Recycled PET (t) 1,62E+03
Electricity energy (kwh) 4,86E+05

- 42 -
Table 5.9: Inventory data related to scenario 3- 5—chemical recycling
Input Output
collection (municipal collection system)
Plastic waste (t) 1,25E+04 Plastic waste (t) 1,25E+04
Transport (km) 9,00E+00
REnescience sorting
Plastic waste (t) 1,25E+04 Plastic waste (t) 1,12E+04
Electricity energy (kwh) 1,18E+05
Pre-washing
Plastic waste (t) 1,12E+04 Plastic waste (t) 1,12E+04
Electricity energy(kwh) 5,61E+03
Cold water (t) 8,75E+05
Heat energy (MJ) 1,22E+08
Transport to pyrolysis:1932km; Transport to gasification: 656km; Transport to hydrogenation: 678km
NIR sorting (Titech)
Plastic waste (t) 1,12E+04 Polyolefines fraction(t) 6,38E+03
Electricity energy (kwh) 3,01E+05 PET(t) 1,65E+03
PET mechanical recycling
Sorted PET(t) 1,65E+03 Recycled PET(t) 1,62E+03
Electricity energy (kwh) 4,86E+05
Pre-shredding
Polyolefines fraction(t) 6,38E+03 Polyolefines fraction(t) 6,38E+03
Electricity energy (kwh) 1,53E+05
Pre-shredding (including PET)
Polyolefines fraction (t) 8,03E+03 Polyolefines fraction(t) 8,03E+03
Electricity energy (kwh) 1,93E+05
Pyrolysis (BP process)
Polyolefines fraction (t) 6,38E+03 Paraffin production(t) 2,86E+03
Naphtha (t) 3,80E+011 Naphtha production(t) 1,69E+03
Electricity energy (MJ) 1,35E+06 Refinery gas (t) 9,38E+02
CO2(t) 2,20E+03
Gasification (SVZ)
Polyolefines fraction(t) 6,38E+03 Methanol (t) 5,96E+03
Waste oil (t)2 2,14E+03 Natural gas (m3) 2,50E+06
3
1 Unit conversion from 8.36E+05 (MJ) to 3.80E+01 (t) by energy value of naphtha: 22000MJ/t
2 Replaced by crude oil process in Sima Pro calculation, specific discussion see AppendixⅠ
3 Unit conversion from 1707 (t) to 2,50E+06 (m3) by energy content of natural gas: 53.2 MJ/kg , 38.2 MJ/m3

- 43 -
……table continued from previous page
Lignite (t) 1,05E+04 Electricity (MJ) 1,91E+07
Natural gas (m3) 8.37E+05 CO2 (t) 5,29E+04
Fuel Oil (t) 3,34E+02
Gasification (SVZ) (including PET)
Polyolefines fraction 8,03E+03 Methanol (t) 7,51E+03
Waste oil (t) 2,70E+03 Natural gas (m3) 3,15E+064
Lignite (t) 1,32E+04 Electricity (MJ) 2,40E+07
Natural gas (m3) 1,05E+06 CO2 (t) 6,66E+04
Fuel Oil (t) 4,21E+02
Hydrogenation (Veba Oel)
Polyolefines fraction(t) 6,38E+03 Crude oil (t) 5,25E+03
Natural gas (m3) 7,72E+055 Natural gas(m3) 7,98E+05
6
Electricity energy (MJ) 6,13E+06
Steam (t) 2,65E+027
Hydrogenation (Veba Oel) (including PET)
Polyolefines fraction (t) 8,03E+03 Crude oil (t) 6,61E+03
Natural gas(m3) 9,72E+058 Natural gas(m3) 1,00E+06
9
Electricity energy (MJ) 7,72E+06
Steam (t) 3,34E+0210
4 Unit conversion same as the above
5 Unit conversion from 2,95E+07 (MJ) to 7,72E+05 (m3) by energy value of natural gas: 38.2MJ/m3
6 Unit conversion by using energy value of natural gas: 53.2 MJ/kg, 38.2MJ/m3
7 Unit conversion from 7,15E+05 (MJ) to 2,65E+02 (t) by energy value of steam: 2700MJ/t
8 Unit conversion by using energy value of natural gas: 38.2MJ/m3
9 Unit conversion by using energy value of natural gas: 53.2 MJ/kg, 38.2MJ/m3
10 Unit conversion by using energy value of steam: 2700MJ/t

- 44 -
Table 5.10: Inventory data related to scenario 6—mechanical recycling after household sorting
Input Output
collection (municipal collection system)
Plastic waste (t) 1,25E+04 Plastic waste (t) 1,25E+04
Transport (km) 9,00E+00
Transport:393km
NIR sorting (Titech)
Plastic waste (t) 1,25E+04 PE (t) 1,65E+03
Electricity energy (kwh) 3,33E+05 PP (t) 4,93E+03
PS (t) 5,10E+02
PET (t) 1,83E+03
Mechanical recycling
Sorted PE (t) 1,65E+03 Recycled PE (t) 1,62E+03
Electricity energy (kwh) 4,85E+05
Sorted PP (t) 4,93E+03 Recycled PP (t) 4,83E+03
Electricity energy (kwh) 1,45E+06
Sorted PS (t) 5,10E+02 Recycled PS (t) 5,00E+02
Electricity energy(kwh) 1,50E+05
Sorted PET (t) 1,83E+03 Recycled PET (t) 1,80E+03
Electricity energy (kwh) 5,39E+05
5.3 Life Cycle Impact Assessment
The main goal of this study is to, based on LCA methodology, calculate the GHG emissions from
plastic waste treatment under current situation in Copenhagen city and give a comparison of
potential recycling methods among four major plastic types from an environmental point of view.
Therefore, the following scenarios have been defined to facilitate the achievement of the aims. In
this step, the global warming potential of each scenario is calculated based on life cycle inventory
presented in above section and the results are presented. Due to the reason that the current
study only focuses on one impact category—“climate change”, normalisation and weighting are
not used. As one of the characterisation factors in the midpoint categories in ReCiPe method, the
global warming potential, abbreviated as GWP is assessed based on the IPCC report 2007 and its
Hierarchist perspective uses 100 year timeframe (Goedkoop, Heijungs, et al. 2009).

- 45 -
Scenario 1
Figure 5.2 Scenario 1—mixed plastic waste end up with incineration with energy recovery
In this scenario, the system starts from the point that the municipal truck leaves for collection of
households’ wastes to the point at which wastes have been incinerated. During the whole
procedure, plastic wastes are mixed with other residues in the households’ waste and then
transported by municipal collection system directly to incineration producing district heating and
power in Copenhagen, Denmark (Figure 5.2).
It should be noted that the bulky PVC has been assumed to be kept away from the collected
waste and the chlorine content is acceptable for municipal incineration (elaborated in chapter
5.1.7). Besides, the data collection and assumption on transport, energy recovery efficiency and
the choice of marginal energy have been discussed in chapter 5.1.7 and 5.2.1.
Assessment results are shown in the following. Figure 5.3 reveals that the impact from
transportation is negligible.
Table 5.11: Global warming contribution from different processes in Scenario 1 (kg CO2-eq/ FU)
Unit Incineration Transport Total
kg CO2-eq -1,75E7 1,47E5 -1,74E7
Heat Incineration
Plastic waste
Mixed in household
waste
Avoided production processes
Electricity

- 46 -
Figure 5.3: CO2-eq emission from different processes in Scenario 1 (kg CO2-eq/ FU)
Note: The avoided products have been included in the incineration process. The small chart on the right hand
shows the separated impacts in incineration process
Scenario 2
Figure 5.4 Scenario 2—PE, PP, PS, PET end up with mechanical recycling individually
This scenario describes that the plastic wastes are collected and sorted in succession and then
end up with mechanical recycling in Hamburg, Germany. Mechanical recycling highly requires the
purity of input materials. Therefore, REnescience sorter is firstly employed to separate mixed
plastics from household waste, and then the mixed plastics experience NIR sorting after washing
-2,00E+07
-1,50E+07
-1,00E+07
-5,00E+06
0,00E+00
5,00E+06
CO2-eq emission from different processes in Scenario 1
kg CO2-eq
REnescience Sorting
Household waste
Plastic waste
Tran
spo
rt
Transport Pretreatment: washing;
NIR Sorting
Virgin plastic
Avoided production processes
PET
PE
PP
PS
Other fractions: metal, glass,
bio-liquid, etc.
Mechanical Recycling
Mechanical Recycling
Mechanical Recycling
Mechanical Recycling
Incinerationwithoutavoidedproducts
Avoidedproducts

- 47 -
to obtain individual type of polymers prepared for mechanical recycling (Figure 5.4).
Assessment results reveal that the sorting processes as well as transportation contribute
negligible impacts on climate change compared with pre-washing process. As a matter of fact,
the medium level of resource and energy consumption (found in the reference document) is
applied in the pre-washing process. It is possible that the impact from pre-washing may be lower
or even higher when the energy consumption is altered. Due to the significance and uncertainty
in the pre-washing process, higher and lower consumption alternatives are assessed in sensitivity
analysis.
Table 5.12: Global warming contribution from different processes in Scenario 2 (kg CO2-eq/ FU)
Unit REnesciecne sorting Pre-washing NIR sorting Mechanical recycling Transport Total
kg CO2-eq 1,98E4 9,98E6 3,56E4 -1,69E7 6,78E5 -6,6E6
Figure 5.5: CO2-eq emission from different processes in Scenario 2 (kg CO2-eq/ FU)
Note: The avoided products have been included in mechanical recycling process. The small chart on the right
hand shows the separated impacts in mechanical recycling process.
-2,00E+07
-1,50E+07
-1,00E+07
-5,00E+06
0,00E+00
5,00E+06
1,00E+07
1,50E+07
CO2-eq emission from different processes in Scenario 2
kg CO2-eq
Mechanical
recycling withoutavoided products
Avoided products

- 48 -
Scenario 3
Figure 5.6: Scenario 3—mechanical recycling for PET, pyrolysis for polyolefins
The overall flow in scenario 3 is the same as scenario 2 with only one change at the end of the
scheme, that is, PE, PP and PS fractions go into chemical recycling—BP pyrolysis in Grangemouth,
United Kingdom instead of mechanical recycling. The light fraction, heavy waxy fraction and
gaseous fraction in the main products can substitute for naphtha, paraffin and refinery gas
respectively (Shonfield 2008)(Figure 5.6).
In polymer cracking process, the acceptance criteria requires about 80% of the plastic that enters
the process is polyolefin (PP/PE), and allows maximum 15% PS (Tukker, et al. 1999). In light of the
situation that the fraction of PS only accounts for small proportion in packaging waste (see table
5), it is estimated here that the PS content in the plastic waste from household is within allowed
limits for polymer cracking process. As such, this scenario assumes that the PE, PP and PS
fractions are suited for pyrolysis technology; while PET is mechanically recycled as scenario 2.
As shown in Table 5.13, similar as scenario 2 the pre-washing process is still significant. However,
the emission from transport becomes higher due to the recycling taken place in UK instead of
Germany. Therefore, the potential savings derived from both mechanical and chemical recycling
is offset by pre-washing and transport, mainly.
REnescience Sorting
Household waste
Plastic waste
Tran
spo
rt
Transport Pre-treatment: washing;
NIR Sorting
Virgin plastic
Avoided production processes
PET
PE/PP/PS
Other fractions: metal, glass,
bio-liquid, etc.
Mechanical Recycling
Pre-treatment: Shred
Pyrolysis (BP)
Refinery gas Naphtha Paraffin
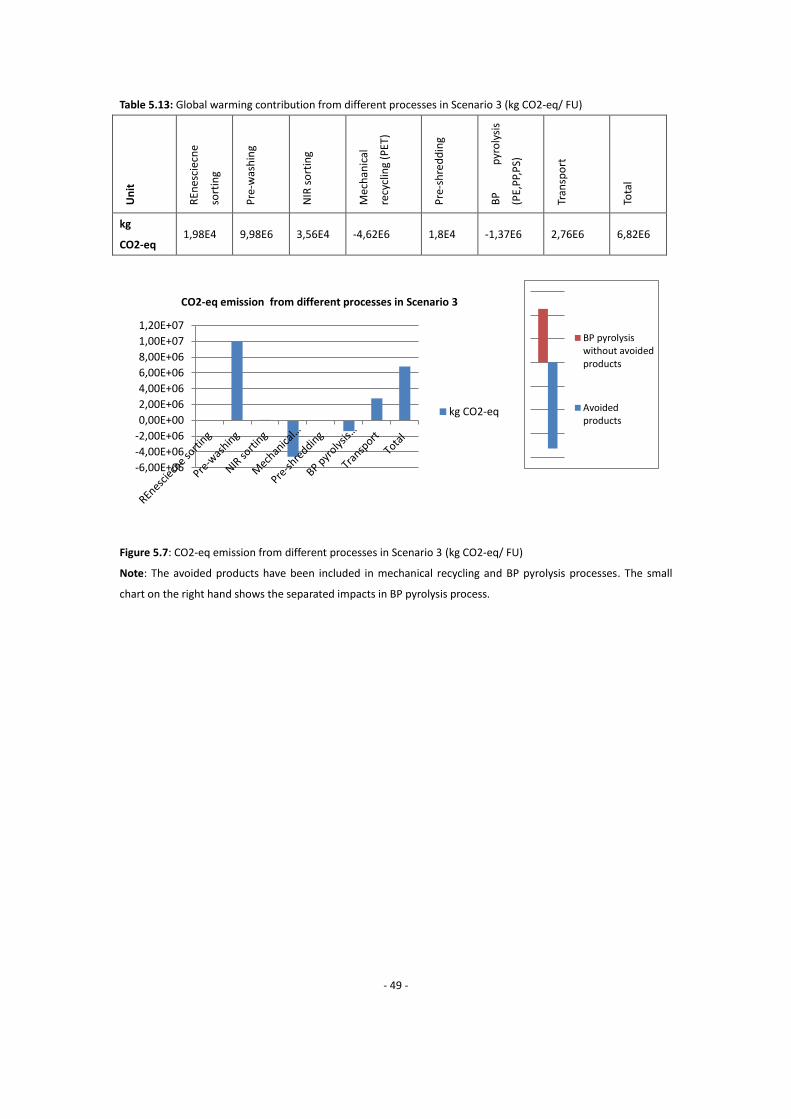
- 49 -
Table 5.13: Global warming contribution from different processes in Scenario 3 (kg CO2-eq/ FU)
Un
it
REn
esci
ecn
e
sort
ing
Pre
-was
hin
g
NIR
so
rtin
g
Mec
han
ical
recy
clin
g (P
ET)
Pre
-sh
red
din
g
BP
p
yro
lysi
s
(PE,
PP,
PS)
Tran
spo
rt
Tota
l
kg
CO2-eq 1,98E4 9,98E6 3,56E4 -4,62E6 1,8E4 -1,37E6 2,76E6 6,82E6
Figure 5.7: CO2-eq emission from different processes in Scenario 3 (kg CO2-eq/ FU)
Note: The avoided products have been included in mechanical recycling and BP pyrolysis processes. The small
chart on the right hand shows the separated impacts in BP pyrolysis process.
-6,00E+06
-4,00E+06
-2,00E+06
0,00E+00
2,00E+06
4,00E+06
6,00E+06
8,00E+06
1,00E+07
1,20E+07
CO2-eq emission from different processes in Scenario 3
kg CO2-eq
BP pyrolysiswithout avoidedproducts
Avoidedproducts

- 50 -
Scenario 4a
Figure 5.8: Scenario 4a—gasification process for mixed plastics
In this scenario, gasification technology has been assessed in other to compare with pyrolysis.
The acceptance criteria of SVZ gasification process are more tolerance for various input materials
than BP pyrolysis but the limitation on chlorine content still exist (2%-6%) (Tukker, et al. 1999).
Therefore, Scenario 4 is the same as scenario 3 with only one change at the end of the scheme,
that is, PE, PP, PET and PS fractions all go into chemical recycling—SVZ gasification process in
Saxony, Germany (Figure 5.8).
Because of the large amount of CO2 emission generated in the gasification process itself along
with the energy inputs, the emission saved by the avoided products seems to be far less the
generation.
Table 5.14: Global warming contribution from different processes in Scenario 4a (kg CO2-eq/ FU)
Unit REnescience sorting Pre-washing Pre-shredding SVZ gasification Transport Total
kg CO2-eq 1,98E4 9,98E6 2,27E4 7,22E7 1,03E6 8,33E7
REnescience Sorting
Household waste
Plastic waste
Tran
spo
rt
Transport Pre-treatment: washing;
NIR Sorting
Electricity
Avoided production processes
PE/PP/PS/PET Other fractions: metal, glass,
bio-liquid, etc.
Pre-treatment: Shred Gasification (SVZ)
Natural gas Methanol

- 51 -
Figure 5.9: CO2-eq emission from different processes in Scenario 4a (kg CO2-eq/ FU)
Note: The avoided products have been included in SVZ gasification process. The small chart on the right hand
shows the separated impacts in SVZ gasification process.
Scenario 4b
Figure 5.10 Scenario 4b—gasification for PE, PP, PS and mechanical recycling for PET
In order to enable a comparison with scenario 4a as well as scenario 3 on a fair basis, this
scenario extracts PET from mixed plastic waste for mechanical recycling while leaves other
fractions in SVZ gasification (Figure 5.10).
0,00E+001,00E+072,00E+073,00E+074,00E+075,00E+076,00E+077,00E+078,00E+079,00E+07
CO2-eq emission from different processes in Scenario 4a
kg CO2-eq
REnescience Sorting
Household waste
Plastic waste
Tran
spo
r
t
Transport Pre-treatment: washing;
NIR Sorting
Mechanical Recycling
Virgin plastic
Avoided production processes
PET
PE/PP/PS Other fractions: metal, glass,
bio-liquid, etc.
Pre-treatment: Shred Gasification (SVZ)
Electricity Natural gas Methanol
SVZ gasificationwithout avoidedproducts
Avoidedproducts

- 52 -
The assessment results reveal that even though the mechanical recycling of PET provided
emission savings but the final result has been diverted by the emission contribution from SVZ
gasification process.
Table 5.15: Global warming contribution from different processes in Scenario 4b (kg CO2-eq/ FU)
Un
it
REn
esci
ence
sort
ing
Pre
-was
hin
g
NIR
so
rtin
g
Mec
han
ical
recy
clin
g (P
ET)
Pre
-sh
red
din
g
SVZ
gasi
fica
tio
n
(PE,
PP,
PS)
Tran
spo
rt
Tota
l
kg
CO2-eq 1,98E4 9,98E6 3,56E4 -4,62E6 1,8E4 5,74E7 1,03E6 6,38E7
Figure 5.11: CO2-eq emission from different processes in Scenario 4b (kg CO2-eq/ FU)
Note: The avoided products have been included in mechanical recycling and SVZ gasification processes. The small
chart on the right hand shows the separated impacts in SVZ gasification process.
-1,00E+070,00E+00
1,00E+07
2,00E+073,00E+074,00E+07
5,00E+07
6,00E+077,00E+07
CO2-eq emission from different processes in Scenario 4b
kg CO2-eq
SVZ gasificationwithoutavoidedproducts
Avoidedproducts

- 53 -
Scenario 5a
Figure 5.12: Scenario5a—hydrogenation for mixed plastic waste
Similar as scenario 4a, household wastes are sent to REnescience for separation of mixed plastic
waste, and then transported to a plant installed in Bottrop, Germany to “convert plastic waste in
fragment of hydrocarbons, in appearance and composition similar to crude oil” (Perugini,
Mastellone and Arena 2005).
The only change between Scenario 4 and Scenario 5 is the technology employed for feedstock
recycling. Besides the variation of recycling site stated above, the approach has also altered from
gasification to hydrogenation. Compared with SVZ gasification process, hydrogenation shows
more positive result on GHG emission. With the emission derived from recycling process
declining, the impact of pre-washing process becomes significant again.
Table 5.16 Global warming contribution from different processes in Scenario 5a (kg CO2-eq/ FU)
Unit REnescience
sorting Pre-washing Pre-shredding
Veba Oel
hydrogenation Transport Total
kg CO2-eq 1,98E4 9,98E6 2,27E4 -3,94E3 1,06E6 1,11E7
REnescience Sorting
Household waste
Plastic waste
Tran
spo
rt
Transport Pre-treatment: washing;
NIR Sorting
Crude oil
Avoided production processes
PE/PP/PS/PET Other fractions: metal, glass,
bio-liquid, etc. Pre-treatment: Shred
Hydrogenation (Veba Oel)
Natural gas

- 54 -
Figure 5.13: CO2-eq emission from different processes in Scenario 5a (kg CO2-eq/ FU)
Note: The avoided products have been included in Veba Oel hydrogenation process. The small chart on the right
hand shows the separated impacts in Veba Oel process.
Scenario 5b
Figure 5.14: Scenario5b—hydrogenation for PE, PP, PS and mechanical recycling for PET
Scenario 5b plays the same role as scenario 4b, that is, to make a comparison among various
treatment options on a same basis respectively. Compared with scenario 3, the only difference
comes from the change between the process of BP pyrolysis and Veba Oel hydrogenation. The
overall emissions of two scenarios are close. Although BP pyrolysis process shows greater
-2,00E+06
0,00E+00
2,00E+06
4,00E+06
6,00E+06
8,00E+06
1,00E+07
1,20E+07
CO2-eq emission from different processes in Scenario 5a
kg CO2-eq
REnescience Sorting
Household waste
Plastic waste
Tran
spo
r
t
Pre-treatment: washing;
NIR Sorting
Mechanical Recycling
Virgin plastic
Avoided production processes
PET
PE/PP/PS Other fractions: metal, glass,
bio-liquid, etc.
Pre-treatment: Shred Hydrogenation
(Veba Oel)
Transport
Crude oil Natural gas
Veba Oelhydrogenation withoutavoidedproducts
Avoidedproducts

- 55 -
advantage on emission saving than Veba Oel hydrogenation, the transport emission finally offsets
and diverts the advantage since the transport distance triples. Compared with scenario 4b, it is
clear that SVZ gasification contributes the highest GHG emission. Finally, when comparing with
scenario 5a, we can see that mechanical recycling displays bigger advantage than hydrogenation.
Of course, the conclusion is based on the assumption that the recycled plastics from mechanical
approach can substitute virgin plastic on 1:1 basis and the market exists.
Table 5.17: Global warming contribution from different processes in Scenario 5b (kg CO2-eq/ FU)
Un
it
REn
esci
ence
sort
ing
Pre
-was
hin
g
NIR
so
rtin
g
Mec
han
ical
recy
clin
g (P
ET)
Pre
-sh
red
din
g
Veb
a O
el
hyd
roge
nat
ion
(PE,
PP,
PS)
Tran
spo
rt
Tota
l
kg CO2-eq 1,98E4 9,98E6 3,56E4 -4,62E6 1,8E4 -3,13E3 1,06E6 6,49E6
Figure 5.15: CO2-eq emission from different processes in Scenario 5b (kg CO2-eq/ FU)
Note: The avoided products have been included in mechanical recycling and Veba Oel hydrogenation processes.
The small chart on the right hand shows the separated impacts in Veba Oel process.
-6,00E+06
-4,00E+06
-2,00E+06
0,00E+00
2,00E+06
4,00E+06
6,00E+06
8,00E+06
1,00E+07
1,20E+07
CO2-eq emission from different processes in Scenario 5b
kg CO2-eq
Veba Oelhydrogenation withoutavoidedproducts
Avoidedproducts

- 56 -
Scenario 6
Figure5.16 Scenario 6—kerbside sorting for mechanical recycling
This scenario describes the situation under the assumption that the potential plastic waste could
be well-separated by household in a designated trash bin when discarding. In fact, a new kerbside
collection is going to be carried out from late 2012 in Copenhagen, aiming at collecting rigid
plastic packaging separately from other household waste (Larsen and Skovgaard 2012).
In this way, the mixed plastic waste could be transported directly to NIR sorting and enter into
different recycling processes afterwards (Figure 5.16). Therefore, this scenario can be roughly
equal to scenario 2 with exclusion of REnescience sorting process. Actually, the result of the
former one is more positive than that of the later one when including material losses in
REnescience into consideration. Obviously, among all the scenarios, it represents the lowest
emission option.
Table 5.18: Global warming contribution from different processes in Scenario 6 (kg CO2-eq/ FU)
Unit NIR sorting Mechanical recycling Transport Total
kg CO2-eq 3,96E4 -1,92E7 7,38E5 -1,84E7
Plastic waste segregated by
households
Transport Pre-treatment: washing;
NIR Sorting
Virgin plastic
Avoided production processes
PET Mechanical Recycling
Mechanical Recycling
Mechanical Recycling
Mechanical Recycling
PS
PE
PP

- 57 -
Figure 5.17: CO2-eq emission from different processes in Scenario 6 (kg CO2-eq/ FU)
Note: The avoided products have been included in mechanical recycling process. The small chart
on the right hand shows the separated impacts in mechanical recycling process.
5.4 Interpretation
In the above section, the individual assessment result has been shown and the comparisons
among mutual processes for each scenario have been also elaborated. The total emission from all
scenarios is illustrated in Figure 5.18, where we can see that scenarios with SVZ gasification
process contribute highest emission, followed by the other two feedstock recycling
approaches—Veba Oel hydrogenation and BP pyrolysis. The largest emission saving occurs in
scenario 6—mechanical recycling with new kerbside sorting system, while incineration with
energy recovery presents the second largest saving.
Figure 5.18: Total emission from all scenarios
-2,50E+07
-2,00E+07
-1,50E+07
-1,00E+07
-5,00E+06
0,00E+00
5,00E+06
NIR sorting Mechanicalrecycling
Transport Total
CO2-eq emission from different processes in Scenario 6
kg CO2-eq
-4,00E+07
-2,00E+07
0,00E+00
2,00E+07
4,00E+07
6,00E+07
8,00E+07
1,00E+08
Total emission from all scenarios
kg CO2-eq
Mechanicalrecyclingwithoutavoidedproducts
Avoidedproducts

- 58 -
However, the result may vary due to some uncertainties. For instance, a change in composition of
plastic waste may result in a different outcome as the amount of plastics entering into different
recycling processes will be changed. Another factor may influence the result is the pre-washing
step. This step has significant affected the total emission of several scenarios, which has been
clearly shown in chapter 5.3. In addition, in the assessment, a marginal power supply
representing future changes has been employed in the situation of both Denmark and other
European countries. However, the future marginal supply doesn't consider coal fired power
supply at all which contributes high CO2 emission. For that reason, the result may vary if the
marginal power supply is assumed as coal fired power supply.
Therefore, sensitivity check is undertaken in this section to provide a critical reflection of the
presented result. As mentioned above, it is necessary to involve three major aspects into
sensitivity analysis—the composition of plastic waste, the energy and resource consumption in
pre-washing and marginal energy supply.
5.4.1 Sensitivity analyses—composition of household plastic waste
The reason to build up this sensitivity check is that a composition ratio based on UK situation has
been applied due to the lack of composition of household plastic waste in Copenhagen. However,
it shows significant differences with the figure collected about plastic packaging waste from
Danish household, especially on the PP and PE fractions (elaborated in Chapter 5.1.7). Thus, it is
necessary to have a look at what will happen when the composition changes (see Table 5.19).
Most scenarios are supposed to be change in current sensitivity check due to the change of
composition ratio in household plastic waste.
Table 5.19: Composition ratio of household plastic waste for sensitivity analysis
Material type Default composition, % Alternative composition, %
PE 15 56
PP 40 10
PET 17 6
PS 6 6
PVC 11 11
Others 11 11

- 59 -
Figure 5.19: Sensitivity analysis of composition
As shown in Figure 5.19, the altering of composition ratio in household plastic waste does affect
the total emission of most scenarios. However, the effect is not to an extent to trigger big
changes in the rankings of the scenarios. The only alternation which affects the rankings occurs
between scenario 1—incineration and scenario 6—mechanical recycling with kerbside sorting.
The change can be attributed to the largely increased PE fraction and decreased PP fraction.
Firstly, the energy value of PE (42.47 MJ/kg) is higher than PP (32.78 MJ/kg), which means that
the energy that can be recovered from the waste stream will increase when the amount of PE
increases and PP decreases. Thus, the emission saving becomes higher in scenario 1 as there is a
potential for more energy recovery. Secondly, the separation efficiency of PE (78.5%) is lower
than PP (88.1%) in NIR sorting facility. With the waste amount increasing in PE and decreasing in
PP, the amount of plastic which can be sorted out from sorting facility for mechanical recycling
will decline. Thus, the emission saving becomes lower in scenario 6 due to the decline of avoided
products—recycled plastics.
5.4.2 Sensitivity analyses—pre-washing
Pre-washing process is built in order to ensure that plastic waste sorted out of municipal waste by
REnescience can meet the input requirements of NIR sorting facility. A medium figure of energy
and water consumption has been used in the LCA models. However, in some scenarios,
pre-washing process shows a significant influence on the total emission. So it is necessary to
make a sensitivity check on the situation with higher or lower consumption (see Table 5.20).
-4,00E+07
-2,00E+07
0,00E+00
2,00E+07
4,00E+07
6,00E+07
8,00E+07
1,00E+08
Sensitivity analysis of composition
Defaultcomposition
Alternativecomposition

- 60 -
Table 5.20: Water and energy consumption in pre-washing for sensitivity analysis
Consumption Default Higher Lower
Cold water (L/kg) 78 213 11
Energy for Warming water (MJ/kg) 10.9 29.8 0
Figure 5.20: Sensitivity analysis of pre-washing
Except for Scenario1 and Scenario6, pre-washing process involves in all of the rest scenarios.
Figure 5.20 illustrates the variation for each scenarios resulting from the consumption levels.
Geranial speaking, pre-washing step has important influence on total emission of all scenarios
with it. However, the original rankings remain the same without affected by the change of
consumption levels in pre-washing. It should be noted that scenario 2 is significantly affected by
pre-washing step, with the lowest consumption in pre-washing scenario 2 becomes very close to
the most emission saving options—Scenario 1 and Scenario 6.
5.4.3 Sensitivity analyses—marginal power production
The applied electricity mix model based on consequential future described in the inventory
reports of 2.0 LCA consultants (Merciai, Schmidt and Dalgaard 2011) has been employ as the
marginal power production. It reflects the competitive suppliers which are likely to respond to a
long-term change in demand (see AppendixⅠ). The coal fired power generation as a traditional
option has not been considered in the future consequential model at all as it is regarded as being
phased out and constrained in the future. However, from a short-term perspective, it is also
-4,00E+07
-2,00E+07
0,00E+00
2,00E+07
4,00E+07
6,00E+07
8,00E+07
1,00E+08
1,20E+08
Sensitivity analysis of pre-washing
Highconsumption
Defaultconsumption
Low consumption

- 61 -
reasonable to assume the marginal supply is coal as it is still has its competitiveness in energy
supply in Denmark and Europe. The unit processes in Ecoinvent used to represent the new
marginal supply in Denmark and OECD countries are “Electricity, hard coal, at power
plant/NORDEL” and “Electricity, hard coal, at power plant/UCTE” respectively.
When the marginal electricity supply changes from “consequential future” to “consequential coal”
the emission results of all scenarios will be changed correspondingly. Figure 5.21 shows the
comparison between the default result and new variation resulting from the assumption of coal
as the marginal electricity supply. The change in marginal supply results in more emission saving
for Scenario 1 and Scenario 4 and higher emission for the rest scenarios. This is because
electricity production exists in the avoided products/output of incineration with energy recovery
(Scenario 1) and SVZ gasification process (Scenario 4a and 4b). More CO2 emission can be saved
when the avoided electricity is generated based on coal than other clean energy (the
consequential future model mainly consists of energy from biomass, wind, etc.). The overall
rankings remain almost same except for a switch between Scenario1 and Scenario 6.
Figure 5.21: Sensitivity analysis of marginal power production
5.4.4 Completeness check
Completeness check is required in order to confirm all the data collection, assumption and life
cycle stages are available and completed (Thrane and Schmidt 2007). In the current study, all the
information about data type, system boundary, scenarios design and processes in waste
-4,00E+07
-2,00E+07
0,00E+00
2,00E+07
4,00E+07
6,00E+07
8,00E+07
1,00E+08
Sensitivity analysis of marginal power production
Consequential coal
Consequentialfuture (default)

- 62 -
treatment stages as well as assumptions have been presented in chapter 5.1—goal and scope.
The inventory data collection and calculation have been shown in chapter 5.2—life cycle
inventory and AppendixⅠ.
5.4.3 Consistency check
The purpose of consistency check is to ensure the data, assumptions and methods are consistent
throughout the whole life cycle assessment (Thrane and Schmidt 2007). In the current study,
chapter 5.2—life cycle inventory and AppendixⅠ provides detailed information on the data
collection and calculation. The data with respect to specific country have been used when the
processing steps which take place in the country (for instance, Denmark), while European average
data have been applied when certain data are not available in specific countries (for instance,
marginal electricity supply in UK and Germany). The assumptions and uncertainties which have or
may have high influence on the results have been checked by sensitivity analysis in the above
sections.
5.4.4 Other Impact Categories
Although this study only focuses on the impact of climate change, it is also possible to have a
glance at several other impact categories for different scenarios. The impact categories such as
depletion, human toxicity, acidification, eutrophication and eco-toxicity etc. are presented in
Figure5.22. We can see from the figure that scenario 4a/4b with SVZ gasification process not only
have strong impact on climate change but also has significant impact on human toxicity, fresh
water eutrophication, fresh water eco-toxicity and marine eco-toxicity.

- 63 -
Figure 5.22 Environmental Impacts from different scenarios (after normalisation)

- 64 -
6. Conclusions
6.1 General conclusion
With a skyrocketed rise of plastic production ever since 1940s, plastics have been getting more
and more attention due to its use of resources and its impacts on the environment and health. In
face of the increasing demand on plastics as well as plastic waste generated correspondingly,
European plastic waste management has experienced the evolution from basic landfill disposal to
energy recovery and recycling with the ultimate goal of prevention. At present, the best practice
of waste plastic management in European countries is a combination of both recycling and
energy recovery. In the year 2010, 57.9% of plastic in EU (EU-27 plus Norway and Switzerland)
ended up in recycling and energy recovery. Looking at recycling alone, mechanical recycling took
place processing 21.3% (5.3 Mt) of the total plastic waste in Europe (EU-27 plus Norway and
Switzerland), while Chemical recycling only representing 0.3% (0.07Mt).
At present, the majority of recycled plastics derive from commercial plastic waste, such as
industrial packaging waste and process scrap. It should be noted that, besides the best practice
in dealing with deposited PET bottles, considerable plastic wastes involved in household waste
have not gotten well-extracted and recycled. These wastes consist of packaging, films, covers,
bags, containers and other plastic products which are widely used in our daily life. In dealing with
MSW, EU waste policy has been playing an important role over the past 30 years. The emphasis
has been changed from reducing waste negative impacts to seeing waste as a valued resource.
The new Waste Framework Directive (WFD-2008/98/EC) has set the targets for EU Member
States to recycle 50% of their municipal waste and 70% of construction waste by 2020.
In Demark, incineration with energy recovery for MSW has been utilised as a strategic component
of an integrated waste management policy (Gendebien, et al. 2003). The total recovery rate for
all plastics in 2010 has reached 95%, in which recycling performance has reached almost 25% and
energy recovery level is around 70%. The recycling rate of plastic packaging waste has been
steadily increasing, and exceeded the target of 22.5% indicated in EU Packaging Directive since
2008. Nevertheless, the same as the situation in other countries, it is the collection from
commercial enterprises that contributes a very large part of the recycling instead of households’
part.

- 65 -
6.2 Conclusion on LCA study
Take Copenhagen municipality as an example, under the framework of EU regulations on waste
and the new targets for recycling, Copenhagen Waste Management Plan 2012 and Copenhagen
Carbon Neutral Plan by 2025 have been put into force. With respect to plastic waste, a new
target has been set up to reduce the amount of waste plastic mixed in municipal waste for
incineration (40,000 tonnes) by 15,000 tonnes. In Copenhagen municipal waste regulation,
specific rules for PVC waste disposal have been already in place. And a new kerbside collection
scheme which includes source separation of plastic waste will start in late 2012.
Based on this background, the current study focuses on different outlets of plastics mixed in
household waste and tries to look at their contributions to climate change. From the perspective
of how to sort plastic out of household waste, a comparison has been made between
REnescience sorting and kerbside sorting. From technology perspective, a comparison has been
made among incineration with energy recovery, mechanical recycling and feedstock recycling. In
addition, it is not realistic for demark to have its own recycling plants due to the amount of
plastic waste, the recycling plants selected in the study are mainly located in Germany (only one
in UK) in consideration of distance. Finally, eight scenarios have been built up.
The total emission from all scenarios presents differently. Scenarios with SVZ gasification process
contribute highest emission, followed by the other two feedstock recycling approaches—Veba
Oel hydrogenation and BP pyrolysis. The largest emission saving occurs in Scenario
6—mechanical recycling with kerbside sorting, while incineration with energy recovery presents
the second largest saving.
If we look at the individual process in each scenario, assessment results reveal that:
1. Although REnescience sorting affects the total emission very slightly, the cleaning of plastic
waste after REnescience increased environmental impacts for recycling, especially in Scenario 2,
Scenario 3 and Scenario 5. Therefore, kerbside sorting presents more advantage.
2. The emission saving rankings of different technologies is:
Mechanical recycling > BP pyrolysis > Veba Oel hydrogenation > SVZ gasification

- 66 -
However, this result should be considered seriously as the real situation on the market for
recycled plastic from mechanical recycling is not clear. Some further discussion on this point has
been made in Chapter 7. Besides, even though feedstock recycling methods showed lower
advantage in emission saving, they are more tolerant in the input materials. Thus, they provide
another outlet for (1) low-quality plastics which cannot be mechanically recycled or; (2)
mechanically recycled plastic which cannot be used due to the quality or market restrictions.
3. Transportation contributes negligible impacts on climate change in all scenarios. One exception
occurs in Scenario 3 where the recycling plant is located in UK.
Given the uncertainty and significance in the pre-washing process, higher and lower consumption
alternatives are assessed in sensitivity analysis. Besides, sensitivity analysis has been also applied
in composition of household plastic waste and alternative marginal electricity supply. The results
reveal that the total emission of the scenarios changed to some extent, but the overall rankings
remain almost the same except for a slight switch between Scenario1 and Scenario 6.
Limitations of LCA Study
1. The market capacity for the recycled plastic and the quality of recycled plastic decides whether
or not the recycled plastic can substitute virgin plastic on 1:1 basis, which are not considered in
this study and deserves further discussion.
2. The real effect of kerbside sorting in Copenhagen is unknown. Therefore, the loss is not
considered in this study.
3. The losses and other residues from NIR sorting and recycling processes ending up with
incineration or landfill is not analysed in this study.
- 67 -
7. Further considerations
The LCA on climate change impact provided in this study is based on different treatment schemes
for household plastics waste from technology perspective. The scenario—Mechanical recycling
with kerbside sorting shows the highest potential in GHG reduction. In reality, the result may also
be affected by the factors like market, policy and citizen participation. Therefore, the integrated
effects from these factors should be considered.
Market
In LCA studies, mechanical recycling shows a clear advantage compared with other options.
However, its advantage in practice may be compromised due to the market condition. This is
because the emission saving from mechanical recycling is largely derived from the avoided
products which are accounted as virgin plastics with the substitution based on 1:1. Hereby, it is
under the risk of saturated market. At present, the only part of the post-consumer plastic waste
stream that has been recycled in the primary recycling is the deposited PET bottles which are
made from similar grades of PET. The recycled plastics originated from packaging or other
products have to be put into other applications because of the downgrading of properties. Some
applications which can be found on the market are grocery bags, garden benches, marker posts,
shutters and blinds, etc. It is possible that the increased amount of recycled plastics will affect the
supply in the market and then replace more virgin plastic in the market as a competitive supplier.
However, another possibility also exists where the demand of recycled plastics has been already
saturated or nearly saturated due to the limited application of downgrading plastics. In this
situation, the plastics come from mechanical recycling have no potential or very limited potential
to substitute virgin plastics. It will result in a large decline in the benefits obtained from
mechanical recycling by reducing avoided products and increasing the load of re-treatment for
the recycled plastics (incineration, feedstock recycling or landfill).
Policy
In the face of the predicament mentioned above, the policy approach adopted by government
may be of help in increasing the demand for recycled materials as the intervention from policy
side can bring some stimulation on the market. For example, maintaining a stable price of

- 68 -
recyclate after processing can be of great help for the development of markets for recycled
plastics (Singer 1995). Besides, to create a framework to encourage a clear separation of plastic
waste from other waste at low level of dirt is also a challenge job for local authorities.
Households
The households play two important roles in plastic recycling. For one thing, they are the
consumers who can make a decision on whether to buy the products made by recycled plastics,
and then affect the market demand on recycled plastics. For another, they are also the waste
producers every day. The kerbside separation efficiency and the benefit obtained by it are largely
rely on the households’ disposal decisions on whether or not to clearly separate plastic out of
other wastes.

- 69 -
References
Aguado, J., D.P. Serrano, and G.San Miguel. “European trends in the feedstock recycling of plastic
wastes.” Global NEST, 01 10 2006: 12-19.
Al-Salem, S.M., P. Lettieri, and J. Baeyens. “Recycling and recovery routes of plastic solid waste
(PSW): A review.” Waste Management, 03 July 2009: 2625–2643.
Andreasen, Preben. Aalborg Portland-Environmental Report 2010. Aalborg Portland A/S, 2011.
Bez, J., and T. Nürrenbach. Feedstock recycling of plastic waste in the polymer cracking process of
the BP-Consortium. Fraunhofer-Institut Final Report for Association of Plastics
Manufacturers in Europe (APME), Darmstadt, Germany : Fraunhofer-Instit, 2001.
Biddle, M. An Overview of Recycling Plastics from Durable Goods: Challenges and Opportunities.
Belgium: Indentiplast II , 1999.
Broek, van den. Chemometrics in spectroscopic near infrared imaging for plastic material
recognition. Doctorate thesis, Netherland: Katholieke Universiteit Nijmegen, 1997.
Buch-Andersen, Thomas. Recycling around the world. 25 June 2005.
http://news.bbc.co.uk/2/hi/europe/4620041.stm (accessed May 20, 2012).
Buley, Jennifer. “Plastic Surgery for Copenhagen's Recycling Policy.” Global Alliance for Incinerator
Alternatives. 14 April 2011.
http://www.no-burn.org/plastic-surgery-for-copenhagens-recycling-policy (accessed
April 14, 2012).
Christensen, T.H.(eds.). Solid Waste Technology & Management. Chichester: John Wiley & Sons,
Ltd, 2010.
City of Copenhagen-- The Technical and Environmental Administration. Carbon neutral by 2025–
Climate Plan Copenhagen. Copenhagen: Jønsson Grafi sk A/S, 2009.
CleanUp Australia. Report on actions to reduce circulation of single-use plastic bags around the
world. Clean Up Australia, 2010.
Cole, M., P. Lindeque, C. Halsband, and T.S. Galloway. “Microplastics as contaminants in the
marine environment: A review.” Marine Pollution Bulletin, Dec 2011: 2588-2597.
Consult with Søren Løkke and Jannick Schmidt (29 May 2012)
Consult with Søren Løkke during supervision (May 2012)
Copenhagen Municipality. Families in Copenhagen by type of family. 01 Jan. 2011.
http://www.kk.dk/sitecore/content/Subsites/CityOfCopenhagen/SubsiteFrontpage/Press
/FactsOnCopenhagen/Statistics/Population/FamiliesByTypeOfFamily.aspx (accessed April
14, 2012).

- 70 -
—. Population in Copenhagen and in Denmark. 05 March 2012.
http://www.kk.dk/sitecore/content/Subsites/CityOfCopenhagen/SubsiteFrontpage/Press
/FactsOnCopenhagen/Statistics/Population/PopulationYear.aspx (accessed April 14,
2012).
—. Workplaces by industry and residence of the employed. 01 Jan 2009.
http://www.kk.dk/sitecore/content/Subsites/CityOfCopenhagen/SubsiteFrontpage/Press
/FactsOnCopenhagen/Statistics/Labor%20market/WorkplacesByIndustry.aspx (accessed
April 14, 2012).
Curran, Mary Ann. "Life cycle assessment: Principles and practice." United States environmental
protection agency. May 30, 2006.
http://www.epa.gov/nrmrl/lcaccess/pdfs/chapter1_frontmatter_lca101.pdf (accessed
Dec 06, 2011).
Dijkema, G.P.J., and L. Stougie. Environmental and economic analysis of Veba Oel option for
processing of mixed plastic waste. The Netherlands: Delft University Clean Technology
Institute, 1994.
Directive 2008/98/EC of the European parliament and of the council of 19 November 2008 on
waste and repealing certain directives (Text with EEA relevance). Document L 312 (2008), pp 3–30
Dodbiba, G., and T. Fujita. “PROGRESS IN SEPARATING PLASTIC MATERIALS FOR RECYCLING.”
Physical Separation in Science and Engineering, 19 10 2004: 165–182.
Dodbiba, G., T. Furuyama, K. Takahashi, J. Sadaki, and T. Fujita. “Life Cycle Assessment: A Tool for
evaluating and comparing different treatment options for plastic waste from old
television sets.” Data Science Journal, 6 March 2007: 39-50.
Doka, Gabor. Lfie cycle inventories of waste treatment services. econinvent report No.13,
St.Gallen: Swiss centre for life cycle inventories, 2009.
DONG Energy. REnescience waste refinery--enzymatic separation of mixed municipal solid waste.
REnescience A/S, DONG Energy Power A/S, n.d.
Environmental Protection Agency. “Copenhagen Waste Management.” Københavns Kommune.
June 2006. web.rec.org/documents/.../first/copenhagen_waste_management.ppt
(accessed April 14, 2012).
European Commission. Being wise with waste:the EU's approach to waste management.
Luxembourg: Publications Office of the European Union, 2010.
EUROPEAN COMMISSION. Critical review of existing studies and life cycle analysis on the
regeneration and incineration of waste oils. A2– SUSTAINABLE
RESOURCES-CONSUMPTION AND WASTE, TAYLOR NELSON Sofres Consulting, 2001.
European Commission DG ENV. Plastic waste in the environment – Final Report. April, 2011.
European Commission. “Packaging waste statistics.” Eurostat. Aug 2011.

- 71 -
http://epp.eurostat.ec.europa.eu/statistics_explained/index.php/Packaging_waste_statis
tics#Plastics (accessed May 12, 2012).
Finnveden, Göran. “Methodological aspects of life cycle assessment of integrated solid waste
management systems.” Resources, Conservation and Recycling, 1999: 173-187.
Frees, Niels. Miljømæ ssige fordele og ulemper ved genvinding af plast. Miljøprojekt Nr. 657 2002,
Miljøstyrelsen, 2002.
Gendebien, A., et al. Refuse derived fuel, current practice and perspectives. Final Report,
European Commission, 2003.
Gielen, Dolf, Kamel Bennaceur, and Cecilia Tam. IEA Petrochemical Scenarios for 2030-2050:
Energy Technology Perspectives. Paris : International Energy Agency , 2006.
Goedkoop, Mark, An De Schryver, Michiel Oele, Sipke Durksz, and Douwe de Roest. Introduction
to LCA with SimaPro 7. Software manual, Netherland: PRé Consultants, 2010.
Goedkoop, Mark, Michiel Oele, An de Schryver, Marisa Vieira, and Sander Hegger. SimaPro
Database Manual,Methods library. Software Manual, Netherland: PRé Consultants,
2010.
Goedkoop, Mark, Reinout Heijungs, Mark Huijbregts, An De Schryver, Jaap Struijs, and Rosalie van
Zelm. ReCiPe 2008--A life cycle impact assessment method which comprises harmonised
category indicators at the midpoint and the endpoint level. PRé Consultants, Amersfoort,
Netherlands, 2009.
Goodship, Vannessa. Introduction to Plastics Recycling. GBR: Smithers Rapra, 2007.
Holmes, L.A., Turner, A., and R.C. Thompson. “Adsorption of trace metals to plastic resin pellets in
the marine environment.” Environmental Pollution, 1 Jan 2012: 42-48.
Hopewell, Jefferson, Robert Dvorak, and Edward Kosior. “Plastics recycling: challenges and
opportunities.” Phil. Trans. R. Soc.B, 2009: Phil. Trans. R. Soc.
HuntG.Robert. “LCA considerations of solid waste management alternatives for paper and
plastics.” Resources, Conservation and Recycling, 1995: 225-231.
IPTS. "End-of-Waste Criteria for Waste Plastic for Conversion." TECHNICAL PROPOSALS, Sevilla,
2011.
ISO 14040. Environmental management – Life Cycle Assessment- Principle and Framework.
International Standard, Geneva: International Standard Organization, 2006.
Kang, H., and J.M. Schoenung. “Electronic waste recycling: a review of U.S.infrastructure and
technology options.” Resources, Conservation and Recycling, 4 2005: 368-400.
Kaysen, Ole, and Kathe Tønning. Statistik for genanvendelse af emballageaffald 2008.
Miljøprojekt nr.1333 2010, Miljøstyrelsen, 2010.

- 72 -
Kaysen, Ole, and Kathe Tønning. Statistik for genanvendelse af emballageaffald 2009.
Miljøprojekt Nr. 1382 2011, Miljøstyrelsen, 2011.
Københavns kommune–Teknik og Miljøforvaltningen. “Bilag 1 Ydelsesbeskrivelse.” Københavns
Kommune. n.d.
http://www.kk.dk/Erhverv/Indkobogudbud/NationaleUdbud/~/media/BF8DC8E7C8B547
0A8037B8B9DEA4D8C6.ashx (accessed Feb 20, 2012).
Larsen, Anna Warberg, and Mette Skovgaard. “Action 1.2 Report on waste plastics in Copenhagen.”
2012.
Lazarevic, David, Emmanuelle Aoustin, Nicolas Buclet, and Nils Brandt. “Plastic waste
management in the context of a European recycling society: Comparing results and
uncertainties in a life cycle perspective.” Resources, Conservation & Recycling, 09 2010:
246-259.
Lindahl, Mattias, and Mats Winsnes. “Recycling of Cable Plastics -A Life Cycle Assessment of
Several Different Alternatives.” ecodesign, 2005: 539-546.
Merciai, Stefano, Jannick H Schmidt, and Randi Dalgaard. Inventory of country specific electricity
in LCA-Denmark. Aalborg, Denmark: Inventory report v2.2.0 LCA consultants, 2011.
Merciai, Stefano, Jannick H Schmidt, and Randi Dalgaard. Inventory of country specific electricity
in LCA-Europe. Aalborg,Denmark: Inventory report v2. 2.‐0 LCA consultants, 2011.
Patel, Martin, Norbert von Thienen, Eberhard Jochem, and Ernst Worrell. “Recycling of plastics in
Germany.” Resources, Conservation and Recycling, 2000: 65-90.
Perugini, Floriana, Maria Laura Mastellone, and Umberto Arena. “A life cycle assessment of
mechanical and feedstock recycling options for managemen.” Environmental Progress, 11
April 2005: 137–154.
—. “A life cycle assessment of mechanical and feedstock recycling options for management.”
Environmental Progress, 11 April 2005: 137–154.
Pilz, H., J. Schweighofer, and E. Kletzer. The Contribution of Plastic Products to Resource Efficiency.
Brussels, Belgium: PlasticsEurope, 2005.
Pilz, Harald, Bernd Brandt, and Roland Fehringer. The impact of plastics on life-cycle energy
consumption and GHG emissions in Europe. Summary report, Vienna, Austria: denkstatt
GmbH, 2010.
Plastics Technology . No. 49 - Density Separation Of Mixed Waste. Oct 2005.
http://www.ptonline.com/articles/49---density-separation-of-mixed-waste (accessed
May 24, 2012).
PlasticsEurope. Plastics - the Facts 2011, An analysis of European plastics production, demand
and recovery for 2010. Brussels,Belgium: PlasticsEurope, 2011.

- 73 -
PlasticsEurope. The compelling facts about plastics 2007:an analysis of plastics production,
demanda and recovery in Europe. Brussels, Australia: PlasticsEurope, 2008.
Pllinke, Eckhard, Niklaus Wenk, Gunther Wolff, Diana Castiglione, and Mogens Palmark.
Mechanical recycling of PVC wastes. Basel/Milan/Lyngby: DG XI of the European
Commission, 2000.
PRé Consultants. About Simapro. n.d.
http://www.pre.nl/simapro/simapro_lca_software.htm#features (accessed April 25,
2012).
Regulative for erhvervsaffald. (København Kommune, 01 Jan 2012).
Regulative for husholdningsaffald. (København Kommune, 01 Jan 2012).
Ross, Stuart, and David Evans. “The environmental effect of reusing and recycling a plastic-based
packaging system.” Journal of Cleaner Production, 11 2003: 561-571.
Sartorius, Ingo, and Joachim Wuttke. Sustainable Management and Recovery Potential of plastic
waste from the commercial and private household sectors. Mechelen: OECD Global
Forum, 2010.
Schmidt, Jannick. LCA af forsøg med indsamling af ikke-pantbelagt drikkevareemballage af plast
og metal i eksisterende glasbeholdere. København: R98/ Renholdningsselskabet af 1898,
2005.
Schmidt, Jannick. Life cycle assessment of rapeseed oil and palm oil. Ph.D. thesis, Part 3: Life cycle
inventory of rapeseed oil and palm oil. Department of Development and Planning, Aalborg
University, Aalborg, 2007.
Shonfield, Peter. LCA of Management Options for Mixed Waste Plastics. Final Report, Oxon,UK:
Waste and Resources Action Programme, 2008.
SingerJoshua. “Does the UK Government's target to recycle 25% of household waste by the year
2000 represent an economic approach to recycling? A case study of plastic.” Resources,
Conservation and Recycling, 1994: 133-155.
—. “Does the UK Government's target to recycle 25% of household waste by the year 2000
represent an economic approach to recycling? A case study of plastic.” Resources,
Conservation and Recycling, 1995: 133-155.
Skovgaard, Mette. Reducing waste plastics in the waste stream enabling a carbon neutral energy
production. Environmental Department,City of Copenhagen, 2012.
Technical and Environmental Administration. “Waste Management Plan 2012 – the short version.”
Copenhagen, 2008.
Thompson, R., C. Moore, A. Andrady, M. Gregory, H. Takada, and S. Weisberg. “New directions in
plastic debris.” Science, 18 Nov 2005: 1117.

- 74 -
Thompson, Richard C., Charles J. Moore, Frederick S. vom Saal, and Shanna H. Swan. "Plastics, the
environment and human health:current consensus and future trends." The Royal Society,
July 27, 2009: 2153-2166.
Thrane, Mikkel, and Jannick H Schmidt. “Life Cycle Assessment.” In Tools for Sustainable
Development, by Lone Kørnøv, Mikkel Thrane, Arne Remmen and Henrik Lund, 235.
Aalborg, Denmark: Aalborg Universitetsforlag, 2007.
Tonini, D., and T. Astrup. “Life-cycle assessment of a waste refinery process for enzymatic
treatment of municipal solid waste.” Waste Management, 2012: 165-176.
Tukker, A., H. de Groot, L. Simons, and S. Wiegersma. Chemical Recycling of Plastics Waste (PVC
and other resins). Netherlands: TNO Institute of Strategy,Technology and Policy, 1999.
Vasiljevic, Tamara Zelenovic, Zorica Srdjevic, Ratko Bajcetic, and Mirjana Vojinovic Miloradov. “GIS
and the Analytic Hierarchy Process for Regional Landfill Site Selection in Transitional
Countries: A Case Study From Serbia.” Environmental Management, 6 Nov 2011.
Veksebo. Kortlæ gning af kommunernes affaldsmæ ngder 2009. Rapport udført af Veksebo
Miljørådgivning ApS for I/S Amagerforbræ nding, 2010.
Wenzel, Henrik, Marianne Wesnæs, and Ole Dall. “Consequential Life Cycle Assessment.”
University of Southern Denmark, 27 Aug 2009.
Wollny, Volrad, and Martin Schmie. Assessment of Plastic Recovery Options. Germany: Institute
for Applied Ecology, 2000.
Wollny, Volrad, Guönter Dehoust, Uwe R. Fritsche, and Peter Weinem. “Comparison of Plastic
Packaging Waste Management Options--Feedstock Recycling versus Energy Recovery in
Germany.” Journal of Industrial Ecology, 3 2001: 49-63.
WUPPI A/S . n.d. http://www.wuppi.dk/ (accessed May 12, 2012).
WUPPI A/S. Sorting guide-recycling. n.d.
http://www.wuppi.dk/sorteringsguide/Genvindingsprocessen/ (accessed May 12, 2012).

- 75 -
AppendixⅠ Data collection
NIR sorting (Titech)
Table 1: NIR sorting (Titech) data from Shonfield (2008)
Calculation on energy consumption:
11214/0.861*(1.6+2.2+1.5*2+15) = 3, 01E+05 (kWh)
12460/0.861* (1.6+2.2+1.5*2+15) = 3, 33E+05 (kWh)
Pyrolysis (BP)
Table 2: Inventory of pyrolysis (BP) recycling (Bez and Nürrenbach 2001), cited by Perugini, Mastellone and Arena
(2005)
Description Unit Value Comment
Throughput t/h 0.861 Based on run 1
Power consumption (per unit)-1000mm
KW 1.6 Suggested set-up uses 2 x 1000 mm sorters and 2 x 700 mm sorters - maximum capacity for this set-up is 2 t/h
Acceleration belt KW 2.2 Requires 1 per sort unit
Conveyor KW 1.5 Requires 2 per sort unit
Compressed air KW 15 Centralised compressor serving all sorters
Separation efficiency
PP % 88.1
PE % 78.5
PET % 77.1
PS % 60.7

- 76 -
Table 3: Products of the BP pyrolysis process and the equivalent avoided products (marginal)
BP pyrolysis process products Equivalent products Basis for Substitution
heavy fraction Paraffin 1:1
light fraction Naphtha 1:1
gas fraction Refinery gas 1:1
Gasification (SVZ)
Table 4: Inventory of SVZ process (Tukker, et al. 1999)
Inputs Outputs
MPW-agglomerate 763 g Methanol 712 g
Waste oil 256 g Syngas 204 g
Lignite 1.25 kg Electricity 2,28 MJ
Water 7.9 l CO2 6,32 kg
Oxygen 1,47 kg Water vapour 9,9 kg
Fuel oil 40 g Effluent 9,9 kg
Natural gas 0,1 m2 Gypsum 0,1 kg
Slag 0,9 g
Table 5: Products of the SVZ gasification process and the equivalent avoided products (marginal)
SVZ gasification process products Equivalent products Basis for Substitution
Methanol Methanol 1:1
Syngas Natural gas 1:1
Electricity Electricity 1:1
As there is no relevant product to describe “Waste oil”, an LCA result from a Germany
organization (Umweltvundesamt) cited by the report—“Critical Review of Existing Studies and
Life Cycle Analysis on the Regeneration and Incineration of waste oil” from DG Environment,
European Commission has been used here to estimate the GWP of waste oil as an input. The
model of LCA conducted by Umweltvundesamt for calculating the environmental performance of
refinery recycling of waste oil in SVZ is as follows:
Environmental performance = process impacts – saved impacts of primary input
“Process impacts” refers to the environmental impacts from consuming 1000kg waste oil (1431
kg CO2-eq); the “saved impacts of primary input” are the environmental benefit derived by
substituting the 75% natural gas, 10% heavy oil and 15% lignite which are avoided by using waste
oil (1366 kg CO2-eq). The result showed that the CO2-eq emission was 65kg for 1000kg waste oil.

- 77 -
(EUROPEAN COMMISSION 2001)
The result is closed to that of the crude oil process (50kg CO2-eq) in Ecoinvent—“Crude oil,
production NL, at long distance transport/RER U”, which includes both the extraction of crude oil
and transportation from exploration site to refinery in Europe. Therefore, in order to simplify the
calculation, this study decided to replace waste oil by using crude oil process from Ecoinvent in
the process—“SVZ gasification recycling” . As a matter of fact, another way has been also tried in
Sima Pro, that is, to directly add 65kg CO2-eq (per tonne of waste oil) emission in the
process—“SVZ gasification recycling” instead of citing crude oil process. The result of GWP
impact remains the same as that of the former one.
Hydrogenation (Veba Oel)
Table 6: Inventory of hydrogenation (Veba Oel) recycling (Dijkema and Stougie 1994) cited by Perugini, Mastellone
and Arena (2005)
Table 7: Products of Veba Oel hydrogenation process and the equivalent avoided products (marginal)
Veba Oel hydrogenation process products Equivalent products Basis for Substitution
Syncrude Crude oil 1:1
Gas fraction Natural gas 1:1

- 78 -
Electricity
Table 8: Data for the consequential future scenario—Denmark (Merciai, Schmidt and Dalgaard 2011)

- 79 -
Table 9: Data for the consequential future scenario—Europe (Merciai, Schmidt and Dalgaard, Inventory of country
specific electricity in LCA-Europe 2011)

- 80 -
AppendixⅡ Unit process used in Ecoinvent
Incineration
Process/product Source
Disposal, polyethylene, 0.4% water, to municipal incineration/CH U Ecoinvent 2.2, unit processes
Disposal, polypropylene, 15.9% water, to municipal incineration/CH U Ecoinvent 2.2, unit processes
Disposal, polyethylene terephtalate, 0.2% water, to municipal incineration/CH U Ecoinvent 2.2, unit processes
Disposal, polystyrene, 0.2% water, to municipal incineration/CH U Ecoinvent 2.2, unit processes
Mechanical recycling
Process/product Source
Polyethylene terephthalate, granulate, bottle grade, at plant/RER U Ecoinvent 2.2, unit processes
Polyethylene, HDPE, granulate, at plant/RER U Ecoinvent 2.2, unit processes
Polypropylene, granulate, at plant/RER U Ecoinvent 2.2, unit processes
Polystyrene, expandable, at plant/RER U Ecoinvent 2.2, unit processes
Electricity and heat in Denmark
Process/product Source
Pellets, mixed, burned in furnace 50kW/CH U Ecoinvent 2.2, unit processes
Electricity, oil, at power plant/DK U Ecoinvent 2.2, unit processes
Electricity, natural gas, at power plant/NORDEL U Ecoinvent 2.2, unit processes
Electricity, Biomass, DK Ecoinvent 2.2, unit processes
Electricity, at wind power plant/RER U Ecoinvent 2.2, unit processes
Electricity, hydropower, at power plant/DK U Ecoinvent 2.2, unit processes
Electricity, hard coal, at power plant/NORDEL U Ecoinvent 2.2, unit processes
Natural gas, burned in boiler modulating >100kW/RER U Ecoinvent 2.2, unit processes
Light fuel oil, burned in boiler 100kW, non-modulating/CH U Ecoinvent 2.2, unit processes

- 81 -
Electricity in Europe
Process/product Source
Pellets, mixed, burned in furnace 50kW/CH U Ecoinvent 2.2, unit processes
Electricity, natural gas, at power plant/UCTE U Ecoinvent 2.2, unit processes
Electricity, at wind power plant 800kW/RER U Ecoinvent 2.2, unit processes
Electricity, hydropower, at reservoir power plant, alpine region/RER U Ecoinvent 2.2, unit processes
Electricity, hydropower, at reservoir power plant, nonalpine regions/RER U Ecoinvent 2.2, unit processes
Electricity, production mix photovoltaic, at plant/DE U Ecoinvent 2.2, unit processes
Electricity, production mix photovoltaic, at plant/DE U Ecoinvent 2.2, unit processes
Electricity, production mix photovoltaic, at plant/DE U Ecoinvent 2.2, unit processes
Electricity, hard coal, at power plant/UCTE U Ecoinvent 2.2, unit processes
Transport
Process/product Source
Transport, municipal waste collection, lorry 21t/CH U copy Ecoinvent 2.2, unit processes
Transport lorry >32t, EURO3/RER U copy Ecoinvent 2.2, unit processes
Others
Process/product Source
Paraffin, at plant/RER U Ecoinvent 2.2, unit processes
Naphtha, at refinery/RER U Ecoinvent 2.2, unit processes
Refinery gas, at refinery/RER U Ecoinvent 2.2, unit processes
Naphtha, at refinery/RER U Ecoinvent 2.2, unit processes
Methanol, from synthetic gas, at plant/CH U Ecoinvent 2.2, unit processes
Natural gas, production DE, at long-distance pipeline/RER U Ecoinvent 2.2, unit processes
Lignite briquettes, at plant/DE U Ecoinvent 2.2, unit processes
Heavy fuel oil, at regional storage/RER U Ecoinvent 2.2, unit processes
Crude oil, production NL, at long distance transport/RER U Ecoinvent 2.2, unit processes
Steam, for chemical processes, at plant/RER U Ecoinvent 2.2, unit processes
Tap water, at user/RER U Ecoinvent 2.2, unit processes

- 82 -
AppendixⅢ Chemical recycling technologies
Table 10: List of initiatives for chemical recycling (Tukker, et al. 1999)
Technology name
Technology description Input Output
Pyrolysis
BP pyrolysis process
Cracking of plastic waste in a fluidized bed reactor of sand. The product (paraffinic wax) is cleaned from fine particles and HCl (amongst others) and fractionated. 80-90% of the plastic waste is recovered as liquid product. Ca. 20 ppm chlorine remains with an input containing 2% PVC.
Process conditions: T = ca. 500ºC
MPW: clean plastic waste, incl. 2wt% PVC (max. 4%), minimum amount of plastics 90 wt%;
Main product is paraffinic wax to be used as a feed for refineries or steam crackers.
BASF pyrolysis process
Liquid phase thermal cracking (pyrolysis/ depolymerisation).
The technology was developed to process DSD waste. Due to lack off waste no large scale plant was build and the pilot plant was shut down. 1994-1996
Process conditions: ca. 400 ºC
MPW: max. 8% PVC HCl, petrochemical gaseous and liquid feedstock
NRC process
(NKT Research
Centre A/S, Denmark)
Pyrolysis with subsequent metal extraction. The aim is to produce purified calcium chloride instead of HCl. Pilot plant project started in September 1998 and will finish in August 2000.
Process conditions: p= 2-3 bar, T= max. 375 ºC;
PVC waste (cables, flooring, profiles...): pre-treatment of mixed plastic waste: separation of PE, PP, wood etc., resulting in almost pure PVC waste;
Calcium chloride, coke, organic condensate (for use as fuels) and heavy metals for metal recycling.
Gasification
Texaco Gasification of pre-treated mixed plastic waste. The technology is based on heavy oil gasification and consists of two parts, a liquefaction step (pre-treatment) and an entrained bed gasifier.
A pilot is available in the USA. A project to erect a large scale plant (40-50 kt/year of MPW) in Rotterdam (Pax project) ceased around 1997. This was due to lack of feedstock with the right specification.
Process conditions:
T steam = 1200-1500 ºC, p= 20 - 60 bar, O2, steam;
MPW: max. 10% PVC, plastics content > 90 wt%;
Input quality: roughly cleaned and shredded plastic waste;
Synthesis gas (mainly CO and H2), slag, fines.

- 83 -
SVZ process The MPW is fed into a reactor, together with lignite (in the form of briquettes) and waste oil. This reactor is a solid bed gasification kiln. Oxygen and steam are used as gasification media, and are supplied in counter flow with the input materials. The output synthesis gas is used for various purposes. The main part, around 70 %, is used for the production of methanol. About 20 % is used for electricity production
Chlorine content: 2% as default, though higher concentrations are tolerable
heat, ash, tar oil (ash and tar oil is gasified in an entrained-flow gasification process to produce synthesis gas)
Hydrogenation
Veba combi cracking process
The plant configuration includes a depolymerisation (visbreaking) section and the VCC section. A plant has been realised in the KAB (Kohleölanlage Bottrop) site.
Process conditions: Depolymerisation: T=350-400ºC
Hydrogenation: 400-450 ºC, p= ca. 100 bar, CaO, H2;
MPW: max 4% PVC syncrude (liquid product), gas, HCl, hydrogenation residue.
Blast furnace Replacement of heavy oil or coal by mixed plastics waste as reduction agent in the pig iron production in a blast furnace.
MPW: chlorine content of up to 1, 5% (ca. 3% PVC) is permitted to be used. The chlorine content should be lower than 2% to avoid corrosion problems in the gas cleaning installations.
Cement kilns Cement kilns produce a clinker by sintering alkalic raw materials such as lime (CaCO3), clay (SiO2 and Al2O3) and gypsum (CaSO4) in a kiln at a very high temperature (1450°C in the solid fraction). Cement production demands major amounts of fuel; coal, oil or gas. The energy costs of cement kilns can be up to 25% of the turnover, and the financial benefits of using waste as a fuel are obvious.
The input material should be chipped or shredded. The PVC content is generally limited by licence obligations, 1-2% chlorine often being the maximum for individual waste streams
Related Documents