ANNEXURE I PLASTIC LEAKAGE PATHWAYS- DETAILED CITY WISE REPORT

Welcome message from author
This document is posted to help you gain knowledge. Please leave a comment to let me know what you think about it! Share it to your friends and learn new things together.
Transcript

Page | 1
ANNEXURE I
PLASTIC LEAKAGE PATHWAYS- DETAILED
CITY WISE REPORT

Page | 2
Table of Contents
1.1 Introduction .................................................................................................................... 3
1.2 Geography & Climate ...................................................................................................... 3
1.2.1 Physiography ................................................................................................................ 3
1.2.2 Climate .......................................................................................................................... 5
1.3 Demography & Land Use ................................................................................................ 5
1.4 Solid Waste Management in Haridwar ........................................................................... 7
1.5 Identification of Hotspots ............................................................................................ 17
1.6 Quantification of Total Plastic Waste Generation ........................................................ 20
1.6.1 Secondary Data Analysis ............................................................................................. 21
1.6.2 Primary Data Analysis ................................................................................................. 21
1.7 Leakages through barriers............................................................................................ 30

Page | 3
PLASTIC LEAKAGE SCENARIO IN HARIDWAR 1.1 Introduction Haridwar, is a city which falls in Uttarakhand state in India. It is located at latitude 29° 58' in the North and longitude 78°10' in the East. Haridwar is situated along Delhi-Niti Pass (DN Road) which starts from Delhi and passes through Meerut, Muzzafarnagar, Roorkee, Haridwar and goes till India-Tibet Boundary. It is the second largest city in the state and the district headquarter of the Haridwar district. Haridwar is regarded as a holy place for Hindus, hosting important religious events and serving as a gateway to several prominent places of worship. Most significant of the events is the Kumbha Mela, which is celebrated every 12 years in Haridwar. During the Haridwar Kumbh Mela, millions of pilgrims, devotees, and tourists congregate in Haridwar to perform ritualistic bathing on the banks of the river Ganges. However, during festive periods such as Kavad Mela, Somvati Amavasya Mela, Shivaratri, Ganga bath, Baisakhi (April – August), numbers increases (around 5 -6 million). Figure 1 shows the municipal boundary of the city.
Figure 1: Municipal Boundaries of Haridwar City
Source: Google Maps
1.2 Geography & Climate
1.2.1 Physiography The city is situated along the bank of Ganga River in the upstream at an altitude of 314 metres from the sea level, between Shivalik Hills in the North and Northeast and the Ganges River in the South. On the left side of the town is Chandi devi hill on which

Page | 4
a temple dedicated to Goddess Chandi is situated; on the right is Mansa Devi temple. Geologically, Shivaliks are separated by the Himalayas by a continuous reverse fault and fall in three main divisions, the upper Shivalik, middle Shivalik and the lower Shivalik. The Shivalik are mostly composed of sandstone and conglomerates. The river Ganga flows in a series of channels separated from each other called aits, most of which are well wooded. Other minor seasonal streams are Ranipur Rao, Pathri Rao, Rawii Rao, Harnaui Rao, Begam Nadi etc. The contour and drainage map of the city is shown in Figure 2. The contour and the major drainage pattern along with the river flow indicates that it emerges from the north, moves towards south west and then changes to east direction. The major part of the city is on the right bank (Eastern side) of the Ganga and has grown beyond the river on the western side as well. There are nineteen major storm water drains with a total length of about 17.9 km draining into Ganga. These include Pandewala, Kasa Nala, Shiv Mandir Nala, Latowali Nala, Jagjeetpur Nala, Avas Vikas Nala, Dev Pura Nala, Mayapur Nala, Lalita Rao Nala, Kusha Ghat Nala, Nago Ki haveli Nala, Nai Sota, Kangra Mandir Nala, Karanwal Nala, Karoli Nala, Bhimgoda Nala, Sapt Sarovar Nala and Lok Nath Nala. Practically the whole town, wherever roads or brick paved lanes/paths exist, have some kind of side drains leading to storm water drains, except in slums or some parts of peripheral areas. These drains are silted and carry a lot of waste into the river.
Figure 2: Contour and Drainage Map of Haridwar
Source: NPC team
Page | 5
1.2.2 Climate The city experiences three seasons, summer, rainy and the winter. The summer season starts from April till June, the rainy season from July to September while winter season starts from October and ends in February. The general characteristics of climate of this region are: Temperature: Hot during summers, cool to cold during winters and warm humid during Monsoon season. Annual maximum temperature is 30 to 42 degree Celsius. Annual minimum winter temperature ranges from 4 to 14 degree Celsius. Humidity: During rainy season humidity ranges from 70 percent to 85 percent while during summer season it ranges from 40 percent to 60 percent. During winter season it is about 25 percent approximately. Wind: The most probable wind direction is West, Northwest and Southwest. Summer is characterized by hot dust raising winds with velocities going up to 15 km/hour. Atmosphere is dusty In May/June. 1.3 Demography & Land Use As per Census 2011, Haridwar has a population of 229,000. The population of Haridwar has maintained an upward trend with a few kinks in some decades. In the recent decades, as is observed, the decadal rate of growth gradually dropped down from 45.71% in 1981 to 16.00 % in 2001, the later being far below the national average. The average household size is about 5.4 persons. The demographic and administrative profile of Haridwar is given below in Table 1.
Table 1: Demographic and Administrative Profile of Haridwar City Population 2011 2,29,000 floating population 6,93,000 slum population 86,880 Peak season floating population 50,00,000-60,00,000 Number of wards 60 Number of households 41335
There are 41335 households falling in 60 wards in Haridwar. Slum population in Haridwar is 86,848. Average household size for slum households, as found from the baseline survey, is 7.1. The slums on encroached land and on the hill slope are generally worse in comparison to other slums. Of the below poverty line (BPL) population, 15 percent households and 10 percent of the poor do not have any legal rights of the land. In the absence of ownership of land and clear policy to address their problems, the poor suffer from many inadequacies in terms of access to basic services like water supply and sanitation, and infrastructure. Land availability is a major constraint in the slums. On an average 20 percent of all the families in the slums stays with some other family. The city receives 0.6 million

Page | 6
floating population. At the height of festivals, it can receive 5 to 6 million of floating population putting a pressure on city services. The city has an area of 12.17 sq.km. Figure 3 shows the land use plan as per the approved master plan 2025. This would be utilized for urban activities, including housing, commerce, industries, tourism, community services, transport, parks, amusement and entertainment centers, parks and parking spaces. Besides being a tourist hub, Haridwar, in relative terms, is also industrialized area of Uttarakhand state. Haridwar is rapidly developing as an important Industrial township of Uttarakhand as the state government agency, SIDCUL has set up Integrated Industrial Estate, within the district attracting many important industrial houses setting up manufacturing facilities in the area. Haridwar already has a thriving Industrial area as BHEL and its ancillary units. The breakup of the land use is given in Table 2. It indicates that residential area constitutes the major part of the land followed by industrial area, area earmarked for fares and commercial and institutional area. Demographic pattern tally with land use pattern of the city with majority population residing in the eastern area. Land use pattern also indicates that residential area as well as the eastern part of the city is a major area of consumption as well as generator of bulk of solid waste within the municipal limits.
Figure 3: Demographic, Administrative and Land Use Map of Haridwar

Page | 7
Table 2: Land Use Haridwar City Sr. No Land Use Area (In Hectare) Area( in %)
1 2 3 4 1 Residential 1455.33 7.23 2 Aasharm 240.20 1.19 3 Business 157.20 0.78
-Commerce 151.32 0.75 -Main Business Centre 5.88 0.03
4 Office 117.8 0.59 5 Other Office 49.3 0.25
-CISF 13.45 0.07 -PAC 35.85 0.18
6 Industrial Area 1139.70 5.67 Industry 135.7 0.67 -BHEL Campus 1004.0 4.99
7 Tourism/Fare 734.56 3.65 8 Public Amenities 294.00 1.46
-Schools/Colleges 54.94 0.27 -Degree College or
Gurukul College 76.97 0.38
-Medical College 5.2 0.03 -Technical Institute 0.95 0.01 -Park 24.99 0.12 -Cultural Centre 2.56 0.01 -Hospitals 4.86 0.02 -Sport Ground 68.84 0.35 Electricity Centre 8.56 0.04 Telephone 2.48 0.01 Post Office 0.82 0.01 Police Station 1.68 0.01 Water body /Sewage
Farm 14.78 0.07
Temple/Mosque/ Church 8.31 0.04 Graveyard/ Cemetery 18.06 0.09
9 Transportation 626.40 3.11 Bus stand 0.72 0.01 Road 523.86 2.60 Railway Line 91.26 0.45 Railway Station 10.56 0.05
10 Garden (eucalyptus plantation)
578.50 2.88
(400) (1.99) 11 Agriculture 10553.32 52.46 12 Infertile 1100.21 5.47 13 Open area island and
Tree Plantation 916.86 4.56
14 River/Sewer/Canal 1864.72 9.27 15 Forest area 690.80 3.43 Total: 20119.00 100.00
Source: Master Plan Haridwar 2025 (1) 1.4 Solid Waste Management in Haridwar

Page | 8
Haridwar Nagar Nigam (HNN) is responsible for Solid Waste Management within the municipal boundaries as per Solid Waste Management Rules, 2016. They are responsible to collect, transport, process, treat and dispose the municipal solid waste in a scientific manner. Since HNN has not updated its Detailed Project Report (DPR) on Solid Waste Management since 2009, NPC has adopted the consultative approach along with field data collection for assessment of MSW management (including waste collection, handling, treatment and its disposal) in the city. NPC team visited various hotspots of waste generation/collection in the city and interacted with various stakeholders. These include Officials of Haridwar Nagar Nigam, representatives of facility for waste treatment, representatives of commercial establishments, and several interviews with ragpickers and with door to door collectors/drivers etc. The outcome of this approach is shown in Figure 4.
Figure- 4: Flow diagram of waste management in Haridwar City Salient features of solid waste management consisting of source, generation, composition, collection, transportation, treatment and disposal are given below. Source: Major sources of solid waste generation in the city are households in located in 60 wards, commercial (e.g. markets, hotels, ghats etc.), industrial areas and street sweeping in residential and commercial areas of the city. According to the information available with Haridwar Nagar Palika Parishad & District Urban Development Authority, Haridwar City has a total of 43 slums out of which some are authorized and others are unauthorised and smaller in size. The population of the slums is 86,888. The city has 3 fruits and 3 vegetable markets, 72 ghats and a big industrial area. There are few markets in the city having small showrooms of various brands of fashion which are managing its waste on their own and also through HNN. However there are shopping malls (small & big) for example “The Pentagon Mall”, which falls under the Industrial area SIIDCUL (State Infrastructure & Industrial Development Corporation Uttarakhand Ltd.), There are around 400 nos. of shops available within the mall premises out of which 70 nos. of shops are presently

Page | 9
functional which includes restaurants such as Mc Donald, Dominos, Burger King, Namaste Foods, Stage Bars, Captain; Outfit accessories such as lifestyle, Trends, Bata etc; Wave Cinema halls, Toys Shops, Wine shops. SIIDCUL, Haridwar has a total area of about 1758 acres out of which, the total allotable area is 1478.02 acres consisting of about 700 nos. of industrial units apart from the a major public sector undertaking M/s BHEL located adjacent to it. In SIIDCUL industrial area, major industrial units such as Hindustan Unilever Limited, VLCC, Lotus Beauty Care Products Pvt. Ltd, Raja Biscuits Pvt. ltd, PPI Blow Pack Pvt. Ltd, Cello Industries, Enn Tee International Pvt. Ltd etc are located. The type of products manufactured in this industrial area include cosmetics, ayurvedic, Herbal, pharmaceuticals, packaging materials, fabrics, PET bottles, single use plastics, plastic dana apart from the electrical & electronic components and mechanical parts, which are also processed/ manufactured in the industrial units. Quantity: Daily MSW collection data collected from the private operator for the month of February 2020 has been depicted in Table 3. This table indicates that the quantum of waste generated ranges from 205.7 tpd to 353.22 tpd. Therefore the average waste generation in the city is about 312 tpd, This waste may vary during festive and other occasion depending upon the floating population. Considering the slum population, the quantum of waste generated from them has been estimated to be about 30.41 tpd. Shopping malls like The Pentagon Mall generate about 3.5-5 tons mixed waste per day considering 50 kg waste generated by each of the existing shops. Hotels for example like Hotel Madhuban located at Ranipur mod, Haridwar informed that about 20-30 kg waste is generated per day, which is disposed in to nearby collection bin. During marriage season or any event like birthday party, business events etc. the waste quantum per day may increase up to 10 times i.e about 0.2-0.3 tons per day.
Table 3: Daily MSW Collected by Private Operator Total Tonnage month of February
Sr. No. Date Tonnage 1. 1/2/2020 726.745 2. 2/2/2020 313.36 3. 3/2/2020 318.22 4. 4/2/2020 245.705 5. 5/2/2020 205.705 6. 6/2/2020 320.795 7. 7/2/2020 323.795 8. 8/2/2020 344.71 9. 9/2/2020 303.74 10. 10/2/2020 323.425 11. 11/2/2020 321.34 12. 12/2/2020 298.215 13. 13/2/2020 324.64 14. 14/2/2020 342.525 15. 15/2/2020 326.43 16. 16/2/2020 294.61 17. 17/2/2020 309.885 18. 18/2/2020 340.42

Page | 10
Total Tonnage month of February Sr. No. Date Tonnage
19. 19/2/2020 327.945 20. 20/2/2020 306.865 21. 21/2/2020 293.555 22. 22/2/2020 353.275 23. 23/2/2020 309.295 24. 24/2/2020 306.87 25. 25/2/2020 313.165 26. 26/2/2020 318.43 27. 27/2/2020 317.245 28. 28/2/2020 310.245
Composition: Most of the waste generated from households comprises of food and other discarded waste such as paper, plastic, glass, metal, packaging material etc Waste collected from commercial and market areas consists of multiplayer plastic, packaging waste, vegetables and fruits piles, transparent polythene, cardboard, hard plastic. printed packagings, About 5% of plastic is observed in tricycle during door to door collection from households. the types of waste incoming at the HNN collection point near the hotel comprises of polythenes, multilayer packaging's, clothes, luggage bags, milk pouches etc. Poly bags, polyesters/synthetic bags, packaging waste etc. are the predominant types of plastic waste coming from the market areas. The mixed waste from the commercial area mostly comprises of food waste, polythene, paper cups, cans, aluminium silver foil, black polythene, thermocole, cardboards etc. Waste generated from The Pentagon Mall premises comprises of transparent polythene, black polythene, Nylon sacks, thermocole, cardboards in significant quantity while other types include synthetic ropes, multilayer packaging, pet bottles, hard plastic. The waste collected from ghats mainly comprises of waste cloths, silt, poly bags, packaging waste, flowers, fruits, vegetables etc The littered waste found near the BHEL plant, Haridwar comprises of polythene, multilayer packagings, synthetic clothes etc.The waste collected during the street sweeping mostly comprises of multilayer plastic packaging's, colored poly bags, synthetic bags, silt etc.. Waste accumulated in vacant lands/plots was found in the industrial estates which mainly comprises of packagings materials, woven bags, fabrics etc.
M/s KRL Waste Management Pvt. Ltd, Sarai is the private operator, which has been engaged by HNN for waste management in the city. It is responsible for waste collection, transportation, storage, treatment & disposal. M/s KRL extends its collection services in 52 wards of the city (86%) including door to door collection from commercialareas & households. The mixed waste generated from Household, Commercial, Market etc is transported using 250-300 tricycles and stored at fifty collection points/bins from where the waste is transported by trucks to the weighbridge located at M/s KRL’s Garage and then further transported to treatment plant/dumping ground near sarai, Haridwar. M/s Akansha Enterprises under Namami Gange project is responsible for maintaining cleanliness of Ghats at Haridwar. The agency covers cleaning activities in 72 nos. of ghats with 400 sanitation workers. All
Collection & Transportation:
Page | 11
the waste collected from ghats is finally transferred to trenching ground adjoining landfill site. Presently street sweeping is carried out manually by sanitation workers of HNN. The collected waste from street sweeping is transported by seven trucks to the trenching ground near waste treatment plant. In industrial areas for example the mixed waste collected from shopping mall is stored at the back side of the mall. Industries located within the industrial areas are managing their waste through their own vendors/ragpickers. The ragpicker collects recyclable waste from trenching ground.
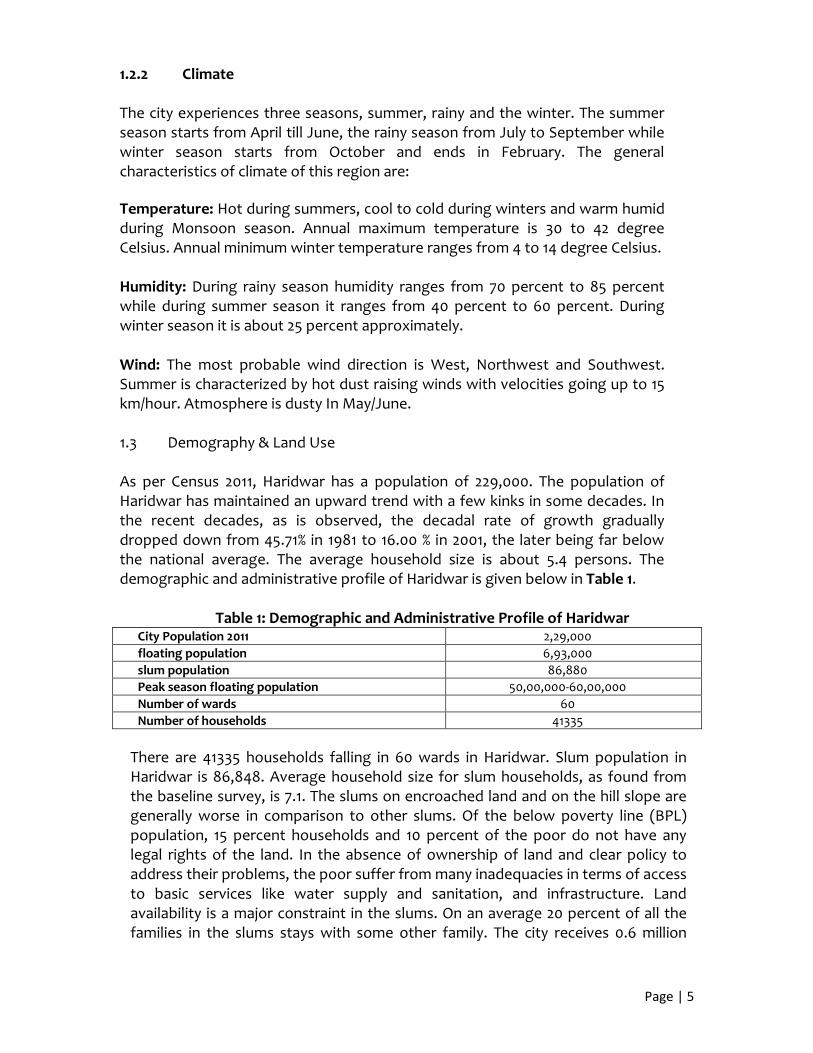
Table 4: Shows Door To door Collection
Plates affixed on the left side shows the type of tricycle used by the M/s KRL for door to door collection of waste from the household. The waste collectors is collecting waste through the indication of whistle jingle and the household comes out from homes to dispose the waste in the tricycle and the tricycle is transported manually to the collection point from where all the waste is transported via heavy vehicle to the KRL garage for weighing at weigh balance from where the same vehicle is transported to the KRL, Sarai waste treatment plant. It was informed by the waste collector that there are around 250-300 nos. of tricycle used for the collection of waste within the city. Plates affixed on the left side shows types of waste collected from household which comprises of multiplayer plastic packaging's, vegetables and fruits piles, transparent polythene, cardboard, hard plastic printed packaging's, remaining food from Household and others. About 5% of plastic is observed in tricycle during door to door collection from household. Some photographs of Door to Door Collection of waste from households of Vishnu garden, Haridwar affixed below
Page | 12
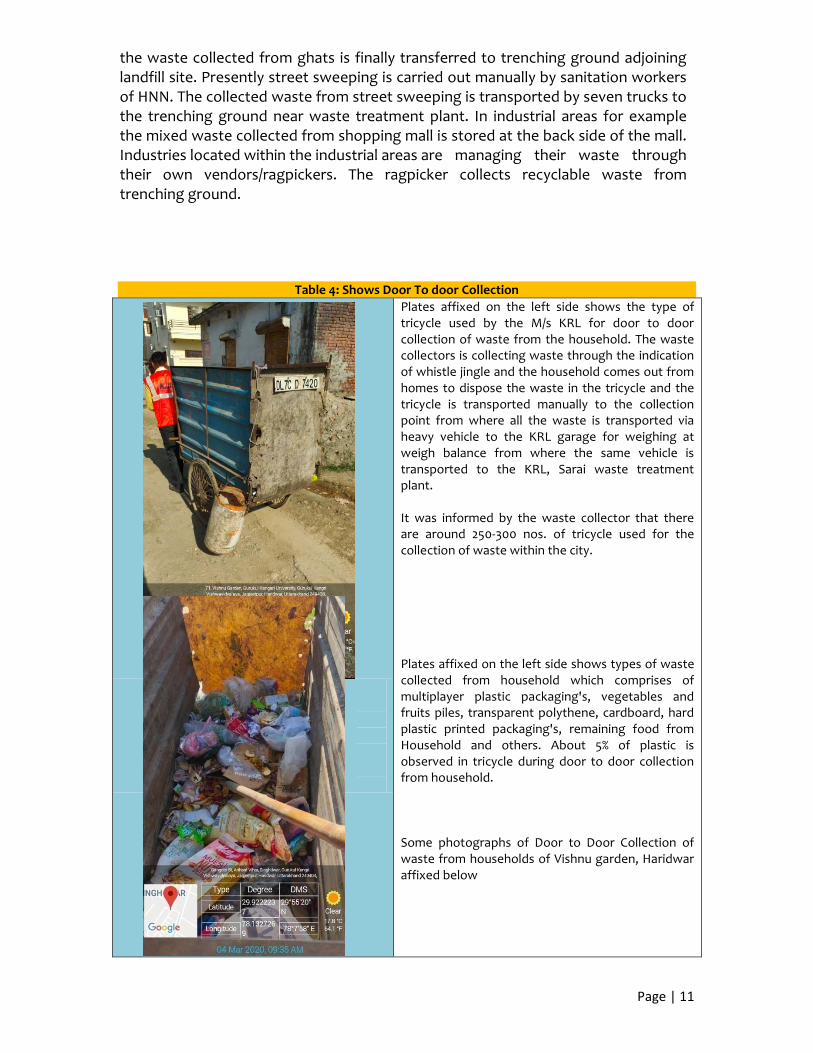
Collection Points: As discussed with Mr. Ajay it was stated as there are about 50 nos. of collection points exists within the city. Plates affixed on the left side shows the collection point located near Hotel Jahanvidale. it was informed by the waste collector that waste collected from around 500 nos. of households reaches at this collection points and about 3-4 collection bins located at collection point is transported bins collected from here The waste collected through tricycles is unloaded at these collection points. It was informed by the waste collector that around 500 nos. of households Plastic - 10-15%

Page | 13
Table 5: shows Commercial Waste Generation
Few plates affixed on the left side show the location of storage of waste generated from The Pentagon Mall premises which comprises of Transparent polythene, black polythene, Nylon sacks, thermocole, cardboards are in significant quantity and synthetic ropes, multilayer packaging, pet bottles, hard plastic. Storage area consists of silt plus ashes generated from tandoor kilns which is selling to the NGO for the preparation of compost.
It was found that ragpickers are collecting waste at the collection points near Hotel Jahanvidale. It was informed by the ragpickers that per day around 3-4 ragpickers are collecting waste from here. In addition to this, around 60-70 kg of waste filled in one tricycle. Plates affixed on the right side show the rickshaws used by the rag pickers for collection of waste from the collection points Plates affixed below shows the types of waste incoming at the collection point which comprises of polythenes, multilayer packaging's, clothes, luggage bags, milk pouches etc. Plastic - 10-15%
The collection point is located near the canal.

Page | 14
Table 6: shows Hotel Waste Generation
Plates affixed on the left side shows collection points where waste generated from the Hotel is stored in the same bins. Plastic percentage- about 5%

Page | 15
Table 7: Shows about Industrial waste
Plates affixed on the left side shows the quantity of llittering found near the BHEL plant, Haridwar which comprises of polythene, multilayer packagings, synthetic clothes etc. It was found that ragpickers are collecting waste from the same place. While taking a foots on the same land it was observed that this land consists of legacy waste. Also fauna like cow, pigs, dogs etc was found there in searching of food. Plastic percentage- about 5%
Plates affixed on the left side shows the conditions of drains found in the SIIDCUL (Industrial Area), Haridwar. The drains was filled with polythene and other trashes. Also the red colour water was observed in the drain.

Page | 16
As SIIDCUL does not comes under the Haridwar municipal boundary. Also it was found that industrial units exists within the SIIDCUL, Haridwar are managing their waste through their own vendors/ragpickers. In addition to this, it was found that ragpickers are collecting waste from the industrial units. Plates affixed on the right side shows the types of waste collected by the ragpickers which comprises of cardboards, plastic etc. Also it was informed by the ragpickers they collect e-waste also from the industrial units.
Table 8: shows about street sweeping
Street sweeping was carrying out by the Nagar Nigam and was found at the approach road to Vishnu garden, Haridwar and it was informed by the truck driver that around 7 nos. of trucks are doing street sweeping each day in the Haridwar city. These trucks transported and unloaded at the Sarai plant. The street sweeping comprises of multilayer plastic packaging's, colored polythenes, synthetic bags, silt etc. Plastic percentage- about 5%
Treatment & Disposal: HNN has a treatment capacity of 150 tons of waste per day. Therefore only 150 tons of waste is being treating per day in Haridwar city and the remaining 162 tpdwaste is disposed in the trenching ground without any treatment. Informal sector collects recyclable waste from this dumping ground regularly. The RDF treatment plant operated by M/s KRL, the private operator consists of trommel screens of 45mm, 25mm and 4mm mesh sizes. RDF segregated form treatment plant is sent to cement plants. Inert /Non recyclable waste is finally disposed in the waste collected from Pentagon mall is further segregated by them. The segregated dry waste is sold to the M/s ITC Shivalik Nagar for further processing and food waste is given to local NGO for animal feeding and making compost SLF (Sanitary landfill). Since industrial units are located in industrial are which falls outside the municipal boundary, they

Page | 17
Commingled waste collected by M/s KRL
from 52 wards in Household, Commerci
al, Market etc.
Commingled waste collected by M/s
Akansha from 72 nos. of Ghats
Commingled waste collected by street
sweepings from Haridwar nagar
Nigam
manage their waste through their own vendors. Table 5: Waste Generated per day during February-2020 1.5 Identification of Hotspots
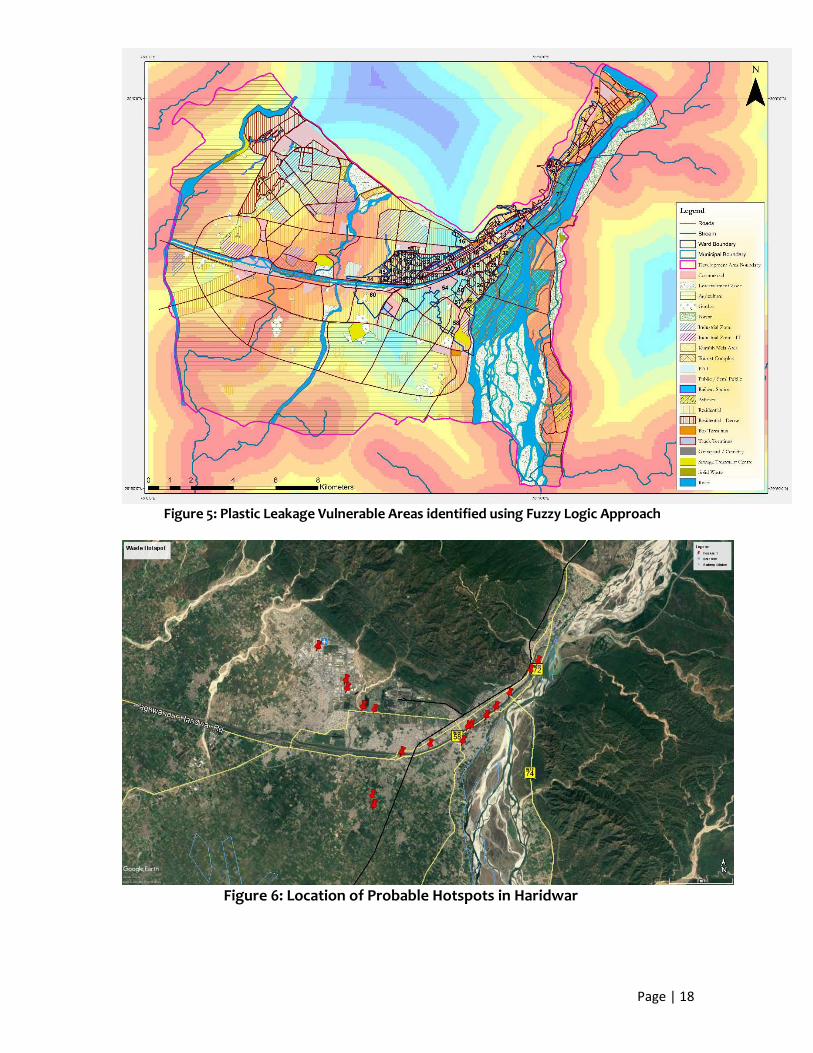
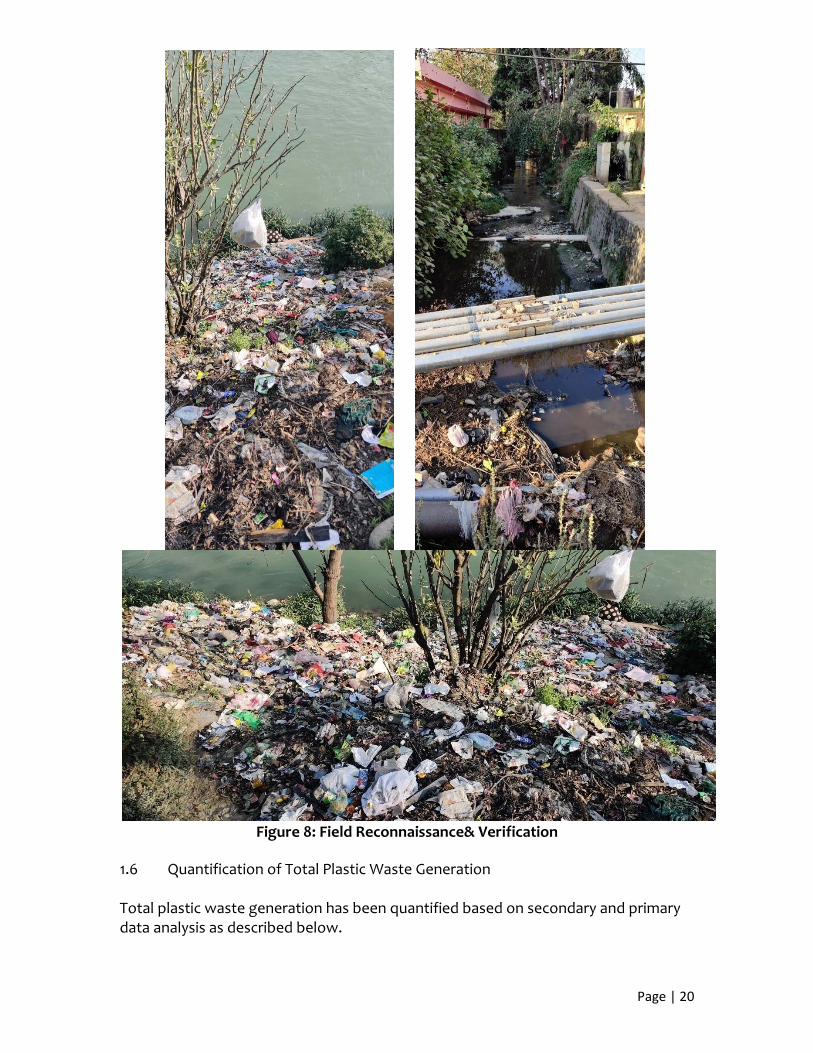
A step wise approach has been adopted to identify the hotspots, which serve as source of plastic leakage into the river. This is based on IUCN’s approach for defining the plastic leakage as a function of loss rate and leakage rate. The various steps include identification of vulnerable areas using fuzzy logic approach adopted by GIC, AIT Thailand (Figure 5) and identification of leakage points (Figure 6 & Figure 7) followed by field reconnaissance & verification (Figure 8) and cleanup activities. During the field survey at Haridwar, littering of solid waste comprising majority of plastic waste was observed in abundance. This was followed by discussion with HNN, M/s Akansha Enterprises, M/s KRL Waste Management Pvt. Ltd. which suggested hotspots, which were in line with predicted vulnerable areas. These include: Pul Jatwada, Shamshaan Ghat- bhim Goda, Har ki Podi, Sati Ghat, Daksh mandir, Alaknanada Ghat, Ranipur Jhaaal, Subhash Ghat, Kangda Ghat, Ghant Ghar ghat, Damp Kothi, Pant deep Parking, Kashyap ghat, Rodi vel, Kankhal, Sukhi Nadi, Laltarapur, Ush Ghat and Kassaban. Some of the places where sacred waste/waste thrown by the people include: Rishikul, Hathiwal, Jatwada, Kankhal Irrigation line, jagjeetpur irrigation line and Ramdev ki puliya.
Page | 18
Figure 5: Plastic Leakage Vulnerable Areas identified using Fuzzy Logic Approach
Figure 6: Location of Probable Hotspots in Haridwar

Page | 19
Figure 7: Drains and Sources of Plastic Leakage
Clean up Area
Plastic Leakage Area
Page | 20
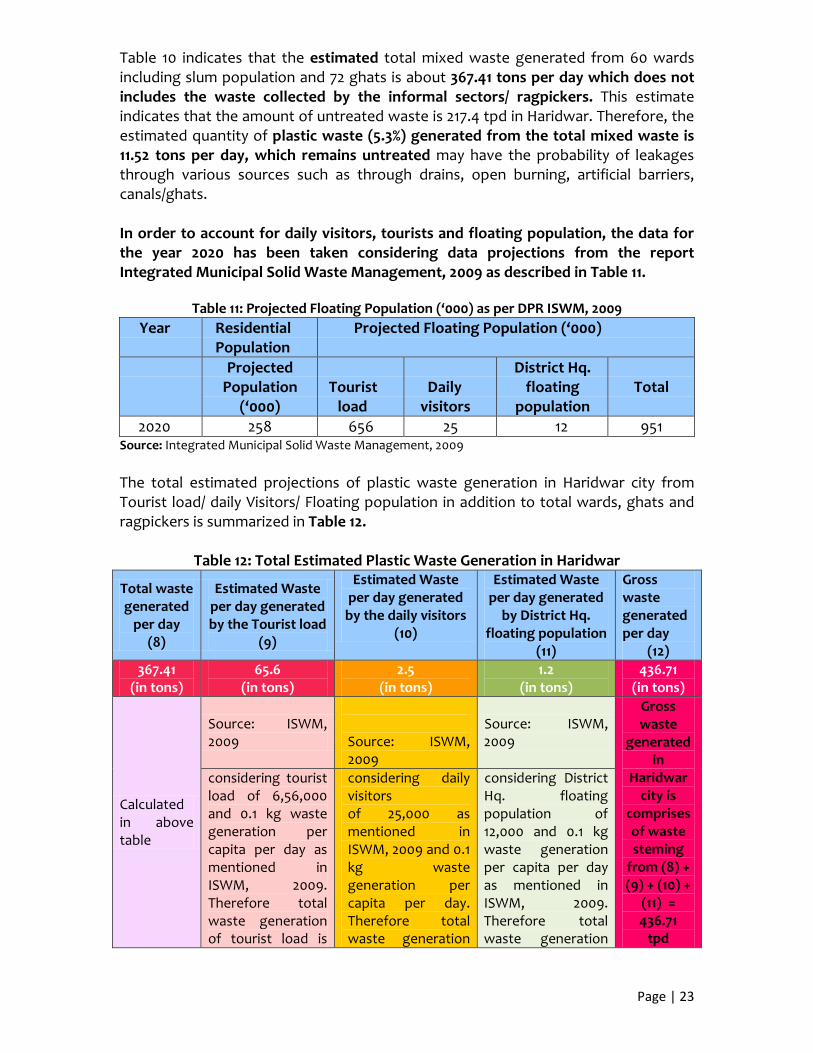
Figure 8: Field Reconnaissance& Verification
1.6 Quantification of Total Plastic Waste Generation Total plastic waste generation has been quantified based on secondary and primary data analysis as described below.

Page | 21
1.6.1 Secondary Data Analysis The data provided by HNN indicates that the average waste collected during door to door collection from 52 wards is about 312 tons per day. Further, HNN has a treatment capacity of 150 tons of waste per day while the remaining 162 tpd waste reaches the trenching ground without treatment. Segment wise breakup of solid waste management as described in Integrated Solid Waste Management Report 2009 is summarized below in Table 9.
Table 9: Solid Waste generation as per DPR, ISWM- 2009 Year 2010 Equivalent population considering floating population 482952 Per capita waste generation in residential areas in gms per day
220
Total waste from residential areas/day in MT/day 106 Commercial waste in MT/day 68 Street Sweepings 39 Total waste generation per day in MT 213 Per capita waste generation/day 442gm/day
(Source: INTEGRATED MUNICIPAL SOLID WASTE MANAGEMENT, 2009) Note: Figures mentioned in the above tables is used ahead in estimation of plastic waste generation. It can be inferred from the above table that commercial waste is 31% of mixed collected waste. Since HNN has a treatment capacity of 150 tons of waste per day, where about 46.5 tpd (31%) is contributed by commercial segment. 1.6.2 Primary Data Analysis The waste treatment agency has informed that around 8 tons out of 150 tons of mixed waste is the plastic waste (About 5.33%), which reaches the treatment plant. Therefore, 5.33% has been taken to estimate the quantity of plastic waste generation from the total waste generation in the city. This waste includes both the unaccounted as well as accounted waste. The unaccounted waste consists of waste from 8 remaining wards of HNN, ghats and floating/ tourist population and waste generated during festive seasons as well as from industrial areas. In addition to the 312 tpd waste collected from 52 wards, the waste collected from the 72 nos. of ghats is estimated to be around 12 tons per day, which also reaches to the trenching ground. Therefore around 174 tons tpd of mixed waste per day reaches the trenching ground where it is dumped without any treatment. The estimated projections of plastic waste generation from different stakeholders are described in Table 10.

Page | 22
Table 10: Estimated projections of plastic waste generation from different stakeholders
Estimated Waste per day collected by M/s KRL (excluding commercial establishments)
(1)
Estimated Waste per day generated by the commercial establishments
(2)
Estimated Waste per day generated by the remaining wards of Haridwar which are not cover by M/s KRL
(3)
Estimated Waste per day generated by the slums populations
(4)
Estimated Waste per day collected by the M/s Akansha Enterprises Pvt Ltd
(5)
Estimated Waste collected by the Ragpickers
(6)
Estimated Waste per day generated at dumping ground
(7)
Total waste generated per day
(8)
103.5 (in tons)
46.5 (in tons)
13 (in tons)
30.41 (in tons)
12 (in tons)
6 (in tons)
174 (in tons)
367.41 (in tons) Source: DPR ISWM,
2009
Source: M/s KRL
Source:ISWM, 2009
Source: M/s
Akansha
Source: local
ragpickers
Source: M/s KRL
Capacity of waste treatment plant- 150 MT per day. • Commercial waste is 31 % of mixed of waste i.e. 46.5 mtd of considering 150 mtd.
Out of total 60 nos. of wards, 8 nos. of wards (about 6500 population) are not covered by M/s KRL and considering a factor of 400gm/day/capita. The total waste generated from these wards is 13,000 kg/day
The total population of slums mentioned in ISWM, 2009 is 86,888 therefore considering a factor of 0.35kg/day/capita the total waste generation is 30,410 kg/day
It was informed that about 12 tons of waste per day is collected from the 72 nos. of ghats
It was informed
that there are around 150 nos.
of ragpickers exists and each
are collecting around 40 kg of
dry waste.
Considering an average of about 312 tpd of waste collected by the M/s KRL out of which 150 tpd is reaching the treatment plant. Therefore total waste reaching the trenching ground is (312-150= 162 tpd) + 12 (Waste collected by M/s Akansha )= 174 tpd.
Estimated total waste generated in Haridwar city is comprises of waste steming from (1) + (2) + (3) + (4) + (7) = 367.41 tpd
Considering 5.3% (8 plastic waste /150 mixed waste) of plastic waste, the untreated plastic waste generated from the total untreated mixed waste (367.41 - 150= 217.41 tons per day) is 11.52 tpd.
Note: Note: The average mixed waste generated per day in the city is 312 TPD. Above estimation does not cover waste generated from the Floating population/Campings during festive months /SIIDCUL industrial area, Haridwar.
Page | 23
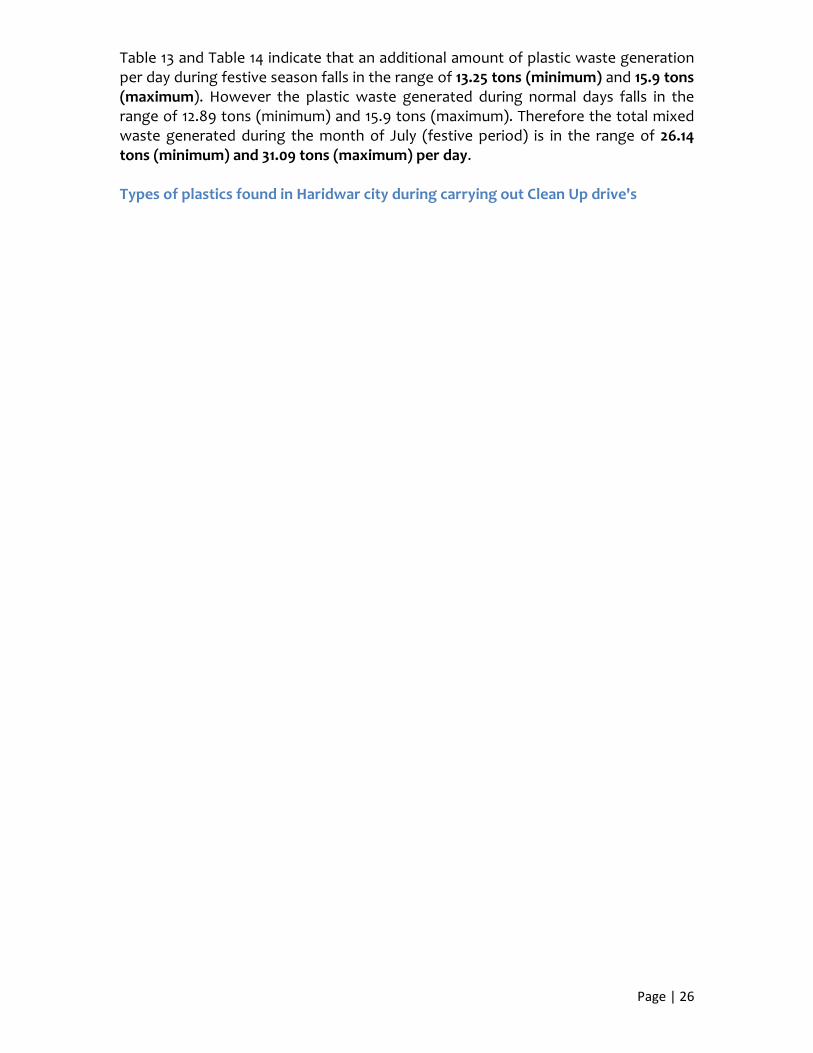
Table 10 indicates that the estimated total mixed waste generated from 60 wards including slum population and 72 ghats is about 367.41 tons per day which does not includes the waste collected by the informal sectors/ ragpickers. This estimate indicates that the amount of untreated waste is 217.4 tpd in Haridwar. Therefore, the estimated quantity of plastic waste (5.3%) generated from the total mixed waste is 11.52 tons per day, which remains untreated may have the probability of leakages through various sources such as through drains, open burning, artificial barriers, canals/ghats. In order to account for daily visitors, tourists and floating population, the data for the year 2020 has been taken considering data projections from the report Integrated Municipal Solid Waste Management, 2009 as described in Table 11.
Table 11: Projected Floating Population (‘000) as per DPR ISWM, 2009 Year Residential
Population Projected Floating Population (‘000)
Projected Population
(‘000)
Tourist
load
Daily
visitors
District Hq. floating
population
Total
2020 258 656 25 12 951 Source: Integrated Municipal Solid Waste Management, 2009 The total estimated projections of plastic waste generation in Haridwar city from Tourist load/ daily Visitors/ Floating population in addition to total wards, ghats and ragpickers is summarized in Table 12.
Table 12: Total Estimated Plastic Waste Generation in Haridwar
Total waste generated
per day (8)
Estimated Waste per day generated by the Tourist load
(9)
Estimated Waste per day generated
by the daily visitors (10)
Estimated Waste per day generated
by District Hq. floating population
(11)
Gross waste generated per day
(12) 367.41
(in tons) 65.6
(in tons) 2.5
(in tons) 1.2
(in tons) 436.71
(in tons)
Calculated in above table
Source: ISWM, 2009
Source: ISWM, 2009
Source: ISWM, 2009
Gross waste
generated in
Haridwar city is
comprises of waste steming
from (8) + (9) + (10) +
(11) = 436.71
tpd
considering tourist load of 6,56,000 and 0.1 kg waste generation per capita per day as mentioned in ISWM, 2009. Therefore total waste generation of tourist load is
considering daily visitors of 25,000 as mentioned in ISWM, 2009 and 0.1 kg waste generation per capita per day. Therefore total waste generation
considering District Hq. floating population of 12,000 and 0.1 kg waste generation per capita per day as mentioned in ISWM, 2009. Therefore total waste generation

Page | 24
Total waste generated
per day (8)
Estimated Waste per day generated by the Tourist load
(9)
Estimated Waste per day generated
by the daily visitors (10)
Estimated Waste per day generated
by District Hq. floating population
(11)
Gross waste generated per day
(12) 65.6 tons by daily visitors 2.5
tons by District Hq. floating population is 1.2 tons
As informed, about 8 tons of plastic waste extracting out of 150 tons of mixed waste reaching at waste treatment plant therefore considering 5.3% (8 plastic waste /150 mixed waste) of plastic waste untreated generated from the total mixed waste untreated (436.41 - 150= 286.71 tons per day) is 15.19 tpd. Considering 100 gm of waste generation per capita per day by the floating/camping population (mentioned in the DPR - ISWM, 2009), the total mixed waste generation has been estimated to be 436.71 out of which 150 tons of waste is treated per day. Therefore, the remaining 286.71 tpd is the untreated waste, which is disposed in the trenching ground. The total plastic waste is about 15.19 tpd considering plastic constitutes about 5.3% of the total waste. This waste has the probability of leakages through various sources such as drains, open burning, artificial barriers, canals/ghats etc. A scenario analysis of the probable plastic waste leakage in the city has been carried out considering normal days and festive days. The findings of these scenarios is described in Table 13 and Table 14.
Table 13: Plastic leakage analysis during Normal days
Matrix for estimation of plastic waste (MTPD) generation in normal days in Haridwar city in the range of Minimum and Maximum
Particulars
Estimated waste generation considering 86% DTDC collection excluding slums waste generation (in tons per day)
Estimated waste generation considering 100% DTDC collection including slums waste generation (in tons per day)
excluding estimated quantity of waste collected by the local ragpickers
393.3 436.71
150 tons of waste per day treated at treatment plant with sanitary landfill
(-150) (-150)
Untreated quantity of waste 243.3 286.71
Considering 5.3% of plastic from the mixed waste as per the
12.89 15.19

Page | 25
information received by the waste treatment agency. Estimate Minimum and maximum range of plastic waste untreated/at trenching ground/leakages
Minimum Maximum
Table 14: Plastic leakage analysis during Festive Season of one month (July)
Matrix for estimation of plastic waste (MTPD) generation during festive season in the month of July in Haridwar city considering minimum and maximum range of 500-600 MT of additional waste generated during this period as mentioned in DPR, ISWM, 2009
Particulars
Estimated quantity of waste generation during festive season considering minimum range i.e 5000000 population mentioned in ISWM, 2009
Estimated quantity of waste generation during festive season considering minimum range i.e 600 MT mentioned in ISWM, 2009
considering a factor of 100gm/day /capita waste generation by floating population during camping as mentioned in ISWM, 2009 500 600 50% of waste is considered as biodegradable as mentioned in ISWM, 2009 250 300 remaining waste 250 300 Considering 5.3% of plastic from the mixed waste as per the information received by the waste treatment agency. 13.25 15.9 Estimate Minimum and maximum range of plastic waste untreated/at trenching ground/leakages
Minimum Maximum
The total mixed waste generated in the month of July is in the range of 893.3 tons (minimum) and (maximum) 1036.71 tons. However the waste treatment capacity is 150 tons per day in Haridwar city. The remaining waste is dumped untreated at trenching ground near which may have a probability of leakages through various sources such as drains, open burning, artificial barriers, sacred waste/waste thrown by people into the canal/ghats/irrigation channel/river.
Page | 26
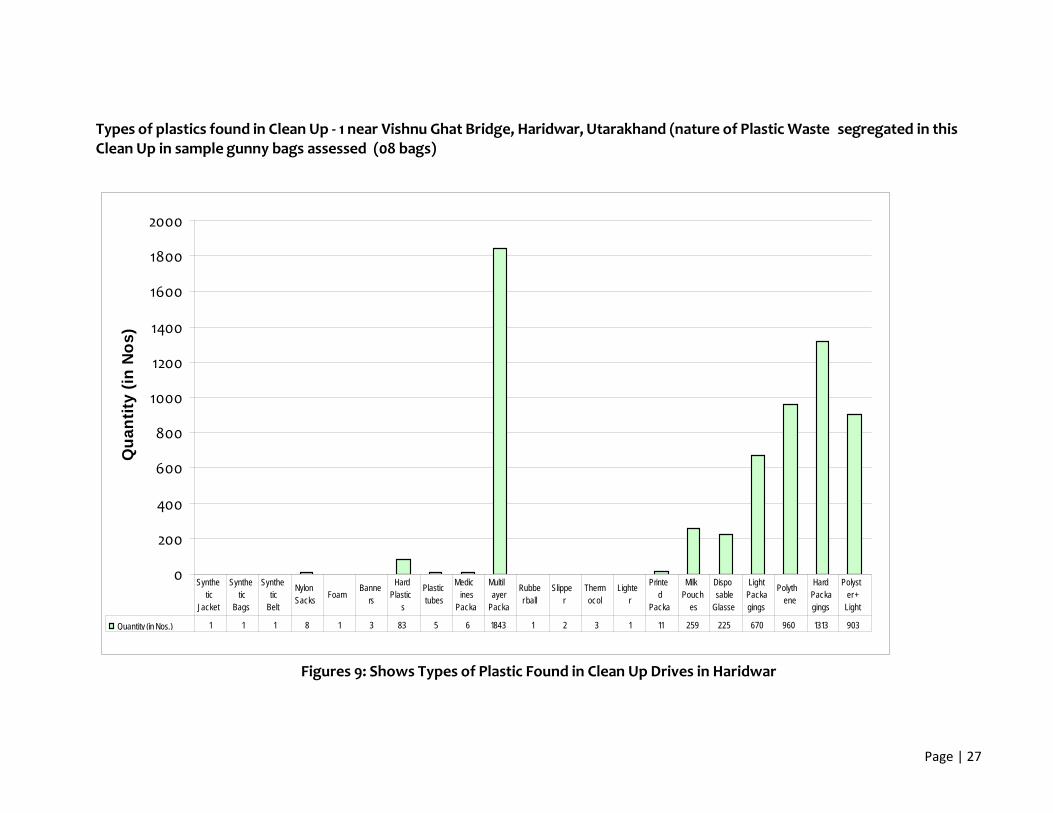
Table 13 and Table 14 indicate that an additional amount of plastic waste generation per day during festive season falls in the range of 13.25 tons (minimum) and 15.9 tons (maximum). However the plastic waste generated during normal days falls in the range of 12.89 tons (minimum) and 15.9 tons (maximum). Therefore the total mixed waste generated during the month of July (festive period) is in the range of 26.14 tons (minimum) and 31.09 tons (maximum) per day. Types of plastics found in Haridwar city during carrying out Clean Up drive's
Page | 27
0
200
400
600
800
1000
1200
1400
1600
1800
2000
Qua
ntity
(in
Nos)
Quantity (in Nos.) 1 1 1 8 1 3 83 5 6 1843 1 2 3 1 11 259 225 670 960 1313 903
Synthetic
Jacket
Synthetic
Bags
Synthetic
Belt
Nylon Sacks Foam
Banners
Hard Plastic
s
Plastic tubes
Medicines
Packa
Multilayer
Packa
Rubber ball
Slipper
Thermocol
Lighter
Printed
Packa
Milk Pouch
es
Disposable
Glasse
Light Packagings
Polythene
Hard Packagings
Polyster +
Light
Types of plastics found in Clean Up - 1 near Vishnu Ghat Bridge, Haridwar, Utarakhand (nature of Plastic Waste segregated in this Clean Up in sample gunny bags assessed (08 bags)
Figures 9: Shows Types of Plastic Found in Clean Up Drives in Haridwar
Page | 28
0
500
1000
1500
2000
2500
Qua
ntity
(in
Nos)
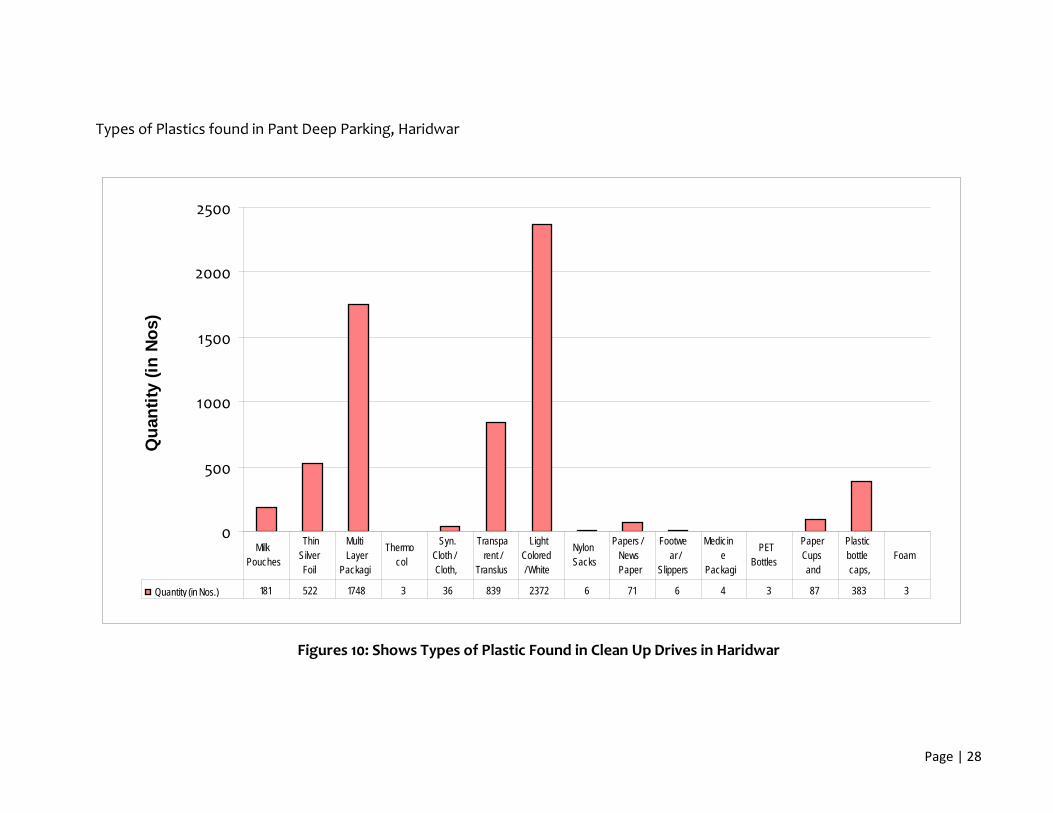
Quantity (in Nos.) 181 522 1748 3 36 839 2372 6 71 6 4 3 87 383 3
Milk Pouches
Thin Silver
Foil
Multi Layer
Packagi
Thermocol
Syn. Cloth / Cloth,
Transparent /
Translus
Light Colored / White
Nylon Sacks
Papers / News Paper
Footwear /
Slippers
Medicine
Packagi
PET Bottles
Paper Cups
and
Plastic bottle caps,
Foam
Types of Plastics found in Pant Deep Parking, Haridwar
Figures 10: Shows Types of Plastic Found in Clean Up Drives in Haridwar

Page | 29
64.57
1914
32.21
47.47
95.943
0
20
40
60
80
100
120
Total Plastic Waste Collected(Kg)
Total Trash Collected (Kg) No. of Categories of PlasticFound
Wei
ght
(in
Kg)
Pant Deep Parking, Haridwar (24th January, 2020) Vishnu Ghat, Haridwar (22nd January, 2020)
Snapshot of cleanup Drive carried out in Haridwar
Figure 11: Shows Quantity of Plastic Collected in Clean Up drives in Haridwar

Page | 30
1.7 Leakages through barriers
Figures 12: Shows Leakage Through Barriers
Huge waste was found stuck in the sluice valves at the barrage near Pul jatwada which is one of the source of plastic leakage in to the Ganga river. The waste comprises of thermocole, plastics, synthetic clothes, footwear etc.

Page | 31
Also found one dead animal floated in the flowing water near sluice valve of the barrage at Pul jatwada, Haridwar.
Figures 13: Shows Path Ways Barriers, Drains and Nala
through open dump:
Dead animal floated in the flowing water near the sluice valve of barrage at Pul Jatwada, Haridwar

Page | 32
through drains

Page | 33
through collection points/bins: those collections ponits are situated near the canal/channel have possibility of leakage of waste in the the same.
`Plastic Leakages in Haridwar City Within Municipal Boundary

Page | 34
Figure 14: Flow Diagram of Plastic Waste Generation and Leakages
Waste Generation Sources
Residential Com. / Mkt. Uncovered Wards Floating Population Slums Ghats Camping
Door to Door Collection
Collection Bins
Road Litter
Accumulated Waste
Drain
Vacant Land – Open Burning
Collection Points
Collection Points
Road Litter
Accumulated Waste
Drain
Special Arrangement Collection
Artificial Barriers
Ghats Sweeping
Scared Activities
Road Litter
Accumulated Waste
Drain
Scared Activities
Artificial Barriers
Ganga River / Ghats / Channel
Local Ragpickers Collects Dry Waste
Weigh Balance
Ragpickers
Compost RDF
Landfill
Waste Treatment Plant
150 TPD Treatment
Page | 35
TABLE OF CONTENT 1.1Introduction ...................................................................................................................................... 36 1.1.1. Agra .................................................................................................................................................. 36 1.1.2. Geographical and Climatic Condition ............................................................................................. 36
1.1.2.1. Climatic Condition ................................................................................................................... 38 1.1.2.2. Demography & Administrative Set Up ................................................................................... 38
1.2 LandUse ........................................................................................................................................... 39 1.3 Tourism in Agra ............................................................................................................................... 41 1.4 Total Sold Waste Generation .......................................................................................................... 41 1.4.1 Section A: Secondary Data Analysis ............................................................................................... 41 1.4.2 Section B: Primary Data Analysis .................................................................................................... 42 1.4.3 Sector-wise Waste Generations ..................................................................................................... 42
1.4.4 Household Waste .................................................................................................................... 43 1.4.5 Slums ........................................................................................................................................ 44 1.4.6 Market Waste .......................................................................................................................... 47 1.4.7 Commercial Waste .................................................................................................................. 47 1.4.8 Industrial Waste ...................................................................................................................... 48 1.4.9 Street Sweeping ...................................................................................................................... 49
1.5 Municipal Solid waste Management in Agra ................................................................................... 52 1.5.1 Primary Collection of Waste ........................................................................................................... 52 1.5.2 Secondary Collection of Waste ...................................................................................................... 54 1.5.3 Secondary Storage .......................................................................................................................... 54 1.5.4 Transportation of Waste ................................................................................................................ 55 1.5.5 Disposal of Waste .................................................................................................................... 57 1.6 Identification of Hotspots.............................................................................................................. 60 1.7 Quantification of Total Plastic Waste Generation........................................................................... 65 1.7.1 Section A - Secondary Data Analysis ...................................................................................... 65 1.7.2 Section B – Primary Data Analysis .......................................................................................... 66 1.8 Prominent Plastic Categories Observed During Cleanup Drives in Agra ...................................... 143 1.9 Plastic leakage Scenario in Agra city from sources ...................................................................... 145 1.10 Plastic Leakage into the Environment ......................................................................................... 148 1.10.1 Road Littering ........................................................................................................................ 148 1.10.2 Secondary Storage Littering .................................................................................................. 151 1.10.3 Open Drains ............................................................................................................................ 153 1.10.4 Burning of Plastic Waste ........................................................................................................154 1.10.5 Littering & Mismanagement of Waste in Slums .................................................................. 156 1.10.6 Open Drain Barriers ............................................................................................................... 158 1.11 Plastic Leaking in the Riverine system .......................................................................................... 161

Page | 36
PLASTIC LEAKAGE SCENARIO IN AGRA 1.1 Introduction 1.1.1 Agra Agra city is of historic importance, which is amply evident from the numerous historical monuments in and around the city. Being centrally located on the national map, Agra forms an important regional urban centre and a prominent tourist destination of India. The Hindu epic Mahabharat are fersitto as “Agraban”, part of Brajbhoomi, and the home land of Lord Krishna. The heritage of the city is linked with the Mughal dynasty but numerous other rulers also contributed to the rich past of this city. Agra was founded by Sikandar Lodhi in the 16th century. It grew into an important power centre and the Delhi sultan shifted his capital from Delhi to Agra 1504. Agra houses one of the ’7 wonders of the World’ i.e. TajMahal. Agra becomes all the more important due to its presence within municipal limits. 1.1.2 Geographical and Climatic Condition Agra is geographically located at 27°12' North latitudes and 78°12' East longitudes. The city of Agra is situated on the Western Bank of river Yamuna at about 200 Kms from Delhi in the state of Uttar Pradesh. Being centrally located on the national map, Agra (akaAkbarabād) forms an important regional urban center and a prominent tourist destination in India. It is a Class I town, municipality and administrative head quarters of Agra District and falls under Agra division of Uttar Pradesh. Its borders touch Rajasthan to its west and south, the district of Firozabad to its East and the districts of Mathura and Etah to its North. The city also falls in the center of the four –culture areas-Braj, Bundelkhand, Rajputana and western U.P. Both these factors have played significant roles in shaping the life and history of the city (Figure A1.1)

Page | 37
Figure A1.1: Location of Agra in Uttar Pradesh
Agra has an extremely strategic location on the confluence of three distinct geo-physical regions namely the plain of Uttar Pradesh, the plateau of Madhya Pradesh and the desert of Rajasthan. It falls in Great Indo-Gangetic Plain region and its strata consist of mainly sandy soil. The ground water level varies generally 6 to 8m below ground level. The altitude varies from RL 150 m to 170m above mean sea level. The city stretches for about 9.0 kms along the Yamuna River. The contour and the major drainage pattern along with the river flow indicate west to east direction as shown in Figure A1.2.The major part of the city is on the Western side of Yamuna and has grown beyond the river on the eastern side and is called the Trans Yamuna area while the original part is called as CIS Yamuna.

Page | 38
Figure A1.2: Drainage and Contour Pattern of the Agra City
Climatic Condition
The climate of Agra is extreme and tropical in nature. The temperature drops to 3°C in winter and rises to 47°C in summer. The city experiences three seasons, the summer, rainy and winter seasons. The summer season starts from April and ends in June, the rainy season starts from June and ends in September with an annual rainfall of 686mm while winter starts in November and last still February. Thick fog is experienced in December and January months of the year.
Demography & Administrative Set Up
Table A1.1 represents the city profile as per mentioned in DPR for Municipal Solid Waste Management scheme for Agra Nagar Nigam (ANN)(1).
Table A1.1: City Profile S. No Particulars Quantities 1. Total Area 126.15sq.km 2. Population 1773408 3. Floating Population 391037 4. Population Density 12580 person/sqkm 5. No. of household 264053

Page | 39
S. No Particulars Quantities 6. Number of Ward 100 7. Number of Zones 4
*Source-DPR Agra Nagar Nigam & Solid Waste Management Monitorable Action Plan, Agra NagarNigam, 2017(2)
Demographic and administrative profile of the city is shown in Figure A1.3. It indicates that Hariparwat, Lohamandi, Cantonment and Tajganj zones on the western side of the river are densely populated while Chatta zone is an upcoming area. It also indicates that western part of the city is major centre of consumption as well as generator of municipal solid waste.
Figure A 1.3: Demographic and Administrative Profile of Agra City
1.2 LandUse The first Master Plan of Agra was prepared for the plan period 1971-2001. In this Master Plan the land use was prepared for an area of 8360 Ha. The second Master Plan for a plan period of 2001-2021 stands approved and the land use break up is provided for an area of20036.97 Ha. This would be utilized for urban activities, including housing, commerce, industries, tourism, community services, transport, parks, amusement and entertainment

Page | 40
centres, parks and parking spaces. The breakup of land use in Agra City is described in Table A1.2and shown in Figure A1.3. About 50 per cent of area is for residential use and about 2percent for commercial use. Demographic pattern tally with land use pattern of the city with majority population residing in the western area. Land use patter also indicates that residential area generates bulk of solid waste within the municipal limits.
Table A1.2: Existing Land Use of Agra Development Area 2001 S. No. Landuse Area in Hectare Percentage
1 Residential 4866.34 61.84 2 Commercial 148.74 1.88 3 Wholesale Commercial 58.88 0.75 4 Community Facilities 842.62 10.66 5 Govt. and Commercial Office Space 177.93 2.25 6 Industrial 542.72 6.87 7 Open Space & Reservation 105.22 2.25 8 Historical Monuments 116.48 1.47 9 Traffic and Transportation 858.65 10.87 10 Crenulations/Burial Grounds 31.25 0.40 11 Nursery 24.09 0.30 12 Gardens 69.12 0.87 13 Sewage Farms 38.35 0.49 Total 7901.39 100.00
Source-AgraMasterPlan-2021 (3)

Page | 41
Figure A1.4: Land Use of Agra City
1.3 Tourism in Agra
Agra is one of the key tourist destinations attracting tourists from all over the world. The city forms one edge of the prime tourist circuit in India- the so-called Golden Triangle, the other two cities being Delhi and Jaipur. The city is rich in its art, heritage and culture, which are also reflected in its historical monuments. This makes the city as one of the most attractive tourist places of the country. The Agra city currently has three world heritage sites: the Taj Mahal, Agra Fort and Fatehpur Sikri. This entire area is called Taj Trapezium Zone (TTZ), 10,400 sq.km area around the monument where industrial and business activities are limited.
1.4 Total Sold Waste Generation The growing population along with rising tourist inflow leads to higher consumption and waste generation in the city. Therefore, an attempt has been made to describe the solid waste generation and management in the city through secondary and primary data collection and field survey. 1.4.1 Section A: Secondary Data Analysis The total solid waste generated in the city as per ANN is 824 metric tonnes per day (4),translating to 550 grams per capita per day which is higher than the standard/norms prescribed in the Manual on Municipal Solid Waste Management; Ministry of Urban Development & Poverty Alleviation, Government of India (5). Another report, Solid Waste Management Monitorable Action Plan, Municipal Action plan of Agra 2017 states that 712 metric tonnes per day of solid waste is generated in Agra (6). As per DPR for SWM Scheme for Agra, 2017(2), the per capita waste generated in different zone of Agra Nagar Nigam ranges from 368.5 to 452.28 gms excluding drain silt. The solid waste generation and projections from 2020 to 2045 has been presented in Table A1.3 (4). It is expected to increase from 1348 tonne per day to 1556 tonne per day with an average annual growth rate of about 1%.
Table A1.3: Solid Waste Generation Corresponding to Projected Populations Year 2020 2025 2030 2035 2040 2045
Projected Population (In millions)
1.460 1.541 3.182 3.259 3.378 3.460
Growth Rate (in percentage)
3.13 2.42 3.65 2.42 3.65 2.42
Solid Waste Generation (metric tonne)
1348.68 1381.34 1431.82 1466.50 1520.09 1556.90

Page | 42
1.4.2 Section B: Primary Data Analysis The primary data from Agra Nagar Nigam indicates that the total municipal solid waste generation in the city are about 850-870 metric tonnes per day. This is based on per capita generation of 400 gm with collection efficiency 91 %. Therefore, an average value of ~866 metric tonnes per day of municipal solid waste has been considered to know about the plastic leakage scenario in Agra. 1.4.3 Sector-wise Waste Generations In Agra municipal area, some of the specified locations with particular waste collections include residential areas, institutional/community areas, vegetable markets (retail wholesale), hotels and restaurants, commercial areas, hospitals and dispensaries, domestic/stray animals/dairies, industries, historical place and also street cleansing materials. There are four different sources of the waste generation consisting of household, market, commercial and industrial areas in the city as described in Table A1.4 and depicted in Figure A1.5
Table A1.4 Estimated projection of solid waste in different sources as DPR of Agra Nagar
Nigam 2017 (2) Particulars Quantity TPD Total Waste (%) Typical Waste Generators
Total Solid Waste 866 100 % -
Household Waste 597.54 69% High Income Group, Low Income Group / Slums
Market Waste 34.64 4% Vegetable Market, Meat & Fish Shop, Bakery & Sweet Shop, Juice Shop
Commercial Waste 216.5 25% Restaurant, Hotel, Office, School & Educational Institute
Industrial Waste 17.3 2% Factory, Workshop & Kabadi Shop *Source: DPR Agra Nagar Nigam & Solid Waste Management Monitorable Action Plan, Agra Nagar Nigam (2)

Page | 43
Figure A1.5: Percentage of Different Sources in Total Waste Generation in Agra City
1.4.4 Household Waste Household waste constitutes 69 % of the total waste generation in the city. The household waste is generated from a number of sources which include household (kitchen and yard) as well as items of daily consumption e.g. plastics. Generally, household waste constitutes Black Polythene, Single Use Plastic Carry Bags, Maggie Pouches and ingle Use Plastic carry bags etc. In household segment door to door collection coverage is about 91 %. A pictorial representation of door to door collection is shown in Figure A1.6. Figure A1.6 indicates that door to door collected waste from household includes clear white plastics, black plastics, disposable plates, beverages bottle, chips packet, single use plastics carry bags etc.
Figure A1.6 Depicts the Door to Door Collection of Household Waste.
Source-NPC team
2%
25%
4%
69%
Household Waste
Market Waste
Commercial Wast
Industrial Wast2
Page | 44
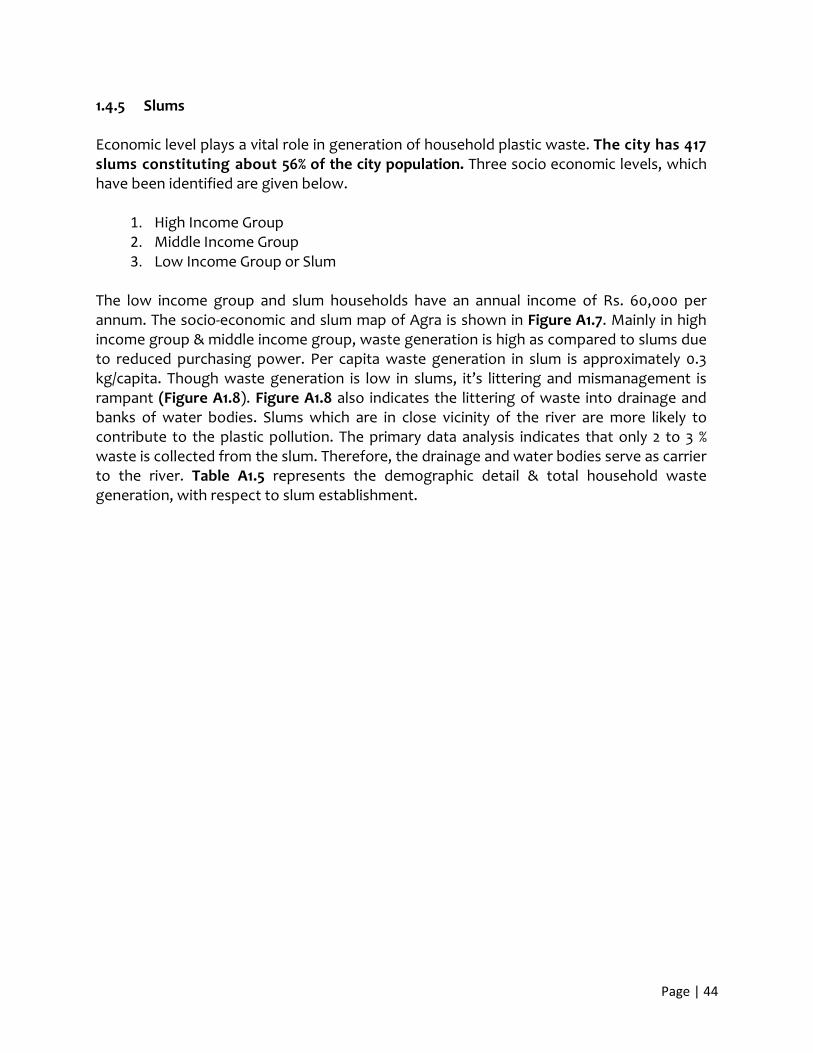
1.4.5 Slums
Economic level plays a vital role in generation of household plastic waste. The city has 417 slums constituting about 56% of the city population. Three socio economic levels, which have been identified are given below.
1. High Income Group 2. Middle Income Group 3. Low Income Group or Slum
The low income group and slum households have an annual income of Rs. 60,000 per annum. The socio-economic and slum map of Agra is shown in Figure A1.7. Mainly in high income group & middle income group, waste generation is high as compared to slums due to reduced purchasing power. Per capita waste generation in slum is approximately 0.3 kg/capita. Though waste generation is low in slums, it’s littering and mismanagement is rampant (Figure A1.8). Figure A1.8 also indicates the littering of waste into drainage and banks of water bodies. Slums which are in close vicinity of the river are more likely to contribute to the plastic pollution. The primary data analysis indicates that only 2 to 3 % waste is collected from the slum. Therefore, the drainage and water bodies serve as carrier to the river. Table A1.5 represents the demographic detail & total household waste generation, with respect to slum establishment.

Page | 45
Figure A1.7: Socio Economic and Slum Map of Agra
Table-A1.5Estimatedslum population asper primarydata
S. No Particulars Quantity Remarks
1. Slums 417slums About 56% of the city population lives in slums (2).
2. Number of
household with slum
123846
3. Slum Population 495384 Assuming 4-6 per person lives in a single household and total population is estimated as number of household (2).
4. Slums Waste generation
148 TPD *only 2 to 3% waste is
collected from the slum as per primary data
Total waste generation is estimated as total population* 300 gm waste generation per person (2).

Page | 46
Figure A1.8: Slum Condition in Agra
Source: Agra Nagar Nigam

Page | 47
1.4.6 Market Waste
Market waste constitutes 4% of the total waste generation in Agra city. Typically, waste generator constitutes, vegetable market, eatry shops, bakery & confectionary shops etc. Generally, market waste constitute disposable cups & plate, plastic straw, white plastic carry bags, chips & confectionery packet, milk pouches etc. Figure A1.9 represent waste collection from and vegetable market.
Figure A1.9: Waste Collection from Market Waste
Source:Agra Nagar Nigam
1.4.7 Commercial Waste
Commercial waste constitutes 25 % of the total waste generation in Agra city. Typical waste generator in commercial area consists of restaurant, hotel/lodge/guest house, dharmshala, marriage hall, marriage hall, office, school & educational institutes with hostel etc. Figure A1.10 and Figure A1.11represent waste generated from the commercial area. Post-consumer product has a high fraction in commercial Waste. Figure A1.11 represent post-consumer product such as detergent bottles, beverage bottles, cleansing product bottle etc.

Page | 48
Figure A1.10: Waste from commercial waste such as plastic wrapper, pen wrapper made
from clear plastic etc
Figure A1.11: Post consumer product such as used detergent bottles, beverage
bottles, cleansing product bottle Source: http://iwma.ie/commercial- waste/
1.4.8 Industrial Waste
Industrial Waste contributes 2% to the total waste generation and includes mainly, plastic waste, textile rejects, footwear rejects, foams, tobacco sachets etc and represent in Figure A1.12. There are various small scale and cottage industries in Agra city. Based on field observations made by the team about these industries, the plastic waste is primarily generated from Petha (local sweet) and Footwear unit. Petha units are mostly located at Noori Darwaza and Raja Mandi. Thin white plastic covers are used for covering Petha boxes that are littered in significant amount after single use and thrown in drain (nallah) and nearby secondary collection points. The synthetic leather and rubber trimming from footwear industry also accounted for the plastic pollution. Waste from Large leather and Rubber industry is not prominent but job works done by individuals for larger establishment at cottage level do not practice recycling rather throw waste in open areas or drains (nallahs). It was also observed that accumulated waste at open dump or dustbins was burnt in order to reduce the volume when it remains unattended for several days.
Figure A1.12: Littering of Industrial Waste such as Packaging Material, Cardboard etc

Page | 49
Source: NPC team
1.4.9 Street Sweeping
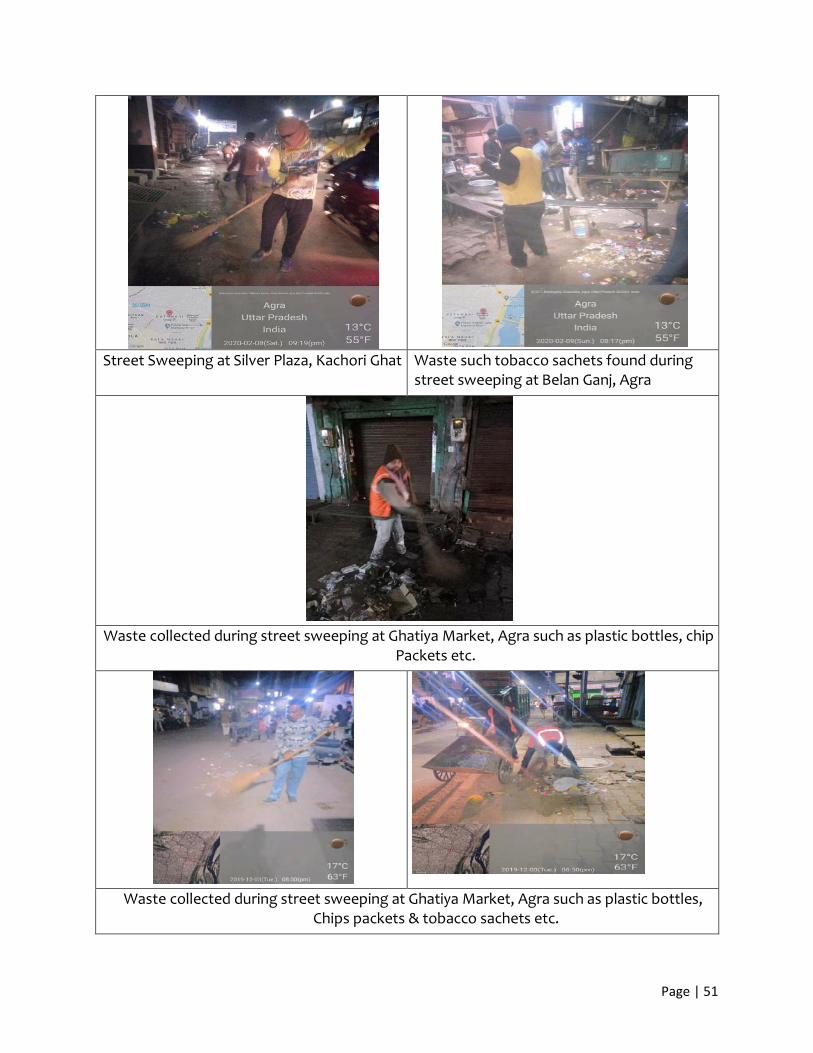
Street cleaning is one of the fundamental service rendered by municipal authorities in India which ensures clean and hygienic urban conditions. Around 84 MT/day of mixed waste is generated from street sweeping as per DPR, Agra Nagar Nigam. It also includes tobacco sachets, plastic bottles and chips packets. Until recently, all domestic and trade waste was being discharged on the streets or in street bins, and street sweeping was the principal method of waste collection. With the introduction of door to- door collection systems in many urban areas, there is a sizeable reduction in the quantity of waste littering on the streets. Further, a change in composition of street sweeping waste has also been observed. However, inefficient waste collection systems coupled with public littering significantly contribute to waste piles in streets. Figure A1.13 shows the street sweeping by manual and mechanized methods and collected waste.
Manual sweeping is commonly practiced in India, as many streets are congested and narrow road conditions are not conducive for mechanical sweeping. A wide variety of tools and equipment are available for manual and mechanical sweeping as are as following:-
• Long handled broom • Metal tray and metal plate • Containerized handcart or tricycle • Secondary storage bin • Dumper placer or compactor • Mechanical street sweeper • Container lifting device
As per ANN, there are about 1402 sweeping staff covering about 1967Km of road length out of which length of minor road is 1508.3 Km, length of major road is 253.56 Km whereas length of dual carriage and highway is 205.10 Km. Street sweepings including solid waste and silt from the drains is required to be collected by containerized handcarts and shall be transported separately through existing tractor and trolley mechanism. The coverage of street cleaning in Agra is mainly done with special focus on busy centres, markets, and tourist spots as under.
• Parks & open spaces • City Centres - commercial area & markets • Bus terminals 3 Nos • Roads around Railway stations
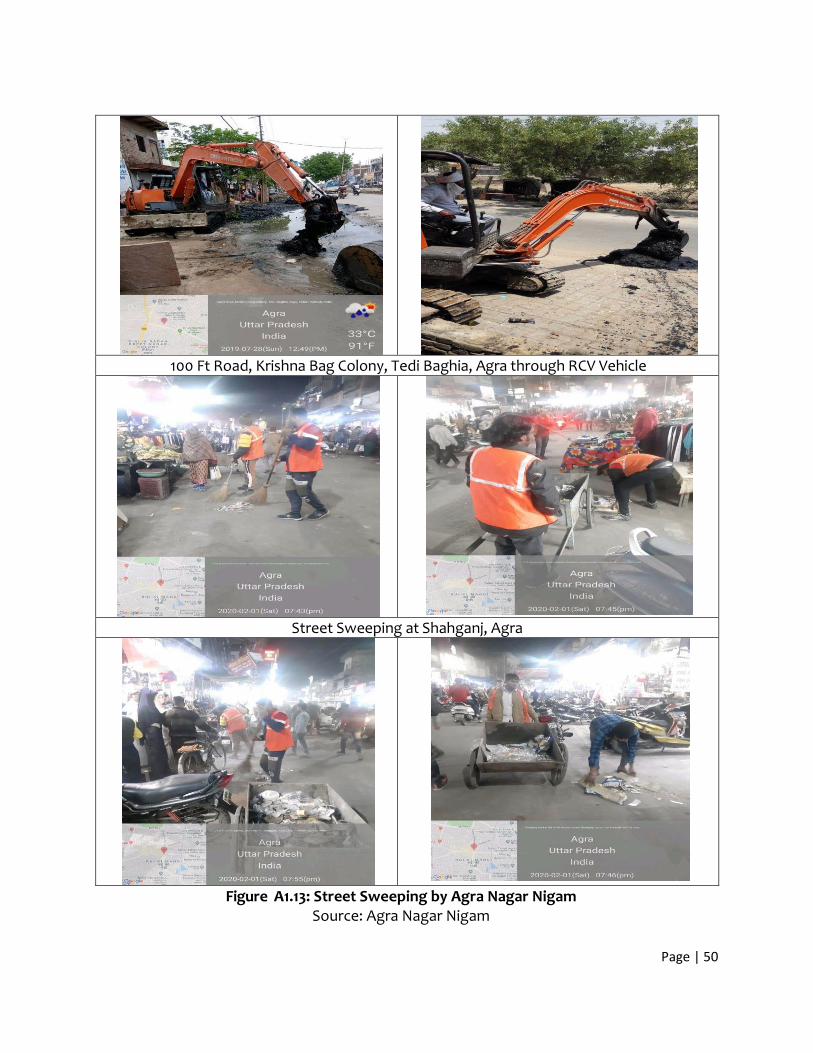
Page | 50
100 Ft Road, Krishna Bag Colony, Tedi Baghia, Agra through RCV Vehicle
Street Sweeping at Shahganj, Agra
Figure A1.13: Street Sweeping by Agra Nagar Nigam
Source: Agra Nagar Nigam
Page | 51
Street Sweeping at Silver Plaza, Kachori Ghat Waste such tobacco sachets found during
street sweeping at Belan Ganj, Agra
Waste collected during street sweeping at Ghatiya Market, Agra such as plastic bottles, chip Packets etc.
Waste collected during street sweeping at Ghatiya Market, Agra such as plastic bottles, Chips packets & tobacco sachets etc.
Page | 52
1.5 Municipal Solid waste Management in Agra
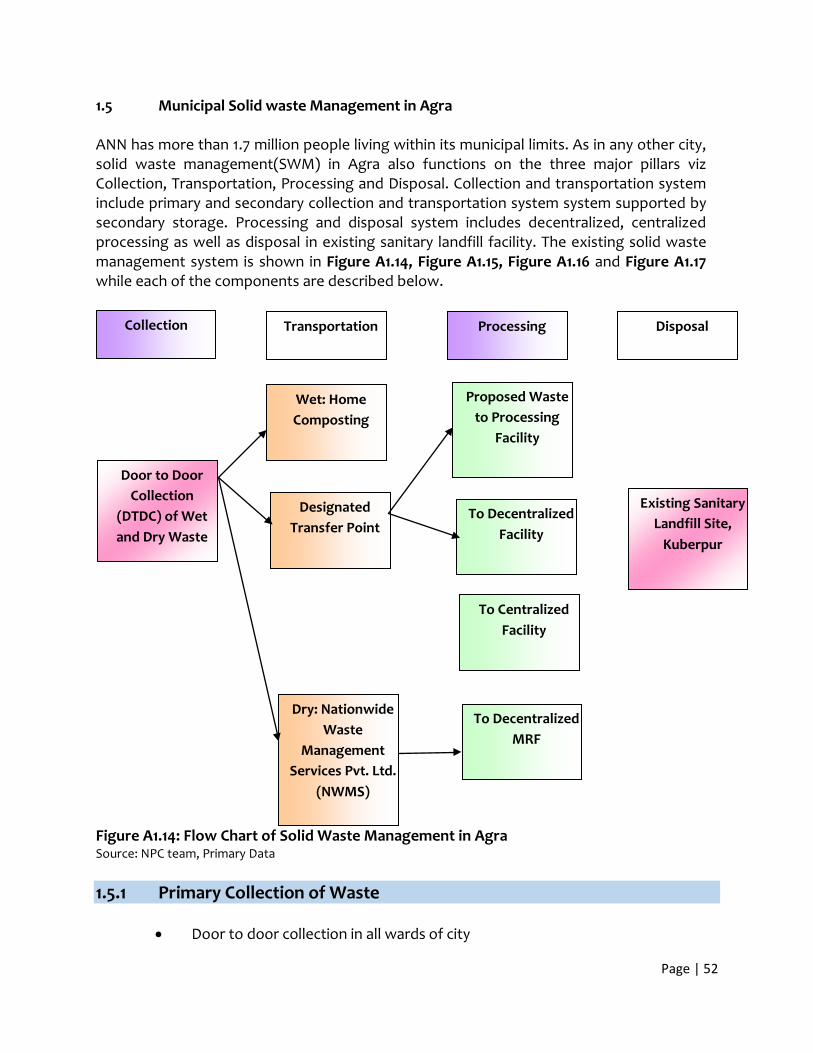
ANN has more than 1.7 million people living within its municipal limits. As in any other city, solid waste management(SWM) in Agra also functions on the three major pillars viz Collection, Transportation, Processing and Disposal. Collection and transportation system include primary and secondary collection and transportation system system supported by secondary storage. Processing and disposal system includes decentralized, centralized processing as well as disposal in existing sanitary landfill facility. The existing solid waste management system is shown in Figure A1.14, Figure A1.15, Figure A1.16 and Figure A1.17 while each of the components are described below.
Figure A1.14: Flow Chart of Solid Waste Management in Agra Source: NPC team, Primary Data 1.5.1 Primary Collection of Waste
• Door to door collection in all wards of city
Collection Transportation Processing Disposal
Proposed Waste to Processing
Facility
To Decentralized Facility
To Centralized Facility
Wet: Home Composting
Designated Transfer Point
Dry: Nationwide Waste
Management Services Pvt. Ltd.
(NWMS)
To Decentralized MRF
Door to Door Collection
(DTDC) of Wet and Dry Waste
Existing Sanitary Landfill Site,
Kuberpur

Page | 53
• Community participation on cost recovery basis • Minimize the multiple handling of waste • Improvement in the productivity of labor and equipment. • Primary Collection is done by mainly door to door collection and community
bin system • Primary Collection is done by DTDC agencies.
Photoplate A1.6: Door to door Collection waste
Figure A1.15: Door to door segregation
Source: Agra Nagar Nigam
Page | 54
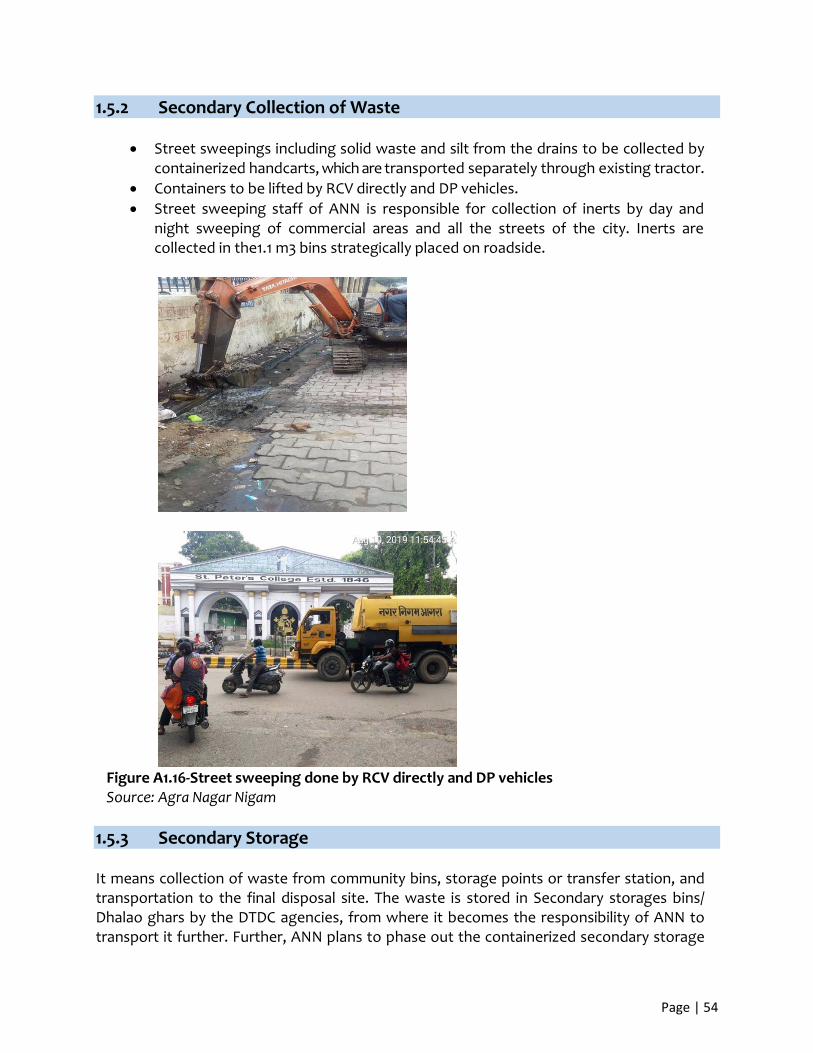
1.5.2 Secondary Collection of Waste
• Street sweepings including solid waste and silt from the drains to be collected by containerized handcarts, which are transported separately through existing tractor.
• Containers to be lifted by RCV directly and DP vehicles. • Street sweeping staff of ANN is responsible for collection of inerts by day and
night sweeping of commercial areas and all the streets of the city. Inerts are collected in the1.1 m3 bins strategically placed on roadside.
Figure A1.16-Street sweeping done by RCV directly and DP vehicles Source: Agra Nagar Nigam
1.5.3 Secondary Storage It means collection of waste from community bins, storage points or transfer station, and transportation to the final disposal site. The waste is stored in Secondary storages bins/ Dhalao ghars by the DTDC agencies, from where it becomes the responsibility of ANN to transport it further. Further, ANN plans to phase out the containerized secondary storage

Page | 55
facilities in time bound manner to make city bin free.
In Agra, there are 4 Transfer and collection stations as described below. a. ISBT Transfer Point–Spaak Global, Om Motors & Constructions, SRMT b. Four Point Hotel Transfer Point–Arva Associates c. Kalindi Plaza Transfer Point–Spaak Global d. Indian Oil Building, Near Ruikim and ifatak Transfer Point –SEWA
Figure A1.17: Community Bin System/Secondary Storage
1.5.4 Transportation of Waste Transportation of waste is carried out by ANN and Nationwide Waste Management Services Pvt. Ltd. (NWMS). Transportation includes daily transportation of segregated waste to the transfer station/treatment site. Separate transportation of domestic waste, commercial and institutional waste and sweeping silt is carried out through the fleet dedicated for particular waste stream. NWMS is only transportation of Dry waste up to their Material Recovery

Page | 56
Facility (MRF) at Rambagh- Tedhi bagiya, Agra after receiving the dry waste from DTDC agencies. Radio Frequency Identification (RFID) technology is being used more and more as a way to track containers and verify service. Transportation of waste is done by two ways –
1. Primary Transportation Small vehicles of up to 2 m3 capacity is used to transfer waste unloaded by Private/ Government Waste Collection Agencies (such as DTDC Agencies & Road Sweepers) at the Dhalao ghars/Bins to Secondary Transfer Stations from where the larger vehicles of ANN take it to Kuberpur Scientific Landfill Site(Figure A1.18).
Figure A1.18- Primary Transportation of Waste to Transfer Station
2. Secondary Transportation Vehicles of capacity higher than 2m3 is used for secondary transportation of waste. These shall be responsible for transfer of Wet and Inert Waste from respective Transfer points to the place of processing.
Page | 57
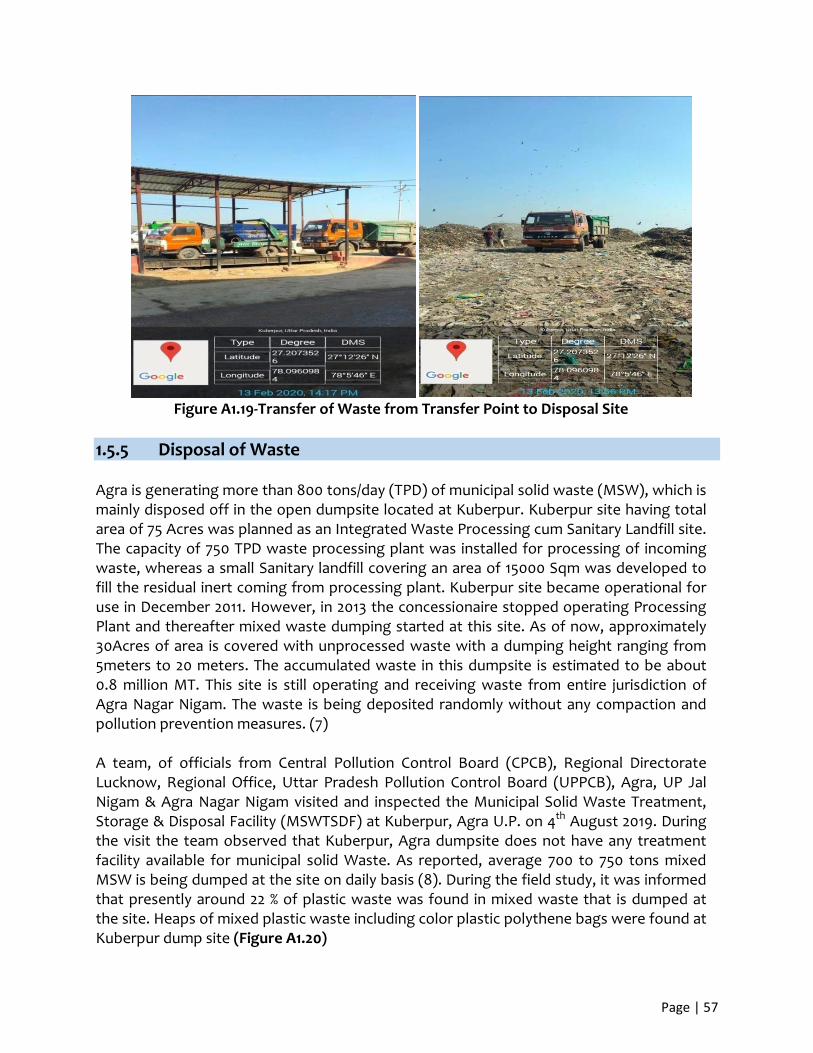
Figure A1.19-Transfer of Waste from Transfer Point to Disposal Site
1.5.5 Disposal of Waste Agra is generating more than 800 tons/day (TPD) of municipal solid waste (MSW), which is mainly disposed off in the open dumpsite located at Kuberpur. Kuberpur site having total area of 75 Acres was planned as an Integrated Waste Processing cum Sanitary Landfill site. The capacity of 750 TPD waste processing plant was installed for processing of incoming waste, whereas a small Sanitary landfill covering an area of 15000 Sqm was developed to fill the residual inert coming from processing plant. Kuberpur site became operational for use in December 2011. However, in 2013 the concessionaire stopped operating Processing Plant and thereafter mixed waste dumping started at this site. As of now, approximately 30Acres of area is covered with unprocessed waste with a dumping height ranging from 5meters to 20 meters. The accumulated waste in this dumpsite is estimated to be about 0.8 million MT. This site is still operating and receiving waste from entire jurisdiction of Agra Nagar Nigam. The waste is being deposited randomly without any compaction and pollution prevention measures. (7)
A team, of officials from Central Pollution Control Board (CPCB), Regional Directorate Lucknow, Regional Office, Uttar Pradesh Pollution Control Board (UPPCB), Agra, UP Jal Nigam & Agra Nagar Nigam visited and inspected the Municipal Solid Waste Treatment, Storage & Disposal Facility (MSWTSDF) at Kuberpur, Agra U.P. on 4th August 2019. During the visit the team observed that Kuberpur, Agra dumpsite does not have any treatment facility available for municipal solid Waste. As reported, average 700 to 750 tons mixed MSW is being dumped at the site on daily basis (8). During the field study, it was informed that presently around 22 % of plastic waste was found in mixed waste that is dumped at the site. Heaps of mixed plastic waste including color plastic polythene bags were found at Kuberpur dump site (Figure A1.20)

Page | 58
(a) Heaps of Mixed Plastic Waste at Kuberpur Dumpsite

Page | 59
(b) Mixed Plastic Waste, Multilayered Plastic was at Kuberpur
Dumpsite
(c) During Visit still Mixed Waste is Dumped at Kuberpur Dump site

Page | 60
(d) During Visit still Mixed Waste is Dumped at Kuberpur Dump
site Figure A1.20 (a) (b) (c) (d): Condition of Kuberpur landfill site
Source: NPC Team
1.6 Identification of Hotspots A two way approach was adopted to identify the hotspots for plastic leakage. At first, field survey was carried out. During the field study at Agra, littering of solid waste comprising majority of plastic waste was observed in abundance. This was followed by discussion with ANN on 7th November 2019. A number of hotspots which have been identified and photo documented based on field survey and discussion with ANN are given below and photo documented in Figure A1.21, Figure A1.22 and Figure A1.23.
1. Kailash Ghat 2. Balkeshwar ghat near Balkeshwar temple 3. Hathi Ghat (Balkeshwar Temple)-Clean Up Done 4. Dussehra ghat (Backsideof TajMahal) 5. Just opposite to Agra fort Zhalkari Bai statue Chowk 6. Across the river and across Shamsan left to Mehtab Bagh 7. Cross the Ambedakar Bridge statue (Eitmadullah Tomb just near to Rambagh) 8. Pohiya Ghat

Page | 61
(a) Hotspot in Agra City
(b) Probable Hotspot near Balkeshwar Ghat, Agra
(c) Probable Hotspot near Dussehra Ghat, Agra

Page | 62
(d) Probable Hotspot near Red Fort Agra
(e) Probable Hotspot near Shamshann Telganj, Agra
(f) Probable hotspot near Kailash Ghat, Agra
Figure A1.21 (a) (b) (c) (d) (e) (f) –Identified Hotspot in Agra city Source: Agra Nagar Nigam
Pictorial representation of hotspot near the Ghat captured by NPC team are given below:

Page | 63
FigureA1.22: Hotspot in Agra Captured by NPC Team
Figure A1.23-Hotspot in Industrial Sector Agra Captured by NPC Team
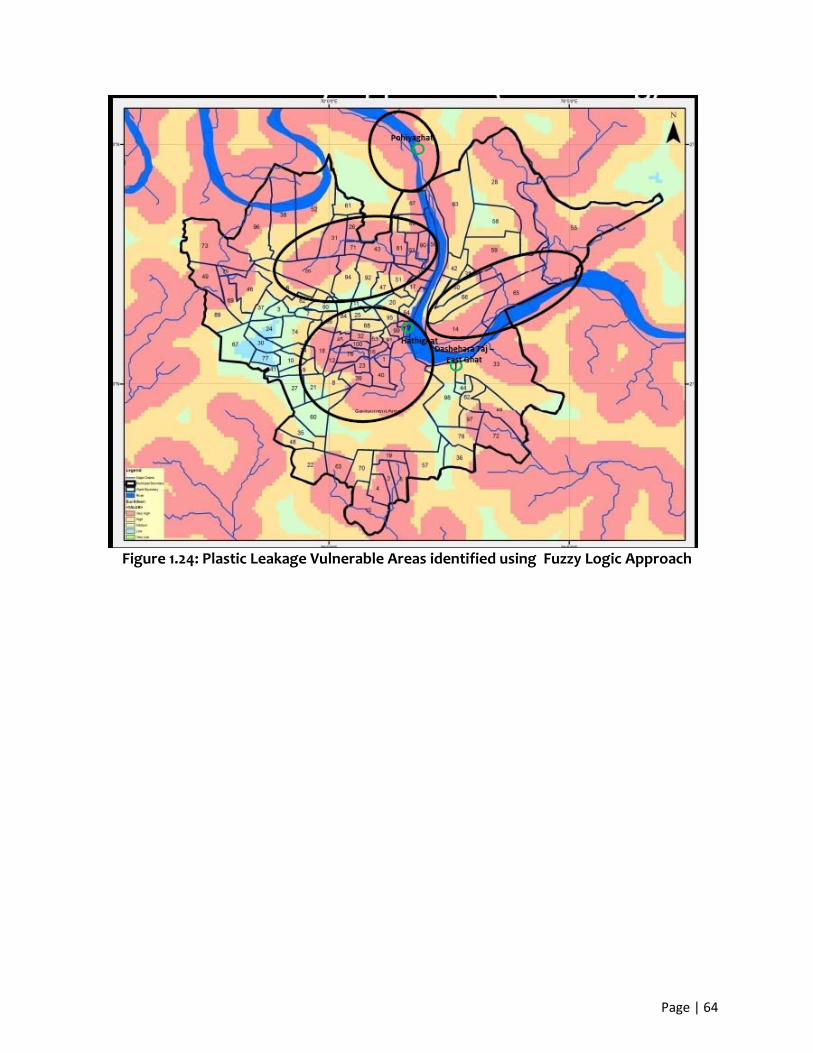
The probable hotspots identified in above Figure 1.21 to Figure 1.23 were further subjected to fuzzy logic approach adopted by GIC, Asian Institute of Technology in order to identify the vulnerable areas in the city, which could be the possible point of plastic leakages in the city. The output of this approach is depicted in Figure A1.24 and Figure A1.25. This indicates that probable hotspots were located in vulnerable areas identified for leakage of plastics in the city.
Page | 64
Figure 1.24: Plastic Leakage Vulnerable Areas identified using Fuzzy Logic Approach

Page | 65
Figure 1.25: Location Plastic Leakage Vulnerable Areas on Land Use Map
In order to establish the plastic leakage scenario, it is pertinent to study the total plastic waste generation and assess their probable leakage based on IUCN approach. As per this approach, the leakage of plastic is measured as a function of a loss rate and a release rate. Mismanaged waste is commonly defined as plastic waste managed in a way that might include some leakage through carriers like air and water into theenvironment.The following sections describe each of these items along with their pictographically representation. 1.7 Quantification of Total Plastic Waste Generation Total plastic waste generation in Agra has been quantified based on secondary data and primary data analysis as described below.
1.7.1 Section A - Secondary Data Analysis A study was carried out by CPCB “Assessment & Characterization of Plastic Waste Generation in 60 Major Cities of India” in January 2015 (9). According to this report, an average total MSW of about 520MT/Day of municipal solid waste was disposed off at chhalesar dumping site. The data revealed that mixed plastic waste constituted about

Page | 66
78.87 Kg/MT of solid waste at the dump site. The quantity of plastic waste ranged from a minimum of about 58.6 Kg/MT to a maximum of about 95.15 Kg/ MT. Therefore, it can be inferred that percentage of plastic contributing to the total sold waste is 7.8 % in Agra. This plastic waste consisted of PET, HDPE/LDPE, PVC, PP, PS and other types of plastics. The percentage composition of each type is described in table A1.6 and shown in Figure A1.26. However, 55 % plastics waste is generated from HDPE/LDPE materials consisting of carry bags, household items and multilayer films.
Table A1.6: PW (Kg/MT) in Agra as per CPCB Report SERIAL
OF DAYS TOTAL
PET HDPE/LDPE PVC PP PS OTHER Total
DAY1 10.33 42.724 5.972 8.484 1.122 11.014 79.646 DAY2 8.786 42.688 7.624 6.746 1.24 7.672 74.756 DAY3 8.746 45.064 8.226 10.162 0.18 9.82 82.198
AVERAGE 9.2873 43.492 7.274 8.464 0.8473 9.502 78.87
FigureA1.26- Percentage Contribution in Total Plastic as per CPCB
1.7.2 Section B – Primary Data Analysis
The quantification and characterization of plastic waste generated was estimated during primary survey and their compilation has been carried out for analysis and reporting in this section.
Based on primary data the ward wise waste generated from various establishments is estimated. Certain information from secondary sources was also compiled. Studies carried out by RCUES (2) on the physical and chemical characteristics of the generated waste in Agra Nagar Nigam are summarized and presented in Table 1.7.
9%
1%12%
55%
12%
11%PET
HDPE / LDPE
PVC
PP
PS
Other

Page | 140
Table A1.7: Plastic Composition Present in Generated Waste as per DPR, Agra Nagar Nigam
Categories Domestic Waste (%weight)
Commercial Waste (%weight)
Market Waste (%weight)
Thermocole 0.6 5.86 2.69 P.V.C/ pipes 0 4.18 0
Plastics 3.98 5.86 0 Polythene 4.98 7.95 3.03
Total 9.56 23.85 5.72 Source: DPR, Agra Nagar Nigam, 2017
As informed by the MRF plant having a capacity of 210 TPD, 40 % of plastic waste, which is recycled comes in Dry waste. This waste comes after the rag pickers have already extracted the high value and recyclable plastic from the mixed solid waste at various collection points/ dhalaos and community garbage bins. The field study also indicated that only 4 to 5 % of high value plastic waste is collected by rag pickers. Collating the plastic waste generation as per DPR Agra Nagar Nigam(2) and picked up by rag pickers or the informal sector, the total plastic waste generation in Agra has been estimated in table A1.8.
Table A1.8: Estimated Plastic Waste Generation by the Primary Data
Particulars Plastic
Generation (TPD)
Remarks
Estimated Plastic in total Domestic Waste 55-60 10% plastic waste present in total household waste 597.54 TPD as per
DPR, Agra Nagar Nigam, 2017. Estimated Plastic in total Commercial
Waste 50-55 24% plastic waste present in total commercial waste 216.5 as DPR, Agra
Nagar Nigam, 2017.
Estimated Plastic in total Market Waste 2-4 6% present plastic waste in total market waste 34.64 TPD as per DPR,
Agra Nagar Nigam, 2017. Estimated total
Plastic waste generation
110-130
Estimated plastic generation in slum 9-13 Estimated from the slum population as mention in DPR Agra Nagar
Nigam, 2017 and taking 9 % plastic waste as per CEPHEEO guidelines
Estimated total Plastic waste recycled
in dry waste
80-85 *Only from
formal collection
Out of 113 TPD total plastic waste, 40 % plastic is recycled from the dry waste as informed by the MRF facility (210TPD).
Estimated high value plastic collected by
rag pickers 4-5 Only 4 to 5% of plastic collected by rag pickers
Estimated Plastic littered
10-30TPD
Most of the contribution of plastic littering comes from mismanagement of waste from slums, secondary storage, uncollected
waste, and dumping site of Agra city. It can be inferred that the amount of plastic that gets collected and is attempted to bring back into the value chain is approx. 80-90 tonnes per day, which is 10% of the total solid waste generated. These values estimated by the primary data collected during NPC field

Page | 141
study are much higher than the values reflected by the various available report and secondary sources. A summary of plastic waste assessment both from secondary and primary sources of data has been summarized in table A1.9 and leakage into the riverine ecosystem has been depicted in figure 1.27.

Page | 142
Figure 1.27: Flow Chart of Plastic Leakage Scenario in Agra
Sources of Solid Waste in Agra
Household
Market
Commercial
Industrial
Total Solid Waste
13-15% Plastic Waste out of Total
Plastic Waste Generation 110 – 130
TPD
Plastic Hotspot
10-25% is littered
80 – 90 TPD Collected by ANN
Community Bins / Depots / Collection
Centres
Plastic Collected in Dry Waste
MRF Facility
Plastic Processed to Pallets / RDF
3 - 5% Plastic Collected Collected by Rag
Pickers
Recycling of
Plastic
Residual
80 – 85 TPD Collected in Dry Waste
Leakage of Plastic to Riverine
Through Drains / Open Channels / Other means
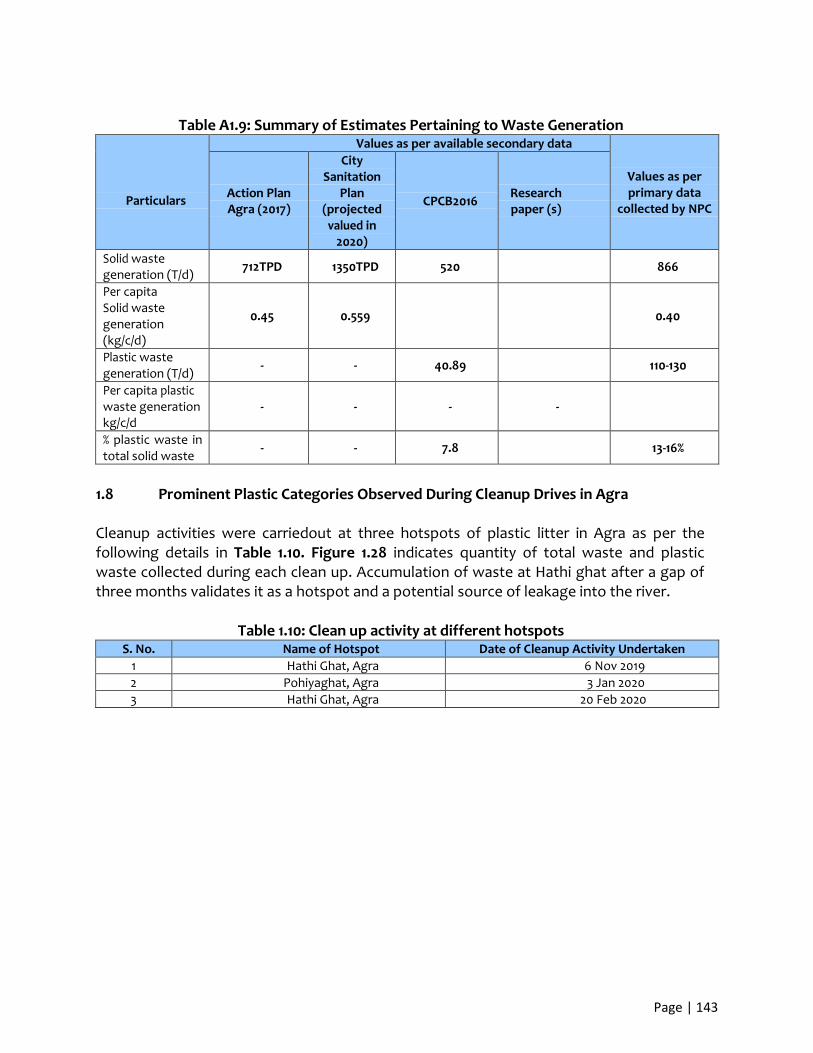
Page | 143
Table A1.9: Summary of Estimates Pertaining to Waste Generation
Particulars
Values as per available secondary data
Values as per primary data
collected by NPC Action Plan Agra (2017)
City Sanitation
Plan (projected
valued in 2020)
CPCB2016 Research paper (s)
Solid waste generation (T/d) 712TPD 1350TPD 520 866
Per capita Solid waste generation (kg/c/d)
0.45 0.559 0.40
Plastic waste generation (T/d) - - 40.89 110-130
Per capita plastic waste generation kg/c/d
- - - -
% plastic waste in total solid waste - - 7.8 13-16%
1.8 Prominent Plastic Categories Observed During Cleanup Drives in Agra Cleanup activities were carriedout at three hotspots of plastic litter in Agra as per the following details in Table 1.10. Figure 1.28 indicates quantity of total waste and plastic waste collected during each clean up. Accumulation of waste at Hathi ghat after a gap of three months validates it as a hotspot and a potential source of leakage into the river.
Table 1.10: Clean up activity at different hotspots
S. No. Name of Hotspot Date of Cleanup Activity Undertaken 1 Hathi Ghat, Agra 6 Nov 2019 2 Pohiyaghat, Agra 3 Jan 2020 3 Hathi Ghat, Agra 20 Feb 2020

Page | 144
Figure A1.28: Snapshot of Cleanup Drive Carriedout in Agra
Figure A1.30: Plastic Types found in Clean up Drive in Poiya Ghat (3rd Jan 2020)
Figure A 1.31: Plastic Types found in Clean up Drive in Hathi Ghat (20th Feb 2020)
390.34
596.6
72.4
168
357.857
100.233
16 17 220
100
200
300
400
500
600
700
Hathighat, Agra, 6 Nov 2019 Pohiyaghat, Agra, 3 Jan 2020 Hathighat, Agra, 20 Feb 2020
Clean Up Locations & Date
Wei
ght
(in
Kgs
)
Total Trash Collected (In Kg) Total Plastic Waste Collected (in Kgs)No. of Categories of Plastic Found
0
50
100
150
200
250
Quantity (in Nos 67 52 120 167 23 215 72 15 11 7 48 11 31 9 4 141 15
Synthetic Bags
Ritual Chunnl
with
Polythene
Light polythen
e
Milk Pouches
Mixed plastic
bags
Drinking water
pouches
Black polythen
e
Plastic Garlands
Slipper / Footwea
r
Transparent /
Translus
PET bottles
Nylon Sacks
Black X Ray film
Hard plastic
includes
Multi Layer
plastic
Themocol
0
500
1000
1500
Series1 26 110 1 95 17 117 345 1346 4 4 5 8 2 1350 15 2 12 15 7 13 55 49
Dalda (Oil
plastic
Milk & water
pouches
Gift packagi
ng
Disposable glass
/ cups
Polyster
wooven
Black polythene (torn
Snacks multilay
er
Poly bags
translusTubes
Disposal Wires (tie)
Plastic disposa
ble
Plastic beads
(artifici
Plastic purse
Mixed plastic waste
Sanitary napkin
Photo frame
Nylon cement wooven
Surf packets
ShoesSauce
pouches
Shampoo
packets
Plastic silver
foil

Page | 145
To summarize, the top five prominent plastic categories observed during cleanups in Agra are:
1. Mixed plastic carry bags 2. Multilayer Packaging 3. Disposable cups &plates 4. Milk & water pouches 5. Packaging plastics
1.9 Plastic leakage Scenario in Agra city from sources
Plastic leakage scenarios from households and commercial / market sources have been depicted in Figure A1.32 and Figure A1.33.

Page | 146
Figure A1.32: Flowchart of Plastic Leakage Scenario in House hold Waste
Household Waste
Urban Household Slums
Mixed Waste
Some % of high value plastics picked up by Rag pickers
Some % collected by Municipality
Remaining are littered
Urban with 91% door to door
collection
Urban collection without daily door to door
collection
Open Street littered
Dhalaos
Transfer Station
(Segregation Site)
Dumpsite Windrow Composting
MR Facility Informal collection of dry waste by Rag pickers
Littering on Road
Yamuna River Ghats
Rituals performed at the bank of
River Yamuna
Drains / Open Drains
River
Littering Littering
Wind Blown
Wind Blown
Run Off
Wind Blown Run Off
Direct Disposing the
Waste
Run Off Wind Blown
Accumulation Points
Recycled Plastics
Wind Blown
Market & Commercial Waste (Shops, Hotel,
Institutes, Restaurant, Vegetable Market)
Mixed Waste
Page | 147
Figure A1.33: Flowchart of plastic Leakage Scenario in Market & Commercial Waste

Page | 148
Figure A1.32 & Figure A1.33 indicate that Littering and direct disposal of waste into the river are major causes of plastic leakages. The major carriers of plastic waste, which have been identified are wind, run off and open drains. 1.10 Plastic Leakage into the Environment
Plastic leakage is defined as the plastic leaving the techno sphere and accumulating in the natural environment. (IUCN, 2020) Plastic waste has a significant impact on environment. Plastics are mainly introduced into the environment through in effective waste management practices. This includes pictorial representation of all the pathway that leaks the plastic into the environment as listed below and depicted in Figures A1.34 to Figure A1.52.
1. Road littering 2. Secondary storage littering 3. Open Drain 4. Burning of plastic waste 5. Littering & mismanagement of waste in Slum 6. Open Drain Barrier
1.10.1 Road Littering
FigureA1.34: Mixed Plastic Waste, Rituals waste at Kamla Nagar, Agra

Page | 149
FigureA1.35: Heap of Plastic Waste, Woven Plastic Waste at Agra
FigureA1.36: Littered Mixed Plastic Waste in Agra City
Source: NPC team
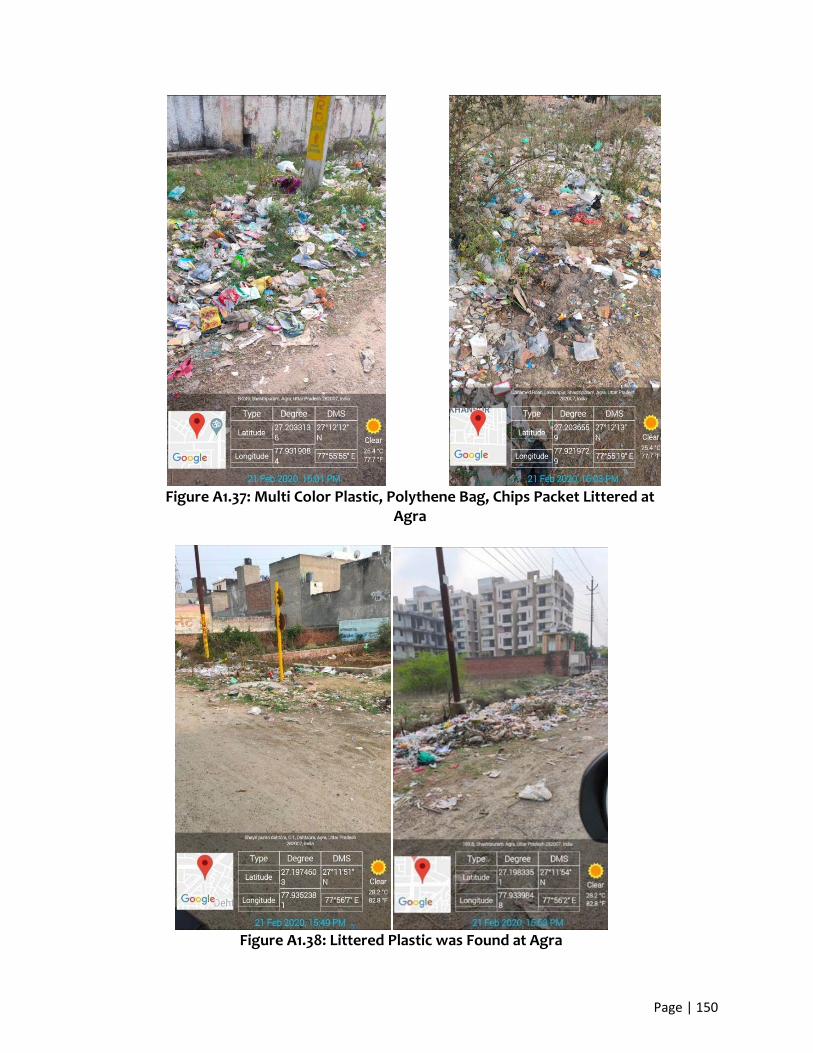
Page | 150
Figure A1.37: Multi Color Plastic, Polythene Bag, Chips Packet Littered at
Agra
Figure A1.38: Littered Plastic was Found at Agra

Page | 151
Source: NPC Team
Figure A1.39: Macro Plastic Floating the Yamuna River, Agra
Figure A1.40: Leather Bag, Chips Packet, Plastic Bag etc was Around the Yamuna River,
Agra 1.10.2 Secondary Storage Littering
Dhalaos / Community bins is secondary storage but along these most of waste is littered and become an open dumping site. Current bin locations have become an open dumpsite for the people residing in the immediate proximity. Community bins are over flowing as the bins are transported regularly for disposal. Waste is being disposed unscientifically.
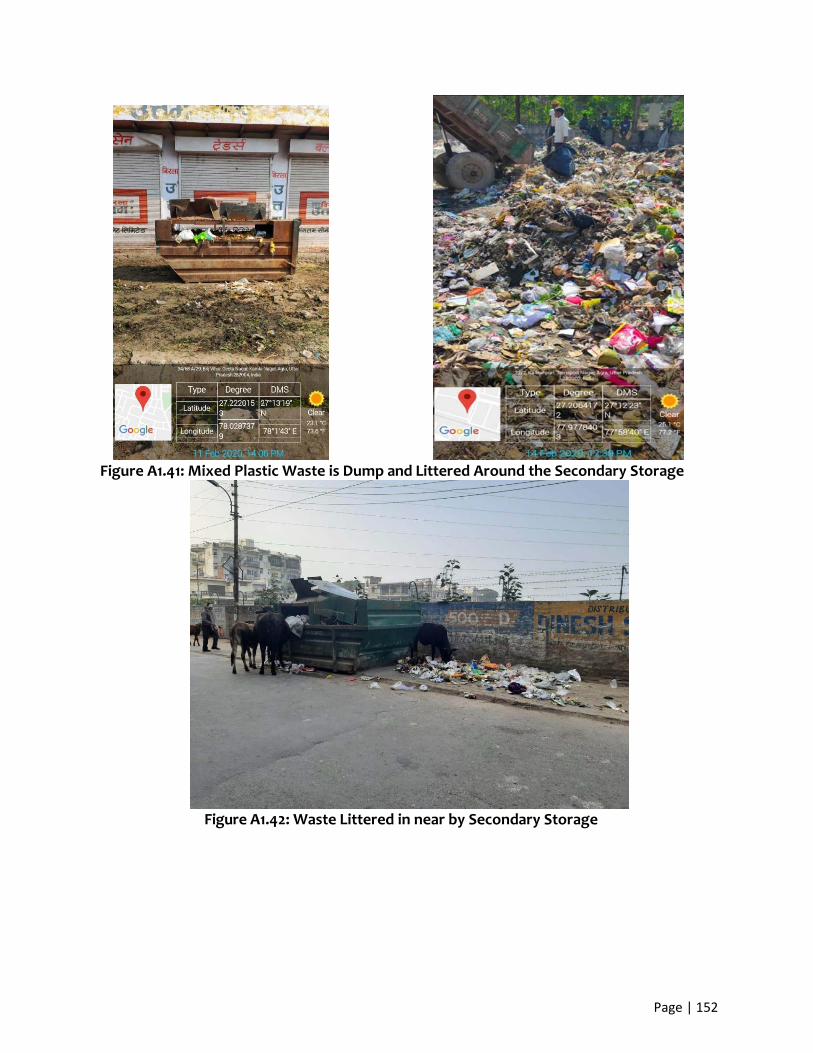
Page | 152
Figure A1.41: Mixed Plastic Waste is Dump and Littered Around the Secondary Storage
Figure A1.42: Waste Littered in near by Secondary Storage
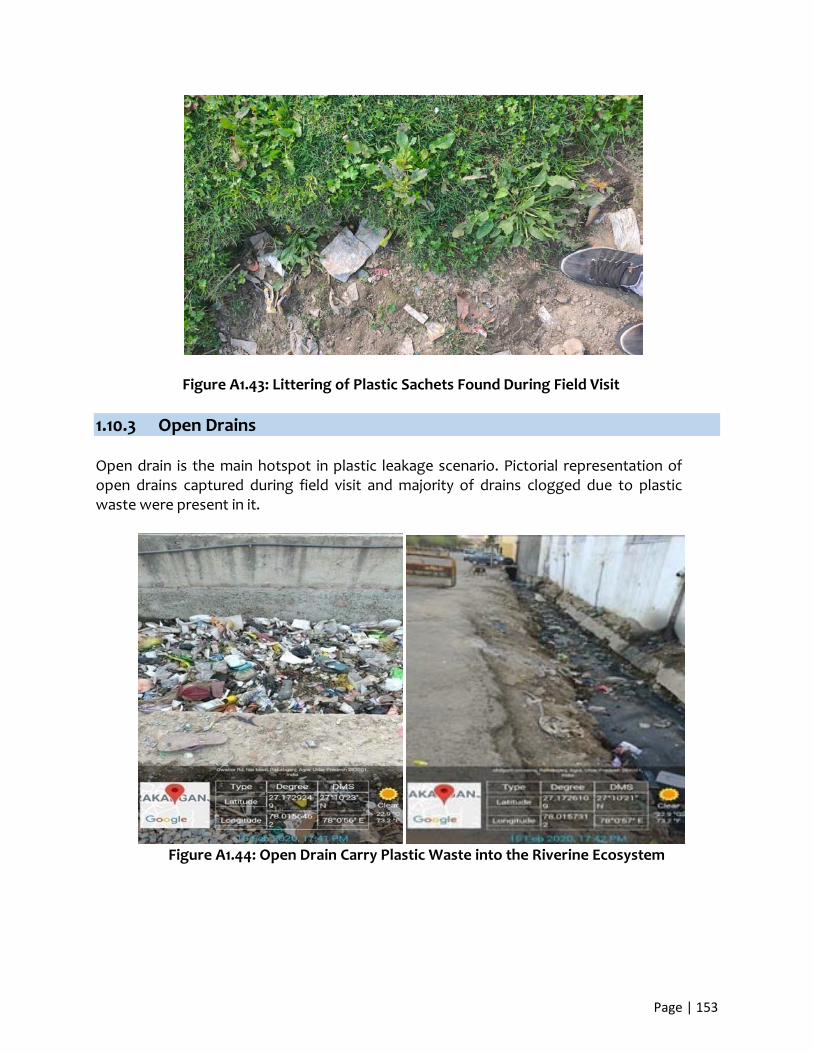
Page | 153
Figure A1.43: Littering of Plastic Sachets Found During Field Visit 1.10.3 Open Drains Open drain is the main hotspot in plastic leakage scenario. Pictorial representation of open drains captured during field visit and majority of drains clogged due to plastic waste were present in it.
Figure A1.44: Open Drain Carry Plastic Waste into the Riverine Ecosystem

Page | 154
Figure A1.45: Open Drain was Clogged Due to Plastic Waste
Figure A1.46: Mixed Wastes is Floating in Open Drain 1.10.4 Burning of Plastic Waste Burning of plastic waste such as footwear, packaging material was found in industrial region.

Page | 155
Figure A1.47-(A): Burning of Waste Were Found in Industrial Sector
Figure A1.47-(B): Burning of Waste Was Found in Industrial Sector
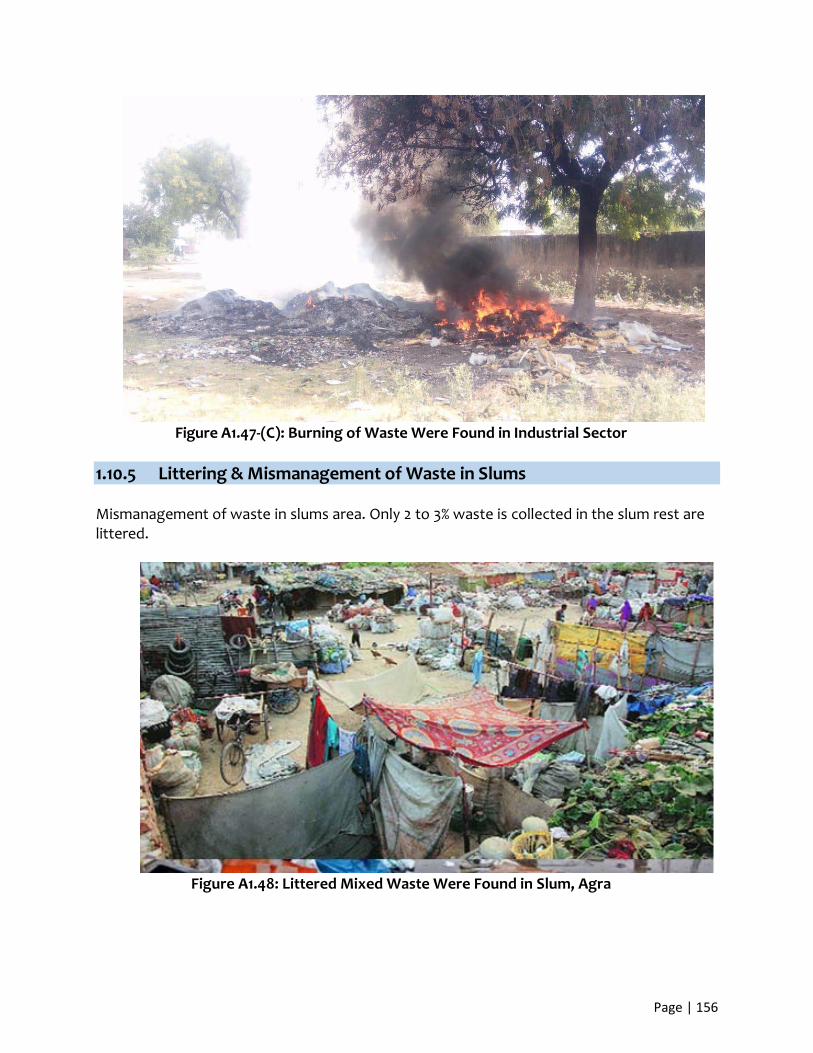
Page | 156
Figure A1.47-(C): Burning of Waste Were Found in Industrial Sector
1.10.5 Littering & Mismanagement of Waste in Slums Mismanagement of waste in slums area. Only 2 to 3% waste is collected in the slum rest are littered.
Figure A1.48: Littered Mixed Waste Were Found in Slum, Agra

Page | 157
Figure A1.49: Condition of slum in Agra

1.10.6 Open Drain Barriers Drain barrier is also a main hotspot of plastic leakage because is waste is clogged in barrier and when the waste water come with pressure the waste is floating down in the river.
Manoharpur Drain G.G. Puram, Kamla Nagar
Lohiya Nagar Rajbada

Page | 159
Chinikaroja Yamuna Brij Nala
LohiyaNagar2 Belanganj Police Chawki
Moti Mahal Brigde Taj Poorvi Gate

Page | 160
Nagla Bhudhi Paliwal Park (Vedant Mandir)
Kakretha Kakretha2
Taj pachimi Gate (JalalBhukari) Mantola

Page | 161
Gokul Nagar Foundary Nagar Vidhya Puram Foundary Nagar
KatraWazirKha2 ChhiniKa Roza 2
FigureA1.50: Drain Barrier in Agra
1.11 Plastic Leaking in the Riverine system
Photo captured by NPC team
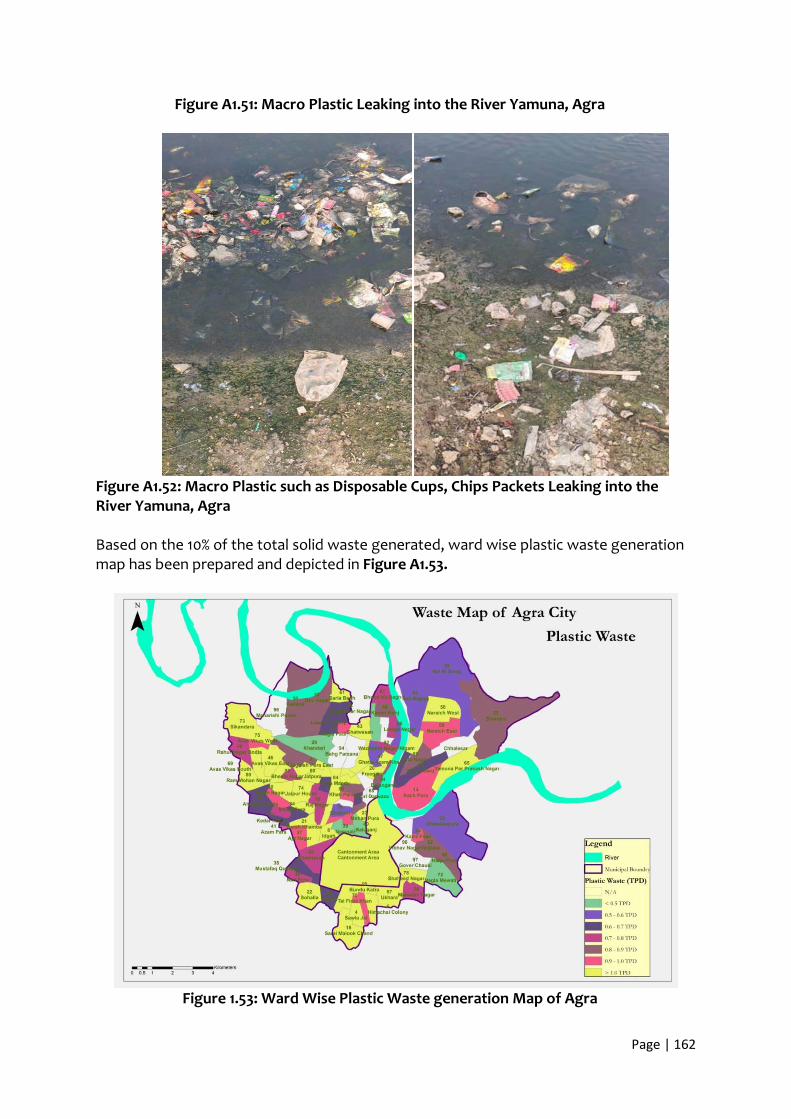
Page | 162
Figure A1.51: Macro Plastic Leaking into the River Yamuna, Agra
Figure A1.52: Macro Plastic such as Disposable Cups, Chips Packets Leaking into the River Yamuna, Agra Based on the 10% of the total solid waste generated, ward wise plastic waste generation map has been prepared and depicted in Figure A1.53.
Figure 1.53: Ward Wise Plastic Waste generation Map of Agra

Page | 163
Massive amount of plastic was observed to be littered during the field study at various locations in Agra. Therefore, littering is one of the major reason for the plastic not being collected and brought back into the value chain. However, majority of the waste categories found during Clean Up includes Multilayer packaging, Plastic Sheet & other thicker plastic bags in black & white color, water pouches, Packaging Material e.g. Tobacco sachets, Biscuit packets, Surf excel, Rusks etc. as per cleanup report. Figure A1.53 also indicates the wards where counter measures can be implemented to prevent leakage of plastics into the river.
Page | 164
REFERENCE
1. Agra Nagar Nigam 2. Detailed Project Report for Municipal Solid Waste Management Scheme
For Agra, 2017 3. Agra Master Plan 2021 4. City Sanitation Plan for Agra 5. Municipal Solid Waste Management Manual by CPHEEO 6. Solid Waste Management Monitorable Action Plan, Municipal Corporation
of Agra 7. www.nagarnigamagra.com, Agra Nagar Nigam website 8. Report in Nagar Nigam Agra in Original Application No.116-2014.pdf 9. Assessment&CharacterizationofPlasticWasteGenerationin60MajorCities,CPC
B 10. AnnualReportofUPPCB2018 11. Municipalsolidwastemanagementchallengesandhealthriskproblematicsolutio
nsat Agra city, U.P., India

Page | 165
Table of Contents
1.0 Introduction .................................................................................................................................. 166 1.1 Prayagraj ........................................................................................................................................ 166 1.2 Geographical and Climatic Condition ........................................................................................... 166 1.2.1 Physiography .......................................................................................................................... 166 1.2.2 Climate ..................................................................................................................................... 168 1.3 Demography & Administrative Set Up.................................................................................. 168 1.4 Population Density (Ward wise) in Prayagraj ............................................................................... 171 1.5 Floating Population ....................................................................................................................... 173 1.6 Land use Analysis Master Plan provisions .................................................................................... 173 1.7 Solid waste management in Mumbai ........................................................................................... 174 1.8 MSW Composition in Prayagraj..................................................................................................... 181 1.9 Estimation of plastic waste generation in Prayagraj based on primary data ............................. 186 1.10 Hotspot identification ................................................................................................................. 189

Page | 166
PLASTIC LEAKAGE SCENARIO IN PRAYAGRAJ
1.0 Introduction 1.1 Prayagraj Prayagraj (previously known as Allahabad) is a major urban agglomeration located in the south eastern region of the state of Uttar Pradesh at the confluence of Rivers Ganga and Yamuna. It is located between 25.4358° N and 81.8463° E (Figure 1). The city draws the attention of pilgrims and heritage lovers from all over the world due to its historical, cultural, mythological and spiritual offerings. Prayagraj is one of the destinations, which holds the KumbhMela, world’s largest congregation of devotees. The city has been described in ancient scriptures as ‘Teerthraj’, the holiest pilgrimage centre and is indeed a perfect place to have a soulful escape. For the Mughals, the city had a great strategic importance to control their empire, and it also became a prominent administrative hub under the British rule. The city was the nerve centre of activities during India’s Freedom Movement. Being centre of higher education, it has also played a leading role in the development of Hindu and Urdu literature.
Figure 1: Prayagraj (previously known as Allahabad)
1.2 Geographical and Climatic Condition Pratapgarh is north of the city, Bhadohi is east, Rewa is south, Chitrakoot (earlier Banda) is west, and Kaushambi, which was till recently a part of Prayagraj, is North-West (Figure 2). 1.2.1 Physiography

Page | 167
Prayagraj lies on the western part of the Great Indo-Gangetic Plain region and is under laid with sediments deposited in successive stages. There can be three distinct physical parts of the city (i) Trans-Ganga Plain, (ii) the Ganga- Yamuna doab (confluence), and (iii) Trans-Yamuna, all three of which are formed by Ganga and its tributary Yamuna. Prayagraj is in the southern part of Uttar Pradesh, at the confluence of the Ganges and the Yamuna. To the southwest is Bundelkhand, to the east and southeast is Baghelkhand, to the north and northeast is Awadh and to the west is the lower doab (of which Prayagraj is part). The city is divided by a railway line running east–west. South of the railway line is the Old Chowk area, while the British-built Civil Lines is in the north of it. Prayagraj is well placed geographically and culturally. Geographically, part of the Ganga-Yamuna Doab (at the mouth of the Yamuna), culturally it is the terminus of the Indian west. The longitude representing Indian Standard Time longitude (25.15°N 82.58°E) passes near the city. It is located at an average altitude of 98 m above mean sea level. The master slope of Trans Ganga is towards east or south east, with the altitude ranging from 89.30 mamsl-93.57 masl. Rivers of the district namely Yamuna, Tons, Sai and Varuna belongs to main drainage system of the Ganga (Figure 3). Dendritic drainage pattern is the most common features in the district which is the structurally controlled. Streams upto the fifth order are encountered in the district. In common with the rest of the doab, its soil and water are primarily alluvial.
Figure 2: Location of Prayagraj in Uttar Pradesh

Page | 168
Figure 3: Contour Map of Prayagraj City
1.2.2 Climate The average annual rainfall in Prayagraj is 934 mm. Climate is sub humid and is characterized by hot summer and pleasant monsoon and cold season. About 90% of rainfall takes place from June to September. During monsoon surplus water is available for deep percolation to ground water. From February there is rapid increase in temperature, May is the hottest month with the mean daily maximum temperature is 41.5°C and mean daily minimum temperature 26°C. After the onset of the monsoon there is appreciable drop in temperature, January is the coldest month with mean daily maximum temperature is 26.20°C and mean daily minimum temperature is 9.3°C. The mean monthly maximum temperature is 19.54°C and mean monthly minimum temperature is 6.23°C. The relative humidity is high during the southwest monsoon season, with mean monthly morning relative humidity at 63.92% and mean monthly evening relative humidity at 48%. Winds are generally high with some increase in force during summer and southwest monsoon season. The mean wind velocity is 5.16 Km/hr and the potential evapotranspiration rate is 1456.7 mm. Prayagraj falls in a "low damage risk" wind and cyclone zone.
1.3 Demography & Administrative Set Up City population: The Municipal Corporation of Prayagraj administers an area of 82 km2 with a population of 11, 17,094 (Census, 2011). The male and female population are 601,363 and 515,731 respectively. The population increased by four folds over the last six decades with increase in population from 332,295 in 1931 to 11,17,095 in year 2011. Prayagraj city comes under Prayagraj metropolitan area along with Cantonment board and urban outgrowths. Population of metropolitan area is 12, 16,719. Male constitutes

Page | 169
655,734 and female constitutes 560,985 of the total population.
Slum Population: As per the survey slums population in the city are 4, 70,467 and households are 91,025 residing in 185 slums of city constituting more than 30% of the total population. The average slum household size is 6.8 which is slightly greater than city household size of 6.4. The household size of slums came down to 5.4 from 6.8 in 2001. The entire population is administratively divided into 5 municipal zones and 80 wards. The city profile of Prayagraj is given in Table 1.
Table 1: City profile of Prayagraj
Particulars Coordinates: 25.45°N81.85°E Elevation : 98 m (322 ft) Area of ULB 82 Km2 Municipal Wards 80 Municipal Zones 5 Growth 20.63% Urban Population (as per 2011 Census) 11.17 Lakh Projected Population (as per Master Plan-2021) 20.50 lakh Average Household Density 1,087/km2 (2,820/sq mi) Govt Type Mayor–Council Body Prayagraj Municipal Corporation
Source: Final Census Report of U.P.-2011
Considering the growth trend of population and based on interaction with municipal corporation, (ANN) officials, the current population of Prayagraj has been considered approx. 20, 00,000 in this report for estimating the current waste generation.
Prayagraj city is the district headquarters of the district. The existing urban setting and growth trends of Prayagraj can be classified into three main categories: - 1. The Old City (consisting of Chowk, Ghantaghar, Bans Mandi, Katghar, Kotwali, Gaughat etc. This shall also include certain areas, though not contiguous but with similar character, like Daraganj, Bairhana, and Katra); 2. The New City (conceived during British rule and thereafter). This includes Civil Lines, Mumford Ganj, Ashok Nagar, Cantonment; and 3. The OG areas (satellite towns and ribbon developments along major corridors including Phaphamau, Jhunsi, Naini, Bamrauli, Manaurietc).The city is spread across 82 sq.km and is divided into 80 wards (Figure 4).The Prayagraj Urban Agglomeration includes the Prayagraj Municipal Corporation area and Prayagraj Outer Growth(OG)areas. The OG areas include Subedarganj Railway Colony, Triveni Nagar(N.E.C.S.W.), T.S.L. Factory, Mukta Vihar, Bharat Pump and Compressor Factory, A.D.A. Colony, Doorbani nagar, ITI Factory and Res. Colony, Shiv Nagar, Gandhi Nagar, Manas Nagar, Industrial Labour Colony, Gangotri Nagar, Mahewa West, Begum Bazar, Bhagal Purwa, Kodra, IOC Colony, Deoghat, ADA Colony and Jhalwagaon, Prayagraj (CB), Arail Uparhar and Chak Babura Alimabad. Prayagraj Municipal Corporation (PMC) is responsible for the management of the MSW generated in the city.

Page | 170
Figure 4: Administrative Ward Map of Prayagraj City
The city has grown organically where the old and new city areas are densely populated while the OG areas are emerging new areas of the city. The densely populated areas are the major sources of waste generation. The District is well connected by roads, railways and airways from the other parts of the Country (Figure 5). It has one of the major junction of railways in northern India along with nine sub stations. Also, the city is connected with major roads. The city is connected to most other Uttar Pradesh cities and major Indian cities such as Kolkata, New Delhi, Hyderabad, Patna, Mumbai, Visakhapatnam, Chennai, Bangalore, Guwahati, Thiruvananthapuram, Pune, Bhopal, Kanpur, Lucknow and Jaipur.

Page | 171
Figure 5: Communication Map of Prayagraj
The main industries of Prayagraj are tourism, fishing and agriculture. There are secondary activities and manufacturing which may be registered or unregistered.
Agriculture: The main crops cultivated in the district are wheat, paddy, potato and sugarcane
Minerals: The mineral products that are commonly found are glass sand, building stone, kankar, brickearth etc.
Industry: Prayagraj has some glass and wire-based industries.The main industrial areas of Prayagraj are Naini and Phulpur, where several public and private sector companies have their units, offices and factories. Bharat Petroleum Corporation Limited, India's largest oil company (which is also state-owned),is setting up a seven million tones per annum(MTPA)capacity refinery at Lohgara, with an estimated investment of Rs.62billion. Prayagraj Bank which began operations in 1865 was founded in Prayagraj. The third All India Census for Small-Scale Industries shows that there are more than 10,000 unregistered small-scale industry units in the city. An integrated industrial township is also proposed over1,200 acres of area in Prayagraj under the Dedicated Freight Corridor Corporation of India.
1.4 Population Density (Ward wise) in Prayagraj Prayagraj is divided in to 80 wards having different population densities. The ward wise population and population density of entire city are given in Table 2. The wardwise
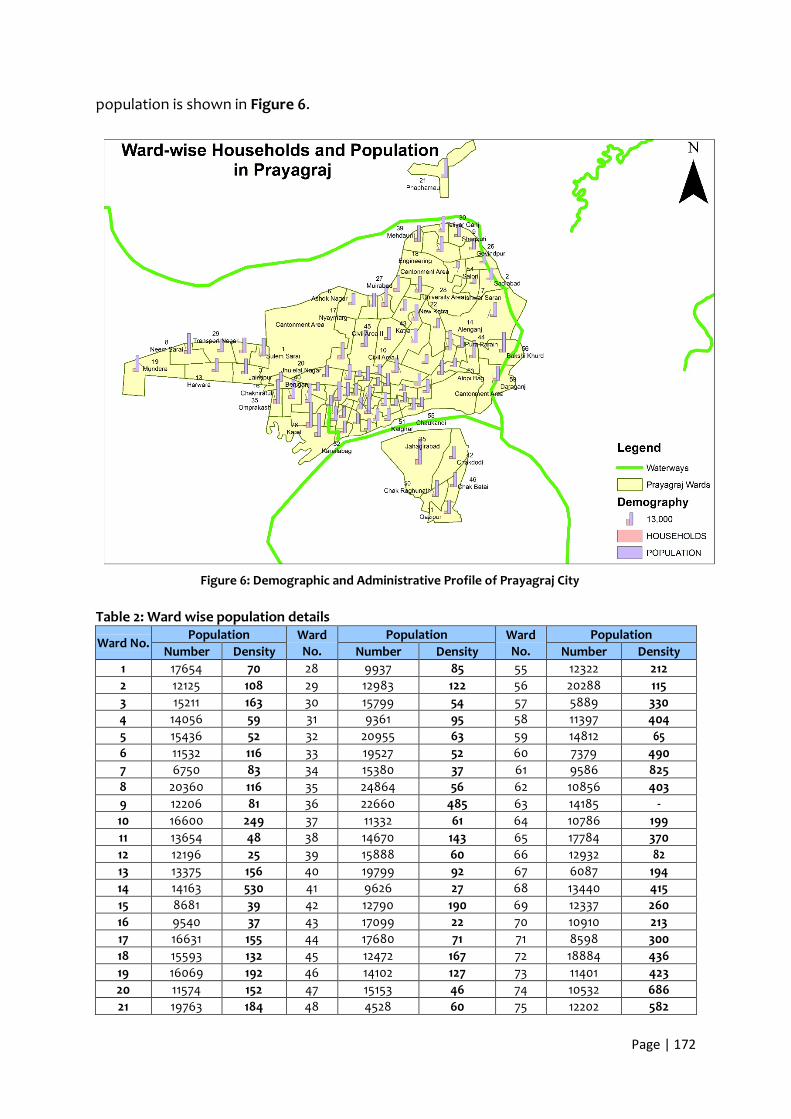
Page | 172
population is shown in Figure 6.
Figure 6: Demographic and Administrative Profile of Prayagraj City
Table 2: Ward wise population details
Ward No. Population Ward
No. Population Ward
No. Population
Number Density Number Density Number Density 1 17654 70 28 9937 85 55 12322 212 2 12125 108 29 12983 122 56 20288 115 3 15211 163 30 15799 54 57 5889 330 4 14056 59 31 9361 95 58 11397 404 5 15436 52 32 20955 63 59 14812 65 6 11532 116 33 19527 52 60 7379 490 7 6750 83 34 15380 37 61 9586 825 8 20360 116 35 24864 56 62 10856 403 9 12206 81 36 22660 485 63 14185 - 10 16600 249 37 11332 61 64 10786 199 11 13654 48 38 14670 143 65 17784 370 12 12196 25 39 15888 60 66 12932 82 13 13375 156 40 19799 92 67 6087 194 14 14163 530 41 9626 27 68 13440 415 15 8681 39 42 12790 190 69 12337 260 16 9540 37 43 17099 22 70 10910 213 17 16631 155 44 17680 71 71 8598 300 18 15593 132 45 12472 167 72 18884 436 19 16069 192 46 14102 127 73 11401 423 20 11574 152 47 15153 46 74 10532 686 21 19763 184 48 4528 60 75 12202 582

Page | 173
Ward No. Population Ward
No. Population Ward
No. Population
Number Density Number Density Number Density 22 11921 99 49 15604 73 76 25256 276 23 13581 48 50 16486 82 77 13483 508 24 14126 22 51 12443 50 78 14342 1115 25 19960 51 52 23241 268 79 12718 779 26 10671 66 53 8904 41 80 11693 498 27 16122 84 54 9612 67
Source:CensusofIndia,2011 1.5 Floating Population Prayagraj attracts a huge number of tourists every day. Over 100 million tourists visited Prayagraj during the Maha Kumbh Mela 2013. In addition, tourists flock to Prayagraj to take holy dip in Triveni Sangam throughout the year. As per City development plan, daily footfall of tourist increases from 50-60 thousands in year 2007-08 to around 80-90 thousands of tourists in the year 2011-12.
1.6 Land use Analysis Master Plan provisions
The proposed future growth for Prayagraj is clearly outlined by the Prayagraj Master Plan 2021. As per the Prayagraj Master Plan 2001, a total area of 216.89 sq. km was proposed to be developed, whereas as per the land use survey conducted in 2002, only about 43.42% of that land, i.e., 94.18 sq. km was developed. The current master plan covers about 309.17 sq.km of land under different categories of land use of which residential land use covers 36%, commercial 2.41%, industrial 5.57%, recreational 16.02%, public/semi-public 3.82%, public utilities 2.23% and transportation 12.09%. However, a significant 13.26% is put to other uses such as horticulture, forestry, and dairy farms. The land use provisions are given Table 3 and shown in Figure 7. Table 3: Percentage of Land Use pattern at Prayagraj
S. No. Landuse Area (sq.km) Percentage (%) 1 Residential 111.64 36.11 2 Commercial 7.46 2.41 3 Industrial 17.22 5.57 4 Government 26.24 8.49 5 Recreational 49.53 16.02 6 Public/semi-public 11.79 3.82 7 Publicutilities 6.90 2.23 8 Transportation 37.36 12.08 9 Otherlanduses 40.99 13.26
Total 309.17 100

Page | 174
Figure 7: Land Use Pattern Map of Prayagraj
1.7 Solid waste management in Mumbai Data on solid waste generation in Prayagraj As per PMC estimates, about 540 TPD of solid waste is generated every day in Prayagraj. The local residents of towns generate solid waste at the rate of about 450 grams per capita per day on an average. This average generation of solid waste includes local inhabitants (comprising the wastes generated by the resident population, shops and commercial establishments, vegetable and fruit markets, construction and demolition and hospital wastes – non-infectious and non- hazardous) and the floating population in the town. Most of the waste generated in Prayagraj comprises food and other discarded waste materials such as paper, plastic, glass, metal, rags, and packaging materials.(Ref: City Development Plan for Prayagraj, 2041; CRISIL, April 2015). Another report, Slum Free City Plan of Action – Prayagraj, 2013 states that the about 680.0 MT (CDP) of solid waste is generated every day in the city. It has been assumed that the local residents of towns generate solid waste at the rate of about 539 grams per capita per day on an average. The solid waste generation has also been projected for 2021 and indicated in Table 4.
Table 4: Projection of solid waste generation in Prayagraj
Year Population Per capita waste generation (kg/capita/day) Total waste generation (ton/day) 1997 8,61,129 0.474 408 2001 9,90,298 0.506 501 2006 11,38,843 0.541 616
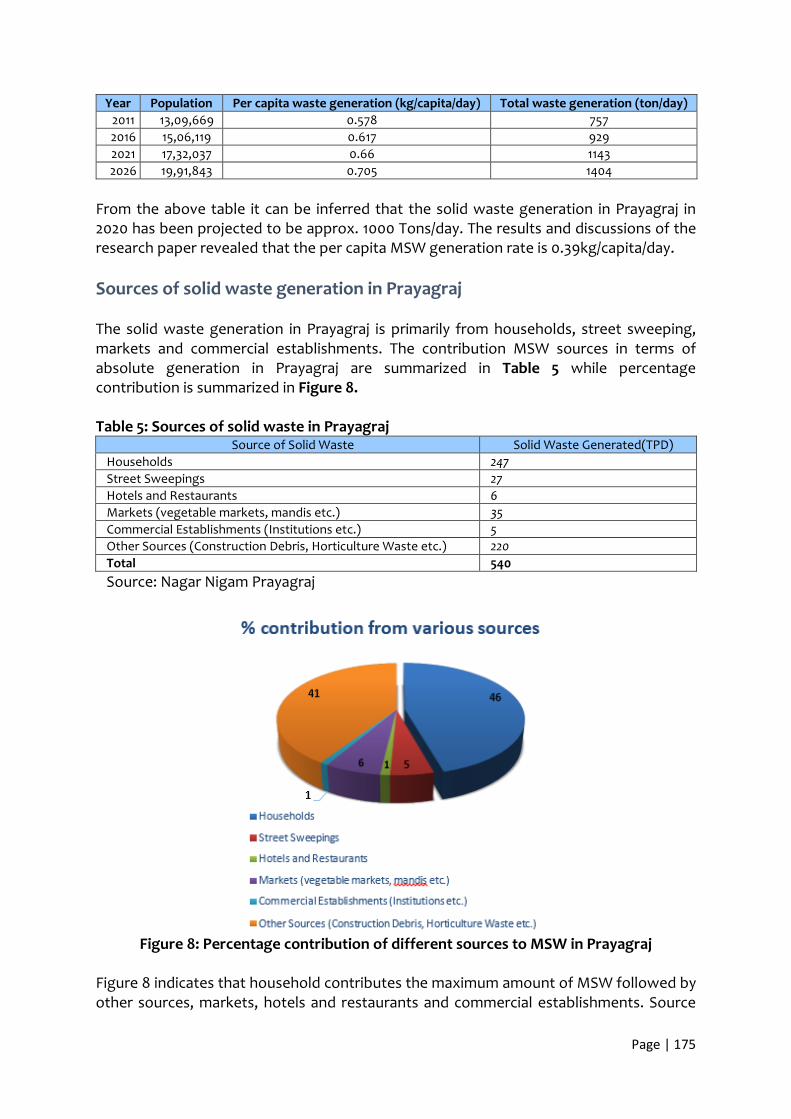
Page | 175
Year Population Per capita waste generation (kg/capita/day) Total waste generation (ton/day) 2011 13,09,669 0.578 757 2016 15,06,119 0.617 929 2021 17,32,037 0.66 1143 2026 19,91,843 0.705 1404
From the above table it can be inferred that the solid waste generation in Prayagraj in 2020 has been projected to be approx. 1000 Tons/day. The results and discussions of the research paper revealed that the per capita MSW generation rate is 0.39kg/capita/day. Sources of solid waste generation in Prayagraj The solid waste generation in Prayagraj is primarily from households, street sweeping, markets and commercial establishments. The contribution MSW sources in terms of absolute generation in Prayagraj are summarized in Table 5 while percentage contribution is summarized in Figure 8. Table 5: Sources of solid waste in Prayagraj
Source of Solid Waste Solid Waste Generated(TPD) Households 247 Street Sweepings 27 Hotels and Restaurants 6 Markets (vegetable markets, mandis etc.) 35 Commercial Establishments (Institutions etc.) 5 Other Sources (Construction Debris, Horticulture Waste etc.) 220 Total 540 Source: Nagar Nigam Prayagraj
Figure 8: Percentage contribution of different sources to MSW in Prayagraj
Figure 8 indicates that household contributes the maximum amount of MSW followed by other sources, markets, hotels and restaurants and commercial establishments. Source

Page | 176
wise waste generation in each zone and each ward is summarized in Table 6 and depicted in Figure 9, Figure 10 and Figure 11. The three figures indicate that core area with maximum population density is the major contributor to solid waste from the city.

Table 6: Zone Wise and Ward Wise different waste generation at Prayagraj
Zone Number Ward Name Ward
Number
ZONE DETAILS WARD DETAILS
Population Household Domestic
Waste (TPD)
Commercial, institution and
other waste (TPD)
Street sweeping and
drain waste (TPD)
C&D Waste (TPD)
Plastic waste (TPD)
Population Household Domestic
Waste (TPD)
Commercial, institution and
other waste (TPD)
Street sweeping and
drain waste (TPD)
C&D Waste (TPD)
Plastic waste (TPD)
Zone 1
Sulem Sarai 1
382442 58294 121.748 35.372 18.810 39.190 17.593
19727 2905 6.621 0.969 0.868 1.808 0.846 Jaintipur 3 16199 2421 5.142 0.741 0.706 1.471 0.659 Harwara 13 14512 2336 4.606 0.692 0.636 1.324 0.593
Pritam Nagar 49 16995 3031 5.394 1.070 0.776 1.616 0.724 Transport Nagar 29 14112 2284 4.479 0.616 0.611 1.274 0.571
Himmatganj 15 9425 1438 2.991 0.751 0.449 0.936 0.419 Chakniratul 16 10438 1396 3.313 1.317 0.556 1.158 0.519
Jhulelal Nagar 20 12557 2182 3.986 1.294 0.634 1.320 0.591 Omprakash Nagar 35 27091 4743 8.599 1.396 1.199 2.499 1.119
Shahganj 63 16259 2318 5.161 4.001 1.099 2.290 1.026 Sarai Garhi 57 6405 822 2.033 1.347 0.406 0.845 0.379
Dariya Shah Ajmal 80 12720 1889 4.037 0.990 0.603 1.257 0.563 Sultanpur Bhawa 72 20308 2916 6.446 2.539 1.078 2.246 1.006
Karela Bagh 52 25113 3951 7.971 1.599 1.148 2.392 1.072 Kareli 76 27484 4268 8.723 2.277 1.320 2.750 1.232
Beniganj 40 21536 3357 6.836 0.746 0.910 1.895 0.849 Chakiya 33 21125 2616 6.705 1.383 0.971 2.022 0.906
Puramanohardas 64 12200 1724 3.872 2.662 0.784 1.634 0.732 Minhaj Pur 34 16651 2629 5.285 3.251 1.024 2.134 0.956
Atala 78 15972 2098 5.070 1.072 0.737 1.535 0.688 Bakshi Bazaar 77 14243 1997 4.521 2.251 0.813 1.693 0.759
Mundera 19 9238 1540 2.932 1.662 0.551 1.149 0.515 Neem Sarai 8 22132 3433 7.025 0.746 0.932 1.943 0.870
Zone 2
Meera Pur 62
194560 31205 61.750 23.820 10.270 21.390 9.584
11777 1982 3.738 1.680 0.650 1.355 0.607 Dariyabad 65 19328 2920 6.135 1.077 0.865 1.803 0.808 Sadiapur 69 13416 1971 4.258 0.439 0.564 1.174 0.526 Tulshipur 70 12030 1892 3.818 1.407 0.627 1.306 0.585 Katghar 51 13569 2207 4.307 1.129 0.652 1.359 0.609
Dariyabad 58 12460 1829 3.955 1.375 0.640 1.333 0.597 Malviya Nagar 73 12438 2620 3.948 0.695 0.557 1.161 0.520
Attar Suiya 79 14004 2114 4.445 1.049 0.659 1.373 0.615 Mohatsimganj 66 14057 2347 4.462 3.443 0.949 1.976 0.885
Narainsingh Nagar 71 9374 1617 2.975 2.604 0.670 1.395 0.625 Meera Ganj 75 13282 2172 4.216 2.989 0.865 1.801 0.807
Azad Square 47 14418 2401 4.576 1.078 0.679 1.414 0.633 Muthi Ganj 60 8020 1232 2.546 1.268 0.458 0.953 0.427
Muthi Ganj bagh 1 68 14727 2288 4.674 1.819 0.779 1.623 0.727 Bahadur Ganj 74 11660 1613 3.701 1.772 0.657 1.368 0.613
Zone 3
Govindpur 26
340666 56573 108.127 53.27 19.37 40.35 18.0767
11577 2144 3.675 1.162 0.580 1.209 0.542 Shiv kuti 9 13178 1951 4.183 1.217 0.648 1.350 0.605
Phaphamau 21 19900 3014 6.316 3.340 1.159 2.414 1.082 Nyaymarg 17 11652 2415 3.698 3.872 0.908 1.893 0.848
Ashok Nagar 6 12553 2190 3.984 0.990 0.597 1.244 0.557 Ganga Nagar 32 22777 3505 7.229 1.070 0.996 2.075 0.930
Rajapur 4 15342 2627 4.870 2.415 0.874 1.821 0.816 Civil Area I 10 18056 3238 5.731 8.316 1.686 3.512 1.573 Civil Area II 45 14612 2642 4.638 6.326 1.316 2.741 1.228

Page | 178
Zone Number Ward Name Ward
Number
ZONE DETAILS WARD DETAILS
Population Household Domestic
Waste (TPD)
Commercial, institution and
other waste (TPD)
Street sweeping and
drain waste (TPD)
C&D Waste (TPD)
Plastic waste (TPD)
Population Household Domestic
Waste (TPD)
Commercial, institution and
other waste (TPD)
Street sweeping and
drain waste (TPD)
C&D Waste (TPD)
Plastic waste (TPD)
Alenganj 14 15796 2598 5.014 1.630 0.797 1.661 0.744 Mehdauri 39 17271 2931 5.482 0.793 0.753 1.569 0.703 Muirabad 27 12688 2034 4.027 1.297 0.639 1.331 0.596 New Katra 22 13142 2574 4.171 2.718 0.827 1.722 0.772
Mumford Ganj 5 15694 2770 4.981 1.531 0.781 1.628 0.729 Old Katra 43 18615 2823 5.900 2.310 0.987 2.057 0.920
Colonel Ganj 38 15945 2655 5.060 2.250 0.880 1.830 0.819 Teliyar Ganj 30 17089 2625 5.420 1.200 0.800 1.660 0.742
Medical College 31 10233 1886 3.250 3.120 0.760 1.590 0.713 University Area 28 11653 2038 3.700 1.730 0.650 1.360 0.608
Sadiabad 2 13180 1905 4.180 0.930 0.610 1.280 0.572 Chadpur Salori 48 4924 716 1.560 1.410 0.360 0.740 0.333
Salori 54 10443 1802 3.310 1.050 0.520 1.090 0.488 Ishwar Saran 7 7329 1030 2.330 1.230 0.430 0.890 0.399 Engineering 18 17017 2460 5.400 1.360 0.810 1.690 0.757
Zone 4
Madhawa Pur 24
184745 29887 58.64 17.67 9.16 19.08 8.547
16673 3221 5.292 1.626 0.830 1.730 0.775 Krishna Nagar 23 13253 2193 4.207 0.813 0.602 1.255 0.562
Rambagh 67 6620 1144 2.101 6.342 1.013 2.111 0.946 Bagambari 37 12001 1894 3.809 2.294 0.732 1.526 0.684
Malakraj 12 13178 2254 4.183 0.820 0.600 1.251 0.560 New Basti 41 10460 1696 3.320 1.188 0.541 1.127 0.505
Bhardwaj Pur 25 21923 3458 6.958 0.669 0.915 1.907 0.854 Pura Parain 44 19145 2691 6.077 0.500 0.789 1.644 0.737
Khalashi Line 61 10437 1614 3.313 0.879 0.503 1.048 0.470 Chaukandi 55 13356 2308 4.239 1.021 0.631 1.315 0.589 Daraganj 59 16134 2818 5.121 0.477 0.672 1.400 0.627
Bakshi Khurd 56 22037 3061 6.995 0.193 0.862 1.797 0.805 Alopi Bag 53 9528 1535 3.024 0.844 0.464 0.967 0.433
Zone 5
Jahagirabad 36
80466 12447 25.54 10.53 4.33 9.02 4.04
20589 2880 6.535 2.836 1.124 2.343 1.050 Chak Batai 46 15330 2412 4.866 2.281 0.858 1.787 0.801
Chak Raghunath 50 18086 2902 5.740 2.323 0.966 2.013 0.903 Chakdodi 42 13083 2058 4.153 1.102 0.631 1.314 0.589 Qazipur 11 13378 2195 4.246 2.000 0.750 1.562 0.700
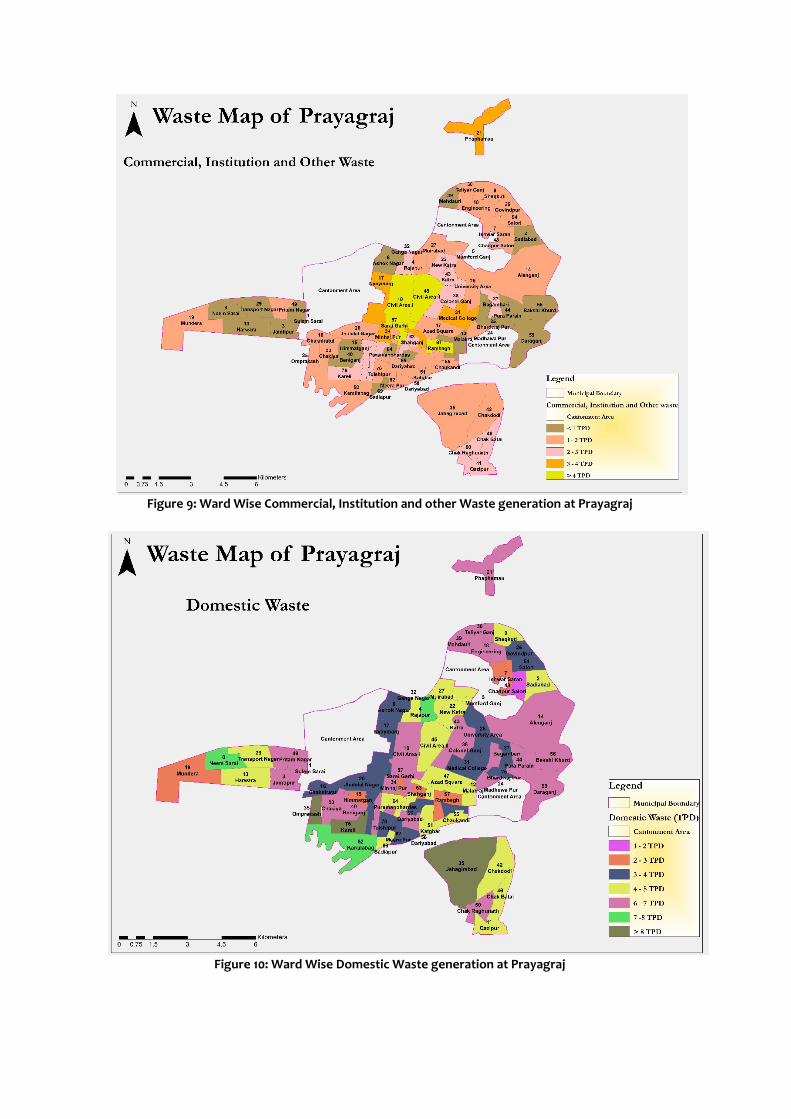
Figure 9: Ward Wise Commercial, Institution and other Waste generation at Prayagraj
Figure 10: Ward Wise Domestic Waste generation at Prayagraj

Page | 180
Figure 11: Ward Wise Plastic Waste generation at Prayagraj
Figure 12: Ward Wise Street Sweeping and Drains Waste generation at Prayagraj

Page | 181
1.8 MSW Composition in Prayagraj The results of the analyses show that MSW contains 45.3% organic matter and 40% miscellaneous materials (bricks, fine dust, rubber, wood, leather, wastewater, etc.). The percentage of recyclable materials (glass, paper, plastic, metals) has been found to be very low. This may be due to rag pickers, who collect and segregate recyclable / high value materials from collection points and disposal sites. The tentative composition of the solid waste generated in the city is summarized in the Table 7 below: Table 7: Composition of solid waste in Prayagraj
Constituents % Of weight Paper 3.6 Cardboard 1.09 Metal, tin cans 2.54 Glass 0.73 Food wastes (vegetable leaves and peels) 45.3 Textile rags 2.22 Plastic (poly bags) 2.86 Miscellaneous (bricks, ash, fine dust, rubber, wood, leather,etc.) 41.66
Total 100 Moisture content 25.86
Source: Nagar Nigam Prayagraj
Thus, according to the above study, the plastic waste contribution in the total municipal solid waste is approximately 3%. However, this composition accounts only poly bags and not other types of plastic waste. Solid Waste Collection and Transportation Solid waste collection and transportation has been described below in terms of primary collection, secondary collection and transportation. Primary Collection Door to door collection efficiency is 61% and it has been initiated in almost of all the

Page | 182
wards. There are about 129,835 households, which are being covered under door to door collection MSW collection service. Slum areas are not fully serviced by waste collection services. Table 8 gives the details of the door-to-door collection services coverage. Table 8: Details of door to door collection service coverage
PROPERTYCATEGORY NUMBER Households 121000
Hotels and Restaurants 145 Commercial Establishments (institutions, offices) 3840
Any other establishments (incl. markets) 4850 Total 129835
Source: SLB 2013, Nagar Nigam Allahabad Field studies indicate that there is a rampant practice of throwing the wastes into the streets and drains by many households in the city as well as within the community of small restaurants and eateries. This littering of waste has resulted in clogging of drains. Excessive use of polythene bags has also emerged out to be one of the reasons for frequent clogging of drains. Solid waste is collected in handcarts by the private operator and is disposed off to nearby secondary collection point. However, others throw the household waste outside their residences from where sweepers of Prayagraj nagar nigam collect waste by means of rickshaw trolley and dump the same into the dustbins or onto streets (open dump). In some of the cases, generators themselves dispose off waste in nearby waste collection points/ containers, onto the streets, or in the nearby drains. The sanitation workers (safai karamcharis) employed by the local administration carry out street sweeping, collect drain silt and waste heaps from roadsides and dispose them at nearby open dumps. These unorganized disposal methods have resulted in accumulation of solid waste on roadsides and vacant plots and in low lying areas and storm water drains. Secondary Collection Secondary collection process is at an average level as shown in Figure 13. The bins are found overflowing with waste resulting in its littering. As per the SWM DPR 2007, the MSW collected from each of the primary collection points mentioned above is transported to designated open dump areas and DP containers (mostly on the main roads), which are the secondary collection points identified are nearly 50 in number and about 160 Dust bins spread over all 80 wards of the city. The waste collection from the secondary collection points starts by Dumpers and Tractor trolleys from 8 AM in the morning and goes on till 5 PM in the evening. These vehicles transfer the MSW to trenching grounds/ crude dumping sites at Buxi Band and Kareli area near Yamuna river (Figure 14).

Page | 183
Figure 13: Bad condition of secondary collection bins.
Figure 14: Road Side Open Dumping
Transportation System Most of the times, solid waste is transported in open trolleys hauled by tractors. These open trolleys are overloaded with waste, resulting in road littering during transportation. The loading and unloading of waste is done manually. It has been found that sanitation worker (safai karamchari) is involved in this activity generally do not use any Personal Protection Equipment (PPE) during the execution of their services. Prayagraj Nagar Nigam (PMV) has 85 transportation equipment / vehicles. Table 9 gives information about the number of vehicles used in collection and transportation of solid waste in the city. 380 MT/Day out of the total generated waste of 540 MT/ Day of waste in the city is collected and transported to the final disposal site. It indicates that 30% the generated waste remains uncollected and littered within the city’s municipal boundaries.
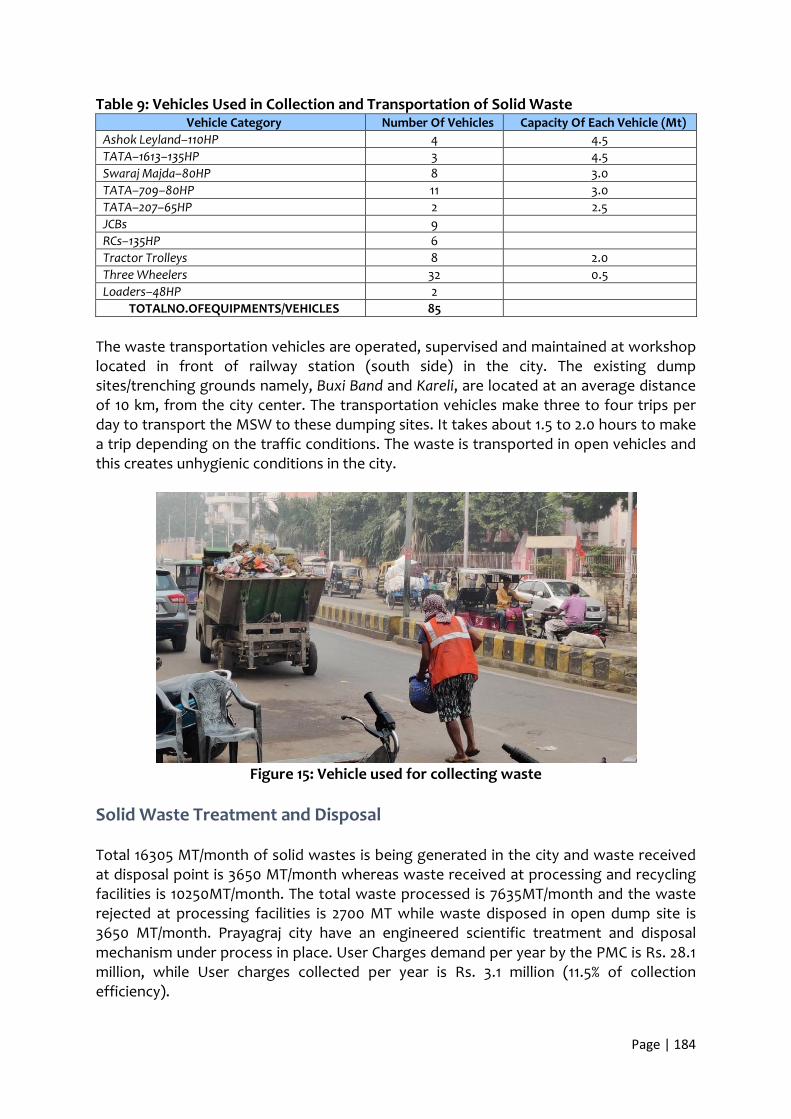
Page | 184
Table 9: Vehicles Used in Collection and Transportation of Solid Waste Vehicle Category Number Of Vehicles Capacity Of Each Vehicle (Mt)
Ashok Leyland–110HP 4 4.5 TATA–1613–135HP 3 4.5 Swaraj Majda–80HP 8 3.0 TATA–709–80HP 11 3.0 TATA–207–65HP 2 2.5 JCBs 9 RCs–135HP 6 Tractor Trolleys 8 2.0 Three Wheelers 32 0.5 Loaders–48HP 2
TOTALNO.OFEQUIPMENTS/VEHICLES 85 The waste transportation vehicles are operated, supervised and maintained at workshop located in front of railway station (south side) in the city. The existing dump sites/trenching grounds namely, Buxi Band and Kareli, are located at an average distance of 10 km, from the city center. The transportation vehicles make three to four trips per day to transport the MSW to these dumping sites. It takes about 1.5 to 2.0 hours to make a trip depending on the traffic conditions. The waste is transported in open vehicles and this creates unhygienic conditions in the city.
Figure 15: Vehicle used for collecting waste
Solid Waste Treatment and Disposal Total 16305 MT/month of solid wastes is being generated in the city and waste received at disposal point is 3650 MT/month whereas waste received at processing and recycling facilities is 10250MT/month. The total waste processed is 7635MT/month and the waste rejected at processing facilities is 2700 MT while waste disposed in open dump site is 3650 MT/month. Prayagraj city have an engineered scientific treatment and disposal mechanism under process in place. User Charges demand per year by the PMC is Rs. 28.1 million, while User charges collected per year is Rs. 3.1 million (11.5% of collection efficiency).

Page | 185
Existing MSW Processing System: The existing waste processing plant and landfill site is situated at Baswar. The existing waste processing unit has
• A pre segregation unit with capacity of 500. 0 MT/day • A compost plant with capacity of 300 MT/day (Figure 16 a&b) • A RDF plant with capacity of 250 MT/day • A plastic plant recycling Unit with the capacity of 25 MT/day
There is no C& D waste processing plant and Waste to energy plant. The capacity of pre segregation unit, compost plant, RDF plant and plastic plant recycling Unit is sufficient to cater the demand taking into 105 variations. Currently, there is no treatment facility for domestic hazardous waste and sanitary waste.
(a) Generation of Compost from Waste
(b) Packing of Compost produced
Figure 16 (a) & (b): Composting Facility at Prayagraj
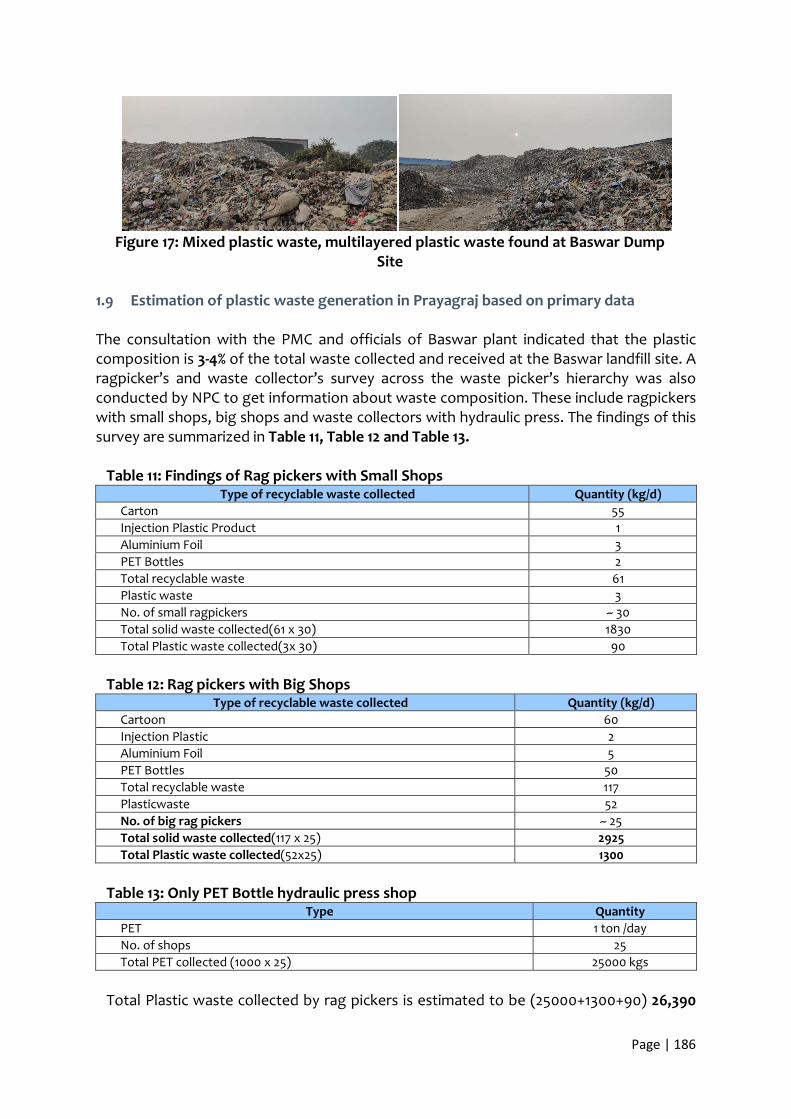
Page | 186
Figure 17: Mixed plastic waste, multilayered plastic waste found at Baswar Dump
Site
1.9 Estimation of plastic waste generation in Prayagraj based on primary data
The consultation with the PMC and officials of Baswar plant indicated that the plastic composition is 3-4% of the total waste collected and received at the Baswar landfill site. A ragpicker’s and waste collector’s survey across the waste picker’s hierarchy was also conducted by NPC to get information about waste composition. These include ragpickers with small shops, big shops and waste collectors with hydraulic press. The findings of this survey are summarized in Table 11, Table 12 and Table 13.
Table 11: Findings of Rag pickers with Small Shops
Type of recyclable waste collected Quantity (kg/d) Carton 55 Injection Plastic Product 1 Aluminium Foil 3 PET Bottles 2 Total recyclable waste 61 Plastic waste 3 No. of small ragpickers ~ 30 Total solid waste collected(61 x 30) 1830 Total Plastic waste collected(3x 30) 90
Table 12: Rag pickers with Big Shops
Type of recyclable waste collected Quantity (kg/d) Cartoon 60 Injection Plastic 2 Aluminium Foil 5 PET Bottles 50 Total recyclable waste 117 Plasticwaste 52 No. of big rag pickers ~ 25 Total solid waste collected(117 x 25) 2925 Total Plastic waste collected(52x25) 1300
Table 13: Only PET Bottle hydraulic press shop
Type Quantity PET 1 ton /day No. of shops 25 Total PET collected (1000 x 25) 25000 kgs
Total Plastic waste collected by rag pickers is estimated to be (25000+1300+90) 26,390

Page | 187
kgs or approx. 26 tons/ day. The total quantity of plastic waste generation in Prayagraj has been estimated by collating the plastic waste collected by PMC and picked up by ragpickers or the informal sector and the plastic waste collected by Municipal Corporation. S. no. Particulars Value
Plastic waste collected by Municipal corporation 1 Solid waste collected by PMC per day as received at Baswar plant 617952 kg/d 2 % plastic in the collected waste at Baswar Plant 3.5% 3 Amount of plastic waste collected 21628 Kg/ d
High value Plastic waste collected by Informal sector/ Rag pickers 4 Recyclable Solid waste collected by rag pickers 29755 Kg/d 5 High value Plastic waste collected by rag pickers 26390 kg / d 6 Total waste generation of city(1 +4) 647707 kg/d 7 Total plastic waste generated per day ((3 +5) 48018 kg / d
It can be inferred that the amount of plastic that gets collected and needs to be addressed is is approximately 48 tons per day,whichis~7.8 % of the solid waste generated. These values are higher than the values from different secondary sources. The difference may be on account of littering (Figure 18), which may not have been accounted earlier. The littered plastic finds its way to the adjoining drains and water bodies and finally ending up in the Ganges and the Yamuna.
Civil Lines Behind Big Bazar: Plastic percentage 20%- commercial area
Rajapur Behind Bus Stop Service Station Plastic 8% (commercial)
Hasimpur Plastic 7-8% Haza – Plastic10-12%
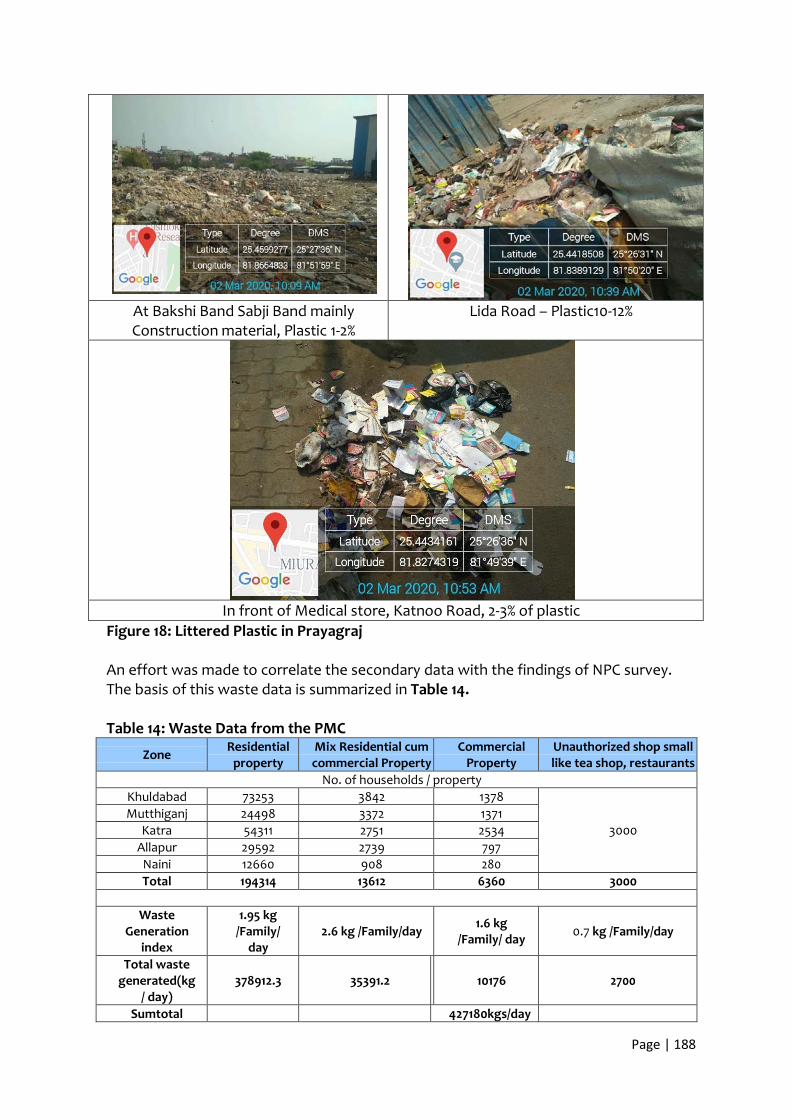
Page | 188
At Bakshi Band Sabji Band mainly Construction material, Plastic 1-2%
Lida Road – Plastic10-12%
In front of Medical store, Katnoo Road, 2-3% of plastic
Figure 18: Littered Plastic in Prayagraj An effort was made to correlate the secondary data with the findings of NPC survey. The basis of this waste data is summarized in Table 14. Table 14: Waste Data from the PMC
Zone Residential property
Mix Residential cum commercial Property
Commercial Property
Unauthorized shop small like tea shop, restaurants
No. of households / property Khuldabad 73253 3842 1378
3000 Mutthiganj 24498 3372 1371
Katra 54311 2751 2534 Allapur 29592 2739 797 Naini 12660 908 280 Total 194314 13612 6360 3000
Waste
Generation index
1.95 kg /Family/
day 2.6 kg /Family/day 1.6 kg
/Family/ day 0.7 kg /Family/day
Total waste generated(kg
/ day) 378912.3 35391.2 10176 2700
Sumtotal 427180kgs/day

Page | 189
Source: Prayagraj Nagar Nigam
Table………indicated that the waste generated is calculated to be 427 tons per day, and at 7.8%, corresponding plastic waste generation comes to be 33.3tonsper day. Hence it can be inferred that there is a high possibility of plastic waste generation from the un serviced or poorly serviced slum areas. Apparently, the waste generated in the slums is not adequately captured under the existing solid waste management plan of the city. 1.10 Hotspot identification
A step wise approach has been adopted to identify the hotspots, which serve as source of plastic leakage into the river. This is based on IUCN’s approach for defining the plastic leakage as a function of loss rate and leakage rate. The various steps include identification of vulnerable areas using fuzzy logic approach adopted by GIC, AIT Thailand (Figure 19) and identification of leakage points (Figure 20 & Figure 21) followed by field reconnaissance & verification (Figure 22) and cleanup activities. This indicates that probable hotspots were located in vulnerable areas identified for leakage of plastics in the city. During the field study at Prayagraj, littering of solid waste comprising majority of plastic waste was observed in abundance. Table 15 describes the list of locations or prime hot spots of waste littering in Prayagraj Table 15: List of littering/ unserviced dumping points/ hotspots
S. No. Particulars Name of ward Block no.
1 Prayagraj Nagar Nigam charge
no.&01
Mundera ward no & 19 26]30
Chakiya ward no.33 140]141&1]141&2]149&1 149&2]149&3]223]224&1]224&2
Chakniratul wardno.&16 164]170]171
Sulem sarai ward no.01 184&1]184&2]185]186
187&1]187&2]188 Jayantipur ward no.03 207]208]210&1]210&2]204
2 Prayagraj Nagar Nigam charge
no.&02
Jhulelal nagarwardno.04 04 Beniganj ward no.40 33&1]33&2]33@204]36&1]36&2
Sadiapur ward no.69 80]88 94]95
Dariyabad ward no. 65 162 165
3 Prayagraj Nagar Nigam charge
no.&03
Shahganj ward no. &63 141&1]142&2 Gadhi sarai ward no. & 57 134]136]137]138]139 Atala ward no.&78 48 Dariyabad ward no. &58 184 Atarsuiya ward no. 79 82]83]86 Mindajpur ward no.34 111]112
4 Prayagraj Nagar Nigam charge
no.&04
Narayan singh nagar ward no. 71 22&1]22&2]27
Moitsimganj ward no. 66 45
485&1]48&2
Chaukhandi ward no.55 135
140&1 Mallahi basti Keedganj 140&2 140&2
5 Prayagraj Nagar Nigam charge Ashok nagar ward no.6
50 51
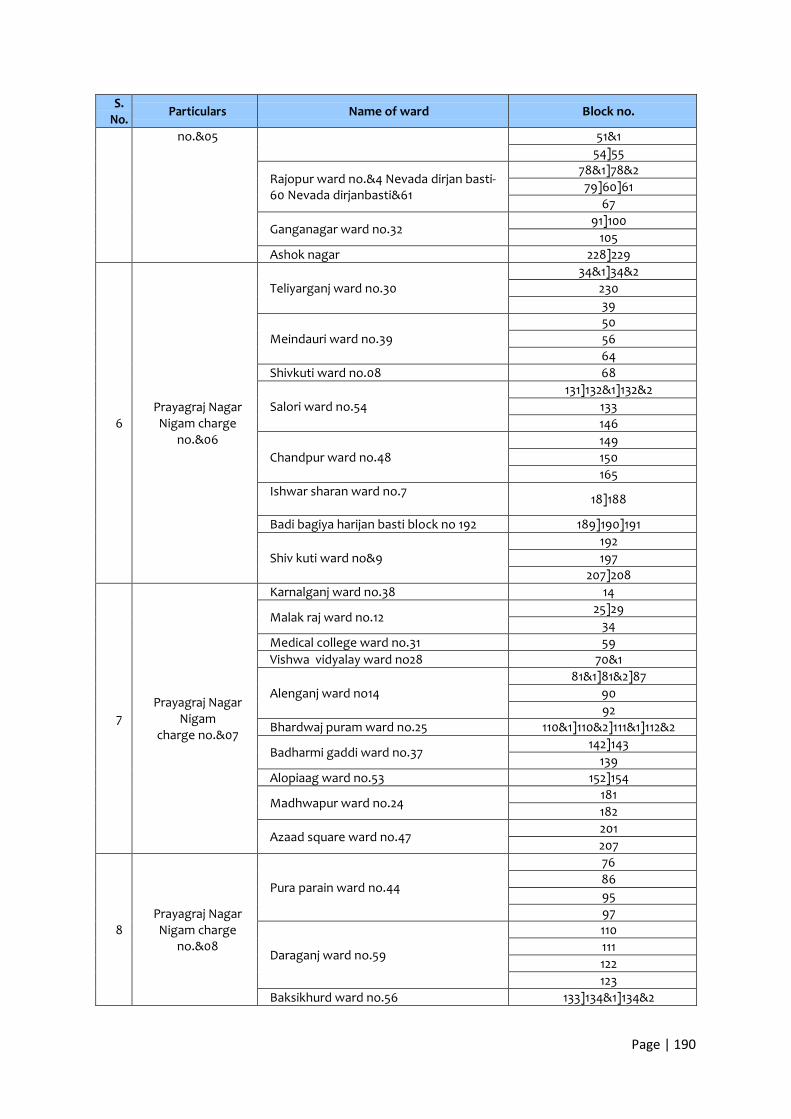
Page | 190
S. No. Particulars Name of ward Block no.
no.&05 51&1 54]55
Rajopur ward no.&4 Nevada dirjan basti-60 Nevada dirjanbasti&61
78&1]78&2 79]60]61
67
Ganganagar ward no.32 91]100
105 Ashok nagar 228]229
6 Prayagraj Nagar Nigam charge
no.&06
Teliyarganj ward no.30 34&1]34&2
230 39
Meindauri ward no.39 50 56 64
Shivkuti ward no.08 68
Salori ward no.54 131]132&1]132&2
133 146
Chandpur ward no.48 149 150 165
Ishwar sharan ward no.7 18]188
Badi bagiya harijan basti block no 192 189]190]191
Shiv kuti ward no&9 192 197
207]208
7 Prayagraj Nagar
Nigam charge no.&07
Karnalganj ward no.38 14
Malak raj ward no.12 25]29
34 Medical college ward no.31 59 Vishwa vidyalay ward no28 70&1
Alenganj ward no14 81&1]81&2]87
90 92
Bhardwaj puram ward no.25 110&1]110&2]111&1]112&2
Badharmi gaddi ward no.37 142]143
139 Alopiaag ward no.53 152]154
Madhwapur ward no.24 181 182
Azaad square ward no.47 201 207
8 Prayagraj Nagar Nigam charge
no.&08
Pura parain ward no.44
76 86 95 97
Daraganj ward no.59
110 111 122 123
Baksikhurd ward no.56 133]134&1]134&2

Page | 191
S. No. Particulars Name of ward Block no.
146&1]146&2
Krishna nagar Keedganj ward no.23
152 153
154&1 155
Naini ward no.&11 4]5]6]7]8
11]12]13]14]15 Naini ward no.&36 o 42 199&1]199&2]199&3]194]67]69
Naini ward no.&36 197&1]197&2]192 193]194]195]196
Naini ward no.&50 200]201]202 Naini ward no.&46 45&1]45&2]49&1]49&2]49&3 Naini ward no.&42 76]77]78&1]78&2 Naini ward no.&50 22&1]22&2 Naini ward no.&42 73]75 Naini ward no.&11 1]2]3 Naini ward no.&50 26]27 Naini ward no.&42 59]60]61]62 Naini ward no.&46 52&1]52&2 Naini ward no&46 47]48
Figure 19: Plastic Leakage Vulnerable Areas identified using Fuzzy Logic Approach

Page | 192
Figure 20: Location of Probable Hotspots in Haridwar
Figure 21: Drains and Sources of Plastic Leakage

Page | 193
Assessment of categories of plastics in the total plastic waste
Ads per secondary data, LDPE/HDPE and PP were most prominent categories of plastics prevalent in the plastic waste in Prayagraj. As per NPC’s assessment the following observations were made with regard to the category of plastics in the plastic waste stream.
Prominent plastic categories observed during cleanup drives in Prayagraj
Cleanup activities werecarried out at four hotspots of plastic litter in Prayagraj as given in Table 16 and the results are shown in Figure 22.
Table 16: Clean up activity at four hotspots
S.no. Name of Hotspot Date of Clean up activity undertaken
1 Katghar Basti, Prayagraj 3-Nov-19 2 Ramghat , Prayagraj 02-Nov-19 3 ABPulliya,Prayagraj 08-Jan-20 4 Kumbh area, below Naini new bridge, Arail Prayagraj 12thMarch 2020
The classification of plastics collected during cleanup drives is shown in Figure 22.

Page | 194
Figure 23: Composition of plastic waste found during cleanup drives To summarize, the top five prominent plastic categories observed during cleanups are: • Beverage bottles/PETbottles • Nylon sacks • Packaging plastic • Poly carry bags

Page | 195
• Multilayer packaging
Prominent plastic waste as per physical observation at various hotspots During physical observation at various hotspots the prominent plastic categories found include • Food wrappers / take away packets • Poly carry bags • Packaging material
Figure 24 depict the dominant plastic categories at Plastic waste hotspots
Figure 24: Type of Plastic Littering at the Hotspot
Quantification of plastic leakage The quantification of plastic waste leakage has been carried out considering 10% of the total solid waste generated as plastic waste in each ward. The ward wise plastic waste generation map has been prepared and depicted in Figure 25.

Page | 196
Figure 25: Ward wise Plastic waste Generation in Prayagraj Summarizing the total solid waste generation as per primary data collection, the total waste generation in the city is calculated to be 721Tons per day and the total waste received at Baswar plant daily is approx.600Tons per day; 26T/d high value plastic is being taken away by the rag pickers. Hence, it can be concluded that the waste collection efficiency by PMC overall is 86% for Prayagraj. Based on the figures of solid and plastic waste generation per day in the city, as estimated by the primary data collected, the quantification of plastic leaking into the environment has been described in Table 17. Table 17: Plastic Leakage Estimation
S. No. Particulars 1 Total solid waste generated in the city ~721 Tons per day 2 Total waste received at Baswar processing facility ~ 600Tons per day
3 High value Plastic waste picked by ragpickers from community bins/collectiondepots ~26 Tons per day
4 Collection efficiency ~86% 5 Plastic waste generated ~56 tons / d (33 +23) 6 Plastic waste brought back to value chain ~ 48 tons 7 Hence, plastic waste littered 8 tons/ d 8 Waste quantity littered@ 14% of (721 + 26) ~101 Tons / day 9 Plastic waste littered @ 7.8% ~7.8tonsper day
Thus, it can be anticipated that at least 7.8tons of plastics per day leaks into the eco system, land and riverine system by various means and pathways. The various pathways of plastic waste litter are:
Page | 197
• Street littering • Direct disposal in to drains/ open channel • Surface run off • Wind-blown from uncovered transfer stations/ wards • Open dumping at hotspots • Open burning
The leakage scenario has been depicted in the following flow chart (Figure 26) While the Photo documentation is given in Figure 27.

Figure 27: Flow chart of plastic leakage into the environment


Page | 200
Plastics in drain at G.T Road, at Bangraulli
Chauraha Bengraulli Gaon Drain going to Ganga
River. Plastic10-15% Figure 28: Photo documentation of plastic leakage Massive amount of plastic was observed to be littered during the field study at various locations in Prayagraj. Therefore, littering is one of the major reasons for the plastic not being collected and brought back into the value chain. However, majority of the waste categories found during Clean Up includes beverage bottles/PET bottles, nylon sacks, packaging plastic, poly carry bags, multilayer packaging.

Page | 201
Table of Contents
1.1 Introduction to Greater Mumbai .................................................................................................. 202 1.1.1 Greater Mumbai ...................................................................................................................... 202 1.2 Geographical and Climatic Condition .................................................................................... 202
1.2.1 Physiography .................................................................................................................. 202 1.2.2 Climate ............................................................................................................................. 203
1.3 Demography ........................................................................................................................... 203 1.4 Land Use ........................................................................................................................................ 205 1.5 Tourism in Mumbai ................................................................................................................. 208 1.6 Natural Economic Resources ................................................................................................. 208 2.1 Solid waste management in Mumbai ........................................................................................... 210 2.1.1 Data on solid waste generation in Mumbai as per secondary data ..................................... 210 2.1.2 Cluster Wise Waste Generation on the basis of composition .............................................. 210 2.1.3 Household Waste ..................................................................................................................... 213 2.2.1 Dry Waste Collection & Sorting Centers ............................................................................... 220 2.3 Disposal & Treatment ............................................................................................................. 223 3.1 Plastic Waste Generation in Greater Mumbai .............................................................................. 226

Page | 202
PLASTIC LEAKAGE SCENARIO IN MUMBAI 1.1 Introduction to Greater Mumbai 1.1.1 Greater Mumbai Mumbai, the capital city of the state of Maharashtra and also known as financial capital of India is the most populated city in India. Mumbai is located on the western sea coast of India from 18°53' North to 19°16' North Latitude and from 72° East to 72°59' East Longitude. Figure 1 shows the Mumbai municipal boundary. Mumbai being an island city is surrounded by Arabian Sea from three sides. Due to limitation of expansion, it is the densest metropolis of the world. Municipal Corporation of Greater Mumbai (MCGM) or Brihanmumbai Municipal Corporation (BMC) is governing civic body in Mumbai.
Figure 1: Mumbai City Map
1.2 Geographical and Climatic Condition 1.2.1 Physiography Mumbai lies at the mouth of the Ulhas River on the western coast of India, in the coastal region known as the Konkan. It sits on Sashti Island, which it partially shares with the Thane district. Mumbai is bounded by the Arabian Sea to the west. Many parts of the city lie just above sea level, with elevations ranging from 10 m to 15 m; the city has an average elevation of 14 m. The drainage and contour pattern is shown in Figure 2. The drainage pattern indicates the natural flow from west to east with major and minor drains draining into The Arabian Sea.
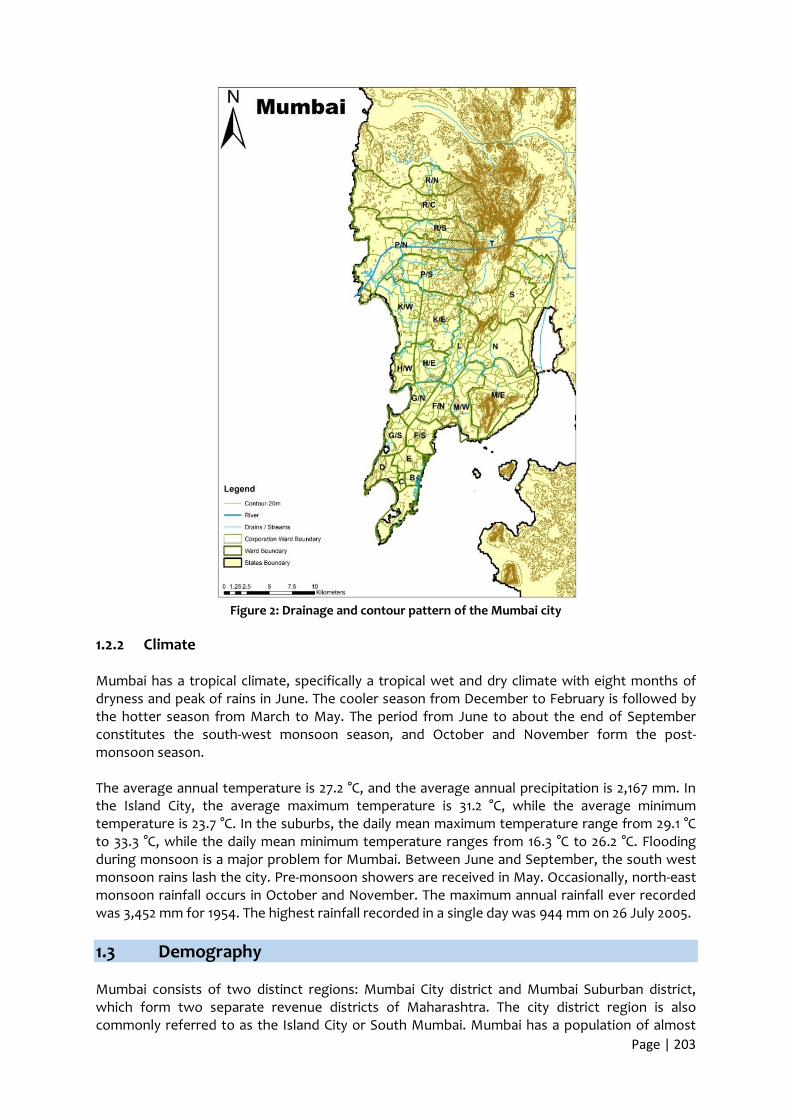
Page | 203
Figure 2: Drainage and contour pattern of the Mumbai city
1.2.2 Climate Mumbai has a tropical climate, specifically a tropical wet and dry climate with eight months of dryness and peak of rains in June. The cooler season from December to February is followed by the hotter season from March to May. The period from June to about the end of September constitutes the south-west monsoon season, and October and November form the post-monsoon season. The average annual temperature is 27.2 °C, and the average annual precipitation is 2,167 mm. In the Island City, the average maximum temperature is 31.2 °C, while the average minimum temperature is 23.7 °C. In the suburbs, the daily mean maximum temperature range from 29.1 °C to 33.3 °C, while the daily mean minimum temperature ranges from 16.3 °C to 26.2 °C. Flooding during monsoon is a major problem for Mumbai. Between June and September, the south west monsoon rains lash the city. Pre-monsoon showers are received in May. Occasionally, north-east monsoon rainfall occurs in October and November. The maximum annual rainfall ever recorded was 3,452 mm for 1954. The highest rainfall recorded in a single day was 944 mm on 26 July 2005. 1.3 Demography Mumbai consists of two distinct regions: Mumbai City district and Mumbai Suburban district, which form two separate revenue districts of Maharashtra. The city district region is also commonly referred to as the Island City or South Mumbai. Mumbai has a population of almost

Page | 204
12.64 million, as per census 2011. As per Master Plan-2021 estimated population of Mumbai will be approximately 25 million by 2021. Mumbai is also recognized as the most densely populated city. The city has an area of 603.4 km2. The population density of the city is 26,645 person per sq.km (excluding no development area). Inverse proportion of Area and Population causes serious impact on its environment. About 40-50 % of the city’s population lives in slum areas. Most prominent slum area is Dharavi, which is considered to be one of the world's largest slums. Mumbai has 24 cluster wards and 227 wards which are further divided in 227 sub-wards. Also, Administrative Ward-wise population indicates that ward has maximum population of 9, 60,074 persons and minimum population of 1, 29,820 persons. The administrative profile of the city is given in Table 1.
Table 1: City Profile
S. No. Particulars Quantities 1. Total Area 603.4 km2 2. Population 12.64 million 3. Floating Population 6 million/year 4. Population Density 26645 persons/km2 5. No. of household 2.7 million 6. Number of cluster Wards 24 7. Number of Wards 227
In Greater Mumbai 1,959 slum settlements have been identified with a total population of 6.25 million, which forms 54 per cent of the total population of the city (Census of India, 2001). The Island City houses only 17 per cent of the slum population whereas the western suburbs have high concentrations of slums especially in the inner western suburbs, where there are large slums with hazy boundaries forming a continuous area containing 58 per cent of the slum population. Average household size is 4.5 and the sex ratio is much better (842 females per thousand males) than in the rest of the city. Cluster wise population and area (in Km2) is given in Table 2 while cluster and ward map is given Figure 3. Ward P/S has the highest population while ward B has the lowest population.
Table 2: Cluster wise population and area
Cluster Area in km2 Population A 11.20 188,691 B 2.65 129,820 C 1.91 169,463 D 8.30 353,759 E 7.27 401,102
F/N 12.85 539,548 F/S 9.87 368,146 G/N 8.31 610,944 G/S 9.74 385,256 H/E 12.41 568,313 H/W 8.65 313,694 K/E 24.00 840,258 K/W 25.18 763,567
L 15.62 920,155 M/E 38.19 823,772 M/W 17.62 420,079
N 29.68 635,231 P/S 46.70 960,074 P/N 25.19 472,718 R/C 47.95 573,334 R/N 14.17 439,941 R/S 18.31 704,966
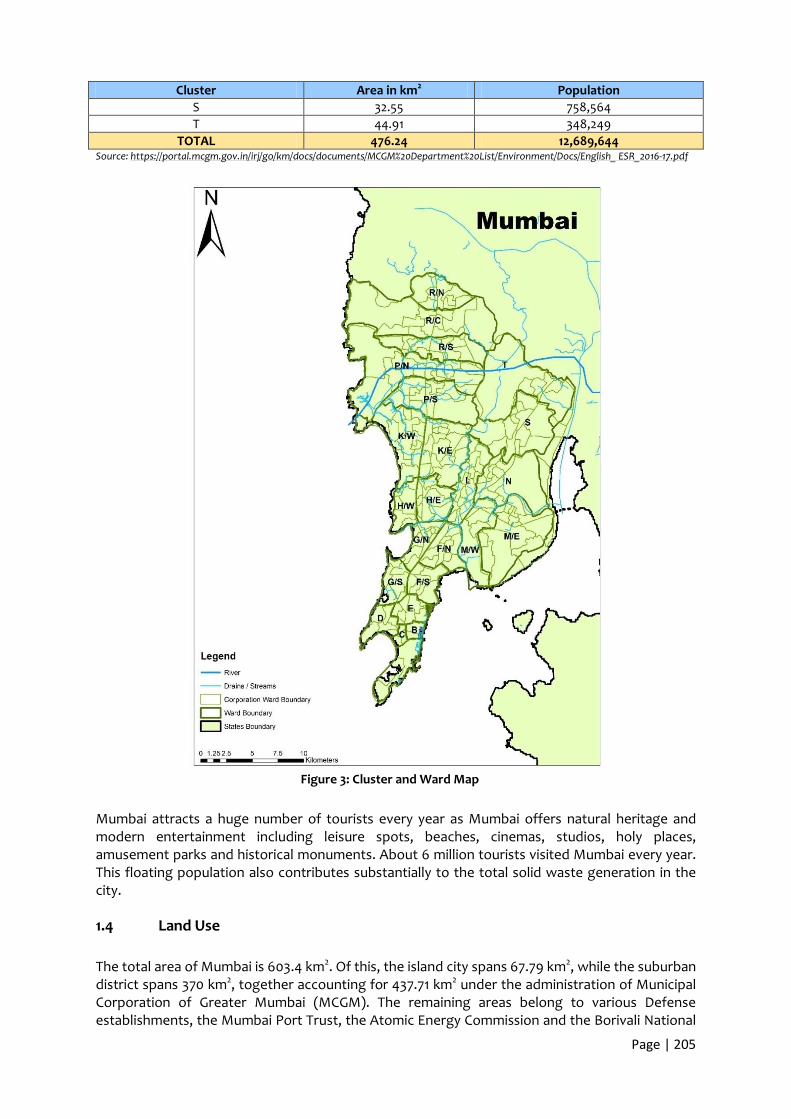
Page | 205
Cluster Area in km2 Population S 32.55 758,564 T 44.91 348,249
TOTAL 476.24 12,689,644 Source: https://portal.mcgm.gov.in/irj/go/km/docs/documents/MCGM%20Department%20List/Environment/Docs/English_ ESR_2016-17.pdf
Figure 3: Cluster and Ward Map
Mumbai attracts a huge number of tourists every year as Mumbai offers natural heritage and modern entertainment including leisure spots, beaches, cinemas, studios, holy places, amusement parks and historical monuments. About 6 million tourists visited Mumbai every year. This floating population also contributes substantially to the total solid waste generation in the city.
1.4 Land Use
The total area of Mumbai is 603.4 km2. Of this, the island city spans 67.79 km2, while the suburban district spans 370 km2, together accounting for 437.71 km2 under the administration of Municipal Corporation of Greater Mumbai (MCGM). The remaining areas belong to various Defense establishments, the Mumbai Port Trust, the Atomic Energy Commission and the Borivali National

Page | 206
Park, which are out of the jurisdiction of the MCGM. The Mumbai Metropolitan Region which includes portions of Thane, Palghar and Raigad districts in addition to Greater Mumbai, covers an area of 4,355 km2 (45828 Ha) Existing Land use distribution for Greater Mumbai (2012) is presented in Table 3, while the breakup is shown in Figure 4 given below. The analysis reveals that 65.3% (271.17sqkm) of the Planning Area of Greater Mumbai is developed, while natural areas, vacant lands, plantation & salt pans constitute the remaining 34.7%. Of this developed area, 24.9% is occupied by Residential use, 5.4% by Industrial uses, 2.2% by Commercial uses and 0.9% by Offices. Amenities (Education, Medical, and Social Amenities) constitute 3.69%, open space 3.7% and Public Utilities & facilities 1.7%. Transport and Communication facilities constitute 12.8%. Together 21.9% of the developed area is under Amenities, Open Space, Public Utilities and Transport.
Table 3: Existing land use distribution for Greater Mumbai (2012)
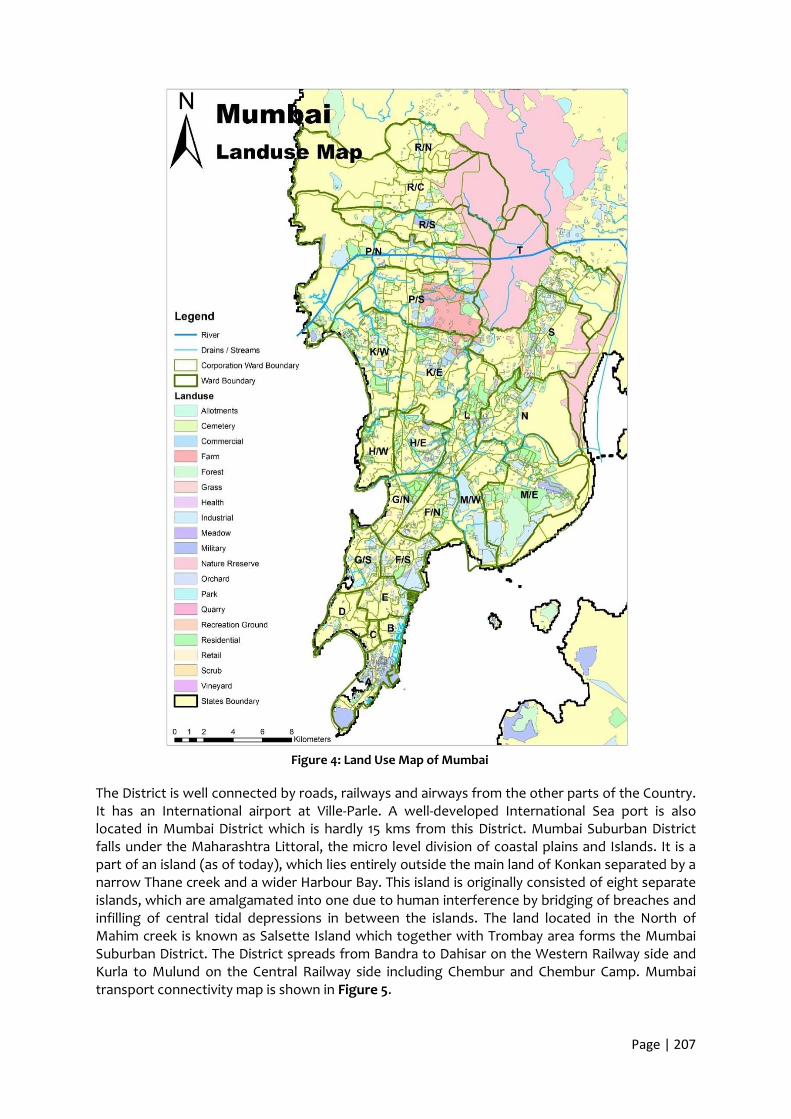
Page | 207
Figure 4: Land Use Map of Mumbai
The District is well connected by roads, railways and airways from the other parts of the Country. It has an International airport at Ville-Parle. A well-developed International Sea port is also located in Mumbai District which is hardly 15 kms from this District. Mumbai Suburban District falls under the Maharashtra Littoral, the micro level division of coastal plains and Islands. It is a part of an island (as of today), which lies entirely outside the main land of Konkan separated by a narrow Thane creek and a wider Harbour Bay. This island is originally consisted of eight separate islands, which are amalgamated into one due to human interference by bridging of breaches and infilling of central tidal depressions in between the islands. The land located in the North of Mahim creek is known as Salsette Island which together with Trombay area forms the Mumbai Suburban District. The District spreads from Bandra to Dahisar on the Western Railway side and Kurla to Mulund on the Central Railway side including Chembur and Chembur Camp. Mumbai transport connectivity map is shown in Figure 5.

Page | 208
Figure 5: Mumbai city Transportation connectivity map
1.5 Tourism in Mumbai Mumbai is one of the key tourist destinations attracting tourists from all over the world. Famously known as the City of Dreams, Mumbai formerly known as Bombay is a beautifully blended melting pot of cultures and lifestyles. The city soaks in everything into its fabric, making it its very own. From upcoming actors struggling to make it big on the silver screen; from Bollywood superstars to big industrialists to tribes of fisherman and slum dwellers, Mumbai is a city that proudly boasts of stories from different walks of human survival. The Mumbai city currently has many tourist spots such as Gateway of India, Marine Drive, Haji Ali, Sidhivinayak temple, Elephanta Caves, JuhuChowpatty Beach, Hanging Garden, Nehru Planetarium, Malabar Hill and many more.
1.6 Natural Economic Resources 1) Forestry The National park on the Northern outskirts of the Western Suburb of the District is the only existing forest in the vicinity of the city. Some pockets of forests are also visible in the catchment

Page | 209
areas of Tulsi, Vihar and Powai lakes. Earlier there used to be considerable vegetation growth in many parts. Now the immense growth of urbanization and industrialisation has reduced the forest cover of the city. 2) Minerals and mining No minerals of economic importance are found in the Mumbai area except some deposits of bauxite in the laterite plateau, East of Kanheri Caves.
3) Soil and Cropping pattern The soil is essentially derived from the Deccan trap, which cover the entire area covering Mumbai. Initially substantial area was under cultivation with rice, coconut and vegetables etc. 4) Agriculture As per 2011 Census, 0.4 percent of the total workers are engaged as cultivators and 0.67 percent of the total workers are engaged as agricultural labourers in the District. Therefore, agriculture is very less practised in the district. 5) Fisheries Marine fishery is an important economic activity of the District. The Mumbai Suburban District has a number of fishing villages all along the coast, where fishing is carried out between September and May. Versova is an important centre of fishing activities in the District. 6) Industry Mumbai Suburban is one of the most industrially advanced and developed districts in the State. All types of major industries like cotton, steel, oil, chemicals, fertilizers, pharmaceuticals, oil refinery, manufacturing of machinery and equipment etc. are located in this District.
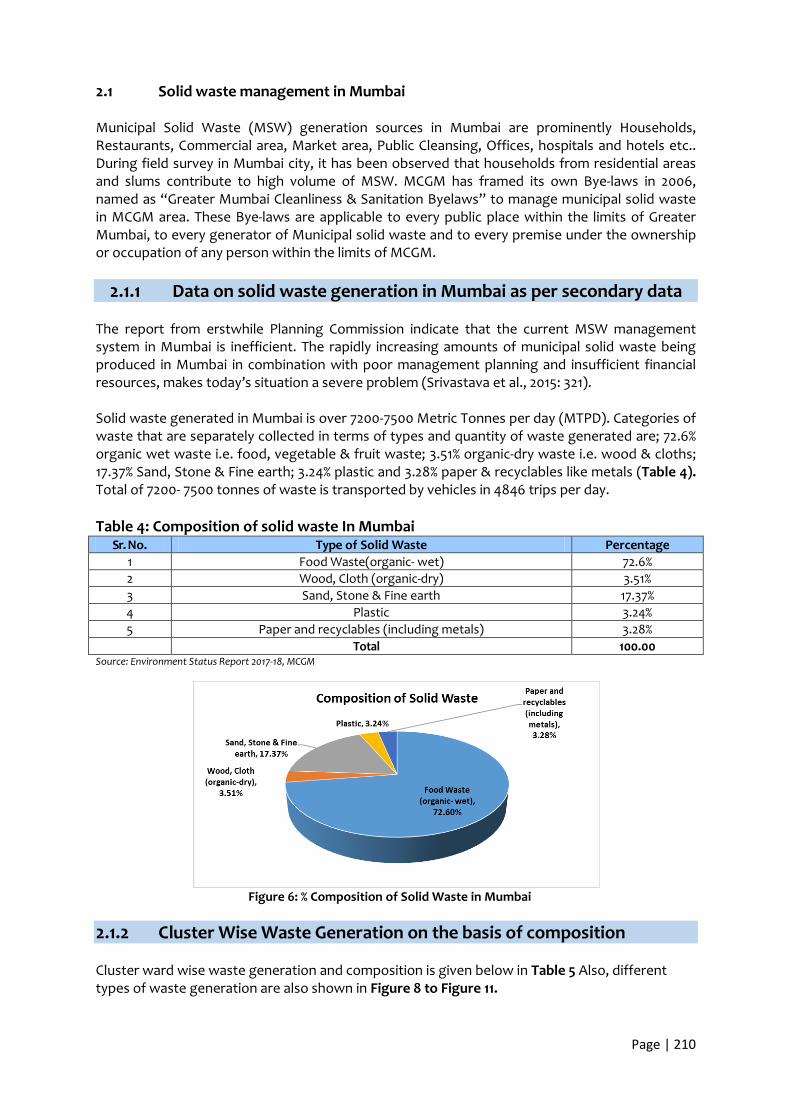
Page | 210
2.1 Solid waste management in Mumbai Municipal Solid Waste (MSW) generation sources in Mumbai are prominently Households, Restaurants, Commercial area, Market area, Public Cleansing, Offices, hospitals and hotels etc.. During field survey in Mumbai city, it has been observed that households from residential areas and slums contribute to high volume of MSW. MCGM has framed its own Bye-laws in 2006, named as “Greater Mumbai Cleanliness & Sanitation Byelaws” to manage municipal solid waste in MCGM area. These Bye-laws are applicable to every public place within the limits of Greater Mumbai, to every generator of Municipal solid waste and to every premise under the ownership or occupation of any person within the limits of MCGM.
2.1.1 Data on solid waste generation in Mumbai as per secondary data The report from erstwhile Planning Commission indicate that the current MSW management system in Mumbai is inefficient. The rapidly increasing amounts of municipal solid waste being produced in Mumbai in combination with poor management planning and insufficient financial resources, makes today’s situation a severe problem (Srivastava et al., 2015: 321). Solid waste generated in Mumbai is over 7200-7500 Metric Tonnes per day (MTPD). Categories of waste that are separately collected in terms of types and quantity of waste generated are; 72.6% organic wet waste i.e. food, vegetable & fruit waste; 3.51% organic-dry waste i.e. wood & cloths; 17.37% Sand, Stone & Fine earth; 3.24% plastic and 3.28% paper & recyclables like metals (Table 4). Total of 7200- 7500 tonnes of waste is transported by vehicles in 4846 trips per day. Table 4: Composition of solid waste In Mumbai
Sr. No. Type of Solid Waste Percentage 1 Food Waste(organic- wet) 72.6% 2 Wood, Cloth (organic-dry) 3.51% 3 Sand, Stone & Fine earth 17.37% 4 Plastic 3.24% 5 Paper and recyclables (including metals) 3.28% Total 100.00
Source: Environment Status Report 2017-18, MCGM
Figure 6: % Composition of Solid Waste in Mumbai
2.1.2 Cluster Wise Waste Generation on the basis of composition Cluster ward wise waste generation and composition is given below in Table 5 Also, different types of waste generation are also shown in Figure 8 to Figure 11.

Page | 211
Table 5: Cluster Ward Wise waste Generation & composition in Mumbai
Cluster Population Total waste generation
Food Waste
Wood & cloth
Sand stone & fine earth Plastic Paper &
recyclables A 188,691 103.78 75.76 3.11 17.64 3.11 4.15 B 129,820 71.40 52.12 2.14 12.14 2.14 2.86 C 169,463 93.20 68.04 2.80 15.84 2.80 3.73 D 353,759 194.57 142.03 5.84 33.08 5.84 7.78 E 401,102 220.61 161.04 6.62 37.50 6.62 8.82
F/N 539,548 296.75 216.63 8.90 50.45 8.90 11.87 F/S 368,146 202.48 147.81 6.07 34.42 6.07 8.10 G/N 610,944 336.02 245.29 10.08 57.12 10.08 13.44 G/S 385,256 211.89 154.68 6.36 36.02 6.36 8.48 H/E 568,313 312.57 228.18 9.38 53.14 9.38 12.50 H/W 313,694 172.53 125.95 5.18 29.33 5.18 6.90 K/E 840,258 462.14 337.36 13.86 78.56 13.86 18.49 K/W 763,567 419.96 306.57 12.60 71.39 12.60 16.80
L 920,155 506.09 369.44 15.18 86.03 15.18 20.24 M/E 823,772 453.07 330.74 13.59 77.02 13.59 18.12 M/W 420,079 231.04 168.66 6.93 39.28 6.93 9.24
N 635,231 349.38 255.05 10.48 59.39 10.48 13.98 P/S 960,074 528.04 385.47 15.84 89.77 15.84 21.12 P/N 472,718 259.99 189.80 7.80 44.20 7.80 10.40 R/C 573,334 315.33 230.19 9.46 53.61 9.46 12.61 R/N 439,941 241.97 176.64 7.26 41.13 7.26 9.68 R/S 704,966 387.73 283.04 11.63 65.91 11.63 15.51 S 758,564 417.21 304.56 12.52 70.93 12.52 16.69 T 348,249 191.54 139.82 5.75 32.56 5.75 7.66
TOTAL 12,689,644 6979.30 5094.89 209.38 1186.48 209.38 279.17
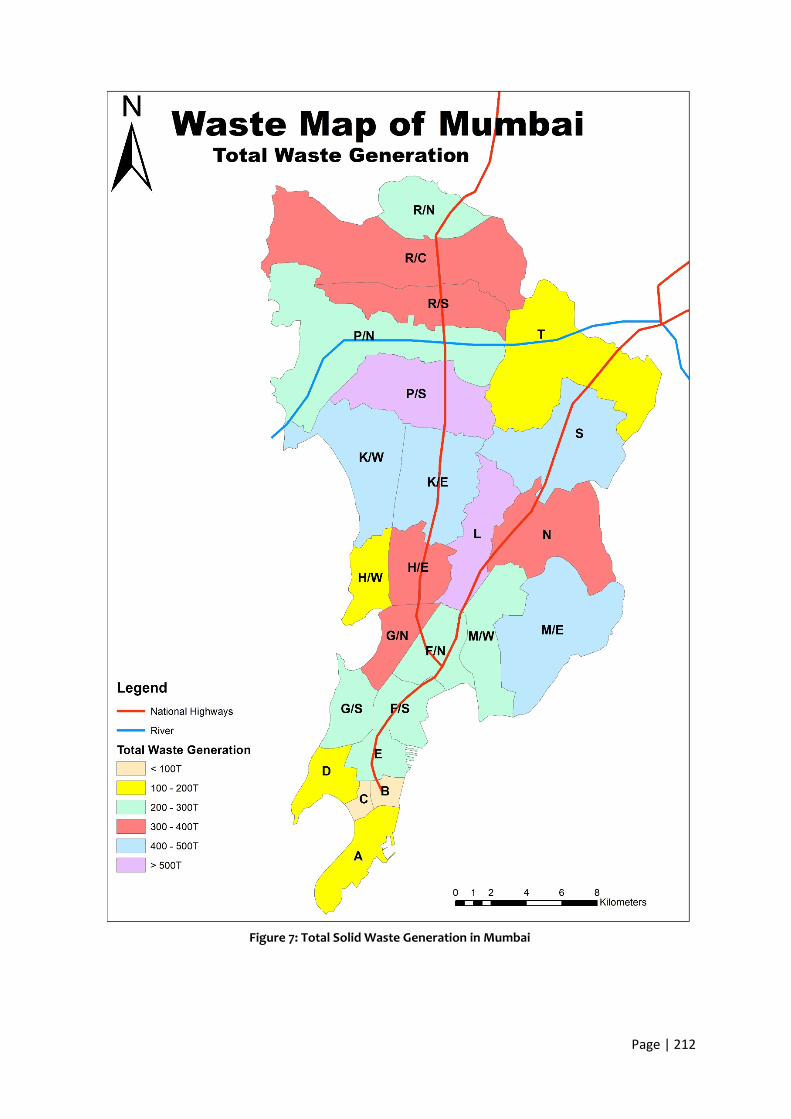
Page | 212
Figure 7: Total Solid Waste Generation in Mumbai

Page | 213
Figure 8: Paper & Recyclables Waste Generation in
Mumbai Figure 9: Plastic Waste Generation in Mumbai
Figure 10: Sandstone & Fine Earth Waste Generation in
Mumbai Figure 11: Wood & Cloth Waste Generation in Mumbai
2.1.3 Household Waste
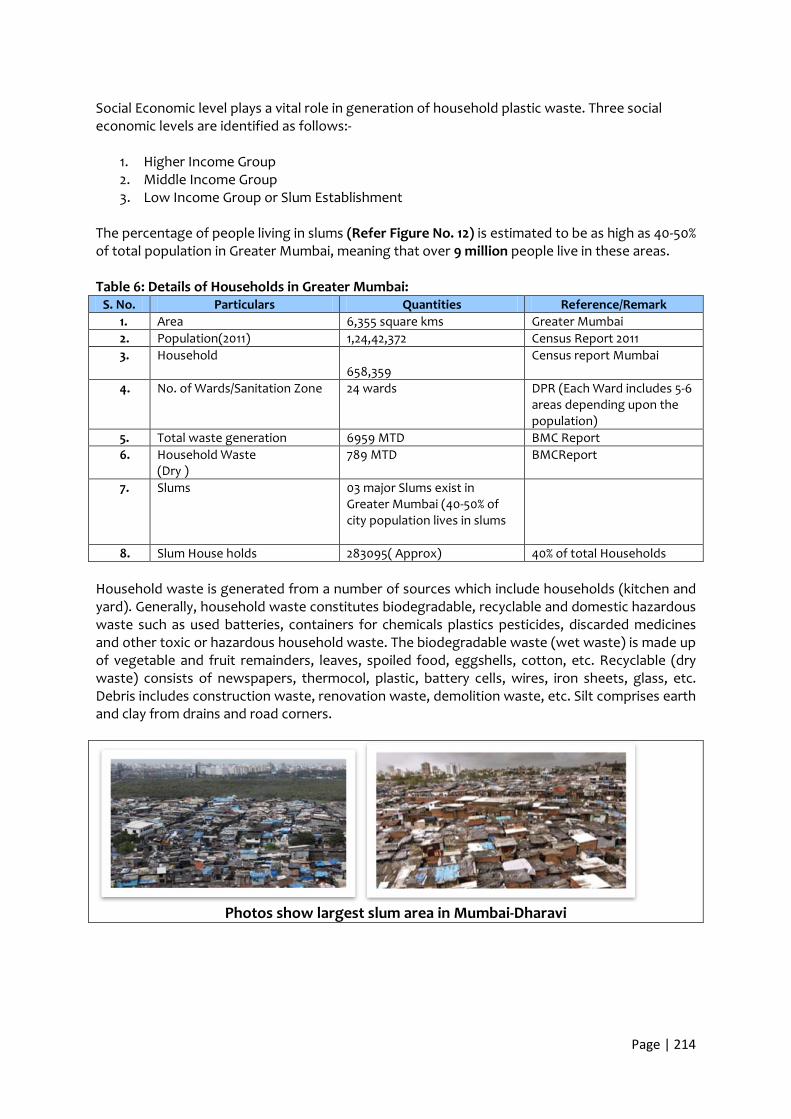
Page | 214
Social Economic level plays a vital role in generation of household plastic waste. Three social economic levels are identified as follows:-
1. Higher Income Group 2. Middle Income Group 3. Low Income Group or Slum Establishment
The percentage of people living in slums (Refer Figure No. 12) is estimated to be as high as 40-50% of total population in Greater Mumbai, meaning that over 9 million people live in these areas.
Table 6: Details of Households in Greater Mumbai:
S. No. Particulars Quantities Reference/Remark 1. Area 6,355 square kms Greater Mumbai 2. Population(2011) 1,24,42,372 Census Report 2011 3. Household
658,359 Census report Mumbai
4. No. of Wards/Sanitation Zone 24 wards DPR (Each Ward includes 5-6 areas depending upon the population)
5. Total waste generation 6959 MTD BMC Report 6. Household Waste
(Dry ) 789 MTD
BMCReport
7. Slums 03 major Slums exist in Greater Mumbai (40-50% of city population lives in slums
8. Slum House holds 283095( Approx) 40% of total Households Household waste is generated from a number of sources which include households (kitchen and yard). Generally, household waste constitutes biodegradable, recyclable and domestic hazardous waste such as used batteries, containers for chemicals plastics pesticides, discarded medicines and other toxic or hazardous household waste. The biodegradable waste (wet waste) is made up of vegetable and fruit remainders, leaves, spoiled food, eggshells, cotton, etc. Recyclable (dry waste) consists of newspapers, thermocol, plastic, battery cells, wires, iron sheets, glass, etc. Debris includes construction waste, renovation waste, demolition waste, etc. Silt comprises earth and clay from drains and road corners.
Photos show largest slum area in Mumbai-Dharavi

Page | 215
Photo indicates that this area is
densely populated so, it is inaccessible for BMC Waste collection vehicles to
reach out in these Slum Areas
Photo indicates that no Proper door to door collection Facility Available in Slum Areas So
People Dump Waste directly into Water Bodies
Photo indicates that thin Layer of
Plastic Litter Clogged into drainage passing through slum areas
Photo indicates that Railway Track near Mahim
area where slum dwellers throw Dry waste directly
Figure 12: Some identified Slum Areas in Mumbai 2.1.4 Market Waste Generally, Market waste constitute waste from vegetable & Fruit Shop, Meat & Fish Shop, Bakery & Sweet Shop, Shop/Tea Shop and Juice Shop. Prominent market areas in greater Mumbai are Crawford Market (Mahatma Jyotiba Phule Market) near CSMT Station, Dadar, Byculla vegetable market etc where all biodegradable waste as well as dry waste is generated on a daily basis. It has been observed that maximum waste generated from market places is prominently biodegradable waste (Figure 13).
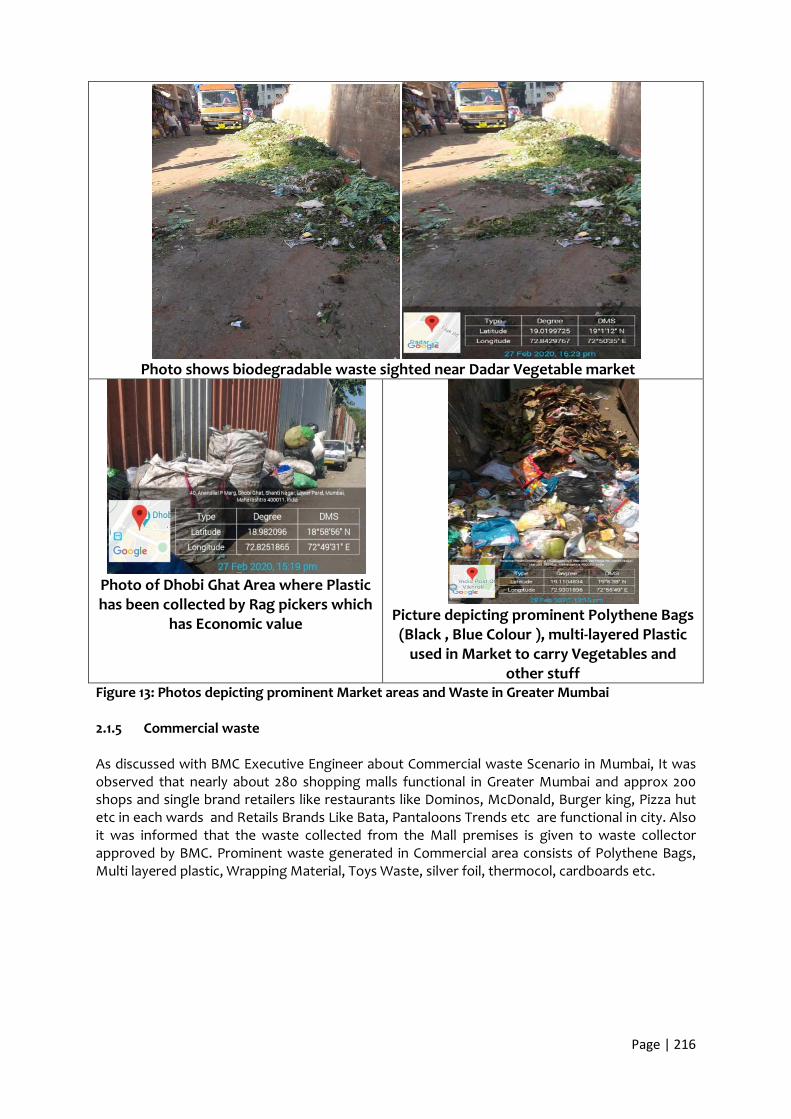
Page | 216
Photo shows biodegradable waste sighted near Dadar Vegetable market
Photo of Dhobi Ghat Area where Plastic has been collected by Rag pickers which
has Economic value
Picture depicting prominent Polythene Bags (Black , Blue Colour ), multi-layered Plastic
used in Market to carry Vegetables and other stuff
Figure 13: Photos depicting prominent Market areas and Waste in Greater Mumbai 2.1.5 Commercial waste As discussed with BMC Executive Engineer about Commercial waste Scenario in Mumbai, It was observed that nearly about 280 shopping malls functional in Greater Mumbai and approx 200 shops and single brand retailers like restaurants like Dominos, McDonald, Burger king, Pizza hut etc in each wards and Retails Brands Like Bata, Pantaloons Trends etc are functional in city. Also it was informed that the waste collected from the Mall premises is given to waste collector approved by BMC. Prominent waste generated in Commercial area consists of Polythene Bags, Multi layered plastic, Wrapping Material, Toys Waste, silver foil, thermocol, cardboards etc.
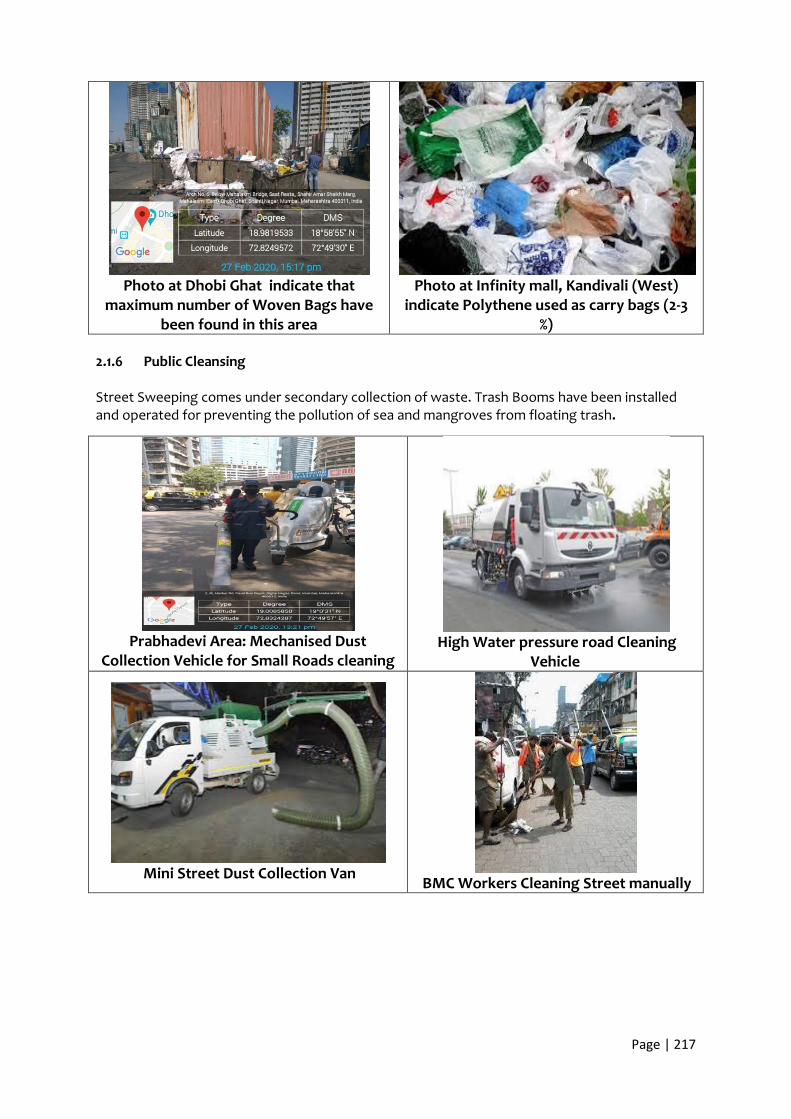
Page | 217
Photo at Dhobi Ghat indicate that
maximum number of Woven Bags have been found in this area
Photo at Infinity mall, Kandivali (West)
indicate Polythene used as carry bags (2-3 %)
2.1.6 Public Cleansing Street Sweeping comes under secondary collection of waste. Trash Booms have been installed and operated for preventing the pollution of sea and mangroves from floating trash.
Prabhadevi Area: Mechanised Dust
Collection Vehicle for Small Roads cleaning
High Water pressure road Cleaning
Vehicle
Mini Street Dust Collection Van
BMC Workers Cleaning Street manually

Page | 218
2.1.7 Industrial Waste Mumbai is the commercial and entertainment capital of India, it is also one of the world's top 10 centres of commerce in terms of global financial flow, generating 5% of India's GDP, and accounting for 25% of industrial output, 70% of maritime trade in India (Mumbai Port Trust &JNPT), and 70% of capital transactions to India's economy. The city also houses India's Hindi (Bollywood) and Marathi film and television industry. As informed by the officials of BMC during field visit, all the Industrial area comes under the jurisdiction of Maharashtra Industrial Development Cooperation (MIDC).so as such no waste collection data was available with the BMC officials as no industrial area is covered by BMC in Greater Mumbai. MIDC caters to waste management services in industrial areas through their own vendors. During field visit to some Industrial areas nearby to Mumbai city (Thane, Panvel which includes areas like Marol, Dombivali, Airoli Knowledge Park etc.) packaging material and woven bags were found to be littered in significant amount near River side. 2.2 Collection and Transportation of Municipal Solid Waste Collection of municipal solid waste is carried out through door to door collection and community bins placed near residential areas. As discussed with the officials of Municipal Cooperation of Greater Mumbai (BMC), there are 24 existing wards. Each ward includes 5-6 areas depending upon the Population and managed by BMC. Each ward has door to door Collection as per Waste management rule 2016. Some of the waste collection mechanism is shown in Figure 14. Each ward has its separate vehicles for collection of Wet (biodegradable) and Dry (Non- biodegradable) waste. Transport facilities provided in each ward for waste collection are given below.
Side Loading Compactor- introduced for first time in India by MCGM
Trash Boom Machine for collection of Floating trash in rivers and mangroves
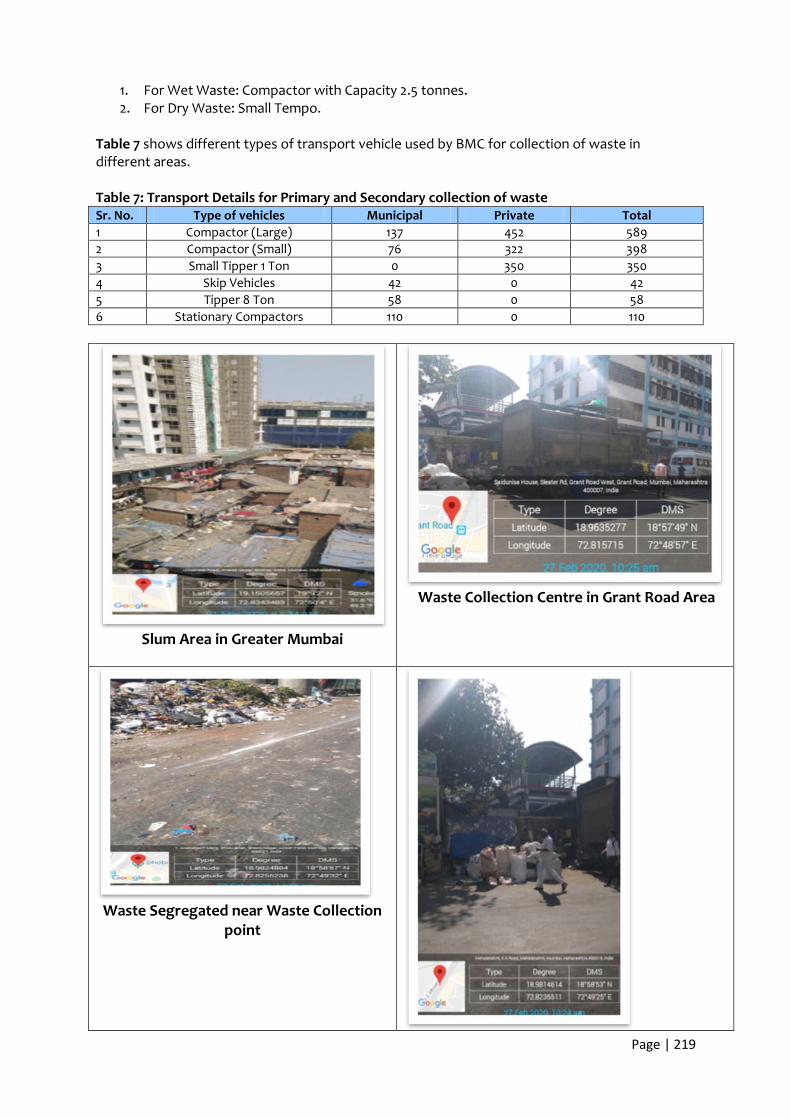
Page | 219
1. For Wet Waste: Compactor with Capacity 2.5 tonnes. 2. For Dry Waste: Small Tempo.
Table 7 shows different types of transport vehicle used by BMC for collection of waste in different areas. Table 7: Transport Details for Primary and Secondary collection of waste Sr. No. Type of vehicles Municipal Private Total 1 Compactor (Large) 137 452 589 2 Compactor (Small) 76 322 398 3 Small Tipper 1 Ton 0 350 350 4 Skip Vehicles 42 0 42 5 Tipper 8 Ton 58 0 58 6 Stationary Compactors 110 0 110
Slum Area in Greater Mumbai
Waste Collection Centre in Grant Road Area
Waste Segregated near Waste Collection
point

Page | 220
Community Dry Waste Collection Centre in Prabhadevi (G-South Ward)
Figure 14: Photos depicting Household areas and Community Bins in Greater Mumbai The collected waste is transported to Dry Waste Collection and Sorting Centres (DWCS) and transfer stations from where it is transported to treatment and dumping sites.
2.2.1 Dry Waste Collection & Sorting Centers
About 98.69% of total garbage is collected through House-to-House collection. The daily Municipal Solid Waste (MSW) is collected and transported by deploying various types of vehicles. There are 2574 no. of 1.1-cubic meter containers and 7 Dumper Placer containers kept at 941 community collection points in Mumbai. MCGM has set up 37 dry waste collection & sorting centers in 24 cluster wards. Other than these, MCGM has decided to set up 24 more dry waste collection & sorting centers and at some places work of setting up of additional dry waste centers is in progress. Separate 96 vehicles are deployed for collection and transportation of dry waste to dry waste sorting centers, in all the 24 wards of MCGM. Waste / Rag Pickers’ Associations are appointed to carry out the collection and segregation of dry waste. Dry Waste is segregated into paper, cardboard, thermacol, plastic, metal & glass and then sent to the recyclers for recycling directly by the rag pickers’ associations. Details of municipal dry waste collection in different wards are given below.
• Under BMC’s (Mumbai Municipal Corporation) control there are 46 DWSCs. • Currently, the DWSC are operated by associations of Rag pickers. They are provided 94
numbers of dedicated dry waste collection vehicles by MCGM for house to house collection and transportation of dry waste.
• The new compactors having separate provision for collection of Dry Waste unload the segregated dry waste at centres.
• Daily 200 MT of dry waste is received at DWSC. • In some dry waste sorting centres, there are baling, compressing and shredding facilities
of paper and plastic. • The revenue generated from the activity is kept by the rag pickers.
Examples of waste collected at DWSCs are given below. 1) Ghokhale Road Segregation Centre (Near Prabhadevi Area, Ward G-South): As It is a
household area, so maximum amount of cardboards and plastic Bottles are identified at this Centre, after Segregation. list of Dry Waste Identified at this Centre is given in Table 8.
Table 8: waste generation identified from Dry Waste Segregation Centre (DWSC) in Mumbai
Sr. No.
Type Of Waste Total Collection Per Day (in Kgs)
Recyclable Value In Rs/Kg
1. Plastic Bottles 12-15 Rs.11 2. Mix Plastic - - 3. Single layered Plastic 5-6 Rs.5-6 4. Multilayered Plastic 2-3 Rs.5-6 5. Milk Pouches 5-6 Rs.3-4 6. Hard Plastic(Shampoo etc) 1-2 Rs.3-4 7. Metal 10-11 Rs.15 8. Cardboards 15-20 Rs.11

Page | 221
9. Waste Paper 5-6 - 10. Disposal Waste (Cups, Plates etc.) 2-3 - 11. Woven Bags (Cement) 5-6 Rs.5 (each bag) 12. Packaging Bags 5-6 Rs.4
2) Sayani Road, Near ST bus Stop, Prabhadevi Area (Ward G-South): List of Dry Waste Identified
at this centre is given in Table 9. Table 9: Waste generation identified from Dry Waste Segregation Centre (DWSC) in Mumbai Sr. No. Type of Waste Total Collection Per Day
(in Kgs) Recyclable Value
In Rs/Kg 1. Plastic Bottles 18-20 Rs.12 2. Mix Plastic 12-15 Rs. 8 3. Milk Pouches 5-6 Rs.3-4 4. Hard Plastic (Shampoo,Oil bottles etc) 10-12 Rs.3-4 5. Metal 2-5 Rs.15 6. Cardboard Boxes 12-15 Rs.10 7. White Paper 12-15 Rs. 8 8. Mixed Paper 10-12 - 9. Tissue paper 10-15 Rs.10 10. Disposal Waste(Cups,Plates etc.) 2-3 - 11. Packaging Bags 5-6 Rs.4 12. Oil Cans 20-22 Piece Rs.25 Dry Waste Segregation Centre (DWSC) Report showing the quantity and composition of municipal solid waste for the month Nov-2019 for (46 Centres) in BMC area is given in Table 10 and shown in Figure 15. Table 10 indicate that glass bottles followed by paper including newspapers and cardboard and plastics both bottles and other recyclable recyclables constitute the maximum amount of waste, which gets segregated. Table 10: Dry Waste Generation and composition in Mumbai at DWSC (November 2019)
Dry Waste Generation in Mumbai (Monthly Report -November 2019) in - MT
Plas
tic B
ottle
s
Oth
er P
last
ic
Recy
clab
les
New
s Pa
per
Mix
ed P
aper
Boxe
s/Ca
rd B
oard
e-w
aste
Ther
moc
ol
Gla
ss B
ottl
es
Tins
Met
als
Clot
hs
Oth
er R
ecyc
labl
es
dry
was
te
Reject
sent to
Dumping Grou
nd
Tota
l Dry
Was
te
321 657 666 592 532 64 71 3410 94 188 181 636 861 8274

Page | 222
Figure 15: Dry Waste Generation in Mumbai (November 2019)
2.2.2 Transfer Station (ST) At present, there are four Refuse Transfer Stations viz. Mahalaxmi Refuse Transfer Station, Kurla Refuse Transfer Station, Versova Lagoon Transfer Station & Gorai Refuse Transfer Station in Mumbai. The MSW collected from nearby MCGM wards through small refuse vehicles are unloaded at Refuse Transfer Station and the said MSW is loaded in Big Close body Refuse vehicles and transported to Dumping Grounds / Landfill site for final disposal.
a. Gorai Refuse Transfer Station: It is having area of approx. 10000 sq.mt. and MSW of approx. 500 MT is handled daily.
b. Kurla Refuse Transfer Station: It is having area of approx. 3000 sq.mt. and MSW of approx. 700 MT is handled daily.
c. Versova Lagoon Transfer Station: It is having area of approx. 8000 sq.mt. and MSW of approx. 400 MT is handled daily.
d. Mahalaxmi Refuse Transfer Station: It is having area of approx. 14700 sq.mt. with modernized machinery and MSW of approx. 750 MT is handled daily (Figure 16)
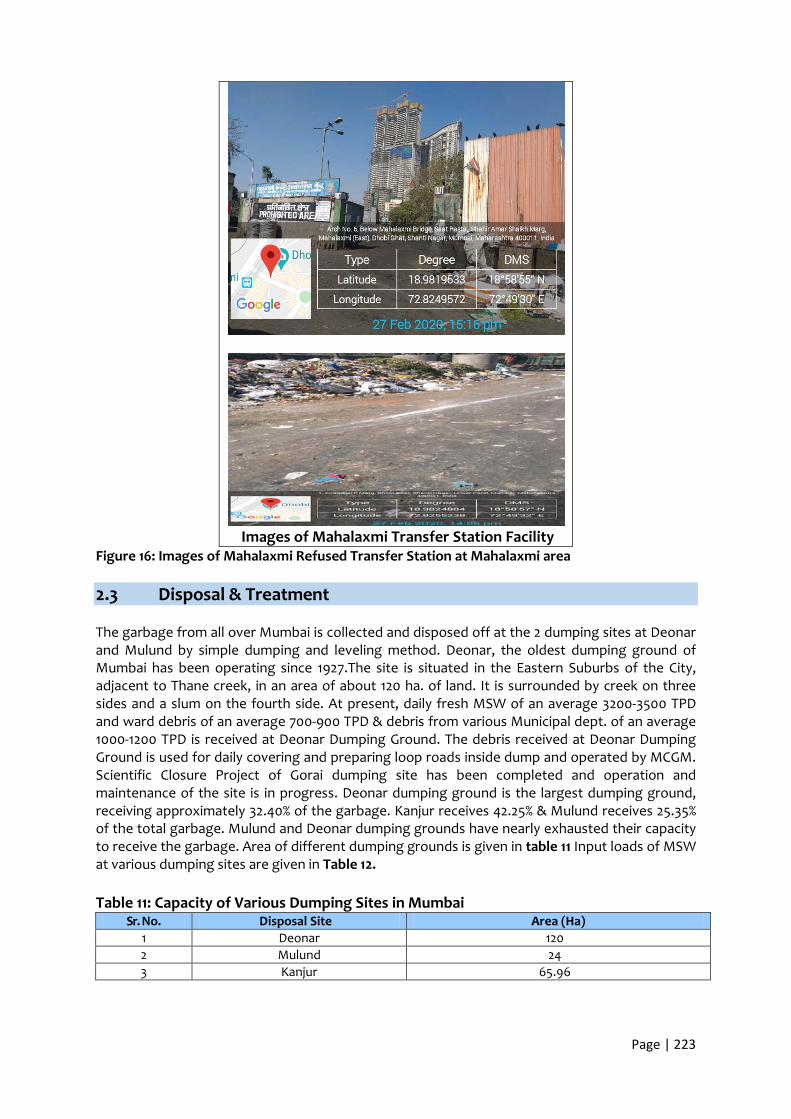
Page | 223
Images of Mahalaxmi Transfer Station Facility
Figure 16: Images of Mahalaxmi Refused Transfer Station at Mahalaxmi area 2.3 Disposal & Treatment The garbage from all over Mumbai is collected and disposed off at the 2 dumping sites at Deonar and Mulund by simple dumping and leveling method. Deonar, the oldest dumping ground of Mumbai has been operating since 1927.The site is situated in the Eastern Suburbs of the City, adjacent to Thane creek, in an area of about 120 ha. of land. It is surrounded by creek on three sides and a slum on the fourth side. At present, daily fresh MSW of an average 3200-3500 TPD and ward debris of an average 700-900 TPD & debris from various Municipal dept. of an average 1000-1200 TPD is received at Deonar Dumping Ground. The debris received at Deonar Dumping Ground is used for daily covering and preparing loop roads inside dump and operated by MCGM. Scientific Closure Project of Gorai dumping site has been completed and operation and maintenance of the site is in progress. Deonar dumping ground is the largest dumping ground, receiving approximately 32.40% of the garbage. Kanjur receives 42.25% & Mulund receives 25.35% of the total garbage. Mulund and Deonar dumping grounds have nearly exhausted their capacity to receive the garbage. Area of different dumping grounds is given in table 11 Input loads of MSW at various dumping sites are given in Table 12. Table 11: Capacity of Various Dumping Sites in Mumbai
Sr. No. Disposal Site Area (Ha) 1 Deonar 120 2 Mulund 24 3 Kanjur 65.96

Page | 224
Table 12: Input Load of Waste Sr. No. Dumping Ground Classification of Waste Tonnes/day (approx.)
1 Deonar Municipal Solid Waste 2200-2500 2 Mulund Municipal Solid Waste 1700-1800
3 Kanjur Debris 600
Municipal Solid Waste 3000 MCGM is responsible for operating the landfills and has emphasized on implementing a PPP framework for the landfill maintenance. Kanjur processing facility and landfill site (Figure 17) is the newest in Mumbai, with a developed Bioreactor landfill facility. The garbage is treated at Kanjur processing site using Bio-methenation Technology. It is also located along the Thane creek and has an area of 121 Ha. The site was handed over to the MCGM in 2003. The site has a capacity of 5000 to 5500 tonnes per day.
Figure 17: Google map showing Kanjur Landfill Site (Lat- 19.072055, Lomg-72.930054)
Kanjur facility has 1000 TPD of MSW treatment by windrow composting and 4000-4500 TPD of MSW treatment by way of bioreactor technology and composting. It is the first time a Bioreactor landfill Facilty (BLF) will be used in India. Currently, about 60% of the waste is being treated for producing RDF, while 30% is going for composting and the remaining 10% is being recycled under various streams. The process flow diagram is shown in Figure 18 and details of all the process steps involved are presented below:
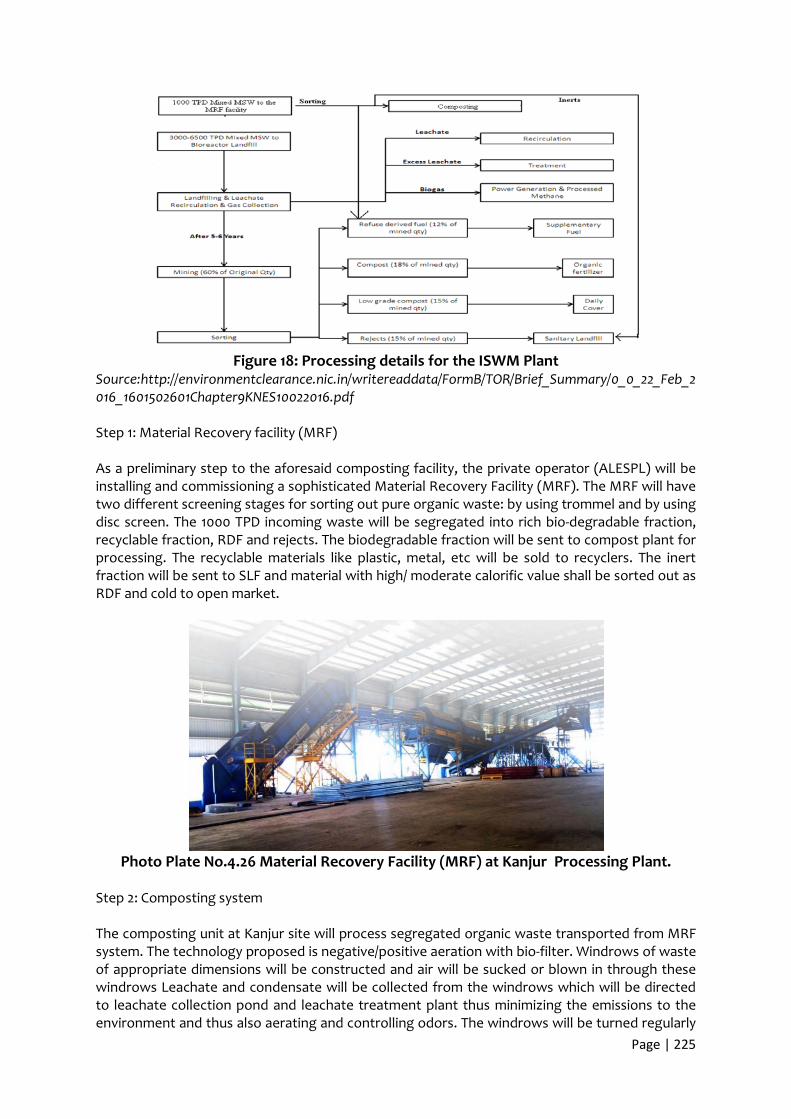
Page | 225
Figure 18: Processing details for the ISWM Plant
Source:http://environmentclearance.nic.in/writereaddata/FormB/TOR/Brief_Summary/0_0_22_Feb_2016_1601502601Chapter9KNES10022016.pdf Step 1: Material Recovery facility (MRF)
As a preliminary step to the aforesaid composting facility, the private operator (ALESPL) will be installing and commissioning a sophisticated Material Recovery Facility (MRF). The MRF will have two different screening stages for sorting out pure organic waste: by using trommel and by using disc screen. The 1000 TPD incoming waste will be segregated into rich bio-degradable fraction, recyclable fraction, RDF and rejects. The biodegradable fraction will be sent to compost plant for processing. The recyclable materials like plastic, metal, etc will be sold to recyclers. The inert fraction will be sent to SLF and material with high/ moderate calorific value shall be sorted out as RDF and cold to open market.
Photo Plate No.4.26 Material Recovery Facility (MRF) at Kanjur Processing Plant.
Step 2: Composting system The composting unit at Kanjur site will process segregated organic waste transported from MRF system. The technology proposed is negative/positive aeration with bio-filter. Windrows of waste of appropriate dimensions will be constructed and air will be sucked or blown in through these windrows Leachate and condensate will be collected from the windrows which will be directed to leachate collection pond and leachate treatment plant thus minimizing the emissions to the environment and thus also aerating and controlling odors. The windrows will be turned regularly

Page | 226
to further aid aeration. The entire composting process is expected to take about 7 - 8 weeks (depending on the weather conditions and waste characteristics). Step 3: Bioreactor landfill facility (BLF) About 3000 TPD to 6500 TPD of mixed municipal solid waste will be transported to the seven cells of the bioreactor landfill sequentially. The base of bioreactor landfill is constructed in a similar way as of a sanitary landfill with layers of Geosynthetic clay liners, HDPE liners, protection geotextile and drainage layer. A series of permeable trenches with blankets of geotextile and gravel will be laid at every 6-7 m of waste fill through which leachate will be recirculated into the cells using a specially designed network of pipes, valves and hydrant stations. 3.1 Plastic Waste Generation in Greater Mumbai 3.1.1 Source of Plastic Waste Plastic waste is found in the collected mixed municipal waste as shown in Figure 19.
Figure 19: Municipal dry waste collection in Maharashtra
Source: report on identifying market potential for recycle solid waste in Maharashtra Different Source of Plastic Waste Generation in Greater Mumbai are: (i) household Waste; (ii) Market Waste; (iii) Commercial waste; (iv) Public Cleansing and (v) Industrial Waste. As per secondary data, the Plastic Waste (PW) contribution in the total solid waste is approx. 3.24%. Earlier a study was carried out by CPCB “Assessment & Characterisation of Plastic Waste Generation in 60 Major Cities of India” in January 2015. As per the CPCB study report, Plastics- waste generation in Mumbai was about 62.81 Kg/MT out of total MSW waste of about 6500 MT/day. This was based on the field study in Mumbai, which was carried out in two dumpsite located at Mulund and Deoner and samples were collected on six days at these sites. The Average PW studied at the both dumpsites is reported in the Table 13 given below. Huge numbers of Rag pickers collect the valuable plastics waste like Polybags, PET Bottles, Sacks, Milk Pouches, rubber & Foam slippers etc at the dumpsite. Metalized pouches were not collected by rag pickers. The CPCB’s annual report indicates that the percentage of plastic contributing to the
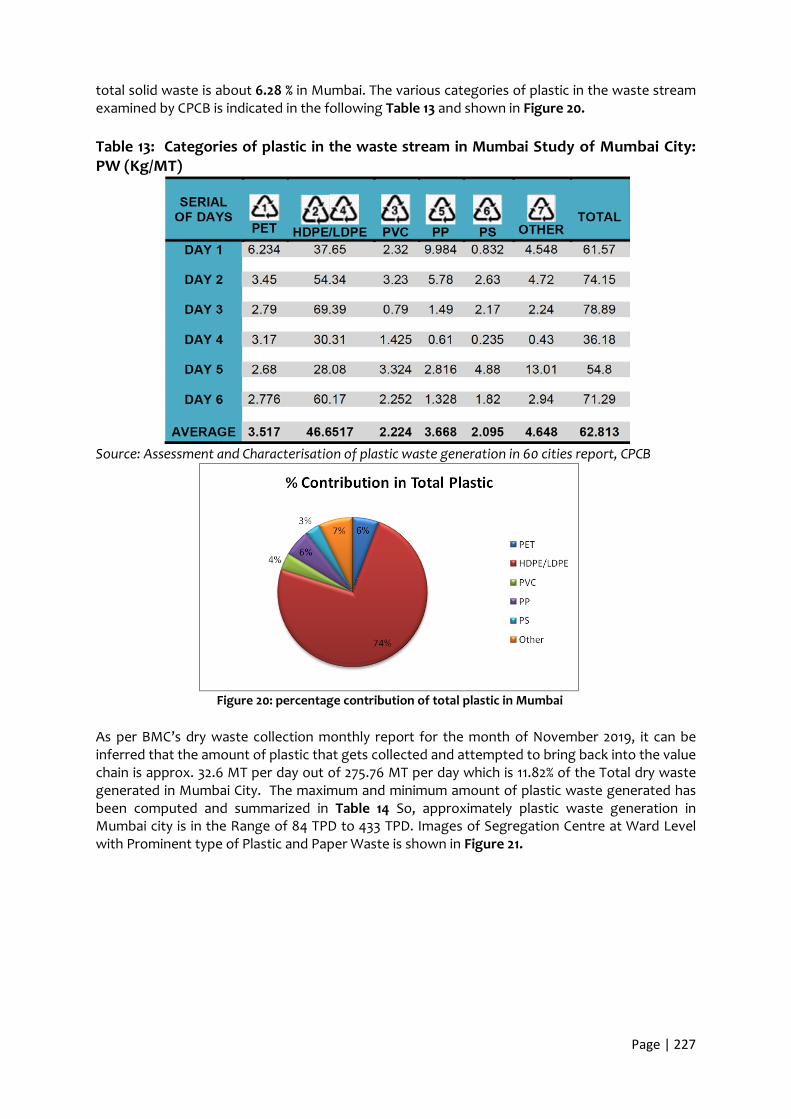
Page | 227
total solid waste is about 6.28 % in Mumbai. The various categories of plastic in the waste stream examined by CPCB is indicated in the following Table 13 and shown in Figure 20. Table 13: Categories of plastic in the waste stream in Mumbai Study of Mumbai City: PW (Kg/MT)
Source: Assessment and Characterisation of plastic waste generation in 60 cities report, CPCB
Figure 20: percentage contribution of total plastic in Mumbai
As per BMC’s dry waste collection monthly report for the month of November 2019, it can be inferred that the amount of plastic that gets collected and attempted to bring back into the value chain is approx. 32.6 MT per day out of 275.76 MT per day which is 11.82% of the Total dry waste generated in Mumbai City. The maximum and minimum amount of plastic waste generated has been computed and summarized in Table 14 So, approximately plastic waste generation in Mumbai city is in the Range of 84 TPD to 433 TPD. Images of Segregation Centre at Ward Level with Prominent type of Plastic and Paper Waste is shown in Figure 21.
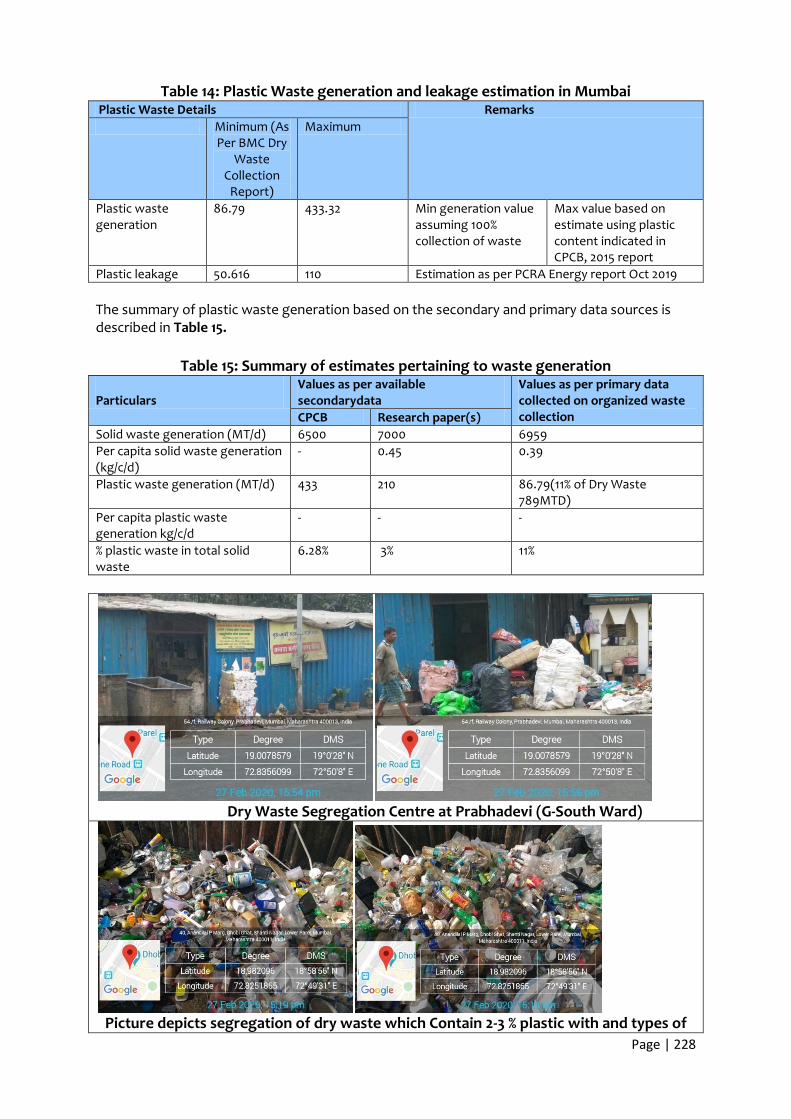
Page | 228
Table 14: Plastic Waste generation and leakage estimation in Mumbai Plastic Waste Details Remarks Minimum (As
Per BMC Dry Waste
Collection Report)
Maximum
Plastic waste generation
86.79 433.32 Min generation value assuming 100% collection of waste
Max value based on estimate using plastic content indicated in CPCB, 2015 report
Plastic leakage 50.616 110 Estimation as per PCRA Energy report Oct 2019 The summary of plastic waste generation based on the secondary and primary data sources is described in Table 15.
Table 15: Summary of estimates pertaining to waste generation Particulars
Values as per available secondarydata
Values as per primary data collected on organized waste collection CPCB Research paper(s)
Solid waste generation (MT/d) 6500 7000 6959 Per capita solid waste generation (kg/c/d)
- 0.45 0.39
Plastic waste generation (MT/d) 433 210 86.79(11% of Dry Waste 789MTD)
Per capita plastic waste generation kg/c/d
- - -
% plastic waste in total solid waste
6.28% 3% 11%
Dry Waste Segregation Centre at Prabhadevi (G-South Ward)
Picture depicts segregation of dry waste which Contain 2-3 % plastic with and types of

Page | 229
plastic waste
Waste Paper and Used Tissue papers which has economic value
Figure 21: Images of Segregation Centre with Prominent type of Plastic and Paper Waste 3.2 Identification of Hotspots A step wise approach has been adopted to identify the hotspots, which serve as source of plastic leakage into the river. This is based on IUCN’s approach for defining the plastic leakage as a function of loss rate and leakage rate. The various steps include identification of vulnerable areas using fuzzy logic approach adopted by GIC, AIT Thailand (Figure 21) and identification of leakage points (Figure 22) followed by field reconnaissance & verification (Figure 23) and cleanup activities. During the field survey at Mumbai, littering of solid waste comprising majority of plastic waste was observed in abundance. This was followed by discussion with MCGM/ BMC, which suggested hotspots, which were in line with predicted vulnerable areas. The major hotspots in Mumbai include:
• direct disposal of plastic waste into drains or into Mithi River from nearby slum
residents, • Littered on streets, nearby community bins in market area, on railway tracks etc.
finally finding its way into riverine ecosystem (Mithi River) and at last into the ocean (Arabian Sea) by various means.
• There are 186 outfall to the Arabian Sea which drains plastic mixed waste from the city. o 5 major outfalls in city which drain sewage mixed with plastic to Arabian Sea
directly, o 8 at Mahim creek and 12 at Mahul creek. o 29 outfalls in western suburbs draining directly into sea o 14 drain into Mithi River which ultimately joins Mahim creek. o In eastern suburbs, 14 outfalls discharge in Thane creek while six discharge in
Mahul creek and 8 into Mahim creek. • Out of 186 outfalls in Mumbai, 135 are above mean sea level but below the high tide
level, 46 outfalls below mean sea level. In addition, there is, a 2,000km roadside open drain system that are mostly clogged with plastic and waste. Only 6 outfalls are above high tide level.

Page | 230
Figure 22: Plastic Leakage Vulnerable Areas identified using Fuzzy Logic Approach
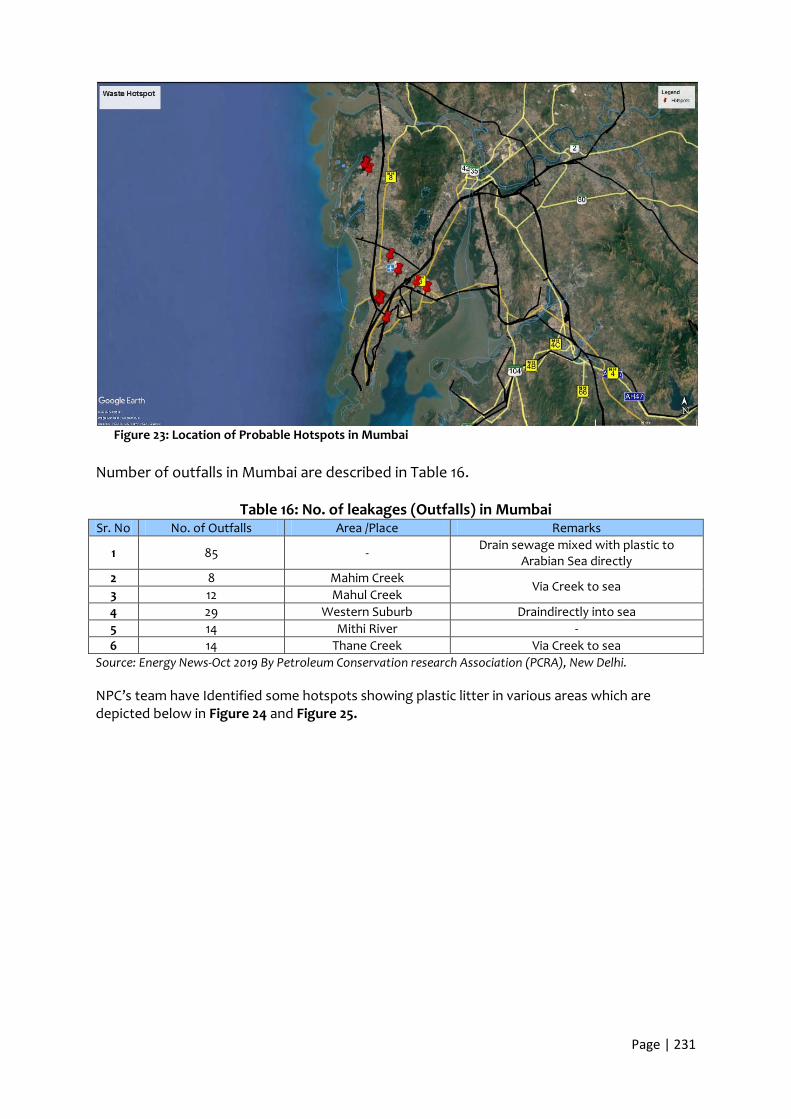
Page | 231
Figure 23: Location of Probable Hotspots in Mumbai
Number of outfalls in Mumbai are described in Table 16.
Table 16: No. of leakages (Outfalls) in Mumbai Sr. No No. of Outfalls Area /Place Remarks
1 85 - Drain sewage mixed with plastic to Arabian Sea directly
2 8 Mahim Creek Via Creek to sea
3 12 Mahul Creek 4 29 Western Suburb Draindirectly into sea 5 14 Mithi River - 6 14 Thane Creek Via Creek to sea
Source: Energy News-Oct 2019 By Petroleum Conservation research Association (PCRA), New Delhi.
NPC’s team have Identified some hotspots showing plastic litter in various areas which are depicted below in Figure 24 and Figure 25.
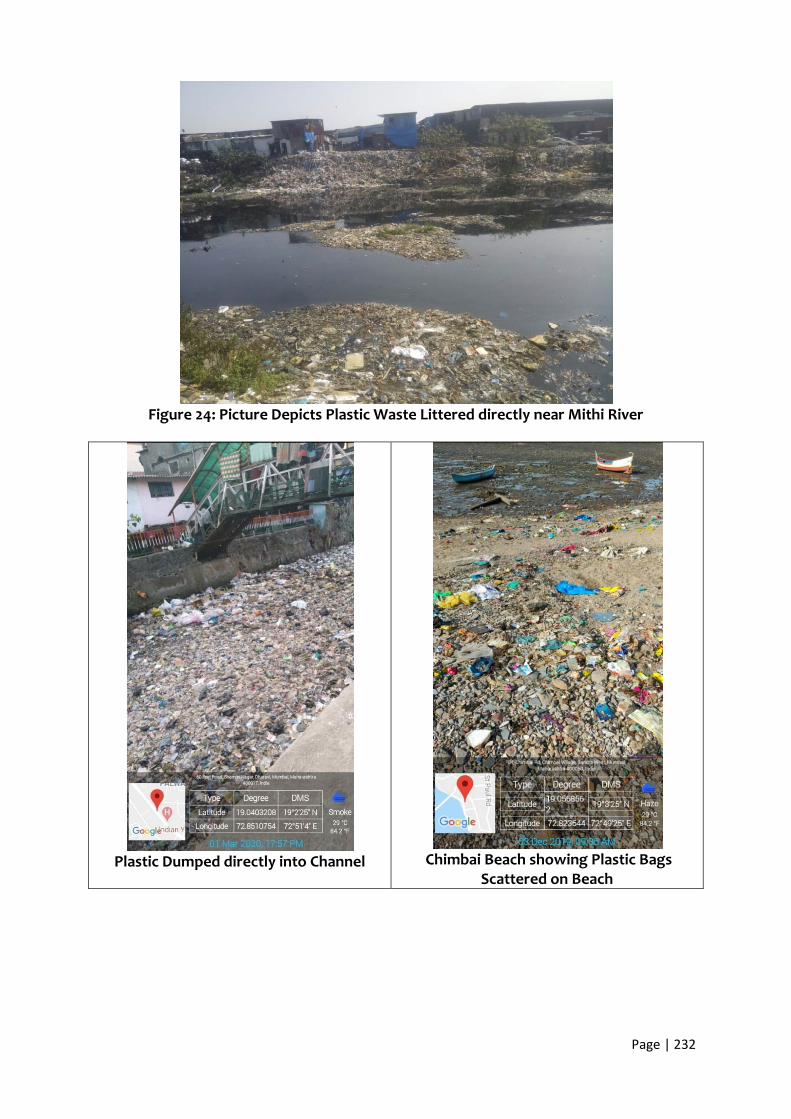
Page | 232
Figure 24: Picture Depicts Plastic Waste Littered directly near Mithi River
Plastic Dumped directly into Channel
Chimbai Beach showing Plastic Bags
Scattered on Beach

Page | 233
Gorai Clean-up Site-50% of Plastic found during the activity
Total beach Area taken for clean-up: 1000m Duration of Clean-up: 2 years Total Waste Collected : 9,50,000kgs No. of dumpers of Waste:95 Most Prominent Waste Category: Plastic Bags, Milk Packets, Footwear, Diapers Most prominent type of plastic was Plastic packaging and single use Plastic % of Plastic Waste : 90%
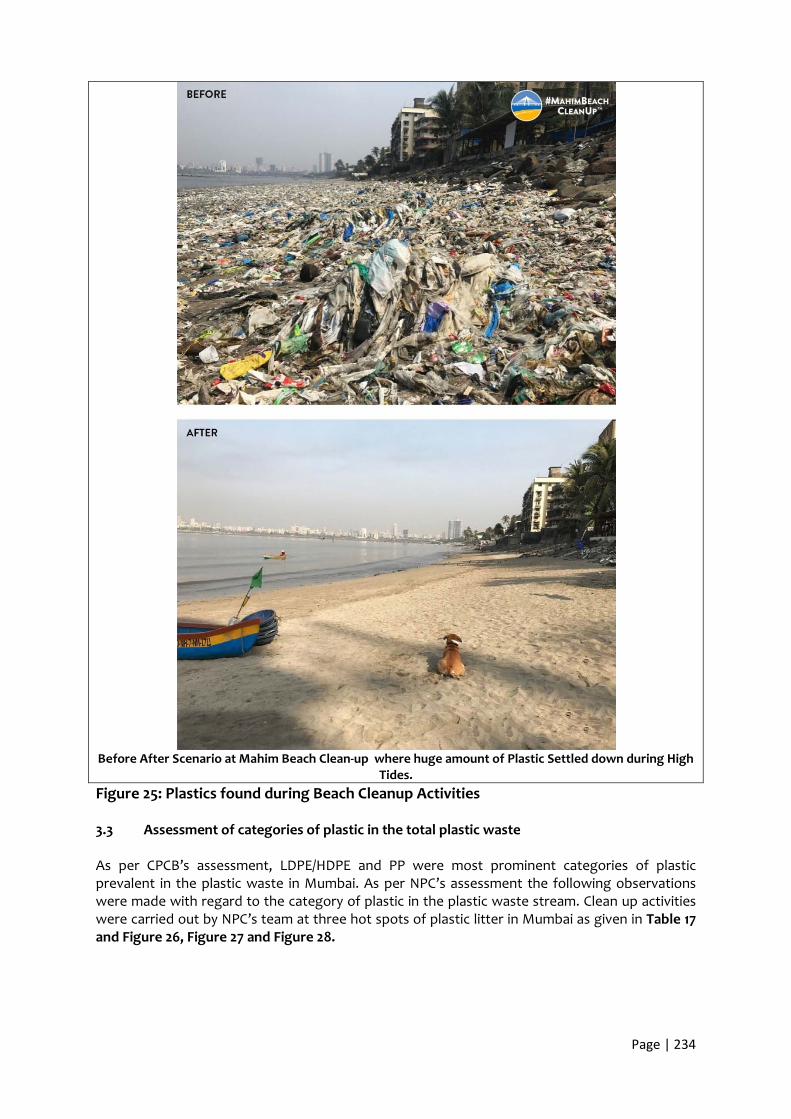
Page | 234
Before After Scenario at Mahim Beach Clean-up where huge amount of Plastic Settled down during High
Tides. Figure 25: Plastics found during Beach Cleanup Activities 3.3 Assessment of categories of plastic in the total plastic waste As per CPCB’s assessment, LDPE/HDPE and PP were most prominent categories of plastic prevalent in the plastic waste in Mumbai. As per NPC’s assessment the following observations were made with regard to the category of plastic in the plastic waste stream. Clean up activities were carried out by NPC’s team at three hot spots of plastic litter in Mumbai as given in Table 17 and Figure 26, Figure 27 and Figure 28.

Page | 235
Table 17: List of Hotspots with date
The cleanup activities indicated that amount of plastic that gets collected is approx. 25-35% of the total Trash collected during clean-up activity at various location in Mumbai City. The classification of plastics Waste collected during clean up drives is shown below. It can be inferred that majorly found plastic category in Mumbai clean-up site is Polythene bags and Multilayer packaging such as packaging of chips, namkeen, snacks etc.
Figure 26: Types of Plastic found in Clean-up at Gorai Creek, Mumbai
Figure 27: Types of Plastic found in Clean-up at Chimbai beach, Mumbai
S. No. Name of Hotspot Date of Clean-up activity undertaken 1 Gorai Creek (Near Gorai Bridge) 2nd march 2020
2 Chimbai Beach 3rd December 2019 3 Vashi Mangroves 2nd November 2019

Page | 236
Figure 28: Types of Plastic found in Clean-up at Vashi Mangroves, Mumbai
During physical observation at various hot spots the prominent plastic categories, which were found include Polythene Bags, Multilayer Plastic, Bottles and Disposable Cups and Plates (Figure 29).

Page | 237
Prominent Plastic Observed during Physical Observation at various hotspots
Figure 29: Prominent plastic waste as per physical observation at various hotspots
3.4 Plastic leakage scenario in Mumbai Plastic leakage scenario is shown in Figure 30, while plastic leakage from Households and commercial and market area is shown in Figure 31 and Figure 32. Salient features of plastic leakage into riverine and seas in Greater Mumbai area are given below.
• Mumbai dumps 50 – 110 TPD of plastic waste into drains and water channels, Main reason to plastics leakage into sea or river in Mumbai is government failure to install nets across storm water drains to collect waste from drain (nallahs) before they empty out.
• The Maharashtra Pollution Control Board (MPCB), in a follow-up affidavit, said creeks,
rivers and the sea along 21 Mumbai’s 437.71sqkm coastal stretch is under threat with plastic waste as a major source among municipal solid waste.
• Plastic directly enters into drain by the general public mainly from slums areas. Discharge
of untreated domestic waste accounts for 93% of the source of pollution for these water bodies.
• The unconcerned attitude of Mumbai people, especially those living near drains and
creeks has resulted in massive amounts of plastic waste, majority of which is single use plastic, being dumped into the natural water courses.
• Experts said the 2005 floods were as much a result of clogged open surface drains with
solid waste including plastic, storm water drains and its channels as it was due to significant changes in land use across the city and illegal construction and encroachments along natural drains and the Mithi river (Figure 33). City authorities should take measures to ensure that when heavy rainfall occurs, adequate drainage systems are in place and these are unclogged so that flooding does not occur in the vulnerable areas.
• A recent analysis by the Mumbai-based Veermata Jijabai Technological Institute (VJTI)
spanning 45 years showed that changing rainfall patterns, extensive concretisation, open drains along roads choked with plastic and other waste together with more than-a-
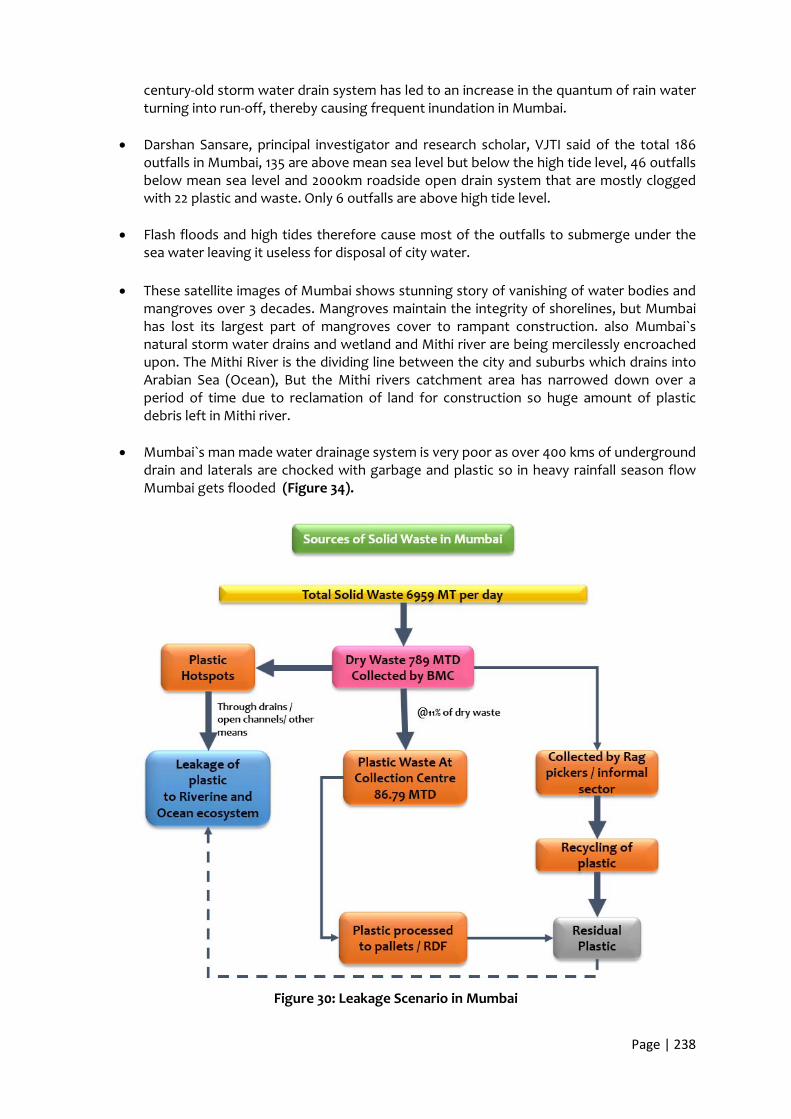
Page | 238
century-old storm water drain system has led to an increase in the quantum of rain water turning into run-off, thereby causing frequent inundation in Mumbai.
• Darshan Sansare, principal investigator and research scholar, VJTI said of the total 186
outfalls in Mumbai, 135 are above mean sea level but below the high tide level, 46 outfalls below mean sea level and 2000km roadside open drain system that are mostly clogged with 22 plastic and waste. Only 6 outfalls are above high tide level.
• Flash floods and high tides therefore cause most of the outfalls to submerge under the
sea water leaving it useless for disposal of city water.
• These satellite images of Mumbai shows stunning story of vanishing of water bodies and mangroves over 3 decades. Mangroves maintain the integrity of shorelines, but Mumbai has lost its largest part of mangroves cover to rampant construction. also Mumbai`s natural storm water drains and wetland and Mithi river are being mercilessly encroached upon. The Mithi River is the dividing line between the city and suburbs which drains into Arabian Sea (Ocean), But the Mithi rivers catchment area has narrowed down over a period of time due to reclamation of land for construction so huge amount of plastic debris left in Mithi river.
• Mumbai`s man made water drainage system is very poor as over 400 kms of underground
drain and laterals are chocked with garbage and plastic so in heavy rainfall season flow Mumbai gets flooded (Figure 34).
Figure 30: Leakage Scenario in Mumbai

Page | 239
Figure 31: Plastic Leakage Scenario from Households
Household
Urban with 100% door to door
collection
Urban Collection without daily door to door
collection
Dry waste
Biodegradable/Wet waste
Dry waste Segregation
Centres
Rag Pickers
Segregated Waste with Econimic
Value
Urban Household
Slums
Discharged In Open Channel in nearby
Slums
Some Areas Having Waste Collection
Points
Disposed In Mithi River
Open Street Littering
Landfill Station
MRF
Recycled Plastic
Remaning Waste
Bioreactor Landfill Facility
Open Street Litterenig
Littering Near Railway tracks
Muck Train Collect Waste on Western Line from Church gate to Virar(Approx.
60kms Patch)
Remaining is discharge in nearby Channels /Nallas
Collection From Wards
Landfill
Plastic Having Economic Value
Plastic Having No Ecomomic value
Recycled Plastic In EPR
Dry Waste Collection Centre
Discharged into Ocean
Hotspot
Discharged Into Mithi River
Remaining Waste
Recycling Plant
Littering by Wind
Discharged Into Ocean
Hotspot
Littering by Wind
Hotspot
Littering
Hotspot

Page | 240
Figure 32: Plastic Leakage Scenario from Market and Commercial Area
Door to door collection from
Market Daily
Direct dumping of waste into
community bins
Direct Dumping into drains
Street littering
Transfer Station
Market & Commercial Waste
(Shops, Hotel, Institutes, Restaurant, Vegetable
Market)
Mixed Waste
Formally segregated Dry waste goes into
MRF Facility
Mixed waste dump at Kanjur Landfill
Mithi River
Wet waste goes for Windrows composting
Informal collection of Dry by Rag
pickers
Littering on Road
Drain
Run off/Wind BlownLitteringLittering Littering
Littering
Run Off
Hotspot
Littering
Hotspot
Recycled PlasticRunoff/Wind Blown
Into Ocean via Esturies
Nearby Drains/Nallas
Runoff/Windblown
Runoff

Page | 241
Figure 33: Picture depicting shrinking catchment area of Mithi River
Drain Near Mankhurd Station (19°02'54.7"N 72°55'57.1"E)-Picture depicting plastic Clogged into
Drain
At Wadala Station (19°00'57.8"N 72°51'31.9"E) - Plastic Littered near Railway Track with
prominent Polythene Bags
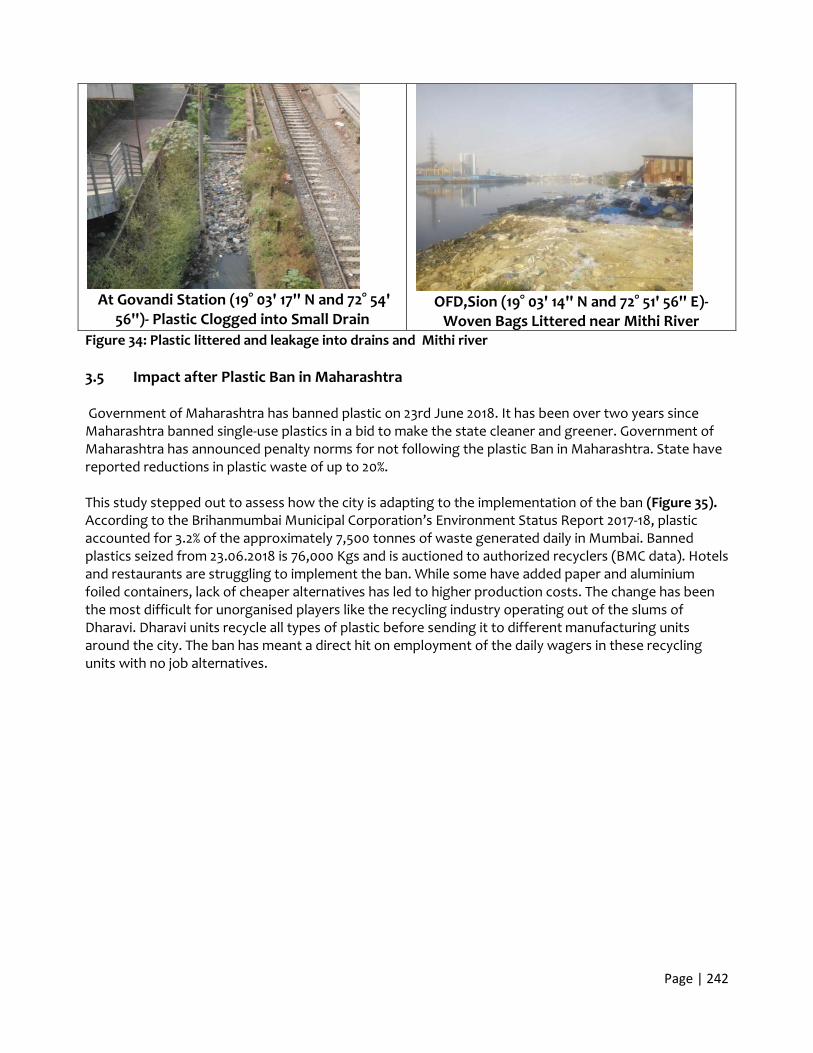
Page | 242
At Govandi Station (19° 03' 17'' N and 72° 54'
56'')- Plastic Clogged into Small Drain
OFD,Sion (19° 03' 14'' N and 72° 51' 56'' E)-
Woven Bags Littered near Mithi River Figure 34: Plastic littered and leakage into drains and Mithi river 3.5 Impact after Plastic Ban in Maharashtra Government of Maharashtra has banned plastic on 23rd June 2018. It has been over two years since Maharashtra banned single-use plastics in a bid to make the state cleaner and greener. Government of Maharashtra has announced penalty norms for not following the plastic Ban in Maharashtra. State have reported reductions in plastic waste of up to 20%. This study stepped out to assess how the city is adapting to the implementation of the ban (Figure 35). According to the Brihanmumbai Municipal Corporation’s Environment Status Report 2017-18, plastic accounted for 3.2% of the approximately 7,500 tonnes of waste generated daily in Mumbai. Banned plastics seized from 23.06.2018 is 76,000 Kgs and is auctioned to authorized recyclers (BMC data). Hotels and restaurants are struggling to implement the ban. While some have added paper and aluminium foiled containers, lack of cheaper alternatives has led to higher production costs. The change has been the most difficult for unorganised players like the recycling industry operating out of the slums of Dharavi. Dharavi units recycle all types of plastic before sending it to different manufacturing units around the city. The ban has meant a direct hit on employment of the daily wagers in these recycling units with no job alternatives.

Page | 243
Figure 35: A fruit stand in Mumbai displays a plccard informing shoppers about the new single-
use plastics ban that went into effect June 23, 2018

Page | 244
Reference:
• Assessment and Characterisation of plastic waste generationin 60 cities report, CPCB • Brihanmumbai Municipal Corporation (BMC) official Website • Development Plan for Greater Mumbai 2014-2034, Report on Preparatory Studies • District Census Handbook-Mumbai (Census Report -2011) • Environment Clearance report for BMC by Fine Envirotech Engineers ltd • Energy News-Oct 2019 By Petroleum Conservation research Association(PCRA),New
Delhi • Greater Mumbai Municipal Cooperation-Environment Status report 2016-17 • Greater Mumbai Municipal Cooperation (MSW monthly reports) • Maharashtra Pollution Control Board annual report • Municipal Solid Waste Management manual by CPHEEO • report on identifying market potential for recycle solid waste in Maharashtra • Urban Solid Waste Management in Mumbai- Minor Field Study by Yuri Joelsson and
Rebecca Lord
Related Documents