Materials Science and Engineering A 381 (2004) 1–15 Plastic deformation of Fe-Al polycrystals strengthened with Zr-containing Laves phases Part II. Mechanical properties A. Wasilkowska a,1 , M. Bartsch a , F. Stein b , M. Palm b , G. Sauthoff b , U. Messerschmidt a,∗ a Max-Planck-Institut für Mikrostrukturphysik, Weinberg 2, D-06120 Halle/Saale, Germany b Max-Planck-Institut für Eisenforschung, Max-Planck-Str.1, D-40074 Düsseldorf, Germany Received 22 August 2003; received in revised form 21 January 2004 Abstract Fe-10 at.% Al-2.5 at.% Zr and Fe-20 at.% Al-2.5 at.% Zr alloys were deformed between room temperature and 700 ◦ C. The materials show a flow stress plateau at about 300 MPa up to 600 ◦ C for the material with 10 at.% Al and above 600 MPa up to 400 ◦ C for the alloy with 20% Al. The high flow stresses compared to Fe-Al reference materials are partly due to the addition of Zr. The strain rate sensitivity of the flow stress was measured by stress relaxation and strain rate cycling tests. It is low up to 400 ◦ C and high between 450 and 600 ◦ C, i.e. in the range of the flow stress decrease. The microstructures of the undeformed materials are described in Part I of this paper. Micrographs of the deformed specimens taken in a high-voltage electron microscope reveal that the deformation occurs mainly within the soft Fe-Al grains and in the Fe-Al component of the grain boundary eutectic. The deformation data are interpreted in terms of solution hardening from the Al solute, dynamic strain ageing due to the Cottrell effect of the same defects, the athermal stress component of elastic dislocation interactions, the Hall–Petch contribution from the grain size, and the strengthening effect of the grain boundary layers. © 2004 Elsevier B.V. All rights reserved. Keywords: Fe-Al-Zr; Laves phase strengthening; Plastic deformation; Dislocation structure; Deformation mechanisms 1. Introduction The challenge to develop high-temperature materials with a good combination of strength and ductility has lead to a new class of structural materials: the Laves phase-strengthened intermetallics [1–3]. Within this class, the Tribaloys which contain large volume fractions of the Mo(Co, Si) 2 Laves phase have excellent wear and corrosion resistance [1]. In Ti–Nb–Cr alloys, (Ti, Nb)Cr 2 particles precipitate resulting in a high strength together with accept- able room-temperature toughness. The particles break dur- ing deformation with crack arrest at the phase boundaries [2]. For directionally solidified NiAl-Ta alloys, the room ∗ Corresponding author. Tel.: +49 345 5582 927; fax: +49 345 5511223. E-mail address: [email protected] (U. Messerschmidt). 1 Present address: TU München, Lehrstuhl für Materialwiss. und Mechanik, Boltzmannstr. 15, D-85748 Garching, Germany. temperature toughness of two-phase alloys with off-eutectic composition was similar to that of polycrystalline NiAl even though the brittle Laves phase NiAlTa was present [3]. Alloying Fe-rich aluminides with up to 25 at.% Zr benefits from the precipitation of Zr(Fe,Al) 2 Laves phases [4,5]. These materials retain a high room-temperature strength up to around 400 ◦ C [6]. In the present study, the deformation behaviour of ductile Fe-10Al-2.5Zr and Fe-20Al-2.5Zr al- loys (numbers indicate at.%) strengthened with Zr(Fe,Al) 2 Laves phases has been studied in more detail also with respect to the strain rate sensitivity of the flow stress and the relation to changes in the microstructure. Both alloys contain about 20 vol.% of a eutectic containing the Laves phase, which is precipitated along the matrix grain bound- aries. In addition, data for reference alloys Fe-10Al and Fe-20Al without Laves phase precipitates as well as for Fe-30Zr consisting mainly of the Laves phase are presented. Details of the starting structure of several Fe-Al-Zr alloys are described in Part I of this paper [7] and first results on plastic deformation in [8]. 0921-5093/$ – see front matter © 2004 Elsevier B.V. All rights reserved. doi:10.1016/j.msea.2004.04.039

Welcome message from author
This document is posted to help you gain knowledge. Please leave a comment to let me know what you think about it! Share it to your friends and learn new things together.
Transcript
Materials Science and Engineering A 381 (2004) 1–15
Plastic deformation of Fe-Al polycrystals strengthenedwith Zr-containing Laves phasesPart II. Mechanical properties
A. Wasilkowskaa,1, M. Bartscha, F. Steinb, M. Palmb,G. Sauthoffb, U. Messerschmidta,∗
a Max-Planck-Institut für Mikrostrukturphysik, Weinberg 2, D-06120 Halle/Saale, Germanyb Max-Planck-Institut für Eisenforschung, Max-Planck-Str.1, D-40074 Düsseldorf, Germany
Received 22 August 2003; received in revised form 21 January 2004
Abstract
Fe-10 at.% Al-2.5 at.% Zr and Fe-20 at.% Al-2.5 at.% Zr alloys were deformed between room temperature and 700◦C. The materials showa flow stress plateau at about 300 MPa up to 600◦C for the material with 10 at.% Al and above 600 MPa up to 400◦C for the alloy with 20%Al. The high flow stresses compared to Fe-Al reference materials are partly due to the addition of Zr. The strain rate sensitivity of the flowstress was measured by stress relaxation and strain rate cycling tests. It is low up to 400◦C and high between 450 and 600◦C, i.e. in the rangeof the flow stress decrease. The microstructures of the undeformed materials are described in Part I of this paper. Micrographs of the deformedspecimens taken in a high-voltage electron microscope reveal that the deformation occurs mainly within the soft Fe-Al grains and in the Fe-Alcomponent of the grain boundary eutectic. The deformation data are interpreted in terms of solution hardening from the Al solute, dynamicstrain ageing due to the Cottrell effect of the same defects, the athermal stress component of elastic dislocation interactions, the Hall–Petchcontribution from the grain size, and the strengthening effect of the grain boundary layers.© 2004 Elsevier B.V. All rights reserved.
Keywords:Fe-Al-Zr; Laves phase strengthening; Plastic deformation; Dislocation structure; Deformation mechanisms
1. Introduction
The challenge to develop high-temperature materialswith a good combination of strength and ductility haslead to a new class of structural materials: the Lavesphase-strengthened intermetallics[1–3]. Within this class,the Tribaloys which contain large volume fractions of theMo(Co, Si)2 Laves phase have excellent wear and corrosionresistance[1]. In Ti–Nb–Cr alloys, (Ti, Nb)Cr2 particlesprecipitate resulting in a high strength together with accept-able room-temperature toughness. The particles break dur-ing deformation with crack arrest at the phase boundaries[2]. For directionally solidified NiAl-Ta alloys, the room
∗ Corresponding author. Tel.:+49 345 5582 927;fax: +49 345 5511223.
E-mail address:[email protected] (U. Messerschmidt).1 Present address: TU München, Lehrstuhl für Materialwiss. und
Mechanik, Boltzmannstr. 15, D-85748 Garching, Germany.
temperature toughness of two-phase alloys with off-eutecticcomposition was similar to that of polycrystalline NiAleven though the brittle Laves phase NiAlTa was present[3].Alloying Fe-rich aluminides with up to 25 at.% Zr benefitsfrom the precipitation of Zr(Fe,Al)2 Laves phases[4,5].These materials retain a high room-temperature strength upto around 400◦C [6]. In the present study, the deformationbehaviour of ductile Fe-10Al-2.5Zr and Fe-20Al-2.5Zr al-loys (numbers indicate at.%) strengthened with Zr(Fe,Al)2Laves phases has been studied in more detail also withrespect to the strain rate sensitivity of the flow stress andthe relation to changes in the microstructure. Both alloyscontain about 20 vol.% of a eutectic containing the Lavesphase, which is precipitated along the matrix grain bound-aries. In addition, data for reference alloys Fe-10Al andFe-20Al without Laves phase precipitates as well as forFe-30Zr consisting mainly of the Laves phase are presented.Details of the starting structure of several Fe-Al-Zr alloysare described in Part I of this paper[7] and first results onplastic deformation in[8].
0921-5093/$ – see front matter © 2004 Elsevier B.V. All rights reserved.doi:10.1016/j.msea.2004.04.039
2 A. Wasilkowska et al. / Materials Science and Engineering A 381 (2004) 1–15
2. Experimental
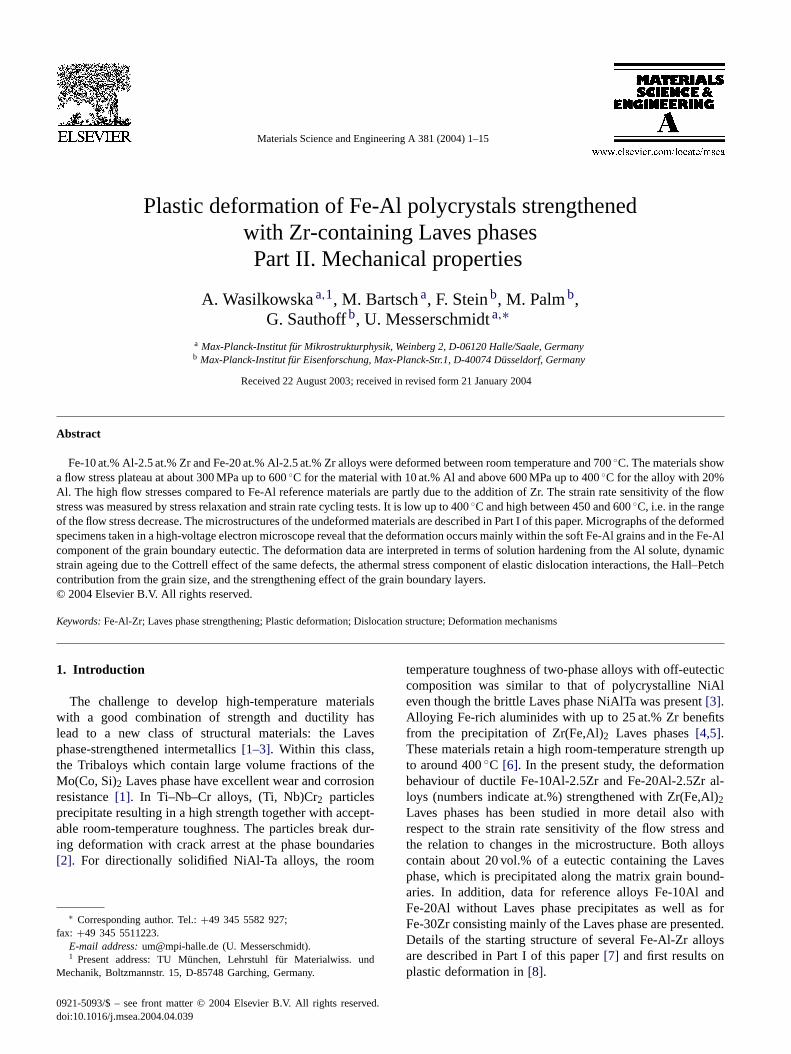
In the following, the two Laves phase-strengthened alloysare called F10AZ and F20AZ and the reference alloys with-out Zr F10A and F20A. The composition and some struc-tural data are listed inTable 1. The reference alloys havemainly columnar grains with a diameter of about 150 and300�m and up to several millimeters length. For the me-chanical tests, samples of about 2 mm× 2 mm× 4 mm werecut from the ingots by electrical discharge machining andtheir faces were subsequently carefully polished. Compres-sion experiments were carried out in a digitally controlledtesting machine at temperatures between 23 and 700◦C inflowing argon at a basic strain rate of 10−4 s−1. The en-gineering stressσ was measured versus the total engineer-ing strainεt. The yield stressσy was determined by linearback extrapolation of the initial work-hardening range ontothe elastic line. In order to study the strain rate sensitivityr= �σ/� lnε, whereε is the plastic strain rate, usually a se-quence of stress relaxation (Rn) and strain rate change (SRC)tests were performed during the deformation as shown inFig. 1. Stress relaxation curves were plotted as ln(−σ) ver-susσ. The strain rate sensitivity is then given by the inverseslope of these curves asrrel = �σ/� ln(−σ). In order to ob-tain information about changes of the microstructure duringthe relaxation tests, some “repeated” relaxation tests (Rnr)were performed, i.e. relaxation tests following an originalrelaxation and starting at a stress not exceeding that of theoriginal relaxation. Thus, repeated relaxation tests are car-ried out before quasi-steady state deformation conditions arereached again. For SRC tests, two quantities of the strainrate sensitivity are determined as demonstrated inFig. 1.The instantaneous strain rate sensitivityr i is calculated fromthe maximum (instantaneous) stress increment�σ i immedi-ately after the strain rate change. Since the strain necessary tomeasure this quantity is small, structural changes during thechange of the deformation conditions should also be small.Thus, this quantity may correspond to the strain rate sensi-tivity rrel measured from stress relaxation tests, where littlestrain is consumed, too. In addition, the steady state strainrate sensitivityrss is obtained from the back-extrapolatedstress increment�σss of the quasi-steady state deformationafter the strain rate change. The difference betweenr i andrss characterizes structural changes caused by a change inthe deformation conditions. Another measure of the strainrate sensitivity is the stress exponentm′ of the strain rate,with m′ = d ln ε/d lnσ. It is related tor by m′ = σ/r.
Table 1Characteristics of the two-phase materials (from[7])
Alloy Composition (at%) Phase structure Structure parameters
Fe Al Zr D [�m] fGB [%] S [mm−1] d [�m]
F10AZ 87.5 10 2.5 �-Fe(Al) + Zr(Fe,Al)2 28 ± 14 22 144 0.22F20AZ 77.5 20 2.5 Fe-Al+ Zr(Fe,Al)2 20 ± 8 25 193 0.16
D: grain size;fGB: volume fraction and;S: mean surface area per volume (of grain boundary phase relates to bothfGB and S).
Fig. 1. Section of a stress–strain curve (flow stressσ vs. total strainεt)with stress relaxation tests (Rn), repeated relaxation test (Rnr) and strainrate cycling test (SRC). The stress increments�σ i and�σss are used tocalculate the instantaneous and steady state strain rate sensitivitiesr i andrss.
To study the deformation microstructures, specimens weredeformed up to plastic strains of about 2.5–3% and thencooled under load. The surface of the deformed specimenswas studied by scanning electron microscopy (SEM). Thinfoils for transmission electron microscopy (TEM) were pre-pared normal to the compression axis by electrolytic jet pol-ishing in 10% perchloric acid in ethanol and 7 g thiourea per1000 cm3 [9]. These samples were investigated in diffractioncontrast in a high-voltage transmission electron microscope(HVTEM) operated at an acceleration voltage of 1 MV. Dis-location densities within the Fe-Al grains were measuredfrom the number of intersections with a square grid. Thefoil thickness was estimated from extinction fringes on dis-locations to be about 500 nm.
A few in situ heating experiments on deformed specimenshave been performed in a heating stage inside the HVTEM tostudy the influence of heating cycles on the microstructure.The heating cycles were: 23→ 370→ 600◦C, 23→ 370→ 490→ 650◦C, and 400→ 23◦C over a total time of 5 h.Changes in the microstructure were recorded on video tape.
3. Results
3.1. Macroscopic deformation parameters
Fig. 2 presents a stress–strain curve of F10AZ at 340◦Cwith stress relaxation and strain rate change tests. It is typ-ical also of other deformation conditions. The curve shows
A. Wasilkowska et al. / Materials Science and Engineering A 381 (2004) 1–15 3
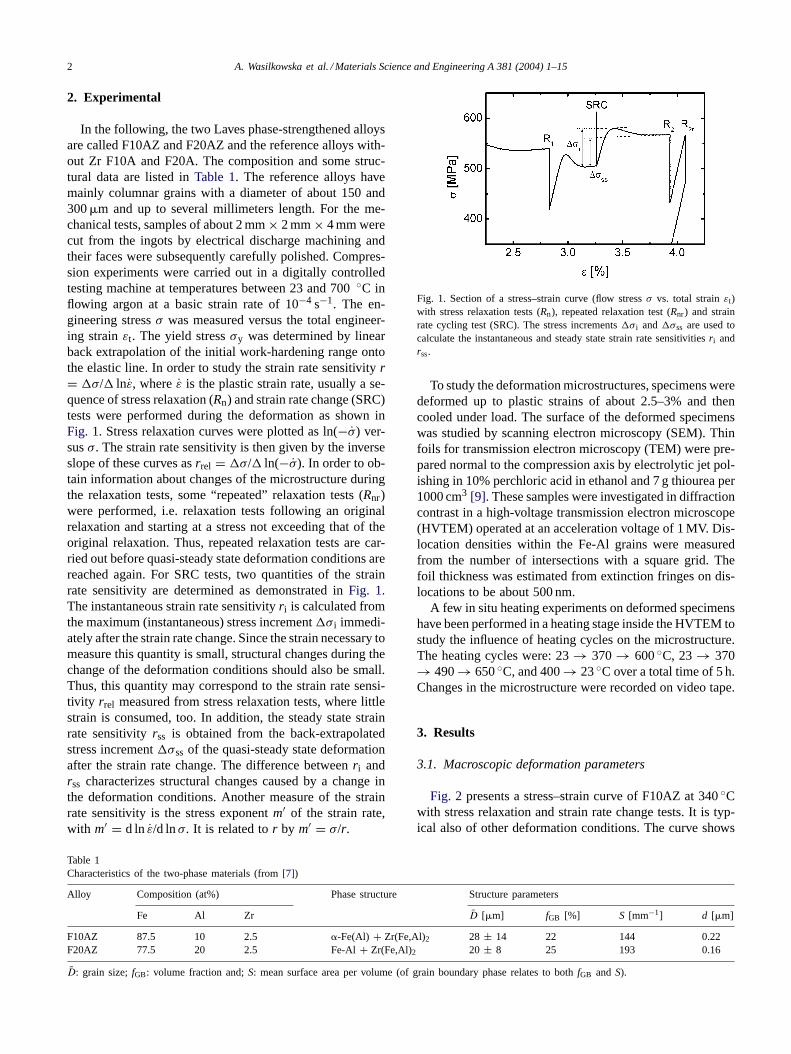
Fig. 2. Section of a stress–strain curve of F10AZ at 340◦C including stressrelaxation (Rn), repeated stress relaxation (Rnr) and strain rate cycling(SRC) tests between the strain rates ofεt = 10−5 s−1 (a) and 10−4 s−1 (b).
Fig. 3. Stress–strain curve of F20AZ at different temperatures and strainrates ofεt = 10−5 s−1 (a) and 10−4 s−1 (b).
the transition between elastic and plastic deformation anda work-hardening stage with a decreasing work-hardeningrate (parabolic hardening). In order to obtain strain rate sen-sitivity data from a limited number of experiments, somespecimens were deformed successively at different tempera-tures, as shown inFig. 3 for an F20AZ sample. The temper-ature dependence of the yield stressσy is plotted inFig. 4.
Fig. 4. Temperature dependence of the yield stressσy of F10A (opentriangles), F10AZ (solid triangles), F20A (open squares), and F20AZ(solid squares). Small symbols: data from[6].
Fig. 5. Stress relaxation curves and repeated relaxation curves of theF20AZ specimen ofFig. 3 at 501◦C (R6, R6r) and at 603◦C (R8, R8r).
Only stress values of the initial loading are used. In additionto the present data (large symbols), 0.2% proof stresses areshown which have been determined previously[6] (smallsymbols). The data of the Laves phase-strengthened mate-rials are compared with the reference materials without Zr,F10A and F20A. The reference material F10A exhibits analmost constant yield stress up to 600◦C. The correspond-ing material containing Zr has a yield stress which is higherby a constant amount. Above 600◦C, the yield stress showsa strong high-temperature decrease. The materials with thehigher Al content show higher yield stresses but an earlierstart of the high-temperature decrease.
Fig. 5exhibits stress relaxation curves of F20AZ taken atabout 500◦C (R6) and 600◦C (R8). The strain rate sensitiv-ity r equals the inverse slope of these curves. Usually,r ismeasured at the beginning of the relaxation curves. Then,the values correspond to the state of the specimen just at thestart of the relaxation test. The relaxation curves inFig. 5are bowed towards the stress axis. This is the usual curva-ture corresponding, e.g., to dislocations overcoming obsta-cles. At 600◦C, the repeated relaxation curve (R8r) is veryclose to the original one (R8), indicating that either structuralchanges did not occur during the relaxation, or that they oc-curred fast so that the deformation always took place closeto steady state. However, at 500◦C, the relaxation rates,which are proportional to the current strain rates, are dras-tically lower in case of the repeated relaxation curve (R6r)than those of the original relaxation curve. This suggestsstructural changes during the relaxation and is mostly con-nected with a yield point effect during further deformationwith a transition into steady state conditions. The differencein the relaxation rates between original and repeated relax-ation curves is generally low for F10AZ and for F20AZ atroom temperature and above 600◦C but increases up to afactor of 20 for F20AZ and F20A in the temperature inter-val between 350 and 500◦C. Fig. 6 presents a relaxationcurve of F10AZ taken at 500◦C. In this case, the curve isbent away from the stress axis, which may be denoted by arelaxation curve with an inverse curvature or a curve withtwo stages, a steep initial stage with a lowr value at high
4 A. Wasilkowska et al. / Materials Science and Engineering A 381 (2004) 1–15
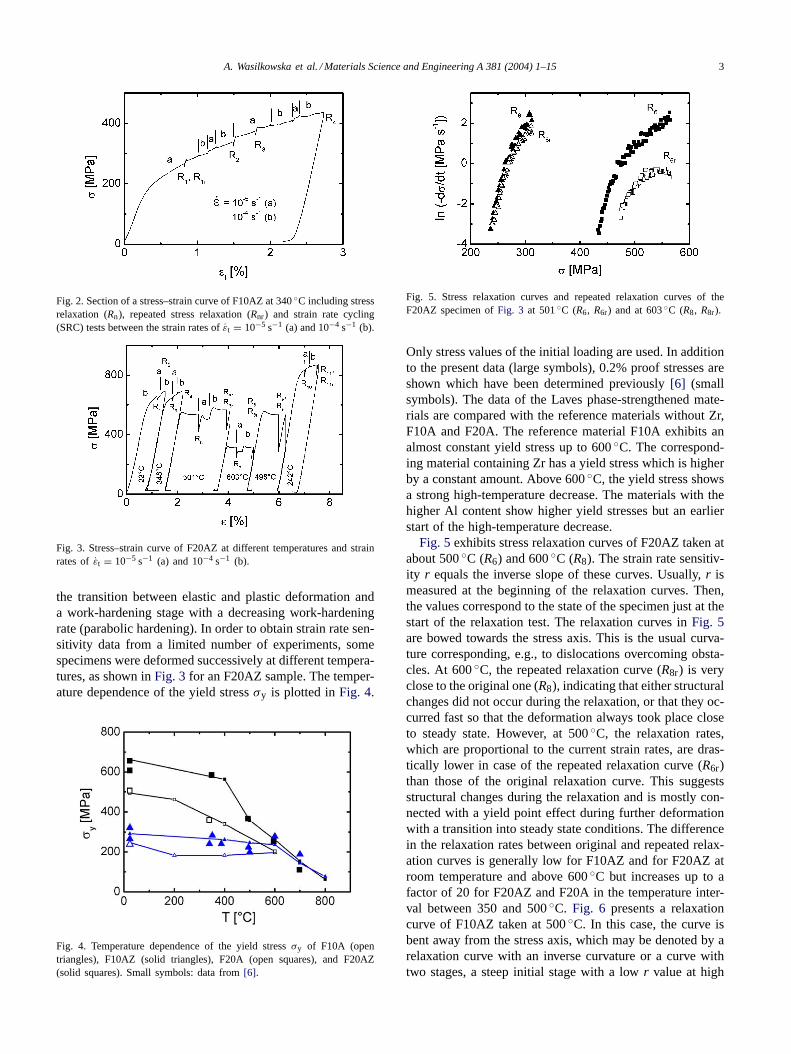
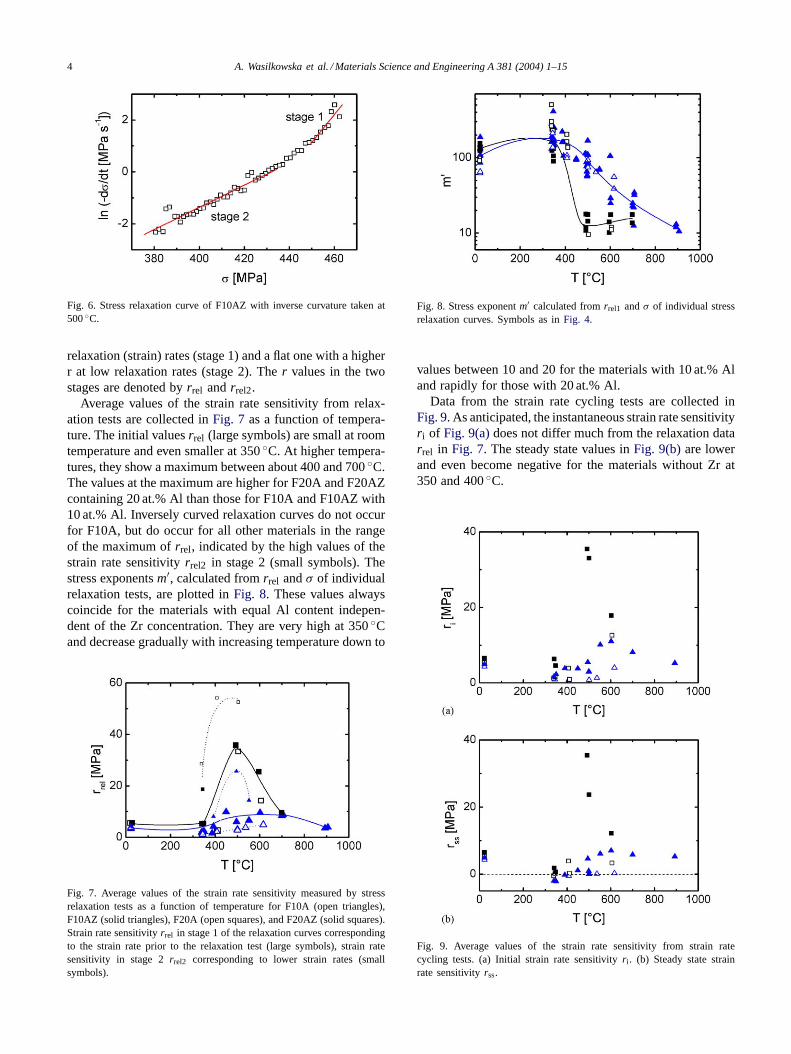
Fig. 6. Stress relaxation curve of F10AZ with inverse curvature taken at500◦C.
relaxation (strain) rates (stage 1) and a flat one with a higherr at low relaxation rates (stage 2). Ther values in the twostages are denoted byrrel andrrel2.
Average values of the strain rate sensitivity from relax-ation tests are collected inFig. 7 as a function of tempera-ture. The initial valuesrrel (large symbols) are small at roomtemperature and even smaller at 350◦C. At higher tempera-tures, they show a maximum between about 400 and 700◦C.The values at the maximum are higher for F20A and F20AZcontaining 20 at.% Al than those for F10A and F10AZ with10 at.% Al. Inversely curved relaxation curves do not occurfor F10A, but do occur for all other materials in the rangeof the maximum ofrrel, indicated by the high values of thestrain rate sensitivityrrel2 in stage 2 (small symbols). Thestress exponentsm′, calculated fromrrel andσ of individualrelaxation tests, are plotted inFig. 8. These values alwayscoincide for the materials with equal Al content indepen-dent of the Zr concentration. They are very high at 350◦Cand decrease gradually with increasing temperature down to
Fig. 7. Average values of the strain rate sensitivity measured by stressrelaxation tests as a function of temperature for F10A (open triangles),F10AZ (solid triangles), F20A (open squares), and F20AZ (solid squares).Strain rate sensitivityrrel in stage 1 of the relaxation curves correspondingto the strain rate prior to the relaxation test (large symbols), strain ratesensitivity in stage 2rrel2 corresponding to lower strain rates (smallsymbols).
Fig. 8. Stress exponentm′ calculated fromrrel1 andσ of individual stressrelaxation curves. Symbols as inFig. 4.
values between 10 and 20 for the materials with 10 at.% Aland rapidly for those with 20 at.% Al.
Data from the strain rate cycling tests are collected inFig. 9. As anticipated, the instantaneous strain rate sensitivityr i of Fig. 9(a)does not differ much from the relaxation datarrel in Fig. 7. The steady state values inFig. 9(b)are lowerand even become negative for the materials without Zr at350 and 400◦C.
Fig. 9. Average values of the strain rate sensitivity from strain ratecycling tests. (a) Initial strain rate sensitivityr i . (b) Steady state strainrate sensitivityrss.
A. Wasilkowska et al. / Materials Science and Engineering A 381 (2004) 1–15 5
The reference alloy Fe-30Zr, consisting mostly of theFe2Zr Laves phase, is brittle up to 600◦C with a fracturestress around 900 MPa. At about 800◦C, the flow stressis around 800 MPa with a strain rate sensitivityrrel ∼=30 MPa.
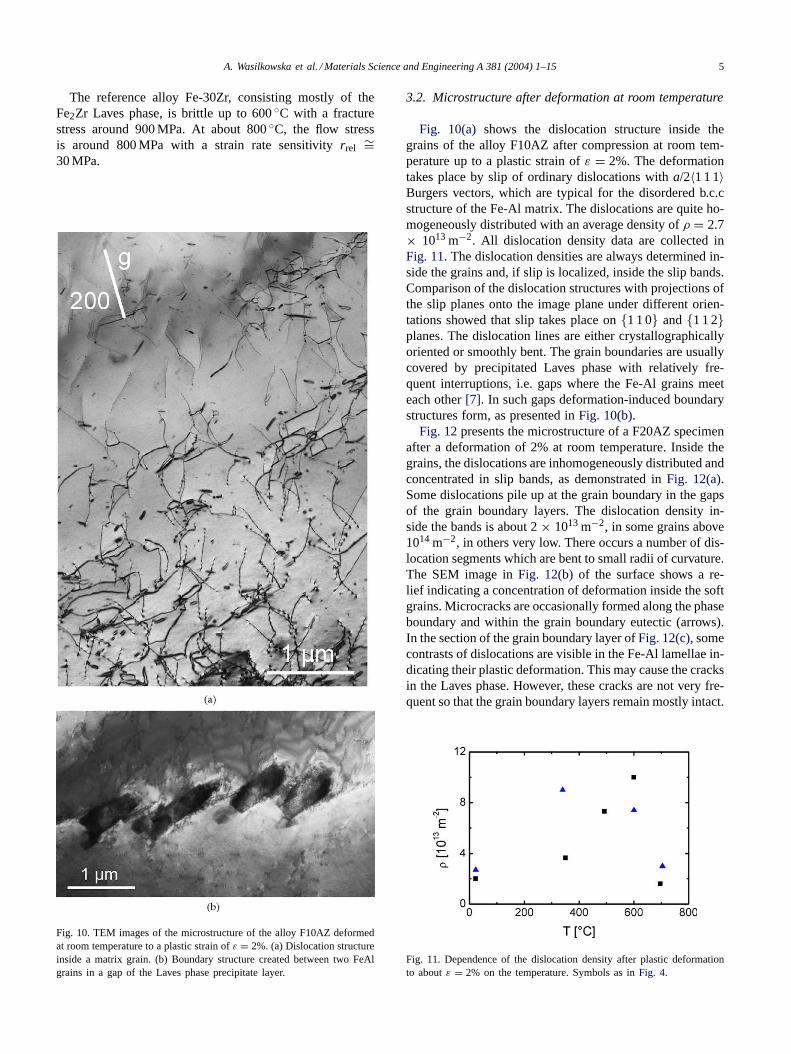
Fig. 10. TEM images of the microstructure of the alloy F10AZ deformedat room temperature to a plastic strain ofε = 2%. (a) Dislocation structureinside a matrix grain. (b) Boundary structure created between two FeAlgrains in a gap of the Laves phase precipitate layer.
3.2. Microstructure after deformation at room temperature
Fig. 10(a) shows the dislocation structure inside thegrains of the alloy F10AZ after compression at room tem-perature up to a plastic strain ofε = 2%. The deformationtakes place by slip of ordinary dislocations witha/2〈1 1 1〉Burgers vectors, which are typical for the disordered b.c.cstructure of the Fe-Al matrix. The dislocations are quite ho-mogeneously distributed with an average density ofρ = 2.7× 10¹³ m−2. All dislocation density data are collected inFig. 11. The dislocation densities are always determined in-side the grains and, if slip is localized, inside the slip bands.Comparison of the dislocation structures with projections ofthe slip planes onto the image plane under different orien-tations showed that slip takes place on{1 1 0} and{1 1 2}planes. The dislocation lines are either crystallographicallyoriented or smoothly bent. The grain boundaries are usuallycovered by precipitated Laves phase with relatively fre-quent interruptions, i.e. gaps where the Fe-Al grains meeteach other[7]. In such gaps deformation-induced boundarystructures form, as presented inFig. 10(b).
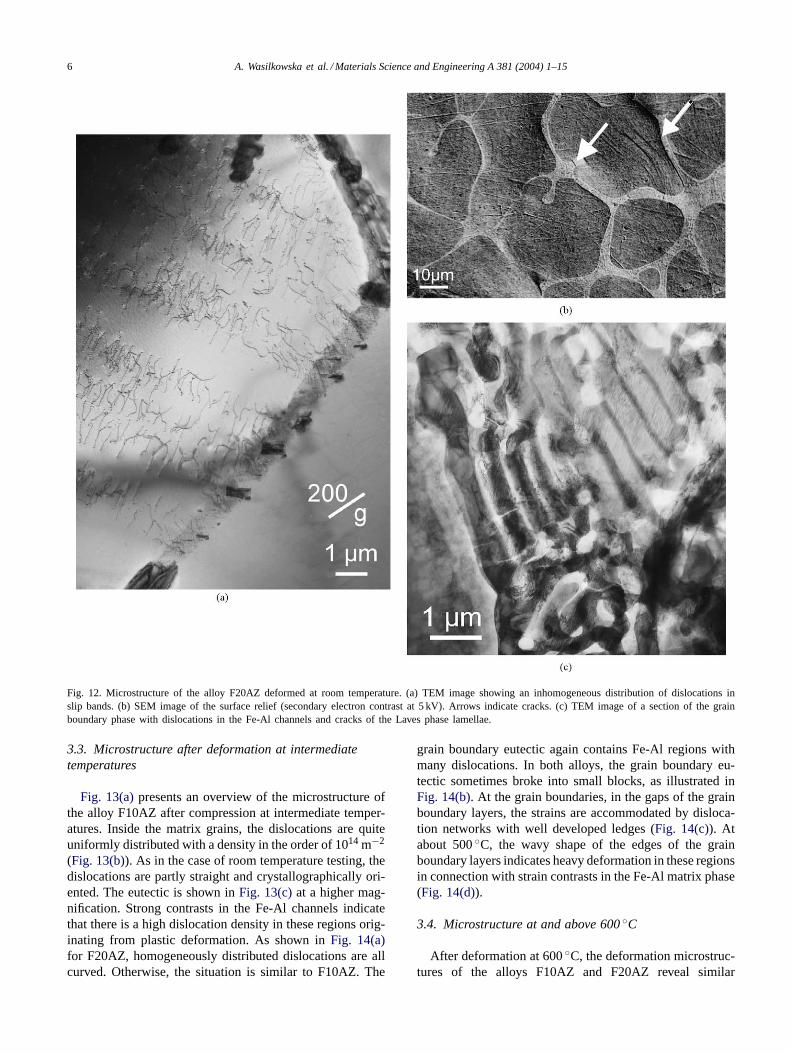
Fig. 12presents the microstructure of a F20AZ specimenafter a deformation of 2% at room temperature. Inside thegrains, the dislocations are inhomogeneously distributed andconcentrated in slip bands, as demonstrated inFig. 12(a).Some dislocations pile up at the grain boundary in the gapsof the grain boundary layers. The dislocation density in-side the bands is about 2× 10¹³ m−2, in some grains above1014 m−2, in others very low. There occurs a number of dis-location segments which are bent to small radii of curvature.The SEM image inFig. 12(b) of the surface shows a re-lief indicating a concentration of deformation inside the softgrains. Microcracks are occasionally formed along the phaseboundary and within the grain boundary eutectic (arrows).In the section of the grain boundary layer ofFig. 12(c), somecontrasts of dislocations are visible in the Fe-Al lamellae in-dicating their plastic deformation. This may cause the cracksin the Laves phase. However, these cracks are not very fre-quent so that the grain boundary layers remain mostly intact.
Fig. 11. Dependence of the dislocation density after plastic deformationto aboutε = 2% on the temperature. Symbols as inFig. 4.
6 A. Wasilkowska et al. / Materials Science and Engineering A 381 (2004) 1–15
Fig. 12. Microstructure of the alloy F20AZ deformed at room temperature. (a) TEM image showing an inhomogeneous distribution of dislocations inslip bands. (b) SEM image of the surface relief (secondary electron contrast at 5 kV). Arrows indicate cracks. (c) TEM image of a section of the grainboundary phase with dislocations in the Fe-Al channels and cracks of the Laves phase lamellae.
3.3. Microstructure after deformation at intermediatetemperatures
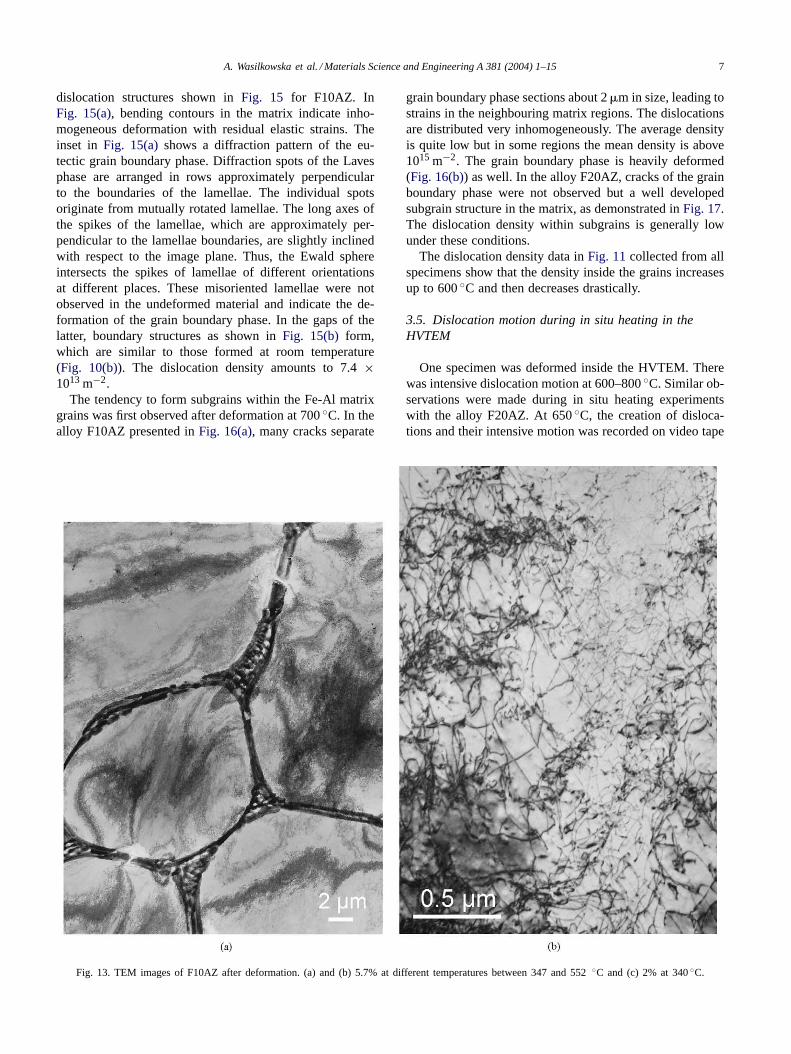
Fig. 13(a)presents an overview of the microstructure ofthe alloy F10AZ after compression at intermediate temper-atures. Inside the matrix grains, the dislocations are quiteuniformly distributed with a density in the order of 1014 m−2
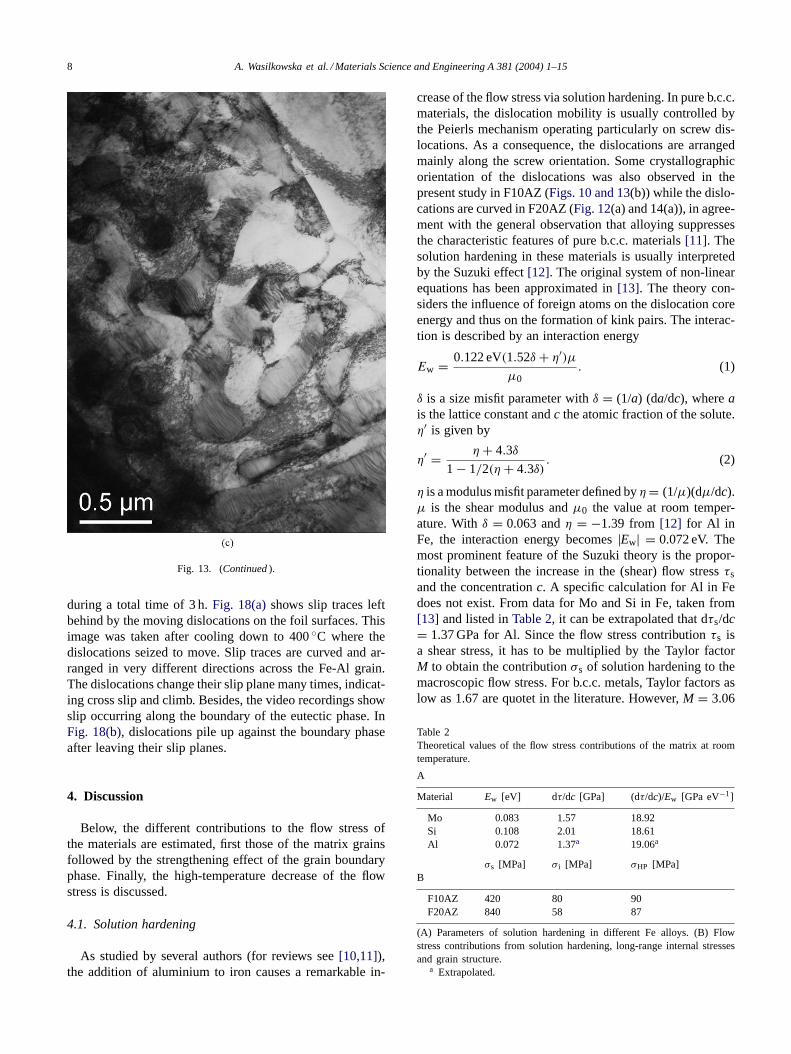
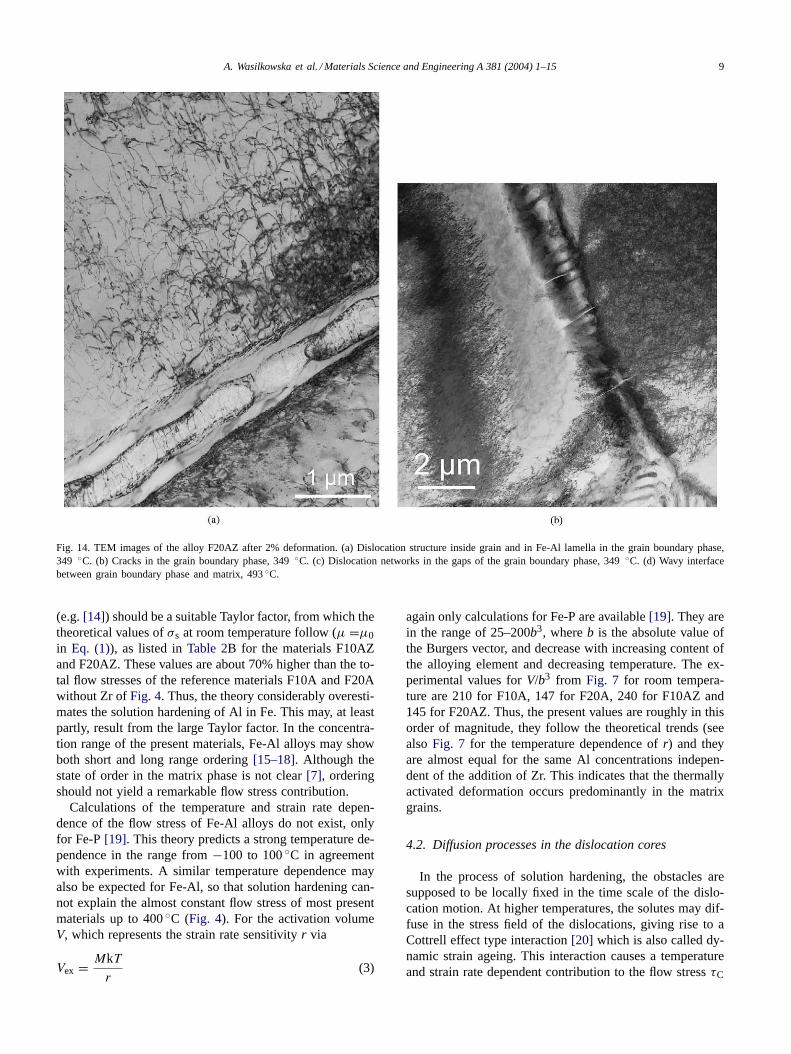
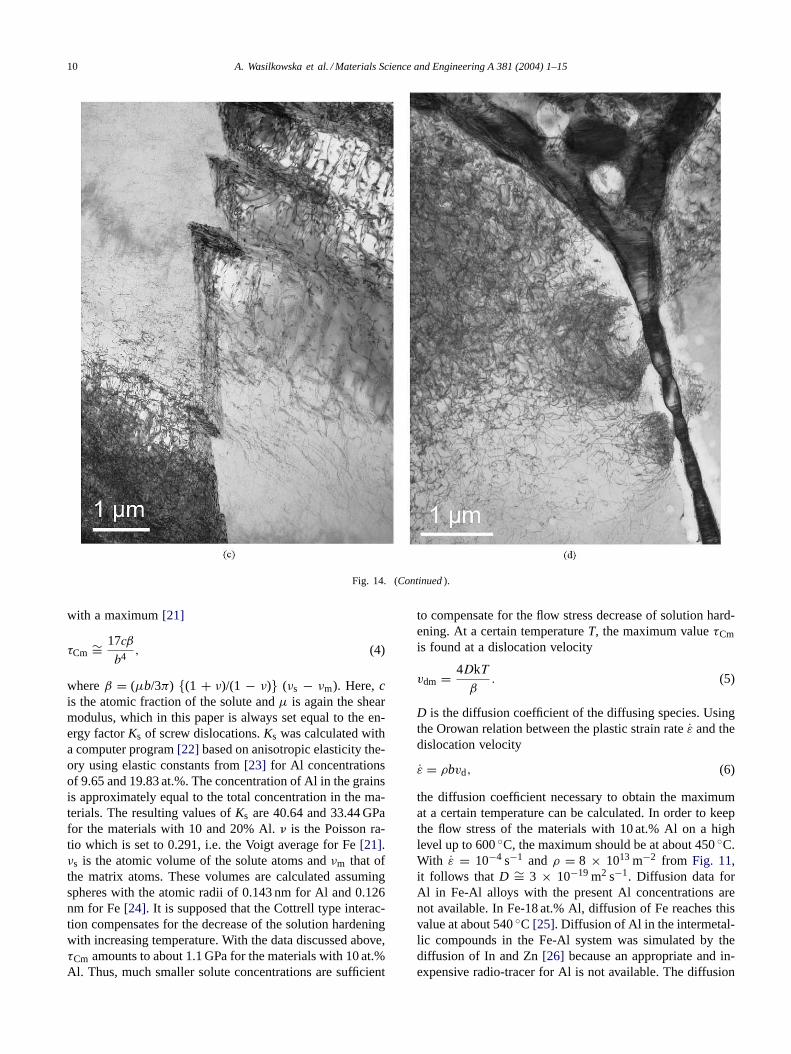
(Fig. 13(b)). As in the case of room temperature testing, thedislocations are partly straight and crystallographically ori-ented. The eutectic is shown inFig. 13(c)at a higher mag-nification. Strong contrasts in the Fe-Al channels indicatethat there is a high dislocation density in these regions orig-inating from plastic deformation. As shown inFig. 14(a)for F20AZ, homogeneously distributed dislocations are allcurved. Otherwise, the situation is similar to F10AZ. The
grain boundary eutectic again contains Fe-Al regions withmany dislocations. In both alloys, the grain boundary eu-tectic sometimes broke into small blocks, as illustrated inFig. 14(b). At the grain boundaries, in the gaps of the grainboundary layers, the strains are accommodated by disloca-tion networks with well developed ledges (Fig. 14(c)). Atabout 500◦C, the wavy shape of the edges of the grainboundary layers indicates heavy deformation in these regionsin connection with strain contrasts in the Fe-Al matrix phase(Fig. 14(d)).
3.4. Microstructure at and above 600◦C
After deformation at 600◦C, the deformation microstruc-tures of the alloys F10AZ and F20AZ reveal similar
A. Wasilkowska et al. / Materials Science and Engineering A 381 (2004) 1–15 7
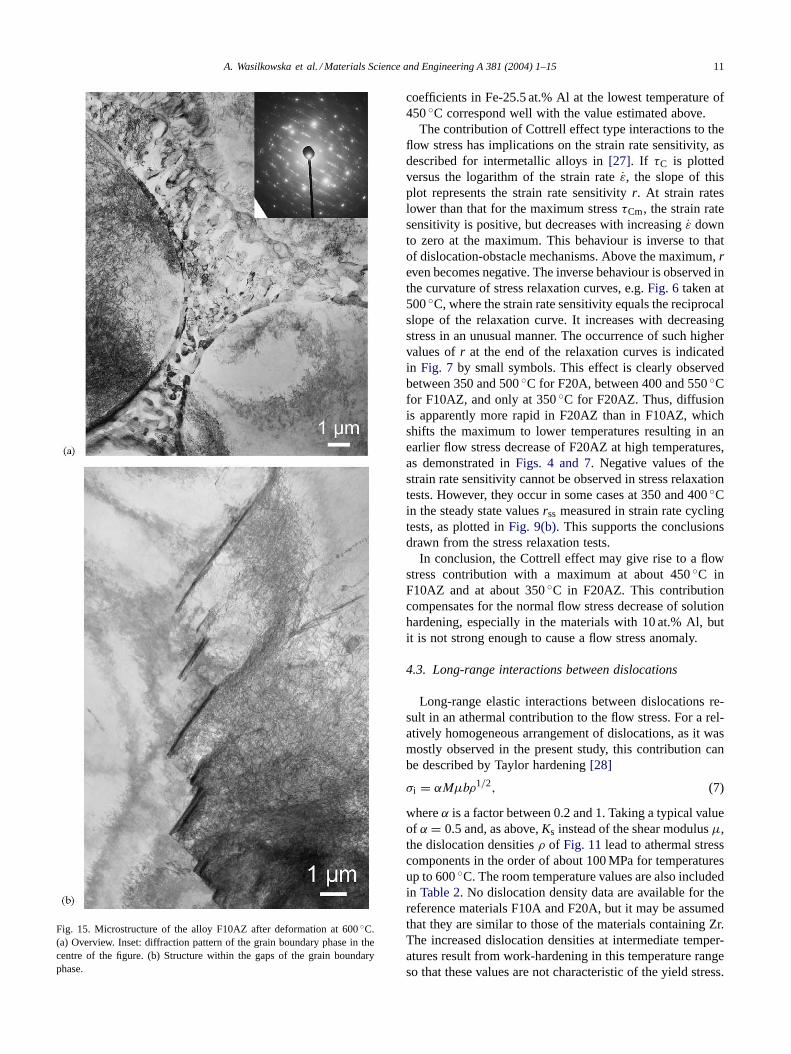
dislocation structures shown inFig. 15 for F10AZ. InFig. 15(a), bending contours in the matrix indicate inho-mogeneous deformation with residual elastic strains. Theinset in Fig. 15(a)shows a diffraction pattern of the eu-tectic grain boundary phase. Diffraction spots of the Lavesphase are arranged in rows approximately perpendicularto the boundaries of the lamellae. The individual spotsoriginate from mutually rotated lamellae. The long axes ofthe spikes of the lamellae, which are approximately per-pendicular to the lamellae boundaries, are slightly inclinedwith respect to the image plane. Thus, the Ewald sphereintersects the spikes of lamellae of different orientationsat different places. These misoriented lamellae were notobserved in the undeformed material and indicate the de-formation of the grain boundary phase. In the gaps of thelatter, boundary structures as shown inFig. 15(b) form,which are similar to those formed at room temperature(Fig. 10(b)). The dislocation density amounts to 7.4×10¹³ m−2.
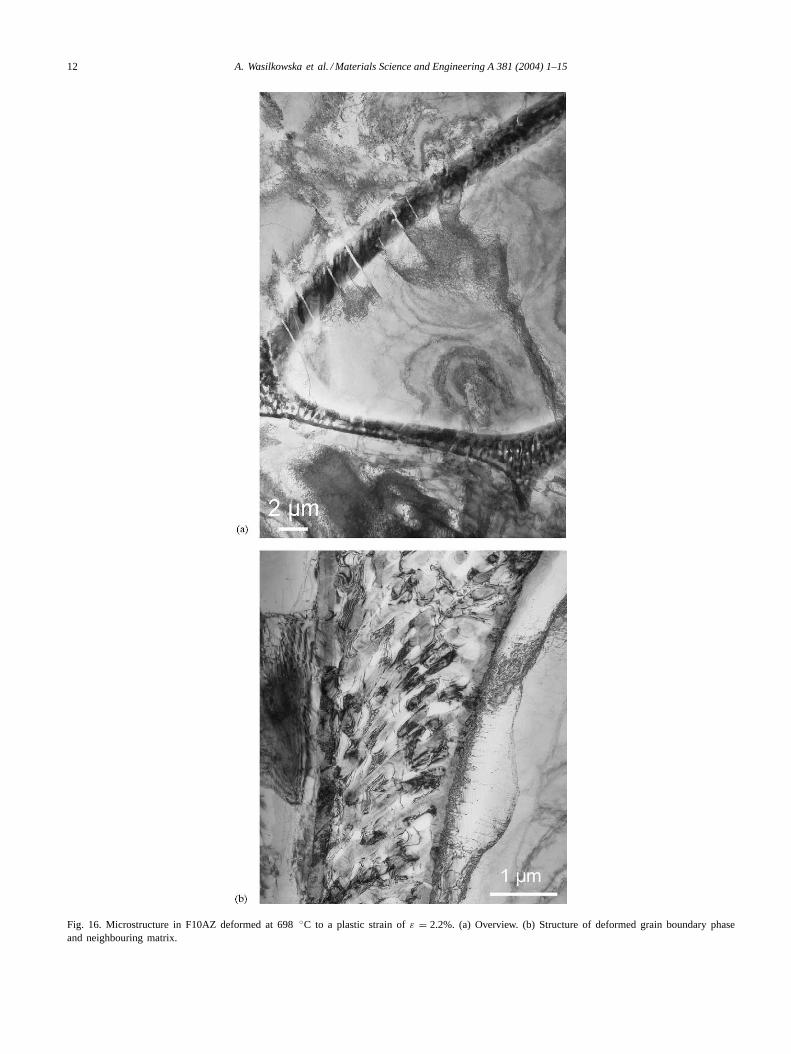
The tendency to form subgrains within the Fe-Al matrixgrains was first observed after deformation at 700◦C. In thealloy F10AZ presented inFig. 16(a), many cracks separate
Fig. 13. TEM images of F10AZ after deformation. (a) and (b) 5.7% at different temperatures between 347 and 552◦C and (c) 2% at 340◦C.
grain boundary phase sections about 2�m in size, leading tostrains in the neighbouring matrix regions. The dislocationsare distributed very inhomogeneously. The average densityis quite low but in some regions the mean density is above1015 m−2. The grain boundary phase is heavily deformed(Fig. 16(b)) as well. In the alloy F20AZ, cracks of the grainboundary phase were not observed but a well developedsubgrain structure in the matrix, as demonstrated inFig. 17.The dislocation density within subgrains is generally lowunder these conditions.
The dislocation density data inFig. 11collected from allspecimens show that the density inside the grains increasesup to 600◦C and then decreases drastically.
3.5. Dislocation motion during in situ heating in theHVTEM
One specimen was deformed inside the HVTEM. Therewas intensive dislocation motion at 600–800◦C. Similar ob-servations were made during in situ heating experimentswith the alloy F20AZ. At 650◦C, the creation of disloca-tions and their intensive motion was recorded on video tape
8 A. Wasilkowska et al. / Materials Science and Engineering A 381 (2004) 1–15
Fig. 13. (Continued).
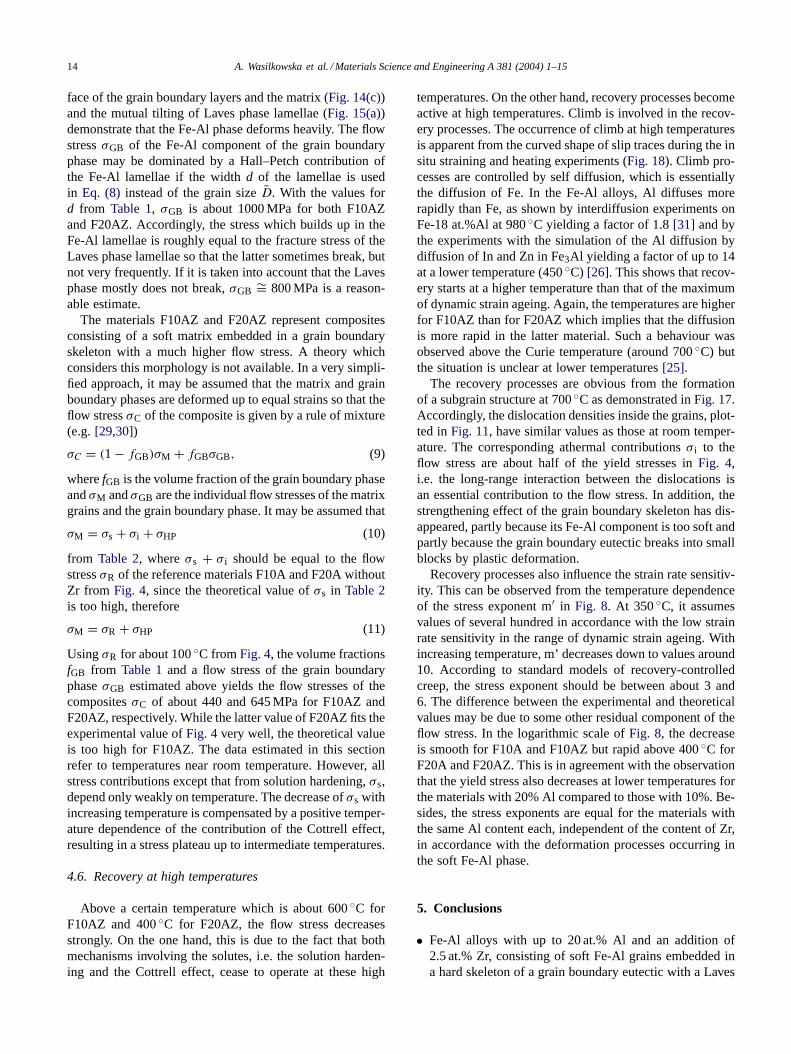
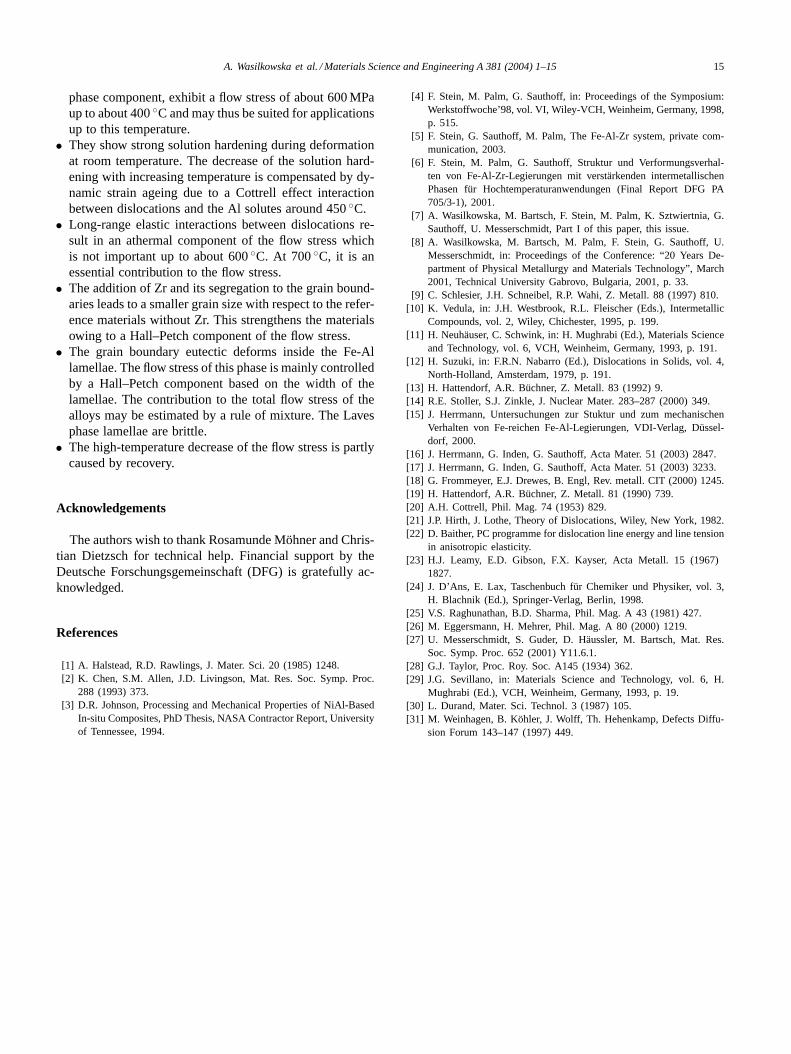
during a total time of 3 h.Fig. 18(a)shows slip traces leftbehind by the moving dislocations on the foil surfaces. Thisimage was taken after cooling down to 400◦C where thedislocations seized to move. Slip traces are curved and ar-ranged in very different directions across the Fe-Al grain.The dislocations change their slip plane many times, indicat-ing cross slip and climb. Besides, the video recordings showslip occurring along the boundary of the eutectic phase. InFig. 18(b), dislocations pile up against the boundary phaseafter leaving their slip planes.
4. Discussion
Below, the different contributions to the flow stress ofthe materials are estimated, first those of the matrix grainsfollowed by the strengthening effect of the grain boundaryphase. Finally, the high-temperature decrease of the flowstress is discussed.
4.1. Solution hardening
As studied by several authors (for reviews see[10,11]),the addition of aluminium to iron causes a remarkable in-
crease of the flow stress via solution hardening. In pure b.c.c.materials, the dislocation mobility is usually controlled bythe Peierls mechanism operating particularly on screw dis-locations. As a consequence, the dislocations are arrangedmainly along the screw orientation. Some crystallographicorientation of the dislocations was also observed in thepresent study in F10AZ (Figs. 10 and 13(b)) while the dislo-cations are curved in F20AZ (Fig. 12(a) and 14(a)), in agree-ment with the general observation that alloying suppressesthe characteristic features of pure b.c.c. materials[11]. Thesolution hardening in these materials is usually interpretedby the Suzuki effect[12]. The original system of non-linearequations has been approximated in[13]. The theory con-siders the influence of foreign atoms on the dislocation coreenergy and thus on the formation of kink pairs. The interac-tion is described by an interaction energy
Ew = 0.122 eV(1.52δ + η′)µµ0
. (1)
δ is a size misfit parameter withδ = (1/a) (da/dc), whereais the lattice constant andc the atomic fraction of the solute.η′ is given by
η′ = η + 4.3δ
1 − 1/2(η + 4.3δ). (2)
η is a modulus misfit parameter defined byη = (1/µ)(dµ/dc).µ is the shear modulus andµ0 the value at room temper-ature. Withδ = 0.063 andη = −1.39 from[12] for Al inFe, the interaction energy becomes |Ew| = 0.072 eV. Themost prominent feature of the Suzuki theory is the propor-tionality between the increase in the (shear) flow stressτsand the concentrationc. A specific calculation for Al in Fedoes not exist. From data for Mo and Si in Fe, taken from[13] and listed inTable 2, it can be extrapolated that dτs/dc= 1.37 GPa for Al. Since the flow stress contributionτs isa shear stress, it has to be multiplied by the Taylor factorM to obtain the contributionσs of solution hardening to themacroscopic flow stress. For b.c.c. metals, Taylor factors aslow as 1.67 are quotet in the literature. However,M = 3.06
Table 2Theoretical values of the flow stress contributions of the matrix at roomtemperature.
A
Material Ew [eV] dτ/dc [GPa] (dτ/dc)/Ew [GPa eV−1]
Mo 0.083 1.57 18.92Si 0.108 2.01 18.61Al 0.072 1.37a 19.06a
σs [MPa] σ i [MPa] σHP [MPa]B
F10AZ 420 80 90F20AZ 840 58 87
(A) Parameters of solution hardening in different Fe alloys. (B) Flowstress contributions from solution hardening, long-range internal stressesand grain structure.
a Extrapolated.
A. Wasilkowska et al. / Materials Science and Engineering A 381 (2004) 1–15 9
Fig. 14. TEM images of the alloy F20AZ after 2% deformation. (a) Dislocation structure inside grain and in Fe-Al lamella in the grain boundary phase,349 ◦C. (b) Cracks in the grain boundary phase, 349◦C. (c) Dislocation networks in the gaps of the grain boundary phase, 349◦C. (d) Wavy interfacebetween grain boundary phase and matrix, 493◦C.
(e.g.[14]) should be a suitable Taylor factor, from which thetheoretical values ofσs at room temperature follow (µ =µ0in Eq. (1)), as listed inTable 2B for the materials F10AZand F20AZ. These values are about 70% higher than the to-tal flow stresses of the reference materials F10A and F20Awithout Zr ofFig. 4. Thus, the theory considerably overesti-mates the solution hardening of Al in Fe. This may, at leastpartly, result from the large Taylor factor. In the concentra-tion range of the present materials, Fe-Al alloys may showboth short and long range ordering[15–18]. Although thestate of order in the matrix phase is not clear[7], orderingshould not yield a remarkable flow stress contribution.
Calculations of the temperature and strain rate depen-dence of the flow stress of Fe-Al alloys do not exist, onlyfor Fe-P[19]. This theory predicts a strong temperature de-pendence in the range from−100 to 100◦C in agreementwith experiments. A similar temperature dependence mayalso be expected for Fe-Al, so that solution hardening can-not explain the almost constant flow stress of most presentmaterials up to 400◦C (Fig. 4). For the activation volumeV, which represents the strain rate sensitivityr via
Vex = MkT
r(3)
again only calculations for Fe-P are available[19]. They arein the range of 25–200b3, whereb is the absolute value ofthe Burgers vector, and decrease with increasing content ofthe alloying element and decreasing temperature. The ex-perimental values forV/b3 from Fig. 7 for room tempera-ture are 210 for F10A, 147 for F20A, 240 for F10AZ and145 for F20AZ. Thus, the present values are roughly in thisorder of magnitude, they follow the theoretical trends (seealso Fig. 7 for the temperature dependence ofr) and theyare almost equal for the same Al concentrations indepen-dent of the addition of Zr. This indicates that the thermallyactivated deformation occurs predominantly in the matrixgrains.
4.2. Diffusion processes in the dislocation cores
In the process of solution hardening, the obstacles aresupposed to be locally fixed in the time scale of the dislo-cation motion. At higher temperatures, the solutes may dif-fuse in the stress field of the dislocations, giving rise to aCottrell effect type interaction[20] which is also called dy-namic strain ageing. This interaction causes a temperatureand strain rate dependent contribution to the flow stressτC
10 A. Wasilkowska et al. / Materials Science and Engineering A 381 (2004) 1–15
Fig. 14. (Continued).
with a maximum[21]
τCm ∼= 17cβ
b4, (4)
whereβ = (µb/3π) {(1 + ν)/(1 − ν)} (νs − νm). Here,cis the atomic fraction of the solute andµ is again the shearmodulus, which in this paper is always set equal to the en-ergy factorKs of screw dislocations.Ks was calculated witha computer program[22] based on anisotropic elasticity the-ory using elastic constants from[23] for Al concentrationsof 9.65 and 19.83 at.%. The concentration of Al in the grainsis approximately equal to the total concentration in the ma-terials. The resulting values ofKs are 40.64 and 33.44 GPafor the materials with 10 and 20% Al.� is the Poisson ra-tio which is set to 0.291, i.e. the Voigt average for Fe[21].νs is the atomic volume of the solute atoms andνm that ofthe matrix atoms. These volumes are calculated assumingspheres with the atomic radii of 0.143 nm for Al and 0.126nm for Fe[24]. It is supposed that the Cottrell type interac-tion compensates for the decrease of the solution hardeningwith increasing temperature. With the data discussed above,τCm amounts to about 1.1 GPa for the materials with 10 at.%Al. Thus, much smaller solute concentrations are sufficient
to compensate for the flow stress decrease of solution hard-ening. At a certain temperatureT, the maximum valueτCmis found at a dislocation velocity
vdm = 4DkT
β. (5)
D is the diffusion coefficient of the diffusing species. Usingthe Orowan relation between the plastic strain rateε and thedislocation velocity
ε = ρbvd, (6)
the diffusion coefficient necessary to obtain the maximumat a certain temperature can be calculated. In order to keepthe flow stress of the materials with 10 at.% Al on a highlevel up to 600◦C, the maximum should be at about 450◦C.With ε = 10−4 s−1 and ρ = 8 × 10¹³ m−2 from Fig. 11,it follows that D ∼= 3 × 10⁻¹⁹ m2 s−1. Diffusion data forAl in Fe-Al alloys with the present Al concentrations arenot available. In Fe-18 at.% Al, diffusion of Fe reaches thisvalue at about 540◦C [25]. Diffusion of Al in the intermetal-lic compounds in the Fe-Al system was simulated by thediffusion of In and Zn[26] because an appropriate and in-expensive radio-tracer for Al is not available. The diffusion
A. Wasilkowska et al. / Materials Science and Engineering A 381 (2004) 1–15 11
Fig. 15. Microstructure of the alloy F10AZ after deformation at 600◦C.(a) Overview. Inset: diffraction pattern of the grain boundary phase in thecentre of the figure. (b) Structure within the gaps of the grain boundaryphase.
coefficients in Fe-25.5 at.% Al at the lowest temperature of450◦C correspond well with the value estimated above.
The contribution of Cottrell effect type interactions to theflow stress has implications on the strain rate sensitivity, asdescribed for intermetallic alloys in[27]. If τC is plottedversus the logarithm of the strain rateε, the slope of thisplot represents the strain rate sensitivityr. At strain rateslower than that for the maximum stressτCm, the strain ratesensitivity is positive, but decreases with increasingε downto zero at the maximum. This behaviour is inverse to thatof dislocation-obstacle mechanisms. Above the maximum,reven becomes negative. The inverse behaviour is observed inthe curvature of stress relaxation curves, e.g.Fig. 6 taken at500◦C, where the strain rate sensitivity equals the reciprocalslope of the relaxation curve. It increases with decreasingstress in an unusual manner. The occurrence of such highervalues ofr at the end of the relaxation curves is indicatedin Fig. 7 by small symbols. This effect is clearly observedbetween 350 and 500◦C for F20A, between 400 and 550◦Cfor F10AZ, and only at 350◦C for F20AZ. Thus, diffusionis apparently more rapid in F20AZ than in F10AZ, whichshifts the maximum to lower temperatures resulting in anearlier flow stress decrease of F20AZ at high temperatures,as demonstrated inFigs. 4 and 7. Negative values of thestrain rate sensitivity cannot be observed in stress relaxationtests. However, they occur in some cases at 350 and 400◦Cin the steady state valuesrss measured in strain rate cyclingtests, as plotted inFig. 9(b). This supports the conclusionsdrawn from the stress relaxation tests.
In conclusion, the Cottrell effect may give rise to a flowstress contribution with a maximum at about 450◦C inF10AZ and at about 350◦C in F20AZ. This contributioncompensates for the normal flow stress decrease of solutionhardening, especially in the materials with 10 at.% Al, butit is not strong enough to cause a flow stress anomaly.
4.3. Long-range interactions between dislocations
Long-range elastic interactions between dislocations re-sult in an athermal contribution to the flow stress. For a rel-atively homogeneous arrangement of dislocations, as it wasmostly observed in the present study, this contribution canbe described by Taylor hardening[28]
σi = αMµbρ1/2, (7)
whereα is a factor between 0.2 and 1. Taking a typical valueof α = 0.5 and, as above,Ks instead of the shear modulusµ,the dislocation densitiesρ of Fig. 11lead to athermal stresscomponents in the order of about 100 MPa for temperaturesup to 600◦C. The room temperature values are also includedin Table 2. No dislocation density data are available for thereference materials F10A and F20A, but it may be assumedthat they are similar to those of the materials containing Zr.The increased dislocation densities at intermediate temper-atures result from work-hardening in this temperature rangeso that these values are not characteristic of the yield stress.
12 A. Wasilkowska et al. / Materials Science and Engineering A 381 (2004) 1–15
Fig. 16. Microstructure in F10AZ deformed at 698◦C to a plastic strain ofε = 2.2%. (a) Overview. (b) Structure of deformed grain boundary phaseand neighbouring matrix.
A. Wasilkowska et al. / Materials Science and Engineering A 381 (2004) 1–15 13
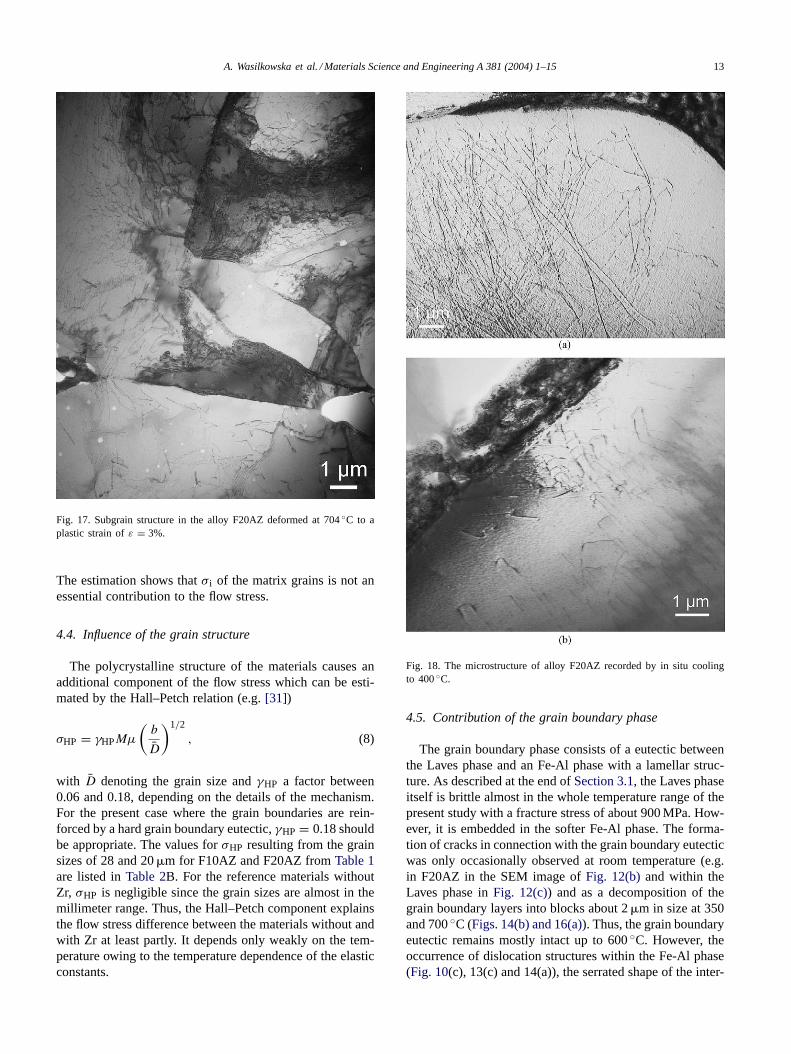
Fig. 17. Subgrain structure in the alloy F20AZ deformed at 704◦C to aplastic strain ofε = 3%.
The estimation shows thatσ i of the matrix grains is not anessential contribution to the flow stress.
4.4. Influence of the grain structure
The polycrystalline structure of the materials causes anadditional component of the flow stress which can be esti-mated by the Hall–Petch relation (e.g.[31])
σHP = γHPMµ
(b
D
)1/2
, (8)
with D denoting the grain size andγHP a factor between0.06 and 0.18, depending on the details of the mechanism.For the present case where the grain boundaries are rein-forced by a hard grain boundary eutectic,γHP = 0.18 shouldbe appropriate. The values forσHP resulting from the grainsizes of 28 and 20�m for F10AZ and F20AZ fromTable 1are listed inTable 2B. For the reference materials withoutZr, σHP is negligible since the grain sizes are almost in themillimeter range. Thus, the Hall–Petch component explainsthe flow stress difference between the materials without andwith Zr at least partly. It depends only weakly on the tem-perature owing to the temperature dependence of the elasticconstants.
Fig. 18. The microstructure of alloy F20AZ recorded by in situ coolingto 400◦C.
4.5. Contribution of the grain boundary phase
The grain boundary phase consists of a eutectic betweenthe Laves phase and an Fe-Al phase with a lamellar struc-ture. As described at the end ofSection 3.1, the Laves phaseitself is brittle almost in the whole temperature range of thepresent study with a fracture stress of about 900 MPa. How-ever, it is embedded in the softer Fe-Al phase. The forma-tion of cracks in connection with the grain boundary eutecticwas only occasionally observed at room temperature (e.g.in F20AZ in the SEM image ofFig. 12(b)and within theLaves phase inFig. 12(c)) and as a decomposition of thegrain boundary layers into blocks about 2�m in size at 350and 700◦C (Figs. 14(b) and 16(a)). Thus, the grain boundaryeutectic remains mostly intact up to 600◦C. However, theoccurrence of dislocation structures within the Fe-Al phase(Fig. 10(c), 13(c) and 14(a)), the serrated shape of the inter-
14 A. Wasilkowska et al. / Materials Science and Engineering A 381 (2004) 1–15
face of the grain boundary layers and the matrix (Fig. 14(c))and the mutual tilting of Laves phase lamellae (Fig. 15(a))demonstrate that the Fe-Al phase deforms heavily. The flowstressσGB of the Fe-Al component of the grain boundaryphase may be dominated by a Hall–Petch contribution ofthe Fe-Al lamellae if the widthd of the lamellae is usedin Eq. (8) instead of the grain sizeD. With the values ford from Table 1, σGB is about 1000 MPa for both F10AZand F20AZ. Accordingly, the stress which builds up in theFe-Al lamellae is roughly equal to the fracture stress of theLaves phase lamellae so that the latter sometimes break, butnot very frequently. If it is taken into account that the Lavesphase mostly does not break,σGB ∼= 800 MPa is a reason-able estimate.
The materials F10AZ and F20AZ represent compositesconsisting of a soft matrix embedded in a grain boundaryskeleton with a much higher flow stress. A theory whichconsiders this morphology is not available. In a very simpli-fied approach, it may be assumed that the matrix and grainboundary phases are deformed up to equal strains so that theflow stressσC of the composite is given by a rule of mixture(e.g.[29,30])
σC = (1 − fGB)σM + fGBσGB, (9)
wherefGB is the volume fraction of the grain boundary phaseandσM andσGB are the individual flow stresses of the matrixgrains and the grain boundary phase. It may be assumed that
σM = σs + σi + σHP (10)
from Table 2, whereσs + σ i should be equal to the flowstressσR of the reference materials F10A and F20A withoutZr from Fig. 4, since the theoretical value ofσs in Table 2is too high, therefore
σM = σR + σHP (11)
UsingσR for about 100◦C fromFig. 4, the volume fractionsfGB from Table 1and a flow stress of the grain boundaryphaseσGB estimated above yields the flow stresses of thecompositesσC of about 440 and 645 MPa for F10AZ andF20AZ, respectively. While the latter value of F20AZ fits theexperimental value ofFig. 4very well, the theoretical valueis too high for F10AZ. The data estimated in this sectionrefer to temperatures near room temperature. However, allstress contributions except that from solution hardening,σs,depend only weakly on temperature. The decrease ofσs withincreasing temperature is compensated by a positive temper-ature dependence of the contribution of the Cottrell effect,resulting in a stress plateau up to intermediate temperatures.
4.6. Recovery at high temperatures
Above a certain temperature which is about 600◦C forF10AZ and 400◦C for F20AZ, the flow stress decreasesstrongly. On the one hand, this is due to the fact that bothmechanisms involving the solutes, i.e. the solution harden-ing and the Cottrell effect, cease to operate at these high
temperatures. On the other hand, recovery processes becomeactive at high temperatures. Climb is involved in the recov-ery processes. The occurrence of climb at high temperaturesis apparent from the curved shape of slip traces during the insitu straining and heating experiments (Fig. 18). Climb pro-cesses are controlled by self diffusion, which is essentiallythe diffusion of Fe. In the Fe-Al alloys, Al diffuses morerapidly than Fe, as shown by interdiffusion experiments onFe-18 at.%Al at 980◦C yielding a factor of 1.8[31] and bythe experiments with the simulation of the Al diffusion bydiffusion of In and Zn in Fe3Al yielding a factor of up to 14at a lower temperature (450◦C) [26]. This shows that recov-ery starts at a higher temperature than that of the maximumof dynamic strain ageing. Again, the temperatures are higherfor F10AZ than for F20AZ which implies that the diffusionis more rapid in the latter material. Such a behaviour wasobserved above the Curie temperature (around 700◦C) butthe situation is unclear at lower temperatures[25].
The recovery processes are obvious from the formationof a subgrain structure at 700◦C as demonstrated inFig. 17.Accordingly, the dislocation densities inside the grains, plot-ted inFig. 11, have similar values as those at room temper-ature. The corresponding athermal contributionsσ i to theflow stress are about half of the yield stresses inFig. 4,i.e. the long-range interaction between the dislocations isan essential contribution to the flow stress. In addition, thestrengthening effect of the grain boundary skeleton has dis-appeared, partly because its Fe-Al component is too soft andpartly because the grain boundary eutectic breaks into smallblocks by plastic deformation.
Recovery processes also influence the strain rate sensitiv-ity. This can be observed from the temperature dependenceof the stress exponent m′ in Fig. 8. At 350◦C, it assumesvalues of several hundred in accordance with the low strainrate sensitivity in the range of dynamic strain ageing. Withincreasing temperature, m’ decreases down to values around10. According to standard models of recovery-controlledcreep, the stress exponent should be between about 3 and6. The difference between the experimental and theoreticalvalues may be due to some other residual component of theflow stress. In the logarithmic scale ofFig. 8, the decreaseis smooth for F10A and F10AZ but rapid above 400◦C forF20A and F20AZ. This is in agreement with the observationthat the yield stress also decreases at lower temperatures forthe materials with 20% Al compared to those with 10%. Be-sides, the stress exponents are equal for the materials withthe same Al content each, independent of the content of Zr,in accordance with the deformation processes occurring inthe soft Fe-Al phase.
5. Conclusions
• Fe-Al alloys with up to 20 at.% Al and an addition of2.5 at.% Zr, consisting of soft Fe-Al grains embedded ina hard skeleton of a grain boundary eutectic with a Laves
A. Wasilkowska et al. / Materials Science and Engineering A 381 (2004) 1–15 15
phase component, exhibit a flow stress of about 600 MPaup to about 400◦C and may thus be suited for applicationsup to this temperature.
• They show strong solution hardening during deformationat room temperature. The decrease of the solution hard-ening with increasing temperature is compensated by dy-namic strain ageing due to a Cottrell effect interactionbetween dislocations and the Al solutes around 450◦C.
• Long-range elastic interactions between dislocations re-sult in an athermal component of the flow stress whichis not important up to about 600◦C. At 700◦C, it is anessential contribution to the flow stress.
• The addition of Zr and its segregation to the grain bound-aries leads to a smaller grain size with respect to the refer-ence materials without Zr. This strengthens the materialsowing to a Hall–Petch component of the flow stress.
• The grain boundary eutectic deforms inside the Fe-Allamellae. The flow stress of this phase is mainly controlledby a Hall–Petch component based on the width of thelamellae. The contribution to the total flow stress of thealloys may be estimated by a rule of mixture. The Lavesphase lamellae are brittle.
• The high-temperature decrease of the flow stress is partlycaused by recovery.
Acknowledgements
The authors wish to thank Rosamunde Möhner and Chris-tian Dietzsch for technical help. Financial support by theDeutsche Forschungsgemeinschaft (DFG) is gratefully ac-knowledged.
References
[1] A. Halstead, R.D. Rawlings, J. Mater. Sci. 20 (1985) 1248.[2] K. Chen, S.M. Allen, J.D. Livingson, Mat. Res. Soc. Symp. Proc.
288 (1993) 373.[3] D.R. Johnson, Processing and Mechanical Properties of NiAl-Based
In-situ Composites, PhD Thesis, NASA Contractor Report, Universityof Tennessee, 1994.
[4] F. Stein, M. Palm, G. Sauthoff, in: Proceedings of the Symposium:Werkstoffwoche’98, vol. VI, Wiley-VCH, Weinheim, Germany, 1998,p. 515.
[5] F. Stein, G. Sauthoff, M. Palm, The Fe-Al-Zr system, private com-munication, 2003.
[6] F. Stein, M. Palm, G. Sauthoff, Struktur und Verformungsverhal-ten von Fe-Al-Zr-Legierungen mit verstärkenden intermetallischenPhasen für Hochtemperaturanwendungen (Final Report DFG PA705/3-1), 2001.
[7] A. Wasilkowska, M. Bartsch, F. Stein, M. Palm, K. Sztwiertnia, G.Sauthoff, U. Messerschmidt, Part I of this paper, this issue.
[8] A. Wasilkowska, M. Bartsch, M. Palm, F. Stein, G. Sauthoff, U.Messerschmidt, in: Proceedings of the Conference: “20 Years De-partment of Physical Metallurgy and Materials Technology”, March2001, Technical University Gabrovo, Bulgaria, 2001, p. 33.
[9] C. Schlesier, J.H. Schneibel, R.P. Wahi, Z. Metall. 88 (1997) 810.[10] K. Vedula, in: J.H. Westbrook, R.L. Fleischer (Eds.), Intermetallic
Compounds, vol. 2, Wiley, Chichester, 1995, p. 199.[11] H. Neuhäuser, C. Schwink, in: H. Mughrabi (Ed.), Materials Science
and Technology, vol. 6, VCH, Weinheim, Germany, 1993, p. 191.[12] H. Suzuki, in: F.R.N. Nabarro (Ed.), Dislocations in Solids, vol. 4,
North-Holland, Amsterdam, 1979, p. 191.[13] H. Hattendorf, A.R. Büchner, Z. Metall. 83 (1992) 9.[14] R.E. Stoller, S.J. Zinkle, J. Nuclear Mater. 283–287 (2000) 349.[15] J. Herrmann, Untersuchungen zur Stuktur und zum mechanischen
Verhalten von Fe-reichen Fe-Al-Legierungen, VDI-Verlag, Düssel-dorf, 2000.
[16] J. Herrmann, G. Inden, G. Sauthoff, Acta Mater. 51 (2003) 2847.[17] J. Herrmann, G. Inden, G. Sauthoff, Acta Mater. 51 (2003) 3233.[18] G. Frommeyer, E.J. Drewes, B. Engl, Rev. metall. CIT (2000) 1245.[19] H. Hattendorf, A.R. Büchner, Z. Metall. 81 (1990) 739.[20] A.H. Cottrell, Phil. Mag. 74 (1953) 829.[21] J.P. Hirth, J. Lothe, Theory of Dislocations, Wiley, New York, 1982.[22] D. Baither, PC programme for dislocation line energy and line tension
in anisotropic elasticity.[23] H.J. Leamy, E.D. Gibson, F.X. Kayser, Acta Metall. 15 (1967)
1827.[24] J. D’Ans, E. Lax, Taschenbuch für Chemiker und Physiker, vol. 3,
H. Blachnik (Ed.), Springer-Verlag, Berlin, 1998.[25] V.S. Raghunathan, B.D. Sharma, Phil. Mag. A 43 (1981) 427.[26] M. Eggersmann, H. Mehrer, Phil. Mag. A 80 (2000) 1219.[27] U. Messerschmidt, S. Guder, D. Häussler, M. Bartsch, Mat. Res.
Soc. Symp. Proc. 652 (2001) Y11.6.1.[28] G.J. Taylor, Proc. Roy. Soc. A145 (1934) 362.[29] J.G. Sevillano, in: Materials Science and Technology, vol. 6, H.
Mughrabi (Ed.), VCH, Weinheim, Germany, 1993, p. 19.[30] L. Durand, Mater. Sci. Technol. 3 (1987) 105.[31] M. Weinhagen, B. Köhler, J. Wolff, Th. Hehenkamp, Defects Diffu-
sion Forum 143–147 (1997) 449.
Related Documents


