University of Arkansas, Fayeeville ScholarWorks@UARK eses and Dissertations 8-2012 Plasmonic Pervaporation via Gold Nanoparticle- Functionalized Nanocomposite Membranes Aaron Russell University of Arkansas, Fayeeville Follow this and additional works at: hp://scholarworks.uark.edu/etd Part of the Complex Fluids Commons , Nanoscience and Nanotechnology Commons , and the ermodynamics Commons is Dissertation is brought to you for free and open access by ScholarWorks@UARK. It has been accepted for inclusion in eses and Dissertations by an authorized administrator of ScholarWorks@UARK. For more information, please contact [email protected], [email protected]. Recommended Citation Russell, Aaron, "Plasmonic Pervaporation via Gold Nanoparticle-Functionalized Nanocomposite Membranes" (2012). eses and Dissertations. 476. hp://scholarworks.uark.edu/etd/476

Welcome message from author
This document is posted to help you gain knowledge. Please leave a comment to let me know what you think about it! Share it to your friends and learn new things together.
Transcript

University of Arkansas, FayettevilleScholarWorks@UARK
Theses and Dissertations
8-2012
Plasmonic Pervaporation via Gold Nanoparticle-Functionalized Nanocomposite MembranesAaron RussellUniversity of Arkansas, Fayetteville
Follow this and additional works at: http://scholarworks.uark.edu/etd
Part of the Complex Fluids Commons, Nanoscience and Nanotechnology Commons, and theThermodynamics Commons
This Dissertation is brought to you for free and open access by ScholarWorks@UARK. It has been accepted for inclusion in Theses and Dissertations byan authorized administrator of ScholarWorks@UARK. For more information, please contact [email protected], [email protected].
Recommended CitationRussell, Aaron, "Plasmonic Pervaporation via Gold Nanoparticle-Functionalized Nanocomposite Membranes" (2012). Theses andDissertations. 476.http://scholarworks.uark.edu/etd/476

PLASMONIC PERVAPORATION VIA GOLD NANOPARTICLE-FUNCTIONALIZED
NANOCOMPOSITE MEMBRANES
PLASMONIC PERVAPORATION VIA GOLD NANOPARTICLE-FUNCTIONALIZED
NANOCOMPOSITE MEMBRANES
A dissertation submitted in partial fulfillment
of the requirements for the degree of
Doctor of Philosophy in Chemical Engineering
By
Aaron Gene Russell
University of Arkansas
Bachelor of Science in Chemical Engineering, 2004
August 2012
University of Arkansas

ABSTRACT
Butanol derived from biological feedstocks has significant potential as a liquid fuel
source, but the separation methods used in its production can be prohibitively expensive and are
therefore currently the subject of extensive research. Pervaporation is a promising membrane
process that is effective in butanol separations, but involves a large energy demand. This study
examines the possibility of increasing flux and energy efficiency in pervaporation via plasmonic
heating of gold nanoparticle-functionalized, polymer nanocomposite membranes (AuNCMs) in
lieu of conventional feed heating. An economic analysis demonstrated that plasmonic
pervaporation could achieve significant reductions in energy usage and utility cost in butanol
production. A novel plasmonic pervaporation system was constructed to evaluate the process
experimentally. The system included uniform laser excitation and infrared thermal analysis of
the membrane surface, as well as automated operation. AuNCMs, fabricated by reduction of
tetrachloroauric acid by the polymer crosslinker, demonstrated stable temperature increases and
flux enhancements (>100%) that increased with gold content and incident laser power.
A thermal model was developed to describe heat transfer in the system and enable
calculation of membrane laser absorption efficiencies and quantification of energy loss modes.
An economic investigation of the system performance was conducted by coupling the thermal
model with an empirical model for flux prediction. The analysis showed that the current system
performance was not sufficient to reduce the energy demand/utility cost versus conventional feed
heating due to: i) heat loss to the feed and ii) low laser absorption efficiencies. The latter effect
was significantly more detrimental economically and, if improved, could result in a 7-fold
increase in energy efficiency.

A spectroscopic analysis method was developed to approximate AuNCM physical and
optical properties to provide insights into why AuNCM absorption was low. The results
indicated that only a small fraction of added Au was effectively being converted to desirable,
light-absorbing nanoparticles. Evidence suggested that the remaining Au formed large, light-
scattering particles, reducing the absorption efficiency of the AuNCMs. The analysis
demonstrated that optimization of fabrication methods could potentially improve absorption
efficiencies to near 100%, making plasmonic pervaporation economically superior to
conventional methods.

This dissertation is approved for recommendation
to the Graduate Council.
Dissertation Director:
__________________________________________
Dr. D. Keith Roper
Dissertation Committee:
__________________________________________
Dr. Jamie Hestekin
__________________________________________
Dr. Tom Spicer
__________________________________________
Dr. Darin Nutter
__________________________________________
Dr. Ingrid Fritsch
©2012 by Aaron Gene Russell
All Rights Reserved

DOCTORAL DUPLICATION RELEASE I hereby authorize the University of Arkansas Libraries to duplicate this dissertation when needed for research and/or scholarship.
Agreed
Aaron Russell
Refused
Aaron Russell

ACKNOWLEDGEMENTS
This work would not have been possible without help from many people. I would first
like to thank my advisor, Dr. D. Keith Roper, for his help and guidance throughout this process.
He was always there to provide direction and assistance when I needed it, or to withhold it when
he knew it would benefit me more to work it out on my own. I thank my co-advisor, Dr. Jamie
Hestekin, not only for his support in my research, but also for providing me with opportunities to
get involved in projects outside the lab. I also thank my committee members, Dr. Tom Spicer,
Dr. Darrin Nutter, and Dr. Ingrid Fritsch, for their participation and support of my work.
I have sincerely enjoyed and benefitted in many ways from working with and learning
from other graduate students – Dr. Wonmi Ahn, Phillip Blake, Gyoung Jang, Braden Harbin,
Laura Velasco, Drew Dejarnette, Jeremy Dunklin, Tom Potts, and Alex Lopez. I have also been
able to work with many excellent undergraduate students in the lab – Keith Berry, Matt
McKnight, Adam Sharp, Jenny Pestel, Stefan Schwarz, Jacob Morgan, and many more. I learned
a great deal working with them and am thankful for having the opportunity.
I thank all the faculty members and staff of the Ralph E. Martin Department of Chemical
Engineering for eight wonderful years of education, as well as Dr. Greg Salamo, Dr. Morgan
Ware, and Dr. Dorel Guzun of the Physics Department for their assistance and use of equipment
and facilities. I am also grateful for the support of Dr. Omnia El-Hakim and the National
Science Foundation Graduate Research Fellowship Program and the Walton Family Charitable
Support Foundation.
Lastly, I would like to thank my parents, Jeff and Sharon, and my brother and sister, Josh
and Chelsea, for everything they have done and continue to do to support me.

DEDICATION
I dedicate this dissertation to my incredible wife, Jamie. Over the past four years, she has
been an unfailing source of encouragement and support. I would not be where I am without her.

TABLE OF CONTENTS CHAPTER 1.................................................................................................................................... 1
1.1 MOTIVATION OF THE PRESENT WORK .............................................................................. 1
1.2 PLASMONIC HEATING IN GOLD NANOPARTICLES ............................................................. 3
1.3 HYPOTHESIS..................................................................................................................... 4
1.4 POTENTIAL FOR ECONOMIC IMPACT ................................................................................. 4
1.5 SIGNIFICANT ADVANCES OF THE PRESENT WORK ............................................................ 5
CHAPTER 2.................................................................................................................................... 9 2.1 SIGNIFICANCE OF THE PRESENT WORK ............................................................................ 9
2.2 PLASMONIC PERVAPORATION SYSTEM ............................................................................11
2.2.1 LASER PERVAPORATION CELL AND EXPERIMENTAL SETUP........................................11
2.2.2 AUTOMATED OPERATION AND DATA CAPTURE......................................................... 12
2.2.3 GOLD-PDMS MEMBRANES ..................................................................................... 13
2.3 PERVAPORATION PERFORMANCE .................................................................................... 15
2.3.1 THERMAL BEHAVIOR IN OPERATION ........................................................................ 15
2.3.2 FLUX ENHANCEMENT .............................................................................................. 18
2.3.3 SOLUTION DIFFUSION MODEL ................................................................................. 20
2.3.4 AUNCM PERMEANCE .............................................................................................. 23
2.4 CONCLUSIONS ................................................................................................................ 24
CHAPTER 3.................................................................................................................................. 35 3.1 SIGNIFICANCE OF THE PRESENT WORK .......................................................................... 35
3.2 THERMOPLASMONIC MODELING .................................................................................... 36
3.2.1 CAPILLARY THERMAL MODEL ................................................................................. 36
3.2.2 PLASMONIC PERVAPORATION MODEL ...................................................................... 39
3.2.3 ACCURACY OF INFINITE FIN APPROACH................................................................... 41
3.2.4 MODEL RESULTS ...................................................................................................... 42
3.3 PERVAPORATION MODELING .......................................................................................... 47
3.3.1 ACTIVATION ENERGY ANALYSIS .............................................................................. 48

3.3.2 PERSPECTIVES ON AUNCM PERMEANCE ................................................................. 49
3.3.3 FLUX PREDICTION .................................................................................................... 51
3.4 COUPLED MODEL FOR ECONOMIC ANALYSIS ................................................................. 52
3.5 CONCLUSIONS ................................................................................................................ 54
CHAPTER 4.................................................................................................................................. 63
4.1 SIGNIFICANCE OF THE PRESENT WORK .......................................................................... 63
4.2 UV-VIS SPECTROSCOPIC ANALYSIS ............................................................................... 65
4.2.1 SPECTRAL ADJUSTMENT .......................................................................................... 66
4.2.2 SPECTRAL RESULTS .................................................................................................. 67
4.3 ESTIMATION OF AUNP CONCENTRATION ....................................................................... 69
4.3.1 INSIGHTS INTO AUNP GROWTH ............................................................................... 71
4.3.2 GOLD UTILIZATION .................................................................................................. 72
4.4 EVIDENCE OF THE PRESENCE OF LARGE PARTICLES ....................................................... 73
4.5 CONCLUSIONS ................................................................................................................ 76
CHAPTER 5.................................................................................................................................. 83
5.1 SUMMARY OF FINDINGS ................................................................................................. 83
5.1.1 PLASMONIC PERVAPORATION SYSTEM AND PERFORMANCE ..................................... 83
5.1.2 THERMAL MODELING .............................................................................................. 84
5.1.3 PERVAPORATION MODELING AND ECONOMIC ANALYSIS .......................................... 85
5.1.4 AUNCM CHARACTERIZATION ................................................................................. 85
5.2 ONGOING AND FUTURE WORK ....................................................................................... 86
5.2.1 IMPROVEMENTS IN CURRENT SYSTEM ..................................................................... 86
5.2.2 INVESTIGATION OF SELECTIVITY .............................................................................. 86
5.2.3 AUNCM THERMAL PROPERTIES .............................................................................. 87
5.2.4 MEMBRANE OPTIMIZATION AND CHARACTERIZATION ............................................. 87
5.2.5 ADDITIONAL APPLICATIONS ..................................................................................... 88

LIST OF FIGURES
Figure 1.1. Illustration of thermoplasmonic heating in AuNPs on silica substrates. ...................... 7
Figure 1.2. Reduction in energy usage and utility costs as a function of light source efficiency in plasmonic pervaporation. ................................................................................................................ 8
Figure 2.1. Schematic of the experimental plasmonic pervaporation system and the laser excited pervaporation cell. Image shows plasmonic pervaporation cell during operation....................... 26
Figure 2.2. Values of laser power extinction fraction (532 nm) for AuNCMs from three different batches at four different values of gold content. Each AuNCM is pictured in the inset. Extinction fractions of the glass substrate and bare PDMS were measured independently and have been factored out of the values in the figure – therefore a 0.0% Au membrane has an extinction fraction of zero on this scale. ........................................................................................................ 27
Figure 2.3. Box and whisker plots of membrane thermal distributions during the 5 -10 h period of pervaporation experiments for the four membranes (0.0, 0.1, 0.4, and 0.6% Au) at four levels of laser irradiation (left to right, 0, 250, 500, and 750 mW). The mean temperature for each point is also shown (red diamonds). Inset shows a representative spatial thermal distribution across the membrane. ...................................... 28
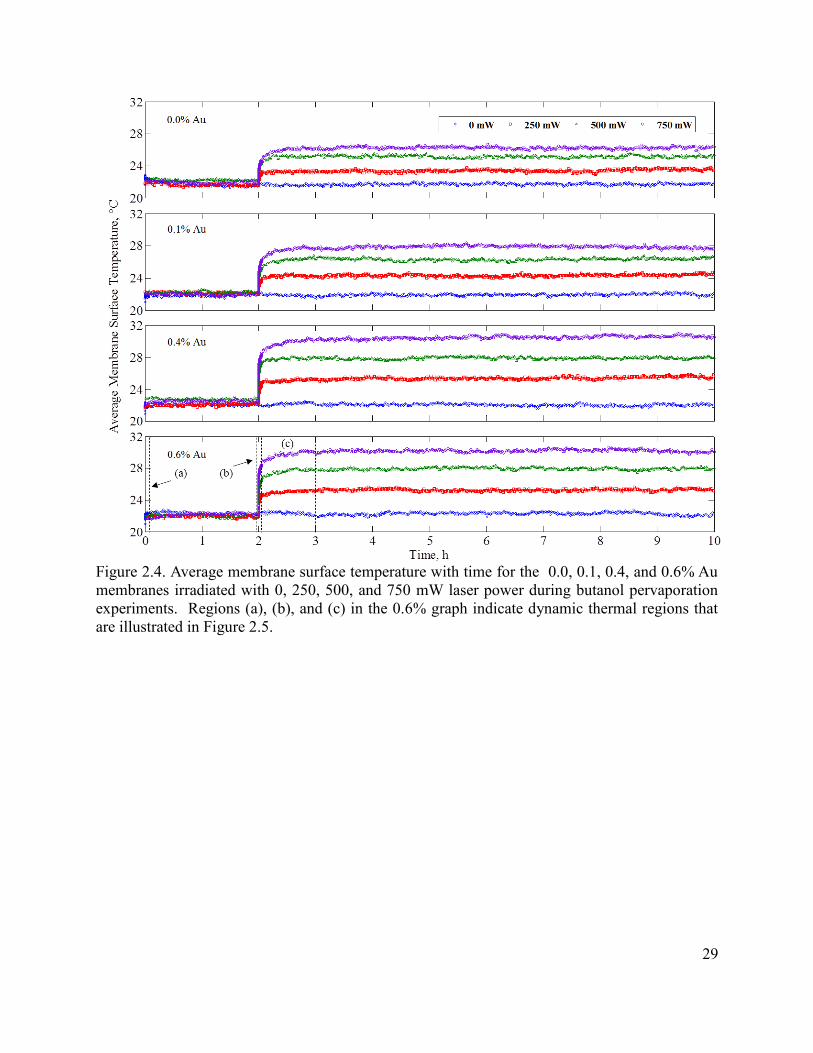
Figure 2.4. Average membrane surface temperature with time for the 0.0, 0.1, 0.4, and 0.6% Au membranes irradiated with 0, 250, 500, and 750 mW laser power during butanol pervaporation experiments. Regions (a), (b), and (c) in the 0.6% graph indicate dynamic thermal regions that are illustrated in Figure 2.5. .......................................................................................................... 29
Figure 2.5. Average temperature of a 0.6% AuNCM with time during the three dynamic thermal regions of the plasmonic pervaporation experiments (750 mW laser irradiation): (a) when the pump is turned on (diamonds), (b) when the laser is turned on and the thermal mass of the membrane dominates (squares), and (c) region after turning on the laser in which the thermal mass of butanol and the cell wall dominate (triangles). Regions (a), (b), and (c) correspond to those indicated in Figure 2.4. ........................................................................................................ 30
Figure 2.6. The average steady state temperature change during butanol pervaporation for membranes of different Au content as a function of incident laser power. Error bars show one standard deviation of 300 measurements taken over the period of 5 h......................................... 31
Figure 2.7. Flux of butanol as a function of time for the four membranes with varying incident laser powers. The data points have been smoothed (boxcar 3) and shifted in time such that the laser is turned on at t=2 h. A dynamic region (shaded) follows t=2 h during which steady state is reached. ......................................................................................................................................... 32
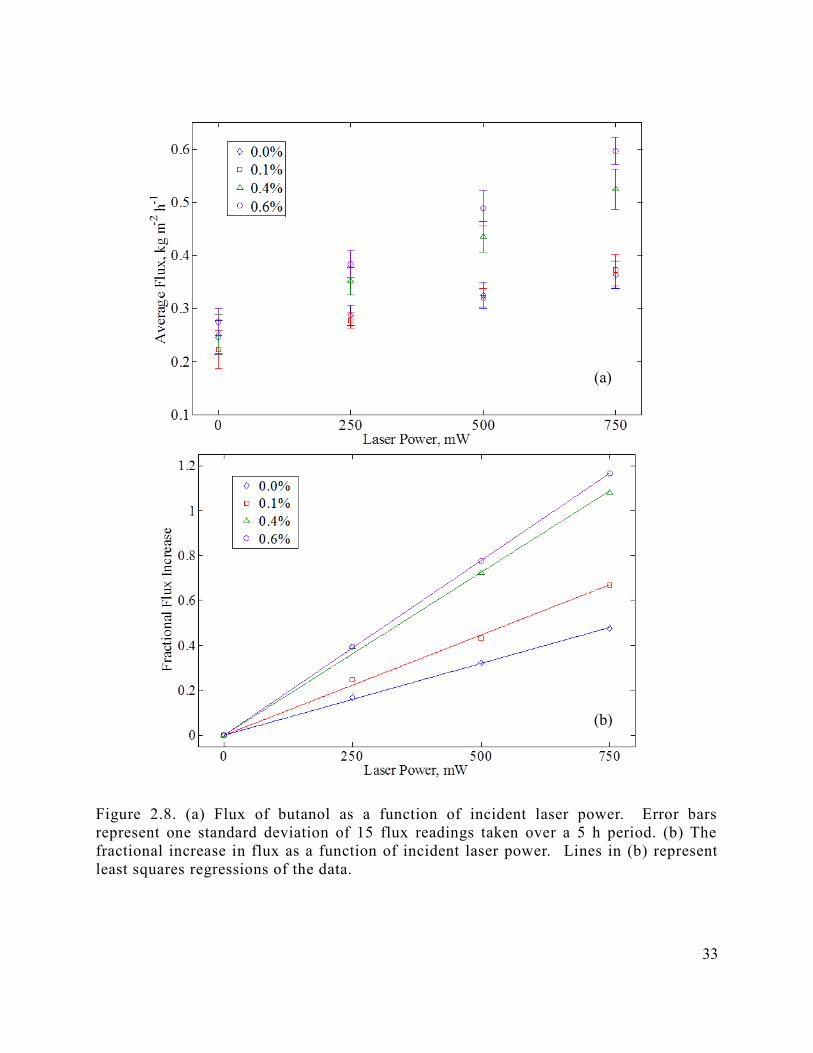
Figure 2.8. (a) Flux of butanol as a function of incident laser power. Error bars represent one standard deviation of 15 flux readings taken over a 5 h period. (b) The fractional increase in flux as a function of incident laser power. Lines in (b) represent least squares regressions of the data. ....................................................................................................................................................... 33

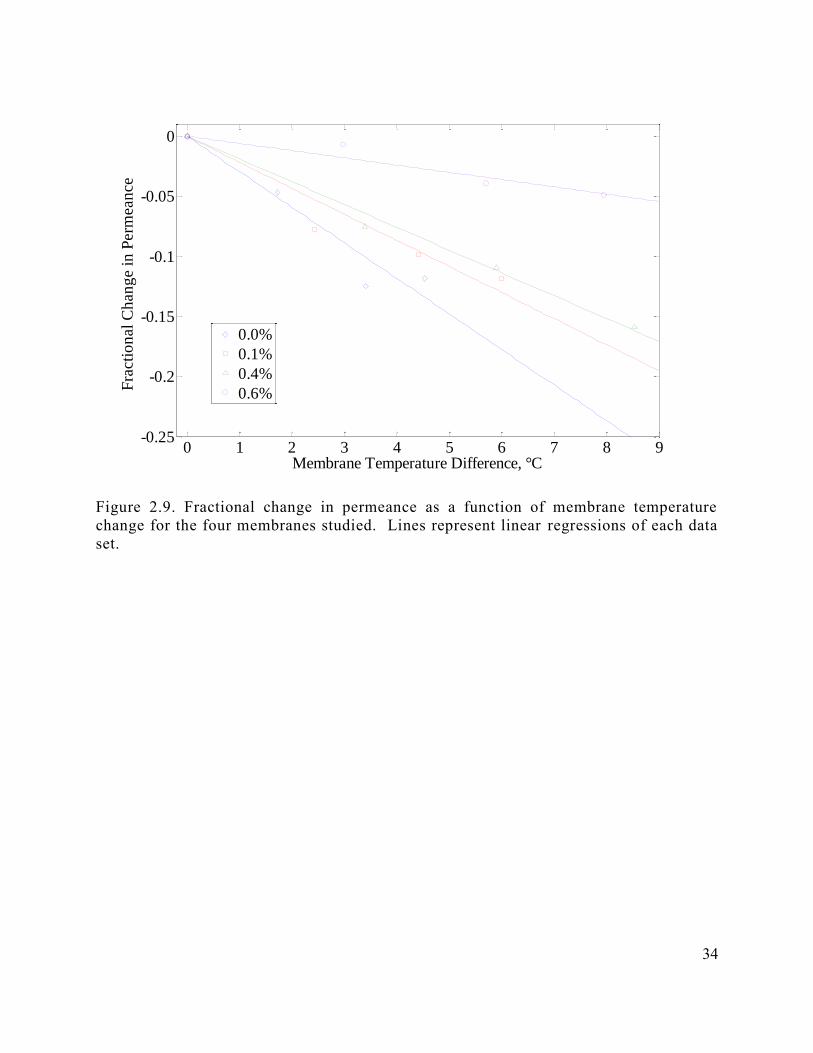
Figure 2.9. Fractional change in permeance as a function of membrane temperature change for the four membranes studied. Lines represent linear regressions of each data set........................ 34
Figure 3.1. Diagram of heat transfer in an open, silica capillary plated with AuNPs................... 55
Figure 3.2. Schematic of heat transfer from the laser heated AuNCM in the plasmonic pervaporation system. ................................................................................................................... 56
Figure 3.3. Comparison of feed cell temperatures measured experimentally and calculated using infinite fin model for each membrane at 250, 500, and 750 mW laser irradiation (left to right). 57
Figure 3.4. Membrane assembly (membrane and stainless steel mesh) laser absorbance fractions for the four membranes at three levels of incident laser power. Representation of the cumulative uncertainty inherent to these values is not shown here, but is discussed at length in Chapter 3. . 58
Figure 3.5. Energy consumed by vaporization of butanol permeate on two different bases: i) as a percentage of the incident light and ii) as a percentage of the absorbed light (incident light multiplied by the absorbance fractions in Figure 3.4) at 250, 500, and 750 mW laser irradiation (left to right). ................................................................................................................................. 59
Figure 3.6. Comparison of experimentally measured fluxes and simulated fluxes generated by an empirical model for membrane permeance based on Au content. ................................................ 60
Figure 3.7. Realization (shaded regions) of predicted reduction in energy demand (blue) and utility cost (red) from experimental plasmonic pervaporation results and modeling. Lines show original ideal case (Figure 1.2), shaded regions outline predicted realization according to Au content (top = 0.6% Au, bottom = 0.0% Au) based on (a) absorbed light and (b) incident light. 61
Figure 4.1. Unadjusted (a) and laser extinction adjusted (b) UV-vis spectra of 12 AuNCMs (three batches at the 4 concentrations shown). Solid, dashed, and dotted lines indicate batch 1, 2, and 3, respectively. .................................................................................................................................. 77
Figure 4.2. Localized surface plasmon wavelength (a) and average AuNP diameter (b) for the 12 AuNCMs (three batches at the 4 concentrations shown). ............................................................. 78
Figure 4.3. Values of estimated laser power consumption (excludes scattered laser light) fraction for Au -NCMs from three different batches at four different values of gold content. ........................................................................................................................................ 79
Figure 4.4. Estimated concentration of AuNPs (a) of the average diameters given in Figure 4.2 and percent conversion of added Au to AuNPs of this type (b). ................................................... 80
Figure 4.5. Increasing opaqueness of AuNCMs with increasing Au content indicating increasing concentration of large particles. .................................................................................................... 81
Figure 4.6. Simulations of transmittance fraction of 532 nm light due to particle scattering for four concentrations of AuNCM for particle diameters from 0-700 nm and for 0-100% conversion of total Au content to particles of that size. .................................................................................. 82

LIST OF TABLES
Table 3.1. Thermoplasmonic model results for each pervaporation data set. All values are in units of mW. .................................................................................................................................. 62
LIST OF NOMENCLATURE ABBREVIATIONS
Au
AuNCM
AuNP
CA
IR
LSPR
NP
PDMS
PI
SD
SS
SS ∆T
TCA
TEM
SYMBOLS a
A1
A2
A506
AE
Gold Gold nanoparticle-functionalized nanocomposite membrane Gold nanoparticle
Cellulose acetate
Infrared
Localized surface plasmon resonance Nanoparticle
Polydimethylsiloxane
Polyimide
Solution diffusion Steady state Steady state temperature change Tetrachloroauric acid Transmission electron microscopy Conversion factor from liquid level change to volume change [pixels mL-1]
Empirical fitting constant for permeation activation energy [J g-1]
Empirical fitting constant for permeation activation energy [J g-1]

Spectral extinction
at 506 nm
Area for
evaporation in the
capillary system
[m2]
Ac
Afin
ap
As
Au%
Aλ
B1
B2
C%
Cabs
cAuNP
Cext
ci
ci,0
ci,0,(m)
ci,l(m)
Cp,f
Cp,j
D
Di
Ep
hconv
hfin
Area for conduction heat transfer [m2]
Fin cross-sectional area [m2]
Empirical fitting constant for the molar extinction coefficient
Area for convention and radiation heat transfer in capillary system [m2]
Gold mass percent in membrane [%]
Spectral extinction at wavelength, λ
Empirical constant for permeation activation energy [mol cm-2
s-1
torr-1
]
Empirical fitting constant for permeation activation energy
Percentage of Au converted to 532 nm-absorbing particles [%]
Absorbance cross-section [m-2
]
Membrane nanoparticle concentration [NP mL-1
]
Extinction cross-section [m-2
]
Molar concentration of i [mol m-3
]
Molar concentration of i in the feed [mol cm-3
]
Molar concentration of i in the membrane on the feed side [mol m-3
]
Molar concentration of i in the membrane on the permeate side [mol m-3
]
Heat capacity of the fluid [J g-1
K-1
]

Heat capacity of i
[J g-1
K-1
]
Particle diameter
[nm]
Diffusivity of i
[cm2 s-1]
Activation energy
of permeation [J g-
1]
Convection heat
transfer coefficient
[W m-2
K-1
]
Convection heat
transfer coefficient
for an infinite fin
[W m-2
K-1
]

Hi
i
I
IT
j
Ji
k
kc
kfin
KG
i
KG
i,0
KL
i
kp
l
L
ṁ
mAu
mf
mj
MWAu
MWf
MWi
T(x)
Henry’s law constant for i [torr cm-3
mol-1
]
Arbitrary component designation
Incident laser power [W]
Transmitted laser power [W]
Mass flux of butanol [kg m-2
h-1
]
Molar flux of i [mol cm-2
s-1
]
Thermal conductivity of capillary system mount [W m-1
K-1
]
Capillary system mass transfer coefficient [cm2 s
-1]
Thermal conductivity of an infinite fin [W m-1
K-1
]
Gas phase sorption coefficient of i [mol cm-3
torr-1
]
Pre-exponential factor for the gas phase sorption coeff. of i [mol cm-3
torr-1
]
Liquid phase sorption coefficient of i
Empirical fitting constant for the molar extinction coefficient
Membrane thickness [m]
Conduction length in capillary system [cm]
Mass transfer rate [g s-1
]
Mass of gold added to membrane solution [g]
Mass of fluid added to capillary [g]
Mass of system component j
Molecular weight of gold [g mol-1
]
Fluid molecular weight [g mol-1
]
Molecular weight of i [g mol-1
]
Temperature as a function of location on an infinite fin [°C]
NA
NAu
nm
p
P1
P2
PG
i
pi,0
pi,l
Qabs
Qcond
Qconv
qexp
Qext
Qfin
QI
QO,i
Qrad
R
T
Tamb
Avogadro’s constant [atoms mol-1
]
Number of gold atoms in a gold nanoparticle [atoms NP-1
]
Refractive index of the polymer matrix
Perimeter of an infinite fin [m]
Total pressure on the feed side [torr]
Total pressure on the permeate side [torr]
Gas phase permeability coefficient [mol m-1
s-1
torr-1
]
Vapor pressure of i on the feed side [torr]
Vapor pressure of i on the permeate side [torr]
Permeance of i [mol m-2
s-1
torr-1
]
Pre-exponential factor for permeance of i [mol m-2
s-1
torr-1
]
Incident laser power absorbed (consumed) [W]
Power loss by conduction [W]
Power loss by convection [W]
Heat of isothermal expansion [J g-1
]
Incident laser power extinguished [W]
Power loss from an infinite fin [W]
Power input from laser [W]
Power loss from mode i [W]
Power loss by radiation [W]
Gas constant [J g-1
K-1
]
Temperature [°C]
Temperature of ambient environment [°C]
iP
0,iP

Tb
V
x
np
r
GREEK LETTERS
∆Cf
∆HS
∆Hv,f
∆p
∆t
ε
ελ
ηT
λ
ρ
σ
Φp
Base temperature of an infinite fin [°C]
Volume of membrane solution [mL]
Distance along an infinite fin [m]
Refractive index of particles
Particle radius [nm]
Concentration difference [mol cm-3
]
Heat of solution [J g-1
]
Heat of vaporization [J g-1
]
Change in liquid level [pixels]
Time between experimental readings [min]
Emissivity
Molar extinction coefficient [L m-1
mol-1
]
Nanoparticle transduction efficiency
Wavelength [nm]
Density of butanol [kg m-3
]
Stefan-Boltzmann constant [W m-2
K-4
]
Particle volume fraction

1
CHAPTER 1
INTRODUCTION TO PLASMONIC PERVAPORATION
1.1 MOTIVATION OF THE PRESENT WORK
Reduction of society’s dependence on fossil fuels remains one of the most pressing issues
facing scientists and engineers today. Considerable research is being done to increase the
viability of alternative energy sources such as wind, solar, and biofuels. In recent years, butanol
derived from biological sources, including bacterial fermentation of cellulosic feedstocks and
algae, has become increasingly popular as a potential liquid fuel source. Butanol boasts many
significant advantages relative to other biofuels. Most notably, butanol has the ability to be used
directly in unmodified gasoline engines, either pure or blended with gasoline in any
concentration, and it is not highly corrosive and can therefore be transported using the current
infrastructure. Additionally, it has a higher energy density and lower vapor pressure than ethanol
– the most widely used biofuel.1, 2
These benefits make butanol highly attractive as part of the
eventual solution to society’s energy needs.
Since butanol is produced in a dilute aqueous solution, separation comprises a large part
of the production costs. In general, the economy of scale for chemical production favors large,
centralized operations, but for some biofuel feedstocks like those used for butanol production,
the cost of material transport can dominate and shift the economic balance toward smaller,
localized facilities. At these small scales, the economic feasibility of conventional distillation
2
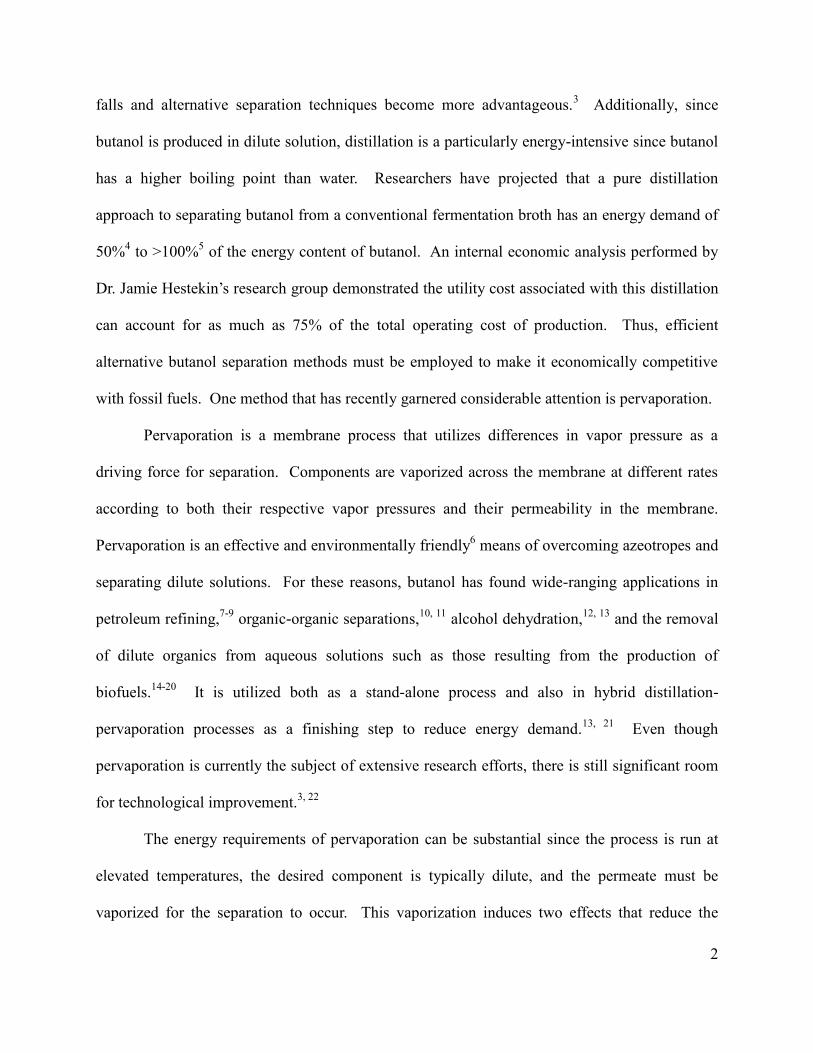
falls and alternative separation techniques become more advantageous.3 Additionally, since
butanol is produced in dilute solution, distillation is a particularly energy-intensive since butanol
has a higher boiling point than water. Researchers have projected that a pure distillation
approach to separating butanol from a conventional fermentation broth has an energy demand of
50%4 to >100%
5 of the energy content of butanol. An internal economic analysis performed by
Dr. Jamie Hestekin’s research group demonstrated the utility cost associated with this distillation
can account for as much as 75% of the total operating cost of production. Thus, efficient
alternative butanol separation methods must be employed to make it economically competitive
with fossil fuels. One method that has recently garnered considerable attention is pervaporation.
Pervaporation is a membrane process that utilizes differences in vapor pressure as a
driving force for separation. Components are vaporized across the membrane at different rates
according to both their respective vapor pressures and their permeability in the membrane.
Pervaporation is an effective and environmentally friendly6 means of overcoming azeotropes and
separating dilute solutions. For these reasons, butanol has found wide-ranging applications in
petroleum refining,7-9
organic-organic separations,10, 11
alcohol dehydration,12, 13
and the removal
of dilute organics from aqueous solutions such as those resulting from the production of
biofuels.14-20
It is utilized both as a stand-alone process and also in hybrid distillation-
pervaporation processes as a finishing step to reduce energy demand.13, 21
Even though
pervaporation is currently the subject of extensive research efforts, there is still significant room
for technological improvement.3, 22
The energy requirements of pervaporation can be substantial since the process is run at
elevated temperatures, the desired component is typically dilute, and the permeate must be
vaporized for the separation to occur. This vaporization induces two effects that reduce the

3
efficiency of the process: i) a thermal gradient from the feed to the permeate side of the
membrane which reduces mass transfer23-25
and ii) feed cooling which results in the need for
additional heating between membrane stages.26
The latter effect significantly increases the
process cost and is the subject of many investigations on reducing the energy demand of the
process. Other significant issues with current pervaporation technology include low production
rate (flux) and loss of efficiency due to concentration polarization in the separation of dilute
organics from aqueous solutions.22
This study examines a possible means of addressing each of
these issues by delivering energy to the membrane itself.
1.2 PLASMONIC HEATING IN GOLD NANOPARTICLES
Gold nanoparticles (AuNP) have generated wide interest due to their ability to undergo
thermoplasmonic heating induced by electromagnetic energy. Thermoplasmonic heating occurs
when incident light at resonant frequencies is absorbed by the NP causing collective oscillations
of conduction electrons on the NP surface. This resonant electron oscillation is known as
localized surface plasmon resonance (LSPR)27
and as it decays, the excited electrons couple with
phonons (i.e. crystal lattice vibrations) in the NP causing an increase in thermal energy which is
then transferred to the NP environment by phonon-phonon coupling (see Figure 1.1).28-30
This
effect has been exploited in biomedical therapeutics including non-invasive photothermal tumor
cell ablation31-33
or targeted release of encapsulated materials,34
local protein or RNA
unfolding,35
nanoscale substrate modification,36
nanomaterials modification,37-39
and improved
performance of catalytic systems.40-42
NP composition, size, morphology, and dielectric environment all affect the fraction of
incident light that is transmitted, scattered, or absorbed. The fraction of extinguished light
(scattered plus absorbed light) that is absorbed and converted to heat is defined as the

4
transduction efficiency.43
For AuNPs under certain conditions (size, refractive index, etc.), the
transduction efficiency approaches 100% meaning that virtually all extinguished light is
absorbed and converted to heat.43-45
Thus, AuNPs are highly efficient at capturing light and, with
their incorporation in certain systems, can be used to efficiently transduce light to thermal energy
in a target region while the remaining elements of the system are relatively unaffected.42
1.3 HYPOTHESIS
The hypothesis guiding this work was that the targeted input of energy via plasmonic
heating of AuNP-functionalized, polymer nanocomposite membranes (AuNCM) will increase
flux and energy efficiency in the pervaporation of butanol. Direct heating of the membrane in
this manner would eliminate the need to heat the entire feedstock as well as the need to reheat the
retentate between membrane stages since the heat of vaporization for the permeate would be
provided in the membrane. In practice, this could be achieved by highly efficient LED excitation
of the AuNP by an optical fiber/diffuser within the membrane module. This process would
benefit both a purely pervaporative separation as well as the integrated pervaporation-distillation
approaches discussed above wherein necessary heat makeup between pervaporation modules
causes both significant operating and capital costs.13
1.4 POTENTIAL FOR ECONOMIC IMPACT
Two competing factors will determine the cost savings of the proposed process: 1) the
reduction in capital and utility costs due to increased flux and decreased energy demand and 2)
the increased costs associated with adding gold (Au) to the membrane and using electrical (LED)
heating as opposed to steam. An initial analysis of energy demand and utility cost reduction was
performed to estimate the savings that could be achieved from plasmonic pervaporation. The
analysis used a basis of a butanol fermentation from which butanol would be removed

5
continuously by pervaporation before recycle of the broth to the fermenter. The energy
requirements include: 1) latent heat needed to vaporize permeate, 2) energy needed to heat
material to the pervaporation utility temperature, and 3) energy to cool retentate for recycle to the
fermenter. Pervaporation occurs at a selectivity of 45 and total flux of 518 g/m2
h at 70 °C.19
Energy is consumed in the system by steam heating the broth from the fermentation operating
temperature of 37 °C to 70 °C to feed the pervaporation system at a feed rate of 1440 mL/min
and cooling of retentate with cooling water from 70 °C to 37 °C (minus the energy lost from
evaporation) to recycle to the fermentor.26, 46
Plasmonic heating of the membrane was assumed
to eliminate the need for steam heating and water cooling. This would occur as an increase of
membrane temperature from laser irradiation to achieve an equivalent flux, but with no loss of
energy by any mechanism other than vaporization.
The result is a reduction in energy use and utility cost by factors up to 12.2- and 5.7-fold,
respectively (see Figure 1.2). These reduction factors increase in proportion to the efficiency of
converting electricity to monochromatic light. This scenario assumes an ideal system in which
there is 100% absorption of incident light and no loss of heat to the feed. It is provided as the
limiting case for the system described above. The utility cost reduction factor at a large scale is
less than the energy reduction factor because cooling water and steam are cheaper at a large scale
than electricity. Consideration of the capacity for reduction of energy demand and utility cost
combined with the fact that energy cost accounts for a large percentage of the production cost of
biobutanol provides a strong basis of support for the potential cost savings of plasmonic
pervaporation.
1.5 SIGNIFICANT ADVANCES OF THE PRESENT WORK

6
A considerable amount of research and development is required to make plasmonic
pervaporation a viable process. The significant advances made in this study are listed below:
1. A plasmonic pervaporation system was developed that enabled uniform laser excitation of
the membrane, thermal analysis of the entire membrane surface, and automated operation
and data capture.
2. AuNCMs were fabricated in varying concentration and utilized in the plasmonic
pervaporation system, demonstrating flux enhancements up to 117% that increased
according to Au content and incident laser power.
3. The thermal behavior of the AuNCMs in operation was described using a continuum heat
transfer model to quantify the modes of energy loss from the system and the AuNCM
absorption efficiencies.
4. The heat transfer model was coupled with an empirical relation to predict flux based on Au
content and incident laser power to estimate realization of the economic impact predicted
above.
5. A method was developed to estimate AuNCM properties (concentration, gold utilization,
etc.) based on laser extinction, spectral analysis, Beer-Lambert’s law, and Mie theory.
Each of these advances will be discussed in detail in the following chapters. The final chapter
will summarize the findings of this study and suggest areas of focus for future work.

7
Figure 1.1. Illustration of thermoplasmonic heating in AuNPs on silica substrates .

8
Figure 1.2. Reduction in energy usage and utility costs as a function of light source
efficiency in plasmonic pervaporation.
0
2
4
6
8
10
12
14
0.2 0.4 0.6 0.8 1.0
Red
uct
ion
Fact
or
Light Source Efficiency
Energy Usage
Utility Cost

9
CHAPTER 2
PLASMONIC PERVAPORATION
2.1 SIGNIFICANCE OF THE PRESENT WORK
This chapter details the design, operation, and performance of the plasmonic
pervaporation system. The purpose of plasmonic pervaporation is to reduce the energy demand
of pervaporation by direct heating of the AuNP-functionalized membrane to provide the requisite
heat of vaporization to the permeate and eliminate the need to heat the entire feedstock. High
flux is maintained by increasing the temperature of the membrane itself. The majority of the
current research in pervaporation energy demand reduction is focused on preventing or
recapturing heat lost due to vaporization of the permeate. This is typically facilitated by
complicated membrane module designs that heat the feed while it is in the module. Some
approaches have focused on capturing energy from the distillate vapor stream – in a hybrid
distillation-pervaporation system – by funneling it through a “heat integrated” pervaporation
module.47, 48
A commercially available shell and tube type pervaporation membrane module
offered by Sultzer Chemtech enables isothermal operation by thermal fluid heating (steam or oil)
of the feed within the module itself.13
Another method, termed “thermo pervap,” attempts to
recapture the heat of vaporization by condensation of the permeate from thermal contact with
incoming feed at a lower temperature. The feed still requires additional heating before exposure
to the membrane.49
While these approaches have demonstrated success in reducing energy

10
demand, they only serve to prevent or recapture feed thermal losses and are not designed to
increase flux, reduce base thermal energy demand, or break the thermal gradient that develops
across the membrane reducing mass transfer efficiency.23, 24
Plasmonic pervaporation addresses
each of these limitations.
Microwave heating has been shown to increase CO2 permeabilities and diffusion
coefficients when applied to a membrane system,50-52
but it has limited viability for the current
application due to its tendency to heat water (and butanol to a lesser extent) combined with its
inability to target the membrane. Additionally, direct local heating of membranes using resistive
electrical heating has previously been studied to reduce energy demand and improve flux and
selectivity in membrane separations. Boddeker et al. demonstrated that both flux and selectivity
could be increased in the pervaporation of high-boiling compounds by using a conductive steel
mesh as both an internal membrane support and resistive heater. The moderate improvements
were attributed to a reversal of the thermal gradient between the feed and permeate sides of the
membrane.25
In a similar system, resistive heating of a silicone rubber coated aluminum
membrane was used to allow isothermal operation in crossflow, ethanol/water pervaporation
modules at low flowrates.53
However, these methods result in sacrificing a substantial amount of
expensive membrane area by incorporation of the large scale metal structures, potential contact
issues between the metal and polymer, and nonuniform membrane heating. These issues can all
be overcome by using nanoscale media excited by electromagnetic fields.
The use of AuNPs in filtration to increase flux is not without precedent. Vanherck et al.
have recently (2011) begun investigating the flux and selectivity effects of incorporating laser
heated AuNPs in cellulose acetate (CA) and polyimide (PI) nanofiltration membranes. It was
demonstrated that this technique increased the single component flux of ethanol substantially

11
more than that of water under the same conditions in CA membranes – which the authors
concluded demonstrates an increase in flux without a reduction in selectivity – and that flux
could be increased without affecting solute rejection in dense PI membranes.54, 55
However, the
work performed and the conclusions made had several limitations: thermal analysis of the
membrane in operation was not possible, measured fluxes were of single components and the
lack of reduced selectivity was attributed to heat transfer effects that would not be present in
mixtures, porous (pressure driven) rather than dense membranes were used and thus the driving
force is not affected, quantitative modeling of the effects was not performed, conclusions
regarding the energy demand were not fully explored, and a beneficial application was not
identified. The plasmonic pervaporation system enables each of these limitations to be addressed
and utilizes plasmonic heating where there is large economic advantage in terms of energy
demand.
2.2 PLASMONIC PERVAPORATION SYSTEM
2.2.1 Laser Pervaporation Cell and Experimental Setup
The entire experimental plasmonic pervaporation system setup, a detailed schematic of
the laser pervaporation cell, and an image of the cell in operation are shown in Figure 2.1. The
custom laser pervaporation cell forms the heart of the plasmonic pervaporation system. The cell
is comprised of two custom glass tubes (feed and permeate) and the membrane assembly. The
feed tube is fitted with a quartz window opposite the membrane for laser introduction and two
graduated pipettes that function as level indicators and enable continuous flux measurement. A
thermocouple was affixed to the outside of the feed tube 1.7 cm away from the membrane to
record the feed temperature at that point. The permeate tube is fitted with a vacuum port and a
germanium window located opposite the membrane. The germanium window is highly

12
transparent to infrared (IR) radiation and allows the temperature of the entire membrane surface
(7178 individual points) to be evaluated using an IR camera (ICI 7320 P-Series, Infrared
Cameras Inc., Beaumont, TX). The active membrane area is circular with a 15 mm diameter
giving an area for each thermal node of ~2.5x10⁻²
mm2. Sandwiched between the permeate and
feed tubes is the membrane assembly which includes two polydimethylsiloxane (PDMS) gaskets,
the AuNCM, and a stainless steel mesh that provides mechanical support as well as additional
laser absorption. The membrane assembly is held between the feed and permeate tubes by an
aluminum clamp/stand (seen in the image). A continuous wave, 532 nm diode laser (MXL-H-
532, CNI, Changchun, China) was used to heat the membrane. A power meter (PM310D,
Thorlabs, Newton, NJ) was used to measure incident laser power before and after each run to
ensure consistency.
The laser pervaporation cell was enclosed in a plexiglass box to minimize convection
currents. A small amount of air was continually drawn through the box to prevent butanol
buildup in the ambient environment. A vacuum pump (DV-4E, JB Industries Inc., Aurora, IL)
was used to evacuate the permeate side and permeate was condensed and captured using a cold
trap (dry ice and isopropyl alcohol). Permeate pressure was controlled using a vacuum regulator
(EW-07061-30, Cole-Parmer, Vernon Hills, IL) and continuous measurements were taken using
an absolute capacitance manometer (722B-100, MKS Instruments, Andover, MA), a data
acquisition card, and LabVIEW Signal Express (National Instruments, Austin, TX).
2.2.2 Automated Operation and Data Capture
The system was designed to enable automated operation and data collection. Permeate
pressure and membrane thermal images were recorded continuously using data acquisition
software. Permeate pressure was set and maintained between 1.8 and 2.2 torr for all experiments

13
using the vacuum regulator. Feed level changes, as well as ambient condition readings
(temperature and humidity) and the feed temperature, were collected by taking intermittent
images (every 20 min) using a webcam and image acquisition software. Small styrofoam balls
were placed in the graduated level indicators to increase visibility of the liquid level. The images
were analyzed with a Matlab script to calculate flux rates using a measured conversion factor of
281.33 pixels/mL volume change. This equates to a level of discretization of 4.89 x 10⁻²
kg m-2
h-1
for 20-min readings; however, Matlab enabled evaluation of partial image pixels (<0.1 pixel)
and therefore the maximum level of discretization was significantly higher. The flux was
calculated as
tA
paj
m
(2.1)
where j is the pure butanol mass flux, ρ is the density of butanol, a is the conversion factor from
change in liquid level position to volume change, ∆p is the change of liquid level position in the
level indicator (in pixels), Am is the active membrane area, and ∆t is the time period over which
the liquid level change occurred (20 min).
2.2.3 Gold-PDMS Membranes
In order to achieve the most efficient use of incident light within the plasmonic
pervaporation system and realize the maximum economic impact, the nanocomposite membranes
utilized in the pervaporation system must: 1) be highly concentrated with AuNPs that absorb at
the excitation wavelength, 2) utilize facile, reproducible fabrication methods, and 3) be as cost-
effective as possible. A brief description of the AuNCMs used in this work is provided here, and
a full characterization with regard to these criteria is the subject of Chapter 4.

14
Briefly, the AuNCMs were fabricated by mixing tetrachloroauric acid (TCA) in varying
concentrations in uncured PDMS to promote Au reduction to AuNPs facilitated by the silicon-
hydride active sites in the PDMS crosslinker.56
The solution was then spincoated on a glass slide
and cured at 150 °C to form dense AuNCMs with thicknesses between 74 and 79 microns.
Detailed fabrication methods and operational parameters are included in a manuscript currently
in preparation to be submitted for publication.57
The AuNCMs were prepared in four
concentrations (0.1, 0.4, 0.6, and 0.75% Au by mass) and three batches were made at each
concentration. The resulting laser extinction capability, measured using the power meter as
incident power minus transmitted power, of each AuNCM from each batch is shown in Figure
2.2. The extinction measurements were taken with the AuNCMs attached to glass substrates, but
the extinction fractions of the glass (0.08) and bare PDMS (0.07) were measured independently
and have been factored out of the values in the figure – therefore, on this scale, a 0.0% Au
membrane would have an extinction fraction of zero. Images of the AuNCMs are shown in the
Figure 2.2 inset. Laser extinction increased logarithmically as a function of total Au content in
the AuNCM. Of particular note is the low variance in the relative extinction between batches at
the same concentration. The standard deviations of the extinction fraction values across batches
are 0.013, 0.021, 0.015, and 0.010 for 0.1, 0.4, 0.6, and 0.75% Au, corresponding to only 8.95,
4.72, 2.67, and 1.54% of the mean extinction fraction values, respectively. Thus, it is evident
that highly consistent laser extinction fraction values can be obtained by this method. This result
is compelling given the ease and rapidity of the fabrication technique, and it supports the
conclusion that even higher levels of reproducibility could be achieved with further optimization.
Pervaporation experiments were performed with one AuNCM from each of the three
lower concentrations and one bare PDMS membrane (0.0, 0.1, 0.4, and 0.6%). The 0.75%

15
AuNCM did not fully cure, most likely due to overconsumption of crosslinker by the reduction
of Au, and was not suitable for use in the plasmonic pervaporation system. Each membrane was
tested at four levels of incident laser power: 0, 250, 500, and 750 mW for >10 h to ensure steady
state (SS) operation was reached. All analysis of SS operation data discussed below was taken
from the time period spanning 5-10 hours following pump startup.
2.3 PERVAPORATION PERFORMANCE
2.3.1 Thermal Behavior in Operation
Laser irradiation of the AuNCMs during operation of the plasmonic pervaporation system
resulted in stable increases in membrane temperature that rose according to membrane Au
content and incident laser power. The laser spot was expanded to irradiate the entire surface of
the membranes; however, the membranes developed a nonuniform thermal profile during
operation. The profile likely developed due to an uneven power distribution in the laser spot and
radial heat transfer from the membrane. To illustrate the variation in the thermal profile, Figure
2.3 shows box and whisker plots of membrane spatial thermal distributions averaged over the 5-
10 h period of the pervaporation experiments for the four membranes (0.0, 0.1, 0.4, and 0.6%
Au) at all four levels of laser irradiation (left to right, 0, 250, 500, and 750 mW). The average
(mean) temperature for each point is also shown (red diamonds). The inset in Figure 2.3 shows a
representative spatial thermal distribution across the membrane. The membrane thermal profile
appears parabolic with the highest temperatures concentrated slightly removed from the center
(likely due to power distribution in the laser spot). The maximum temperature spread across the
membrane grows with increasing laser power for all membranes, as does the difference between
the 1st and 3
rd quartiles. Although the thermal distribution widens with laser power, the mean
and median of each data set remain very closely aligned. This alignment indicates that the
16
spatial temperature profile of the membrane follows a normal distribution and the average
temperature of each set can be treated as a representative value. Thus, the average temperature
will be used in all further discussion and modeling of the membrane thermal response.
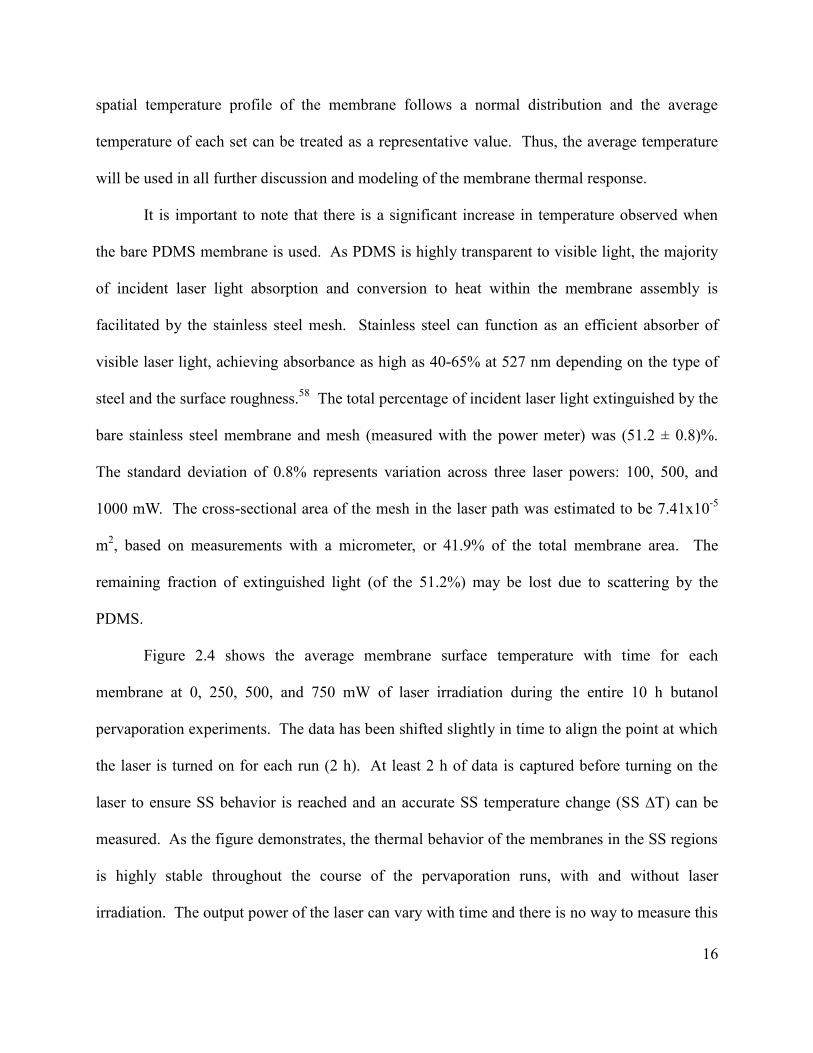
It is important to note that there is a significant increase in temperature observed when
the bare PDMS membrane is used. As PDMS is highly transparent to visible light, the majority
of incident laser light absorption and conversion to heat within the membrane assembly is
facilitated by the stainless steel mesh. Stainless steel can function as an efficient absorber of
visible laser light, achieving absorbance as high as 40-65% at 527 nm depending on the type of
steel and the surface roughness.58
The total percentage of incident laser light extinguished by the
bare stainless steel membrane and mesh (measured with the power meter) was (51.2 ± 0.8)%.
The standard deviation of 0.8% represents variation across three laser powers: 100, 500, and
1000 mW. The cross-sectional area of the mesh in the laser path was estimated to be 7.41x10⁻⁵
m2, based on measurements with a micrometer, or 41.9% of the total membrane area. The
remaining fraction of extinguished light (of the 51.2%) may be lost due to scattering by the
PDMS.
Figure 2.4 shows the average membrane surface temperature with time for each
membrane at 0, 250, 500, and 750 mW of laser irradiation during the entire 10 h butanol
pervaporation experiments. The data has been shifted slightly in time to align the point at which
the laser is turned on for each run (2 h). At least 2 h of data is captured before turning on the
laser to ensure SS behavior is reached and an accurate SS temperature change (SS ∆T) can be
measured. As the figure demonstrates, the thermal behavior of the membranes in the SS regions
is highly stable throughout the course of the pervaporation runs, with and without laser
irradiation. The output power of the laser can vary with time and there is no way to measure this
17
occurrence throughout the experiments. However, the stability of the data sets suggests that no
significant variation in laser power occurred. Average SS ∆Ts and flux values reported below
were calculated from the 5-10 h region of each run.
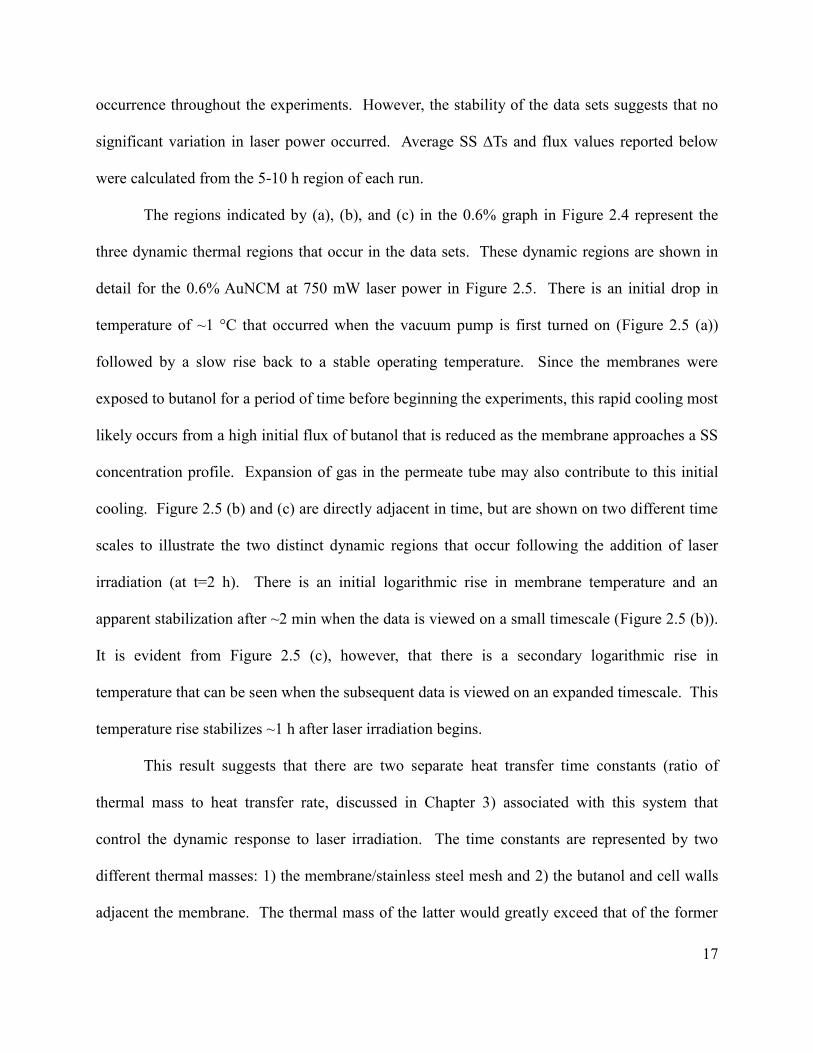
The regions indicated by (a), (b), and (c) in the 0.6% graph in Figure 2.4 represent the
three dynamic thermal regions that occur in the data sets. These dynamic regions are shown in
detail for the 0.6% AuNCM at 750 mW laser power in Figure 2.5. There is an initial drop in
temperature of ~1 °C that occurred when the vacuum pump is first turned on (Figure 2.5 (a))
followed by a slow rise back to a stable operating temperature. Since the membranes were
exposed to butanol for a period of time before beginning the experiments, this rapid cooling most
likely occurs from a high initial flux of butanol that is reduced as the membrane approaches a SS
concentration profile. Expansion of gas in the permeate tube may also contribute to this initial
cooling. Figure 2.5 (b) and (c) are directly adjacent in time, but are shown on two different time
scales to illustrate the two distinct dynamic regions that occur following the addition of laser
irradiation (at t=2 h). There is an initial logarithmic rise in membrane temperature and an
apparent stabilization after ~2 min when the data is viewed on a small timescale (Figure 2.5 (b)).
It is evident from Figure 2.5 (c), however, that there is a secondary logarithmic rise in
temperature that can be seen when the subsequent data is viewed on an expanded timescale. This
temperature rise stabilizes ~1 h after laser irradiation begins.
This result suggests that there are two separate heat transfer time constants (ratio of
thermal mass to heat transfer rate, discussed in Chapter 3) associated with this system that
control the dynamic response to laser irradiation. The time constants are represented by two
different thermal masses: 1) the membrane/stainless steel mesh and 2) the butanol and cell walls
adjacent the membrane. The thermal mass of the latter would greatly exceed that of the former

18
resulting in a much slower rise to a SS ∆T as is observed in the data. The respective time
constants dominate at different times because of the time needed for the temperature change of
the membrane to penetrate into the stagnant butanol. The gradual penetration of heat into the
butanol may actually result in a dynamically growing thermal mass and thus an even slower
approach to SS.
Figure 2.6 shows the final SS ∆T for each membrane during pervaporation as a function
of incident laser power. Each value represents the difference in membrane temperature between
a 1h period leading up to turning on the laser and a 1 h period beginning 1 h after the laser is
turned on (when SS is reached). The error bars show one standard deviation in 60 measurements
over the 1 h period. The data show that the average SS ∆T increases as a function of Au content
and exhibits a linear response to increasing laser power. Although SS ∆T increases linearly, the
increases are typically less than proportional to the amount of additional incident laser power –
i.e., the SS ∆T per W incident laser power decreases for each membrane at higher powers.
Several factors exist that could contribute to this result (e.g., transduction efficiency, heat transfer
parameters, etc.). This will be discussed in detail in the thermal modeling section of Chapter 3.
There is a large increase in SS ∆T when AuNCM Au content is increased from 0.1% to 0.4%, but
only a very small increase from 0.4% to 0.6%, despite a 50% increase in added Au and a
significantly larger laser extinction fraction (Figure 2.2). This result suggests that, at higher
concentrations, Au is not being used as efficiently to create additional 532 nm light-absorbing
AuNPs. This observation will be examined in detail in Chapter 4.
2.3.2 Flux Enhancement
Laser irradiation of AuNCMs in the plasmonic pervaporation system resulted in stable,
linear flux enhancements up to 117% that increased according to membrane Au content and laser

19
power. The butanol fluxes as a function of time for all membranes and values of incident laser
power for the entire duration of the pervaporation experiments are shown in Figure 2.7. The data
have been smoothed (boxcar 3) and shifted in time such that the laser is turned on at t=0 h for all
data sets. After the laser is turned on, there is a 1-1.5 h dynamic region before a steady flux is
reached, corresponding to the dynamic regions outlined in Figure 2.5 (b) and (c). There is a
large amount of variability in the beginning fluxes of the membranes when the experiments
begin caused by differences in the initial saturation state of the membranes. As the experiment
proceeds, all the data sets approach a similar flux (~0.25 kg m-2
h-1
) before the laser is turned on
at t=2 h. As the figure shows, each data set demonstrates very stable performance throughout the
operating period following the transition region. The flux increased for each set according to the
Au content of the membrane and the incident laser power.
The average flux for each data set over the 5-10 h period of the pervaporation
experiments is shown in Figure 2.8 (a). Error bars represent one standard deviation of 15 flux
readings taken over 5 h (no smoothing). The variation in fluxes at 0 mW stem from minor
differences in ambient conditions and small variances in membrane permeance (discussed in the
following section). The flux for each membrane increases with increasing laser power. The rate
of increase depends on the amount of Au content in the membrane. This effect is illustrated in
Figure 2.8 (b) as the fractional increase in flux as a function of laser power relative to the same
membrane under no irradiation. The lines in Figure 2.8 (b) show linear regressions of each data
set. Flux enhancement is highly linear (R2>0.99) over this range of temperatures for each
membrane with slopes that rise according to Au content. The increase in slope slows
logarithmically for the more highly concentrated AuNCMs indicating again that Au is being
utilized less efficiently as more is added. The fluxes enhancement ranges from 16.9-47.6% for

20
the 0.0% membrane to 39.5-116.6% for the 0.6% membrane. This result demonstrates that the
addition of plasmon-heated AuNPs to pervaporation membranes enables significantly higher flux
enhancement from laser irradiation and that this enhancement increases according to the amount
of added Au. These enhancements are accomplished with only moderate increases in feed
temperature that fall quickly with increasing distance from the membrane (discussed in Chapter
3) which indicates partial realization of the hypothesized energy reduction.
2.3.3 Solution Diffusion Model
Examination of the fluxes and enhancements in Figure 2.8 (a) and (b) reveals two
interesting observations: 1) flux of the 0.1% AuNCM at 0 mW is smaller than the 0.0%
membrane despite a higher operating temperature and 2) the flux and enhancement are
consistently larger in the 0.6% AuNCM than the 0.4% despite negligible differences in operating
temperature (Figure 2.6). Both observations can be explained by investigation of the permeance
of each membrane. To evaluate the membrane permeance, the effects of the driving force and
permeance on butanol flux must be uncoupled. The in situ membrane thermal analysis offered
by the plasmonic pervaporation system facilitated the direct determination of the AuNCM
permeance using the solution diffusion (SD) model for membrane transport.
Membranes with pore sizes on the order of 5 Å or less are typically not described using
the conventional pore model of membrane transport. At this point, pore size is on the order of
the thermal motion of the polymer chains that compose the membrane and permeation is no
longer pressure driven. Rather, it becomes a diffusive process controlled by the motion of the
polymer chains.59
Mass transport in membranes of this type is governed by three fundamental
processes: 1) solution of molecules on the feed side of the membrane, 2) diffusion of molecules
through the membrane, and 3) desorption of molecules on the permeate side of the membrane.

21
The SD model is most often used to describe this process.22
There are three key assumptions
implicit in the SD model:
1. The fluid on each side of the membrane is in equilibrium with the membrane material at
the membrane/fluid interface. Thus, the component chemical potentials are equal in the
membrane and fluid phases at each interface and there is a continuous gradient between
them.
2. Absorption and desorption occur much faster than diffusion through the membrane and
can therefore be neglected.
3. Pressure throughout the membrane is assumed to be equal to the feed pressure and
therefore transport is governed solely by the concentration gradient across the membrane.
These assumptions result in a Fick’s law diffusive flux:
mimi
iiii cc
D
d
dcDJ
,0, (2.2)
where Ji is the molar flux of i (equal to j from eq 2.1 divided by molecular weight), Di is the
diffusivity of i in the membrane, l is the length of the membrane, and ci,0,(m) and ci,l(m) are the
concentrations of i in the membrane on the feed side and permeate side, respectively. Since
component concentrations in the membrane phase are difficult to obtain, they must be
determined in terms of fluid phase concentration by setting the respective chemical potentials
equal (assumption 1 above) and solving. From this point, the SD model can be applied to a
variety of membrane operations (e.g., reverse osmosis, gas separations) including
pervaporation.60
The pervaporative flux of a component, i, according to the SD model and written in terms
of fluid phase concentrations (partial pressure for the vapor phase) is

22
,0, i
G
ii
L
ii
i pKcKD
J (2.3)
where KL
i and KG
i are the liquid and gas phase sorption coefficients, respectively, representing
the ratio of component i'’s activity coefficients in either the liquid and gas phase to that in the
membrane phase, ci,0 is the concentration in the feed, and pi,l is the partial vapor pressure of i in
the permeate. The sorption coefficients are for different phases and differ slightly in definition;
thus KL
i is dimensionless and KG
i has units of concentration divided by pressure. The full
derivation of these parameters is given by Wijmans60
The different sorption coefficients make this form of the SD model unwieldy from a
practical standpoint. This difficulty is overcome by considering a hypothetical vapor in
equilibrium with the feed liquid. Equating the chemical potential of these two phases enables
redefining the liquid phase concentration in terms of partial vapor pressure
0,0, iL
i
G
i
i pK
Kc (2.4)
where pi,0 is the partial vapor pressure i in the hypothetical vapor phase in equilibrium with the
feed liquid. Substituting eq 2.4 into 2.3 and rearrangement yields
,0, ii
G
iii pp
KDJ (2.5)
The product, DiKG
i, is referred to as the gas phase permeability coefficient, PG
i. When the
permeability is weighted by the membrane length, it becomes the membrane permeance, iP :
G
ii
G
ii
KDPP (2.6)
It is important to note that the equilibrium interaction of a sorbed vapor in the liquid phase with
the partial pressure of the vapor is given by Henry’s law:

23
0,0, iii cHp (2.7)
where Hi is the Henry’s law coefficient in units of pressure divided by concentration. From eq
2.4, it follows that
G
i
L
ii
K
KH (2.8)
and eq 2.5 can be returned to a concentration-based driving force as60
,0, iiiii pHcPJ (2.9)
2.3.4 AuNCM Permeance
Rearrangement of eq 2.5 allows the gas phase permeance of the AuNCMs to be
calculated using experimental flux and driving force data:
,0, ii
i
ipp
JP
(2.10)
In the single component system used in this work, pi,0 and pi,l are equal to the saturation vapor
pressure of butanol at the membrane temperature and the total permeate pressure, respectively.
The permeance of each AuNCM at each level of laser power was computed according to eq 2.10
by calculating the saturation vapor pressure from the measured membrane temperature during
operation.
At 0 mW laser irradiation, the permeance of each membrane was 1.07, 0.93, 1.07, and 1.09
mol h-1
m-2 torr
-1 for the 0.0, 0.1, 0.4, and 0.6% membranes, respectively. Remarkably, the
membranes demonstrate very consistent base (no irradiation) permeance values. The 0.1%
AuNCM varies more and appears to be an outlier in this regard, but still only varies from the
average of the remaining three membranes by <14%. The lower value of permeance explains the
first observation made in the beginning of section 2.3.3 – that the flux of the 0.1% AuNCM is

24
lower at 0 mW than the 0.0% membrane despite a slightly higher operating temperature.
Eventually, the 0.1% flux is enhanced beyond that of the 0.0% as incident radiation is increased
due to increased heat generation from the presence of the AuNPs.
The second observation from section 2.3.3 can be explained by evaluating how the
permeance values for each membrane change as a function of temperature. Although little
variation is seen in the 0 mW permeance values of the membranes, as temperature is increased
(increased laser irradiation), the values vary widely. Figure 2.9 shows the fractional change in
permeance for each membrane as a function of temperature change. The permeance falls linearly
with increasing temperature for each membrane, but the rate at which it falls decreases with
increasing Au content. The 0.6% AuNCM appears to exhibit higher flux values and
enhancements than the 0.4% AuNCM at similar SS ∆Ts (i.e., driving forces) because it maintains
a higher permeance at elevated temperatures. A pervaporation activation energy analysis is
typically used to decipher how temperature changes affect membrane permeance.61
This
analysis, as well as a hypothesized explanation for the mitigation in permeance reduction with
increasing Au content, is given in Chapter 3.
2.4 CONCLUSIONS
For the first time, a plasmonic pervaporation system was designed and constructed. The
system enabled uniform laser membrane excitation, full thermal analysis of membrane surface
temperature during operation, and automated operation and data capture (flux, membrane and
feed temperature, permeate pressure, and ambient conditions). Novel AuNP-functionalized
PDMS membranes were fabricated in varying concentrations (0.0, 0.1, 0.4, and 0.6% Au by
mass) and were tested for performance in the plasmonic pervaporation system against a bare
PDMS membrane at four levels of laser irradiation (0, 250, 500, and 750 mW). Laser irradiation

25
resulted in stable enhancement of butanol fluxes up to 117% that increased according to both Au
content in the membrane and laser power. The membrane thermal analysis offered by the system
enabled calculation of membrane permeance using the solution diffusion model. It was observed
that the permeance of each membrane fell with increasing temperature, but the reduction rate (as
a function of temperature) decreased with increasing Au content.

26
Figure 2.1. Schematic of the experimental plasmonic pervaporation system and the laser
excited pervaporation cell. Image shows plasmonic pervaporation cell during
operation.

27
Figure 2.2. Values of laser power extinction fraction (532 nm) for AuNCMs from three
different batches at four different values of gold content. Each AuNCM is pictured in
the inset. Extinction fractions of the glass substrate and bare PDMS were measured
independently and have been factored out of the values in the figure – therefore a 0.0%
Au membrane has an extinction fraction of zero on this scale.

28
Figure 2.3. Box and whisker plots of membrane thermal distributions during the 5 -10 h
period of pervaporation experiments for the four membranes (0.0, 0.1, 0.4, and 0.6%
Au) at four levels of laser irradiation (left to right, 0, 250, 500, and 750 mW). The
mean temperature for each point is also shown (red diamonds). Inset shows a
representative spatial thermal distribution across the membrane.
29
Figure 2.4. Average membrane surface temperature with time for the 0.0, 0.1, 0.4, and 0.6% Au
membranes irradiated with 0, 250, 500, and 750 mW laser power during butanol pervaporation
experiments. Regions (a), (b), and (c) in the 0.6% graph indicate dynamic thermal regions that
are illustrated in Figure 2.5.

30
Figure 2.5. Average temperature of a 0.6% AuNCM with time during the three dynamic
thermal regions of the plasmonic pervaporation experiments (750 mW laser irradiation):
(a) when the pump is turned on (diamonds), (b) when the laser is turned on and the
thermal mass of the membrane dominates (squares), and (c) region after turning on the
laser in which the thermal mass of butanol and the cell wall dominate (triangles).
Regions (a), (b), and (c) correspond to those indicated in Figure 2.4.

31
Figure 2.6. The average steady state temperature change during butanol pervaporation
for membranes of different Au content as a function of incident laser power. Error bars
show one standard deviation of 300 measurements taken over the period of 5 h.
250 500 7500
1
2
3
4
5
6
7
8
Laser Power, mW
Av
erag
e T
emp
erat
ure
Ch
ang
e, °
C
0.0%
0.1%
0.4%
0.6%

32
Figure 2.7. Flux of butanol as a function of time for the four membranes with varying
incident laser powers. The data points have been smoothed (boxcar 3) and shifted in
time such that the laser is turned on at t=2 h. A dynamic region (shaded) follows t=2 h
during which steady state is reached.
33
Figure 2.8. (a) Flux of butanol as a function of incident laser power. Error bars
represent one standard deviation of 15 flux readings taken over a 5 h period. (b) The
fractional increase in flux as a function of incident laser power. Lines in (b) represent
least squares regressions of the data.
(a)
(b)
34
Figure 2.9. Fractional change in permeance as a function of membrane temperature
change for the four membranes studied. Lines represent linear regressions of each data
set.
0 1 2 3 4 5 6 7 8 9-0.25
-0.2
-0.15
-0.1
-0.05
0
Membrane Temperature Difference, °C
Fra
ctio
nal
Ch
ang
e in
Per
mea
nce
0.0%
0.1%
0.4%
0.6%
35
CHAPTER 3
MODELING PLASMONIC PERVAPORATION
3.1 SIGNIFICANCE OF THE PRESENT WORK
In order to achieve the highest economic impact in plasmonic pervaporation, it is
necessary to identify the means by which the laser energy input is consumed. The ideal case
discussed in Chapter 1 assumed 100% of the laser energy was absorbed by the membrane and
that it all was consumed by evaporating permeate. The purpose of this chapter is to quantify the
thermal behavior of the plasmonic pervaporation system at steady state and to evaluate the extent
to which the ideal case is realized in this system. In the first section, a previously demonstrated
model for plasmonic heating is adapted to describe the thermal behavior of the AuNCMs in
operation. In the second section, a pervaporation activation energy analysis is used to develop an
empirical model that accurately describes the experimental data and can be used to estimate flux
enhancement at temperatures beyond those measured experimentally. In the final section, these
two models are coupled to predict the performance of the plasmonic pervaporation system under
conditions matching those used in the preliminary economic analysis to evaluate its realization.
Considerable experimental and computational work has been done to measure and predict
the thermal and optical behavior of AuNPs under high-power, pulsed laser irradiation with large
temperature increases in aqueous solutions62-68
as well as in live cells.69, 70
In Roper’s lab in
particular, as well as some others, thermal behavior of aqueous AuNP/media and solid-state

36
AuNP/substrate systems as a whole have been examined under relatively low steady state
temperature increases by continuous wave excitation.44, 71-73
However, as no other system of this
type has been developed, quantitative description of thermal energy transfer has not been
performed.
3.2 THERMOPLASMONIC MODELING
3.2.1 Capillary Thermal Model
The model to describe the plasmonic pervaporation thermal behavior was adapted from a
previously developed model for plasmonic heating in open, fluid-filled AuNP-plated silica
capillaries.44, 72
The model was given by45, 74
j
fpfjpj
fv
i
iOI
CtmmCm
HmQQ
dt
dT
,,
,,
)(
(3.1)
where the left hand side equals the changes in the uniform temperature of the system, T, as a
function of time, t. The terms in the numerator on the right hand side represent, respectively,
energy input from the laser, QI; power losses due to conventional heat transfer modes, i.e.
conduction, convection, and/or radiation, contained in the sum ΣQ0,i; and power lost by
evaporative cooling, ṁ∆Hv,f, which is the evaporation rate, ṁ, multiplied by the heat of
vaporization of the fluid, ∆Hv,f. The terms in the denominator represent the dynamic thermal
capacity of the system in which ΣmjCp,j is the sum of the masses of system components (e.g., the
capillary) multiplied by their respective specific heat capacities, Cp,j, mf is the initial fluid mass,
and Cp,f is the specific heat capacity of the fluid. This energy balance is illustrated in Figure 3.1.
The surface temperature of the small capillary was considered uniform due to its short internal
thermal equilibration time, resulting from high conductivity of Au and silica, relative to
equilibration with its external environment.39
This allows neglecting internal thermal resistances
37
in the energy balance and linear summation of power losses by convection, conduction, and/or
radiation from a “black box” – illustrated by the dotted line in Figure 3.1– which has constant
energy input via incident light.45
The energy input term, QI, is the thermal energy transduced from the absorbed laser
power and results from crystal lattice excitation (phonon) that occurs as optically-induced
plasmons on the AuNP surfaces decay. This term was previously defined by Roper et al.72
as
T
A
I IQ )101(
(3.2)
where I is the incident laser power, Aλ is the measured AuNP spectral absorbance at the
wavelength of excitation, λ, and ηT, is the transduction efficiency. The value, ηT, represents the
fraction of absorbed laser power that is transduced to thermal energy. Measurement of
transmitted laser light through the capillary during experimentation enables QI to be conveniently
redefined as
TTI IIQ )( (3.3)
where IT is the measured transmitted laser power.
The term ΣQ0,i in eq 3.1 sums external thermal transfer modes not related to mass
transfer: conduction, Qcond; convection, Qconv; and radiation, Qrad. Conduction is given by
)( amb
ccond TT
L
kAQ
(3.4)
where k is the thermal conductivity of the surface, Ac is the contact area perpendicular to
conduction, L is the characteristic length for conduction to the environment, and Tamb is the
ambient temperature. Power loss by convection is given by
)( ambsconvconv TTAhQ
(3.5)

38
where hconv is the heat transfer coefficient for convection and As is the surface area of the sample
cell exposed to air. Radiation power loss is given by
)( 44
ambsrad TTAQ (3.6)
where 𝜖 is the emissivity of AuNPs and σ is the Stefan-Boltzmann constant.
The mass transfer rate of liquid from the capillary to the ambient environment is given by
fcfE CkMWAm (3.7)
where AE is the area available for evaporation, MWf is the molecular weight of the liquid, kc is the
mass transfer coefficient, and ∆Cf is the difference in liquid concentration between the liquid
boundary and the environment. The mass transfer coefficient, kc, was given by
f
A
cC
Nk
(3.8)
where NA is the experimentally determined average molar flux of the liquid from the substrate
surface. Substitution of Eq 2.8 into Eq 2.7 gives an alternate definition of the mass transfer rate:
AfE NMWAm
(3.9)
The model was tested experimentally using a AuNP-silica nanocomposite capillary
fabricated by electroless plating and thermal annealing technique75, 76
The model was shown to
accurately predict the dynamic and steady state thermal behavior of the capillary over a defined
range of conditions including evaporation of organic and aqueous liquids.45, 74
Although, it was
developed to describe the capillary system shown in Figure 3.1, the generality it possesses
enables its extension to any system that conforms to the constraints discussed herein – i.e.,
linearly additive heat transfer modes to and from a defined system (black box) at a uniform
temperature. The following section discusses extension of this model to the plasmonic
pervaporation system.

39
3.2.2 Plasmonic Pervaporation Model
For the plasmonic pervaporation system, the system was defined as the AuNCM and
stainless steel mesh. The system has a single heat input from the laser and all heat output occurs
axially into either the feed or permeate tube. A schematic illustrating heat transfer to and from
the membrane/mesh system is given in Figure 3.2. On the permeate side, four modes of heat loss
are identified. They include: 1) temperature rise of the permeate (it was assumed to evaporate at
the temperature of the membrane), 2) heat of vaporization from permeate, 3) heat of isothermal
expansion from atmospheric pressure to permeate pressure (previously demonstrated to be
significant24
), and 4) radiation from the membrane/mesh surface. Conduction and convection are
taken to be negligible on the permeate side due to the low pressure (2 torr). On the feed side,
heat transfer is taken to occur only by conduction into the feed liquid. Conduction into the feed
liquid is difficult to determine because the characteristic length (eq 3.4) is not readily definable.
However, at steady state, all heat transferred to the feed liquid will be transferred to the
environment via convention and conduction from the feed tube walls. Because of the geometry
of the system (heat conduction from a hot surface through a long, cylindrical tube), heat transfer
from the feed tube walls is estimated using a relation for an infinite fin. In the following section,
the assumptions and possible sources of uncertainty associated with this approach are discussed.
This approach yields the following relation for membrane/mesh temperature as a function
of time:
j
jpj
fvambfpradfinI
Cm
qHTTCmQQQ
dt
dT
,
exp,,
(3.10)
where QI is the power input from the laser, Qfin is the power loss from the feed tube (defined
below), Qrad is the power loss due to radiation to the permeate side (defined by eq 3.6). The

40
power loss from evaporation of butanol permeate is calculated by the product of the mass
evaporation rate, ṁ, and the sum of i) the product of the heat capacity of butanol and the
temperature change, ii) the heat of vaporization, ∆Hv,f, and iii) the heat generation per mass of
isothermally expanded material, qexp. The thermal mass (denominator) of the plasmonic
pervaporation system is convoluted by the multiple time constants discussed in Chapter 2. Thus,
in this study, only steady state operation was investigated because the thermal mass has no
bearing on the steady state behavior, only the time it takes to reach it. In order to predict the
transient behavior of the system, the transient penetration of heat into the feed liquid could be
modeled using a semi-infinite medium relation, but that analysis is beyond the scope of this
work.
The rate of heat transfer from an infinite fin is given by77
)( ambbfinfinfinfin TTApkhQ (3.11)
where hfin is the heat transfer coefficient (combining effects of convection and radiation), p is the
perimeter of the fin, kfin is the thermal conductivity of the fin, Afin is the cross-sectional area of
the fin, and Tb is the temperature of the fin base, taken to be the membrane temperature. The
area for radiation in eq 3.10 was assumed to be the exposed area of the membrane plus 80% of
the surface area of the stainless steel since the feed-facing side of the mesh is in contact with the
membrane. This parameter is difficult to identify, but a variation in its value from 60-100% only
has an effect of ~±2% on overall heat transfer from the system. The heat generated per mass due
to isothermal expansion of an ideal gas was defined as78
1
2
exp lnP
PRTq (3.12)

41
where R is the gas constant and P1 and P2 are the pressures on the feed and permeate sides,
respectively.
3.2.3 Accuracy of Infinite Fin Approach
Use of the 1-dimensional infinite fin model to calculate power loss through the feed
liquid introduces several potentially significant uncertainties due to certain assumptions that have
been made. These assumptions include: 1) a uniform butanol temperature across the radius of
the fin and 2) free convection-dominated fin heat loss. The first assumption is expected to result
in some uncertainty because the base temperature, Tb, in the model is assigned to be the average
membrane temperature taken to be uniform throughout the membrane. Since the measured
membrane temperatures were nonuniform with a substantial distribution (Figure 2.3), using this
assumption could overestimate fin heat transfer because actual temperatures changes less sharply
than model fin temperatures toward the perimeter. The second assumption may also introduce
uncertainty in the approach since radiation can, at times, dominate heat transfer in free
convection environments.77
Below, evidence is provided to support the use of this approach as a
first approximation despite these potential uncertainty.
To evaluate the accuracy of the infinite fin approach, the steady state exterior temperature
of the feed tube for each data set, measured by the thermocouple (Figure 2.1), was compared to
temperatures calculated for the same position using the infinite fin model. This comparison
assumes there is a negligible temperature drop across the glass to where temperature is being
measured by the thermocouple. This assumption should introduce little uncertainty as the
thermal conductivity of the glass is nearly an order of magnitude larger than that of butanol and
the glass is thin (~3 mm). The thermal profile as a function of distance away from the base is
given by77
42
finfin
fin
ambbambAk
phxTTTxT exp (3.12)
where T(x) is the fin temperature at distance x (x=0 at fin base). For the predicted temperatures,
the average membrane temperature was used for Tb, x was 1.7 cm, hfin was calculated for each
data set (because it depends on SS ∆T) using a free convection model for cylindrical tubes using
ambient conditions,77
p and Afin were measured, and kfin was taken as an average of the thermal
conductivities of glass and butanol (weighted by their fractional contributions to the Ac).
The calculated and measured temperatures are shown in Figure 3.3. There is excellent
agreement between the calculated and measured temperatures for each data set, excluding the
0.1% AuNCM. The temperatures vary considerably more for this membrane than for the others.
Because all data was taken under the same conditions, the large difference is most likely a result
of experimental error. There were times during experimentation when the thermocouple was
detached from the feed tube and had to be reattached. It is possible that incorrect placement of
the thermocouple could account for the temperature differences. The alignment of the remaining
data sets is extraordinary. Measurement of additional thermal points along the cell may offer
improved confidence in the thermal model.
3.2.4 Model Results
In general, the thermal model can provide a means of estimating both the average SS ∆T of
the membrane and the power loss due to each mode of heat transfer according to three input
parameters: the incident laser power, the laser absorbance fraction (product of extinguished laser
light and transduction efficiency), and the experimentally measured (steady state) mass flux. In
this work, the laser absorbance fraction of the membranes was unknown, but the SS ∆T were
measured experimentally. This allowed an estimation of the laser absorbance fraction for each

43
data set to be made by manipulating its input value to achieve a SS ∆T that agreed with the
experimental results. The resulting laser absorbance values are shown in Figure 3.4 – these
values represent the absorbance of both the AuNCM and the stainless steel mesh. As the figure
demonstrates, the laser absorbance fractions varied from a minimum of 0.066 for the 0.0%
membrane at 750 mW to a maximum of 0.167 for the 0.6% AuNCM at 250 mW and, expectedly,
the values increase consistently according to Au content of the membrane.
Several interesting observations can be made from the data in Figure 3.4. First, the
absorbance values of the AuNCMs are much lower than their extinction fractions measured with
the laser (Figure 2.2), especially for the higher Au content membranes. This difference could be
attributable to a number of factors. Primarily, AuNCM extinction was measured under different
conditions than those experienced during operation including a smaller laser spot size and
different substrate. This prevents a direct comparison. Additionally, laser loss due to its path
through the feed tube during operation was not present during extinction fraction measurements.
Differences can also be attributed to the extinction contribution due to light scattering, rather
than absorption, in the membranes. As was previously mentioned (section 1.2), AuNPs that
absorb in the green wavelengths (532 nm) typically demonstrate transduction efficiencies near
100%. As AuNP diameter is increased, the scattering cross-section of the particles grows,
exceeding the absorption cross-section.43
This is a possible indication that large Au particles
may be forming in the AuNCMs, resulting in an increase in scattering. This possibility is
examined more closely in the following chapter. Lastly, because the absorbance fraction of the
0.0% membrane is on the order of all the AuNCMs (due to light absorbance by the mesh), the
stainless steel mesh appears to make a large contribution to the absorbance at each laser power.
Exactly how large a contribution it makes is difficult to estimate because of the dependence of

44
each absorbing element on the other – i.e., as the AuNCM absorbs more light, there is less
available to be absorbed by the mesh.
The highest value of absorption calculated for the stainless steel mesh alone (0.0% Au
content) was 9.9% at 750 mW. Based on its measured cross sectional area (41.9% of the active
membrane area) and the experimental absorption values for stainless steel reported in one study
(40-65%),58
the absorption fraction could be expected to be as high as 16.8-27.2%. This result
could possibly indicate that the heat absorbed by the membrane is being underestimated by the
model. This cannot be determined with certainty considering the absorption values in the cited
study varied considerably with steel type and the exact make of the mesh is unknown. However,
it does help to stress the convolution of model results that occurs due to the absorption by the
mesh. In future work, it would be beneficial to devise a mechanical support that is optically
inert.
Another interesting result from Figure 3.4 is that the absorbance fraction falls for each
membrane with increasing laser power. The overall drop is significant from 250-750 mW – 32.9,
26.0, 26.6, and 27.6% for the 0.0, 0.1, 0.4, and 0.6% membranes, respectively – but it appears to
slow with increasing power. This reduction in absorption could be attributed to multiple factors
including actual changes in the absorbance properties of the system and/or underestimation in the
model regarding heat transfer modes that increase nonlinearly with increasing temperature.
Review of the literature suggests the former is less likely given that only minor decreases in
AuNP extinction have been observed with >50 °C temperature increases79
and the absorption of
light by metals (the stainless steel) is generally shown to increase with increasing temperature.58
However, the exact absorption properties of steel, particularly its continuous wave laser
absorption capacity, and how they change with increased irradiation is unknown. Also, we have
45
observed that absorbance fractions of AuNP-silica nanocomposites under lower irradiation
powers44, 74
and extinction fractions of AuNCMs under similar irradiation powers do not vary
measurably. However, the conditions of these experiments were notably different from those
experienced in the plasmonic pervaporation system and therefore cannot preclude the possibility
of actual changes in the absorbance behavior of the membranes. The location of the AuNPs in a
thermally insulating environment (low conductivity, radiation) may result in partial saturation of
the plasmon resonance capacity due to the increasing requisite time for phonon transfer. Because
a similar effect is seen with the 0.0% membrane, this effect could only partially account for the
loss in absorption efficiency.
Because the absorption values fall so much, if underestimations in one or more heat
transfer modes occurred, they would need to be significant in the overall thermal behavior of the
system. Table 3.1 gives the contributions of each heat transfer mode calculated by the model for
each data set. A majority (77-79%) of the input power is dissipated by conduction to the feed
(Qfin) and vaporization of the permeate. These power losses are similar at lower temperatures,
but conduction increasingly dominates as temperature increases. Power loss from permeate
evaporation is set by the flux rate and therefore is not considered to contribute significantly to
potential underestimation. Power loss from radiation and expansion account for the vast
majority of the remaining power loss and follow a similar trend with radiation dominating as
temperature increases. Radiation from the feed side of the membrane was not considered and
could be significant depending on the infrared absorption characteristics of butanol. Thus, if
underestimations were made, they could most likely be attributed to any combination of the
remaining three modes, all of which have the potential to be nonlinear in their dependence on

46
temperature (free convention heat transfer coefficient, radiation driving force, non-ideal gas
expansion).
Feed conduction in the model was determined by the fin relation and is set by the system
geometry, thermal conductivity, and the free convection heat transfer coefficient. As a function
of increasing temperature change, the free convection heat transfer coefficient increases in a
logarithmic-type profile – quickly at first but slowing as the temperature change grows. This
profile is similar to that which would be required to induce the slowing loss in absorption
efficiency as mentioned above. The coefficients calculated in the model are on the order of 5 W
m-2
K-1
. Since the values are so small, an underestimation of only several W m-2
K-1
could
account for significant differences in the calculated power loss to the feed. Measurement of
additional thermal points along the length of the feed cell would reduce uncertainty in the feed
heat loss prediction in future experiments.
Although there is the possibility of uncertainty in the thermal model, it provides a useful
approximation of how effectively the input energy is being consumed as well as indicating how it
may be improved. In the ideal case for plasmonic pervaporation, all laser energy is absorbed by
the membrane and used explicitly for the evaporation of additional permeate. In reality, laser
absorption is limited by the absorbance fraction of the membrane and some heat will be lost by
alternate mechanisms. The blue diamonds in Figure 3.5 show the percentage of incident light
that is consumed by the vaporization of butanol for each membrane at 250, 500, and 750 mW
laser irradiation (left to right). For all membranes, each value falls below 7%, due mostly to the
low absorbance fraction. The red squares show the same data on the basis of absorbed light
rather than incident light. These values show that if 100% absorption was achieved in the
AuNCMs, >40% of the energy could be channeled to vaporization of the permeate. The
47
percentages fall with increasing laser power due to the combined effects of increased conduction
to the feed and decreased absorption fraction.
The thermal model shows that these two factors, heat loss to feed and absorption
efficiency, will exhibit the largest control over energy efficiency in the plasmonic pervaporation
process. Improvement in either factor would increase the overall economic impact. However,
the results in Figure 3.5 suggest that a much larger impact is possible by focusing on the
improvement of AuNCM light absorption. Independently reducing heat loss to the feed to 0% or
alternatively increasing AuNCM absorption efficiency to 100% result in 1.6- to 3-fold or 6.4- to
12-fold reductions in energy demand, respectively. In the following section, an empirical model
is developed that can be used in conjunction with this thermal analysis to predict the economic
impact of this process based on the initial analysis given in section 1.4.
3.3 PERVAPORATION MODELING
The economic impact analysis used a basis of a system with a 37 °C feed heated to 70 °C
for pervaporation. Based on the study used for the basis,19
flux was enhanced by a factor of 4.9
due to the increase in temperature. In order to estimate the economic effect of plasmonic heating
on the same basis, we must be able to estimate the energy input required to achieve an equivalent
flux enhancement. The effect on flux of increased driving force is readily calculated from the
vapor pressure as a function of temperature, but the effects of membrane permeance must be
modeled empirically using an activation energy analysis of the experimental fluxes. This
analysis also provides insights into why the permeance of the AuNCMs fell with increasing
temperature at rates that decreased according to Au content as was shown in Figure 2.9.

48
3.3.1 Activation Energy Analysis
Membrane permeance is dependent on both the diffusivity and sorption coefficients of
components in the membrane phase (eq 2.6). Temperature dependence of both these parameters
can be expressed as an Arrhenius-type relationship:61
RT
EDD D
ii exp0, (3.13)
RT
HKK SG
i
G
i exp0, (3.14)
where Di,0 and KG
i,0 are preexponential factors, ED is the activation energy of diffusion, and ∆HS
is the enthalpy of dissolution of the permeant in the membrane. Substitution of eqs 3.13 and 3.14
into eq 2.6 gives
RT
EP
RT
HEKDP P
i
SD
G
ii
i expexp 0,
0,0,
(3.15)
where 0,iP is the preexponential factor for permeance and EP is the activation energy for
permeability characterizing the combined temperature dependence of sorption and diffusivity.
Because temperature affects both the driving force (vapor pressure difference) and the
permeance, the thermal dependence of the permeance should be evaluated independently.
Substitution of eq 3.15 into eq 2.10 gives
RT
EP
pp
J P
i
ii
i exp0,
,0,
(3.16)
The parameters 0,iP and EP can then be determined by taking the natural log of each side and
plotting ln(Ji/∆p) vs. T-1
where ln 0,iP will be the y-intercept and EP will be the negative of the
slope (after multiplying by R) of a linear regression of the data points.61
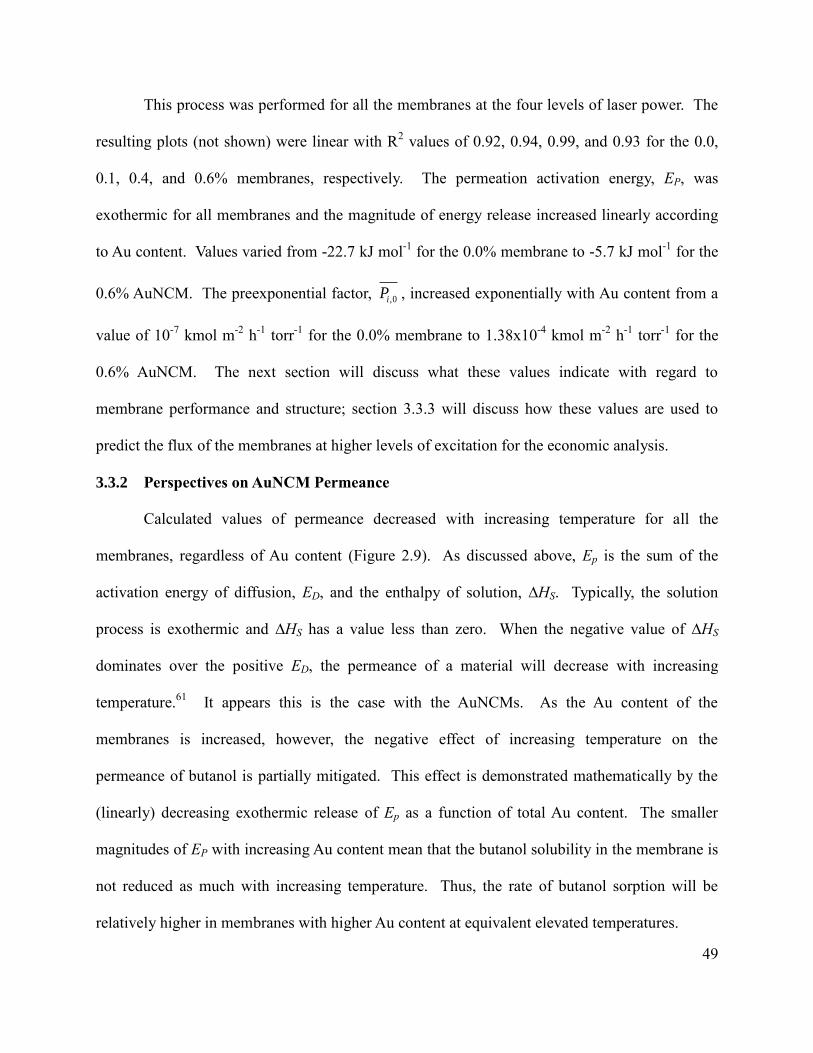
49
This process was performed for all the membranes at the four levels of laser power. The
resulting plots (not shown) were linear with R2 values of 0.92, 0.94, 0.99, and 0.93 for the 0.0,
0.1, 0.4, and 0.6% membranes, respectively. The permeation activation energy, EP, was
exothermic for all membranes and the magnitude of energy release increased linearly according
to Au content. Values varied from -22.7 kJ mol-1
for the 0.0% membrane to -5.7 kJ mol-1
for the
0.6% AuNCM. The preexponential factor, 0,iP , increased exponentially with Au content from a
value of 10-7
kmol m-2
h-1
torr-1
for the 0.0% membrane to 1.38x10⁻⁴
kmol m-2
h-1
torr-1
for the
0.6% AuNCM. The next section will discuss what these values indicate with regard to
membrane performance and structure; section 3.3.3 will discuss how these values are used to
predict the flux of the membranes at higher levels of excitation for the economic analysis.
3.3.2 Perspectives on AuNCM Permeance
Calculated values of permeance decreased with increasing temperature for all the
membranes, regardless of Au content (Figure 2.9). As discussed above, Ep is the sum of the
activation energy of diffusion, ED, and the enthalpy of solution, ∆HS. Typically, the solution
process is exothermic and ∆HS has a value less than zero. When the negative value of ∆HS
dominates over the positive ED, the permeance of a material will decrease with increasing
temperature.61
It appears this is the case with the AuNCMs. As the Au content of the
membranes is increased, however, the negative effect of increasing temperature on the
permeance of butanol is partially mitigated. This effect is demonstrated mathematically by the
(linearly) decreasing exothermic release of Ep as a function of total Au content. The smaller
magnitudes of EP with increasing Au content mean that the butanol solubility in the membrane is
not reduced as much with increasing temperature. Thus, the rate of butanol sorption will be
relatively higher in membranes with higher Au content at equivalent elevated temperatures.

50
The increased sorption rate of the more highly Au concentrated membranes most likely
occurs due to increased membrane swelling, defined as the weight fraction of penetrant (butanol)
inside the membrane relative to the weight fraction of the dry membrane material.80
Additional
penetrant in the membrane corresponds to increased mobility of the polymer chains and thus
significantly easier permeation through the membrane81
since diffusivities can increase orders of
magnitude as a result of swelling.80
A polymer’s susceptibility to swelling is directly tied to its
elastic modulus. As the modulus is increased (more rigid polymer), the degree to which the
membrane will swell under the same conditions is decreased.82, 83
In the AuNCMs, introduction
of the AuNPs results in two competing effects on the modulus of the composite polymer: i) an
increase due to the inclusion of nanoscale particles and ii) a decrease due to the consumption of
available crosslinker.
Inclusion of inorganic fillers (e.g.,carbon nanotubes) has been shown to substantially
increase the mechanical properties of PDMS.84
Recently, this effect has been demonstrated with
in situ reduction of metal salts (silver and gold) in PDMS to form nanocomposites like those
examined here.85, 86
The nanoparticles were shown to interface well with the PDMS matrix and
served to improve mechanical load transfer within the nanocomposite, resulting in a higher
modulus.86
Formation of the AuNPs in the AuNCMs then can reasonably be expected to increase
the elastic modulus to a certain extent and, consequently, prevent swelling. However, the elastic
modulus of PDMS decreases strongly as the degree of crosslinking is reduced82, 83, 87
because of
the increased mobility of the polymer chains.22
Deuschle et al. and Stafie et al. demonstrated
experimentally that PDMS swelling increases significantly in organic solutions when the
available crosslinker is reduced.82, 83

51
As discussed above, it was evident from experimental observations that the AuNCMs
were not curing as well when Au content was continually increased, indicating a possible
reduction in the degree of crosslinking that resulted from consumption of active crosslinker sites
by the ionic Au. The performance of the AuNCMs in this study suggests that the reduction in the
membranes’ elastic modulus due to reduced crosslinking dominates relative to any increase
resulting from inclusion of the AuNPs. Thus, it appears that the diminished decrease in
permeance as a function of increasing temperature stems from increased swelling in the highly
Au concentrated, but poorly crosslinked, AuNCMs. It should be noted that repeated swelling
cycles could detrimentally affect the AuNP/polymer interface, leading to poorer thermal contact
or nanoscale defects in the polymer structure. No measurable effects of this type were observed
in this study, but attention should be given to this possibility in future work.
3.3.3 Flux Prediction
Within the range of experimental observation, EP and 0,iP demonstrated linear and
exponential dependence, respectively, on the total Au content of the membrane – as mentioned in
section 3.3.1. These relationships enable functions to be defined that predict their values based
on Au mass %:
21 % AAuAEP (3.17)
%exp 210, AuBBPi
(3.18)
where A1, A2, B1, and B2 are fitting constants defined by the linear (R2=.81) and exponential
(R2=0.83) regressions. Eq 3.17 and 3.18 can then be substituted into eq 3.16 to give a single
empirical relation for flux based on Au mass %, temperature (saturation vapor pressure), and
permeate pressure. The results of the relation, as well as the experimentally measured fluxes, are

52
shown in 3.3.3. The simulated fluxes exhibit excellent agreement with the 0.4% and 0.6%
AuNCMs with a maximum error <3%. Agreement is worse for the 0.0% and 0.1% membranes
due to the difference in the 0.1% permeance at 0 mW discussed in section 2.3.4. However, the
error for all data points is <8% with one exception (9.6%). Flux values do not vary widely at
low temperatures and the simulations fall closely together. As temperature is raised, divergence
among the fluxes at similar temperatures grows large and the relative accuracy of the empirical
relation increases.
3.4 COUPLED MODEL FOR ECONOMIC ANALYSIS
The empirical relation for flux and the thermal model (eq 3.10) were coupled together by
setting
imi MWAJm (3.19)
where Am is the active area of the membrane, MWi is the molecular weight of i, and Ji is the flux
of i according to eqs 3.16, 3.17, and 3.18. This coupling created a single model that estimated
membrane SS ∆T, flux, and energy efficiencies with only three input parameters: incident laser
power, absorbance fraction, and membrane Au content. Using this model, realization of the
economic impact prediction given in section 1.4 could be estimated.
The predicted impact was based on experimental data19
and involved raising the feed
temperature from 37 °C to 70 °C for pervaporation, resulting in flux increase by a factor of 4.9.
Selectivity was shown not to vary significantly with temperature, so a constant selectivity of 45
was assumed. For the model predictions, all the same conditions were assumed. For each
simulation, laser power was raised to achieve a starting temperature of 37 °C (feed temperature)
to establish a baseline flux, and it was then adjusted to achieve the flux enhancement factor of
4.9. The resulting energy usage percentages were recorded and input into the economic model.

53
Thus for simulated plasmonic pervaporation, the utility usage included: i) energy (electricity)
needed for permeate vaporization divided by the efficiency predicted by the coupled thermal
model and ii) the cooling water (equal on an energy basis) to remove the percentage of heat lost
to the feed.
The results are shown in Figure 3.7. Like the results given in Figure 3.5, this analysis
was performed both assuming (Figure 3.7 (a)) 100% absorption by of laser light by the
membranes (laser power = power absorbed) and (Figure 3.7 (b)) assuming the actual, calculated
membrane laser absorbance (taken, for each membrane, as the average of the three values in
Figure 3.4). Lines in the figure show the original predictions from Figure 1.2. The shaded
regions outline the results calculated from the coupled thermal model – the top and bottom of
each region correspond to the 0.6% and 0.0% membranes, respectively. Energy and operating
cost reduction are indicated by the blue and red shaded regions, respectively. Areas of the
shaded region that fall below the dotted line at a reduction factor of one require more energy or
utility cost than the conventional method of feed heating. The model shows that, if the
membranes absorbed 100% of the incident laser light (laser power = QI in eq 3.10) energy usage
and utility cost of the process could be reduced by maximum factors of 6.42 and 2.73,
respectively, with the 0.6% membrane. Although, when the calculated absorbance is used, these
figures fall to 0.91 and 0.39 for the energy usage and utility cost, respectively, indicating that
plasmonic pervaporation will require slightly more energy and cost more than double to operate.
As was previously discussed, the two main losses of energy efficiency in this process are
heat loss to the feed and low light absorption in the membranes. The latter is ignored in Figure
3.7 (a) and it can be seen that the control of energy losses to the feed (and other mechanisms)
offers ~2-fold enhancement of the economic impact. However, increasing membrane absorbance

54
has the potential to increase the economic impact of the process by 7-fold (bringing it to the
levels shown in Figure 3.7 (a)). Thus, significantly more potential for improvement exists in
optimizing the AuNCMs to achieve as much absorption as possible. In the next chapter, a novel
spectroscopic approach is used as a first estimate of the physical characteristics of the AuNCMs
to investigate why they do not absorb as much light as was expected.
3.5 CONCLUSIONS
The work outlined in this chapter attempted to simulate and understand the
experimentally observed plasmonic pervaporation results. A thermal model was proposed to
describe the transfer of thermal energy in the plasmonic pervaporation process by a variety of
heat transfer modes. Loss of heat to the feed by conduction was shown to align well with an
infinite fin model for cooling. The model enabled the absorption fractions of each membrane to
be calculated and the resulting values were much smaller than the extinction values given in
Chapter 2. An activation energy analysis of the experimental flux data provided an empirical
model for predicting membrane permeance as a function of Au content. The mitigated negative
thermal dependence of membrane permeance with increased Au content was attributed to
increased swelling resulting from overconsumption of crosslinker. The two models were coupled
to identify the energy and utility cost savings that were possible with the plasmonic
pervaporation process. The process required more energy and was more costly due mainly to
low absorption but offered a potential 7-fold enhancement in energy and cost efficiency with
improved membrane fabrication. Additional improvements (2-fold) were shown to be possible
through reduction of energy loss to the feed.
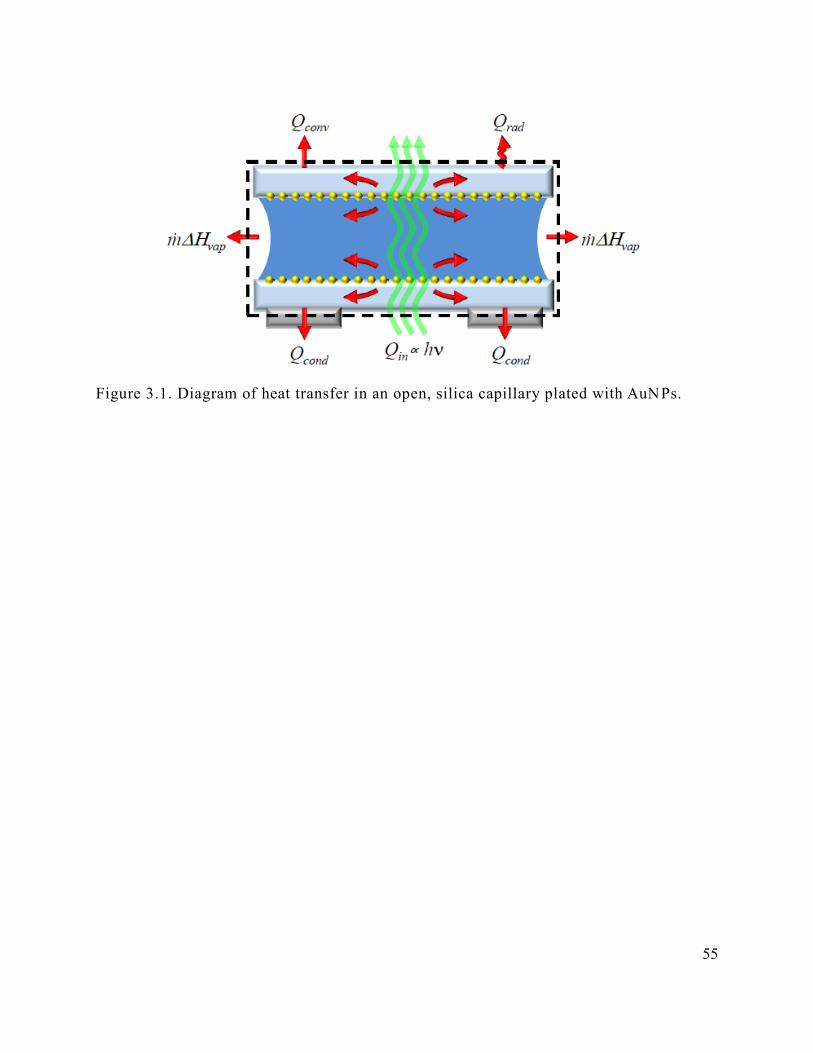
55
Figure 3.1. Diagram of heat transfer in an open, silica capillary plated with AuNPs.

56
Figure 3.2. Schematic of heat transfer from the laser heated AuNCM in the plasmonic
pervaporation system.
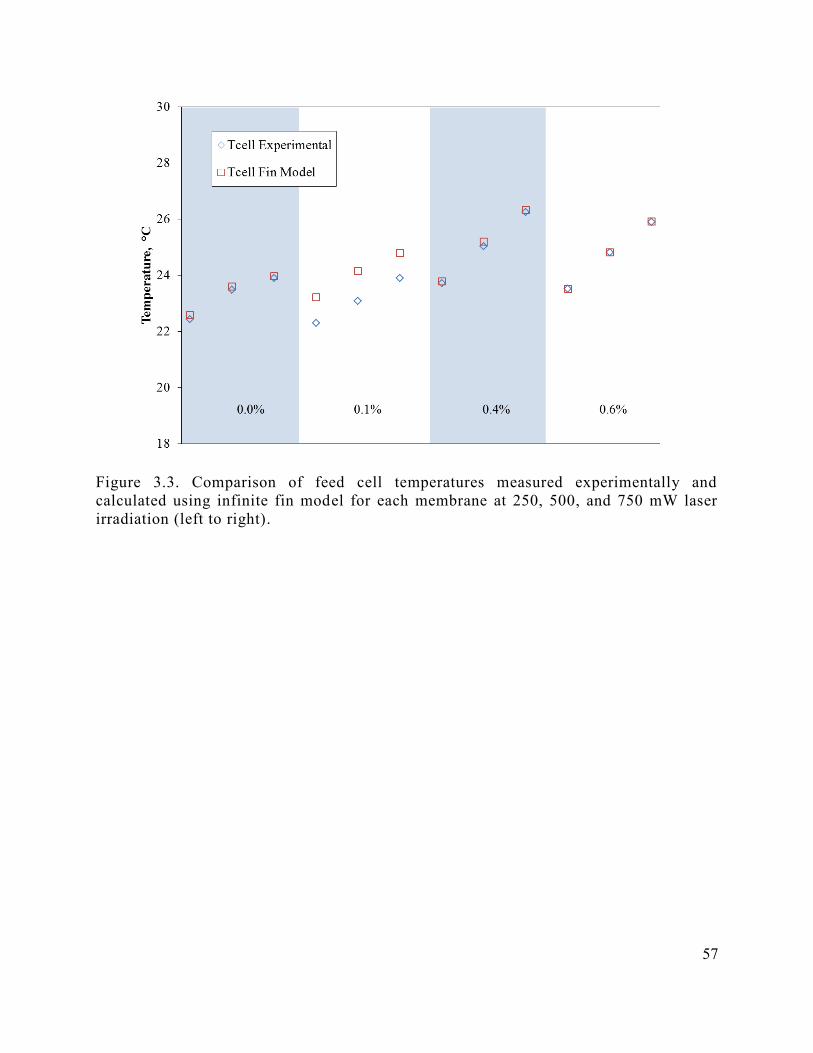
57
Figure 3.3. Comparison of feed cell temperatures measured experimentally and
calculated using infinite fin model for each membrane at 250, 500, and 750 mW laser
irradiation (left to right).

58
Figure 3.4. Membrane assembly (membrane and stainless steel mesh) laser absorbance
fractions for the four membranes at three levels of incident laser power. Representation
of the cumulative uncertainty inherent to these values is not shown here, but is
discussed at length in Chapter 3.
250 500 7500
0.02
0.04
0.06
0.08
0.1
0.12
0.14
0.16
0.18
Laser Power, mW
Cla
cula
ted
Las
er A
bso
rban
ce F
ract
ion
0.0% Au
0.1% Au
0.4% Au
0.6% Au

59
Figure 3.5. Energy consumed by vaporization of butanol permeate on two different
bases: i) as a percentage of the incident light and ii) as a percentage of the absorbed
light (incident light multiplied by the absorbance fractions in Figure 3.4) at 250, 500,
and 750 mW laser irradiation (left to right).

60
Figure 3.6. Comparison of experimentally measured fluxes and simulated fluxes
generated by an empirical model for membrane permeance based on Au content.
20 22 24 26 28 30
0.2
0.25
0.3
0.35
0.4
0.45
0.5
0.55
0.6
Temperature, °C
Flu
x, k
g m
2 h
1
0.0% Simulation
0.1% Simulation
0.4% Simulation
0.6% Simulation
0.0% Data
0.1% Data
0.4% Data
0.6% Data
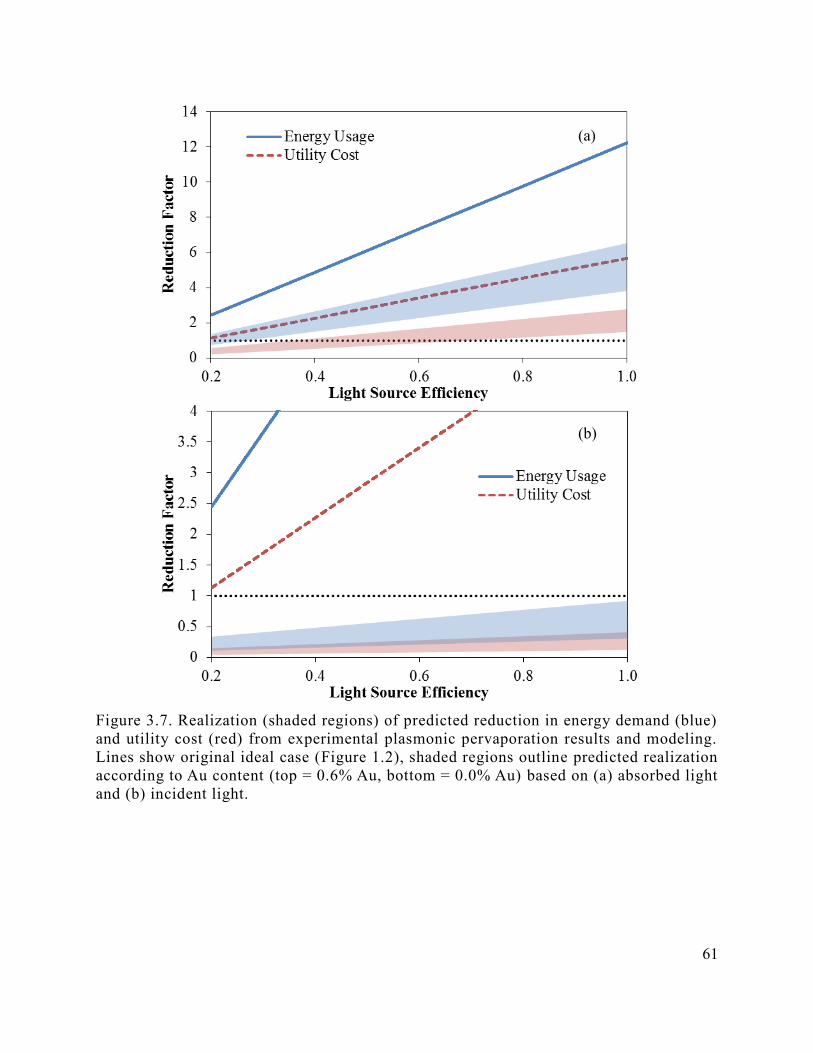
61
Figure 3.7. Realization (shaded regions) of predicted reduction in energy demand (blue)
and utility cost (red) from experimental plasmonic pervaporation results and modeling.
Lines show original ideal case (Figure 1.2), shaded regions outline predicted realization
according to Au content (top = 0.6% Au, bottom = 0.0% Au) based on (a) absorbed light
and (b) incident light.
(a)
(b)
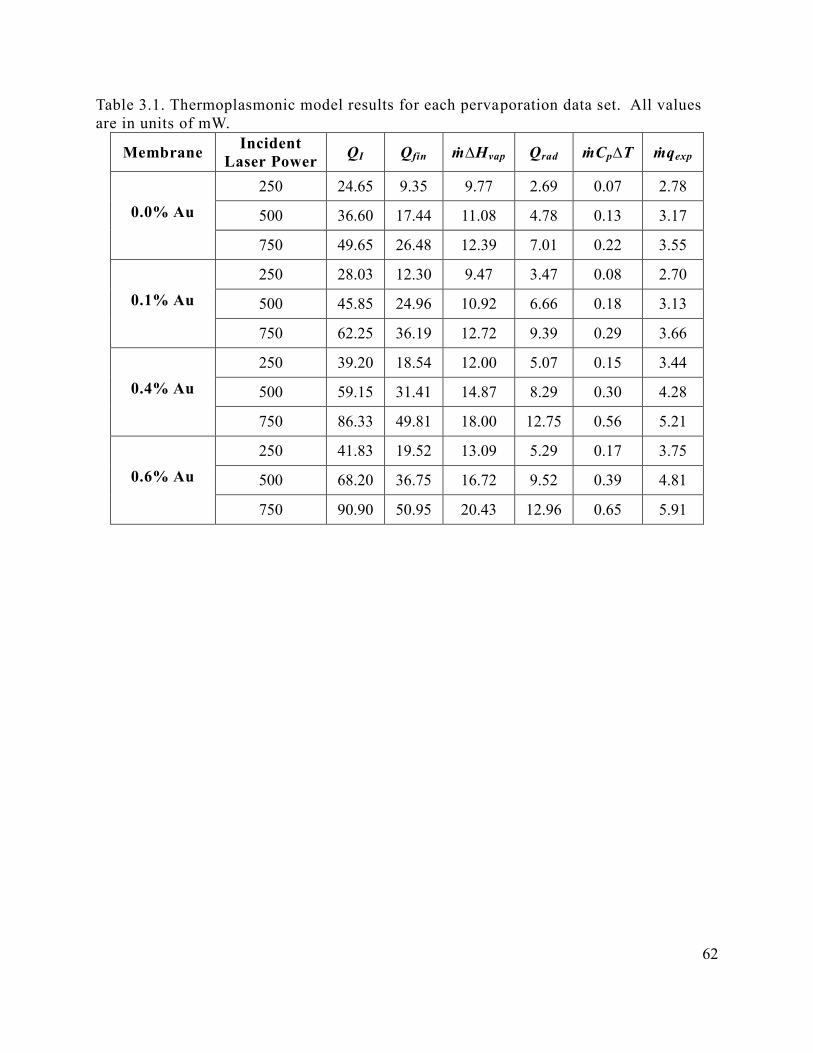
62
Table 3.1. Thermoplasmonic model results for each pervaporation data set. All values
are in units of mW.
Membrane Incident
Laser Power QI Qfin ṁ∆Hvap Qrad ṁCp∆T ṁqexp
0.0% Au
250 24.65 9.35 9.77 2.69 0.07 2.78
500 36.60 17.44 11.08 4.78 0.13 3.17
750 49.65 26.48 12.39 7.01 0.22 3.55
0.1% Au
250 28.03 12.30 9.47 3.47 0.08 2.70
500 45.85 24.96 10.92 6.66 0.18 3.13
750 62.25 36.19 12.72 9.39 0.29 3.66
0.4% Au
250 39.20 18.54 12.00 5.07 0.15 3.44
500 59.15 31.41 14.87 8.29 0.30 4.28
750 86.33 49.81 18.00 12.75 0.56 5.21
0.6% Au
250 41.83 19.52 13.09 5.29 0.17 3.75
500 68.20 36.75 16.72 9.52 0.39 4.81
750 90.90 50.95 20.43 12.96 0.65 5.91

63
CHAPTER 4
INITIAL CHARACTERIZATION OF NANOCOMPOSITE MEMBRANES
4.1 SIGNIFICANCE OF THE PRESENT WORK
In the previous chapters it was shown that plasmonic heating of AuNP-functionalized
pervaporation membranes can significantly and stably enhance the flux of butanol; yet, for the
system studied, the low levels of light absorption by the membranes reduces the economic
impact of the process beyond feasibility. In this chapter, physical properties of the AuNCMs
(e.g., AuNP size, concentration, etc.) are investigated to ascertain the cause of the low absorption
and identify potential for improvements. It is estimated that only a small fraction (<25%) of the
added Au is being reduced to the desired, green light-absorbing AuNPs. Evidence is then
provided to suggest that this result may stem from the formation of much larger Au particles that
are not plasmon-active at the desired wavelength, but increase the overall light scattering in the
polymer matrix, reducing the absorption efficiency.
Several methods of analysis were attempted to determine the physical properties of the
AuNCMs. Scanning electron microscopy (SEM, Philips XL40) was performed on the surfaces
of the membranes at 5 keV using the backscattering electron detector. Qualitative evidence of
the presence of AuNPs (30-80 nm) on the order of the desired diameter was obtained, but
charging due to the non-conducting PDMS and the fact that the vast majority of particles were
within the polymer matrix, rather than on the surface, prevented accurate evaluation of AuNP

64
properties. Silver paint was used on the samples to mitigate charging, but was not found to be
effective. X-ray photoelectron spectroscopy was performed in unscanned mode (150 eV) on the
cross-section of the most concentrated AuNCM (0.6%), but no peak for Au appeared in the
spectra. This could have resulted from diffuse AuNP dispersal as well as possible particle
removal as the sample was cleaved.
Additionally, attempts were made to remove the AuNPs from the matrix for SEM
analysis by dissolving the polymer in sulfuric acid and depositing the solution onto a silica
substrate. Multiple lower acid concentrations were tried, but only undiluted (95-98%) acid was
capable of dissolving the PDMS. Following dissolution of the polymer, the particles were
centrifuged and resuspended in water. A drop of the solution was dried on a glass slide and
examined in the SEM. The particles observed in the SEM were typically much larger than
expected based on plasmonic response suggesting aggregation had occurred during the
removal/deposition process due to the lack of a stabilizing agent. Also, many particles were
contained in what appeared to be large agglomerations of polymer. These results prevented
accurate analysis of AuNP properties using this approach.
Other investigations of nanocomposite materials such as those examined here have relied
upon transmission electron microscopy54, 86, 88, 89
(TEM) and, in some cases, X-ray diffraction89
for quantitative analysis of AuNP size and, to the author’s knowledge, have not attempted to
analyze final AuNP concentration in the polymer matrix. TEM analysis is not sufficient to
describe the large-scale (15 mm diameter) AuNCMs used here because it is both destructive to
the samples and only reasonably capable of investigating extremely small areas within the
nanocomposite – on the order of tens to hundreds of square microns. In contrast, UV-vis spectral
analysis of the AuNCMs offers the benefits of both not harming the material and investigating
65
the entire active area. Some researchers have claimed that spectral techniques are only sufficient
for qualitative analysis of similar materials (i.e., indication of the presence of NPs),90
but it has
been well established that UV-vis spectroscopy in conjunction with Mie theory and Beer-
Lambert’s law can be used to accurately evaluate both average AuNP size and concentration in
liquid AuNP composites.91, 92
The discussion that follows is an adaptation and extension of these
spectral techniques to the solid-state nanocomposites fabricated in this study.
The use of spectroscopic methods to quantify properties of materials of this type is
unprecedented, and the methods carry several convoluting factors that could affect the accuracy
of the approach. A list of underlying assumptions and potential limitations follows:
1. Defining a common baseline for spectral analysis was difficult because the AuNCMs vary
in transparency with Au content, so the raw spectra had to be adjusted.
2. Spectral methods (e.g., Beer-Lambert’s law) used were adapted from those used for liquid
analysis, not solid nanocomposites such as those in this study.
3. Mie theory (used for AuNP diameter and optical cross-sections) was developed for
spherical particles, thus the AuNPs are assumed to be spherical.
4. LSPR peak contributions are assumed to come only from AuNPs at the average diameter.
Efforts were made to identify and discuss possible implications of each difficulty, and literature
references are provided to support assumptions where possible. In spite of these considerations,
this analysis provides important insights into how Au is consumed in the membranes, and how it
might be improved
4.2 UV-VIS SPECTROSCOPIC ANALYSIS

66
4.2.1 Spectral Adjustment
The raw UV-vis spectra of the 12 AuNCMs, taken with a custom spectral system, are
shown in Figure 4.1 (a). As is evident from the figure, there appears to be no common baseline
between the samples, even though all were taken under the same conditions and with the same
reference (blank glass slide). The variation in baseline most likely results from the loss of
transparency associated with increased formation of macroscale agglomerates within the
nanocomposite (discussed below). Although the shape of the curves is meaningful and can
indicate some information (e.g., average AuNP size), inconsistency in the spectral baseline
makes quantitative analysis impossible since meaningful absolute extinction values cannot be
extracted. However, the laser extinction fractions given in Figure 2.2 provide an absolute
measurement of wavelength-specific (532 nm) extinction by the membranes. These laser
extinction fractions can be converted to spectral extinction values at 532 nm by rearrangement of
eq 3.2, given by Roper et al.,72
to
1
1log
I
QA ext
(4.1)
where A is the spectral extinction, Qext is the extinguished laser power, and I is the incident laser
power. For this calculation, the transduction efficiency,T, is neglected because no distinction is
made between absorbed and scattered light.
Once these spectral values are obtained, they provide an anchor for baseline (y-axis)
adjustment of the raw spectra shown in Figure 4.1 (a) which, in effect, normalizes the spectra by
providing a meaningful common baseline. The adjustment was performed by subtracting the raw
spectral extinction value at 532 nm from the entire spectrum and then adding back the spectral
extinction value converted from laser extinction fraction (using eq 4.1) in the same way. The

67
adjusted spectra are given in Figure 4.1 (b). The resulting agreement of spectra for AuNCMs
with the same Au content indicates that this normalization is an effective method for baseline
correction of these nanocomposite materials and suggests that the adjusted spectra may be used
for estimation of material properties. Some of the adjusted spectra fall below zero at longer
wavelengths because bare PDMS was not included in the spectral reference, but was accounted
for in the laser extinction fraction measurements. The adjusted spectra only show extinction due
to the presence of the particles.
4.2.2 Spectral Results
The spectra show impressive similarity in peak location, breadth, and amplitude among
the AuNCMs from different batches at the same Au content, providing additional evidence of the
reproducibility that is possible with this method. Figure 4.2 (a) shows the LSPR peak locations
for each membrane. The LSPR location seems to increase linearly with increasing Au content,
with 0.6% occurring as the only exception. On average there is a rise in the LSPR wavelength of
16.4 nm/Au%. The peak locations at equivalent Au content are very closely grouped with the
exception of singular outliers for the 0.1% and 0.6% groups. The standard deviation for the
0.4% and 0.75% groups are less than 1 nm (0.7 nm for both). Even with consideration of the
outlying points, the standard deviations for the 0.1% and 0.6% groups are quite small at 2.0 nm
and 3.3 nm, respectively. The largest divergences among spectral characteristics of the
AuNCMs occur at wavelengths much larger than the LSPR wavelength, likely due to differences
in the size and concentration of larger, aggregate particles.
If the AuNPs are assumed to be spherical in shape (supported by TEM analysis by
others86
), Mie theory can be used in conjunction with the LSPR locations to determine the
average diameter of the AuNPs.91
For this analysis, the refractive index of the polymer

68
nanocomposite was assumed to be that of the polymer itself (1.43). Previous studies have shown
that inclusion of certain inorganic filler particles in polymer matrices can either significantly
raise (e.g., PbS particles) or lower (AuNPs) the refractive index. However, these changes
resulted at 10- to 100-fold greater particle concentrations.93
Simulations were run for the LSPR
locations given in Figure 4.2 (a) and the resulting averages AuNP diameters are given Figure 4.2
(b). Since the diameter is only dependent on the refractive index (constant) and the LSPR
location, the simulated AuNP diameters follow the same trend. There is an average increase in
diameter with increasing Au content (~30 nm/Au%) and good agreement among diameters at the
same concentration. The 0.4% and 0.75% samples have a very small standard deviation (1.3 nm
for both) and the 0.1% and 0.6% AuNCMs have somewhat larger standard deviations (5.1 nm
and 7.0 nm, respectively) due to the outlying points.
In addition to particle diameter, Mie theory can be used to calculate, on a spectral basis,
the fraction of extinguished light that is absorbed (transduced to thermal energy) rather than
scattered by evaluating the ratio of absorption coefficient to extinction coefficient, Cabs/Cext. This
ratio can be used with the measured overall laser power extinction fraction values shown in
Figure 2.2 (Qext/I from eq 4.1) and further manipulation of eq 3.2 to directly calculate the
transduction efficiency for each AuNCM:
IQIQ
IQ
Q
Q
ext
AC
C
ext
abs
ext
abs
T
ext
abs
101
(4.2)
where T is the transduction efficiency defined as the ratio of absorbed (consumed) laser power,
Qabs, to total extinguished laser power, Qext. This value should be as high as possible as scattered
laser light results in a net energy loss in the plasmonic pervaporation process. Figure 4.3 shows
the fraction of incident laser light that is predicted to be absorbed by the particles, (Qext/IT.

69
An important result of this analysis is that the absorption fraction of the 0.6% Au
membrane is <5% smaller than that of the 0.75% (0.52 vs. 0.54, respectively) even though the
overall extinction fraction at 0.75% was 14.1% higher. This difference results from the samples’
relative average diameter and the fact that the ratio, Cabs/Cext, decreases rapidly as AuNP size
increases. The 0.75% samples have an average diameter of 545 nm with an average transduction
efficiency of 0.88 compared to 533 nm and 0.96 for the 0.6% sample. It appears that Au content
of 0.75% represents not only a curability limit (discussed above), but also may act as an
absorption limit due to increasing AuNP diameter. These results suggest that 50-55% laser
absorption is the maximum light-to-heat conversion efficiency achievable by AuNCMs of this
thickness without altering the fabrication method. Possible means of improving this efficiency
are discussed later.
The absorption values in Figure 4.3 should correspond (though not agree due to
convolution by the steel mesh) to the absorption efficiencies (Figure 3.4) calculated in the
previous chapter. The average (over the three laser powers) calculated absorption efficiencies for
the 0.1, 0.4, and 0.6% AuNCMs were 0.096, 0.130, and 0.142 compared to values from the
spectral analysis of 0.075, 0.376, and 0.520, respectively. There is close agreement for the 0.1%
AuNCM (not accounting for absorption by the mesh), but differences increase substantially with
increasing Au content. The reason for the increasing disparity between values estimated from the
two methods is most likely an increase in the formation of large, scattering particles in the
polymer matrix. This conclusion, with supporting evidence, will be discussed below.
4.3 ESTIMATION OF AUNP CONCENTRATION
Beer-Lambert’s law enables the calculation of the concentration of an absorbing element
in a solution using spectral analysis. It is given as Aλ=λlc, where A is spectral extinction, is
70
the wavelength-dependent molar extinction coefficient of the absorbing element, l is the path
length of light through the sample (membrane thickness), and c is the molar concentration. It
was demonstrated by Liu et al. that this relation could be used to accurately determine the
concentration of AuNPs in solution. Furthermore, they developed a double logarithmic relation
for calculation of the molar extinction coefficient of AuNPs in solution as a function of particle
diameter. The relation was given as
pp aDk lnln (4.3)
where kp and ap are experimentally-determined constants and D is the particle diameter. The
relation is specific to a wavelength of 506 nm and was shown to be independent of solution and
capping ligand (i.e., refractive index-independent).94
The adjusted spectra in Figure 4.1 (b) can
be combined with Beer-Lambert’s law and eq 4.3 to estimate AuNP concentration (NP mL-1
) in
the AuNCMs using the following equation:
pp
AAuNP
aDk
NAc
lnexp103
506 (4.4)
where cAuNP is the AuNP concentration in NP mL-1
, A506 is the extinction at 506 nm taken from
the adjusted spectra, NA is Avogadro’s number, 103 is a conversion factor from L to mL, and l is
the thickness of each AuNCM (74-79 m). There are three important assumptions inherent to
this calculation: i) Beer-Lambert’s law holds true for solid-state nanocomposite materials,88
ii)
the laser extinction-adjusted spectral extinction values are accurate, and iii) all extinction at 506
nm is directly attributable to AuNPs at the average diameter of each AuNCM.
The calculated AuNP concentrations are given for each membrane in Figure 4.4 (a). The
resulting AuNP concentrations are remarkably consistent within each sample set. The largest
variation occurs in the 0.6% set, although the respective concentrations are well within the same

71
order of magnitude, varying by <4-fold. The divergence in the concentrations of the two
outlying points results from their smaller average diameters compared to the remaining point in
the set. As a percentage of the average concentration, the standard deviation of the 0.1% set is
slightly less than that of the 0.6% set – 50.0% and 52.5%, respectively. Relative concentrations
in the 0.4% and 0.75% sample sets are significantly more closely aligned with standard
deviations of 14.4% and 5.7% of the average concentration, respectively. This level of
consistency is impressive given the facile methods used to produce the AuNCMs.
4.3.1 Insights into AuNP Growth
Interestingly, excluding the two outlying points at 0.6%, there is excellent agreement
among the AuNP concentrations across sample sets at different levels of Au content, with a
maximum difference of only 5-fold between the smallest and largest concentrations. Growth of
AuNPs in solution is widely described as involving two steps: i) particle nucleation involving the
coalescence of Au atoms into small nuclei and ii) particle growth involving both addition of Au
atoms to existing nuclei and the coalescence of small particles.92, 95, 96
Further investigation of
AuNCM fabrication would be required to draw firm conclusions regarding the exact growth
mechanism involved, but analysis of the data in Figure 4.4 (a) provides an initial perspective.
The consistency among different levels of Au content suggests that the AuNP growth mechanism
followed in all the AuNCMs is similar, regardless of the total Au content (over the range of
examined concentrations). In other words, a comparable number of nucleation sites appear to
form in each membrane and any additional Au content is primarily funneled toward growth of
existing particles rather than formation of additional nucleation sites. This conclusion is further
evidenced by the general upward trend of AuNP diameter as Au content is increased.

72
4.3.2 Gold Utilization
Knowledge of the AuNP concentration and their average diameter enables the
approximation of the percentage of added Au that is converted to 532-nm extinguishing AuNPs.
This percentage is calculated as
%100%
AuA
AuAuAuNP
mN
MWVNcC (4.5)
where C% is the conversion percentage, V is the total solution volume (2.2 mL), NAu is the
number of Au atoms per AuNP calculated using the average diameter and the bulk density of Au
(19.3 g/mL), MWAu is the molecular weight of Au, and mAu is the total mass of Au added to the
solution (2.2-16.5 mg). The conversion percentages for all AuNCMs are given in Figure 4.4 (b).
There is again a high level of consistency among the different batches at each level of Au
content. The average values of C% for the 0.1, 0.4, 0.6, and 0.75% samples are 15.6, 22.9, 28.0,
and 20.8% with standard deviations of only 2.4, 1.3, 2.9, and 0.9%, respectively. At 0.6%, the
agreement of C% is much stronger than it is for concentration among the three batches, which
results from the smaller diameters of the two outlying points from Figure 4.4 (a). C% does not
seem to follow a trend with increasing Au content, but rather, all the values fall within a small
window of variation. The average C% for all twelve AuNCMs is 21.8% with a standard deviation
of only 5.0%. This result suggests that, on average for all samples, less than 25% of the added
Au is being effectively used for formation of AuNPs that are plasmon-resonant at the excitation
wavelength of 532 nm.
This analysis provides several important insights regarding these materials. First, the
consistency in conversion percent provides further evidence that the AuNCMs are following a
highly similar growth mechanism that is stable across a wide range of Au contents. From a

73
practical standpoint, it is important that such a small amount of added Au is producing the
desired plasmonic AuNPs. This observation suggests that optimization of fabrication methods
could produce AuNCMs with significantly higher (≥4-fold) laser absorption capabilities. Lastly,
if it is assumed that no Au is left in ionic form, it follows that the majority of the Au content is
forming larger, undesirable particles. Evidence and discussion of this conclusion is provided in
the following section.
4.4 EVIDENCE OF THE PRESENCE OF LARGE PARTICLES
There are two indications of increasing formation of large particles with increases in total
Au content. The first is the consistency of conversion percent for all the AuNCMs. Since a
comparable fraction of Au content at each level is being used to form the larger, undesirable
particles, the concentration of these particles will increase with total Au content. The second
indication of increased large particles is reduced transparency in the membranes. Light
scattering in polymer nanocomposites containing random dispersions of primarily small particles
(absorbing) occurs at low levels and is virtually absent when compared to similar materials
containing equivalent volume fractions of larger particles (scattering). Therefore, composites
containing small particles are transparent and, as particle size increases, the composite material
will become increasingly opaque. The opacity will also increase as a function of particle
aggregation.97
Figure 4.5 shows digital images of lines viewed through AuNCMs at each
concentration under the same conditions. It is apparent from the figure that the AuNCMs
become increasingly opaque – indicating increasing concentration of light-scattering large
particles – in addition to becoming deeper in color – indicating increasing concentration of light-
absorbing small particles. This could explain why, although 0.6% AuNCMs appear to absorb
significantly more light than the 0.4% AuNCMs (Chapter 2), their thermal behavior under

74
operation is essentially equivalent. To the naked eye, the 0.6% AuNCM appears a deeper reddish
color, indicating a higher concentration of plasmonic AuNPs. However, the reduced
transparency of the polymer matrix would cause more light scattering, resulting in a
proportionally decreasing fraction of light reaching AuNPs located at increasing depths. Thus, a
larger concentration of plasmonic AuNPs may not necessarily result in a proportionally higher
thermal response under the same level of laser irradiation.
The loss of intensity at a specific wavelength due to the presence of large particles can
be estimated using the equation98
2
2
2
4
434
2
132exp
mp
mpmpT
nn
nnnr
I
I
(4.6)
where IT/I is the transmittance fraction of light at wavelength, λ, Φp is the volume fraction of
particles in the polymer, l is the thickness of the composite material (membrane thickness), r is
the particle radius, np is the refractive index of the particles, and nm is the refractive index of the
polymer. Simulations were run using this relation at a wavelength of 532 nm for each
concentration of AuNCM assuming particle diameters from 0-700 nm and 0-100% conversion of
total Au content to particles of that size (converted to volume fraction for use in eq 4.6). The
results for the four concentrations of AuNCMs are shown in Figure 4.6. This relation does not
predict plasmonic activity and thus, is only provided for qualitative evidence.
The transmittance fraction falls sharply (increased scattering) both as particle size
increases and as a higher percentage of Au is transformed to particles of a particular size. As
would be expected, the effects are more extreme at higher Au content. For example, for 0.1%
AuNCMs, 80% conversion of Au content to 200 nm particles results in a transmittance fraction

75
of 0.91 (>90% of light unaffected). The same conditions for the 0.75% AuNCM yield a
transmittance fraction of only 0.49. These theoretical results are entirely consistent with the
conclusions drawn from the images in Figure 4.5 and the data in Figure 4.4 (b). It was
demonstrated a comparable percentage (~78% on average) of added Au was converted to
undesirable, large particles for all membranes. Since a larger mass of Au is available to form
large particles at higher levels of Au content, the resulting particles will form with larger
diameters and/or in higher concentration. Both phenomena induce lower transmittance fractions
as was predicted in Figure 4.6 and higher levels of nanocomposite opacity as was experimentally
observed in Figure 4.5.
This observation has the potential to reduce the accuracy of the AuNP concentrations
given in Figure 4.4 (a). If a high concentration of larger particles is present in the AuNCMs, they
could be contributing to the total extinction at 532 nm. The degree to which the accuracy of the
concentrations is affected depends on both the size distribution of the large particles and the total
Au content of the material. For example, a transmittance fraction of 0.9 at 532 nm is still
achieved (meaning a small effect on total extinction at 532 nm) with 78% conversion of the
added Au to 205, 127, 113, and 106 nm particles for 0.1, 0.4, 0.6, and 0.75% AuNCMs,
respectively. Thus, calculation of concentration most likely decreases in accuracy as Au content
increases. This effect could account for the increasing differences between the predicted
absorbance values and those calculated from the thermal model. However, the presence of large
particles would most likely cause an overestimation of the calculated AuNP concentrations and,
by extension, the total conversion percentage of Au to desirable AuNPs. This result would imply
an even larger increase in plasmonic activity at 532 nm is possible by further refinement of
fabrication methods.

76
4.5 CONCLUSIONS
This chapter provided a novel spectroscopic method for estimating Au utilization in the
AuNCMs. Twelve AuNCMs formed by reduction of TCA in different concentrations were
analyzed. AuNCMs made in different batches with equivalent Au content demonstrated highly
similar properties indicating a high level of reproducibility in the fabrication method. The
spectral analysis was used to estimate AuNP concentration and the percentage of added Au that
was converted to 532 nm-resonant AuNPs. The analysis concluded that <25% of Au was
converted to desirable AuNPs for all levels of Au content indicating significant (≥4-fold)
potential for increased plasmonic response with refinement of fabrication methods. Evidence of
large particle formation was provided and evaluated against theoretical predictions. The large
particles appear to be the root of poor Au utilization and low laser absorption in the AuNCMs.
Preventing large particle formation by optimizing fabrication methods could result in significant
increases in AuNCM absorption efficiency. Some suggestions on how this may be achieved are
given in the final chapter.

77
Figure 4.1. Unadjusted (a) and laser extinction adjusted (b) UV-vis spectra of 12
AuNCMs (three batches at the 4 concentrations shown). Solid, dashed, and dotted lines
indicate batch 1, 2, and 3, respectively.
450 550 650 750
0
0.1
0.2
0.3
0.4
Wavelength, nm
Ex
tin
ctio
n,
a.u
.
450 550 650 7500
0.2
0.4
0.6
0.8
1
1.2
1.4
1.6
Wavelength, nm
Ex
tin
ctio
n,
a.u
.
0.40%
0.60%
0.75%
0.10%

78
Figure 4.2. Localized surface plasmon wavelength (a) and average AuNP diameter (b)
for the 12 AuNCMs (three batches at the 4 concentrations shown).
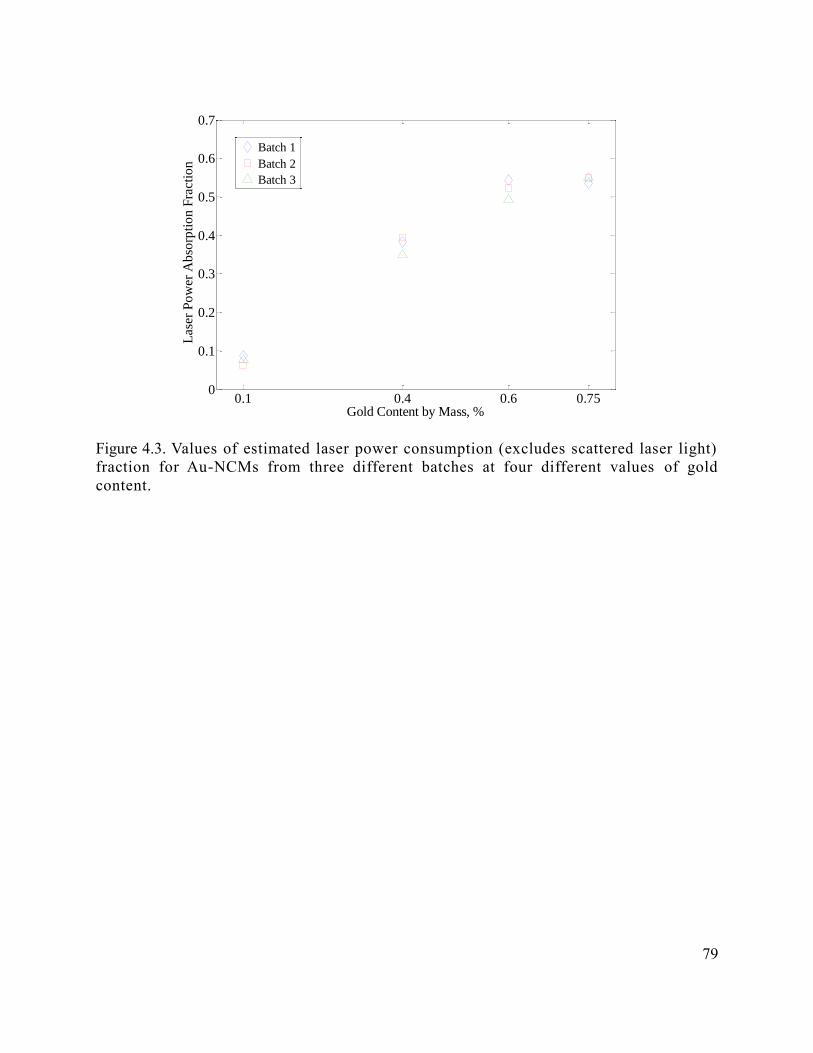
79
Figure 4.3. Values of estimated laser power consumption (excludes scattered laser light)
fraction for Au-NCMs from three different batches at four different values of gold
content.
0.1 0.4 0.6 0.750
0.1
0.2
0.3
0.4
0.5
0.6
0.7
Gold Content by Mass, %
Las
er P
ow
er A
bso
rpti
on
Fra
ctio
n
Batch 1
Batch 2
Batch 3

80
Figure 4.4. Estimated concentration of AuNPs (a) of the average diameters given in
Figure 4.2 and percent conversion of added Au to AuNPs of this type (b).

81
Figure 4.5. Increasing opaqueness of AuNCMs with increasing Au content indicat ing
increasing concentration of large particles.

82
Figure 4.6. Simulations of transmittance fraction of 532 nm light due to particle
scattering for four concentrations of AuNCM for particle diameters from 0 -700 nm and
for 0-100% conversion of total Au content to particles of that size.

83
CHAPTER 5
CONCLUDING REMARKS
The ability to carefully and precisely introduce thermal energy into a process via
plasmonic heating is a powerful tool. The purpose of this project was to demonstrate that
plasmonic heating of gold nanoparticle-functionalized, polymer nanocomposite membranes
(AuNCMs) in a pervaporation system could increase flux and lower energy demand in the
process to reduce the production cost of biobutanol. Experimental investigation showed
plasmonic membrane heating effectively increased butanol flux with controlled energy loss to
undesired mechanisms (feed heating, etc.). AuNCM absorption efficiencies in the system were
too low to achieve the predicted economic impact of the process; however, analysis of the
AuNCM physical and optical properties indicated that significant improvements are possible by
optimization of fabrication techniques. These improvements have the potential to make
plasmonic pervaporation economically superior to conventional methods.
The sections that follow summarize the findings of this study, discuss areas of ongoing
work, and suggest future areas of focus.
5.1 SUMMARY OF FINDINGS
5.1.1 Plasmonic Pervaporation System and Performance
Pervaporation flux enhancements of >100% were demonstrated using electromagnetic
excitation of AuNCMs. Enhancements were measured in a plasmonic pervaporation system that

84
was designed and constructed to allow uniform laser excitation and complete thermal analysis of
the membrane, as well as automated operation and data capture (flux, membrane and feed
temperature, permeate pressure, and ambient conditions). AuNCMs were fabricated in varying
concentrations by reduction of tetrachloroauric acid to gold nanoparticles in
polydimethylsiloxane facilitated by active sites in the polymer crosslinker. The AuNCMs
reached laser extinction percentages of >50% depending on Au content. Stable increases in
average membrane temperature (up to ~8 °C) and flux enhancements (up to ~117%) were
achieved and increased as a function of both total Au content and incident laser power.
Membrane thermal analysis allowed the permeance of each AuNCM to be evaluated as a
function of membrane temperature change. The permeance of each membrane fell as a function
of temperature change at a rate that decreased with increasing Au content.
5.1.2 Thermal Modeling
A thermal model was developed to calculate the absorption efficiencies of the membrane
assemblies in operation and quantify how energy in transferred within the plasmonic
pervaporation system. The model treated the membrane and support mesh as a single system
with one power input (the laser) and multiple power outputs. Power lost to the feed by
conduction was shown to align well with an infinite fin model. Calculated absorption of incident
laser light fell well below laser extinction percentages measured outside the system. Thermal
analysis of heat transfer mechanisms showed that conduction to the feed was the largest mode of
energy loss in the system, accounting for 38% to 58% of total heat loss depending on conditions.
The amount of input energy consumed by permeate vaporization varied from 20% to 40% and
generally decreased with increasing laser absorption. Other important modes of heat transfer
included radiation from the AuNCM/mesh and heat of isothermal expansion of the permeate.
85
Energy losses to the feed and to radiative transfer should be minimized to increase the efficiency
of the process.
5.1.3 Pervaporation Modeling and Economic Analysis
The dependence of membrane permeance on temperature and Au content were
characterized using an activation energy analysis of the experimental flux data. The analysis
provided the development of an empirical model for predicting membrane permeance. The
mitigated negative thermal dependence of membrane permeance with increased Au content was
attributed to increased swelling resulting from overconsumption of crosslinker. The empirical
model for permeance was coupled with the thermal model to evaluate the energy and utility cost
savings that were possible with the plasmonic pervaporation process and how they compared to
the initial predictions. The analysis showed plasmonic pervaporation required more energy and
was more costly than conventional feed heating due to the low laser absorption in the
membranes. However, the analysis showed the potential for 7-fold enhancement in energy and
cost efficiency with improved membrane fabrication and up to 2-fold enhancements from
reduction of energy loss to the feed.
5.1.4 AuNCM Characterization
Finally, the physical and optical properties of the AuNCMs were estimated using a novel
spectroscopic approach to evaluate the reason for the low laser absorption efficiencies. Twelve
AuNCMs formed by reduction of TCA in four different concentrations were analyzed. AuNCMs
with equivalent Au content demonstrated very similar properties indicating a high level of
reproducibility in the fabrication method. The spectral analysis showed that, on average, <25%
of added Au was converted to desirable AuNPs for all levels of Au content. This result indicated
that ≥4-fold potential exists for increased plasmonic response with refinement of fabrication

86
methods. Evidence of large particle formation was provided and identified as the most likely
reason for the low absorption efficiencies and a possible means of reducing the accuracy of the
spectral analysis. The improvement of fabrication methods to reduce large particle formation
and increase light absorption was demonstrated to be largest source of potential improvement in
the process of plasmonic pervaporation.
5.2 ONGOING AND FUTURE WORK
The sections below discuss work currently being performed as well as suggested research
areas to improve upon the current state of plasmonic pervaporation. Some alternative
applications are also suggested.
5.2.1 Improvements in Current System
There are several possible system and experimental modifications that were discussed
that could reduce uncertainty in the thermal model. First, incorporation of a mechanical
membrane support that is optically inert will offer improved negative control experiments and
deconvolute determination of the AuNCM efficiencies. A rigid, plastic mesh support may
accomplish this goal. Secondly, the measurement of additional thermal points along the length
of the feed tube would provide a more direct indication of the thermal profile and the associated
heat loss. Also, if radial heat transfer is significant in the membrane, thermal insulation of the
membrane assembly may allow a more uniform membrane thermal profile to be established.
5.2.2 Investigation of Selectivity
Plasmonic pervaporation results in this study were for butanol alone, but the effects of
AuNP inclusion, crosslinker consumption, and plasmonic heating of the AuNCMs on membrane
selectivity will be extremely important. Currently, we are beginning experiments similar to those
herein, but with pure water rather than butanol. The relative behavior of the two components
87
will provide and initial indication of selectivities that may be attained in the plasmonic
pervaporation system. Using multiple components simultaneously in the stagnant pervaporation
cell would result in dynamically evolving concentration gradients in the feed due to the lack of
mixing. Eventually, the cell could be redesigned to allow flow across the membrane from a
mixed vessel to enable direct determination of selectivity.
5.2.3 AuNCM Thermal Properties
We have recently characterized the spectral properties and thermal behavior of AuNP-
functionalized polymer nanocomposite films fabricated by different methods (TCA reduction and
pre-formed AuNP dispersion).99
Currently, work is being performed to estimate the transduction
efficiencies and thermal conductivities exhibited by these materials.100
The analysis will
examine how these properties change with increasing Au content and with different fabrication
methods. The results will provide helpful insights into how the absorption efficiencies of the
AuNCMs may be improved.
5.2.4 Membrane Optimization and Characterization
The present work concluded that the greatest potential for improvement in plasmonic
pervaporation is in membranes fabrication. The analysis showed hypothetical increases in
absorption efficiency of ≥4-fold are possible. The focus should be on reducing the formation of
large, light-scattering particles. Some suggested approaches are:
1. Varying fabrication methods. This could include different curing temperatures/times,
staged TCA addition and mixing, or sonication88
during AuNP growth to prevent
aggregation and stimulate additional nucleation.
2. Increasing crosslinker concentration. It was mentioned previously that AuNCMs did not
cure well with >0.6% Au by mass. It may be possible to increase Au content by providing

88
a higher fraction of crosslinker. This may also result in higher AuNP concentration from
the additional site for possible nucleation.
These improved methods will serve both to increase the economic impact of plasmonic
pervaporation and the accuracy of the spectral characterization method developed in this work.
It has also been suggested that alternative particle analysis techniques such as small-angle
scattering, energy-dispersive x-ray spectroscopy, and x-ray photoelectron spectroscopy could be
employedestimate AuNCM properties. Collaboration with investigators familiar with application
of these techniques to nanoscale analysis could provide direct, in situ characterization of particle
size distribution, concentration, and interface composition
5.2.5 Additional Applications
It has been demonstrated herein that the localized introduction of energy can strongly
benefit a process in terms of productivity and energy efficiency, but this effect is not limited to
pervaporation. This same approach could be applied in alternate membrane separations, catalytic
systems, and heating in microfluidic channels.
89
REFERENCES
1. Qureshi, N.; Ezeji, T. C. Butanol, 'a Superior Biofuel' Production from Agricultural Residues
(Renewable Biomass): Recent Progress in Technology. Biofuels, Bioproducts and Biorefining
2008, 2, 319-330.
2. Duerre, P. Biobutanol: An Attractive Biofuel. Biotechnology Journal 2007, 2, 1525-1534.
3. Vane, L. M. A Review of Pervaporation for Product Recovery from Biomass Fermentation
Processes. Journal of Chemical Technology & Biotechnology 2005, 80, 603-629.
4. Kraemer, K.; Harwardt, A.; Bronneberg, R.; Marquardt, W. Separation of Butanol from
Acetone-Butanol-Ethanol Fermentation by a Hybrid Extraction-Distillation Process.
Computers & Chemical Engineering 2011, 35, 949-963.
5. Friedl, A.; Qureshi, N.; Maddox, I. Continuous Acetone-Butanol-Ethanol (ABE) Fermentation
using Immobilized Cells of Clostridium Acetobutylicum in a Packed Bed Reactor and
Integration with Product Removal by Pervaporation. Biotechnology and Bioengineering 2004,
38, 518-527.
6. Kujawski, W. Application of Pervaporation and Vapor Permeation in Environmental
Protection. Polish Journal of Environmental Studies 2000, 9, 13-26.
7. Lin, L.; Zhang, Y.; Kong, Y. Recent Advances in Sulfur Removal from Gasoline by
Pervaporation. Fuel 2009, 88, 1799-1809.
8. Huh, H.; Rhim, J. W.; Park, J. S.; Nam, S. Y. Petroleum Separation through Polymer Blend
Membranes by using Pervaporation. Materials Science Forum 2005, 486-487, 432-435.
9. White, L. S. Development of Large-Scale Applications in Organic Solvent Nanofiltration and
Pervaporation for Chemical and Refining Processes. Journal of Membrane Science 2006, 286,
26-35.
10. Shao, P.; Kumar, A. Separation of 1-butanol/2,3-Butanediol using ZSM-5 Zeolite-Filled
Polydimethylsiloxane Membranes. Journal of Membrane Science 2009, 339, 143-150.
11. Wang, Y.; Chung, T. S.; Wang, H. Polyamide-Imide Membranes with Surface Immobilized
Cyclodextrin for Butanol Isomer Separation Via Pervaporation. AIChE J. 2011, 57, 1470-
1484.
12. Choudhari, S. K.; Kariduraganavar, M. Y. Development of Novel Composite Membranes
using Quaternized Chitosan and Na+-MMT Clay for the Pervaporation Dehydration of
Isopropanol. Journal of Colloid and Interface Science 2009, 338, 111-120.

90
13. Sommer, S.; Melin, T. Design and Optimization of Hybrid Separation Processes for the
Dehydration of 2-Propanol and Other Organics. Industrial & Engineering Chemistry
Research 2004, 43, 5248-5259.
14. Zhang, W.; Sun, W.; Yang, J.; Ren, Z. The Study on Pervaporation Behaviors of Dilute
Organic Solution through PDMS/PTFE Composite Membrane. Applied Biochemistry and
Biotechnology 2010, 160, 156-167.
15. Zhou, H.; Su, Y.; Chen, X.; Wan, Y. Separation of Acetone, Butanol and Ethanol (ABE)
from Dilute Aqueous Solutions by Silicalite-1/PDMS Hybrid Pervaporation Membranes.
Separation and Purification Technology 2011, 79, 375-384.
16. Guo, J.; Zhang, G.; Wu, W.; Ji, S.; Qin, Z.; Liu, Z. Dynamically Formed Inner Skin Hollow
Fiber polydimethylsiloxane/polysulfone Composite Membrane for Alcohol Permselective
Pervaporation. Chemical Engineering Journal 2010, 158, 558-565.
17. Li, S.; Srivastava, R.; Parnas, R. S. Study of in Situ 1-Butanol Pervaporation from A-B-E
Fermentation using a PDMS Composite Membrane: Validity of Solution-Diffusion Model
for Pervaporative A-B-E Fermentation. Biotechnology Progress 2011, 27, 111-120.
18. Li, S.; Srivastava, R.; Parnas, R. S. Separation of 1-Butanol by Pervaporation using a Novel
Tri-Layer PDMS Composite Membrane. Journal of Membrane Science 2010, 363, 287-294.
19. Huang, J.; Meagher, M. M. Pervaporative Recovery of n-Butanol from Aqueous Solutions
and ABE Fermentation Broth using Thin-Film Silicalite-Filled Silicone Composite
Membranes. Journal of Membrane Science 2001, 192, 231-242.
20. Fouad, E. A.; Feng, X. Pervaporative Separation of n-Butanol from Dilute Aqueous
Solutions using Silicalite-Filled Poly(Dimethyl Siloxane) Membranes. Journal of
Membrane Science 2009, 339, 120-125.
21. Pribic, P.; Roza, M.; Zuber, L. How to Improve the Energy Savings in Distillation and
Hybrid Distillation-Pervaporation Systems. Separation Science and Technology 2006, 41,
2581-2602.
22. Shao, P.; Huang, R. Y. M. Polymeric Membrane Pervaporation. Journal of Membrane
Science 2007, 287, 162-179.
23. Sommer, S.; Klinkhammer, B.; Schleger, M.; Melin, T. Performance Efficiency of Tubular
Inorganic Membrane Modules for Pervaporation. AIChE J. 2005, 51, 162-177.
24. Karlsson, H. O. E.; Traegardh, G. Heat Transfer in Pervaporation. Journal of Membrane
Science 1996, 119, 295-306.
25. Boeddeker, K. W.; Bengtson, G.; Pingel, H.; Dozel, S. Pervaporation of High Boilers using
Heated Membranes. Desalination 1993, 90, 249-257.
91
26. Ho, W. S. W.,; Sirkar, K. K., In Membrane Handbook; Van Nostrand Reinhold: New York,
1992; .
27. Storti, B.; Elisei, F.; Abbruzzetti, S.; Viappiani, C.; Latterini, L. One-Pot Synthesis of Gold
Nanoshells with High Photon-to-Heat Conversion Efficiency. Journal of Physical
Chemistry, C 2009, 113, 7516-7521.
28. Cortie, M. B.; Xu, X.; Chowdhury, H.; Zareie, H.; Smith, G. Plasmonic Heating of Gold
Nanoparticles and its Exploitation. Proceedings of SPIE 2005, 5649, 565-573.
29. Grua, P.; Morreeuw, J. P.; Bercegol, H.; Jonusauskas, G.; Vallee, F. Electron Kinetics and
Emission for Metal Nanoparticles Exposed to Intense Laser Pulses. Physical Review B 2003,
68, 035424/1-035424/12.
30. Voisin, C.; Del Fatti, N.; Christofilos, D.; Vallee, F. Ultrafast Electron Dynamics and Optical
Nonlinearities in Metal Nanoparticles. Journal of Physical Chemistry, B 2001, 105, 2264-
2280.
31. Pissuwan, D.; Valenzuela, S. M.; Cortie, M. B. Therapeutic Possibilities of Plasmonically
Heated Gold Nanoparticles. Trends in Biotechnology 2006, 24, 62-67.
32. Avedisian, C. T.; Cavicchi, R. E.; McEuen, P. L.; Zhou, X. Nanoparticles for Cancer
Treatment: Role of Heat Transfer. Annals of the New York Academy of Sciences 2009, 1161,
62-73.
33. Tong, L.; Zhao, Y.; Huff, T. B.; Hansen, M. N.; Wei, A.; Cheng, J. X. Gold Nanorods
Mediate Tumor Cell Death by Compromising Membrane Integrity. Advanced Materials
2007, 19, 3136.
34. Skirtach, A. G.; Dejugnat, C.; Braun, D.; Susha, A. S.; Rogach, A. L.; Parak, W. J.;
Mohwald, H.; Sukhorukov, G. B. The Role of Metal Nanoparticles in Remote Release of
Encapsulated Materials. Nano Letters 2005, 5, 1371-1377.
35. Seol, Y.; Carpenter, A. E.; Perkins, T. T. Gold Nanoparticles: Enhanced Optical Trapping
and Sensitivity Coupled with Significant Heating. Optics Letters 2006, 31, 2429-2431.
36. Hashimoto, S.; Uwada, T.; Hagiri, M.; Takai, H.; Ueki, T. Gold Nanoparticle-Assisted Laser
Surface Modification of Borosilicate Glass Substrates. Journal of Physical Chemistry, C
2009, 113, 20640-20647.
37. Halabica, A.; Idrobo, J. C.; Pantelides, S. T.; Magruder, R. H.,III; Pennycook, S. J.; Haglund,
R. F.,Jr Pulsed Infrared Laser Annealing of Gold Nanoparticles Embedded in a Silica
Matrix. Journal of Applied Physics 2008, 103, 083545/1-083545/4.

92
38. Aguirre, C. M.; Moran, C. E.; Young, J. F.; Halas, N. J. Laser-Induced Reshaping of
Metallodielectric Nanoshells Under Femtosecond and Nanosecond Plasmon Resonant
Illumination. Journal of Physical Chemistry, B 2004, 108, 7040-7045.
39. Cao, L.; Barsic, D. N.; Guichard, A. R.; Brongersma, M. L. Plasmon-Assisted Local
Temperature Control to Pattern Individual Semiconductor Nanowires and Carbon
Nanotubes. Nano Letters 2007, 7, 3523-3527.
40. Yu, J.; Dai, G.; Huang, B. Fabrication and Characterization of Visible-Light-Driven
Plasmonic Photocatalyst Ag/AgCl/TiO2 Nanotube Arrays. Journal of Physical Chemistry, C
2009, 113, 16394-16401.
41. Yen, C.; El-Sayed, M. A. Plasmonic Field Effect on the Hexacyanoferrate (III)-Thiosulfate
Electron Transfer Catalytic Reaction on Gold Nanoparticles: Electromagnetic Or Thermal?.
Journal of Physical Chemistry, C 2009, 113, 19585-19590.
42. Adleman, J. R.; Boyd, D. A.; Goodwin, D. G.; Psaltis, D. Heterogenous Catalysis Mediated
by Plasmon Heating. Nano Letters 2009, 9, 4417-4423.
43. Jain, P. K.; Lee, K. S.; El-Sayed, I. H.; El-Sayed, M. A. Calculated Absorption and
Scattering Properties of Gold Nanoparticles of Different Size, Shape, and Composition:
Applications in Biological Imaging and Biomedicine. Journal of Physical Chemistry, B
2006, 110, 7238-7248.
44. Ahn, W.; Roper, D. K. Transformed Gold Island Film Improves Light-to-Heat Transduction
of Nanoparticles on Silica Capillaries. Journal of Physical Chemistry C 2008, 112, 12214-
12218.
45. Russell, A. G.; McKnight, M. D.; Sharp, A. C.; Hestekin, J. A.; Roper, D. K. Gold
Nanoparticles Allow Optoplasmonic Evaporation from Open Silica Cells with a
Logarithmic Approach to Steady-State Thermal Profiles. Journal of Physical Chemistry, C
2010, 114, 10132-10139.
46. Seader, J. D.; Henley, E. J. In Separation Process Principles; Wiley, John & Sons,
Incorporated: Hoboken, NJ, 2006; .
47. Gomez, M. T.; Klein, A.; Repke, J.; Wozny, G. A New Energy-Integrated Pervaporation
Distillation Approach. Desalination 2008, 224, 28-33.
48. Gomez, M. T.; Repke, J.; Kim, D.; Yang, D. R.; Wozny, G. Reduction of Energy
Consumption in the Process Industry using a Heat-Integrated Hybrid Distillation
Pervaporation Process. Industrial & Engineering Chemistry Research 2009, 48, 4484-4494.
49. Fernandez, E.; Geerdink, P.; Goetheer, E. L. V. Thermo Pervap: The Next Step in Energy
Efficient Pervaporation. Desalination 2010, 250, 1053-1055.

93
50. Tsujita, Y.; Yoshimizu, H.; Nakai, Y.; Kinoshita, T. Control of Gas Permeability of
Polymeric Membrane by Microwave Irradiation. Polymeric Materials: Science and
Engineering 2001, 85, 583.
51. Nakai, Y.; Yoshimizu, H.; Tsujita, Y. Enhanced Gas Permeability of Cellulose Acetate
Membranes Under Microwave Irradiation. Journal of Membrane Science 2005, 256, 72-77.
52. Nakai, Y.; Tsujita, Y.; Yoshimizu, H. Control of Gas Permeability for Cellulose Acetate
Membrane by Microwave Irradiation. Desalination 2002, 145, 375-377.
53. Wnuk, R.; Chmiel, H. Direct Heating of Composite Membranes in Pervaporation and Gas
Separation Processes. Journal of Membrane Science 1992, 68, 293-300.
54. Vanherck, K.; Hermans, S.; Verbiest, T.; Vankelecom, I. Using the Photothermal Effect to
Improve Membrane Separations Via Localized Heating. Journal of Materials Chemistry
2011, 21, 6079-6087.
55. Vanherck, K.; Vankelecom, I.; Verbiest, T. Improving Fluxes of Polyimide Membranes
Containing Gold Nanoparticles by Photothermal Heating. Journal of Membrane Science
2011, 373, 5-13.
56. Zhang, Q.; Xu, J.; Liu, Y.; Chen, H. In-Situ Synthesis of Poly(Dimethylsiloxane)-Gold
Nanoparticles Composite Films and its Application in Microfluidic Systems. Lab on a Chip
2008, 8, 352-357.
57. Russell, A.; Schwarz, S.; Heskekin, J.; Roper, D. K. 2012 (In Preparation).
58. Bergstrom, D.; Powell, J.; Kaplan, A. F. K. The Absorptance of Steels to Nd:YLF and
Nd:YAG Laser Light at Room Temperature. Applied Surface Science 2007, 253, 5017-
5028.
59. Yampolskii, Y.; Pinnau, I.; Freeman, B. D.; (Eds.) In Materials Science of Membranes for
Gas and Vapor Separation. 2006, 445.
60. Wijmans, J. G.; Baker, R. W. The Solution-Diffusion Model: A Review. Journal of
Membrane Science 1995, 107, 1-21.
61. Feng, X.; Huang, R. Y. M. Liquid Separation by Membrane Pervaporation: A Review.
Industrial & Engineering Chemistry Research 1997, 36, 1048-1066.
62. Harris, N.; Ford, M. J.; Cortie, M. B. Optimization of Plasmonic Heating by Gold
Nanospheres and Nanoshells. Journal of Physical Chemistry, B 2006, 110, 10701-10707.
63. Volkov, A. N.; Sevilla, C.; Zhigilei, L. V. Numerical Modeling of Short Pulse Laser
Interaction with Au Nanoparticle Surrounded by Water. Applied Surface Science 2007, 253,
6394-6399.

94
64. Hu, M.; Hartland, G. V. Heat Dissipation for Au Particles in Aqueous Solution: Relaxation
Time Versus Size. Journal of Physical Chemistry, B 2002, 106, 7029-7033.
65. Lapotko, D. Optical Excitation and Detection of Vapor Bubbles Around Plasmonic
Nanoparticles. Optics Express 2009, 17, 2538-2556.
66. Kotaidis, V.; Dahmen, C.; von Plessen, G.; Springer, F.; Plech, A. Excitation of Nanoscale
Vapor Bubbles at the Surface of Gold Nanoparticles in Water. Journal of Physical
Chemistry 2006, 124, 184702/1-184702/7.
67. Lukianova-Hleb, E. Y.; Lapotko, D. O. Influence of Transient Environmental Photothermal
Effects on Optical Scattering by Gold Nanoparticles. Nano Letters 2009, 9, 2160-2166.
68. Hu, M.; Petrova, H.; Hartland, G. V. Investigation of the Properties of Gold Nanoparticles in
Aqueous Solution at Extremely High Lattice Temperatures. Chemical Physics Letters 2004,
391, 220-225.
69. Lapotko, D. Pulsed Photothermal Heating of the Media during Bubble Generation Around
Gold Nanoparticles. International Journal of Heat and Mass Transfer 2009, 52, 1540-1543.
70. Lapotko, D.; Lukianova, E. Laser-Induced Micro-Bubbles in Cells. International Journal of
Heat and Mass Transfer 2004, 48, 227-234.
71. Richardson, H. H.; Carlson, M. T.; Tandler, P. J.; Hernandez, P.; Govorov, A. O.
Experimental and Theoretical Studies of Light-to-Heat Conversion and Collective Heating
Effects in Metal Nanoparticle Solutions. Nano Letters 2009, 9, 1139-1146.
72. Roper, D. K.; Ahn, W.; Hoepfner, M. Microscale Heat Transfer Transduced by Surface
Plasmon Resonant Gold Nanoparticles. Journal of Physical Chemistry, C 2007, 111, 3636.
73. Hoepfner, M. P.; Roper, D. K. Describing Temperature Increases in Plasmon-Resonant
Nanoparticle Systems. Journal of Thermal Analysis and Calorimetry 2009, 98, 197-202.
74. Russell, A. G.; McKnight, M. D.; Hestekin, J. A.; Roper, D. K. Thermodynamics of
Optoplasmonic Heating in Fluid-Filled Gold-Nanoparticle-Plated Capillaries. Langmuir
2011, 27, 7799-7805.
75. Ahn, W.; Taylor, B.; Dall'Asen, A. G.; Roper, D. K. Electroless Gold Island Thin Films:
Photoluminescence and Thermal Transformation to Nanoparticle Ensembles. Langmuir
2008, 24, 4174-4184.
76. Jang, G.; Roper, D. K. Continuous-Flow Electroless Plating Enhances Optical Features of
Au Films and Nanoparticles. Journal of Physical Chemistry,C 2009, 113, 19228-19236.

95
77. Cengel, Y. A. In Heat and Mass Transfer: A Practical Approach; McGraw-Hill: New York,
NY, 2007.
78. Smith, J. M.; Van Ness, H. C.; Abbot, M. M. In Introduction to Chemical Engineering
Thermodynamics; McGraw-Hill: New York, NY, 2005.
79. Link, S.; El-Sayed, M. A. Size and Temperature Dependence of the Plasmon Absorption of
Colloidal Gold Nanoparticles. Journal of Physical Chemistry, B 1999, 103, 4212-4217.
80. Mulder, M.; Editor Basic Principles of Membrane Technology, Second Edition. 1996, 564.
81. Vankelecom, I. F. J.; Depre, D.; De Beukelaer, S.; Uytterhoeven, J. B. Influence of Zeolites
in PDMS Membranes: Pervaporation of Water/Alcohol Mixtures. Journal of Physical
Chemistry 1995, 99, 13193-13197.
82. Deuschle, J. K.; de Souza, E. J.; Arzt, E.; Enders, S. Nanoindentation Studies on Crosslinking
and Curing Effects of PDMS. International Journal of Materials Research 2010, 101, 1014-
1023.
83. Stafie, N.; Stamatialis, D. F.; Wessling, M. Effect of PDMS Cross-Linking Degree on the
Permeation Performance of PAN/PDMS Composite Nanofiltration Membranes. Separation
and Purification Technology 2005, 45, 220-231.
84. Ci, L.; Suhr, J.; Pushparaj, V.; Zhang, X.; Ajayan, P. M. Continuous Carbon Nanotube
Reinforced Composites. Nano Letters 2008, 8, 2762-2766.
85. Niklaus, M.; Shea, H. R. Electrical Conductivity and Young's Modulus of Flexible
Nanocomposites made by Metal-Ion Implantation of Polydimethylsiloxane: The
Relationship between Nanostructure and Macroscopic Properties. Acta Materialia 2010, 59,
830-840.
86. Goyal, A.; Kumar, A.; Patra, P. K.; Mahendra, S.; Tabatabaei, S.; Alvarez, P. J. J.; John, G.;
Ajayan, P. M. In Situ Synthesis of Metal Nanoparticle Embedded Free Standing
Multifunctional PDMS Films. Macromolecular Rapid Communications 2009, 30, 1116-
1122.
87. Mata, A.; Fleischman, A. J.; Roy, S. Characterization of Polydimethylsiloxane (PDMS)
Properties for Biomedical micro/nanosystems. Biomedical Microdevices 2005, 7, 281-293.
88. Ryu, D.; Loh, K. J.; Ireland, R.; Karimzada, M.; Yaghmaie, F.; Gusman, A. M. In Situ
Reduction of Gold Nanoparticles in PDMS Matrices and Applications for Large Strain
Sensing. Smart Structures and Systems 2011, 8, 471-486.
89. Kumar, R.; Pandey, A. K.; Tyagi, A. K.; Dey, G. K.; Ramagiri, S. V.; Bellare, J. R.;
Goswami, A. In Situ Formation of Stable Gold Nanoparticles in Polymer Inclusion
Membranes. Journal of Colloid and Interface Science 2009, 337, 523-530.
96
90. Vanherck, K.; Verbiest, T.; Vankelecom, I. Comparison of Two Synthesis Routes to Obtain
Gold Nanoparticles in Polyimide. Journal of Physical Chemistry, C 2012, 116, 115-125.
91. Haiss, W.; Thanh, N. T. K.; Aveyard, J.; Fernig, D. G. Determination of Size and
Concentration of Gold Nanoparticles from UV-Vis Spectra. Analytical Chemistry 2007, 79,
4215-4221.
92. Liu, X.; Worden, J. G.; Huo, Q.; Brennan, J. P. Kinetic Study of Gold Nanoparticle Growth
in Solution by Brust-Schiffrin Reaction. Journal of Nanoscience and Nanotechnology 2006,
6, 1054-1059.
93. Caseri, W. Nanocomposites of Polymers and Metals or Semiconductors: Historical
Background and Optical Properties. Macromolecular Rapid Communications 2000, 21, 705-
722.
94. Liu, X.; Atwater, M.; Wang, J.; Huo, Q. Extinction Coefficient of Gold Nanoparticles with
Different Sizes and Different Capping Ligands. Colloids and Surfaces, B 2007, 58, 3-7.
95. Jana, N. R.; Gearheart, L.; Murphy, C. J. Evidence for Seed-Mediated Nucleation in the
Chemical Reduction of Gold Salts to Gold Nanoparticles. Chemistry of Materials 2001, 13,
2313-2322.
96. Murillo, L. E.; Viera, O.; Vicuña, E.; Briano, J. G.; Castro, M. E.; Ishikawa, Y.; Irizarry, R.;
Solá, L. In In Growth Kinetics of Gold Nanoparticles; Technical Proceedings of the 2002
International Conference on Computational Nanoscience and Nanotechnology; 2002; pp
435-438.
97. Caseri, W. R. Nanocomposites of Polymers and Inorganic Particles: Preparation, Structure
and Properties. Material Science and Technology 2006, 22, 807-817.
98. Nussbaumer, R. J. Phd Thesis No. 15516, ETH Zurich, 2004.
99. Berry, K.; Russell, A.; Blake, P.; Roper, D. K. Gold Nanoparticles Reduced in situ and
Dispersed in Polymer Thin Films: Optical and Thermal Properties. 2012, Nanotechnology
(In Revision).
100. Berry, K.; Russell, A.; Roper, D. K. 2012, (In Preparation).
Related Documents