Plasmodium falciparum Malaria Endemicity in Indonesia in 2010 Iqbal R. F. Elyazar 1 *, Peter W. Gething 2 , Anand P. Patil 2 , Hanifah Rogayah 3 , Rita Kusriastuti 3 , Desak M. Wismarini 3 , Siti N. Tarmizi 3 , J. Kevin Baird 1,4 , Simon I. Hay 2 * 1 Eijkman-Oxford Clinical Research Unit, Jakarta, Indonesia, 2 Spatial Ecology and Epidemiology Group, Department of Zoology, University of Oxford, Oxford, United Kingdom, 3 Directorate of Vector-borne Diseases, Indonesian Ministry of Health, Jakarta, Indonesia, 4 Nuffield Department of Clinical Medicine, Centre for Tropical Medicine, University of Oxford, Oxford, United Kingdom Abstract Background: Malaria control programs require a detailed understanding of the contemporary spatial distribution of infection risk to efficiently allocate resources. We used model based geostatistics (MBG) techniques to generate a contemporary map of Plasmodium falciparum malaria risk in Indonesia in 2010. Methods: Plasmodium falciparum Annual Parasite Incidence (PfAPI) data (2006–2008) were used to map limits of P. falciparum transmission. A total of 2,581 community blood surveys of P. falciparum parasite rate (PfPR) were identified (1985–2009). After quality control, 2,516 were included into a national database of age-standardized 2–10 year old PfPR data (PfPR 2–10 ) for endemicity mapping. A Bayesian MBG procedure was used to create a predicted surface of PfPR 2–10 endemicity with uncertainty estimates. Population at risk estimates were derived with reference to a 2010 human population count surface. Results: We estimate 132.8 million people in Indonesia, lived at risk of P. falciparum transmission in 2010. Of these, 70.3% inhabited areas of unstable transmission and 29.7% in stable transmission. Among those exposed to stable risk, the vast majority were at low risk (93.39%) with the reminder at intermediate (6.6%) and high risk (0.01%). More people in western Indonesia lived in unstable rather than stable transmission zones. In contrast, fewer people in eastern Indonesia lived in unstable versus stable transmission areas. Conclusion: While further feasibility assessments will be required, the immediate prospects for sustained control are good across much of the archipelago and medium term plans to transition to the pre-elimination phase are not unrealistic for P. falciparum. Endemicity in areas of Papua will clearly present the greatest challenge. This P. falciparum endemicity map allows malaria control agencies and their partners to comprehensively assess the region-specific prospects for reaching pre- elimination, monitor and evaluate the effectiveness of future strategies against this 2010 baseline and ultimately improve their evidence-based malaria control strategies. Citation: Elyazar IRF, Gething PW, Patil AP, Rogayah H, Kusriastuti R, et al. (2011) Plasmodium falciparum Malaria Endemicity in Indonesia in 2010. PLoS ONE 6(6): e21315. doi:10.1371/journal.pone.0021315 Editor: Georges Snounou, Universite ´ Pierre et Marie Curie, France Received April 8, 2011; Accepted May 25, 2011; Published June 29, 2011 Copyright: ß 2011 Elyazar et al. This is an open-access article distributed under the terms of the Creative Commons Attribution License, which permits unrestricted use, distribution, and reproduction in any medium, provided the original author and source are credited. Funding: IE is funded by grants from the University of Oxford-Li Ka Shing Foundation Global Health Program and the Oxford Tropical Network. SIH is funded by a Senior Research Fellowship from the Wellcome Trust (#079091), which also supports PWG. SIH also acknowledges funding support from the RAPIDD program of the Science and Technology Directorate, Department of Homeland Security, and the Fogarty International Center, National Institutes of Health. APP is funded by a grant from the Wellcome Trust (#091835). HR, RK, DMW, SNT are funded by the Indonesian Ministry of Health. JKB is funded by a grant from the Wellcome Trust (#B9RJIXO). This work forms part of the output of the Malaria Atlas Project (MAP, http://www.map.ox.ac.uk), principally funded by the Wellcome Trust, U.K. The funders had no role in study design, data collection and analysis, decision to publish, or preparation of the manuscript. Competing Interests: The authors have declared that no competing interests exist. * E-mail: [email protected] (IRFE); [email protected] (SIH) Introduction The Indonesian archipelago of some 17,000 islands straddles the equator and stretches 5,200 km from western Malaysia to Papua New Guinea and covers a land area of 1.9 million km 2 (Figure 1) [1]. Seven main islands or island groups comprise the nation: Sumatra, Java, Kalimantan, Sulawesi, Maluku, the Lesser Sundas, and Papua (Figure 1). Indonesia was home to over 230 million people in 2010 [2]. These islands also harbour 20 known anopheline vectors of malaria transmitting all four of the species of Plasmodium that routinely infect humans [3]. By a narrow margin over Plasmodium vivax, P. falciparum is the most common cause of human malaria in Indonesia [4] with an estimated 12 million (6–21 million) clinical cases of P. falciparum cases each year [5]. Elyazar et al. [4] detail this complex geography and mosaic of infection risk which seriously complicates efforts to control malaria on the archipelago. On 28 April 2009, the Indonesian Ministry of Health announced its plan [6] to reach the pre-elimination stage by 2020 and to be free of malaria transmission by 2030 [7]. The plan states that these objectives would be reached in four distinct stages (Figure 1) [6]: (stage 1) the Thousand Islands group just north of Jakarta, Bali and Batam Islands in 2010; (stage 2) Java, Aceh and Riau Islands in 2015; (stage 3) Sumatra, West Nusa Tenggara, PLoS ONE | www.plosone.org 1 June 2011 | Volume 6 | Issue 6 | e21315

Welcome message from author
This document is posted to help you gain knowledge. Please leave a comment to let me know what you think about it! Share it to your friends and learn new things together.
Transcript
Plasmodium falciparum Malaria Endemicity in Indonesiain 2010Iqbal R. F. Elyazar1*, Peter W. Gething2, Anand P. Patil2, Hanifah Rogayah3, Rita Kusriastuti3, Desak M.
Wismarini3, Siti N. Tarmizi3, J. Kevin Baird1,4, Simon I. Hay2*
1 Eijkman-Oxford Clinical Research Unit, Jakarta, Indonesia, 2 Spatial Ecology and Epidemiology Group, Department of Zoology, University of Oxford, Oxford, United
Kingdom, 3 Directorate of Vector-borne Diseases, Indonesian Ministry of Health, Jakarta, Indonesia, 4 Nuffield Department of Clinical Medicine, Centre for Tropical
Medicine, University of Oxford, Oxford, United Kingdom
Abstract
Background: Malaria control programs require a detailed understanding of the contemporary spatial distribution ofinfection risk to efficiently allocate resources. We used model based geostatistics (MBG) techniques to generate acontemporary map of Plasmodium falciparum malaria risk in Indonesia in 2010.
Methods: Plasmodium falciparum Annual Parasite Incidence (PfAPI) data (2006–2008) were used to map limits of P.falciparum transmission. A total of 2,581 community blood surveys of P. falciparum parasite rate (PfPR) were identified(1985–2009). After quality control, 2,516 were included into a national database of age-standardized 2–10 year old PfPR data(PfPR2–10) for endemicity mapping. A Bayesian MBG procedure was used to create a predicted surface of PfPR2–10 endemicitywith uncertainty estimates. Population at risk estimates were derived with reference to a 2010 human population countsurface.
Results: We estimate 132.8 million people in Indonesia, lived at risk of P. falciparum transmission in 2010. Of these, 70.3%inhabited areas of unstable transmission and 29.7% in stable transmission. Among those exposed to stable risk, the vastmajority were at low risk (93.39%) with the reminder at intermediate (6.6%) and high risk (0.01%). More people in westernIndonesia lived in unstable rather than stable transmission zones. In contrast, fewer people in eastern Indonesia lived inunstable versus stable transmission areas.
Conclusion: While further feasibility assessments will be required, the immediate prospects for sustained control are goodacross much of the archipelago and medium term plans to transition to the pre-elimination phase are not unrealistic for P.falciparum. Endemicity in areas of Papua will clearly present the greatest challenge. This P. falciparum endemicity mapallows malaria control agencies and their partners to comprehensively assess the region-specific prospects for reaching pre-elimination, monitor and evaluate the effectiveness of future strategies against this 2010 baseline and ultimately improvetheir evidence-based malaria control strategies.
Citation: Elyazar IRF, Gething PW, Patil AP, Rogayah H, Kusriastuti R, et al. (2011) Plasmodium falciparum Malaria Endemicity in Indonesia in 2010. PLoS ONE 6(6):e21315. doi:10.1371/journal.pone.0021315
Editor: Georges Snounou, Universite Pierre et Marie Curie, France
Received April 8, 2011; Accepted May 25, 2011; Published June 29, 2011
Copyright: � 2011 Elyazar et al. This is an open-access article distributed under the terms of the Creative Commons Attribution License, which permitsunrestricted use, distribution, and reproduction in any medium, provided the original author and source are credited.
Funding: IE is funded by grants from the University of Oxford-Li Ka Shing Foundation Global Health Program and the Oxford Tropical Network. SIH is funded by aSenior Research Fellowship from the Wellcome Trust (#079091), which also supports PWG. SIH also acknowledges funding support from the RAPIDD program ofthe Science and Technology Directorate, Department of Homeland Security, and the Fogarty International Center, National Institutes of Health. APP is funded by agrant from the Wellcome Trust (#091835). HR, RK, DMW, SNT are funded by the Indonesian Ministry of Health. JKB is funded by a grant from the Wellcome Trust(#B9RJIXO). This work forms part of the output of the Malaria Atlas Project (MAP, http://www.map.ox.ac.uk), principally funded by the Wellcome Trust, U.K. Thefunders had no role in study design, data collection and analysis, decision to publish, or preparation of the manuscript.
Competing Interests: The authors have declared that no competing interests exist.
* E-mail: [email protected] (IRFE); [email protected] (SIH)
Introduction
The Indonesian archipelago of some 17,000 islands straddles
the equator and stretches 5,200 km from western Malaysia to
Papua New Guinea and covers a land area of 1.9 million km2
(Figure 1) [1]. Seven main islands or island groups comprise the
nation: Sumatra, Java, Kalimantan, Sulawesi, Maluku, the Lesser
Sundas, and Papua (Figure 1). Indonesia was home to over 230
million people in 2010 [2]. These islands also harbour 20 known
anopheline vectors of malaria transmitting all four of the species of
Plasmodium that routinely infect humans [3]. By a narrow margin
over Plasmodium vivax, P. falciparum is the most common cause of
human malaria in Indonesia [4] with an estimated 12 million
(6–21 million) clinical cases of P. falciparum cases each year [5].
Elyazar et al. [4] detail this complex geography and mosaic of
infection risk which seriously complicates efforts to control malaria
on the archipelago.
On 28 April 2009, the Indonesian Ministry of Health
announced its plan [6] to reach the pre-elimination stage by
2020 and to be free of malaria transmission by 2030 [7]. The plan
states that these objectives would be reached in four distinct stages
(Figure 1) [6]: (stage 1) the Thousand Islands group just north of
Jakarta, Bali and Batam Islands in 2010; (stage 2) Java, Aceh and
Riau Islands in 2015; (stage 3) Sumatra, West Nusa Tenggara,
PLoS ONE | www.plosone.org 1 June 2011 | Volume 6 | Issue 6 | e21315
Kalimantan and Sulawesi in 2020 and (stage 4) Papua, West
Papua, East Nusa Tenggara and Maluku Islands in 2030. These
efforts require detailed maps of malaria risk to guide the strategic
distribution of limited fiscal resources, expertise, and, importantly,
social and political capital in meeting declared objectives
[6,7,8,9,10,11]. Updates of the baseline map described here will
be essential as control progresses, thus identifying the main foci of
active transmission and bringing focus to efforts to interrupt
sources of residual transmission and in limiting importation risk in
areas that have been cleared of malaria.
There have been many recent efforts to establish national
contemporary malaria distributions to help optimize malaria
intervention strategies in Africa, Asia and the Western Pacific. In
Africa, Kazembe et al. [12] derived malaria risk maps in Malawi
using data from 73 survey sites across that country between 1977
and 2002. Noor et al. [13] presented P. falciparum malaria
prevalence maps in Somalia in 2008 at 565 km resolution using
452 community-based parasite prevalence surveys conducted data
between 2005 and 2007. Noor et al. [14] also defined Kenya P.
falciparum risk maps at 161 km resolution in 2009 using 2,095
malaria surveys sites between 1975 and 2009. Gosoniu et al. [15]
have produced Angolan malaria prevalence maps for 2010 at a
spatial resolution of 161 km resolution using malaria data from 92
survey locations. In Asia, Brooker et al. [16] developed P. vivax
maps in Afghanistan for 2006 at spatial resolution 868 km using
logistic regression models and malaria survey data from 269
endemic villages. Reid et al. [17] constructed P. falciparum risk maps
for Bangladesh for 2007 at 161 km resolution using Bayesian
geostatistical logistic regression models and 345 malaria preva-
lence surveys in 2007. Manh et al. [18] produced malaria
distribution maps in Vietnam for 2010 using zero-inflated Poisson
regression models in a Bayesian framework from 12 months of P.
falciparum and P. vivax malaria reported cases from 670 districts. In
the Western Pacific, Reid et al. [19] established the baseline of
malaria distribution maps prior to an elimination programme on
the most malarious province in Vanuatu for 2010 using 220 geo-
referenced villages. This work reflects increasing demand for
national level malaria risk maps to help guide malaria control
operations, as well as growing confidence and sophistication of the
methodologies used to derive useful and operationally relevant
maps.
This report describes the use of a Bayesian model-based
geostatistics (MBG) approach [20,21] to predict the risk of P.
falciparum malaria in Indonesia in 2010 at a spatial resolution of
161 km using the largest assembled contemporary empirical
evidence for any country in Asia. This collaborative effort between
the Ministry of Health of the Republic of Indonesia and the
Malaria Atlas Project (MAP, http://www.map.ox.ac.uk) aims to
improve national planning for the implementation of malaria
control and elimination strategies. This work currently addresses
only P. falciparum malaria as work on the important P. vivax
problem is in progress.
Methods
Assembling a national database of Plasmodiumfalciparum Annual Parasite Incidence data
The collation of Annual Parasite Incidence (API) at the highest
spatial resolution available between 2006 and 2008 was routinely
conducted by the Sub-Directorate of Malaria Control at the
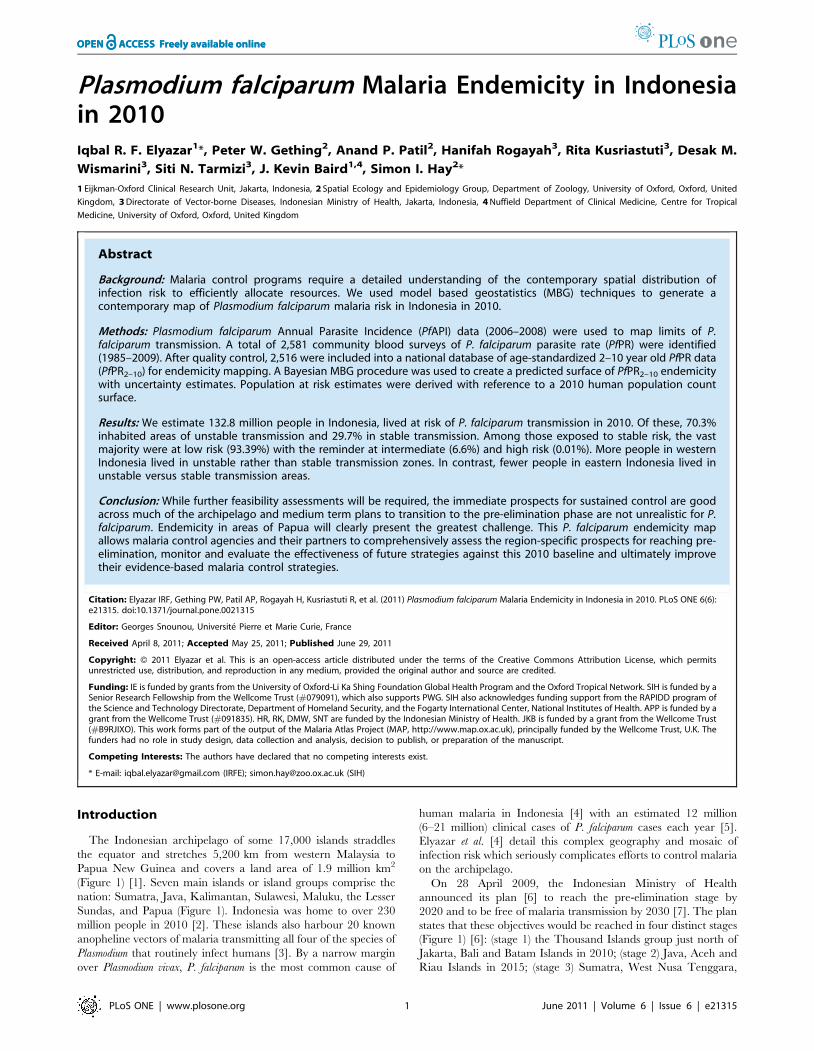
Figure 1. The map of Indonesian provincial administrative boundaries and their elimination objectives. The Indonesian archipelagoconsists of 33 provinces and comprises seven main islands: Sumatra, Java, Kalimantan, Sulawesi, Maluku, the Lesser Sundas and Papua. The dashedlines, Wallace Line [23], separate the Western Indonesia (to left from the line) and Eastern Indonesia regions (to right from the line). The Indonesianelimination objectives are to be implemented in four stages: (stage 1) The thousand islands (Jakarta), Bali and Batam Islands in 2010; (stage 2) Java,Aceh and Riau Islands in 2015; (stage 3) Sumatra, West Nusa Tenggara, Kalimantan and Sulawesi in 2020 and (stage 4) Papua, West Papua, East NusaTenggara and Maluku Islands in 2030.doi:10.1371/journal.pone.0021315.g001
Falciparum Malaria Endemicity in Indonesia in 2010
PLoS ONE | www.plosone.org 2 June 2011 | Volume 6 | Issue 6 | e21315

Directorate of Vector-borne Diseases in Jakarta. The reported
cases of confirmed P. falciparum malaria per 1,000 population were
computed for each year by district level and averaged over the
number of reporting years. Each PfAPI summary estimate was
mapped by matching it to its corresponding first and second level
administrative unit in a geographic information system (GIS;
ArcView GIS 9.3, ESRI, 2008).
Assembling a national database of Plasmodiumfalciparum malariometric prevalence
The process of assembling community-based survey estimates of
parasite prevalence undertaken since 1985 has been described
previously [22]. Searches for PfPR data are an on-going activity of
the Malaria Atlas Project (MAP, http://www.map.ox.ac.uk) and
were completed for the current study on 1 June 2010. The
completed database was subjected to various levels of exclusion in
order to obtain the final input data set for modelling as follows:
removing surveys located only to large (.100 km2) and small
polygons (.25 km2), removing those surveys that could not be
precisely geo-positioned, removing those that could not be
temporally disaggregated into independent surveys or for which
the date was unknown. The dataset was then stratified into two
regions for descriptive purposes (Figure 1), since western and
eastern Indonesia are biogeographically distinct regions of the
archipelago, typically demarked by the Wallace Line [23].
Assembling Indonesia human population dataThe Global Rural Urban Mapping Project (GRUMP) beta
version provides gridded population counts and population density
estimates at 161 km spatial resolution for the years 1990, 1995 and
2000, both adjusted and unadjusted to the United Nations’national
population estimates [24,25]. The adjusted population counts for
the year 2000 were projected to 2010 by applying the relevant
national urban and rural growth rates by country [26] using
methods described previously [27]. The urban growth rates were
applied to populations residing within the GRUMP-defined urban
extents [25], and the rural rates were applied elsewhere. National
2010 totals were then adjusted to match those estimated by the
United Nations [28]. These population counts were then stratified
nationally by age group using United Nations-defined [28]
population age structures for the year 2010 to obtain population
count surfaces for the 0–5 years, 5–14 years and $15 years age
groups. This population surface was extracted for Indonesia and
aligned to all other spatial data grids used in the analysis.
Defining the limits of Plasmodium falciparumtransmission
Following previously defined protocols [21,29,30], PfAPI data
were mapped to the lowest available administrative unit and used
to classify areas as either no risk (zero cases over three years), and
either unstable or stable risk if the mean annual number of
confirmed cases over three years was lower or higher than 0.1 per
1,000 people per annum respectively. These polygon-based data
were then rasterised to 161 km spatial grids. A biological model
that identified areas where low temperatures were likely to
preclude transmission [31] was used to identify further risk-free
areas, and merged onto the same 161 km grid to create a single
surface defining areas of no risk, unstable, and stable transmission
at high spatial resolution.
Assembling environmental covariatesThe MAP maintains a large library of globally mapped
environmental data that represent potentially useful covariates of
malaria prevalence. This grid library has recently been described
in detail [32] and includes suites of temporal Fourier analysis
(TFA) [33] products deriving from time-series of remotely sensed
land-surface temperature, normalized difference vegetation index
(NDVI), and middle infra-red (MIR) data from the Advanced
Very High Resolution Radiometer (AVHRR) platform [34];
equivalent TFA-processed precipitation products derived from
the WorldClim gridded climatology resource [35]; land cover
classifications from the GlobCover project [36]; delineations of
rural and urban areas based on the GRUMP [25] product with
additional stratification of the latter into urban/peri-urban using
approaches described previously [37]; and finally a bespoke
temperature suitability index that captures the dynamic suitability
of local ambient temperature regimes to support malaria parasite
development within anopheline vectors [35]. All grids were
clipped to a standard regional extent that incorporated Indonesia
and that matched the grids defined for the spatial limits of
transmission, and subject to an automated pre-processing
algorithm that used per-pixel resampling and/or nearest neigh-
bour interpolation to ensure identical spatial resolution and
definition of land versus sea pixels.
Defining an optimum suite of environmental covariatesThe environmental data library described above consists of
around 90 potential covariates. A variable selection procedure was
implemented to identify an optimum subset of 20 covariates, a
number chosen to representing an appropriate trade-off between
gaining maximum informative power from the covariates whilst
retaining computational feasibility and avoiding over-fitting. The
Bayesian Information Criteria (BIC) [36,38] is a model compar-
ison metric which provides an objective means of quantifying the
trade-off described above: predictive accuracy (which tends to
increase with more covariates) is scored against model parsimony
(which decreases with more covariates) and an optimum
compromise is suggested. A total set-analysis was undertaken
whereby models were built using all possible combinations of 20
covariate sets, and the BIC statistic calculated for each. The set
with the optimum (i.e. lowest) BIC value was then identified.
Because of their very large computational expense, this prelimi-
nary analysis could not be conducted using full geostatistical
models and, in line with previous studies [38], was instead based
on comparison of simpler non-spatial generalised linear regression
models. The final selected suite consisted of the two indicator grids
defining areas that were urban or peri-urban; the bespoke
temperature suitability index; six products from the TFA
processed WorldClim precipitation data; and five, four, and two
from the TFA processed AVHRR NDVI, land surface temper-
ature, and MIR data sets, respectively.
Bayesian space-time geostatistical modellingBuilding on approaches described previously for global
prevalence mapping [21]. The underlying value of PfPR2–10 in
2010, Pf 2P2R2{10 xið Þ, at each location xi was modelled as a
transformation g :ð Þ of a spatiotemporally structured field super-
imposed with unstructured (random) variation [ xið Þ. The number
of P. falciparum positive responses Niz from a total sample of Ni
individuals at each survey location was modelled as a conditionally
independent binomial variate given the unobserved underlying
age-standardized PfPR2–10 value [39]. An age-standardisation
procedure [21,40] was implemented to allow surveys conducted in
participants of any age range to be converted to the epidemio-
logically informative two-up-to-ten-year age range using an
algorithm based on catalytic conversion models first adapted for
malaria by Pull and Grab [41]. Each survey was referenced
Falciparum Malaria Endemicity in Indonesia in 2010
PLoS ONE | www.plosone.org 3 June 2011 | Volume 6 | Issue 6 | e21315

temporally using the mid-point (in decimal years) between the
recorded start and end months. The spatiotemporal component
was represented by a stationary Gaussian process f xi,tið Þ with
mean m and covariance defined by a spatially anisotropic version
of the space-time covariance function proposed by Stein [42]. A
modification was made to the Stein covariance function to allow
the time-marginal model to include a periodic component of
wavelength 12 months, providing the capability to model seasonal
effects in the observed temporal covariance structure. These effects
arise when studies performed in different years but during similar
calendar months have a tendency to be more similar to each other
than would be expected in the absence of seasonality. The mean
component m was modelled as a linear function of a vector of the
final selected suite of twenty environmental covariates,
k : m~bxzbk xð Þ: The unstructured component [ xið Þ was
represented as Gaussian with zero mean and variance V . Bayesian
inference was implemented using Markov Chain Monte Carlo to
generate 100,000 samples from the posterior distribution of: the
Gaussian field f xi,tið Þ at each data location: the unobserved
parameters bx,b, and V as stated above and further unobserved
parameters defining the structure and anisotropy of the exponen-
tial space-time covariance function. Distances between locations
were computed in great-circle distance to incorporate the effect of
the curvature of the Earth, which becomes important for a nation
as large as Indonesia. Samples were generated from the 2010
annual mean of the posterior distribution of f xi,tið Þ at each
prediction location. For each sample of the joint posterior,
predictions were made using space-time conditional simulation
over the 12 months of 2010 {t = 2010Jan, ..., 2010Dec}. These
predictions were made at points on a regular 161 km spatial grid.
Model output therefore consisted of samples from the predicted
posterior distribution of the 2010 annual mean PfPR2–10 at each
grid location, which were used to generate point estimates and
uncertainty metrics (computed as the mean and standard
deviation, respectively, of the set of posterior samples at each
pixel). Additionally each pixel was also classified into one of three
endemicity classes defined previously [21] as of particular
relevance for control: PfPR2–10#5%; 5%,PfPR2–10,40%;
PfPR2–10$40%. Classification was based on the class with the
highest posterior probability of membership.
Evaluating model performanceAn empirical model assessment exercise was carried out by first
selecting 10% (252) of the full data set using a spatially de-clustered
stratified random sampling algorithm, described previously [21],
and then re-running the model in full using the remaining 90%
(2,264) of data to make predictions at the space-time locations of
these held-out data. Model performance was then evaluated using
three criteria: the ability of the model to (1) predict point-values of
PfPR2–10 at un-sampled locations, (2) predict the correct
endemicity class at un-sampled locations and (3) to generate
credible intervals that capture appropriately the uncertainty
associated with predictions at each location.
The ability of model to predict point-values of PfPR2–10 at un-
sampled locations was then evaluated by comparing observed
values to those predicted (using the posterior mean) by the model
at the equivalent locations. Assessment was made using three
summary statistics: (1) the mean prediction error (ME), (2) the
mean prediction absolute error (MAE) and (3) the linear
correlation coefficient. The ME measures the bias of prediction
and the MAE measures the accuracy of predictions. The
correlation coefficient indicates the linear association between
predicted and observed values, which was also visualised using a
scatter plot.
The ability of the model to predict the correct endemicity class
at un-sampled locations was assessed by (1) using the area of under
curve (AUC) of a receiver-operating characteristics (ROC) curve
and (2) calculating the overall percentage of validation points
predicted to the correct class and those grossly mis-assigned (with a
low endemicity point being classed as high, and vice-versa). These
assessments indicated the reliability of endemicity class assignment
[21,43,44,45]. The interpretation of AUC was defined by
established cut-off values, whereby an AUC of one indicates the
model is perfect in differentiating a given endemicity class, values
above 0.9 regarded as excellent discrimination and between 0.7
and 0.9 as fair to good discrimination. An AUC value of 0.5
represents a model with no ability to differentiate endemicity
classes above a random allocation.
The ability of the model to generate appropriate credible
intervals was tested via a coverage plot. Working through 100
progressively narrower credible intervals (CIs), from the 99% CI to
the 1% CI, each was tested by computing the actual proportion of
held-out prevalence observations that fell within the predicted CI.
Plotting these actual proportions against each predicted CI level
allows the overall fidelity of the posterior probability distributions
predicted at the held-out data locations to be assessed.
Measuring area and population at riskThe modelled surface defining the limits of stable transmission
was combined with that defining the binned endemicity classes
within this limit to produce a single five-category map delineating
areas within Indonesia: those at zero risk; at risk of unstable
transmission; and those at risk of stable transmission experiencing
infection prevalence of between 0% and 5%; 5% and 40%, and
40% to 100% PfPR2–10. The quantification of areas within each
category was undertaken by first projecting the predicted class
map from geographic to Mollweide equal area projection in
ArcGIS 9.3. The areas covered by each category were then
calculated in km2. To derive population at risk within each zone,
this categorical map was overlaid with the GRUMP-beta 2010
gridded population surface using an exact bespoke algorithm
written in Fortran90, and the total population living in each risk
category was calculated. These totals were further disaggregated
by provincial level.
Results
Summaries of P. falciparum malaria prevalence surveydata
A total of 2,581 temporally independent community PfPR were
identified nationally from 27 of the 33 P. falciparum malaria
endemic provinces from a total of 79 different sources between
1985 and 2009 (Figure 2). The three data richest provinces were
Papua (n = 643), East Nusa Tenggara (n = 516) and Aceh
(n = 288). A total of 65 survey locations were excluded from
analysis because they were polygon data (n = 6), could not be geo-
positioned (n = 6), were longitudinal surveys that could not be
disaggregated temporally (n = 39) or were missing information on
the month of survey (n = 14).
Of the remaining 2,516 data points, Table 1 shows the
summaries of PfPR by region. The presence of P. falciparum was
observed in 75% of total data points. PfPR was generally higher in
surveys in the eastern than the western region. The majority of the
PfPR data incorporated resulted from surveys conducted in 2008
(57%). Most surveys included the upper age.20 years (89%). A
total of 85% of the total number of records resulted from direct
communication with malaria specialists across Indonesia and with
the Indonesian National Malaria Control Program. Twelve
Falciparum Malaria Endemicity in Indonesia in 2010
PLoS ONE | www.plosone.org 4 June 2011 | Volume 6 | Issue 6 | e21315
percent of surveys were geo-positioned by Global Positioning
Systems (GPS). Surveys with small sample sizes (n,50) represent-
ed 12% of the total data archived whilst 38% had sample sizes
between 100 and 500. The median sample size was 187.
Microscopy was the most commonly recorded diagnostic tech-
nique (66% of all surveys).
Overall, more malaria surveys were conducted in Eastern regions
compared to Western regions (60% vs. 40%). The distribution of P.
falciparum malaria surveys was not uniform among main islands in
the archipelago (Figure 2). The islands of Sumatra (Western), Papua
(Eastern) and Lesser Sundas (Eastern) were reported as the three
richest PfPR data islands with proportion of 34.7%, 25.4% and
24.6%, respectively. Kalimantan was reported as the island with the
sparsest PfPR data (0.8%) followed by Sulawesi (1.2%). In Java
where more districts reported no-risk of malaria, only 4.8% of PfPR
data were collected between 1985 and 2009.
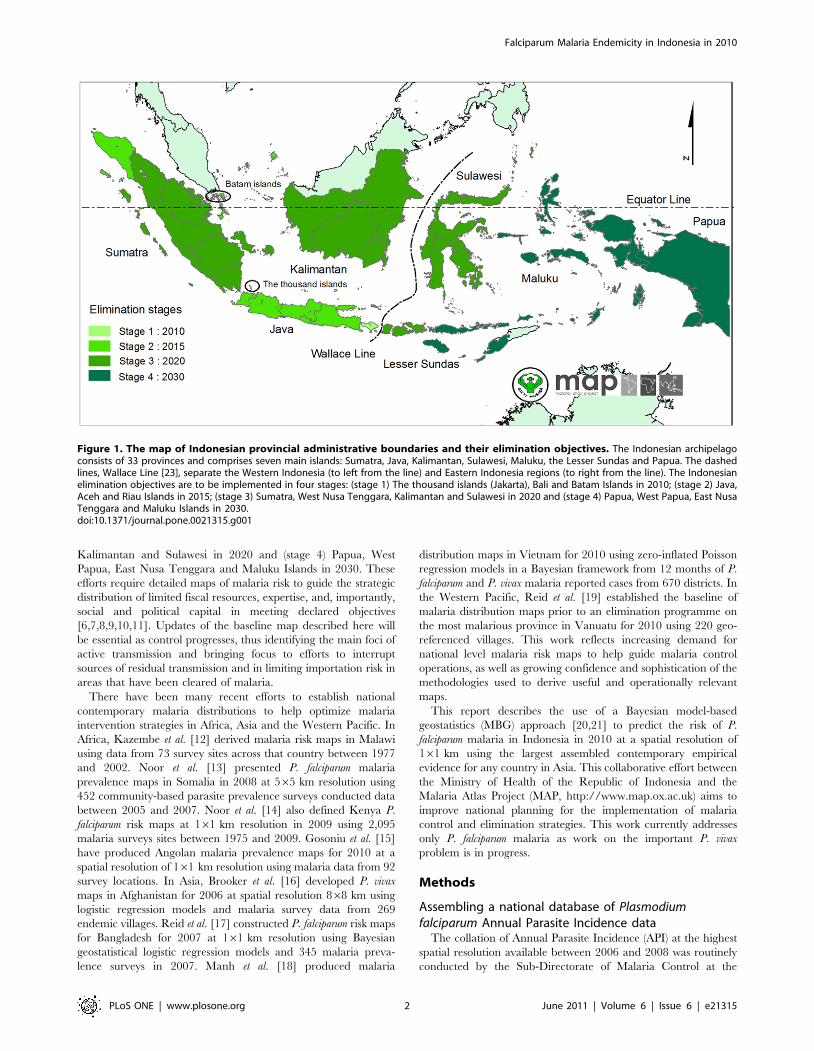
The spatial limits of Plasmodium falciparum transmissionThe Plasmodium falciparum malaria risk defined by API and the
temperature mask is shown in Figure 2. The clear demarcation of
no P. falciparum risk in the Papuan highland is the most striking
feature; the aridity mask [21] was not used as it did not modify risk
in any areas of Indonesia. Of a total land area of 1.9 million km2,
0.2 million km2 (11.4%) was classified at no risk of malaria
transmission, 0.5 million km2 (26.4%) as unstable transmission and
1.2 million km2 (62.2%) as stable transmission (Table 2). Further
regional stratifications of areas at risk are provided in Table 2.
The spatial distribution of Plasmodium falciparum malariaendemicity
The continuous predicted surface of P. falciparum is presented in
Figure 3. In stable transmission areas, the distribution of P.
falciparum shows a high degree of heterogeneity ranging from 0.3%
to about 41%. The frequency distribution of both input data and
predicted PfPR2–10 in 2010 for Indonesia were visualised using
violin plots (Figure 4). These plots display a smoothed distribution
of PfPR2–10 overlaid on a central bar showing median and inter-
quartile range values. The median of predicted PfPR2–10 was
11.9% (range 0.4%–39.5%).
The map of the predicted malaria endemicity class of PfPR2–10 is
presented in Figure 5. Each pixel was also classified into one of three
endemicity classes defined previously [21,46] as of particular
relevance for control: PfPR2–10#5%; 5%,PfPR2–10,40%;
PfPR2–10$40%. We refer to these as low, intermediate and high
stable risk. Of those exposed to stable P. falciparum risk, the largest
area was at low risk (0.967 million km2, 50.8% of total area at risk),
followed by intermediate risk (0.216 million km2, 11.4%) and high
risk (864 km2, 0.05%). Further regional stratifications of areas at risk
are provided in Table 2 and provincial level estimates in Table S1.
The estimation of population at risk of Plasmodiumfalciparum malaria
Table 2 shows the estimated population at risk of P. falciparum
malaria in Indonesia in 2010. We have estimated 132.8 million
people (57.1%) lived at any risk of P. falciparum transmission in
Indonesia in 2010. Of these, 93.5 million (70.3%) inhabited areas
of unstable and 39.3 million (29.7%) in stable transmission.
Among those exposed to stable P. falciparum risk the vast majority
were at low risk (36.7 million, 93.3%) with the reminder at
intermediate (2.6 million, 6.6%) and high risk (0.006 million,
0.01%). Further provincial level estimates of population at risk are
provided in Table S2.
In the Western region, 112.1 million people (54.7%) live at any
risk of P. falciparum transmission. Of these, 87.9 million (78.5%)
Figure 2. The spatial limits of Plasmodium falciparum defined by Annual Parasite Incidence and the temperature mask. Areas weredefined as stable (dark grey areas, where PfAPI$0.1 per 1,000 pa), unstable (medium grey areas, where PfAPI,0.1 per 1,000 pa), or no risk (light grey,where PfAPI = 0 per 1,000 pa). The 2,516 community surveys of P. falciparum prevalence conducted between 01 January 1985 and 31 May 2010 areplotted.doi:10.1371/journal.pone.0021315.g002
Falciparum Malaria Endemicity in Indonesia in 2010
PLoS ONE | www.plosone.org 5 June 2011 | Volume 6 | Issue 6 | e21315

inhabited areas of unstable and 24.2 million (21.5%) in stable
transmission. Within the area of stable P. falciparum risk, 23.5
million lived in low risk (97.3%) and 0.65 million in intermediate
risk (2.7%). Alternatively, more people in western Indonesia lived
in unstable transmission zone than those of stable transmission
zone (78% vs 22%). The distribution of the population at risk was
not uniform across the islands of the western region: 80.4 million
in Java, 23.3 million in Sumatra and 8.5 million in Kalimantan.
The proportion of unstable to stable risk was 96% vs. 4% in Java,
38% vs. 62% in Sumatra and 23% vs. 77% in Kalimantan. In the
stable transmission zone, 100% of people in Java lived in low
endemicity risk, 98.8% in Sumatra and 92.7% in Kalimantan.
In the Eastern region, 20.7 million (75%) people live at any risk
of P. falciparum transmission. Of these, 5.5 million (26.7%)
inhabited unstable transmission areas and 15.2 million (73.3%)
stable. Within areas stable P. falciparum risk, 13.2 million (87.1%)
lived in low risk, 1.9 million (12.8%) in intermediate risk and 0.005
million (0.04%) in high endemicity risk. In other words, less people
lived in unstable transmission areas than those of stable
transmission areas (27% vs 73%). All of 10.2 million people lived
Table 1. Summary of the most important aspects of the PfPR data by main region.
Total records of input data set Western Eastern Total Percentage
(n = 1,013) (n = 1,503) (n = 2,516) (100%)
Number selected for model
Population sample size 264,304 674,753 939,057
Number of PfPR.0 520 1,355 1,875 74.5
Mean (standar deviation) PfPR (%) 3.06 (6.64) 8.14 (9.57) 6.09 (8.87)
Median (range) PfPR (%) 0.16 (0–61.3) 5.02 (0–81.7) 2.63 (0–81.7)
Primary source of PfPR data
Peer reviewed sources 95 150 245 9.7
Unpublished work 819 1,343 2,162 85.9
Reports{ 99 10 109 4.4
Source of spatial coordinates
Personal communication 35 39 74 2.9
GPS 129 165 294 11.7
Encarta 106 142 248 9.9
Combination 661 1,070 1,731 68.8
Other digital gazetteers 36 29 65 2.6
Paper source 4 1 5 0.2
Map 42 57 99 3.9
Time period
1985–1989 104 12 116 4.6
1990–1994 58 64 122 4.9
1995–1999 35 60 95 3.8
2000–2004 81 115 196 7.8
2005–2009 735 1,252 1,987 78.9
Upper age sampled
, = 10 18 42 60 2.4
.10 and , = 15 70 10 80 3.2
.15 and , = 20 - 117 117 4.6
.20 925 1,334 2,259 89.8
Diagnostic method
Microscopy 806 866 1,672 66.5
RDT 207 637 844 33.5
Denominator
1–49 216 72 288 11.5
50–100 282 252 534 21.2
101–500 305 662 967 38.4
.500 210 517 727 29.9
Median (IQR) 104 (53–424) 245 (108–725) 187 (84–581)
{Ministry of Health reports, theses and other unpublished sources.doi:10.1371/journal.pone.0021315.t001
Falciparum Malaria Endemicity in Indonesia in 2010
PLoS ONE | www.plosone.org 6 June 2011 | Volume 6 | Issue 6 | e21315

Table 2. Areas and population at risk of Plasmodium falciparum malaria in 2010 throughout the Indonesian archipelago.
Area and population at risk Region Total
Western Eastern
Value % Value % Value %
Area (km2) 1,153,945 100.0 748,886 100.0 1,902,831 100.0
No-risk 145,516 12.6 71,373 9.5 216,889 11.4
At-risk 1,008,429 87.4 677,513 90.5 1,685,942 88.6
Unstable 402,204 34.9 99,427 13.3 501,631 26.4
Stable 606,225 52.5 578,086 77.2 1,184,311 62.2
PfPR2–10#5% 588,510 51.0 378,317 50.5 966,827 50.8
5%,PfPR2–10,40% 17,715 1.5 198,905 26.6 216,620 11.4
PfPR2–10$40% 0 0 864 0.1 864 0.05
Population 204,915,987 100.0 27,628,308 100.0 232,544,295 100.0
No-risk 92,753,767 45.3 6,912,056 25.0 99,665,823 42.9
At-risk 112,162,220 54.7 20,716,252 75.0 132,878,472 57.1
Unstable 87,994,775 42.9 5,538,611 20.0 93,533,386 40.2
Stable 24,167,445 11.8 15,177,641 54.9 39,345,086 16.9
PfPR2–10#5% 23,517,672 11.5 13,225,290 47.9 36,742,962 15.8
5%,PfPR2–10,40% 649,773 0.3 1,946,790 7.0 2,596,563 1.1
PfPR2–10$40% 0 0 5,561 0.02 5,561 0.02
Free, unstable and stable risk areas were corresponded to PfAPI = 0 per 1,000 pa, 0,PfAPI,0.1 per 1,000 pa and PfAPI$0.1 per 1,000 pa.doi:10.1371/journal.pone.0021315.t002
Figure 3. The Plasmodium falciparum malaria PfPR2–10 endemicity map. Model-based geostatistical point estimates of the annual mean PfPR2–10
for 2010 within the stable spatial limits of P. falciparum malaria transmission, displayed as a continuum of yellow to red from 0%–50% (see map legend).The rest of the land area was defined as unstable risk (medium grey areas, where PfAPI,0.1 per 1,000 pa) or no risk (light grey, where PfAPI = 0 per1,000 pa).doi:10.1371/journal.pone.0021315.g003
Falciparum Malaria Endemicity in Indonesia in 2010
PLoS ONE | www.plosone.org 7 June 2011 | Volume 6 | Issue 6 | e21315
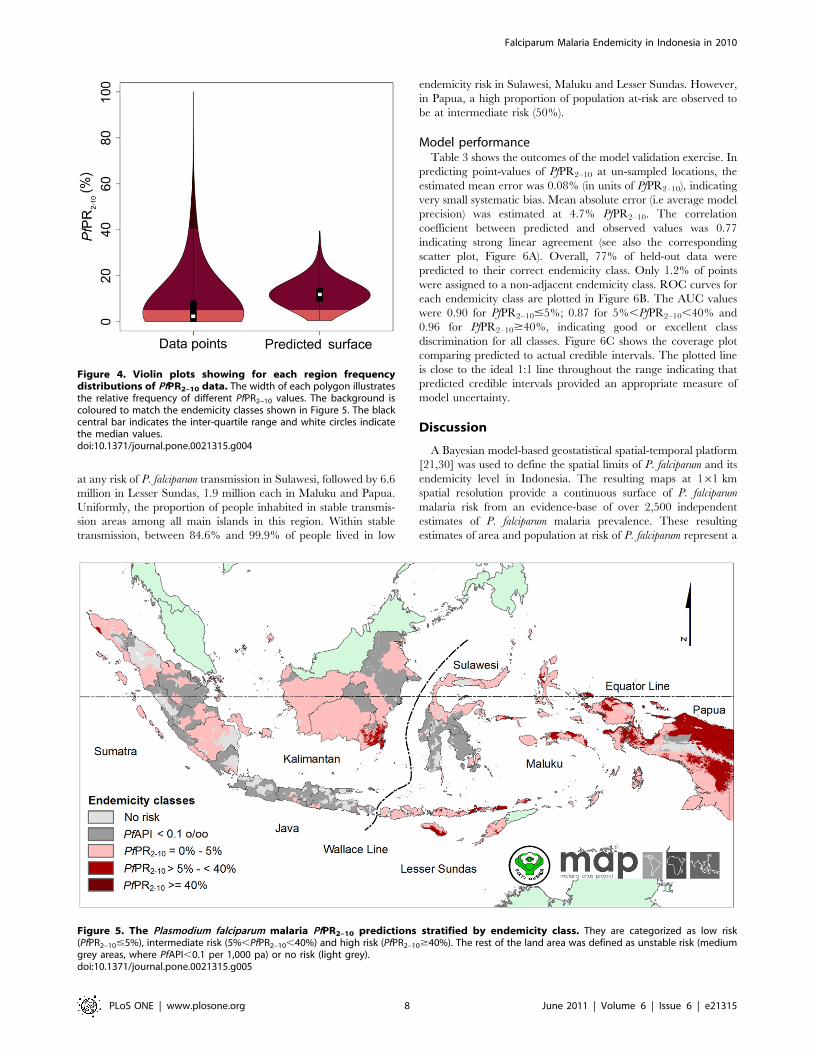
at any risk of P. falciparum transmission in Sulawesi, followed by 6.6
million in Lesser Sundas, 1.9 million each in Maluku and Papua.
Uniformly, the proportion of people inhabited in stable transmis-
sion areas among all main islands in this region. Within stable
transmission, between 84.6% and 99.9% of people lived in low
endemicity risk in Sulawesi, Maluku and Lesser Sundas. However,
in Papua, a high proportion of population at-risk are observed to
be at intermediate risk (50%).
Model performanceTable 3 shows the outcomes of the model validation exercise. In
predicting point-values of PfPR2–10 at un-sampled locations, the
estimated mean error was 0.08% (in units of PfPR2–10), indicating
very small systematic bias. Mean absolute error (i.e average model
precision) was estimated at 4.7% PfPR2–10. The correlation
coefficient between predicted and observed values was 0.77
indicating strong linear agreement (see also the corresponding
scatter plot, Figure 6A). Overall, 77% of held-out data were
predicted to their correct endemicity class. Only 1.2% of points
were assigned to a non-adjacent endemicity class. ROC curves for
each endemicity class are plotted in Figure 6B. The AUC values
were 0.90 for PfPR2–10#5%; 0.87 for 5%,PfPR2–10,40% and
0.96 for PfPR2–10$40%, indicating good or excellent class
discrimination for all classes. Figure 6C shows the coverage plot
comparing predicted to actual credible intervals. The plotted line
is close to the ideal 1:1 line throughout the range indicating that
predicted credible intervals provided an appropriate measure of
model uncertainty.
Discussion
A Bayesian model-based geostatistical spatial-temporal platform
[21,30] was used to define the spatial limits of P. falciparum and its
endemicity level in Indonesia. The resulting maps at 161 km
spatial resolution provide a continuous surface of P. falciparum
malaria risk from an evidence-base of over 2,500 independent
estimates of P. falciparum malaria prevalence. These resulting
estimates of area and population at risk of P. falciparum represent a
Figure 4. Violin plots showing for each region frequencydistributions of PfPR2–10 data. The width of each polygon illustratesthe relative frequency of different PfPR2–10 values. The background iscoloured to match the endemicity classes shown in Figure 5. The blackcentral bar indicates the inter-quartile range and white circles indicatethe median values.doi:10.1371/journal.pone.0021315.g004
Figure 5. The Plasmodium falciparum malaria PfPR2–10 predictions stratified by endemicity class. They are categorized as low risk(PfPR2–10#5%), intermediate risk (5%,PfPR2–10,40%) and high risk (PfPR2–10$40%). The rest of the land area was defined as unstable risk (mediumgrey areas, where PfAPI,0.1 per 1,000 pa) or no risk (light grey).doi:10.1371/journal.pone.0021315.g005
Falciparum Malaria Endemicity in Indonesia in 2010
PLoS ONE | www.plosone.org 8 June 2011 | Volume 6 | Issue 6 | e21315

refinement and update for Indonesia of an earlier estimate made
for 2007 [21,30]. The substantive difference in methods used to
generate the maps means that a comparison between the two is
not a valid method for tracking change. The operational
importance of such methods in an elimination context is
acknowledged, and specific methods are being developed to
facilitate the process of tracking change in malaria risk over the
time.
P. falciparum maps and the control and eliminationobjectives of Indonesia
The maps presented here provide detailed insights into spatially
varying risk that, in turn, can support a range of strategic planning
and wider decision making within the Indonesia Ministry of
Health and among its many partners in malaria control and
elimination. By means of example we discuss here utility with
respect to a comparison of two regions of Indonesia at opposing
ends of the transmission intensity spectrum: Java and Papua.
The three provinces of Java (which exclude the national capital
area of Jakarta and a special administrative area of the city of
Yogyakarta) are densely populated: West Java (42 million), East
Java (39.9 million) and Central Java (35.2 million) (Table S2).
These three provinces contribute 71.6 million people (54%) of
total population at risk of P. falciparum in the whole of Indonesia. In
contrast, the three provinces constitute only 4.9% (83.163 km2) of
the total area at risk (Table S1) with the vast majority living under
unstable transmission (68.9 million; 96.3%). The remainder
inhabit low endemicity areas (2.6 million; 4.7%). Efforts focused
upon Java would result in relatively large gains in reducing the
population at risk of P. falciparum malaria in all of Indonesia. This is
not inconsistent with national plans, both historically and
currently, with elimination of malaria from Java planned by
2015. The absolute feasibility of this goal would need to be further
assessed with additional work [47].
The situation of malaria in Papua island is entirely different to
Java. Papua (the western half of the island of New Guinea)
comprises two provinces contributing only 1.4% (1.85 million) of
total population at risk of P. falciparum in the whole of Indonesia,
whilst they occupied over a fifth of total area at risk of P. falciparum
in this country. About 96% of the population at risk inhabited
areas of stable transmission. Among those exposed to stable risk,
the proportion of people living in between low and medium risk is
essentially similar. Altogether these two endemicity classes
contributed 99.7% (1.78 million) of total population at stable risk.
The remainder reside in high risk areas (0.3%). Therefore
maintaining aggressive control in Papua is critical and will be
necessary to continue for the foreseeable future. It is clear that
Figure 6. Evaluation of model performance. (A) Scatter plot ofactual versus predicted point-values of PfPR2–10. (B) Receiver-Operating-Characteristic curves for each PfPR2–10 endemicity class (PfPR2–10,5%;5%,PfPR2–10,40%; PfPR2–10$40%) and associated AUC statistics. (C)Probability-probability plot comparing predicted credible intervals withthe actual percentage of true values lying inside those intervals. In thetop and bottom plots the 1:1 line is also shown (dashed line) forreference.doi:10.1371/journal.pone.0021315.g006
Table 3. Summary of the validation statistics for predictingpoint values PfPR2–10 and endemicity class.
Evaluation measure Indonesia
Predicting point values PfPR2–10
Mean prediction error 0.08%
Mean absolute prediction error 4.7%
Correlation between the predicted and observed data 0.77
Predicting PfPR2–10 endemicity class
AUC (#5%) 0.898
AUC (.5% to,40%) 0.866
AUC ($40%) 0.964
Overall % correct 77.2%
#5% classed as $40% (%) 0.3%
$40% classed as#5% (%) 0.9%
doi:10.1371/journal.pone.0021315.t003
Falciparum Malaria Endemicity in Indonesia in 2010
PLoS ONE | www.plosone.org 9 June 2011 | Volume 6 | Issue 6 | e21315

similar evidence-based guides will help untangle the complexity of
the malaria epidemiology in Indonesia and that this will need to be
augmented by additional work on morbidity and mortality
estimation, as well as on P. vivax malaria. The prospects for
elimination of malaria on Papua by 2030 will hinge upon long-
term progress in reducing high risk among relatively low numbers
of people scattered across wide and often remote areas. This in
turn depends largely upon broader development of healthcare
systems delivering prompt diagnosis and effective treatment,
especially at the fringe of reach for such services. Maps like those
presented here may bring focus to the placement of resources
aimed at this objective.
Spatial variation in map accuracyThe precision of the predicted map (Figures 7 and 8) is
influenced strongly by the density of data points used for analysis
as well as the inherent variability of the underlying survey data
[48]. About 85% of PfPR data is supplied by three main islands
(Sumatra, Papua and Lesser Sundas) which covered 48.7% of 1.68
million km2 of area at risk of P. falciparum in Indonesia. However,
only two percent of total PfPR data was assembled from two
islands (Kalimantan and Sulawesi) which occupied 40.9% of total
area at risk. These maps can help direct future parasitological
surveys to areas of maximal uncertainty. At the time of writing,
The Global Fund for AIDS, Tuberculosis and Malaria has funded
the Indonesian Ministry of Health to conduct a series of malaria
surveys covering 51 of 128 districts in Kalimantan and Sulawesi
Islands. The assembled data described here guided that commit-
ment of survey resources. Future maps, informed by additional
and well-placed data gathering, will similarly do so and yield
increasingly reliable distributions of risk.
The reliable distribution of local risk can facilitate travel
medicine professionals and travellers in their assessment of the risk
of malaria infection in the Indonesian archipelago and Figures 7
and 8 produced here will help to indicate the spatial accuracy of
malaria intensity at detailed tourist destinations. However, the
information should not be used directly to estimate risk to
individual travellers risk and should never be used as an alternative
to formal travel advice. The risk to malaria infection can
substantially differ for different travellers taking into account their
personal protection and prophylactic measure. The longer they
stay in malaria areas, the higher the risk of contracting malaria.
Precautionary measures to prevent mosquito bites should be
advised although visiting malaria free zones.
Indonesian challenges to control and eliminationHay et al. [49] suggested a framework of milestones on the path
to malaria elimination in the context of MAP outputs. The five
stages and their corresponding endemicity levels include: attack
(PfPR2–10$40%), sustain (PfPR2–10.5%–,40%), transition
(PfPR2–10#5%), consolidate (PfAPI,0.01) and maintain
(PfAPI = 0). In attack and sustain phases, the suggested actions
are aggressive, combined and extensive interventions, such as total
coverage of artemisinin combination therapies (ACTs), insecticide
treated nets (ITNs), indoor residual spraying, and intermittent
preventive treatment. When PfPR2–10#5%, specific and targeted
intervention should be implemented, guided by efficient active and
passive case detection through surveillance and foci of deliberate
control measures. In the consolidation phase, the foci of infection
must be eliminated through sustained specific and targeted
interventions. After the malaria-free stage is achieved, the ability
to detect cases and respond with ACT therapies and other
measures, e.g., vector control, will be absolutely necessary.
Adapting such a generic schema to an Indonesia-specific
context is required to make progress and this adaptation is on-
going. The obstacles and opportunities of malaria control in
Figure 7. The standard deviation map of predicted PfPR2-10 within the stable transmission areas. These values indicate an index ofrelative uncertainty. Dark blue areas represent where predictions were made with large uncertainty. Yellow areas represent where predictions weremade with small uncertainty.doi:10.1371/journal.pone.0021315.g007
Falciparum Malaria Endemicity in Indonesia in 2010
PLoS ONE | www.plosone.org 10 June 2011 | Volume 6 | Issue 6 | e21315

Falciparum Malaria Endemicity in Indonesia in 2010
PLoS ONE | www.plosone.org 11 June 2011 | Volume 6 | Issue 6 | e21315

Indonesia have been recently described in detail [4] and include
case detection and surveillance, diagnosis, treatment, and vector
control. In addition to substantially increasing access to diagnostic
services, the establishment of a robust quality assurance program
in support of such services may be essential [50]. Progress in
diagnostics is certainly required to to overcome the high
proportion of clinically diagnosed malaria cases (87%) [4]. The
persistent use of chloroquine or sulfadoxine/pyrimethamine, both
known to be widely ineffective, to treat clinically diagnosed
malaria should be immediately minimized and ultimately
abandoned. This requires aggressive strategies for expanding the
reach of reliable diagnostic services.
Future workThere are inherent uncertainties in any use of routine malaria
case reports to measure risk, driven largely by the completeness
and representativeness of data sources [18,51]. While biological
masks can help differentiate areas of incomplete reporting from
areas of true zero risk, significant efforts will need to be devoted
into improving the precision of our estimates in low transmission
zones. It is certainly true that people charged with conducting
blood surveys in search of malaria parasites are guided by instinct
and information to areas where they are most likely to be found.
Overcoming this tendency will become especially important as
Indonesia progresses towards elimination.
The population at risk estimates represent the denominator in
deriving morbidity and mortality estimates [52]. Hay et al. [5]
presented a new cartographic technique to estimate national,
regional and global scales of clinical burden of P. falciparum
malaria. A modelled relationship between prevalence and clinical
incidence [53], together with P. falciparum malaria endemicity
maps were used to estimate incidence in areas of stable
transmission. Geostatistical joint simulation was then used to
quantify uncertainty in these estimates. However, this work did not
provide sub-national level estimates and deriving these would help
the Indonesian malaria control agencies forecasting the area-
specific requirements for antimalarial drugs, and thereby minimize
both health-costly stock-outs and financially costly loss of therapies
to expiration [54].
The population at risk estimates will allow malaria control
managers to tailor vector control interventions. This can help
forecast the number of long-lasting insecticide treated nets (LLINs)
that need to be procured and distributed [55]. The cost estimates
of scaling up LLIN coverage can also be calculated [56]. This
LLIN intervention has important implications in those areas where
the interruption of malaria transmission could be achieved with
universal coverage of LLIN in medium transmission intensity
(PfPR2–10,40%) [49,57]. However, the distribution of the
Anopheles vectors and their bionomics need evaluating before the
scale up any LLIN intervention. This is also true of the myriad
other possible interventions aimed at reducing human-anopheline
contact. The selection and investment in specific tools for doing so
hinges upon the distribution, density, behaviour and physiology
(i.e., resistance to insecticides) of the local anopheline species. The
combination of sub-national endemicity maps with maps of the
distribution of the dominant Anopheles vectors of malaria could
empower malaria control managers to formulate evidence-based
intervention strategy appropriate to the bionomics of their local
vectors [21,58]. This is another significant area of on-going
activity.
The assembled survey data described in this report also revealed
the almost ubiquitous presence of P. vivax malaria in Indonesia.
The biological complexity of P. vivax relative to P. falciparum
imposes obstacles to mapping endemicity [29,30] but the 1,732
data points in hand for this parasite represent a wealth of
information for working through the technical challenges. That
important work is in progress. Malaria elimination aims at all
species and the fielding of interventions effective against that
biological range will provide conspicuous and likely necessary
economies of scale in reaching success.
Supporting Information
Table S1
(DOCX)
Table S2
(DOCX)
Acknowledgments
The national assembly of parasite prevalence surveys was dependent on the
generous contributions of data by a large number of people in the malaria
research and control communities, and these individuals are listed on the
MAP website (http://www.map.ac.uk/acknowledgements.html). We thank
Catherine Moyes for comments and Jennie Charlton for proofreading this
paper. The authors additionally acknowledge the support of the colleagues
from the Sub-Directorate of Indonesian Malaria Control including
Achmad Farchanny, Adhi Sambodo, Ali Romzan, Aris Munanto, Bangkit
Hutajulu, Budi Pramono, Charles Tobing, Elvieda Samoedro, Niken W.
Palupi, Nur Asni and Saktiyono. The authors also thank the support of the
Eijkman Institute of Molecular Biology, Jakarta.
Author Contributions
Conceived and designed the experiments: IE SIH. Performed the
experiments: PWG APP. Analyzed the data: IE. Contributed reagents/
materials/analysis tools: PWG APP. Wrote the paper: IE SIH JKB.
Assembled and managed the PfAPI data: HR IE. Provided context
regarding the Indonesian malaria control strategy: RK DMW SNT.
Commented on the final draft of the manuscript: IE PWG APP HR RK
DMW SNT JKB SIH.
References
1. Departemen Dalam Negeri (2008) Kode dan data wilayah administrasi
pemerintahan per provinsi, kabupaten/kota dan kecamatan seluruh Indonesia.
Jakarta, Departemen Dalam Negeri Indonesia. 185 p.
2. Badan Pusat Statistika (2010) Hasil Sensus Penduduk 2010. Data agregat per
provinsi. Jakarta: Badan Pusat Statistika Indonesia. 16 p.
3. Takken W, Snellen WB, Verhave JP, Knols BGJ, Atmosoedjono S (1990)
Environmental measures for malaria control in Indonesia-An historical review
on species sanitation. Wageningen: Wageningen Agricultural University. 167 p.
4. Elyazar IRF, Hay SI, Baird JK (2011) Malaria distribution, prevalence, drug
resistance and control in Indonesia. Adv Parasitol 74: 41–175.
5. Hay SI, Okiro EA, Gething PW, Patil AP, Tatem AJ, et al. (2010) Estimating the
global clinical burden of Plasmodium falciparum malaria in 2007. PLoS Med 7: 6.
6. Departemen Kesehatan (2009) Keputusan Menteri Kesehatan Republik
Indonesia Nomor 293/MENKES/SK/IV/2009 28 April 2009 tentang
Eliminasi Malaria di Indonesia. Jakarta: Direktorat Pemberantasan Penyakit
Bersumber Binatang, Departemen Kesehatan Indonesia. 31 p.
Figure 8. The predicted probability of PfPR2–10 falling in each endemicity class within the Plasmodium falciparum stable transmissionareas. (A) The map of predicted probability of PfPR2–10 falling in the PfPR2–10#5% endemicity class. (B) The map of predicted probability of PfPR2–10
falling in the 5%,PfPR2–10,40% endemicity class. (C) The map of predicted probability of PfPR2–10 falling in the PfPR2–10$40% endemicity class.doi:10.1371/journal.pone.0021315.g008
Falciparum Malaria Endemicity in Indonesia in 2010
PLoS ONE | www.plosone.org 12 June 2011 | Volume 6 | Issue 6 | e21315

7. Global Malaria Programme (2007) Malaria elimination: a field manual for low
and moderate endemic countries. Geneva: World Health Organization. 85 p.8. Feachem RGA, Phillips AA, Target GA (2009) Shrinking the malaria map: A
prospectus on malaria elimination. California: The Global Health Group,
Global Health Sciences, University of California. 187 p.9. Feachem RGA, The Malaria Elimination Group (2009) Shrinking the malaria
map: A guide on malaria elimination for policy makers. California: The GlobalHealth Group, Global Health Sciences, University of California. 66 p.
10. Snow RW, Marsh K, Le Sueur D (1996) The need for maps of transmission
intensity to guide malaria control in Africa. Parasitol Today 12: 455–457.11. Hay SI, Snow RW (2006) The Malaria Atlas Project: Develoving global maps of
malaria risk. PLoS Med 3: 2.12. Kazembe LN, Kleinschmidt I, Holtz TH, Sharp BL (2006) Spatial analysis and
mapping of malaria risk in Malawi using point-referenced prevalence of infectiondata. Int J Health Geogr 5: 41.
13. Noor AM, Clements ACA, Gething PW, Moloney G, Borle M, et al. (2008)
Spatial prediction of Plasmodium falciparum prevalence in Somalia. Malar J 7: 159.14. Noor AM, PW. G, Alegana VA, Patil AP, Hay SI, et al. (2009) The risk of
malaria infection in Kenya in 2009. BMC Infect Dis 9: 180.15. Gosoniu L, Veta AM, Vounatsou P (2010) Bayesian geostatistical modelling of
malaria indicator survey data in Angola. PLoS ONE 5: 3.
16. Brooker S, Leslie T, Kolaczinski K, Mohsen E, Mehboob N, et al. (2006) Spatialepidemiology of Plasmodium vivax, Afghanistan. Emerg Infect Dis 12: 1600–1602.
17. Reid H, Haque U, Clements ACA, Tatem AJ, Vallely A, et al. (2010) Mappingmalaria risk in Bangladesh using Bayesian Geostatistical Models. Am J Trop
Med Hyg 83: 861–867.18. Manh BH, Clements ACA, Thieu NQ, Hung NM, Hung LX, et al. (2010)
Social and environmental determinants of malaria in space and time in Vietnam.
Int J Parasitol 41: 109–116.19. Reid H, Vallely A, Taleo G, Tatem AJ, Kelly G, et al. (2010) Baseline spatial
distribution of malaria prior to an elimination programme in Vanuatu. Malar J9: 150.
20. Diggle PJ, Tawn JA, Moyeed RA (1998) Model-based geostatistics. J Roy Stat
Soc C-App 47: 299–326.21. Hay SI, Guerra CA, Gething PW, Patil AP, Tatem AJ, et al. (2009) A world
malaria map: Plasmodium falciparum endemicity in 2007. PLoS Med 6: 3.22. Guerra CA, Hay SI, Lucioparedes LS, Gikandi PW, Tatem AJ, et al. (2007)
Assembling a global database of malaria parasite prevalence for the MalariaAtlas Project. Malar J 6: 17.
23. Wallace AR (1863) On the physical geography of the Malay Archipelago.
Journal of the Royal Geography Society of London 33: 217–234.24. Center of International Earth Science Information Network CUIFPRITWBa-
CIdAT (2007) Global Rural Urban Mapping Project (GRUMP) alpha: GriddedPopulation of the World, version 2, with urban reallocation (GPW-UR).
Available: http://sedacciesincolumbiaedu/gpw Palisades (New York): Center
for International Earth Science Information Network, Columbia University/International Food Policy Research Institute/The World Bank/and Centro
Internacional de Agricultura Tropical.25. Balk DL, Deichmann U, Yetman G, Pozzi F, Hay SI, et al. (2006) Determining
global population distribution: methods, applications and data. Adv Parasitol 62:119–156.
26. N.P.D.U (2007) World population prospects: the 2007 revision population
database. http://esaunorg/unpp/ New York: United Nations PopulationDivision (UNDP).
27. Hay SI, Noor AM, Nelson A, Tatem AJ (2005) The accuracy of humanpopulation maps for public health application. Trop Med Int Health 10:
1073–1086.
28. N.P.D.U (2008) World population prospects: the 2008 revision populationdatabase. http://esaunorg/unpp/ New York: United Nations Population
Division (UNDP).29. Guerra CA, Gikandi PW, Tatem AJ, Noor AM, Smith DL, et al. (2008) The
limits and intensity of Plasmodium falciparum transmission implications for malaria
control elimination worldwide. PLoS Med 5: 2.30. Guerra CA, Howes RE, Patil AP, Gething PW, van Boeckel T, et al. (2010) The
international limits and population at risk of Plasmodium vivax transmission in2009. PLoS Negl Trop Dis 4: 8.
31. Gething PW, Van Boeckel TP, Guerra CA, Patil AP, Snow RW, et al. (2011)Modelling the global constraints of temperature on transmission of Plasmodium
falciparum and P. vivax. PLoS Comput Bio. submitted.
32. Sinka M, Rubio-Palis Y, Manguin S, Patil A, Temperley WH, et al. (2010) Thedominant Anopheles vectors of human malaria in the Americas: occurrence data,
distribution maps and bionomic precis. Parasites & Vectors 3: 72.
33. Scharlemann JPW, Benz D, Hay SI, Purse BV, Tatem AJ, et al. (2008) Global
data for ecology and epidemiology: a novel algorithm for temporal Fourier
processing MODIS data. PLoS ONE 3: 1.
34. Hay SI, Tatem AJ, Graham AJ, Goetz SJ, Rogers DJ (2006) Global
environmental data for mapping infectious disease distribution. Adv Parasitol
62: 37–77.
35. Hijmans RJ, Cameron SE, Parra JL, Jones PG, Jarvis A (2005) Very high
resolution interpolated climate surfaces for global land areas. Int J Climatology
25: 1965–1978.
36. Bicheron P, Defourny P, Brockmann C, Schouten L, Vancutsem C, et al. (2010)
GLOBCOVER: Products Description and Validation Report.
37. Tatem AJ, Guerra CA, Kabaria CW, Noor AM, Hay SI (2008) Human
population, urban settlement patterns and their impact Plasmodium falciparum
malaria endemicity. Malar J 7: 128.
38. Schwarz GE (1978) Estimating the dimension of a model. Ann Stat 6: 461–464.
39. Diggle PJ, Thomson MC, Christensen OF, Rowlingson B, Obsomer V, et al.
(2007) Spatial modelling and the prediction of Loa loa risk: decision making
under uncertainty. Ann Trop Med Parasitol 101: 499–509.
40. Smith DL, Guerra CA, Snow RW, Hay SI (2007) Standardizing estimates of the
Plasmodium falciparum epidemics in Africa. Malar J 6: 131.
41. Pull JH, Grab B (1974) A simple epidemiological model for evaluating the
malaria inoculation rate and the risk of infection in infants. Bull World Health
Organ 51: 507–516.
42. Stein ML (2005) Space-time covariance functions. J Am Stat Assoc 100:
310–321.
43. Greiner M, Pfeiffer D, Smith RD (2000) Principles and practical application of
the receiver-operating characteristic analysis for diagnostic tests. Prev Vet Med
45: 23–41.
44. Brooker S, Hay SI, Bundy DA (2002) Tools from ecology: useful for evaluating
infection risk models? Trends Parasitol 18: 70–74.
45. Clements ACA, Lwambo NJS, Blair L, Nyandindi U, Kaatano G, et al. (2006)
Bayesian spatial analysis and disease mapping: tools to enhance planning and
implementation of a schistosomiasis control programme in Tanzania. Trop Med
Int Health 11: 490–503.
46. Smith DL, Hay SI (2009) Endemicity response timelines for Plasmodium falciparum
elimination. Malar J 8: 87.
47. Zanzibar Malaria Control Program (2009) Malaria elimination in Zanzibar. A
feasibility assessment. Zanzibar: Zanzibar Malaria Control Program, Ministry of
Health and Social Welfare. 87 p.
48. Patil AP, Gething PW, Piel FB, Hay SI (2011) Bayesian geostatistics in health
cartography: the perspectives of malaria. Trends Parasitol In press.
49. Hay SI, Smith DL, Snow RW (2008) Measuring malaria endemicity from
intense to interrupted transmission. Lancet Infect Dis 8: 369–378.
50. World Health Organization (2009) Malaria microscopy quality assurance
manual. Version 1. 125 p.
51. Gething PW, Noor AM, Gikandi PW, Ogara EAA, Hay SI, et al. (2006)
Improving imperfect data from health management information systems in
Africa using space-time geostatistics. PLoS Med 3: 6.
52. Hay SI, Guerra CA, Tatem AJ, Noor AM, Snow RW (2004) The global
distribution and population at risk of malaria: past, present and future. Lancet 4:
327–336.
53. Patil AP, Okiro EA, Gething PW, Guerra CA, Sharma SK, et al. (2009)
Defining the relationship between Plasmodium falciparum parasite rate and clinical
disease: statistical models for disease burden estimation. Malar J 8: 186.
54. Gething PW, Kirui VC, Alegana VA, Okiro EA, Noor AM, et al. (2010)
Estimating the number of paediatric fevers associated with malaria infection
presenting to Africa’s public health sector in 2007. PLoS Med 3: 6.
55. Noor AM, Alegana VA, Patil AP, Snow RW (2010) Predicting the unmet need
for biologically targeted coverage of insecticide-treated nets in Kenya. Am J Trop
Med Hyg 83: 854–860.
56. Stevens W, Wiseman V, Ortiz J, Chavasse D (2005) The costs and effects of a
nationwide insecticide-treated net programme: the case of Malawi. Malar J 4:
22.
57. Smith DL, Smith TA, Hay SI (2009) Measuring malaria for elimination.
Chapter 7 Shrinking the malaria map: a prospectus on malaria elimination.
Santa Cruz (California): Malaria Elimination Group, Universitas of California
Santa Cruz. pp 108–126.
58. Hay SI, Sinka ME, Okara RM, Kabaria CW, Mbithi PM, et al. (2010)
Developing global maps of the dominant Anopheles vectors of human malaria.
PLoS Med 7: 2.
Falciparum Malaria Endemicity in Indonesia in 2010
PLoS ONE | www.plosone.org 13 June 2011 | Volume 6 | Issue 6 | e21315
Related Documents