Plasma Methods for the Clean-up of Organic Liquid Waste A thesis submitted to The University of Manchester for the degree of Doctor of philosophy in the Faculty of Engineering and Physical Sciences 2013 Maria Prantsidou School of Chemistry

Welcome message from author
This document is posted to help you gain knowledge. Please leave a comment to let me know what you think about it! Share it to your friends and learn new things together.
Transcript
Plasma Methods for the Clean-up of
Organic Liquid
Waste
A thesis submitted to The University of Manchester for the degree of Doctor of philosophy
in the Faculty of Engineering and Physical Sciences
2013
Maria Prantsidou
School of Chemistry

2
Contents
List of Figures
List of Tables
Abstract
Declaration
Copyright
Acknowledgements
List of Abbreviations
CHAPTER ONE
1. The problem of organic liquid waste in nuclear industries and introduction to
plasma technology ............................................................................................. 25
1.1 Introduction to nuclear waste ........................................................................... 25
1.2 Classification of radioactive waste................................................................... 27
1.3 The nuclear fuel cycle ...................................................................................... 28
1.4 The origin of the organic liquid nuclear waste................................................. 29
1.5 The nuclear waste management- the challenge of organics ............................. 31
1.6 Low temperature plasma potential application in nuclear waste management 34
1.7 Plasma Technology ..................................................................................... 35
1.7.1 Introduction to plasma.......................................................................... 35
1.7.2 Plasma properties and classification .................................................... 38
1.7.3 Low temperature atmospheric pressure discharges and their applications 42
1.8 Non-Thermal Plasma Composition and Generation of Active Species ........... 49
1.9 Low temperature plasma treatment of organic liquid waste - a literature
review ..................................................................................................................... 58

3
1.9.1 Introduction ............................................................................................... 58
1.9.2 Classification of discharges in and in contact with liquids ....................... 58
1.9.3 Non-Thermal Plasma Treatment of Liquid Waste .................................... 60
1.9.4 Gliding Arc Applications on Organic Liquid Waste Treatment ............... 61
1.10 Objectives and thesis structure ....................................................................... 62
1.11 References ...................................................................................................... 63
CHAPTER TWO
2. Analytical Techniques ......................................................................................... 71
2.1 Introduction ...................................................................................................... 71
2.2 Fourier Transform Infrared (FTIR) Spectroscopy ........................................... 71
2.2.1 Outline of Basic Spectroscopy .................................................................. 71
2.2.2 Principles of IR spectroscopy ................................................................... 73
2.2.3 FTIR spectrometer components ................................................................ 75
2.2.4 Attenuated Total Reflectance (ATR) FTIR spectroscopy ......................... 78
2.2.4 Qualitative and Quantitative Analysis Using FTIR Spectroscopy ............ 79
2.3 Optical Emission Spectroscopy (OES) ............................................................ 82
2.3.1 Introduction ............................................................................................... 82
2.3.2 OES Instrumentation ................................................................................. 82
2.3.3 Operating conditions ................................................................................. 84
2.4 Gas Chromatography and Mass spectroscopy (GC-MS) ................................. 85
2.4.1 Gas Chromatography ................................................................................ 85
2.4.2 Mass Spectroscopy .................................................................................... 86
2.4.3 Gas chromatography-Mass Spectroscopy combined technique ................ 87
2.4.4 GC-MS Operating Conditions .................................................................. 90
2.5 Flash Column Chromatography .................................................................. 90
2.6 References ................................................................................................... 92
4
CHAPTER THREE
3. Plasma-chemical degradation of vapour phase kerosene and dodecane in
an atmospheric ferroelectric packed-bed plasma reactor
3.1 Introduction ...................................................................................................... 93
3.2 Experimental Set-up ......................................................................................... 94
3.3 Results & Discussion ....................................................................................... 97
3.3.1 Gas effect to the plasma-chemical degradation of kerosene and dodecane
............................................................................................................................ 97
3.3.2 OES diagnostics of packed bed plasma in different gas compositions ... 101
3.3.3 The Oxygen Effect on dodecane degradation and end-products formation
.......................................................................................................................... 106
3.3.4 The Plasma-chemical destruction of gaseous dodecane in the ferroelectric
packed bed reactor............................................................................................ 109
3.4 Summary & Conclusions ............................................................................... 114
3.5 References ...................................................................................................... 115
CHAPTER FOUR
4. Gliding Arc Discharge degradation of oil in the vapour phase ..................... 120
4.1 Introduction .................................................................................................... 120
4.2 Experimental set-up ....................................................................................... 121
4.3 Results and Discussion ................................................................................... 123
4.3.1 OES diagnostics of the GAD under different gas compositions and
comparison with end-products formation ........................................................ 123
4.3.2 Gas effect on the GAD odourless vapour oil degradation and products . 133
4.3.3 The oxygen effect on dodecane GAD degradation in N2 /O2 mixtures and
end-products formation .................................................................................... 139
4.3.4 The plasma-chemical degradation of vapour dodecane in the gliding arc
discharge, comparison with BaTiO3 packed bed discharge treatment. ............ 142
4.4 Summary & Conclusions ............................................................................... 148
5
4.5 References ...................................................................................................... 150
CHAPTER FIVE
5. Argon Dielectric Barrier Discharge degradation of n- dodecane in the liquid
phase ................................................................................................................. 155
5.1 Introduction .................................................................................................... 155
5.2 Experimental set-up ................................................................................... 157
5.3 Results and Discussion .............................................................................. 158
5.3.1. The effect of HV electrode position on argon DBD treatment of liquid n-
dodecane, in dry or humid conditions .............................................................. 158
5.3.2 The influence of humidity and temperature in the DBD treatment of liquid
n-dodecane with the assistance of Ar bubbles ................................................. 160
5.3.3 The influence of humidity and temperature in the Ar DBD “in contact”
treatment of liquid n-dodecane ........................................................................ 163
5.4 Summary and Conclusions ........................................................................ 166
5.5 References ................................................................................................. 167
CHAPTER SIX
6. The plasma-liquid treatment of n-dodecane using gliding arc discharge .... 170
6.1 Introduction .................................................................................................... 170
6.2 Experimental set-up ................................................................................... 171
6.3 Results and Discussion .............................................................................. 173
6.3.1 The influence of plasma gas composition on the GAD plasma-liquid
dodecane degradation yield .............................................................................. 173
6.3.2 The gaseous analysis of the dodecane plasma-liquid batch treatment
using Ar, N2, Ar/H2O or N2/H2O gliding arc discharge ................................... 174
6.3.3 The liquid analysis of the dodecane plasma-liquid batch treatment
using Ar, N2, Ar/H2O or N2/H2O gliding arc discharge ................................... 182
6.3.4 Unravelling the liquid chemistry in the plasma-liquid treatment of
dodecane ........................................................................................................... 187

6
6.3.5 The gliding arc discharge treatment of recycling liquid dodecane under
Ar/H2O and N2/H2O plasma ............................................................................. 190
6.4 Summary and Conclusions ........................................................................ 195
6.5 References ................................................................................................. 197
CHAPTER SEVEN
7. Thesis summary, conclusions and future work .............................................. 200
7.1 Thesis summary and conclusions ................................................................... 200
7.2 Recommendations for future work ................................................................ 201
Appendix I: Energy conversion table ....................................................................... 203
Appendix II: Power measurement in a DBD plasma reactor ................................... 204
Appendix III: Publications and conferences ............................................................ 209
Final World count: 55,070
7
List of Figures
Chapter 1
Figure 1.1 Penetration characteristics of various ionising radiation ......................... 25
Figure 1.2 Potential radionuclide pathways from nuclear waste (taken from [3]) ..... 26
Figure 1.3 A schematic of the nuclear Fuel Cycle adapted from [4]. ........................ 29
Figure 1.4 Principles of the PUREX process for the separation of uranium and
plutonium from fission products ( taken from [7]) .................................................... 31
Figure 1.5 Major radioactive waste production sites in UK, excluding Northern
Ireland and minor nuclear companies and research institutions (adapted from [11]) 32
Figure 1.6 The four states of matter ( taken from [15]) ............................................. 36
Figure 1.7 Operating regions of nature and manmade plasma (taken from [16]) ...... 37
Figure 1.8 Principles of plasma generation (adapted from [17]) ............................... 37
Figure 1.9 The motion of electrons and ions in a magnetic field, taken from [13]... 39
Figure 1.10 The dependence of voltage upon current for various kinds of DC
discharges (taken from [17]) ...................................................................................... 40
Figure 1.11 Schematic diagrams showing different forms of corona discharges in a
point-to-plate electrode configuration (adapted from [19]) ....................................... 43
Figure 1.12 Common planar and cylindrical dielectric-barrier discharge
configurations [22] ..................................................................................................... 44
Figure 1.13 Schematic configurations of packed bed reactors, a) without a dielectric
layer between electrodes, b) parallel plate packed bed with dielectric layer and c)
cylindrical packed bed with dielectric layer (b, c taken from [28]) ........................... 46
Figure 1.14 Phases of the gliding arc evolution i) (A) gas break down, (B)
equilibrium heating phase, (C) non equilibrium reaction phase, ii) Argon GAD
showing the transition (when flow is Q = 5 L min-1
and input power is Pin = 100 W)
.................................................................................................................................... 48
8
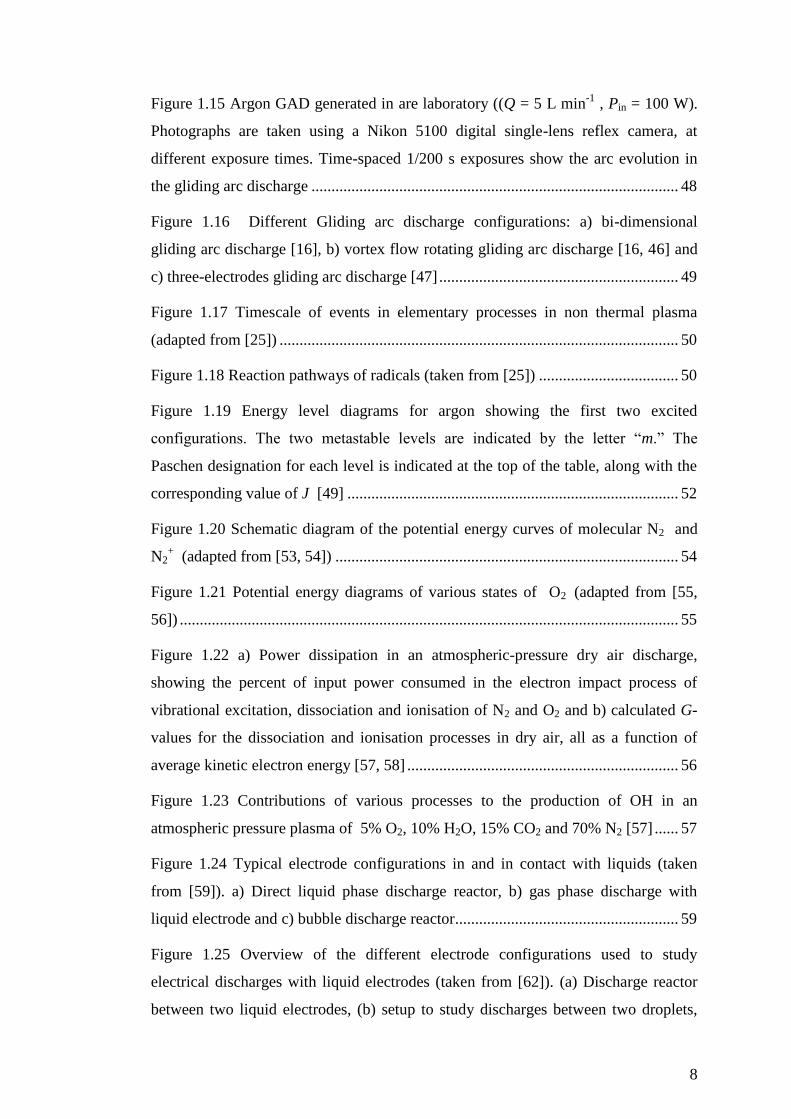
Figure 1.15 Argon GAD generated in are laboratory ((Q = 5 L min-1
, Pin = 100 W).
Photographs are taken using a Nikon 5100 digital single-lens reflex camera, at
different exposure times. Time-spaced 1/200 s exposures show the arc evolution in
the gliding arc discharge ............................................................................................ 48
Figure 1.16 Different Gliding arc discharge configurations: a) bi-dimensional
gliding arc discharge [16], b) vortex flow rotating gliding arc discharge [16, 46] and
c) three-electrodes gliding arc discharge [47] ............................................................ 49
Figure 1.17 Timescale of events in elementary processes in non thermal plasma
(adapted from [25]) .................................................................................................... 50
Figure 1.18 Reaction pathways of radicals (taken from [25]) ................................... 50
Figure 1.19 Energy level diagrams for argon showing the first two excited
configurations. The two metastable levels are indicated by the letter “m.” The
Paschen designation for each level is indicated at the top of the table, along with the
corresponding value of J [49] ................................................................................... 52
Figure 1.20 Schematic diagram of the potential energy curves of molecular N2 and
N2+ (adapted from [53, 54]) ...................................................................................... 54
Figure 1.21 Potential energy diagrams of various states of O2 (adapted from [55,
56]) ............................................................................................................................. 55
Figure 1.22 a) Power dissipation in an atmospheric-pressure dry air discharge,
showing the percent of input power consumed in the electron impact process of
vibrational excitation, dissociation and ionisation of N2 and O2 and b) calculated G-
values for the dissociation and ionisation processes in dry air, all as a function of
average kinetic electron energy [57, 58] .................................................................... 56
Figure 1.23 Contributions of various processes to the production of OH in an
atmospheric pressure plasma of 5% O2, 10% H2O, 15% CO2 and 70% N2 [57] ...... 57
Figure 1.24 Typical electrode configurations in and in contact with liquids (taken
from [59]). a) Direct liquid phase discharge reactor, b) gas phase discharge with
liquid electrode and c) bubble discharge reactor........................................................ 59
Figure 1.25 Overview of the different electrode configurations used to study
electrical discharges with liquid electrodes (taken from [62]). (a) Discharge reactor
between two liquid electrodes, (b) setup to study discharges between two droplets,
9
(c) water surface discharge setup (flashover), (d) gliding arc reactor with active water
electrode [63] , (e) gliding arc reactor with passive water electrode (standard gliding
arc configuration) and (f ) hybrid reactor ( [64] ) ...................................................... 59
Chapter 2
Figure 2.1 a) Energy level separations on the four types of molecular motions and b)
regions of the electromagnetic spectrum [1] .............................................................. 72
Figure 2.2 Normal modes of vibration of CO2 A: Symmetric stretching (IR inactive),
B: antisymmetric stretching, C: in plane deformation, D: out of plane deformation (C
and D result in same frequency, the so-called two-fold degenerate deformation
vibration [3]). ............................................................................................................. 74
Figure 2.3 Normal vibrational modes of water .......................................................... 74
Figure 2.4 Vibrational modes of two atoms attached on a stationary atom ............... 74
Figure 2.5 Schematic layout of a FTIR spectrometer (adapted from [3]) .................. 76
Figure 2.6 A typical interferogram and the single beam spectrum after the Fourier
Transform (adapted from [2]) .................................................................................... 77
Figure 2.7 Schematic of ATR crystal cell in FTIR spectroscopy .............................. 78
Figure 2.8 Regions of IR functional groups ............................................................... 79
Figure 2.9 The dodecane reference spectrum with major absorbance peaks annotated.
Dodecane reference concentration is Co = 100 ppm, mixed in N2 at pressure 1atm.
The optical pathlength is Lo = 1 m and the spectral resolution is 1 cm-1
. ........ 80
Figure 2.10 A classic ruled grating showing the diffraction principle. N is the grating
normal, d the groove distance, α is the angle of incidence and β is the angle of
diffraction and ϑ is the blaze angle [7]. ...................................................................... 83
Figure 2.11 a) A general and b) a more detailed schematic of the OES spectrograph
with the Czerny–Turner diffraction configuration and the CCD detector [9] ........... 84
Figure 2.12 Schematic for simple gas chromatography (taken from [4]) .................. 86
Figure 2.13 An example of a chromatograph from a plasma-dodecane post treatment
sample. Most abundant component is untreated dodecane, however, traces of other
alkanes were identified ............................................................................................... 86

10
Figure 2.14 A typical GC-MS system diagram [12] .................................................. 87
Figure 2.15 Mass spectrum for 1-decanol via a) chemical ionisation and b) electron
impact ionisation methods [4] .................................................................................... 89
Figure 2.16 Schematic of a quadrupole mass analyser [4]......................................... 89
Figure 2.17 Column characteristics used in this work. Various samples were < 7 ml
.................................................................................................................................... 91
Chapter 3
Figure 3.1 Schematic diagram of experimental set-up............................................... 95
Figure 3.2 The BaTiO3 packed bed DBD reactor ...................................................... 96
Figure 3.3 An example of current and voltage waveforms during the BaTiO3 packed
bed nitrogen discharge and the Q-U plot for the calculation of discharge power per
cycle, Pd = 0.7 W. The spikes on the current waveform correspond to
microdischarges formed from the contact points between the beads and it is of
nanosecond duration................................................................................................... 96
Figure 3.4 FTIR comparative spectra of 65 ppm dodecane when plasma was off, and
in nitrogen or air discharge at maximum power Pd = 1.4 W and SIE = 42 J L-1
.
Spectral resolution is 1 cm-1
. ..................................................................................... 98
Figure 3.5 Gas effect on dodecane (65 ppm) and kerosene (80 ppm) degradation as a
function of specific input energy in the PBDBD reactor ........................................... 99
Figure 3.6 Effect of specific input energy on gaseous products at the destruction of
65 ppm dodecane in N2 PBDBD ................................................................................ 99
Figure 3.7 Effect of specific input energy effect on gaseous products at the
destruction of 65 ppm dodecane in air PBDBD ....................................................... 100
Figure 3.8 Emission spectra of 0.52 nm resolution from pure N2 and air packed bed
plasma, at power Pd = 1.4 W and Q = 2 L min-1
...................................................... 103
Figure 3.9 Emission comparative spectra in packed bed discharge in pure N2 and
N2/dodecane, pure air and air/dodecane gases, when dodecane concentration is 65
ppm, total flow is Q = 2 L min-1
and discharge power is Pd = 1.4 W. The spectral
resolution is 0.13 nm with exposure time t = 2 sec. ................................................. 104
11
Figure 3.10 Rotational and vibrational temperature of N2 C →B in different gas
mixture BaTiO3 packed bed discharge, at maximum discharge power, Pd = 1.4 W 106
Figure 3.11. Oxygen concentration effect on 35 ppm dodecane plasma degradation in
N2-O2 mixtures, at fixed power Pd = 1.4 W and Q = 2 L min-1
................................ 107
Figure 3.12 Oxygen concentration effect on the end-products formation of 35ppm
dodecane plasma degradation in N2-O2 mixtures, at fixed power Pd = 1.4 W and
Q = 2 L min-1
............................................................................................................ 107
Figure 3.13 The NOx and N2O distribution as a function of increasing oxygen
concentration in the discharge, with or without the addition of 35 ppm dodecane at
fixed power Pd = 1.4 W and Q = 2 L min-1
.............................................................. 108
Figure 3.14 Schematic of initiation reaction mechanism of the oxidation processes of
the n-dodecane ......................................................................................................... 111
Figure 3.15 Schematic summary of plasma-chemical decomposition of dodecane in
N2 PBDBD ............................................................................................................... 111
Figure 3.16 Schematic summary of plasma-chemical decomposition of dodecane in
air PBDBD ............................................................................................................... 112
Chapter 4
Figure 4.1 Schematic diagram of experimental configuration: 1) mass flow
controller, 2) bubbler with odourless kerosene or dodecane, 3) bubbler with water, 4)
bypass for experiments with no water, 5) AC gliding arc reactor, 6) gas FTIR sample
inlet, 7) optical emission spectrometer..................................................................... 122
Figure 4.2 a) Position of the K-type thermocouple probe to collect gas temperatures
(red dot) and electrodes dimensions. b) Position of the multi-mode quartz fibre
during the OES measurements in gliding arc discharge. The half angle of the
maximum cone of light that can enter the fibre is 21.7◦ resulting in an optical field
diameter of 4 cm along the plasma plume. .............................................................. 122
Figure 4.3 Optical emission spectra of a) Ar GAD plasma with b) 90 ppm dodecane
admixture c) 2.3% H2O admixture and d) both H2O/dodecane admixture. Spectral
resolution is 0.13 nm and the intensity has been scaled to account for different
exposure times used. ................................................................................................ 124
12
Figure 4.4 Optical emission spectra in the range of 300-410 nm of a) N2 GAD
plasma with b) 90 ppm dodecane admixture c) 2.3% H2O admixture and d) both
H2O/dodecane admixture. Spectral resolution is 0.13 nm and the intensity has been
scaled in account for different exposure time used. ................................................. 126
Figure 4.5 Optical emission spectra of a) Air GAD plasma with b) 90 ppm dodecane
admixture c) 2.3% H2O admixture and d) both H2O/dodecane admixture. Spectral
resolution is 0.13 nm and the intensity has been scaled in account for different
exposure time used. .................................................................................................. 129
Figure 4.6 The degradation efficiency of both dodecane and odourless kerosene
under gliding arc discharge in argon, nitrogen and air, with maximum input power
achieved in each case. .............................................................................................. 133
Figure 4.7 FTIR absorption spectra of dodecane degradation products in Ar, N2 and
air GAD with input power Pmax(Ar) = 105 W , Pmax(N2) = 185 W, Pmax(air) = 200 W.
The initial concentration of dodecane is 90 ppm in all cases. The resolution is 1 cm-1
.
.................................................................................................................................. 134
Figure 4.8 Dodecane degradation product selectivity in argon, nitrogen and air in
maximum input power achieved in each case Pmax(Ar) = 110 W , Pmax(N2) = 190 W,
Pmax(air) = 200 W. .................................................................................................... 135
Figure 4.9 Effect of humidity on the argon, nitrogen and air gliding arc discharge
degradation of dodecane with the maximum input power achieved in each case.
Initial concentration of dodecane is 90 ppm and H2O = 2.3 ± 0.3 (RH = 75 ± 2%,
t = 24°C). .................................................................................................................. 136
Figure 4.10 Influence of humidity in the end-products products selectivity of GAD
dodecane degradation to the inorganic (IC) and the organic products (OC) as
observed in each case. .............................................................................................. 137
Figure 4.11 Oxygen concentration effect on 90 ppm dodecane plasma degradation in
N2-O2 mixture GAD, at maximum input power Pin = 190-200 W and Q = 5 L min-1
.................................................................................................................................. 139
Figure 4.12 Oxygen concentration effect on the end-products formation for 90 ppm
dodecane plasma degradation in N2-O2 mixture GAD plasma, at maximum input
power Pin = 190-200 W and Q = 2 L min-1
............................................................ 140

13
Figure 4.13 The NOx, HNO2 and N2O distribution as a function of increasing oxygen
concentration in the GAD plasma, with or without the addition of 90 ppm dodecane
at maximum input power Pin = 190-200 W and Q = 5 L min-1
................................ 141
Figure 4.14 Schematic summary of plasma-chemical decomposition of dodecane in
dry and humid Ar gliding arc discharge ................................................................... 144
Figure 4.15 Schematic summary of plasma-chemical decomposition of dodecane in
humid N2 gliding arc discharge ................................................................................ 146
Figure 4.16 Schematic summary of plasma-chemical decomposition of dodecane in
dry and humid gliding arc discharge ........................................................................ 147
Chapter 5
Figure 5.1 Schematic of a dielectric barrier discharge configuration where one
electrode is covered by a dielectric and microdischarges are formed in the discharge
gap [9]. ..................................................................................................................... 155
Figure 5.2 (A) DBD oil treatment with gas bubbling through the liquid and HV
electrode submerged (B) DBD oil treatment “in contact”. 1) Flow controller, 2)
humidity generation, 4) AC HV stainless steel electrode, 5) aluminium foil ground
electrode, 6) gas outlet for FTIR analysis, 7) PC FTIR control. .............................. 157
Figure 5.3 Ar DBD A) inside the n-dodecane with bubble feed, B) in contact with n-
dodecane, where a = 6 mm is the electrode gap and b = 10 mm, c = 4 mm the oil
height in each case respectively ............................................................................... 159
Figure 5.4 Lissajous Figures in case of A) the Ar DBD treatment of dodecane with
bubbles feed and B) Ar DBD “in contact” treatment of dodecane, under the same
applied electrical field, Vin p-p = 24 kV, f = 1 kHz and the same electrode gap = 6 mm.
X is the discharge voltage (U) expressed in kV and Y is the charge (Q) expressed in
nC though capacitor of C = 100 nF .......................................................................... 160
Figure 5.5 Lissajous figures s for (A) dry argon DBD at 25 ◦C, (B) humid argon DBD
at 25 ◦C, (C) Dry argon DBD at 100
◦C and (D) humid argon DBD at 100
◦C. In all
cases the maximum applied voltage was used (V in p-p = 40 kV) at f = 1 kHz. ......... 161
Figure 5.6 Effect of humidity and temperature on the detected gaseous-products
concenration in the Ar bubbles DBD plasma treatment of n-dodecane ................... 162

14
Figure 5.7 Photographs taken during argon DBD “in contact” treatment of dodecane
in a) dry conditions and b) humid conditions of water/oil = 0.1 emulsion .............. 164
Figure 5.8 Lissajous figures s for (A) dry argon DBD at 25 ◦C, (B) humid argon
DBD at 25 ◦C, (C) Dry argon DBD at 100
◦C and (D) humid argon DBD at 100
◦C. In
all cases the maximum applied voltage was used (V in p-p = 40 kV) at f = 1 kHz. .... 164
Figure 5.9 Effect of humidity and temperature on gaseous-products concentration in
the Ar DBD “in contact” treatment of n-dodecane .................................................. 165
Chapter 6
Figure 6.1 The scope of plasma-liquid interactions ................................................. 170
Figure 6.2. a) Picture of the homemade water cooling jacketed cell used for the
gliding arc batch treatment of n-dodecane, b) N2 gliding arc discharge dodecane
treatment using the cell ............................................................................................ 172
Figure 6.3. a) Schematic of the gliding arc reactor design for the recycling plasma-
liquid treatment of dodecane and photographs taken during b) humid argon and c)
humid nitrogen plasma recycling treatment of dodecane showing the direct injection
of the oil to the plasma plume .................................................................................. 172
Figure 6.4 Gaseous products concentration in the Ar GAD treatment of a) liquid
dodecane as a function of treatment time and in b) gaseous dodecane treatment (90
ppm) ......................................................................................................................... 174
Figure 6.5 Equilibrium Composition for the System Ar-He-C12H26 in a RF plasma
reactor at 101.3 kPa and H/C Ratio 2.16, taken from [8]......................................... 176
Figure 6.6 Gaseous products concentration in the Ar/H2O GAD treatment (H2O = 2.3
± 0.3 %) of a) liquid dodecane as a function of treatment time and in b) gaseous
dodecane treatment (90 ppm) ................................................................................... 176
Figure 6.7 Optical emission spectra of a) dry Ar GAD plasma, b) dry Ar with 90
ppm dodecane admixture plasma, c) Ar plasma-liquid treatment of dodecane, d)
humid argon plasma (H2O = 2.3 ± 0.3%), e) Humid argon plasma with dodecane (90
ppm) and f) humid argon plasma-liquid treatment of dodecane. Spectral resolution is
0.13 nm and the intensity has been scaled for exposure time t = 10 ms to account for
the different exposure times used. ............................................................................ 177
15
Figure 6.8 Gaseous products concentration in the N2 GAD treatment of a) liquid
dodecane as a function of treatment time and in b) gaseous dodecane treatment (90
ppm) ......................................................................................................................... 178
Figure 6.9 Gaseous products concentration in the N2/H2O GAD treatment (H2O = 2.3
± 0.3) of a) liquid dodecane as a function of treatment time and in b) gaseous
dodecane treatment (90 ppm) ................................................................................... 180
Figure 6.10 Optical emission spectra of a) dry N2 GAD plasma, b) dry N2 with 90
ppm dodecane admixture plasma, c) N2 plasma-liquid treatment of dodecane, d)
humid N2 plasma (H2O = 2.3 ± 0.3%), e) Humid N2 plasma with dodecane (90 ppm)
and f) humid N2 plasma-liquid treatment of dodecane. Spectral resolution is 0.13 nm
for 300-420 nm and 0.02 nm when different grating was used in the range of 502-520
nm to enable the detection of C2 line. In both cases the intensity has been scaled to
account the different exposure times used. .............................................................. 181
Figure 6.11 Normalised GC chromatograms using of crude liquid samples in case of
a no treatment, N2 plasma treatment, Ar plasma treatment, N2/H2O plasma treatment
and Ar/H2O plasma treatment of dodecane .............................................................. 183
Figure 6.12 IR spectra of polar fractions of liquid samples after N2, Ar, N2/H2O and
Ar/H2O plasma treatment of dodecane. Hexane spectrum was used as background184
Figure 6.13 Normalised GC chromatograms of polar fractions of liquid samples after
N2, Ar, N2/H2O and Ar/H2O plasma treatment of dodecane. ................................... 186
Figure 6.14 A summary of the major liquid products identified in the plasma post
treated dodecane ....................................................................................................... 188
Figure 6.15 Gaseous products comparison between Ar/H2O GAD batch and
recycling, Pin = 140W ............................................................................................. 191
Figure 6.16 Gaseous products comparison between N2/H2O GAD during 60 min of
batch and recycling treatment, Pin = 200 W ............................................................. 192
Figure 6.17 Crude samples of a) N2/H2O and b) Ar/H2O plasma recycling treatment
of dodecane at different treatment time up to 60 min .............................................. 192
Figure 6.18 Normalised GC chromatograms of liquid crude samples after N2/H2O
and Ar/H2O recycling plasma treatment of dodecane. ............................................. 193
16
Figure 6.19 IR spectra of polar fractions of liquid samples after N2/H2O and Ar/H2O
plasma recycling treatment of dodecane after 60 min ............................................. 194
Figure 6.20 Normalised GC chromatograms of polar fractions of samples taken
during the N2/H2O and Ar/H2O GAD recycling treatment of dodecane at 5, 30 and 60
min. .......................................................................................................................... 195

17
List of Tables
Chapter 1
Table 1.1 Unsuitable solvent destruction processes (adapted from [4]) .................... 33
Table 1.2 Main characteristics of thermal and non-thermal plasmas (adapted from
[14]) ............................................................................................................................ 41
Table 1.3 Typical reactions occurring in non thermal discharges (adapted from [48])
.................................................................................................................................... 51
Chapter 2
Table 2.1 Operating conditions of the FTIR spectrometers used............................... 81
Table 2.2 Operating conditions of the OES plasma spectroscopy used in this work. 84
Table 2.3 Methods used in GC-MS analysis of plasma post-treated liquid dodecane
.................................................................................................................................... 90
Chapter 3
Table 3.1 Comparison of excited species and end-products in different gas mixtures
in PB DBD ............................................................................................................... 101
Table 3.2 Bond dissociation enthalpies of C–H and C-C bond in n-dodecane at
different C sites (adapted from [37]) ........................................................................ 110
Chapter 4
Table 4.1 Summary of the intermediate species observed by OES and the end-
products observed by FTIR. Relative intensities are characterised as strong (s),
medium (m) or weak (w). The input power of the reactor is the maximum achievable
in each case and photographs are given indicating the difference in colour. ........... 124
Table 4.2 Summary of the intermediate species observed by OES and the end-
products observed by FTIR. Relative intensities are characterised as strong (s),
medium (m) or weak (w). The input power of the reactor is the maximum achievable
in each case and photographs are given indicating the difference in colour. ........... 126
Table 4.3 Summary of the intermediate excited species and the end-products
observed in air plasma admixtures. Relative intensities are characterised as strong(s),
18
medium (m) or weak (w). There were no observable differences in colour in the
different admixtures in the air plasma. ..................................................................... 129
Table 4.4 Temperatures profile of different gas composition gliding arc plasma. The
gas temperature (Tgas) was obtained by a thermocouple and rotational and vibrational
temperatures were obtain by fitting simulation spectra using Specair 2.2 [22] ....... 131
Table 4.5 The end-products concentration in the different admixtures of gliding arc
NO, NO2, N2O and HNO2 formation in gliding arc discharge. Uncertainty is < 2% 138
Table 4.6 Comparison of dodecane degradation ability between BaTiO3 packed bed
plasma (PB) and gliding arc discharge plasma (GAD) used in this work, where Pin
and Pd is the input and discharge power respectively. ............................................. 149
Chapter 5
Table 5.1 Effect of humidity and temperature on the total gaseous end-products
concentration and respective selectivity in each case. Uncertainty in values is less
than 3%..................................................................................................................... 162
Table 5.2 Effect of humidity and temperature on the total end-products concentration
and respective selectivity in each case. Uncertainty in values is less than 3%. ....... 165
Chapter 6
Table 6.1 Summary of different plasma gas used for the GAD plasma-liquid
degradation of dodecane. Initial volume of C12H26 was 15 ml. The total oil volume
reduction is calculated after 1 hour of treatment. GC-MS analysis has been
performed to quantify the amount of liquid by-products in the post-treatment
samples. .................................................................................................................... 173
Table 6.2 Summary of results of the GAD plasma-liquid degradation of dodecane
using batch and recycling treatment. The total volume of oil removed is calculated
after 1 hour of treatment. Initial volume of dodecane was 15 ml in the batch
treatment and 60 ml in the recycling treatment. GC-MS analysis has been performed
to quantify the amount of liquid by-products in the samples after the treatment. ... 190
19
Abstract
This thesis has studied the low-temperature atmospheric pressure plasma as a
potential technological application for the degradation of waste oils. The study has
been approached initially by investigating the degradation of oil in gas phase only, in
order to understand the gas chemistry and elucidate the plasma-chemical degradation
mechanism. Gaseous odourless kerosene and dodecane have been used as simulants
to waste oil and their plasma-chemical degradation has been studied using a BaTiO3
packed bed plasma reactor and a gliding arc discharge reactor. Kerosene showed
similar degradation behaviour to dodecane and the latter one was chosen as a
surrogate to allow quantitative analysis. The dodecane plasma degradation efficiency
and the distribution of end-gaseous products have been studied under these two
reactors in different gas compositions. Optical emission spectroscopy was used to
identify intermediate excited species and calculate the rotational and vibrational
temperature profiles. Differences in the dodecane degradation gas chemistry between
the packed bed and the gliding arc plasma are discussed and postulated mechanisms
are presented for each condition. Gliding arc discharge demonstrates higher
degradation efficiency and it will be used mainly for the plasma-liquid treatment.
The plasma-liquid dodecane treatment is firstly studied using argon dielectric barrier
discharge. The effect of different reactor configuration, humidity and temperature to
the discharge characteristics and degradation efficiency will be discussed.
The study of the liquid dodecane degradation is extended by using the gliding arc
discharge. Using N2 and Ar in both dry and humid conditions for the batch treatment
of dodecane, the degradation efficiency, gas chemistry and liquid chemistry are
discussed and correlated to the gas chemistry observed during the plasma treatment
of gaseous dodecane under the same conditions, in order to gain an overall
understanding of the plasma-liquid clean-up process.
Finally, the gliding arc plasma treatment of liquid dodecane is studied using the
recycling method and shows a significant improvement to the degradation efficiency.

20
Declaration
No portion of the work referred to in this thesis has been submitted in support
of an application for another degree or qualification of this or any other
university or other institute of learning.
21
Copyright Statement
i. The author of this thesis (including any appendices and/or schedules
to this thesis) owns any copyright in it (the “Copyright”) and she has
given The University of Manchester the right to use such Copyright
for any administrative, promotional, educational and/or teaching
purposes.
ii. Copies of this thesis, either in full or in extracts, may be made only in
accordance with the regulations of the John Rylands University
Library of Manchester. Details of these regulations may be obtained
from the Librarian. This page must form part of any such copies
made.
iii. The ownership of any patents, designs, trade marks and any and all
other intellectual property rights except for the Copyright (the
“Intellectual Property Rights” and any reproductions of copyright
works, for example graphs and tables (“Reproductions”), which may
be described in this thesis, may not be owned by the author and may
be owned by third parties. Such Intellectual Property Rights and
Reproductions cannot and must not be made available for use without
the prior written permission of the owner(s) of the relevant
Intellectual Property Rights and/or Reproductions.
iv. Further information on the conditions under which disclosure,
publication and exploitation of this thesis, the Copyright and any
Intellectual Property Rights and/or Reproductions described in it may
take place is available from the Head of School of the School of
Chemistry.

22
Acknowledgements
Foremost, I would like to express my deepest thanks to my supervisor, Prof
Christopher Whitehead. His immense knowledge, valuable advice and great
optimism, were key motivations throughout my PhD and helped me develop both
personally and academically. I enjoyed our fruitful discussions about research which
were a great source of brainstorming and inspiration. Moreover, I have always felt
able to discuss any matter with him, and he would always respond to my questions
and queries promptly, I am very grateful for that.
I would also like to specially thank Dr Xin Tu, for the great source of help and
advice on the reactor design and optical measurements and for always finding the
time to reply to my questions. Many thanks go also to Dr. Helen Gallon, who
welcomed me and introduced me to the plasma chemistry lab work and also to Dr
Zaenab Abd Allah, for the support and encouragement during my last steps of my
PhD.
I like to express my sincere gratitude to Prof Akira Mizuno, for his scientific
expertise and his warm hospitality in his laboratory during my short-term research
fellowship in Toyohashi University of Technology, which work has contributed to
this thesis. I am indebted to the Japanese Society for Promotion of Science, for
funding this fellowship, which has been an excellent experience.
This thesis would have not been possible without the technical expertise of many of
the staff in the School of Chemistry. My thanks go especially to Steve Mottley and
Andy Sutherland for their work on the power supply, but also Peter Wilde and
Malcolm Carroll for their innovation and efficiency in building my reactor from
scratch and always being cheerful to help me confront my technical challenges. I
would never have thought before that spending time in an organic synthesis lab will
be a part of a PhD in Physical Chemistry, but I am deeply grateful to Dr Peter Quale
for allowing me to use his lab facilities for the column chromatography. My special
thanks go to Dr Andreas Economou, for his valuable help but also I am deeply
grateful for his continuous support and care.
Finally, many thanks to my industrial supervisor Dr Luke O’ Brien for the support
and NNL/NDA for funding this research but also the many conferences I have
attended.
23
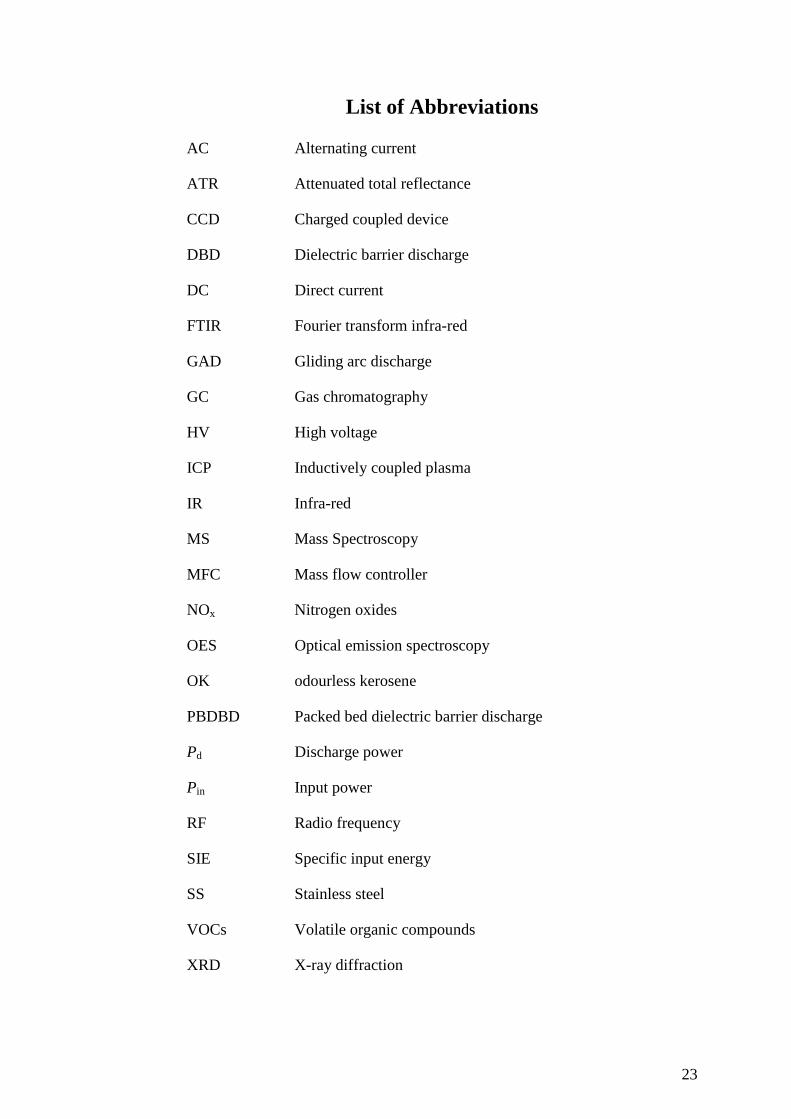
List of Abbreviations
AC Alternating current
ATR Attenuated total reflectance
CCD Charged coupled device
DBD Dielectric barrier discharge
DC Direct current
FTIR Fourier transform infra-red
GAD Gliding arc discharge
GC Gas chromatography
HV High voltage
ICP Inductively coupled plasma
IR Infra-red
MS Mass Spectroscopy
MFC Mass flow controller
NOx Nitrogen oxides
OES Optical emission spectroscopy
OK odourless kerosene
PBDBD Packed bed dielectric barrier discharge
Pd Discharge power
Pin Input power
RF Radio frequency
SIE Specific input energy
SS Stainless steel
VOCs Volatile organic compounds
XRD X-ray diffraction

24
“As you set out for Ithaka, hope the journey will be a long one, full of adventures,
full of discovery…
…keep Ithaka always in your mind, arriving there is what you are destined for.
But do not hurry the journey at all. Better if it lasts for years, so you are old by the
time you reach the island, weathly with all you have gained on the way, not
expecting Ithaka to make you rich. Ithaka gave you the marvellous journey.
Without her, you would not have set out. She has nothing left to give you now. And
if you find it poor, Ithaka won’t have fooled you. Wise as you will have become, so
full of experience, you will have understood by then what these Ithakas mean.”
C.P. Cavafy
25
Chapter 1
1. The problem of organic liquid waste in nuclear industries
and introduction to plasma technology
1.1 Introduction to nuclear waste
Nuclear wastes are by-products of nuclear power generation, nuclear weapon
production plus residuals of radioactive materials used by industry, medicine,
agriculture and academia. It is their radioactive nature and potential hazard that make
nuclear waste the most dangerous type of waste, but also the most controversial and
regulated with respect to disposal.
Radiation is measured in terms of its effects on people and materials. Radiation
emitted from radioactive materials is known as ionising radiation and can be in the
form of three main types.
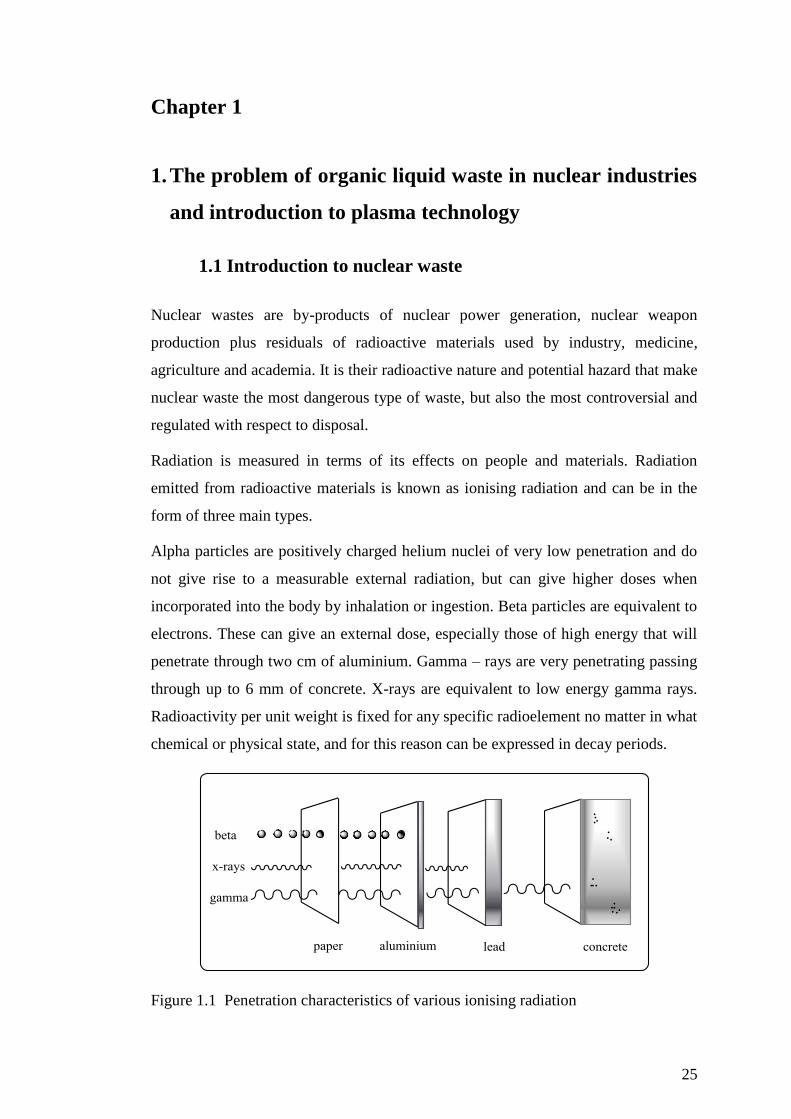
Alpha particles are positively charged helium nuclei of very low penetration and do
not give rise to a measurable external radiation, but can give higher doses when
incorporated into the body by inhalation or ingestion. Beta particles are equivalent to
electrons. These can give an external dose, especially those of high energy that will
penetrate through two cm of aluminium. Gamma – rays are very penetrating passing
through up to 6 mm of concrete. X-rays are equivalent to low energy gamma rays.
Radioactivity per unit weight is fixed for any specific radioelement no matter in what
chemical or physical state, and for this reason can be expressed in decay periods.
Figure 1.1 Penetration characteristics of various ionising radiation
26
The SI unit for radioactivity is Becqerel (Bq) which is equal to one disintegration per
second. A common term also used to express radioactivity is half-life, which is the
time needed for the radioactivity of a radioelement to decay to one-half of its original
value.
Radioactivity can spread to the environment and may cause severe health effects in
humans. The physiological effect of very large whole-body doses is radiation
sickness and early death, while large organ doses lead to local cell destructions and
possibly organ death. The effect of lower doses are cell changes like decreased
surviving fraction, decreased rate of division, chromosomal aberrations and more [2].
For man, the unit that is used to measure ionising radiation is Sievert (Sv). In
humans, it has been calculated that a 5 Sv is usually fatal, and the lifetime risk of
dying from radiation-induced cancer from a single dose of 0.1 Sv is 0.8%, increasing
by the same amount for each additional 0.1 Sv increment of dosage.
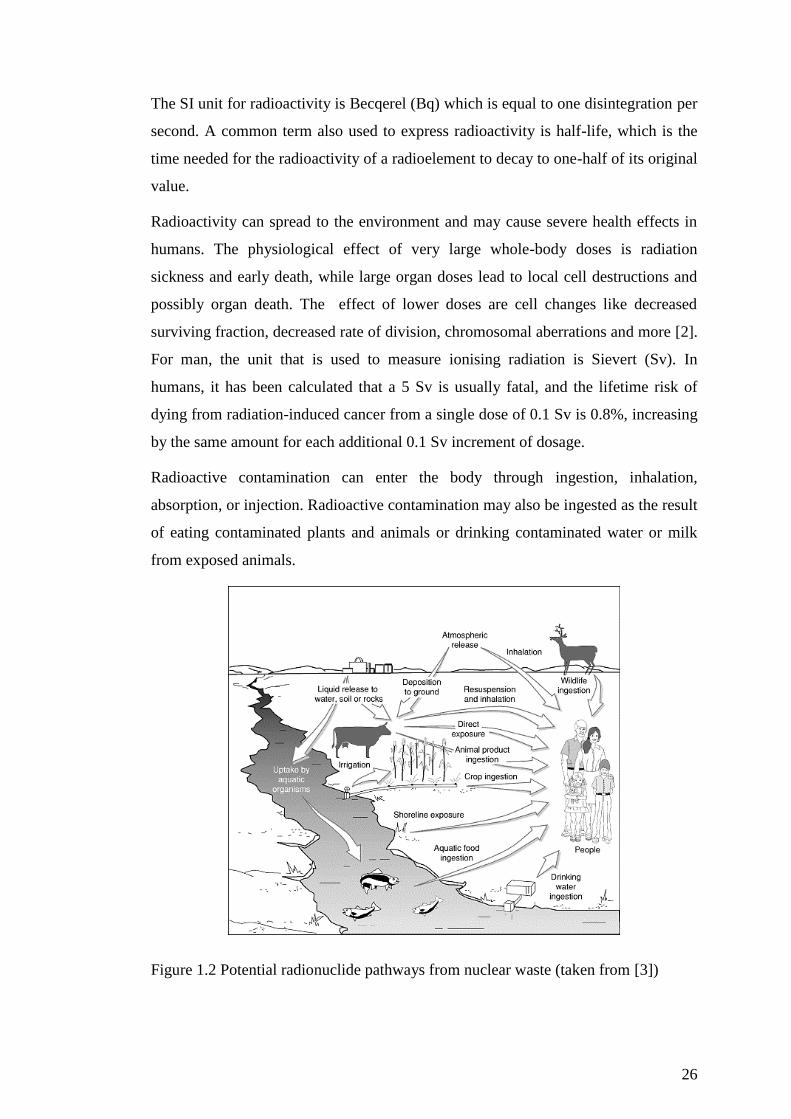
Radioactive contamination can enter the body through ingestion, inhalation,
absorption, or injection. Radioactive contamination may also be ingested as the result
of eating contaminated plants and animals or drinking contaminated water or milk
from exposed animals.
Figure 1.2 Potential radionuclide pathways from nuclear waste (taken from [3])
27
The main radioactivity by definition reduces over time, so in principle the waste
needs to be isolated for a particular period of time until its components no longer
pose a hazard. This depends on the components’ half-life and it can mean hours to
years for some common medical or industrial radioactive wastes or many thousands
of years for high-level wastes, such as plutonium-239 in spent fuel. The main
approaches to managing radioactive waste so far have been segregation and storage
for short-lived waste, near-surface disposal for low and some intermediate level
waste, and deep and secure burial for the long-lived high-level waste.
The object of radioactive management is to concentrate the radioactive material as
far as possible into a small volume that can be isolated indefinitely from human
contact. If streams such as water from fuel storage ponds are too bulky for anything
but release into the environment, all radioactivity or harmful material that poses a
significant risk has to be removed [4].
1.2 Classification of radioactive waste
Waste can be classified according to activity (low, medium or high) and physical
state (gas, liquid or solid package). The four main types according to activity are
given below [4, 5].
Exempt or very low level waste (VLLW) is sometimes described as “below
regulatory concern” and contains very low concentrations of radioactivity. The
associated radiological hazards are considered negligible as they are less than the
naturally occurring radioactivity (each 0.1 m3
of material or single item containing
less than < 400 kBq or 40 kBq beta/gamma activity, respectively).
Low Level waste (LLW) is generated from hospitals, laboratories, industries as well
as nuclear fuel and defence program cycles. It comprises paper, rags, tools, clothing,
filters and other lightly contaminated materials containing small amounts of short-
lived radionuclides. It is easy to handle but must be disposed of more carefully than
normal garbage, often buried in shallow monitored landfill sites. To reduce its
volume, it can be either compacted or incinerated (in a closed container) before
disposal. Worldwide it constitutes 90% of the volume but only 1% of the
radioactivity associated with other radioactive waste (not exceeding 4 GBq alpha or
12 GBq beta/gamma activity).
28
Intermediate Level Waste (ILW) contains higher amounts of radioactivity and
requires the use of special shielding before operation. It could be materials like
resins, filters, chemical sludge, reactor components, or contaminated materials from
reactor decommissioning and it usually needs to be solidified into concrete or
bitumen for disposal. Whilst short-lived waste can be buried, long lived waste from
nuclear fuel reprocessing is usually subject to deep geological disposal. ILW
contains 4% of the radioactivity of all radioactive wastes.
High Level Waste (HLW) generally refers to materials requiring permanent isolation
from the environment. When nuclear fuel from nuclear reactors is chemically
processed, wastes include highly concentrated liquid solutions with fission products
and transuranic elements generated in the reactor core. It is highly radioactive and
often thermally hot. Although HLW is small compared to the total radioactive waste
produced, it contains over 95% of the total radioactivity.
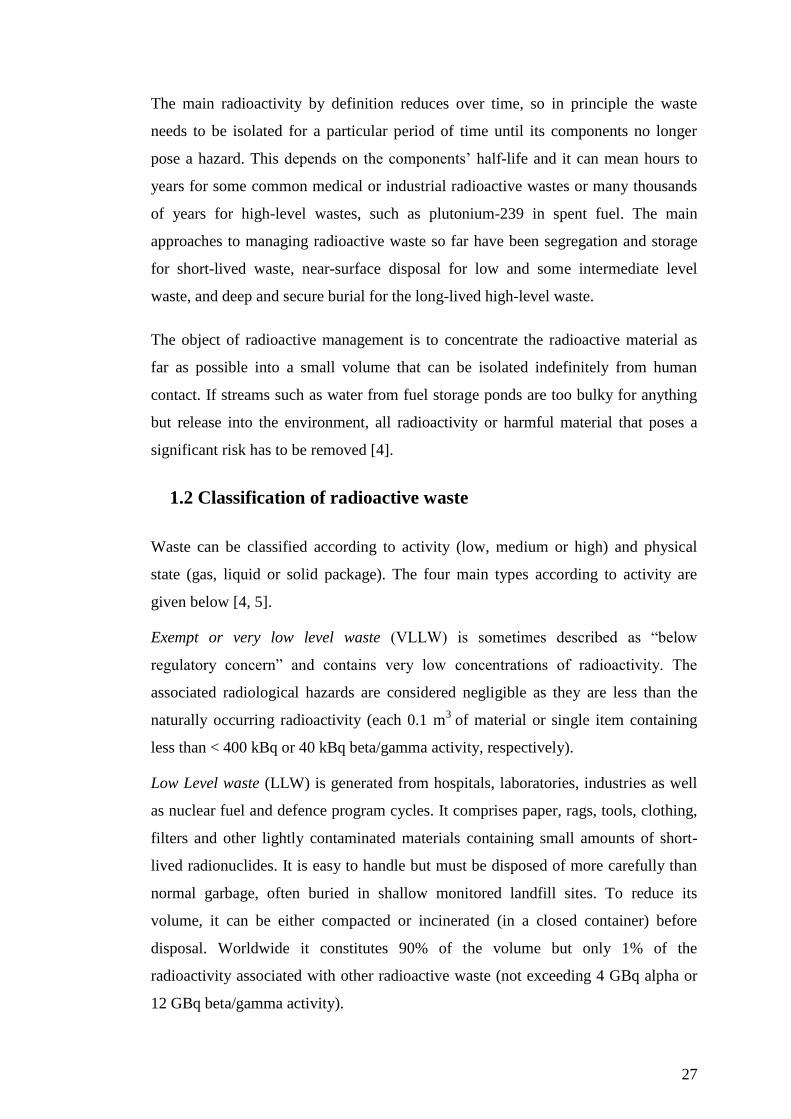
1.3 The nuclear fuel cycle
The nuclear fuel cycle is the series of industrial processes which involve the
production of electricity from uranium in nuclear power reactors. A schematic of the
nuclear fuel cycle is given in Figure 1.3. Where fuel discharged from a reactor is
reprocessed and the uranium or plutonium returned for further use, at least some of
the material follows a closed loop or cycle. Reprocessing for this purpose is often
described as closing the Back End of the fuel cycle [3]. The genuine nuclear fuel
cycle comprises: mining and milling the ore, purifying the ore concentrate, etching
the U-253 content if necessary and manufacturing fuel, utilising the fuel in reactors
of various kinds, reprocessing the discharged fuel to separate uranium and plutonium
from waste, returning the uranium and plutonium for further use and disposing of
wastes.
Discussing how to manage waste from the nuclear power industry, the Fuel Cycle
divides into two parts. The Front End, which consists of the activities beginning with
mining and milling up through and including burning the uranium fuel in a nuclear
reactor. The Back End of the nuclear cycle is the remaining activities, where the vast
majority of the waste is generated and managed.
29
Figure 1.3 A schematic of the nuclear Fuel Cycle adapted from [4].
The three major options resulting from the Back End fuel cycle according to the
waste management are as follow: 1) the once-through cycle and direct disposal as
HLW, 2) the reprocessing fuel cycle (RFC) with mixed oxides (MOX), recycling of
U and P in light water or fast breeder reactors and then disposal of HLW or 3) the
advanced fuel cycle (AFC), as an extension of the RFC in which the wastes are
partitioned or transmuted to reduce radiotoxicity [5].
The nuclear industry’s common option is reprocessing, where the unused uranium
and the plutonium produced are recovered leaving the minor actinides with the
fission products as HLW. This method would give recovered fuel to produce more
energy while, the volume of the HLW would be significantly reduced. This method
follows the rule of making full use of the valuable energy resources of mankind.
1.4 The origin of the organic liquid nuclear waste
The majority of the organic liquid radioactive waste in the nuclear industry consists
of lubricating oils and extraction solvents.
30
Lubricating oils are mostly paraffins and could come from primary heat transport
pumps, hydraulic fluids from fuelling machines, and turbine oils. These are normally
low level wastes containing only relatively small quantities of beta/gamma emitting
radionuclides. They can become waste as a result of regular servicing of equipment,
or when an item of equipment is discarded.
Organic extraction solvents are used both in the Front End for uranium ore
purification processes and in the reprocessing plants in the Back End of the nuclear
cycle. At the present time, the PUREX (Plutonium Uranium Redox Extraction)
process is universally employed as the preferred aqueous chemical processing
technology for reprocessing spent nuclear fuel. It is a wet chemical process that uses
mixtures of 20% or 30% tributylphosphate (TBP) in diluents (usually odourless
kerosene or dodecane) to co-extract U (VI) and Pu (IV) from a strongly acidic nitrate
solution (3-4 M HNO3) [2, 4-6].
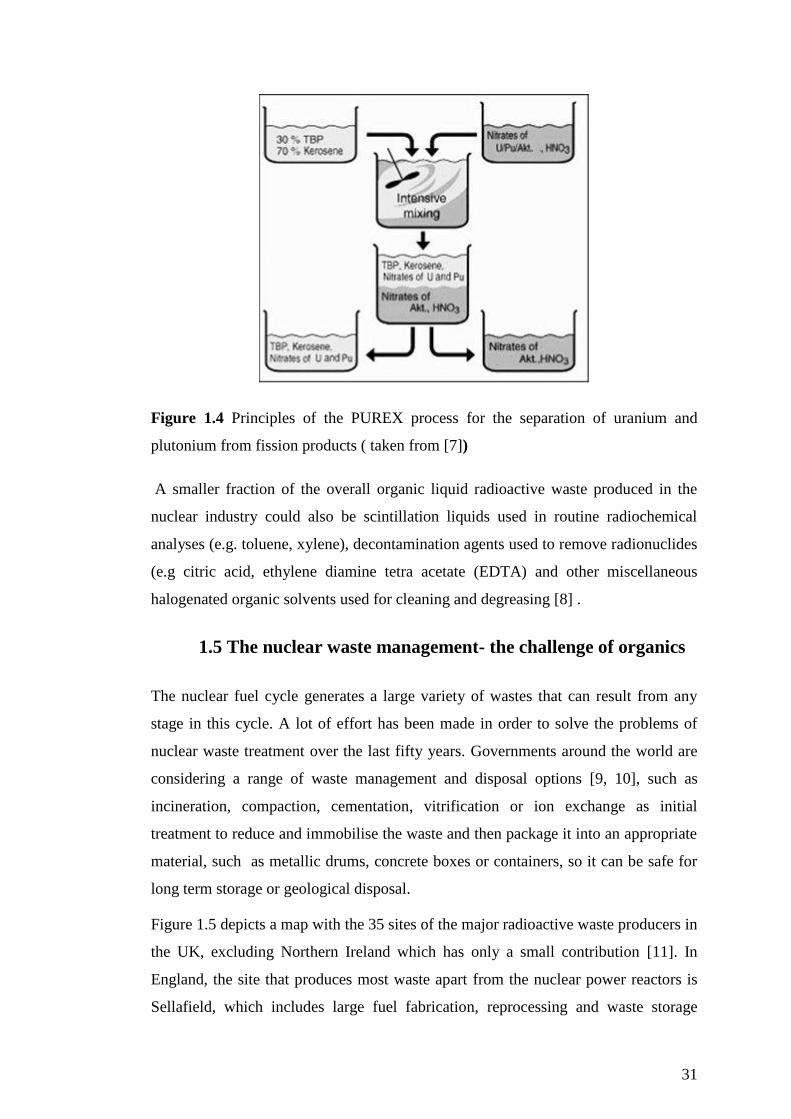
Specifically in PUREX process after the extraction, the uranium and plutonium are
transferred by intensive mixing to the organic phase of the tributylphosphate (TBP)
in kerosene, while the fission products remain in the aqueous nitric phase (Figure
1.4). Further process steps enable the subsequent separation of uranium and
plutonium from one another. The chemical reactions that describe the extraction of
uranium and plutonium in the PUREX process are as follows [4]:
UO22+
+ 2NO3-aq + 2 TBP → UO2(NO3)2(TBP)2 org Equation 1.1
Pu4+
+ 4NO3- aq + 2 TPB → Pu(NO3)4(TPB)2 org Equation 1.2
The PUREX process yields two product streams, which are chemically-purified
uranium and plutonium that are further separated from each other with selective
extraction and repetitive cycles of “steam-stripping” to remove any by-products. Two
main waste streams are the aqueous remains including nitrates of actinides and
fission products as HLW, and the organic extractants (TBP/kerosene) with small
residues of radioactive actinides (U, Pu) and fission products (Ru, Zr, Nb) and a
small amount of solvent degradation by products such as dibutyl or
monobutylphosphate caused by radiolysis as a result of the intense radiation arising
primarily from fission product decay [2].
31
Figure 1.4 Principles of the PUREX process for the separation of uranium and
plutonium from fission products ( taken from [7])
A smaller fraction of the overall organic liquid radioactive waste produced in the
nuclear industry could also be scintillation liquids used in routine radiochemical
analyses (e.g. toluene, xylene), decontamination agents used to remove radionuclides
(e.g citric acid, ethylene diamine tetra acetate (EDTA) and other miscellaneous
halogenated organic solvents used for cleaning and degreasing [8] .
1.5 The nuclear waste management- the challenge of organics
The nuclear fuel cycle generates a large variety of wastes that can result from any
stage in this cycle. A lot of effort has been made in order to solve the problems of
nuclear waste treatment over the last fifty years. Governments around the world are
considering a range of waste management and disposal options [9, 10], such as
incineration, compaction, cementation, vitrification or ion exchange as initial
treatment to reduce and immobilise the waste and then package it into an appropriate
material, such as metallic drums, concrete boxes or containers, so it can be safe for
long term storage or geological disposal.
Figure 1.5 depicts a map with the 35 sites of the major radioactive waste producers in
the UK, excluding Northern Ireland which has only a small contribution [11]. In
England, the site that produces most waste apart from the nuclear power reactors is
Sellafield, which includes large fuel fabrication, reprocessing and waste storage
32
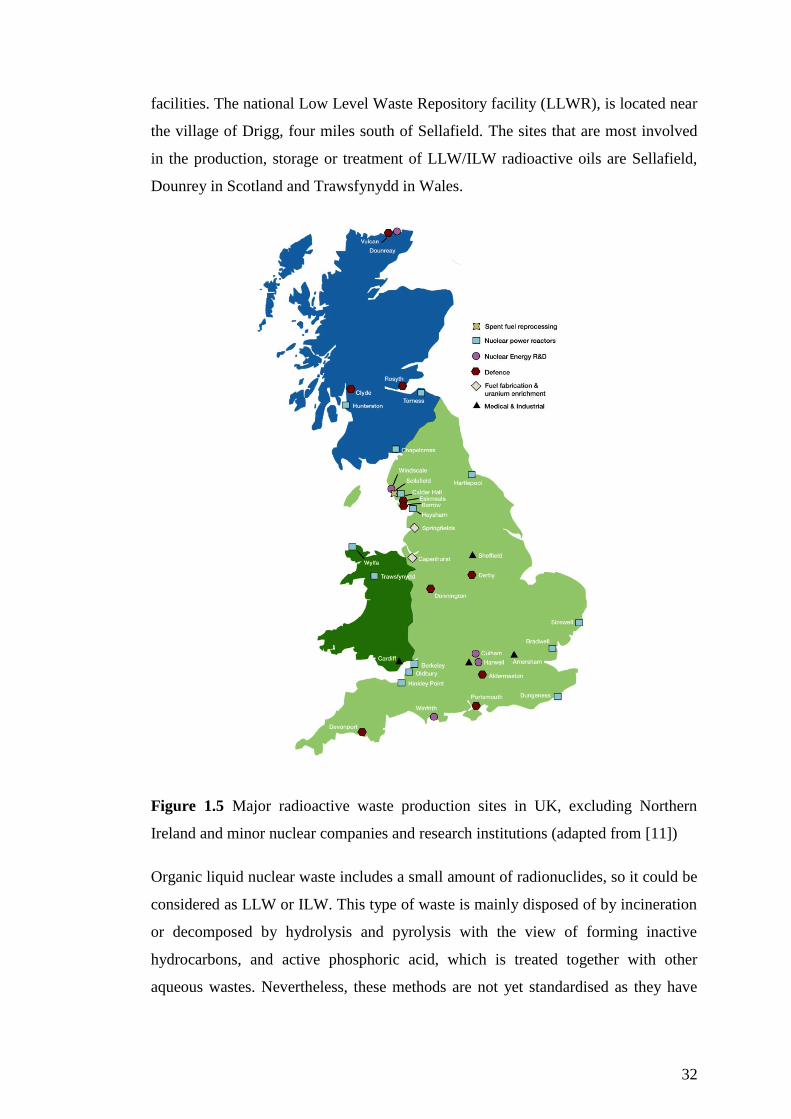
facilities. The national Low Level Waste Repository facility (LLWR), is located near
the village of Drigg, four miles south of Sellafield. The sites that are most involved
in the production, storage or treatment of LLW/ILW radioactive oils are Sellafield,
Dounrey in Scotland and Trawsfynydd in Wales.
Figure 1.5 Major radioactive waste production sites in UK, excluding Northern
Ireland and minor nuclear companies and research institutions (adapted from [11])
Organic liquid nuclear waste includes a small amount of radionuclides, so it could be
considered as LLW or ILW. This type of waste is mainly disposed of by incineration
or decomposed by hydrolysis and pyrolysis with the view of forming inactive
hydrocarbons, and active phosphoric acid, which is treated together with other
aqueous wastes. Nevertheless, these methods are not yet standardised as they have

33
many disadvantages. Table 1.1 summarises the possible waste treatments and their
limitations.
Process
Advantages Problems
Direct incineration Conceptually
straightforward
Burnout, plant life, ventilation
clean up
Pyrolysis Avoids corrosive fume Intractable residues
Phosphoric acid
split
Possible recycling High temperature moving parts,
undesirable distribution of
activity
Encapsulation Conceptually straight-
forward
High volume of solid waste
a) Direct
encapsulation
Conceptually
straightforward
Low fractional incorporation,
weepage
b) Absorption and
cementation
Conceptually
straightforward
High volume of solid waste
Ultraviolet
irradiation
No reagents needed Highly inefficient, high energy
costs
Gamma radiation Conceptually elegant
process, radiation available,
continuous degradation
Very high energy required,
practical demonstration
lacking, safety engineering
problems
Microbial
degradation
Potential low temperature,
modern technology
Large waste volumes, large
plant required
Dealkylation
( Friedel -Craft)
Chemically elegant Poor performance, by products
difficult to handle
Distillation Simple process, reduces
interim storage acquirement.
Partial process, OK* distillate
not suitable for recycling
Emulsification and
sea discharge
Simple and cheap Extremely large effluent
volumes, discharges and
organics
Silver II
electrochemical
Potential versatile Energy costs, needs excessive
development with no guarantee
of success
*Odourless Kerosene
Table 1.1 Unsuitable solvent destruction processes (adapted from [4])
It is the characteristics of liquid organic radioactive waste that makes its management
and treatment complicated and expensive. In general, the organic components of
radioactive waste can change form more easily than most inorganic components, for
example due to their low melting point, their response to radiolysis or their volatility.
They will drain under gravity and contribute to the spread of contamination, so they
need to be effectively contained. Many are volatile and combustible, or will support

34
combustion of other wastes. They can also provide a source of nutrients for microbial
activity. Their immiscibility with water require special care due to their potential to
migrate rapidly in the environment (the lighter fraction can float on water whereas
the dense fraction cannot), or some of the decontaminants (chelating agents) can
form water soluble complexes with radionuclides. This distinction may be of
significance for waste collection, storage and processing [8].
It is the complexity of this waste in conjunction with the lack of appropriate
treatment and management policy that leads to the option of storing a huge
generation of LLW/ILW liquid organics since 1950’s until now. Nowadays, the
amount of this waste volume in Sellafield is equivalent approximately to an Olympic
size swimming pool. Degradation and leakage with time made this waste even more
complicated and very difficult to transport. For that reason, the interest in the recent
years has been focused on searching for treatment solutions. Looking in that
direction, this project investigates the potential of low temperature plasma
application to the clean-up of liquid organic waste, supported by Nuclear
Decommissioning Authority (NDA) in collaboration with National Nuclear
Laboratory (NNL).
1.6 Low temperature plasma potential application in nuclear
waste management
No commercial-scale treatment has yet been universally established for the treatment
of radioactive organic liquid waste. The criteria for solvent treatment process may be
summarised as follows [12]:
Reasonable chance of successful development on an acceptable timescale
Demonstrated to be safe with small uncertainty and compatible with associated
plants
Simple and easy to control with minimal steps and operation units
Acceptable lifetime costs
Taking into account the above consideration, the objective for this piece of work is to
investigate the potential application of atmospheric pressure, low-temperature plasma
destruction or conversion of oils in the nuclear industries liquid waste management.

35
Furthermore, the investigation of the plasma-chemical oxidation and degradation of
liquid hydrocarbons has yet much information to yield.
The next sections introduce the plasma technology and give a literature review on the
history and current findings of plasma-gaseous or plasma-liquid organics treatment
with relevance to the nuclear decommissioning.
1.7 Plasma Technology
1.7.1 Introduction to plasma
It is from the ancient times that the Greek philosopher Empedocles (490-460 BC)
suggested that everything is made up of four elements; earth, water, air and fire and
that every matter can be formed by transmutation between these. This is principally
correct if the four elements are interpreted as being the gaseous, liquid, solid and fire
is interpreted as energy (or plasma). In 1929, the American chemist Irving Langmuir
was the first who used the term plasma while he was trying to describe the
oscillations of the electron cloud during electrical gas discharges [13]. Plasma is also
known as the fourth state of matter [13, 14]. As temperature increases, a substance
transforms in the sequence of solid, liquid, gas and finally plasma. Molecules
become more energetic by heating until they dissociate to form gas atoms and then a
mixture of gas particles freely moving in the plasma state. Some of these particles are
charged particles such as electrons and ions or neutral particles, freely moving in
random directions being on average, electrically neutral. Figure 1.6 illustrates the
four states of matter. The origin of plasma was lately found that could be from the
universe formation, and the Big Bang theory. According to this scientifically
accepted theory, over fifteen million years ago, the matter and energy of the universe
was squeezed into a small and unstable ball that exploded, causing the Big Bang. The
matter was so hot, that it was in a state of plasma. Plasma exists in space, the Sun and
the stars, but can also be man-made in laboratory, as a result of thermal, electric,
microwave or radio frequency induced processes.

36
Figure 1.6 The four states of matter ( taken from [15])
Plasma can occur over a wide range of pressure and it is commonly classified in
terms of electron temperature and electron densities. Most plasmas of practical
significance in laboratory have electron energies of 1-20 eV and electron densities of
106-10
18 cm
-3 [16]. Figure 1.7 shows electron temperatures and densities of typical
natural and man-made plasmas.
Not all particles need to be ionised in the plasma and the ionisation degree can be
very different between various types. When the ionisation degree is close to unity, it
is called completely ionised plasma, such as thermonuclear systems. The main
interest for plasma-chemical applications is weakly ionised plasmas, with a low
degree of ionisation in a range of 10-4
-10-7
[16].
The plasma medium is usually described macroscopically by its temperature and
density and changes in the plasma are calculated by using conservation equations
such as energy, momentum and mass. Microscopically, plasma is described using
statistical probabilities distribution for calculating positions and velocities of all
particles.

37
Figure 1.7 Operating regions of nature and manmade plasma (taken from [16])
Plasma is generated by supplying energy to a neutral gas causing the formation of
charge carriers [17]. There are various ways to supply the energy for the plasma
generation and a schematic of this is given in Figure 1.8.
Figure 1.8 Principles of plasma generation (adapted from [17])

38
The most common way of generating and sustaining low temperature plasma for
technological applications is by applying an electric field to a neutral gas. Free
charged particles are formed and accelerated by the electric field and while colliding
with other atoms, molecules, or the electrode’s surfaces, new charged particles may
be created. This leads to an avalanche of charged particles, but while some charge
carrier losses also occur, eventually balance is created and steady-state plasma
develops.
The plasma which is generated by applying electrical energy, is also called electrical
gas discharge, initially defined the process of “discharge” of a capacitor into a circuit
containing a gas gap between the electrodes. If the electrical field is sufficiently
large, breakdown occurs, the gas becomes a conductor and the capacitor discharges.
More recently, electrodeless electrical field induced breakdown became also possible
to cause a gas discharge.
Depending on the type of energy supply and the amount of energy transferred to the
plasma, the properties of the plasma change in terms of electron density and
temperature. These parameters can be used to group plasma into different categories.
1.7.2 Plasma properties and classification
The different plasma generation methods and large range of plasma sources create
multiple characteristics and variations in plasma. The main characteristics of plasma
such as density, temperature pressure and electric field can be altered by different
types of discharge, power supply or operating temperature and pressure. That leads
to a promising technology with a wide choice of technical applications [17].
Plasma conductivity and electromagnetic field
The presence of a non-negligible number of charge carriers makes the plasma
electrically conductive so that it responds strongly to electromagnetic fields. This is
the main property that distinguishes plasma from neutral gas, which is an electrical
insulator. Like gas, plasma does not have a definite shape or a definite volume unless
enclosed in a container; although unlike gas, in the influence of a magnetic field, it
may form structures such as filaments, beams and double layers. Although, plasma is
quasi-neutral, which means that the total density of the positive charge carriers are
equal to the total density of the negative charge carriers.

39
Moving charged particles of plasma create magnetic fields (Figure 1.9) and magnetic
fields can apply forces on other charged particles which affect the motion of the
original moving particles in a continuous cycle [13]. Due to this chaotic energetic
motion, mutual collisions are taking place and the charged particles in the plasma
may emit radiation.
Figure 1.9 The motion of electrons and ions in a magnetic field, taken from [13]
Plasma can be classified by the nature of the electric field that causes the discharge.
Basically, they can be categorised as direct current (DC), or non-direct current (non-
DC) discharges. The DC discharges can be continuous with a constant current (arc,
glow) or can be sustained in a pulsed-periodic regime (pulsed corona). Pulsed DC
discharges can provide the advantages of better control of plasma regime and
afterglow by varying the duty cycles and increasing power for cold plasmas at
atmospheric pressure. Figure 1.10 shows different types of plasma dc discharges
depending on the applied voltage and the discharge current. The Townsend discharge
is a self-sustained discharge created at low discharge current. Transition to a glow
discharge is marked by voltage decrease and an increase in current. At very high
currents, the discharge undergoes a glow-to-arc transition [17].
Non-DC discharges can be sinusoidal with low or high frequency. Alternating
current (AC) dielectric barrier discharges (DBD) can be generated at low frequencies
between 0.5-1 MHz [17], while high frequencies include electrodeless induced
radiofrequency (RF) discharges between 1-100 MHz and microwave (MW)
discharges commonly generated at 2.45 GHz [17] . These electrodeless discharges
play an important role in technologies where electrode erosion is undesirable, but
their operational cost is generally higher.

40
Figure 1.10 The dependence of voltage upon current for various kinds of DC
discharges (taken from [17])
Plasma temperature
The gas translational temperature is defined as the average kinetic energy of the
particles in thermal equilibrium. Thus, plasma can not be described by a single
temperature, unless sufficient collisions occur between particles to equilibrate [14].
Nevertheless, the electron mass is much more less than the mass of heavy particles
such as atoms, molecules or ions and many collisions are required for this to occur.
Even with a high frequency of collisions at higher pressure, the electron and particle
temperatures may be different. A more elaborate profile of plasma temperature is
presented when different forms of plasma energy are studied separately such as
electron temperature (Te), heavy species temperature (Tn) - such as vibrational or
rotational temperature- or translational gas temperature (Tg).
A parameter which determines the electron energy in a plasma is the reduced field
(E/n), where the electric field (E) is divided by the neutral gas density (n) [14]. If the
ratio E/n is really small, elastic collisions between hot electrons and heavy particles
are more likely to occur and subsequently their temperature can approach each other
to create a thermodynamic equilibrium. In this conditions where the electrons
temperature is close to the particles temperature (Te = Tn), the plasma is called
equilibrium or thermal plasma. When the electrons in the plasma have a much higher
energy or temperature than the gas neutral particles (Te > Tn), then the plasma is
called as non-equilibrium or non-thermal plasma. In discharge physics, the reduced
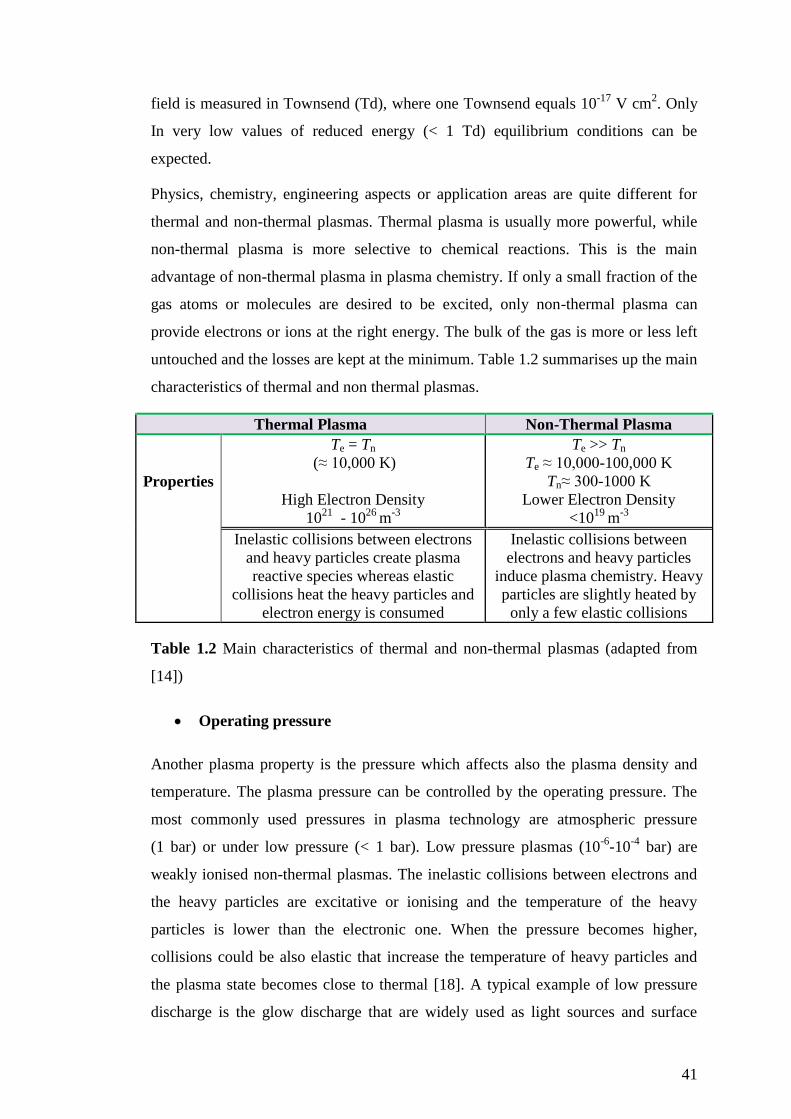
41
field is measured in Townsend (Td), where one Townsend equals 10-17
V cm2. Only
In very low values of reduced energy (< 1 Td) equilibrium conditions can be
expected.
Physics, chemistry, engineering aspects or application areas are quite different for
thermal and non-thermal plasmas. Thermal plasma is usually more powerful, while
non-thermal plasma is more selective to chemical reactions. This is the main
advantage of non-thermal plasma in plasma chemistry. If only a small fraction of the
gas atoms or molecules are desired to be excited, only non-thermal plasma can
provide electrons or ions at the right energy. The bulk of the gas is more or less left
untouched and the losses are kept at the minimum. Table 1.2 summarises up the main
characteristics of thermal and non thermal plasmas.
Thermal Plasma Non-Thermal Plasma
Properties
Te = Tn
(≈ 10,000 K)
High Electron Density
1021
- 1026
m-3
Te >> Tn
Te ≈ 10,000-100,000 K
Tn≈ 300-1000 K
Lower Electron Density
<1019
m-3
Inelastic collisions between electrons
and heavy particles create plasma
reactive species whereas elastic
collisions heat the heavy particles and
electron energy is consumed
Inelastic collisions between
electrons and heavy particles
induce plasma chemistry. Heavy
particles are slightly heated by
only a few elastic collisions
Table 1.2 Main characteristics of thermal and non-thermal plasmas (adapted from
[14])
Operating pressure
Another plasma property is the pressure which affects also the plasma density and
temperature. The plasma pressure can be controlled by the operating pressure. The
most commonly used pressures in plasma technology are atmospheric pressure
(1 bar) or under low pressure (< 1 bar). Low pressure plasmas (10-6
-10-4
bar) are
weakly ionised non-thermal plasmas. The inelastic collisions between electrons and
the heavy particles are excitative or ionising and the temperature of the heavy
particles is lower than the electronic one. When the pressure becomes higher,
collisions could be also elastic that increase the temperature of heavy particles and
the plasma state becomes close to thermal [18]. A typical example of low pressure
discharge is the glow discharge that are widely used as light sources and surface

42
treatment applications and it can operating between 10-6
bar to near atmospheric
pressure. Above atmospheric pressures, glow discharge can transform to thermal arcs
that can operate at high pressures exceeding 10 atm. The plasma in that case is so
dense that most of the discharge power (80-90 %) is converted into radiation [16].
Non-thermal low temperature plasmas can be operated in atmospheric pressure and
are attractive to plasma-chemical applications. In the next section characteristic
atmospheric pressure low temperature gas discharges that are in relevance to this
work will be described.
1.7.3 Low temperature atmospheric pressure discharges and their applications
Corona discharge
The corona discharge consists of relatively low power electrical discharges that take
place at or near atmospheric pressure. They appear when the field at one or both
electrodes is stronger than in the surrounding gas, thus they are easily formed near
sharp points, edges or thin wires. Coronas have frequently been observed at high
voltage transmission lines, lightning rods and ships masts during electrical storms,
where the discharge takes the shape of a crown (from which corona takes its name)
[19].
A corona discharge can be formed by applying either continuous or pulsed DC
voltage between two electrodes. The electrodes are most commonly arranged as a
grounded cylindrical outer electrode with a high voltage wire or rod inner electrode
or as a point-to-plate, or point-to-point electrode configuration. The area between the
electrodes where the corona is formed is occupied by a static or continuous flow gas.
Corona discharges can take on several forms depending on the relative polarity of the
electrodes. For a point-to-plate electrode configuration, the different types of corona
discharge are shown in Figure 1.11, where the applied voltage increases from left to
right. In a positive corona, the initial breakdown of the gas produces a burst pulse,
limited to the area surrounding the electrode. Increasing the voltage creates
additional charged species, leading to the formation of streamers. In this mode, the
corona occupies a relatively large active volume and has a low temperature of ~
27 °C [19]. However, application of the continuous corona discharge is limited by
low current and low discharge power. Increasing the electrical field the active corona
can reach the opposite electrode, causing a spark (Figure 1.11). Spark channels result

43
in local overheating and plasma non-uniforminity which is not acceptable for
applications. The generation of higher discharge power corona streamers without the
formation of sparks, is possible with the pulsed-periodic voltages.
Figure 1.11 Schematic diagrams showing different forms of corona discharges in a
point-to-plate electrode configuration (adapted from [19])
Corona discharges were first applied for the first electrostatic precipitator of Lodge
[20], and after that they have been spread to other applications such as
electrophotography, static control in semiconductor manufacture and ionization
instrumentation. Furthermore, their ability of generating high concentration of active
atoms and radicals in atmospheric pressure without heating the gas have made them
very attractive for other applications such as surface treatment and cleaning of gas
and liquid waste streams.
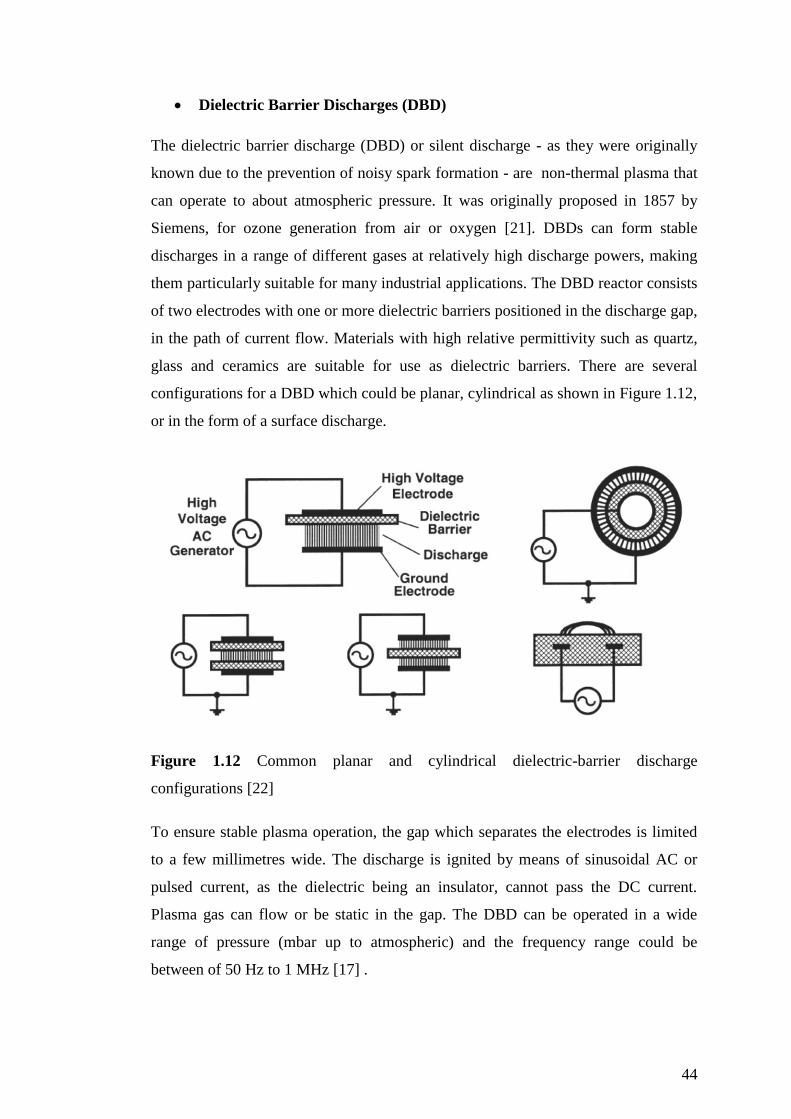
44
Dielectric Barrier Discharges (DBD)
The dielectric barrier discharge (DBD) or silent discharge - as they were originally
known due to the prevention of noisy spark formation - are non-thermal plasma that
can operate to about atmospheric pressure. It was originally proposed in 1857 by
Siemens, for ozone generation from air or oxygen [21]. DBDs can form stable
discharges in a range of different gases at relatively high discharge powers, making
them particularly suitable for many industrial applications. The DBD reactor consists
of two electrodes with one or more dielectric barriers positioned in the discharge gap,
in the path of current flow. Materials with high relative permittivity such as quartz,
glass and ceramics are suitable for use as dielectric barriers. There are several
configurations for a DBD which could be planar, cylindrical as shown in Figure 1.12,
or in the form of a surface discharge.
Figure 1.12 Common planar and cylindrical dielectric-barrier discharge
configurations [22]
To ensure stable plasma operation, the gap which separates the electrodes is limited
to a few millimetres wide. The discharge is ignited by means of sinusoidal AC or
pulsed current, as the dielectric being an insulator, cannot pass the DC current.
Plasma gas can flow or be static in the gap. The DBD can be operated in a wide
range of pressure (mbar up to atmospheric) and the frequency range could be
between of 50 Hz to 1 MHz [17] .
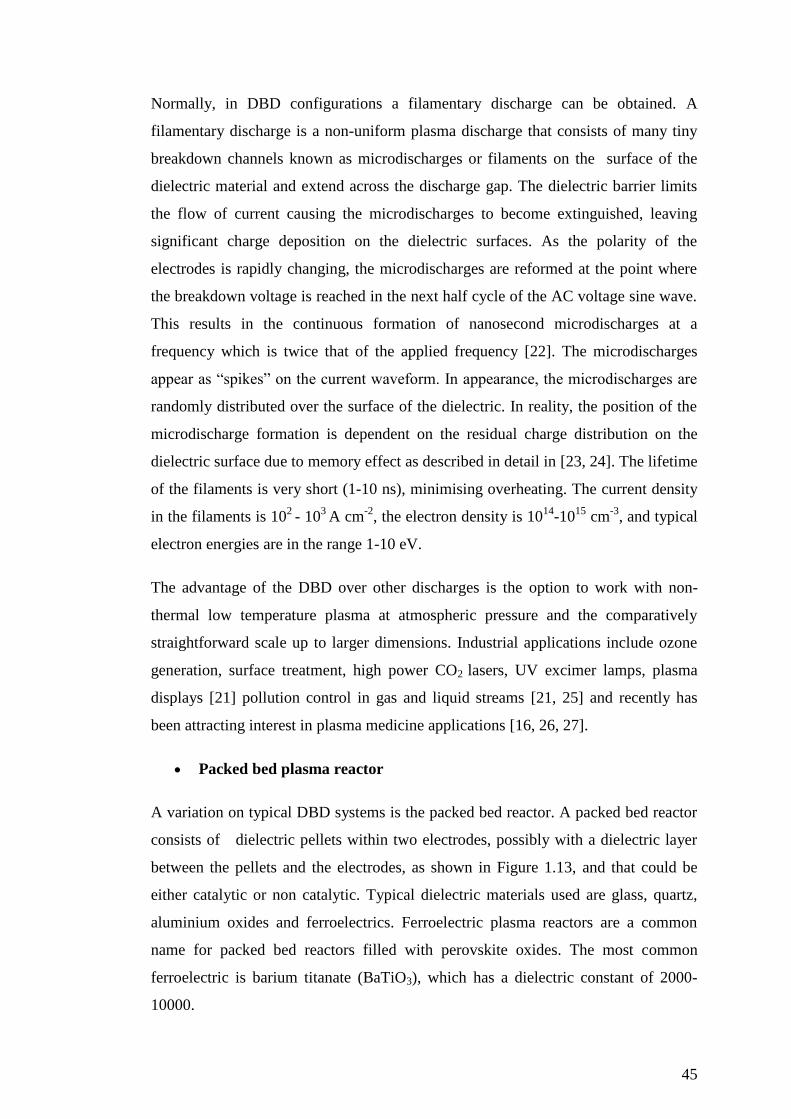
45
Normally, in DBD configurations a filamentary discharge can be obtained. A
filamentary discharge is a non-uniform plasma discharge that consists of many tiny
breakdown channels known as microdischarges or filaments on the surface of the
dielectric material and extend across the discharge gap. The dielectric barrier limits
the flow of current causing the microdischarges to become extinguished, leaving
significant charge deposition on the dielectric surfaces. As the polarity of the
electrodes is rapidly changing, the microdischarges are reformed at the point where
the breakdown voltage is reached in the next half cycle of the AC voltage sine wave.
This results in the continuous formation of nanosecond microdischarges at a
frequency which is twice that of the applied frequency [22]. The microdischarges
appear as “spikes” on the current waveform. In appearance, the microdischarges are
randomly distributed over the surface of the dielectric. In reality, the position of the
microdischarge formation is dependent on the residual charge distribution on the
dielectric surface due to memory effect as described in detail in [23, 24]. The lifetime
of the filaments is very short (1-10 ns), minimising overheating. The current density
in the filaments is 102
- 103
A cm-2
, the electron density is 1014
-1015
cm-3
, and typical
electron energies are in the range 1-10 eV.
The advantage of the DBD over other discharges is the option to work with non-
thermal low temperature plasma at atmospheric pressure and the comparatively
straightforward scale up to larger dimensions. Industrial applications include ozone
generation, surface treatment, high power CO2 lasers, UV excimer lamps, plasma
displays [21] pollution control in gas and liquid streams [21, 25] and recently has
been attracting interest in plasma medicine applications [16, 26, 27].
Packed bed plasma reactor
A variation on typical DBD systems is the packed bed reactor. A packed bed reactor
consists of dielectric pellets within two electrodes, possibly with a dielectric layer
between the pellets and the electrodes, as shown in Figure 1.13, and that could be
either catalytic or non catalytic. Typical dielectric materials used are glass, quartz,
aluminium oxides and ferroelectrics. Ferroelectric plasma reactors are a common
name for packed bed reactors filled with perovskite oxides. The most common
ferroelectric is barium titanate (BaTiO3), which has a dielectric constant of 2000-
10000.
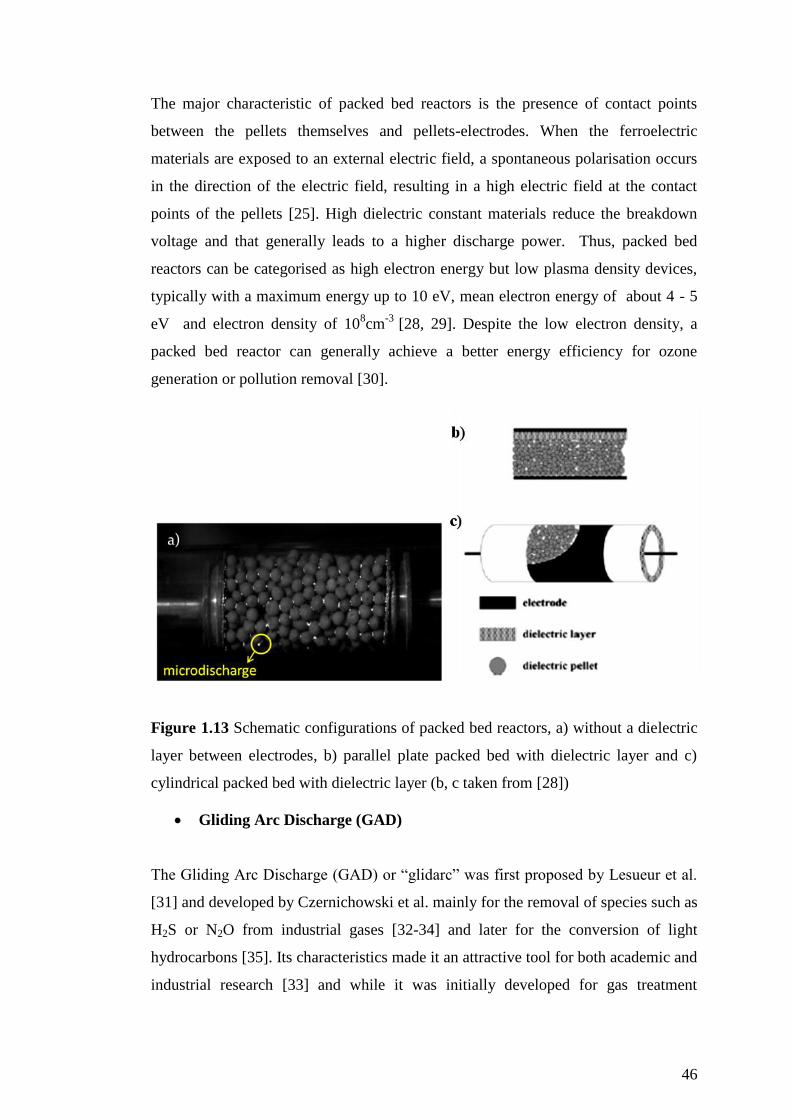
46
The major characteristic of packed bed reactors is the presence of contact points
between the pellets themselves and pellets-electrodes. When the ferroelectric
materials are exposed to an external electric field, a spontaneous polarisation occurs
in the direction of the electric field, resulting in a high electric field at the contact
points of the pellets [25]. High dielectric constant materials reduce the breakdown
voltage and that generally leads to a higher discharge power. Thus, packed bed
reactors can be categorised as high electron energy but low plasma density devices,
typically with a maximum energy up to 10 eV, mean electron energy of about 4 - 5
eV and electron density of 108cm
-3 [28, 29]. Despite the low electron density, a
packed bed reactor can generally achieve a better energy efficiency for ozone
generation or pollution removal [30].
Figure 1.13 Schematic configurations of packed bed reactors, a) without a dielectric
layer between electrodes, b) parallel plate packed bed with dielectric layer and c)
cylindrical packed bed with dielectric layer (b, c taken from [28])
Gliding Arc Discharge (GAD)
The Gliding Arc Discharge (GAD) or “glidarc” was first proposed by Lesueur et al.
[31] and developed by Czernichowski et al. mainly for the removal of species such as
H2S or N2O from industrial gases [32-34] and later for the conversion of light
hydrocarbons [35]. Its characteristics made it an attractive tool for both academic and
industrial research [33] and while it was initially developed for gas treatment

47
applications, it soon was developed also for solids treatment [36-38] or liquid waste
treatment [39].
A GAD is an auto-oscillating phenomenon developing between at least two
diverging electrodes placed in a fast laminar or turbulent gas flow. It operates at
atmospheric pressure or higher and the power at non-equilibrium conditions could
exist up to 40 kW power [40]. A high voltage generator can provide the appropriate
electric field to initially breakdown the gas at the upstream shortest gap between the
two electrodes and create a plasma arc column between the electrodes. The gas flow
gently pushes the arc downstream along the electrode axis so its length increases
until it extinguishes and reignites itself again at the minimum gap between the
electrodes starting a new cycle. The gliding arc plasma can be either thermal or non-
thermal depending on the power and gas flow applied, but also can be operated at the
transitional regime. In that case is also described as low-temperature quenched
plasma, because it includes both regions of thermal and non-thermal plasma. The
initial arc breakdown region is characterised by quasi-equilibrium phenomena, but as
its length increases, the temperature of the heavy species decreases, so it becomes
non-thermal quenched plasma upon breaking into a plasma plume. The physical
characteristics and dynamics of this Fast Equilibrium to Non-Equilibrium Transition
(FENETRe) regime have been studied considerably by several researchers [40-43].
Figures 1.14 and 1.15 illustrate that phenomenon.
The advantage of gliding arc is that by combining both thermal and non-thermal
plasma characteristics, it can successfully provide high power and electron density,
whilst simultaneously maintaining a high electron temperature and low gas
temperature that is favourable in plasma-chemical applications. Many people have
worked on the development of gliding arc discharge. Czernikowski tried three-phase,
three-electrode gliding arc discharge for removing H2S as early as 1993 [44].
Cormier and co-workers [45] and more recently Fridman and his group have studied
rotating discharges [46]. Stryczevska and co-workers studied the improvement of
power supply especially for a three-electrode configuration [47]. Three different
gliding arc configurations are given in Figure 1.16.

48
Figure 1.14 Phases of the gliding arc evolution i) (A) gas break down, (B)
equilibrium heating phase, (C) non equilibrium reaction phase, ii) Argon GAD
showing the transition (when flow is Q = 5 L min-1
and input power is Pin = 100 W)
Figure 1.15 Argon GAD generated in are laboratory ((Q = 5 L min-1
, Pin = 100 W).
Photographs are taken using a Nikon 5100 digital single-lens reflex camera, at
different exposure times. Time-spaced 1/200 s exposures show the arc evolution in
the gliding arc discharge

49
Figure 1.16 Different Gliding arc discharge configurations: a) bi-dimensional
gliding arc discharge [16], b) vortex flow rotating gliding arc discharge [16, 46] and
c) three-electrodes gliding arc discharge [47]
1.8 Non-Thermal Plasma Composition and Generation of
Active Species
Plasma discharges can cause molecular dissociation and produce radicals, and in
oxygen source gas mixtures that will create oxidative environment and promote the
chemical reactivity. The chemical effects occurring in an electrical discharge are the
consequence of the energy injection into a gas stream by electron impact reactions
under the influence of the electric field [25]. Collisions of electrons with neutral
particles may produce ionisation, fragmentation of molecules, electronic, vibrational
and rotational excitation of the neutral gas. The importance of its reaction is based on
its timescale as shown if Figure 1.17.
Chemical processes in non-thermal plasma are divided into a primary and a
secondary process depending on the timescale. Primary process includes ionisation,
excitation, and dissociation, light emission and charge transfer. Table 1.3 lists these
reactions occurring in the plasma phase. The secondary process is the subsequent
chemical reactions between products of the primary process such as electrons, ions,
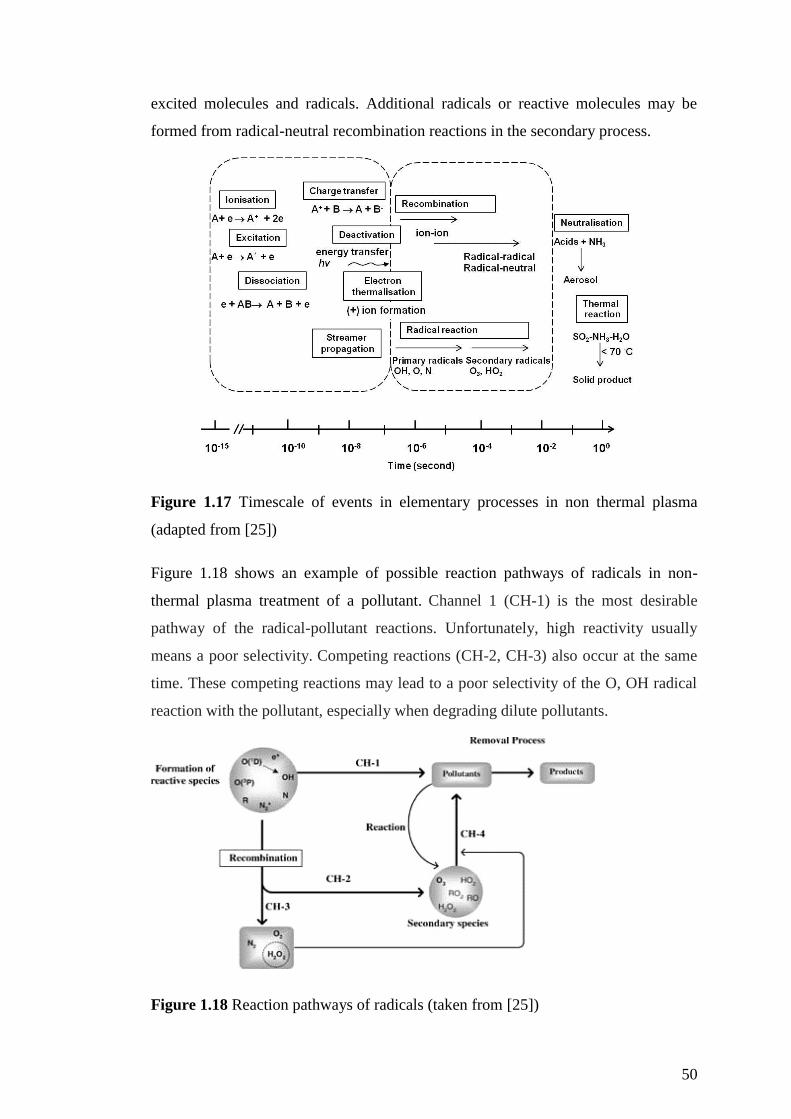
50
excited molecules and radicals. Additional radicals or reactive molecules may be
formed from radical-neutral recombination reactions in the secondary process.
Figure 1.17 Timescale of events in elementary processes in non thermal plasma
(adapted from [25])
Figure 1.18 shows an example of possible reaction pathways of radicals in non-
thermal plasma treatment of a pollutant. Channel 1 (CH-1) is the most desirable
pathway of the radical-pollutant reactions. Unfortunately, high reactivity usually
means a poor selectivity. Competing reactions (CH-2, CH-3) also occur at the same
time. These competing reactions may lead to a poor selectivity of the O, OH radical
reaction with the pollutant, especially when degrading dilute pollutants.
Figure 1.18 Reaction pathways of radicals (taken from [25])

51
Type of reaction Reaction Type of reaction Reaction
Excitation by Recombination by
Heavy particles A+ B A+B* atoms A+ A +B B + A2
Photon A+ hv A* e
-/ion A
+ +e A + hv
Electron A+ e A
* + e ion/ion A
- + B
+ AB
Transfer A+B* A
*+B Radicals
ion/molecule
A + B AB
A + B+ AB
+
De-excitation/photon A* A + hv Charge transfer A
+ + B A + B
-
Ionisation by Dissociation by
heavy particles impact A+BA+ + B + e Heavy particles impact A2+ B A + A + B
electron attachment A+ e A
- Heavy particles attachment A
*+ BC AB + C
*
Photon impact A+ hv A
+ + e electron impact A2+ e
A +A + e
electron impact A+ e A
+ + 2e electron attachment A2+ e
A
- + A
photon impact A2+ hv A + A
Table 1.3 Typical reactions occurring in non thermal discharges (adapted from [48])
In this work, the plasma gases used were argon, nitrogen and N2-O2 mixtures in dry
or humid conditions. A short description of the primary generated species is given
below.
Argon plasma species
In argon plasmas electron impact reactions generate species such as excited neutral
argon atoms Arm*(4s), Ar
*(4p) or Ar
**(5p) ( Ar I lines) and ground Ar
+ , or excited
singly ionised argon atoms, Ar+*
(Ar II lines). Among them , the first excited state
Arm* belongs to metastable states with a natural decay lifetime of about 1.3 s [49]. It
is expected to be the most populated among the other states and thus it is considered
important in the plasma-chemical reactions.

52
Figure 1.19 Energy level diagrams for argon showing the first two excited
configurations. The two metastable levels are indicated by the letter “m.” The
Paschen designation for each level is indicated at the top of the table, along with the
corresponding value of J [49]
The most pronounced population mechanism for Arm*
is direct electron impact
excitation, but direct or stepwise electron impact excitation to Ar*, Ar
** and then
cascade to Arm* is also possible. Ionisation can initially occur by direct electron
impact but Penning ionisation from argon metastables or other excited species in the
discharge can also occur. However, direct electron impact mechanisms are more
important in cold discharges with high electron temperatures and moderate excited
heavy species. Stepwise electron impact mechanisms become more important in
more energy-intense plasmas where the concentration of highly excited species is
higher [16].
Direct electron impact excitation
R 1.1 e + Ar → e + Arm*, Ar
* or Ar
** ΔE = 11.5 – 11.7, 13.08- 13.33 or 14.7 eV
Stepwise excitation
R 1.2 e + Arm*or Ar
* → Ar**
Direct Electron impact ionisation
R 1.3 e + Ar → Ar+
+ 2e ΔE = 15.7 eV
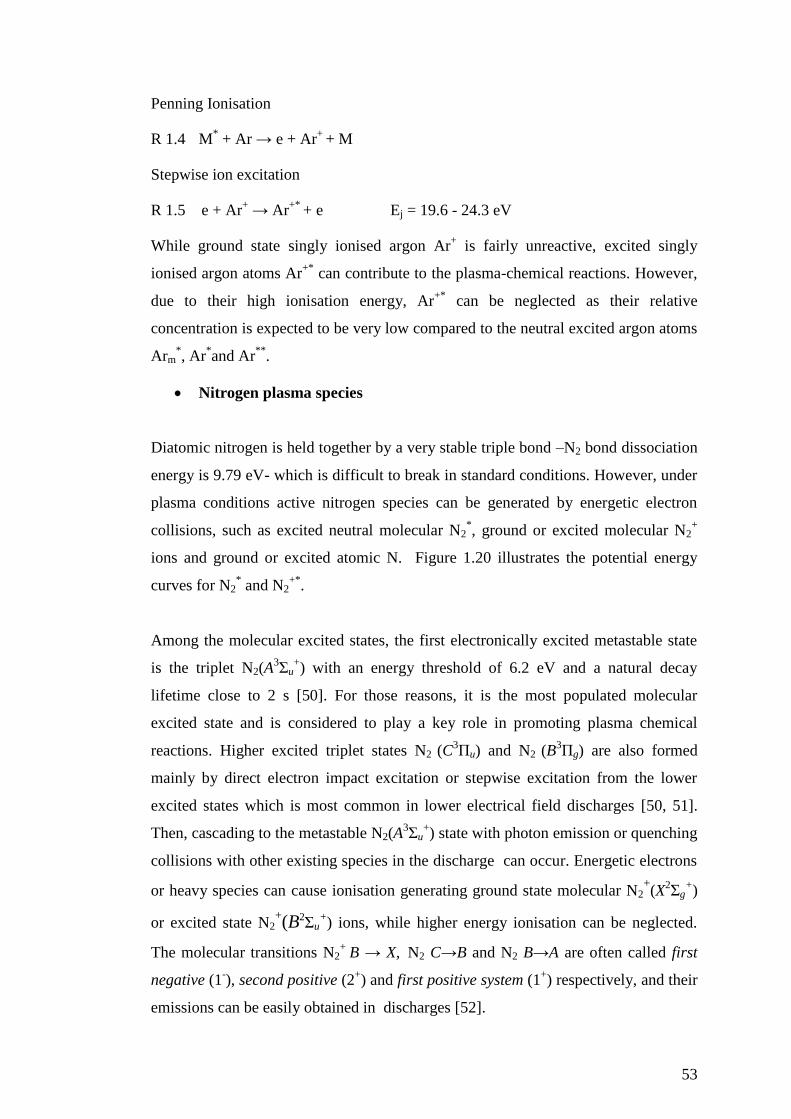
53
Penning Ionisation
R 1.4 M* + Ar → e + Ar
+ + M
Stepwise ion excitation
R 1.5 e + Ar+ → Ar
+* + e Ej = 19.6 - 24.3 eV
While ground state singly ionised argon Ar+ is fairly unreactive, excited singly
ionised argon atoms Ar+*
can contribute to the plasma-chemical reactions. However,
due to their high ionisation energy, Ar+*
can be neglected as their relative
concentration is expected to be very low compared to the neutral excited argon atoms
Arm*, Ar
*and Ar
**.
Nitrogen plasma species
Diatomic nitrogen is held together by a very stable triple bond –N2 bond dissociation
energy is 9.79 eV- which is difficult to break in standard conditions. However, under
plasma conditions active nitrogen species can be generated by energetic electron
collisions, such as excited neutral molecular N2*, ground or excited molecular N2
+
ions and ground or excited atomic N. Figure 1.20 illustrates the potential energy
curves for N2* and N2
+*.
Among the molecular excited states, the first electronically excited metastable state
is the triplet N2(A3Σu
+) with an energy threshold of 6.2 eV and a natural decay
lifetime close to 2 s [50]. For those reasons, it is the most populated molecular
excited state and is considered to play a key role in promoting plasma chemical
reactions. Higher excited triplet states N2 (C3Πu) and N2 (B
3Πg) are also formed
mainly by direct electron impact excitation or stepwise excitation from the lower
excited states which is most common in lower electrical field discharges [50, 51].
Then, cascading to the metastable N2(A3Σu
+) state with photon emission or quenching
collisions with other existing species in the discharge can occur. Energetic electrons
or heavy species can cause ionisation generating ground state molecular N2+(X
2Σg
+)
or excited state N2+(B2
Σu+) ions, while higher energy ionisation can be neglected.
The molecular transitions N2+
B → X, N2 C→B and N2 B→A are often called first
negative (1-), second positive (2
+) and first positive system (1
+) respectively, and their
emissions can be easily obtained in discharges [52].
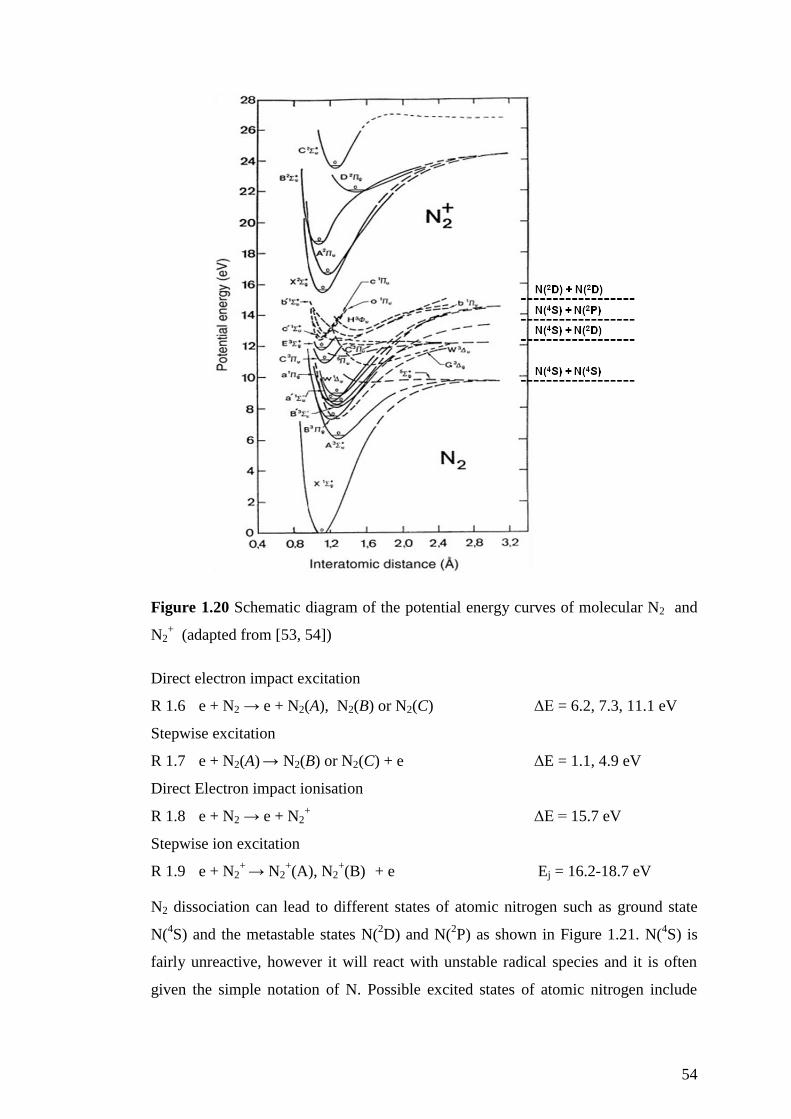
54
Figure 1.20 Schematic diagram of the potential energy curves of molecular N2 and
N2+ (adapted from [53, 54])
Direct electron impact excitation
R 1.6 e + N2 → e + N2(A), N2(B) or N2(C) ΔE = 6.2, 7.3, 11.1 eV
Stepwise excitation
R 1.7 e + N2(A) → N2(B) or N2(C) + e ΔE = 1.1, 4.9 eV
Direct Electron impact ionisation
R 1.8 e + N2 → e + N2+
ΔE = 15.7 eV
Stepwise ion excitation
R 1.9 e + N2+ → N2
+(A), N2
+(B)
+ e Ej = 16.2-18.7 eV
N2 dissociation can lead to different states of atomic nitrogen such as ground state
N(4S) and the metastable states N(
2D) and N(
2P) as shown in Figure 1.21. N(
4S) is
fairly unreactive, however it will react with unstable radical species and it is often
given the simple notation of N. Possible excited states of atomic nitrogen include
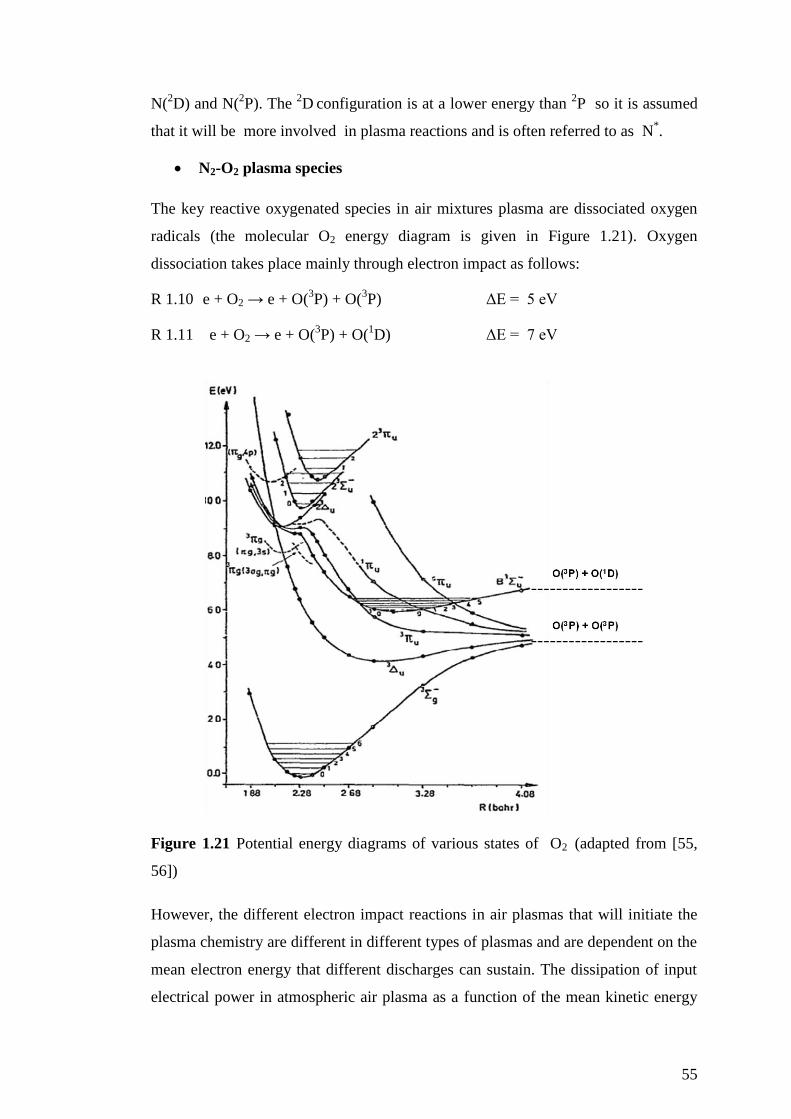
55
N(2D) and N(
2P). The
2D
configuration is at a lower energy than
2P so it is assumed
that it will be more involved in plasma reactions and is often referred to as N*.
N2-O2 plasma species
The key reactive oxygenated species in air mixtures plasma are dissociated oxygen
radicals (the molecular O2 energy diagram is given in Figure 1.21). Oxygen
dissociation takes place mainly through electron impact as follows:
R 1.10 e + O2 → e + O(3P) + O(
3P) ΔE = 5 eV
R 1.11 e + O2 → e + O(3P) + O(
1D) ΔE = 7 eV
Figure 1.21 Potential energy diagrams of various states of O2 (adapted from [55,
56])
However, the different electron impact reactions in air plasmas that will initiate the
plasma chemistry are different in different types of plasmas and are dependent on the
mean electron energy that different discharges can sustain. The dissipation of input
electrical power in atmospheric air plasma as a function of the mean kinetic energy
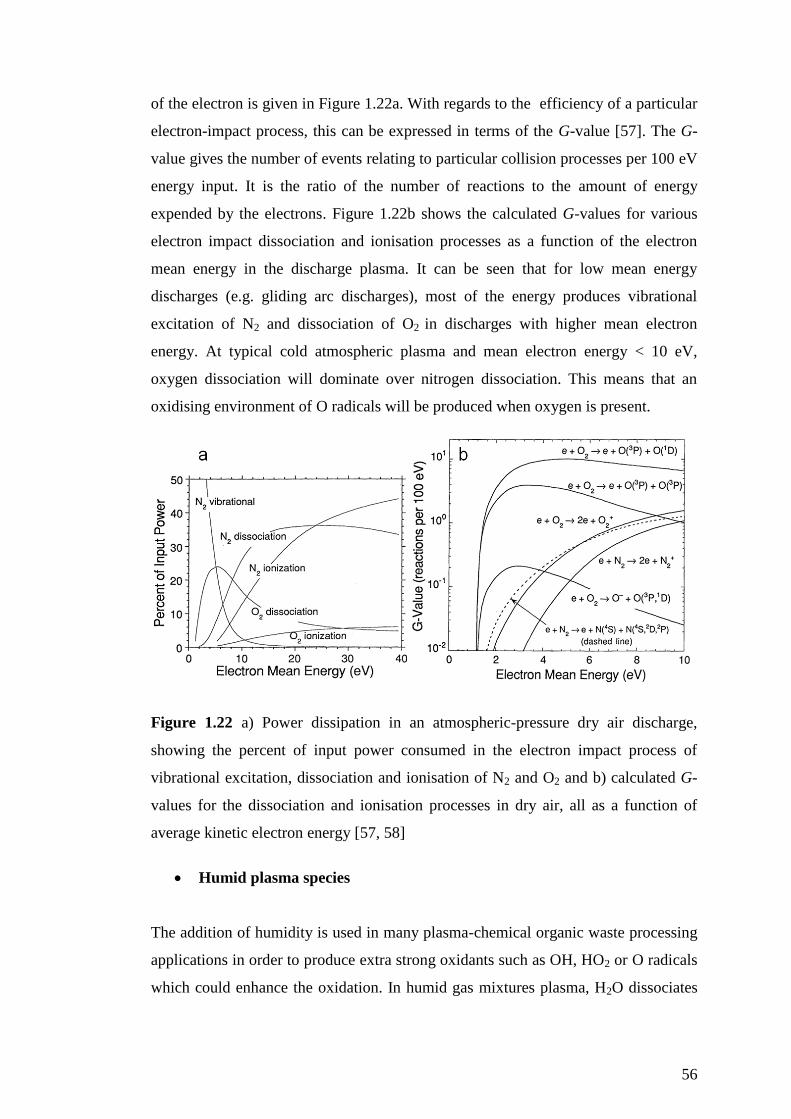
56
of the electron is given in Figure 1.22a. With regards to the efficiency of a particular
electron-impact process, this can be expressed in terms of the G-value [57]. The G-
value gives the number of events relating to particular collision processes per 100 eV
energy input. It is the ratio of the number of reactions to the amount of energy
expended by the electrons. Figure 1.22b shows the calculated G-values for various
electron impact dissociation and ionisation processes as a function of the electron
mean energy in the discharge plasma. It can be seen that for low mean energy
discharges (e.g. gliding arc discharges), most of the energy produces vibrational
excitation of N2 and dissociation of O2 in discharges with higher mean electron
energy. At typical cold atmospheric plasma and mean electron energy < 10 eV,
oxygen dissociation will dominate over nitrogen dissociation. This means that an
oxidising environment of O radicals will be produced when oxygen is present.
Figure 1.22 a) Power dissipation in an atmospheric-pressure dry air discharge,
showing the percent of input power consumed in the electron impact process of
vibrational excitation, dissociation and ionisation of N2 and O2 and b) calculated G-
values for the dissociation and ionisation processes in dry air, all as a function of
average kinetic electron energy [57, 58]
Humid plasma species
The addition of humidity is used in many plasma-chemical organic waste processing
applications in order to produce extra strong oxidants such as OH, HO2 or O radicals
which could enhance the oxidation. In humid gas mixtures plasma, H2O dissociates

57
to produce OH and H radicals. In low mean electron energy discharges, this
dissociation can occur via mainly three types of reactions:
Direct impact dissociation
R 1.12 e + H2O → e + H + OH
Dissociative electron attachment
R1.13 e + H2O → H- + OH
Penning dissociation or dissociative attachment
R 1.14 M* + H2O → M + H+ OH
→ MH + OH
In O2 gas mixtures plasmas O(1D) can also significantly contribute to the water
dissociation in atmospheric plasma by increasing the production of OH radicals,
according to Reaction 1.14. Figure 1.23 shows the contributions of these reactions in
a mixture of 5% O2, 10% H2O, 15% CO2 and 70% N2, as calculated from Penetrante
et al [57].
.
Figure 1.23 Contributions of various processes to the production of OH in an
atmospheric pressure plasma of 5% O2, 10% H2O, 15% CO2 and 70% N2 [57]

58
1.9 Low temperature plasma treatment of organic liquid waste -
a literature review
1.9.1 Introduction
Gaseous pollution control, solid and liquid waste treatments have been developed
into commercial processes based on incineration, catalysis, adsorption, disposal with
landfill, etc. More recently, technology based on plasmas has become significant for
these environmental applications due to the advantages such as lower costs, higher
treatment, energy efficiencies and smaller space volume.
During the last two decades, non-thermal plasmas in and in contact with higher
density media, like liquids, have attracted much attention. Due to their nature, they
can produce a high active species density with short quenching times and with
simultaneous UV radiation, making them particularly suitable for environmental
applications such as water decontamination, sterilisation and purification processes.
Although such plasmas have been known for a long time, they are still considered as
a new aspect of plasma science, and further research is needed to understand its
effect and learn how to control them.
1.9.2 Classification of discharges in and in contact with liquids
Discharges in and in contact with liquids can be divided into three main types such as
direct liquid phase discharges, discharges in the gas phase with one or more liquid
electrodes and discharges creating into bubbles in liquids [59]. Figure 1.24 illustrates
examples of those three main categories. Non-thermal direct liquid-phase discharges
are often called direct liquid streamer or corona discharges and are almost always
generated by pulsed excitation in a pin-to-plate or in plate-to-plate configuration [60,
61].
Discharges in the gas phase with liquids are in principle gas discharges.
Nevertheless, the properties of these discharges can be different as the discharge
current is transported through the liquid electrode by ions which have smaller
mobility than electrons in gases. Configurations used to generate this type are shown
in Figure 1.25. Discharges in gas-liquid phase can be generated by dc, pulsed or ac
excitation. Discharges created in bubbles in water are usually treated as a separate
group, as they are completely surrounded by the liquid which serves as an electrode.

59
Figure 1.24 Typical electrode configurations in and in contact with liquids (taken
from [59]). a) Direct liquid phase discharge reactor, b) gas phase discharge with
liquid electrode and c) bubble discharge reactor
Figure 1.25 Overview of the different electrode configurations used to study
electrical discharges with liquid electrodes (taken from [62]). (a) Discharge reactor
between two liquid electrodes, (b) setup to study discharges between two droplets,
(c) water surface discharge setup (flashover), (d) gliding arc reactor with active water
electrode [63] , (e) gliding arc reactor with passive water electrode (standard gliding
arc configuration) and (f ) hybrid reactor ( [64] )
Many different configurations have been used such as bubbling systems, capillary or
diaphragm systems. The gliding arc discharge configuration belongs to the plasma
“in contact” with the liquid treatment method as shown in Figure 1.25 e.
60
1.9.3 Non-Thermal Plasma Treatment of Liquid Waste
Environmental applications of electrical discharges in liquid treatment are being
considered increasingly, as they could present many potential advantages [65]:
Direct in situ production of multiple reactive chemical species;
Enhancement of gas phase reactions through quenching of gas reaction
products into the liquid and species formed in liquid reactions and transferred
to the gas;
Facilitation and enhancement of both gas and liquid phase reactions;
Control of relative amounts of reactive species by adjusting the applied
electric field and the gas-liquid flow rates;
Simultaneous production of UV light and shock waves.
Many of the different plasma-liquid configurations have been centred on waste water
treatment and water purification processes [65, 66]. The corona discharge [61, 65,
67-70], and optimised hybrid reactors [71], the gliding arc discharge [39, 72], as well
as dielectric barrier discharges have been tested for their efficiency in this field [73-
76]. A review on water purification by plasma comparing the energy efficiency for
different reactors is given by Malik [77]. A recent review and discussion on different
plasma-liquid treatment methods in aqueous systems even with the use of catalyst is
given in the book edited by Parvulescu, Maguraneu and Lukes [78].
Changing the liquid in the plasma-liquid process would significantly affect the
plasma properties and chemistry, for example going from a high salt containing
liquid to high purity water or an organic liquid which generally have lower
conductivity properties and it could be more difficult or more energy demanding to
create an in-liquid discharge. For that reason, we find extended literature on the
treatment of organics in aqueous systems and wastewater, however, the literature on
plasma-liquid treatment of organic waste is more limited. However, plasma in
contact with organics can be found in literature as early as 1978, when Sharbaugh et
al. used benzene as an example to study the breakdown phenomena in insulating
dielectric liquids [79]. Later in 1982, Suhr reviewed on the organic plasma-chemical
reactions in organic plasma synthesis and [80] some of his later work with co-
workers using low-pressure RF discharge can be found on [81-83]. In atmospheric

61
plasma processing of organic liquids, Prieto et al studied the conversion of heavy oil
to lighter hydrocarbons [84] and soon, research was extended to the field of plasma
reforming for the production of hydrogen rich gases using different configurations
such as corona discharges [85-89], dielectric barrier discharges [90-92] or gliding arc
discharge [35, 93].
1.9.4 Gliding Arc Applications on Organic Liquid Waste Treatment
The interest in the gliding arc discharges in interaction with liquids has also started to
increase in the last few years and soon a standardised reactor configuration for the
treatment of aqueous waste was developed [39]. The main reason for its use is
because it can provide plasma with both useful properties from thermal (large
electron densities, currents and power) and non-thermal plasma (low operating gas
temperature). Gliding arc was mainly developed in France [94-96] and Algeria [97,
98], but now it is considered as an easy technique to use and it is further developed in
other groups in Unites States [99-101], Far East [102, 103], Cameroon [104-106] and
Eastern Europe [37, 107].
Regarding the treatment of organic liquid waste, Moussa and Brisset were the first
to treat an organic solvent rather than an aqueous solution using the gliding arc
configuration [94]. The treatment was performed using tributylphosphate (TBP)
under humid air batch conditions and results show that TBP is degraded mainly to
CO2 and H3PO4 by means of highly reactive species (e.g. HO•) formed in the plasma
arc and the plasma-liquid contact surface. Similar work has been performed by the
same group in trilaurylamine (TLA) [96]. In addition to batch treatment, a recycling
device for the treated liquid was developed in order to improve the kinetic rate.
Further work has been done in organophosphorous compounds (triethylphosphate,
TEP) using a modified version of a gliding arc discharge with an auxiliary pair of
electrodes in order to control the discharge energy and decrease the operating voltage
[95].
An important development in the use of gliding arc discharge for liquid treatment has
been performed by Burlica, Locke and their co-workers, using a spraying nozzle
injection system of the treated solution directly to the plasma plume [99, 108, 109].

62
1.10 Objectives and thesis structure
The objective of this thesis is the study of low-temperature atmospheric pressure
plasma as a potential technological application for the degradation of organic liquid
waste found in nuclear industries. Literature supports the idea that low-temperature
plasma technology and especially the unique properties of gliding arc discharge have
much potential for the nuclear decommissioning and the treatment of organic liquid
waste. However, limited literature is found for the plasma treatment of liquid
organics and fundamental aspects of the chemical process still remain to be
unravelled.
For this reason, the study has been approached initially by investigating the
degradation of oil in gas phase only, in order to understand the gas chemistry and
elucidate the plasma-chemical degradation mechanism. Gaseous odourless kerosene and
dodecane have been used as simulants and their plasma-chemical degradation has been
studied using a BaTiO3 packed bed plasma reactor (Chapter 3) and a gliding arc
discharge reactor (Chapter 4). The effect of different gas composition to the plasma-
chemical degradation has been studied and overall degradation ability and efficiency is
compared and discussed.
The plasma-liquid dodecane treatment is firstly studied using Ar dielectric barrier
discharge (Chapter 5), testing the effect of different reactor configuration, humidity
and temperature to the discharge characteristics and degradation efficiency will be
discussed. The study of the liquid dodecane degradation is then extended by using
the gliding arc discharge (Chapter 6). Using N2 and Ar in both dry and humid
conditions for the batch treatment of dodecane, the degradation efficiency, gas
chemistry and liquid chemistry are discussed and correlated to the gas chemistry
observed during the plasma treatment of gaseous dodecane under the same
conditions, in order to gain an overall understanding of the plasma-liquid clean-up
process. Finally, the gliding arc plasma treatment of liquid dodecane is studied using
the recycling method investigating the effect to the reactivity and degradation
efficiency.

63
1.11 References
[1] R. J. Choppin G., Liljenzin J. O., Radiochemistry and Nuclear Chemistry,
2nd Edidtion of Nuclear Chemistry Theory and Applications ed.: Butterworth
- Heinerann Ltd, 1995.
[2] G. W. Gee, Meyer P. D., Ward A. L, "Nuclear Waste Disposal," in
Encyclopedia of Soils in the Environment, ed. Oxford: Elsevier, 2005, pp. 56-
63.
[3] P. D. Wilson, The Nuclear Fuel Cycle - From Ore to Waste. Oxford: Oxford
University Press, 1996.
[4] S. N. A. Vertes, Z. Klencsar, Ed., Handbook of Nuclear Chemistry -
Instumentation, Separation techniques, Environmental Issues. Kluwer
Academic Publishers, 2003, p.^pp. Pages.
[5] P. D. Wilson, The Nuclear Fuel Cycle - From Ore to Waste. Oxford: Oxford
University Press, 1996.
[6] A. Ramanujam, et al., "Purex and Thorex Processes (Aqueous
Reprocessing)," in Encyclopedia of Materials: Science and Technology, ed
Oxford: Elsevier, 2001, pp. 7918-7924.
[7] (2010, 13-10-2010). ENS- European Nuclear Society. Available:
http://www.euronuclear.org/info/encyclopedia/p/purex-process.htm
[8] "Predisposal Management of Organic Radioactive Waste," IAEA, Technical
reports series No 427, 2004.
[9] K. Raj, Prasad, K. K., Bansal, N. K., "Radioactive waste management
practices in India," Nuclear Engineering and Design, vol. 236, pp. 914-930,
2006.
[10] C.-C. Tzeng, Kuo, Yung-Yen, Huang, Tsair-Fuh, Lin, Deng-Lain, Yu, Yuh-
Jenq, "Treatment of radioactive wastes by plasma incineration and
vitrification for final disposal," Journal of Hazardous Materials, vol. 58, pp.
207-220, 1998.
[11] "Radioactive Waste in the UK.A summary of the 2010 Inventory," NDA
Technical Report, NDA/ST/STY (11) 0005, 2011.
[12] B. Fabiano, Pastorino, R., Ferrando, M., "Distillation of radioactive liquid
organic wastes for subsequent wet oxidation," Journal of Hazardous
Materials, vol. 57, pp. 105-125, 1998.
[13] E. Y. Elizier S. , The Fourth State of Matter, 2nd ed. London: IOP Publishing
Ltd, 2001.
[14] A. Fridman, Kennedy L.A., Plasma Physics and Engineering. New York:
Taylor & Francis Inc., 2004.
[15] I. H. Kawai Y., Sato N.,Matsuda A., Uchino K., Kuzua M., Mizuno A., Ed.,
Industrial Plasma Technology - Application from Environmental to Energy
Technologies. Weinheim: WILEY-VCH Verlag GmbH & Co KGaA, 2010,
p.^pp. Pages.

64
[16] A. Fridman, Plasma Chemistry. New York: Cambridge University Press,
2008.
[17] S. M. Conrads H. , "Plasma generation and plasma sources," Plasma Sources
Science and Technology, vol. 9, p. 441, 2000.
[18] C. Tendero, Tixier C., Tristant P. ,Desmaison J. ,Leprince P., "Atmospheric
pressure plasmas: A review," Spectrochimica Acta Part B: Atomic
Spectroscopy, vol. 61, pp. 2-30, 2006.
[19] J. S. Chang, Lawless, P. A., Yamamoto, T., "Corona discharge processes,"
Plasma Science, IEEE Transactions on, vol. 19, pp. 1152-1166, 1991.
[20] S. J. Oglesby, G. B., Nichols, Electrostatic precipitation. York: Marcel
Dekker, 1978.
[21] U. Kogelschatz, "Dielectric Barrier Discharges: Their History, Discharge
Physics and Industrial Applications," Plasma Chemistry and Plasma
Processing, vol. 23, 2003.
[22] U. Kogelschatz, Eliasson, Baldur, Egli, Walter, "From ozone generators to
flat television screens: history and future potential of dielectric-barrier
discharges," Pure and Applied Chemistry, vol. 71, pp. 1819-1828, 1999.
[23] E. B. a. E. W. Konelschatz U., "Dielectric-Barrier Discharges. Principle and
Applications," Journal De Physique IV, vol. 7, pp. 47-66, 1997.
[24] U. Kogelschatz, "Filamentary, patterned, and diffuse barrier discharges,"
Plasma Science, IEEE Transactions on, vol. 30, pp. 1400-1408, 2002.
[25] H. H. Kim, "Nonthermal Plasma Processing for Air-Pollution Control: A
Historical Review, Current Issues, and Future Prospects," Plasma Processes
and Polymers, vol. 1, pp. 91-110, 2004.
[26] G. Fridman, Dobrynin, D., Kalghatgi, S., Brooks, A. D., Friedman, G.,
Fridman, A., "Physical and biological mechanisms of plasma interaction with
living tissue," in Plasma Science - Abstracts, 2009. ICOPS 2009. IEEE
International Conference on, 2009, pp. 1-1.
[27] V. N. Vasilets, Gutsol A.,Shekhter A. B.,Fridman A., "Plasma medicine,"
High Energy Chemistry, vol. 43, pp. 229-233, 2009/05/01 2009.
[28] H. L. Chen, Lee H.M., Chen S. H., "Review of Packed-Bed Plasma Reactor
for Ozone Generation and Air Pollution Control," Industrial & Engineering
Chemistry Research, vol. 47, pp. 2122-2130, 2008/04/01 2008.
[29] K. Takaki, Chang J. S., Kostov K. G., "Atmospheric pressure of nitrogen
plasmas in a ferroelectric packed bed barrier discharge reactor. Part I.
Modeling," Dielectrics and Electrical Insulation, IEEE Transactions on, vol.
11, pp. 481-490, 2004.
[30] H.-H. Kim, Kobara H., Ogata, A. Futamura, S., "Comparative assessment of
different nonthermal plasma reactors on energy efficiency and aerosol
formation from the decomposition of gas-phase benzene," IEEE Transactions
onIndustry Applications, vol. 41, pp. 206-214, 2005.
[31] H. Lesueur, Czernichowski, A, Chapelle, J. , "Dispositif de génération de
plasma basse température par formation de décharges électriques glissantes,"
French Patent 2, 639, 172, 1988.
65
[32] A. Czernichowski, Czernichowski I., Chapelle J., Fouillac C., Lesueur H. ,
"Process for the electrochemical treatment of an hydrogen sulfide containing
gas," European Patent 0394141, 1990.
[33] A. Czernichowski, "Gliding arc: Applications to engineering and
environment control," Pure Appl. Chem., vol. 66, pp. 1301-1310, 1994.
[34] A. Charamel, Czernichowski A., Gorius A. , "Process for plasma-chemical
transformation of N2O into NOx and into derivatives " U.S. Patent 5,711,859,
1998.
[35] P. Czernichowski, Czernichowski A., "Conversion of hydrocarbons assisted
by gliding electric arcs," European Patent, OA10872, 2001.
[36] A. Czernichowski, "Gliding arc: Applications to engineering and
environment control," Pure Appl. Chem., vol. 66, pp. 1301-1310, 1994.
[37] F. Depenyou Jr, Doubla, A., Laminsi, S., Moussa, D., Brisset, J. L., Le
Breton, J. M., "Corrosion resistance of AISI 1018 carbon steel in NaCl
solution by plasma-chemical formation of a barrier layer," Corrosion Science,
vol. 50, pp. 1422-1432, 2008.
[38] K. Schmidt-Szałowski, Krawczyk, Krzysztof, Młotek, Michał, "Catalytic
Effects of Metals on the Conversion of Methane in Gliding Discharges,"
Plasma Processes and Polymers, vol. 4, pp. 728-736, 2007.
[39] Y. Kusano, Norrman Kion, Drews Joanna, Leipold Frank, Singh Shailendra
Vikram, Morgen Per, Bardenshtein Alexander, Krebs Niels, "Gliding arc
surface treatment of glass-fiber-reinforced polyester enhanced by ultrasonic
irradiation," Surface and Coatings Technology, vol. 205, Supplement 2, pp.
S490-S494, 2011.
[40] J. L. Brisset, Moussa, D., Doubla, A., Hnatiuc, E., Hnatiuc, B., Youbi, G. K.,
Herry, J. M., Naitali, M., Bellon-Fontaine, M. N., "Chemical reactivity of
discharges and temporal post-discharges in plasma treatment of aqueous
media: Examples of gliding discharge treated solutions," Industrial &
Engineering Chemistry Research, vol. 47, pp. 5761-5781, Aug 2008.
[41] A. Fridman, Nester S., Kennedy L. A., Saveliev A., Mutaf-Yardimci O.,
"Gliding arc gas discharge," Progress in Energy and Combustion Science,
vol. 25, pp. 211-231, 1998.
[42] A. Czernichowski, Nassar H., Ranaivosoloarimanana A., Fridman A. A.,
Simeek M., Musiol K., Pawelec E. and Dittrichova L. , "Spectral and
electrical diagnostics of gliding arc," Acta Physica Polonica A vol. 89 pp.
559-568, 1996.
[43] O. Mutaf-Yardimci, Saveliev A.V. Fridman A. A., Kennedy L. A., "Thermal
and nonthermal regimes of gliding arc discharge in air flow," Journal of
Applied Physics, vol. 87, pp. 1632-1641, Feb 2000.
[44] L. Delair, J. L. Brisset and B. G. Cheron, "Spectral, electrical and dynamic
analysis of a 50 Hz gliding arc discharge," Journal of High Temperature
Material Processes vol. 5, pp. 381-403, 2001.
[45] A. Czernichowski, "Gliding Discharge Reactor for H2S Valorization or
Destruction," in Non-Thermal Plasma Techniques for Pollution Control. vol.

66
34, B. Penetrante and S. Schultheis, Eds., ed: Springer Berlin Heidelberg,
1993, pp. 371-387.
[46] I. Rusu, Cormier, J-M., "Study of a rotarc plasma reactor stability by means
of electric discharge frequency analysis," International Journal of Hydrogen
Energy, vol. 28, pp. 1039-1043, 2003.
[47] C. S. Kalra, Young I. C., A. Gutsol1, A. Fridman, and T.S. Rufael, "Gliding
arc in tornado using a reverse vortex flow " Review Of Scientific Instruments,
76, vol. 76, p. 025110, 2005.
[48] J. Diatczyk, G. Komarzyniec, and H. D. Stryczewska, "Power Consumption
of Gliding Arc Discharge Plasma Reactor," International Journal of Plasma
Environmental Science & Technology, vol. 5, 2011.
[49] H. H. Kim, "Nonthermal Plasma Processing for Air-Pollution Control: A
Historical Review, Current Issues, and Future Prospects," Plasma Processes
and Polymers, vol. 1, pp. 91-110, 2004.
[50] B. Eliasson and U. Kogelschatz, "Nonequilibrium volume plasma chemical
processing," Plasma Science, IEEE Transactions on, vol. 19, pp. 1063-1077,
1991.
[51] G. A. Piech, Boffard, John B., Gehrke, Mark F., Anderson, L. W., Lin, Chun
C., "Measurement of Cross Sections for Electron Excitation out of the
Metastable Levels of Argon," Physical Review Letters, vol. 81, pp. 309-312,
1998.
[52] V. Guerra, P, A. Sá, J. Loureiro, "Role played by the N2 (A 3 Σ u+) metastable
in stationary N2 and N2 -O2 discharges," Journal of Physics D: Applied
Physics, vol. 34, p. 1745, 2001.
[53] S. V. Pancheshnyi, Starikovskaia, S. M., Starikovskii, A. Yu, "Collisional
deactivation of N2(C3Πu, v=0, 1, 2, 3) states by N2, O2, H2 and H2O
molecules," Chemical Physics, vol. 262, pp. 349-357, 2000.
[54] R. W. B. Pearse, A.G. Gaydon, The identification of molecular spectra, 4th
ed. London: Chapman and Hall, 1976.
[55] A. Bogaerts, "Hybrid Monte Carlo — Fluid model for studying the effects of
nitrogen addition to argon glow discharges," Spectrochimica Acta Part B:
Atomic Spectroscopy, vol. 64, pp. 126-140, 2009.
[56] A. Lofthus, P. H Krupenie, "The spectrum of molecular nitrogen," Journal of
Physical and Chemical Reference Data vol. 6, 1977.
[57] R. J. Buenker, Peyerimhoff, Sigrid D., Perić, Miljenko, "AB initio vibrational
analysis of the Schumann—Runge bands and the neighboring absorption
region of molecular oxygen," Chemical Physics Letters, vol. 42, pp. 383-389,
1976.
[58] G. Herzberg, “Spectra of Diatomic Molecules”, 2nd edition ed. New York:
Van Nostrand Reinhold Company 1950.
[59] B. M. Penetrante, Bardsley J.N. ,Hsiao M.C., "Kinetic Analysis of Non-
Thermal Plasmas Used for Pollution Control," Japanese Journal of Applied
Physics, vol. Part 1, No. 36, pp. 5007-50017, 1997.
67
[60] B. M. H. Penetrante, M. C., Bardsley, J. N., Merritt, B. T., Vogtlin, G. E.,
Wallman, P. H., Kuthi, A., Burkhart, C. P.,Bayless, J. R., "Electron beam and
pulsed corona processing of volatile organic compounds and nitrogen
oxides," in Pulsed Power Conference, 1995. Digest of Technical Papers.,
Tenth IEEE International, 1995, pp. 144-149 vol.1.
[61] P. Bruggeman, C., Leys, "Non-thermal plasmas in and in contact with
liquids," Journal of Physics D: Applied Physics, vol. 42, p. 053001, 2009.
[62] P. Šunka, "Pulse electrical discharges in water and their applications,"
Physics of Plasmas, vol. 8, pp. 2587-2594, 2001.
[63] H. Akiyama, "Streamer discharges in liquids and their applications," IEEE
Transactions on Dielectrics and Electrical Insulation, vol. vol.7, pp. 646-653,
2000.
[64] B. Peter and L. Christophe, "Non-thermal plasmas in and in contact with
liquids," Journal of Physics D: Applied Physics, vol. 42, p. 053001, 2009.
[65] J. Janca, et al., "Investigation of the Chemical Action of the Gliding and
“Point” Arcs Between the Metallic Electrode and Aqueous Solution," Plasma
Chemistry and Plasma Processing, vol. 19, pp. 53-67, 1999.
[66] P. Lukes and B. R. Locke, "Degradation of Substituted Phenols in a Hybrid
Gas−Liquid Electrical Discharge Reactor," Industrial & Engineering
Chemistry Research, vol. 44, pp. 2921-2930, 2005.
[67] B. R. Locke, Sato, M., Sunka, P., Hoffmann, M. R., Chang, J. S.,
"Electrohydraulic discharge and nonthermal plasma for water treatment,"
Industrial & Engineering Chemistry Research, vol. 45, pp. 882-905, Feb
2006.
[68] M. Muhammad Arif, et al., "Water purification by electrical discharges,"
Plasma Sources Science and Technology, vol. 10, p. 82, 2001.
[69] H. Wang, et al., "Decoloration of azo dye by a multi-needle-to-plate high-
voltage pulsed corona discharge system in water," Journal of Electrostatics,
vol. 64, pp. 416-421, 2006.
[70] J. Shi, Bian, Wenjuan, Yin, Xiangli, "Organic contaminants removal by the
technique of pulsed high-voltage discharge in water," Journal of Hazardous
Materials, vol. 171, pp. 924-931, 2009.
[71] A. T. Sugiarto and M. Sato, "Pulsed plasma processing of organic compounds
in aqueous solution," Thin Solid Films, vol. 386, pp. 295-299, 2001.
[72] Y. Yang, et al., "Application of pulsed spark discharge for calcium carbonate
precipitation in hard water," Water Research, vol. 44, pp. 3659-3668.
[73] P. Lukes, B., R. Locke, "Plasmachemical oxidation processes in a hybrid
gas–liquid electrical discharge reactor," Journal of Physics D: Applied
Physics, vol. 38, p. 4074, 2005.
[74] J.-L. Brisset, Baghdad, Benstaali,David, Moussa, Jean, Fanmoe, Estella,
Njoyim-Tamungang, "Acidity control of plasma-chemical oxidation:
applications to dye removal, urban waste abatement and microbial
inactivation," Plasma Sources Science and Technology, vol. 20, p. 034021,
2011.

68
[75] J. Xue, Chen, Li, Wang, Honglin, "Degradation mechanism of Alizarin Red
in hybrid gas-liquid phase dielectric barrier discharge plasmas: Experimental
and theoretical examination," Chemical Engineering Journal, vol. 138, pp.
120-127, 2008.
[76] Y. S. Mok, Jo, Jin- O., Whitehead, J. Christopher, "Degradation of an azo dye
Orange II using a gas phase dielectric barrier discharge reactor submerged in
water," Chemical Engineering Journal, vol. 142, pp. 56-64, 2008.
[77] M. Magureanu, Piroi, Daniela, Mandache, Nicolae Bogdan, David, Victor,
Medvedovici, Andrei, Parvulescu, Vasile I., "Degradation of pharmaceutical
compound pentoxifylline in water by non-thermal plasma treatment," Water
Research, vol. 44, pp. 3445-3453, 2010.
[78] J. Z. Zhang, Zheng Zhang, Yinni Feng, Jingwei Li, Jihong, "Low-temperature
plasma-induced degradation of aqueous 2,4-dinitrophenol," Journal of
Hazardous Materials, vol. 154, pp. 506-512, 2008.
[79] M. Malik, "Water Purification by Plasmas: Which Reactors are Most Energy
Efficient?," Plasma Chemistry and Plasma Processing, vol. 30, pp. 21-31,
2010/02/01 2010.
[80] V. Parvulescu, M. Magureanu, P. Lukes Plasma Chemistry and Catalysis in
Gases and Liquids. Weinheim, Germany: Wiley-VCH, 2012.
[81] A. H. Sharbaugh, Devins, J. C. Rzad, S. J., "Progress in the Field of Electric
Breakdown in Dielectric Liquids," Electrical Insulation, IEEE Transactions
on, vol. EI-13, pp. 249-276, 1978.
[82] H. Suhr, "Application of nonequilibrium plasmas in organic chemistry,"
Plasma Chemistry and Plasma Processing, vol. 3, pp. 1-61, 1983/03/01 1983.
[83] H. Suhr, "Applications and trends of nonequilibrium plasma chemistry with
organic and organometallic compounds," Plasma Chemistry and Plasma
Processing, vol. 9, pp. 7S-28S, 1989/03/01 1989.
[84] H. Suhr, Schmid, H., Pfeundschuh, H., Lacocca, D., "Plasma oxidation of
liquids," Plasma Chemistry and Plasma Processing, vol. 4, pp. 285-295,
1984.
[85] P. Patiño, Sánchez, N., Suhr, H., Hernández, N., "Reactions of
Nonequilibrium Oxygen Plasmas with Liquid Olefins," Plasma Chemistry
and Plasma Processing, vol. 19, pp. 241-254, 1999.
[86] G. O. Prieto, M. Shimano, K. Takashima, K. Katsura, S. Mizuno, A. Prieto,
O. Gay, C. R., "Heavy oil conversion by plasma chemical reactors," in
Industry Applications Conference, 1999. Thirty-Fourth IAS Annual Meeting.
Conference Record of the 1999 IEEE, 1999, pp. 1144-1149 vol.2.
[87] G. O. Prieto, M. Shimano, K. Takashima, K. Katsura, S. Mizuno, A.,
"Reforming of heavy oil using nonthermal plasma," Industry Applications,
IEEE Transactions on, vol. 37, pp. 1464-1467, 2001.
[88] G. O. Prieto, M. Takashima, K. Mizuno, A. Prieto, O. Gay, C. R., "A plate-
to-plate plasma reactor as a fuel processor for hydrogen-rich gas production,"
in Industry Applications Conference, 2001. Thirty-Sixth IAS Annual Meeting.
Conference Record of the 2001 IEEE, 2001, pp. 1099-1102 vol.2.
69
[89] Y. Matsui, et al., "Liquid-Phase Fuel Re-forming at Room Temperature
Using Nonthermal Plasma," Energy & Fuels, vol. 19, pp. 1561-1565,
2005/07/01 2005.
[90] S. M. P. Thagard, G. Takashima, K. Mizuno, A. , "Identification of Gas-
Phase By-Products Formed During Electrical Discharges in Liquid Fuels,"
Plasma Science, IEEE Transactions on, vol. 40, pp. 2106-2111, 2012.
[91] M. A. Malik, Hughes, D., Malik, A., Xiao, S., Schoenbach, K. H., "Study of
the production of hydrogen and light hydrocarbons by spark discharges in
diesel, kerosene, gasoline, and methane," Plasma Chemistry and Plasma
Processing, vol. 33, pp. 271-279, 2013.
[92] N. R. Hooshmand, Mohammad Reza Jahanmiri, Abdolhosein Taghvaei,
Hamed Mohamadzadeh Shirazi, Meisam, "Hexadecane Cracking in a Hybrid
Catalytic Pulsed Dielectric Barrier Discharge Plasma Reactor," Industrial &
Engineering Chemistry Research, vol. 52, pp. 4443-4449, 2013/03/27 2013.
[93] H. J. Taghvaei, Abdolhosien Rahimpour, Mohammad Reza Shirazi, Meisam
Mohamadzadeh, Hooshmand, Navid, "Hydrogen production through plasma
cracking of hydrocarbons: Effect of carrier gas and hydrocarbon type,"
Chemical Engineering Journal, vol. 226, pp. 384-392, 2013.
[94] M. R. B. Khani, S. H. R. Yaghmaee, M. S. Hosseini, S. I. Shariat, M. Shokri,
B. Fakhari, A. R. Nojavan, S. Tabani, H. Ghaedian, M., "Investigation of
Cracking by Cylindrical Dielectric Barrier Discharge Reactor on the n-
Hexadecane as a Model Compound," Plasma Science, IEEE Transactions on,
vol. 39, pp. 1807-1813, 2011.
[95] T. Paulmier and L. Fulcheri, "Use of non-thermal plasma for hydrocarbon
reforming," Chemical Engineering Journal, vol. 106, pp. 59-71, 2005.
[96] D. Moussa and J. L. Brisset, "Disposal of spent tributylphosphate by gliding
arc plasma," Journal of Hazardous Materials, vol. 102, pp. 189-200, Aug
2003.
[97] S. Pascal, et al., "Plasma chemical degradation of phosphorous-containing
warfare agents simulants," Journal of Hazardous Materials, vol. 175, pp.
1037-1041.
[98] D. Moussa, et al., "Plasma-Chemical Destruction of Trilaurylamine Issued
from Nuclear Laboratories of Reprocessing Plants," Industrial & Engineering
Chemistry Research, vol. 45, pp. 30-33, 2005.
[99] F. Abdelmalek, et al., "Plasmachemical degradation of azo dyes by humid air
plasma: Yellow Supranol 4 GL, Scarlet Red Nylosan F3 GL and industrial
waste," Water Research, vol. 38, pp. 2339-2347, 2004.
[100] F. Abdelmalek, et al., "Gliding Arc Discharge (GAD) assisted catalytic
degradation of bisphenol A in solution with ferrous ions," Separation and
Purification Technology, vol. 63, pp. 30-37, 2008.
[101] R. Burlica, Kirkpatrick, Michael J., Finney, Wright C. Clark, Ronald J.
Locke, Bruce R., "Organic dye removal from aqueous solution by glidarc
discharges," Journal of Electrostatics, vol. 62, pp. 309-321, 2004.
70
[102] R. Burlica and et al., "Bacteria Inactivation Using Low Power Pulsed Gliding
Arc Discharges with Water Spray," Plasma Processes and Polymers, p. n/a.
[103] R. Burlica, et al., "Formation of reactive species in gliding arc discharges
with liquid water," Journal of Electrostatics, vol. 64, pp. 35-43, 2006.
[104] C. Du, et al., "Degradation of 4-Chlorophenol using a Gas–Liquid Gliding
Arc Discharge Plasma Reactor," Plasma Chemistry and Plasma Processing,
vol. 27, pp. 635-646, 2007.
[105] C. M. Du and H. H. Yan, "Electrical and spectral characteristics of a hybrid
gliding arc discharge in air-water," Ieee Transactions on Plasma Science, vol.
35, pp. 1648-1650, Dec 2007.
[106] A. B. Doubla, J. L. Moussa, D. Hnatiuc, E. Burlica, R., "Destruction of
alkaline cyanides by electric discharges," Research Journal of Chemistry and
Environment, vol. 11, pp. 92-95, Mar 2007.
[107] A. B. B. Doubla, L. Fotso, M. Brisset, J. L., "Plasmachemical decolourisation
of Bromothymol Blue by gliding electric discharge at atmospheric pressure,"
Dyes and Pigments, vol. 77, pp. 118-124, 2008.
[108] A. A. Doubla, F. Khelifa, K. Addou, A. Brisset, J. L., "Post-discharge
plasma-chemical oxidation of iron(II) complexes," Journal of Applied
Electrochemistry, vol. 33, pp. 73-77, Jan 2003.
[109] K. Krawczyk, Ulejczyk, Bogdan, "Influence of Water Vapor on CCl4 and
CHCl3 Conversion in Gliding Discharge," Plasma Chemistry and Plasma
Processing, vol. 24, pp. 155-167, 2004/06/01 2004.
[110] R. Burlica, Kirkpatrick, Michael J., Locke, Bruce R., "Formation of reactive
species in gliding arc discharges with liquid water," Journal of Electrostatics,
vol. 64, pp. 35-43, 2006.
[111] R. Burlica, Locke, B. R., "Pulsed Plasma Gliding-Arc Discharges With Water
Spray," Industry Applications, IEEE Transactions on, vol. 44, pp. 482-489,
2008.

71
Chapter 2
2. Analytical Techniques
2.1 Introduction
This chapter aims to give a background on the main analytical techniques used in this
work. These were Fourier Transform Infrared (FTIR) spectroscopy, Optical Emission
Spectroscopy (OES) spectroscopy, the combined Gas Chromatography and Mass
Spectroscopy (GC-MS) technique and Flash Colum Chromatography. The following
sessions will present a short description of the principles and the operating conditions
that were used for each technique, while further description of the experimental set-
ups used are given separately in the next chapters.
2.2 Fourier Transform Infrared (FTIR) Spectroscopy
FTIR absorption spectroscopy has been used in this work for the quantitative and
qualitative gaseous analysis using real time in-line sampling system, as well as for
qualitative characterisation of off-line liquid samples. The next sections will present
a background on the principles of IR spectroscopy, instrumentation and methods
used.
2.2.1 Outline of Basic Spectroscopy
Spectroscopy is the study of interaction between electromagnetic radiation and
matter studied as a function of frequency (v), or wavelength (λ). According to the
quantisation of energy, the energies of various forms of motions in atoms and
molecules are limited to certain discrete values, those which correspond to the so-
called stationary states. When an atomic or molecular system absorbs or emits light,
the system goes from one quantised energy level to another. The Bohr frequency
condition states that the difference in the energy level must equal the energy of the
light absorbed or emitted:
ΔΕ = h v Equation 2.1
where, h = 6.626 x 10⁻³⁴
J s, the Planck constant, v = frequency (s-1
), E = energy (J)
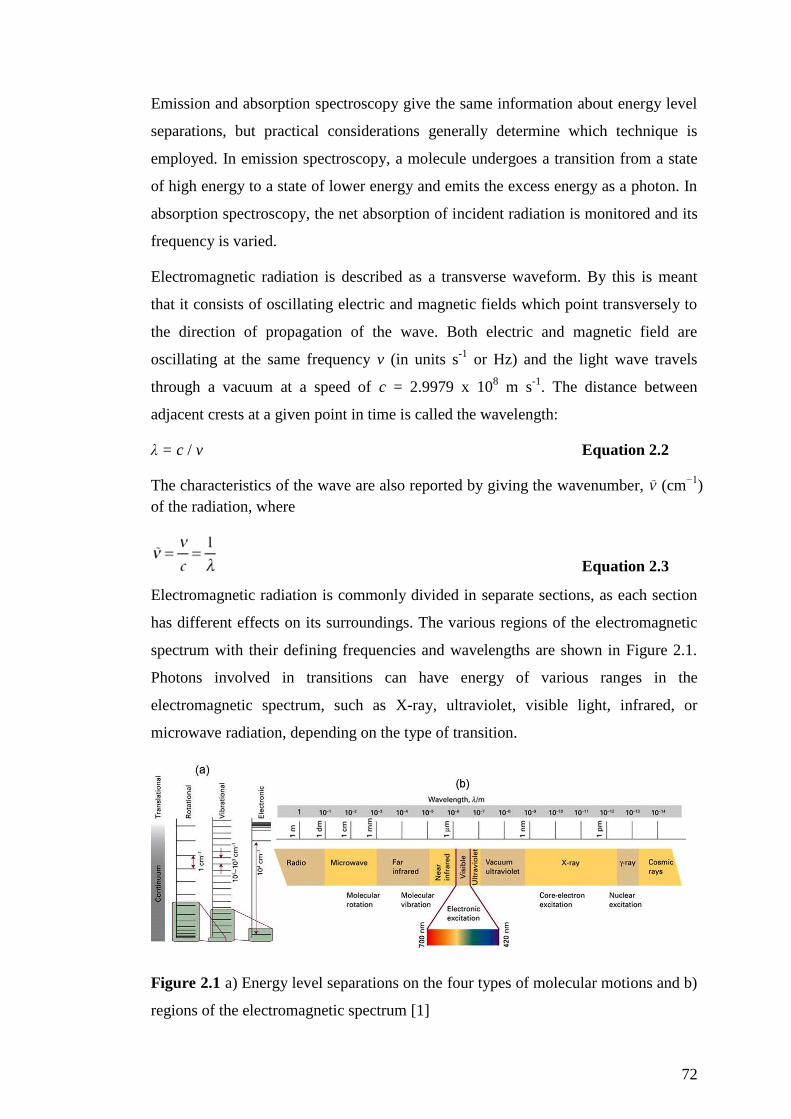
72
Emission and absorption spectroscopy give the same information about energy level
separations, but practical considerations generally determine which technique is
employed. In emission spectroscopy, a molecule undergoes a transition from a state
of high energy to a state of lower energy and emits the excess energy as a photon. In
absorption spectroscopy, the net absorption of incident radiation is monitored and its
frequency is varied.
Electromagnetic radiation is described as a transverse waveform. By this is meant
that it consists of oscillating electric and magnetic fields which point transversely to
the direction of propagation of the wave. Both electric and magnetic field are
oscillating at the same frequency v (in units s-1
or Hz) and the light wave travels
through a vacuum at a speed of c = 2.9979 x 10⁸ m s
-1. The distance between
adjacent crests at a given point in time is called the wavelength:
λ = c / v Equation 2.2
The characteristics of the wave are also reported by giving the wavenumber, (cm−1
)
of the radiation, where
Equation 2.3
Electromagnetic radiation is commonly divided in separate sections, as each section
has different effects on its surroundings. The various regions of the electromagnetic
spectrum with their defining frequencies and wavelengths are shown in Figure 2.1.
Photons involved in transitions can have energy of various ranges in the
electromagnetic spectrum, such as X-ray, ultraviolet, visible light, infrared, or
microwave radiation, depending on the type of transition.
Figure 2.1 a) Energy level separations on the four types of molecular motions and b)
regions of the electromagnetic spectrum [1]
73
Translational energy levels are practically continuous and can be calculated as
kinetic energy using classical mechanics. An energy unit often used in spectroscopy
is eV, the amount of energy an electron acquires when it is has been accelerated
through a potential of 1 V. A table of conversion factors for energy units is given in
Appendix I.
2.2.2 Principles of IR spectroscopy
Infrared (IR) spectrometers have been used and developed since 1800 when Sir
William Herschel did the first experiment passing sunlight through a prism in his
laboratory [2]. IR spectroscopy today is one of the most common spectroscopic
techniques used by organic and inorganic chemists. Spectra of gaseous, liquid and
solid samples can all be measured and so functional group information can be
gathered easily with no special sample-handling techniques. More profound
information of the molecular structure can be also obtained in the high resolution
gaseous analysis. This section will focus mainly on the gaseous IR analysis as it
constitutes the majority of the analysis used in this work.
Infrared radiation is divided into three subsections of far IR (13,000 – 4,000 cm–1
),
mid IR (4,000 – 200 cm-1
) and near IR (200 – 10 cm–1
). The mid IR is the most
frequently used, also used in conventional FTIR spectrometers (4000 – 400 cm-1
). In
this range, vibrational transitions of a molecule can be observed. When dealing with
vibrational spectra of polyatomics, the gross selection rule is that the normal mode of
vibration must result in a change of dipole moment for that mode to be IR active [1,
2]. When the frequency of a specific vibration is equal to the frequency of the IR
radiation directed on the molecule, the molecule absorbs the radiation, causing a a
higher amplitude vibration and rotation until de-excitation happens. Different IR
frequencies correspond to different types of vibrations. Each atom has three degrees
of freedom, corresponding to motions along any of the three Cartesian coordinate
axes (x, y, z). A polyatomic molecule of n atoms has 3n total degrees of freedom.
However, 3 degrees of freedom are required to describe the translation, of the entire
molecule through space and 3 or 2 additional degrees of freedom to describe the
rotation of a non-linear or linear molecule, respectively. Therefore, the remaining 3n
– 6 degrees of freedom are true, fundamental vibrations for non-linear molecules,
where linear molecules possess 3n – 5 fundamental vibrational modes. Among these

74
fundamental vibrations (also known as normal modes of vibration), those that
produce a net change in the dipole moment may result in an IR activity. However
some vibrations leave the net dipole moment unchanged (e.g. symmentric stretching)
corresponding to IR inactive modes. Major types of vibrations are stretching and
bending and typical examples of carbon dioxide and water gas molecules are given in
Figure 2.2 and 2.3. More complex polyatomics can exhibit bending, rocking or
wagging. Figure 2.4 depicts the vibrational modes of two atoms attached in a
stationary one, as in the case of a hydrocarbon.
Figure 2.2 Normal modes of vibration of CO2 A: Symmetric stretching (IR inactive),
B: antisymmetric stretching, C: in plane deformation, D: out of plane deformation (C
and D result in same frequency, the so-called two-fold degenerate deformation
vibration [3]).
Figure 2.3 Normal vibrational modes of water
Figure 2.4 Vibrational modes of two atoms attached on a stationary atom
75
2.2.3 FTIR spectrometer components
The basic instrumentation of an IR absorption spectrometer includes the radiation
source, the dispersive element and the detector. Early IR spectrometers introduced in
the mid 1940’s are the dispersive spectrometers. They use a monochromator as a
dispersive element that separates light it into different frequencies. The intensity of
radiation at each frequency is then analysed by a suitable detector. Fourier transform
spectrometers have recently replaced dispersive instruments for most applications
due to their superior speed and sensitivity. Instead of viewing each component
frequency sequentially, as in a dispersive IR spectrometer, all frequencies are
examined simultaneously in Fourier transform infrared (FTIR) spectroscopy (the
Multiplex or Felgett Advantage).
Common radiation sources that could be used for both dispersive and FT
spectrometers are the Plank (or black-body) radiator, thermal radiator, Nerst rod and
high pressure lamp. Common reference source is the He-Ne laser that can produce
two lines in the mid-IR (1.152 μm and 3.391 μm) that cannot be detuned easily [2].
Instead of a monochromator in dispersive spectrometers, FTIR spectrometers use an
interferometer. After the radiation is emitted, the beam enters the interferometer
where spectral splitting takes place allowing a wavelength dependent radiation
modulation. The most common and widely used type of interferometer is the
Michelson interferometer. The Michelson interferometer consists of two mutually
perpendicular plane mirrors. One can move either at a constant velocity or is held at
equidistant points for fixed short time periods and rapidly stepped between these
points. Between the fixed and moveable mirror there is the beamsplitter. The IR
beam from the source reaches the beamsplitter where is split into two partial beams
that are reflected on the fixed mirror and on the movable mirror back to the
beamsplitter where they recombine and are brought to interfere. A shift of the
movable mirror changes the optical pathlength into the interferometer. That results in
a phase difference between both partial beams, hence a change of the interference
amplitude happens. The intensity signal from the detector, as a function of the
change of the optical pathlength corrected by a constant component, is called an
interferogram. After the interference, the IR modulated beam enters the sample
compartment where specific frequencies of energy unique to the sample, are
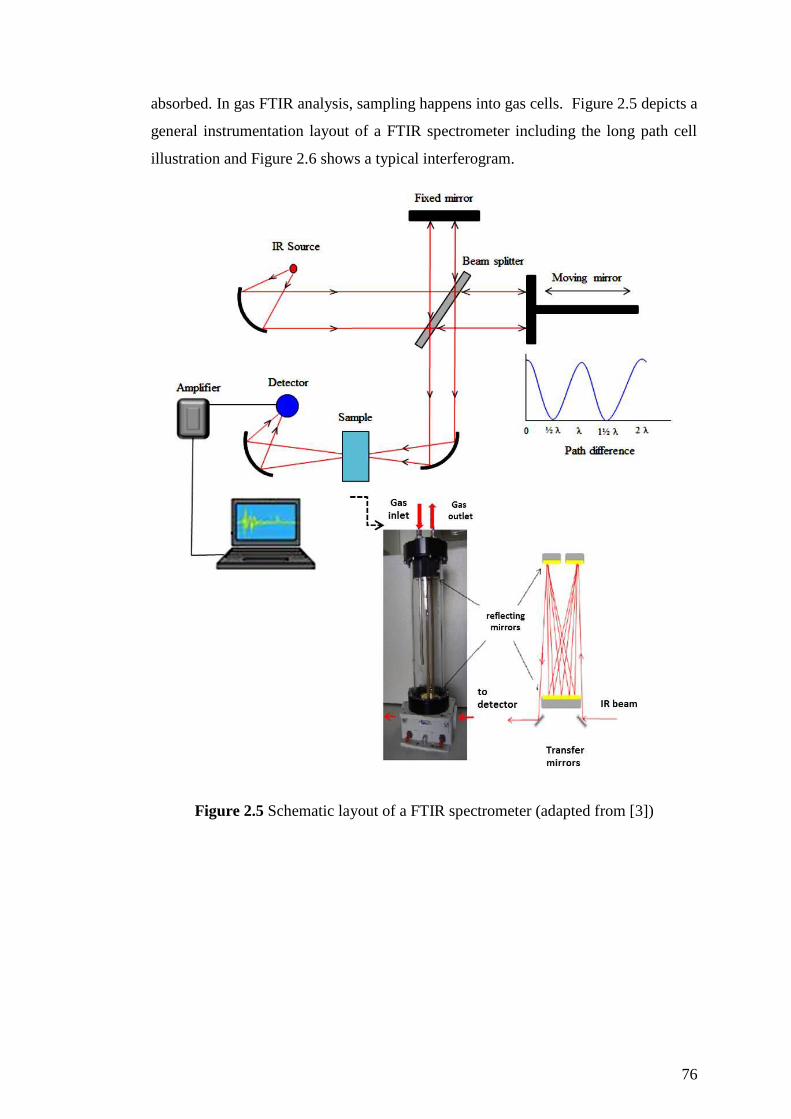
76
absorbed. In gas FTIR analysis, sampling happens into gas cells. Figure 2.5 depicts a
general instrumentation layout of a FTIR spectrometer including the long path cell
illustration and Figure 2.6 shows a typical interferogram.
Figure 2.5 Schematic layout of a FTIR spectrometer (adapted from [3])

77
Figure 2.6 A typical interferogram and the single beam spectrum after the Fourier
Transform (adapted from [2])
The gas cell used in this work was a Specac Tornado T5 long path 1.3 L cylindrical
borosilicate cell using gold coated mirrors and KBr windows. Within the cell, the
beam is deflected by a plane mirror horizontally by 90 and reflected back and forth
many times until it finally leaves the cell exit KBr window having travelled a defined
pathlength of 5 m. Long pathlengths can increase sensitivity, as the longer the
pathlength at a fixed concentration the more molecules the IR beam passes through.
However they might also cause considerable radiation loses, that is why most
frequently used pathlengths are up to 10 m. After the long path gas cell, the beam
finally passes to the detector for final measurement. The measured signal is
digitalised and sent to the computer where the mathematical Fourier transformation
takes place. The final infrared spectrum is then presented to the user for
interpretation and any further manipulation.
FTIR spectrometers do not require slits to achieve resolution and therefore they can
succeed high spectral resolution with a much higher throughput compared to
dispersive spectrometers. In FTIR, the spectral resolution is determined by the
maximum achievable optical path difference between the two parallel beams in the
interferometer. The bigger the optical path difference results in a longer
interferogram, thus more data points present to allow higher resolution. High
resolution reduces spectral overlap allowing the detection of narrow absorbance
peaks at specific frequencies. However, high resolution spectra require longer
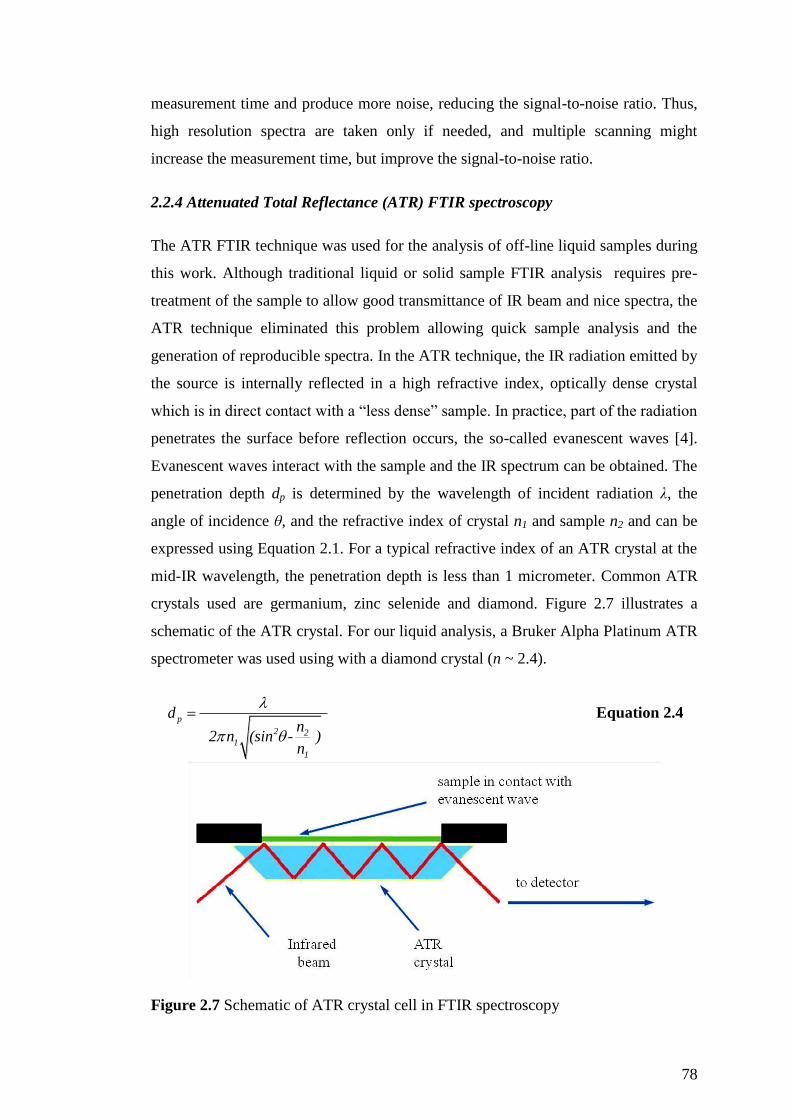
78
measurement time and produce more noise, reducing the signal-to-noise ratio. Thus,
high resolution spectra are taken only if needed, and multiple scanning might
increase the measurement time, but improve the signal-to-noise ratio.
2.2.4 Attenuated Total Reflectance (ATR) FTIR spectroscopy
The ATR FTIR technique was used for the analysis of off-line liquid samples during
this work. Although traditional liquid or solid sample FTIR analysis requires pre-
treatment of the sample to allow good transmittance of IR beam and nice spectra, the
ATR technique eliminated this problem allowing quick sample analysis and the
generation of reproducible spectra. In the ATR technique, the IR radiation emitted by
the source is internally reflected in a high refractive index, optically dense crystal
which is in direct contact with a “less dense” sample. In practice, part of the radiation
penetrates the surface before reflection occurs, the so-called evanescent waves [4].
Evanescent waves interact with the sample and the IR spectrum can be obtained. The
penetration depth dp is determined by the wavelength of incident radiation λ, the
angle of incidence θ, and the refractive index of crystal n1 and sample n2 and can be
expressed using Equation 2.1. For a typical refractive index of an ATR crystal at the
mid-IR wavelength, the penetration depth is less than 1 micrometer. Common ATR
crystals used are germanium, zinc selenide and diamond. Figure 2.7 illustrates a
schematic of the ATR crystal. For our liquid analysis, a Bruker Alpha Platinum ATR
spectrometer was used using with a diamond crystal (n ~ 2.4).
p
2 21
1
dn
2 n (sin - ) n
Equation 2.4
Figure 2.7 Schematic of ATR crystal cell in FTIR spectroscopy

79
2.2.4 Qualitative and Quantitative Analysis Using FTIR Spectroscopy
The gaseous analysis of the plasma processing end-products has been performed
using a FTIR spectrometer (Shimadzu 8300). Analysis can be both qualitative and
quantitative and methods are described in the following sections.
Qualitative analysis in IR spectroscopy is mainly used in two ways, structural
elucidation and compound identification. Structural elucidation is possible, as many
functional groups give characteristic IR absorption at specific, narrow frequency
ranges, regardless of their relationship with the rest of the molecule. This method is
routinely used in organic chemistry and characteristic group frequencies are well
given in literature. Figure 2.8 shows the regions of mid-IR, in which functional
groups absorb. However, spectral interpretations should not be confined to one or
two bands and the whole spectrum should be examined. To confirm or gain more
information of an unknown substance, other analytical information provided by
nuclear magnetic resonance (NMR), mass spectrometry (MS), or other chemical
analysis should also be used where possible. Furthermore, compound identification
can be more easily achieved by using a reference IR spectrum that matches that of
the unknown compound. A large number of reference spectra for vapour and
condensed phases are available in printed and electronic formats.
Figure 2.8 Regions of IR functional groups

80
Quantitative analysis in FTIR spectroscopy follows Beer-Lambert law. Using the
Beer-Lambert law the absorbance can be converted to concentration [4]:
A CL Equation 2.5
where, A = absorbance, ε = molar absorption coefficient which is constant for a
specific compound, C = sample concentration, L = optical pathlength of absorbance
In this work, compound identification and quantitative analysis was performed using
the gaseous IR reference spectra from the QASoft database by Infrared Analysis Inc
[5]. Bruker’s Opus 4.2 software was used for the interpretation of the experimental
IR spectra and comparison with the reference. Measuring the absorbance peak
heights of specific bands at characteristic frequencies the concentration of the
compound can be obtained according to the equations below. The reference spectrum
of dodecane is given as an example of the calculation as shown in Figure 2.9.
Figure 2.9 The dodecane reference spectrum with major absorbance peaks
annotated. Dodecane reference concentration is Co = 100 ppm, mixed in N2 at
pressure 1atm. The optical pathlength is Lo = 1 m and the spectral resolution is
1 cm-1
.
For a known compound reference spectrum the absorbance of a characteristic peak at
specific frequency is:
81
o o oA C L Equation 2.6
In case of dodecane, at specific frequency 2863cm-1
the absorbance is Ao = 0.1176,
Co = 100 ppm, Lo = 1 m
The concentration value of dodecane in an experimental sample spectrum under the
same spectral conditions can be obtained using the following equations:
s s sA C L Equation 2.7
Where, the optical pathlength in the long path cell used was Ls= 5 m
Equations 2.6 and 2.7 can give Equation 2.8and finally Equation 2.9:
o o o
s s s
A C L
A C L , Equation 2.8
100
0.1176 5
ss
AC
Equation 2.9
Using the Equation 2.9 relationship between the dodecane concentration and its
absorbance, the same method is used for the quantitative analysis of the plasma
processing gaseous end-products using the reference QASoft database.
2.2.5 Operating Conditions
A Shimadzu 8300 FTIR spectrometer was mainly used for the experimental
measurements and a Bio-Rad 4000 FTIR spectrometer was used for the work
described in Chapter 5. The operating conditions are summarised in Table 2.1.
FTIR Spectrometer Cell Pathlength Resolution
Shimadzu 8300 SpecacTornado T5, 1.3 L 5 m 1cm-1
Bio-Rad 4000
Excalibur series
Infrared Analysis Inc
Mini series 6-PA, 0.5 L
6 m
1 cm-1
Table 2.1 Operating conditions of the FTIR spectrometers used

82
In all cases the measurements were in-line with the gas sample flowing continuously
through the gas cell. The sampling temperature is laboratory temperature at 24 ◦C and
pressure is atmospheric. Considering the nature of the gas sample which consists of
narrow peaks, a high resolution of 1 cm-1
was necessary in all measurements. In
order to improve the signal to noise ratio (S/N) 10 multiple scans were used and the
spectrometer automatically gives the average spectrum of the sample. The standard
deviation in concentration values was calculated from 5 repetitive samples in each
case.
2.3 Optical Emission Spectroscopy (OES)
2.3.1 Introduction
Optical emission spectroscopy (OES) is commonly employed in the diagnosis of
laboratory plasmas and it was also used in this work, in both gaseous and plasma-
liquid treatment. A short introduction to the technique is given below.
Atomic or molecular emission is based upon the emission of light upon the relaxation
of an electron from an excited state of an atom or molecule. In plasma emission
spectroscopy, light emitted from the plasma itself is recorded. One of the basic
underlying processes is the excitation of particles (atoms, molecules, ions) by
electron impact and the decay by spontaneous emission. The intensity of emission
line is correlated with the particle density in the excited state [6].
2.3.2 OES Instrumentation
The basic components of a spectrometer are the entrance slit, the wavelength
dispersion element, the imaging mirrors and the exit slit equipped with a detector. A
monochromator uses a prism as the dispersive element and the slits at fixed positions
where the prism needs to be rotated to change wavelength. Spectrographs use
diffraction grating as the dispersive element in a fixed position, and the angle of
diffraction varies with the wavelength. The principle of the spitting of a wide range
spectral region into numerous sub-spectra by a classic ruled grating is described by
the grating equation (Equation 2.10) and illustrated in Figure 2.10 [7]. The
relationship between an incident and a diffracted parallel light beam for a grating is:
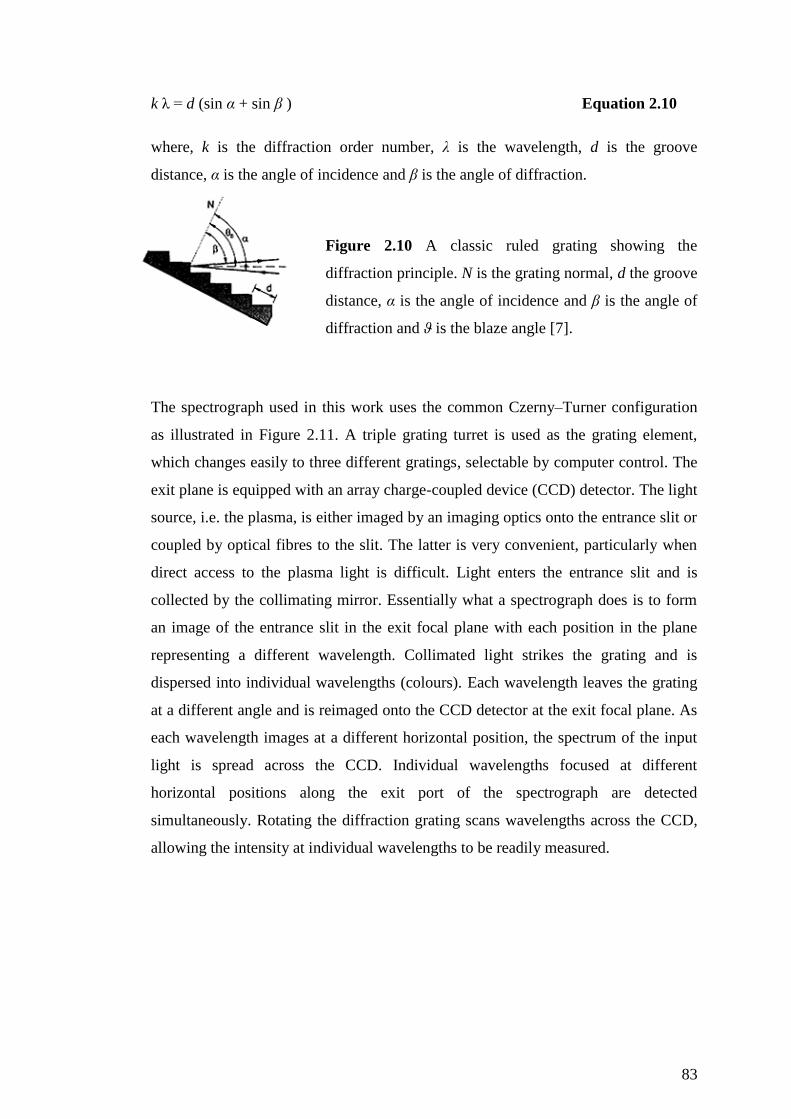
83
k λ = d (sin α + sin β ) Equation 2.10
where, k is the diffraction order number, λ is the wavelength, d is the groove
distance, α is the angle of incidence and β is the angle of diffraction.
Figure 2.10 A classic ruled grating showing the
diffraction principle. N is the grating normal, d the groove
distance, α is the angle of incidence and β is the angle of
diffraction and ϑ is the blaze angle [7].
The spectrograph used in this work uses the common Czerny–Turner configuration
as illustrated in Figure 2.11. A triple grating turret is used as the grating element,
which changes easily to three different gratings, selectable by computer control. The
exit plane is equipped with an array charge-coupled device (CCD) detector. The light
source, i.e. the plasma, is either imaged by an imaging optics onto the entrance slit or
coupled by optical fibres to the slit. The latter is very convenient, particularly when
direct access to the plasma light is difficult. Light enters the entrance slit and is
collected by the collimating mirror. Essentially what a spectrograph does is to form
an image of the entrance slit in the exit focal plane with each position in the plane
representing a different wavelength. Collimated light strikes the grating and is
dispersed into individual wavelengths (colours). Each wavelength leaves the grating
at a different angle and is reimaged onto the CCD detector at the exit focal plane. As
each wavelength images at a different horizontal position, the spectrum of the input
light is spread across the CCD. Individual wavelengths focused at different
horizontal positions along the exit port of the spectrograph are detected
simultaneously. Rotating the diffraction grating scans wavelengths across the CCD,
allowing the intensity at individual wavelengths to be readily measured.

84
Figure 2.11 a) A general and b) a more detailed schematic of the OES spectrograph
with the Czerny–Turner diffraction configuration and the CCD detector [9]
The CCD refers to a semiconductor ( usually silica oxide) matrix array that charge is
collected, transferred and converted into measurable voltage [8]. In principle, they
are consisted of many single pixels in arrays, which generate photoelectrons and
transport them by vertical and horizontal shifting to the read-out amplifier [7, 8].
CCDs have various applications in imaging and they are considered ideal detectors in
spectroscopy, due to their mechanical accuracy and photometric performance.
2.3.3 Operating conditions
A Princeton 320PI spectrograph was used for the optical emission spectroscopy
measurements of various plasma conditions in this work and the operating conditions
are given in below.
Princeton 320PI CCD spectrograph
Wavelength range 200-850 nm
grating 150gr/mm 600gr/mm 2400gr/mm
resolution 0.52nm 0.13nm 0.02nm
Muti-mode quartz optical fibre
Numerical Aperture (NA) 0.37
Optical field diameter 2.4 cm
Table 2.2 Operating conditions of the OES plasma spectroscopy used in this work
85
2.4 Gas Chromatography and Mass spectroscopy (GC-MS)
2.4.1 Gas Chromatography
Gas chromatography is the type of chromatography where the mobile phase is a gas.
Separation occurs by partitioning gaseous samples between a carrier gas and a
stationary phase. The gas chromatograph enables a small amount of sample (gas or
vaporised liquid) to be introduced into an inlet system where it is vaporised and
passed into a column. The column is held within an oven and a flow of the inert
carrier gas passes through it. A detector is fitted to the column exit to monitor the
eluted and separated components. The detector creates the electrical signal which is
amplified and sent to the recording or data-processing device, from which results can
be obtained [10].
Different gas species pass through the column at different rates depending on the
strength of interactions with the walls of the column. This causes the gas mixture to
become separated into individual components that reach the end of the column and are
detected at different times. By measuring the retention time of each species in the
column, the component gases can be identified either by comparison with
chromatograms for known species or coupled with an identification technique (e.g. GC-
MS). Retention times are affected by the gas concentration, flow rate and pressure as
well as the column material and temperature [11], therefore selection of appropriate
column materials and operating conditions are critical for resolution of the gas mixture.
Common carrier gases are usually high purity inert gases like helium, nitrogen, or
argon, normally determined by the detector used. GC columns originally consisted of a
tube containing a packing of solid support material with various liquid or solid coatings
depending on the type of mixture being separated. Most GCs now use capillary columns,
which offer several advantages over packed columns. The stationary phase is coated
uniformly on the inside of a capillary eliminating problems associated with uneven
packing. They are made of a flexible material so that longer lengths can be wound into
compact coils that allow for a better resolution of the separated gas mixture.
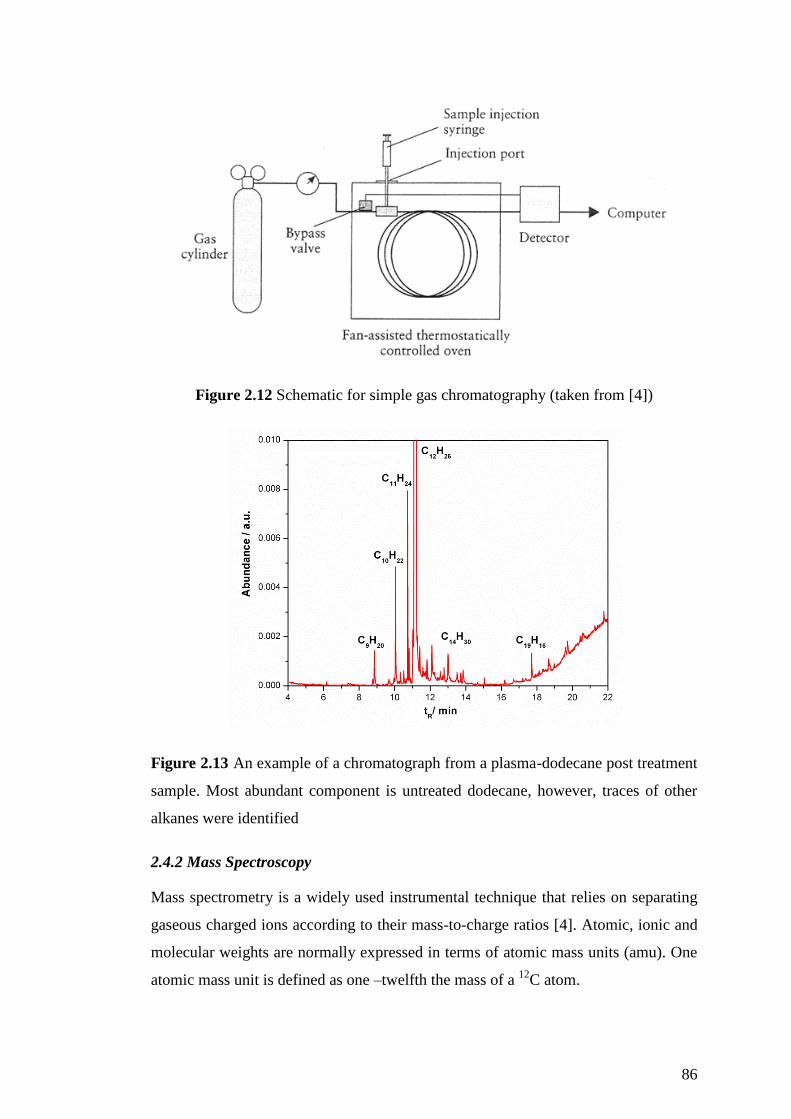
86
Figure 2.12 Schematic for simple gas chromatography (taken from [4])
Figure 2.13 An example of a chromatograph from a plasma-dodecane post treatment
sample. Most abundant component is untreated dodecane, however, traces of other
alkanes were identified
2.4.2 Mass Spectroscopy
Mass spectrometry is a widely used instrumental technique that relies on separating
gaseous charged ions according to their mass-to-charge ratios [4]. Atomic, ionic and
molecular weights are normally expressed in terms of atomic mass units (amu). One
atomic mass unit is defined as one –twelfth the mass of a 12
C atom.
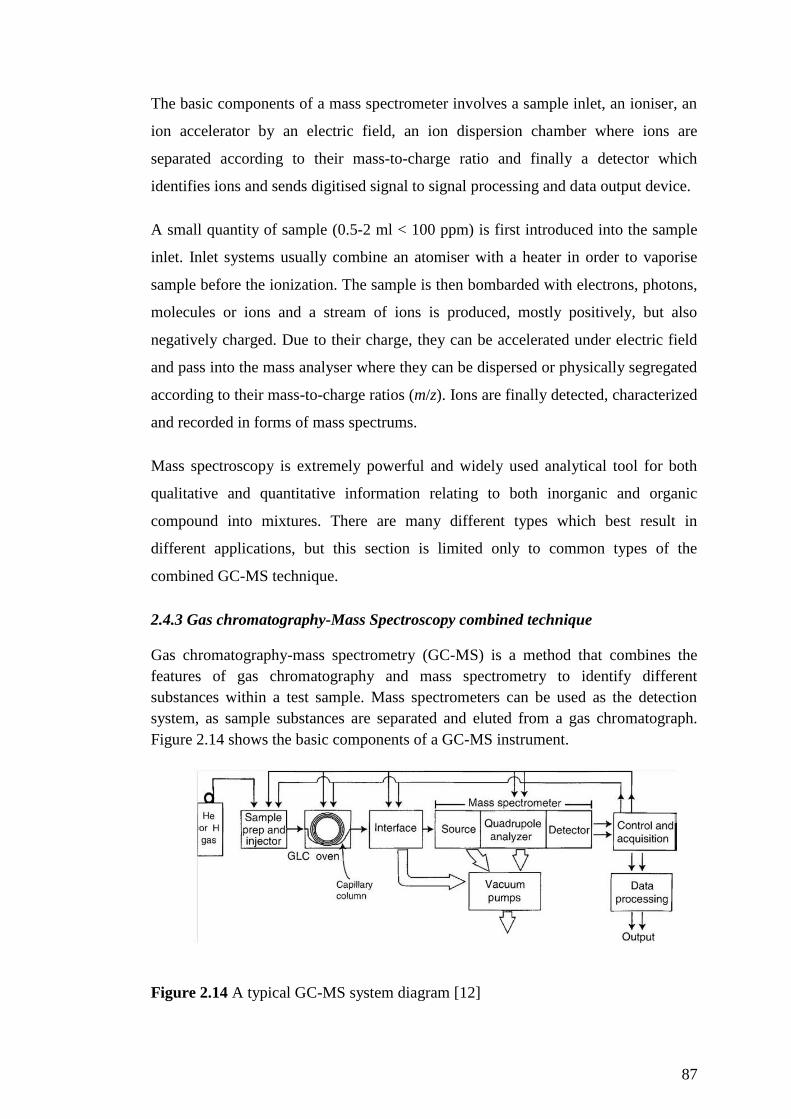
87
The basic components of a mass spectrometer involves a sample inlet, an ioniser, an
ion accelerator by an electric field, an ion dispersion chamber where ions are
separated according to their mass-to-charge ratio and finally a detector which
identifies ions and sends digitised signal to signal processing and data output device.
A small quantity of sample (0.5-2 ml < 100 ppm) is first introduced into the sample
inlet. Inlet systems usually combine an atomiser with a heater in order to vaporise
sample before the ionization. The sample is then bombarded with electrons, photons,
molecules or ions and a stream of ions is produced, mostly positively, but also
negatively charged. Due to their charge, they can be accelerated under electric field
and pass into the mass analyser where they can be dispersed or physically segregated
according to their mass-to-charge ratios (m/z). Ions are finally detected, characterized
and recorded in forms of mass spectrums.
Mass spectroscopy is extremely powerful and widely used analytical tool for both
qualitative and quantitative information relating to both inorganic and organic
compound into mixtures. There are many different types which best result in
different applications, but this section is limited only to common types of the
combined GC-MS technique.
2.4.3 Gas chromatography-Mass Spectroscopy combined technique
Gas chromatography-mass spectrometry (GC-MS) is a method that combines the
features of gas chromatography and mass spectrometry to identify different
substances within a test sample. Mass spectrometers can be used as the detection
system, as sample substances are separated and eluted from a gas chromatograph.
Figure 2.14 shows the basic components of a GC-MS instrument.
Figure 2.14 A typical GC-MS system diagram [12]

88
Electron ionisation (EI) and chemical ionization (CI) are the two most widely used
ionisation techniques in GC-MS. In this work both EI and CI ionisation was used for
the GC-MS samples, in order to obtain complementary information.
EI is produced by accelerating electrons from a hot filament through a potential
difference, usually of 70 eV. Organic molecules that eluted from a GC column will
be ionised and fragmented. The initial product of EI is a radical cation, resulting
from the removal of one electron from the analyte molecule. This cation is called
molecular ion (M+•
) and provides the molecular weight of the substance, whereas
smaller pieces of the analyte molecule are called fragment ions. EI method is a well
understood method that can create reproducible spectra. The fragmentation provides
useful structural information for the analyte and there are available mass spectra
libraries where compounds can be identified based of their EI “fingerprint”.
Limitations of this method are that the analyte must be volatile and stable and the
M+•
is frequently weak or absent from spectra. Usually, CI is used instead of EI to
provide molecular weights in GC-MS work.
The CI method uses ion-molecule reactions to produce ions from the analyte. The
chemical ionization process begins when a reagent gas such as methane or ammonia
is ionised by electron impact. A high reagent gas pressure (or long reaction time)
results in ion-molecule reactions between the reagent gas ions and reagent gas
neutrals. Some of the products of these ion-molecule reactions can react with the
analyte molecules to form ions. Advantages of this method are that molecular weight
information of the analyte can be obtained with the molecular-like ions such as
[M-H]+
- even when EI cannot produce a M
+• - and the limited fragmentation creates
simple spectra. Limitations are that the analyte must be thermally volatile and stable
and that spectra are not reproducible enough to allow library searches. The final mass
spectra depend on the reagent gas type, reagent gas pressure or reaction time, and
nature of the sample.
Figure 2.15 shows an example of 1-dodecanol mass spectrum via EI and CI
approaches.

89
Figure 2.15 Mass spectrum for 1-decanol via a) chemical ionisation and b) electron
impact ionisation methods [4]
GC-MS instruments most commonly employ quadrupole mass filters, magnetic
sectors analyzers or ion trap detector as mass analyzers. A brief description of
quadrupole mass filters is given below, as it was applied in this work.
The quadrupole consists of four parallel metal rods of hyperbolic or circular cross-
section. A radio frequency (RF) potential and DC voltage is connected opposite pairs
of rods. Ions are injected into the oscillating electric field by a small accelerating
voltage (10-20 V) and undergo complex oscillations. Mass separation is achieved by
varying (scanning) the voltages on the quadrupole rods, while keeping the RF/DC
ratio constant. Only ions of a certain m/z will reach the detector for a given ratio of
voltage while other will collide with the rods. At any one point in the scan only one
mass can pass through the system. A scheme of a quadrupole mass analyzer is given
in Figure 2.16.
Figure 2.16 Schematic of a quadrupole mass analyser [4]
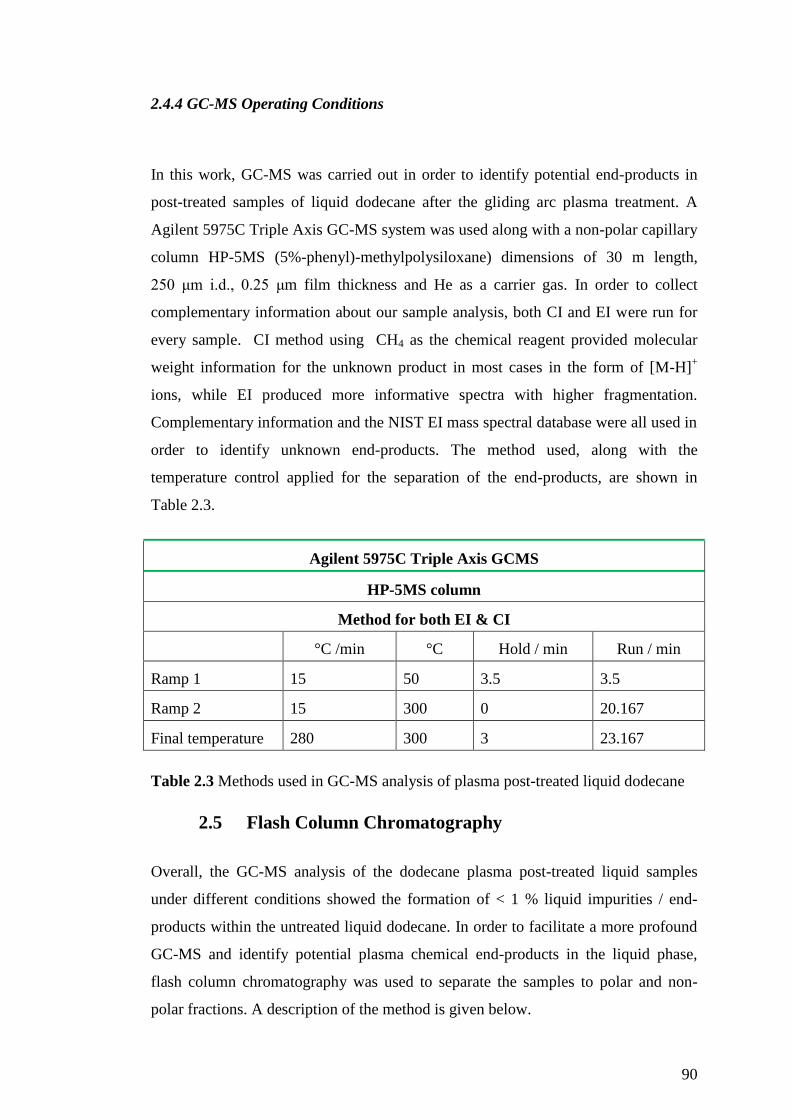
90
2.4.4 GC-MS Operating Conditions
In this work, GC-MS was carried out in order to identify potential end-products in
post-treated samples of liquid dodecane after the gliding arc plasma treatment. A
Agilent 5975C Triple Axis GC-MS system was used along with a non-polar capillary
column HP-5MS (5%-phenyl)-methylpolysiloxane) dimensions of 30 m length,
250 μm i.d., 0.25 μm film thickness and He as a carrier gas. In order to collect
complementary information about our sample analysis, both CI and EI were run for
every sample. CI method using CH4 as the chemical reagent provided molecular
weight information for the unknown product in most cases in the form of [M-H]+
ions, while EI produced more informative spectra with higher fragmentation.
Complementary information and the NIST EI mass spectral database were all used in
order to identify unknown end-products. The method used, along with the
temperature control applied for the separation of the end-products, are shown in
Table 2.3.
Agilent 5975C Triple Axis GCMS
HP-5MS column
Method for both EI & CI
°C /min °C Hold / min Run / min
Ramp 1 15 50 3.5 3.5
Ramp 2 15 300 0 20.167
Final temperature 280 300 3 23.167
Table 2.3 Methods used in GC-MS analysis of plasma post-treated liquid dodecane
2.5 Flash Column Chromatography
Overall, the GC-MS analysis of the dodecane plasma post-treated liquid samples
under different conditions showed the formation of < 1 % liquid impurities / end-
products within the untreated liquid dodecane. In order to facilitate a more profound
GC-MS and identify potential plasma chemical end-products in the liquid phase,
flash column chromatography was used to separate the samples to polar and non-
polar fractions. A description of the method is given below.
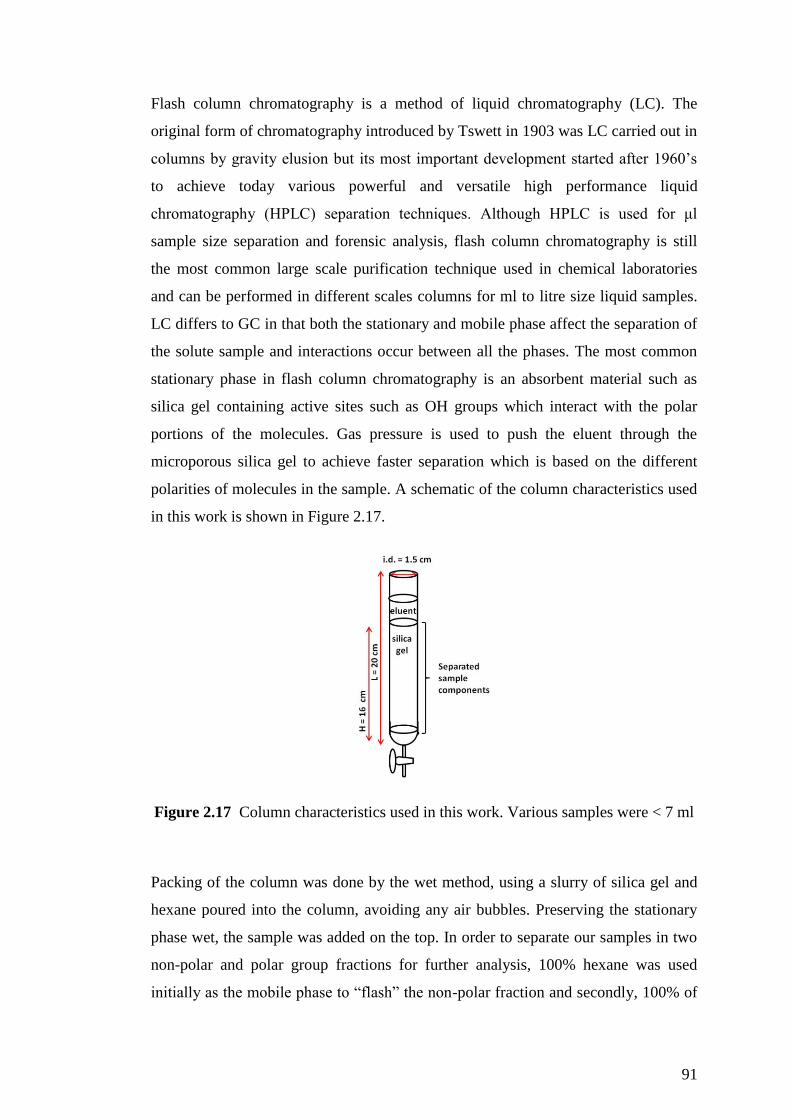
91
Flash column chromatography is a method of liquid chromatography (LC). The
original form of chromatography introduced by Tswett in 1903 was LC carried out in
columns by gravity elusion but its most important development started after 1960’s
to achieve today various powerful and versatile high performance liquid
chromatography (HPLC) separation techniques. Although HPLC is used for μl
sample size separation and forensic analysis, flash column chromatography is still
the most common large scale purification technique used in chemical laboratories
and can be performed in different scales columns for ml to litre size liquid samples.
LC differs to GC in that both the stationary and mobile phase affect the separation of
the solute sample and interactions occur between all the phases. The most common
stationary phase in flash column chromatography is an absorbent material such as
silica gel containing active sites such as OH groups which interact with the polar
portions of the molecules. Gas pressure is used to push the eluent through the
microporous silica gel to achieve faster separation which is based on the different
polarities of molecules in the sample. A schematic of the column characteristics used
in this work is shown in Figure 2.17.
Figure 2.17 Column characteristics used in this work. Various samples were < 7 ml
Packing of the column was done by the wet method, using a slurry of silica gel and
hexane poured into the column, avoiding any air bubbles. Preserving the stationary
phase wet, the sample was added on the top. In order to separate our samples in two
non-polar and polar group fractions for further analysis, 100% hexane was used
initially as the mobile phase to “flash” the non-polar fraction and secondly, 100% of
92
diethyether was used to “flash” any polar molecules from the column. The fractions
collection was monitored via the TLC technique. After evaporation of of the solvents
used, samples were collected for GC-MS analysis.
2.6 References
[1] P. Atkins, J. Paula, Atkin's Physical Chemistry, 9th ed.: Oxford University
Press, 2010.
[2] H. Gunzler, Hans-Ulrich Gremlich, IR Spectroscopy: Wiley-VCH, 2002.
[3] Z. Abd Allah, "Non-thermal atmospheric plasma for remediation of volatile
organic compounds.," in School of Chemical Engineering and Analytical
Science. vol. Doctor of Philosophy Manchester: The Univeristy of
Manchester, 2012.
[4] S. Higson, Analytical Chemistry, 3rd ed. New York: Oxford University Press
Inc, 2006.
[5] P. L. Hanst, Procedures in Infrared Analysis of Gases, Part II - Quantitative
Reference Spectra. Anaheim,California, 2005.
[6] U. Fantz, "Basics of plasma spectroscopy," Plasma Sources Science and
Technology, vol. 15, p. S137, 2006.
[7] H. Becker-Ross and S. V. Florek, "Echelle spectrometers and charge-coupled
devices," Spectrochimica Acta Part B: Atomic Spectroscopy, vol. 52, pp.
1367-1375, 1997.
[8] G. C. Holst, CCD Arrays, cameras and displays, 2nd ed. Bellingham: SPIE
Optical Engineering Press, 1996.
[9] J. M. Lerner, "Imaging spectrometer fundamentals for researchers in the
biosciences—A tutorial," Cytometry Part A, vol. 69A, pp. 712-734, 2006.
[10] P. J. Baugh, Gas Chromatography - A Practical Approach: Oxford
University Press, 1993.
[11] R. Stock, Rice, C.B.F., Chromatographic Methods. 2 ed. 1967, . London:
Chapman and Hall Ltd., 1967.
[12] M. C. McMaster, GC/MS: a practical user's guide: Interscience, 2008.
93
Chapter 3
3. Plasma-chemical degradation of vapour phase kerosene
and dodecane in an atmospheric ferroelectric packed-bed
plasma reactor
3.1 Introduction
Petroleum-based products, ranging from fuel oil and hydraulic fluid to lubricating
greases and oils, can be found in all power generating plants. Specifically in nuclear
plants, hydrocarbon oils are also used in ore purification and spent fuel reprocessing
extraction processes leading to a large amount of waste oils, normally characterised
as low level radioactive waste (LLW) [1]. Among them the most common oils used
are odourless kerosene and dodecane (C12H26). Non-thermal plasma technology
could be a promising method for the treatment of this waste as it can essentially
provide the same outcome as incineration but at low temperatures, thus providing
advantages such as lower process cost and construction simplification. In addition,
plasma systems could be produced in almost any scale for waste treatment, giving
the potential of portable plasma devices for on-site or spillage treatment. The plasma-
liquid clean-up process in its different forms involves reactions in the gas phase with
the evaporated liquid, but also reactions at an interface between the gaseous plasma
and the target liquid. The latter one takes place either as a gas-surface process or by
diffusion of the reactive species into the bulk of the liquid. Thus, it was considered
important as a first step to study the plasma degradation of the target liquid pollutant
in the gas phase, as a key for the second step, the study of the degradation
mechanism in the liquid phase.
This chapter investigates the use of a ferroelectric BaTiO3 packed bed plasma for the
plasma-chemical degradation of gaseous kerosene and dodecane, considering them
as VOCs that can be found in power plants, but also getting a forehand insight of the
gaseous degradation mechanism as necessary step applying plasma technology for
the liquid waste oil treatment.
Ferroelectric bed reactors were first developed as electrostatic precipitators [2] and
then they were widely studied for the VOC decomposition, for a variety of hazardous
94
compounds [3-7]. The most widely used ferroelectric material is barium titanate
(BaTiO3), which has a high dielectric constant of ~10 000. The advantage of the
BaTiO3 packed bed beads, is the formation of microdischarges between the short
contact distances, which significantly enhance the electrical field. Despite the fact
that the electron energy density is lower compare to the non-packed reactors [8],
ferroelectric packed bed reactors can still achieve a good efficiency for pollution
removal, as shown in numerous studies [9].
Regarding the use of ferroelectric barrier discharge reactors for hydrocarbon
destruction, Ogata and co-workers [6] have studied the destruction of methane in
nitrogen and air plasmas, while Pringle et al. [10] have extended the study with
varying oxygen concentrations and developing a model to compare the experimental
results. Futamura and co-workers have investigated the destruction of butane in dry
and humid nitrogen and air working gases [5], also presenting a more profound
investigation of the intermediates in [11]. However, there is no literature evidence of
the use of ferroelectric packed bed reactor for the treatment of longer chain
hydrocarbons.
In this work, the plasma-chemical decomposition of oil vapour was investigated in a
BaTiO3 packed bed dielectric barrier discharge reactor (PBDBD). The degradation of
kerosene and n-dodecane mixed in nitrogen and air plasmas was studied with varying
specific input energy of the reactor and end-products distribution has been measured
using FTIR spectroscopy. However, kerosene is a mixture of saturated hydrocarbons
with no defined structure (CnH2n+2, n = 9-16) which does not allow quantitative
analysis, thus, n-dodecane was used as a surrogate instead. The influence of the
varying oxygen concentration in the N2-O2 plasma gas mixture for the destruction
and end-products distribution is discussed. Optical emission spectroscopy was used
to study the plasma under different conditions, and the mechanism of the plasma-
chemical dodecane decomposition will be discussed.
3.2 Experimental Set-up
A schematic diagram of the experimental configuration is given in Figure 3.1 and
more detailed view of the reactor in Figure 3.2. The reactor used in these
experiments was an atmospheric pressure non-thermal packed bed dielectric barrier
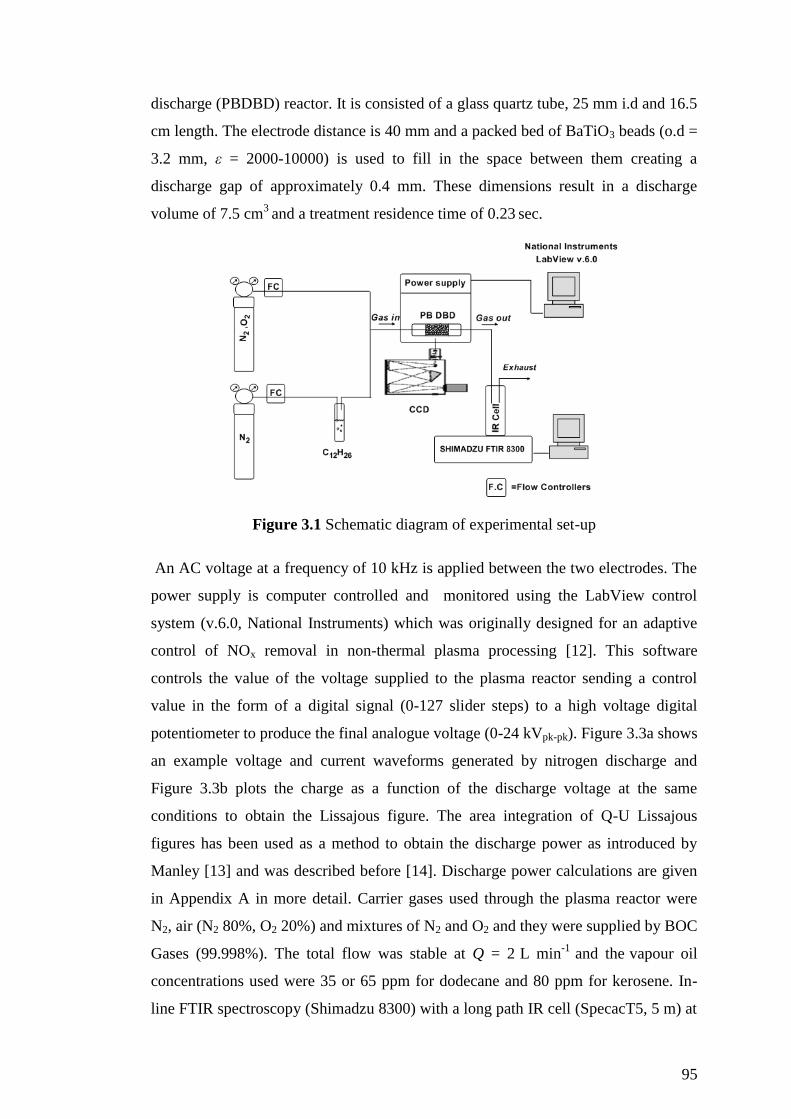
95
discharge (PBDBD) reactor. It is consisted of a glass quartz tube, 25 mm i.d and 16.5
cm length. The electrode distance is 40 mm and a packed bed of BaTiO3 beads (o.d =
3.2 mm, ε = 2000-10000) is used to fill in the space between them creating a
discharge gap of approximately 0.4 mm. These dimensions result in a discharge
volume of 7.5 cm3
and a treatment residence time of 0.23 sec.
Figure 3.1 Schematic diagram of experimental set-up
An AC voltage at a frequency of 10 kHz is applied between the two electrodes. The
power supply is computer controlled and monitored using the LabView control
system (v.6.0, National Instruments) which was originally designed for an adaptive
control of NOx removal in non-thermal plasma processing [12]. This software
controls the value of the voltage supplied to the plasma reactor sending a control
value in the form of a digital signal (0-127 slider steps) to a high voltage digital
potentiometer to produce the final analogue voltage (0-24 kVpk-pk). Figure 3.3a shows
an example voltage and current waveforms generated by nitrogen discharge and
Figure 3.3b plots the charge as a function of the discharge voltage at the same
conditions to obtain the Lissajous figure. The area integration of Q-U Lissajous
figures has been used as a method to obtain the discharge power as introduced by
Manley [13] and was described before [14]. Discharge power calculations are given
in Appendix A in more detail. Carrier gases used through the plasma reactor were
N2, air (N2 80%, O2 20%) and mixtures of N2 and O2 and they were supplied by BOC
Gases (99.998%). The total flow was stable at Q = 2 L min-1
and the vapour oil
concentrations used were 35 or 65 ppm for dodecane and 80 ppm for kerosene. In-
line FTIR spectroscopy (Shimadzu 8300) with a long path IR cell (SpecacT5, 5 m) at

96
resolution 1 cm-1
was used for the identification and concentration determination of
the gaseous products. Optical emission spectroscopy measurements occurred along
the discharge in a central and parallel position to the reactor, and by integration of a
2.4 cm diameter optical field, using a multi-mode quartz optical fibre. The
spectrograph CCD Princeton Instrument 320PI spectrograph was used, with a 150 or
600 g/mm grating (0.52 or 0.13 nm resolution) and in the range of 200 – 800 nm.
Figure 3.2 The BaTiO3 packed bed DBD reactor
Figure 3.3 An example of current and voltage waveforms during the BaTiO3 packed
bed nitrogen discharge and the Q-U plot for the calculation of discharge power per
cycle, Pd = 0.7 W. The spikes on the current waveform correspond to
microdischarges formed from the contact points between the beads and it is of
nanosecond duration.
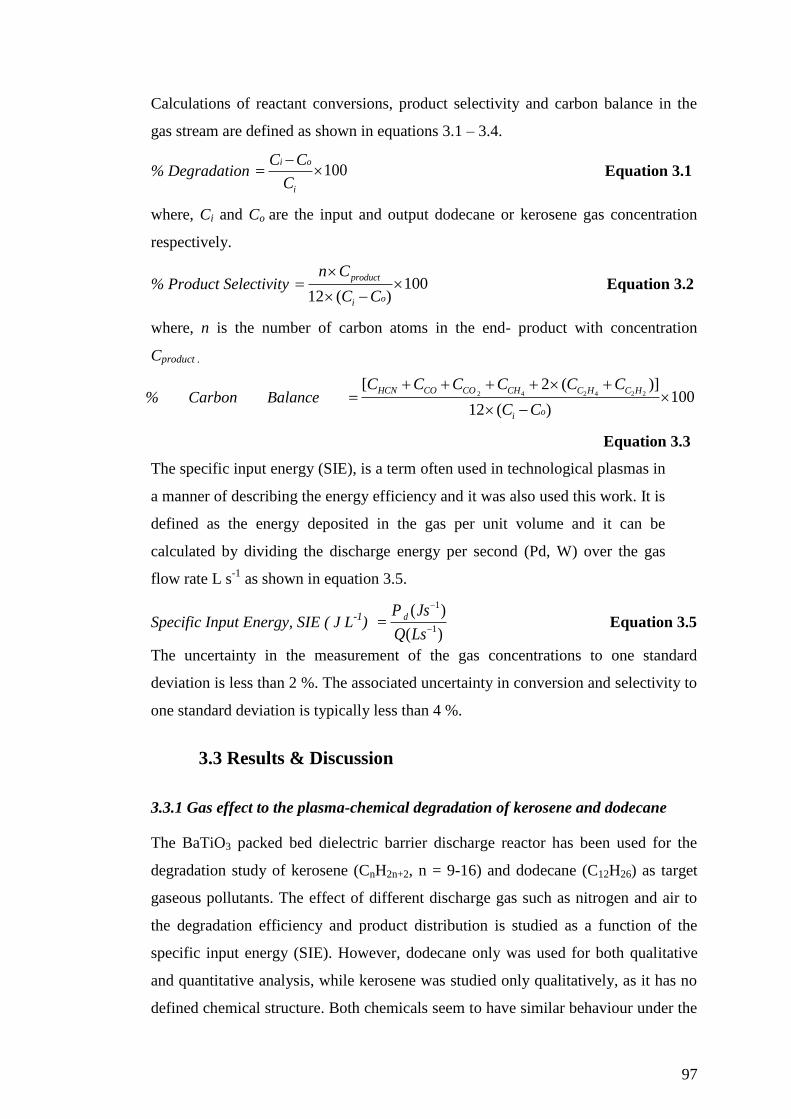
97
Calculations of reactant conversions, product selectivity and carbon balance in the
gas stream are defined as shown in equations 3.1 – 3.4.
% Degradation 100i o
i
C C
C
Equation 3.1
where, Ci and Co are the input and output dodecane or kerosene gas concentration
respectively.
% Product Selectivity 10012 ( )
product
oi
n C
C C
Equation 3.2
where, n is the number of carbon atoms in the end- product with concentration
Cproduct .
% Carbon Balance 2 4 2 4 2 2[ 2 ( )]
10012 ( )
HCN CO CO CH C H C H
oi
C C C C C C
C C
Equation 3.3
The specific input energy (SIE), is a term often used in technological plasmas in
a manner of describing the energy efficiency and it was also used this work. It is
defined as the energy deposited in the gas per unit volume and it can be
calculated by dividing the discharge energy per second (Pd, W) over the gas
flow rate L s-1
as shown in equation 3.5.
Specific Input Energy, SIE ( J L-1
)
1
1
( )
( )
dP Js
Q Ls
Equation 3.5
The uncertainty in the measurement of the gas concentrations to one standard
deviation is less than 2 %. The associated uncertainty in conversion and selectivity to
one standard deviation is typically less than 4 %.
3.3 Results & Discussion
3.3.1 Gas effect to the plasma-chemical degradation of kerosene and dodecane
The BaTiO3 packed bed dielectric barrier discharge reactor has been used for the
degradation study of kerosene (CnH2n+2, n = 9-16) and dodecane (C12H26) as target
gaseous pollutants. The effect of different discharge gas such as nitrogen and air to
the degradation efficiency and product distribution is studied as a function of the
specific input energy (SIE). However, dodecane only was used for both qualitative
and quantitative analysis, while kerosene was studied only qualitatively, as it has no
defined chemical structure. Both chemicals seem to have similar behaviour under the

98
N2 or air plasma treatment resulting in the same degradation products. The FTIR
spectra in Figure 3.4 show the degradation products observed when nitrogen and air
discharge in maximum discharge power (Pd) was applied for the treatment of
dodecane.
Figure 3.4 FTIR comparative spectra of 65 ppm dodecane when plasma was off, and
in nitrogen or air discharge at maximum power Pd = 1.4 W and SIE = 42 J L-1
.
Spectral resolution is 1 cm-1
.
Figure 3.5 shows the degradation rate as a function of the specific input energy.
Overall both dodecane and kerosene appear to have similar degradation rates with a
maximum destruction of 21%. The degradation rate increases almost linearly with
increasing energy density, which increases the generation of the active species and
promotes the chemical reactions. The degradation rate in the nitrogen discharge for
both chemicals seems higher than the air in less powerful discharges when SIE < 30 J
L-1
, but beyond that energy there is no significant influence of the different gas used.
Futamura et al. has studied the decomposition of butane in a BaTiO3 packed bed
discharge and he observed a higher decomposition efficiency in a nitrogen discharge
rather than air, especially at lower electrical field [11].
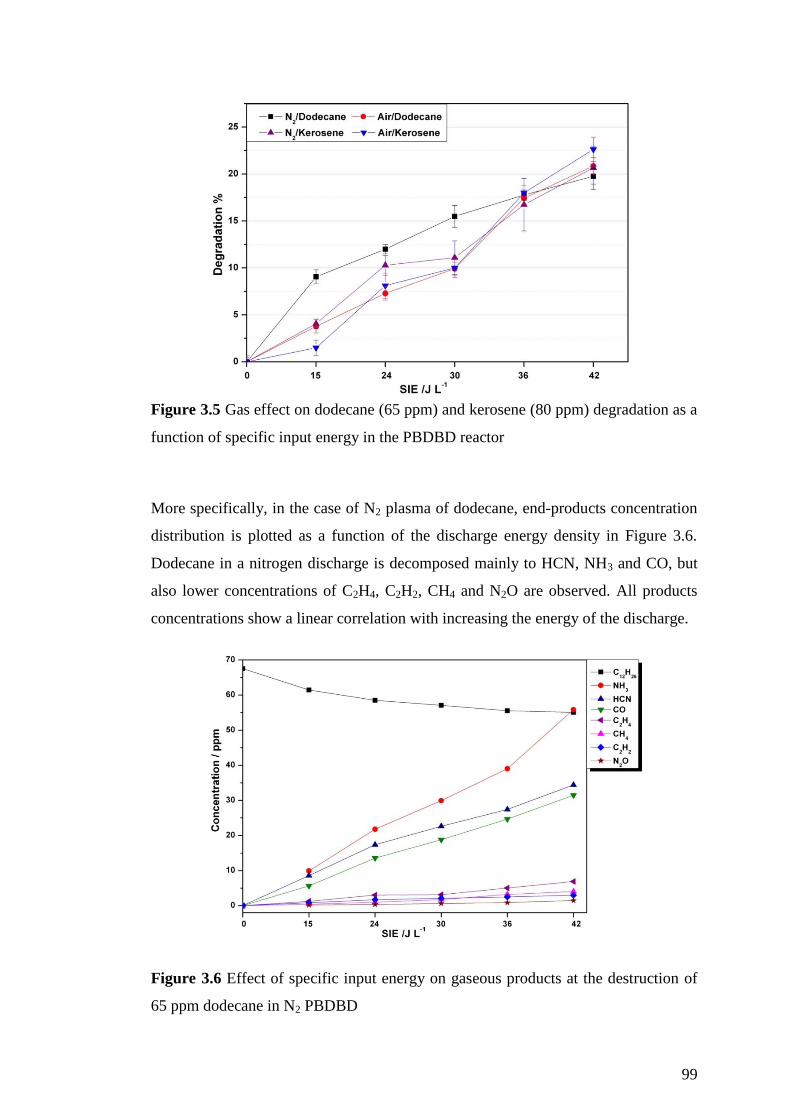
99
Figure 3.5 Gas effect on dodecane (65 ppm) and kerosene (80 ppm) degradation as a
function of specific input energy in the PBDBD reactor
More specifically, in the case of N2 plasma of dodecane, end-products concentration
distribution is plotted as a function of the discharge energy density in Figure 3.6.
Dodecane in a nitrogen discharge is decomposed mainly to HCN, NH3 and CO, but
also lower concentrations of C2H4, C2H2, CH4 and N2O are observed. All products
concentrations show a linear correlation with increasing the energy of the discharge.
Figure 3.6 Effect of specific input energy on gaseous products at the destruction of
65 ppm dodecane in N2 PBDBD
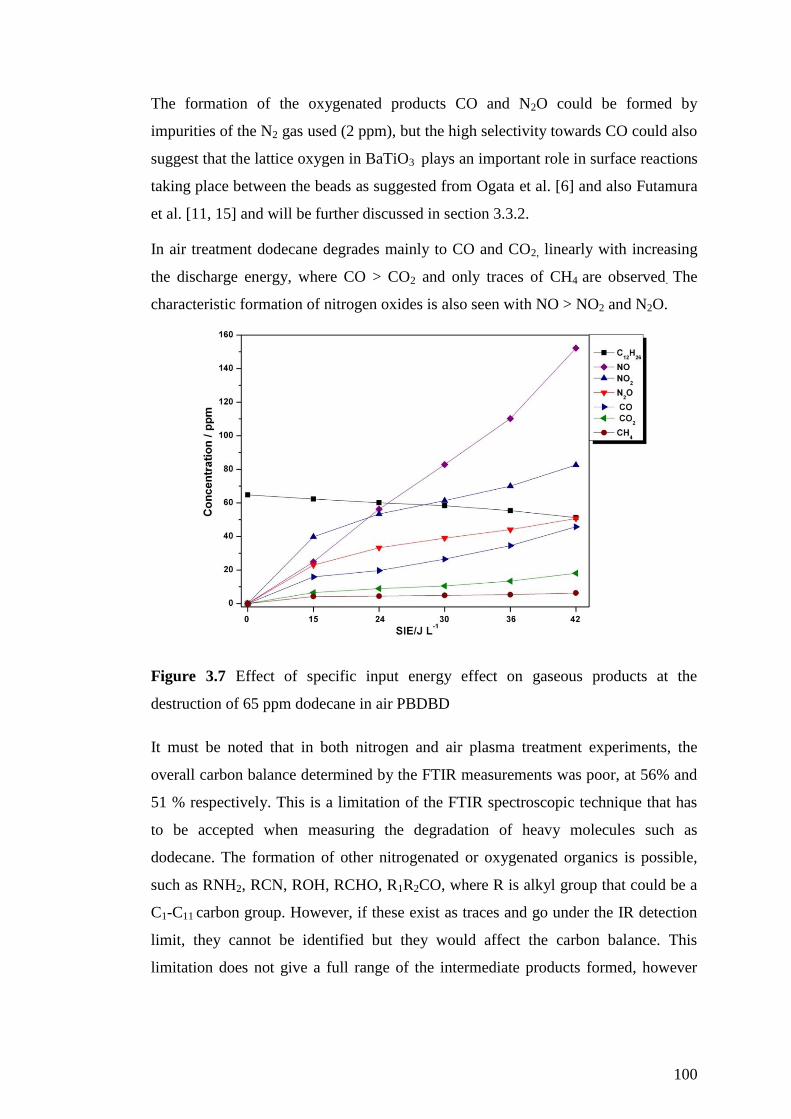
100
The formation of the oxygenated products CO and N2O could be formed by
impurities of the N2 gas used (2 ppm), but the high selectivity towards CO could also
suggest that the lattice oxygen in BaTiO3 plays an important role in surface reactions
taking place between the beads as suggested from Ogata et al. [6] and also Futamura
et al. [11, 15] and will be further discussed in section 3.3.2.
In air treatment dodecane degrades mainly to CO and CO2, linearly with increasing
the discharge energy, where CO > CO2 and only traces of CH4 are observed. The
characteristic formation of nitrogen oxides is also seen with NO > NO2 and N2O.
Figure 3.7 Effect of specific input energy effect on gaseous products at the
destruction of 65 ppm dodecane in air PBDBD
It must be noted that in both nitrogen and air plasma treatment experiments, the
overall carbon balance determined by the FTIR measurements was poor, at 56% and
51 % respectively. This is a limitation of the FTIR spectroscopic technique that has
to be accepted when measuring the degradation of heavy molecules such as
dodecane. The formation of other nitrogenated or oxygenated organics is possible,
such as RNH2, RCN, ROH, RCHO, R1R2CO, where R is alkyl group that could be a
C1-C11 carbon group. However, if these exist as traces and go under the IR detection
limit, they cannot be identified but they would affect the carbon balance. This
limitation does not give a full range of the intermediate products formed, however

101
does not affect our conclusions which are based on the major products formed and
interpretation of comparative results.
3.3.2 OES diagnostics of packed bed plasma in different gas compositions
Optical emission spectroscopy (OES) is a common diagnostic tool for low-
temperature plasma under different conditions, as it uses the intensity of the light
emitted at particular wavelengths from an electronically-excited state to calculate the
concentration of the species, rotational (Tr) and vibrational (Tv) temperature of these
species, as well as the electron temperature (Te) [16]. In this work emission spectra
were collected under different gas compositions BaTiO3 packed bed dielectric barrier
discharge such as nitrogen, air and with addition of low concentration dodecane
(~ 65 ppm). Table 3.1 compares the intermediate excited species observed by OES
with the end-products formed in each case as measured by FTIR.
PBDBD
Plasma
OES
Intermediate
species
Region/nm
Intensity
ratio
N2(2+)/N2+
(1-)
FTIR
end-
products
N2
NO-γ
N2 C3Πu -B
3Πg
( 2+)
N2+ Β
2Σu
+-X
2Σg
+
(1-)
247.8, 259.5, 272.2
315.9, 337.1, 353.6,
357.7
391.4, 427.8
12.3
(N2O)
Air
N2 C3Πu -B
3Πg
( 2+)
N2+Β
2Σu
+-X
2Σg
+
(1-)
315.9,337.1,353.6,357.7
391.4, 427.8
2.6
NO, NO2
N2O
N2/C12
NO-γ
N2 C3Πu -B
3Πg
( 2+)
N2+ Β
2Σu
+-X
2Σg
+
(1-)
СN B2Σ –X
2Σ
247.8, 259.5, 272.2
315.9,337.1,353.6,357.7
391.4, 427.8
386.1,387.1,388.3
11.3
HCN, NH3
CH4, C2H4,
C2H2
(CO, N2O)
Air/C12
N2 C3Πu - B
3Πg (
2+)
N2+ Β
2Σu
+- X
2Σg
+
(1-)
315.9,337.1,353.6,357.7
391.4, 427.8
1.78
CO,CO2,
HCN
C2H4, C2H2
NO, NO2,
N2O
*oxygenated
products
Table 3.1 Comparison of excited species and end-products in different gas mixtures
in PB DBD
102
In all spectra the characteristic second positive nitrogen N2 C→B and first negative
N2+
B → X systems are observed as are commonly formed in discharges by the
primary steps of electron impact excitation and ionisation, shown in reactions R 3.1-
3.3. The electron impact dissociation of molecular nitrogen and oxygen also occurs
as shown is reactions R 3.4 and R 3.5, however the N and O atomic lines needs high
sensitivity and resolution and they could not be detected.
R 3.1 e + N2 (X) → N2 (A) + e electron impact excitation
R 3.2 e + N2 (A) →N2+ + 2e stepwise ionisation
R 3.3 e + N2 (A) →N2 (B, C) + e stepwise excitation
R 3.4 e + N2 (X) → N (2D) + N (
2P) electron impact dissociation
R 3.5 e + O2 → e + O (3P) + O (
1D) electron impact dissociation
where, N2 (A), N (2D) or N (
2P) and O(
3P) or O(
1D) are often referred as N2
*, N
*
and O* respectively.
The intensity of N2 C→B and thus the relative concentration is much weaker in the
air discharge where oxygenated species are also formed. It is interesting to note that
the emission of NO-γ is observed in nitrogen discharge where also forms traces of
N2O as an end-product, but surprisingly not in case of air, where NO and NO2
undoubtedly exist as end-products but also N2O forms. Figure 3.8 illustrates the
emission spectra collected in case of pure nitrogen and pure air discharge with 0.52
nm resolution. A suggested explanation for the appearance of NO-γ in N2 plasma
could be due to the microdischarges and surface discharges that are formed between
the BaTiO3 beads, which could allow the energetic nitrogen metastables to interact
with the lattice oxygen species. This could lead to the formation of excited species of
NO and finally N2O as an end-product, as shown in reactions R 3.6, 3.7 and R 3.10.
R 3.6 N2* + O → NO
* + N
R 3.7 N2* + NO → NO
* +N2
R 3.8 N* + O → NO
*
R 3.9 N2* +O → N2O
R 3.10 N2* +O2 → N2O + O
*

103
Figure 3.8 Emission spectra of 0.52 nm resolution from pure N2 and air packed bed
plasma, at power Pd = 1.4 W and Q = 2 L min-1
Furthermore, the formation of N2O traces that are formed in the nitrogen discharge
could be also due to the plasma surface interaction as shown in reactions R 3.9,
R 3.10. Reaction R 3.10 was first suggested from Malcombe-Lawes [17] and studied
thoroughly from Zipf [18] in corona discharges, where he suggests that the energy-
rich metastable N2(A) molecules that can be formed efficiently with large cross
sections, can produce N2O in the stratosphere and aurora zone.
The occurrence of surface discharges and reactions has been discussed from several
researchers in the past. Tu et al. [19] discusses the transition behaviour from
filamentary microdischarges to surface discharges around the contact points between
the BaTiO3 beads. Yamamoto et al. [3] has observed the formation of Ti and Ba ions
suggesting that it is caused by local heating and energetic electron bombardment near
the contact points on the surface of BaTiO3 pellets in air discharge. Ogata et al. [6]
has suggested that lattice oxygen in BaTiO3 plays an important role in surface
reactions and to the N2O formation. A few years later, Futamura et al. [15] in an
attempt to investigate any catalytic effect of BaTiO3 to the packed bed reactor, agree
that BaTiO3 can act as monoxygenated agent and produce CO and N2O in N2 plasma,
but the contribution of this reaction is negligible under air plasma. The formation of
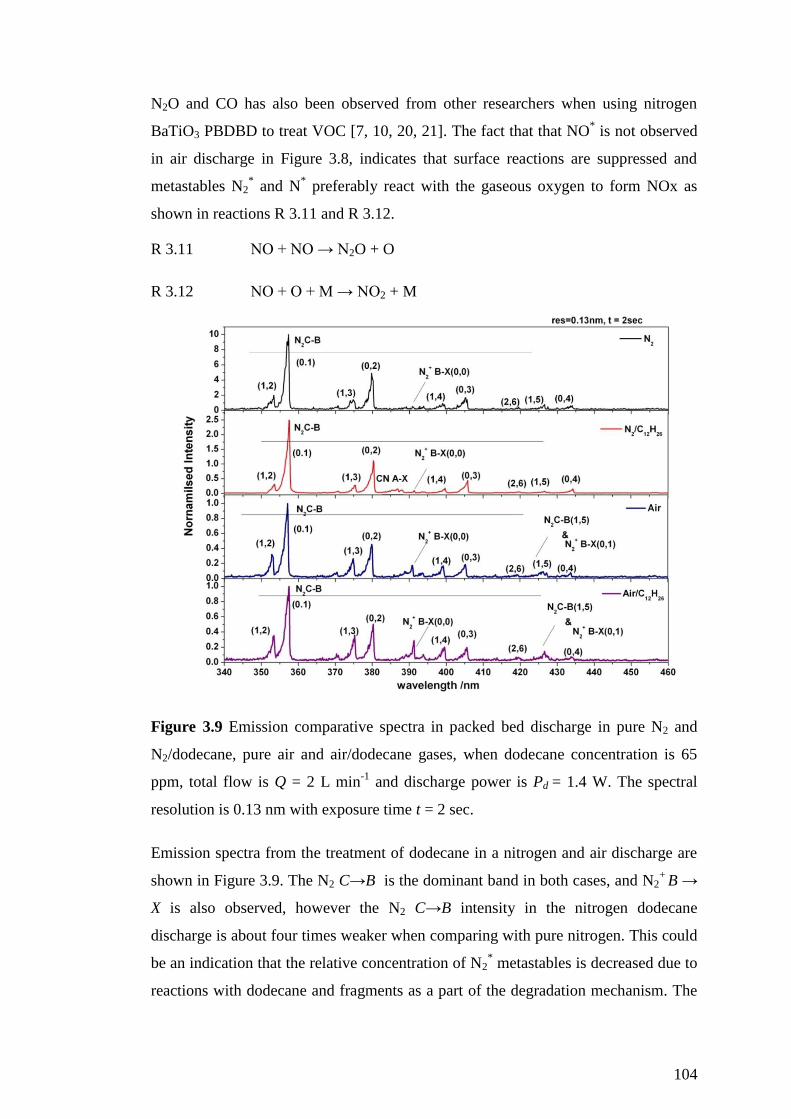
104
N2O and CO has also been observed from other researchers when using nitrogen
BaTiO3 PBDBD to treat VOC [7, 10, 20, 21]. The fact that that NO* is not observed
in air discharge in Figure 3.8, indicates that surface reactions are suppressed and
metastables N2* and N
* preferably react with the gaseous oxygen to form NOx as
shown in reactions R 3.11 and R 3.12.
R 3.11 NO + NO → N2O + O
R 3.12 NO + O + M → NO2 + M
Figure 3.9 Emission comparative spectra in packed bed discharge in pure N2 and
N2/dodecane, pure air and air/dodecane gases, when dodecane concentration is 65
ppm, total flow is Q = 2 L min-1
and discharge power is Pd = 1.4 W. The spectral
resolution is 0.13 nm with exposure time t = 2 sec.
Emission spectra from the treatment of dodecane in a nitrogen and air discharge are
shown in Figure 3.9. The N2 C→B is the dominant band in both cases, and N2+
B →
X is also observed, however the N2 C→B intensity in the nitrogen dodecane
discharge is about four times weaker when comparing with pure nitrogen. This could
be an indication that the relative concentration of N2* metastables is decreased due to
reactions with dodecane and fragments as a part of the degradation mechanism. The

105
CN violet system is also observed, which is correlated with the HCN formation, one
of major end-products. In case of air, when adding dodecane, there is no significant
change to the N2 C→B intensity, but the ratio of N2 C-B (0,0) /N2+
B-X (0,0) decreases as
N2+
B → X emission becomes stronger. This could suggest that N2* metastables
preferably react with oxygen leading to the formation of NO, NO2 and N2O as end
products as shown before in reactions R 3.6 – R 3.12.
The emission spectra in the different gas mixture BaTiO3 packed bed discharge were
also used to obtain vibrational and rotational temperatures of the N2 C→B in the
different conditions. The rotational temperature (Tr) is determined by a comparison
between the experimental spectrum of molecular band of N2 (C3Πu-B
3Πg, Δv = -1, at
357 nm) and a simulated one by using Specair [22], while vibrational temperature is
calculated using the Boltzmann plot method.
The intensity of the spectral line is given by:
( ) (
) Equation 3.4
where Iij and λij are the intensity and wavelength that corresponds to transition i to j
respectively, h is the Planck’s constant, c is the speed of light, n the number density
of emitting species, U(Tv) the partition function, Aij the transition probability between
level i and j , kB the Boltzmann’s constant, Tv the vibrational temperature, qij the
Franck-Condon factor and Ej the upper energy level in eV unit.
Equation 3.2 gives a linear relationship when ln( ) versus (Ej) is
plotted, and then Tv can be determined by the plot’s slope. The Frank-Condon factor
and transition probabilities can be found in [23].
(
)
( ) (
( )) Equation 3.5
Figure 3.10 shows the gas mixture effect to the N2 C→B vibrational and rotational
temperatures. The difference between the vibrational and rotational temperature is
expected in our packed bed dielectric barrier discharge system, indicating the
significant degree of non-equilibrium state. Generally, in low temperature non-
thermal plasmas, the rotational temperature is taken to be a good indicator of the gas
temperature, involving the assumptions that the rotational population is following
Boltzmann’s law and the rotational temperature is equilibrated with the translational

106
temperature by fast intermolecular relaxation [22, 24]. The nitrogen or air discharge
with or no addition of dodecane vapour had no influence to the rotational
temperature of N2 C→B, which was measured at Tr ≈ 750 K (0.06 eV). The
vibrational temperature is much higher at Tv = 2500 K (0.21 eV) in nitrogen
discharge while the dodecane vapour appears to have no effect. However, it slightly
increases in air discharge Tv = 2750 K (0.24 eV), and with the addition of vapour
dodecane Tv = 2900 K (0.25 eV).
.
Figure 3.10 Rotational and vibrational temperature of N2 C →B in different gas
mixture BaTiO3 packed bed discharge, at maximum discharge power, Pd = 1.4 W
3.3.3 The Oxygen Effect on dodecane degradation and end-products formation
The effect of oxygen concentration in the N2-O2 discharge feed gas on the dodecane
decomposition was studied in order to identify potential optimal processing
conditions, as increased oxygen concentration is generally believed that it can
promote the oxidation rate. Figure 3.11 shows the results of PB DBD degradation of
dodecane (35 ppm) when (0-40) % concentration of oxygen was used at a fixed
energy density, SIE = 42 J L-1
. As observed, variation even up to high oxygen
concentration 40% hardly influences the degradation efficiency, which lies within
the experimental error at ~ 24%. This is not surprising in case of packed bed plasma
treatment of hydrocarbons, as previous literature has shown that best destruction
rates have been noted in the absence of oxygen in dry nitrogen packed bed plasma of
methane [10] and butane [11].
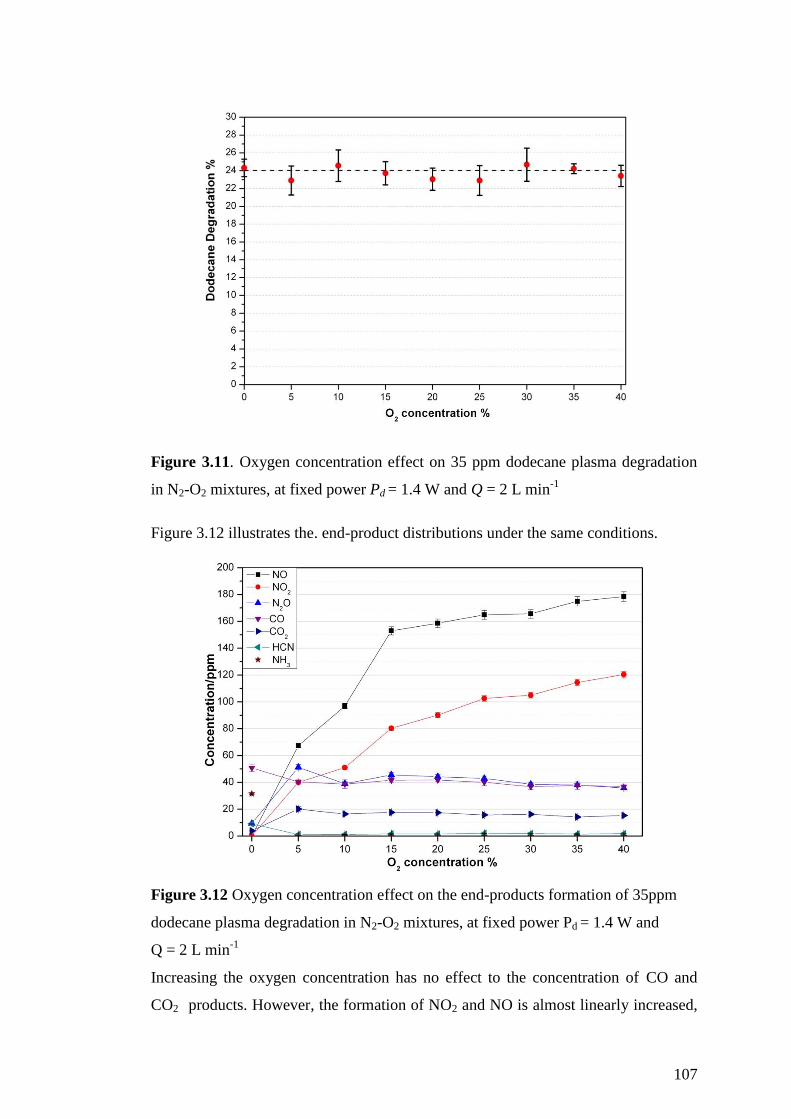
107
Figure 3.11. Oxygen concentration effect on 35 ppm dodecane plasma degradation
in N2-O2 mixtures, at fixed power Pd = 1.4 W and Q = 2 L min-1
Figure 3.12 illustrates the. end-product distributions under the same conditions.
Figure 3.12 Oxygen concentration effect on the end-products formation of 35ppm
dodecane plasma degradation in N2-O2 mixtures, at fixed power Pd = 1.4 W and
Q = 2 L min-1
Increasing the oxygen concentration has no effect to the concentration of CO and
CO2 products. However, the formation of NO2 and NO is almost linearly increased,
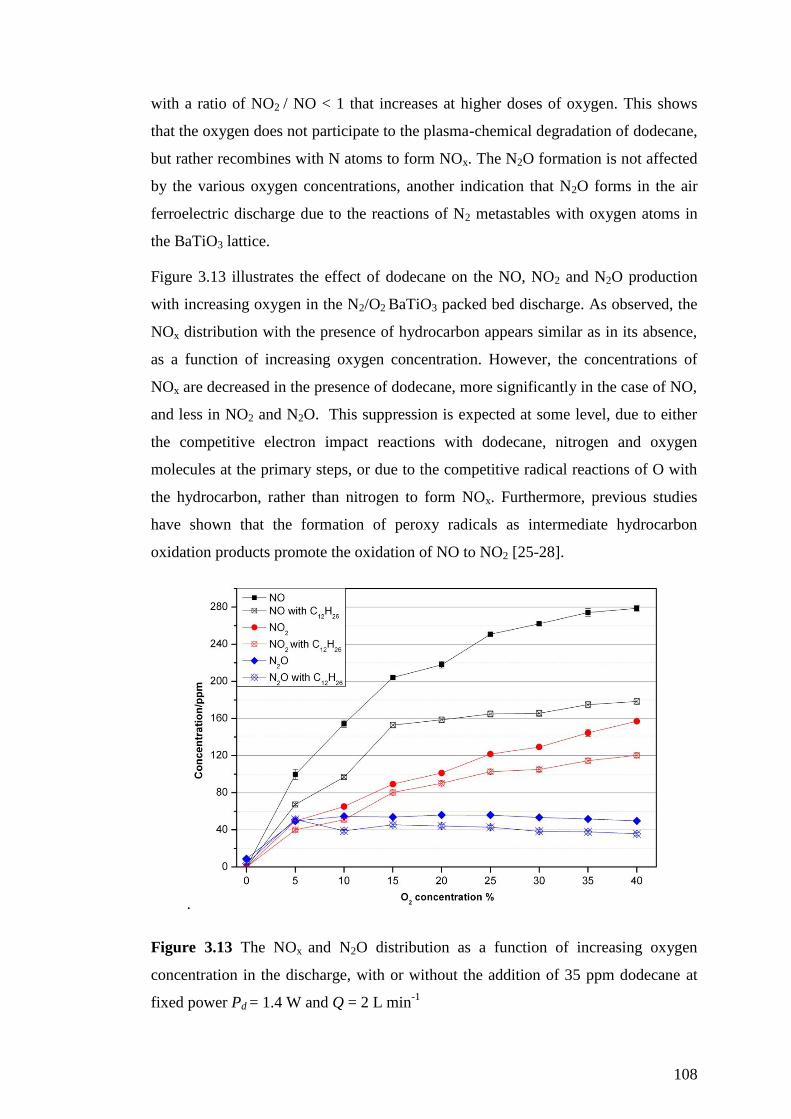
108
with a ratio of NO2 / NO < 1 that increases at higher doses of oxygen. This shows
that the oxygen does not participate to the plasma-chemical degradation of dodecane,
but rather recombines with N atoms to form NOx. The N2O formation is not affected
by the various oxygen concentrations, another indication that N2O forms in the air
ferroelectric discharge due to the reactions of N2 metastables with oxygen atoms in
the BaTiO3 lattice.
Figure 3.13 illustrates the effect of dodecane on the NO, NO2 and N2O production
with increasing oxygen in the N2/O2 BaTiO3 packed bed discharge. As observed, the
NOx distribution with the presence of hydrocarbon appears similar as in its absence,
as a function of increasing oxygen concentration. However, the concentrations of
NOx are decreased in the presence of dodecane, more significantly in the case of NO,
and less in NO2 and N2O. This suppression is expected at some level, due to either
the competitive electron impact reactions with dodecane, nitrogen and oxygen
molecules at the primary steps, or due to the competitive radical reactions of O with
the hydrocarbon, rather than nitrogen to form NOx. Furthermore, previous studies
have shown that the formation of peroxy radicals as intermediate hydrocarbon
oxidation products promote the oxidation of NO to NO2 [25-28].
.
Figure 3.13 The NOx and N2O distribution as a function of increasing oxygen
concentration in the discharge, with or without the addition of 35 ppm dodecane at
fixed power Pd = 1.4 W and Q = 2 L min-1
109
3.3.4 The Plasma-chemical destruction of gaseous dodecane in the ferroelectric
packed bed reactor
As discussed earlier in chapter 2, the chemical effects occurring in an electrical
discharge are the consequence of the energy injection into the bulk gas by electron
impact reactions under the influence of the electric field [29]. Electron collisions
with neutral particles cause the primary reactions of ionisation, excitation and
dissociation, followed by charge and energy transfer reactions (~10-8
s). The
secondary processes consist of the radical reactions which are important for the
pollutant decomposition, as they last longer (~10-3
s). In this part, a postulated plasma
chemical decomposition of dodecane in the BaTiO3 PBDBD reactor will be
discussed.
The mean electron energy in most electric discharge reactors operating at
atmospheric pressure is typically between 3 – 6 eV [30]. BaTiO3 packed reactors,
due to the contact points between the pellets which enhance the electric field, can be
categorised as high electron energy but low energy density devices [31], with a
maximum energy up to 10 eV and mean electron energy of about 4 - 5 eV [32]. In
this range, the direct electron impact dissociation of dodecane on our diluted gas
mixture is not expected to be an important reaction. Although the dissociation energy
of the C-C and C-H dodecane bonds are ~ 4.3 eV and 3.8 eV respectively (Table
3.2), the threshold dissociation energy by electron impact is considerably higher at ~
9 eV. However, one must consider that these reactions become more important in
concentrated systems, where the probability of the energetic electrons collision with
the hydrocarbon is increased. Moreau et al. [33] have studied by experiments and
model predictions the dissociation of propane and propene in N2 non-thermal plasma
and they suggest that the quenching N2* metastable states by C3H8 and C3H6 are the
most important processes for the removal of the hydrocarbons for concentrations
~ 5500 ppm. In addition, Aerts et al. [34] have used a kinetic model to study the
initiation reactions of ethylene destruction in an air DBD plasma, where it is found
that electrons have minimum contribution to ethylene plasma destruction compared
to N2(A) metastables and O atoms, up to 10.000 ppm concentration of ethylene.
It is suggested that the initiation mechanism of dodecane plasma-chemical
decomposition happens through two main pathways: 1) the cleavage of C–C bond to
form smaller hydrocarbon radicals, and 2) the dehydrogenation reaction to form an H

110
radical and the corresponding C12H25 radical. Another pathway is H-abstraction
reactions by small radicals including O, OH, N, H, CH3, and C2H5, which are
secondary products after initiation reactions. It should be noted that C-H cleavage is
more thermodynamically favoured in the C4 carbon as shown in Table 3.2. This
could create initial dodecyl radicals and subsequent C-C scission with higher
probability between C5-C6 or C5-C4 positions which could be followed by chain
radical reactions with simultaneous C2H4 elimination by β-scission, leading to methyl
fragments and final oxidation products. The β-scission reaction in alkyl radical
reactions is often used to describe initiation radical reactions in fuel combustion
mechanistic studies [35-37]. A schematic of the postulated plasma-chemical
initiation mechanism is given in Figure 3.14.
Reactions
ΔH◦ (C-H )/eV
n-C12H26 →H + CH3(CH2)10CH2• 4.40
n-C12H26 →H + CH3(CH2)9CH•CH3 4.22
n-C12H26 →H + CH3(CH2)8CH•CH2CH3 4.21
n-C12H26 →H + CH3(CH2)7CH•(CH2)2CH3 4.20
n-C12H26 →H + CH3(CH2)6CH•(CH2)3CH3 4.18
n-C12H26 →H + CH3(CH2)5CH•(CH2)4CH3 4.21
Reactions
ΔH◦ (C-C)/eV
n-C12H26 → CH3+n-C11H23 3.85
n-C12H26 → n-C2H5 +n-C10H21 3.73
n-C12H26 → n-C3H7 +n-C9H19 3.71
n-C12H26 → n-C4H9 +n-C8H17 3.71
n-C12H26 → n-C5H11 +n-C7H15 3.67
n-C12H26 → 2 n-C6H13 3.68
Table 3.2 Bond dissociation enthalpies of C–H and C-C bond in n-dodecane at
different C sites (adapted from [37])

111
Figure 3.14 Schematic of initiation reaction mechanism of the oxidation processes of
the n-dodecane
In a nitrogen plasma, the largest fraction of the electron energy is used to create
vibrationally-excited nitrogen metastables such as N2(A), and N2(B, C) as shows in
reactions R3.1, R3.3. The first excited N2 metastable N2(A), with the lowest
threshold energy of 6.2 eV and the longest lifetime ~ 2 s, is considered to be the most
populated and for that reason to play a central role to plasma processing [38]. The
rest of the electron energy is used to electron impact dissociation and ionisation
reactions to create N, N* radicals and N2+, N2
+*, N
+, and N
+* ions. From our OES
observations, it can be suggested that N2* plays an important role in dodecane
decomposition by creating initiation radical reactions through energy transfer
reactions which could dissociate the C-H and C-C bonds at the different positions to
create initial H and alkyl radicals. Furthermore, H-abstraction from the C-H bond at
the various positions can happen from N radicals to create also initial alkyl radicals,
but also leading to NH3 formation by stepwise H addition. The methyl radicals can
react with N radicals to give H2CN intermediates which can then form HCN by
simultaneous H-abstraction. A schematic summary of the plasma-chemical
decomposition of dodecane in N2 PBDBD is given in Figure 3.15.
Figure 3.15 Schematic summary of plasma-chemical decomposition of dodecane in
N2 PBDBD

112
In an air plasma, a large amount of the electron energy is consumed in the vibrational
excitation of molecular nitrogen, but also a significant amount goes into the electron
impact dissociation of oxygen to create O radicals [30] as shown earlier in reaction
R 3.5. The O radicals can abstract H atoms to form OH radicals, which in turn can
also contribute to the H-abstraction reactions forming H2O and promoting radical
reactions. Both O and OH radicals can add to dodecane and sub-sequential fragments
to produce RO and RCHO as intermediates which with subsequent oxidation steps
can lead to final oxidation products of CO and CO2. A schematic summary of the
plasma-chemical decomposition of dodecane in air PBDBD is given in Figure 3.16.
Figure 3.16 Schematic summary of plasma-chemical decomposition of dodecane in
air PBDBD
The formation of nitrogen oxides is unavoidable in air discharges and it has been
well-studied [39, 40]. It can be initiated by nitrogen metastables as shown in
reactions R 3.13- R 3.16.
R 3.13 N2 (A) + O2 → products k300 = 2.5 x 10⁻¹²
cm3 molecule
-1 s
-1 [41]
R 3.14 N2 (A) + O→ NO+ N(D) k300 = 7 x 10-12
cm3 molecule
-1 s
-1 [38]
R 3.15 N2* + O → N2O no data
R 3.16 N2* + O2 → N2O + O* no data
R 3.17 N (D) + O2 → NO + O k = 5.2 x 10⁻¹²
cm3 molecule
-1 s
-1
[41]
R 3.18 N (P) + O2 → NO + O k = 2.9 x 10⁻¹²
cm3 molecule
-1 s
-1 [41]
R 3.19 NO + O + M → NO2 + M k = 3.0 x 10⁻¹¹
cm3 molecule
-1 s
-1
[42]
113
Our results indicate that increasing the oxygen concentration in the N2-O2 mixture
plasma does not increase the dodecane destruction. The rapid NOx formation
reactions act as competitive reactions to the degradation of the hydrocarbon. This
could take place in the radical initiation stage, where nitrogen metastables react faster
with oxygen rather with the hydrocarbon, as shown in reactions R 3.14, R 3.20
(C4H10 was used as the largest hydrocarbon with available kinetic data). From
extrapolation of kinetics in reactions R 3.20 – R 3.27 we understand firstly that
reaction rates generally become faster for longer unsaturated hydrocarbons as
someone could easily suggest, since the longer hydrocarbon, the weaker the C-C and
C-H bonds become and thus, easier to breakdown. Secondly, it can be noted that the
reaction of metastable N2(A) with the longer hydrocarbons becomes very important
kinetically for the initiation of the radical chemistry, where the H-abstraction
reaction by O or OH radicals is slower. Furthermore, although singlet state oxygen
O(D) reacts quite fast with the hydrocarbons, its relative concentration is thought to
be small compared to N2(A) and thus its contribution cannot be considered
significant. For that reason, it is suggested that the reactions of N2(A) leading to NOx
formation inhibit the initiation dodecane breakdown to smaller fragment radicals
which could then rapidly react with O and OH radicals as shown in reactions R 3.28-
R 3.30, until subsequently complete oxidation.
R 3.20 N2 (A) + C4H10 → products k300 = 2.7 x 10⁻¹²
cm3 molecule
-1 s
-1
[41]
R 3.21 N2 (A) + CH4 → products k300 = 3.0 x 10⁻¹⁵
cm3 molecule
-1 s
-1
[41]
R 3.22 O + C4H10 → products k300 = 4.2 x 10⁻¹⁴
cm3 molecule
-1 s
-1
[43]
R 3.23 O + CH4 → CH3 + OH k300 = 1.4 x 10⁻¹⁷
cm3 molecule
-1 s
-1
[44]
R 3.24 OH + C4H10 → C4H9 + H2O k300 = 1.6 x 10⁻¹²
cm3 molecule
-1 s
-1
[45]
R 3.25 OH + CH4 → products + H2O k300 = 6.4 x 10⁻¹⁵
cm3 molecule
-1 s
-1 [46]
R 3.24 O (1D) + C4H10 → products + OH k300= 2.5 x 10
-10 cm
3 molecule
-1 s
-1 [47]
R 3.27 O (1D) + CH4 → CH3 + OH k300 = 1.0 x 10
-10 cm
3 molecule
-1 s
-1 [46]

114
R 3.28 CH3 + O2 → products k300 = 1.8 x 10⁻¹²
cm3 molecule
-1 s
-1
[46]
R 3.29 CH3 + O → products k300 = 1.3 x 10⁻¹⁰
cm3 molecule
-1 s
-1
[46]
R 3.30 CH3+ OH →products k300 = 1.3 x 10⁻¹¹
cm3 molecule
-1 s
-1
[48]
3.4 Summary & Conclusions
A ferroelectric BaTiO3 packed bed plasma reactor has been investigated for the
plasma-chemical degradation of gaseous kerosene and dodecane, considering it as
VOC that can be found in power plants, but also getting a forehand insight of the
gaseous degradation mechanism as necessary step applying plasma technology for
the liquid waste oil treatment.
The degradation efficiency follows a similar trend for kerosene and dodecane as
target pollutants, and thus, dodecane can be used as a surrogate for quantitative
analysis. The degradation increases with increasing SIE for both nitrogen and air,
however with a higher rate in case in nitrogen at lower electrical field, but with no
significant difference with air at maximum 42 J L-1
where was found 22%.
Optical emission spectroscopy has been used as plasma diagnostics of the treatment
in N2 and air plasma. It can be suggested that the dodecane decomposition in a
nitrogen plasma is controlled by the primary steps of electron-induced excited
nitrogen metastables which can initiate radical reactions by energy transfer reactions.
Interestingly, the excited NO-γ is observed only in case of nitrogen, suggesting
surface reactions are taking place between the nitrogen metastables and the lattice
oxygen of BaTiO3, resulting in the formation of N2O and CO. In an air plasma, the
electron impact dissociation of molecular oxygen in the primary steps, create the O
atoms which could contribute to the dodecane degradation mechanism, but can also
rapidly react with nitrogen metastables to form nitrogen oxides.
Increasing the oxygen concentration between (0–40) % in N2-O2 mixture plasma
shows no significant influence to the degradation efficiency, however the yields of
NO and NO2 is almost linearly increased with a ratio NO2/NO < 1, which slightly
115
increases at higher oxygen doses. This shows that oxygen does not participate to the
degradation mechanism of dodecane, as rapid recombination reactions with nitrogen
metastables form NOx and hinder the dodecane breakdown initiation reactions.
However, the N2O formation is not majorly influenced, and remains stable for ≥ 10%
oxygen, which also indicates that its origin is related to the lattice oxygen of BaTiO3.
Overall, interesting observations have been made for the dodecane treatment in the
BaTiO3 PBDBD. The maximum degradation efficiency found was rather low ~24%,
but with a good energy efficiency of 2.63 mg/kJ. For the same configuration
ferroelectric plasma reactor, the treatment of dodecane appears more efficient
compared to propane studied by Hill et al. [49] and methane treatment studied by
Pringle et al. [10] which is calculated at 0.87 mg/kJ and 0.38 mg/kJ, respectively. It
can be suggested that a higher energy density and longer residence time treatment
would presumably lead to total oxidation of the VOC. Regarding the view on
applying plasma technology for the liquid waste oil, the gliding arc plasma reactor is
suggested and will be examined in the next chapter.
3.5 References
[1] International Atomic Energy Agency, "Handling and Processing of
Radioactive Waste from Nuclear Applications," IAEA, Vienna 2001.
[2] A. Mizuno and H. Ito, "Basic performance of an electrostatically augmented
filter consisting of a packed ferroelectric pellet layer," Journal of
Electrostatics, vol. 25, pp. 97-107, 1990.
[3] T. Yamamoto, Ramanathan K., Lawless P. A., Ensor D. S., Newsome J. R.,
Plaks N., Ramsey G. H., "Control of volatile organic compounds by an AC
energized ferroelectric pellet reactor and a pulsed corona reactor," Industry
Applications, IEEE Transactions on, vol. 28, pp. 528-534, 1992.
[4] S. Futamura, Yamamoto T., "By-product identification and mechanism
determination in plasma chemical decomposition of trichloroethylene,"
Industry Applications, IEEE Transactions on vol. vol.33, no.2, pp.
pp.447,453, 1997.
[5] S. Futamura, Zhang A. H., YamamotoT., "The dependence of non-thermal
plasma behavior of VOCs on their chemical structures," Journal of
Electrostatics, vol. 42, pp. 51-62, 1997.
[6] A. Ogata, Mizuno K., Kushiyama S., Yamamoto T., "Methane
Decomposition in a Barium Titanate Packed-Bed Nonthermal Plasma

116
Reactor," Plasma Chemistry and Plasma Processing, vol. 18, pp. 363-373,
1998/09/01 1998.
[7] C. Fitzsimmons, Ismail, F., Whitehead, J.C., Wilman, J.J., "The Chemistry of
Dichloromethane Destruction in Atmospheric-Pressure Gas Streams by a
Dielectric Packed-Bed Plasma Reactor," The Journal of Physical Chemistry
A, vol. 104, pp. 6032-6038, 2000/06/01 2000.
[8] J. S. K. Chang, K.G.; Urashima, K.; Yamamoto, T.; Okayasu, Y.; Kato, T.;
Iwaizumi, T.; Yoshimura, K, "Removal of NF3 from semiconductor-process
flue gases by tandem packed-bed plasma and adsorbent hybrid systems,"
IEEE Transactions on Industry Applications, vol. vol.36, pp. 1251,1259,
2000.
[9] H.-H. Kim, Kobara H., Ogata, A. Futamura, S., "Comparative assessment of
different nonthermal plasma reactors on energy efficiency and aerosol
formation from the decomposition of gas-phase benzene," IEEE Transactions
onIndustry Applications, vol. 41, pp. 206-214, 2005.
[10] K. J. Pringle, Whitehead J. C., Wilman J. J., Wu J., "The Chemistry of
Methane Remediation by a Non-thermal Atmospheric Pressure Plasma,"
Plasma Chemistry and Plasma Processing, vol. 24, pp. 421-434, 2004/09/01
2004.
[11] S. Futamura, Zhang A., Prieto, G., Yamamoto, T., "Factors and intermediates
governing byproduct distribution for decomposition of butane in nonthermal
plasma," Industry Applications, IEEE Transactions on, vol. 34, pp. 967-974,
1998.
[12] P. A. Gorry, Whitehead J. C., Wu J., "Adaptive Control for NOx Removal in
Non-Thermal Plasma Processing," Plasma Processes and Polymers, vol. 4,
pp. 556-562, 2007.
[13] T. C. Manley, "The Electric Characteristics of the Ozonator Discharge,"
Journal of The Electrochemical Society, vol. 84, pp. 83-96, 1943.
[14] T. Xin, Helen J Gallon, Martyn V Twigg, Peter A Gorry, J Christopher
Whitehead, "Dry reforming of methane over a Ni/Al2O3 catalyst in a coaxial
dielectric barrier discharge reactor," Journal of Physics D: Applied Physics,
vol. 44, p. 274007, 2011.
[15] S. Futamura, Zhang Aihua, Einaga Hisahiro, Kabashima Hajime,
"Involvement of catalyst materials in nonthermal plasma chemical processing
of hazardous air pollutants," Catalysis Today, vol. 72, pp. 259-265, 2002.
[16] U. Fantz, "Basics of plasma spectroscopy," Plasma Sources Science and
Technology, vol. 15, p. S137, 2006.
[17] D. J. Malcombe-Lawes, Nature, vol. 247, pp. 540-540, 1974.
[18] E. C. Zipf, "A laboratory study on the formation of nitrous oxide by the
reaction N2(A3[Sigma]u+) + O2 to N2O + O," Nature, vol. 287, pp. 523-524,
1980.
[19] X. Tu, Gallon H. J., Whitehead J. C., "Transition Behavior of Packed-Bed
Dielectric Barrier Discharge in Argon," Plasma Science, IEEE Transactions
on, vol. 39, pp. 2172-2173, 2011.

117
[20] A. E. Wallis, Whitehead, J. C., Zhang, K., "The removal of dichloromethane
from atmospheric pressure nitrogen gas streams using plasma-assisted
catalysis," Applied Catalysis B: Environmental, vol. 74, pp. 111-116, 2007.
[21] Y. S. Mok, Demidyuk V., Whitehead J. C., "Decomposition of
Hydrofluorocarbons in a Dielectric-Packed Plasma Reactor," The Journal of
Physical Chemistry A, vol. 112, pp. 6586-6591, 2008/07/01 2008.
[22] C. O. Laux, T. G. Spence,C. H. Kruger, R. N. Zare, "Optical diagnostics of
atmospheric pressure air plasmas," Plasma Sources Science and Technology,
vol. 12, p. 125, 2003.
[23] R. R. L. Forrest R. Gilmore, and Patrick J. Espy, "Franck–Condon Factors, r-
Centroids, Electronic Transition Moments, and Einstein Coefficients for
Many Nitrogen and Oxygen Band Systems," J. Phys. Chem. Ref. Data vol.
21, pp. 1005-1108, 1992.
[24] B. A. Cruden, M. V. V. S. Rao, Surendra P. S., and Meyyappan M., "Neutral
gas temperature estimates in an inductively coupled CF4 plasma by fitting
diatomic emission spectra," J. Appl. Phys. 8955 (2002), vol. 91, pp. 8951-
8964, 2002.
[25] R. Dorai, Mark J. Kushner, "Consequences of propene and propane on
plasma remediation of NOx," Journal of Applied Physics, vol. 88, p. 9, 2000.
[26] Y.-S. Mok, Nam, In-Sik, "Role of Organic Chemical Additives in Pulsed
Corona Discharge Process for Conversion of NO," JOURNAL OF
CHEMICAL ENGINEERING OF JAPAN, vol. 31, pp. 391-397, 1998.
[27] I. Orlandini and U. Riedel, "Modelling of NO and HC removal by non-
thermal plasmas," Combustion Theory and Modelling, vol. 5, pp. 447-462,
2001/09/01 2001.
[28] B. M. Penetrante, W. J. Pitz, M.C. Hsiao, B.T. Merritt and G.E. Vogtlin,
"Effect of Hydrocarbons on Plasma Treatment of NOx," in Procedings of
the1997 Diesel Engine Emissions Reduction Workshop, 1997.
[29] H. H. Kim, "Nonthermal Plasma Processing for Air-Pollution Control: A
Historical Review, Current Issues, and Future Prospects," Plasma Processes
and Polymers, vol. 1, pp. 91-110, 2004.
[30] B. M. Penetrante, Bardsley J.N. ,Hsiao M.C., "Kinetic Analysis of Non-
Thermal Plasmas Used for Pollution Control," Japanese Journal of Applied
Physics, vol. Part 1, No. 36, pp. 5007-50017, 1997.
[31] L. H. M. C. Chen Hsin Liang, Shiaw Huei, "Review of Packed-Bed Plasma
Reactor for Ozone Generation and Air Pollution Control," Industrial &
Engineering Chemistry Research, vol. 47, pp. 2122-2130, 2008.
[32] J. S. Chang, A.J. Kelly, J.M. Crowley, Handbook of Electrostatic Processes.
New York: Dekker, 1995.
[33] S. P. N. Moreau, N. Blin-Simiand, L. Magne, F. Jorand, C. Postel, J. R.
Vacher, "Propane dissociation in a non-thermal high-pressure nitrogen
plasma," Journal of Physics D: Applied Physics, vol. 43, p. 285201, 2010.
[34] R. Aerts, Tu Xin, De Bie Christophe, Whitehead J. Christopher, Bogaerts
Annemie, "An Investigation into the Dominant Reactions for Ethylene
118
Destruction in Non-Thermal Atmospheric Plasmas," Plasma Processes and
Polymers, vol. 9, pp. 994-1000, 2012.
[35] A. Ratkiewicz and T. N. Truong, "Kinetics of the C–C Bond Beta Scission
Reactions in Alkyl Radical Reaction Class," The Journal of Physical
Chemistry A, vol. 116, pp. 6643-6654, 2012/06/28 2012.
[36] J. Zádor, Craig A.T., Fernandes, Ravi X., "Kinetics of elementary reactions in
low-temperature autoignition chemistry," Progress in Energy and
Combustion Science, vol. 37, pp. 371-421, 2011.
[37] Q.-D. Wang, Wang Jing-Bo, Li Juan-Qin, Tan Ning-Xin, Li Xiang-Yuan,
"Reactive molecular dynamics simulation and chemical kinetic modeling of
pyrolysis and combustion of n-dodecane," Combustion and Flame, vol. 158,
pp. 217-226, 2011.
[38] V. Guerra, P, A. Sá, J. Loureiro, "Role played by the N2 (A 3 Σ u+) metastable
in stationary N2 and N2 -O2 discharges," Journal of Physics D: Applied
Physics, vol. 34, p. 1745, 2001.
[39] J. Herron, "Modeling Studies of the Formation and Destruction of NO in
Pulsed Barrier Discharges in Nitrogen and Air," Plasma Chemistry and
Plasma Processing, vol. 21, pp. 581-609, 2001/12/01 2001.
[40] D.-J. Kim, Choi Y., Kim K.-S., "Effects of Process Variables on NOx
Conversion by Pulsed Corona Discharge Process," Plasma Chemistry and
Plasma Processing, vol. 21, pp. 625-650, 2001/12/01 2001.
[41] J. T. Herron, "Evaluated Chemical Kinetics Data for Reactions of N(2D),
N(2P), and N2(A3Σu+) in the Gas Phase " J. Phys. Chem. Ref. Data vol. 28,
pp. 1453-1483, 1999.
[42] R. B. Atkinson, D.L.; Cox, R.A.; Crowley, J.N.; Hampson, R.F.; Hynes,
R.G.; Jenkin, M.E.; Rossi, M.J.; Troe, J., "Evaluated kinetic and
photochemical data for atmospheric chemistry: Volume I - gas phase
reactions of Ox, HOx, NOx and SOx species," Atmos. Chem. Phys., vol. 4,
pp. 1461 - 1738, 2004.
[43] L. Elias, Schiff H.I., "Absolute rate measurements of O-atom reactions with
ethylene and with butane," Can. J. Chem., vol. 38, pp. 1657 - 1665, 1960.
[44] J. Barassin, Combourieu J., "Etude cinetique des reactions entre l'oxygene
atomique et les derives chlores du methane," Bull. Soc. Chim. Fr., 1973.
[45] G. Bravo-Perez, Alvarez-Idaboy J.R., Jimenez A.G., Cruz-Torres A.,
"Quantum chemical and conventional TST calculations of rate constants for
the OH plus alkane reaction," Chem. Phys., vol. 310, pp. 213 - 223, 2005.
[46] R. Atkinson, Baulch, D. L., Cox, R. A., Crowley, J. N., Hampson, R. F.,
Hynes, R. G., Jenkin, M. E., Rossi, M. J., Troe, J., and IUPAC
Subcommittee, "Evaluated kinetic and photochemical data for atmospheric
chemistry: Volume II – gas phase reactions of organic species," Atmos.
Chem. Phys., vol. 6, pp. 3625-4055, 2006.
[47] N. W. Cohen, K.R., "The use of transition-state theory to extrapolate rate
coefficients for reactions of O atoms with alkanes," Int. J. Chem. Kinet., vol.
18, 1986.
119
[48] R. De Avillez Pereira, Baulch D.L., Pilling M.J., Robertson S.H., Zeng, G.,
"Temperature and pressure dependence of the multichannel rate coefficients
for the CH3 + OH system," J. Phys. Chem. A, vol. 101, pp. 9681 - 9693,
1997.
[49] S. L. Hill, Whitehead, J. Christopher, Zhang, Kui, "Plasma Processing of
Propane at Hyper-Atmospheric Pressure: Experiment and Modelling,"
Plasma Processes and Polymers, vol. 4, pp. 710-718, 2007.

120
Chapter 4
4. Gliding Arc Discharge degradation of oil in the vapour
phase
4.1 Introduction
Applying low-temperature plasma technology for the treatment of waste oil in power
plants, gliding arc discharge (GAD) has been suggested as a favoured type of low-
temperature plasma. Its simple and flexible design can build reactors for both gas and
liquid treatment and on different scales such as portable reactors for emergency
spillage treatment. In addition, its discharge characteristics preserving the dual
character of thermal and non-thermal plasma, offer elevated power which is
preferable to treat concentrated organics, with possibly the same outcome as
incineration, but at lower operating temperatures targeting at cost efficient
processing.
Gliding arc discharge (or “glidarc”) was first proposed by Lesueur et al. [1] and
developed by Czernichowski et al. mainly for the treatment of gases such as H2S or
N2O removal from industrial gases [2-4] and later for the conversion of light
hydrocarbons [5]. Its characteristics made it an attractive tool for both academic and
industrial research [6] and while it was initially developed for gas treatment
applications, it soon was developed also for liquid treatment [7]. These physical
characteristics and dynamics have been studied extensively by several researchers [8-
11].
In this work, gliding arc discharge has been used as a source of low-temperature
atmospheric plasma for the study of the degradation of hydrocarbon oils such as
odourless kerosene and n-dodecane, under different conditions. The aim of this study
focuses only on the vapour phase destruction of the oil as an essential first step to
understanding the gas chemistry which would help to elucidate the chemistry of
plasma-liquid treatment. Following the same approach as described in Chapter 3,
odourless kerosene has been studied only qualitatively and is compared with
dodecane which is then used as a surrogate instead to allow quantitative analysis.

121
FTIR spectroscopy has been used for identification and quantification of the
processing end-products. Comparison has been made between different gas streams
such as N2, air and Ar and the effect of humidity has also been studied. Optical
Emission Spectroscopy (OES) was used as a plasma diagnostic tool under different
conditions, where reactive excited species were observed and temperature profiles
were obtained. In order to investigate the optimal conditions for the oil destruction,
the effect of O2 concentration in the N2-O2 buffer mixtures is also presented in this
work.
4.2 Experimental set-up
Non-thermal plasma was generated in a gliding arc discharge (GAD) reactor at low
temperature and atmospheric pressure. Figure 4.1 illustrates the experimental
configuration.
The GAD reactor consists of two stainless steel diverging electrodes, 50 mm long, 18
mm to 2.4 mm diverging width, 5 mm thick and with an adjustable minimum gap
fixed at 3 mm, located under a feeding gas nozzle of i.d. 1.5 mm, as shown in Figure
4.2a. Reactions are performed in a Pyrex glass vessel of ~ 1 L capacity. An AC neon
sign power supply provides a high voltage up to 20 kVp-p and 50 mA at a frequency
of 50 Hz. The plasma gases used were N2, synthetic air (80% N2, 20% O2) and Ar
(99.998% purity) in dry or humid conditions. For the humid conditions, the inlet gas
relative humidity was RH = 75% ± 2% (H2O = 2.3 ± 0.3 %), at T = 24°C, measured
with a HTD-625 thermo-hygrometer. The total flow was 5 L min-1
passing through
bubblers filled with n-dodecane or odourless kerosene and water (for the humidity
investigation), to create a vapour of initial concentration 90 and 300 ppm dodecane
and odourless kerosene respectively. Plasma gas temperatures were obtained
applying a K-type thermocouple at a 1.5 cm distance between the probe and the
electrode and in a 4 cm position along the electrode axis as shown in Figure 4.2a.
On-line FTIR spectroscopy (Shimadzu 8300) with a long path IR cell (5 m) at
resolution 1 cm-1
was used for the identification and concentration determination of
the gaseous products. Every measurement is an average of ten scannings and is
repeated five times to obtain the uncertainty in values < 2%. Optical emission
spectroscopy measurements occurred as depicted in Figure 4.2b. The position of the

122
multi-mode quartz optical fibre allowed the integration of 4 cm diameter optical field
along the GAD downstream plume. The optical fibre was connected to a CCD
Princeton Instrument 320PI spectrograph with a 2400, 600 or 1500 g/mm grating
(0.03, 0.13 and 0.52 nm resolution) and wavelength in the range 200-800 nm.
Figure 4.1 Schematic diagram of experimental configuration: 1) mass flow
controller, 2) bubbler with odourless kerosene or dodecane, 3) bubbler with water, 4)
bypass for experiments with no water, 5) AC gliding arc reactor, 6) gas FTIR sample
inlet, 7) optical emission spectrometer
Figure 4.2 a) Position of the K-type thermocouple probe to collect gas temperatures
(red dot) and electrodes dimensions. b) Position of the multi-mode quartz fibre
during the OES measurements in gliding arc discharge. The half angle of the
maximum cone of light that can enter the fibre is 21.7◦ resulting in an optical field
diameter of 4 cm along the plasma plume.

123
The results obtained from the oil conversion were expressed as follows:
% Degradation 100i o
i
C C
C
Equation 4.1
where, Ci and Co are the input and output odourless kerosene or dodecane
concentrations, respectively.
% Product Selectivity = 12 26
100product
converted
C
C H Equation 4.2
% IC Selectivity =2
12 26
( )100
HCN CO CO
converted
C C C
C H
Equation 4.3
% OC Selectivity = 4 2 4 2 2
12 26
( )100
CH C H C H
converted
C C C
C H
Equation 4.4
where IC Selectivity is the selectivity of dodecane conversion to inorganic carbon as
HCN, CO and CO2 and OC is the selectivity to organic carbon of CH4, C2H4 and
C2H2. Existence of C2H6 could not be determined by FTIR, as its absorption
frequencies overlap with those of C12H26. However, based on the carbon balance
calculations, if any C2H6 forms, it cannot only have low selectivity (> 5%).
4.3 Results and Discussion
4.3.1 OES diagnostics of the GAD under different gas compositions and
comparison with end-products formation
In this work dodecane degradation using GAD was applied in different gas streams
of argon, nitrogen and air, in both dry and humid conditions. Changing the gas
composition causes observable changes in the plasma plume characteristics like
colour, length, and carbon deposition. OES was used as a diagnostic tool to identify
and study the behaviour of the reactive excited species which are correlated with
these changes.
The emission spectra collected under argon plasma with different admixtures are
given in Figure 4.3 and interpretation was done using the NIST Atomic Spectra
Database and literature [12, 13]. Table 4.1 summarises the intermediate excited
species that were identified in these conditions, in addition to the end-products
identified in the reaction gas outlet by FTIR spectroscopy.

124
Figure 4.3 Optical emission spectra of a) Ar GAD plasma with b) 90 ppm dodecane
admixture c) 2.3% H2O admixture and d) both H2O/dodecane admixture. Spectral
resolution is 0.13 nm and the intensity has been scaled to account for different
exposure times used.
*Other oxygenated products are observed, such as aldehydes or ketones (RCHO, RCO) but
cannot be specified
Table 4.1 Summary of the intermediate species observed by OES and the end-
products observed by FTIR. Relative intensities are characterised as strong (s),
medium (m) or weak (w). The input power of the reactor is the maximum achievable
in each case and photographs are given indicating the difference in colour.
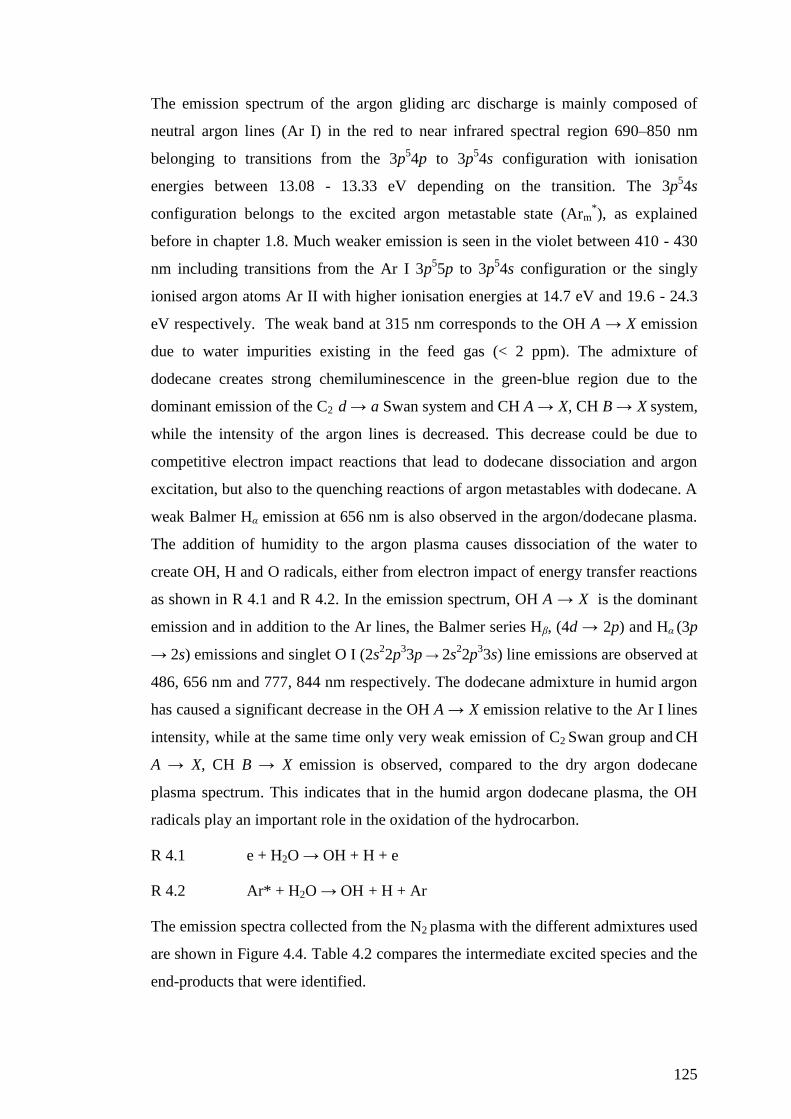
125
The emission spectrum of the argon gliding arc discharge is mainly composed of
neutral argon lines (Ar I) in the red to near infrared spectral region 690–850 nm
belonging to transitions from the 3p54p to 3p
54s configuration with ionisation
energies between 13.08 - 13.33 eV depending on the transition. The 3p54s
configuration belongs to the excited argon metastable state (Arm*), as explained
before in chapter 1.8. Much weaker emission is seen in the violet between 410 - 430
nm including transitions from the Ar I 3p55p to 3p
54s configuration or the singly
ionised argon atoms Ar II with higher ionisation energies at 14.7 eV and 19.6 - 24.3
eV respectively. The weak band at 315 nm corresponds to the OH A → X emission
due to water impurities existing in the feed gas (< 2 ppm). The admixture of
dodecane creates strong chemiluminescence in the green-blue region due to the
dominant emission of the C2 d → a Swan system and CH A → X, CH B → X system,
while the intensity of the argon lines is decreased. This decrease could be due to
competitive electron impact reactions that lead to dodecane dissociation and argon
excitation, but also to the quenching reactions of argon metastables with dodecane. A
weak Balmer Hα emission at 656 nm is also observed in the argon/dodecane plasma.
The addition of humidity to the argon plasma causes dissociation of the water to
create OH, H and O radicals, either from electron impact of energy transfer reactions
as shown in R 4.1 and R 4.2. In the emission spectrum, OH A → X is the dominant
emission and in addition to the Ar lines, the Balmer series Hβ, (4d → 2p) and Hα (3p
→ 2s) emissions and singlet O I (2s22p
33p → 2s
22p
33s) line emissions are observed at
486, 656 nm and 777, 844 nm respectively. The dodecane admixture in humid argon
has caused a significant decrease in the OH A → X emission relative to the Ar I lines
intensity, while at the same time only very weak emission of C2 Swan group and CH
A → X, CH B → X emission is observed, compared to the dry argon dodecane
plasma spectrum. This indicates that in the humid argon dodecane plasma, the OH
radicals play an important role in the oxidation of the hydrocarbon.
R 4.1 e + H2O → OH + H + e
R 4.2 Ar* + H2O → OH + H + Ar
The emission spectra collected from the N2 plasma with the different admixtures used
are shown in Figure 4.4. Table 4.2 compares the intermediate excited species and the
end-products that were identified.

126
Figure 4.4 Optical emission spectra in the range of 300-410 nm of a) N2 GAD
plasma with b) 90 ppm dodecane admixture c) 2.3% H2O admixture and d) both
H2O/dodecane admixture. Spectral resolution is 0.13 nm and the intensity has been
scaled in account for different exposure time used.
Table 4.2 Summary of the intermediate species observed by OES and the end-
products observed by FTIR. Relative intensities are characterised as strong (s),
medium (m) or weak (w). The input power of the reactor is the maximum achievable
in each case and photographs are given indicating the difference in colour.

127
The emission spectrum of the dry nitrogen gliding arc discharge is dominated by the
characteristic second positive system of neutral molecular N2 C→B in the UV which
is commonly formed in discharges by the primary steps of direct electron impact
excitation of N2(X) to N2(C) or to N2(A) and stepwise excitation to N2(B, C). This
was also observed in the packed bed dielectric barrier discharge in chapter 3.3.1. The
N2(A) metastables are considered to play a key role in promoting plasma chemical
reactions since they are the first electronically excited N2 metastable with an energy
threshold of 6.2 eV and with a lifetime close to 2 s [14]. Weak emission from the
first negative ionic N2+
B → X system is also observed in the violet. The N2+
B → X
ionisation energy is 18.7 eV and it is characteristic in plasmas with high electron
temperature, indicating the non-equilibrium character. The admixture of dodecane
dramatically changes the plasma chemistry in the gliding arc discharge and thus the
emitted spectrum. In this case, N2 C→B is not observed, as the nitrogen metastables
may quench with dodecane to initiate the decomposition. Very strong
chemiluminescence of the CN B → X system is also observed in the violet,
correlatively with the formation of HCN as the major end–product observed in FTIR.
Emission of C2 a → d is also observed at ~ 516 nm but the CH A, B → X system is
not observed. When water is added to the nitrogen plasma, the intensity of the N2
C→B is decreased and dissociation of water can occur either by electron impact
(R 4.1) or by energy transfer reactions as shown to reactions R.4.3 and R4.4 leading
to OH, and subsequently H, O radicals.
R 4.3 N2(A) + H2O → N2(X) + OH+ H [15]
R 4.4 N(2D) + H2O → NH + OH [15]
R4.5 OH + e → O + H + e
It is interesting to note that in the humid nitrogen plasma the dominant emission
belongs to the NH A → X system and the OH A → X system is also observed in the
UV but no H or O emission is observed. Excited NO* as intermediate cannot be seen
due to the transmittance of the Pyrex vessel used. The fact that no NH3 but instead
NO > HNO2 > N2O are formed as end-products seen by FTIR, indicates that NH* is
most likely an intermediate correlated with reaction R 4.4, rather than the reaction
products. The NH radical which could be then oxidised towards NO according to

128
reactions R 4.6, R 4.7 and R 4.8. NO can be formed by N and O or OH radical
recombination, and NO can also react with OH to produce HNO2 as shown in the
reactions below. However, the oxidative environment is not sufficient to form further
oxidation to NO2.
R 4.6 NH + OH → H + HNO k 300 = 3.3 x 10⁻¹¹
cm3 molecule
-1 s
-1 [16]
R 4.7 HNO + O → OH + NO k 300 = 3.8 x 10⁻¹¹
cm3
molecule-1
s-1
[17]
R 4.8 NH + O →NO + H k 300 = 1.6 x 10⁻¹⁰
cm3
molecule-1
s-1
[16]
R 4.9 N + OH → NO + H k 300 = 4.4 x 10⁻¹¹
cm3
molecule-1
s-1
[18]
R 4.0 N + O + M → NO + M k 300 = 7 x 10⁻¹⁰
cm3
molecule-1
s-1
[19]
R 4.11 NO + OH → HNO2 k300 = 3.2 x 10⁻¹¹
cm3 molecule
-1 s
-1 [20]
The addition of 90 ppm dodecane to the N2/H2O plasma does not cause a significant
change to the emission spectrum where again the dominant emission belongs mainly
to the NH A→X system and then to the N2 C→ B system. The intensity of the OH
A→X emission in this case appears slightly decreased as OH and O radicals react
with dodecane to give CO, CO2 and oxygenated end-products. In contrast to the dry
nitrogen-dodecane admixture, in the case of the humid nitrogen-dodecane admixture
only weak peaks of CN B→X and C2 a→d systems are observed, and gaseous HCN
and C2H4, C2H2 hydrocarbons as end-products are measured in low concentrations.
In the humid nitrogen plasma with dodecane, NH3 is observed but no HNO2, as
reactions R 4.6, R 4.7 and R 4.11 may be suppressed by alternative faster reactions of
OH and O reactions with dodecane and subsequent hydrocarbon fragments.
The emission spectra of different admixtures of an air gliding arc discharge are given
in Figure 4.5 and Table 4.3 summarises the intermediate excited species and gaseous
end-products observed in each case.
In the air gliding arc plasma, the emission spectrum is also dominated by the N2
C→B system in the UV range, and the N2+
B → X system is also observed in the
violet. Emission of oxygen atomic O I is observed in the red caused mainly by
electron impact dissociation of molecular oxygen. Other smaller peaks observed in
the red region are caused by second diffraction order of N2 C→ B and N2+
B → X.
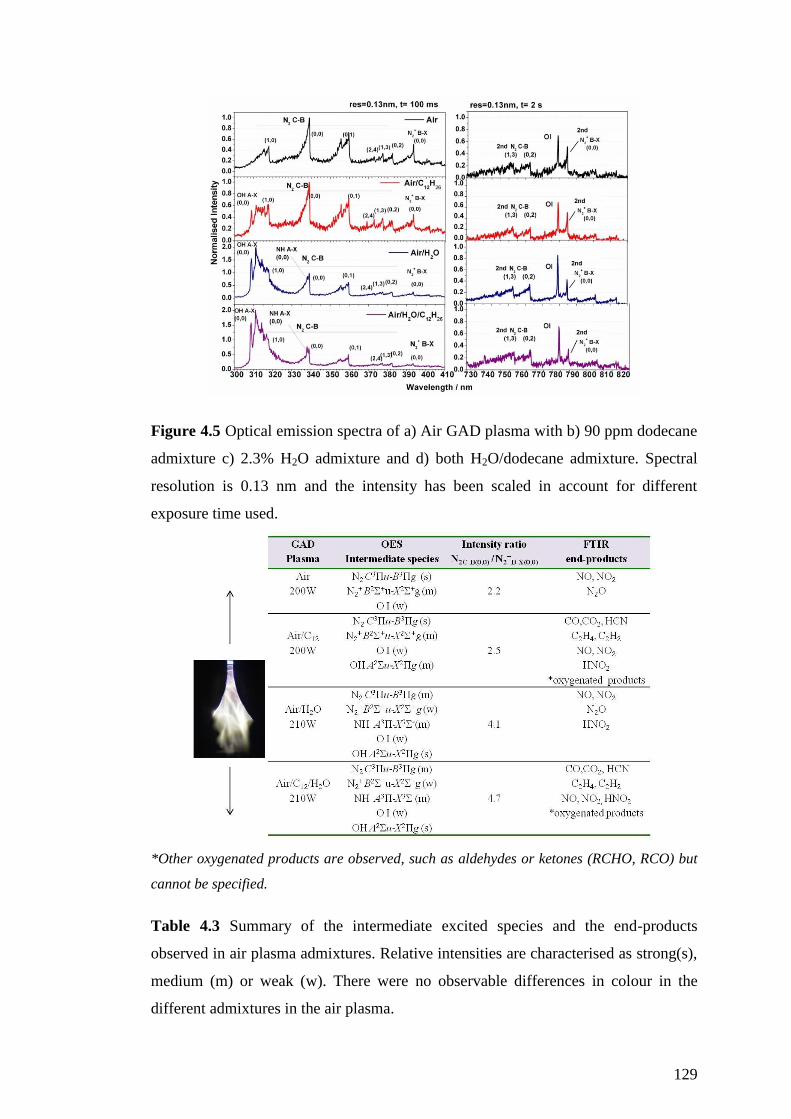
129
Figure 4.5 Optical emission spectra of a) Air GAD plasma with b) 90 ppm dodecane
admixture c) 2.3% H2O admixture and d) both H2O/dodecane admixture. Spectral
resolution is 0.13 nm and the intensity has been scaled in account for different
exposure time used.
*Other oxygenated products are observed, such as aldehydes or ketones (RCHO, RCO) but
cannot be specified.
Table 4.3 Summary of the intermediate excited species and the end-products
observed in air plasma admixtures. Relative intensities are characterised as strong(s),
medium (m) or weak (w). There were no observable differences in colour in the
different admixtures in the air plasma.

130
It is interesting to note that the intensity of the N2 C→B in the air plasma is about 10
times weaker compared to the dry nitrogen discharge indicating the decreased
relative concentration of nitrogen metastables. This is expected, as firstly the plasma
electron energy can more favourably go into electron impact reactions with oxygen
reducing the overall N2* metastables and secondly, nitrogen metastables can be
quenched by oxygen to form nitrogen oxides as end-products such as NO, NO2 and
N2O. However, the intensity of the N2+
B → X (0,0) band head appears similar to the
case of nitrogen discharge and thus the ratio N2 C→B (0,0) /N2+A→X (0,0) in air (
Table 4.3) is smaller than in nitrogen discharge (Table 4.2), suggesting that the
relative concentration of the nitrogen metastables is mainly decreased due to the
reactions with oxygen to form NOx, and less affected by the competitive electron
impact processes with oxygen. When adding dodecane to the air plasma, the
emission of N2 C→B and N2+
B → X intensity is not significantly affected. This
could be an indication that the nitrogen metastables that give rapid reactions to NOx,
may not play an important role in dodecane radical initiation reactions as electron
impact of dodecane does, in the relatively dense gliding arc discharge (ne ~ 1013
cm-3
[8]). In contrast, as described and suggested earlier in Chapter 3.3.3, nitrogen
metastables in the air plasma could play an important role in the radical initiation
reactions of dodecane degradation in a less dense plasma such as the BaTiO3 packed
bed discharge (ne ~ 109 cm
-3 [21] ). The O I emission appears to be decreased in the
air/dodecane admixture, as oxygen atoms react with dodecane to remove H and form
OH radicals and the OH A → X system is also observed in the UV range. In the
humid air plasma, dissociation of water creates extra OH and O radicals, where OH
A → X is the dominant emission and O I emission appears increased. Similar to the
humid nitrogen spectrum described before, N2 C→B is decreased as nitrogen
metastables may also contribute to the water dissociation and NH radicals could also
form, according to Reaction 4.4 given before. The emission spectrum when dodecane
is added to humid air appears similar to that for humid air, only in this case the
intensity of the N2 C→B band and O I line are decreased indicating their reaction
with the hydrocarbon.
The emission spectra of the different gliding arc plasma systems have been used to
obtain rotational and vibrational temperatures from characteristic band heads as
shown in Table 4.4 where they are compared with the gas temperature and input
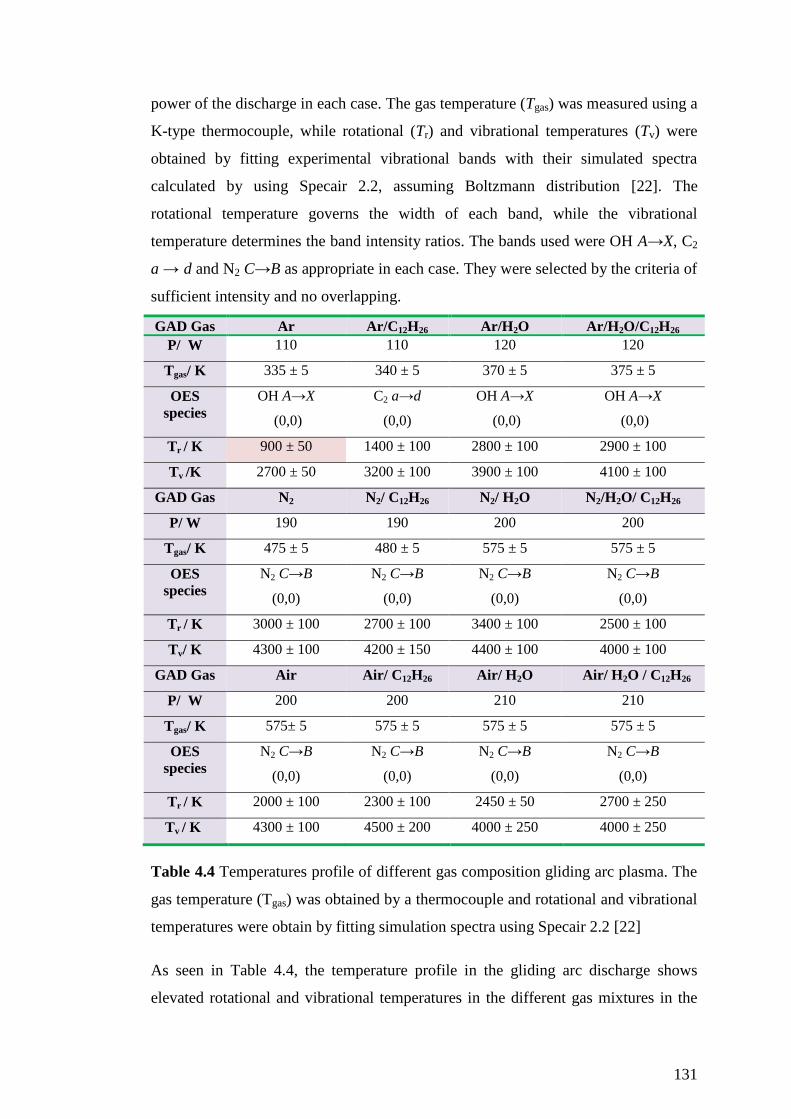
131
power of the discharge in each case. The gas temperature (Tgas) was measured using a
K-type thermocouple, while rotational (Tr) and vibrational temperatures (Tv) were
obtained by fitting experimental vibrational bands with their simulated spectra
calculated by using Specair 2.2, assuming Boltzmann distribution [22]. The
rotational temperature governs the width of each band, while the vibrational
temperature determines the band intensity ratios. The bands used were OH A→X, C2
a → d and N2 C→B as appropriate in each case. They were selected by the criteria of
sufficient intensity and no overlapping.
GAD Gas Ar Ar/C12H26 Ar/H2O Ar/H2O/C12H26
P/ W 110 110 120 120
Tgas/ K 335 ± 5 340 ± 5 370 ± 5 375 ± 5
OES
species
OH A→X
(0,0)
C2 a→d
(0,0)
OH A→X
(0,0)
OH A→X
(0,0)
Tr / K 900 ± 50 1400 ± 100 2800 ± 100 2900 ± 100
Tv /K 2700 ± 50 3200 ± 100 3900 ± 100 4100 ± 100
GAD Gas N2 N2/ C12H26 N2/ H2O N2/H2O/ C12H26
P/ W 190 190 200 200
Tgas/ K 475 ± 5 480 ± 5 575 ± 5 575 ± 5
OES
species
N2 C→B
(0,0)
N2 C→B
(0,0)
N2 C→B
(0,0)
N2 C→B
(0,0)
Tr / K 3000 ± 100 2700 ± 100 3400 ± 100 2500 ± 100
Tv/ K 4300 ± 100 4200 ± 150 4400 ± 100 4000 ± 100
GAD Gas Air Air/ C12H26 Air/ H2O Air/ H2O / C12H26
P/ W 200 200 210 210
Tgas/ K 575± 5 575 ± 5 575 ± 5 575 ± 5
OES
species
N2 C→B
(0,0)
N2 C→B
(0,0)
N2 C→B
(0,0)
N2 C→B
(0,0)
Tr / K 2000 ± 100 2300 ± 100 2450 ± 50 2700 ± 250
Tv / K 4300 ± 100 4500 ± 200 4000 ± 250 4000 ± 250
Table 4.4 Temperatures profile of different gas composition gliding arc plasma. The
gas temperature (Tgas) was obtained by a thermocouple and rotational and vibrational
temperatures were obtain by fitting simulation spectra using Specair 2.2 [22]
As seen in Table 4.4, the temperature profile in the gliding arc discharge shows
elevated rotational and vibrational temperatures in the different gas mixtures in the
132
range of 1300 - 3400 K and 3100 - 4700 K respectively. The only exception is in
case of argon plasma, where the temperatures of the OH A → X band was found to
be lower, Tr = 900 ± 50 and Tv = 2400 ± 50. The difference between the Tr and Tv
temperatures with Tv > Tr is indicative of the non-equilibrium character of the
discharge, however it is rather small compared to other “cold” plasma systems, such
as DBDs [23, 24]. This is not surprising for a “hotter” plasma as a gliding arc
discharge combining both quasi-equilibrium and non-equilibrium physical
characteristics. Czernichowski et al [8] have studied this FENETRe phenomenon
(Fast Equilibrium to Non-Equilibrium Transition) in the GAD, by obtaining
spectroscopic measurements of the N2 C→B band along the electrode axis using two
different models. The temperatures they obtained fall within two ranges of high
temperatures Tr = 2300 - 4000 K, Tv = 3100 - 4000 K and lower temperatures Tr =
800 - 2100 K , Tv = 2000 – 2700 K, showing the quasi-equilibrium and non-
equilibrium zone. However, other researchers have found higher temperatures in the
non-equilibrium zone downstream of the discharge such as Tr = 3700 - 4500 K and
Tv = 4700 - 5500 K [11] , and Tr = 2900 - 3500 K and Tv = 4000 - 4500 K [25]. It is
generally believed that the rotational temperature in non-equilibrium plasmas is close
to the translational gas temperature if the intermolecular rotation-translation
relaxation time is much shorter than the radiative lifetime of the exited state,
allowing thermalisation of the rotational population [26]. In our case, the rotational
temperatures are much higher than the gas temperatures obtained by the
thermocouple 330-380 K, 470-580 K and 570-580 K in argon, nitrogen and air
plasma respectively, and cannot be considered close to the translational temperature.
Bruggeman et al [27] have discussed that non-Boltzmann behaviour can happen due
to the different production processes of the excited species such as, electron impact
or metastable collisions, and it is more likely in non-homogeneous discharges such as
arcs. We only find that the temperature for rotation is close to that for translation in
case of the argon plasma which is found using OH A → X as Tr = 900±50 K. In this
case, OH is produced by the feed argon gas humidity impurities. Its relatively low
concentration could minimise collisions with Ar* and favour direct electron impact
excitation to OH* which can then lead to lower rotational energies and display
Boltzmann behaviour. However, due to the non-homogeneous and quasi-equilibrium
character of the gliding arc discharge, the thermocouple values are taken as more
precise for obtaining the gas temperature.

133
4.3.2 Gas effect on the GAD odourless vapour oil degradation and products
In this section, the GAD degradation of odourless kerosene and dodecane in the
vapour phase will be discussed using the different plasma gases, N2, air and Ar in dry
and humid conditions. The degradation efficiency and end-product distribution is
determined as a function of the maximum input power achievable in each case. As
mentioned before, odourless kerosene (OK) cannot be used for accurate quantitative
analysis, thus only dodecane was used, instead. However, in order to check if
dodecane can be used as a surrogate for OK, the GAD treatment of both dodecane
and OK has been performed.
A comparison between the maximum degradation achieved for OK and dodecane
with the different gases at maximum input power in each case is shown in Figure 4.6.
Both dodecane and OK show similar degradation efficiencies for the same gas and
the same end-products have been identified, showing that dodecane can be
considered a good simulant.
Figure 4.6 The degradation efficiency of both dodecane and odourless kerosene
under gliding arc discharge in argon, nitrogen and air, with maximum input power
achieved in each case.
The maximum conversions observed in air plasma are 43 % and 47% for dodecane
and kerosene, respectively, at a maximum input power of Pmax(air) = 200 W. Plasma

134
in N2 was less efficient for both oils at 32 % and 37 % respectively for Pmax(N2) =
185 W. The maximum input power achieved in the Ar gliding arc plasma was only
Pmax(Ar) = 105 W and resulted in poorer conversion of 12 and 14 %, respectively.
This observation is in contrast with Yan et al’s work on GAD for the decomposition
of hexane (C6H14) comparing also the effect of Ar, N2 and air plasma [28]. They
observed higher decomposition efficiency of the hydrocarbon in an argon plasma
rather than nitrogen plasma, however, as no plasma power parameters are given clear
conclusions cannot be drawn.
The dodecane degradation products observed under the different gas GAD plasma
are shown in Figure 4.7 and the product selectivity for each case is given in Figure
4.8.
Figure 4.7 FTIR absorption spectra of dodecane degradation products in Ar, N2 and
air GAD with input power Pmax(Ar) = 105 W , Pmax(N2) = 185 W, Pmax(air) = 200 W.
The initial concentration of dodecane is 90 ppm in all cases. The resolution is 1 cm-1
.
In the non-oxidative, dry argon gliding arc plasma, electron impact and Ar* reactions
with dodecane lead to methane, ethylene and acetylene with a selectivity C2H2 > CH4
> C2H4, while there is also low selectivity to CO formation due to the < 2 ppm
oxygen impurities in the feed gas. Similarly in the dry nitrogen plasma, dodecane

135
degradation gives a good selectivity to organic hydrocarbons, but the dominant
product formation is HCN and the overall sequence in selectivity is HCN > C2H4 >
C2H2 > CH4 and NH3 and CO are also observed. In the case of air, low selectivity
occurs towards the specified organic hydrocarbon products since the generation of
the reactive O and OH radicals oxidise dodecane and the subsequent fragments to
CO and CO2. The rapid reaction of nitrogen metastables N2* and N* or N atoms with
O and O2 leads to the characteristic formation of NO and NO2, but no N2O is
observed. Additionally, HNO2 is formed by the reaction of OH with NO, but no
HNO3 is observed.
Figure 4.8 Dodecane degradation product selectivity in argon, nitrogen and air in
maximum input power achieved in each case Pmax(Ar) = 110 W , Pmax(N2) = 190 W,
Pmax(air) = 200 W.
It must be noted that the formation of other nitrogenated or oxygenated organic
intermediates such as RNH2, RCN, ROH, RCHO, R1R2CO is possible, but they could
not be identified by FTIR. In addition, soot formation is observed during argon and
nitrogen treatment. Qualitative analysis of the soot by x-ray diffraction (XRD) has
shown that it is formed of amorphous carbon with Fe impurities derived from the
stainless steel electrodes used.

136
Water vapour is important in plasma processing as it can be a major source of OH
and HO2 radicals which may accelerate the oxidation reactions. In this work, the
effect of humid argon, nitrogen and air as carrier gases is investigated and compared
to the dry conditions. The water concentration was 2.3 ± 0.3 % (RH = 75 ± 2 %,
T = 24 °C) in each case. When water is injected into the plasma gas, it can also affect
the physical characteristics of the discharge as electron energy goes into water
dissociation to produce the OH, O radicals, confirmed by OES. That makes the
discharge more stable and stronger, resulting also in an increased power. This effect
has been also observed by Yu et al. [29]. Figure 4.9 and 4.10 show the effect of
humidity on dodecane degradation and end-products selectivity and Table 4.4
summarises the end-products concentration in each case, including as well the NH3,
N2O, NO, NO2 and HNO2 emissions in each case.
Figure 4.9 Effect of humidity on the argon, nitrogen and air gliding arc discharge
degradation of dodecane with the maximum input power achieved in each case.
Initial concentration of dodecane is 90 ppm and H2O = 2.3 ± 0.3 (RH = 75 ± 2%,
t = 24°C).
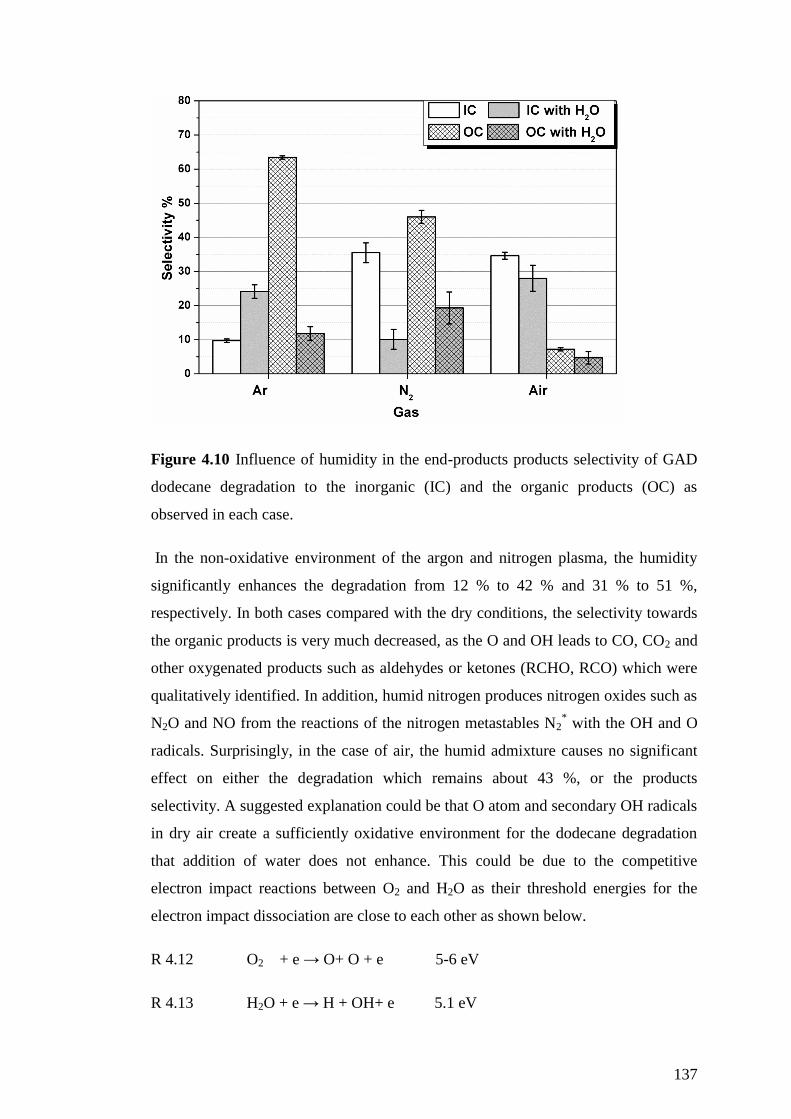
137
Figure 4.10 Influence of humidity in the end-products products selectivity of GAD
dodecane degradation to the inorganic (IC) and the organic products (OC) as
observed in each case.
In the non-oxidative environment of the argon and nitrogen plasma, the humidity
significantly enhances the degradation from 12 % to 42 % and 31 % to 51 %,
respectively. In both cases compared with the dry conditions, the selectivity towards
the organic products is very much decreased, as the O and OH leads to CO, CO2 and
other oxygenated products such as aldehydes or ketones (RCHO, RCO) which were
qualitatively identified. In addition, humid nitrogen produces nitrogen oxides such as
N2O and NO from the reactions of the nitrogen metastables N2* with the OH and O
radicals. Surprisingly, in the case of air, the humid admixture causes no significant
effect on either the degradation which remains about 43 %, or the products
selectivity. A suggested explanation could be that O atom and secondary OH radicals
in dry air create a sufficiently oxidative environment for the dodecane degradation
that addition of water does not enhance. This could be due to the competitive
electron impact reactions between O2 and H2O as their threshold energies for the
electron impact dissociation are close to each other as shown below.
R 4.12 O2 + e → O+ O + e 5-6 eV
R 4.13 H2O + e → H + OH+ e 5.1 eV

138
The reaction R 4.13 with the lower threshold energy could be favoured, decreasing
the relative concentration of O. This could also agree with decrease in emission of
O I between dry and humid air observed in OES and described in the section 4.3.1.
On the other hand, the increased relative concentration of OH could react not only
with dodecane but also with NO to form HNO2. As we observe in Table 4.5,
humidity slightly decreases the amount of NO and NO2 in the air plasma, while
HNO2 is increased. Looking at the reactions below, the reaction rate constant of the
OH with NO is higher than OH with C12H26. In addition, one has to bare in mind that
the relative concentrations of OH and NO are much higher, so the collision
probability is increased.
R 4.14 OH +NO → HNO2 k300 = 3.2 x 10⁻¹¹
cm3
moecule-1
s-1
[20]
R 4.15 OH + C12H26 → products + H2 k300 =1.32 x 10⁻¹¹
cm3
molecule-1
s-1
[30]
Product/
ppm
Ar/
C12
Ar/H2O
/C12
N2/
C12
N2/
H2O
N2/
H2O/
C12
Air Air/
C12
Air/
H2O
Air/
H2O/
C12
CH4 19.9 37.0 37.5 - 60.5 - - - -
C2H4 14.7 1.0 25.3 - 6.3 - 8.9 - 7.6
C2H2 6.0 1.1 13.7 - 1.7 - 2.5 - 1.2
HCN - - 127.02 - 12.2 - 8.4 - 4.2
NH3 - - 5.7 - 5.2 - - -
CO 10.7 68.4 20.9 - 100.3 - 104.6 - 70.5
CO2 - 15.6 - - 39.8 - 91.7 - 105.4
N2O - - - 4.4 3.8 3.8 2.9 2.4 2.5
NO - - 337.3 228.5 1180.2 873.1 906.2 811.7
NO2 - - - - - 1860.1 1980.5 1579.1 1669.2
HNO2 - - - 68.5 - - 138.36 527.2 455.85
Table 4.5 The end-products concentration in the different admixtures of gliding arc
NO, NO2, N2O and HNO2 formation in gliding arc discharge. Uncertainty is < 2%

139
4.3.3 The oxygen effect on dodecane GAD degradation in N2 /O2 mixtures and end-
products formation
The influence of oxygen concentration in the N2-O2 mixture gliding arc plasma
treatment of dodecane has been studied in order to identify potential optimal
conditions. It is generally believed that increasing oxygen can enhance volatile
organic compounds degradation by promoting complete oxidation to CO2. However,
there are cases where the optimal conditions have been found for only small
concentrations of oxygen, such as 3 % O2 in case of dichloromethane in a packed
bed discharge [31, 32], or best destruction rates have been noted in the absence of
oxygen in dry nitrogen packed bed plasma of methane [33] and butane [34]. Our
work on the O2 % variation in N2-O2 mixtures in the packed bed discharge as
described in chapter 3 showed no effect to the degradation of dodecane for O2
concentration up to 40 %, where only the NOx production was increased. In this
work, the oxygen concentration steps were 0, 2, 4, 6, 8, 10, 15 and 20 % vol. and the
influence on the dodecane degradation efficiency is depicted in Figure 4.11.
Figure 4.11 Oxygen concentration effect on 90 ppm dodecane plasma degradation in
N2-O2 mixture GAD, at maximum input power Pin = 190-200 W and Q = 5 L min-1
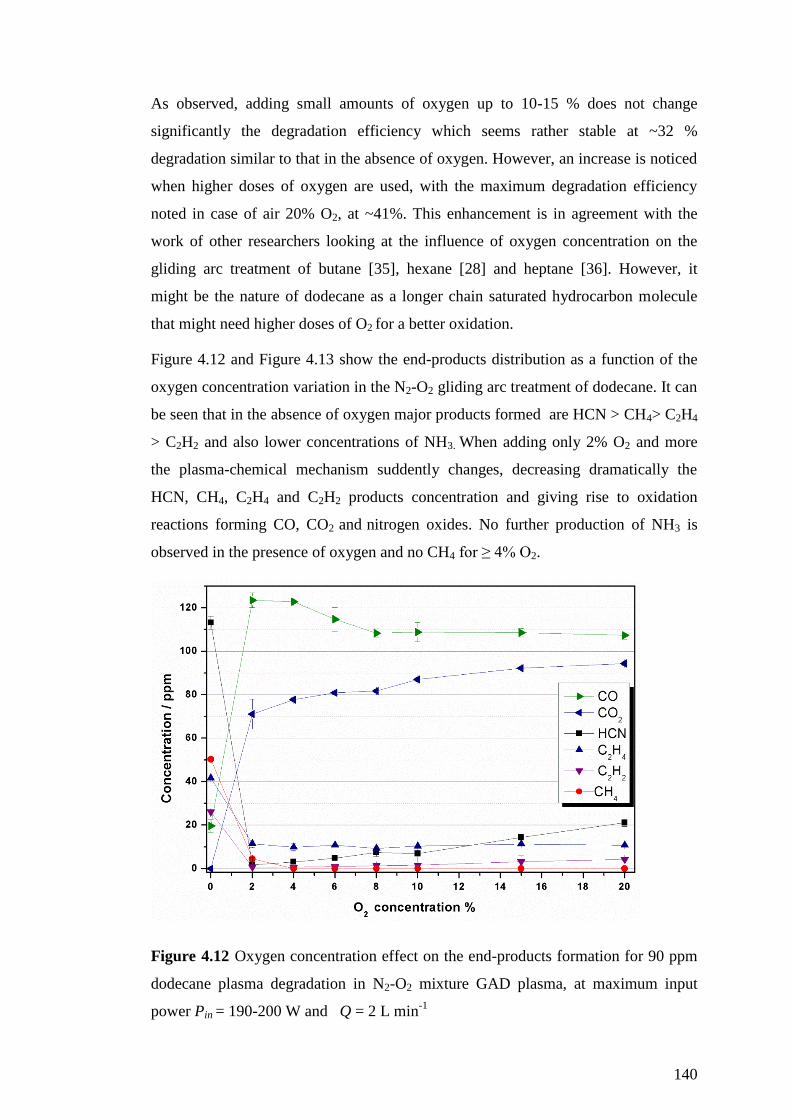
140
As observed, adding small amounts of oxygen up to 10-15 % does not change
significantly the degradation efficiency which seems rather stable at ~32 %
degradation similar to that in the absence of oxygen. However, an increase is noticed
when higher doses of oxygen are used, with the maximum degradation efficiency
noted in case of air 20% O2, at ~41%. This enhancement is in agreement with the
work of other researchers looking at the influence of oxygen concentration on the
gliding arc treatment of butane [35], hexane [28] and heptane [36]. However, it
might be the nature of dodecane as a longer chain saturated hydrocarbon molecule
that might need higher doses of O2 for a better oxidation.
Figure 4.12 and Figure 4.13 show the end-products distribution as a function of the
oxygen concentration variation in the N2-O2 gliding arc treatment of dodecane. It can
be seen that in the absence of oxygen major products formed are HCN > CH4> C2H4
> C2H2 and also lower concentrations of NH3. When adding only 2% O2 and more
the plasma-chemical mechanism suddently changes, decreasing dramatically the
HCN, CH4, C2H4 and C2H2 products concentration and giving rise to oxidation
reactions forming CO, CO2 and nitrogen oxides. No further production of NH3 is
observed in the presence of oxygen and no CH4 for ≥ 4% O2.
Figure 4.12 Oxygen concentration effect on the end-products formation for 90 ppm
dodecane plasma degradation in N2-O2 mixture GAD plasma, at maximum input
power Pin = 190-200 W and Q = 2 L min-1
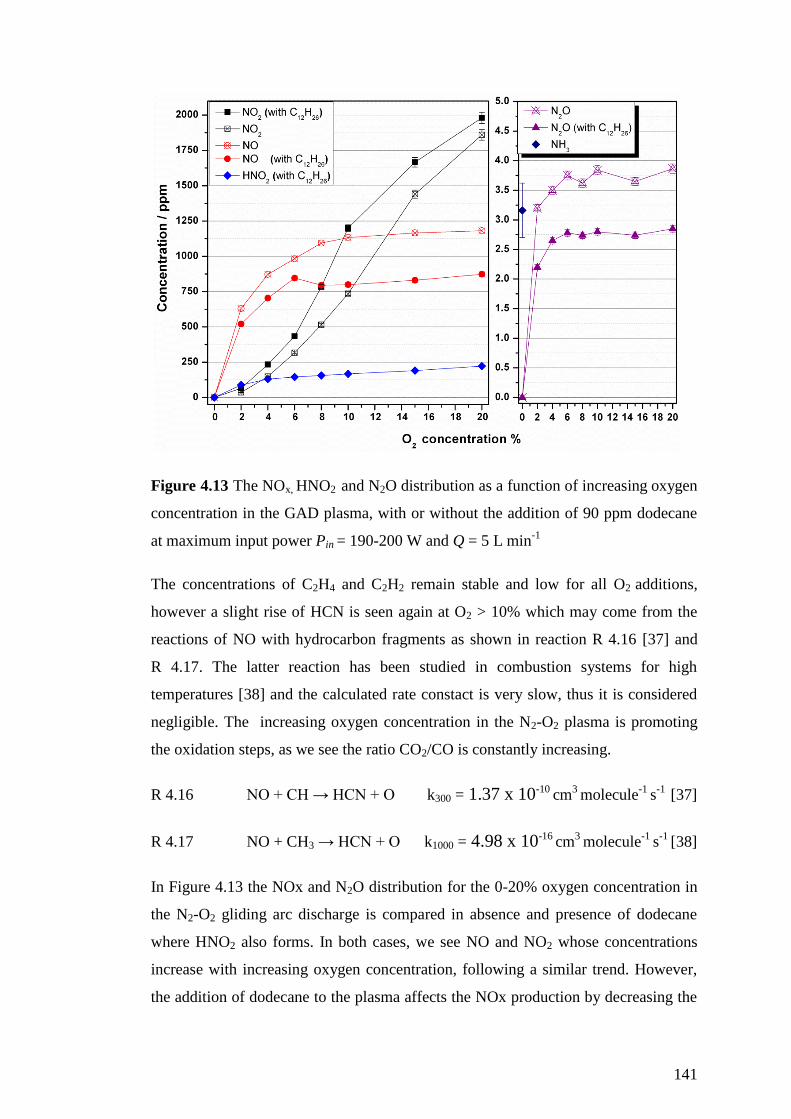
141
Figure 4.13 The NOx, HNO2 and N2O distribution as a function of increasing oxygen
concentration in the GAD plasma, with or without the addition of 90 ppm dodecane
at maximum input power Pin = 190-200 W and Q = 5 L min-1
The concentrations of C2H4 and C2H2 remain stable and low for all O2 additions,
however a slight rise of HCN is seen again at O2 > 10% which may come from the
reactions of NO with hydrocarbon fragments as shown in reaction R 4.16 [37] and
R 4.17. The latter reaction has been studied in combustion systems for high
temperatures [38] and the calculated rate constact is very slow, thus it is considered
negligible. The increasing oxygen concentration in the N2-O2 plasma is promoting
the oxidation steps, as we see the ratio CO2/CO is constantly increasing.
R 4.16 NO + CH → HCN + O k300 = 1.37 x 10⁻¹⁰ cm
3 molecule
-1 s
-1 [37]
R 4.17 NO + CH3 → HCN + O k1000 = 4.98 x 10⁻¹⁶ cm
3 molecule
-1 s
-1 [38]
In Figure 4.13 the NOx and N2O distribution for the 0-20% oxygen concentration in
the N2-O2 gliding arc discharge is compared in absence and presence of dodecane
where HNO2 also forms. In both cases, we see NO and NO2 whose concentrations
increase with increasing oxygen concentration, following a similar trend. However,
the addition of dodecane to the plasma affects the NOx production by decreasing the

142
NO concentration and increasing NO2. The decrease of NO can be assigned both to
the reaction with OH to form HNO2 (R 4.14), but also to the reaction with peroxy
radicals as intermediate hydrocarbon oxidation products which promotes its
oxidation to NO2 [39-42].
R 4.18 ROO + NO → RO + NO2
It is also interesting to note that the concentration of NO2 becomes greater than that
for NO at 15% O2 in absence of the hydrocarbon but at ≥ of 8% when dodecane is
added indicating the promotion of NO to NO2 by reaction R 4.18. Low
concentrations of N2O are observed both with or without dodecane, which are
slightly increased with increasing oxygen concentration following the same trend.
The lower N2O concetration in presense of dodecane is expected due to competative
reactions of N2* and O with dodecane.
4.3.4 The plasma-chemical degradation of vapour dodecane in the gliding arc
discharge, comparison with BaTiO3 packed bed discharge treatment.
The principal processes of the destruction of gaseous pollutants in plasma include
primary charge or energy transfer reactions (10-8
s) and secondary radical impact
reactions (≤ 10-3
s) to cause dissociation of the pollutants [43]. Usually, due to their
larger timescale, radical reactions are considered more for the decomposition
mechanism. However primary reactions are important for their initiation. The
plasma-chemical degradation of dodecane vapour has been discussed earlier for the
nitrogen and air BaTiO3 packed bed discharge. In this section, the degradation
mechanism will be discussed for the case of dry and humid argon, nitrogen and air
gliding arc discharge and any differences will be emphasised.
It has to be noted that the physical characteristics of the BaTiO3 packed bed
discharge and gliding arc discharge are very different. The first one is considered to
be generally homogeneous and the occurrence of the microdischarges creates high
mean electron energies ~ 4-5 eV, but low electron densities at ~ 108 cm
-3 [21], while
the “quenched” gliding arc discharge has a less homogeneous character, with a lower
mean electron energy ~ 1 eV, but the electron density is much higher at ~1013
cm-3
[8]. In addition, the energy deposited in the packed bed discharge was SIEmax = 42 J

143
L-1
, while in case of gliding arc discharge and using the assumption that the
discharge power is approximately equal to the input power used, the energy density
was SIEmax = 1200 - 2400 J L-1
. As discussed in chapter 3.3.4, electron impact
reactions with dodecane were not considered significant in the packed bed discharge,
however it would be inaccurate to ignore them in the higher electron density
discharge of gliding arc.
In the argon GAD, the primary electron impact reactions generate excited argon
species such as Ar (4p), Ar (5p) and argon metastables Arm (4s), and in less extend
excited singly ionised Ar+*
, as also observed in our OES observations by the
emission of Ar I and Ar II. Reactions are given below:
Electron impact excitation
R 4.19 e + Ar → e + Arm*Ar
* or Ar
** ΔE = 11.5 - 11.7, 13.08 - 13.33 or 14.7 eV
Electron impact ion excitation
R 4.20 e + Ar+ → e + Ar
+* ΔE = 19.6 - 24.3 eV
The argon metastables considered to be the dominant reactive species (see chapter
1.8) while excited argon ions can be neglected as their relative concentration is
expected to be very low, due to the high ionisation energy required. Thus, the main
decomposition paths of dodecane in the argon GAD is considered to be by electron
impact dissociation or by Ar* energy transfer reactions, followed by homolytic
scission of the C-C or C-H bond. The electron impact dissociation is believed to
more likely happen indirectly, by electron impact ionisation followed by dissociative
recombination [44] :
R 4.21 e + C12H26 → C12H26+
+ 2e
e + C12H26+ → C12H25 + H, or → R1 + R2
R 4.22 Ar* + C12H26 → C12H26
* + Ar
→ C12H25 + H, or → R1 + R2
where, R1, R2 are the alkyl radicals derived from the C-C homolytic scission in the
different possible carbon atom positions.

144
It was discussed earlier in chapter 3.3.4 that the cleavage of C-H and C-C bond is
more thermodynamically favoured at the C4 carbon forming subsequent alkyl
radicals. Chain radical reactions with simultaneous β-scission C2H4 elimination and
methyl fragments breakdown, can then lead to the final C2H4, C2H2 and CH4
products, as shown in Figure 4.14.
In humid argon conditions, water dissociation by electron impact reactions can
happen both directly and indirectly by dissociative electron attachment [45] , but also
by Ar* energy transfer reactions [46] to generate OH, O and H radicals. These
radicals can not only contribute to the initiation step of the radical degradation
mechanism by H-abstraction reactions but also react rapidly with the different alkyl
fragments to create oxygenated intermediates and finally CO and CO2, increasing the
overall decomposition rate. A summary of these processes is given in Figure 4.14.
Figure 4.14 Schematic summary of plasma-chemical decomposition of dodecane in
dry and humid Ar gliding arc discharge
It is interesting to note that when water is added to the argon-dodecane plasma
processing, the selectivity to C2H4, C2H2 hydrocarbons is decreased in favour of
oxygenated products formation, whilst the selectivity to CH4 is increased. This
suggests that we should consider the recombination reaction R 4.23 as being more
significant in humid conditions, due to the higher concentration of H radicals coming
from dissociation of water. In this case, reaction R 4.23 is favoured over the
competitive reaction R 4.24, and it is suggested that pathway A in Figure 4.14 is

145
more likely than pathway B for the formation of CO and CO2 oxidation products.
Indeed, kinetics of O, OH reaction with other alkyl fragments heavier than methyl
support this argument, as shown in reactions R 4.23- R 4.26:
R 4.23 CH3 + H → CH4 k300 = 3.21 x 10⁻¹⁰
cm3
molecule-1
s-1
[47]
R 4.24 CH3 + O → CH2O + H k300 = 1.30 x 10⁻¹⁰
cm3
molecule-1
s-1
[48]
R 4.25 C4H9 + H → C4H10 k300 = 4.26 x 10⁻¹¹
cm3
molecule-1
s-1
[47]
R 4.26 C4H9 + O → CH2O + C3H7 k300 = 1.59 x 10⁻¹⁰
cm3
molecule-1
s-1
[49]
The nitrogen plasma dodecane degradation has been discussed earlier in the case of
packed bed discharge. In the dry N2 GAD, the mean electron energy of ~1 eV gives a
higher probability to create vibrationally excited nitrogen N2 and in a less extent N
radicals. This is different in N2 packed bed discharge, where the higher mean
electron energy of 4-5 eV creates a higher probability of N radical generation due to
the higher energy for dissociation [50]. Thus, in GAD, N2* charge transfer and
electron impact reactions are more likely to play a significant role in the initial
dodecane breakdown, while H-abstraction by N radicals could be considered to be
less important. The fact that between the end-products in GAD, there are high
concentrations of HCN and hydrocarbons but low concentrations of NH3, while in PB
plasma the formation of ammonia is more significant, shows an extra indication to
support this suggestion. In humid N2 GAD, the generation of OH, O radical create
an oxidative environment which enhances the dodecane degradation and leads to the
formation of CO and CO2 and low concentrations of HCN and NH3. The N2/H2O
GAD reactions are summarised in Figure 4.15.
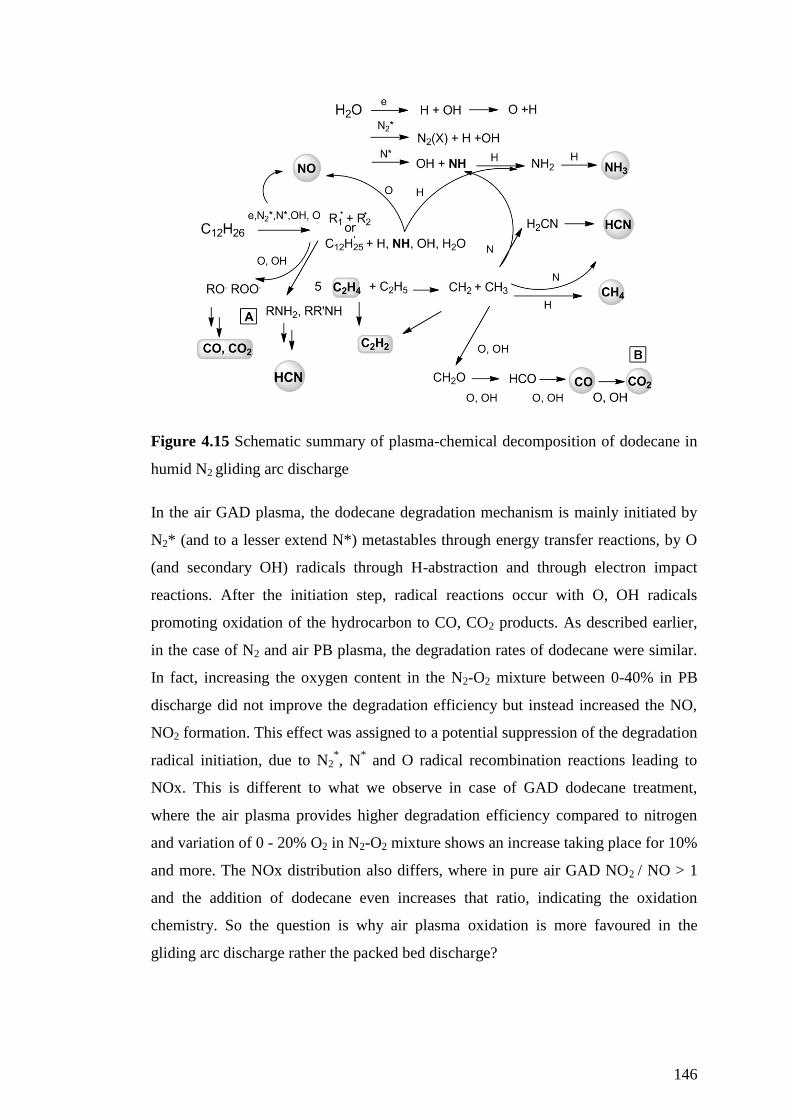
146
Figure 4.15 Schematic summary of plasma-chemical decomposition of dodecane in
humid N2 gliding arc discharge
In the air GAD plasma, the dodecane degradation mechanism is mainly initiated by
N2* (and to a lesser extend N*) metastables through energy transfer reactions, by O
(and secondary OH) radicals through H-abstraction and through electron impact
reactions. After the initiation step, radical reactions occur with O, OH radicals
promoting oxidation of the hydrocarbon to CO, CO2 products. As described earlier,
in the case of N2 and air PB plasma, the degradation rates of dodecane were similar.
In fact, increasing the oxygen content in the N2-O2 mixture between 0-40% in PB
discharge did not improve the degradation efficiency but instead increased the NO,
NO2 formation. This effect was assigned to a potential suppression of the degradation
radical initiation, due to N2*, N
* and O radical recombination reactions leading to
NOx. This is different to what we observe in case of GAD dodecane treatment,
where the air plasma provides higher degradation efficiency compared to nitrogen
and variation of 0 - 20% O2 in N2-O2 mixture shows an increase taking place for 10%
and more. The NOx distribution also differs, where in pure air GAD NO2 / NO > 1
and the addition of dodecane even increases that ratio, indicating the oxidation
chemistry. So the question is why air plasma oxidation is more favoured in the
gliding arc discharge rather the packed bed discharge?

147
One reason can be related to the electron density and input energy dissipated in the
discharge in each case. As mentioned earlier, the electron impact radical initiation
reactions should not be neglected in the case of the GAD as higher electron energy
density plasma compared to PB plasma. Thus, if in the air packed bed plasma the
radical initiation is suppressed by the rapid N2*, N
* reactions with O to form NOx, in
air GAD electron impact reactions could create radicals than then could promote
oxidation reactions with O, OH radicals. This can also explain the NOx distribution
in the air GAD where the formation of peroxy radicals such as HOO•, ROO
• promote
the oxidation ratio NO2 / NO >1 [41, 42].
In the humid air GAD plasma, the dissociation of water creates OH and O radicals
that can also participate in the radical initiation step of dodecane degradation.
However as discussed earlier, humidity has caused no improvement to the overall
degradation but instead has increased significantly the HNO2 formation. A summary
of the dry and humid air reactions are given in Figure 4.16.
Figure 4.16 Schematic summary of plasma-chemical decomposition of dodecane in
dry and humid gliding arc discharge

148
4.4 Summary & Conclusions
The gliding arc discharge has been used as a source of low temperature plasma for
the treatment of oil in the vapour phase, in order to investigate the gas chemistry and
identify optimal conditions, before the plasma-liquid treatment. The effect of
different gas compositions such as dry or humid Ar, N2 and air plasma, or the
variation of 0-20 % oxygen to N2-O2 mixture plasma gas has been studied.
A comparison between the treatment of the target oils such as odourless kerosene and
n-dodecane in Ar, N2 and air GAD showed similar degradation efficiency and end-
product formation. Thus, n-dodecane was chosen as a simulant for further
experiments in order to perform quantitative analysis.
Changing the plasma gas composition causes observable changes to the gliding arc
plasma characteristics and thus the plasma-chemical dodecane degradation and end-
products formation. OES diagnostics at different conditions show a strong correlation
between the intermediate excited species and the end-products. The rotational and
vibrational temperature from the different species shows the non-equilibrium degree
of the discharge. However, rotational temperature values in most cases are high
(Tr = 1300 – 3500 K) and cannot be used to obtain the translational gas temperature.
In case of dry argon plasma, the rotational temperature of OH* is lower
Tr = 900 ± 50 K. However, thermocouple measurements are taken as more reliable
values for the gas temperatures which are 330 - 380 K, 470 - 580 K and 570 - 580 K
in the different argon, nitrogen and air admixtures respectively.
In dry conditions, the maximum dodecane degradation achieved was 41% with the
air plasma. The variation of oxygen concentration before 0-20 % in the N2-O2
mixture showed a degradation increase for O2 >10% with optimal conditions in case
of air (20% O2). The increasing oxygen concentration promotes oxidation and
increases the ratios of CO2/CO and NO2/NO. However there is a significant amount
of NOx production.
Humidity increases significantly the degradation efficiency in the Ar and N2 GAD
by about 70% and 40%, respectively, but not in case of air plasma. Humid nitrogen
gives the best degradation efficiency with an overall of 51% degradation. However
humid argon gives better selectivity towards CO, CO2 and better energy efficiency.
Table 4.6 compares the energy efficiency in PB and GAD plasma.
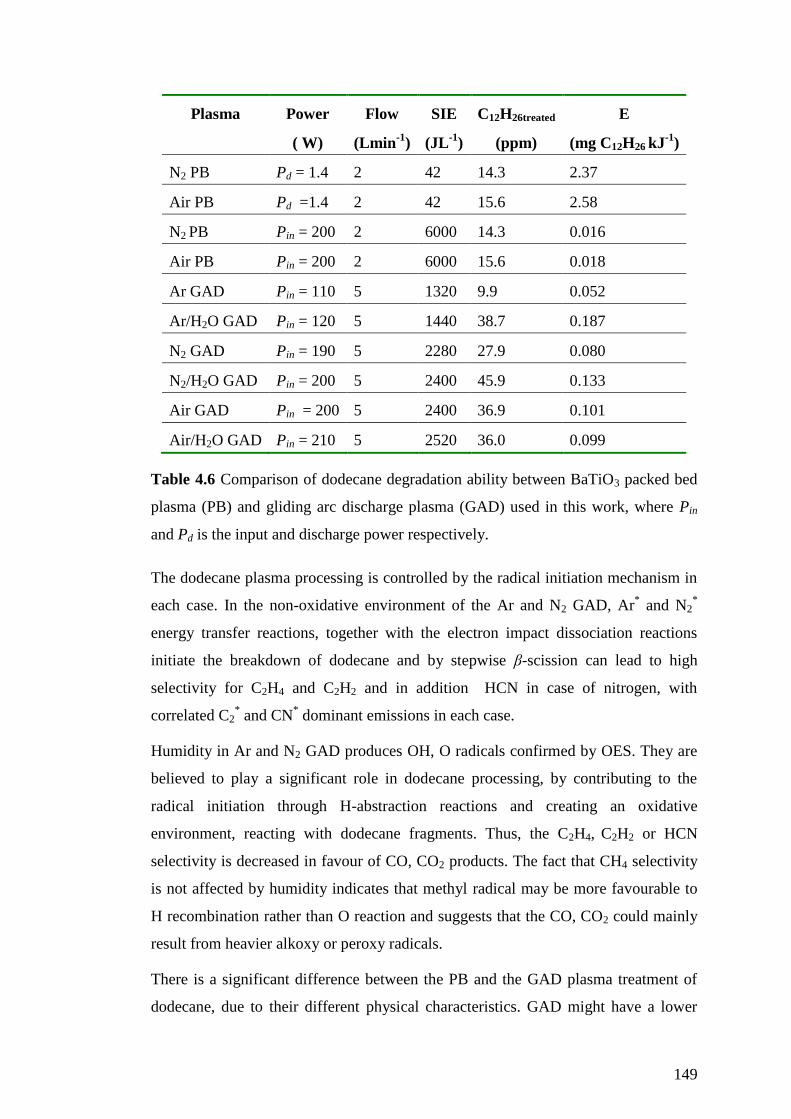
149
Plasma Power
( W)
Flow
(Lmin-1
)
SIE
(JL-1
)
C12H26treated
(ppm)
E
(mg C12H26 kJ-1
)
N2 PB Pd = 1.4 2 42 14.3 2.37
Air PB Pd =1.4 2 42 15.6 2.58
N2 PB Pin = 200 2 6000 14.3 0.016
Air PB Pin = 200 2 6000 15.6 0.018
Ar GAD Pin = 110 5 1320 9.9 0.052
Ar/H2O GAD Pin = 120 5 1440 38.7 0.187
N2 GAD Pin = 190 5 2280 27.9 0.080
N2/H2O GAD Pin = 200 5 2400 45.9 0.133
Air GAD Pin = 200 5 2400 36.9 0.101
Air/H2O GAD Pin = 210 5 2520 36.0 0.099
Table 4.6 Comparison of dodecane degradation ability between BaTiO3 packed bed
plasma (PB) and gliding arc discharge plasma (GAD) used in this work, where Pin
and Pd is the input and discharge power respectively.
The dodecane plasma processing is controlled by the radical initiation mechanism in
each case. In the non-oxidative environment of the Ar and N2 GAD, Ar* and N2
*
energy transfer reactions, together with the electron impact dissociation reactions
initiate the breakdown of dodecane and by stepwise β-scission can lead to high
selectivity for C2H4 and C2H2 and in addition HCN in case of nitrogen, with
correlated C2* and CN
* dominant emissions in each case.
Humidity in Ar and N2 GAD produces OH, O radicals confirmed by OES. They are
believed to play a significant role in dodecane processing, by contributing to the
radical initiation through H-abstraction reactions and creating an oxidative
environment, reacting with dodecane fragments. Thus, the C2H4, C2H2 or HCN
selectivity is decreased in favour of CO, CO2 products. The fact that CH4 selectivity
is not affected by humidity indicates that methyl radical may be more favourable to
H recombination rather than O reaction and suggests that the CO, CO2 could mainly
result from heavier alkoxy or peroxy radicals.
There is a significant difference between the PB and the GAD plasma treatment of
dodecane, due to their different physical characteristics. GAD might have a lower
150
mean electron energy compared to PB, but it has higher electron density and gives
higher electron power dissipated in the discharge. This gives higher degradation
efficiency compared to PB discharge, but it appears more energy demanding (Table
4.6). However, the reactor was designed for the plasma-liquid waste treatment and
higher power is needed to treat concentrated organics.
For future plasma-liquid treatment, humid argon and humid nitrogen conditions look
favourable in terms of degradation efficiency and avoiding the excess NOx
formation.
4.5 References
[1] H. Lesueur, Czernichowski, A, Chapelle, J. , "Dispositif de génération de
plasma basse température par formation de décharges électriques glissantes,"
French Patent 2, 639, 172, 1988.
[2] A. Czernichowski, Czernichowski I., Chapelle J., Fouillac C., Lesueur H. ,
"Process for the electrochemical treatment of an hydrogen sulfide containing
gas," European Patent 0394141, 1990.
[3] A. Czernichowski, "Gliding arc: Applications to engineering and
environment control," Pure Appl. Chem., vol. 66, pp. 1301-1310, 1994.
[4] A. Charamel, Czernichowski A., Gorius A. , "Process for plasma-chemical
transformation of N2O into NOx and into derivatives " U.S. Patent 5,711,859,
1998.
[5] P. Czernichowski, Czernichowski A., "Conversion of hydrocarbons assisted
by gliding electric arcs," European Patent, OA10872, 2001.
[6] A. Czernichowski, "Gliding arc: Applications to engineering and
environment control," Pure Appl. Chem., vol. 66, pp. 1301-1310, 1994.
[7] J. L. Brisset, Moussa, D., Doubla, A., Hnatiuc, E., Hnatiuc, B., Youbi, G. K.,
Herry, J. M., Naitali, M., Bellon-Fontaine, M. N., "Chemical reactivity of
discharges and temporal post-discharges in plasma treatment of aqueous
media: Examples of gliding discharge treated solutions," Industrial &
Engineering Chemistry Research, vol. 47, pp. 5761-5781, Aug 2008.
[8] A. Czernichowski, Nassar H., Ranaivosoloarimanana A., Fridman A. A.,
Simeek M., Musiol K., Pawelec E. and Dittrichova L. , "Spectral and
electrical diagnostics of gliding arc," Acta Physica Polonica A vol. 89 pp.
559-568, 1996.
[9] A. Fridman, Nester S., Kennedy L. A., Saveliev A., Mutaf-Yardimci O.,
"Gliding arc gas discharge," Progress in Energy and Combustion Science,
vol. 25, pp. 211-231, 1998.

151
[10] O. Mutaf-Yardimci, Saveliev A.V. Fridman A. A., Kennedy L. A., "Thermal
and nonthermal regimes of gliding arc discharge in air flow," Journal of
Applied Physics, vol. 87, pp. 1632-1641, Feb 2000.
[11] L. Delair, J. L. Brisset and B. G. Cheron, "Spectral, electrical and dynamic
analysis of a 50 Hz gliding arc discharge," Journal of High Temperature
Material Processes vol. 5, pp. 381-403, 2001.
[12] A. Kramida, Ralchenko, Yu., Reader, J., and NIST ASD Team NIST Atomic
Spectra Database (ver. 5.1), Available: http://physics.nist.gov/asd [2013,
September 20]. National Institute of Standards and Technology,
Gaithersburg, MD. [Online].
[13] R. W. B. Pearse, A.G. Gaydon, The identification of molecular spectra, 4th
ed. London: Chapman and Hall, 1976.
[14] V. Guerra, P, A. Sá, J. Loureiro, "Role played by the N2 (A 3 Σ u+) metastable
in stationary N2 and N2 -O2 discharges," Journal of Physics D: Applied
Physics, vol. 34, p. 1745, 2001.
[15] J. T. Herron, "Evaluated Chemical Kinetics Data for Reactions of N(2D),
N(2P), and N2(A3Σu+) in the Gas Phase " J. Phys. Chem. Ref. Data vol. 28,
pp. 1453-1483, 1999.
[16] N. Cohen, K.R. Westberg "Chemical Kinetic Data Sheets for
HighTemperature Reactions. Part II " Journal of physical and chemical
reference data vol. 20, 1991.
[17] S. Inomata, N, Washida, "Rate Constants for the Reactions of NH2 and HNO
with Atomic Oxygen at Temperatures between 242 and 473 K," The Journal
of Physical Chemistry A, vol. 103, pp. 5023-5031, 1999/07/01 1999.
[18] D. Edvardsson, Williams, Christopher F., Clary, David C., "Rate constant
calculations on the N(4S) + OH(2Π) reaction," Chemical Physics Letters, vol.
431, pp. 261-266, 2006.
[19] I. M. Campbell, Thrush, B. A., "The Association of Oxygen Atoms and their
Combination with Nitrogen Atoms," Proceedings of the Royal Society of
London. Series A. Mathematical and Physical Sciences, vol. 296, pp. 222-
232, 1967.
[20] R. B. Atkinson, D.L.; Cox, R.A.; Crowley, J.N.; Hampson, R.F.; Hynes,
R.G.; Jenkin, M.E.; Rossi, M.J.; Troe, J., "Evaluated kinetic and
photochemical data for atmospheric chemistry: Volume I - gas phase
reactions of Ox, HOx, NOx and SOx species," Atmos. Chem. Phys., vol. 4,
pp. 1461 - 1738, 2004.
[21] K. Takaki, Chang J. S., Kostov K. G., "Atmospheric pressure of nitrogen
plasmas in a ferroelectric packed bed barrier discharge reactor. Part I.
Modeling," Dielectrics and Electrical Insulation, IEEE Transactions on, vol.
11, pp. 481-490, 2004.
[22] C. O. Laux, T. G. Spence,C. H. Kruger, R. N. Zare, "Optical diagnostics of
atmospheric pressure air plasmas," Plasma Sources Science and Technology,
vol. 12, p. 125, 2003.

152
[23] Z. Shuai, Wenchun, Wang, Li, Jia, Zhijie, Liu, Yang, Yang, Leyang, Dai,
"Rotational, Vibrational, and Excitation Temperatures in Bipolar
Nanosecond-Pulsed Diffuse Dielectric-Barrier-Discharge Plasma at
Atmospheric Pressure," Plasma Science, IEEE Transactions on, vol. 41, pp.
350-354.
[24] T. Xin, Helen, J. Gallon, J. Christopher Whitehead, "Electrical and
spectroscopic diagnostics of a single-stage plasma-catalysis system: effect of
packing with TiO2," Journal of Physics D: Applied Physics, vol. 44, p.
482003, 2011.
[25] X. Tu, Yu L., Yan J. H., Cen K. F., Cheron B. G., "Dynamic and
spectroscopic characteristics of atmospheric gliding arc in gas-liquid two-
phase flow," Physics of Plasmas, vol. 16, Nov 2009.
[26] B. P. Lavrov, M. Osiac, A. V. Pipa, J. Ropcke, "On the spectroscopic
detection of neutral species in a low-pressure plasma containing boron and
hydrogen," Plasma Sources Science and Technology, vol. 12, p. 576, 2003.
[27] P. Bruggeman, C. Schram Daan, Michael G. Kong , Leys Christophe, "Is the
Rotational Temperature of OH(A–X) for Discharges in and in Contact with
Liquids a Good Diagnostic for Determining the Gas Temperature?," Plasma
Processes and Polymers, vol. 6, pp. 751-762, 2009.
[28] J. Yan, H. Bo, Zh Li X. D., Du Ch M., Cen K. F., Chéron B. G., "Study of
Mechanism for Hexane Decomposition with Gliding Arc Gas Discharge,"
Plasma Chemistry and Plasma Processing, vol. 27, pp. 115-126, 2007/04/01
2007.
[29] L. Yu, J. H. Yan, X. Tu, X. D. Li, S. Y. Lu, K. F. Cen, "Effect of water on
gliding arc discharge fluctuation," EPL (Europhysics Letters), vol. 83, p.
45001, 2008.
[30] R. Atkinson, "Kinetics of the gas-phase reactions of OH radicals with alkanes
and cycloalkanes," Atmospheric Chemistry and Physics, vol. 3, pp. 2233 -
2307, 2003.
[31] C. Fitzsimmons, Ismail, F., Whitehead, J.C., Wilman, J.J., "The Chemistry of
Dichloromethane Destruction in Atmospheric-Pressure Gas Streams by a
Dielectric Packed-Bed Plasma Reactor," The Journal of Physical Chemistry
A, vol. 104, pp. 6032-6038, 2000/06/01 2000.
[32] Z. Abd Allah, "Non-thermal atmospheric plasma for remediation of volatile
organic compounds.," Doctor of Philosophy, School of Chemical Engineering
and Analytical Science, The Univeristy of Manchester, Manchester, 2012.
[33] K. J. Pringle, Whitehead J. C., Wilman J. J., Wu J., "The Chemistry of
Methane Remediation by a Non-thermal Atmospheric Pressure Plasma,"
Plasma Chemistry and Plasma Processing, vol. 24, pp. 421-434, 2004/09/01
2004.
[34] S. Futamura, Zhang A. H., YamamotoT., "The dependence of non-thermal
plasma behavior of VOCs on their chemical structures," Journal of
Electrostatics, vol. 42, pp. 51-62, 1997.
[35] Z. Bo, Yan, J., Li, X., Chi, Y., Cen, K., Chéron, B., "Effects of Oxygen and
Water Vapor on Volatile Organic Compounds Decomposition Using Gliding

153
Arc Gas Discharge," Plasma Chemistry and Plasma Processing, vol. 27, pp.
546-558, 2007.
[36] M. Pospisil, Viden Ivan, Simek Milan,Pekarek Stanislav, "Application of
plasma techniques for exhaust aftertreatment," International Journal of
Vehicle Design, vol. 27, pp. 306-314, 2001.
[37] A. Bergeat, et al., "Product Branching Ratios of the CH + NO Reaction," The
Journal of Physical Chemistry A, vol. 102, pp. 8124-8130, 2013/09/25 1998.
[38] A. C. Baldwin and D. M. Golden, "Reactions of methyl radicals of
importance in combustion systems," Chemical Physics Letters, vol. 55, pp.
350-352, 1978.
[39] R. Dorai, Mark J. Kushner, "Consequences of propene and propane on
plasma remediation of NOx," Journal of Applied Physics, vol. 88, p. 9, 2000.
[40] Y.-S. Mok and I.-S. Nam, "Role of Organic Chemical Additives in Pulsed
Corona Discharge Process for Conversion of NO," JOURNAL OF
CHEMICAL ENGINEERING OF JAPAN, vol. 31, pp. 391-397, 1998.
[41] I. Orlandini and U. Riedel, "Modelling of NO and HC removal by non-
thermal plasmas," Combustion Theory and Modelling, vol. 5, pp. 447-462,
2001/09/01 2001.
[42] B. M. Penetrante, W. J. Pitz, M.C. Hsiao, B.T. Merritt and G.E. Vogtlin,
"Effect of Hydrocarbons on Plasma Treatment of NOx," in Procedings of
the1997 Diesel Engine Emissions Reduction Workshop, 1997.
[43] H. H. Kim, "Nonthermal Plasma Processing for Air-Pollution Control: A
Historical Review, Current Issues, and Future Prospects," Plasma Process.
Polym., vol. 1, p. 91, 2004.
[44] R. Aerts, Tu Xin, De Bie Christophe, Whitehead J. Christopher, Bogaerts
Annemie, "An Investigation into the Dominant Reactions for Ethylene
Destruction in Non-Thermal Atmospheric Plasmas," Plasma Processes and
Polymers, vol. 9, pp. 994-1000, 2012.
[45] Y. Itikawa and N. Mason, "Cross sections for electron collisions with water
molecules," Journal of Physical and Chemical Reference Data, vol. 34, pp. 1-
22, 2005.
[46] X. Xu, "Dynamics of high- and low-pressure plasma remediation," PhD
Thesis, University of Illinois, 2000.
[47] L. B. Harding, et al., "Predictive Theory for Hydrogen Atom - Hydrocarbon
Radical Association Kinetics," The Journal of Physical Chemistry A, vol.
109, pp. 4646-4656, 2013/09/03 2005.
[48] S. M. Aschmann and R. Atkinson, "Rate constants for the reactions of the
NO3 radical with alkanes at 296 ± 2 K," Atmospheric Environment, vol. 29,
pp. 2311-2316, 1995.
[49] W. Hack, et al., "Mechanism of the 1-C4H9 + O reaction and the kinetics of
the intermediate 1-C4H9O radical," Physical Chemistry Chemical Physics,
vol. 3, pp. 2365-2371, 2001.

154
[50] B. M. Penetrante, Bardsley J.N. ,Hsiao M.C., "Kinetic Analysis of Non-
Thermal Plasmas Used for Pollution Control," Japanese Journal of Applied
Physics, vol. Part 1, No. 36, pp. 5007-50017, 1997.

155
Chapter 5
5. Argon Dielectric Barrier Discharge degradation of n-
dodecane in the liquid phase
5.1 Introduction
This chapter investigates the argon DBD plasma treatment of n-dodecane as a first
approach to the plasma-liquid treatment of oil waste. This work was carried out in
the Applied Electrostatics Laboratory in Toyohashi University of Technology in
Japan, as a joint-research project with Prof. Akira Mizuno, under a two months
fellowship supported by Japanese Society for Promotion of Science (JSPS).
Electrical discharges in gas-liquid or liquid environments have been studied for a
number of years. DBD discharges have been also studied in this field mainly in water
environments in applications such as wastewater treatment [1, 2] and biomedical
applications [3, 4]. More recently, DBD discharges in contact with oils have been
also found in applications of surface cleaning [5] or oil upgrading and reforming [6-
8]. When DBD plasma configurations are used for liquid treatment, the liquid could
be considered as one of the dielectrics, as illustrated below in Figure 5.1. In our case
liquid n-dodecane works as the dielectric.
Figure 5.1 Schematic of a dielectric barrier discharge configuration where one
electrode is covered by a dielectric and microdischarges are formed in the discharge
gap [9].
A series of experiments on argon DBD degradation of n-dodecane have been
performed, as a part of a preliminary research on non-thermal methods for the

156
degradation of oil waste. Argon plasma gas was chosen in order to avoid the
undesirable NOx formation found in air mixtures plasmas. Moreover, previous work
has shown it can provide good energy efficiency (Chapter 4). The methods
investigated can be categorised as given below:
i) The effect of HV electrode position in gas or liquid environment
Experiments were performed using the DBD reactor with the HV electrode placed
inside or outside the oil in order to investigate how two different electrode positions
can affect the target liquid treatment as the plasma characteristics are expected to be
different. In the first case, the electrode placed inside the oil and argon gas was
bubbling through the liquid to facilitate the discharge “inside” the liquid. It is
expected that bubbles will enhance the breakdown, increase the reaction surface area
and create intense mixing in order to allow the reactive species to diffuse into the
bulk liquid. In the second case, the HV electrode was placed outside the oil in order
to create an argon discharge “in contact” with the target liquid. The aforementioned
two methods create discharges with different characteristics, so different results are
also expected.
ii) The effect of humidity to the oil degradation
Water vapour is an important factor in plasma processing as it can be a major source
of OH and HO2 radicals which may accelerate the oxidation reactions. In this work,
the effect of humidity is investigated in the argon DBD plasma “inside” and “in
contact” with the target oil.
iii) The effect of temperature to the oil degradation
A temperature increase is expected to enhance the oil degradation by promoting
endothermic reactions and change the product selectivities. Moreover, it may
enhance the generation of OH radicals under humid conditions. In addition, it would
be interesting to determine if the heating influences the electrical discharge
characteristics.

157
5.2 Experimental set-up
Experiments were performed using argon atmospheric pressure DBD plasma for the
treatment of liquid n-dodecane and two main experimental configurations were used
as illustrated in Figure 5.2. The DBD reactor consisted of a 0.5 L quartz glass vessel,
a HV stainless steel mesh plate electrode (d = 3 cm) and an aluminium foil plate (d =
3 cm) as the ground electrode attached on the bottom of the glass vessel (dielectric)
preserving an electrode gap of 6 mm. The first experimental set-up uses the HV
electrode surrounded by the oil. Argon gas is supplied by a capillary glass tube also
submerged in the oil to create bubbles, in order tο generate the discharge “inside” the
liquid (Figure 5.2.a). The second configuration uses the HV electrode above the oil
in an argon gas atmosphere, to create an argon discharge “in contact” with the oil.
Figure 5.2 (A) DBD oil treatment with gas bubbling through the liquid and HV
electrode submerged (B) DBD oil treatment “in contact”. 1) Flow controller, 2)
humidity generation, 4) AC HV stainless steel electrode, 5) aluminium foil ground
electrode, 6) gas outlet for FTIR analysis, 7) PC FTIR control.
158
The power supply consisted of a Trek HV 20/20C amplifier, and an Agilent 33210
10 MHz generator to produce sinusoidal waveforms of maximum Vp-p = ± 20 k V and
I p-p = ± 20 mA at frequency of 1 kHz across the discharge gap. The applied voltage
was measured by an oscilloscope (Tektronix TDS 2014) using a high voltage probe.
When current was allowed to pass across a capacitor (C = 0.1 μF ), the charge could
be collected and the oscilloscope could plot the charge-to-voltage Q-U Lissajous
figures which were used to calculate the discharge power [10] (see also Chapter 3
and Appendix II). Ar (99.998%) was used as the carrier gas passing through the
DBD reactor containing liquid n-dodecane (99%) and the flow was stable at 0.5 L
min-1
. For the humid conditions, argon was passed through a water bubbler, creating
humidity of H2O ~ 3 % (T = 25 ◦C). For the investigation of the temperature effect,
the reactor was placed in a Sibata Lab Ltd oven heater where temperature was set to
100 ◦C. In-line FTIR spectroscopy (BioRad 4000 Excalibur Series) at a resolution of
1 cm-1
set with a long path IR cell (Infrared Analysis Inc, 6 m) was used for the
identification and concentration determination of the gaseous products. After the
plasma treatment of dodecane, there was no obvious change in the liquid colour
which usually indicates the formation of liquid end-products and so no liquid
analysis was performed at this short period of experimental time.
5.3 Results and Discussion
5.3.1. The effect of HV electrode position on argon DBD treatment of liquid n-
dodecane, in dry or humid conditions
When the HV electrode was submerged in the oil without any bubbles feed, the
ignition of DBD was not possible at a voltage ≤ 40 kV and a 1 kHz frequency. This
is not surprising as generally, discharges in liquids are harder to generate in
comparison with gas discharges [11], and also n-dodecane is considered as an
insulator (dielectric liquid) that could act as a second barrier to the dielectric barrier
discharge formation (Figure 5.1). When Ar bubbles are introduced to the reactor, as
shown in Figure 5.2.a, breakdown first occurred at 7.3 kV at 1 kHz frequency. When
the HV electrode is put above the oil with the electron-oil gap at 1 mm, the electrode
gap at 6 mm and with an argon gas flow above the liquid (Figure 5.2b), breakdown
first occurs at 10 kV. These two different configurations create different discharge
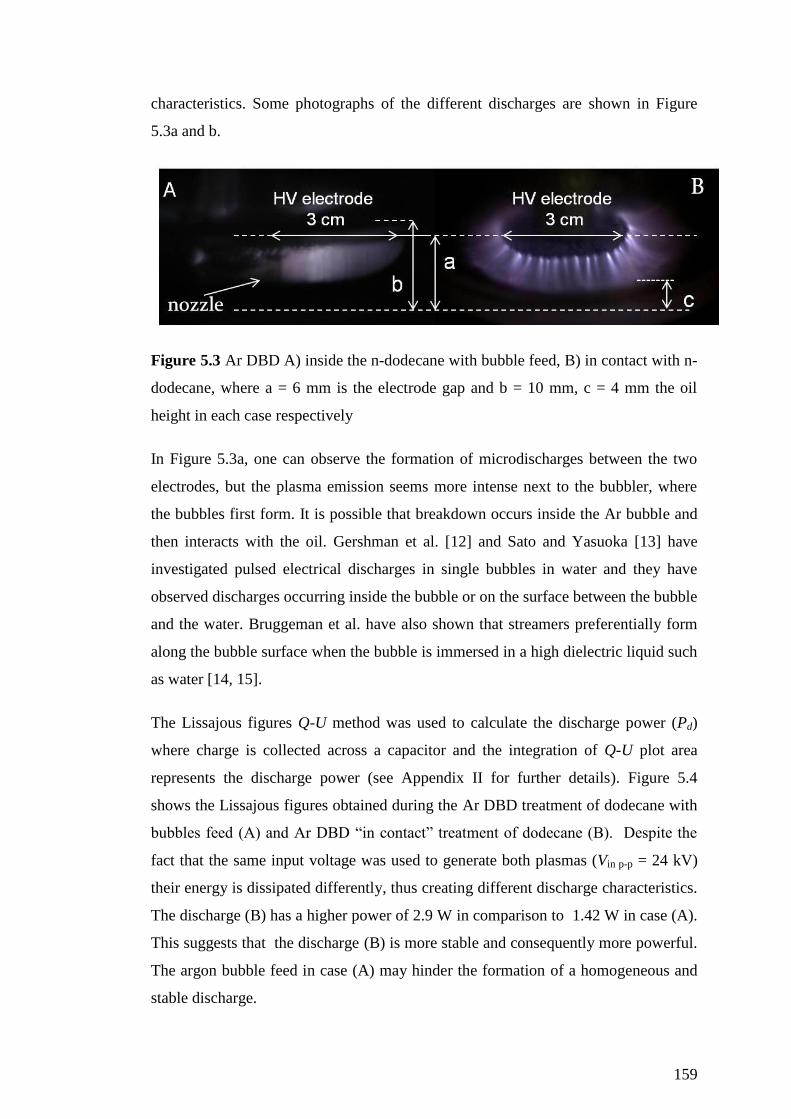
159
characteristics. Some photographs of the different discharges are shown in Figure
5.3a and b.
Figure 5.3 Ar DBD A) inside the n-dodecane with bubble feed, B) in contact with n-
dodecane, where a = 6 mm is the electrode gap and b = 10 mm, c = 4 mm the oil
height in each case respectively
In Figure 5.3a, one can observe the formation of microdischarges between the two
electrodes, but the plasma emission seems more intense next to the bubbler, where
the bubbles first form. It is possible that breakdown occurs inside the Ar bubble and
then interacts with the oil. Gershman et al. [12] and Sato and Yasuoka [13] have
investigated pulsed electrical discharges in single bubbles in water and they have
observed discharges occurring inside the bubble or on the surface between the bubble
and the water. Bruggeman et al. have also shown that streamers preferentially form
along the bubble surface when the bubble is immersed in a high dielectric liquid such
as water [14, 15].
The Lissajous figures Q-U method was used to calculate the discharge power (Pd)
where charge is collected across a capacitor and the integration of Q-U plot area
represents the discharge power (see Appendix II for further details). Figure 5.4
shows the Lissajous figures obtained during the Ar DBD treatment of dodecane with
bubbles feed (A) and Ar DBD “in contact” treatment of dodecane (B). Despite the
fact that the same input voltage was used to generate both plasmas (Vin p-p = 24 kV)
their energy is dissipated differently, thus creating different discharge characteristics.
The discharge (B) has a higher power of 2.9 W in comparison to 1.42 W in case (A).
This suggests that the discharge (B) is more stable and consequently more powerful.
The argon bubble feed in case (A) may hinder the formation of a homogeneous and
stable discharge.

160
Figure 5.4 Lissajous Figures in case of A) the Ar DBD treatment of dodecane with
bubbles feed and B) Ar DBD “in contact” treatment of dodecane, under the same
applied electrical field, Vin p-p = 24 kV, f = 1 kHz and the same electrode gap = 6 mm.
X is the discharge voltage (U) expressed in kV and Y is the charge (Q) expressed in
nC though capacitor of C = 100 nF
Furthermore, the Lissajous figures (Figure 5.4) have different shapes for the two
different discharge configurations. In case (A) the Lissajous figure forms an
ellipsoidal, indicative of diffused discharge and proposed by many researchers to be
a characteristic of surface discharge [16, 17]. This could be an indication that the
discharge occurs along the bubbles surface creating a more uniform charge transport
through the liquid. In case (B) of the “in contact” Ar plasma treatment of the oil, the
Lissajous figure tends to form a parallelogram, a characteristic of a volume non-
uniform filamentary discharge [18, 19].
5.3.2 The influence of humidity and temperature in the DBD treatment of liquid n-
dodecane with the assistance of Ar bubbles
The DBD reactor with the HV electrode submerged in the oil was placed inside a
furnace and a gas flow of Q = 0.5 Lmin-1
through a glass capillary nozzle created the
bubbles feed in the oil. The experiments were performed in dry and humid conditions
at temperatures of 25 ◦C and 100
◦C. In all cases the applied voltage was set at a
maximum of Vin p-p = 40 kV at frequency of 1 kHz. The humidity and temperature
effect on the electrical characteristics is shown in the Lissajous figures recorded in
each case as illustrated in Figure 5.5 below.

161
Figure 5.5 Lissajous figures s for (A) dry argon DBD at 25 ◦C, (B) humid argon
DBD at 25 ◦C, (C) Dry argon DBD at 100
◦C and (D) humid argon DBD at 100
◦C. In
all cases the maximum applied voltage was used (V in p-p = 40 kV) at f = 1 kHz.
The maximum discharge power (Pd) achieved is different in all cases. For both dry
and humid conditions, the increase of temperature at 100 ◦C gives a rise to the
discharge power from 1.4 to 4.3 W and from 0.2 to 17.6 W for the dry and humid
conditions, respectively. In addition, the shape of the Lissajous figure slightly
changes from an ellipsoidal to a more parallelogram-like form. This suggests that
increased temperature may favour the formation of a filamentary discharge. In the
humidity experiments in the case of 25 ◦C temperature, a negative influence on
power is observed. The humidified argon bubbles weaken the discharge formation
and result in an energy drop from 1.4 W to 0.2 W. Moreover, the charge appears
more diffused (Figure 5.5-B). It may be that water vapour requires higher dissipated
power for the breakdown, hindering the formation of a stable discharge. Increasing
the temperature favours the formation of a stronger filamentary discharge, with a
discharge power at 17.6 W (Figure 5.5-D).
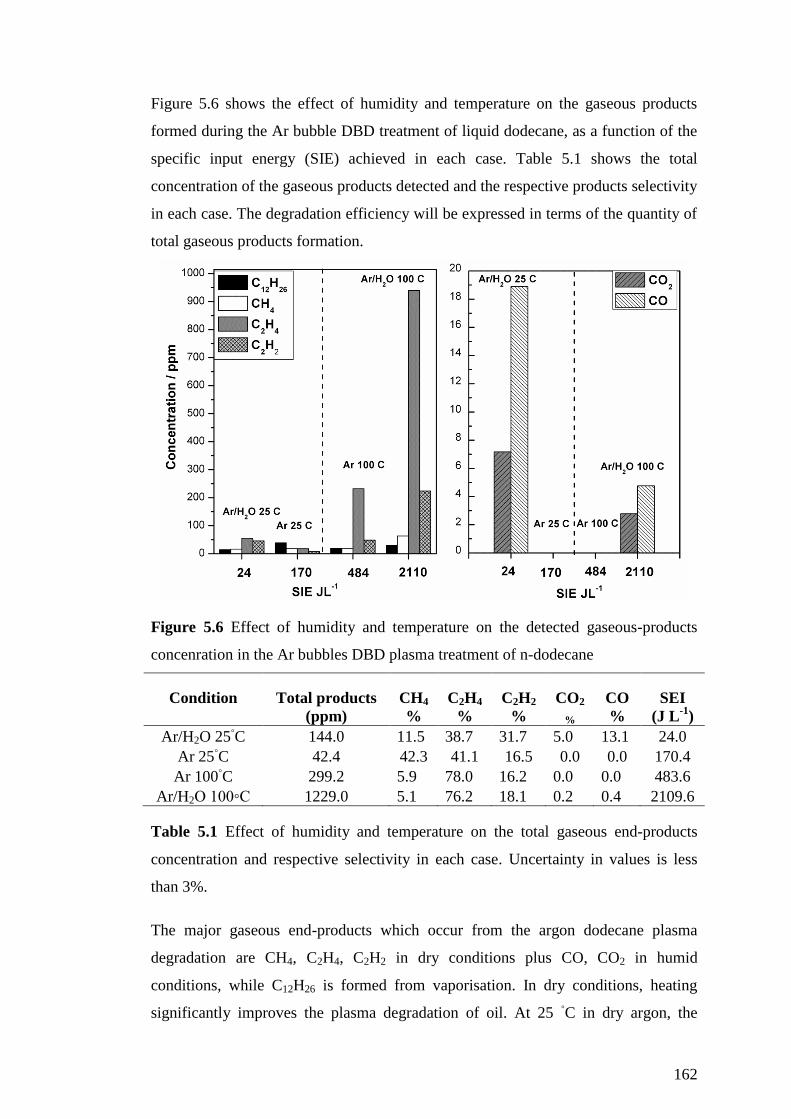
162
Figure 5.6 shows the effect of humidity and temperature on the gaseous products
formed during the Ar bubble DBD treatment of liquid dodecane, as a function of the
specific input energy (SIE) achieved in each case. Table 5.1 shows the total
concentration of the gaseous products detected and the respective products selectivity
in each case. The degradation efficiency will be expressed in terms of the quantity of
total gaseous products formation.
Figure 5.6 Effect of humidity and temperature on the detected gaseous-products
concenration in the Ar bubbles DBD plasma treatment of n-dodecane
Condition
Total products
(ppm)
CH4
%
C2H4
%
C2H2
%
CO2
%
CO
%
SEI
(J L-1
)
Ar/H2O 25◦C 144.0 11.5 38.7 31.7 5.0 13.1 24.0
Ar 25◦C 42.4 42.3 41.1 16.5 0.0 0.0 170.4
Ar 100◦C 299.2 5.9 78.0 16.2 0.0 0.0 483.6
Ar/H2O 100◦C 1229.0 5.1 76.2 18.1 0.2 0.4 2109.6
Table 5.1 Effect of humidity and temperature on the total gaseous end-products
concentration and respective selectivity in each case. Uncertainty in values is less
than 3%.
The major gaseous end-products which occur from the argon dodecane plasma
degradation are CH4, C2H4, C2H2 in dry conditions plus CO, CO2 in humid
conditions, while C12H26 is formed from vaporisation. In dry conditions, heating
significantly improves the plasma degradation of oil. At 25 ◦C in dry argon, the

163
degradation is poor. However, when humidity is added the degradation is improved
by a factor of 3, while the energy dissipated in plasma is decreased by a factor of 7.
This is a significant effect as the overall process efficiency is improved by a factor of
21. At 100 ◦C temperature, the humid argon plasma leads to the discharge of highest
power and also the best degradation yield in this case. Regarding the temperature
effect in humid conditions, the degradation has increased eightfold, giving a good
selectivity to C2H4 of 76.4%. However, the energy dissipated in humid argon plasma
is also increased by a factor of 4. Overall, the humid argon plasma at 25 ◦C appears
to be the most energy efficient degradation of dodecane leading also to a better
selectivity of CO, CO2 products.
5.3.3 The influence of humidity and temperature in the Ar DBD “in contact”
treatment of liquid n-dodecane
In this case, the HV electrode in the DBD reactor has a 2 mm gap distance with the
oil surface and argon gas (Q = 0.5 L min-1
) flows in between to create an “in contact”
plasma treatment. In all cases, the applied voltage was set at a maximum of Vin p-p =
40 kV at a frequency of 1 kHz. The reactor was placed inside a furnace for the
temperature effect experiments at 25 ◦C and 100
◦C. The humid conditions in this
case were created by using an emulsion of oil and water. A ratio of water/oil = 0.1
was chosen for the emulsion and Figure 5.7 shows the effect of humidity on the
discharge colour. The bright blue filaments that appear only in some parts of the
discharge might be formed in the point where water droplets are positioned in the
emulsion. The blue emission could be correlated with high concentration of excited
CH, C2 radicals that are formed from the dodecane dissociation and emit light in the
blue region, as also observed previously in case of Ar/H2O gliding arc discharge in
Chapter 4.
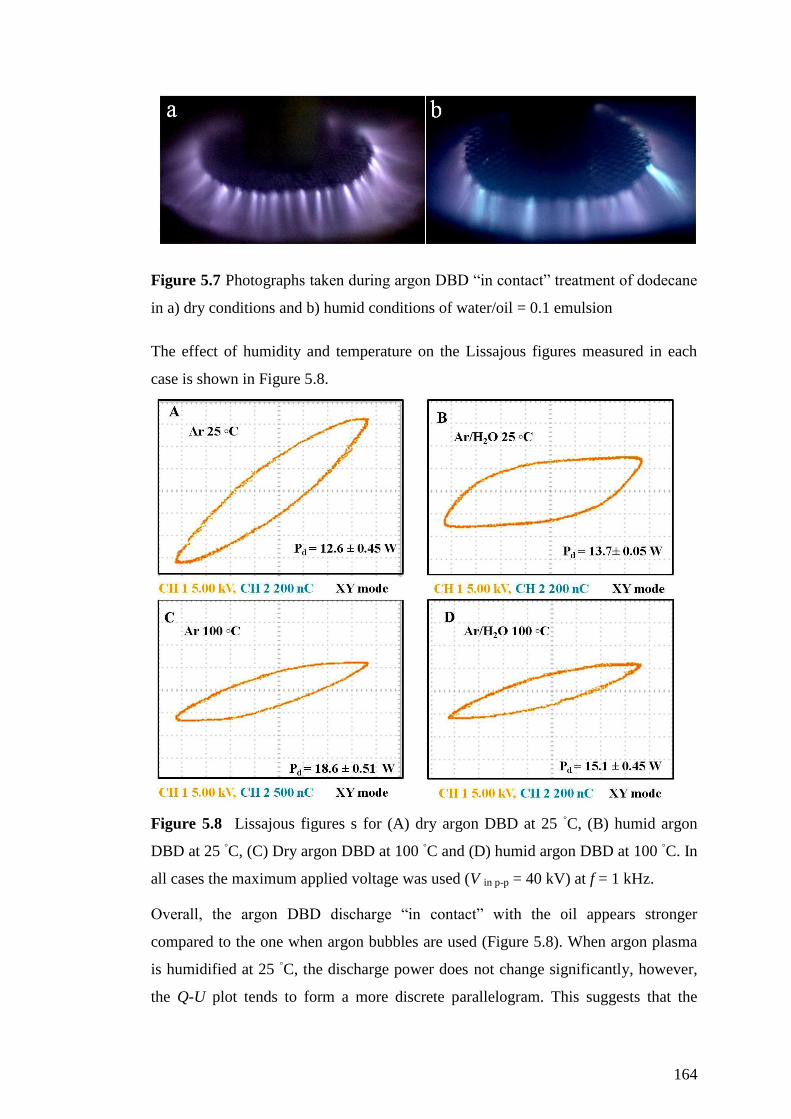
164
Figure 5.7 Photographs taken during argon DBD “in contact” treatment of dodecane
in a) dry conditions and b) humid conditions of water/oil = 0.1 emulsion
The effect of humidity and temperature on the Lissajous figures measured in each
case is shown in Figure 5.8.
Figure 5.8 Lissajous figures s for (A) dry argon DBD at 25 ◦C, (B) humid argon
DBD at 25 ◦C, (C) Dry argon DBD at 100
◦C and (D) humid argon DBD at 100
◦C. In
all cases the maximum applied voltage was used (V in p-p = 40 kV) at f = 1 kHz.
Overall, the argon DBD discharge “in contact” with the oil appears stronger
compared to the one when argon bubbles are used (Figure 5.8). When argon plasma
is humidified at 25 ◦C, the discharge power does not change significantly, however,
the Q-U plot tends to form a more discrete parallelogram. This suggests that the
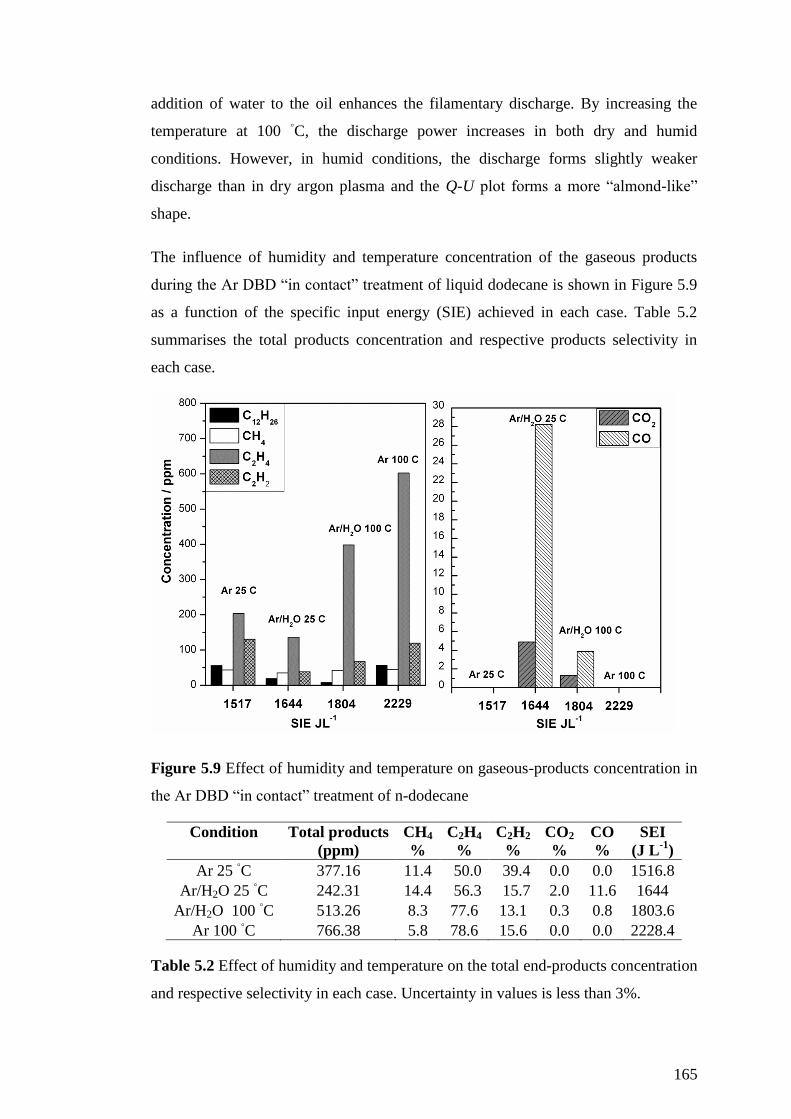
165
addition of water to the oil enhances the filamentary discharge. By increasing the
temperature at 100 ◦C, the discharge power increases in both dry and humid
conditions. However, in humid conditions, the discharge forms slightly weaker
discharge than in dry argon plasma and the Q-U plot forms a more “almond-like”
shape.
The influence of humidity and temperature concentration of the gaseous products
during the Ar DBD “in contact” treatment of liquid dodecane is shown in Figure 5.9
as a function of the specific input energy (SIE) achieved in each case. Table 5.2
summarises the total products concentration and respective products selectivity in
each case.
Figure 5.9 Effect of humidity and temperature on gaseous-products concentration in
the Ar DBD “in contact” treatment of n-dodecane
Condition
Total products
(ppm)
CH4
%
C2H4
%
C2H2
%
CO2
%
CO
%
SEI
(J L-1
)
Ar 25 ◦C 377.16 11.4 50.0 39.4 0.0 0.0 1516.8
Ar/H2O 25 ◦C 242.31 14.4 56.3 15.7 2.0 11.6 1644
Ar/H2O 100 ◦C 513.26 8.3 77.6 13.1 0.3 0.8 1803.6
Ar 100 ◦C 766.38 5.8 78.6 15.6 0.0 0.0 2228.4
Table 5.2 Effect of humidity and temperature on the total end-products concentration
and respective selectivity in each case. Uncertainty in values is less than 3%.
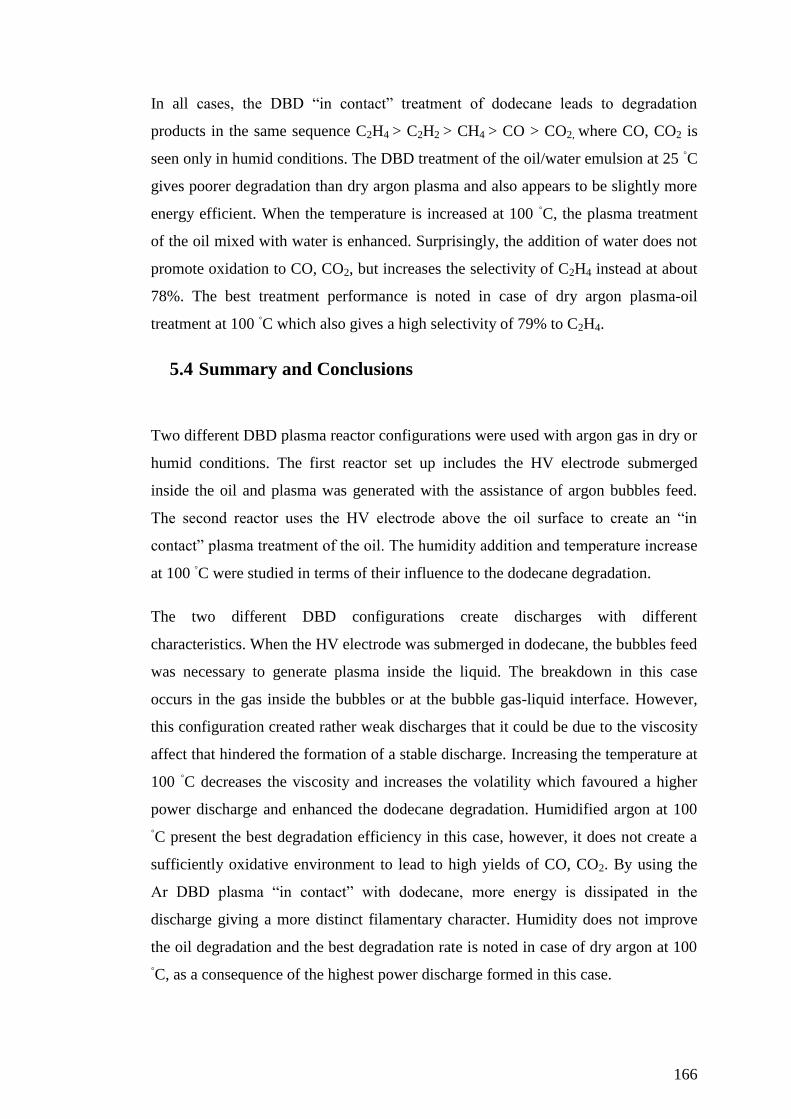
166
In all cases, the DBD “in contact” treatment of dodecane leads to degradation
products in the same sequence C2H4 > C2H2 > CH4 > CO > CO2, where CO, CO2 is
seen only in humid conditions. The DBD treatment of the oil/water emulsion at 25 ◦C
gives poorer degradation than dry argon plasma and also appears to be slightly more
energy efficient. When the temperature is increased at 100 ◦C, the plasma treatment
of the oil mixed with water is enhanced. Surprisingly, the addition of water does not
promote oxidation to CO, CO2, but increases the selectivity of C2H4 instead at about
78%. The best treatment performance is noted in case of dry argon plasma-oil
treatment at 100 ◦C which also gives a high selectivity of 79% to C2H4.
5.4 Summary and Conclusions
Two different DBD plasma reactor configurations were used with argon gas in dry or
humid conditions. The first reactor set up includes the HV electrode submerged
inside the oil and plasma was generated with the assistance of argon bubbles feed.
The second reactor uses the HV electrode above the oil surface to create an “in
contact” plasma treatment of the oil. The humidity addition and temperature increase
at 100 ◦C were studied in terms of their influence to the dodecane degradation.
The two different DBD configurations create discharges with different
characteristics. When the HV electrode was submerged in dodecane, the bubbles feed
was necessary to generate plasma inside the liquid. The breakdown in this case
occurs in the gas inside the bubbles or at the bubble gas-liquid interface. However,
this configuration created rather weak discharges that it could be due to the viscosity
affect that hindered the formation of a stable discharge. Increasing the temperature at
100 ◦C decreases the viscosity and increases the volatility which favoured a higher
power discharge and enhanced the dodecane degradation. Humidified argon at 100
◦C present the best degradation efficiency in this case, however, it does not create a
sufficiently oxidative environment to lead to high yields of CO, CO2. By using the
Ar DBD plasma “in contact” with dodecane, more energy is dissipated in the
discharge giving a more distinct filamentary character. Humidity does not improve
the oil degradation and the best degradation rate is noted in case of dry argon at 100
◦C, as a consequence of the highest power discharge formed in this case.

167
In all cases the product selectivity follow the sequence of C2H4 > C2H 2> CH4 > CO >
CO2. Moreover, humid argon bubbles plasma presents the best energy efficiency in
the dodecane treatment. However, further work is needed to improve the degradation
rate and should be also expanded in the liquid. The next chapter will study the use of
gliding arc discharge as more powerful plasma for the plasma-liquid treatment of
dodecane.
5.5 References
[1] M. Magureanu, Piroi, D., Mandache, N. B., David, V., Medvedovici, A.,
Bradu, C., Parvulescu, V. I., "Degradation of antibiotics in water by non-
thermal plasma treatment," Water Research, vol. 45, pp. 3407-3416, 2011.
[2] Y. Liu, Sun, Yu, Hu, Jinlong, He, Jun, Mei, Shufang, Xue, Gang, Ognier,
Stéphanie, "Removal of iopromide from an aqueous solution using dielectric
barrier discharge," Journal of Chemical Technology & Biotechnology, vol.
88, pp. 468-473, 2013.
[3] N. J. Mastanaiah, J. A. R.Subrata, "Effect of Dielectric and Liquid on Plasma
Sterilization Using Dielectric Barrier Discharge Plasma," PLoS ONE, vol. 8,
p. e70840, 2013.
[4] M. J. Kirkpatrick, B. Dodet, E. Odic "Atmospheric Pressure Humid Argon
DBD Plasma for the Application of Sterilization - Measurement and
Simulation of Hydrogen, Oxygen, and Hydrogen Peroxide Formation "
International Journal of Plasma Environmental Science & Technology vol. 1,
2007.
[5] R. Thyen, K. Höpfner , N. Kläke, C., Klages, , "Cleaning of Silicon and Steel
Surfaces Using Dielectric Barrier Discharges," Plasmas and Polymers, vol. 5,
pp. 91-102, 2000/06/01 2000.
[6] H. Yu, W. Ling, M. Zhao, J. Wang, Y. Liu "Reaction of dielectric barrier
discharge plasma with crude oil," Nuclear Fusion and Plasma Physics, vol.
32, 2012.
[7] N. R. Hooshmand, Mohammad Reza Jahanmiri, Abdolhosein Taghvaei,
Hamed Mohamadzadeh Shirazi, Meisam, "Hexadecane Cracking in a Hybrid

168
Catalytic Pulsed Dielectric Barrier Discharge Plasma Reactor," Industrial &
Engineering Chemistry Research, vol. 52, pp. 4443-4449, 2013/03/27 2013.
[8] H. J. Taghvaei, Abdolhosien Rahimpour, Mohammad Reza Shirazi, Meisam
Mohamadzadeh, Hooshmand, Navid, "Hydrogen production through plasma
cracking of hydrocarbons: Effect of carrier gas and hydrocarbon type,"
Chemical Engineering Journal, vol. 226, pp. 384-392, 2013.
[9] B. Eliasson and U. Kogelschatz, "Nonequilibrium volume plasma chemical
processing," Plasma Science, IEEE Transactions on, vol. 19, pp. 1063-1077,
1991.
[10] T. C. Manley, "The Electric Characteristics of the Ozonator Discharge,"
Journal of The Electrochemical Society, vol. 84, pp. 83-96, 1943.
[11] B. Peter and L. Christophe, "Non-thermal plasmas in and in contact with
liquids," Journal of Physics D: Applied Physics, vol. 42, p. 053001, 2009.
[12] S. Gershman, Mozgina, O., Belkind, A., Becker, K., Kunhardt, E., "Pulsed
Electrical Discharge in Bubbled Water," Contributions to Plasma Physics,
vol. 47, pp. 19-25, 2007.
[13] K. Sato, Yasuoka, K., "Pulsed Discharge Development in Oxygen, Argon,
and Helium Bubbles in Water," Plasma Science, IEEE Transactions on, vol.
36, pp. 1144-1145, 2008.
[14] P. Bruggeman, J. Degroote, J. Vierendeels, C. Leys, "DC-excited discharges
in vapour bubbles in capillaries," Plasma Sources Science and Technology,
vol. 17, p. 025008, 2008.
[15] P. Bruggeman, C Leys, J Vierendeels, "Experimental investigation of dc
electrical breakdown of long vapour bubbles in capillaries," Journal of
Physics D: Applied Physics, vol. 40, p. 1937, 2007.
[16] U. Kogelschatz, "Collective phenomena in volume and surface barrier
discharges," Journal of Physics: Conference Series, vol. 257, p. 012015,
2010.
[17] J. Kriegseis, Möller, Benjamin, Grundmann, Sven, Tropea, Cameron,
"Capacitance and power consumption quantification of dielectric barrier
169
discharge (DBD) plasma actuators," Journal of Electrostatics, vol. 69, pp.
302-312, 2011.
[18] U. Kogelschatz, "Dielectric Barrier Discharges: Their History, Discharge
Physics and Industrial Applications," Plasma Chemistry and Plasma
Processing, vol. 23, 2003.
[19] H. E. Wagner, Brandenburg R., Kozlov K. V, Sonnenfeld A.,Michel P.,
Behnke J. F., "The barrier discharge: basic properties and applications to
surface treatment," Vacuum, vol. 71, pp. 417-436, 2003.

170
Chapter 6
6 The plasma-liquid treatment of n-dodecane using gliding
arc discharge
6.1 Introduction
The scope of the plasma-liquid interactions is vast including a complex mechanism
between gas and interfacial chemistry and subsequently the chemistry in the bulk
liquid. A schematic summary of the plasma-liquid mechanism is given in Figure 6.1.
Figure 6.1 The scope of plasma-liquid interactions
The gaseous plasma containing reactive species such as electrons, ions, radicals and
photons initially reacts with the liquid interface. Reaction can take place either as a
gas-surface process leading mainly to gaseous products, or reactions can be initiated
by diffusion and convection mechanisms in the bulk liquid. Mariotti et al. have
discussed possible electron-liquid reactions in a plasma-liquid system for
nanoparticles synthesis [1]. The electrons and charged particles in the gas phase have
an isolated behaviour and their reactions are distinguished from reactions in the
liquid phase. Electrons can penetrate into the plasma-liquid interface and solvent
effects can diffuse the electrons initiating reactions in the bulk liquid. The solvation
effect is not very well understood, but it is thought to be dependent on the electron
kinetic energy [2]. Regarding the radicals behaviour, several researchers has proven
the dissolution of reactive species to the bulk liquid, for example, OH, HO2 radicals
and NOx species formed in the plasma phase can react with liquid water to form
H2O2 [3], HNO2 and HNO2 [4, 5], respectively.
171
Earlier in this thesis, the gliding arc plasma treatment of dodecane in the gaseous
phase has been discussed, unravelling the plasma-chemical degradation mechanism
under different gas compositions such as dry and humid nitrogen, argon and air. In
terms of the degradation efficiency, humid nitrogen and humid argon are favoured,
avoiding at the same time the NOx formation occurring in the air plasma. Extending
this work, this chapter presents the study of gliding arc plasma treatment of liquid
dodecane. The selected plasma gases are nitrogen and argon in both dry and humid
conditions, in order to test their influence on the liquid dodecane degradation
efficiency, but also to study the plasma-liquid mechanism looking at both gaseous
and liquid chemistry with reference to the earlier gas phase experiments.
6.2 Experimental set-up
The gliding arc discharge (GAD) has been used for the treatment of liquid n-
dodecane (C12H26, supplied by Alfa Aesar ≥ 99%) using two different approaches of
batch and recycling treatment. The main GAD reactor that has been used and
described earlier for the treatment of gaseous dodecane (Chapter 4) has been used for
the treatment of liquid dodecane in this case, with some essential modifications to fit
the experimental conditions.
For the batch treatment, the plasma gases used were N2 and Ar (BOC 99.998%) in
dry or humid conditions. For the humid conditions, the inlet gas relative humidity
was RH = 75% ± 2% (H2O = 2.3 ± 0.3 %), at T = 24°C, measured with a HTD-625
thermo-hygrometer. The GAD was running with a 5 L min-1
flow of the gas and 15
ml of dodecane was placed below the plasma plume, at a distance of 17 mm from the
electrode with no direct contact of the plasma with the liquid. In order to facilitate
the treatment and minimise the vaporisation, a homemade jacketed cell was used and
water cooling of 22 ºC was applied, as shown in Figure 6.2. The plasma-liquid
treatment of dodecane was running for 60 min with the maximum input power
achieved in each case (P(N2) = 200 W, P(Ar) = 120 W, P(N2/H2O) = 220W,
P(Ar/H2O) = 140 W) and the gaseous end-products were measured in-line and in
real-time by FTIR spectroscopy. Under the same conditions, spectroscopic studies
using OES spectroscopy were used as diagnostics of the plasma and intermediate
excited species behaviour.

172
Figure 6.2. a) Picture of the homemade water cooling jacketed cell used for the
gliding arc batch treatment of n-dodecane, b) N2 gliding arc discharge dodecane
treatment using the cell
For the recycling oil plasma treatment, 60 ml of dodecane were placed initially in the
reaction vessel and a peristaltic pump was applied to drive the oil into a metal nozzle
and recycle it using a set flow of 120 ml min-1
. The nozzle was homemade and it was
consisted of a copper tube (id = 1.7 mm) with a mesh plate attached in the outlet. The
plasma gases used in this case were N2 and Ar in humid conditions only (H2O = 2.3
± 0.3 %), as used during the batch treatment. Gaseous product analysis was
performed using in-line FTIR spectroscopy. No OES analysis was performed in this
case. A schematic of the recycling treatment reactor set-up and pictures during the
plasma treatment are given in Figure 6.3.
Figure 6.3. a) Schematic of the gliding arc reactor design for the recycling plasma-
liquid treatment of dodecane and photographs taken during b) humid argon and c)
humid nitrogen plasma recycling treatment of dodecane showing the direct injection
of the oil to the plasma plume

173
In both the batch and recycling methods of plasma treatment of dodecane, liquid
analysis was performed in order to identify potential by-products formed in the liquid
phase. Batch treatment samples were collected post-treatment (t = 60 min) while
samples during the recycling treatment were collected in time intervals of t = 5, 20,
30, 40, 50 and 60 min. GC-MS analysis was performed in crude treated oil samples
to quantify the level of by-products formed in reference to dodecane. In order to
facilitate a more profound analysis, column chromatography was performed to
collect non-polar and polar fractions which were subject to ATR IR and GC-MS
liquid analysis. Identification of the different components seen in GC-MS was done
with the assistance of the NIST EI mass spectral database and by complementary
interpretation of both EI and CI MS.
6.3 Results and Discussion
6.3.1 The influence of plasma gas composition on the GAD plasma-liquid
dodecane degradation yield
The overall results of the plasma-liquid degradation of n-dodecane in dry or humid
N2 or Ar plasma in both dry and humid conditions are summarised in Table 6.1. The
% oil volume removal is given as an indication of the degradation efficiency and it
was calculating by measuring the initial volume of oil and the volume of oil after 1 h
of treatment. GC-MS analysis was performed in the post treatment crude samples
and using a peak ratio technique, the level of end-products as impurities mixed with
untreated dodecane was estimated.
GAD
gas
Pin
/ W
% v/v oil
removal
after
treatment
oil
removed /
ml
% liquid end-
products after
treatment
gaseous products
concentration/
ppm
at t = 60 min
Ar 120 5.3 0.80 < 0.21 211.5 ± 8.5
N2 200 25.3 3.75 < 0.08 932.4± 37.3
Ar/H2O 140 13.4 2.01 < 0.64 712.4 ± 28.5
N2/H2O 220 44.2 6.63 < 0.20 1546.9 ± 61.9
Table 6.1 Summary of different plasma gas used for the GAD plasma-liquid
degradation of dodecane. Initial volume of C12H26 was 15 ml. The total oil volume
reduction is calculated after 1 hour of treatment. GC-MS analysis has been
performed to quantify the amount of liquid by-products in the post-treatment
samples.
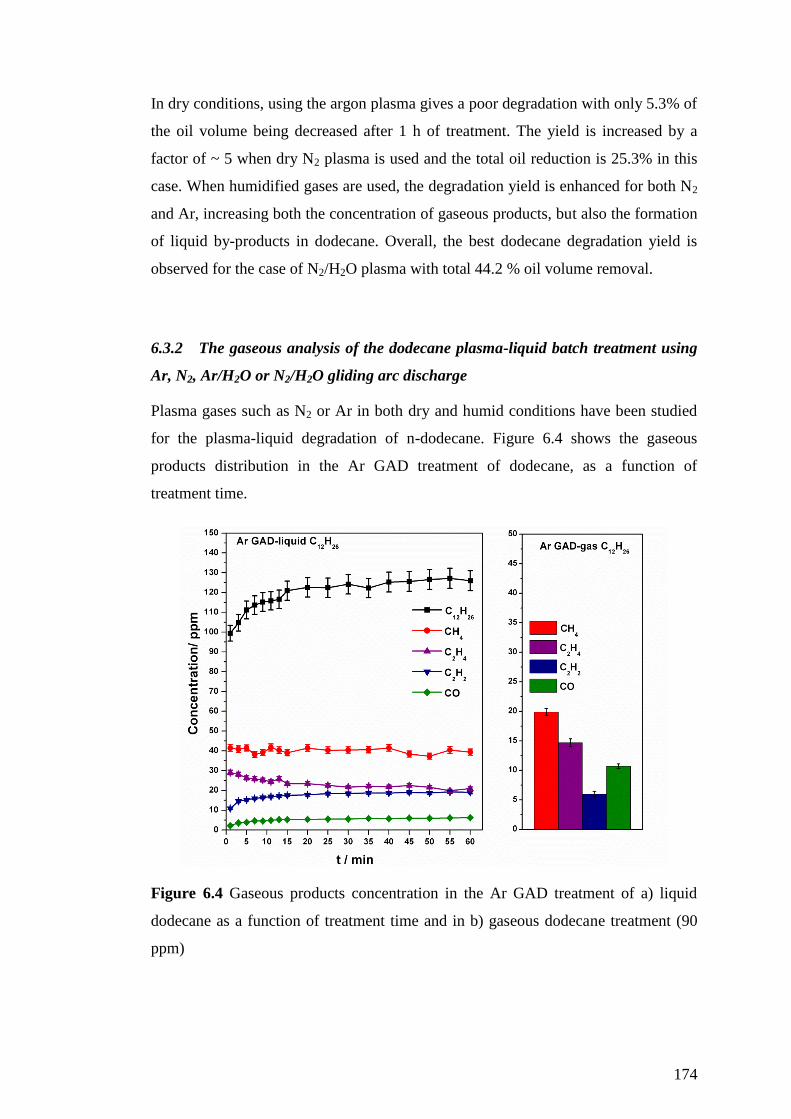
174
In dry conditions, using the argon plasma gives a poor degradation with only 5.3% of
the oil volume being decreased after 1 h of treatment. The yield is increased by a
factor of ~ 5 when dry N2 plasma is used and the total oil reduction is 25.3% in this
case. When humidified gases are used, the degradation yield is enhanced for both N2
and Ar, increasing both the concentration of gaseous products, but also the formation
of liquid by-products in dodecane. Overall, the best dodecane degradation yield is
observed for the case of N2/H2O plasma with total 44.2 % oil volume removal.
6.3.2 The gaseous analysis of the dodecane plasma-liquid batch treatment using
Ar, N2, Ar/H2O or N2/H2O gliding arc discharge
Plasma gases such as N2 or Ar in both dry and humid conditions have been studied
for the plasma-liquid degradation of n-dodecane. Figure 6.4 shows the gaseous
products distribution in the Ar GAD treatment of dodecane, as a function of
treatment time.
Figure 6.4 Gaseous products concentration in the Ar GAD treatment of a) liquid
dodecane as a function of treatment time and in b) gaseous dodecane treatment (90
ppm)
175
The Ar plasma gives a poor degradation of liquid dodecane and a low concentration
of gaseous products. The off-gas is rich in gaseous dodecane which is formed by
evaporation caused by the temperature increase inside the reactor and the
concentration of all the gases is stabilised after the first 10 min of the Ar plasma
treatment. The observed products following the Ar plasma-liquid treatment of
dodecane does not differ significantly from those observed in case of the Ar plasma
treatment of gaseous dodecane. No new products are observed and the selectivity for
the production of the hydrocarbons remains the same CH4 > C2H4 > C2H2, while the
low concentration of CO is thought to be due to oxygen impurities in the feed gas.
However, it needs to be reminded here, that C2H6 and other lighter hydrocarbons are
possibly also formed, although they cannot be seen due to overlapping limitations
caused by the IR spectroscopy. The decomposition mechanism as described earlier in
chapter 3, leads mainly to CH3 and C2H5 radicals which can then form final products
as shown in reactions R6.1-6.4. In fact, CH4 and C2H6 products are expected to be
formed in higher abundance from the unsaturated hydrocarbons of C2H4, C2H2, as
more thermodynamically-stable products. At low temperatures, alkyl radicals are
more likely to recombine with H atoms (reactions R 6.1, 6.2) forming a new σ bond,
rather to react with H in order to form alkenes and molecular hydrogen involving the
formation of a new π bond (reaction R 6.3).
R 6.1 CH3 + H → CH4 k300 = 3.21 x 10⁻¹⁰
cm3 molecule
-1 s
-1 [6]
R 6.2 C2H5+ H → C2H6 k 300 = 2.25 x 10⁻¹⁰
cm3
molecule-1
s-1
[5]
R 6.3 C2H 5 + H→ C2H4 + H2 k 300 = 3.0 x 10⁻¹²
cm
3 molecule
-1 s
-1 [7]
R 6.4 C2H4 → C2H2 + H2 (no available kinetic data)
However our system is different to a system close to thermodynamic equilibrium.
Merlo-Sosa et al. [8] have studied the thermodynamic pyrolysis of gaseous dodecane
in a RF plasma reactor using a mixture of Ar / He / C12H26 and the composition of the
different species in the equilibrium are shown in Figure 6.5. According to their
results, the thermodynamic equilibrium reactions show the gas composition is rich in
H2, CH4 and C2H6 below 500 K, but C2H4 and C2H2 start forming only for
temperatures higher than 500 K and 800 K, whereas in our case the gas temperature
during Ar GAD plasma treatment of gaseous dodecane is measured T(Ar)gas = 340 ±5
K.
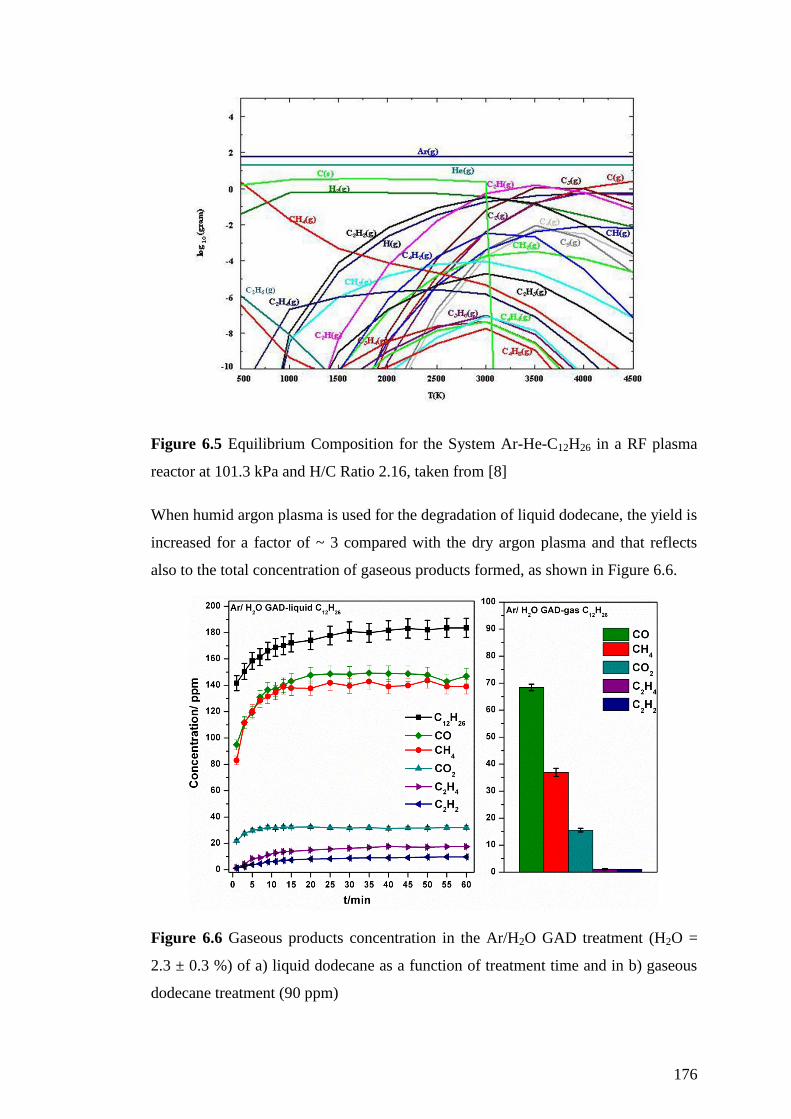
176
Figure 6.5 Equilibrium Composition for the System Ar-He-C12H26 in a RF plasma
reactor at 101.3 kPa and H/C Ratio 2.16, taken from [8]
When humid argon plasma is used for the degradation of liquid dodecane, the yield is
increased for a factor of ~ 3 compared with the dry argon plasma and that reflects
also to the total concentration of gaseous products formed, as shown in Figure 6.6.
Figure 6.6 Gaseous products concentration in the Ar/H2O GAD treatment (H2O =
2.3 ± 0.3 %) of a) liquid dodecane as a function of treatment time and in b) gaseous
dodecane treatment (90 ppm)
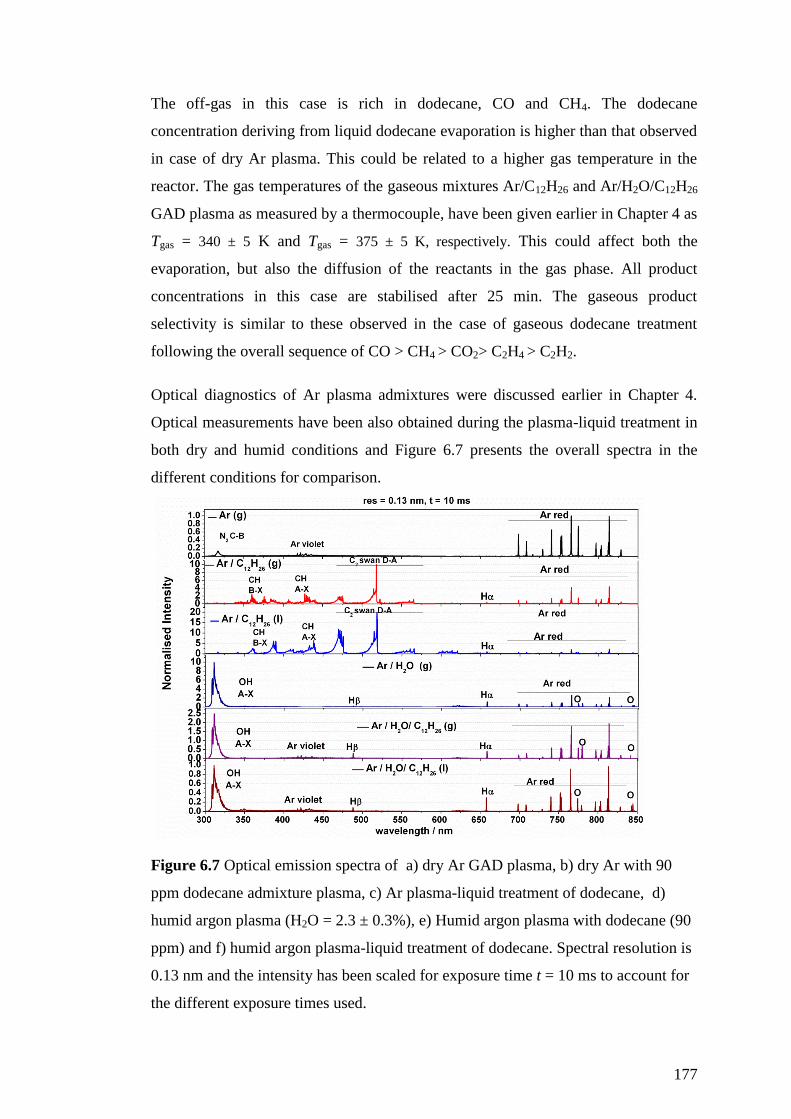
177
The off-gas in this case is rich in dodecane, CO and CH4. The dodecane
concentration deriving from liquid dodecane evaporation is higher than that observed
in case of dry Ar plasma. This could be related to a higher gas temperature in the
reactor. The gas temperatures of the gaseous mixtures Ar/C12H26 and Ar/H2O/C12H26
GAD plasma as measured by a thermocouple, have been given earlier in Chapter 4 as
Tgas = 340 ± 5 K and Tgas = 375 ± 5 K, respectively. This could affect both the
evaporation, but also the diffusion of the reactants in the gas phase. All product
concentrations in this case are stabilised after 25 min. The gaseous product
selectivity is similar to these observed in the case of gaseous dodecane treatment
following the overall sequence of CO > CH4 > CO2> C2H4 > C2H2.
Optical diagnostics of Ar plasma admixtures were discussed earlier in Chapter 4.
Optical measurements have been also obtained during the plasma-liquid treatment in
both dry and humid conditions and Figure 6.7 presents the overall spectra in the
different conditions for comparison.
Figure 6.7 Optical emission spectra of a) dry Ar GAD plasma, b) dry Ar with 90
ppm dodecane admixture plasma, c) Ar plasma-liquid treatment of dodecane, d)
humid argon plasma (H2O = 2.3 ± 0.3%), e) Humid argon plasma with dodecane (90
ppm) and f) humid argon plasma-liquid treatment of dodecane. Spectral resolution is
0.13 nm and the intensity has been scaled for exposure time t = 10 ms to account for
the different exposure times used.

178
When a dry Ar plasma is used to treat liquid dodecane, the intensity of emission
from C2 and CH is increased by a factor of 2 compared to the treatment of gaseous
dodecane. This is correlated with the gaseous products of C2 hydrocarbons from
liquid dodecane treatment, as their concentation is also double compared to the
gaseous dodecane treatment. In humid conditions, the intensity of the OH (A→X )
emission observed in humid argon plasma is decreased by a factor of 4 and a factor
or 10 in case of the gaseous and liquid treatment of dodecane respectively. The
decrease in the relative concentration of the OH (A→X ) emission indicates that OH
reacts with gaseous dodoecane to form CO, CO2 products. In case of the treatment
of liquid dodecane, it is also possible that quenching reactions can occur in the
liquid interface and OH radicals can diffuse to react with the bulk liquid.
Figure 6.8 shows the gaseous products concentration as a function of time during the
N2 GAD treatment at the liquid dodecane, compared with the concentration of
gaseous products for gaseous dodecane treatment under the same conditions.
Figure 6.8 Gaseous products concentration in the N2 GAD treatment of a) liquid
dodecane as a function of treatment time and in b) gaseous dodecane treatment (90
ppm)
There are two main observations deriving from this figure. Firstly, there are
differences in the gas chemistry between the Ar and N2 plasma gas used for the
plasma-liquid treatment. In case of Ar (Figure 6.4 earlier), the selectivity of the
lighter hydrocarbons is CH4 > C2H4 > C2H2 which changes to C2H4 > C2H2 > CH4 in
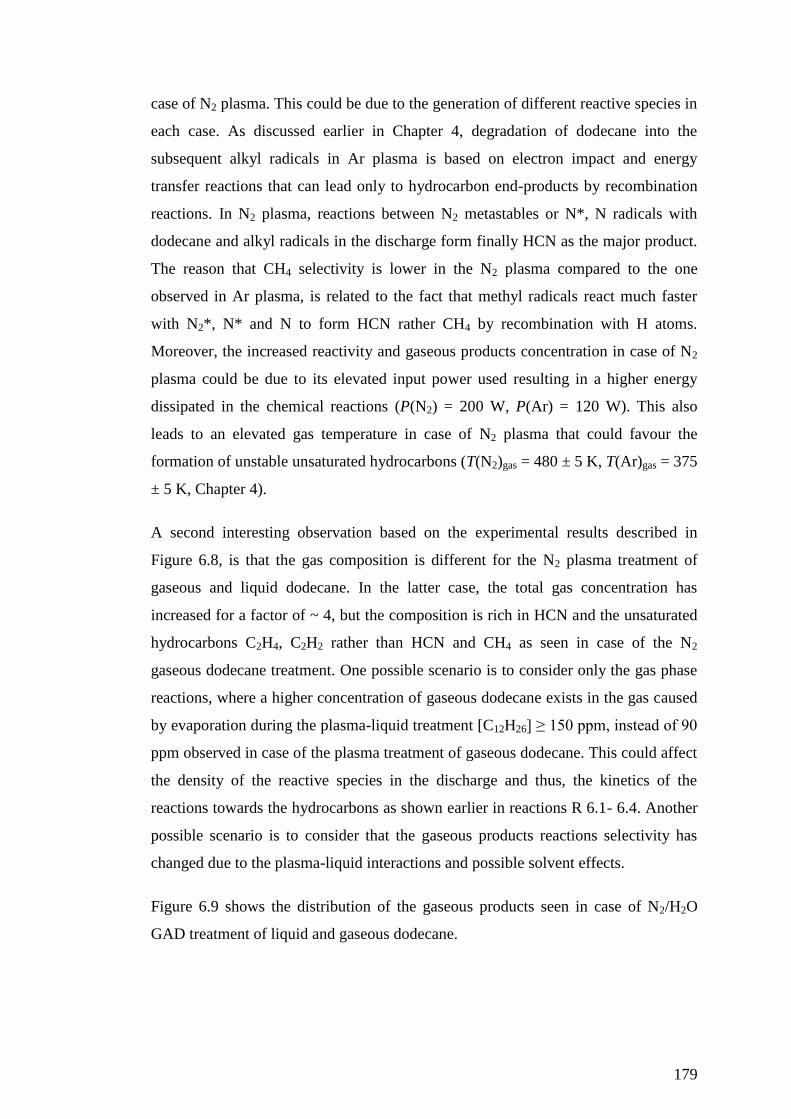
179
case of N2 plasma. This could be due to the generation of different reactive species in
each case. As discussed earlier in Chapter 4, degradation of dodecane into the
subsequent alkyl radicals in Ar plasma is based on electron impact and energy
transfer reactions that can lead only to hydrocarbon end-products by recombination
reactions. In N2 plasma, reactions between N2 metastables or N*, N radicals with
dodecane and alkyl radicals in the discharge form finally HCN as the major product.
The reason that CH4 selectivity is lower in the N2 plasma compared to the one
observed in Ar plasma, is related to the fact that methyl radicals react much faster
with N2*, N* and N to form HCN rather CH4 by recombination with H atoms.
Moreover, the increased reactivity and gaseous products concentration in case of N2
plasma could be due to its elevated input power used resulting in a higher energy
dissipated in the chemical reactions (P(N2) = 200 W, P(Ar) = 120 W). This also
leads to an elevated gas temperature in case of N2 plasma that could favour the
formation of unstable unsaturated hydrocarbons (T(N2)gas = 480 ± 5 K, T(Ar)gas = 375
± 5 K, Chapter 4).
A second interesting observation based on the experimental results described in
Figure 6.8, is that the gas composition is different for the N2 plasma treatment of
gaseous and liquid dodecane. In the latter case, the total gas concentration has
increased for a factor of ~ 4, but the composition is rich in HCN and the unsaturated
hydrocarbons C2H4, C2H2 rather than HCN and CH4 as seen in case of the N2
gaseous dodecane treatment. One possible scenario is to consider only the gas phase
reactions, where a higher concentration of gaseous dodecane exists in the gas caused
by evaporation during the plasma-liquid treatment [C12H26] ≥ 150 ppm, instead of 90
ppm observed in case of the plasma treatment of gaseous dodecane. This could affect
the density of the reactive species in the discharge and thus, the kinetics of the
reactions towards the hydrocarbons as shown earlier in reactions R 6.1- 6.4. Another
possible scenario is to consider that the gaseous products reactions selectivity has
changed due to the plasma-liquid interactions and possible solvent effects.
Figure 6.9 shows the distribution of the gaseous products seen in case of N2/H2O
GAD treatment of liquid and gaseous dodecane.
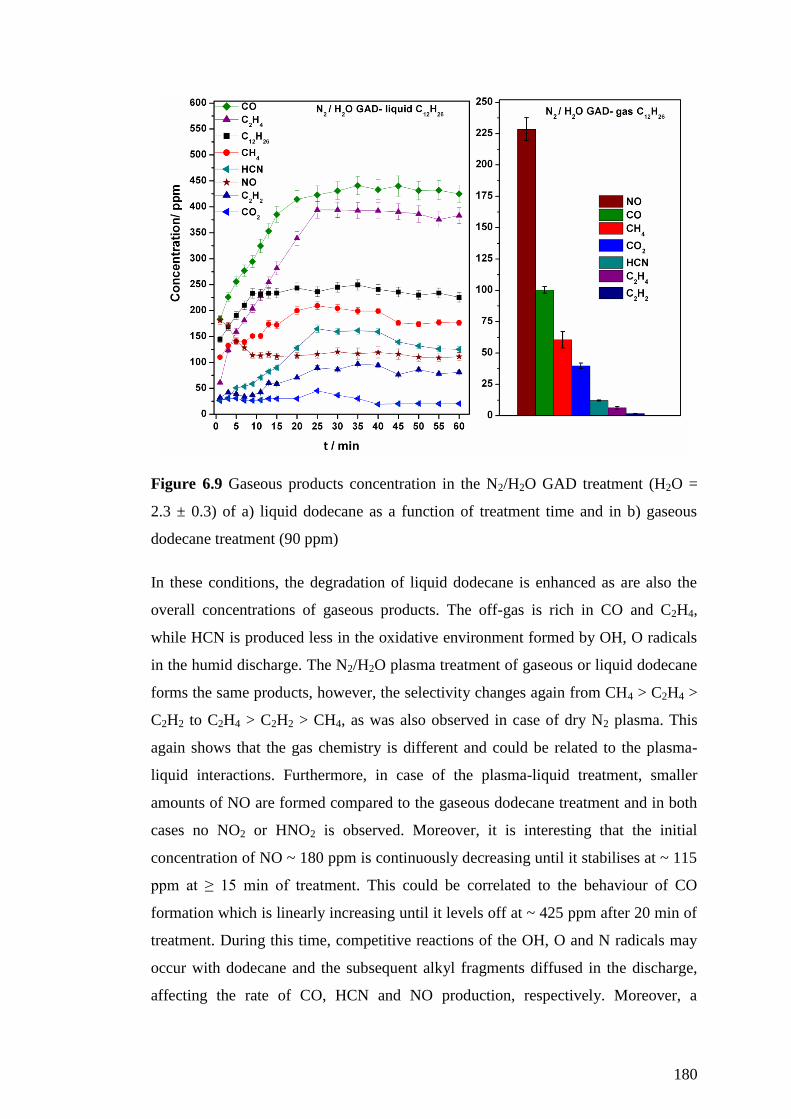
180
Figure 6.9 Gaseous products concentration in the N2/H2O GAD treatment (H2O =
2.3 ± 0.3) of a) liquid dodecane as a function of treatment time and in b) gaseous
dodecane treatment (90 ppm)
In these conditions, the degradation of liquid dodecane is enhanced as are also the
overall concentrations of gaseous products. The off-gas is rich in CO and C2H4,
while HCN is produced less in the oxidative environment formed by OH, O radicals
in the humid discharge. The N2/H2O plasma treatment of gaseous or liquid dodecane
forms the same products, however, the selectivity changes again from CH4 > C2H4 >
C2H2 to C2H4 > C2H2 > CH4, as was also observed in case of dry N2 plasma. This
again shows that the gas chemistry is different and could be related to the plasma-
liquid interactions. Furthermore, in case of the plasma-liquid treatment, smaller
amounts of NO are formed compared to the gaseous dodecane treatment and in both
cases no NO2 or HNO2 is observed. Moreover, it is interesting that the initial
concentration of NO ~ 180 ppm is continuously decreasing until it stabilises at ~ 115
ppm at ≥ 15 min of treatment. This could be correlated to the behaviour of CO
formation which is linearly increasing until it levels off at ~ 425 ppm after 20 min of
treatment. During this time, competitive reactions of the OH, O and N radicals may
occur with dodecane and the subsequent alkyl fragments diffused in the discharge,
affecting the rate of CO, HCN and NO production, respectively. Moreover, a
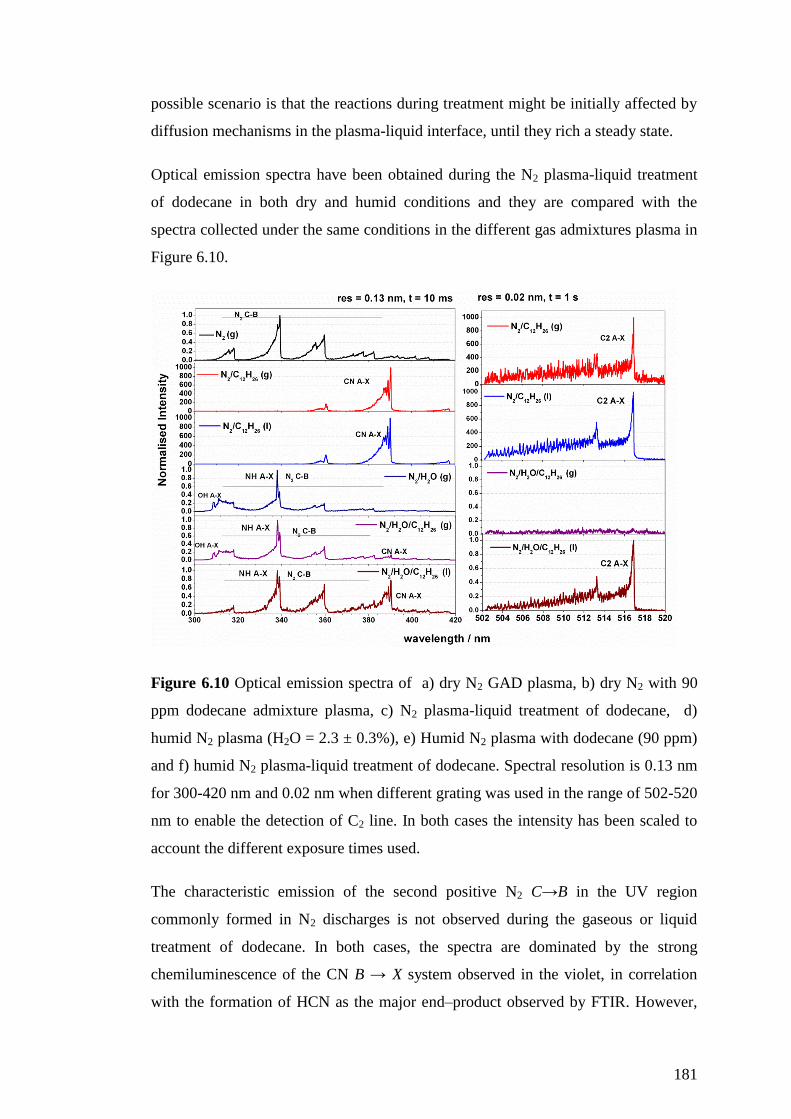
181
possible scenario is that the reactions during treatment might be initially affected by
diffusion mechanisms in the plasma-liquid interface, until they rich a steady state.
Optical emission spectra have been obtained during the N2 plasma-liquid treatment
of dodecane in both dry and humid conditions and they are compared with the
spectra collected under the same conditions in the different gas admixtures plasma in
Figure 6.10.
Figure 6.10 Optical emission spectra of a) dry N2 GAD plasma, b) dry N2 with 90
ppm dodecane admixture plasma, c) N2 plasma-liquid treatment of dodecane, d)
humid N2 plasma (H2O = 2.3 ± 0.3%), e) Humid N2 plasma with dodecane (90 ppm)
and f) humid N2 plasma-liquid treatment of dodecane. Spectral resolution is 0.13 nm
for 300-420 nm and 0.02 nm when different grating was used in the range of 502-520
nm to enable the detection of C2 line. In both cases the intensity has been scaled to
account the different exposure times used.
The characteristic emission of the second positive N2 C→B in the UV region
commonly formed in N2 discharges is not observed during the gaseous or liquid
treatment of dodecane. In both cases, the spectra are dominated by the strong
chemiluminescence of the CN B → X system observed in the violet, in correlation
with the formation of HCN as the major end–product observed by FTIR. However,
182
no difference in the relative intensity of CN B → X, but also of C2 a → d is observed
between the plasma-gas and liquid treatment.
The spectrum of the N2/H2O/C12H26 gaseous plasma has been discussed earlier in
Chapter 4. What is remarkable is that in the corresponding spectrum in the plasma-
liquid treatment the OH A→X emission is not observed for the same exposure time
used. Quenching reactions with the liquid surface are likely to happen which could
induce reactions in the liquid phase. Furthermore, in humid conditions C2 a → d
emission is only seen during the plasma-liquid treatment and the CN B → X intensity
is increased, showing a possible relationship of their increased relative intensity to
the increased concentration of HCN, C2H4 and C2H2 end-products in the gas phase.
6.3.3 The liquid analysis of the dodecane plasma-liquid batch treatment using
Ar, N2, Ar/H2O or N2/H2O gliding arc discharge
Many researchers have studied the use of non-thermal plasma-liquid reforming of
hydrocarbons oils for H2 production including the use of corona discharge [9-13],
dielectric barrier discharge [14-16] and gliding arc discharge [17, 18]. However, no
attention has been given to the plasma-liquid interaction or the potential liquid
chemistry taking place in the hydrocarbon oil. Some work can be found in literature
related to plasma-liquid treatment of liquid hydrocarbons for product synthesis
purposes, but low temperature and low pressure was used in order to minimise the
vaporisation and gaseous phase reactions and the chemistry could be different
compared to our warmer atmospheric pressure system [19-23].
In this section, analysis has been performed on the liquid samples collected after 60
min of plasma treatment of dodecane under Ar, N2, Ar/H2O or N2/H2O gliding arc
plasma. It must be noted that soot was found in all liquid samples, even under the
humid conditions experiments. XRD analysis of the soot formed during the gas phase
experiments showed that it is amorphous carbon and no further analysis was
performed in this case. Liquid samples of each case were analysed as crudes
collected after treatment but also as polar fractions collected after column
chromatography separation, by means of IR and GC-MS spectroscopy.
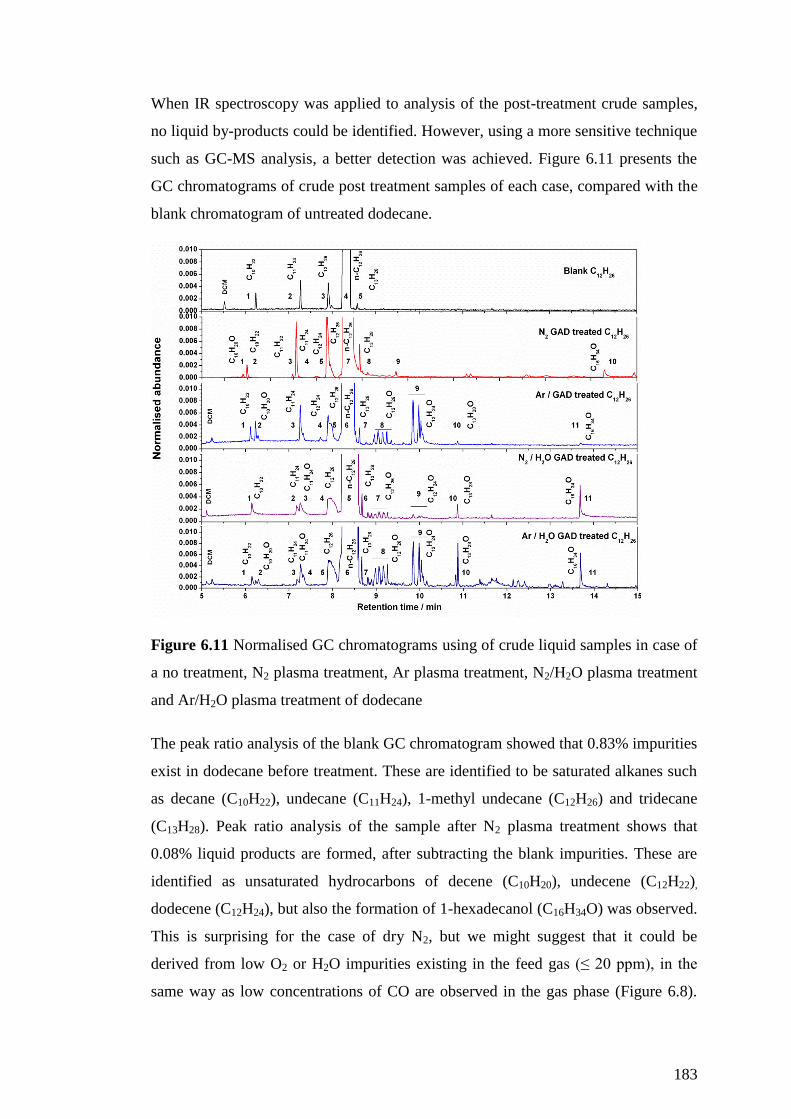
183
When IR spectroscopy was applied to analysis of the post-treatment crude samples,
no liquid by-products could be identified. However, using a more sensitive technique
such as GC-MS analysis, a better detection was achieved. Figure 6.11 presents the
GC chromatograms of crude post treatment samples of each case, compared with the
blank chromatogram of untreated dodecane.
Figure 6.11 Normalised GC chromatograms using of crude liquid samples in case of
a no treatment, N2 plasma treatment, Ar plasma treatment, N2/H2O plasma treatment
and Ar/H2O plasma treatment of dodecane
The peak ratio analysis of the blank GC chromatogram showed that 0.83% impurities
exist in dodecane before treatment. These are identified to be saturated alkanes such
as decane (C10H22), undecane (C11H24), 1-methyl undecane (C12H26) and tridecane
(C13H28). Peak ratio analysis of the sample after N2 plasma treatment shows that
0.08% liquid products are formed, after subtracting the blank impurities. These are
identified as unsaturated hydrocarbons of decene (C10H20), undecene (C12H22),
dodecene (C12H24), but also the formation of 1-hexadecanol (C16H34O) was observed.
This is surprising for the case of dry N2, but we might suggest that it could be
derived from low O2 or H2O impurities existing in the feed gas (≤ 20 ppm), in the
same way as low concentrations of CO are observed in the gas phase (Figure 6.8).

184
The analysis of the chromatogram of the Ar plasma-treated sample showed the
formation of 0.21 % liquid products other than dodecane. Surprisingly, the products
identified other than saturated hydrocarbons were mainly oxygenated products such
as alcohols of decanol (C10H22O), isomers of dodecanol (C12H26O), isomers of
C12H24O (could be dodecanone or dodecanal isomers), tridecanol ( C13H28O) and
hexadecanol (C16H34O). The same trend of products is also observed in case of
Ar/H2O plasma treatment but the concentration of liquid products other than
dodecane is higher (0.64 %). In case of the N2/H2O plasma treatment of dodecane,
the same oxygenated products are identified, however the abundance of the C12H26O
alcohols is higher than the abundance of the C12H24O isomers and the concentration
of the total liquid by-products in this case is lower at 0.2 %.
Polar fractions of the crude samples were collected after liquid column
chromatography and subjected to IR analysis. In this case, absorption peaks of
characteristic functional groups were detected as shown in Figure 6.12. In all cases,
hexane solvent was used as background and was subtracted, as it was found to exist
as impurity after separation.
Figure 6.12 IR spectra of polar fractions of liquid samples after N2, Ar, N2/H2O and
Ar/H2O plasma treatment of dodecane. Hexane spectrum was used as background

185
The C-H stretching (~ 2800 cm-1
), and bending (~ 1380, 1430 cm-1
) modes are seen
in all spectra. In the IR spectrum of N2 plasma-treated sample, the broad peak at ~
3400 cm-1
belongs to the H-bonded O-H stretching mode and the peak of C-O
stretching mode at ~ 1100 cm-1
is also detected, although they appear with very low
intensity. Their observation indicates the existence of alcohols in the sample as was
seen in the crude analysis, however no C=C bonds are detected relating to
unsaturated hydrocarbons. It is possible that the latter ones could not be collected in
the polar fraction due to their very low polarity compared with the oxygenated
products. In case of the Ar treatment sample, O-H and C-O are also observed with
higher intensity. Moreover, the carbonyl group stretching is also seen at ~ 1700 cm-1
.
The spectrum of the N2/H2O plasma treated sample detects the same functional
groups, however the shape of the broad peak at ~3400 cm-1
could be interpreted as an
overlapping double band at the same region, characteristic of primary amines [24].
Moreover, a new peak at ~ 1260 cm-1
is detected, which could belong to unsaturated
or cyclic C-O-C ether bonds [24]. The weak double band at ~ 1625 cm-1
and ~1550
cm-1
could be
assigned to the aromatic ring C-H stretching, indicating low
concentrations of aromatics. Similarly in the spectrum of Ar/H2O treated sample,
functional groups of OH, C-O, C=O and C-O-C are also observed. Additionally the
double band at ~ 1625 cm-1
, ~1550 cm-1
appears stronger in this case.
The polar fractions of the crude plasma post-treated samples were also subject to
GC-MS analysis and the comparative chromatograms for each case are shown in
Figure 6.13. In all cases, the formation of primary aliphatic alcohols is dominant and
hexadecanol (C16H34O) especially is formed with the highest abundance. In the case
of N2 plasma treatment, other alcohols identified are dodecanol (C12H26O), tridecanol
(C13H28O) and tetradecanol (C14H30O), and also isomers of dodecanone (C12H24O). It
must be noted these alcohols have very low abundance which might be the reason
that they could not be identified in the crude analysis, with the exemption of
C16H34O. Remarkably, the aromatic compound of triphenylmetahnol (C19H16) has
been also identified. It must be noted that the C10-C12 aliphatic unsaturated
hydrocarbons seen in the crude sample are most likely not contained in the polar
fraction after separation. In case of Ar plasma treatment, in addition to the alcohols
already mentioned before, pentadecanol (C15H32O) but also the aromatic alcohol 2,6-
di-tert-butyl-4-methylphenol (C15H24O) is also identified. Furthermore, higher

186
oxidation state products such as aldehydes or ketones seem to form in higher
abundance in this case and among them nonanal (C9H18O) and decanal (C10H20O) are
also observed. Several isomers of C12H24O have been observed among them 2-
dodecanone and 4- dodecanone were identified.
Figure 6.13 Normalised GC chromatograms of polar fractions of liquid samples after
N2, Ar, N2/H2O and Ar/H2O plasma treatment of dodecane.
In case of the N2/H2O plasma treatment of dodecane, mainly aliphatic primary
alcohols are formed, but surprisingly, the formation of a phthalate ester
6-methylheptyl2-(2-(heptyloxy)-2-oxoethyl)benzoate (C24H38O4) is also identified. It
must be noted that phthalates are commonly considered as contaminants in routine
GC-MS as they are used as plasticisers in the sample vials. However, the fact that the
IR spectrum in this case presents evidence of aromatic rings and the =C-O-C bond,
considered with the fact that no contamination is observed in repetitive blank
samples, lead us to conclude that the phthalate is a liquid reaction by-product. In the
analysis of Ar/H2O plasma treated sample shows that similar products are observed
as in case of dry Ar, only in this case they are formed in much higher abundance. The
isomeric products of C12H24O are the dominant products in this case. Their high
abundance allows a better interpretation, showing that 2- dodecanone, 3- dodecanone
and 4-dodecanone are all formed, as well as a cyclic ether, 2-isopentyl-5-
187
propyltetrahydrofuran. Moreover, aromatic alcohols such as triphenylmethanol
(C19H16O) and 2,2,2-triphenylethanol ( C20H18O) are also identified. A new ester of
bis(3-ethylhexyl) adipate (C22H42O4) as well as the one seen in case of N2/H2O
phthalate ester bis(6-methylheptyl) (C24H38O4) is also seen in low abundance.
6.3.4 Unravelling the liquid chemistry in the plasma-liquid treatment of dodecane
Our experiments and analysis have shown that the gliding arc plasma-liquid
treatment of dodecane induces reactions in the liquid phase. This indicates that
electron and reactive species formed in the discharge can be diffused in the liquid
interface to initiate the decomposition of dodecane molecules. Stepwise
fragmentation and radical reactions can then form light gaseous end-products, or
heavier products, which latter ones are more likely to remain in the liquid phase.
However, vaporisation phenomena cannot be neglected adding further complexity to
the plasma-liquid interaction. The degree of vaporisation could be dependent on the
gas temperature and energy provided to the discharge and it is possible to induce
further reactions in the gas phase.
Results show that during the dry or humid N2 plasma treatment of dodecane, the
concentration of gaseous products is higher and the abundance of liquid products is
lower compared to the Ar plasma conditions. During the dry or humid Ar plasma
degradation of dodecane, the liquid chemistry is more active and can lead to higher
oxidation products (aldehydes, ketones). This could be driven by their differences in
input energy and temperature causing different degree of vaporisation and gas phase
reactions.
A wide range of different end-products have been identified in the plasma post-
treated dodecane. These fall into categories of alkanes, alkenes, aromatic
hydrocarbons and different oxidation level products such as both aliphatic and
aromatic alcohols, ethers, aldehydes, ketones and esters. Figure 6.13 summarises the
major liquid products observed.
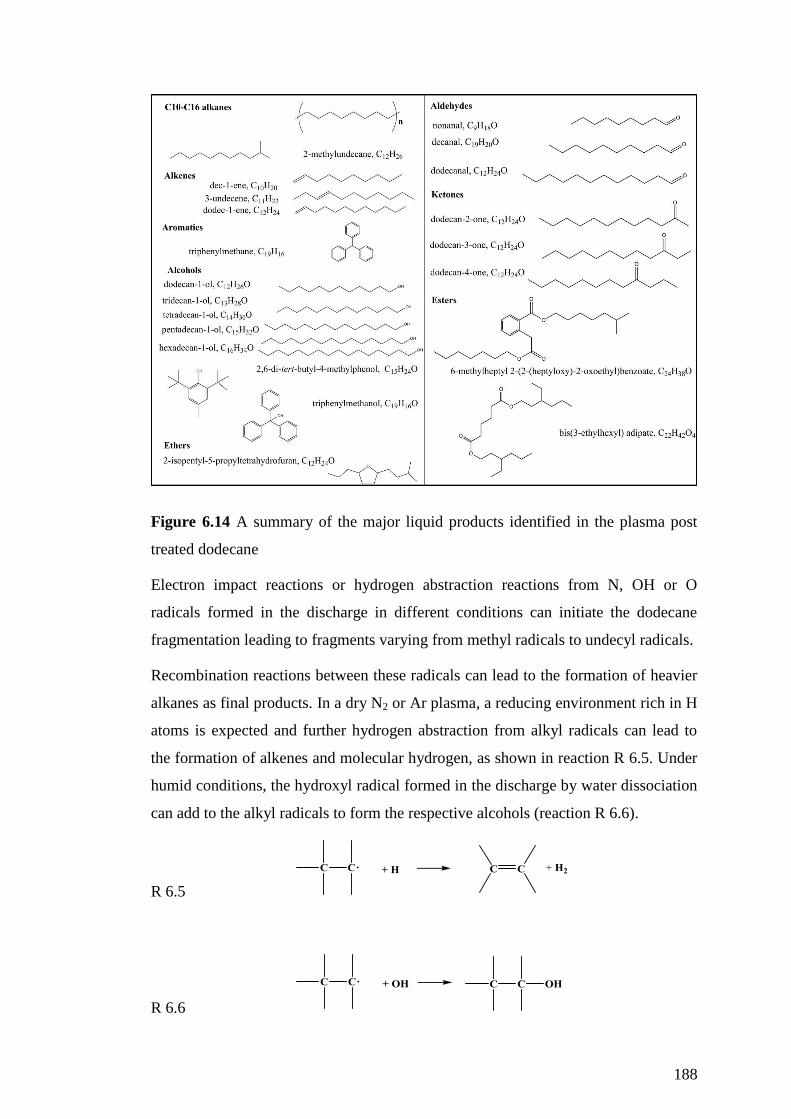
188
Figure 6.14 A summary of the major liquid products identified in the plasma post
treated dodecane
Electron impact reactions or hydrogen abstraction reactions from N, OH or O
radicals formed in the discharge in different conditions can initiate the dodecane
fragmentation leading to fragments varying from methyl radicals to undecyl radicals.
Recombination reactions between these radicals can lead to the formation of heavier
alkanes as final products. In a dry N2 or Ar plasma, a reducing environment rich in H
atoms is expected and further hydrogen abstraction from alkyl radicals can lead to
the formation of alkenes and molecular hydrogen, as shown in reaction R 6.5. Under
humid conditions, the hydroxyl radical formed in the discharge by water dissociation
can add to the alkyl radicals to form the respective alcohols (reaction R 6.6).
R 6.5
R 6.6

189
Atomic oxygen also identified in humid conditions can add to alkyl radicals leading
to alkoxy radicals which can then form alcohols if they are hydrogenated, aldehydes
or ketones if dehydrogenated and ethers in they react further with another alkyl
radical (reaction R 6 .7).
R 6.7
where R1, R2 could be alkyl radicals or hydrogen
The formation of a cyclic ether like the hydrofuran shown in Figure 6. 14, shows that
intermediate products such as alcohols with a double bond in position 1,4 are
possible, which can further react to form the cyclic ether as shown in reaction R 6.8.
R 6.8
The formation of aromatic rings can occur after polymerisation reaction of acetylene,
as shown in reaction R 6.9. However, no polyaromatics are observed which are
commonly found in combustion systems [25].
R6.9
Addition of OH, O radicals to benzene ring can form aromatic alcohols and
subsequent oxidation can lead to the formation of benzoic acid or esters, which could
be a precursor for the benzoate formation shown in Figure 6 .14.

190
6.3.5 The gliding arc discharge treatment of recycling liquid dodecane under
Ar/H2O and N2/H2O plasma
The recycling dodecane plasma treatment has been investigated as a different
approach in order to improve the degradation efficiency and Ar/H2O and N2/H2O
plasma were used. In this case, the injection of dodecane directly to the discharge
area creates a direct plasma-liquid contact which is expected to increase the reaction
surface and improve the degradation efficiency.
Table 6.2 compares the overall results in the plasma-liquid treatment of dodecane in
the batch and recycling treatment method. In both Ar/H2O and N2/H2O conditions,
the recycling treatment has increased the total volume of oil treated by a factor of 4.9
and 4.2 respectively. Following this, both the gaseous and liquid products
concentration is increased. The best degradation efficiency is noted in case of
N2/H2O recycling treatment, where a total of 28.2 ml oil was removed after 1 h.
GAD gas
Pin /
W
oil removed /
ml at t = 60 min
% liquid end-
products after
treatment
gaseous products
concentration / ppm
at t = 60 min
Batch
Ar/H2O
140 2.01 < 0.64 712.4 ± 28.5
Batch
N2/H2O
220 6.63 < 0.20 1546.9 ± 61.9
Recycling
Ar/H2O
140 9.96 < 1.1 960.3 ± 38.4
Recycling
N2/H2O
220 28.2 < 0.5 5287.05± 206.2
Table 6.2 Summary of results of the GAD plasma-liquid degradation of dodecane
using batch and recycling treatment. The total volume of oil removed is calculated
after 1 hour of treatment. Initial volume of dodecane was 15 ml in the batch
treatment and 60 ml in the recycling treatment. GC-MS analysis has been performed
to quantify the amount of liquid by-products in the samples after the treatment.
A comparison of the gaseous end-products formation between the Ar/H2O plasma
batch and recycling plasma-liquid dodecane treatment is given in Figure 6.15. The
degradation efficiency has been increased in the case of the recycling treatment, and
the steady state concentration of CO, CH4 and C2H2 has been increased by a factor of
~ 2. Interestingly, the selectivity towards the end-products has also changed, and
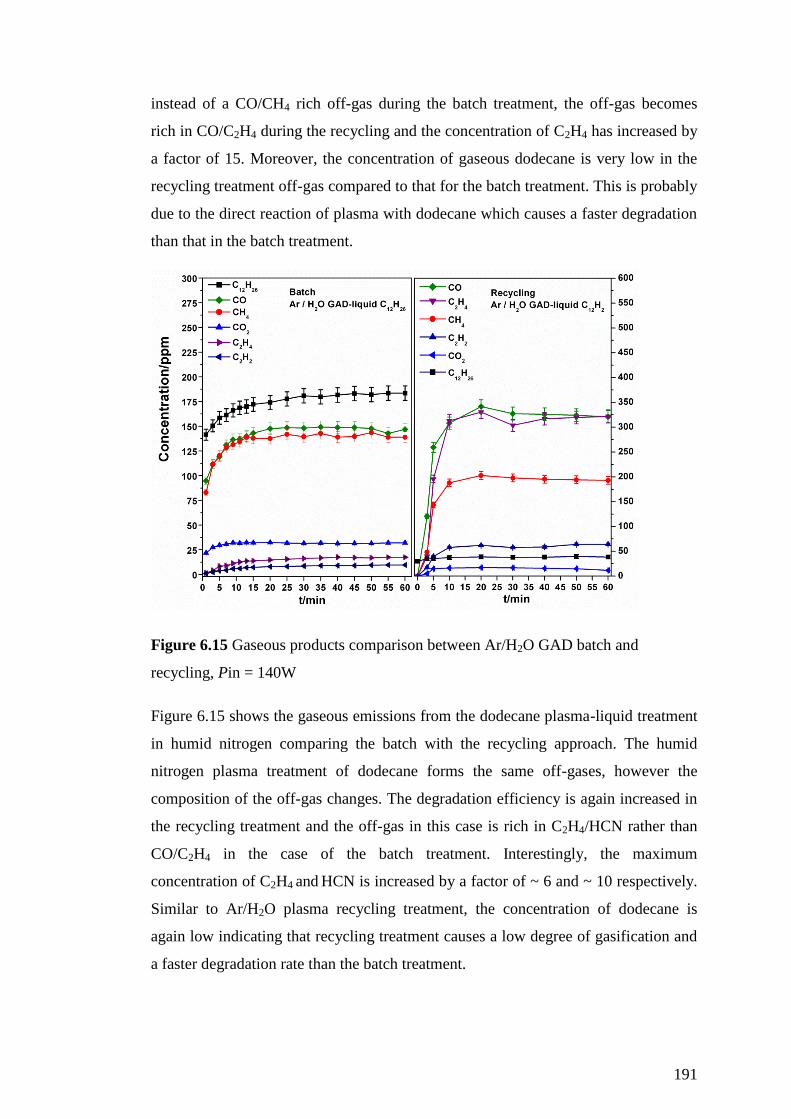
191
instead of a CO/CH4 rich off-gas during the batch treatment, the off-gas becomes
rich in CO/C2H4 during the recycling and the concentration of C2H4 has increased by
a factor of 15. Moreover, the concentration of gaseous dodecane is very low in the
recycling treatment off-gas compared to that for the batch treatment. This is probably
due to the direct reaction of plasma with dodecane which causes a faster degradation
than that in the batch treatment.
Figure 6.15 Gaseous products comparison between Ar/H2O GAD batch and
recycling, Pin = 140W
Figure 6.15 shows the gaseous emissions from the dodecane plasma-liquid treatment
in humid nitrogen comparing the batch with the recycling approach. The humid
nitrogen plasma treatment of dodecane forms the same off-gases, however the
composition of the off-gas changes. The degradation efficiency is again increased in
the recycling treatment and the off-gas in this case is rich in C2H4/HCN rather than
CO/C2H4 in the case of the batch treatment. Interestingly, the maximum
concentration of C2H4 and HCN is increased by a factor of ~ 6 and ~ 10 respectively.
Similar to Ar/H2O plasma recycling treatment, the concentration of dodecane is
again low indicating that recycling treatment causes a low degree of gasification and
a faster degradation rate than the batch treatment.

192
Figure 6.16 Gaseous products comparison between N2/H2O GAD during 60 min of
batch and recycling treatment, Pin = 200 W
During the recycling N2/H2O or Ar/H2O plasma-liquid treatment of dodecane, liquid
samples were collected at time intervals of 5, 20, 30, 40, 50 and 60 min, in order to
characterise the by-product formation in the liquid during treatment time. In both
conditions, the colour of the oil was turning gradually to yellow indicating the
formation of liquid by-products. In addition, soot was also formed, in higher
concentration in case of the N2/H2O treatment.
Figure 6.17 Crude samples of a) N2/H2O and b) Ar/H2O plasma recycling treatment
of dodecane at different treatment time up to 60 min

193
Moreover, it is interesting to note that the soot formation in case of N2/H2O increases
significantly after 20 min, while in case of ArH2O, no significant change is observed
after the 10 min of treatment time. This could be correlated with the production rate
of the gaseous products, where in Ar/H2O they rich a steady state after 10 min, while
in N2/H2O the concentration of HCN and C2H4 significantly increases after 20 min.
After filtration, the crude samples from 60 min of treatment were subjected to GC-
MS analysis and using the peak ratio technique, the level of by-products mixed with
untreated dodecane was estimated to be < 0.5 and < 1.1 % in case of N2/H2O and
Ar/H2O plasma, respectively. Figure 6.18 shows the respective chromatograms
compared with the blank dodecane.
Figure 6.18 Normalised GC chromatograms of liquid crude samples after N2/H2O
and Ar/H2O recycling plasma treatment of dodecane.
The liquid products identified in the crude samples after the N2/H2O plasma batch
treatment of dodecane, are similar to those observed earlier in the case of the batch
treatment. These are alkenes such as decene (C10H20), undecene (C12H22), alcohols
such as tridecanol (C13H28O), tetradecanol (C14H30O), pentadecanol (C15H32O) ,
hexadecanol (C16H34O) and triphenylmethanol (C19H16O). The aliphatic ester of
bis(3-ethylhexyl) adipate (C22H42O4) is also identified. These species are also seen in
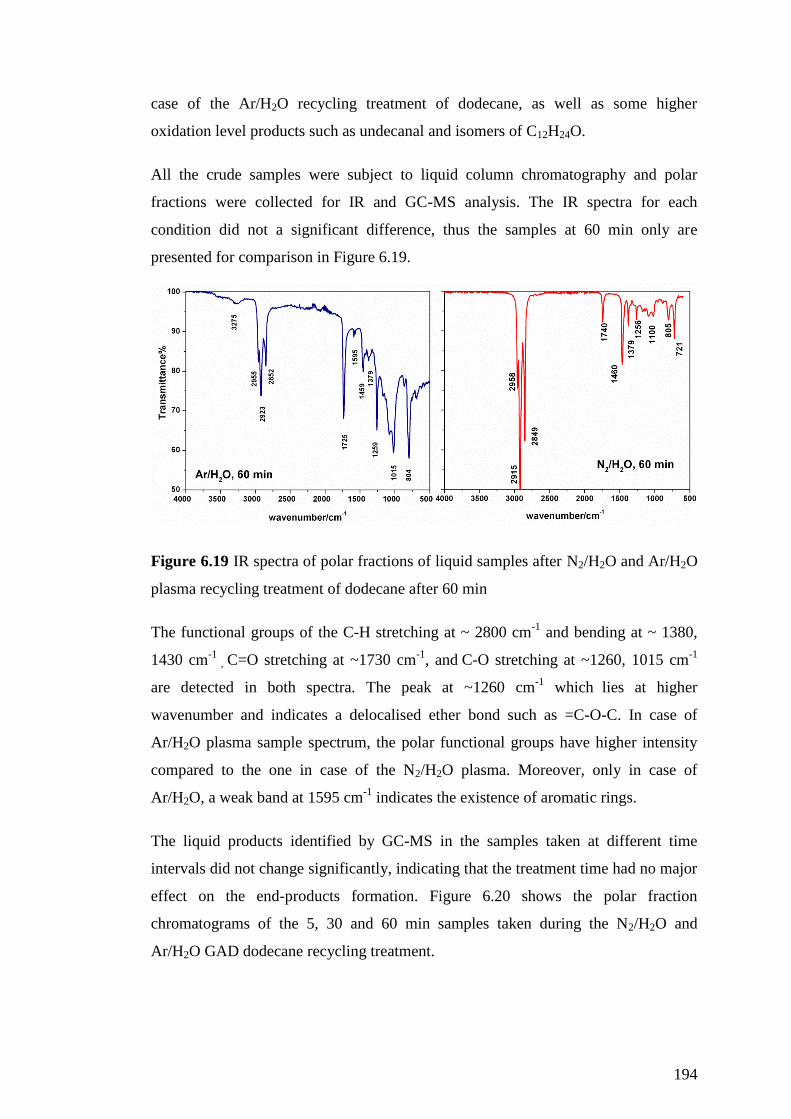
194
case of the Ar/H2O recycling treatment of dodecane, as well as some higher
oxidation level products such as undecanal and isomers of C12H24O.
All the crude samples were subject to liquid column chromatography and polar
fractions were collected for IR and GC-MS analysis. The IR spectra for each
condition did not a significant difference, thus the samples at 60 min only are
presented for comparison in Figure 6.19.
Figure 6.19 IR spectra of polar fractions of liquid samples after N2/H2O and Ar/H2O
plasma recycling treatment of dodecane after 60 min
The functional groups of the C-H stretching at ~ 2800 cm-1
and bending at ~ 1380,
1430 cm-1
, C=O stretching at ~1730 cm
-1, and
C-O stretching at ~1260, 1015 cm
-1
are detected in both spectra. The peak at ~1260 cm-1
which
lies at higher
wavenumber and indicates a delocalised ether bond such as =C-O-C. In case of
Ar/H2O plasma sample spectrum, the polar functional groups have higher intensity
compared to the one in case of the N2/H2O plasma. Moreover, only in case of
Ar/H2O, a weak band at 1595 cm-1
indicates the existence of aromatic rings.
The liquid products identified by GC-MS in the samples taken at different time
intervals did not change significantly, indicating that the treatment time had no major
effect on the end-products formation. Figure 6.20 shows the polar fraction
chromatograms of the 5, 30 and 60 min samples taken during the N2/H2O and
Ar/H2O GAD dodecane recycling treatment.

195
Figure 6.20 Normalised GC chromatograms of polar fractions of samples taken
during the N2/H2O and Ar/H2O GAD recycling treatment of dodecane at 5, 30 and 60
min.
Major products formed in all cases are decanol, tetradecanol, pentadecanol,
hexadecanol, the aliphatic ester of bis(3-ethylhexyl) adipate and the bis(6-
methylheptyl) phthalate ester. In both N2/H2O and Ar/H2O plasma treatment at 5
min, alcohol products seems to have overall high abundance, while the products of
esters seem to be more important in longer treatment time up to 60 min. This could
indicate that light molecules formed initially in the treated dodecane can
subsequently lead to heavier higher oxidation state molecules.
6.4 Summary and Conclusions
The plasma degradation of liquid dodecane has been studied using gliding arc
discharge, as a batch and recycling treatment. Results show that there are differences
between the gas chemistry during the plasma-liquid treatment of dodecane and the
treatment of gaseous dodecane. The selectivity of the gaseous products can change,
due to the plasma-liquid interactions. The reactive species formed in plasma can

196
diffuse into the liquid interface to initiate reactions which could mainly breakdown
dodecane to lighter gaseous products but also form heavier products remaining in the
bulk liquid. Cascaded liquid-based chemistry presents a scenario largely dominated
by molecular potentials and reaction activation energies. This differs from the gas-
phase chemistry in plasmas where the species and in particular charged species
behave as isolated entities and the reactions are mainly determined by their kinetic
energies.
In the case of batch treatment, Ar and N2 have been studied as plasma gases in both
dry and humid conditions. Humidity increases the oil degradation for both Ar and N2
plasma by increasing the production rate of gaseous products and also the
concentration of the products in the liquid. The best degradation efficiency is noted
in the case of N2/H2O causing a 44.2 % reduction in the oil volume after 1 h of
treatment. The Ar/H2O plasma treatment of dodecane creates a slower rate of
gaseous-product formation, but a higher abundance of liquid end-products. It is
suggested that the higher energy dissipated in the N2 plasma and the elevated gas
temperature can affect the degradation mechanism chemically, by increasing the
reactivity, but also physically, causing a higher degree of vaporisation.
A wide range of liquid products have been identified such as heavier saturated or
unsaturated hydrocarbons both aliphatic and aromatic, and oxidation products mainly
alcohols, but also aldehydes, ketones and esters. In the case of Ar plasma, the
abundance of aldehydes and ketones is higher than alcohols, in contrast to the N2
plasma liquid products, where alcohols abundance is higher. In the latter case, it is
possible that the oxidation reaction rates are decreased, due to slower diffusion rate
of the reactive species caused by dynamic vaporisation.
The recycling treatment of dodecane creates a direct plasma-liquid treatment, which
increases the reactivity and changes the selectivities of the gaseous products.
Compared to the batch treatment results, the degradation efficiency for both Ar/H2O
and N2/H2O plasma is increased by a factor of 4.2 and 4.9, respectively. Liquid
analysis of samples from different treatment times shows that similar products are
formed, with no significant change during the treatment time.
Overall, the study of gliding arc plasma-liquid treatment of dodecane shows
promising results for the application on organic liquid waste. Among Ar and N2 in
197
both dry and humid conditions, humid N2 plasma appears as the favoured condition
which allows higher degradation rate and destroys a larger volume of oil, leaving
lower concentration of residual end-products in the liquid. On the other hand, using
dry or humid Ar plasma creates lower gasification and promotes the liquid chemistry.
This would be interesting to be further explored for selective liquid treatment
applications. In both cases, our results show that a potential recycling treatment
would increase significantly the rate of the process.
6.5 References
[1] D. Mariotti, Patel, J., Švrček, V., Maguire, P., "Plasma-liquid interactions at
atmospheric pressure for nanomaterials synthesis and surface engineering,"
Plasma Processes and Polymers, vol. 9, pp. 1074-1085, 2012.
[2] B. Abel, Buck, U., Sobolewski, A. L., Domcke, W., "On the nature and
signatures of the solvated electron in water," Physical Chemistry Chemical
Physics, vol. 14, pp. 22-34, 2012.
[3] B. R. Locke, Thagard, S. M., "Analysis of Chemical Reactions in Gliding-
Arc Reactors With Water Spray Into Flowing Oxygen," Plasma Science,
IEEE Transactions on, vol. 37, pp. 494-501, 2009.
[4] J.-L. Brisset, Baghdad, Benstaali,David, Moussa, Jean, Fanmoe, Estella,
Njoyim-Tamungang, "Acidity control of plasma-chemical oxidation:
applications to dye removal, urban waste abatement and microbial
inactivation," Plasma Sources Science and Technology, vol. 20, p. 034021,
2011.
[5] K. Oehmigen, Hoder, T., Wilke, C., Brandenburg, R., Hahnel, M., Weltmann,
K. D., von Woedtke, T., "Volume Effects of Atmospheric-Pressure Plasma in
Liquids," Plasma Science, IEEE Transactions on, vol. 39, pp. 2646-2647,
2011.
[6] L. B. Harding, et al., "Predictive Theory for Hydrogen Atom - Hydrocarbon
Radical Association Kinetics," The Journal of Physical Chemistry A, vol.
109, pp. 4646-4656, 2013/09/03 2005.

198
[7] W. Tsang and R. F. Hampson, "Chemical Kinetic Data Base for Combustion
Chemistry. Part I. Methane and Related Compounds," Journal of Physical
and Chemical Reference Data, vol. 15, pp. 1087-1279, 1986.
[8] L. Merlo-Sosa, G.Soucy, "Dodecane Decomposition in a Radio-Frequency
(RF) Plasma Reactor," International Journal of Chemical Reactor
Engineering, vol. 3, 2005.
[9] G. O. Prieto, M. Shimano, K. Takashima, K. Katsura, S. Mizuno, A.,
"Reforming of heavy oil using nonthermal plasma," Industry Applications,
IEEE Transactions on, vol. 37, pp. 1464-1467, 2001.
[10] G. O. Prieto, M. Takashima, K. Mizuno, A. Prieto, O. Gay, C. R., "A plate-
to-plate plasma reactor as a fuel processor for hydrogen-rich gas production,"
in Industry Applications Conference, 2001. Thirty-Sixth IAS Annual Meeting.
Conference Record of the 2001 IEEE, 2001, pp. 1099-1102 vol.2.
[11] Y. Matsui, et al., "Liquid-Phase Fuel Re-forming at Room Temperature
Using Nonthermal Plasma," Energy & Fuels, vol. 19, pp. 1561-1565,
2005/07/01 2005.
[12] S. M. P. Thagard, G. Takashima, K. Mizuno, A. , "Identification of Gas-
Phase By-Products Formed During Electrical Discharges in Liquid Fuels,"
Plasma Science, IEEE Transactions on, vol. 40, pp. 2106-2111, 2012.
[13] M. A. Malik, Hughes, D., Malik, A., Xiao, S., Schoenbach, K. H., "Study of
the production of hydrogen and light hydrocarbons by spark discharges in
diesel, kerosene, gasoline, and methane," Plasma Chemistry and Plasma
Processing, vol. 33, pp. 271-279, 2013.
[14] N. R. Hooshmand, Mohammad Reza Jahanmiri, Abdolhosein Taghvaei,
Hamed Mohamadzadeh Shirazi, Meisam, "Hexadecane Cracking in a Hybrid
Catalytic Pulsed Dielectric Barrier Discharge Plasma Reactor," Industrial &
Engineering Chemistry Research, vol. 52, pp. 4443-4449, 2013/03/27 2013.
[15] H. J. Taghvaei, Abdolhosien Rahimpour, Mohammad Reza Shirazi, Meisam
Mohamadzadeh, Hooshmand, Navid, "Hydrogen production through plasma
cracking of hydrocarbons: Effect of carrier gas and hydrocarbon type,"
Chemical Engineering Journal, vol. 226, pp. 384-392, 2013.

199
[16] M. R. B. Khani, S. H. R. Yaghmaee, M. S. Hosseini, S. I. Shariat, M. Shokri,
B. Fakhari, A. R. Nojavan, S. Tabani, H. Ghaedian, M., "Investigation of
Cracking by Cylindrical Dielectric Barrier Discharge Reactor on the n-
Hexadecane as a Model Compound," Plasma Science, IEEE Transactions on,
vol. 39, pp. 1807-1813, 2011.
[17] T. Paulmier and L. Fulcheri, "Use of non-thermal plasma for hydrocarbon
reforming," Chemical Engineering Journal, vol. 106, pp. 59-71, 2005.
[18] P. Czernichowski, Czernichowski A., "Conversion of hydrocarbons assisted
by gliding electric arcs," European Patent, OA10872, 2001.
[19] W.-y. Liu, Lei, Zheng-lan, Lü, Wei, Wang, Jin-kun, "Plasma Oxidation of n-
heptane in Liquid Phase," Plasma Science and Technology, vol. 2, p. 463,
2000.
[20] H. Suhr, Schmid, H., Pfeundschuh, H., Lacocca, D., "Plasma oxidation of
liquids," Plasma Chemistry and Plasma Processing, vol. 4, pp. 285-295,
1984.
[21] P. Patiño, Hernández, F. E., Rondón, S., "Reactions of O(3P) with secondary
C-H bonds of saturated hydrocarbons in nonequilibrium plasmas," Plasma
Chemistry and Plasma Processing, vol. 15, pp. 159-171, 1995.
[22] G. Gambús, Patiño, Pedro, Méndez, Bernardo, Sifontes, Angela, Navea, Juan,
Martín, Pedro, Taylor, Patrick, "Oxidation of Long Chain Hydrocarbons by
Means of Low-Pressure Plasmas," Energy & Fuels, vol. 15, pp. 881-886,
2001/07/01 2001.
[23] P. Pati o, Mej a, Aurora, Rodr guez, Patricia, M ndez, Bernardo, " pgrading
of diesel fuels and mixtures of hydrocarbons by means of oxygen low
pressure plasmas: a comparative study," Fuel, vol. 82, pp. 1613-1619, 2003.
[24] D. H. Williams, I. Fleming, Spectroscopic Methods in Organic Chemistry.
London: McGraw-Hill Publishing Company Ltd, 1966.
[25] V. V. Kislov, Sadovnikov, A. I., Mebel, A. M., "Formation Mechanism of
Polycyclic Aromatic Hydrocarbons beyond the Second Aromatic Ring," The
Journal of Physical Chemistry A, vol. 117, pp. 4794-4816, 2013/06/13 2013.
200
Chapter 7
7. Thesis summary, conclusions and future work
7.1 Thesis summary and conclusions
This thesis has studied the low-temperature atmospheric pressure plasma as a
potential technological application for the degradation of organic liquid waste found
in nuclear industries. Odourless kerosene and dodecane have been used as simulants,
as they are mostly found among spent solvents in nuclear industries. The study has
been approached initially by investigating the degradation of oil in gas phase only,
using a BaTiO3 packed bed plasma reactor and a gliding arc discharge reactor.
Kerosene has showed similar degradation behaviour to dodecane and the latter one
was chosen as a surrogate to allow quantitative analysis. The dodecane plasma
degradation efficiency and the distribution of end-gaseous products have been
studied under these two reactors in different gas compositions. Overall, there are
differences in dodecane degradation gas chemistry between the packed bed and the
gliding arc plasma and postulated mechanisms are presented for each condition.
Gliding arc discharge demonstrates higher degradation efficiency and it is mainly
used for the plasma-liquid treatment.
The plasma-liquid dodecane treatment is firstly studied using argon dielectric barrier
discharge. Using different reactor configuration, humidified plasma gas or increased
operating temperature affects the discharge characteristics and thus the degradation
efficiency. Using the DBD plasma “in contact” with dodecane, more energy is
dissipated in the discharge giving a more distinct filamentary character. When DBD
plasma is generated inside dodecane with the assistance of argon bubbles feed,
discharge can occur in the gas inside the bubble or as a surface discharge in the
bubble-liquid interface. Best degradation rate is shown in dry argon plasma “in
contact” with dodecane at 100 ∙C. However, most energy efficient treatment occurs
in case of humidified argon bubble plasma at 25 ∙C.
The study of the liquid dodecane degradation is expanded by using the gliding arc
discharge, as a batch and recycling treatment. Nitrogen and argon plasma gases have
been used in both dry and humid conditions for the batch treatment of dodecane.

201
Results show that there are differences between the gas chemistry during the plasma-
liquid treatment of dodecane and the treatment of gaseous dodecane. The selectivity
of the gaseous products can change, due to the plasma-liquid interactions. The
reactive species formed in plasma can diffuse into the liquid interface to initiate
reactions which could mainly breakdown dodecane to lighter gaseous products but
also form heavier products remaining in the bulk liquid. Overall, humid N2 plasma
appears as the favoured condition which allows higher degradation rate and destroys
a larger volume of oil, leaving lower concentration of residual end-products in the
liquid. On the other hand, using dry or humid Ar plasma creates lower gasification
and promotes the liquid chemistry. This could be useful if tailored for specific
applications, for example in cases that minimum vaporisation is desirable to convert
liquid waste into solid parts for transport and disposal. In both cases, our results
show that a potential recycling treatment would increase significantly the rate of the
process. Future work on these directions can contribute to the development of a
promising technology for the organic waste treatment.
7.2 Recommendations for future work
The key factor to develop an efficient plasma-chemical process is to understand the
mechanism, in order to be able to control, optimise and tailor the process. The
plasma-liquid treatment of organics is a complicated mechanism that has been
discussed in this thesis, but there are yet many discoveries to unravel. Optical
emission spectroscopy is a strong plasma diagnostics tool that was used in this work
and gave very interesting observations for the gliding arc plasma processing during
gaseous or liquid treatment of dodecane. This work could be extended to space and
time resolved spectroscopy, which would enable diagnostics of the intermediate
excited species in different positions and during the treatment time. In addition, the
advanced optical diagnostics such as laser-induced fluorescence (LIF) techniques
would allow the calculation of densities of intermediate species which would add
valuable information. The study of the plasma-liquid mechanism could be also
enhanced by using further diagnostics in the liquid phase. Electron paramagnetic
resonance (EPR) could be applied to detect the radicals in the liquid and give useful
information for the chemistry in the liquid interface. Optimisation of the gas phase
analysis is also needed to detect a full range of the gaseous end-products. In addition
202
to IR detection, a properly set-up GC system would also allow the identification of a
wider range of hydrocarbons, as well as other gases including H2, which would help
to elucidate the waste destruction mechanism. This also opens research directions to
potential optimisation of the plasma organic waste conversion towards high
selectivities of H2 or other valuable products, that would benefit the market.
Further work is also needed in terms of optimising the plasma-liquid waste treatment
parameters in order to improve the efficiency of the destruction. This work has
shown promising results under N2/H2O plasma conditions, however the influence of
different gas compositions, could be also studied. Knowing that air is commonly
supplied in industrial sites, it should be also investigated for the plasma-liquid
processing. Preliminary experiments in this work has shown promising results,
however difficulties in the analysis from the excess vaporisation and water
production, did not allow a complete study and someone should consider this
challenges in future research. Mixtures of Ar/O2 plasma could be also tested, as it
could improve the waste oxidation, avoiding at the same time the undesirable NOx
formation occurring in air plasma.
This work has also shown that the recycling treatment has increased the efficiency of
the plasma-liquid degradation, compared to the batch treatment. This work could be
extended on investigating injection methods to further the efficiency of the process.
Injecting the liquid from the top or optimising the injection nozzle to form aerosols
could further increase the surface reaction area and thus, the degradation rate.
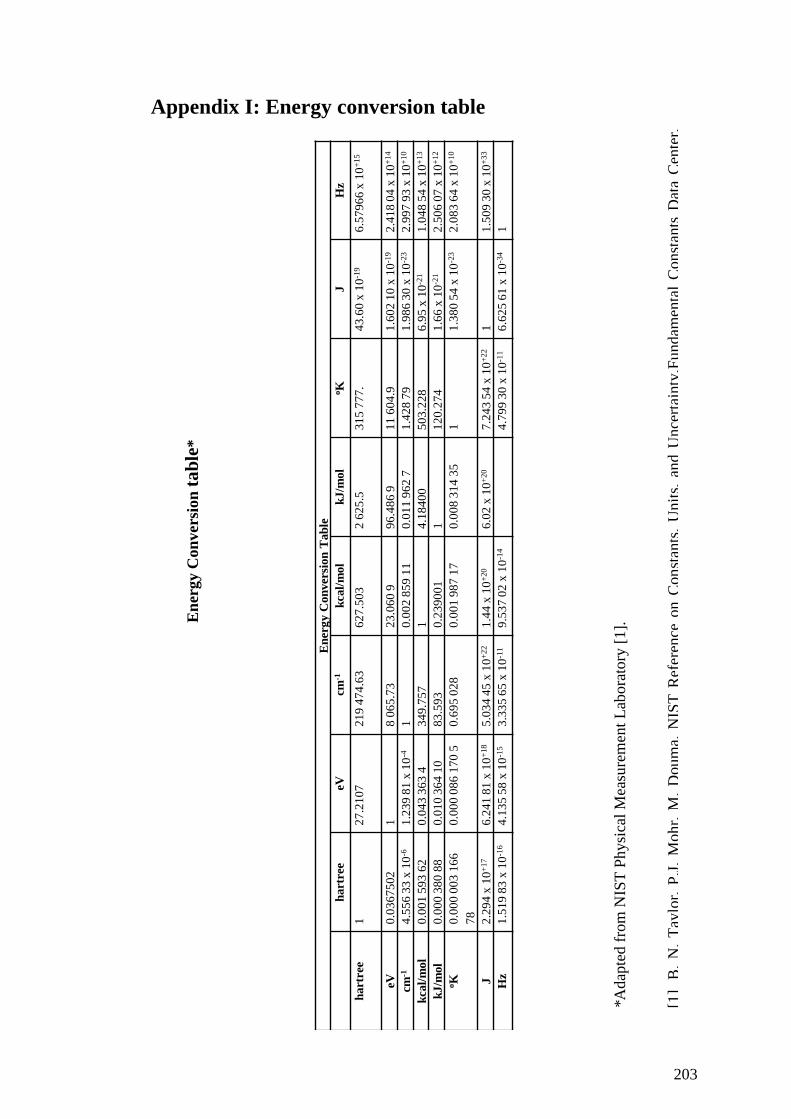
203
En
ergy C
on
ver
sion
ta
ble
*
Appendix I: Energy conversion table
En
erg
y C
on
ver
sion
Tab
le
hart
ree
eV
cm-1
kca
l/m
ol
kJ
/mol
oK
J
H
z
hart
ree
1
27
.21
07
2
19
47
4.6
3
62
7.5
03
2
62
5.5
3
15
77
7.
43
.60
x 1
0-1
96
.57
96
6 x
10
+1
5
eV
0.0
36
75
02
1
8
06
5.7
3
23
.06
0 9
9
6.4
86
9
11
60
4.9
1
.60
2 1
0 x
10
-19
2.4
18
04
x 1
0+
14
cm-1
4.5
56
33
x 1
0-6
1.2
39
81
x 1
0-4
1
0.0
02
85
9 1
1
0.0
11
96
2 7
1
.42
8 7
9
1.9
86
30
x 1
0-2
32
.99
7 9
3 x
10
+1
0
kca
l/m
ol
0.0
01
59
3 6
2
0.0
43
36
3 4
3
49
.75
7
1
4.1
84
00
5
03
.22
8
6.9
5 x
10
-21
1.0
48
54
x 1
0+
13
kJ
/mol
0.0
00
38
0 8
8
0.0
10
36
4 1
0
83
.59
3
0.2
39
00
1
1
12
0.2
74
1
.66
x 1
0-2
12
.50
6 0
7 x
10
+1
2
oK
0
.00
0 0
03
16
6
78
0.0
00
08
6 1
70
5
0.6
95
02
8
0.0
01
98
7 1
7
0.0
08
31
4 3
5
1
1.3
80
54
x 1
0-2
32
.08
3 6
4 x
10
+1
0
J
2.2
94
x 1
0+
17
6.2
41
81
x 1
0+
18
5.0
34
45
x 1
0+
22
1.4
4 x
10
+2
06
.02
x 1
0+
20
7.2
43
54
x 1
0+
22
1
1.5
09
30
x 1
0+
33
Hz
1.5
19
83
x 1
0-1
64
.13
5 5
8 x
10
-15
3.3
35
65
x 1
0-1
19
.53
7 0
2 x
10
-14
4.7
99
30
x 1
0-1
16
.62
5 6
1 x
10
-34
1
*A
dap
ted f
rom
NIS
T P
hysi
cal
Mea
sure
men
t L
abora
tory
[1].
[1]
B.
N.
Tay
lor,
P.J
. M
ohr,
M.
Doum
a. N
IST
Ref
eren
ce o
n C
on
stan
ts,
Unit
s, a
nd U
nce
rtai
nty
,Fundam
enta
l C
onst
ants
Dat
a C
ente
r,
NIS
T P
hysi
cal
Mea
sure
men
tLab
ora
tory
.[O
nli
ne]
.Avai
lable
: htt
p:/
/physi
cs.n
ist.
gov/c
uu/C
onst
ants
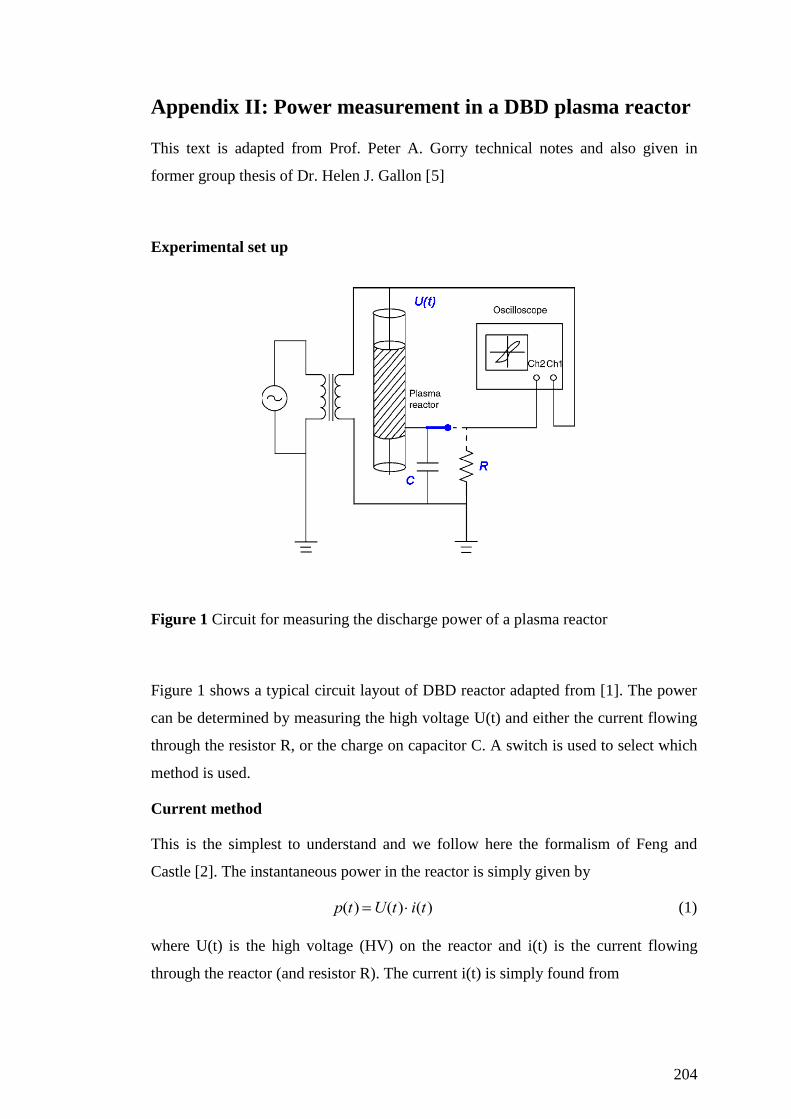
204
Appendix II: Power measurement in a DBD plasma reactor
This text is adapted from Prof. Peter A. Gorry technical notes and also given in
former group thesis of Dr. Helen J. Gallon [5]
Experimental set up
Figure 1 Circuit for measuring the discharge power of a plasma reactor
Figure 1 shows a typical circuit layout of DBD reactor adapted from [1]. The power
can be determined by measuring the high voltage U(t) and either the current flowing
through the resistor R, or the charge on capacitor C. A switch is used to select which
method is used.
Current method
This is the simplest to understand and we follow here the formalism of Feng and
Castle [2]. The instantaneous power in the reactor is simply given by
p(t) U(t) i(t) (1)
where U(t) is the high voltage (HV) on the reactor and i(t) is the current flowing
through the reactor (and resistor R). The current i(t) is simply found from
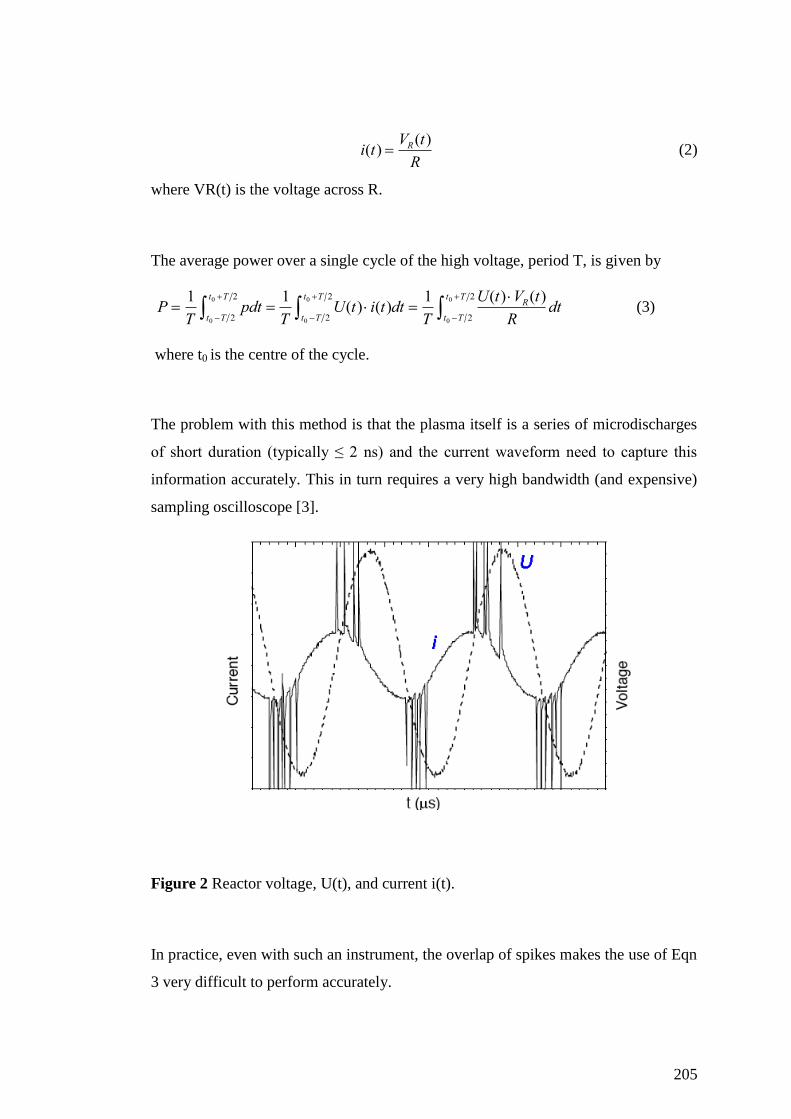
205
i(t) VR(t)
R (2)
where VR(t) is the voltage across R.
The average power over a single cycle of the high voltage, period T, is given by
P 1
Tpdt
t0 T 2
t0 T 2
1
TU(t) i(t)dt
t0 T 2
t0 T 2
1
T
U(t) VR(t)
Rdt
t0 T 2
t0 T 2
(3)
where t0 is the centre of the cycle.
The problem with this method is that the plasma itself is a series of microdischarges
of short duration (typically ≤ 2 ns) and the current waveform need to capture this
information accurately. This in turn requires a very high bandwidth (and expensive)
sampling oscilloscope [3].
Figure 2 Reactor voltage, U(t), and current i(t).
In practice, even with such an instrument, the overlap of spikes makes the use of Eqn
3 very difficult to perform accurately.
206
Lissajous method
This method was introduced by Manley [4] in 1943. In the absence of any way of
accurately recording the microdischarge current spikes the alternative is to replace
the probe resistor R by a probe capacitor C. The capacitor accumulates a charge from
the current flowing through the reactor and this can be determined by measuring the
voltage on the capacitor Vc.
q(t) C Vc(t) (4)
The advantage is that the charge is stored in the capacitor and does not require a fast
transient digitiser to record it. The energy per cycle, W, can be found from Eqn 3 by
multiplying by T.
W U(t) i(t)dtt0 T 2
t0 T 2
(5)
The current flowing through the measuring capacitor, C, is given by
i(t) dq
dt C
dVc
dt (6)
hence we have
q(t) C Vc(t) (7)
and the energy per cycle becomes
W U(t) C Vc(t)dtt0 T 2
t0 T 2
U(t) dq(t)t0 T 2
t0 T 2
(8)
If we record U(t) and q(t) as a series of n regularly sampled points over one cycle we
can approximate Eqn 8 by a summation, using trapezoidal integration, as
W Uk1 Uk
2
k1
n
(qk1 qk ) (9)
We now simply have to multiply by the number of cycles per second to get the
power in the reactor. So, if the voltage U has a frequency, f, where f = 1/T , we have
P W f fUk1 Uk
2
k1
n
(qk1 qk ) (10)
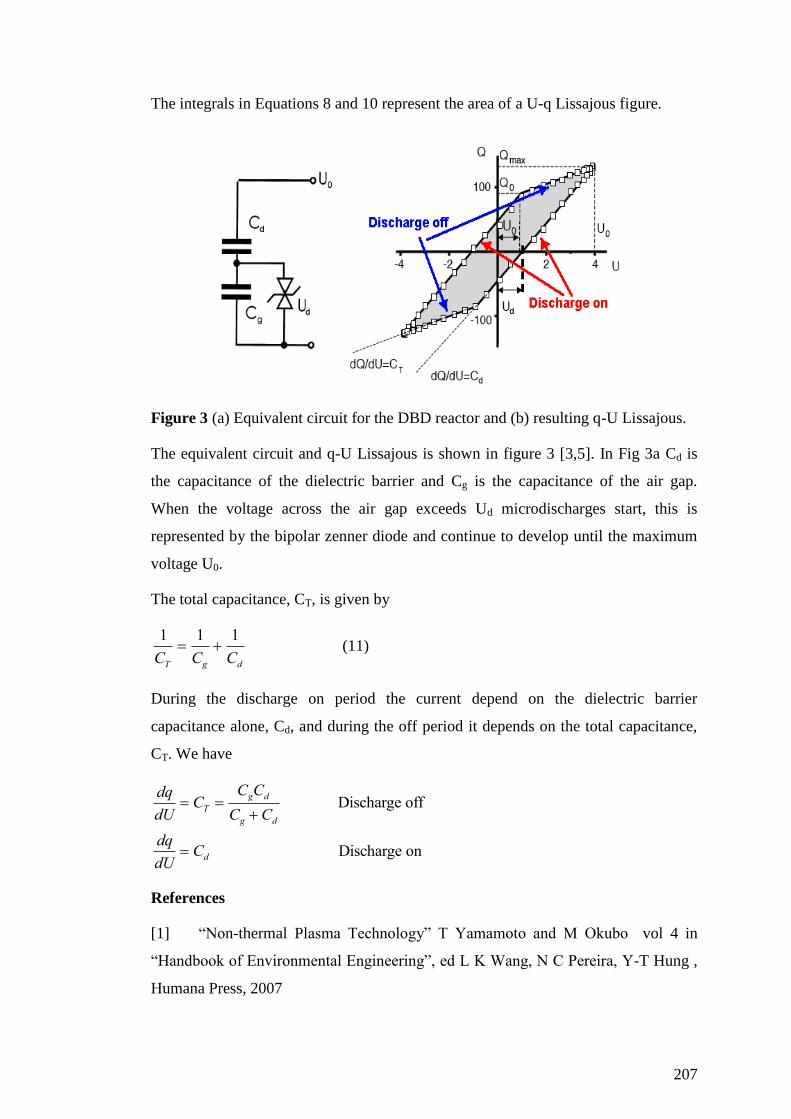
207
The integrals in Equations 8 and 10 represent the area of a U-q Lissajous figure.
Figure 3 (a) Equivalent circuit for the DBD reactor and (b) resulting q-U Lissajous.
The equivalent circuit and q-U Lissajous is shown in figure 3 [3,5]. In Fig 3a Cd is
the capacitance of the dielectric barrier and Cg is the capacitance of the air gap.
When the voltage across the air gap exceeds Ud microdischarges start, this is
represented by the bipolar zenner diode and continue to develop until the maximum
voltage U0.
The total capacitance, CT, is given by
1
CT
1
Cg
1
Cd (11)
During the discharge on period the current depend on the dielectric barrier
capacitance alone, Cd, and during the off period it depends on the total capacitance,
CT. We have
dq
dU CT
CgCd
Cg Cd Discharge off
dq
dU Cd Discharge on
References
[1] “Non-thermal Plasma Technology” T Yamamoto and M Okubo vol 4 in
“Handbook of Environmental Engineering”, ed L K Wang, N C Pereira, Y-T Hung ,
Humana Press, 2007
208
[2] R. Feng and G.S.P. Castle, “Automated System for Power Measurement in
the Silent Discharge,” IEEE. Trans. Indust. Appl., vol. 34, pp. 563–569,. 1998.
[3] H. E. Wagner, R. Brandenburg, K. V. Kozlov, A. Sonnenfeld, P. Michel, J. F.
Behnke, “The barrier discharge: basic properties and applications to surface
treatment”, Vacuum, vol 71, 417-436, 2003.
[4] T. C. Manley, “The electric characteristics of the ozonator discharge,” Trans.
Electrochem. Soc., vol. 84, 83–94,. 1943.
[5] H. J. Gallon, "Dry Reforming of Methane Using Non-Thermal Plasma-
Catalysis," PhD in the Faculty of Engineering and Physical Sciences., School of
Chemistry, University of Manchester, Manchester, 2010.

209
Appendix III: Publications and conferences
Publications
Maria Prantsidou, J. Christopher Whitehead, “Plasma-chemical degradation of
gaseous dodecane in a ferroelectric packed-bed plasma reactor”- to be submitted
in the Journal of Plasma Chemistry and Plasma Processing
Conference Presentations
Maria Prantsidou, J. Christopher Whitehead, “Plasma Degradation of Organic
Liquid Waste”, Royal Society of Chemistry - Radiochemistry Group Seminar:
Recent Innovation in Nuclear Waste Treatment, Birchwood Park, Warrington,
Cheshire, April 2013, invited talk.
Maria Prantsidou, J. Christopher Whitehead, "Spent Oil Degradation by Gliding
Arc Discharge", International Workshop on Plasma Exhaust Treatment,
Leibniz Institute for Plasma Science and Technology,
INP Greifswald, December 2012, invited talk.
Maria Prantsidou, J. Christopher Whitehead, " Plasma-liquid Degradation of
Waste Oil”, 10th
Technological Plasma Workshop (TPW-10), Milton Keys UK,
December 2012, poster.
Maria Prantsidou, J. Christopher Whitehead, "Spent Oil Degradation by Gliding
Arc Discharge", 13th International Symposium on High Pressure Low
Temperature Plasma Chemistry (HAKONE XIII), Kazimierz Dolny, Poland,
September 2012, talk.
Maria Prantsidou, J. Christopher Whitehead, "Low Temperature Atmospheric
Plasma Clean-up of Waste Oils", 1th Postgraduate Chemistry Committee
Symposium (PGCC-2012), Newcastle, UK, July 2012, talk.
Maria Prantsidou, J. Christopher Whitehead, "Low Temperature Atmospheric
Pressure Plasma Degradation of Waste Oils", 8th International Symposium on
Non-Thermal/Thermal Plasma Pollution Control Technology & Sustainable
Energy, (ISNTP-8), Camaret, France, June 2012, talk.
210
Maria Prantsidou, J. Christopher Whitehead, "Low Temperature Plasma
Degradation of Waste Oils" 9th
Technological Plasma Workshop (TPW-9),
Manchester, UK, January 2012, talk.
Maria Prantsidou, J. Christopher Whitehead, “Non thermal plasma degradation of
spent solvents and oils using a gliding arc discharge reactor”. RSC ChemCareers,
Postgraduate Competition London, November 2011, poster
Maria Prantsidou, J. Christopher Whitehead, "Non-thermal Plasma Degradation
of Spent Oils", Annual meeting of Institute of Electrostatics Japan (IESJ),
University of Science, Tokyo, Japan , Sept 2011, talk.
Maria Prantsidou, J. Christopher Whitehead, "Non-thermal Plasma Degradation
of Spent Solvents and Oils using a Gliding Arc Discharge Reactor", 20th
International Symposium on Plasma Chemistry (ISPC-20), Philadelphia, USA.
August 2011, poster.
Maria Prantsidou, J. Christopher Whitehead, "Non-thermal plasma destruction of
oils in the vapour phase", 8th
Technological plasma Workshop (TPW-8), Bristol
UK, January 2011, poster.
Related Documents