HAL Id: cea-01807460 https://hal-cea.archives-ouvertes.fr/cea-01807460 Submitted on 7 Jun 2021 HAL is a multi-disciplinary open access archive for the deposit and dissemination of sci- entific research documents, whether they are pub- lished or not. The documents may come from teaching and research institutions in France or abroad, or from public or private research centers. L’archive ouverte pluridisciplinaire HAL, est destinée au dépôt et à la diffusion de documents scientifiques de niveau recherche, publiés ou non, émanant des établissements d’enseignement et de recherche français ou étrangers, des laboratoires publics ou privés. Plasma hydrogenated cationic detonation nanodiamonds effciently deliver to human cells in culture functional siRNA targeting the Ewing sarcoma junction oncogene Jean-Rémi Bertrand, Catherine Pioche-Durieu, Juan Ayala, Tristan Petit, Hugues Girard, Claude Malvy, Eric Le Cam, François Treussart, Jean-Charles Arnault To cite this version: Jean-Rémi Bertrand, Catherine Pioche-Durieu, Juan Ayala, Tristan Petit, Hugues Girard, et al.. Plasma hydrogenated cationic detonation nanodiamonds effciently deliver to human cells in culture functional siRNA targeting the Ewing sarcoma junction oncogene. Biomaterials, Elsevier, 2015, 45, pp.93 - 98. 10.1016/j.biomaterials.2014.12.007. cea-01807460

Welcome message from author
This document is posted to help you gain knowledge. Please leave a comment to let me know what you think about it! Share it to your friends and learn new things together.
Transcript
HAL Id: cea-01807460https://hal-cea.archives-ouvertes.fr/cea-01807460
Submitted on 7 Jun 2021
HAL is a multi-disciplinary open accessarchive for the deposit and dissemination of sci-entific research documents, whether they are pub-lished or not. The documents may come fromteaching and research institutions in France orabroad, or from public or private research centers.
L’archive ouverte pluridisciplinaire HAL, estdestinée au dépôt et à la diffusion de documentsscientifiques de niveau recherche, publiés ou non,émanant des établissements d’enseignement et derecherche français ou étrangers, des laboratoirespublics ou privés.
Plasma hydrogenated cationic detonation nanodiamondsefficiently deliver to human cells in culture functional
siRNA targeting the Ewing sarcoma junction oncogeneJean-Rémi Bertrand, Catherine Pioche-Durieu, Juan Ayala, Tristan Petit,
Hugues Girard, Claude Malvy, Eric Le Cam, François Treussart, Jean-CharlesArnault
To cite this version:Jean-Rémi Bertrand, Catherine Pioche-Durieu, Juan Ayala, Tristan Petit, Hugues Girard, et al..Plasma hydrogenated cationic detonation nanodiamonds efficiently deliver to human cells in culturefunctional siRNA targeting the Ewing sarcoma junction oncogene. Biomaterials, Elsevier, 2015, 45,pp.93 - 98. �10.1016/j.biomaterials.2014.12.007�. �cea-01807460�
Plasma hydrogenated cationic detonation nanodiamonds efficiently
deliver to human cells in culture functional siRNA targeting the
Ewing sarcoma junction oncogene
J.-R. Bertrand,a C. Pioche-Durieu,b J. Ayala,a T. Petit,c H. A. Girard,c C. P. Malvya, E. Le Cam,b
F. Treussart,d and J.-C. Arnaultc
a Laboratoire de Vectorologie et Thérapeutiques Anticancéreuses, UMR 8203 CNRS,
Université Paris Sud, Institut Gustave Roussy, 94805 Villejuif, France. E-Mail : jean-
[email protected] b Signalisation, Noyaux et Innovations en Cancérologie, UMR 8126 CNRS, Université Paris
Sud, Institut Gustave Roussy, 94805 Villejuif, France c CEA, LIST, Diamond Sensors Laboratory, F-91191 Gif-sur-Yvette, France. E-Mail: jean-
[email protected] d Laboratoire Aimé Cotton, CNRS, Université Paris Sud and ENS Cachan, 91405 Orsay, France.
E-Mail : [email protected]
Abstract: The expression of a defective gene can lead to major cell dysfunctions among
which cell proliferation and tumor formation. One promising therapeutic strategy consists in
silencing the defective gene using small interfering RNA (siRNA). In previous publications we
showed that diamond nanocrystals (ND) of primary size 35 nm, rendered cationic by
polyethyleneimine-coating, can efficiently deliver siRNA into cell, which further block the
expression of EWS/FLI-1 oncogene in a Ewing sarcoma disease model. However, a
therapeutic application of such nanodiamonds requires their elimination by the organism,
particularly in urine, which is impossible for 35 nm particles. Here, we report that
hydrogenated cationic nano- diamonds of primary size 7 nm (ND-H) have also a high affinity
for siRNA and are capable of delivering them in cells. With siRNA/ND-H complexes, we
measured a high inhibition efficacy of EWS/FLI-1 gene expression in Ewing sarcoma cell line.
Electron microscopy investigations showed ND-H in endocytosis compartments, and
especially in macropinosomes from which they can escape before siRNA degradation
occurred. In addition, the association of EWS/FLI-1 silencing by the siRNA/ND-H complex
with a vincristine treatment yielded a potentiation of the toxic effect of this
chemotherapeutic drug. Therefore ND-H appears as a promising delivery agent in anti-
tumoral gene therapy.
1. Introduction
In recent years, nanodiamonds (NDs) have gained increasing attention as powerful
nanoplatform with fluorescent labeling ca- pacities for both diagnostic and therapeutic
purposes [1,2]. Indeed, NDs have properties that make them highly suitable for biomedical
applications: several in vitro [3] and in vivo [4] studies have shown that NDs are non-
cytotoxic with an enhanced cell tolerance compared to other carbon nanoparticles, and their
carbon-related surface chemistry is interesting for covalent or non-covalent functionalization
of therapeutic, targeting or labeling moieties (drugs, oligonucleotides, proteins, fluorescent
dyes) [5,6]. In this context, small interfering RNA (siRNA) is a powerful agent for gene
inhibition, but its activity is limited by a poor capacity to penetrate into cells and by the
degradation by nucleases. For this reason, several groups have developed vectors to deliver
efficiently oligo- nucleotides [7] and siRNA to cells [8]. In previous studies we showed that
synthetic NDs of primary core size around 35 nm, produced by high-pressure and high
temperature synthesis (HPHT), can deliver active siRNA to cells in culture resulting in
inhibiting the expression of Ewing sarcoma junction oncogene EWS/FLI-1 in Ewing human
cells [9,10]. These NDs were carboxyl- ated by strong acid cleaning resulting in a negative
surface charge at pH 7. They were then coated with cationic polymers (poly- ethylene-imine
[PEI] or polyallylamine hydrochloride [PAH]) so that negatively charged siRNA can bind to
them by electrostatic interaction. This strategy has revealed to be efficient with a low
toxicity for the transfected cell and a good gene inhibition. How- ever, it cannot be
translated to animals because of the vector size (further increased to about 120-130 nm
after polymer coating [9]) preventing its elimination in urine after intravenous injection [11].
Moreover, since the polymer is non-covalently bound to the ND vector, it may dissociate
from its surface after injection to the animals, taking the siRNA away with it, which results in
a loss of the expected gene inhibition.
In this study, we used intrinsically cationic nanodiamonds [12] of 7 nm primary core size,
which could be compatible with in vivo applications. Indeed, one can expect their
elimination by kidney [11]. These nanodiamonds produced by detonation of high energy
explosives (hexogen/RDX) [13] were exposed to a micro- wave hydrogen plasma leading to
an efficient cleaning of oxygen groups, a removal of non-diamond carbon and the formation
of C sp3-H terminations as previously reported [12,14,15]. After plasma exposure,
hydrogenated detonation ND (ND-H) were dispersed in water forming a stable suspension
with a positive zeta potential of 50 mV favorable to nucleic acids electrostatic binding. The
origin of the positive Zeta potential was recently explained by a surface transfer doping
mechanism [16]. In this work, we show that siRNA binds to ND-H, and we demonstrate that
the siRNA/ND-H complex can efficiently deliver siRNA promoting EWS/FLI-1 targeted gene
silencing into human Ewing sarcoma cells in culture. These results establish a first step
towards applications to small animals of ND vector that could be eliminated in urine owing
to its ultrasmall size.
2. Experimental section
2.1. Cationic ND-H and anionic ND-COOH preparation and characterization
Detonation nanodiamonds were provided by the NanoCarbon Institute Co., Ltd. (Japan).
Hydrogenation of nanodiamonds was achieved by microwave-enhanced plasma treatments.
A mass of 80e100 mg of NDs was deposited in a quartz tube and inserted in a plasma
Downstream source (Sairem SAS, France). High purity hydrogen gas (>N70) was injected in
the tube at a pressure of 15 mbar and plasma was generated in the quartz tube at a micro-
wave power of 300 W (2.45 GHz). During the plasma, the tube was air-cooled. NDs were
exposed to hydrogen plasma for 15 min and were cooled down under hydrogen, leading to
ND-H. More details were previously reported [12]. ND-H were then dispersed in ultrapure
water by sonication (UP400S, 300 W, 24 kHz, Hielscher Ultrasonics GmbH, Germany) for 2 h
under cooling. Larger aggregates were removed from the solution by centrifugation at 4000
rpm (30 min or 2 h depending on the sample). Oxidized NDs (ND-COOH) were obtained by
air annealing (400°C for 2 h) and dispersed in ultrapure water by the same sonication
procedure than ND-H. Size and Zeta potential measurements of ND-H and ND-COOH
suspensions were performed in ultrapure water on a Nanosizer ZS (Malvern, UK) in the back
scattering configuration (173°).
2.2. siRNA binding to ND-H
The binding capacity of cationic hydrogenated ND-H was studied by mixing 28 ng of siRNA
in 30 µL of 10 mM HEPES buffer at pH=7.2 and 100 mM NaCl, with increasing concentration
of ND-H ranging from 0 to 0.1 µg/µL. After 10 min incubation at room temperature, the
solution was centrifuged at speed 13000 rpm, for 10 min and at 15 °C. Then 30 µL of
supernatant was mixed with 30 µL of 1 µg/mL ethidium bromide (Sigma-Aldric, USA) and
fluorescence was recorded with a fluorescence plate reader with excitation wavelength of
525 nm, and detection range 580-640 nm (GloMax®-Multi, Promega). Experiments were
performed in triplicate. siRNA labeled with FITC dye (siRNA-FITC) was used to identify the
location of siRNA in cell by epifluorescence microscopy.
2.3. Cytotoxicity
A673 human Ewing sarcoma cell line was a generous gift from Dr. Elizabeth R. Lawlor
(University of Michigan, USA). Cells were grown in DMEM medium supplemented by 10% of
fetal bovine serum (Gibco) and 1% penicillin-streptomycin antibiotics (Gibco). One day
before treatment, 2 x 10³ cells by well were plated in 96 wells and incubated at 37°C, 5% CO2
in moistly atmosphere. The medium was then removed and replaced by 100 µL medium
containing increasing concentrations of either ND-H or ND-COOH from 0 to 0.3 mg/mL. Two
series were treated with ND mixed with 50 nM siRNA. Cells were incubated for 48 h and the
cell viability was then determined using a MTT assay. Briefly, 10 µL of 5 mg/mL MTT in PBS
buffer were added and cells were incubated for 2 h. Then, 100 µL of lysis buffer (10 mH HCl,
10% SDS) was added overnight and the produced formazan was quantified on cell
suspension by absorbance measurement at 570 nm wavelength using a micro plate reader
(EL 808, BioTek, USA). Experiments were performed in 8 replicates. Data were corrected
from the absorbance/scattering of free ND suspension. For such correction, a 96 wells plate
is seeded with just ND solution in increasing concentration and MTT treatment is performed
as for cell cytotoxicity test. Then optical density is measured with the microplate reader and
the value corresponding to each ND concentration is subtracted to the one measured for
cells treated with the same ND concentration. Results are expressed as % of untreated cells.
2.4. siRNA delivery to cells: epifluorescence microscopy observations.
A673 cells (2 x 10⁵ cells per well) were seeded 24 h before the addition of cationic ND in
12 wells plate with 18 mm diameter coverslips at the bottom, and containing 500 µl DMEM
medium (Gibco) with 10 % bovine calf serum (Gibco) and 1% Penicillin/streptomycin solution
(Gibco). The culture was done at 37 °C, 5% CO2 in moistly atmosphere. The medium was
then discarded and replaced by 500 µL of the same medium or serum free Opti-MEM
medium (Gibco) containing ND-H/siRNA-FITC fluorescent conjugate at mass ratio of 10, 25,
50 and 75 (ND/siRNA, µg/µg), at final siRNA concentration of 50 nM. The mass-ratio
corresponds to the mixed masses of NDs and siRNA. The ND-H/siRNA-FITC were incubated
with cells for 4 hours at 37 °C, 5% CO2 in moistly atmosphere. Then, the cells were washed
twice with 1 mL PBS and fixed with 4% formaldehyde in PBS for 20 min at room
temperature. The cells were washed with PBS and mounted on microscope slide with Dapi
Fluoromount G (Southern Biotech, USA). The internalization of ND-H/siRNA-FITC by the cells
was monitored with an epifluorescence microscope (Observer, Zeiss, Germany).
2.5. siRNA delivery to cells: confocal microscopy and fluorescence spectroscopy.
Confocal raster scans (Supporting Information Fig. S2) were done with a home-made
microscope described in Ref. [17], equipped with single photon counting module capable of
detecting single nitrogen color center. Neutraly charged nitrogen-vacancy color center
emission having a maximum around 615 nm wavelength, was detected in the microscope
red channel. The confocal microscope excitation source is a continuous wave (cw) solid-state
laser (561L-100-COL-PP, Oxxius SA, France) emitting at the wavelength 561 nm. The red
detection channel consists in a longpass detection/emission filter with a steep edge at
580 nm and an optical density larger than 6 at 561 nm (BLP01-561R-25, Semrock, USA). The
microscope green detection channel allowing to detect FITC dye fluorescence is composed of
a cw solid-state laser emitting at 488 nm wavelength (Sapphhire 488-50, Coherent Inc., USA),
and a detection/emission bandpass filter centered on 525 nm (ET525/50, Chroma Corp.,
USA). Both 561 nm and 488 nm beam were focused onto the sample via an immersion oil
x60, numerical aperture 1.40 microscope objective (CFI Plan Apochromat DM60x oil, Nikon,
Japan) after their combination and reflection onto a double-band dichroic filter (Di01-
R488/561, Semrock). The fluorescence spectrum displayed on Fig. S1f was acquired with an
imaging spectrograph (MicroHR MHRA-1X-AMS equipped with Symphony CCD-1024x256-
BIUV-STE Open electrode cooled CCD array detector, Horiba Jobin Yvon, France).
2.6. siRNA delivery to cells: TEM studies.
For TEM studies, the cells were seeded in 12 wells plates containing a coverslip at 8 x 10⁴
cells per wells 24 h before the addition of ND. Then the medium was discarded and replaced
by 500 µL of DMEM medium containing 10% bovine calf serum or free serum OptiMEM
medium containing 40 µg/mL of NDs-H. The cells were incubated for 3 h at 37 °C, 5% CO2 in
a moistly atmosphere. The medium was discarded and replaced by 1 mL of 2%
glutaraldehyde (EMS, Hatfield, PA, USA) in 0.1 M cacodylate buffer pH=7.4, for 1 h at room
temperature. Cells were post-fixed for 1 hour at room temperature with 1% osmium
tetroxide and 1.5% potassium ferrocyanide (Sigma-Aldrich,France) (EMS,Hatfield, PA, USA) in
cacodylate buffer. They were dehydrated by increasing concentrations of ethanol and finally
embedded in Epon812 epoxy resin (EMS, Hatfield, PA, USA). The polymerization was carried
out by heating the sample during 72 hours at 56°C. It was then sectioned with a microtome
(thickness 90 nm), and the sections were collected on collodion-carbon-coated copper grids.
Sections were contrasted using aqueous uranyl acetate 2% (w/v) (Merck, France) and lead
citrate solutions (Reynold’s stain). The samples were observed with Zeiss 902 TEM in the
filtered zero loss modes using a CCD array detector (Megaview III, Olympus, Japan) coupled
to the SIS software (Olympus).
2.7. Inhibition of EWS/FLI-1 gene expression
24 h before treatment, 5 x 10⁴ A673 cells are seeded per wells in 12 wells plate with 500
µL DMEM medium (Gibco) containing 10% bovine calf serum and 1% penicillin/streptomycin
(Gibco) and incubated at 37°C, 5% CO2 in moistly atmosphere. Then, medium was removed
and replaced by 450 µL of same medium and 50 µL of 10 mM Hepes pH 7.2, 100 mM NaCl
containing free siRNA or NDs-H bounded siRNA targeted toward EWS/FLI-1 or control
sequence to 50 nM final concentration. siRNA/ND mass ratio is 50 (w/w). Cells were
incubated for 24 hours and total RNA was extracted by Trizol (Invitrogen, USA) methods.
Briefly, the cell culture medium is discarded first. Cells are then washed with PBS and lysed
with 800 µL of Trizol solution. Finally, the cells are scrapped and 160 µL of
chloroform/isoamyl alcohol (49/1) are added. The solution is centrifuged at 13000 rpm for
15 min at 4°C. 300 µL of the supernatant containing the RNA were added to the same
volume of isopropanol and RNA precipitation was obtained after 15 min at room
temperature. The solutions are then centrifuged 13000 rpm for 15 min at 4°C and the pellet
is washed twice with 70% ethanol and dried. The total extracted RNA was dissolved in 10 µL
of water containing 0.5 U RNasin (Promega, USA) and the RNA concentration was
determined by spectrophotometry at 260 nm (Nanodrop, ThermoFisher, USA ). The reverse
transcription was performed on 1.5 µg of total RNA by adding 2 µl of random hexamers at a
concentration of 50 µg/mL (Promega), and heating at 65°C for 5 min. The RNA was then
incubated with 0.5 µL M-MLV reverse transcriptase 200 U/µL, 0.5 µL 20 mM DNTP, 0.5 µL
RNasin (40 U/µL) and 4 µL of 5x buffer (Promega) for 1 h at 42°C. PCR quantification was
carried out with qPCR SuperMix SYBR GreenER (Invitrogen, France). The EWS/FLI-1 gene was
amplified with the EWS- Forward Primer: 5’-AGC AGT TAC TCT CAG CAG AAC ACC-3’ and FLI-
1-reverse primer: 5’-CCA GGA TCT GAT ACG GAT CTG GCT G-3’ (Eurogentec, Belgium). We
mixed 1 µL of each primer, at a concentration of 10 µM, with 5 µL of cDNA diluted 1/20 (v/v)
in a final volume of 25 µL. The samples were amplified over 45 cycles, in a 7900 Fast Real-
Time PCR System (Applied Biosystems, USA), as follows: 2 minutes of incubation at 50°C, 10
min at 95°C, followed by 45 cycles of 95°C for 15 seconds, 60°C for 1 min. The human 18S
rRNA gene was used as a control and was amplified with the 18S Forward Primer 5’-CGT TCA
GCC ACC CGA GAT-3’, and 18S reverse primer 5’ TAA TGA TCC TTC CGC AGG TT-3’. The Ct
obtained was between 10 and 16 for 18S and between 20 and 24 for EWS/FLI-1.
Comparative Ct methods were used to normalize the target Ct by the 18S control gene Ct.
2.8. Effect of the association of ND-H vectorized siRNA and Vincristine on cell growth
One day before treatment, 2 x 10³ A673 cells in 100 µL were seeded per wells in 96 wells
plate in DMEM medium (Gibco) containing 10 % bovine calf serum and 1%
penicillin/streptomycin (Gibco) and incubated at 37°C, 5% CO2 in moistly atmosphere. Then,
the medium was removed and replaced by 100 µL of the same medium containing 0.3 ng/mL
of vincristin and ND-H vectorized siRNA antisens or control at 50 nM siRNA and ND-H at
molar ratio of 50 (siRNA/ND-H, W/W). The cells were incubated for 48 hours and their
viability was determined by a MTT assay as described above. The results are expressed as %
of untreated cells. Statistical tests were performed with Instat software (Graphpad software
Inc, USA) using the Friedman Test (Nonparametric Repeated Measures ANOVA).
3. Results and discussion
3.1. Binding of siRNA on ND-H
Hydrogenated detonation nanodiamonds (ND-H) exhibit a primary core size of ~7 nm
[12]. After their dispersion in water and a short centrifugation of 30 min, dynamic light
scattering (DLS) measurements report a hydrodynamic diameter of ~30 nm and
EZETA=+55 mV (see Supporting Information Fig. S1a). A longer centrifugation duration
(2 hours) lead to a suspension constituted of isolated particles, with a hydrodynamic
diameter reduced to 7 nm as shown on Fig. S1c. However, the concentration was drastically
reduced in that case. In this study, size ≈30 nm aggregates of 7 nm ND-H were thus used for
the proof of concept. Starting with this material, the capacity of ND-H to bind siRNA by
electrostatic interaction was measured after incubation of an increasing concentration of
ND-H at a fixed quantity of siRNA. After centrifugation, free siRNA in the supernatant was
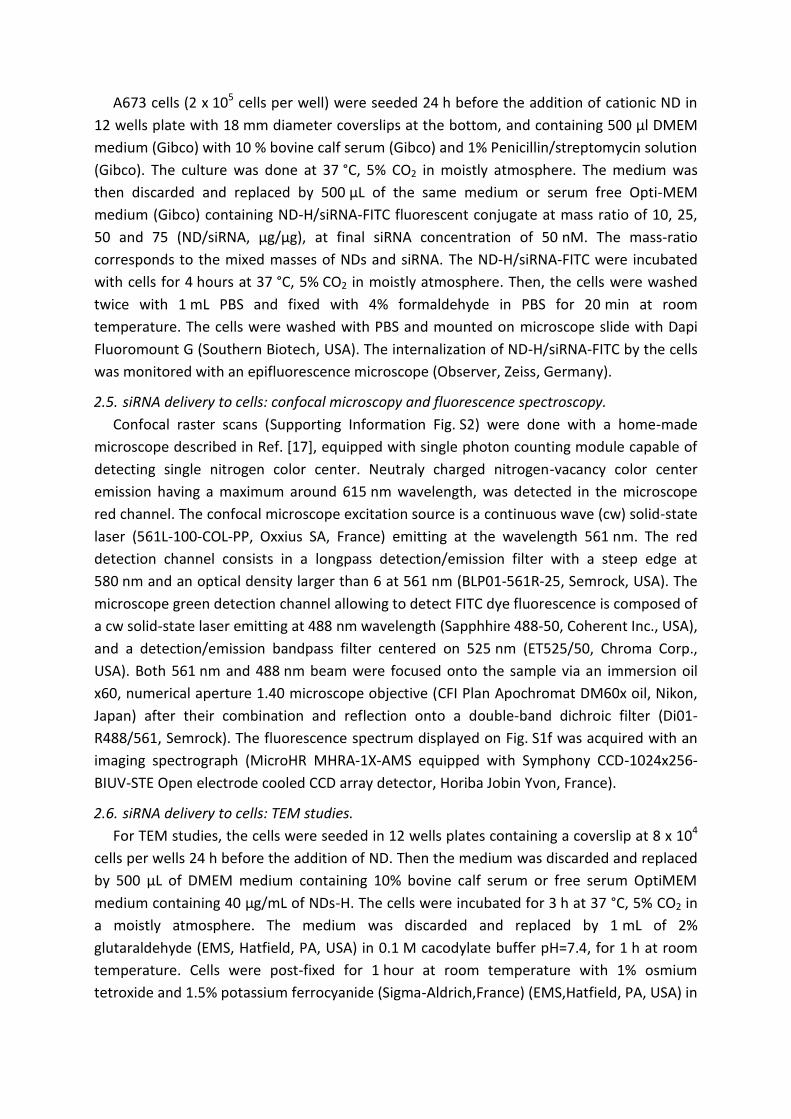
quantified thanks to ethydium bromide coloration (Fig. 1).
Fig. 1. siRNA binding to cationic ND-H (square) or to anionic ND-COOH (diamond). Free siRNAs are detected in the supernatant after centrifugation of the samples. Experiment performed in triplicate. In the case of ND-H (+) the remaining 20% free siRNA may be due to the oligonucleotide detachment during the ultracentrifugation separation step.
When the ND-H concentration was increased, the free siRNA decreased due to the
binding on ND-H. The minimum ND-H concentration capable to bind 80% of siRNA is
40 µg/mL for a siRNA concentration of 0.8 µg/mL corresponding to a mass ratio of 50
(ND/siRNA, w/w). As a comparison, using the same detonation NDs (size=7 nm) that were
carboxylated instead of hydrogenated in order to provide them a negative charge (EZETA=-
50 mV, see Fig. S1b), we did not observe siRNA/nanodiamond binding as expected from
electrostatic repulsion.
The observed binding capacity corresponds to 16 mg of siRNA (corresponding to
1.23 µmoles) for 1 g of ND-H. Surprisingly, it is similar to the one of polymeric-coated HPHT
ND exhibiting an overall diameter of 120 nm, for which 14 mg of siRNA can be bound to 1 g
of ND/Polyallylamine chloride [9]. To determine the optimal conditions cell delivery efficacy
two parameters needed to be studied: i) the toxicity of NDs and ii) the mass ratio between
siRNA and NDs.
3.2. Cytotoxicity assay
The toxicity of detonation anionic ND-COOH and cationic ND-H was determined after
48 hours treatment of A673 human Ewing sarcoma cell by a MTT proliferation test. Cationic
and anionic NDs were used with or without 50 nM siRNA (corresponding to a siRNA
concentration of 0.65 µg/mL) covering their surface. A toxicity (death of more than 50% of
the cells) was observed at ND concentrations larger than 50 µg/mL (Fig. 2). Cationic NDs are
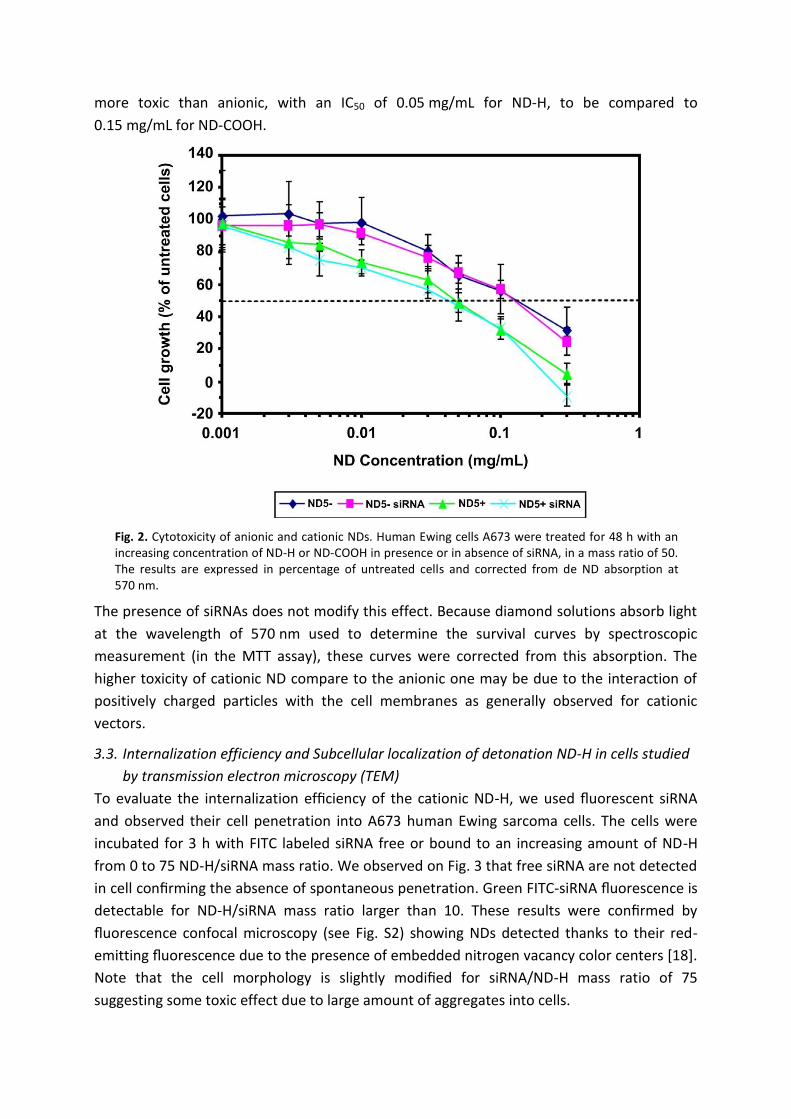
more toxic than anionic, with an IC50 of 0.05 mg/mL for ND-H, to be compared to
0.15 mg/mL for ND-COOH.
Fig. 2. Cytotoxicity of anionic and cationic NDs. Human Ewing cells A673 were treated for 48 h with an increasing concentration of ND-H or ND-COOH in presence or in absence of siRNA, in a mass ratio of 50. The results are expressed in percentage of untreated cells and corrected from de ND absorption at 570 nm.
The presence of siRNAs does not modify this effect. Because diamond solutions absorb light
at the wavelength of 570 nm used to determine the survival curves by spectroscopic
measurement (in the MTT assay), these curves were corrected from this absorption. The
higher toxicity of cationic ND compare to the anionic one may be due to the interaction of
positively charged particles with the cell membranes as generally observed for cationic
vectors.
3.3. Internalization efficiency and Subcellular localization of detonation ND-H in cells studied
by transmission electron microscopy (TEM)
To evaluate the internalization efficiency of the cationic ND-H, we used fluorescent siRNA
and observed their cell penetration into A673 human Ewing sarcoma cells. The cells were
incubated for 3 h with FITC labeled siRNA free or bound to an increasing amount of ND-H
from 0 to 75 ND-H/siRNA mass ratio. We observed on Fig. 3 that free siRNA are not detected
in cell confirming the absence of spontaneous penetration. Green FITC-siRNA fluorescence is
detectable for ND-H/siRNA mass ratio larger than 10. These results were confirmed by
fluorescence confocal microscopy (see Fig. S2) showing NDs detected thanks to their red-
emitting fluorescence due to the presence of embedded nitrogen vacancy color centers [18].
Note that the cell morphology is slightly modified for siRNA/ND-H mass ratio of 75
suggesting some toxic effect due to large amount of aggregates into cells.
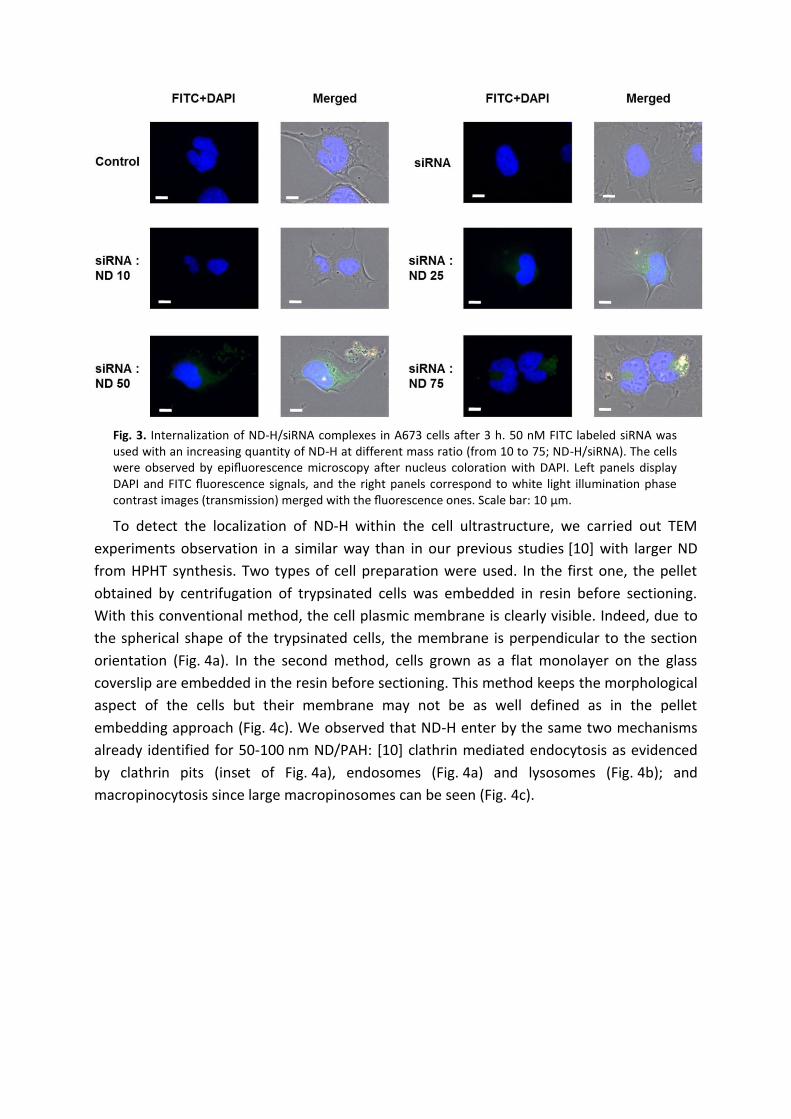
Fig. 3. Internalization of ND-H/siRNA complexes in A673 cells after 3 h. 50 nM FITC labeled siRNA was used with an increasing quantity of ND-H at different mass ratio (from 10 to 75; ND-H/siRNA). The cells were observed by epifluorescence microscopy after nucleus coloration with DAPI. Left panels display DAPI and FITC fluorescence signals, and the right panels correspond to white light illumination phase contrast images (transmission) merged with the fluorescence ones. Scale bar: 10 µm.
To detect the localization of ND-H within the cell ultrastructure, we carried out TEM
experiments observation in a similar way than in our previous studies [10] with larger ND
from HPHT synthesis. Two types of cell preparation were used. In the first one, the pellet
obtained by centrifugation of trypsinated cells was embedded in resin before sectioning.
With this conventional method, the cell plasmic membrane is clearly visible. Indeed, due to
the spherical shape of the trypsinated cells, the membrane is perpendicular to the section
orientation (Fig. 4a). In the second method, cells grown as a flat monolayer on the glass
coverslip are embedded in the resin before sectioning. This method keeps the morphological
aspect of the cells but their membrane may not be as well defined as in the pellet
embedding approach (Fig. 4c). We observed that ND-H enter by the same two mechanisms
already identified for 50-100 nm ND/PAH: [10] clathrin mediated endocytosis as evidenced
by clathrin pits (inset of Fig. 4a), endosomes (Fig. 4a) and lysosomes (Fig. 4b); and
macropinocytosis since large macropinosomes can be seen (Fig. 4c).
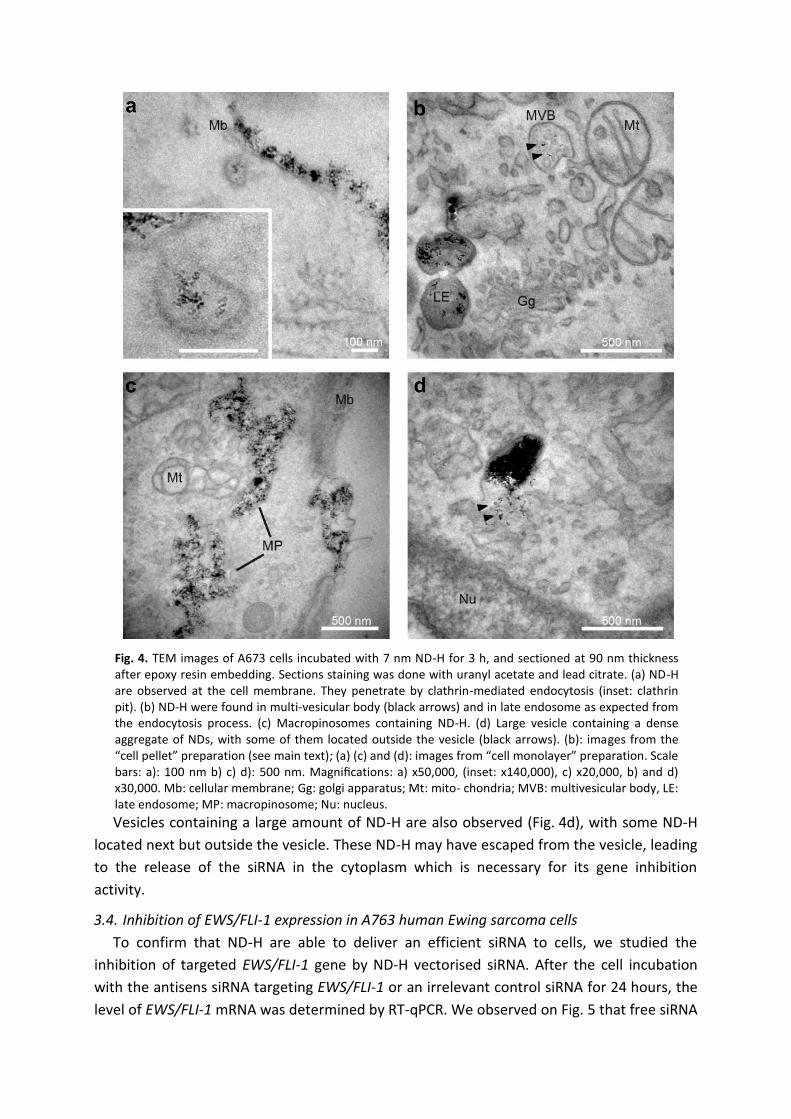
Fig. 4. TEM images of A673 cells incubated with 7 nm ND-H for 3 h, and sectioned at 90 nm thickness after epoxy resin embedding. Sections staining was done with uranyl acetate and lead citrate. (a) ND-H are observed at the cell membrane. They penetrate by clathrin-mediated endocytosis (inset: clathrin pit). (b) ND-H were found in multi-vesicular body (black arrows) and in late endosome as expected from the endocytosis process. (c) Macropinosomes containing ND-H. (d) Large vesicle containing a dense aggregate of NDs, with some of them located outside the vesicle (black arrows). (b): images from the “cell pellet” preparation (see main text); (a) (c) and (d): images from “cell monolayer” preparation. Scale bars: a): 100 nm b) c) d): 500 nm. Magnifications: a) x50,000, (inset: x140,000), c) x20,000, b) and d) x30,000. Mb: cellular membrane; Gg: golgi apparatus; Mt: mito- chondria; MVB: multivesicular body, LE: late endosome; MP: macropinosome; Nu: nucleus.
Vesicles containing a large amount of ND-H are also observed (Fig. 4d), with some ND-H
located next but outside the vesicle. These ND-H may have escaped from the vesicle, leading
to the release of the siRNA in the cytoplasm which is necessary for its gene inhibition
activity.
3.4. Inhibition of EWS/FLI-1 expression in A763 human Ewing sarcoma cells
To confirm that ND-H are able to deliver an efficient siRNA to cells, we studied the
inhibition of targeted EWS/FLI-1 gene by ND-H vectorised siRNA. After the cell incubation
with the antisens siRNA targeting EWS/FLI-1 or an irrelevant control siRNA for 24 hours, the
level of EWS/FLI-1 mRNA was determined by RT-qPCR. We observed on Fig. 5 that free siRNA
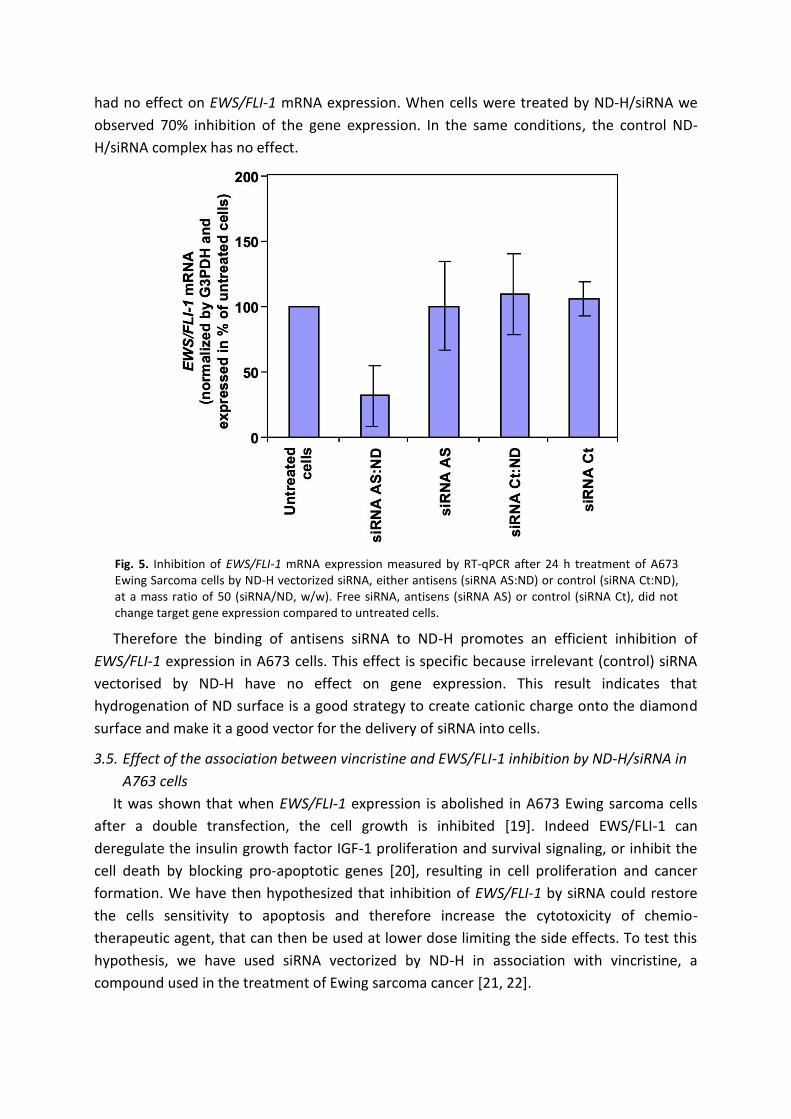
had no effect on EWS/FLI-1 mRNA expression. When cells were treated by ND-H/siRNA we
observed 70% inhibition of the gene expression. In the same conditions, the control ND-
H/siRNA complex has no effect.
Fig. 5. Inhibition of EWS/FLI-1 mRNA expression measured by RT-qPCR after 24 h treatment of A673 Ewing Sarcoma cells by ND-H vectorized siRNA, either antisens (siRNA AS:ND) or control (siRNA Ct:ND), at a mass ratio of 50 (siRNA/ND, w/w). Free siRNA, antisens (siRNA AS) or control (siRNA Ct), did not change target gene expression compared to untreated cells.
Therefore the binding of antisens siRNA to ND-H promotes an efficient inhibition of
EWS/FLI-1 expression in A673 cells. This effect is specific because irrelevant (control) siRNA
vectorised by ND-H have no effect on gene expression. This result indicates that
hydrogenation of ND surface is a good strategy to create cationic charge onto the diamond
surface and make it a good vector for the delivery of siRNA into cells.
3.5. Effect of the association between vincristine and EWS/FLI-1 inhibition by ND-H/siRNA in
A763 cells
It was shown that when EWS/FLI-1 expression is abolished in A673 Ewing sarcoma cells
after a double transfection, the cell growth is inhibited [19]. Indeed EWS/FLI-1 can
deregulate the insulin growth factor IGF-1 proliferation and survival signaling, or inhibit the
cell death by blocking pro-apoptotic genes [20], resulting in cell proliferation and cancer
formation. We have then hypothesized that inhibition of EWS/FLI-1 by siRNA could restore
the cells sensitivity to apoptosis and therefore increase the cytotoxicity of chemio-
therapeutic agent, that can then be used at lower dose limiting the side effects. To test this
hypothesis, we have used siRNA vectorized by ND-H in association with vincristine, a
compound used in the treatment of Ewing sarcoma cancer [21, 22].
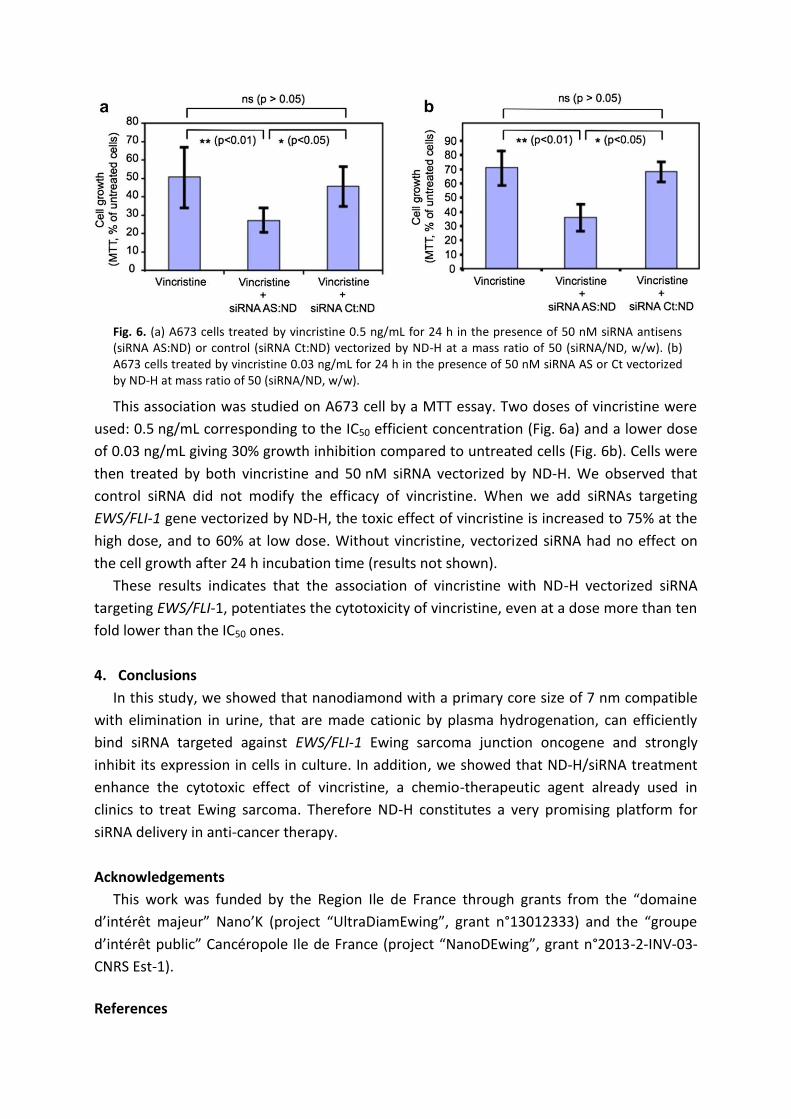
Fig. 6. (a) A673 cells treated by vincristine 0.5 ng/mL for 24 h in the presence of 50 nM siRNA antisens (siRNA AS:ND) or control (siRNA Ct:ND) vectorized by ND-H at a mass ratio of 50 (siRNA/ND, w/w). (b) A673 cells treated by vincristine 0.03 ng/mL for 24 h in the presence of 50 nM siRNA AS or Ct vectorized by ND-H at mass ratio of 50 (siRNA/ND, w/w).
This association was studied on A673 cell by a MTT essay. Two doses of vincristine were
used: 0.5 ng/mL corresponding to the IC50 efficient concentration (Fig. 6a) and a lower dose
of 0.03 ng/mL giving 30% growth inhibition compared to untreated cells (Fig. 6b). Cells were
then treated by both vincristine and 50 nM siRNA vectorized by ND-H. We observed that
control siRNA did not modify the efficacy of vincristine. When we add siRNAs targeting
EWS/FLI-1 gene vectorized by ND-H, the toxic effect of vincristine is increased to 75% at the
high dose, and to 60% at low dose. Without vincristine, vectorized siRNA had no effect on
the cell growth after 24 h incubation time (results not shown).
These results indicates that the association of vincristine with ND-H vectorized siRNA
targeting EWS/FLI-1, potentiates the cytotoxicity of vincristine, even at a dose more than ten
fold lower than the IC50 ones.
4. Conclusions
In this study, we showed that nanodiamond with a primary core size of 7 nm compatible
with elimination in urine, that are made cationic by plasma hydrogenation, can efficiently
bind siRNA targeted against EWS/FLI-1 Ewing sarcoma junction oncogene and strongly
inhibit its expression in cells in culture. In addition, we showed that ND-H/siRNA treatment
enhance the cytotoxic effect of vincristine, a chemio-therapeutic agent already used in
clinics to treat Ewing sarcoma. Therefore ND-H constitutes a very promising platform for
siRNA delivery in anti-cancer therapy.
Acknowledgements
This work was funded by the Region Ile de France through grants from the “domaine
d’intérêt majeur” Nano’K (project “UltraDiamEwing”, grant n°13012333) and the “groupe
d’intérêt public” Cancéropole Ile de France (project “NanoDEwing”, grant n°2013-2-INV-03-
CNRS Est-1).
References
[1] Slegerova J, Rehor I, Havlik J, Raabova H, Muchova E, Cigler P. Intracellular delivery II, vol. 7. Netherlands, Dordrecht: Springer; 2014. p. 363e401.
[2] Perevedentseva E, Lin Y-C, Jani M, Cheng C-L. Biomedical applications of nanodiamonds in imaging and therapy. Nanomedicine 2013;8:2041e60.
[3] Paget V, Sergent JA, Grall R, Altmeyer-Morel S, Girard HA, Petit T, et al. Carboxylated nanodiamonds are neither cytotoxic nor genotoxic on liver, kidney, intestine and lung human cell lines. Nanotoxicology 2014;8:46e56.
[4] Vaijayanthimala V, Cheng P, Yeh S-H, Liu K-K, Hsiao C, Chao J, et al. The long- term stability and biocompatibility of fluorescent nanodiamond as an in vivo contrast agent. Biomaterials 2012;33:7794e802.
[5] Krueger A, Lang D. Functionality is key: recent progress in the surface modification of nanodiamond. Adv Funct Mater 2012;22:890e906.
[6] Smith AH, Robinson EM, Zhang X-Q, Chow EK, Lin Y, Osawa E, et al. Triggered release of therapeutic antibodies from nanodiamond complexes. Nanoscale 2011;3:2844e8.
[7] Zhang X-Q, Chen M, Lam R, Xu X, Osawa E, Ho D. Polymer-functionalized nanodiamond platforms as vehicles for gene delivery. ACS Nano 2009;3: 2609e16.
[8] Chen M, Zhang X-Q, Man HB, Lam R, Chow EK, Ho D. Nanodiamond vectors functionalized with polyethylenimine for siRNA delivery. J Phys Chem Lett 2010;1:3167e71.
[9] Alhaddad A, Adam M-P, Botsoa J, Dantelle G, Perruchas S, Gacoin T, et al. Nanodiamond as a vector for siRNA delivery to Ewing sarcoma cells. Small 2011;7:3087e95.
[10] Alhaddad A, Durieu C, Dantelle G, Le Cam E, Malvy C, Treussart F, et al. In- fluence of the internalization pathway on the efficacy of siRNA delivery by cationic fluorescent nanodiamonds in the Ewing sarcoma cell model. PLoS One 2012;7:e52207.
[11] Soo Choi H, Liu W, Misra P, Tanaka E, Zimmer JP, Itty Ipe B, et al. Renal clearance of quantum dots. Nat Biotechnol 2007;25:1165e70.
[12] Girard HA, Arnault JC, Perruchas S, Saada S, Gacoin T, Boilot J-P, et al. Hydrogenation of nanodiamonds using MPCVD: a new route toward organic functionalization. Diam Relat Mater 2010;19:1117e23.
[13] Mochalin VN, Shenderova O, Ho D, Gogotsi Y. The properties and applications of nanodiamonds. Nat Nanotechnol 2011;7:1e13.
[14] Arnault J-C, Petit T, Girard HA, Chavanne A, Gesset CC, Sennour M, et al. Surface chemical modifications and surface reactivity of nanodiamonds hydrogenated by CVD plasma. Phys Chem Chem Phys 2011;13:11481e7.
[15] Girard HA, Gacoin T, Petit T, Perruchas S, Gesset C, Arnault JC, et al. Surface properties of hydrogenated nanodiamonds: a chemical investigation. Phys Chem Chem Phys 2011;13:11517e23.
[16] Petit T, Girard HA, Trouvé A, Batonneau-Gener I, Bergonzo P, Arnault J-C. Surface transfer doping can mediate both colloidal stability and self-assembly of nanodiamonds. Nanoscale 2013;5:8958e62.
[17] Faklaris O, Garrot D, Joshi V, Druon F, Boudou J, Sauvage T, et al. Detection of single photoluminescent diamond nanoparticles in cells and study of the internalization pathway. Small 2008;4:2236e9.
[18] Chang Y-R, Lee H-Y, Chen K, Chang C-C, Tsai D-S, Fu C-C, et al. Mass production and dynamic imaging of fluorescent nanodiamonds. Nat Nanotechnol 2008;3:284e8.
[19] Prieur A, Tirode F, Cohen P, Delattre O. EWS/FLI-1 silencing and gene profiling of Ewing cells reveal downstream oncogenic pathways and a crucial role for repression of insulin-like growth factor binding protein 3. Mol Cell Biol 2004;24:7275e83.
[20] Kontny U. Regulation of apoptosis and proliferation in Ewing's sarcoma: opportunities for targeted therapy. Hematol Oncol 2006;24:14e21.
[21] Martins AS, Mackintosh C, Martín DH, Campos M, Hernandez T, Ordoñez J-L, et al. Insulin-like growth factor I receptor pathway inhibition by ADW742, alone or in combination with imatinib, doxorubicin, or vincristine, is a novel therapeutic approach in Ewing tumor. Clin Cancer Res 2006;12: 3532e40.
[22] Raciborska A, Bilska K, Drabko K, Chaber R, Pogorzala M, Polczyn K. Vincristine, irinotecan, and temozolomide in patients with relapsed and refractory Ewing sarcoma. Pediatr Blood Cancer 2013:1621e5.
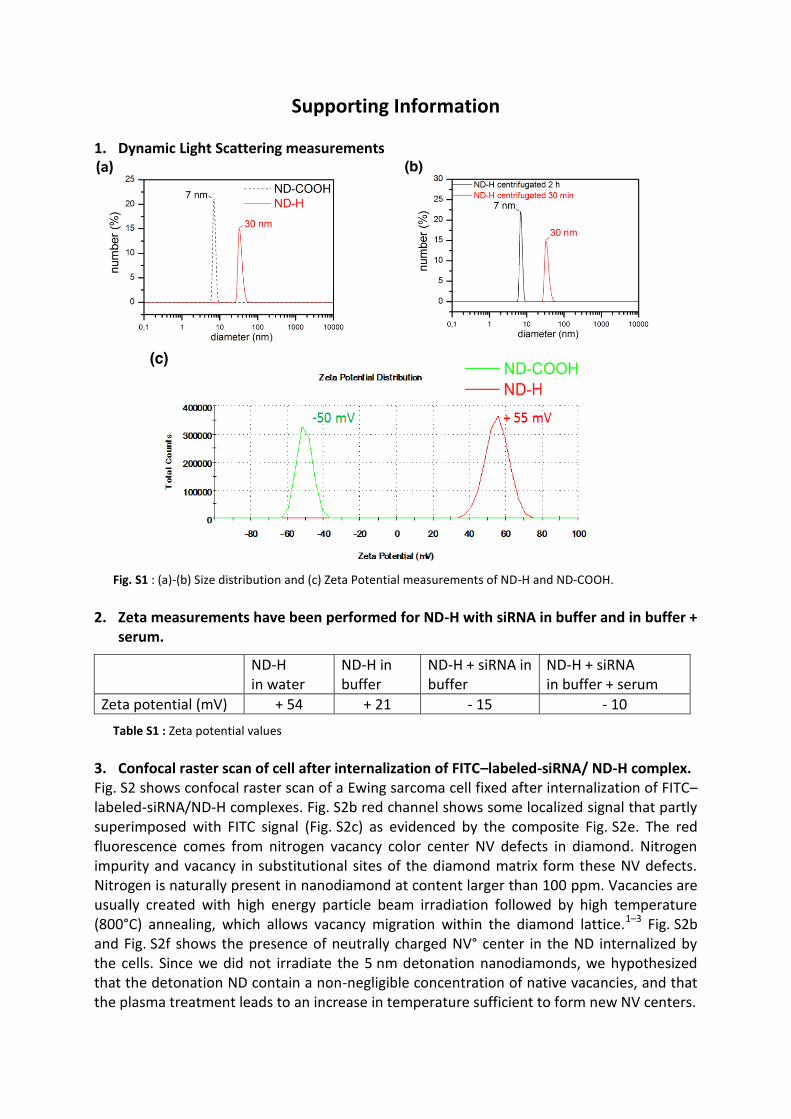
Supporting Information 1. Dynamic Light Scattering measurements
Fig. S1 : (a)-(b) Size distribution and (c) Zeta Potential measurements of ND-H and ND-COOH.
2. Zeta measurements have been performed for ND-H with siRNA in buffer and in buffer +
serum.
ND-H in water
ND-H in buffer
ND-H + siRNA in buffer
ND-H + siRNA in buffer + serum
Zeta potential (mV) + 54 + 21 - 15 - 10
Table S1 : Zeta potential values
3. Confocal raster scan of cell after internalization of FITC–labeled-siRNA/ ND-H complex. Fig. S2 shows confocal raster scan of a Ewing sarcoma cell fixed after internalization of FITC–labeled-siRNA/ND-H complexes. Fig. S2b red channel shows some localized signal that partly superimposed with FITC signal (Fig. S2c) as evidenced by the composite Fig. S2e. The red fluorescence comes from nitrogen vacancy color center NV defects in diamond. Nitrogen impurity and vacancy in substitutional sites of the diamond matrix form these NV defects. Nitrogen is naturally present in nanodiamond at content larger than 100 ppm. Vacancies are usually created with high energy particle beam irradiation followed by high temperature (800°C) annealing, which allows vacancy migration within the diamond lattice.1–3 Fig. S2b and Fig. S2f shows the presence of neutrally charged NV° center in the ND internalized by the cells. Since we did not irradiate the 5 nm detonation nanodiamonds, we hypothesized that the detonation ND contain a non-negligible concentration of native vacancies, and that the plasma treatment leads to an increase in temperature sufficient to form new NV centers.
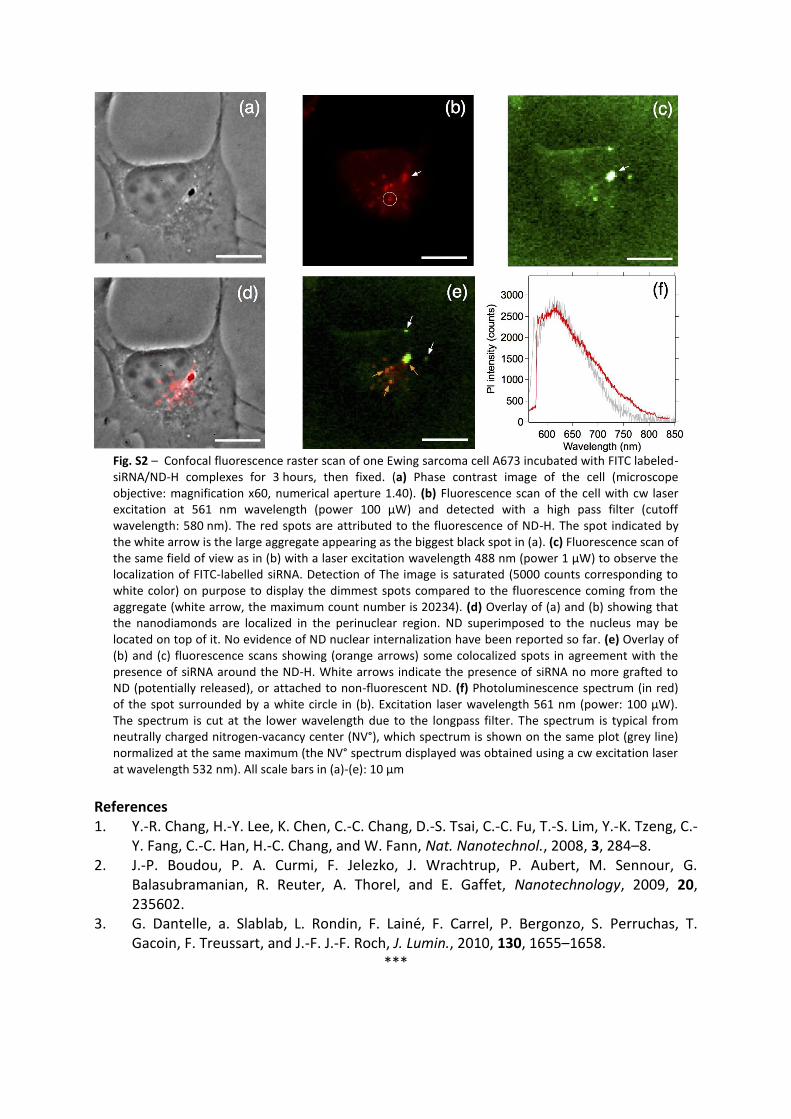
Fig. S2 – Confocal fluorescence raster scan of one Ewing sarcoma cell A673 incubated with FITC labeled-siRNA/ND-H complexes for 3 hours, then fixed. (a) Phase contrast image of the cell (microscope objective: magnification x60, numerical aperture 1.40). (b) Fluorescence scan of the cell with cw laser excitation at 561 nm wavelength (power 100 µW) and detected with a high pass filter (cutoff wavelength: 580 nm). The red spots are attributed to the fluorescence of ND-H. The spot indicated by the white arrow is the large aggregate appearing as the biggest black spot in (a). (c) Fluorescence scan of the same field of view as in (b) with a laser excitation wavelength 488 nm (power 1 µW) to observe the localization of FITC-labelled siRNA. Detection of The image is saturated (5000 counts corresponding to white color) on purpose to display the dimmest spots compared to the fluorescence coming from the aggregate (white arrow, the maximum count number is 20234). (d) Overlay of (a) and (b) showing that the nanodiamonds are localized in the perinuclear region. ND superimposed to the nucleus may be located on top of it. No evidence of ND nuclear internalization have been reported so far. (e) Overlay of (b) and (c) fluorescence scans showing (orange arrows) some colocalized spots in agreement with the presence of siRNA around the ND-H. White arrows indicate the presence of siRNA no more grafted to ND (potentially released), or attached to non-fluorescent ND. (f) Photoluminescence spectrum (in red) of the spot surrounded by a white circle in (b). Excitation laser wavelength 561 nm (power: 100 µW). The spectrum is cut at the lower wavelength due to the longpass filter. The spectrum is typical from neutrally charged nitrogen-vacancy center (NV°), which spectrum is shown on the same plot (grey line) normalized at the same maximum (the NV° spectrum displayed was obtained using a cw excitation laser at wavelength 532 nm). All scale bars in (a)-(e): 10 µm
References 1. Y.-R. Chang, H.-Y. Lee, K. Chen, C.-C. Chang, D.-S. Tsai, C.-C. Fu, T.-S. Lim, Y.-K. Tzeng, C.-
Y. Fang, C.-C. Han, H.-C. Chang, and W. Fann, Nat. Nanotechnol., 2008, 3, 284–8. 2. J.-P. Boudou, P. A. Curmi, F. Jelezko, J. Wrachtrup, P. Aubert, M. Sennour, G.
Balasubramanian, R. Reuter, A. Thorel, and E. Gaffet, Nanotechnology, 2009, 20, 235602.
3. G. Dantelle, a. Slablab, L. Rondin, F. Lainé, F. Carrel, P. Bergonzo, S. Perruchas, T. Gacoin, F. Treussart, and J.-F. J.-F. Roch, J. Lumin., 2010, 130, 1655–1658.
***
Related Documents


