eScholarship provides open access, scholarly publishing services to the University of California and delivers a dynamic research platform to scholars worldwide. University of California Peer Reviewed Title: Plant-soil biodiversity relationships and nutrient retention in agricultural riparian zones of the Sacramento Valley, California Author: Young-Mathews, Anna ; Culman, Steven W. ; Sánchez-Moreno, Sara ; Toby O’Geen, A. ; Ferris, Howard ; Hollander, Allan D. ; et al. Publication Date: 2010 Publication Info: Postprints, Multi-Campus Permalink: http://escholarship.org/uc/item/2t39m335 DOI: 10.1007/s10457-010-9332-9 Abstract: Forested riparian buffers in California historically supported high levels of biodiversity, but human activities have degraded these ecosystems over much of their former range. This study examined plant communities, belowground biodiversity and indicators of multiple ecosystem functions of riparian areas across an agricultural landscape in the Sacramento Valley of California, USA. Plant, nematode and soil microbial communities and soil physical and chemical properties were studied along 50-m transects at 20 sites that represented the different land use, soil and vegetation types in the landscape. Riparian zones supported greater plant diversity and nearly twice as much total carbon (C) per hectare compared to adjacent land managed for agricultural uses, but had generally lower soil microbial and nematode diversity and abundance. When woody plant communities were present in the riparian zone, plant diversity and species richness were higher, and soil nitrate and plant-available phosphorus levels were lower. Belowground diversity and community structure, however, appeared to depend more on plant productivity (as inferred by vegetation cover) than plant diversity or species richness. Greater plant species richness, nematode food web structure, total microbial biomass, woody C storage and lower soil nitrate and phosphorus loading were correlated with higher visual riparian health assessment scores, offering the possibility of managing these riparian habitats to provide multiple ecosystem functions.

Welcome message from author
This document is posted to help you gain knowledge. Please leave a comment to let me know what you think about it! Share it to your friends and learn new things together.
Transcript
eScholarship provides open access, scholarly publishingservices to the University of California and delivers a dynamicresearch platform to scholars worldwide.
University of California
Peer Reviewed
Title:Plant-soil biodiversity relationships and nutrient retention in agricultural riparian zones of theSacramento Valley, California
Author:Young-Mathews, Anna; Culman, Steven W.; Sánchez-Moreno, Sara; Toby O’Geen, A.; Ferris,Howard; Hollander, Allan D.; et al.
Publication Date:2010
Publication Info:Postprints, Multi-Campus
Permalink:http://escholarship.org/uc/item/2t39m335
DOI:10.1007/s10457-010-9332-9
Abstract:Forested riparian buffers in California historically supported high levels of biodiversity, but humanactivities have degraded these ecosystems over much of their former range. This study examinedplant communities, belowground biodiversity and indicators of multiple ecosystem functions ofriparian areas across an agricultural landscape in the Sacramento Valley of California, USA. Plant,nematode and soil microbial communities and soil physical and chemical properties were studiedalong 50-m transects at 20 sites that represented the different land use, soil and vegetation typesin the landscape. Riparian zones supported greater plant diversity and nearly twice as much totalcarbon (C) per hectare compared to adjacent land managed for agricultural uses, but had generallylower soil microbial and nematode diversity and abundance. When woody plant communitieswere present in the riparian zone, plant diversity and species richness were higher, and soilnitrate and plant-available phosphorus levels were lower. Belowground diversity and communitystructure, however, appeared to depend more on plant productivity (as inferred by vegetationcover) than plant diversity or species richness. Greater plant species richness, nematode food webstructure, total microbial biomass, woody C storage and lower soil nitrate and phosphorus loadingwere correlated with higher visual riparian health assessment scores, offering the possibility ofmanaging these riparian habitats to provide multiple ecosystem functions.

Plant-soil biodiversity relationships and nutrient retentionin agricultural riparian zones of the Sacramento Valley,California
Anna Young-Mathews • Steven W. Culman •
Sara Sanchez-Moreno • A. Toby O’Geen •
Howard Ferris • Allan D. Hollander • Louise E. Jackson
Received: 11 July 2009 / Accepted: 23 June 2010 / Published online: 15 July 2010
� The Author(s) 2010. This article is published with open access at Springerlink.com
Abstract Forested riparian buffers in California
historically supported high levels of biodiversity, but
human activities have degraded these ecosystems over
much of their former range. This study examined plant
communities, belowground biodiversity and indicators
of multiple ecosystem functions of riparian areas
across an agricultural landscape in the Sacramento
Valley of California, USA. Plant, nematode and soil
microbial communities and soil physical and chemical
properties were studied along 50-m transects at 20 sites
that represented the different land use, soil and
vegetation types in the landscape. Riparian zones
supported greater plant diversity and nearly twice as
much total carbon (C) per hectare compared to adjacent
land managed for agricultural uses, but had generally
lower soil microbial and nematode diversity and
abundance. When woody plant communities were
present in the riparian zone, plant diversity and species
richness were higher, and soil nitrate and plant-available
phosphorus levels were lower. Belowground diversity
and community structure, however, appeared to depend
more on plant productivity (as inferred by vegetation
cover) than plant diversity or species richness. Greater
plant species richness, nematode food web structure,
total microbial biomass, woody C storage and lower soil
nitrate and phosphorus loading were correlated with
higher visual riparian health assessment scores, offering
the possibility of managing these riparian habitats to
provide multiple ecosystem functions.
Keywords Aboveground-belowground
relationships � Carbon storage � Ecosystem function �Nematodes � PLFA
Introduction
Riparian corridors are well recognized as havens of
biodiversity, but over 80% of the original riparian area
has been lost from North America and Europe over the
past 200 years (Naiman et al. 1993). Human activities,
especially conversion of land to agricultural uses, have
resulted in a loss of habitat and related biodiversity and
ecosystem services (Balvanera et al. 2006; Millennium
Ecosystem Assessment 2005). ‘‘Working landscapes’’
A. Young-Mathews (&) � S. W. Culman �A. Toby O’Geen � L. E. Jackson
Department of Land, Air and Water Resources,
University of California, One Shields Avenue,
Davis, CA 95616, USA
e-mail: [email protected]
A. D. Hollander
Information Center for the Environment, University
of California, Davis, CA 95616, USA
H. Ferris
Department of Nematology, University of California,
Davis, CA 95616, USA
S. Sanchez-Moreno
Unidad de Productos Fitosanitarios, Instituto Nacional de
Investigacion y Tecnologıa Agraria y Alimentaria,
Crta. Coruna km 7.5, Madrid 28040, Spain
123
Agroforest Syst (2010) 80:41–60
DOI 10.1007/s10457-010-9332-9

that include agriculture as well as riparian and other
natural ecosystems may protect biodiversity and
ecosystem functions while maintaining agricultural
productivity (Jordan et al. 2007).
In a heterogeneous agricultural landscape, manage-
ment of riparian buffer zones changes soil properties,
plant and soil biodiversity, nutrient cycling, and
erosion potential (Lovell and Sullivan 2006; Neher
et al. 2005). Vegetated riparian buffers filter agricul-
tural nutrients and pollutants, reduce erosion, improve
water quality and provide reservoirs for biodiversity
(Lovell and Sullivan 2006; Peterjohn and Correll 1984;
Richardson et al. 2007). Multi-species riparian buffers
that include herbaceous as well as woody species may
result in higher total productivity, soil carbon (C)
sequestration, and nitrogen (N) immobilization than
monoculture plantings (Hill 1996; Marquez et al. 1999;
Rowe et al. 2005; Tufekcioglu et al. 1998).
Soil microbial and nematode communities are
important for ecosystem functions such as nutrient
cycling and the stabilization of soil C from plant and
microbial residues (Anderson 2000; Six et al. 2006),
and soil biodiversity is thought to be essential for
the maintenance of sustainable agricultural systems
(Brussaard et al. 2007). Plant diversity and soil
ecology are linked; greater diversity of plant species
is often associated with greater plant productivity and
soil microbial activity in field studies (Liu et al. 2008;
Wardle et al. 2006; Zak et al. 2003). However, such
studies have often been conducted at the field plot
scale (Bardgett 2005; Ferris and Matute 2003;
Porazinska et al. 2003), and thus have yielded little
information on how these ecological phenomena
extrapolate to the larger landscape scale where the
collective effects of management decisions become
evident (Swift et al. 2004; Tscharntke et al. 2005).
This study examined the relationship between
above- and belowground biodiversity and ecosystem
function of riparian areas in a heterogeneous agricul-
tural landscape with different land use and soil types,
located in the Sacramento Valley of California, USA.
Land use varies in the degree of agricultural inten-
sification, from non-irrigated rangelands to intensive,
irrigated croplands, and management of canal and
stream edges is largely under the control of individual
landowners. Restoration of farm edges and riparian
zones with native perennial plants has been a priority
of some local stakeholders (Brodt et al. 2009; Robins
et al. 2001).
Species-rich riparian forests once covered several
million hectares (ha) in California’s Sacramento
Valley before clearing and draining by European
settlers (Barbour et al. 1993; Roberts et al. 1980). Such
forests are now restricted to narrow bands, typically
2–15 m wide, along streams and rivers, or have been
eliminated. The following hypotheses were developed
to compare ecosystem services of riparian areas with
associated uplands over a gradient of land use intensity
and physiographic conditions: (i) riparian areas sup-
port greater levels of plant and soil biodiversity, greater
C stock per unit area and lower soil nutrient pools than
adjacent agricultural land (crop fields or grazed
grasslands); (ii) land use type affects these differences
in biodiversity and nutrient pools; (iii) the presence of
woody vegetation in the riparian zone increases the
diversity and structure of above- and belowground
communities and soil properties; and (iv) riparian zone
health rating serves as an indicator of above- and
belowground diversity and ecosystem functions.
Materials and methods
Site description
The study area is a 150-km2 region of western Yolo
County in the Sacramento Valley (northern Central
Valley) of California, USA (38�N, 122�W) that ranges
from 27 to 105 m in elevation. The area consists of
upland annual grasslands and oak savanna in the Coast
Ranges to the west (used for cattle grazing and dry farm
grain rotations) and flat, lowland alluvial fans and plains
to the east (used for intensive irrigated cropland,
including walnut orchards and rotations of both con-
ventional and organic corn, processing tomatoes, wheat,
oats and barley). Average monthly temperatures range
from about 6–29�C, and annual precipitation is 47 cm
for this dry, Mediterranean climate, with rainfall mostly
between November and April (WRCC 2009). Soils
include the following great groups: Haploxeralfs,
Haploxererts, Palexeralfs, Haploxerepts, and Xerorth-
ents (Soil Survey Staff 2009). There are 212.9 km of
waterways in the study area, which include both natural
streams and constructed irrigation canals.
Twenty sites were sampled across the landscape, and
were chosen to represent the range of soil and vegetation
types found in the study area (see Culman et al. in press,
Landscape Ecol, for details on site selection). Briefly,
42 Agroforest Syst (2010) 80:41–60
123

2,049 points across the landscape were randomly
selected within 50 m of a waterway. Then 14 spatial
datasets on soil characteristics, land use, vegetation and
topography were compiled in a Geographic Information
System (GIS). Multivariate cluster analysis was used to
classify the points into five clusters, from which 20 sites
were chosen to represent the variation within each
cluster, thus providing a systematic sampling regime for
the entire landscape.
At each site, a 50-m transect was established
perpendicular to the waterway, running from the
channel edge into the adjacent field. Sampling plots
were established at three positions along this transect
at a distance of approximately 0.5, 9 and 50 m from
the bankfull channel edge (Fig. 1). These positions
are referred to as A (agricultural field, which is either
cropland or grazed grassland), B (floodplain bench
above the waterway), and C (channel edge). Position
B was located on the edge of the floodplain bench, or
in the case of irrigation canals, where permanent
vegetation could potentially be established, and
ranged from 4 to 24 m from the channel edge.
Characterization of vegetation communities,
riparian health and woody carbon storage
Vegetation and riparian characterization were con-
ducted at each site from May to June of 2007. For
community-level vegetation assessment, the riparian
greenline method was used on 40-m transects to
classify communities into the appropriate vegetation
series (Sawyer and Keeler-Wolf 1995; Winward
2000). At the species level, vegetation surveys used
Braun-Blanquet style releve plots of 15–100 m2 for
each of the three positions at each site (CNPS
Vegetation Committee 2000); plants were identified
according to Hickman (1993). Plants were classified
into five main functional groups: (i) woody perenni-
als, (ii) herbaceous natives, (iii) legumes, (iv) inva-
sive/noxious weeds (USDA-NRCS 2009), and (v)
other non-natives (excluding invasive/noxious weeds
and legumes, but including crop species).
A quantitative visual assessment of riparian health
was conducted along a 40-m reach at each site with a
modification of the method for low gradient rangeland
streams (Ward et al. 2003). Channel condition, access
to the floodplain, bank stability, extent of natural
riparian zone vegetation, macroinvertebrate habitat,
pool variability and pool substrate were scored on a
scale from 1 to 12. The riparian health score was
calculated as a percentage for each of the 20 sites.
To estimate woody C sequestration, the height,
canopy dimensions and diameter at breast height
(DBH) of all woody species 1.5 m or taller were
recorded within the 40-m reach of the riparian zone
(this zone varied in width from 14 to 40 m, depend-
ing on surrounding land use and topography) follow-
ing the Forest Project Protocol (California Climate
Action Registry 2007). Aboveground wood biomass
of each tree species was calculated using allometric
equations based on DBH (Jenkins et al. 2003).
Belowground tree biomass at each site was estimated
using an allometric equation based on the calculated
aboveground biomass density (Cairns et al. 1997).
Shrub above- and belowground biomass were calcu-
lated based on equations from Smukler et al. (pro-
visionally accepted, Agric Ecosyst Env), which
related the ellipsoid volume of each shrub canopy
to biomass. Total woody biomass per ha was
calculated as the sum of above- and belowground
tree and shrub biomass divided by the area surveyed.
Total woody C storage (Mg ha-1) was calculated
assuming a 50% C content for all species (California
Climate Action Registry 2007).
Fig. 1 Sampling positions
relative to the waterway for
the two land use types
within the study area in the
Sacramento Valley,
California (not drawn to
scale)
Agroforest Syst (2010) 80:41–60 43
123

Soil sampling and profile descriptions
Soil profile characterization and sampling took place
from late March to mid-April of 2007, when soil moisture
was most similar across the landscape, and when soil
temperatures were warm enough to facilitate soil micro-
bial and nematode activity. Soil profiles (1 m 9 1 m 9
1 m) were dug at positions A, B and C at each site, but in
three cases no soil pit could be dug at position B because
the canal was incised within an agricultural field.
Profile descriptions were performed using standard
soil survey techniques (Schoeneberger et al. 2002).
Four semi-quantitative morphologic indicators of soil
quality were measured: (1) A-horizon darkening
(indicating the accumulation of soil organic matter
(SOM)); (2) A-horizon thickness (indicating a lack of
soil disturbance); (3) depth to redoximorphic features
(indicating presence of water table during some
portion of the year); and (4) depth to a potentially
root-limiting horizon, defined by root-restrictive bulk
density in any horizon (e.g., greater than 1.7 g m-3
for loams or greater than 1.5 g m-3 for silty clay
loams; USDA 2001) and/or an extremely firm
consistence or textural classes with greater than
60% coarse fragments ([2 mm in diam.). A-horizon
darkening (in any A-, Ap-, AB- or BA-horizons) was
considered significant when there was a decrease of at
least one unit in the Munsell color value from the
surface to the next underlying horizon.
Soil was sampled from each pit, and from two
7.5-cm diameter soil cores taken 2 m from the pit
on either side, which were analyzed separately and
treated as replicates. Depths were 0–15, 15–45,
45–75, and 75–100 cm. Each soil sample was homog-
enized, bagged, transported on ice, and stored at 4�C
for less than 8 days before analysis for soil moisture,
inorganic N, nematodes and PLFA (surface samples
only), and air drying for other soil properties.
Characterization of soil biotic communities,
physical properties and nutrients
Nematodes were extracted by a modified sieving and
Baermann funnel method (Barker 1985; Ferris and
Matute 2003). Nematodes were identified to genus or
family level, assigned to trophic groups (Yeates et al.
1993) and functional guilds (Bongers and Bongers 1998),
and used to calculate structure index (an indicator of soil
food web length and connectance; Ferris et al. 2001).
For microbial community composition and biomass,
phospholipid fatty acids (PLFA) were extracted and
analyzed (Bossio and Scow 1998), and identified on a
Hewlett Packard 6890 gas chromatograph (J&W Scien-
tific, Folsom, CA). PLFA biomarkers were grouped into
bacterial (actinomycetes, Gram? and Gram-), fungal and
unspecific origins following Potthoff et al. (2006).
Inorganic N was extracted with 2 M KCl, and
analyzed colorimetrically for ammonium (NH4?) and
nitrate (NO3-) on a Genesys 10VIS spectrophotometer
(Thermo Fisher Scientific, Waltham, MA; Forster 1995;
Miranda et al. 2001). Air-dried samples were crushed and
sieved through a 2 mm screen. Particle size analysis was
performed on a Coulter LS-230 Particle Size Analyzer
(Beckman Coulter Inc., Miami, FL; Eshel et al. 2004).
The Agriculture and Natural Resources Analytical
Laboratory at the University of California at Davis
analyzed soil for boron (B), total N and C, pH, Olsen
phosphorus (P) and exchangeable cations as described at
http://groups.ucanr.org/danranlab/Soil_Analysis_2/.
Two bulk density samples were collected from each
soil pit at two depths (1–7 and 27–33 cm) using a brass
ring (345 cm3) to remove intact soil cores (Blake and
Hartge 1986). Bulk density values of the bottom two
soil layers were approximated based on the SSURGO
data for the mapped soil type (Soil Survey Staff 2009).
These values were used to calculate total soil C for the
full 1-m profile using the percent soil C from each of
the four sampled depth intervals.
Statistical analyses
Effects of land use and position from the channel edge
on soil properties and plant, nematode and microbial
diversity, richness and functional group abundance were
analyzed using a mixed model ANOVA (based on
repeated measures) with land use type as the between-
subject factor (two levels: rangeland and cropland), and
position from the channel edge as the within-subject
factor (three levels: A, B and C). This and all other tests
were considered significant at P\0.05. One-way
ANOVAs examined the simple effects of position for
each land use type when there was a significant
interaction, as well as for sites where woody-dominated
communities (defined as narrowleaf willow series, blue
oak series, Fremont cottonwood series, and valley oak
series) were either absent or present in the riparian area.
Mixed model three-way ANOVAs were used to analyze
soil properties by depth, position from waterway and
44 Agroforest Syst (2010) 80:41–60
123

land use type. Data were normalized using log (x ? 1)
or square root transformations when necessary to meet
ANOVA assumptions. All ANOVAs were performed in
SAS v9.1 (SAS Institute, Cary, NC) using the Tukey HSD
test to determine differences between least square means.
Pearson’s product moment correlations between
riparian health rating, diversity measures, soil prop-
erties and soil profile indicators were run in R 2.7.2
(R Development Core Team 2008). Shannon’s diver-
sity index (H0) and species richness were calculated
with the diversity function in the vegan package in
R. Pairwise comparisons of each group of biota were
performed with Mantel tests to test the null hypoth-
eses that no relationship exists between the two
datasets (Mantel 1967). The test was performed in
R with the mantel function in the vegan package
using Bray-Curtis distance measures.
An indicator species analysis identified plant spe-
cies that were indicators of good versus poor riparian
health, based on species abundance (cover) and
frequency (Dufrene and Legendre 1997). A perfect
score (1.0) indicates a species is both faithful (always
present) and exclusive to a given category (McCune
and Grace 2002). Indicator values were calculated
using the duleg function in the labdsv package in R,
and significance was tested with 1,000 randomizations
in a Monte Carlo test. For this purpose, the riparian
health ratings were divided into four equally weighted
health classes: poor (19.6–34.5%), fair (34.6–49.4%),
moderate (49.5–64.3%), and good (64.4–79.2%).
Results
Diversity and structure of plant, nematode
and microbial communities
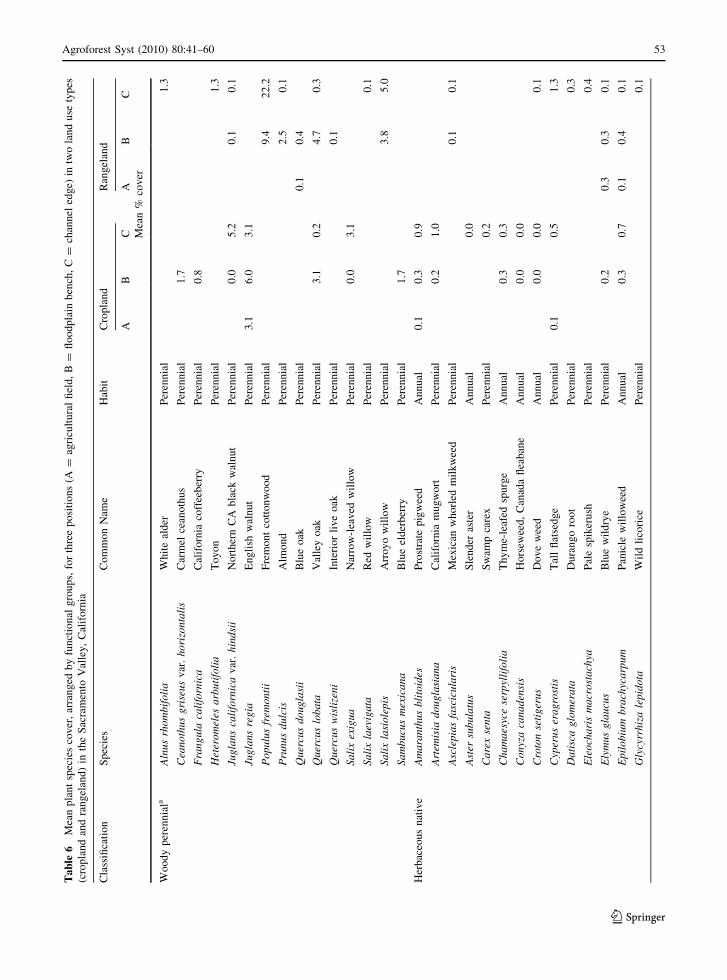
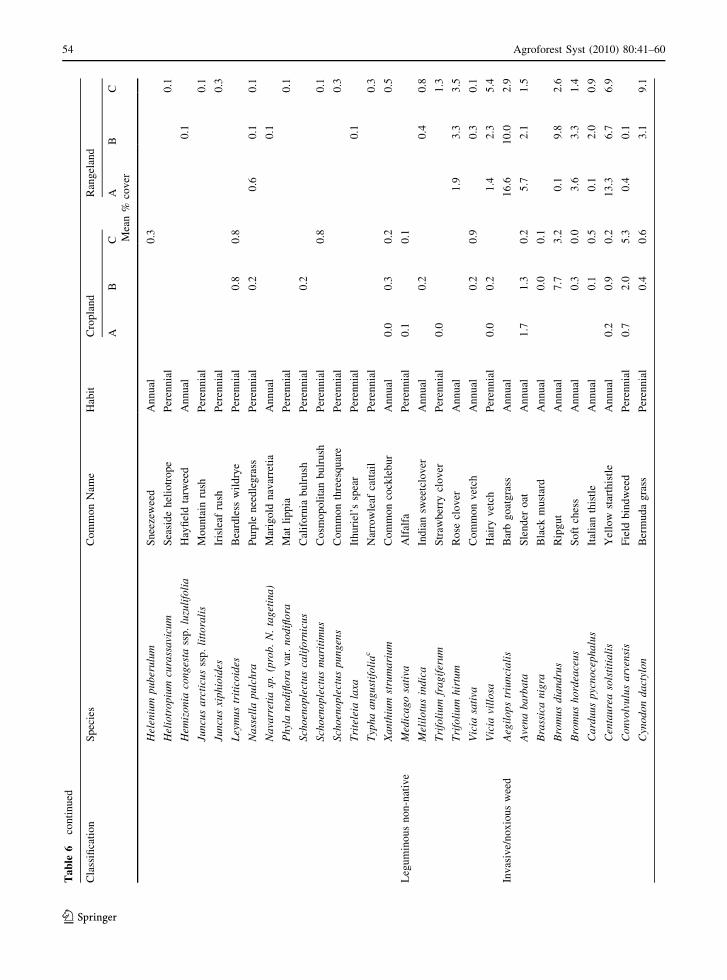
A total of 114 plant species were identified (Appendix
Table 6), and classified into five main functional
groups: California state-listed invasive/noxious weeds
(33 species), other herbaceous non-natives (excluding
legumes and invasive/noxious weeds; 31 species),
herbaceous natives (29 species), woody perennials (15
species), and non-native legumes (6 species). Of the
total, 62 were annual species while 52 were perennials.
Plant diversity (H’) was greater in the riparian
positions, B and C, than in the agricultural position, A
(Table 1). Rangeland H’ was greater than in the
cropland land use type, and had an average of almost
twice as many species. Positional differences were more
pronounced in the rangeland than the cropland sites,
with more species near the waterway in both cases.
Both woody perennial cover and native herbaceous
species cover were greater in the riparian positions (B
and C) than in position A in both land use types. Mean
percent cover of total vegetation and legumes were
both greater in rangeland than cropland. In the
croplands, invasive/noxious weed cover was greater
in riparian positions (B and C) than position A, while
rangeland sites had greatest invasive/noxious weed
cover at position B. The arable croplands had much
greater cover of non-native species in the agricultural
fields than in the riparian zone, but non-native species
cover did not vary with position in the rangelands.
Nematode H0 and richness did not vary by position
from the waterway or land use type (Table 1). There
were 43 different nematode taxa (either genera or
families), of which 14 were plant feeders or associates,
13 were bacterivores, six were fungivores, five were
omnivores and four were predators. There were 10
common nematode taxa (found in over half of the
samples), and 15 rare nematode taxa (found in less
than 5% of the samples) (data not shown). Total
nematode abundance and abundance of fungivores and
plant feeders were greater at position A than at position
C on the channel edge (Table 1). Both omnivores and
predators were rare, but they were more abundant in
agricultural fields and floodplain benches (positions A
and B), than at the waterway edge (position C).
Bacterivores were the only trophic group that varied
between land use types, and were two times more
abundant in cropland than rangeland sites.
Nematode structure index, a measure of soil food
web length and connectance, ranged from 0 to 93.9
(on a scale of 0–100). In rangeland sites, it was
greater in the field and riparian bench positions
(56.5 ± 5.0 and 48.4 ± 3.6 for positions A and B,
respectively) than at position C near the channel edge
(30.1 ± 5.4, P \ 0.001). However, structure index
did not differ by position in the cropland, and
averaged 34.8 ± 3.3 for all sites.
Diversity of microbial PLFA biomarkers was
greater in the agricultural position (A) than at
position C at the edge of the channel (Table 1). Both
the diversity and richness of the microbial biomarkers
were greater for rangelands than croplands. There
were 72 different PLFA biomarkers identified across
the landscape: bacterial (18 biomarkers, composed of
Agroforest Syst (2010) 80:41–60 45
123

seven Gram? bacteria, five Gram- bacteria, three
actinomycetes, and three unspecific bacterial bio-
markers), fungal (three biomarkers), and 51 unspe-
cific biomarkers. Mean bacterial PLFA abundance
was about three times higher than fungal PLFA
abundance at each position from the waterway.
When group abundances were adjusted for total
PLFA abundance, the relative abundance of fungi was
Table 1 Distribution of plant, nematode and microbial communities according to position from waterway (A = agricultural field,
B = floodplain bench, C = channel edge) and two land use types in the Sacramento Valley, California
Position from waterway Land use type P*LU
A B C Siga Cropland Rangeland Sig Sig
Plants (n = 20) (n = 20) (n = 20) (n = 36) (n = 24)
Shannon’s diversity index 0.8 ± 0.1 b 1.5 ± 0.1 a 1.5 ± 0.1 a *** 1.1 ± 0.1 1.5 ± 0.1 ** NS
Species richness 7.5 ± 0.8 14.2 ± 1.3 *** *
Cropland 4.5 ± 0.9 b 8.4 ± 1.2 ab 9.6 ± 1.4 a **
Rangeland 8.8 ± 0.8 b 13.8 ± 1.0 b 20.0 ± 2.5 a ***
Total cover (%)b 46.5 ± 7.5 61.3 ± 7.8 62.2 ± 6.9 NS 45.9 ± 5.8 72.7 ± 4.7 * NS
Woody perennials 1.9 ± 1.9 b 16.4 ± 6.0 a 19.1 ± 7.9 a ** 9.4 ± 3.5 17.0 ± 6.8 NS NS
Herbaceous natives 0.6 ± 1.9 b 2.1 ± 0.6 a 5.1 ± 1.5 a *** 2.9 ± 0.8 2.0 ± 0.7 NS NS
Legumes 1.4 ± 0.8 2.9 ± 0.9 5.0 ± 1.8 NS 0.6 ± 0.3 6.9 ± 1.5 *** NS
Invasive/noxious weeds 23.2 ± 4.5 56.0 ± 5.2 *** *
Cropland 5.8 ± 3.8 b 29.7 ± 8.9 a 34.0 ± 7.9 a *
Rangeland 59.0 ± 7.6 ab 69.2 ± 9.0 a 39.8 ± 8.2 b *
Other non-nativesc 10.8 ± 3.6 3.3 ± 1.7 NS **
Cropland 26.8 ± 9.0 a 3.8 ± 1.9 b 2.0 ± 0.8 b **
Rangeland 0.7 ± 0.4 2.0 ± 1.2 7.2 ± 4.8 NS
Nematodes (n = 20) (n = 18) (n = 20) (n = 34) (n = 24)
Shannon’s diversity index 1.8 ± 0.1 1.9 ± 0.1 1.8 ± 0.1 NS 1.8 ± 0.1 1.9 ± 0.1 NS NS
Taxa richness 16.0 ± 0.7 16.0 ± 0.8 15.4 ± 1.3 NS 15.3 ± 0.7 16.5 ± 0.9 NS NS
Total abundance (100 g-1 soil) 592 ± 59 a 431 ± 68 ab 309 ± 58 b ** 478 ± 58 397 ± 42 NS NS
Bacterivores 143 ± 24 125 ± 30 80 ± 12 NS 144 ± 20 75 ± 11 * NS
Fungivores 272 ± 35 a 158 ± 25 b 110 ± 22 b *** 195 ± 28 161 ± 19 NS NS
Plant feeders 142 ± 19 a 120 ± 23 ab 101 ± 30 b * 106 ± 20 142 ± 18 NS NS
Omnivores ? predators 34.7 ± 7.1 a 28.9 ± 5.2 a 17.4 ± 4.8 b * 32.6 ± 5.2 18.9 ± 3.4 NS NS
PLFA biomarkers (n = 19) (n = 18) (n = 17) (n = 33) (n = 21)
Shannon’s diversity index 3.1 ± 0.0 a 3.1 ± 0.0 ab 3.1 ± 0.0 b *** 3.1 ± 0.0 3.1 ± 0.0 * NS
PLFA richness 39.9 ± 1.2 39.6 ± 1.2 36.0 ± 1.3 NS 36.5 ± 0.9 42.0 ± 1.1 ** NS
Total abundance (nmol g-1 soil) 40.9 ± 5.1 41.8 ± 5.1 29.9 ± 3.9 NS 29.6 ± 2.7 50.5 ± 4.7 *** NS
Actinomycetes 2.4 ± 0.3 2.3 ± 0.3 1.8 ± 0.2 NS 1.8 ± 0.1 2.9 ± 0.3 *** NS
Gram? bacteria 8.7 ± 1.0 8.2 ± 0.9 6.1 ± 0.8 NS 6.3 ± 0.5 10.0 ± 0.9 *** NS
Gram- bacteria 6.0 ± 0.8 6.2 ± 0.8 4.3 ± 0.5 NS 4.5 ± 0.4 7.2 ± 0.7 ** NS
Fungi 5.4 ± 0.8 5.8 ± 0.8 4.1 ± 0.6 NS 3.8 ± 0.4 7.2 ± 0.7 *** NS
Mean ± SEa Significance for each main effect in the 2-way ANOVA, and the interaction of the two terms (position by land use type, P*LU):
P B 0.001 = ***; B 0.01 = **; B 0.05 = *. For significant interactions, simple effects are described instead of main effects for
position. Means with the same lower-case letter within each row are not significantly different in Tukey comparisons at a = 0.05
levelb Cover does not necessarily total 100% as there may be canopy overlap or bare groundc Non-native, herbaceous species excluding legumes and invasive/noxious weeds
46 Agroforest Syst (2010) 80:41–60
123

still greater in rangelands than croplands (14.0 ± 0.2
vs. 12.5 ± 0.3%, respectively; P \ 0.01). The
response for Gram? and Gram- bacteria was opposite,
with relative abundance less in rangelands than
croplands (19.9 ± 0.4 vs. 21.6 ± 0.3%, respectively,
P = 0.01 for Gram?; 14.1 ± 0.3 vs. 15.2 ± 0.2%,
respectively, P \ 0.01 for Gram-). Actinomycetes
had an average relative abundance of 6.1 ± 0.2% and
did not vary with land use type or position.
Soil properties
Soil surface samples (0–15 cm depth) were on average
34% lower in total soil C at position C near the channel
edge than at position A (i.e., fields or grasslands
managed for agricultural production) (Table 2). The
percentage of fine particles (silt and clay) was lower at
the channel edge than at position A. Rangeland sites had
larger pools of NH4?–N, total soil C and exchangeable
Ca in the surface layer, and smaller pools of NO3-–N
and Olsen-P than the cropland sites. Total C was almost
50% higher in rangelands than croplands, and range-
lands had a higher soil C to N ratio. In general, stronger
positional gradients occurred for soil properties in
rangelands than croplands, e.g. total soil N. Rangeland
sites had higher pH and greater B concentration near the
edge of the channel than in grazed fields. Weighted
averages of soil nutrients for the four sampling depths
from 0 to 100 cm showed similar trends for position and
land use as for the 0–15 cm surface layer (Appendix
Table 7). However, differences in weighted average
values tended to be smaller.
Depth explained from 4% (NO3-–N) to 42% (total
C) of the variance in the three-way ANOVA model
(data not shown). Total C and N, NH4?–N, NO3
-–N,
Olsen-P and exchangeable K decreased with depth,
while pH and exchangeable Na, Ca and Mg increased
with depth (data not shown). Effects of depth on total C
and N were especially pronounced, with differences of
about 50% between surface (0–15 cm) and deepest
(75–100 cm) samples (data not shown).
Linking aboveground and belowground biota
and soil properties
Vegetation and nematodes shared the greatest correlative
structure out of the three biological communities, with a
standardized Mantel statistic (r, analogous to a correla-
tion coefficient) of 0.24 (P \0.001). PLFA communities
were only weakly related to nematodes (r = 0.11,
P\ 0.01) and vegetation (r = 0.08, P \0.05) in
Mantel tests. Using Pearson’s correlation tests, total
percent plant cover correlated positively with nematode
diversity and richness, as well as PLFA biomarker
richness and abundance (Table 3). Vegetation species
richness was also positively correlated with total PLFA
abundance, which can be used as a proxy for total
microbial biomass. Diversity of PLFA biomarkers was
positively correlated with nematode diversity (r = 0.29,
P\ 0.05) and PLFA richness was positively correlated
with nematode richness (r = 0.32, P\0.05).
The presence of woody-dominated plant communi-
ties in the riparian zone increased total plant species
diversity and richness (Fig. 2a, b). Nematode diversity
and richness showed no differences (Fig. 2c, d), while
PLFA diversity decreased in the riparian zone regard-
less of the presence of woody communities (Fig. 2e, f).
Soil concentrations of NO3-–N and Olsen-P in the
riparian positions were lower in sites with woody
communities (1.7 ± 0.7 vs. 7.4 ± 2.0 lg NO3-–
N g-1, P = 0.01, and 14.1 ± 1.4 vs. 20.8 ± 2.2 lg
Olsen-P g-1, P = 0.01, for presence versus absence of
woody communities, respectively). Total soil C, how-
ever, did not vary in the presence of woody commu-
nities at either position B or C (data not shown).
Riparian health and ecosystem functions
Riparian health scores for the 20 sites ranged from
19.6% to 79.2%, with an average score of
41.3 ± 4.2%. At position C near the channel edge,
riparian health scores correlated positively with plant
diversity and richness, and with soil NH4?–N and C
concentrations for the surface 0–15 cm (Table 4). In
contrast, the riparian health scores were negatively
correlated with soil NO3-–N and Olsen-P at position
C. Both PLFA and nematode richness were positively
correlated with riparian health scores at position B on
the floodplain bench. Riparian health rating also
correlated positively with nematode structure index at
position B, but showed a trend in the opposite
direction at the more disturbed position C.
Total C storage per ha (sum of soil C to 1-m depth
and woody C), was greater in the riparian zones of the
rangelands than croplands or agricultural fields used
for crops or grazing (Fig. 3). This difference was
largely due to greater wood C, as total soil C storage
for the full 1-m profile did not vary between positions
Agroforest Syst (2010) 80:41–60 47
123

or land use types (data not shown). Woody C storage
in the riparian zone was positively correlated with
riparian health scores (r = 0.58, P \ 0.01).
Indicator species analysis for riparian health clas-
ses at position C at the channel edge revealed that
Johnsongrass (Sorghum halepense, a perennial state-
listed noxious weed) was an indicator of poor riparian
health (Indicator Value (IV) = 0.63, P \ 0.05), while
dogstail grass (Cynosurus echinatus, an annual non-
native) and pale spikerush (Eleocharis macrostachya,
a perennial native) were strong indicators of good
riparian health (IV = 0.75, P \ 0.01 for both). At
position B on the floodplain bench, no plant species
was an indicator of poor riparian health, but hairy
vetch (Vicia villosa, a non-native legume) and
Fremont cottonwood (Populus fremontii, a native
tree) were both indicators of good riparian health
(IV = 0.56, P \ 0.05 and IV = 0.50, P \ 0.05,
respectively).
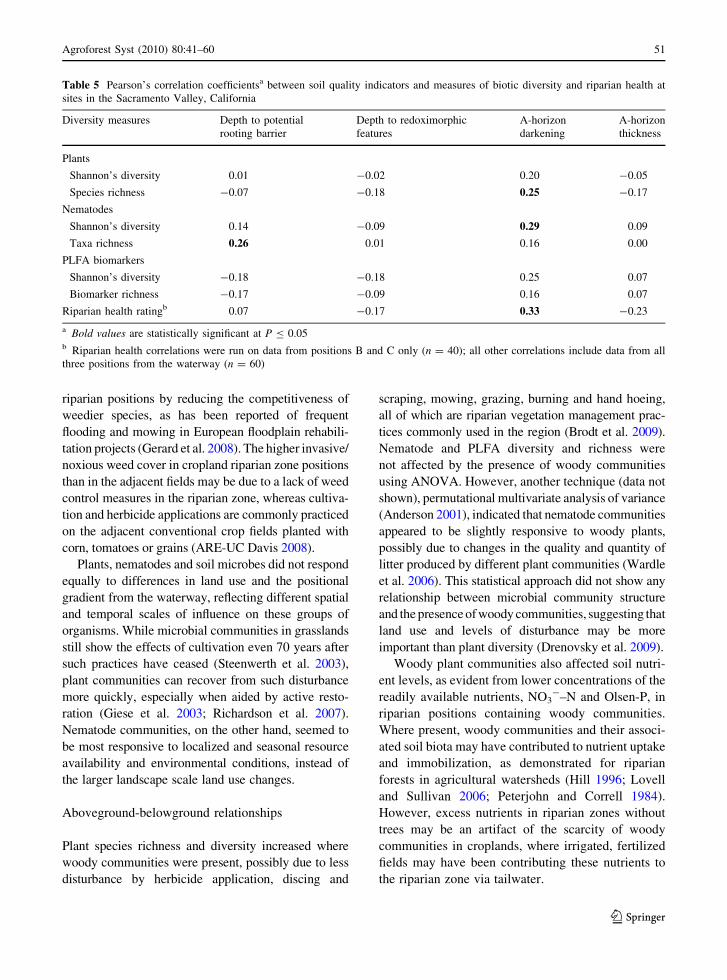
Of our four indicators of soil quality based on soil
profile characteristics, only A-horizon darkening
correlated with riparian health scores (Table 5).
Table 2 Soil properties in top 15 cm layer according to three positions from waterway (A = agricultural field, B = floodplain
bench, C = channel edge) and two land use types in the Sacramento Valley, California
Position from waterway Land use type P*LU
A (n = 20) B (n = 20) C (n = 20) Siga Cropland
(n = 36)
Rangeland
(n = 24)
Sig Sig
NO3-–N (lg g-1) 5.7 ± 1.5 4.2 ± 1.2 4.2 ± 1.8 NS 7.6 ± 1.2 0.4 ± 0.1 *** NS
NH4?–N (lg g-1) 1.6 ± 0.2 1.7 ± 0.3 1.2 ± 0.2 NS 1.1 ± 0.2 2.0 ± 0.2 ** NS
Total N (%) 0.09 ± 0.00 0.11 ± 0.01 NS **
Cropland 0.11 ± 0.01 a 0.09 ± 0.01 ab 0.08 ± 0.01 b *
Rangeland 0.13 ± 0.01 a 0.13 ± 0.01 a 0.06 ± 0.01 b ***
Total C (%) 1.1 ± 0.1 a 1.1 ± 0.1 a 0.8 ± 0.1 b ** 0.9 ± 0.0 1.2 ± 0.1 *** NS
C:N ratio 9.4 ± 0.3 10.3 ± 0.4 11.9 ± 0.9 NS 9.7 ± 0.4 11.9 ± 0.6 ** NS
Olsen-P (lg g-1) 22.3 ± 3.4 19.6 ± 1.8 14.6 ± 1.8 NS 21.8 ± 1.5 14.3 ± 2.6 ** NS
B (lg g-1) 0.5 ± 0.1 0.1 ± 0.0 *** ***
Cropland 0.7 ± 0.1 0.3 ± 0.1 0.4 ± 0.1 NS
Rangeland 0.0 ± 0.0 b 0.0 ± 0.0 ab 0.1 ± 0.1 a *
Exchangeable Kb 0.7 ± 0.1 ab 0.8 ± 0.0 a 0.5 ± 0.1 b * 0.7 ± 0.1 0.7 ± 0.1 NS NS
Exchangeable Nab 0.2 ± 0.0 0.3 ± 0.1 NS ***
Cropland 0.2 ± 0.0 a 0.1 ± 0.0 b 0.2 ± 0.1 ab *
Rangeland 0.1 ± 0.0 b 0.1 ± 0.0 b 0.6 ± 0.2 a ***
Exchangeable Cab 13.3 ± 1.0 ab 13.3 ± 0.8 b 15.0 ± 0.9 a * 12.6 ± 0.4 15.9 ± 1.1 * NS
Exchangeable Mgb 6.6 ± 0.6 5.6 ± 0.4 6.6 ± 0.4 NS 6.3 ± 0.3 6.1 ± 0.5 NS NS
pH 7.1 ± 0.1 7.1 ± 0.2 NS **
Cropland 6.5 ± 0.1 7.0 ± 0.2 7.3 ± 0.2 NS
Rangeland 6.5 ± 0.2 b 6.9 ± 0.2 b 7.8 ± 0.1 a ***
Clay (%) 17.9 ± 0.9 a 14.9 ± 1.0 b 14.1 ± 0.8 b *** 16.1 ± 0.6 14.9 ± 1.0 NS NS
Silt (%) 54.4 ± 1.1 50.4 ± 2.1 NS *
Cropland 57.3 ± 1.6 53.4 ± 1.9 52.5 ± 2.0 NS
Rangeland 58.0 ± 2.4 a 49.9 ± 3.7 ab 43.5 ± 3.4 b *
Sand (%) 24.5 ± 1.8 b 33.1 ± 2.7 a 37.0 ± 2.6 a *** 29.5 ± 1.6 34.7 ± 3.0 NS NS
Mean ± SEa Significance for each main effect in the 2-way ANOVA, and the interaction of the two terms (position by land use type, P*LU):
P B 0.001 = ***; B 0.01 = **; B 0.05 = *. For significant interactions, simple effects are described instead of main effects for
position. Means with the same lower-case letter within each row are not significantly different in Tukey comparisons at a = 0.05
levelb Exchangeable cations are given in meq 100 g-1 soil
48 Agroforest Syst (2010) 80:41–60
123

A-horizon darkening also correlated positively with
plant species richness and nematode H0. Thus, a
change in soil surface color was the most informative
soil quality indicator of biodiversity and riparian
health.
Discussion
Riparian gradient and land use types
Riparian zones are often reservoirs of native plant
diversity (Richardson et al. 2007), and indeed riparian
positions here were richer in plant diversity than
adjacent fields managed for agricultural purposes.
However, native plant diversity in the riparian
positions in this landscape was lower than in
historical or remnant stands elsewhere in the Central
Valley (Roberts et al. 1980; Sawyer and Keeler-Wolf
1995). This lower native plant diversity could be the
legacy of historic land use change, including drainage
of wetlands, clearing of forests, and tillage and land
Table 3 Pearson’s correlation coefficients between above-
ground and belowground biotic diversity, richness and abun-
dance at sites in the Sacramento Valley, California (n = 60)
Vegetation
Shannon’s
diversity
Vegetation
species
richness
Vegetation
total % cover
Nematodes
Shannon’s diversity 0.02 0.16 0.38
Taxa richness 0.06 0.08 0.34
Total abundance -0.04 -0.23 -0.08
PLFA biomarkers
Shannon’s diversity -0.20 -0.08 0.03
Biomarker richness 0.17 0.22 0.29
Total abundance 0.25 0.28 0.31
Bold values are statistically significant at P B 0.05
0
5
10
15
20
Plant Species
Ric
hnes
s
Position APosition BPosition C
z
y
x(a)
0
5
10
15
20
Nematode Taxa
(c)
20
25
30
35
40
45
PLFA Biomarkers
(e)
0.0
0.5
1.0
1.5
2.0
- Woody + Woody
Sha
nnon
's d
iver
sity
inde
x
b
a
aby
xx
(b)
0.0
0.5
1.0
1.5
2.0
- Woody + Woody
(d)
2.4
2.6
2.8
3.0
3.2
- Woody + Woody
aab b
x xy y
(f)
Fig. 2 Richness and diversity of plants (a, b), nematodes
(c, d) and microbes (PLFA biomarkers) (e, f) in sites without
(- Woody, n = 8) or with (? Woody, n = 12) woody riparian
communities in the Sacramento Valley, California. Position
A = agricultural field, Position B = floodplain bench, Position
C = channel edge. Means ± SE with the same lower-caseletter within each group of biota are not statistically different in
Tukey means comparisons at a = 0.05 level
Agroforest Syst (2010) 80:41–60 49
123

planing for agriculture, dating back to the late 1800s
(Barbour et al. 1993).
Soil fungi and fungivorous nematodes often
decrease with disturbance and/or wetter soils (Hol-
land and Coleman 1987; Neher et al. 2005; Six et al.
2006). Thus, the greater abundance of fungivorous
nematodes in position A may reflect drier and less
disturbed soil conditions more conducive to fungal
decomposition pathways further from the waterways.
Most of the grazed rangelands were not tilled, and
some of the irrigated cropland had not received
spring tillage, whereas waterways had experienced
substantial water and soil movement during the fall
and winter rainy season. Surprisingly, abundance of
PLFA fungal biomarkers did not vary according to
position from the waterway, but the trend was toward
fewer fungi near the channel edge.
Position C in the active stream channel was subject
to frequent erosion, deposition, and submergence due
to seasonal flooding and irrigation events. Low values
of C and N at this landscape position are likely due to
the dynamic nature of stream channel processes. In
this setting, deposition and erosion can inhibit SOM
accumulation (and associated N mineralization)
either by deposition of parent material low in organic
matter or by episodic stripping of carbon-rich flood-
plain soils during flood events. The high level of soil
disturbance along the active stream channel may also
explain the lower overall abundance of nematodes
(Bouwman and Zwart 1994; Ferris et al. 2001; Lenz
and Eisenbeis 2000).
Land use type was an important factor in explaining
variance in plant and microbial diversity and functional
group distribution, as well as many soil nutrients. For
example, cropland sites had a higher relative abundance
of Gram? and Gram- bacteria, and bacterivorous
nematodes were also nearly twice as abundant in
croplands as rangelands. These trends likely reflect the
effects of tillage and agrochemical application on soil
community diversity and function, as opportunistic
bacteria and bacterivorous nematodes are known to
increase with ecosystem disturbance (Ferris et al. 2001;
Minoshima et al. 2007).
The relatively low invasive/noxious weed cover near
rangeland waterways suggests interactions with native
perennial woody and herbaceous species. Disturbance
along the channel edge, and more intensive grazing
pressure from cattle accessing water, may have con-
tributed to the increased plant species richness of
Table 4 Pearson’s correlation coefficients between riparian
health scores and biotic and soil properties at two positions
within the riparian zone (B = floodplain bench, C = channel
edge, n = 20 for each) at sites in the Sacramento Valley,
California
Riparian Health Scores
Position B Position C
Plants
Shannon’s diversity 0.13 0.52*
Species richness 0.58** 0.70***
Nematodes
Shannon’s diversity 0.23 0.27
Taxa richness 0.50* 0.09
Total abundance -0.15 0.10
Structure index 0.49*** -0.29
PLFA biomarkers
Shannon’s diversity 0.30 0.01
Biomarker richness 0.55* 0.45
Total abundance 0.57* 0.54*
Soil (0–15 cm)
NO3-–N (lg g-1) -0.49* -0.53*
NH4?–N (lg g-1) 0.61** 0.64**
Total N (%) 0.36 -0.35
Total C (%) 0.61** 0.60**
Olsen-P (lg g-1) -0.43 -0.69***
Significance levels: P B 0.001 = ***; B 0.01 = **; B 0.05 = *
Field (A) Riparian (B & C) Field (A) Riparian (B & C) 0
50
100
150
200
250
Car
bon
stor
age
(Mg/
ha)
Trees & shrubsSoil 0-15 cmSoil 15-45 cmSoil 45-75 cmSoil 75-100 cm
Cropland Rangeland
b
bb
a
Fig. 3 Carbon storage in the top 1 m of soil and in woody
biomass in the field (Position A) versus riparian zone (mean of
Positions B and C) according to two land use types in the
Sacramento Valley, California. Total mean C storage ± SE
denoted by the same lower-case letter is not statistically
different in Tukey means comparisons at a = 0.05 level
(n = 12 for cropland and n = 8 for rangeland)
50 Agroforest Syst (2010) 80:41–60
123
riparian positions by reducing the competitiveness of
weedier species, as has been reported of frequent
flooding and mowing in European floodplain rehabili-
tation projects (Gerard et al. 2008). The higher invasive/
noxious weed cover in cropland riparian zone positions
than in the adjacent fields may be due to a lack of weed
control measures in the riparian zone, whereas cultiva-
tion and herbicide applications are commonly practiced
on the adjacent conventional crop fields planted with
corn, tomatoes or grains (ARE-UC Davis 2008).
Plants, nematodes and soil microbes did not respond
equally to differences in land use and the positional
gradient from the waterway, reflecting different spatial
and temporal scales of influence on these groups of
organisms. While microbial communities in grasslands
still show the effects of cultivation even 70 years after
such practices have ceased (Steenwerth et al. 2003),
plant communities can recover from such disturbance
more quickly, especially when aided by active resto-
ration (Giese et al. 2003; Richardson et al. 2007).
Nematode communities, on the other hand, seemed to
be most responsive to localized and seasonal resource
availability and environmental conditions, instead of
the larger landscape scale land use changes.
Aboveground-belowground relationships
Plant species richness and diversity increased where
woody communities were present, possibly due to less
disturbance by herbicide application, discing and
scraping, mowing, grazing, burning and hand hoeing,
all of which are riparian vegetation management prac-
tices commonly used in the region (Brodt et al. 2009).
Nematode and PLFA diversity and richness were
not affected by the presence of woody communities
using ANOVA. However, another technique (data not
shown), permutational multivariate analysis of variance
(Anderson 2001), indicated that nematode communities
appeared to be slightly responsive to woody plants,
possibly due to changes in the quality and quantity of
litter produced by different plant communities (Wardle
et al. 2006). This statistical approach did not show any
relationship between microbial community structure
and the presence of woody communities, suggesting that
land use and levels of disturbance may be more
important than plant diversity (Drenovsky et al. 2009).
Woody plant communities also affected soil nutri-
ent levels, as evident from lower concentrations of the
readily available nutrients, NO3-–N and Olsen-P, in
riparian positions containing woody communities.
Where present, woody communities and their associ-
ated soil biota may have contributed to nutrient uptake
and immobilization, as demonstrated for riparian
forests in agricultural watersheds (Hill 1996; Lovell
and Sullivan 2006; Peterjohn and Correll 1984).
However, excess nutrients in riparian zones without
trees may be an artifact of the scarcity of woody
communities in croplands, where irrigated, fertilized
fields may have been contributing these nutrients to
the riparian zone via tailwater.
Table 5 Pearson’s correlation coefficientsa between soil quality indicators and measures of biotic diversity and riparian health at
sites in the Sacramento Valley, California
Diversity measures Depth to potential
rooting barrier
Depth to redoximorphic
features
A-horizon
darkening
A-horizon
thickness
Plants
Shannon’s diversity 0.01 -0.02 0.20 -0.05
Species richness -0.07 -0.18 0.25 -0.17
Nematodes
Shannon’s diversity 0.14 -0.09 0.29 0.09
Taxa richness 0.26 0.01 0.16 0.00
PLFA biomarkers
Shannon’s diversity -0.18 -0.18 0.25 0.07
Biomarker richness -0.17 -0.09 0.16 0.07
Riparian health ratingb 0.07 -0.17 0.33 -0.23
a Bold values are statistically significant at P B 0.05b Riparian health correlations were run on data from positions B and C only (n = 40); all other correlations include data from all
three positions from the waterway (n = 60)
Agroforest Syst (2010) 80:41–60 51
123

Plant, nematode and microbial communities were
positively but weakly correlated with each other in
Mantel tests, indicating that the three community
datasets were related, but that the majority of structure
in these data was not accounted for. Trophic interac-
tions would be expected to influence the structure of the
microbial, nematode and vegetation communities
(Waldrop et al. 2006; Zak et al. 2003). The stronger
correlation between nematode and microbial diversity
and richness was probably due to the link between
microbial-feeding nematodes (the most abundant
group in the nematode community) and their food
source. Although no direct synchrony exists between
nematode and bacterial growth (Papatheodorou et al.
2004), abundance of bacterial-feeding nematodes
depends on bacterial biomass (Zelenev et al. 2004).
Net primary productivity may have been important
in shaping nematode and microbial diversity and
richness, based on their correlations with total plant
cover. Positive correlations between above- and
belowground diversity have been observed (De Deyn
and Van der Putten 2005; Zak et al. 2003), but net
primary productivity or specific plant traits appear to
be stronger drivers of microbial and nematode
diversity than plant diversity (Sanchez-Moreno
et al. 2008; Viketoft et al. 2009; Waldrop et al. 2006).
Riparian health as an indicator of biodiversity
and ecosystem function
Riparian zone health scores from visual assessments
were highly correlated with many biodiversity and soil
properties, e.g., total soil C, A-horizon darkening and
nematode structure index. The mechanism by which
healthier riparian zones increase SOM accumulation
and soil food web structure is not clear, but disturbance
is apparently a factor, since there were fewer correla-
tions at the channel edge than on the floodplain bench.
Riparian health scores were negatively correlated
with soil NO3-–N and Olsen-P, which may reflect the
generally degraded state of the riparian zones in more
intensive cropland sites where these nutrients were
applied as fertilizers. Vegetation cover in these
degraded riparian zones was mostly weedy, with
Johnsongrass emerging as an indicator species.
Greater riparian health scores, on the other hand,
may indicate nutrient immobilization by more pro-
ductive plant communities, where Fremont cotton-
wood and hairy vetch were found to be indicator
species. The strong association between riparian
health scores, soil quality, diversity measures and
noxious weed distribution suggests that this simple
visual scoring approach may prove useful for assess-
ments by landowners and resource agencies. For
example, local conservation and restoration programs
led by non-governmental organizations (e.g., Audu-
bon California) and governmental agencies (e.g., the
Resource Conservation District and the USDA Nat-
ural Resources Conservation Service) are in need of
inexpensive monitoring and evaluation tools.
Conclusions
In this complex agricultural landscape in a Mediter-
ranean climate, riparian vegetation was a key element
in management strategies to provide multiple eco-
system benefits. Healthier riparian zones, especially
those with woody communities, provided more
ecosystem functions, acting as C reservoirs, nutrient
buffer strips to protect water quality, and habitat for
above- and belowground biodiversity. The visual
rating of riparian health, plant indicator species, and
soil color differences were associated with indicators
of biodiversity and ecosystem functions, and thus
could serve as rapid assessment tools for land
managers and restoration professionals. Maintaining
or restoring native woody plant communities along
these agricultural waterways appears to be a key
element in improving the services they provide.
Acknowledgements We are very grateful to the farmers and
ranchers in western Yolo County who allowed us access to their
land, and to the staff of the Yolo County Resource Conservation
District for helping to put us in touch with those growers. The
Yolo Land and Cattle Co. was especially generous in field
support. E. Dean of the UC Davis Herbarium kindly supplied
plant identification services. We thank S. Sokolow, S. Smukler,
F. Barrios-Masias, J. Seigies, M. Adams, B. Smith and R. Lee for
field and laboratory assistance. This research was supported by
the Kearney Foundation of Soil Science and the Orr Chair in
Environmental Plant Science.
Open Access This article is distributed under the terms of the
Creative Commons Attribution Noncommercial License which
permits any noncommercial use, distribution, and reproduction
in any medium, provided the original author(s) and source are
credited.
Appendix
52 Agroforest Syst (2010) 80:41–60
123
Ta
ble
6M
ean
pla
nt
spec
ies
cov
er,
arra
ng
edb
yfu
nct
ion
alg
rou
ps,
for
thre
ep
osi
tio
ns
(A=
agri
cult
ura
lfi
eld
,B
=fl
oo
dp
lain
ben
ch,
C=
chan
nel
edg
e)in
two
lan
du
sety
pes
(cro
pla
nd
and
ran
gel
and
)in
the
Sac
ram
ento
Val
ley
,C
alif
orn
ia
Cla
ssifi
cati
on
Sp
ecie
sC
om
mo
nN
ame
Hab
itC
rop
lan
dR
ang
elan
d
AB
CA
BC
Mea
n%
cov
er
Wo
od
yp
eren
nia
laA
lnu
srh
om
bif
oli
aW
hit
eal
der
Per
enn
ial
1.3
Cea
no
thu
sg
rise
us
var
.h
ori
zon
tali
sC
arm
elce
ano
thu
sP
eren
nia
l1
.7
Fra
ng
ula
cali
forn
ica
Cal
ifo
rnia
coff
eeb
erry
Per
enn
ial
0.8
Het
ero
mel
esa
rbu
tifo
lia
To
yo
nP
eren
nia
l1
.3
Jug
lan
sca
lifo
rnic
av
ar.
hin
dsi
iN
ort
her
nC
Ab
lack
wal
nu
tP
eren
nia
l0
.05
.20
.10
.1
Jug
lan
sre
gia
En
gli
shw
aln
ut
Per
enn
ial
3.1
6.0
3.1
Po
pu
lus
frem
on
tii
Fre
mo
nt
cott
on
wo
od
Per
enn
ial
9.4
22
.2
Pru
nu
sd
ulc
isA
lmo
nd
Per
enn
ial
2.5
0.1
Qu
ercu
sd
ou
gla
sii
Blu
eo
akP
eren
nia
l0
.10
.4
Qu
ercu
slo
ba
taV
alle
yo
akP
eren
nia
l3
.10
.24
.70
.3
Qu
ercu
sw
isli
zen
iIn
teri
or
liv
eo
akP
eren
nia
l0
.1
Sa
lix
exig
ua
Nar
row
-lea
ved
wil
low
Per
enn
ial
0.0
3.1
Sa
lix
laev
iga
taR
edw
illo
wP
eren
nia
l0
.1
Sa
lix
lasi
ole
pis
Arr
oy
ow
illo
wP
eren
nia
l3
.85
.0
Sa
mb
ucu
sm
exic
an
aB
lue
eld
erb
erry
Per
enn
ial
1.7
Her
bac
eou
sn
ativ
eA
ma
ran
thu
sb
lito
ides
Pro
stra
tep
igw
eed
An
nu
al0
.10
.30
.9
Art
emis
iad
ou
gla
sia
na
Cal
ifo
rnia
mu
gw
ort
Per
enn
ial
0.2
1.0
Asc
lep
ias
fasc
icu
lari
sM
exic
anw
ho
rled
mil
kw
eed
Per
enn
ial
0.1
0.1
Ast
ersu
bu
latu
sS
len
der
aste
rA
nn
ual
0.0
Ca
rex
sen
taS
wam
pca
rex
Per
enn
ial
0.2
Ch
am
aes
yce
serp
ylli
foli
aT
hy
me-
leaf
edsp
urg
eA
nn
ual
0.3
0.3
Co
nyz
aca
na
den
sis
Ho
rsew
eed
,C
anad
afl
eab
ane
An
nu
al0
.00
.0
Cro
ton
seti
ger
us
Do
ve
wee
dA
nn
ual
0.0
0.0
0.1
Cyp
eru
ser
ag
rost
isT
all
flat
sed
ge
Per
enn
ial
0.1
0.5
1.3
Da
tisc
ag
lom
era
taD
ura
ng
oro
ot
Per
enn
ial
0.3
Ele
och
ari
sm
acr
ost
ach
yaP
ale
spik
eru
shP
eren
nia
l0
.4
Ely
mu
sg
lau
cus
Blu
ew
ild
rye
Per
enn
ial
0.2
0.3
0.3
0.1
Ep
ilo
biu
mb
rach
yca
rpu
mP
anic
lew
illo
wee
dA
nn
ual
0.3
0.7
0.1
0.4
0.1
Gly
cyrr
hiz
ale
pid
ota
Wil
dli
cori
ceP
eren
nia
l0
.1
Agroforest Syst (2010) 80:41–60 53
123
Ta
ble
6co
nti
nu
ed
Cla
ssifi
cati
on
Sp
ecie
sC
om
mo
nN
ame
Hab
itC
rop
lan
dR
ang
elan
d
AB
CA
BC
Mea
n%
cov
er
Hel
eniu
mp
ub
eru
lum
Sn
eeze
wee
dA
nn
ual
0.3
Hel
iotr
op
ium
cura
ssa
vicu
mS
easi
de
hel
iotr
op
eP
eren
nia
l0
.1
Hem
izo
nia
con
ges
tass
p.
luzu
lifo
lia
Hay
fiel
dta
rwee
dA
nn
ual
0.1
Jun
cus
arc
ticu
sss
p.
litt
ora
lis
Mo
un
tain
rush
Per
enn
ial
0.1
Jun
cus
xip
hio
ides
Iris
leaf
rush
Per
enn
ial
0.3
Ley
mu
str
itic
oid
esB
eard
less
wil
dry
eP
eren
nia
l0
.80
.8
Na
ssel
lap
ulc
hra
Pu
rple
nee
dle
gra
ssP
eren
nia
l0
.20
.60
.10
.1
Na
varr
etia
sp.
(pro
b.
N.
tag
etin
a)
Mar
igo
ldn
avar
reti
aA
nn
ual
0.1
Ph
yla
no
difl
ora
var
.n
od
iflo
raM
atli
pp
iaP
eren
nia
l0
.1
Sch
oen
op
lect
us
cali
forn
icu
sC
alif
orn
iab
ulr
ush
Per
enn
ial
0.2
Sch
oen
op
lect
us
ma
riti
mu
sC
osm
op
oli
tan
bu
lru
shP
eren
nia
l0
.80
.1
Sch
oen
op
lect
us
pu
ng
ens
Co
mm
on
thre
esq
uar
eP
eren
nia
l0
.3
Tri
tele
iala
xaIt
hu
riel
’ssp
ear
Per
enn
ial
0.1
Typ
ha
an
gu
stif
oli
ac
Nar
row
leaf
catt
ail
Per
enn
ial
0.3
Xa
nth
ium
stru
ma
riu
mC
om
mo
nco
ckle
bu
rA
nn
ual
0.0
0.3
0.2
0.5
Leg
um
ino
us
no
n-n
ativ
eM
edic
ag
osa
tiva
Alf
alfa
Per
enn
ial
0.1
0.1
Mel
ilo
tus
ind
ica
Ind
ian
swee
tclo
ver
An
nu
al0
.20
.40
.8
Tri
foli
um
fra
gif
eru
mS
traw
ber
rycl
ov
erP
eren
nia
l0
.01
.3
Tri
foli
um
hir
tum
Ro
secl
ov
erA
nn
ual
1.9
3.3
3.5
Vic
iasa
tiva
Co
mm
on
vet
chA
nn
ual
0.2
0.9
0.3
0.1
Vic
iavi
llo
saH
airy
vet
chP
eren
nia
l0
.00
.21
.42
.35
.4
Inv
asiv
e/n
ox
iou
sw
eed
Aeg
ilo
ps
triu
nci
ali
sB
arb
go
atg
rass
An
nu
al1
6.6
10
.02
.9
Ave
na
ba
rba
taS
len
der
oat
An
nu
al1
.71
.30
.25
.72
.11
.5
Bra
ssic
an
igra
Bla
ckm
ust
ard
An
nu
al0
.00
.1
Bro
mu
sd
ian
dru
sR
ipg
ut
An
nu
al7
.73
.20
.19
.82
.6
Bro
mu
sh
ord
eace
us
So
ftch
ess
An
nu
al0
.30
.03
.63
.31
.4
Ca
rdu
us
pyc
no
cep
ha
lus
Ital
ian
this
tle
An
nu
al0
.10
.50
.12
.00
.9
Cen
tau
rea
sols
titi
ali
sY
ello
wst
arth
istl
eA
nn
ual
0.2
0.9
0.2
13
.36
.76
.9
Co
nvo
lvu
lus
arv
ensi
sF
ield
bin
dw
eed
Per
enn
ial
0.7
2.0
5.3
0.4
0.1
Cyn
od
on
da
ctyl
on
Ber
mu
da
gra
ssP
eren
nia
l0
.40
.63
.19
.1
54 Agroforest Syst (2010) 80:41–60
123

Ta
ble
6co
nti
nu
ed
Cla
ssifi
cati
on
Sp
ecie
sC
om
mo
nN
ame
Hab
itC
rop
lan
dR
ang
elan
d
AB
CA
BC
Mea
n%
cov
er
Cyn
osu
rus
ech
ina
tus
Do
gst
ail
gra
ssA
nn
ual
0.0
0.3
Da
ctyl
isg
lom
era
taO
rch
ard
gra
ssP
eren
nia
l0
.1
Fes
tuca
aru
nd
ina
cea
Tal
lfe
scu
eP
eren
nia
l0
.1
Ho
rdeu
mm
ari
nu
mss
p.
gu
sso
nia
nu
mM
edit
erra
nea
nb
arle
yA
nn
ual
0.2
0.4
0.0
0.3
2.8
2.0
Ho
rdeu
mm
uri
nu
mss
p.
lep
ori
nu
mH
are
bar
ley
An
nu
al0
.10
.1
Hyp
och
aer
isg
lab
raS
mo
oth
cat’
s-ea
rA
nn
ual
0.0
Lep
idiu
mla
tifo
liu
mP
eren
nia
lp
epp
erw
eed
Per
enn
ial
0.2
0.2
Lo
liu
mm
ult
iflo
rum
Ital
ian
ryeg
rass
An
nu
al2
.55
.51
2.6
1.1
6.1
4.9
Lyt
hru
mh
ysso
pif
oli
um
Hy
sso
plo
ose
stri
feA
nn
ual
0.2
Ma
lvel
lale
pro
saA
lkal
im
allo
wP
eren
nia
l0
.20
.10
.10
.3
Ma
rru
biu
mvu
lga
reH
ore
ho
un
dP
eren
nia
l0
.00
.10
.40
.1
Med
ica
go
po
lym
orp
ha
Cal
ifo
rnia
bu
rclo
ver
An
nu
al0
.30
.30
.01
.60
.40
.5
Nic
oti
an
ag
lau
caT
ree
tob
acco
Per
enn
ial
0.0
0.1
Pic
ris
ech
ioid
esO
xto
ng
ue
An
nu
al0
.00
.10
.30
.10
.10
.4
Pip
tath
eru
mm
ilia
ceu
mS
mil
og
rass
Per
enn
ial
1.0
0.9
0.3
Ra
ph
an
us
sati
vus
Rad
ish
An
nu
al0
.0
Ru
bu
sd
isco
lor
Him
alay
anb
lack
ber
ryP
eren
nia
l3
.11
.9
Ru
mex
ace
tose
lla
Red
sorr
elP
eren
nia
l0
.00
.1
Ru
mex
cris
pu
sC
url
yd
ock
Per
enn
ial
0.1
0.1
0.1
0.1
0.1
Sin
ap
isa
rven
sis
Ch
arlo
ckm
ust
ard
An
nu
al0
.15
.73
.5
So
rgh
um
ha
lep
ense
Joh
nso
ng
rass
Per
enn
ial
0.2
4.3
Ta
enia
ther
um
cap
ut-
med
usa
eM
edu
sah
ead
An
nu
al1
6.1
21
.35
.1
To
rili
sa
rven
sis
Hed
gep
arsl
eyA
nn
ual
0.1
0.1
0.6
0.3
Tri
bu
lus
terr
estr
isP
un
ctu
rev
ine
An
nu
al0
.0
Her
bac
eou
sn
on
-nat
iveb
Am
ara
nth
us
alb
us
Tu
mb
lep
igw
eed
An
nu
al0
.20
.00
.0
An
ag
all
isa
rven
sis
Sca
rlet
pim
per
nel
An
nu
al0
.00
.00
.1
An
them
isco
tula
May
wee
dch
amo
mil
eA
nn
ual
0.0
0.0
Ave
na
sati
vaO
atcv
.A
nn
ual
7.3
Agroforest Syst (2010) 80:41–60 55
123

Ta
ble
6co
nti
nu
ed
Cla
ssifi
cati
on
Sp
ecie
sC
om
mo
nN
ame
Hab
itC
rop
lan
dR
ang
elan
d
AB
CA
BC
Mea
n%
cov
er
Bra
chyp
od
ium
dis
tach
yon
Pu
rple
fals
eb
rom
eA
nn
ual
0.1
Bro
mu
sm
ad
rite
nsi
sss
p.
ma
dri
ten
sis
Fo
xta
ilch
ess
An
nu
al1
.00
.81
.60
.2
Ca
pse
lla
bu
rsa-p
ast
ori
sS
hep
her
d’s
pu
rse
An
nu
al0
.3
Ch
eno
po
diu
ma
lbu
mL
amb
squ
arte
rsA
nn
ual
0.0
0.9
0.3
Eu
ph
orb
iase
rpen
sC
reep
ing
spu
rge
An
nu
al0
.3
Ga
liu
mm
ura
leT
iny
bed
stra
wA
nn
ual
0.0
0.0
Ga
liu
mp
ari
sien
seW
all
bed
stra
wA
nn
ual
0.1
0.3
Ger
an
ium
mo
lle
Do
vef
oo
tg
eran
ium
An
nu
al0
.00
.20
.10
.1
Gn
ap
ha
liu
mlu
teo
alb
um
Ev
erla
stin
gcu
dw
eed
An
nu
al0
.00
.1
Ho
rdeu
mvu
lga
ress
p.
vulg
are
Bar
ley
cv.
An
nu
al1
.70
.8
La
ctu
case
rrio
laP
rick
lyle
ttu
ceA
nn
ual
0.2
0.1
0.2
Lyc
op
ersi
con
escu
len
tum
To
mat
ocv
.A
nn
ual
7.7
Ma
lva
nic
aee
nsi
sB
ull
mal
low
An
nu
al0
.20
.30
.2
Po
lyg
on
um
are
na
stru
mC
om
mo
nk
no
twee
dA
nn
ual
0.1
Po
lyg
on
um
arg
yro
cole
on
Sil
ver
shea
thk
no
twee
dA
nn
ual
0.0
0.0
0.0
Po
lyp
og
on
mo
nsp
elie
nsi
sA
nn
ual
rab
bit
sfo
ot
gra
ssA
nn
ual
0.0
5.3
Po
rtu
laca
ole
race
aC
om
mo
np
urs
lan
eA
nn
ual
0.0
0.2
Ru
mex
den
tatu
sT
oo
thed
do
ckA
nn
ual
0.1
0.1
Ru
mex
ob
tusi
foli
us
Bro
adle
afd
ock
Per
enn
ial
0.1
Sil
ene
ga
llic
aE
ng
lish
catc
hfl
yA
nn
ual
0.1
So
nch
us
ole
race
us
An
nu
also
wth
istl
eA
nn
ual
0.3
0.3
0.1
0.1
0.1
To
rili
sn
od
osa
Kn
ott
edh
edg
epar
sley
An
nu
al0
.1
Tra
go
po
go
np
orr
ifo
liu
sS
alsi
fyA
nn
ual
0.1
Tri
ticu
ma
esti
vum
Wh
eat
cv.
An
nu
al7
.3
Ver
ben
ali
tora
lis
Sea
sho
rev
erv
ain
Per
enn
ial
0.1
Ver
on
ica
per
sica
Per
sian
spee
dw
ell
An
nu
al0
.00
.0
Zea
ma
ysC
orn
cv.
An
nu
al1
.9
aA
llar
en
ativ
eex
cep
tJ.
reg
iaan
dP
.d
ulc
isb
Ex
clu
din
gle
gu
mes
and
no
xio
us
wee
ds
cN
ativ
eto
Can
ada,
bu
tp
oss
ibly
nat
ura
lize
din
Cal
ifo
rnia
(Hic
km
an1
99
3;
US
DA
-NR
CS
20
09
)
56 Agroforest Syst (2010) 80:41–60
123

Ta
ble
7W
eig
hte
dav
erag
eso
ilp
rop
erti
esfo
rto
p1
00
cmac
cord
ing
top
osi
tio
nfr
om
wat
erw
ay(A
=ag
ricu
ltu
ral
fiel
d,
B=
flo
od
pla
inb
ench
,C
=ch
ann
eled
ge)
and
two
lan
d
use
typ
esin
the
Sac
ram
ento
Val
ley
,C
alif
orn
ia
Po
siti
on
fro
mw
ater
way
Lan
du
sety
pe
P*
LU
A(n
=2
0)
B(n
=2
0)
C(n
=2
0)
Sig
.C
rop
lan
d(n
=3
6)
Ran
gel
and
(n=
24
)S
ig.
Sig
.
NO
3-
–N
(lg
g-
1)
3.8
5±
1.0
73
.83
±1
.12
2.6
8±
1.0
5N
S5
.44
±0
.88
a0
.48
±0
.18
b*
**
NS
NH
4?
–N
(lg
g-
1)
0.6
6±
0.0
7ab
1.0
2±
0.2
9a
0.6
3±
0.0
7b
*0
.57
±0
.05
b1
.08
±0
.24
a**
NS
To
tal
N(%
)0
.08
±0
.00
a0
.07
±0
.00
ab0
.06
±0
.01
b*
*0
.07
±0
.00
0.0
6±
0.0
1N
S*
To
tal
C(%
)0
.69
±0
.04
0.6
7±
0.0
40
.66
±0
.04
NS
0.6
2±
0.0
3b
0.7
4±
0.0
4a
*N
S
C:N
rati
o9
.32
±0
.61
b1
0.3
8±
0.5
9ab
12
.41
±1
.53
a**
9.5
4±
0.4
21
2.4
6±
1.2
8N
S**
Ols
en-P
(lg
g-
1)
11
.85
±2
.81
11
.82
±1
.67
10
.44
±1
.31
NS
12
.69
±1
.07
a9
.40
±2
.39
b*
NS
B(l
gg
-1)
0.3
9±
0.1
00
.22
±0
.05
0.2
8±
0.0
5N
S0
.46
±0
.05
a0
.06
±0
.03
b*
**
**
*
Ex
ch-K
(meq
/10
0g
)0
.47
±0
.03
0.4
9±
0.0
30
.43
±0
.03
NS
0.4
6±
0.0
20
.47
±0
.03
NS
*
Ex
ch-N
a(m
eq/1
00
g)
0.3
8±
0.0
8ab
0.2
0±
0.0
4b
0.5
1±
0.1
6a
*0
.33
±0
.05
0.4
1±
0.1
3N
S**
Ex
ch-C
a(m
eq/1
00
g)
15
.18
±1
.10
14
.42
±0
.72
15
.56
±0
.83
NS
13
.48
±0
.35
b1
7.4
1±
1.0
1a
**
NS
Ex
ch-M
g(m
eq/1
00
g)
7.4
5±
0.5
96
.46
±0
.56
7.4
3±
0.3
9N
S7
.26
±0
.28
6.9
0±
0.6
3N
SN
S
pH
6.9
6±
0.1
0b
7.1
2±
0.1
4b
7.5
0±
0.1
3a
**
*7
.14
±0
.09
7.2
7±
0.1
4N
S**
Cla
y(%
)2
1.1
±0
.9a
17
.3±
1.0
b1
6.7
±0
.9b
**
*1
8.9
±0
.71
7.6
±1
.1N
S**
Sil
t(%
)5
8.4
±1
.1a
53
.8±
1.8
b5
3.2
±2
.3b
**
57
.6±
1.2
51
.4±
1.7
NS
*
San
d(%
)2
0.6
±1
.8b
28
.8±
2.7
a3
0.1
±3
.1a
**
*2
3.5
±1
.83
1.1
±2
.7N
S*
Mea
n(±
SE
)si
gn
ifica
nce
isin
dic
ated
for
each
mai
nef
fect
inth
e2
-way
AN
OV
A,
and
the
inte
ract
ion
of
the
two
term
s:P
B0
.00
1=
**
*;
B0
.01
=*
*;
B0
.05
=*
.M
ean
sw
ith
the
sam
ele
tter
are
no
tsi
gn
ifica
ntl
yd
iffe
ren
tin
Tu
key
com
par
iso
ns
ata
=0
.05
lev
el
Agroforest Syst (2010) 80:41–60 57
123

References
Anderson JM (2000) Food web functioning and ecosystem
properties: problems and perception of scaling. In: Cole-
man DC, Hendrix PF (eds) Invertebrates as webmasters in
ecosystems. CAB International, Wallingford, UK, pp 3–24
Anderson MJ (2001) A new method for non-parametric mul-
tivariate analysis of variance. Aust Ecol 26:32–46
ARE-UC Davis (2008) Current cost and return studies. Agri-
cultural and resource economics. University of California,
Davis. http://coststudies.ucdavis.edu/current.php. Acces-
sed 17 Dec 2008
Balvanera P, Pfisterer AB, Buchmann N, He J-S, Nakashizuka
T, Raffaelli D, Schmid B (2006) Quantifying the evidence
for biodiversity effects on ecosystem functioning and
services. Ecol Lett 9:1146–1156
Barbour M, Pavlik B, Drysdale F, Lindstron S (1993) Cali-
fornia’s changing landscapes: diversity and conservation
of California vegetation. California Native Plant Society,
Sacramento
Bardgett RD (2005) The biology of soil: a community and
ecosystem approach. Oxford University Press, UK
Barker KR (1985) Nematode extraction and bioassays. In:
Carter KR, Carter CC, Sasser JN (eds) An advanced
treatise on Meloidogyne. North Carolina State University
Graphics, Raleigh, pp 19–35
Blake GR, Hartge KH (1986) Bulk density. In: Klute A (ed)
Methods of soil analysis: part 1 physical and mineralogical
methods. ASA Monographs, Madison, WI, pp 364–367
Bongers T, Bongers M (1998) Functional diversity of nema-
todes. Appl Soil Ecol 10:239–251
Bossio DA, Scow KM (1998) Impacts of carbon and flooding
on soil microbial communities: phospholipid fatty acid
profiles and substrate utilization patterns. Microb Ecol
35:265–278
Bouwman LA, Zwart KB (1994) The ecology of bacterivorous
protozoans and nematodes in arable soil. Agric Ecosyst
Environ 51:145–160
Brodt S, Klonsky K, Jackson L, Brush SB, Smukler S (2009)
Factors affecting adoption of hedgerows and other bio-
diversity-enhancing features on farms in California, USA.
Agrofor Syst 76:195–206
Brussaard L, de Ruiter PC, Brown GG (2007) Soil biodiversity
for agricultural sustainability. Agric Ecosyst Environ
121:233–244
Cairns MA, Brown S, Helmer EH, Baumgardner GA (1997)
Root biomass allocation in the world’s upland forests.
Oecologia 111:1–11
California Climate Action Registry (2007) Forest project pro-
tocol version 2.1. http://www.climateregistry.org/resou
rces/docs/protocols/industry/forest/forest_project_protocol_
version_2.1_sept2007.pdf. Accessed 15 Nov 2008
CNPS Vegetation Committee (2000) CNPS releve protocol.
California Native Plant Society, Sacramento
Culman SW, Young-Mathews A, Hollander AD, Ferris H,
Sanchez-Moreno S, O’Geen AT, Jackson LE (in press)
Biodiversity is associated with indicators of soil ecosys-
tem functions over a landscape gradient of agricultural
intensification. Landscape Ecol. doi:10.1007/s10980-010-
9511-0
De Deyn GB, Van der Putten WH (2005) Linking aboveground
and belowground diversity. Trends Ecol Evol 20:625–633
Drenovsky RE, Steenwerth KL, Jackson LE, Scow KM (2009)
Land use and climate factors structure regional patterns in
soil microbial communities. Global Ecol Manag 19:27–39
Dufrene M, Legendre P (1997) Species assemblages and
indicator species: the need for a flexible asymmetrical
approach. Ecol Monogr 67:345–366
Eshel G, Levy GJ, Mingelgrin U, Singer MJ (2004) Critical
evaluation of the use of laser diffraction for particle-size
distribution analysis. Soil Sci Soc Am J 68:736–743
Ferris H, Matute MM (2003) Structural and functional suc-
cession in the nematode fauna of a soil food web. Appl
Soil Ecol 23:93–110
Ferris H, Bongers T, de Goede RGM (2001) A framework for
soil food web diagnostics: extension of the nematode
faunal analysis concept. Appl Soil Ecol 18:13–29
Forster JC (1995) Soil nitrogen. In: Alef K, Nannipieri P (eds)
Methods in applied soil microbiology and biochemistry.
Academic Press, San Diego, pp 79–87
Gerard M, El Kahloun M, Rymen J, Beauchard O, Meire P
(2008) Importance of mowing and flood frequency in
promoting species richness in restored floodplains. J Appl
Ecol 45:1780–1789
Giese LAB, Aust WM, Kolka RK, Trettin CC (2003) Biomass
and carbon pools of disturbed riparian forests. For Ecol
Manag 180:493–508
Hickman JC (ed) (1993) The Jepson manual: higher plants of
California. University of California Press, Berkeley
Hill AR (1996) Nitrate removal in stream riparian zones.
J Environ Qual 25:743–755
Holland EA, Coleman DC (1987) Litter placement effects on
microbial and organic matter dynamics in an agroeco-
system. Ecology 68:425–433
Jenkins JC, Chojnacky DC, Heath LS, Birdsey RA (2003)
National-scale biomass estimators for United States tree
species. For Sci 49:12–35
Jordan N, Boody G, Broussard W, Glover JD, Keeney D,
McCown BH, McIsaac G, Muller M, Murray H, Neal J,
Pansing C, Turner RE, Warner K, Wyse D (2007) Envi-
ronment - sustainable development of the agricultural bio-
economy. Science 316:1570–1571
Lenz R, Eisenbeis G (2000) Short-term effects of different
tillage in a sustainable farming system on nematode
community structure. Biol Fertl Soils 31:237–244
Liu ZF, Liu GH, Fu BJ, Zheng XX (2008) Relationship
between plant species diversity and soil microbial func-
tional diversity along a longitudinal gradient in temperate
grasslands of Hulunbeir, Inner Mongolia, China. Ecol Res
23:511–518
Lovell ST, Sullivan WC (2006) Environmental benefits of
conservation buffers in the United States: evidence,
promise, and open questions. Agric Ecosyst Environ
112:249–260
Mantel N (1967) Detection of disease clustering and a gen-
eralized regression approach. Cancer Res 27:209–220
Marquez CO, Cambardella CA, Isenhart TM, Schultz RC
(1999) Assessing soil quality in a riparian buffer by
testing organic matter fractions in central Iowa, USA.
Agrofor Syst 44:133–140
58 Agroforest Syst (2010) 80:41–60
123

McCune B, Grace JB (2002) Analysis of ecological commu-
nities. MjM Software Design, Gleneden Beach, OR
Millennium Ecosystem Assessment (2005) Ecosystems and
human well-being: biodiversity synthesis. World Resour-
ces Institute, Washington DC
Minoshima H, Jackson LE, Cavagnaro TR, Sanchez-Moreno S,
Ferris H, Temple SR, Mitchell JP (2007) Soil food webs
and carbon dynamics in response to conservation tillage in
legume rotations in California. Soil Sci Soc Am J
71:952–963
Miranda KM, Espey MG, Wink DA (2001) A rapid, simple
spectrophotometric method for simultaneous detection of
nitrate and nitrite. Nitric Oxide-Biol Chem 5:62–71
Naiman RJ, Decamps H, Pollock M (1993) The role of riparian
corridors in maintaining regional biodiversity. Ecol Appl
3:209–212
Neher DA, Wu J, Barbercheck ME, Anas O (2005) Ecosystem
type affects interpretation of soil nematode community
measures. Appl Soil Ecol 30:47–64
Papatheodorou EM, Argyropoulou MD, Stamou GP (2004)
The effects of large- and small-scale differences in soil
temperature and moisture on bacterial functional diversity
and the community of bacterivorous nematodes. Appl Soil
Ecol 25:37–49
Peterjohn WT, Correll DL (1984) Nutrient dynamics in an
agricultural watershed: observations on the role of a
riparian forest. Ecology 65:1466–1475
Porazinska DL, Bardgett RD, Blaauw MB, Hunt HW, Parsons
AN, Seastedt TR, Wall DH (2003) Relationships at the
aboveground-belowground interface: plants, soil biota,
and soil processes. Ecol Monogr 73:377–395
Potthoff M, Steenwerth KL, Jackson LE, Drenovsky RE, Scow
KM, Joergensen RG (2006) Soil microbial community
composition as affected by restoration practices in
California grassland. Soil Biol Biochem 38:1851–1860
R Development Core Team (2008) R: a language and envi-
ronment for statistical computing. R Foundation for Sta-
tistical Computing, Vienna, Austria
Richardson DM, Holmes PM, Esler KJ, Galatowitsch SM,
Stromberg JC, Kirkman SP, Pysek P, Hobbs RJ (2007)
Riparian vegetation: degradation, alien plant invasions,
and restoration prospects. Divers Distrib 13:126–139
Roberts WG, Howe JG and Major J (1980) A survey of riparian
forest flora and fauna in California. In: Sands A (ed)
Riparian forests in California: their ecology and conser-
vation. University of California, Davis, pp 3–20
Robins P, Holmes RB, Laddish K (2001) Bringing farm edges
back to life. Yolo County Resource Conservation District,
Woodland, CA
Rowe EC, Van Noordwijk M, Suprayogo D, Cadisch G (2005)
Nitrogen use efficiency of monoculture and hedgerow
intercropping in the humid tropics. Plant Soil 268:61–74
Sanchez-Moreno S, Smukler S, Ferris H, O’Geen AT, Jackson
LE (2008) Nematode diversity, food web condition, and
chemical and physical properties in different soil habitats
of an organic farm. Biol Fertl Soils 44:727–744
Sawyer JO, Keeler-Wolf T (1995) Manual of California veg-
etation. California Native Plant Society, Sacramento
Schoeneberger PJ, Wysocki DA, Benham EC and Broderson
WD (eds) (2002) Field book for describing and sampling
soils, version 2.0. Natural Resources Conservation Ser-
vice, USDA, National Soil Survey Center, Lincoln, NE
Six J, Frey SD, Thiet RK, Batten KM (2006) Bacterial and
fungal contributions to carbon sequestration in agroeco-
systems. Soil Sci Soc Am J 70:555–569
Smukler SM, Jackson LE, Sanchez-Moreno S, Fonte SJ, Ferris
H, Klonsky K, O’Geen AT, Scow KM, and Steenwerth
KL (submitted) Biodiversity and multiple ecosystem
functions in an organic farmscape. Agric Ecosyst Env
Soil Survey Staff (2009) National soil survey characterization
data. USDA-NRCS, Soil Survey Laboratory, National
Soil Survey Center, Lincoln, NE
Steenwerth KL, Jackson LE, Calderon FJ, Stromberg MR,
Scow KM (2003) Soil community composition and land
use history in cultivated and grassland ecosystems of
coastal California. Soil Biol Biochem 35:487–500
Swift MJ, Izac AMN, van Noordwijk M (2004) Biodiversity
and ecosystem services in agricultural landscapes: are we
asking the right questions? Agric Ecosyst Environ 104:
113–134
Tscharntke T, Klein AM, Kruess A, Steffan-Dewenter I, Thies
C (2005) Landscape perspectives on agricultural intensi-
fication and biodiversity - ecosystem service management.
Ecol Lett 8:857–874
Tufekcioglu A, Raich JW, Isenhart TM, Schultz RC (1998)
Fine root dynamics, coarse root biomass, root distribution,
and soil respiration in a multispecies riparian buffer in
Central Iowa, USA. Agrofor Syst 44:163–174
USDA (2001) Rangeland soil quality: compaction. USDA
Natural Resources Conservation Service. http://www.nys
envirothon.org/Soils_CD/sq_info/RSQIS4.pdf. Accessed 2
Feb 2009
USDA-NRCS (2009) California state-listed noxious weeds. In:
The PLANTS database. National Plant Data Center, Baton
Rouge, LA. http://plants.usda.gov. Accessed 7 Jun 2009
Viketoft M, Bengtsson J, Sohlenius B, Berg MP, Petchey O,
Palmborg C, Huss-Danell K (2009) Long-term effects of
plant diversity and composition on soil nematode com-
munities in model grasslands. Ecology 90:90–99
Waldrop MP, Zak DR, Blackwood CB, Curtis CD, Tilman D
(2006) Resource availability controls fungal diversity
across a plant diversity gradient. Ecol Lett 9:1127–1135
Ward TA, Tate KW and Atwill ER (2003) Visual Assessment
of Riparian Health. Rangeland monitoring series. UC
ANR, Davis, CA
Wardle DA, Yeates GW, Barker GM, Bonner KI (2006) The
influence of plant litter diversity on decomposer abun-
dance and diversity. Soil Biol Biochem 38:1052–1062
Winward AH (2000) Monitoring the vegetation resources in
riparian areas. U.S. Department of Agriculture, Forest
Service, Rocky Mountain Research Station, Ogden, UT
WRCC (2009) Western Regional Climate Center. http://www.
wrcc.dri.edu/cgi-bin/cliMAIN.pl?ca9781. Accessed 29
May 2009
Yeates GW, Bongers T, Degoede RGM, Freckman DW,
Georgieva SS (1993) Feeding habits in soil nematode
families and genera: an outline for soil ecologists.
J Nematol 25:315–331
Zak DR, Holmes WE, White DC, Peacock AD, Tilman D
(2003) Plant diversity, soil microbial communities, and
Agroforest Syst (2010) 80:41–60 59
123

ecosystem function: are there any links? Ecology
(Washington DC) 84:2042–2050
Zelenev VV, Berkelmans R, van Bruggen AHC, Bongers T,
Semenov AM (2004) Daily changes in bacterial-feeding
nematode populations oscillate with similar periods as
bacterial populations after a nutrient impulse in soil. Appl
Soil Ecol 26:93–106
60 Agroforest Syst (2010) 80:41–60
123
Related Documents