Plant-induced changes in soil chemistry do not explain differences in uranium transfer L. Duque `ne a, * , H. Vandenhove a , F. Tack b , E. Van der Avoort c , M. Van Hees a , J. Wannijn a a SCK-CEN, Radioecology Section, Boeretang 200, B-2400 Mol, Belgium b Ghent University, Laboratory for Analytical Chemistry and Applied Ecochemistry, Coupure Links 653, B-9000 Gent, Belgium c Katholieke Hogeschool Kempen, Department of Health-Care and Chemistry, Kleinhoefstraat 4, B-2440 Geel, Belgium Received 19 September 2005; received in revised form 26 April 2006; accepted 3 June 2006 Available online 24 July 2006 Abstract A greenhouse experiment was set up with maize, ryegrass, Indian mustard, wheat and pea to evaluate to what extent differences in uranium (U) transfer factors can be explained by root-mediated changes in selected soil properties. The experiment involved an acid and an alkaline soil contaminated with 238 U. U soil-to-shoot transfer factors (TFs) ranged between 0.0005 and 0.021 on the acid soil and between 0.007 and 0.179 on the alkaline soil. Indian mustard showed the highest U uptake in shoots and maize the lowest. The root TFs, only available for the acid soil, ranged from 0.58 for maize and Indian mustard to 1.38 for rye- grass. The difference in U uptake between the two soils and the five plants was only partially explained by the different initial U concentrations in soil solution or differences in soil properties in the two soils. However, we obtained a significant relation for differences in shoot TFs observed between the two soils when relating shoot TFs with concentration of UO 2 2þ and uranyl carbonate complexes in soil solution (R 2 ¼ 0.88). The physiolog- ical mechanisms by which root-to-shoot U transfer is inhibited or promoted seemed at least as important as the plant-induced changes in soil characteristics in determining soil-to-shoot TFs. Ó 2006 Elsevier Ltd. All rights reserved. Keywords: Uranium; Transfer factor; Soil characteristics; Maize; Pea; Wheat; Indian mustard; Ryegrass * Corresponding author. Tel.: þ32 14332116; fax: þ32 14321056. E-mail address: [email protected] (L. Duque `ne). 0265-931X/$ - see front matter Ó 2006 Elsevier Ltd. All rights reserved. doi:10.1016/j.jenvrad.2006.06.001 Journal of Environmental Radioactivity 90 (2006) 1e14 www.elsevier.com/locate/jenvrad

Welcome message from author
This document is posted to help you gain knowledge. Please leave a comment to let me know what you think about it! Share it to your friends and learn new things together.
Transcript
Journal of Environmental Radioactivity 90 (2006) 1e14www.elsevier.com/locate/jenvrad
Plant-induced changes in soil chemistry do notexplain differences in uranium transfer
L. Duquene a,*, H. Vandenhove a, F. Tack b, E. Van der Avoort c,M. Van Hees a, J. Wannijn a
a SCK-CEN, Radioecology Section, Boeretang 200, B-2400 Mol, Belgiumb Ghent University, Laboratory for Analytical Chemistry and Applied Ecochemistry,
Coupure Links 653, B-9000 Gent, Belgiumc Katholieke Hogeschool Kempen, Department of Health-Care and Chemistry,
Kleinhoefstraat 4, B-2440 Geel, Belgium
Received 19 September 2005; received in revised form 26 April 2006; accepted 3 June 2006
Available online 24 July 2006
Abstract
A greenhouse experiment was set up with maize, ryegrass, Indian mustard, wheat and pea to evaluateto what extent differences in uranium (U) transfer factors can be explained by root-mediated changes inselected soil properties. The experiment involved an acid and an alkaline soil contaminated with 238U.
U soil-to-shoot transfer factors (TFs) ranged between 0.0005 and 0.021 on the acid soil and between 0.007and 0.179 on the alkaline soil. Indian mustard showed the highest U uptake in shoots and maize the lowest.The root TFs, only available for the acid soil, ranged from 0.58 for maize and Indian mustard to 1.38 for rye-grass. The difference in U uptake between the two soils and the five plants was only partially explained by thedifferent initial U concentrations in soil solution or differences in soil properties in the two soils. However, weobtained a significant relation for differences in shoot TFs observed between the two soils when relating shootTFs with concentration of UO2
2þ and uranyl carbonate complexes in soil solution (R2¼ 0.88). The physiolog-ical mechanisms by which root-to-shoot U transfer is inhibited or promoted seemed at least as important asthe plant-induced changes in soil characteristics in determining soil-to-shoot TFs.� 2006 Elsevier Ltd. All rights reserved.
Keywords: Uranium; Transfer factor; Soil characteristics; Maize; Pea; Wheat; Indian mustard; Ryegrass
* Corresponding author. Tel.: þ32 14332116; fax: þ32 14321056.
E-mail address: [email protected] (L. Duquene).
0265-931X/$ - see front matter � 2006 Elsevier Ltd. All rights reserved.
doi:10.1016/j.jenvrad.2006.06.001
2 L. Duquene et al. / J. Environ. Radioactivity 90 (2006) 1e14
1. Introduction
Uranium (U) is one of the most common radionuclides contaminating groundwater and sur-face soils (Riley et al., 1992). Effects of U to humans apart from the damage by ionizing radi-ation mimic those of lead and result mainly in renal diseases. Moreover, insoluble Ucompounds are carcinogenic (Hossner et al., 1998). Improper management of U contaminatedsoils may cause significant toxicological hazards via the food chain.
The behavior of U in soils is complex. Uranium can be associated with numerous mineralsand phases in soils, such as sulfates, phosphates, carbonates, oxides, hydroxides and clay min-erals. Uranium availability is pH dependent because of changes in solution speciation and insurface species and charge. At low pH where the uranyl cation UO2
2þ predominates (Ebbset al., 1998), sorption is weak. Under near neutral conditions, hydroxide and phosphate U com-plexes are likely to exist (Langmuir, 1978) while highly soluble uranyl carbonates dominate athigh pH (Gobran et al., 2001). Sheppard et al. (1989) reported that background U concentra-tions in soils tend to increase with cation exchange capacity (CEC) and/or organic matter con-tent. Organic matter and clay minerals provide exchange sites and as such are expected toincrease sorption of UO2
2þ and other positively charged U species. In soils with high phosphatecontent, U (VI) may precipitate as uranyl phosphate (Duff and Amrhein, 1996).
Uranium uptake has been studied for native plant species grown on contaminated sites (Ibra-him and Whicker, 1988; Pande et al., 1993) and for crops and vegetables (Ebbs et al., 1998;Saric et al., 1995). It is generally observed that plants vary greatly in their U uptake capacities.
The presence of plants is likely to affect U mobility in the soil. Rhizospheric soil has sig-nificantly different properties than the bulk soil (Gobran et al., 2001). Ions in the rhizospheremay either be depleted or accumulated, pH may change and trace elements may be complexedby root exudates (siderophores or organic acids) (Hernlem et al., 1999; Marschner, 2002). Al-though as yet there are no specific studies about the direct influence of the rhizosphere on Usoil-to-plant transfer, it is generally accepted that rhizosphere processes play a significant role.
The objectives of this study were (i) to screen the TFs of five plant species differing in theirreported U uptake characteristics and uptake strategy in case of trace elements deficiencies(strategy I and strategy II plants); and (ii) to elucidate differences in TFs observed in relationto soil characteristics and plant-induced changes in the soil environment.
The five plant species used in this study included three monocotyledonous (graminaceous) andtwo dicotyledonous species. Selection of the plants was based on reported TFs and difference intrace element uptake strategy. Graminaceous plants (strategy II plants) release siderophores in therhizosphere in order to mobilize micronutrients (Gobran et al., 2001; Marschner, 2002). Sidero-phores may also affect U availability (Hernlem et al., 1999). Dicotyledonous and monocotyledon-ous species (except graminaceous species) show an enhanced excretion of protons, reducing andchelating agents when under trace element deficiencies (strategy I) (Marschner, 2002).
Maize is a traditional field crop, with an important biomass production. This plant speciesshowed medium values for U TFs in shoots (Huang et al., 1998; Shahandeh and Hossner,2002b), and roots (Chen et al., 2005; Shahandeh and Hossner, 2002b). Wheat was reportedto show low root and shoot U TFs (Shahandeh and Hossner, 2002b). For ryegrass, the thirdmonocotyledonous species in our study, Shahandeh and Hossner (2002b) found similar shootTFs but slightly higher root TFs than for wheat.
Characteristic to numerous species from the Brassicaceae family, Indian mustard effectivelyaccumulates various heavy metals and radionuclides in higher quantities than many other spe-cies (Ramaswami et al., 2001; Shahandeh and Hossner, 2002b). This plant produces a relatively
3L. Duquene et al. / J. Environ. Radioactivity 90 (2006) 1e14
high biomass. Pea, as a member of the Fabaceae family, represents the last plant species of ourstudy. Huang et al. (1998) found similar U uptake in shoots for pea and Indian mustard but Ebbset al. (1998) showed that, despite a lower U concentration in shoots, pea accumulated more U inaerial parts than Indian mustard due to a higher biomass production.
2. Materials and methods
2.1. Soils
The surface layer of two soils, consisting of the first 10 cm after removal of the root mat, was collected.The soils were selected based on distinct characteristics in pH, clay content, organic matter and oxalate ex-tractable iron. The first soil, which will be referred to as the ‘‘acid soil’’, originated from the Belgian Campineregion (Plaggept). The second soil, the ‘‘alkaline soil’’, is from the Belgian Loam region (typic Hapludalf).
Soils were air-dried, and ground to pass a 2-mm sieve. Texture was determined according to the pipettemethod (Day, 1965). Organic matter content was estimated by loss on ignition after heating at 550 �C dur-ing 48 h. Cation exchange capacity (CEC) was determined according to Chhabra et al. (1975). Total P wasmeasured using ICP-OES (Optima 3300 DV, Perkin-Elmer) after borate fusion according to Vo€ınovitch(1988). All analyses were performed in triplicate.
Soils were also analysed for their nutritional status. Organic carbon was estimated using the Walkleyand Black method (Walkley and Black, 1934) and measured by a METROHM-titrator. Soil extracts wereprepared with the EgnereRiehm method (Egner et al., 1960). Ca2þ, Mg2þ, and Kþ were measured byAAS (Pye Unicam) on the extracted solution after addition of 1% LaCl3. P was analysed by spectropho-tometry (Beckmans mod. 35) and Na by flame emission spectrophotometry (FES). Based on the results ofthese analyses, a fertilizer advice (NPK) was made up for ryegrass by the Belgian Soil Science Service(Heverlee, Belgium). Although five different plants were considered in the transfer experiment, the fertil-izer regime for ryegrass was maintained for all the plants to exclude potential effects from differences inamendments. Per 3000 g soil, 0.55 g KH2PO4, 0.70 g K2HPO4, 3.95 g KNO3 and 2.70 g NH4NO3 wereapplied to the acid soil and 1.72 g KNO3 and 4.07 g NH4NO3 to the alkaline soil.
For each soil type, five batches of about 9 kg of soil were moistened using distilled water to 50% of thesaturation point (Jackson, 1965), fertilized and contaminated with 300 Bq kg�1 (24.1 mg kg�1) 238U (VI)added as uranyl nitrate hexahydrate (UO2(NO3)2$6H2O), considering a specific activity of 12 436 Bq g�1
(Joint Evaluated File (JEF) version 2.2, OECD/NEA Data Bank, Paris, France). ConcentratedUO2(NO3)2$6H2O was diluted to obtain an activity of 300 Bq kg�1 and mixed with fertilizer in deionizedwater. Quantities of total added deionized water were calculated to bring the soils to the selected moisturecontent. Soils were mechanically homogenized in each batch of 9 kg (homogenization time: 5 min). Theelectric mixer comprised of a professional drilling machine (Bosch, 800 W) equipped with a 60 cm axisand a 11 cm long mixing head (efficient volume¼ 1250 cm3). Soils were incubated for 3 weeks prior tosowing. During this period, moisture content was maintained by weighing the batches daily and adjustingto initial weight with deionized water. The soils were also homogenized and aerated by manual mixing toprevent anaerobic conditions from being established. At the end of the incubation period the soils wereanalysed for major ion concentrations and pH. Soil pH was measured in H2O (1:2.5 solid:liquid ratio,2 h shaking, electrode model 910-600, ATI ORION, Boston) and concentrations of Ca2þ, Mg2þ andKþ were measured in 1 M ammonium acetate extracts (NH4OAc, 1:18 solid:liquid ratio, 24 h shaking)at pH 7 and analysed by atomic absorption spectrometry (AAS, model GBC 932 AA, GBC ScientificEquipment Pty Ltd, Victoria, Australia). Available P was determined following 0.5 M sodium bicarbonateextraction at pH 8.5 (0.5:20 solid:liquid ratio, 30 min shaking). The soluble P in the extraction solutionwas quantified by colorimetry using the molybdate blue method (Watanabe and Olson, 1965). AmorphousFe was extracted with oxalate (Blackmore et al., 1987).
To collect the soil solution, soil at 50% of the saturation point was put on a grid covered with a No. 42Whatman filter paper in the inner chamber of a double-chambered centrifuge tube. The tubes were
4 L. Duquene et al. / J. Environ. Radioactivity 90 (2006) 1e14
centrifuged at 5520 g for 30 min. The soil solution collected at the bottom of the outer chamber was fil-tered through a 0.45 mm membrane filter (Acrodisc syringe filter, Pall Corporation, MI, USA), diluted to20 mL and kept at 4 �C till analysis. The concentrations of Ca2þ, Mg2þ and Kþ in soil solution were mea-sured by AAS and the concentrations of HPO4
2�, SO42� and NO3
� by high pressure ion chromatography(DIONEX DX-320, DIONEX Corporation, Sunnyvale, CA, USA).
Uranium was measured in the soil solution and exchangeable U was determined following extraction in1 M ammonium acetate (1:18 solid:liquid ratio, 24 h shaking) at pH 7. Supernatants were filtered overa 2.5 mm filter paper (S & S Blue ribbon 5893). Total U content was measured following borate fusion at1000 �C (Vo€ınovitch, 1988). Finely ground soil samples were well mixed with Li-metaborate and tetraborateand calcinated at 1000 �C for 5 min. The fusion beads were dissolved in hot 2 M HNO3. Uranium concentra-tions in soil solution and chemical extracts were determined by inductively coupled plasma mass spectrometry(ICP-MS, Perkin-Elmer, Elan 5000) using a cross-flow nebulizer and a Ryton spray chamber. Uranium stan-dard solutions (0e10 mg L�1) used for calibration were prepared with elemental standard SPEX solutions(SPEX industries, New Jersey, USA). The instrumental detection limit of U was 10 ng L�1. Typical precisionfor the samples indicated variation below 5% (relative standard deviation, 10 replicates).
At the end of the experiment, pots were dismantled and the soil of each treatment unit was reanalysedfor all parameters except for texture, CEC, organic matter, total P and total U. All analyses were per-formed in at least three replicates.
2.2. Plant culture
After 3 weeks of incubation, about 3000 g (2800 g for ryegrass and Indian mustard) of contaminatedsoil at 50% of the saturation point was transferred to a 3-L pot. Three replicates were prepared for eachsoil type and plant species. Maize (Zea mais cv. Anjou 230), wheat (Triticum aestivum cv. Baldus), rye-grass (Lolium perenne cv. Melvina), Indian mustard (Brassica juncea cv. Vitasso) and pea (Pisum sativumcv. Kalife) seeds were sown on top. Quantities of seeds used were 8, 50, 210, 12 and 1750 seeds for maize,wheat, ryegrass, pea and Indian mustard, respectively. Maize, wheat and pea seeds were inserted at 1.5 cmdepth. Ryegrass and Indian mustard were evenly distributed on the soil surface and covered with 200 g ofmoist, U-enriched soil.
The 30 pots (two soils, five plants, three replicates) were randomly placed on a greenhouse bench. Theaverage greenhouse temperature was 20� 2 �C, with a 12 h/12 h day/night lighting cycle. The averagelight intensity at canopy height was 296 mmol of photons m�2 s�1. The pots were weighed and the soilbrought to 50% of the saturation point with deionized water every day. Pots were randomized aftereach water addition. After 7 weeks, all plants were harvested except for the ryegrass which was harvestedtwice, at 5 and 10 weeks (R1 and R2, respectively). Shoots were cut 1 cm above the soil surface to min-imise contamination by soil and fresh weights were recorded. For the acid soil, most roots were retrievedfrom the soil by hand picking. Hand picking of roots was not possible in the alkaline soil because of thevery compact structure of the soil. Root washing in distilled water was selected as a reference method(Chen et al., 2005; Shahandeh and Hossner, 2002b). Roots retrieved from the acid soil were washed inthree batches of distilled water to remove adhering soil, blotted dry and weighed. All plant sampleswere dried at 70 �C until constant weight (maximum duration 7 days) and dry weights were recorded.Plant samples were ashed at 550 �C in a muffle furnace (Carbolite CWF 11/23). The ashes were then dis-solved in 37% HCl (Donohue and Friedericks, 1984) and diluted in deionized water before filtrationthrough a No. 42 Whatman filter paper. Samples were kept at 4 �C before analysis for total 238U contentby ICP-MS (Perkin-Elmer Elan 5000).
2.3. Statistical analysis and U speciation calculations
Statistical analysis (ANOVA, linear regression, correlation) of data was performed using Statistica forWindows version 6.0. Significant differences were considered at p¼ 0.05 and mean values were rankedwith Tukey’s multiple range test when more than two groups were compared with ANOVA.
5L. Duquene et al. / J. Environ. Radioactivity 90 (2006) 1e14
Uranium speciation calculations were performed using the geochemical computer code The Geoche-mist’s Workbench� database Pro 5.04 (Bethke, 2001) and the NEA thermodynamic data review byGrenthe et al. (1992), considering soil solution U, anionic and cationic composition, and pH.
3. Results
3.1. Soil parameters
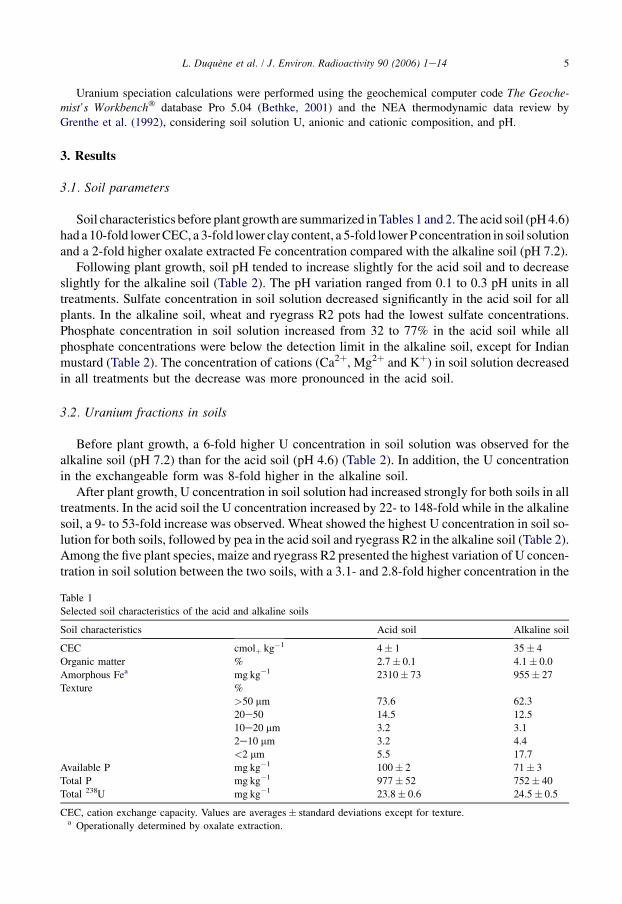
Soil characteristics before plant growth are summarized in Tables 1 and 2. The acid soil (pH 4.6)had a 10-fold lower CEC, a 3-fold lower clay content, a 5-fold lower P concentration in soil solutionand a 2-fold higher oxalate extracted Fe concentration compared with the alkaline soil (pH 7.2).
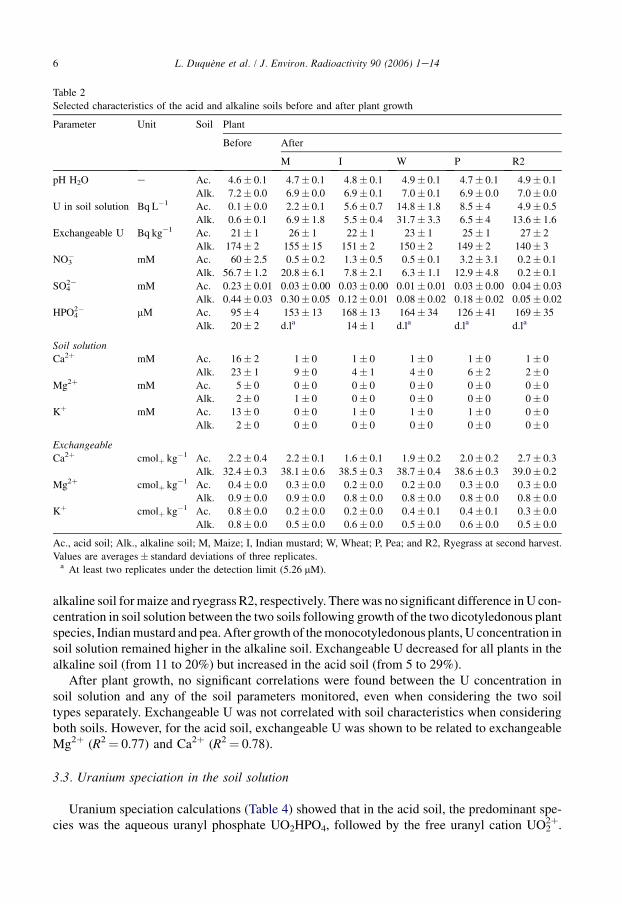
Following plant growth, soil pH tended to increase slightly for the acid soil and to decreaseslightly for the alkaline soil (Table 2). The pH variation ranged from 0.1 to 0.3 pH units in alltreatments. Sulfate concentration in soil solution decreased significantly in the acid soil for allplants. In the alkaline soil, wheat and ryegrass R2 pots had the lowest sulfate concentrations.Phosphate concentration in soil solution increased from 32 to 77% in the acid soil while allphosphate concentrations were below the detection limit in the alkaline soil, except for Indianmustard (Table 2). The concentration of cations (Ca2þ, Mg2þ and Kþ) in soil solution decreasedin all treatments but the decrease was more pronounced in the acid soil.
3.2. Uranium fractions in soils
Before plant growth, a 6-fold higher U concentration in soil solution was observed for thealkaline soil (pH 7.2) than for the acid soil (pH 4.6) (Table 2). In addition, the U concentrationin the exchangeable form was 8-fold higher in the alkaline soil.
After plant growth, U concentration in soil solution had increased strongly for both soils in alltreatments. In the acid soil the U concentration increased by 22- to 148-fold while in the alkalinesoil, a 9- to 53-fold increase was observed. Wheat showed the highest U concentration in soil so-lution for both soils, followed by pea in the acid soil and ryegrass R2 in the alkaline soil (Table 2).Among the five plant species, maize and ryegrass R2 presented the highest variation of U concen-tration in soil solution between the two soils, with a 3.1- and 2.8-fold higher concentration in the
Table 1
Selected soil characteristics of the acid and alkaline soils
Soil characteristics Acid soil Alkaline soil
CEC cmolþ kg�1 4� 1 35� 4
Organic matter % 2.7� 0.1 4.1� 0.0
Amorphous Fea mg kg�1 2310� 73 955� 27
Texture %
>50 mm 73.6 62.3
20e50 14.5 12.5
10e20 mm 3.2 3.1
2e10 mm 3.2 4.4
<2 mm 5.5 17.7
Available P mg kg�1 100� 2 71� 3
Total P mg kg�1 977� 52 752� 40
Total 238U mg kg�1 23.8� 0.6 24.5� 0.5
CEC, cation exchange capacity. Values are averages� standard deviations except for texture.a Operationally determined by oxalate extraction.
6 L. Duquene et al. / J. Environ. Radioactivity 90 (2006) 1e14
alkaline soil for maize and ryegrass R2, respectively. There was no significant difference in U con-centration in soil solution between the two soils following growth of the two dicotyledonous plantspecies, Indian mustard and pea. After growth of the monocotyledonous plants, U concentration insoil solution remained higher in the alkaline soil. Exchangeable U decreased for all plants in thealkaline soil (from 11 to 20%) but increased in the acid soil (from 5 to 29%).
After plant growth, no significant correlations were found between the U concentration insoil solution and any of the soil parameters monitored, even when considering the two soiltypes separately. Exchangeable U was not correlated with soil characteristics when consideringboth soils. However, for the acid soil, exchangeable U was shown to be related to exchangeableMg2þ (R2¼ 0.77) and Ca2þ (R2¼ 0.78).
3.3. Uranium speciation in the soil solution
Uranium speciation calculations (Table 4) showed that in the acid soil, the predominant spe-cies was the aqueous uranyl phosphate UO2HPO4, followed by the free uranyl cation UO2
2þ.
Table 2
Selected characteristics of the acid and alkaline soils before and after plant growth
Parameter Unit Soil Plant
Before After
M I W P R2
pH H2O e Ac. 4.6� 0.1 4.7� 0.1 4.8� 0.1 4.9� 0.1 4.7� 0.1 4.9� 0.1
Alk. 7.2� 0.0 6.9� 0.0 6.9� 0.1 7.0� 0.1 6.9� 0.0 7.0� 0.0
U in soil solution Bq L�1 Ac. 0.1� 0.0 2.2� 0.1 5.6� 0.7 14.8� 1.8 8.5� 4 4.9� 0.5
Alk. 0.6� 0.1 6.9� 1.8 5.5� 0.4 31.7� 3.3 6.5� 4 13.6� 1.6
Exchangeable U Bq kg�1 Ac. 21� 1 26� 1 22� 1 23� 1 25� 1 27� 2
Alk. 174� 2 155� 15 151� 2 150� 2 149� 2 140� 3
NO3� mM Ac. 60� 2.5 0.5� 0.2 1.3� 0.5 0.5� 0.1 3.2� 3.1 0.2� 0.1
Alk. 56.7� 1.2 20.8� 6.1 7.8� 2.1 6.3� 1.1 12.9� 4.8 0.2� 0.1
SO42� mM Ac. 0.23� 0.01 0.03� 0.00 0.03� 0.00 0.01� 0.01 0.03� 0.00 0.04� 0.03
Alk. 0.44� 0.03 0.30� 0.05 0.12� 0.01 0.08� 0.02 0.18� 0.02 0.05� 0.02
HPO42� mM Ac. 95� 4 153� 13 168� 13 164� 34 126� 41 169� 35
Alk. 20� 2 d.la 14� 1 d.la d.la d.la
Soil solution
Ca2þ mM Ac. 16� 2 1� 0 1� 0 1� 0 1� 0 1� 0
Alk. 23� 1 9� 0 4� 1 4� 0 6� 2 2� 0
Mg2þ mM Ac. 5� 0 0� 0 0� 0 0� 0 0� 0 0� 0
Alk. 2� 0 1� 0 0� 0 0� 0 0� 0 0� 0
Kþ mM Ac. 13� 0 0� 0 1� 0 1� 0 1� 0 0� 0
Alk. 2� 0 0� 0 0� 0 0� 0 0� 0 0� 0
Exchangeable
Ca2þ cmolþ kg�1 Ac. 2.2� 0.4 2.2� 0.1 1.6� 0.1 1.9� 0.2 2.0� 0.2 2.7� 0.3
Alk. 32.4� 0.3 38.1� 0.6 38.5� 0.3 38.7� 0.4 38.6� 0.3 39.0� 0.2
Mg2þ cmolþ kg�1 Ac. 0.4� 0.0 0.3� 0.0 0.2� 0.0 0.2� 0.0 0.3� 0.0 0.3� 0.0
Alk. 0.9� 0.0 0.9� 0.0 0.8� 0.0 0.8� 0.0 0.8� 0.0 0.8� 0.0
Kþ cmolþ kg�1 Ac. 0.8� 0.0 0.2� 0.0 0.2� 0.0 0.4� 0.1 0.4� 0.1 0.3� 0.0
Alk. 0.8� 0.0 0.5� 0.0 0.6� 0.0 0.5� 0.0 0.6� 0.0 0.5� 0.0
Ac., acid soil; Alk., alkaline soil; M, Maize; I, Indian mustard; W, Wheat; P, Pea; and R2, Ryegrass at second harvest.
Values are averages� standard deviations of three replicates.a At least two replicates under the detection limit (5.26 mM).
7L. Duquene et al. / J. Environ. Radioactivity 90 (2006) 1e14
The high P levels in the soil solution (Table 2) explain why UO2HPO4 is the dominant speciesat the low soil pH of the acid soil. In the alkaline soil, the negatively charged uranyl carbonatecomplexes dominated.
3.4. Plant parameters
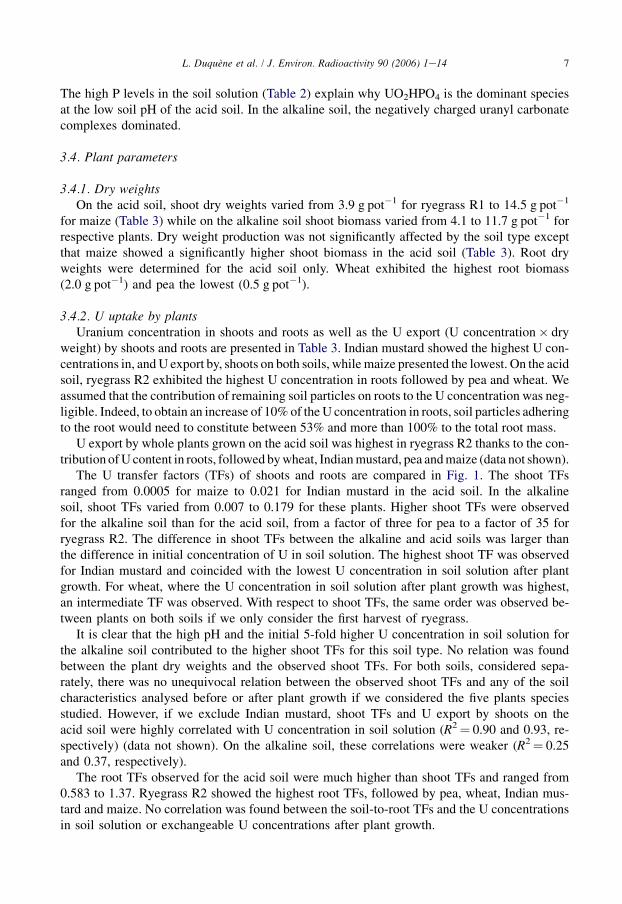
3.4.1. Dry weightsOn the acid soil, shoot dry weights varied from 3.9 g pot�1 for ryegrass R1 to 14.5 g pot�1
for maize (Table 3) while on the alkaline soil shoot biomass varied from 4.1 to 11.7 g pot�1 forrespective plants. Dry weight production was not significantly affected by the soil type exceptthat maize showed a significantly higher shoot biomass in the acid soil (Table 3). Root dryweights were determined for the acid soil only. Wheat exhibited the highest root biomass(2.0 g pot�1) and pea the lowest (0.5 g pot�1).
3.4.2. U uptake by plantsUranium concentration in shoots and roots as well as the U export (U concentration� dry
weight) by shoots and roots are presented in Table 3. Indian mustard showed the highest U con-centrations in, and U export by, shoots on both soils, while maize presented the lowest. On the acidsoil, ryegrass R2 exhibited the highest U concentration in roots followed by pea and wheat. Weassumed that the contribution of remaining soil particles on roots to the U concentration was neg-ligible. Indeed, to obtain an increase of 10% of the U concentration in roots, soil particles adheringto the root would need to constitute between 53% and more than 100% to the total root mass.
U export by whole plants grown on the acid soil was highest in ryegrass R2 thanks to the con-tribution of U content in roots, followed by wheat, Indian mustard, pea and maize (data not shown).
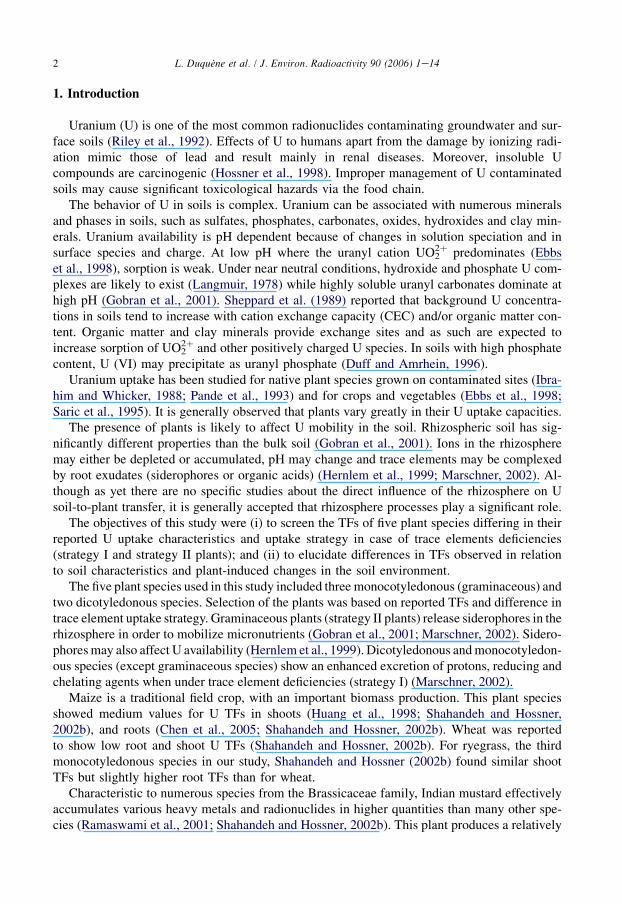
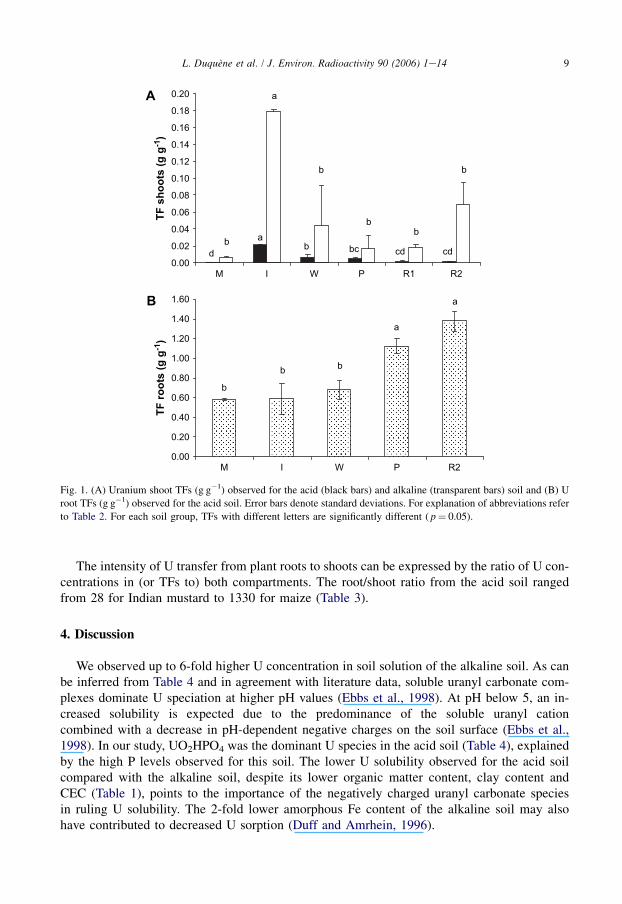
The U transfer factors (TFs) of shoots and roots are compared in Fig. 1. The shoot TFsranged from 0.0005 for maize to 0.021 for Indian mustard in the acid soil. In the alkalinesoil, shoot TFs varied from 0.007 to 0.179 for these plants. Higher shoot TFs were observedfor the alkaline soil than for the acid soil, from a factor of three for pea to a factor of 35 forryegrass R2. The difference in shoot TFs between the alkaline and acid soils was larger thanthe difference in initial concentration of U in soil solution. The highest shoot TF was observedfor Indian mustard and coincided with the lowest U concentration in soil solution after plantgrowth. For wheat, where the U concentration in soil solution after plant growth was highest,an intermediate TF was observed. With respect to shoot TFs, the same order was observed be-tween plants on both soils if we only consider the first harvest of ryegrass.
It is clear that the high pH and the initial 5-fold higher U concentration in soil solution forthe alkaline soil contributed to the higher shoot TFs for this soil type. No relation was foundbetween the plant dry weights and the observed shoot TFs. For both soils, considered sepa-rately, there was no unequivocal relation between the observed shoot TFs and any of the soilcharacteristics analysed before or after plant growth if we considered the five plants speciesstudied. However, if we exclude Indian mustard, shoot TFs and U export by shoots on theacid soil were highly correlated with U concentration in soil solution (R2¼ 0.90 and 0.93, re-spectively) (data not shown). On the alkaline soil, these correlations were weaker (R2¼ 0.25and 0.37, respectively).
The root TFs observed for the acid soil were much higher than shoot TFs and ranged from0.583 to 1.37. Ryegrass R2 showed the highest root TFs, followed by pea, wheat, Indian mus-tard and maize. No correlation was found between the soil-to-root TFs and the U concentrationsin soil solution or exchangeable U concentrations after plant growth.
Table 3
Shoot and roo oot ratio of U concentrations
Plant compar
P R1 R2
Shoots .9� 0.2 5.6� 0.9 3.9� 0.5 4.3� 0.5
.6� 1 6.6� 0.4 4.1� 0.5 5.8� 1.2
6� 0.03 0.13� 0.04 0.03� 0.00 0.04� 0.01
8� 0.38 0.42� 0.09 0.45� 0.02 1.70� 0.66
2� 0.23 0.73� 0.07 0.12� 0.02 0.18� 0.04
7� 2.17 2.71� 0.42 1.82� 0.29 10.41� 6.32
Roots .0� 0.7 0.5� 0.1 n.a 0.9� 0.2
.2� 2.3 27.6� 1.7 n.a 33.1� 2.5
.9� 10.3 14.4� 2.6 n.a 28.2� 4.2
Whole plant 1 212 n.a 827
Values are ave ass at first harvest; for explanation of other abbreviations see Table 2.
8L
.D
uqueneet
al./
J.E
nviron.R
adioactivity90
(2006)1e
14
t dry weights (g pot�1), U concentrations (mg kg�1 DW) and U export (mg pot�1), root/sh
tment Parameter Soil Plant
M I W
DW Ac. 14.5� 0.2 9.3� 1.3 6
Alk. 11.7� 0.3 6.3� 0.9 7
U concentration Ac. 0.01� 0.00 0.50� 0.07 0.1
Alk. 0.16� 0.07 4.46� 1.17 1.0
U export Ac. 0.18� 0.02 4.73� 1.32 1.1
Alk. 1.89� 0.74 28.12� 7.74 8.0
DW Ac. 1� 0.2 0.8� 0.1 2
U concentration Ac. 13.3� 0.2 13.9� 3.6 16
U export Ac. 12.8� 1.9 11.4� 1.9 31
Root/shoot ratio Ac. 1330 28 10
rages� standard deviations of three replicates. DW, dry weight; n.a, non available; R1, Ryegr
9L. Duquene et al. / J. Environ. Radioactivity 90 (2006) 1e14
The intensity of U transfer from plant roots to shoots can be expressed by the ratio of U con-centrations in (or TFs to) both compartments. The root/shoot ratio from the acid soil rangedfrom 28 for Indian mustard to 1330 for maize (Table 3).
4. Discussion
We observed up to 6-fold higher U concentration in soil solution of the alkaline soil. As canbe inferred from Table 4 and in agreement with literature data, soluble uranyl carbonate com-plexes dominate U speciation at higher pH values (Ebbs et al., 1998). At pH below 5, an in-creased solubility is expected due to the predominance of the soluble uranyl cationcombined with a decrease in pH-dependent negative charges on the soil surface (Ebbs et al.,1998). In our study, UO2HPO4 was the dominant U species in the acid soil (Table 4), explainedby the high P levels observed for this soil. The lower U solubility observed for the acid soilcompared with the alkaline soil, despite its lower organic matter content, clay content andCEC (Table 1), points to the importance of the negatively charged uranyl carbonate speciesin ruling U solubility. The 2-fold lower amorphous Fe content of the alkaline soil may alsohave contributed to decreased U sorption (Duff and Amrhein, 1996).
0.00
0.02
0.04
0.06
0.08
0.10
0.12
0.14
0.16
0.18
0.20
R1 R2
TF
sh
oo
ts (g
g
-1)
A
0.00
0.20
0.40
0.60
0.80
1.00
1.20
1.40
1.60
M I W P
M I W P R2
TF
ro
ots (g
g
-1)
B
db a
a
b
b
bc
b
cd
b
cd
b
a
a
bb
b
Fig. 1. (A) Uranium shoot TFs (g g�1) observed for the acid (black bars) and alkaline (transparent bars) soil and (B) U
root TFs (g g�1) observed for the acid soil. Error bars denote standard deviations. For explanation of abbreviations refer
to Table 2. For each soil group, TFs with different letters are significantly different ( p¼ 0.05).
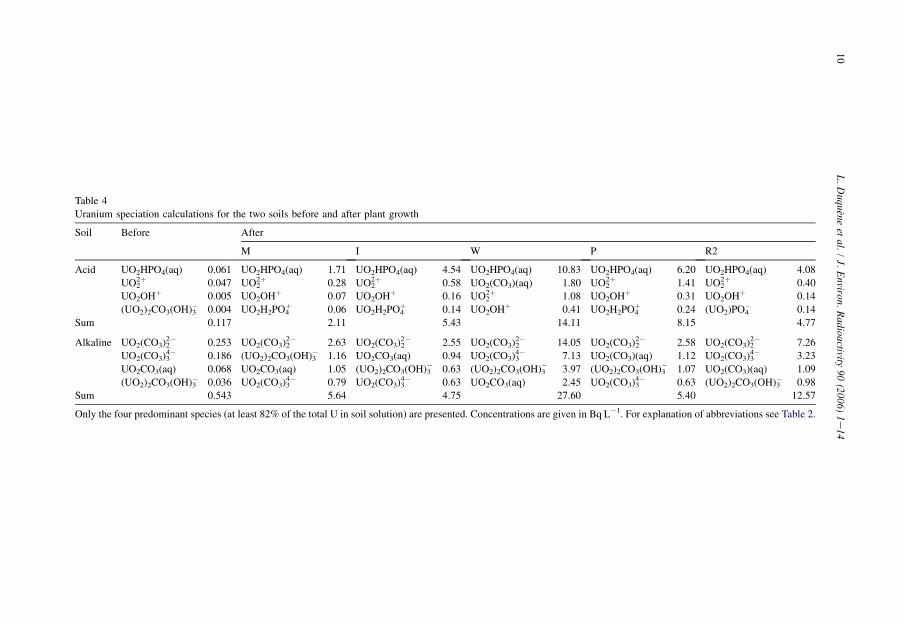
Table 4
Uranium sp
Soil B
P R2
Acid U 10.83 UO2HPO4(aq) 6.20 UO2HPO4(aq) 4.08
U 1.80 UO22þ 1.41 UO2
2þ 0.40
U 1.08 UO2OHþ 0.31 UO2OHþ 0.14
( 0.41 UO2H2PO4þ 0.24 (UO2)PO4
� 0.14
Sum 14.11 8.15 4.77
Alkaline U 14.05 UO2(CO3)22� 2.58 UO2(CO3)2
2� 7.26
U 7.13 UO2(CO3)(aq) 1.12 UO2(CO3)34� 3.23
U )3� 3.97 (UO2)2CO3(OH)3
� 1.07 UO2(CO3)(aq) 1.09
( 2.45 UO2(CO3)34� 0.63 (UO2)2CO3(OH)3
� 0.98
Sum 27.60 5.40 12.57
Only the fou re given in Bq L�1. For explanation of abbreviations see Table 2.
10
L.
Duquene
etal.
/J.
Environ.
Radioactivity
90(2006)
1e14
eciation calculations for the two soils before and after plant growth
efore After
M I W
O2HPO4(aq) 0.061 UO2HPO4(aq) 1.71 UO2HPO4(aq) 4.54 UO2HPO4(aq)
O22þ 0.047 UO2
2þ 0.28 UO22þ 0.58 UO2(CO3)(aq)
O2OHþ 0.005 UO2OHþ 0.07 UO2OHþ 0.16 UO22þ
UO2)2CO3(OH)3� 0.004 UO2H2PO4
þ 0.06 UO2H2PO4þ 0.14 UO2OHþ
0.117 2.11 5.43
O2(CO3)22� 0.253 UO2(CO3)2
2� 2.63 UO2(CO3)22� 2.55 UO2(CO3)2
2�
O2(CO3)34� 0.186 (UO2)2CO3(OH)3
� 1.16 UO2CO3(aq) 0.94 UO2(CO3)34�
O2CO3(aq) 0.068 UO2CO3(aq) 1.05 (UO2)2CO3(OH)3� 0.63 (UO2)2CO3(OH
UO2)2CO3(OH)3� 0.036 UO2(CO3)3
4� 0.79 UO2(CO3)34� 0.63 UO2CO3(aq)
0.543 5.64 4.75
r predominant species (at least 82% of the total U in soil solution) are presented. Concentrations a
11L. Duquene et al. / J. Environ. Radioactivity 90 (2006) 1e14
In agreement with results from previous studies (Shahandeh and Hossner, 2002b), we ob-tained higher shoot TFs for the alkaline soil than for the acid soil. These results are only par-tially explained by the higher U concentration in soil solution in the alkaline soil. Actually up to38-fold difference in shoot TFs observed for both soils (Fig. 1A) was higher than the differencein U concentrations in soil solution (up to 6-fold before plant growth and up to 3-fold after plantgrowth) or in the exchangeable form (around 7-fold) (Table 2). Relating the ratio of the shootTFs observed for both soils with the difference in U concentrations in soil solution, we obtaineda non-significant relation (R2¼ 0.35). Vandenhove et al. (in press) concluded that apparentlyUO2
2þ, uranyl carbonate complexes and UO2PO4� are the U species being preferentially taken
up by the roots and transferred to the shoots. Relating the ratio of the shoot TFs observed forboth soils with the ratio of concentration of UO2
2þ, uranyl carbonate complexes and UO2PO4�,
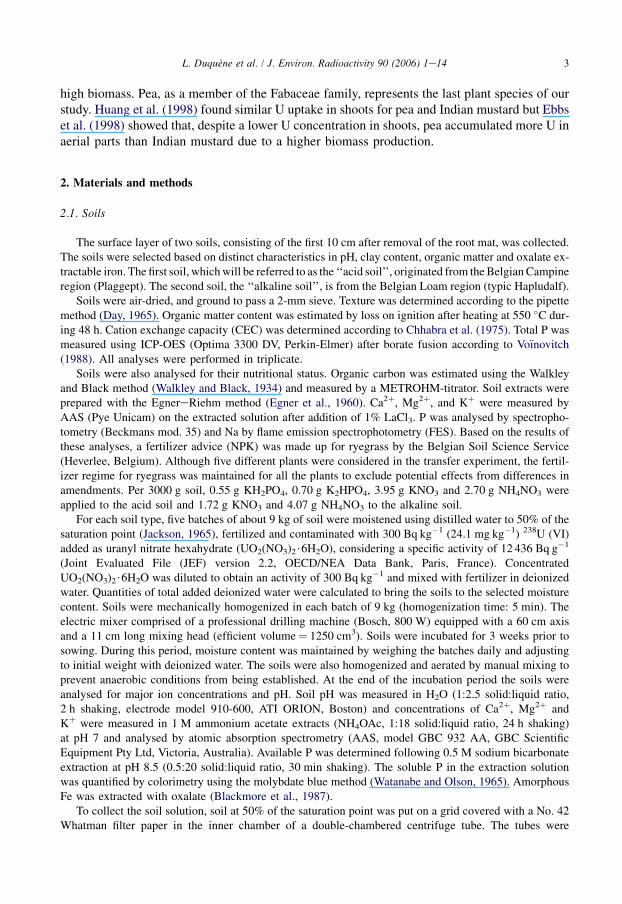
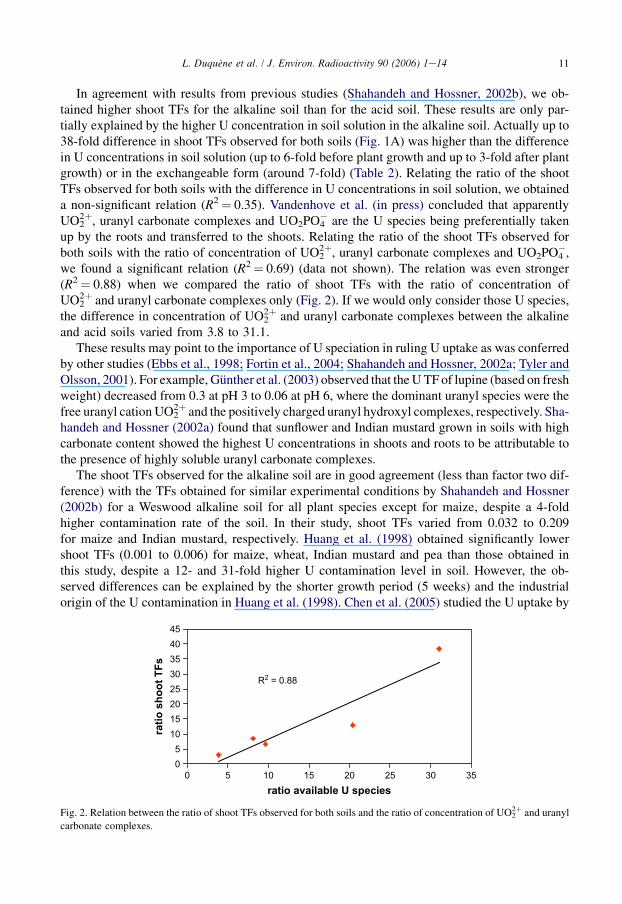
we found a significant relation (R2¼ 0.69) (data not shown). The relation was even stronger(R2¼ 0.88) when we compared the ratio of shoot TFs with the ratio of concentration ofUO2
2þ and uranyl carbonate complexes only (Fig. 2). If we would only consider those U species,the difference in concentration of UO2
2þ and uranyl carbonate complexes between the alkalineand acid soils varied from 3.8 to 31.1.
These results may point to the importance of U speciation in ruling U uptake as was conferredby other studies (Ebbs et al., 1998; Fortin et al., 2004; Shahandeh and Hossner, 2002a; Tyler andOlsson, 2001). For example, Gunther et al. (2003) observed that the U TF of lupine (based on freshweight) decreased from 0.3 at pH 3 to 0.06 at pH 6, where the dominant uranyl species were thefree uranyl cation UO2
2þ and the positively charged uranyl hydroxyl complexes, respectively. Sha-handeh and Hossner (2002a) found that sunflower and Indian mustard grown in soils with highcarbonate content showed the highest U concentrations in shoots and roots to be attributable tothe presence of highly soluble uranyl carbonate complexes.
The shoot TFs observed for the alkaline soil are in good agreement (less than factor two dif-ference) with the TFs obtained for similar experimental conditions by Shahandeh and Hossner(2002b) for a Weswood alkaline soil for all plant species except for maize, despite a 4-foldhigher contamination rate of the soil. In their study, shoot TFs varied from 0.032 to 0.209for maize and Indian mustard, respectively. Huang et al. (1998) obtained significantly lowershoot TFs (0.001 to 0.006) for maize, wheat, Indian mustard and pea than those obtained inthis study, despite a 12- and 31-fold higher U contamination level in soil. However, the ob-served differences can be explained by the shorter growth period (5 weeks) and the industrialorigin of the U contamination in Huang et al. (1998). Chen et al. (2005) studied the U uptake by
R2 = 0.88
05
1015202530354045
0 5 10 15 20 25 30 35ratio available U species
ratio
sh
oo
t T
Fs
Fig. 2. Relation between the ratio of shoot TFs observed for both soils and the ratio of concentration of UO22þ and uranyl
carbonate complexes.
12 L. Duquene et al. / J. Environ. Radioactivity 90 (2006) 1e14
maize, perennial ryegrass and Indian mustard on an alkaline soil mixed with material from Utailings. Their shoot TFs ranged from 0.008 to 0.013 for the three plants, which was a morenarrow range than that obtained in our experiment and in Shahandeh and Hossner (2002b).
Contrary to Shahandeh and Hossner (2002b) and in agreement with Chen et al. (2005), wedid not find a significant or consistently higher U uptake by dicotyledonous compared to mono-cotyledonous species. Rufyikiri et al. (2003) showed that differences in root uptake could pos-sibly be traced back by the potential action of mycorrhizes. However, in our experiment we didnot observe a significant difference in concentration of U in roots between non-mycorrhizal(e.g. Indian mustard) and mycorrhizal species (e.g. maize).
The major plant-induced change in the soil environment was the significant increase in Uconcentration in soil solution. However, induced differences in U concentration in soil solutionor in exchangeable U fraction for a given soil could not explain the variation in TFs found forthat soil. For example, the highest shoot TF was observed for Indian mustard for which the Uconcentration in soil solution was the lowest. Though we obtained a better relation for differ-ences in shoot TFs observed between the alkaline and acid soils when relating uptake with con-centration of UO2
2þ and uranyl carbonate complexes (Fig. 2), differences in observedconcentrations of those U species assumed available for uptake did not explain the differencesobserved for the shoot (or root) TFs between different plant species for a given soil. Only whenexcluding the data for Indian mustard, significant linear relations were observed between theshoot TFs and the U concentration in soil solution (or the concentration of available U species)(R2¼ 0.90 and 0.88, respectively) and this for the acid soil only. It is not clear so far why theobservations for Indian mustard are not in line with the observations for the other crops in thissoil. Despite the fact that the roots are in direct contact with the soil solution or soil matrix,surprisingly, no correlations were found between the U concentration in soil solution (or con-centration of available U species or exchangeable U fraction) and the transfer to the roots (sameresult when excluding the data for Indian mustard).
The results obtained for the acid soil point to the importance of plant physiological charac-teristics in governing observed shoot TFs. The U concentrations in soil solution after plantgrowth varied by about 7-fold between the plant species studied, the root TFs only 2-fold,but the shoot TFs 42-fold. This indicates that the difference in the observed shoot concentra-tions or shoot TFs is influenced to a larger extent by plant physiological characteristics thanby plant-induced changes in the soil chemistry. Data for Indian mustard clearly show this.Both U concentration in soil solution (Table 2) and root TF (Fig. 1) were among the lowest,whereas the shoot TF was the highest (Fig. 1). The ratios of U concentrations in roots andshoots clearly show the difference in U translocation from roots to shoots between plants. Theseratios vary 48-fold: from 28 for Indian mustard to 1330 for maize. The physiological mecha-nisms by which root-to-shoot transfer of U is inhibited or promoted are as yet unknown. Animproved knowledge on U distribution and forms in roots (precipitated at root surface, incor-porated as granules in the root cytoplasm or in vacuoles (Laroche, 2005)) may yield importantinformation on which fraction of U located in roots is available for transfer.
5. Conclusions
In agreement with previous studies, higher shoot TFs were observed for the alkaline soil,corresponding with higher concentrations of soluble U. Indian mustard showed the highestsoil-to-shoot TFs on both soils, but not the highest root TF, which indicates that activephysiological mechanisms are important in U translocation. These mechanisms by which
13L. Duquene et al. / J. Environ. Radioactivity 90 (2006) 1e14
root-to-shoot transfer of U is inhibited or promoted should be further studied to betterunderstand the different TFs obtained between plant species.
Neither the differences in U concentration and/or speciation in soil solution, nor the otherplant-induced changes in analysed soil parameters were sufficient to explain the differencesin U TFs between plants observed in this study. However, we obtained a better relation for dif-ferences in shoot TFs observed between the alkaline and acid soils when relating shoot TFswith concentration of UO2
2þ and uranyl carbonate complexes than with total U concentrationin soil solution.
References
Bethke, C.M., 2001. The Geochemist’s Workbench�, Release 3.2. A User’s Guide to Rxn, Act2, Tact, React and Gtplot.
Hydrogeology Program. University of Illinois, Urbana, IL, USA.
Blackmore, L.C., Searle, P.L., Daly, B.K., 1987. Methods for Chemical Analysis of Soils. New Zealand Soil Bureau of
Science. Soil Bureau, Lower Hutt, New Zealand. Report 80.
Chen, S.B., Zhu, Y.G., Hu, Q.H., 2005. Soil to plant transfer of 238U, 226Ra and 232Th on a uranium mining-impacted
soil from southeastern China. Journal of Environmental Radioactivity 82, 223e236.
Chhabra, R., Pleysier, J., Cremers, A., 1975. The measurement of the cation exchange capacity and exchangeable
cations in soils: a new method. In: Bailey, S.W. (Ed.), Proceedings of the International Clay Conference, Mexico.
Applied Science Publishers, London, pp. 439e449.
Day, P.R., 1965. Particle fraction and particle size analysis. In: Black, C.A., Evans, D.D., White, J.L., Ensmiger, L.E.,
Clark, F.E. (Eds.), Methods of Soil Analysis e Part 1 e Physical and Mineralogical Properties, Including Statistics
of Measurements and Sampling. American Society of Agronomy, Wisconsin, USA, pp. 556e561.
Donohue, S.J., Friedericks, J.B., 1984. Laboratory Procedures. Soil Testing and Plant Analysis Laboratory, Virginia
Technical Publication.
Duff, M.C., Amrhein, C., 1996. U (VI) sorption on goethite and soil in carbonate solutions. Soil Science Society of
America Journal 60, 1393e1400.
Ebbs, S.D., Brady, D.J., Kochian, L.V., 1998. Role of U speciation in the uptake and the translocation of uranium by
plants. Journal of Experimental Botany 49, 1183e1190.
Egner, H., Riehm, H., Domingo, W.R., 1960. Untersuchungen uber die chemische Boden-analyse als Grundlage fur die
Beurteilung des Nahrstoffzustandes der Boden. Kungliga Lantbrukshogskolans Annaler 26, 199e215.
Fortin, C., Dutel, L., Garnier-Laplace, J., 2004. Uranium complexation and uptake by green algae in relation to chem-
ical speciation: the importance of the free uranyl ion. Environmental Toxicology and Chemistry 23 (4), 974e981.
Gobran, R.G., Wenzel, W.W., Lombi, E., 2001. Trace Elements in the Rhizosphere. CRC Press, Boca Raton/London/
New York/Washington, DC.
Grenthe, I., Furger, J., Konings, R.J.M., Lemire, R.J., Muller, A.B., Nguy-en-Trung, C., Wanner, H., 1992. Chemical
Thermodynamics of Uranium (NEAeOECD Ed.). Elsevier, Amsterdam.
Gunther, A., Bernhard, G., Geipel, G., Reich, T., Rossberg, A., Nitsche, H., 2003. Uranium speciation in plants. Radio-
chimica Acta 91 (6), 319e328.
Hernlem, B.J., Vane, L.M., Sayles, G.D., 1999. The application of siderophores for metal recovery and waste remedi-
ation: examination of correlations for prediction of metal affinities. Water Research 33 (4), 951e960.
Hossner, L.R., Loeppert, R.H., Newton, R.J., Szaniszlo, P.J., 1998. Literature Review: Phytoaccumulation of Chromium,
Uranium, and Plutonium in Plant Systems. Amarillo National Resource Centre for Plutonium, Springfield, VA, p. 51.
Huang, J.W., Blaylock, M.J., Kapulnik, Y., Ensley, B.D., 1998. Phytoremediation of uranium contaminated soils: role of
organic acids in triggering hyperaccumulation in plants. Environmental Science and Technology 32, 2004e2008.
Ibrahim, S.A., Whicker, F.W., 1988. Comparative uptake of U and Th by native plants at a U production site. Health
Physics 54 (4), 413e419.
Jackson, M.L., 1965. Soil Chemical Analysis. Prentice-Hall, Englewood Cliffs, NJ.
Langmuir, D., 1978. Uranium solutionemineral equilibria at low temperature with applications to sedimentary ore de-
posits. Geochimica et Cosmochimica Acta 42, 547e569.
Laroche, L., 2005. Transfert racinaire de l’uranium (VI) en solution chez une plante superieure: speciation en solution
hydroponique, prise en charge par la plante, microlocalisation et effets biologiques induits. These de doctorat. Uni-
versite d’Aix-Marseille I specialite Biosciences de l’Environnement, Chimie et Sante, 21 janvier 2005, p. 241.
14 L. Duquene et al. / J. Environ. Radioactivity 90 (2006) 1e14
Marschner, H., 2002. Mineral Nutrition of Higher Plants, second ed. Academic Press, London, UK.
Pande, S.K., Deshmukh, A.N., Shrivastava, P.K., 1993. The significance of the dormant stage in the growth-cycle of
deciduous plants for biogeochemical uranium prospecting, India. Journal of Geochemical Exploration 46, 365e374.
Ramaswami, A., Carr, P., Burkhardt, M., 2001. Plant-uptake of uranium: hydroponic and soil-system studies. Interna-
tional Journal of Phytoremediation 3 (2), 189e201.
Riley, R.J., Zachara, J.M., Wobber, F.J., 1992. Chemical contaminants on DOE lands and selection of contaminant mix-
tures for subsurface science research DOE/ER-0547T. DOE Office of Energy Research Report.
Rufyikiri, G., Thiry, Y., Declerck, S., 2003. Contribution of hyphae and roots to uranium uptake and translocation by
arbuscular mycorrhizal carrot roots under root-organ culture conditions. New Phytologist 158, 391e399.
Saric, M.R., Stojanovic, M., Milan, B., 1995. Uranium in plant species grown on natural barren soil. Journal of Plant
Nutrition 18, 1509e1518.
Shahandeh, H., Hossner, L.R., 2002a. Enhancement of uranium phytoaccumulation from contaminated soils. Soil Sci-
ence 167 (4), 269e280.
Shahandeh, H., Hossner, L.R., 2002b. Role of soil properties in phytoaccumulation of uranium. Water, Air and Soil
Pollution 141, 165e180.
Sheppard, S.C., Evenden, W.G., Pollock, R.J., 1989. Uptake of natural radionuclides by field and garden crops. Cana-
dian Journal of Soil Science 69, 751e767.
Tyler, G., Olsson, T., 2001. Plant uptake of major and minor mineral elements as influenced by soil acidity and liming.
Plant and Soil 230, 301e321.
Vandenhove, H., Van Hees, M., Wannijn, J., Wouters, K., Wang, L. Can we predict uranium bioavailability based on soil
parameters? Part 2: soil solution uranium concentration is not a good bioavailability index. Environmental Pollution,
in press. doi:10.1016/j.envpol.2006.04.012.
Vo€ınovitch, I.A., 1988. Analyse des Sols, Roches et Ciments. In: Methodes Choisies. Masson, Paris.
Walkley, A., Black, I.A., 1934. An examination of Degtjareff method for determining soil organic matter and a proposed
modification of the chromic acid titration method. Soil Science 37, 29e37.
Watanabe, F.S., Olson, S.R., 1965. Test of an ascorbic acid method for determining phosphorus in water and NaHCO3
extracts from soil. Soil Science Society of America Proceedings 29, 677e678.
Related Documents


![Western Uranium Corporation [Type text]western-uranium.com/media/Western Uranium Corp...2015, Western Uranium acquired Black Range Minerals Ltd to acquire additional uranium assets](https://static.cupdf.com/doc/110x72/5e9e2fdc39245c320521c248/western-uranium-corporation-type-textwestern-uranium-corp-2015-western-uranium.jpg)


