Plant diversity in sacred forest fragments of Western Ghats: a comparative study of four life forms Navendu V. Page Qamar Qureshi Gopal S. Rawat Cheppudira G. Kushalappa Received: 22 February 2009 / Accepted: 3 July 2009 Ó Springer Science+Business Media B.V. 2009 Abstract The effect of fragmentation on different life forms within tropical forest plant communities is poorly understood. We studied the effect of degree of fragmentation and surrounding matrix on trees, lianas, shrubs and epiphytes in tropical forest frag- ments of Kodagu, Western Ghats, India. These fragments exist as sacred groves amidst a highly modified agricultural landscape, and have been preserved by the religious sentiments of local com- munities. Plants were sampled at two sites in continuous forests and 11 forest fragments. A total of 122 species of trees, 29 species of lianas, 60 species of shrubs and 66 species of epiphytes were recorded. Trees exhibited a significant species–area relationship (R 2 = 0.74). Richness estimates after controlling for stem density (rarefaction) revealed that observed species–area relationship was not an artefact of passive sampling. Variation in species richness of the other three groups was explained by stem density and structural diversity. Linear distance from the reserve forest did not explain any variation in species richness. All life forms exhibited signifi- cant nested pattern. Trees were nested along the area gradient while nestedness in the other three groups showed evidence in support of habitat nestedness. The four life forms thus responded variably to degree of fragmentation. Our study revealed that 74% of the regional diversity for trees was contributed by diversity among plots, highlighting the importance of inter-patch habitat diversity in maintaining the total regional species pool. We conclude that trees alone cannot serve as good indicator for taking appropriate conservation measures to mitigate species loss resulting from habitat fragmentation. Keywords Species–area Richness Nestedness Tropical forest Fragmentation Life form Introduction Traditional conservation practices in the form of nature worship have played an important role in protection and conservation of biodiversity in India N. V. Page Q. Qureshi G. S. Rawat Wildlife Institute of India, P.O. Box 18, Dehradun 248001, India Q. Qureshi e-mail: [email protected] G. S. Rawat e-mail: [email protected] C. G. Kushalappa University of Agricultural Science College of Forestry, Kunda Road, Ponnampet, 571216 South Kodagu, Karnataka, India e-mail: [email protected] N. V. Page (&) Samradni, 58 Lokmanya Colony, Kothrud, Pune 411038, India e-mail: [email protected] 123 Plant Ecol DOI 10.1007/s11258-009-9638-8

Welcome message from author
This document is posted to help you gain knowledge. Please leave a comment to let me know what you think about it! Share it to your friends and learn new things together.
Transcript
Plant diversity in sacred forest fragments of Western Ghats:a comparative study of four life forms
Navendu V. Page Æ Qamar Qureshi ÆGopal S. Rawat Æ Cheppudira G. Kushalappa
Received: 22 February 2009 / Accepted: 3 July 2009
� Springer Science+Business Media B.V. 2009
Abstract The effect of fragmentation on different
life forms within tropical forest plant communities is
poorly understood. We studied the effect of degree of
fragmentation and surrounding matrix on trees,
lianas, shrubs and epiphytes in tropical forest frag-
ments of Kodagu, Western Ghats, India. These
fragments exist as sacred groves amidst a highly
modified agricultural landscape, and have been
preserved by the religious sentiments of local com-
munities. Plants were sampled at two sites in
continuous forests and 11 forest fragments. A total
of 122 species of trees, 29 species of lianas, 60
species of shrubs and 66 species of epiphytes were
recorded. Trees exhibited a significant species–area
relationship (R2 = 0.74). Richness estimates after
controlling for stem density (rarefaction) revealed
that observed species–area relationship was not an
artefact of passive sampling. Variation in species
richness of the other three groups was explained by
stem density and structural diversity. Linear distance
from the reserve forest did not explain any variation
in species richness. All life forms exhibited signifi-
cant nested pattern. Trees were nested along the area
gradient while nestedness in the other three groups
showed evidence in support of habitat nestedness.
The four life forms thus responded variably to degree
of fragmentation. Our study revealed that 74% of the
regional diversity for trees was contributed by
diversity among plots, highlighting the importance
of inter-patch habitat diversity in maintaining the
total regional species pool. We conclude that trees
alone cannot serve as good indicator for taking
appropriate conservation measures to mitigate species
loss resulting from habitat fragmentation.
Keywords Species–area � Richness �Nestedness � Tropical forest � Fragmentation �Life form
Introduction
Traditional conservation practices in the form of
nature worship have played an important role in
protection and conservation of biodiversity in India
N. V. Page � Q. Qureshi � G. S. Rawat
Wildlife Institute of India, P.O. Box 18,
Dehradun 248001, India
Q. Qureshi
e-mail: [email protected]
G. S. Rawat
e-mail: [email protected]
C. G. Kushalappa
University of Agricultural Science College of Forestry,
Kunda Road, Ponnampet, 571216 South Kodagu,
Karnataka, India
e-mail: [email protected]
N. V. Page (&)
Samradni, 58 Lokmanya Colony, Kothrud, Pune 411038,
India
e-mail: [email protected]
123
Plant Ecol
DOI 10.1007/s11258-009-9638-8
(Bhagwat and Rutte 2006). In the Kodagu district of
Karnataka state (India), local communities have
traditionally protected forests patches which are
dedicated to the local deity. Such forest patches
reserved in the name of God (local deity) are called
sacred groves (Devakad or Devarakadus). Forest
fragments in Kodagu which exist in the form of
sacred groves contain trees, lianas, epiphytes and
understorey plants (mainly shrubs). The proximal
surrounding matrix is dominated by relatively recent
coffee plantations, many of which have maintained
native tree cover within them. This tree covered
coffee matrix surrounding the forest fragments in
Kodagu have helped in maintaining tree diversity
within fragments by providing connectivity to other
fragments as well as the reserve forest, thus making
the effect of fragmentation less severe (Bhagwat et al.
2005a). They act as a reservoir for local, endemic and
endangered tree species and as an important source of
propagules and genetic diversity (Elouard 2000;
Boraiah et al. 2003; Bhagwat et al. 2005b). Coffee
plantations that maintain native tree species support a
good diversity of epiphytes. Lianas and understorey
plants, however, are completely absent in these
plantations. This makes fragments of Kodagu an
ideal place to study the influence of the matrix on
forest plants and to examine the response of four
different plant life forms, namely trees, lianas, shrubs
and epiphytes, to degree of fragmentation. Since the
previous studies carried out in Kodagu have focused
only on trees, there is a need to asses the effect of
fragmentation on other groups of plants.
The equilibrium theory of island biogeography
(ETIB; MacArthur and Wilson 1967) has often been
invoked to explain species–area relationship and to
predict species loss in habitat fragments (Kilburn
1966; Connor and McCoy 1979; He and Legendre
1996; Wilsey et al. 2005). Since the classical
equilibrium theory was proposed for strictly insular
biotas such as island archipelagos, its application to
habitat fragments have certain shortcomings. ETIB
considers the matrix lying in between these patches
as inhospitable and assumes that species present
within patches are absent from the matrix (Cook et al.
2002). Further, it considers mainland as the only
source of immigrants and does not anticipate immi-
gration from surrounding matrix. Increasing number
of studies from the tropics have recognised the
potential of the matrix surrounding the remnant forest
patches in biodiversity conservation. While some of
these studies have revealed that population declines
within patches can be compensated by immigration
from surrounding matrix (Brown and Kodric-Brown
1977; Piessens et al. 2004), consequently alleviating
patch level extinctions (Knutson et al. 2004; Silva
et al. 2005; Bhagwat et al. 2005a), some have
highlighted the importance of the matrix itself in
housing substantial biodiversity (Sekercioglu et al.
2007). Since the forest fragments in Kodagu are
surrounded predominantly by coffee-based agro-for-
estry, it provides an ideal situation to test the role of
matrix in maintaining biodiversity and its influence
on plant diversity within the forest fragments.
The broad objectives of the study were (i) to
investigate the effect of fragmentation on plant
species diversity in the forest fragments of Kodagu,
(ii) to assess the influence of spatial attributes (area
and isolation) and landscape variables (surrounding
matrix) on plant diversity within these remnant forest
fragments and (iii) to assess if the diversity and
distribution patterns of species vary across these
groups. We expect the surrounding matrix to differ-
entially influence trees and epiphytes diversity in the
fragments since these plant groups are also supported
by the coffee matrix.
Materials and methods
Study area
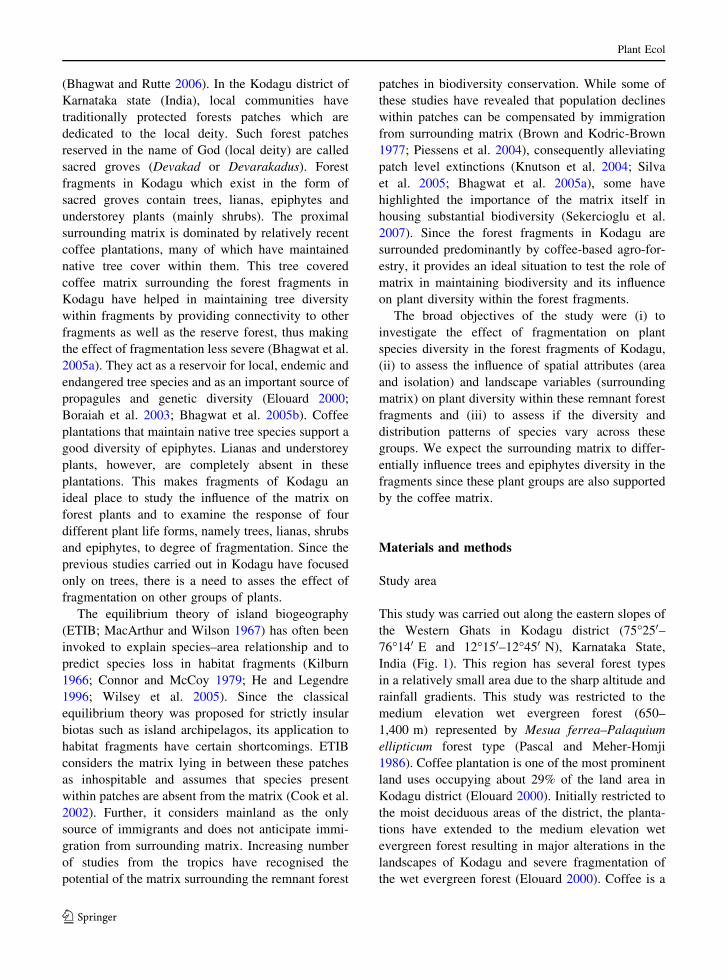
This study was carried out along the eastern slopes of
the Western Ghats in Kodagu district (75�250–76�140 E and 12�150–12�450 N), Karnataka State,
India (Fig. 1). This region has several forest types
in a relatively small area due to the sharp altitude and
rainfall gradients. This study was restricted to the
medium elevation wet evergreen forest (650–
1,400 m) represented by Mesua ferrea–Palaquium
ellipticum forest type (Pascal and Meher-Homji
1986). Coffee plantation is one of the most prominent
land uses occupying about 29% of the land area in
Kodagu district (Elouard 2000). Initially restricted to
the moist deciduous areas of the district, the planta-
tions have extended to the medium elevation wet
evergreen forest resulting in major alterations in the
landscapes of Kodagu and severe fragmentation of
the wet evergreen forest (Elouard 2000). Coffee is a
Plant Ecol
123
shade-demanding plant, hence the planters maintain
canopy cover in coffee plantations, which may either
be constituted exclusively of native forest species or
with varying percentage of exotics. Paddy is the next
most prominent crop of the study area. A large
fraction of the forest fragments in Kodagu ([1200)
are sacred groves, (Kalam 1996), making it the
district with perhaps the highest density of scared
groves in the world (Bhagwat et al. 2005b). Most of
the contiguous and undisturbed forest are now found
only in the Reserve Forests (RF), which constitute
30% of Kodagu’s forest cover. These RFs are
contiguous with large protected areas in this region
such as the Bramhagiri, Talakaveri and Pushpagiri
Wildlife Sanctuaries (Elouard 2000).
Study design
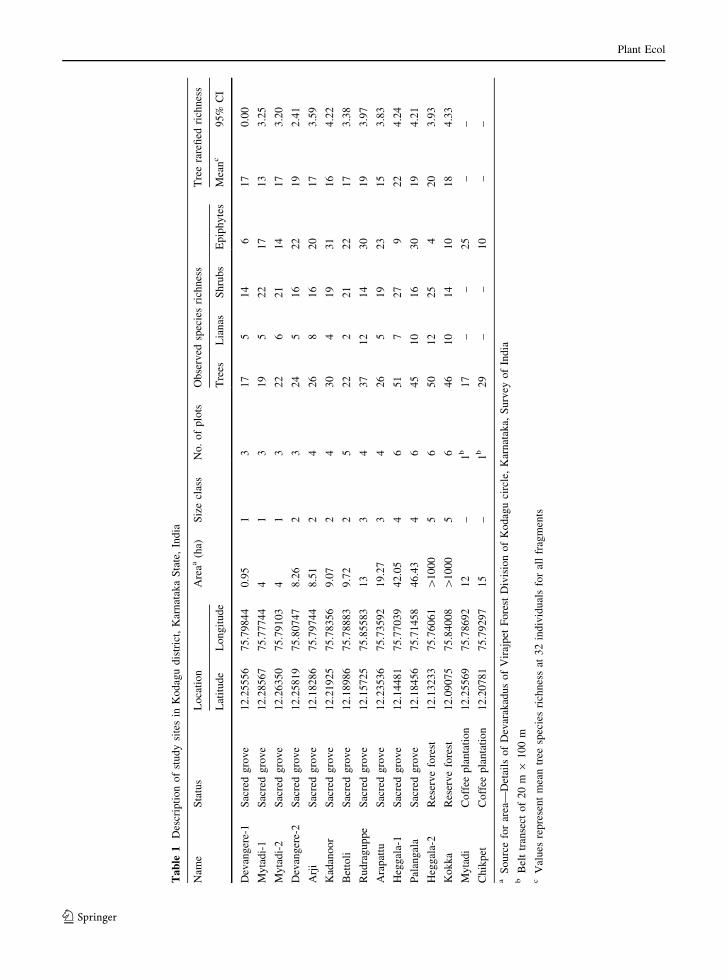
A total of 11 sacred groves (henceforth ‘fragments’)
ranging in size from 0.94 to 47 ha, two coffee
plantations and two sites within the RF, were sampled
across 5 months, from December 2006 to April 2007
(Table 1). Fragments were selected such that they
represented a size gradient, and chosen such that they
had similar topography, altitude and the surrounding
landscape type. In addition, two sites in coffee
plantations, one which had mostly native shade trees
and another which had primarily exotic shade trees
(Silver oak, Grevillea robusta), were sampled to
investigate the epiphyte diversity supported by these
plantations. Two sites were also sampled within the
reserve forest adjoining Bramhagiri Wildlife Sanctu-
ary as controls. All 11 fragments and the two sites in
reserve forest were grouped into five size classes such
that each class had 2–4 replicates (Table 1). Stratified
random sampling (Mueller-Dombois and Ellenberg
1974) was carried out for woody species in each of the
fragments and reserve forest sites. Quadrats of
25 m 9 25 m (n = 57) were used as the primary
sampling unit for trees, lianas and epiphytes. Each
fragment was divided into edge, intermediate and
interior strata and plots were laid in each of the strata so
as to capture the heterogeneity in vegetation structure
and composition. Distribution of plots within these
strata was arbitrary. Within these plots, we recorded all
trees with girth at breast height (GBH; measured at a
height of 1.35 m from the ground) exceeding 0.30 m
and lianas with GBH exceeding 0.10 m. All epiphytes
Fig. 1 Location of the study area in the Virajpet Taluka of Kodagu district in Karnataka State, India. Dots represent fragments;
squares represent the two sampling localities in the reserve forest while triangles represent coffee plantations
Plant Ecol
123
Ta
ble
1D
escr
ipti
on
of
stu
dy
site
sin
Ko
dag
ud
istr
ict,
Kar
nat
aka
Sta
te,
Ind
ia
Nam
eS
tatu
sL
oca
tio
nA
reaa
(ha)
Siz
ecl
ass
No
.o
fp
lots
Ob
serv
edsp
ecie
sri
chn
ess
Tre
era
refi
edri
chn
ess
Lat
itu
de
Lo
ng
itu
de
Tre
esL
ian
asS
hru
bs
Ep
iph
yte
sM
ean
c9
5%
CI
Dev
ang
ere-
1S
acre
dg
rov
e1
2.2
55
56
75
.79
84
40
.95
13
17
51
46
17
0.0
0
My
tad
i-1
Sac
red
gro
ve
12
.28
56
77
5.7
77
44
41
31
95
22
17
13
3.2
5
My
tad
i-2
Sac
red
gro
ve
12
.26
35
07
5.7
91
03
41
32
26
21
14
17
3.2
0
Dev
ang
ere-
2S
acre
dg
rov
e1
2.2
58
19
75
.80
74
78
.26
23
24
51
62
21
92
.41
Arj
iS
acre
dg
rov
e1
2.1
82
86
75
.79
74
48
.51
24
26
81
62
01
73
.59
Kad
ano
or
Sac
red
gro
ve
12
.21
92
57
5.7
83
56
9.0
72
43
04
19
31
16
4.2
2
Bet
toli
Sac
red
gro
ve
12
.18
98
67
5.7
88
83
9.7
22
52
22
21
22
17
3.3
8
Ru
dra
gu
pp
eS
acre
dg
rov
e1
2.1
57
25
75
.85
58
31
33
43
71
21
43
01
93
.97
Ara
pat
tuS
acre
dg
rov
e1
2.2
35
36
75
.73
59
21
9.2
73
42
65
19
23
15
3.8
3
Heg
gal
a-1
Sac
red
gro
ve
12
.14
48
17
5.7
70
39
42
.05
46
51
72
79
22
4.2
4
Pal
ang
ala
Sac
red
gro
ve
12
.18
45
67
5.7
14
58
46
.43
46
45
10
16
30
19
4.2
1
Heg
gal
a-2
Res
erv
efo
rest
12
.13
23
37
5.7
60
61
[1
00
05
65
01
22
54
20
3.9
3
Ko
kk
aR
eser
ve
fore
st1
2.0
90
75
75
.84
00
8[
10
00
56
46
10
14
10
18
4.3
3
My
tad
iC
off
eep
lan
tati
on
12
.25
56
97
5.7
86
92
12
–1
b1
7–
–2
5–
–
Ch
ikp
etC
off
eep
lan
tati
on
12
.20
78
17
5.7
92
97
15
–1
b2
9–
–1
0–
–
aS
ou
rce
for
area
—D
etai
lso
fD
evar
akad
us
of
Vir
ajp
etF
ore
stD
ivis
ion
of
Ko
dag
uci
rcle
,K
arn
atak
a,S
urv
eyo
fIn
dia
bB
elt
tran
sect
of
20
m9
10
0m
cV
alu
esre
pre
sen
tm
ean
tree
spec
ies
rich
nes
sat
32
ind
ivid
ual
sfo
ral
lfr
agm
ents
Plant Ecol
123
within these plots were noted using a pair of binoculars
and we occasionally had to climb trees to confirm their
taxonomic identity. Nested plots of 5 m 9 5 m
(n = 90) were laid in corners of the plot for sampling
shrubs. All life forms were identified to species level
with the help of local and regional floras. Voucher
specimens were deposited at the Herbarium depart-
ment of Wildlife Institute of India, Dehradun, India.
Data analysis
Species accumulation curves were generated after
1,000 randomizations using the program EstimateS
(Colwell 1997). The non-parametric estimator Jack-
knife-1 was used to estimate species richness in each
fragment (Heltshe and Forrester 1983). Jackknife-1
gives an estimate of absolute number of species in an
assemblage based on number of rare species (species
that occur only in one sample; Magurran 2004). Linear
form of Arrhenius’ (1921) power function (log S = log
k ? z log A) was used for estimating ‘z’ values
resulting from species–area relationship. The slope
values were estimated using linear regression equation
with the help of program SPSS 14 (SPSS Inc. 2005).
Both area and stem density were used to explain the
variation in plant species richness using Pearson’s
correlation test. Rarefied species richness was used to
make valid comparisons across different fragments and
to test for passive sampling (Simberloff 1978). Ran-
domisations of individuals were done using program
EcoSim700 (Gotelli and Entsminger 2001). We cal-
culated beta diversity using Whittaker’s b as a measure
of species turnover because of its advantages over
other indices (Wilson and Shmida 1984). However,
Whittaker’s b performs poorly in case of changing
alpha diversity across a gradient (Harrison et al. 1992),
hence we also calculated Cody’s index (1993) as an
additional measure of beta diversity. The additive
partitioning model of Lande (1996) was used to
calculate overall beta diversity. Effect of fragmenta-
tion on relative species abundance of plants was
assessed based on dominance diversity curves gener-
ated using program BioDiversity ProVer.2 (McAleece
et al. 1996). Differences in species abundance with
respect to patch size were tested using Wilcoxon’s
paired sample test.
Program Nestedness (Ulrich 2006) was used to
quantify nestedness of species by site matrix. The
program provides nestedness scores in form of
‘temperature-T’, the values of which range between
0 (perfect order) and 100 (perfect disorder). The
significance of the observed temperature was judged
from the 95% CI after 1,000 randomisations. Man-
tel’s test was used to test the correlation between
dissimilarity distance matrices (McCune and Grace
2002). We used Mantel’s test to detect the effect of
geographical distance between patches on (i) absolute
differences in residual values resulting from species–
area regression, (ii) species compositional similarity,
and (iii) patch temperature. Geographical distance
between patches (from the center) was calculated
using ArcView GIS (ESRI 1998) software. Area was
correlated with rank order of fragments in maximally
nested matrix using rank correlation analysis to test
the influence of area on patch temperature, i.e. to test
whether fragments were nested along an area
gradient.
Results
Species richness
A total of 122 species of trees, 29 species of lianas,
60 species of shrubs and 66 species of epiphytes were
recorded in 11 fragments and two sites in reserve
forests. Of these, 47 species of trees, 12 species of
lianas, 29 species of shrubs and 55 species of
epiphytes were recorded exclusively in the fragments,
while 19 species of trees, 6 species of lianas and 8
species of shrubs were recorded only in the reserve
forest. No species of epiphyte was unique to the
reserve forest. We recorded 41 species of native trees
apart from two exotics (Grevillea robusta and
Erythrina sp.) and 28 species of epiphytes in two
coffee plantations. We did not observe any epiphytes
growing on the exotic tree species within the coffee
plantation.
Tree species richness increased consistently with
area (Table 1, Fig. 2a). Shrub and liana species
richness did not show any particular trend with area
while epiphytes species richness peaked at interme-
diate sized fragments (Fig. 2b–d).
Stem density of trees was also correlated with area
(R = 0.66, P = 0.01). This resulted in a significant
correlation of tree species richness with both area and
stem density. Increase in stem density of trees with
area was because of increase in proportion of tree
Plant Ecol
123

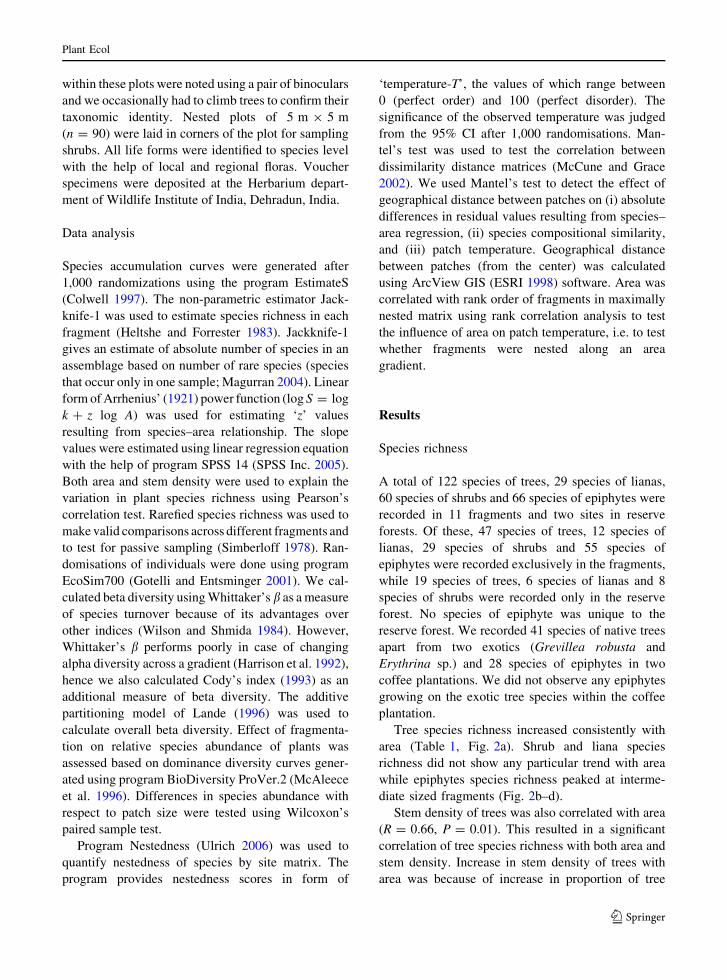
individuals in smaller girth classes (Fig. 3). Species
richness when controlled for stem density (rarefied
richness) did not show a significant difference
between any of the size classes.
Dominance and diversity
The dominance diversity curves of trees for all five
size classes exhibit similar shape but differ in their
slope, degree of dominance of the community by
common species and number of rare species in each
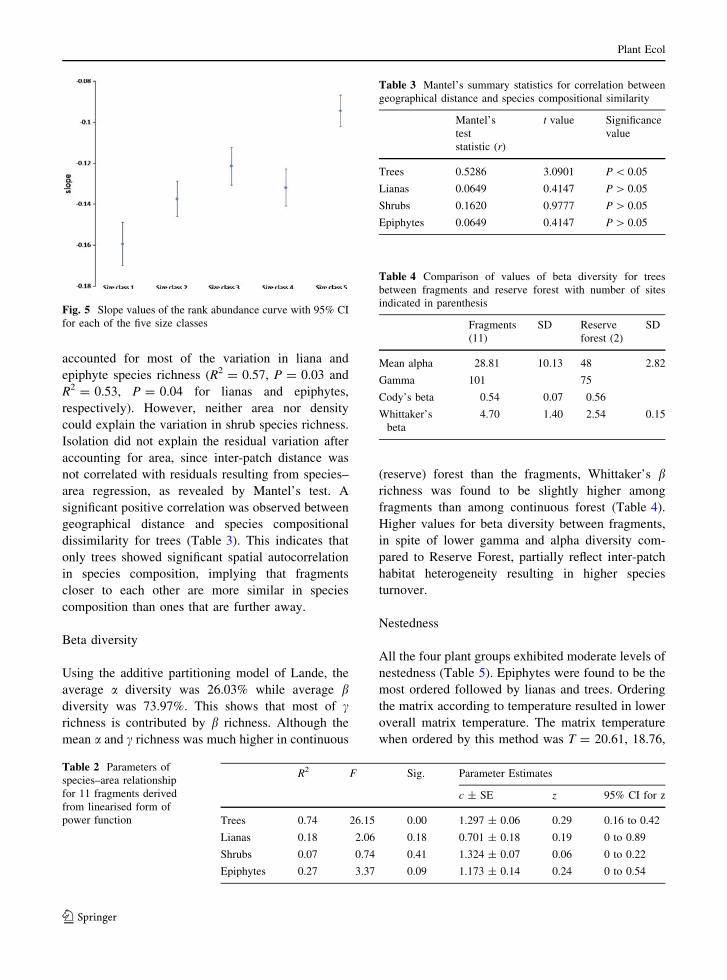
(Fig. 4a). Size class 1 shows the steepest slope
(Fig. 5), indicating high dominance. The species
distribution in this size class is least equitable,
showing high abundance of common species and
absence of rare species. Larger size classes
successively showed higher number of rare species
with reserve forest having the highest proportion of
rare species and also exhibiting the lowest slope
(Fig. 5). Certain species such as Xanthophyllum
flavescens, Nothopegia racemosa and two species of
Holigarna were the most abundant in the forest
fragments but were recorded in very low abundance
in reserve forest (Fig. 4a). On the other hand, species
like Elaeocarpus tuberculatus and Olea dioica were
most abundant in reserve forest but were encountered
rarely in forest fragments. Dimocarpus longan was
the only species that remained the most dominant
species in both forest fragments and reserve forest.
General trends for shrub species abundance were
similar to those of trees (Fig. 4b). The relative
abundance of Coffea canephora, an exotic grown
Fig. 2 Scatter plot of
estimated species richness
(±1 SD) plotted against
area for four plant life forms
Fig. 3 Girth class distribution for trees across five size classes. GBH of trees was divided into 15 girth classes with a class interval of
0.3 m, shown on the x-axis, while y-axis represents proportion of stems in each girth class
Plant Ecol
123
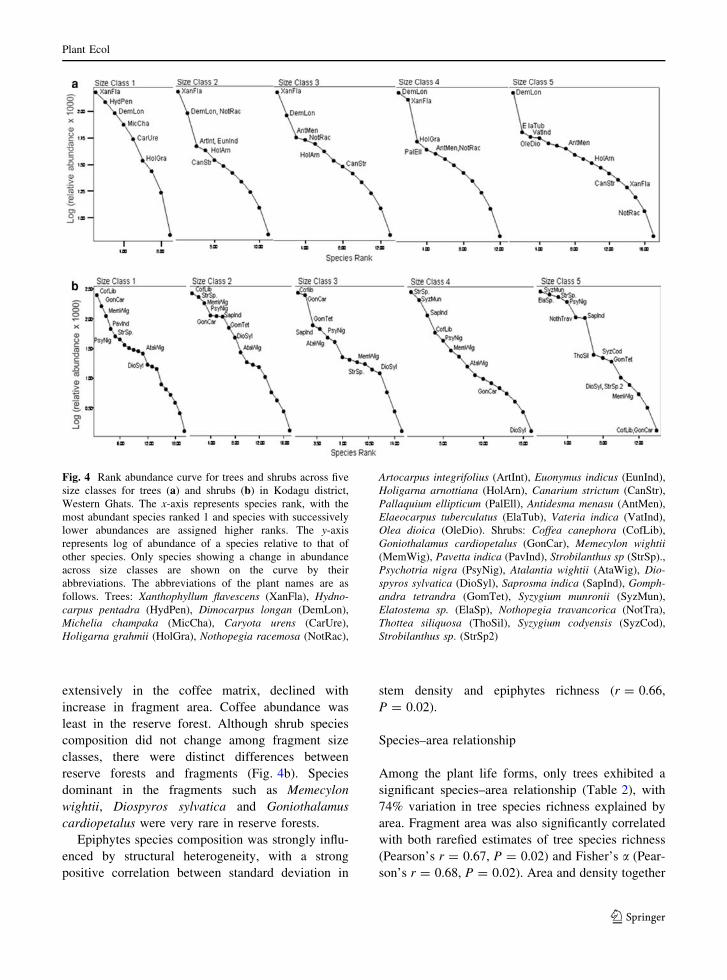
extensively in the coffee matrix, declined with
increase in fragment area. Coffee abundance was
least in the reserve forest. Although shrub species
composition did not change among fragment size
classes, there were distinct differences between
reserve forests and fragments (Fig. 4b). Species
dominant in the fragments such as Memecylon
wightii, Diospyros sylvatica and Goniothalamus
cardiopetalus were very rare in reserve forests.
Epiphytes species composition was strongly influ-
enced by structural heterogeneity, with a strong
positive correlation between standard deviation in
stem density and epiphytes richness (r = 0.66,
P = 0.02).
Species–area relationship
Among the plant life forms, only trees exhibited a
significant species–area relationship (Table 2), with
74% variation in tree species richness explained by
area. Fragment area was also significantly correlated
with both rarefied estimates of tree species richness
(Pearson’s r = 0.67, P = 0.02) and Fisher’s a (Pear-
son’s r = 0.68, P = 0.02). Area and density together
Fig. 4 Rank abundance curve for trees and shrubs across five
size classes for trees (a) and shrubs (b) in Kodagu district,
Western Ghats. The x-axis represents species rank, with the
most abundant species ranked 1 and species with successively
lower abundances are assigned higher ranks. The y-axis
represents log of abundance of a species relative to that of
other species. Only species showing a change in abundance
across size classes are shown on the curve by their
abbreviations. The abbreviations of the plant names are as
follows. Trees: Xanthophyllum flavescens (XanFla), Hydno-carpus pentadra (HydPen), Dimocarpus longan (DemLon),
Michelia champaka (MicCha), Caryota urens (CarUre),
Holigarna grahmii (HolGra), Nothopegia racemosa (NotRac),
Artocarpus integrifolius (ArtInt), Euonymus indicus (EunInd),
Holigarna arnottiana (HolArn), Canarium strictum (CanStr),
Pallaquium ellipticum (PalEll), Antidesma menasu (AntMen),
Elaeocarpus tuberculatus (ElaTub), Vateria indica (VatInd),
Olea dioica (OleDio). Shrubs: Coffea canephora (CofLib),
Goniothalamus cardiopetalus (GonCar), Memecylon wightii(MemWig), Pavetta indica (PavInd), Strobilanthus sp (StrSp).,
Psychotria nigra (PsyNig), Atalantia wightii (AtaWig), Dio-spyros sylvatica (DioSyl), Saprosma indica (SapInd), Gomph-andra tetrandra (GomTet), Syzygium munronii (SyzMun),
Elatostema sp. (ElaSp), Nothopegia travancorica (NotTra),
Thottea siliquosa (ThoSil), Syzygium codyensis (SyzCod),
Strobilanthus sp. (StrSp2)
Plant Ecol
123
accounted for most of the variation in liana and
epiphyte species richness (R2 = 0.57, P = 0.03 and
R2 = 0.53, P = 0.04 for lianas and epiphytes,
respectively). However, neither area nor density
could explain the variation in shrub species richness.
Isolation did not explain the residual variation after
accounting for area, since inter-patch distance was
not correlated with residuals resulting from species–
area regression, as revealed by Mantel’s test. A
significant positive correlation was observed between
geographical distance and species compositional
dissimilarity for trees (Table 3). This indicates that
only trees showed significant spatial autocorrelation
in species composition, implying that fragments
closer to each other are more similar in species
composition than ones that are further away.
Beta diversity
Using the additive partitioning model of Lande, the
average a diversity was 26.03% while average bdiversity was 73.97%. This shows that most of crichness is contributed by b richness. Although the
mean a and c richness was much higher in continuous
(reserve) forest than the fragments, Whittaker’s brichness was found to be slightly higher among
fragments than among continuous forest (Table 4).
Higher values for beta diversity between fragments,
in spite of lower gamma and alpha diversity com-
pared to Reserve Forest, partially reflect inter-patch
habitat heterogeneity resulting in higher species
turnover.
Nestedness
All the four plant groups exhibited moderate levels of
nestedness (Table 5). Epiphytes were found to be the
most ordered followed by lianas and trees. Ordering
the matrix according to temperature resulted in lower
overall matrix temperature. The matrix temperature
when ordered by this method was T = 20.61, 18.76,
Fig. 5 Slope values of the rank abundance curve with 95% CI
for each of the five size classes
Table 2 Parameters of
species–area relationship
for 11 fragments derived
from linearised form of
power function
R2 F Sig. Parameter Estimates
c ± SE z 95% CI for z
Trees 0.74 26.15 0.00 1.297 ± 0.06 0.29 0.16 to 0.42
Lianas 0.18 2.06 0.18 0.701 ± 0.18 0.19 0 to 0.89
Shrubs 0.07 0.74 0.41 1.324 ± 0.07 0.06 0 to 0.22
Epiphytes 0.27 3.37 0.09 1.173 ± 0.14 0.24 0 to 0.54
Table 3 Mantel’s summary statistics for correlation between
geographical distance and species compositional similarity
Mantel’s
test
statistic (r)
t value Significance
value
Trees 0.5286 3.0901 P \ 0.05
Lianas 0.0649 0.4147 P [ 0.05
Shrubs 0.1620 0.9777 P [ 0.05
Epiphytes 0.0649 0.4147 P [ 0.05
Table 4 Comparison of values of beta diversity for trees
between fragments and reserve forest with number of sites
indicated in parenthesis
Fragments
(11)
SD Reserve
forest (2)
SD
Mean alpha 28.81 10.13 48 2.82
Gamma 101 75
Cody’s beta 0.54 0.07 0.56
Whittaker’s
beta
4.70 1.40 2.54 0.15
Plant Ecol
123
26.68 and 18.58 for trees, lianas, shrubs and
epiphytes, respectively.
Fragment area was significantly correlated with
matrix temperature (Spearman’s coefficient = 0.86,
P = 0.001) for trees species only showing that only
trees were nested along the area gradient. From
correlation of geographical distance matrix with
absolute differences in patch temperature for each
pair of fragments, we found that isolation could not
explain the species nestedness pattern in any of the
plant groups.
Discussion
Species richness
Effect of area and isolation
A positive species–area relationship, as observed for
trees indicates that species richness was a function of
patch area, highlighting once again the importance of
area as one of the most important determinants of
species richness in fragmented habitats. The rate at
which species accumulate with area or the z value for
trees (z = 0.29) and for epiphytes (z = 0.24, but with
wider confidence intervals) in the present study lies
within the canonical range proposed by Preston
(1962) and MacArthur and Wilson (1967). Rarefied
estimates of species richness indicate that passive
sampling was not responsible in generating signifi-
cant positive correlation between area and tree
species richness, as area was significantly correlated
with tree species richness even after controlling for
sample size and abundance. Thus, increasing trees
species richness was not because of larger patches
containing larger samples and effectively more
species, as proposed by the passive sampling hypoth-
esis (Connor and McCoy 1979).
Isolation plays an important role in colonization
processes and is one of the important predictors of
species diversity in fragmented biotas (MacArthur
and Wilson 1967; Simberloff 1972). In the present
study, however, there was little evidence suggesting
the influence of isolation on plant species richness.
However, species compositional data provides evi-
dence in support of inter-patch immigration which is
revealed by a significant spatial autocorrelation for
trees. It has been predicted that ‘reciprocal colonisa-
tion’ or immigration from neighbouring patches
should result in spatial autocorrelation with respect
to species composition (Preston 1962). Spatial auto-
correlation of trees species observed in our study
could be either because of persistence of species in a
once contiguous landscape or because of influx of
species from the surrounding patches (Hanski 1999).
Effect of density
For trees and lianas, both species density and species
richness were lower in smaller fragments than larger
fragments and continuous reserve forest. This was
partly because smaller fragments had lower stem
density, and density increased with an increase in
fragment area. Many studies dealing with species–
area relationship do not consider correlation between
density and area (Preston 1962; MacArthur and
Wilson 1967). However, this correlation between
area and density has been documented by a few other
studies, particularly those carried out in anthropo-
genic habitat fragments. A similar pattern was
observed in a study carried out in forest fragments
of Southern Western Ghats, where stem density was
correlated with patch area and negatively correlated
with the disturbance score (Muthuramkumar et al.
2006). In the present study, the reduced density in
smaller fragments was largely attributed to a low
proportion of young trees belonging to smaller girth
Table 5 Nestedness and matrix temperature (when packed according to species richness)
Matrix temp. Simulated temp. SD Z-score Lower 95% CI Upper 95% CI
Trees 26.34 55.91 2.71 -10.9 50.62 61.04
Lianas 24.63 47.84 5.27 -4.4 38.08 58.82
Shrubs 31.95 56.65 3.8 -6.5 49.09 64.26
Epiphytes 21.62 55.01 3.74 -8.93 47.59 62.09
Plant Ecol
123
classes. The lower tree density could be a result of
higher edge to area ratio and a subsequent increase in
exposure to the physical environment. This makes
smaller patches prone to large number of gaps that
eventually affect tree regeneration and recruitment
(Lovejoy et al. 1986; Turner 1996; Laurence et al.
1998).
Nestedness
Our results clearly indicate that the four plant life
forms in fragmented landscapes of Kodagu show an
ordered species composition. Nestedness temperature
in the present study was higher than values observed
for plants in other matrix types such as heathland
relicts, isolated mountaintops and fragments in agri-
cultural matrix (Piessens et al. 2004; Bruun and Moen
2003; Butaye et al. 2001). This could be because of
the nature of the surrounding matrix that has helped
in maintaining similarity in species composition
between fragments and reserve forest (Bhagwat
et al. 2005a) by facilitating sufficient movement of
propagules and pollen flow through the landscape and
thus keeping patch extinction low (Piessens et al.
2004; Watling and Donnelly 2006). This effect, often
referred to as rescue-effect, was first predicted and
then observed for arthropods on isolated thistle plants
(Brown and Kodric-Brown 1977), and subsequently
many other ecosystems, for e.g. plants in heathland
fragments (Piessens et al. 2004). The comparatively
low degree of nestedness observed for the plant
groups in our study is also consistent with the
hypothesis that extinction within patches that origi-
nally contained the same set of species, like the forest
fragments in the study, should result in irregular and
less nested patterns (Darlington 1957).
Life history and factors influencing nestedness
Area
Area dependent patch extinction has been widely
found to be the most important process influencing
nestedness (Wright and Reeves 1992; Atmar and
Patterson 1993; Watling and Donnelly 2006). How-
ever, a similar study dealing with core forest plant
species found contrasting results, where patch area
did not determine nestedness in forest plants although
a significant species–log (area) correlation was
observed (Honnay et al. 1999). Trees were the only
life form in which the nested pattern was influenced
by area and the only group to exhibit a significant
species–area relationship. This study therefore pro-
vides substantiation in support of patch area as a
predictor of nestedness when species richness is
significantly correlated with area. Principal processes
like area dependent extinction and isolation depen-
dent colonisation, however, did not show any influ-
ence on nestedness in lianas, shrubs and epiphytes. In
fragmented communities, isolation dependent colo-
nisation is a less likely process as such communities
often undergo species relaxation post fragmentation,
unlike the colonisation-dominated biotas of island
archipelagos (Patterson 1987; Patterson 1990; Wright
and Reeves 1992). Area showed a strong influence
only on tree species. This is because among the
studied life forms, trees probably experience the
greatest space constraint and thus are directly influ-
enced by patch area. In addition, the diversity and
species composition of trees is relatively independent
of other life forms.
Habitat diversity
In the case of epiphytes, most species recorded in
smaller fragments were light demanding species
which grew abundantly along forest edges, tree fall
gaps and in coffee plantations where canopy is mostly
open. Smaller fragments favoured the growth of such
epiphytes since they had lower canopy cover and
stem density. However, relative density of few
epiphytic species that require high shade and mois-
ture (such as Loxoma straminea, Phalaenopsis
mysorensis and Gastrochilus acaulis) were higher in
the interiors of larger fragments. Our findings are
consistent with the earlier finding of De Walt et al.
(2000) and Padmawathe et al. (2004) that diversity
and species composition of lianas, shrubs and
epiphytes was dependent on tree structural diversity.
Additionally, as epiphytes are highly vagile they can
disperse across very large distances. High species
richness of epiphytes in medium-sized fragments
(Size class-3) was because of high structural diver-
sity. Fragments in this size class had both a prominent
edge and a relatively undisturbed interior zone, unlike
Size class-1 in which fragments were too small to
have a well-defined interior. Medium-sized fragments
therefore captured maximum structural heterogeneity
Plant Ecol
123
and consequently had high habitat diversity allowing
for the coexistence of many species. This finding is
further supported by the fact that about 85% of total
epiphytic species were recorded in Size class-2 and 3.
Reserve forests on the other hand, were structurally
homogenous on account of their high tree density and
unbroken canopy cover. As a consequence they could
only support a few epiphytes such as shade loving
Asplenium nidus.
Observed patterns for lianas and shrubs can be
explained similarly. We however, detected that
reserve forest had a different set of shrub and liana
that were absent in fragments, a trend not observed for
epiphytes. These shrubs and lianas could be the species
sensitive to fragmentation or those that have specia-
lised requirements. The absence of these species from
the fragments may be due to lack of suitable micro-
habitat or species relaxation due to deterioration in
habitat after fragmentation, rather than area dependent
extinction. Spatial turnover could also be responsible
for the observed change in species composition
(Gentry 1988; Benitez-Malvido and Martinez-Ramos
2003). The scale of the present study, however, was
too small for spatial turnover to exert a strong
influence on the changes in species composition. The
influence of light, structural diversity and other habitat
variables causes us to suspect that, rather than
colonisation or extinction processes, nested distribu-
tion of habitats (Honnay et al. 1999; Patterson and
Atmar 2000) is the most likely cause for nestedness in
epiphytes, shrubs and lianas.
Dispersal ability
Studies that have examined the effect of dispersal
ability have highlighted its strong influence on
distribution patterns of forest plants (Matlac 1994;
Bossuyt et al. 1999). Species with poor dispersal
ability are the most nested, while wind and bird
dispersed plants are the most ubiquitous (Kadmon
1995; and for exceptions see Schoener and Schoener
1983; Ryti and Gilpin 1987). Our findings were,
however, contrary to the above mentioned studies.
We noted that about 33% of epiphytes were found to
be adapted for bird dispersal while pteridophytes and
orchids, which constituted 56% of epiphytes, were
dispersed through microspores and are likely to be
carried over extremely long distances by wind.
Epiphytes were therefore most vagile among the four
life forms, and while we expected this group to
exhibit high degree of disorder, it was found to be the
most nested. Our findings agree with those of Crowe
(1979) who found that pioneer weed species with
high dispersal ability exhibited colonisation driven
nestedness pattern in recently vacated plots.
Shrubs differ greatly from epiphytes in dispersal
methods. Shrubs fail to disperse themselves over long
distances because most species are autochorus and
occupy the forest understorey in which wind is an
ineffective agent for seed dispersal (Honnay et al.
1999). Because of these factors, shrubs can be
expected to exhibit maximum nestedness. Our results,
however, reveal that shrub communities were the most
disordered among the four plant life forms, and the
observed patterns may be because of two reasons.
First, the forest fragments in the present study
represent remnants of once contiguous forest (unlike
islands). Hence it is apparent that most, if not all of the
species present in these patches were also present prior
to fragmentation (except epiphytes which may have
colonised the fragments post fragmentation). It is
therefore unlikely that the species assemblages have
been primarily shaped by colonisation of species
dispersing from surrounding areas (Wright and Reeves
1992). Second, very static species like the shrubs of the
forest understorey are unable to colonise to other
habitats and therefore are insensitive to patch isolation
(Honnay et al. 1999). In conclusion, the patterns we
observe and report for epiphytes, shrubs and lianas
present no evidence in favour of selective dispersal
affecting nestedness of different plant groups.
Conclusions
Our study underscores the importance of comparing
data across different plant groups in examining the
response of plant communities to habitat fragmenta-
tion. While large contiguous forests maintain a much
larger proportion of regional species on account of
their larger area, they do not adequately represent the
landscape and habitat heterogeneity within the
region. This is partly because, the forest fragments
in the region are more spatially separated, and as a
consequence they collectively support more diverse
life forms than larger continuous forests. Second,
higher structural heterogeneity exhibited by the
fragments suggests that, unlike continuous reserve
Plant Ecol
123
forests, these fragments offer more intra patch habitat
diversity to life forms such as epiphytes, shrubs and
lianas. Hence, intra patch habitat diversity and inter
patch landscape heterogeneity are very effective in
maintaining the total pool of regional species diver-
sity, as has been pointed out by previous studies
(Honnay et al. 1999; Bhagwat et al. 2005a; Muth-
uramkumar et al. 2006). Maintaining large tracts of
forest alone would effectively help preserve only a
part of regional plant diversity (Tscharntke et al.
2002). This deficiency of reserve forests has very
well been compensated for by locally protected forest
fragments in the Kodagu landscape, which is borne
out by several observations. First, in comparison to
the reserve forests, all the fragments studied collec-
tively house a greater number of plants endemic to
the Western Ghats—Sri Lanka biodiversity hotspot
(Table 6). Secondly, our study determined that these
fragments are particularly important for epiphytes
since the only other land use type which harbour
comparable levels of epiphyte diversity of epiphytes
are the privately owned coffee plantations which
maintain native tree cover. These findings have also
been supported by some recent fragmentation studies
from neotropics where small fragments were extre-
mely valuable for maintaining regional plant diver-
sity since they comprise of diverse native plant
communities including endangered and economically
important species (Arroyo-Rodrı́guez et al. 2008).
Existing sacred forest fragments and native tree
friendly coffee plantations (Anand et al. 2008)
therefore, provide a fine example of ‘‘reconciliation
ecology’’ (Rosenzweig 2003). These traditional
conservation and agricultural practices within the
human-modified landscape of Kodagu jointly sustain
a wider variety of plants than forest areas that are
formally preserved and protected. The high diversity
of shrubs and epiphytes recorded in sacred groves and
plantations, respectively, suggests that these practices
are compatible with the habitat requirements of
certain life forms such as epiphytes. Williams et al.
(2006) suggested that quality of surrounding land-
scape matrix is more important for persistence of
plants within the forest remnants than the spatial
attributes. Therefore, in the present scenario, safe-
guarding the native tree cover within the coffee
plantations is crucial considering its role in main-
taining plant diversity in forest remnants.
Our results indicate that the four life forms
respond differentially to the degree of fragmentation.
We therefore suggest prudence in using any one of
these as a surrogate for others. Trees alone may not
serve as good indicators to assess the effect of
fragmentation and any conservation measures taken
to mitigate species loss may not be effective unless
different life forms within and across taxonomic
groups are taken into consideration.
Acknowledgements The study was supported by Master’s in
Wildlife Science program at the Wildlife Institute of India. We
thank Karnataka State forest department for giving us
permissions to carry out the field study. Thanks to Shonil
Bhagwat and MS Chaitra for their help and encouragement to
take up this study. Sujay, Muddasir, Manu, Mohan, Mahesh,
Anil, Parshu, Abhishek,Shrinath, Kartik, Kiran, Shrinivas,
Ratnavarma, G. T. Reddy, Raghunath and Chandrashekhar for
all their help and assistance in the field. Sathish, Raghvendra,
Dr. Ravi Kumar and Dr. Milind Sardesai,for helping in plant
identification. We are grateful to College of Forestry,
Ponnampet and Shrikant Inganhallikar for their logistic
support. Nilanjana for making the maps and K. Ramesh,
Shonil Bhagwat, Kavita Isvaran, Saumya Prasad, Hari Sridhar,
Abhishek Harihar, Ishan Agarwal, Pranav Chanchani,
Mousumi Ghosh for their valuable inputs and comments.
Finally we would like to thank the four anonymous reviewers
whose comments helped greatly improve the quality of the
manuscript.
References
Ahmedullah M, Nayar MP (1987) Endemic plants of Indian
region. Botanical Survey of India, New Delhi
Anand MO, Krishnaswamy J, Das A (2008) Proximity to for-
ests drives bird conservation value of coffee plantations:
implications for certification. Ecol Appl 18:1754–1763
Arrhenius O (1921) Species and area. J Ecol 9:95–99
Table 6 Number of species recorded in the fragments and
reserve forest of Kodagu district that are endemic to Western
Ghats, India
Life form Forest fragments
(n = 11)
Reserve forest
(n = 2)
Trees 33 (8) 29 (4)
Lianas 7 (2) 6 (1)
Epiphytes 15 (15) 0
Understorey
plants
14 (5) 10 (2)
Total 69 (30) 45 (7)
Numbers in parentheses indicate exclusive species
Ahmedullah and Nayar 1987; Ramesh and Pascal 1997;
Gopalan and Henry 2000
Plant Ecol
123
Arroyo-Rodrı́guez VE, Pineda E, Escobar F, Benı́tez-Malvido J
(2008) Conservation value of small patches to plant spe-
cies diversity in highly fragmented landscapes. Conserv
Biol 23:723–739
Atmar W, Patterson BD (1993) The measure of order and
disorder in the distribution of species in fragmented
habitat. Oecologia 96:373–382
Benitez-Malvido J, Martinez-Ramos M (2003) Impact of forest
fragmentation on understory plant species richness in
Amazonia. Conserv Biol 17:389–400
Bhagwat SA, Rutte C (2006) Sacred groves: potential for
biodiversity management. Front Ecol Environ 4:519–524
Bhagwat SA, Kushalappa CG, Williams PH, Brown ND
(2005a) A landscape, approach to biodiversity conserva-
tion of sacred groves in the Western Ghats of India.
Conserv Biol 19:1853–1862
Bhagwat SA, Kushalappa CG, Williams PH, Brown ND
(2005b) The role of informal protected areas in main-
taining biodiversity in the Western Ghats of India. Ecol
Soc 10:8
Boraiah KT, Vasudeva R, Bhagwat SA, Kushalappa CG (2003)
Do informally managed sacred groves have higher rich-
ness and regeneration of medicinal plants than state-
managed reserve forests? Curr Sci 84:804–808
Bossuyt B, Hermy M, Deckers J (1999) Migration of herba-
ceous plant species across ancient–recent forest ecotones
in central Belgium. J Ecol 87:628–638
Brown JH, Kodric-Brown A (1977) Turnover rates in insular
biogeography: effect of immigration on extinction. Ecol-
ogy 58:445–449
Bruun HH, Moen J (2003) Nested communities of alpine plants
on isolated mountains: the relative importance of coloni-
sation and extinction. J Biogeogr 30:297–303
Butaye J, Jacquemyn H, Hermy M (2001) Differential colo-
nization causing non-random forest plant community
structure in a fragmented agricultural landscape. Ecogra-
phy 24:369–380
Cody ML (1993) Bird diversity within and between habitats in
Australia. In: Ricklefs R, Schluter D (eds) Species
diversity in ecological communities: historical and geo-
graphical perspectives. University of Chicago Press,
Chicago
Colwell RK (1997) EstimateS: statistical estimation of species
richness and shared species from samples. Version 8
Cook WC, Lane KT, Foster BL, Holt RD (2002) Island theory,
matrix effects and species richness patterns in habitat
fragments. Ecol Lett 5:619–623
Connor EF, McCoy ED (1979) The statistics and biology of the
species–area relationship. Am Nat 113:791–833
Crowe TM (1979) Lots of weeds: insular phytogeography of
vacant urban lots. J Biogeogr 6:169–181
Darlington PJ (1957) Zoogeography: the geographical distri-
bution of animals. Wiley, New York
DeWalt SJ, Schnitzer SA, Denslow JS (2000) Density and
diversity of lianas along a chronosequence in a central
Panamanian tropical forest. J Trop Ecol 16:1–19
Elouard C (2000) The role of coffee plantations in biodiverisity
conservation. In: Ramakrishnan PS, Chandrashekara UM,
Elouard C, Guilmoto CZ, Maikhuri RK, Rao KS, Sankar
S, Saxena KG (eds) Mountain biodiversity, land use
dynamics, and traditional knowledge. Man and the
biosphere programme. Oxford and IBH Publishing Co.
Pvt. Ltd, New Delhi
ESRI (1998) ArcView GIS 3.2. Environmental Systems
Research Institute, California
Gentry AH (1988) Changes in plant community diversity and
floristic composition on environmental and geographical
gradients. Ann MO Bot Gard 75:1–34
Gopalan R, Henry AN (2000) Endemic plants of India. Bishan
Sing Mahendra Pal Sing, Dehradun
Gotelli NJ, Entsminger GL (2001) Ecosim: null models soft-
ware for ecology, version 7.0. Acquired Intelligence Inc,
& Kesey-Bear, Jericho
Hanski I (1999) Metapopulation ecology. In: Rhodes OEJ,
Chesser RK, Smith MH (eds) Population dynamics in
ecological space and time. Chicago University Press,
Chicago
Harrison S (1997) How natural habitat patchiness affects the
distribution of diversity in Californian serpentine chap-
arral. Ecology 78:1898–1906
Harrison S, Ross SJ, Lawton JH (1992) Beta diversity on
geographic gradients in Britain. J Anim Ecol 61:151–158
He FL, Legendre P (1996) On species–area relations. Am Nat
148:719–737
Heltshe J, Forrester NE (1983) Estimating species richness
using the jackknife procedure. Biometrics 39:1–11
Honnay O, Hermy M, Coppin P (1999) Nested plant commu-
nities in forest fragments: species relaxation or nested
habitats. Oikos 84:119–129
Kadmon A (1995) Nested species subsets and geographic
isolation: a case study. Ecology 76:458–465
Kalam MA (1996) Sacred groves in Kodagu district of Kar-
nataka (South India): a socio-historical study. Institute
Francais de Pondichery, Pondichery
Kilburn PD (1966) Analysis of the species–area relation.
Ecology 47:831–843
Knutson MG, Richardson WB, Reineke DM, Gray BR, Par-
melee JR, Weick SE (2004) Agricultural ponds support
amphibian populations. Ecol Appl 14:669–684
Kushalappa CG, Bhagwat S (2001) Sacred groves: biodiver-
sity, threats and conservation. In: Shaanker UR, Gane-
shaiah KN, Bawa KS (eds) Forest genetic resources:
status, threats, and conservation strategies. Oxford and
IBH, New Delhi
Lande R (1996) Statistics and partitioning of species diversity,
and similarity among multiple communities. Oikos 76:5–13
Laurence WF, Ferreira LV, Rankin-DE Merona JM, Laurance
SG (1998) Rain forest fragmentation and the dynamics of
Amazonian tree communities. Ecology 79:2032–2042
Lovejoy TE, Bierregaard RO Jr, Rylands AB, Malcolm JR,
Quintela CE, Harper LH, Brown KS Jr, Powell AH,
Powell GVN, Schubart HoR, Hays MB (1986) Edge and
other effects of isolation on Amazon forest fragments. In:
Soule ME (ed) Conservation biology: the science of
scarcity and diversity. Sinauer Associates, Mass
MacArthur RH, Wilson EO (1963) An equilibrium theory of
insular zoogeography. Evolution Int J org Evolution
17:373–387
MacArthur RH, Wilson EO (1967) The theory of island bio-
geography. Princeton University Press, Princeton
Magurran AE (2004) Measuring biological diversity. Black-
well Publishing Science, Oxford
Plant Ecol
123
Martinez-Morales MA (2005) Nested species assemblages as a
tool to detect sensitivity to forest fragmentation: the case
of cloud forest birds. Oikos 108:634–642
Matlac RG (1994) Plant species migration in a mixed-history
forest landscape in eastern North America. Ecology
75:1491–1502
McAleece N, Lambshead PJD, Paterson GLJ, Gage JD (1996)
Biodiversity Pro. A program for analysing ecological data.
Natural History Museum, London
McCune B, Grace JB (2002) Analysis of ecological commu-
nities. MjM Software, Gleneden Beach, Oregon
Mueller-Dombois D, Ellenberg H (1974) Aims and methods of
vegetation ecology. Wiley, New York
Muthuramkumar S, Ayyappan N, Parthasarathy N, Mudappa
D, Raman TRS, Selwyn MA, Pragasan LA (2006) Plant
community structure in tropical rain forest fragments of
the Western Ghats, India. Biotropica 38:143–160
Padmawathe R, Qureshi Q, Rawat GS (2004) Effects of
selective logging on vascular epiphyte diversity in a moist
lowland forest of Eastern Himalaya, India. Biol Conserv
119:81–92
Pascal JP, Meher-Homji VM (1986) Phytochorology of Kod-
agu (Coorg) district, Karnataka. J Bombay Nat Hist Soc
83:43–56
Patterson BD (1987) The principle of nested subsets and its
implications for biological conservation. Conserv Biol
1:323–334
Patterson BD (1990) On the temporal development of nested
subset patterns of species composition. Oikos 59:330–342
Patterson BD, Atmar W (2000) Analyzing species composition
in fragments. In: Rheinwald G (ed) Isolated vertebrate
communities in the tropics. Bonner Zoologishe Monog-
raphen, Bonn, Germany
Piessens K, Honnay O, Nakaerts K, Hermy M (2004) Plant
species richness and composition of heathland relics in
north-western Belgium: evidence for a rescue-effect? J
Biogeogr 31:1683–1692
Poulsen AD, Hafashimana D, Eilu G, Liengola IB, Ewango
CEN, Hart TB (2005) Composition and species richness
of forest plants along the Albertine Rift, Africa. Biolog-
iske Skrifter 55:129–143
Preston FW (1962) The canonical distribution of commonness
and rarity. Ecology 43:185–215
Ramesh BR, Pascal JP (1997) Atlas of endemics of the Wes-
tern Ghats (India). Institut Francais de Pondichery,
Pondichery, India
Rosenzweig ML (1995) Species diversity in space and time.
Cambridge University Press, New York
Rosenzweig ML (2003) Reconciliation ecology and the future
of species diversity. Oryx 37:194–205
Ryti RT, Gilpin ME (1987) The comparative analysis of spe-
cies occurence patterns on archipelagoes. Oecologia
73:282–287
Schoener TW, Schoener A (1983) Distribution of vertebrates
on some very small islands: I.Occurrence sequences of
individual species. J Anim Ecol 52:209–235
Sekercioglu CH, Loarie SC, Oviedo-Brenes F, Daily GC,
Ehrlich PR (2007) Persistence of forest birds in the trop-
ical countryside. Conserv Biol 21:482–494
Silva M, Hartling L, Opps SB (2005) Small mammals in
agricultural landscapes of Prince Edward Island (Canada):
effects of habitat characteristics at three different spatial
scales. Biol Conserv 126:556–568
Simberloff DS (1972) Models in biogeography. In: Schopf
TJM (ed) Models in paleobiology. Freeman, San
Francisco
Simberloff DS (1978) Use of rarefaction and related methods
in ecology. In: Dickson KL, Cairns J Jr, Livingston RJ
(eds) Biological data in water pollution assessment:
quantitative and statistical analyses. American Society for
Testing and Materials, STP 652, Philadelphia
SPSS Inc (2005) SPSS for Windows Release 14.0.0. In. SPSS
Inc
Tscharntke T, Steffan-Dewenter I, Kruess A, Thies C (2002)
Contribution of small habitat fragments to conservation of
insect communities of grassland-cropland landscapes.
Ecol Appl 12:354–363
Turner IM (1996) Species loss in fragments of tropical rain
forest: a review of the evidence. J Appl Ecol 33:200–209
Ulrich W (2006) Nestedness—a FORTRAN program for cal-
culating ecological matrix temperature
Watling JI, Donnelly MI (2006) Fragments as islands: a syn-
thesis of faunal responses to habitat patchiness. Conserv
Biol 20:1016–1025
Williams NSG, Morgan JW, McCarthy MA, McDonnell MJ
(2006) Local extinction of grassland plants: the landscape
matrix is more important than patch attributes. Ecology
87:3000–3006
Wilsey BJ, Martin LM, Polley HW (2005) Predicting plant
extinction based on species–area curves in prairie frag-
ments with high beta richness. Conserv Biol 19:1835–
1841
Wilson M, Shmida A (1984) Measuring beta diversity with
presence–absence data. J Ecol 72:1055–1064
Wright DH, Reeves JH (1992) On the meaning and measure-
ment of nestedness of species assemblages. Oecologia
92:416–428
Wright DH, Patterson BD, Mikkelson GM, Cutler A, Atmar W
(1998) A comparative analysis of nested subset patterns of
species composition. Oecologia 113:1–20
Plant Ecol
123
Related Documents


![GEOGRAPHY - KopyKitab... distinguish between western ghats and eastern ghats [4m] c)What is drainage basin [2m] ... Difference between Western ghats and Eastern ghats [2m]](https://static.cupdf.com/doc/110x72/5aa043b77f8b9a7f178ddf76/pdfgeography-kopykitab-distinguish-between-western-ghats-and-eastern-ghats.jpg)
