PLANNING OPTIMUM LOCATION FOR WIRELESS TOWER IN GIS ENVIRONMENT A DISSERTATION Submitted in partial fulfillment of the requirements for the award of the degree of MASTER OF TECHNOLOGY in CIVIL ENGINEERING (With Specialization in Geomatics Engineering) By SVL!AY KUMAII C IIAUf$ASHA DEPARTMENT OF CIVIL ENGINEERING INDIAN INSTITUTE OF TECHNOLOGY ROORKEE ROORKEE-247 667 (INDIA) JUNE,, 2006 -

Welcome message from author
This document is posted to help you gain knowledge. Please leave a comment to let me know what you think about it! Share it to your friends and learn new things together.
Transcript
PLANNING OPTIMUM LOCATION FOR WIRELESS TOWER IN GIS ENVIRONMENT
A DISSERTATION
Submitted in partial fulfillment of the requirements for the award of the degree
of MASTER OF TECHNOLOGY
in CIVIL ENGINEERING
(With Specialization in Geomatics Engineering)
By
SVL!AY KUMAII C IIAUf$ASHA
DEPARTMENT OF CIVIL ENGINEERING INDIAN INSTITUTE OF TECHNOLOGY ROORKEE
ROORKEE-247 667 (INDIA)
JUNE,, 2006 -
CANDIDATE DECLARATION
I here by declare that the work presented as the project entitled "Planning Optimum Location
for Wireless Tower in GIS Environment" in partial fulfillment of requirements of award of the
Masters of Technology in Civil Engineering with specialization in Geomatics Engineering,
submitted in Civil Engineering, Indian Institute of Technology Roorkee, India, is an authentic
record of my own work carried under the guidance of Dr. P.K.Garg, Professor, Indian Institute of
Technology Roorkee
The matter submitted in this Thesis report has not submitted by me for the award of any other
degree.
Date: o/o6~aC \I~
Place: Roorkee (Vijay Kumar Chaurasia)
Certificate
This is to certify that the above statement made by the candidate is correct to the best of my
knowledge and belief.
(Dr. P.K.Ga g)
Professor,
Department of Civil Engineering,
Indian Institute of Technology Roorkee,
Roorkee — 247667, Uttaranchal, India
i
ACKNOWLEDGEMENT
It is a matter of great pleasure for me to express my deep sense of gratitude to Dr. P.K.Garg,
Professor, Department of civil Engineering, Indian Institute of Technology Roorkee, for his
meticulous guidance during the course of my whole Thesis work. The completion of this whole
work would have been impossible without his invaluable guidance and everlasting
encouragement. My association with them for excels the scope of this study and indeed it has
been a great experience. With deep regards, I thank him to make my work success.
My sincere thanks to all faculty members of Geomatics Engineering Section for their
constant encouragements, caring words, constructive criticism and suggestions towards the
successful completion of this work.
My sincere thanks to lab technicians and supporting staffs, who helped me timely. Also I am
grateful to my friend MISS POONAM NEGI and MR.VENKAT CHAUDHARY for their
moral support and encouragement.
Last but not the least, I am highly Indebted to my parents and family members, whose
sincere prayers, best wises moral support and encouragement have a constant source of
assurance, guidance, strength and inspiration to me.
DATED: Vijay Kumar Chaurasia
ii
ABSTRACT
Mobile cellular communication has already entered the mass market, and mobile internet
services will soon become a reality. The frequent use of mobile radio technologies for
people are has a direct impact on the deployment of base stations or radio access points,
including antennas. To serve an increasing number of users, it requires an increasing
number of base stations. Thus, operators must. carefully plan the deployment and
configurations of radio base stations in order to support at a level of quality expected by
customers. Planning is used to help radio engineers in their difficult tasks of balancing
requirements or radio coverage and quality with customer's satisfaction and other
practical aspects. These planning make extensive uses of functionalities very similar to a
Geographical Information System (GIS) or even to base their product on a GIS.
Furthermore, because radio communication between base stations and users is crucial, all
computations are based on the use of radio-propagation predictions. Until recently,
empirical propagation prediction seemed sufficient. However, more efficient planning
and the planning of nonvoice services or of a mixture of voice and nonvoice services
require more accurate propagation-prediction models. These propagation models are
usually based on the computation of the physical interaction of radio waves and the
environment. The establishment of tower cannot be performed efficiently manually
because of their complexity and because of the time pressure involved in deploying
costly infrastructure. Thus, there is a need of classification of area type and planning by
radio engineers to design, analyses, and compare various scenarios.
Thus, more detailed information is required, especially in urban environments
where most users are located. If we are going to establish the towers, there should be
need of consideration of road networks, railway lines and settlements of whole area
planning in land use area. The aim is to develop some relationship between radio-
propagation models used for mobile radio network planning and find the existed coverage
and establish the new wireless tower where coverage are very less (or no coverage). The
actual position of wireless towers can be identifying after ground survey only. The
simulation results show the use of conventional propagation models and rough
geographical databases for the planning of future cellular systems.
CONTENTS
Page No.
CANDIDATE'S DECLARATION i
CERTIFICATE
ACKNOWLEDGEMENNTS ii
ABSTRACT iii
CONTENTS iv
LIST OF FIGURES vii
LIST OF TABLES x
CHAPTER 1 INTRODUCTION 1
1.1 GENERAL 1
1.2 DEMAND OF THE WIRELESS TOWER 2
1.3 BJECTIVES OF STUDY 2
CHAPTER2 MOBILE COMMUNICATION: BASICS 3
2.1 THE GENERATION OF MOBILE NETWORKS 3
2.2 ARCHITECTURE OF WIRELESS NETWORKS 4
2.2.1 Mobile Station (MS) 5
2.2.2 Base Transceiver Station (BTS) or Cell Tower 6
2.2.3 Mobile Switching Center (MSC) 6
2.2.4 Public Switched Telephone Network (PSTN) 7
2.2.5 Location Registers 7
2.2.6 Equipment Identity Register (EIR) 8
2.2.7 Authentication Center (AUC) 8
iv
2.3 GLOBAL SYSTEM FOR MOBILE COMMUNICATION (GSM) 8
2.4 UP LINK/ DOWN LINK FREQUANCIES 9
CHAPTER 3 THE CELLULAR CONCEPT 10
3.1 GENERAL 11
3.2 CELL SHAPE 11
3.3 FREQUANCY REUSE 12
3.4 CONCEPT OF HANDOFF 13
3.5 CONCEPT OF TRUNKING 15
CHAPTER 4 COVERAGE PLANNING 16
4.1 GENERAL 16
4.2 COVERAGE DEFINITION 17
4.3 AREA DEFINITION 17
4.3.1 Definition of Morphology Classification 17
4.3.1.1. Dense urban 17
4.3.1.2 Urban 17
4.3.1.2 Suburban 18
4.3.1.3 Rural 18
4.4 PROPAGATION PREDICTION MODELS 18
4.4.1 Okumura Hata Model 20
4.4.2 Maximum Path Losses Allowed 21
4.5 SPECIFIC COVERAGE REQUIREMENT 21
4.6 SPECIFIC RESTRICTIONS 22
v
CHAPTER 5 DATA SET AND METHODOLOGY 23
5.1 GENERAL 23
5.2 THE STUDY AREA 23
5.3 GIS DATA SET 24
5.3.1 Topographical Maps 24
5.3.2 Municipal Digital Maps 24
5.3.3 PAN (Panchromatic) Data 26
5.4 SITE PARAMETERS 27
5.4.1 EIRP (Elective Isotopic Radiated Power) Values 29
5.4.2 Site names, Locations and Antenna Heights 29
5.4.3 Up link/Down link Frequencies 30
5.5 SOFT WARES USED IN COVERAGE PLANNING 31
5.5.1 Are GIS 8.3 31
5.5.2 ERADAS Imagine 8.6 32
5.5.3 Visual Basic 6.0 32
5.6 METHODOLOGY 32
5.6.1 Registration 33
5.6.2 Mosaicking 33
5.6.3 Digitization 34
5.6.4 Overlay 34
5.6.5 Buffer 35
5.6.5.1 Buffer for the coverage planning 35
5.6.5.2 Buffer for the road networks and railway lines 35
5.6.6 Thiessen Polygon 35
5.7 WORK FLOW DIAGRAM 38
vi
CHAPTER 6 RESULTS AND DISCUSSION 41
6.1 GENERAL 41
6.2 DIGITIZATION OF POINTS, LINES AND POLYGONS FEATURES 41
6.2.1 Points Features 41
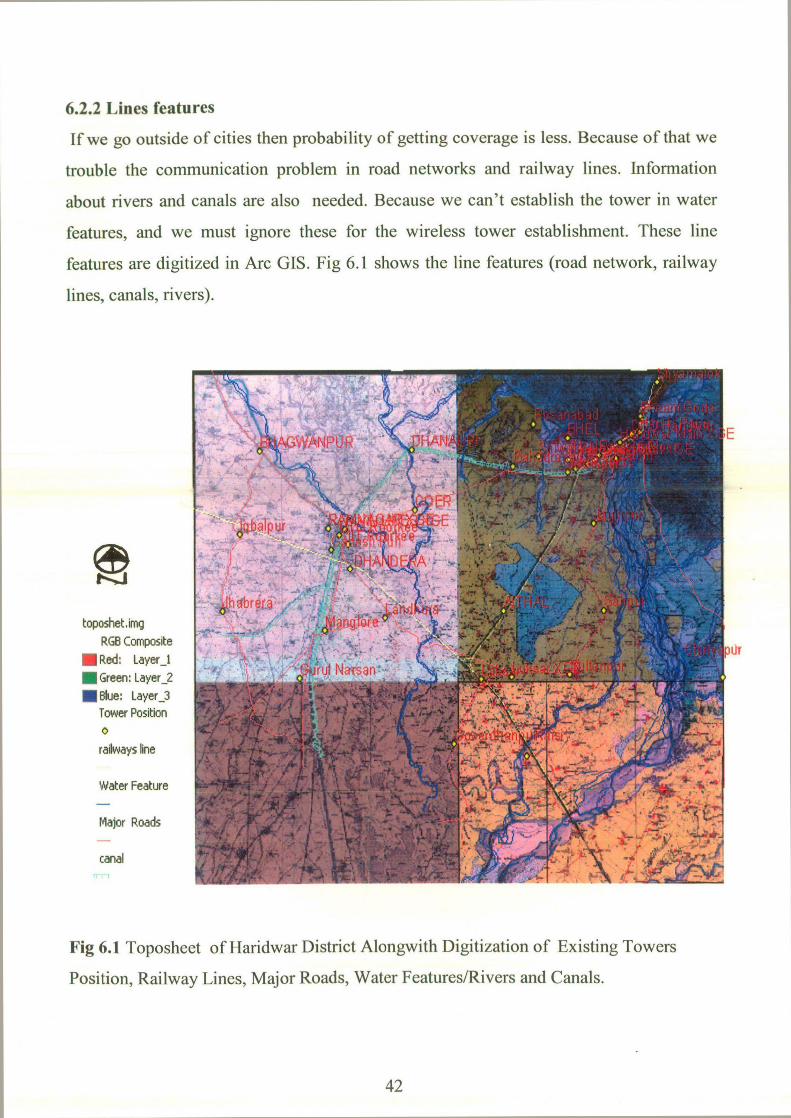
6.2.2 Lines features 42
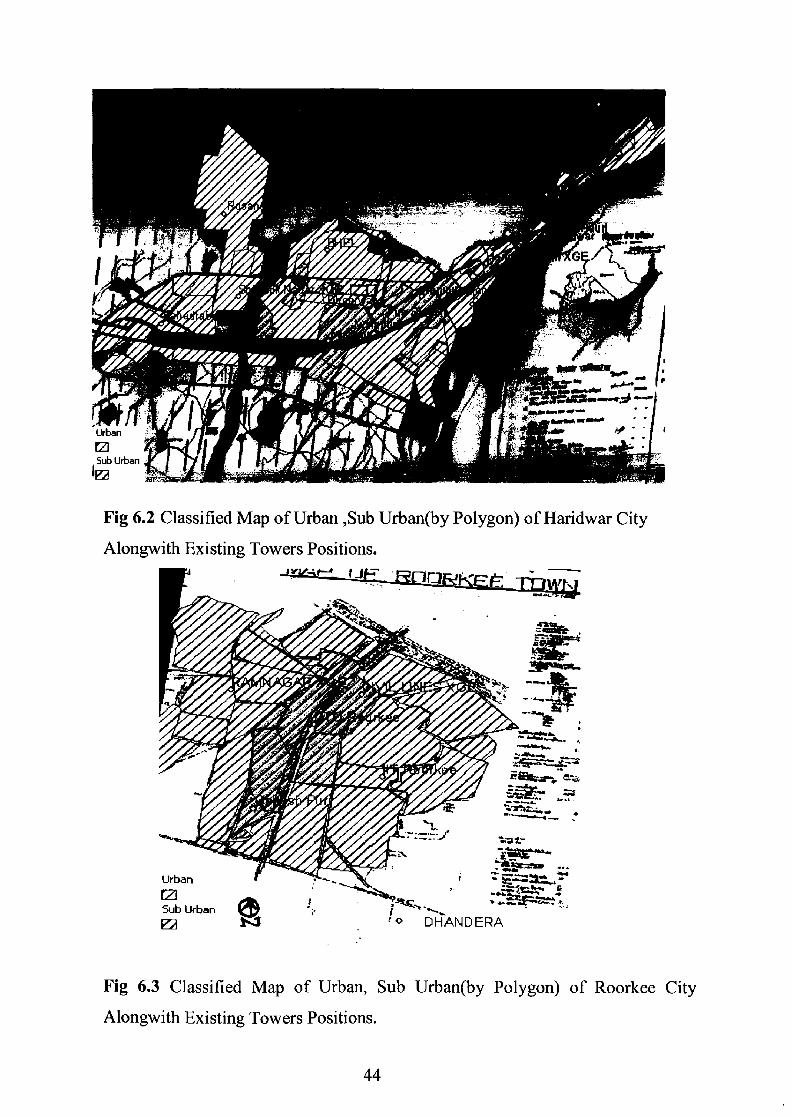
6.2.3 Polygon Features
6.3 OVERLAY OF FEATURES 43
6.4 ANALYSIS OF OKUMURA HATA MODEL FOR 43
COVERAGE PLANNING
6.4.1 Decision of the Area Type and Coverage 46
6.5 BUFERING AROUND THE EXISTING POSITIONS 55
6.6 BUFFERING AROUND THE LINE FEATURES 55
6.7 THEISSEN POLYGON ANALYSIS 56
6.8 NEW TOWER POSITION 59
6.9 RESULTS 65
CHAPTER 7 CONCLUSION 66
7.1 CONCLUSION 66
REFRENCES 67
vii
LIST OF FIGURES
S. No. Title Page No.
2.1 Architecture of Wireless Networks 6
2.2 Concept of uplink/down link scenario 9
2.3 Frequency division for uplink/down link 10
3.1 Concept of cell shape 12
3.2 Concept of Reuse 13
3.3 Handoff scenario in cellular systems 14
5.1 Haridwar district in Uttranchal State of India 24
5.2 Mosaic Topographical maps at 1:50,000 Scale (Source: Survey of India) 25
5.3 Map of Haridwar City at 131db0 scale 26
5.4 Map of Roorkee city at 1 1200 scale 27
5.5 Mosaic PAN image with boundary of Haridwar District 28
5.6 Concept of Thiessen polygons 36
5.7 Work flow diagram 40
6.1 Toposheet of Haridwar District Alongwith Digitization of Existing 42
Towers Position, Railway Lines, Major Roads, Water Features/Rivers
and Canals.
6..2 Classified Map of Urban ,Sub Urban(by Polygon) of Haridwar City 44
Alongwith Existing Towers Positions.
6.3 Classified Map of Urban, Sub Urban(by Polygon) of Roorkee City 44
Alongwith Existing Towers Positions.
viii
6.4 Classified PAN Image of Urban, Sub Urban,Dense Forest and Hilly 45
Forest (by Polygon Digitization) Alongwith Existing Towers Positions
6.5 Overlay of Road Network, Railway Lines, Canal, River, Urban, 45
Sub Urban, Dense Forest, Hilly Forest at PAN Image Alongwith
Existing Tower Position
6.6 Okumura Hata Model (programming in Visual Basic 6.) 47
6.7 Coverage (More than 90% Probability of Getting Signal) of Existing 56
Towers in Haridwar District.
6.8 Buffer Created Both Side of Major Roads and Railway 57 Lines( for Rural=3 km,Sub urban=1 km ,Urban =0.5 km)
6.9 Information About the Urban, Sub Urban, Hilly Forest, Canals, 58
Railway Lines, Rivers Major roads and buffer in Haridwar city along with
Existing Wireless Tower Positions.
6.10 Information About the Urban ,Sub Urban, Canals, Railway Line, 58
River Major Roads and Buffer in Roorkee City Along with Existing
Wireless Tower Positions.
6.11 Information About the Sub Urban, Rrailway Line, Major Roads 59 and Buffer in Laksar Alongwith Existing Wireless Towers Positions.
6.12 Created Thiessen Polygon ( Dark Red Lines) on Image 60
6.13 Position of New WirelessTowers
6.14 Position of New Wireless Tower in Haridwar City. 63
6.15 Position of Existing Wireless Tower and New Wireless Tower 64
in Haridwar District.
ix
LIST OF TABLES
S. No. Title Page No.
4.1 Signal Strength and Coverage Probability 16
5.1 Site Name, Latitude/Longitude and Antenna Height of Existing 29
Wireless Tower in Haridwar District (Source: BSNL Haridwar)
5.2 Up Link /Down Link Spectrum of Frequencies and Centre of the 30
Frequencies of existing Wireless Tower in Haridwar District
(Source: BSNL Haridwar)
6.1 Site Name , Lat/Long and Area Type of New Wireless Towers. 65
x
CHAPTER! INTRODUCTION
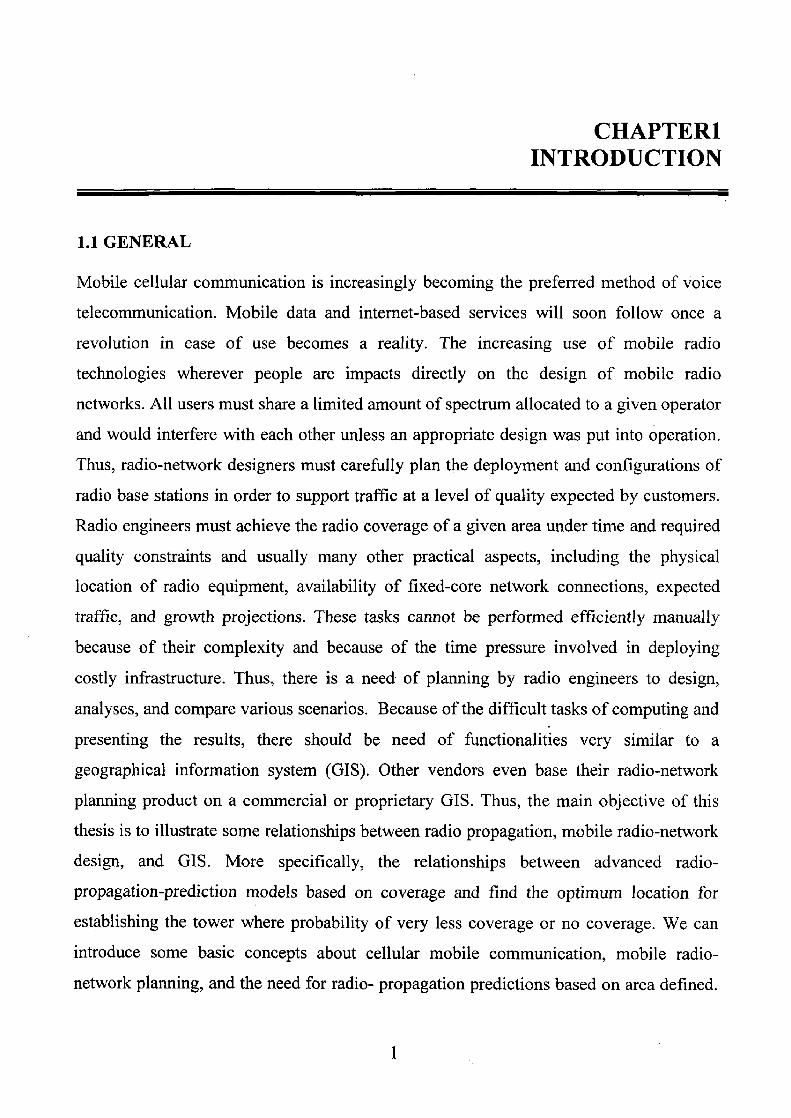
1.1 GENERAL
Mobile cellular communication is increasingly becoming the preferred method of voice
telecommunication. Mobile data and internet-based services will soon follow once a
revolution in ease of use becomes a reality. The increasing use of mobile radio
technologies wherever people are impacts directly on the design of mobile radio
networks. All users must share a limited amount of spectrum allocated to a given operator
and would interfere with each other unless an appropriate design was put into operation.
Thus, radio-network designers must carefully plan the deployment and configurations of
radio base stations in order to support traffic at a level of quality expected by customers.
Radio engineers must achieve the radio coverage of a given area under time and required
quality constraints and usually many other practical aspects, including the physical
location of radio equipment, availability of fixed-core network connections, expected
traffic, and growth projections. These tasks cannot be performed efficiently manually
because of their complexity and because of the time pressure involved in deploying
costly infrastructure. Thus, there is a need- of planning by radio engineers to design,
analyses, and compare various scenarios. Because of the difficult tasks of computing and
presenting the results, there should be need of functionalities very similar to a
geographical information system (GIS). Other vendors even base their radio-network
planning product on a commercial or proprietary GIS. Thus, the main objective of this
thesis is to illustrate some relationships between radio propagation, mobile radio-network
design, and GIS. More specifically, the relationships between advanced radio-
propagation-prediction models based on coverage and find the optimum location for
establishing the tower where probability of very less coverage or no coverage. We can
introduce some basic concepts about cellular mobile communication, mobile radio-
network planning, and the need for radio- propagation predictions based on area defined.
1
The use of planning tools for radio-network planning is further explained. It can be
introduce the need for mobile radio-network-planning for a graphical user interface
(GUI) based on the capabilities of a GIS.
1.2 DEMAND OF THE WIRELESS TOWER
It is seen coverage problem in the area. commonly world is says like "he is on his way
that's why we are able to contact him" or "he is in the train or Bus ,so signal is not
catching". This is the cause of coverage problem. This is depending upon type of clutters
in that area and lack of available wireless towers. There should be more towers for
getting better coverage. If a person is getting coverage then at least he will get more
chance for communication. No coverage and less coverage area should identify for
establishing the new towers. The coverage may be planned so that it covers whole area of
cities major roads, railway lines, and all towns/villages.
1.3 BJECTIVES OF STUDY
The objectives of this thesis are as follows:
1. Planning optimum location for mobile tower in GIS environment in Haridwar district.
2. Finding the towers positions for providing the better coverage of signals using GIS in
Haridwar District.
3. Describing the propagation model tuning procedure for BSNL for their GSM 900
network in GIS environment.
4. By the new towers positions for capturing the mass market in this competitive by
increasing the number of users in Haridwar District.
2
CHAPTER2
MOBILE COMMUNICATION: BASICS
2.1 THE GENERATION OF MOBILE NETWORKS
The idea of cell-based mobile radio systems appeared at Bell Laboratories in the United
States in the early 1970s. However, mobile cellular systems were not introduced for
commercial use until a decade later. During the early 1980's, analog cellular telephone
systems experienced very rapid growth in Europe, particularly in Scandinavia and the
United Kingdom. Today, cellular systems still represent one of the fastest growing
telecommunications systems. During development, numerous problems arose as each
country developed its own system, producing equipment limited to operate only within
the boundaries of respective countries, thus limiting the markets in which services could
be sold. First-generation cellular networks, the primary focus of the communications
industry in the early 1980's, were characterized by a few compatible systems that were
designed to provide purely local cellular solutions. It became increasingly apparent that
there would be an escalating demand for a technology that could facilitate flexible and
reliable mobile communications.
By the early 1990's, the lack of capacity of these existing networks emerged as a core
challenge to keeping up with market demand. The first mobile wireless phones utilized
analog transmission technologies, the dominant analog standard being known as
"AMPS", (Advanced Mobile Phone System). Analog standards operated on bands of
spectrum with a lower frequency and greater wavelength than subsequent standards,
providing a significant signal range per cell along with a high propensity for interference
Nonetheless, it is worth noting the continuing persistence of analog (AMPS) technologies
in North America and Latin America through the 1990's. Initial deployments of second-
generation wireless networks occurred in Europe in the 1980's. These networks were
based on digital, rather than analog technologies, and were circuit-switched. Circuit-
switched cellular data is still the most widely used mobile wireless data service. Digital
technology offered an appealing combination of performance and spectral efficiency (in
3
terms of management of scarce frequency bands), as well as the development of features
like speech security and data communications over high quality transmissions. It is also
compatible with Integrated Services Digital Network (ISDN) technology, which was
being developed for land-based telecommunication systems throughout the world, and
which would be necessary for GSM to be successful. Moreover in the digital world, it
would be possible to employ very large-scale integrated silicon technology to make
handsets more affordable. To a certain extent, the late 1980's and early 1990's were
characterized by the perception that a complete migration to digital cellular would take
many years, and that digital systems would suffer from a number of technical difficulties
(i.e., handset technology).
However, second-generation equipment has since proven to offer many advantages over
analog systems, including efficient use of radio-magnetic spectrum, enhanced security,
extended battery life, and data transmission capabilities. There are four main standards
for 2G networks: Time Division Multiple Access (TDMA), Global System for Mobile
Communications (GSM) and Code Division Multiple Access (CDMA); there is also
Personal Digital Cellular (PDC), which is used exclusively in India In the meantime, a
variety of 2.5G standards have been developed. `Going digital' has led to the emergence
of several major 2G mobile wireless systems.
2.2 ARCHITECTURE OF WIRELESS NETWORKS
The early versions of analog cellular networks are called as first generation networks.
The current digital cellular networks are called second generation networks and the future
cellular networks under development are called third generation networks. First
Generation Wireless Networks All first generation cellular networks are based on analog
technology and use FM modulation. An example of the first generation cellular telephone
system is Advanced Mobile Phone Services (AMPS) The block diagram of a first
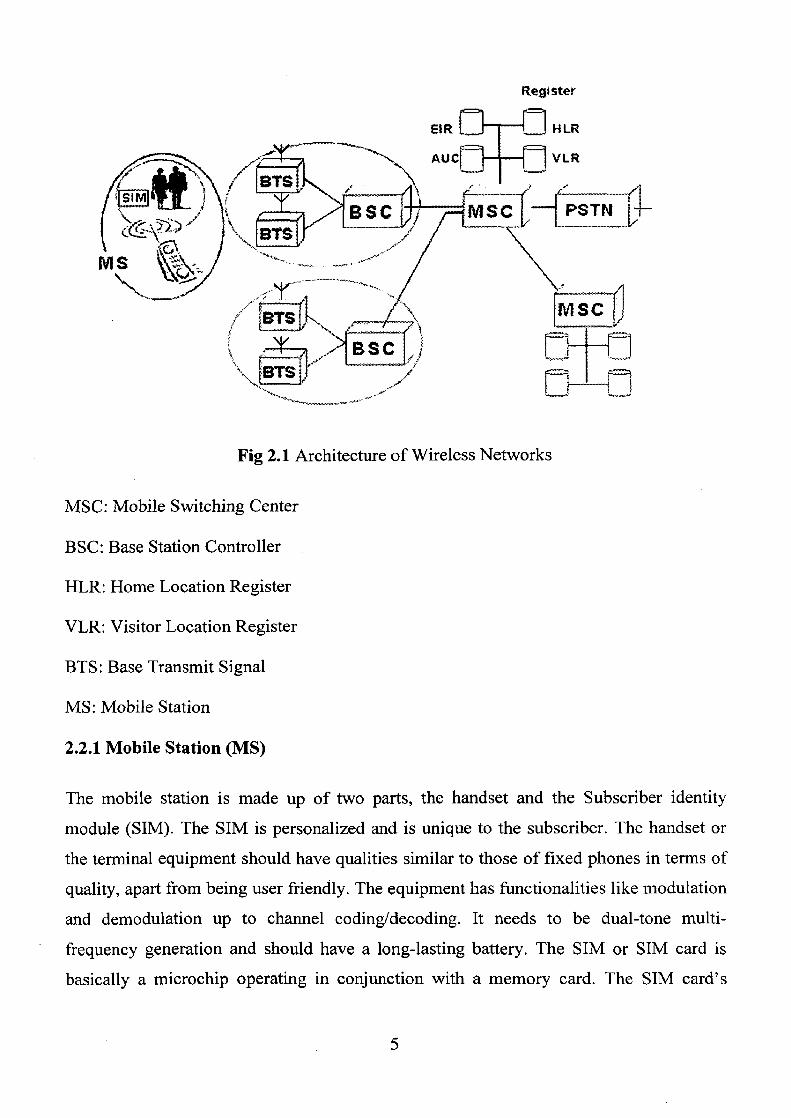
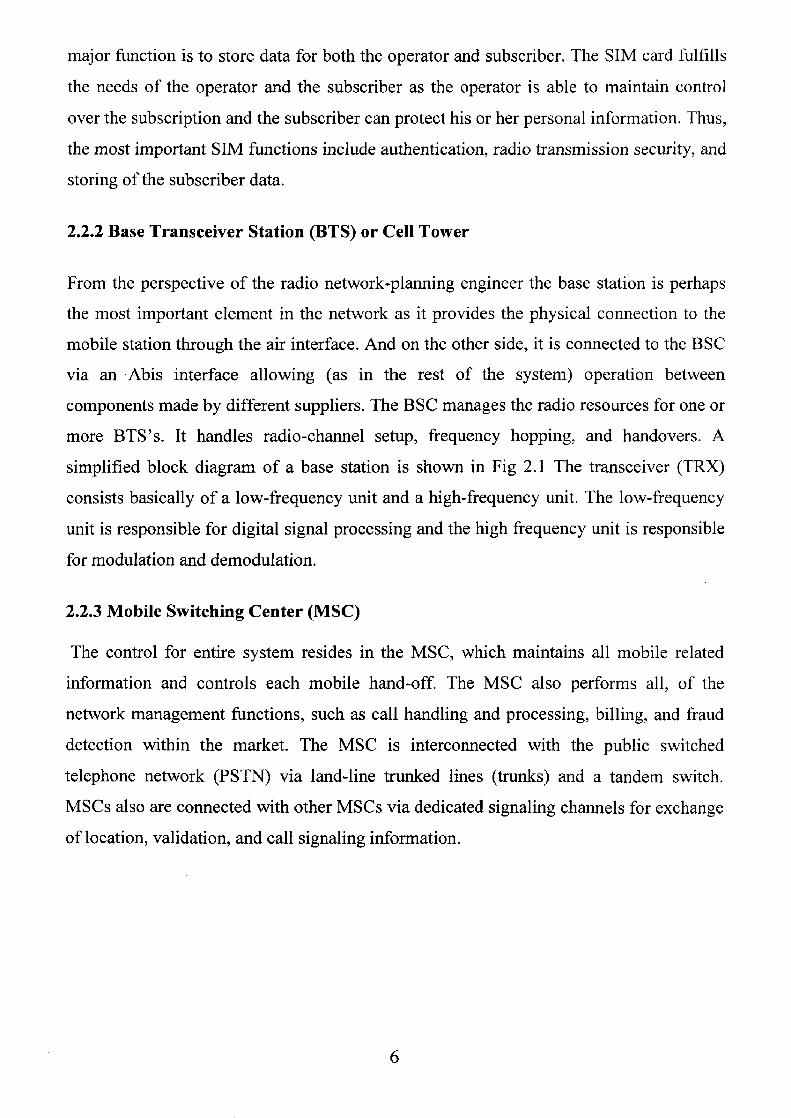
generation cellular radio network architecture is shown in Fig 2.1, which includes the
mobile terminals, the base station and the mobile switching center (MSC).
r
j` BT SI M ! . '~
y
\ B S~ G
~ Cam ..'"°.. ~~ L IBTS }'
MS) •;Ii; BTS(l'..
Register
HLR
auc VLR
S PSTN ~V
MSC
Fig 2.1 Architecture of Wireless Networks
MSC: Mobile Switching Center
BSC: Base Station Controller
HLR: Home Location Register
VLR: Visitor Location Register
BTS: Base Transmit Signal
MS: Mobile Station
2.2.1 Mobile Station (MS)
The mobile station is made up of two parts, the handset and the Subscriber identity
module (SIM). The SIM is personalized and is unique to the subscriber. The handset or
the terminal equipment should have qualities similar to those of fixed phones in terms of
quality, apart from being user friendly. The equipment has functionalities like modulation
and demodulation up to channel coding/decoding. It needs to be dual-tone multi-
frequency generation and should have a long-lasting battery. The SIM or SIM card is
basically a microchip operating in conjunction with a memory card. The SIM card's
5
major function is to store data for both the operator and subscriber. The SIM card fulfills
the needs of the operator and the subscriber as the operator is able to maintain control
over the subscription and the subscriber can protect his or her personal information. Thus,
the most important SIM functions include authentication, radio transmission security, and
storing of the subscriber data.
2.2.2 Base Transceiver Station (BTS) or Cell Tower
From the perspective of the radio network-planning engineer the base station is perhaps
the most important element in the network as it provides the physical connection to the
mobile station through the air interface. And on the other side, it is connected to the BSC
via an Abis interface allowing (as in the rest of the system) operation between
components made by different suppliers. The BSC manages the radio resources for one or
more BTS's. It handles radio-channel setup, frequency hopping, and handovers. A
simplified block diagram of a base station is shown in Fig 2.1 The transceiver (TRX)
consists basically of a low-frequency unit and a high-frequency unit. The low-frequency
unit is responsible for digital signal processing and the high frequency unit is responsible
for modulation and demodulation.
2.2.3 Mobile Switching Center (MSC)
The control for entire system resides in the MSC, which maintains all mobile related
information and controls each mobile hand-off. The MSC also performs all, of the
network management functions, such as call handling and processing, billing, and fraud
detection within the market. The MSC is interconnected with the public switched
telephone network (PSTN) via land-line trunked lines (trunks) and a tandem switch.
MSCs also are connected with other MSCs via dedicated signaling channels for exchange
of location, validation, and call signaling information.
31
2.2.4 Public Switched Telephone Network (PSTN)
PSTN is a separate network from the SS7 (Signaling System 7) signaling network. In
modern cellular telephone systems, Iong distance voice traffic is carried on the PSTN, but
the signaling information used to provide call set-up and to information used to provide
call set-up and inform MSCs about a particular user is carried on the SS7 network.
Network protocol allows different cellular systems to automatically accommodate
subscribers who roam into their coverage region. Protocol allows MSCs of different
service providers to pass information about their subscribers to other MSCs on demand. .
The mobile accomplishes autonomous registration by periodically keying up and
transmitting its identity information, which allows the MSC to constantly update its
subscriber list.
2.2.5 Location Registers
With each MSC, there is associated a Visitors Location Register (VLR). The VLR can be
associated with one or several MSCs. The VLR stores data about all customers who are
roaming within the location area of that MSC. This data is updated with the location
update procedure initiated from the MS through the MSC, or directly from the subscriber
Home Location Register (HLR). The HLR is the home register of the subscriber.
Subscription information, allowed services, authentication information and localization of
the subscriber are at all times stored in the HLR. This information may be obtained by the,
VLR/MSC when necessary. When the subscriber roams into the location area of another
VLR/MSC, the HLR is updated. At mobile terminated calls, the HLR is interrogated to
find which MSC the MS is registered with. Because the HLR is a centralized database
that need to be accessed during every call setup and data transmission in the GSM
network, this entity need to have a very large data transmission capacity. Suggests a
scheme for distributing the data in the HLR in order to reduce the load.
7
2.2.6 Equipment Identity Register (EIR)
The Equipment Identity Register (EIR) is an optional register. Its purpose is to register of
mobile stations in use. By implementing the EIR the network provider can blacklist
malfunctioning MSs or even receive reports to the operations centre when stolen mobile
stations are used to make calls.
2.2.7 Authentication Center (AUC)
Authenticates users and validates accounts. It is used for authentication activities, holds
encryption keys. The system is designed to authenticate the subscriber using share secrets
cryptography. Communications between the subscriber and the base station can be
encrypted. If the authentication fails, then no services are possible from that particular
combination of SIM card. Since the radio medium can be accessed by anyone,
authentication of users to prove that they are who they claim to be is a very important
element of a mobile network. Authentication involves two functional entities, the SIM
card in the mobile, and the Authentication Center (AuC). Each subscriber is given a
secret key, one copy of which is stored in the SIM card and the other in the AuC. During
authentication, the AuC generates a random number that it sends to the mobile. Both the
mobile and the AuC then use the random number.
2.3 GLOBAL SYSTEM FOR MOBILE COMMUNICATION (GSM)
The GSM network uses the frequencies 900 MHz (GSM 900) and 1800 MHz (GSM
1800). The GSM network which was established in the middle of the nineties is using the
frequency 1900 MHz. A technical trick, the so-called time slot method increases the
number of simultaneous cellular phone users. Since radio spectrum is a limited resource
shared among all users, GSM introduced the method for splitting the bandwidth among as
many users as possible. The method is a combination of Time and Frequency Division
Multiple Access (TDMA/FDMA). The FDMA part involves the division by frequency of
the (maximum) 25 MHz bandwidth into 124 carrier frequencies spaced 200 kHz apart
and one carrier frequency is use for guard band . One or more carrier frequencies are
E9
assigned to each base station. Each of these carrier frequencies is then divided in time,
using TDMA scheme, into 8 logical channels. Means every single channel is divided into
8 time slots maximum in which data can be sent or received. Precisely speaking 8 users
per channel maximum can send or receive data every 4.62 milliseconds for 0.577
milliseconds before the frequency is released for the next mobile terminal. During the
radio link the time slot remains reserved even if no data is sent or received.
This main principle which corresponds to the conventional network connection is
described as "circuit switching" in the GSM system. Its advantage is certainly that data is
easily associated to a connection and does not need to have a complicated encoding first.
However, the more profound disadvantage is that the existing connection must be paid
for during the reserved period as well as during interferences. This may be acceptable for
a standard phone call but it gets expensive and binds transmission capacity if data isn't
permanently transmitted. Data must be read by the receiver first before new data can be
retrieved. The GSM standard was developed only for voice transmission.
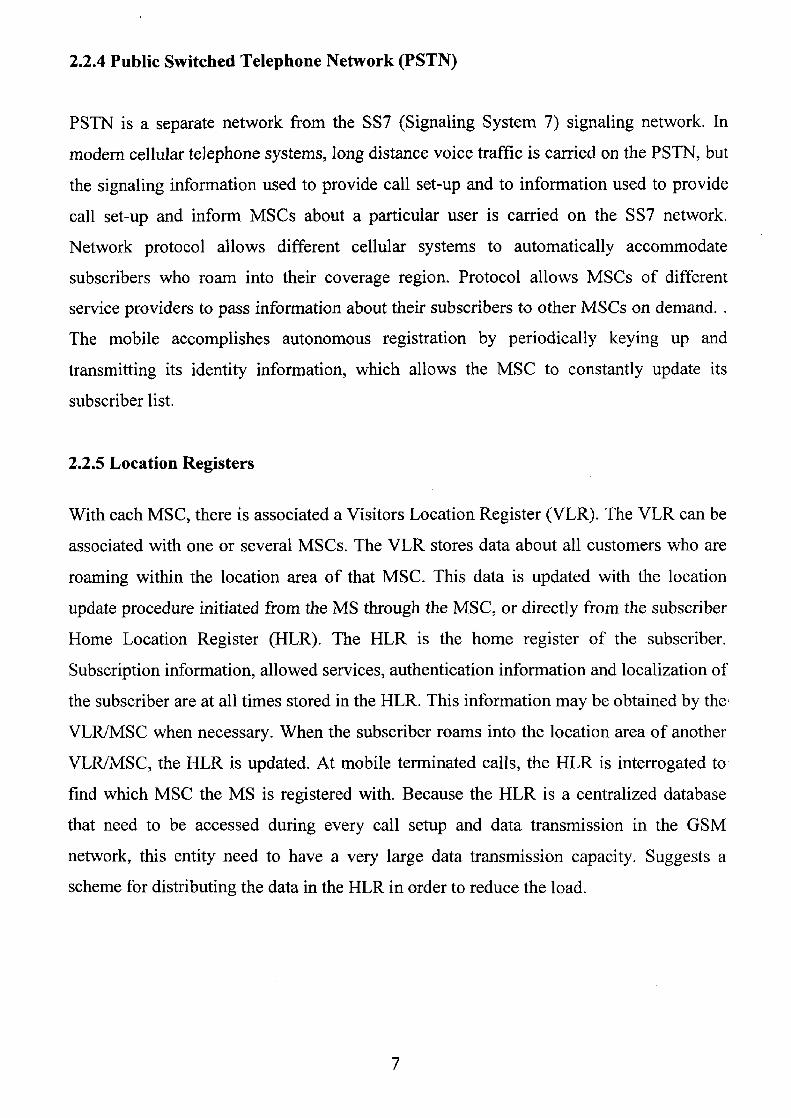
2.4 UP LINK/ DOWN LINK FREQUANCIES
Uplink (UL) is the direction from the MS to the BTS. The uplink gives the power level
received in the base station. Downlink (DL) is the direction from the BTS to the MS
(Fig2.2). The downlink budget gives the power level received in the MS.
Fig 2.2 Concept of uplink/down link scenario
E
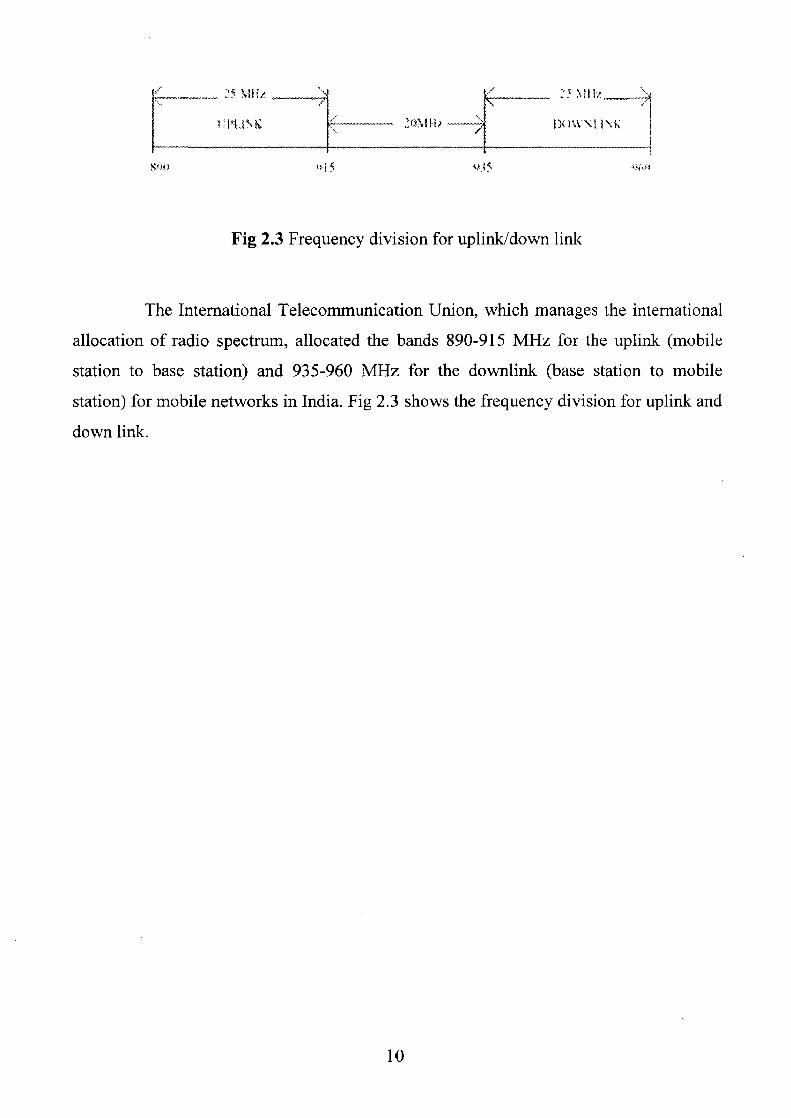
Fig 2.3 Frequency division for uplink/down link
The International Telecommunication Union, which manages the international
allocation of radio spectrum, allocated the bands 890-915 MHz for the uplink (mobile
station to base station) and 935-960 MHz for the downlink (base station to mobile
station) for mobile networks in India. Fig 2.3 shows the frequency division for uplink and
down link.
10
CHAPTER 3 THE CELLULAR CONCEPT
3.1 GENERAL
The cellular concept was a major breakthrough in solving the problem of spectral
congestion and user capacity. It offered high capacity with a limited spectrum allocation
without any major technological changes. The cellular concept is a system level idea in
which a single, large cell is replaced with many small cells. The area serviced by a
transmitter is called a cell. Each small, also called a base station provides coverage to
only a small portion of the service area. Base stations close to one another are assigned
different groups of channels so that all the available channels are assigned to a relatively
small number of neighboring base stations. Neighboring base stations are assigned
different groups of channels so that the interference between base stations is minimized.
By symmetrically spacing base stations and their channel groups throughout a service
area, the available channels are distributed throughout the geographic region and may be
reused as many times as necessary, so long as the interference between co-channel
stations is kept below acceptable levels. As the demand for service increases, the number
of base stations may be increased, thereby providing additional capacity with no increase
in radio spectrum. This fundamental principle is the foundation for modern mobile
communication systems, since it enables a fixed number of channels to serve an
arbitrarily large number of subscribers by reusing the channels throughout the region.
3.2 CELL SHAPE
In mobile networks we talk in terms of `cells'. The base stations can have many cells. In
general, a cell can be defined as the area covered by base station. The hexagonal nature of
the cell is an artificial shape (Fig 3.1). This is the shape that is closest to being circular,
which represents the ideal coverage of the power transmitted by the base station antenna.
11
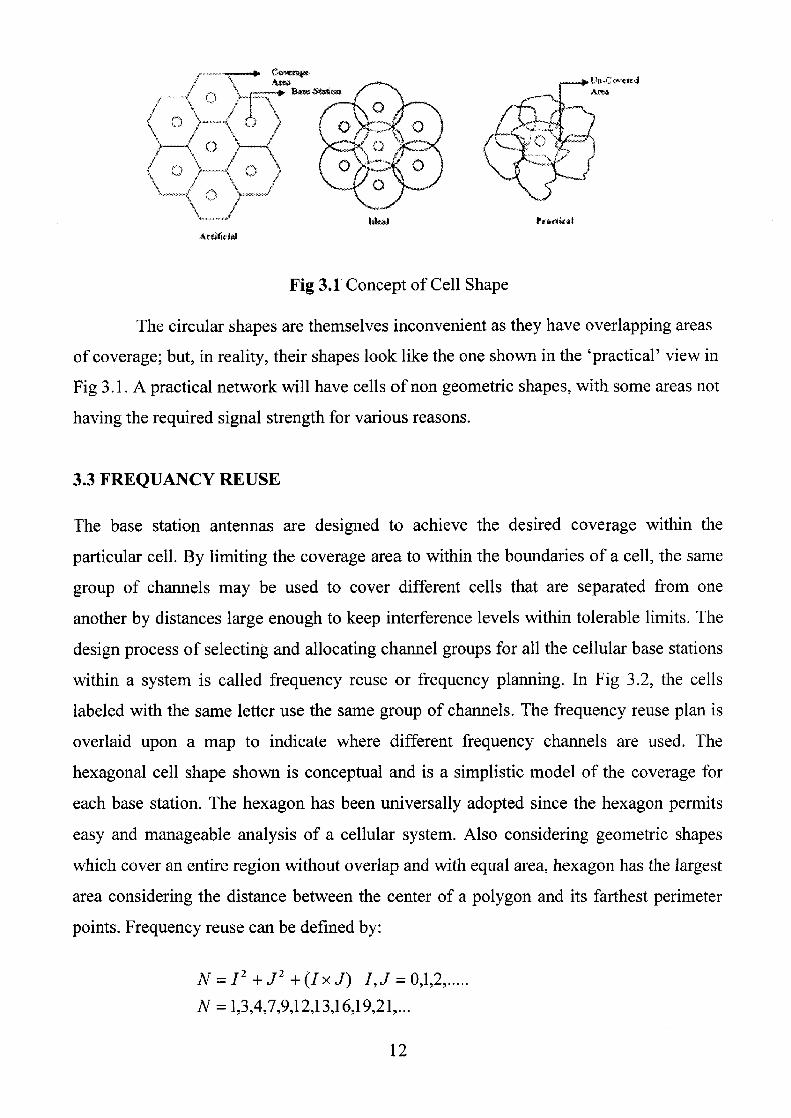
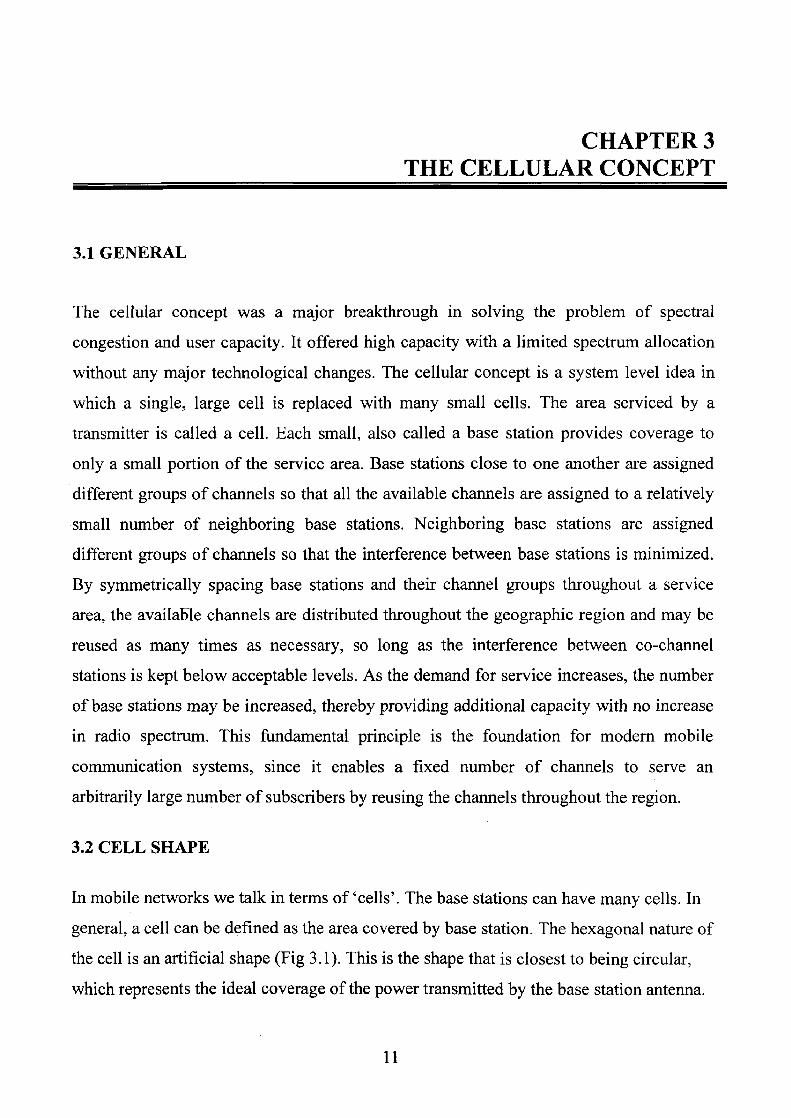
Fig 3.1 Concept of Cell Shape
The circular shapes are themselves inconvenient as they have overlapping areas
of coverage; but, in reality, their shapes look like the one shown in the `practical' view in
Fig 3.1. A practical network will have cells of non geometric shapes, with some areas not
having the required signal strength for various reasons.
3.3 FREQUANCY REUSE
The base station antennas are designed to achieve the desired coverage within the
particular cell. By limiting the coverage area to within the boundaries of a cell, the same
group of channels may be used to cover different cells that are separated from one
another by distances large enough to keep interference levels within tolerable limits. The
design process of selecting and allocating channel groups for all the cellular base stations
within a system is called frequency reuse or frequency planning. In Fig 3.2, the cells
labeled with the same letter use the same group of channels. The frequency reuse plan is
overlaid upon a map to indicate where different frequency channels are used. The
hexagonal cell shape shown is conceptual and is a simplistic model of the coverage for
each base station. The hexagon has been universally adopted since the hexagon permits
easy and manageable analysis of a cellular system. Also considering geometric shapes
which cover an entire region without overlap and with equal area, hexagon has the largest
area considering the distance between the center of a polygon and its farthest perimeter
points. Frequency reuse can be defined by:
N=I 2 +J 2 +(IxJ) I,J=0,1,2,..... N =1,3,4,7,9,12,13,16,19,21,...
12
4-Cell frequency reuse 7- Cell frequency reuse
Fig 3.2 Concept of Reuse
Where N is the no. of cell frequency reuse. But seven cell frequency reuse concept is
mostly use Frequency reuse concept can be seen in Fig 3.2 where different colors shows
in group of four and seven cells. For example in the case of four groups green colour(cell) assign again at the farthest distance in another groups by the same green color and in case of seven group blue color is assign again at the farthest distance in
another group. In four cell frequency reuse concept reuse is stronger but interference will be more. So seven cell frequency reuse concept is frequently using.
3.4 CONCEPT OF LIANDOFF
When a mobile moves into a different cell while a call is in progress, the mobile switching center (MSC) automatically transfers the call to a new channel belonging to the new base station.
13
}
11nae q
/. Li;asc tihifin 5 • i'nii+rn I.
Cell s% C01 R
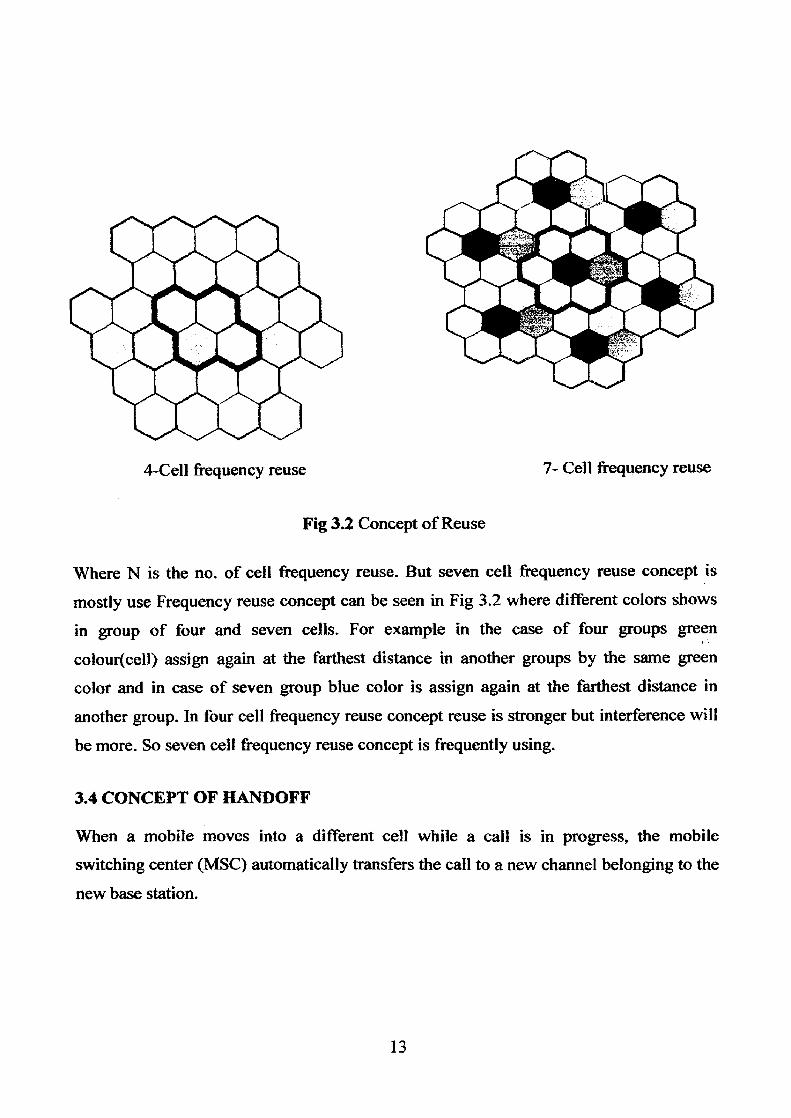
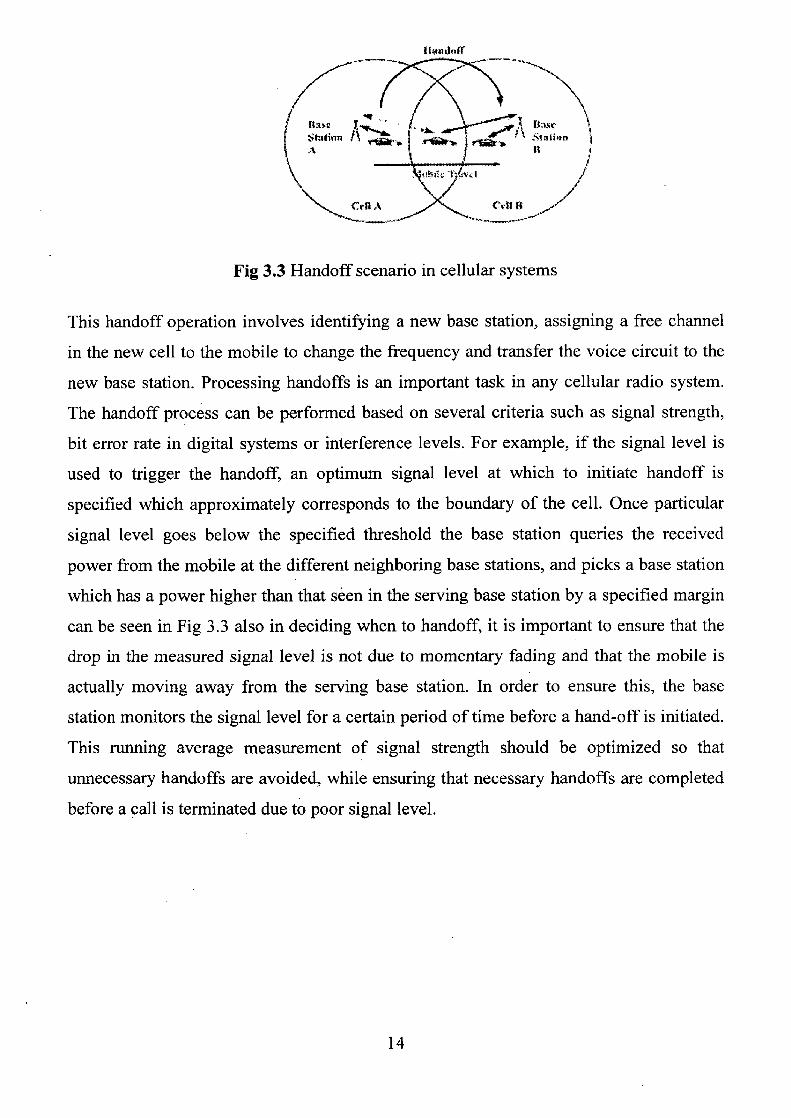
Fig 3.3 Handoff scenario in cellular systems
This handoff operation involves identifying a new base station, assigning a free channel
in the new cell to the mobile to change the frequency and transfer the voice circuit to the
new base station. Processing handoffs is an important task in any cellular radio system.
The handoff process can be performed based on several criteria such as signal strength,
bit error rate in digital systems or interference levels. For example, if the signal level is
used to trigger the handoff, an optimum signal level at which to initiate handoff is
specified which approximately corresponds to the boundary of the cell. Once particular
signal level goes below the specified threshold the base station queries the received
power from the mobile at the different neighboring base stations, and picks a base station
which has a power higher than that seen in the serving base station by a specified margin
can be seen in Fig 3.3 also in deciding when to handoff, it is important to ensure that the
drop in the measured signal level is not due to momentary fading and that the mobile is
actually moving away from the serving base station. In order to ensure this, the base
station monitors the signal level for a certain period of time before a hand-off is initiated.
This running average measurement of signal strength should be optimized so that
unnecessary handoffs are avoided, while ensuring that necessary handoffs are completed
before a call is terminated due to poor signal level.
14
3.5 CONCEPT OF TRUNKING
Cellular systems depend on trunking to accommodate a large number of subscribers in a
limited number of channels. The concept of trunking allows a large number of users to
share a relatively small number of channels by providing access to each user, on demand,
from a pool of available channels. In a trunked system, each user is assigned a channel on
a per call basis, and upon termination of the call, the previously occupied channel is
immediately returned to the pool of available channels. Trunking exploits the statistical
behavior of users so that a fixed number of channels or circuits may accommodate a large
number of users. The grade of service (GOS) is a measure of the ability of a user to
access a trunked system during the busiest hour of call traffic. It is clear that there is a
trade-off between the number of available channels and the likelihood of a particular user
finding that no channels are available during the peak calling time. The number of
channels required is determined based the number of subscribers, desired GOS, average
call holding time and traffic distribution with time.
15
CHAPTER 4
COVERAGE PLANNING
4.1 GENERAL
Radio coverage is frequently perceived to be the most important measurement for
network quality. Radio coverage planning plays a major role in GSM network planning,
because it decides extent of coverage area, speech quality, mobility and customer
satisfaction. Various forms of inputs and limitations from the customer in terms of
spectrum availability, network dimensions, frequency planning, network growth, local
wireless regulations and finally the RF (Radio Frequency) environment itself plays an
important role in coverage planning. The approach for the coverage plan needs to be well
defined since; it requires to accommodate various phases of network growth across time
without any compromise on service quality goal.
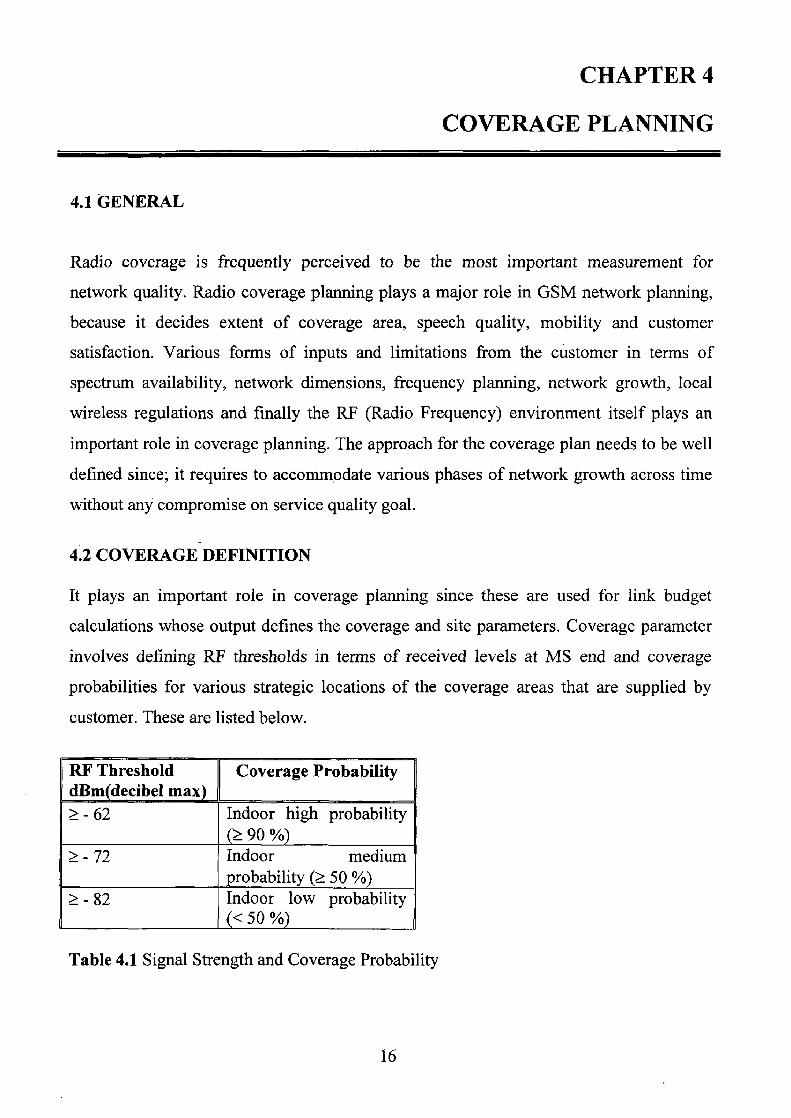
4.2 COVERAGE DEFINITION
It plays an important role in coverage planning since these are used for link budget
calculations whose output defines the coverage and site parameters. Coverage parameter
involves defining RF thresholds in terms of received levels at MS end and coverage
probabilities for various strategic locations of the coverage areas that are supplied by
customer. These are listed below.
RF Threshold Coverage Probability dBm(decibel max)
- 62 Indoor high probability 90%)
- 72 Indoor medium probability (>_ 50 %)
>_ - 82 Indoor low probability (<50%)
Table 4.1 Signal Strength and Coverage Probability
16
4.3 AREA DEFINITION
A planner needs to know the area type he is expected to cover under his plan. It starts
with defining whether the area is rural or urban, because the approach of the plan varies
in both the cases. If an area has been classified to fall under urban then it needs to be sub-
classified as which part of the area falls under sub (medium)-urban, urban and dense-
urban. These details are normally marked on the maps. The design criteria used for radio
coverage of a cell is to meet coverage probability of >_ 90%. The signal level received at
both the mobile station and the base station has to meet the threshold specified in GSM
technical specification. In order to ensure reliable communication the planning figures used for radio planning has to include an extra margin to account for the shadow fading.
The margin is dependent on the standard deviation of the received signal level and path loss characteristic.
4.3.1 Definition of Morphology Classification
Definition of classification in telecommunication can be defining the clutter type
available in that area. This is depend upon type of buildings, isolated houses; trees open
area in that region. In telecommunication area can be categorised in four classes as
fallows.
4.3.1.1. Dense urban
A mixture of 6-15 storey commercial buildings/residential apartments/shopping
complexes and 15-25 storey skyscrapers. Buildings are densely packed. Major roads are
at least 4 lanes wide and minor roads are 2 lanes wide. There is very little or no trees.
4.3.1.2 Urban
High priority business and commercial areas, VIP residential areas, Prestigious
hotels/Tourist places and some Prestigious residential areas A mixture of 2-6 storey shop
houses densely packed and commercial buildings/residential apartments/shopping
complexes. Compared to dense urban, the buildings are not as tall or as densely packed.
17
Major roads are at least 4 lanes wide and minor roads are 2 lanes wide. There is very little
or no trees.
4.3.1.2 Suburban
Other commercial areas, residential areas, high priority industrial areas, shopping Malls,
airport, railway stations, sports stadium, exhibition centres, special tunnel areas for
railway and roads. pedestrian area, parks, etc. Typically less than 4 storey shop houses
lined along highway/main road. The shop houses form 1 or 2 tier from the road and the
houses are not densely packed. Usually at the outer fringe of a city. light to moderate
foliage.
4.3.1.3 Rural
Along major roads/highways where there are isolated houses or open ground
town/village areas within the city limits.
4.4 PROPAGATION PREDICTION MODELS
To implement a mobile radio system, wave propagation models are necessary to
determine propagation characteristics for any arbitrary installation. The predictions are
required for a proper coverage planning, the determination of path effects as well as for
interference and cell calculations, which are the basis for the high-level network planning
process. In a GSM system the high-level network planning process includes, e.g.,
frequency assignment and the determination of the BSS (base station subsystem)
parameter set. The environments where these systems are intended to be installed are
stretching from in-house areas up to large rural areas. Hence wave propagation prediction
methods are required covering the whole range of indoor scenarios and situations in
special environments like tunnels, highways and along railways. The phenomena which
influence radio wave propagation can generally be described by four basic mechanisms:
Reflection, penetration, diffraction, and scattering. For the practical prediction of
propagation in a real environment these mechanisms must be described by
approximations. Furthermore investigations have been stressed on proper processing
techniques to extract the relevant information in a time-efficient manner. The second
18
modelling step includes the definition of mathematical approximations for the physical
propagation mechanisms, which are applicable to all cell types. As the definition of cell
types is not unique , the cell type definition used is explained more detailed. In "large
cells" and small cells" the base station antenna is installed.
The mobile radio environment causes some special difficulties to the investigation of
propagation phenomena:
( 1.) The distances between a base station and a mobile range from some metres to several
kilometers.
( 2.) Man-made structures and natural features have size ranging from smaller to much
larger than a wavelength and affect the propagation of radio waves.
(3.) The description of the environment is usually not at our disposal in very much detail.
(4.) These are the simulated model based on specular, reflection, diffraction, multiple
diffraction, scattering, penetration and absorption, guided wave, atmospheric effects etc.
Roughly several complementary approaches can be identified to deal with these
difficulties:
o Okumura Hata Model
o Lee's Model
o Walfish-Ikegami Model
o Jake's formulas
o Durkin's Model
o Longley-Rice Model
4.4.1 Okumura Hata Model
Okumura has simulated the model for urban, sub urban and rural. Which is frequently use
for India situation. Path loss estimation is performed by empirical models if land cover
we known only roughly, and the parameters required for semi-deterministic models
cannot be determined. Four parameters are used for estimation of the propagation loss by
Okumura Hata's well-known model: frequency ff distance d, base station antenna height
hb and the height of the mobile antenna hm. In Okumura Hata's model, which is based on
Okumura's various correction functions. The basic transmission path loss is L. which is
maximum path loss for given distance.
Where:
Carrier frequency ff : 150 to 1000 (MHz)
BS antenna height hb : 30 to200 (m)
MS antenna height hm : 1 to 10 (m)
and the distance between the BS and MS d: 0 to. 20 (km)
The model is known to be accurate to within 1 dB for distances ranging from 0 to 20 km.
With Okumura Hata's model, the path loss (in dB)
The distance can be calculated
d= 10p
Where values p for different type of area are
p= ( Lp (db)-A)B for urban
p= (Lp (db)-A+C)/B for sub urban
p= (LP (db)-A+D)/B for rural
Path losses can be calculated
Lp (db) = A+Blogio (d) for urban area
A+Blogio (d)-C for sub urban area
A+Blogio (d)-D for rural area
Where
A= 69.55+26.16 loglo (fe)-13.82 logo (hb)-a(hm)
B= 44.9-13.82 logs o (hb )
C= 5.4+2[logi o (ff /28)]2
D= 40.94+4.78[log10 (fc /28)]2 — 18.33 login (fe)
The value of a(h,,,) is calculated by
a(h,,,) = 3.2(log 11.75 * hn,)2 - 4.97
4.4.2 Maximum Path Losses Allowed
The maximum allowed path loss (Lpathmax) can be calculated from the uplink power budget:
Lpathmax = EIRP- SSdesign
Where EIRP(Elective Isotopic Radiated Power) = 56.7 dBm(decibel maximum) . and
SSdesign (Signal Strength design) = -62 dBm (decibel maximum) for getting more than
90% probability of indoor coverage. Once the maximum allowed path loss has been
calculated, the approximate cell size can be found by using one of the wave propagation
models.
4.5 SPECIFIC COVERAGE REQUIREMENT
There are many cases where the customer wants to focus on coverage and quality
requirements for special areas, buildings, highways, etc. We list out the special coverage
requirements and the benchmark to be met for these areas. Some special coverage and
quality requirements in areas such as important commercial areas, airports, hotels,
commercial establishments, etc, should be covered in the Coverage Definition and
Quality of Service inputs from the customer above.
21
4.6 SPECIFIC RESTRICTIONS
In certain cases there are few restrictions proposed by the Government authorities on the
usage of a spectrum band in a particular area. Further there could also be list of structures
on which a site cannot be planned like, heritage buildings, hospitals, schools and
colleges, etc. A list and address of the same is essential to ensure that a site is not located
on a restricted structure. In many case antennas needs to be camouflaged with the
surrounding such that coverage requirements are met without visibility of antenna such as
from the entrance or they are to be placed in such a way that it adds to the beauty of
surrounding. Plans in such cases are special and do not follow the normal procedure,
hence play a vital role in the network plan since frequency assignment and site
parameters needs to be well planned.
22
CHAPTER 5 DATA SET AND METHODOLOGY
5.1 GENERAL
Geographic Information Systems (GIS) have become very popular in a application
domains for instance in coverage and network planning, display of spatial-referenced data
for solving complex planning and management problems. The data of a GIS are of
different types depends on the dimension of the data items. Usually, the following data
types are provided by a GIS; Point data, defined by spatial coordinates, e.g. the position
of a base station of a personal communications network Normally, the attributes are
allocated to the cell represented by the point and not to the point, e.g Line data, defined
by the origins and ends (nodes) and of intermediate points (vertices), e.g. river or road
networks railways line. Polygon data, defined by their boundary lines, e.g. lakes, hilly
forest, forest areas, urban etc. This type of GIS data can be correlated with the data of
wireless tower which are use for the location planning and field strength prediction.
5.2 THE STUDY AREA
The study area lies between 77°57'29.59"E to 78°01'46.63"E longitude and
29°32'55.81"N to 30°14'22.18"N latitude of Haridwar district in Uttranchal state of
India. Haridwar district, covering an area of about 2360 km2. The district is ringed by
Saharanpur in the west, Dehradun in the north and east, Pauri Garhwal in the east,
Muzaffarnagar and Bijnor in the south. Fig 5.1 shows the location of Haridwar district in
Uttranchal state of India. The district is primarily covered with hilly forest, forest,
vegetation, built-up, and water. This area has line features like road network, railways
lines and canals, where Haridwar city, Roorkee city and Lakser are the main city of
Haridwar District, and other areas are town or villages.
23
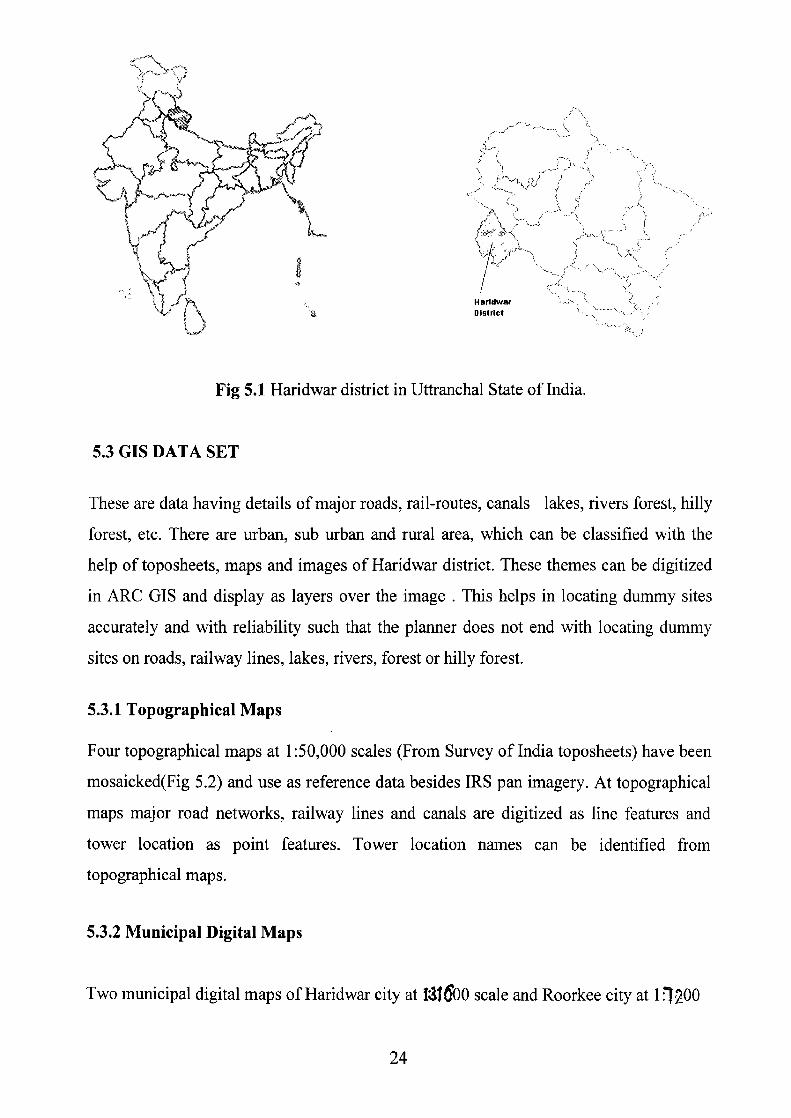
Fig 5.1 Haridwar district in Uttranchal State of India.
5.3 GIS DATA SET
These are data having details of major roads, rail-routes, canals lakes, rivers forest, hilly
forest, etc. There are urban, sub urban and rural area, which can be classified with the
help of toposheets, maps and images of Haridwar district. These themes can be digitized
in ARC GIS and display as layers over the image . This helps in locating dummy sites
accurately and with reliability such that the planner does not end with locating dummy
sites on roads, railway lines, lakes, rivers, forest or hilly forest.
5.3.1 Topographical Maps
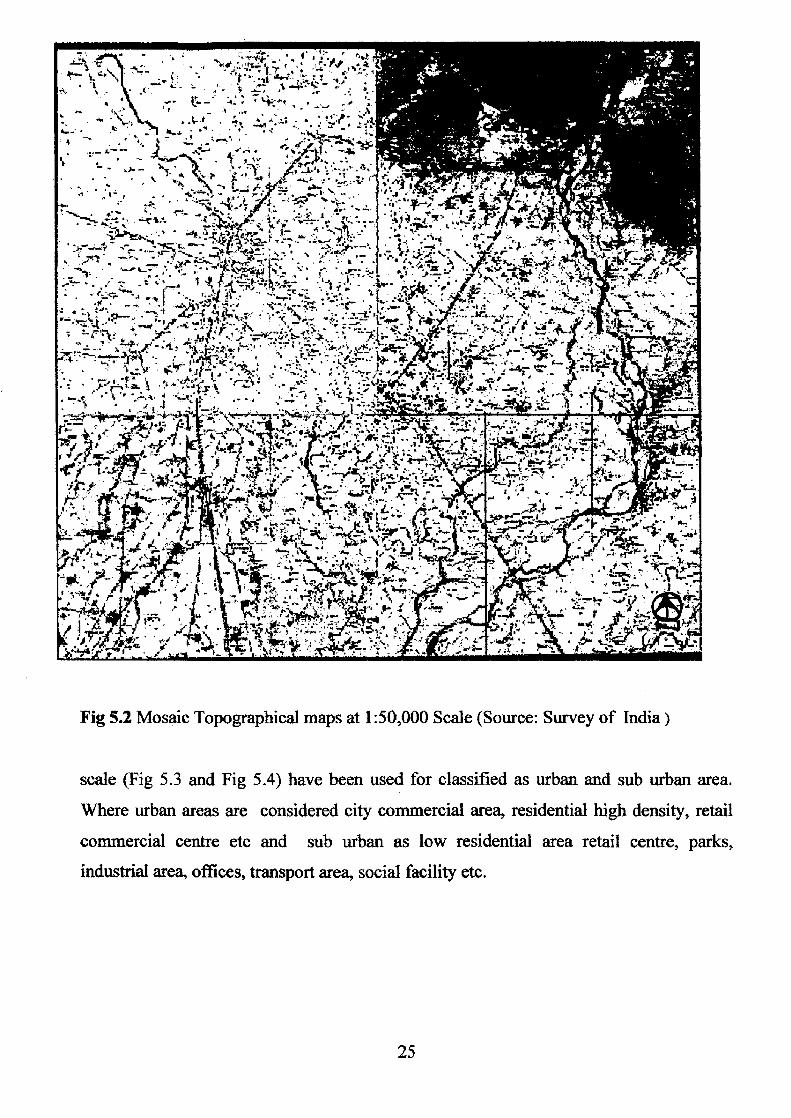
Four topographical maps at 1:50,000 scales (From Survey of India toposheets) have been
mosaicked(Fig 5.2) and use as reference data besides IRS pan imagery. At topographical
maps major road networks, railway lines and canals are digitized as line features and
tower location as point features. Tower location names can be identified from
topographical maps.
5.3.2 Municipal Digital Maps
Two municipal digital maps of Haridwar city at i3I500 scale and Roorkee city at l00
24
r P,
• M k • A. r!"! i? '~~' ~ s
t `''!., 1 • r ti r .•••' .'~,r1~~ ~rf,' ~•• ~y 4 ~ tiYR
•̀ M~'y'--cif # P
ii tb'.- ."`'- y~~` •
t' ~'~•",r♦•!sY , at1rs a+.h Ih' 'Kati•- +y♦i
"r
r~'rr _ k ! ._4,` r. R3t ~t Td •'3"•*+'" ~- !F'r ~. ~
•,I ~.•.'•
i•`
,+~t_
te. ,.,'W a l •~ a~1 -r.' . 1'~° . • 'a~'` 1•I~ i . ~•! -'
•' wry ♦J+ .a %y ! ~ r yy~~~-~, y -. ..1' ,. • = ~jLLL..~ ~~lf~
~.•..— r~
t. i i s ,a •rA- ` !ds . Leov~' a, •nZ 1 S `5~
rM' ^: ~. ~ its 1 .••• e~+ j ~~tTr ' • ~ r, .t .—; ! : ? , , •ia a ~ .~
r.# ''- 4 _ • 1 7K~^ t a. . -̀r1 t :Gf4R' ' ~,.,,
7~ x4 ! , ,t • , ~ r r 1 ," .~ .•L "~''„ 'r .e : ..M
. -- '.•~y• -a 1' ..l.
Ip
,^
'—.
,
:.y
S
_to{~
~
.~a.
~
-
.
~
4.
'.
. ✓
~
1
'SIT
+
~
xF
'•
~
R
YR
'
i .~
.
.~~
.
tF :
s
r~
, . q, 1
:
Yy
+
''
r -. .. •
s4
•
.
;
'L3
-
_ ,
'rtes . 1
,
I,
L ` " T
.
.!
t.+ •w.~ 1 _ y.
~5. r~• 1 6 +- 'r'r '"~ •:~,. V4. {✓F-}o
~..~r: i1;•:•:.
-.b T t ; ~i" *_ .-.. --'1L r, . .4 i7R~ ...rte ~
h !'f .. -.
,fit R• - ~ n.',~,,~~'p~y• /,y. ! .,~, r ~ w * •.i•
t 4+ ~ ~ 71-"r• ' °. ~~ i f~ ~ 7 ~'~ s' ~ t~ {'~y~ r'',y` ."r ter- ~
r"4 ~. ~, ~,.. ~ •r ,~
1... .rte. .~•
, 'i _____
Fig 5.2 Mosaic Topographical maps at 1:50,000 Scale (Source: Survey of India)
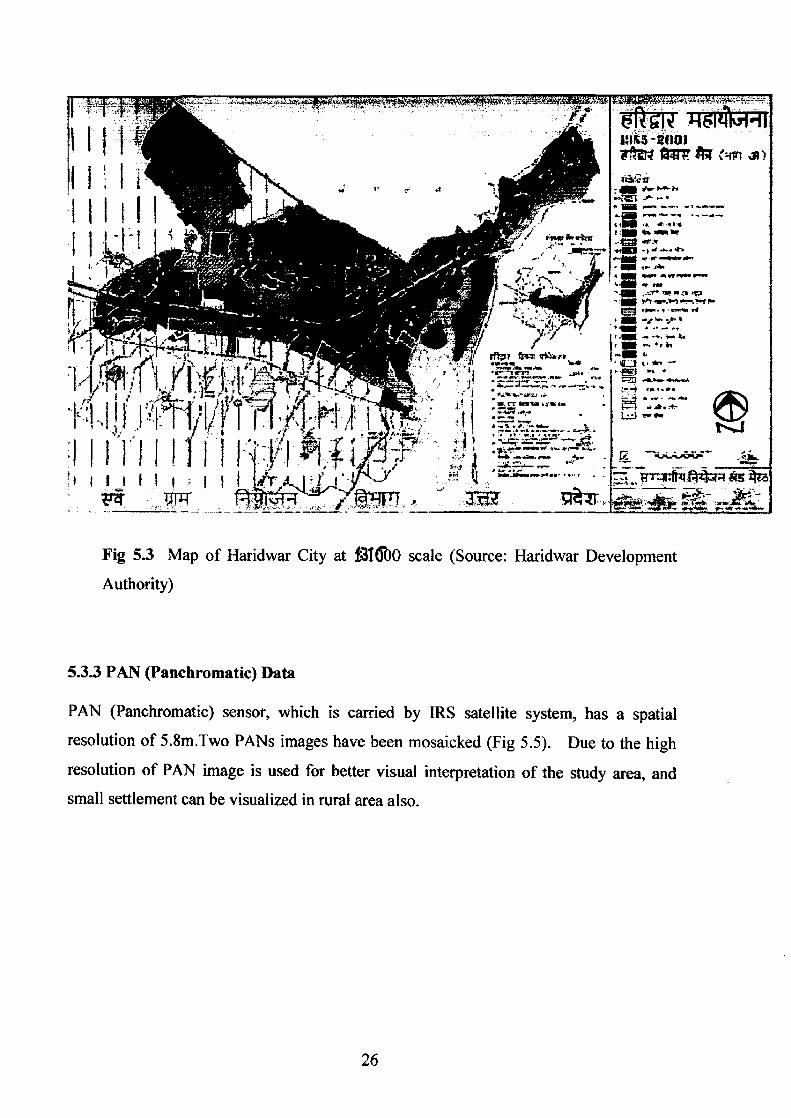
scale (Fig 5.3 and Fig 5.4) have been used for classified as urban and sub urban area.
Where urban areas are considered city commercial area, residential high density, retail
commercial centre etc and sub urban as low residential area retail centre, parks, industrial area, offices, transport area, social facility etc.
25
I J 1' il I I II I ii
Fig 5.3 Map of Haridwar City at 1t1M0 scale (Source: Haridwar Development Authority)
5.3.3 PAN (Panchromatic) Data
PAN (Panchromatic) sensor, which is carried by IRS satellite system, has a spatial
resolution of 5.Sm.Two PANs images have been mosaicked (Fig 5.5). Due to the high
resolution of PAN image is used for better visual interpretation of the study area, and
small settlement can be visualized in rural area also.
26
DL R
4.S
I
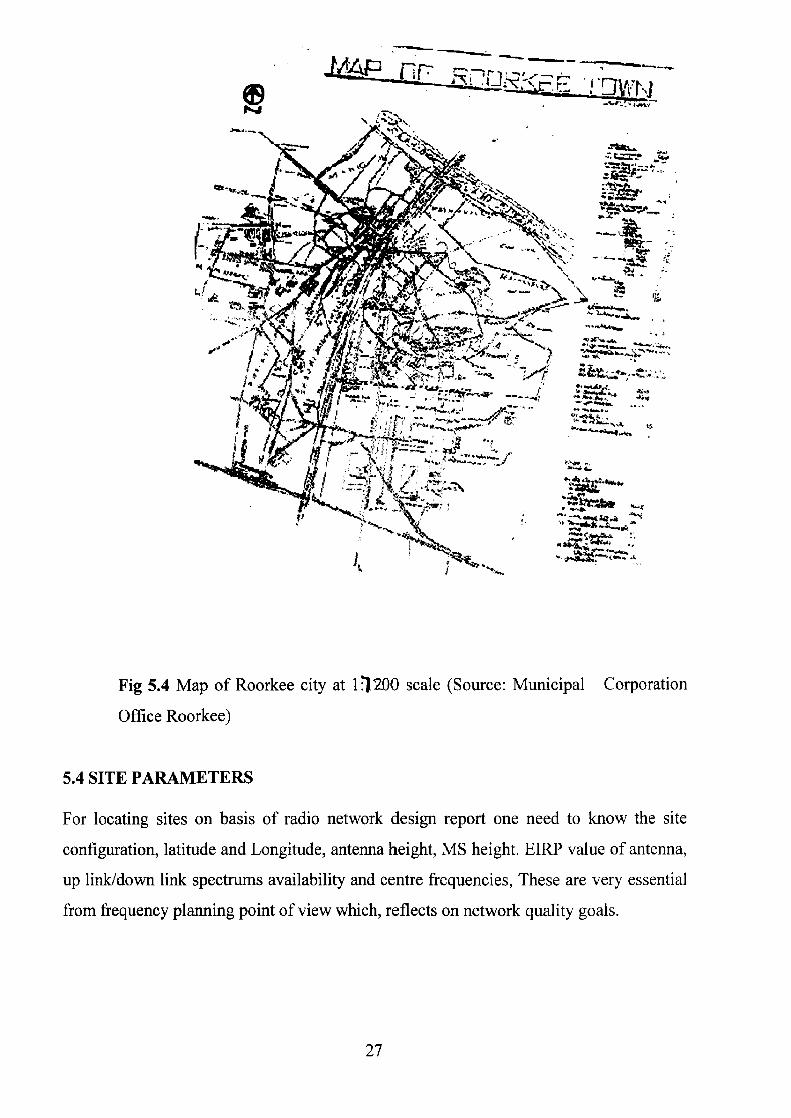
Fig 5.4 Map of Roorkee city at 11200 scale (Source: Municipal Corporation
Office Roorkee)
5.4 SITE PARAMETERS
For locating sites on basis of radio network design report one need to know the site
configuration, latitude and Longitude, antenna height, MS height. EIRP value of antenna,
up link/down link spectrums availability and centre frequencies, These are very essential
from frequency planning point of view which, reflects on network quality goals.
27
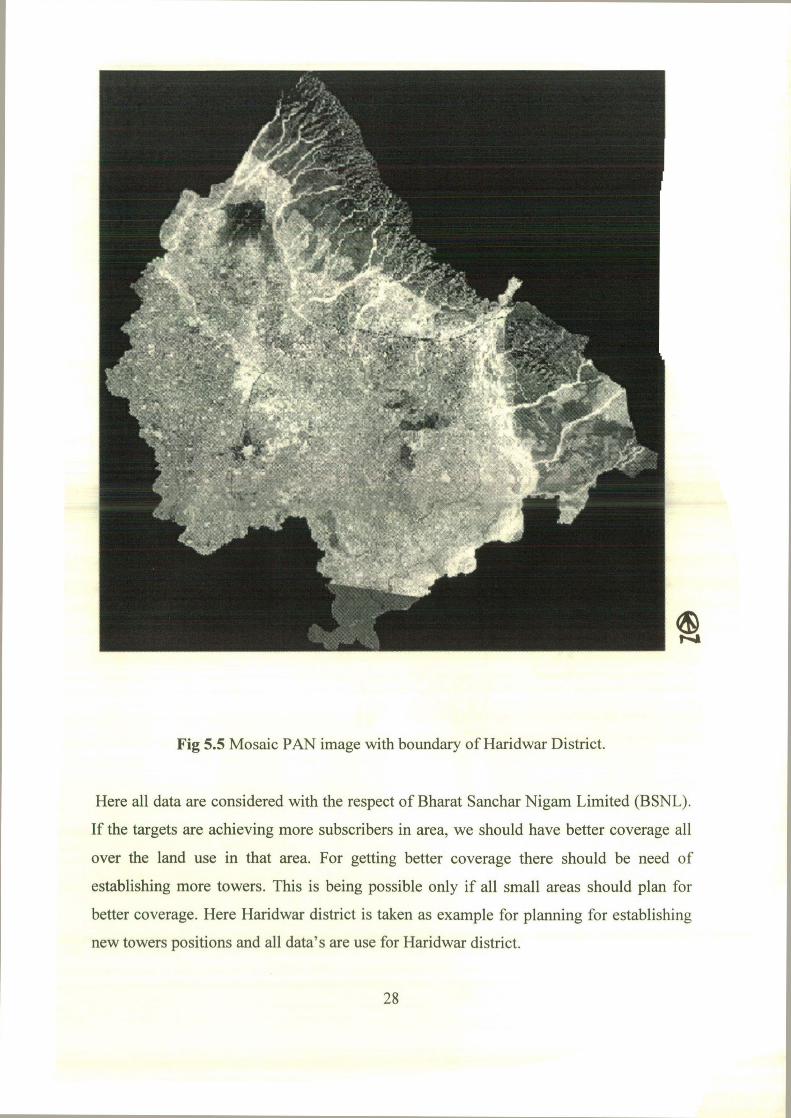
Fig 5.5 Mosaic PAN image with boundary of Haridwar District.
Here all data are considered with the respect of Bharat Sanchar Nigam Limited (BSNL).
If the targets are achieving more subscribers in area, we should have better coverage all
over the land use in that area. For getting better coverage there should be need of
establishing more towers. This is being possible only if all small areas should plan for
better coverage. Here Haridwar district is taken as example for planning for establishing
new towers positions and all data's are use for Haridwar district.
28
5.4.1 EIRP (Elective Isotopic Radiated Power) Values
EIRP is the apparent power transmitted towards the receiver. It is the power supplied to
an antenna type. EIRP values for every antenna is depend upon the antenna type to be
used. BSNL are using FMA-200(UTE) antenna, which EIRP values are 56.7 dBm
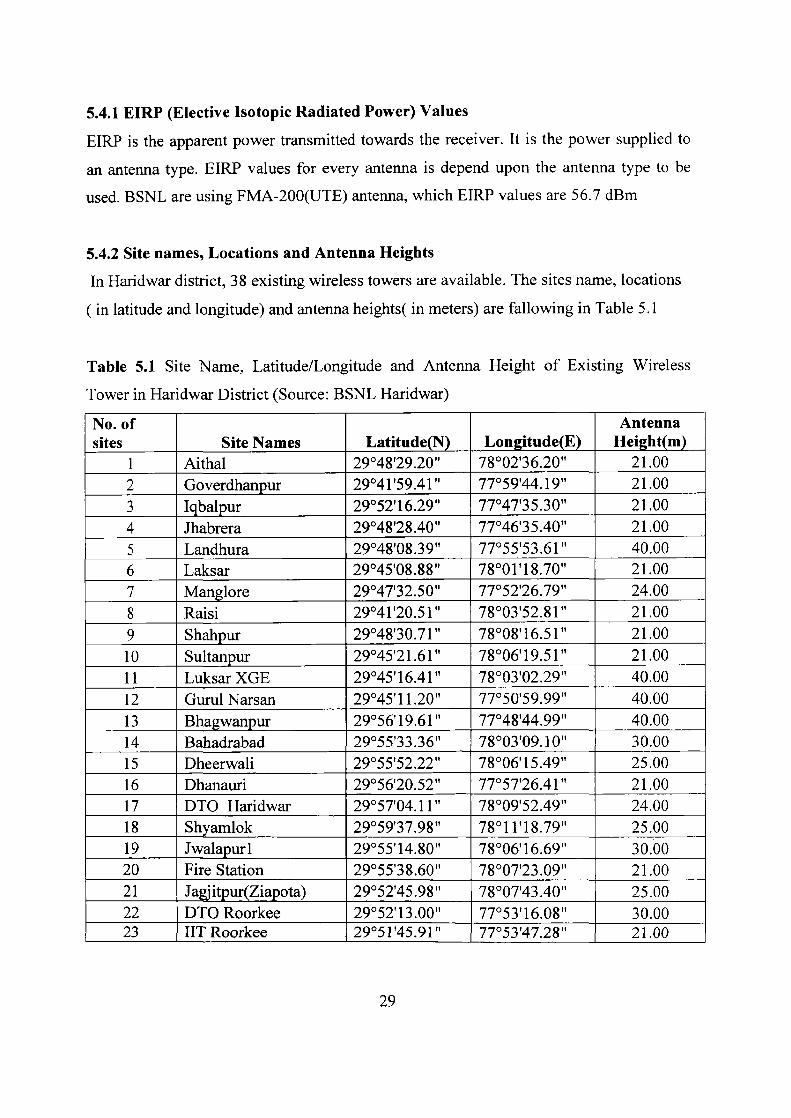
5.4.2 Site names, Locations and Antenna Heights In Haridwar district, 38 existing wireless towers are available. The sites name, locations
( in latitude and longitude) and antenna heights( in meters) are fallowing in Table 5.1
Table 5.1 Site Name, Latitude/Longitude and Antenna Height of Existing Wireless
Tower in Haridwar District (Source: BSNL Haridwar)
No. of sites Site Names Latitude(N) Longitude(E)
Antenna Height(m)
1 Aithal 2904829.20" 78002'36.20" 21.00 2 Goverdhanpur 29°41'59.41" 77°59'44.19" 21.00 3 I bal ur 29052'16.29" 77047'35.30" 21.00 4 Jhabrera 29048'28.40" 77046'35.40" 21.00 5 Landhura 29°48'08.39" 77°55'53.61" 40.00 6 Laksar 29045'08.88" 78°01'18.70" 21.00 7 Manglore 29047'32.50" 77052'26.79" 24.00 8 Raisi 29°41'20.51" 78°03'52.81" 21.00 9 Shahpur 29048'30.71" 78008'16.51" 21.00 10 Sultanpur 29°45'21.61" 78°06'19.51" 21.00 11 Luksar XGE 29°45'16.41" 78°03'02.29" 40.00 12 Gurul Narsan 29°45' 11.20" 77°50'59.99" 40.00 13 Bha wan ur 29°56'19.61" 77°48'44.99" 40.00 14 Bahadrabad 29°55'33.36" 78°03'09.10" 30.00 15 Dheerwali 29055'52.22" 78006'15.49" 25.00 16 Dhanauri 2905620.52" 77057'26.41" 21.00 17 DTO Haridwar 29°57'04.11" 78°09'52.49" 24.00 18 Shyamlok 29059'37.98" 78°11'18.79" 25.00 19 Jwalapurl 29055'14.80" 78°06'16.69" 30.00 20 Fire Station 29°55'38.60" 78°07'23.09" 21.00 21 Ja 'it ur(Zia ota) 29°52'45.98" 78°07'43.40" 25.00 22 DTO Roorkee 29°52'13.00" 77°53'16.08" 30.00 23 IIT Roorkee 29°51'45.91" 77°53'47.28" 21.00
29
24 Roshanabad 29°57'34.99" 78°04'19.33" 40.00 25 Hridwar Main XGE 29°56'40.80" 78°09'13.29" 36.00 26 Shiwalik Naar XGE 29°56'03.71" 78°04'35.70" 39.00 27 Jwalapur2 290551 25.10" 78006'40.62" 27.00 28 Hari Ki Pauri 29°57'13.40" 78°10'18.21" 9.00 29 Kankhal XGE 29°55'55.69" 78°08'57.92" 39.00 30 Ramnagar XGE 29°52'31.00" 77°52'38.31" 40.00 31 Civil Lines XGE 29°52'28.41" 77053'37.59" 39.00 32 Bheem Goda 29°57'57.41" 78°10'20.40" 40.00 33 Ranipur Moor 29056'03.92" 78°08'01.39" 24.00 34 Dhandera 29050'32.25" 77053'54.30" 39.00 35 BHEL 29°56'55.89" 78°06'15.92" 30.00 36 COER 29053'26.19" 77057'34.39" 25.00 37 Ganesh PuriI 29°51'29.88" 77°52'48.78" 40.00 38 Chiriyapur 29°45'11.20" 78°14'58.40" 59.50
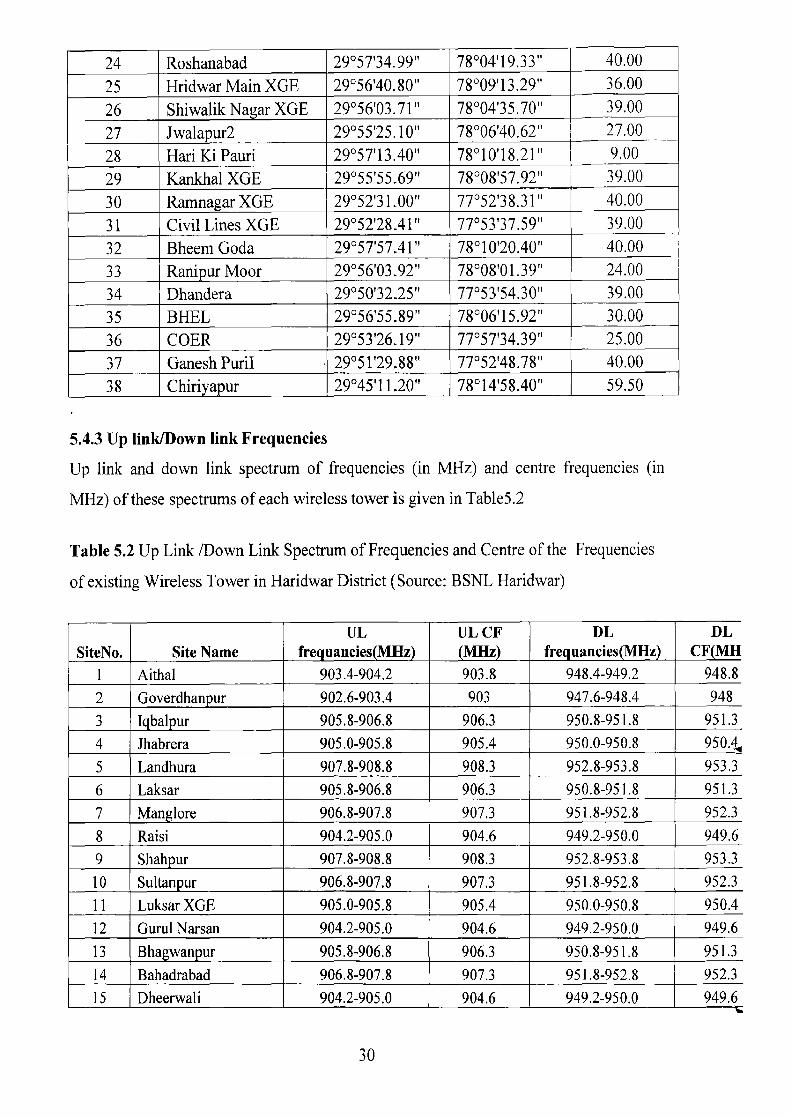
5.4.3 Up link/Down link Frequencies
Up link and down link spectrum of frequencies (in MHz) and centre frequencies (in
MHz) of these spectrums of each wireless tower is given in Table5.2
Table 5.2 Up Link /Down Link Spectrum of Frequencies and Centre of the Frequencies
of existing Wireless Tower in Haridwar District (Source: BSNL Haridwar)
SiteNo. Site Name UL
fre uancies MHz UL CF MHz
DL fre uancies MHz
DL CF MH
1 Aithal 903.4-904.2 903.8 948.4-949.2 948.8 2 Goverdhanpur 902.6-903.4 903 947.6-948.4 948 3 I bal ur 905.8-906.8 906.3 950.8-951.8 951.3 4 Jhabrera 905.0-905.8 905.4 950.0-950.8 950.4+ 5 Landhura 907.8-908.8 908.3 952.8-953.8 953.3 6 Laksar 905.8-906.8 906.3 950.8-951.8 951.3 7 Man lore 906.8-907.8 907.3 951.8-952.8 952.3 8 Raisi 904.2-905.0 904.6 949.2-950.0 949.6 9 Shah ur 907.8-908.8 908.3 952.8-953.8 953.3 10 Sultanpur 906.8-907.8 907.3 951.8-952.8 952.3 11 Luksar XGE 905.0-905.8 905.4 950.0-950.8 950.4 12 Guru! Narsan 904.2-905.0 904.6 949.2-950.0 949.6 13 Bha wan ur 905.8-906.8 906.3 950.8-951.8 951.3 14 Bahadrabad 906.8-907.8 907.3 951.8-952.8 952.3 15 Dheerwali 904.2-905.0 904.6 949.2-950.0 949.6
30
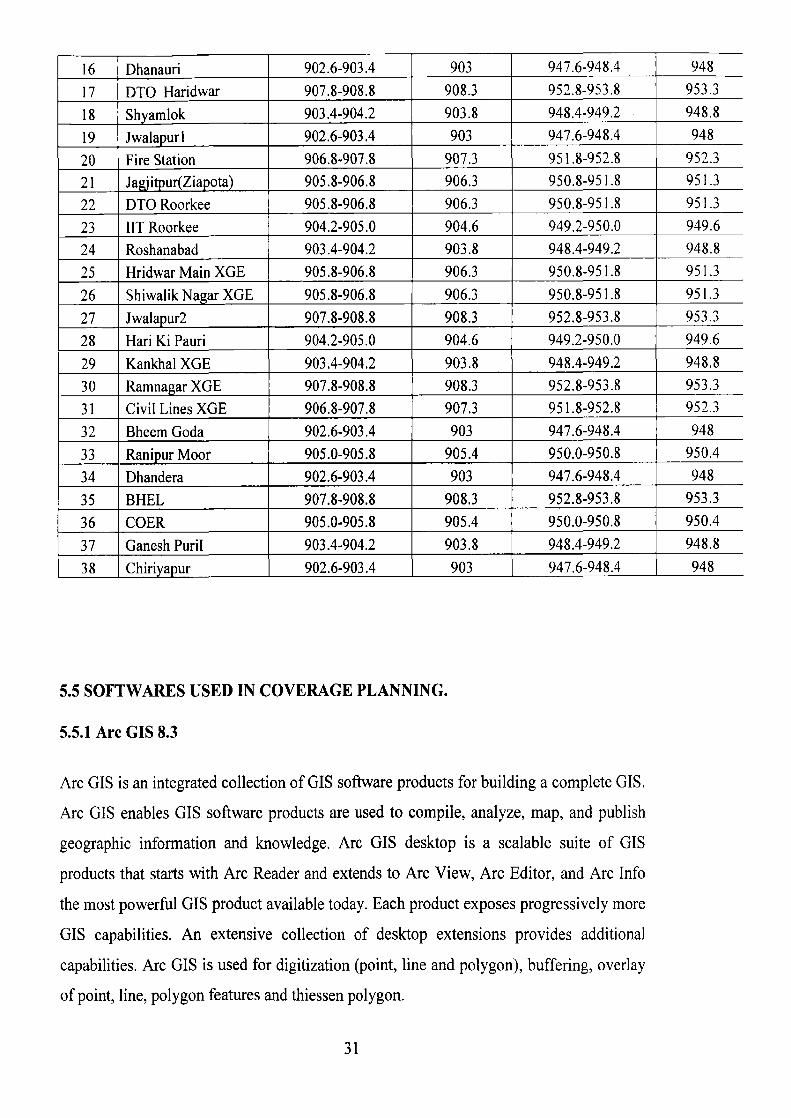
16 Dhanauri 902.6-903.4 903 947.6-948.4 948 17 DTO Haridwar 907.8-908.8 908.3 952.8-953.8 953.3 18 Shyamlok 903.4-904.2 903.8 948.4-949.2 948.8 19 Jwalapurl 902.6-903.4 903 947.6-948.4 948 20 Fire Station 906.8-907.8 907.3 951.8-952.8 952.3 21 Ja 'i ur(Zia ota) 905.8-906.8 906.3 950.8-951.8 951.3 22 DTO Roorkee 905.8-906.8 906.3 950.8-951.8 951.3 23 IIT Roorkee 904.2-905.0 904.6 949.2-950.0 949.6 24 Roshanabad 903.4-904.2 903.8 948.4-949.2 948.8 25 Hridwar Main XGE 905.8-906.8 906.3 950.8-951.8 951.3 26 Shiwalik Naar XGE 905.8-906.8 906.3 950.8-951.8 951.3 27 Jwalapur2 907.8-908.8 908.3 952.8-953.8 953.3 28 Hari Ki Pauri 904.2-905.0 904.6 949.2-950.0 949.6 29 Kankhal XGE 903.4-904.2 903.8 948.4-949.2 948.8 30 Ramnagar XGE 907.8-908.8 908.3 952.8-953.8 953.3 31 Civil Lines XGE 906.8-907.8 907.3 951.8-952.8 952.3 32 Bheem Goda 902.6-903.4 903 947.6-948.4 948 33 Ranipur Moor 905.0-905.8 905.4 950.0-950.8 950.4 34 Dhandera 902.6-903.4 903 947.6-948.4 948 35 BHEL 907.8-908.8 908.3 952.8-953.8 953.3 36 COER 905.0-905.8 905.4 950.0-950.8 950.4 37 Ganesh Puri! 903.4-904.2 903.8 948.4-949.2 948.8 38 Chiri a ur 902.6-903.4 903 947.6-948.4 948
5.5 SOFT WARES USED IN COVERAGE PLANNING.
5.5.1 Arc GIS 8.3
Arc GIS is an integrated collection of GIS software products for building a complete GIS.
Arc GIS enables GIS software products are used to compile, analyze, map, and publish
geographic information and knowledge. Arc GIS desktop is a scalable suite of GIS
products that starts with Arc Reader and extends to Arc View, Arc Editor, and Arc Info
the most powerful GIS product available today. Each product exposes progressively more
GIS capabilities. An extensive collection of desktop extensions provides additional
capabilities. Arc GIS is used for digitization (point, line and polygon), buffering, overlay
of point, line, polygon features and thiessen polygon.
31
5.5.2 ERADAS Imagine 8.6
ERADAS Imagine is the Remote sensing and GIS base software choice for geographic
imaging needs. As the value of imagery becomes more important for various
applications (urban and rural planning, environmental monitoring, telecommunications,
disaster planning and management, and transportation) the ability to quickly process
current imagery for information is crucial. As the world's leading geographic imaging
software suite, ERADAS Imagine offers a comprehensive solution that features extensive
image processing capabilities. ERADAS Imagine is used for registration of toposheets,
images, maps and mosaicing and subset of image for deciding boundary of Haridwar
district.
5.5.3 Visual Basic 6.0 Visual Basic is power full programming language, which has
evolved in to a major development environment that covers every aspect of
programming, from educational application to data base. This is used as a programming
for simulated Okumura Hata Model for the calculation of coverage.
5.6 METHODOLOGY
Using a map in network, monitoring can provide a dramatic improvement over traditional
optimization methods, allowing the engineers to see a precise picture of the entire
network, and quickly identify the trouble spots. From a practical point of view, we've
found out that the use of maps and GIS in a standard network monitoring tool that will
reduce the monitoring engineer's load significantly and increase productivity. The
requirements for this application are predicted coverage arrays, network statistics and
map layers administrative boundaries, towns/villages, settlements, rivers, forest lakes,
roads, railways, forest, land use, etc. where reorganized and updated using Arc GIS to
network planners requirements. Network planners created demographic GIS Database
using Arc GIS. Data from cartographic database and demographic tables. This database
contains geographically related data about number of inhabitants in regions, cities, and
32
towns, and is very important in GSM, calculations for the network coverage and finding
the new location of wireless towers.
5.6.1 Registration
Generally, a remote sensing image is not used directly in raw form due to the presence of
certain geometric errors in it. These errors may occur due to the movements of the
satellite platforms that carry sensors. The image therefore may have to be geometrically
rectified (registered) to extract useful information particularly for change detection
studies, and for its input as a data layer to GIS. If accurate geometric registration is not
achieved, then spurious differences will be detected, arising just because different
locations are compared. Often a polynomial transformation coupled with a resampling
procedure is utilized to geometrically register the image to other geographical data sets
through the knowledge of the actual positions of Ground Control Points (GCP) in both
the data sets. However, the process of geometric registration may also have its own
limitations due to the possibility of errors in GCP location, the number and distribution of
GCP, the accuracy of polynomial transformation and the resampling procedure.
Resampling is particularly important in classification as it alters the digital numbers of
the pixels. Therefore, these things must be given due consideration to achieve sub-pixel
registration accuracy that is often desired to obtain reliable estimates of land cover
particularly for change detection applications.
For planning of wireless tower establishment toposheets plays a role for identify
the name and location and use as reference data. These are registered in geographical
projection system in Eradas Software. Here four toposheets have been registered at
1:50,000 scale from survey of India ( Fig 5.2) and with the help of reference data PANs
image, large scale( at 1:1000 scale) municipal maps of Haridwar and Roorkee are
registered.
5.6.2 Mosaicking
Mosaicking is the process of image (or picture) made up of two or smaller images (or
pictures). By the moaic, we can create a long strip of images it is an integrated spatial
33
optimization framework for exploring future land use and management options at
regional and landscape scales. . Mosaic provides the capability of identifying the social,
environmental and economic trade-offs of changing the way land is managed in particular
landscape contexts, here four toposheets two images after registration of Haridwar
district are mosaicked( Fig 5.2 and Fig 5.5)
5.6.3 Digitization
Digitization is usually done feature by feature. For the points feature, the digitization
process builds up a database of the points of their coordinates. For the lines it builds up a
database , the starting and end nodes for the line and its length. In addition the GIS also
create a database of the topology, that is, the spatial relationships between the lines. For
the polygons also it develops the database . For example, all point features are on a map,
say wireless towers positions (Fig 6.1) are digitized in one layer. Similarly all line
features eg. Road networks, rivers, canal networks, railway lines (Fig 6.1) are digitized as
a separate layer. So are the polygon features urban and sub urban (Fig 6.2 and Fig 6.3)
and forest, hilly forest ( shown in Fig 6.4 ) are digitized as a another separate layers
5.6.4 Overlay
Overlay is an operation in which the spatial locations of features from two or more layers
and their attributes are joined to derive new data relationships in the output layer. That
may sound complicated, but it's really not. Overlaying layers is like overlaying map
sheets, but with a bonus. You get an output layer that combines data from all layers. For
planning about the whole Haridwar district, PAN image is used. Then there is need to
overlay of all road networks, railway lines, canals, water features from toposheets and
urban and sub urban from large scale maps and information about the forest and hilly
forest. Fig 6.5 explaining information about overlay of all layers along with wireless
tower positions.
5.6.5 Buffer
Buffering, or buffer analysis means creating a zone or zones of proximity around one or
more geographic features, then using the zone for display and other spatial queries. A
buffer is a polygon feature or simple graphic around some geographic feature or set of
features (points, lines, polygons). A buffer operation is one of the most common spatial
analysis tools. A buffer is a map feature that represents a uniform distance around a
feature. When creating a buffer, the user selects the feature to buffer from, as well as the
distance to be buffered. The buffer operation creates a new polygon data set, where a
specified distance is drawn around specific features within a layer. The distances can
either be constant or can vary depending upon attribute values. When features are close
together, their buffers may overlap. The user can choose to preserve the overlaps or
remove them.
5.6.5.1 Buffer for the coverage planning
Coverage can be plan around the position of each tower with help of Okumura Hata
Model using buffer coverage depends upon antenna height, MS (mobile station) height,
frequencies of each tower and what signal strength are planning for better coverage After
getting coverage (radius),we can make the buffer around the each tower(Fig 6.7).
Coverage depends upon type of area like urban, sub urban and rural.
5.6.5.2 Buffer for the road networks and railway lines
During coverage planning we should give the importance of road networks and railway
lines. This is also depend upon area type (rural, urban and sub urban). For the rural, tower
position should be under the buffer of 3 km and for the urban and sub urban, it should be
1.0 km and 0.5 km (shown in Fig P.8). By this decision we can get better coverage on the
road networks and railway lines.
5.6.6 Thiessen Polygon
Thiessen polygons define individual areas of influence around each of a set of points.
Thiessen polygons are polygons whose boundaries define the area that is closest to each
35
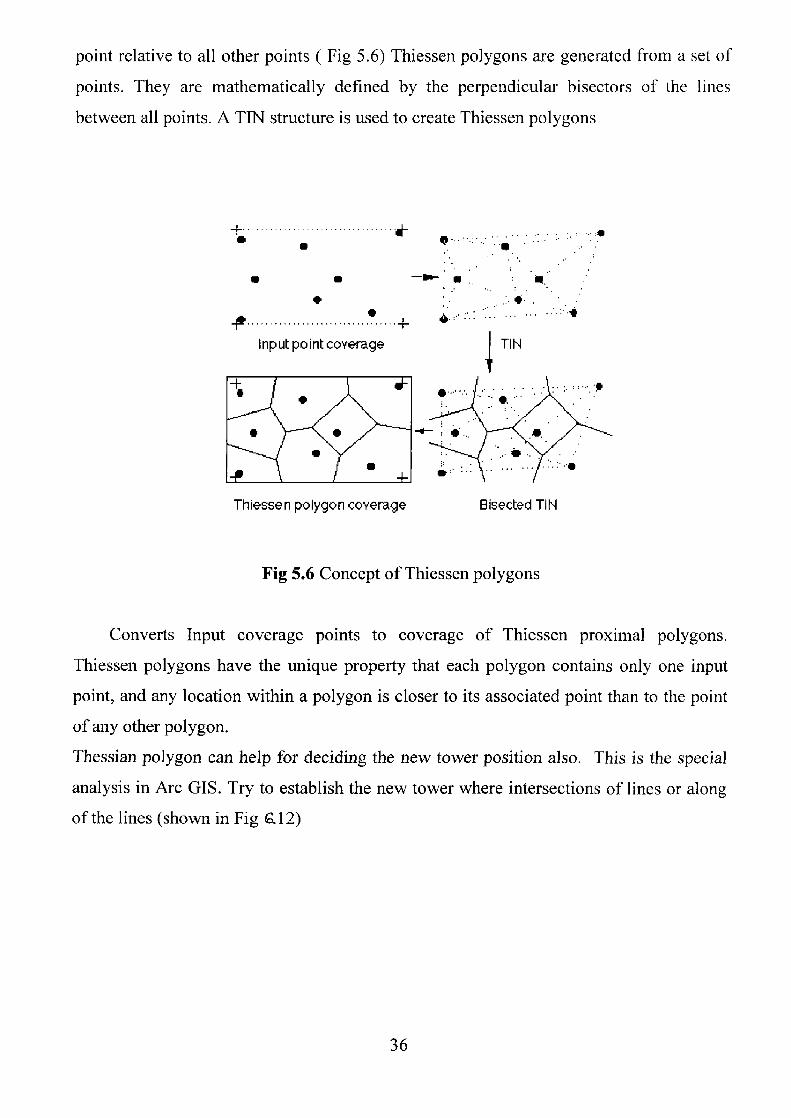
point relative to all other points ( Fig 5.6) Thiessen polygons are generated from a set of
points. They are mathematically defined by the perpendicular bisectors of the lines
between all points. A TIN structure is used to create Thiessen polygons
+ .................................1- •
i ................................. +
Input point coverage
+0 i f i
• ■
Thiessen polygon coverage Bisected TIN
Fig 5.6 Concept of Thiessen polygons
Converts Input coverage points to coverage of Thiessen proximal polygons.
Thiessen polygons have the unique property that each polygon contains only one input
point, and any location within a polygon is closer to its associated point than to the point
of any other polygon.
Thessian polygon can help for deciding the new tower position also. This is the special
analysis in Are GIS. Try to establish the new tower where intersections of lines or along
of the lines (shown in Fig 6.12)
5.7 WORK FLOW DIAGRAM
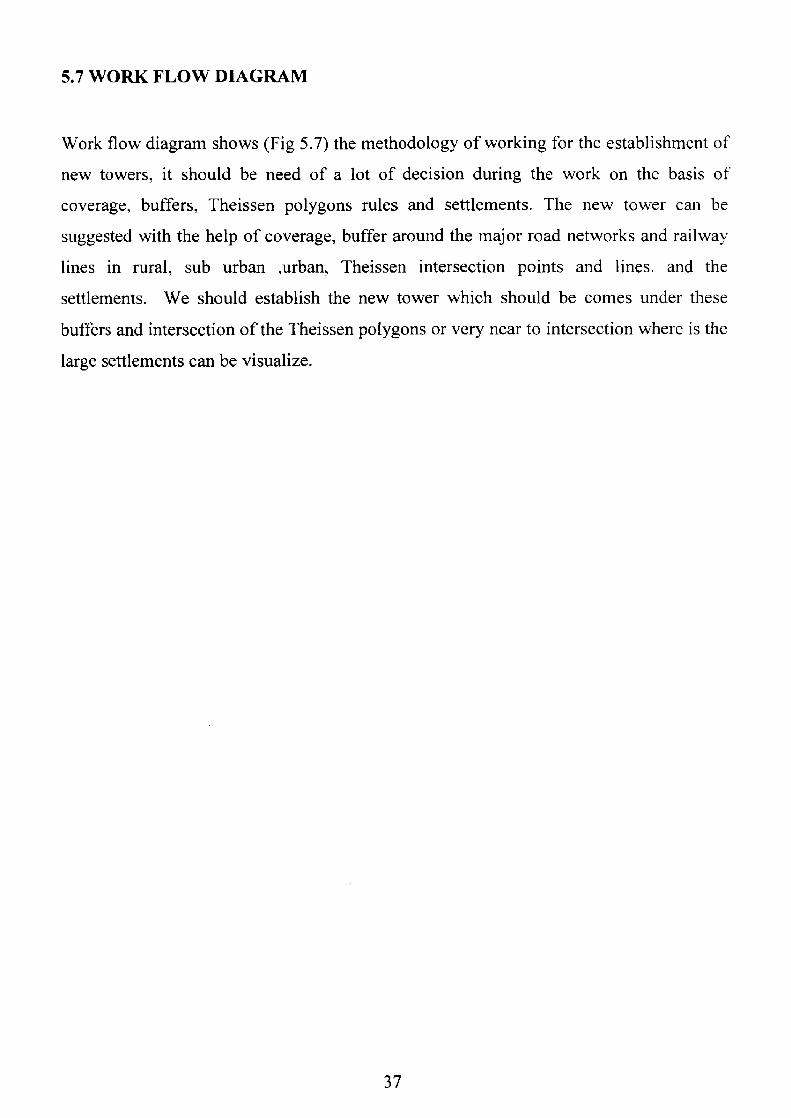
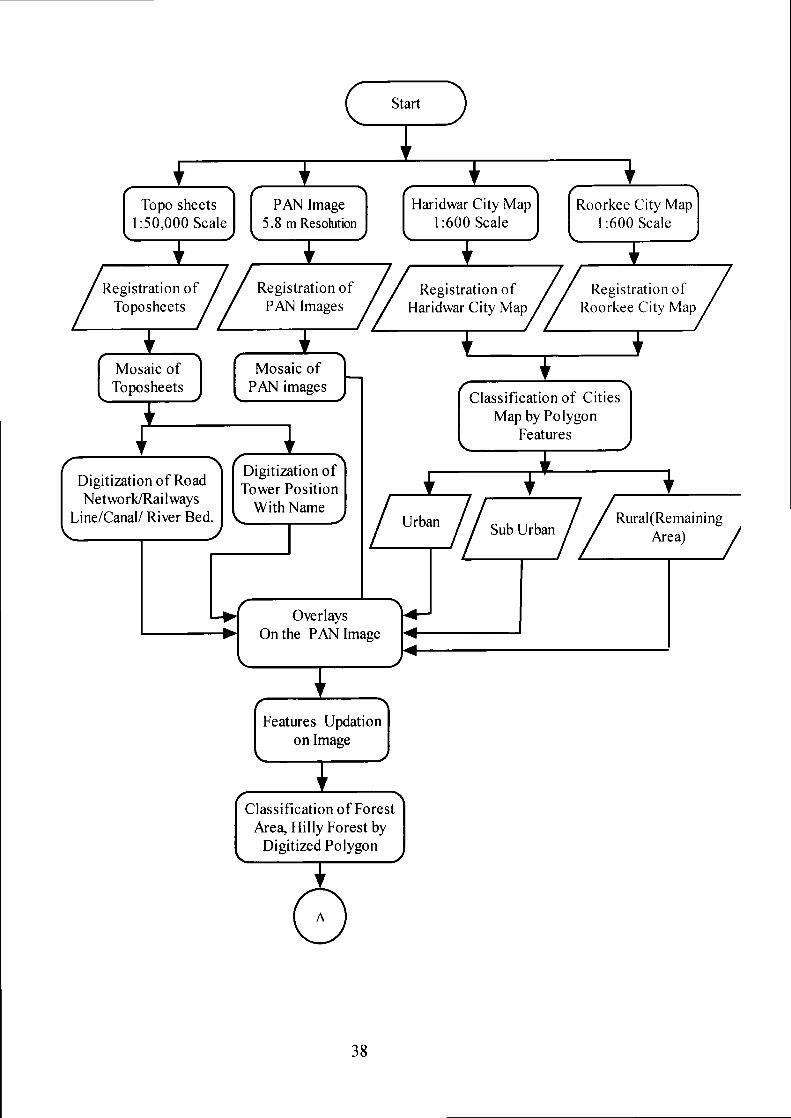
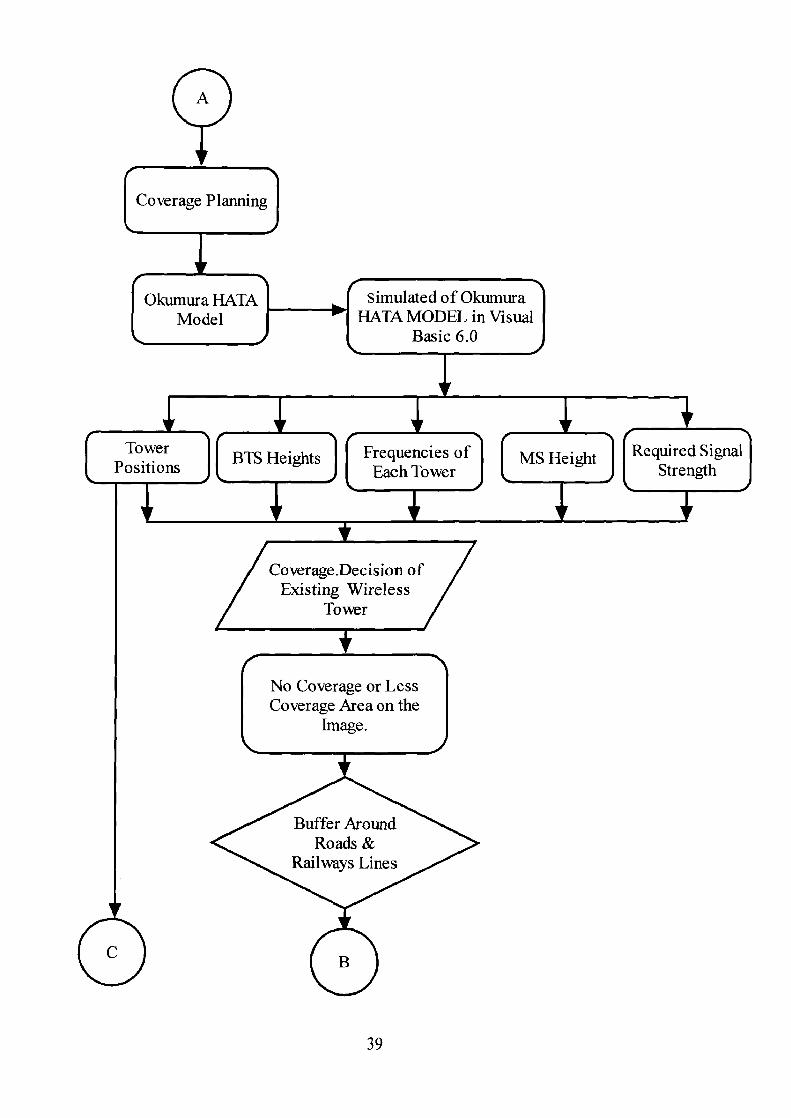
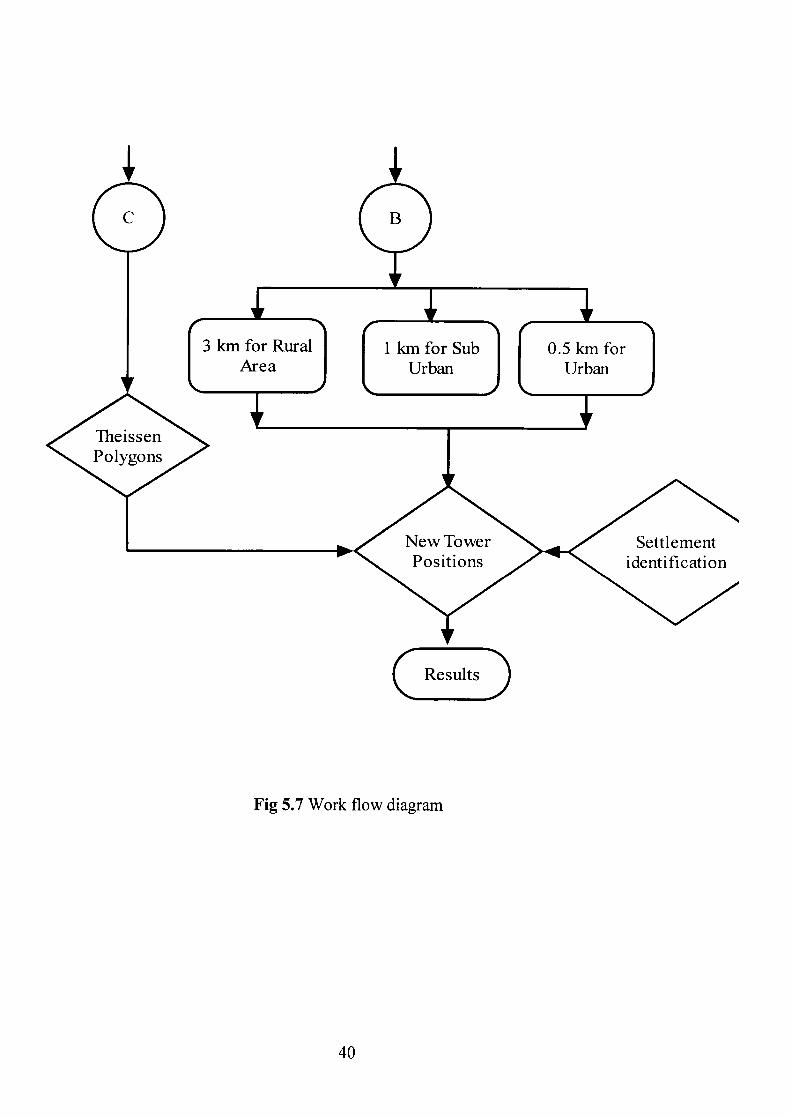
Work flow diagram shows (Fig 5.7) the methodology of working for the establishment of
new towers, it should be need of a lot of decision during the work on the basis of
coverage, buffers, Theissen polygons rules and settlements. The new tower can be
suggested with the help of coverage, buffer around the major road networks and railway
lines in rural, sub urban ,urban, Theissen intersection points and lines, and the
settlements. We should establish the new tower which should be comes under these
buffers and intersection of the Theissen polygons or very near to intersection where is the
large settlements can be visualize.
37
Start
Topo sheets PAN Image Haridwar City Map Roorkee City Map 1:50,000 Scale 5.8 m Resolution 1:600 Scale 1:600 Scale
Registration of
Registration of
Registration of
Registration of Toposheets PAN Images Haridwar City Map Roorkee City Map
Classification of Cities Map by Polygon
Features
Urban // Sub Urban / / Rural(Remaining Area)
Mosaic of
Mosaic of Toposheets PAN images
Digitization of Road Network/Railways
Line/Canal/ River Bed.
Digitization of Tower Position
With Name
Overlays On the PAN Image
Features Updation on Image
Classification of Forest Area, Hilly Forest by
Digitized Polygon
A
38
M
Coverage Planning
Okumura HATA simulated of Okumura
Model HATA MODEL in Visual
Basic 6.0
Tower Positions BTS Heights Frequencies of MS Height Required Signal
Each Tower I J I Strength
Coverage.Decision of Existing Wireless
Tower
No Coverage or Less Coverage Area on the
Image.
Buffer Around Roads &
Railways Lines
C) ( B
39
Results
Fig 5.7 Work flow diagram
CHAPTER 6
RESULTS AND DISCUSSION
6.1 GENERAL Coverage planning is hypothetical. It is very difficult to consider the signal losses by all
buildings, vehicles, trees, vegetations, water feature, forest etc. we use simulated models.
Okumura Hata Model is the popular model in telecommunication planning for the
coverage in India for large area. This model can be plan according to definition of urban,
sub urban and rural in wireless coverage planning. The propose tower position can be
plan in office by this technique. But actual position can be decided by the survey of the
area or the knowledge by the ground truth data. So the proposed position can be displaced
any where approximately in the circle of 100m. Because one can't plan the tower
position in the water, on the roads or railway lines or very near the hospitals, kids school
or restricted area. We can see the classify image in some coverage area, rural, urban and
sub urban are mixture of these. There should be need of decision after visualization that
which type of area we should apply in Okumura Hata Model. In some area buffer of road
network and railway lines and intersection of Theissen polygon is not possible. But there
is need to coverage identify after finding the big settlements, so that the tower in that are
can be established. In some cases, there should be need of special coverage like in
tunnel, mines or coverage for some important places, so we may plan special coverage in
this type of area.
6.2 DIGITIZATION OF POINTS, LINES AND POLYGONS FEATURES
6.2.1 Points Features
Tower positions (latitude/longitude) are digitized by the point features from the
registered toposheet using in Arc GIS. With the help of toposheets we can verify the
name of these positions are entered. Fig 6.1 shows the positions(yellow points) and
names(red colour) of existing wireless towers.
41
II
6.2.2 Lines features
If we go outside of cities then probability of getting coverage is less. Because of that we
trouble the communication problem in road networks and railway lines. Information
about rivers and canals are also needed. Because we can't establish the tower in water
features, and we must ignore these for the wireless tower establishment. These line
features are digitized in Arc GIS. Fig 6.1 shows the line features (road network, railway
lines, canals, rivers).
toposhet.img RGB Composite
0 Red: Layer_1
• Green: Layer_2
• Blue: Layer_3 Tower Position 0
railways line
Water Feature
Major Roads
canal
Fig 6.1 Toposheet of Haridwar District Alongwith Digitization of Existing Towers
Position, Railway Lines, Major Roads, Water Features/Rivers and Canals.
42
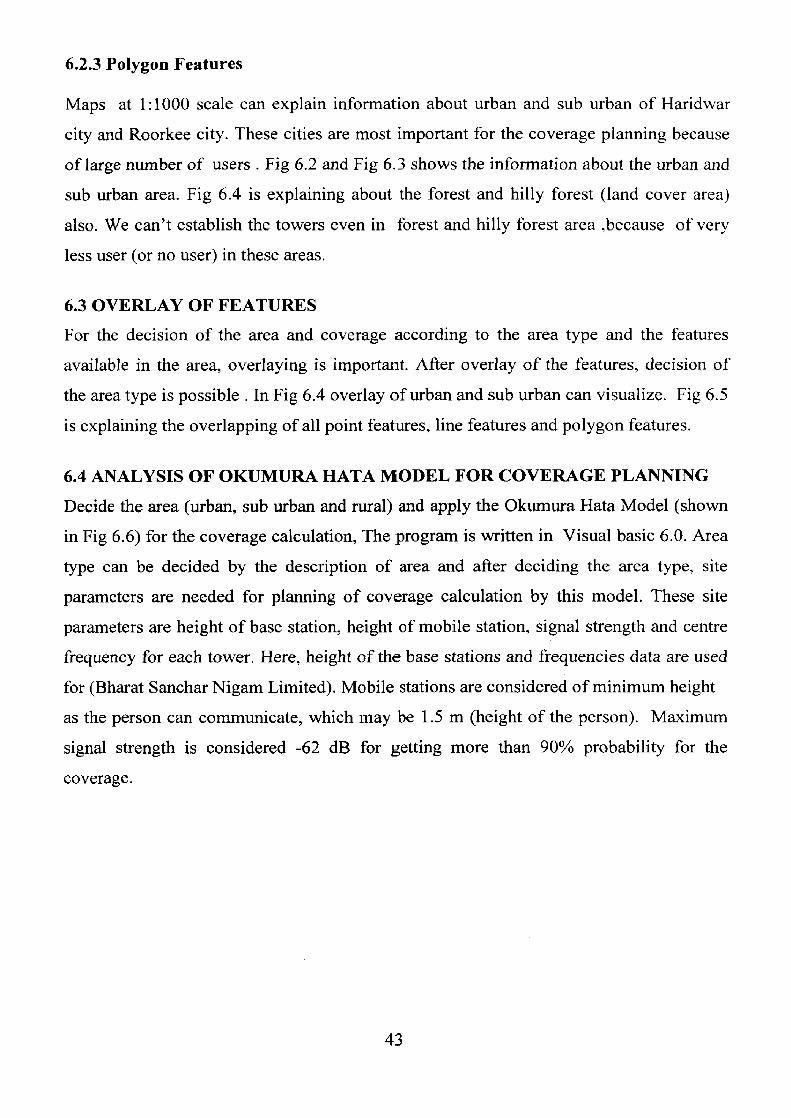
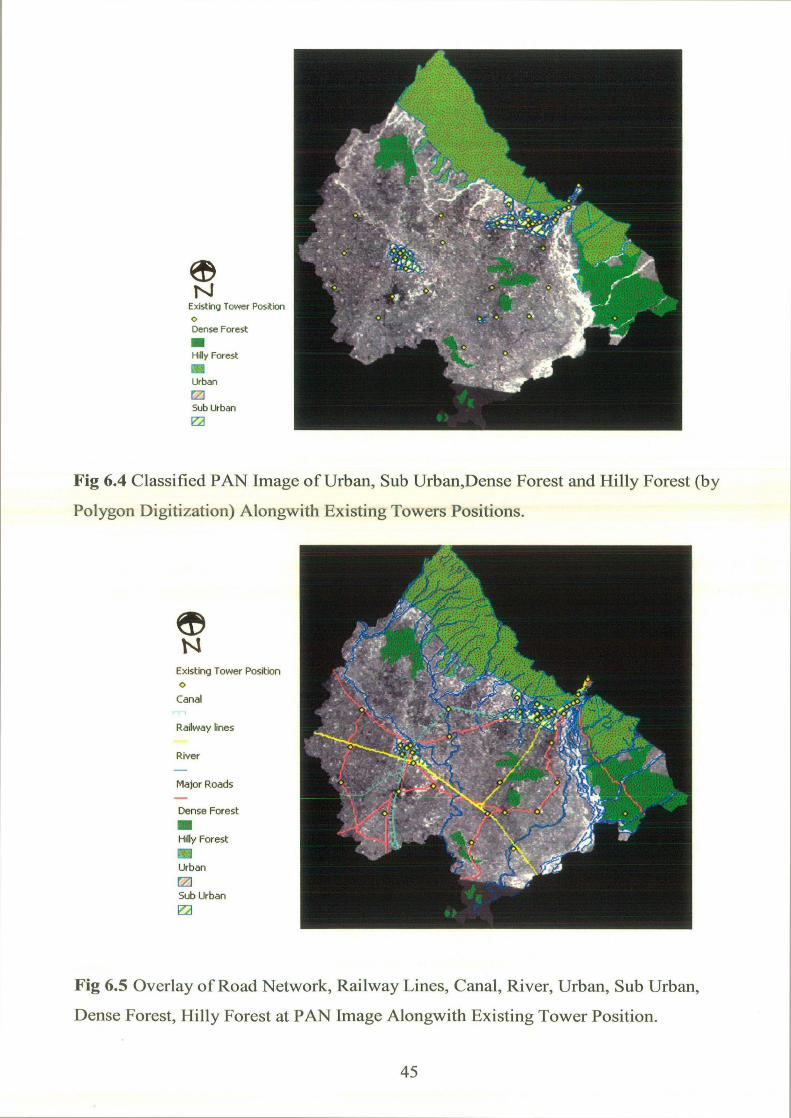
6.2.3 Polygon Features
Maps at 1:1000 scale can explain information about urban and sub urban of Haridwar
city and Roorkee city. These cities are most important for the coverage planning because
of large number of users . Fig 6.2 and Fig 6.3 shows the information about the urban and
sub urban area. Fig 6.4 is explaining about the forest and hilly forest (land cover area)
also. We can't establish the towers even in forest and hilly forest area ,because of very
less user (or no user) in these areas.
6.3 OVERLAY OF FEATURES
For the decision of the area and coverage according to the area type and the features
available in the area, overlaying is important. After overlay of the features, decision of
the area type is possible. In Fig 6.4 overlay of urban and sub urban can visualize. Fig 6.5
is explaining the overlapping of all point features, line features and polygon features.
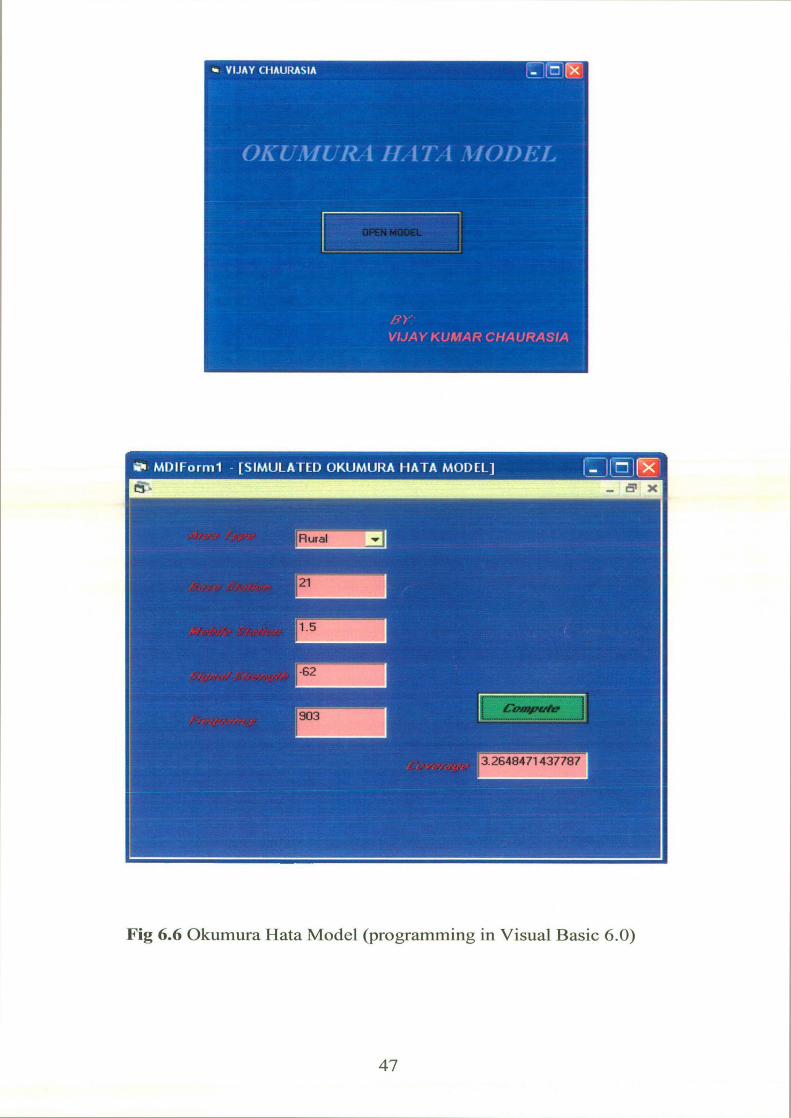
6.4 ANALYSIS OF OKUMURA HATA MODEL FOR COVERAGE PLANNING
Decide the area (urban, sub urban and rural) and apply the Okumura Hata Model (shown
in Fig 6.6) for the coverage calculation, The program is written in Visual basic 6.0. Area
type can be decided by the description of area and after deciding the area type, site
parameters are needed for planning of coverage calculation by this model. These site
parameters are height of base station, height of mobile station, signal strength and centre
frequency for each tower. Here, height of the base stations and frequencies data are used
for (Bharat Sanchar Nigam Limited). Mobile stations are considered of minimum height
as the person can communicate, which may be 1.5 m (height of the person). Maximum
signal strength is considered -62 dB for getting more than 90% probability for the
coverage.
•
Existing Tower Position 0 Dense Forest
0 Hilly Forest
Urban
rz Sub Urban
V2
Fig 6.4 Classified PAN Image of Urban, Sub Urban,Dense Forest and Hilly Forest (by
Polygon Digitization) Alongwith Existing Towers Positions.
Existing Tower Position 0
Canal
Railway lines
River
Major Roads
Dense Forest
Hilly Forest
Urban
Sub Urban
Fig 6.5 Overlay of Road Network, Railway Lines, Canal, River, Urban, Sub Urban,
Dense Forest, Hilly Forest at PAN Image Alongwith Existing Tower Position.
Wi
6.4.1 Decision of the Area Type and Coverage
Urban, sub urban, rural are decided with the help of images and map data or ground
knowledge of some area. In the Haridwar district, Haridwar city, Rroorkee city and laksar
are three cities. Urban and sub urban are decided with the help of maps at 1:1000 scale
(show Fig 6.2 and Fig 6.3) and rural (remaining area) by the high resolution of PAN
image (shows Fig 6.5). Area type can be decided after description of the area.
Description of the area for decision of the urban and sub urban and rural (remaining
area) with coverage calculation are as fallows:
1. Aithal
Area description:-Aithal is surrounding by villages and one side is covered by
the forest.
Classified type: - Rural
Coverage (Radius):- 3.26 km
2. Goverdhanpur
Area description:- it is a small town. Mostly sides are covered by the forest.
one major road is passing through this town.
Classified type: - Rural
Coverage (Radius):- 3.26 km
3. Igbalpur
Area description: - Igbalpur is a town has a small railway station and
surrounded by small villages, and one major road is passing through this area.
Classified type: - Rural
Coverage (Radius):- 3.26 km
0 MDIForml - [SIMULATED OKUMURA HATA MODEL] I
u1c II
Fig 6.6 Okumura Hata Model (programming in Visual Basic 6.0)
47
4. Jhabrera
Area description: - it is a small town surrounded by villages. One major road is
passing by this area. A small canal is also passing near this town.
Classified type: - Rural
Coverage (Radius):- 3.26 km
5. Landhura
Area description:- It has mostly open area ,which is surrounded by small
villages It is crossing two major roads and railways lines and has a railway
station. It is situated to near Solani river.
Classified type: - Rural
Coverage (Radius):- 4.49 km
6. Laksar
Area description: - It has residential and commercial area.and important Tahasil
of haridwar district. Two major roads are crossing to each other and one
important railway station is here.
Classified type: - Sub urban
Coverage (Radius):- 1.00 km
7. Manglore
Area description: - This town is surrounded by small orchards. This town is
situated at the NH 58. and one major road and situated near the canal .
Classified type: - Rural
Coverage (Radius):- 3.47 km
8. Raisi
Area description:-It is small town with railway station. near this area one river
is also passing.
Classified type: - Rural
Coverage (Radius):- 3.26 km
48
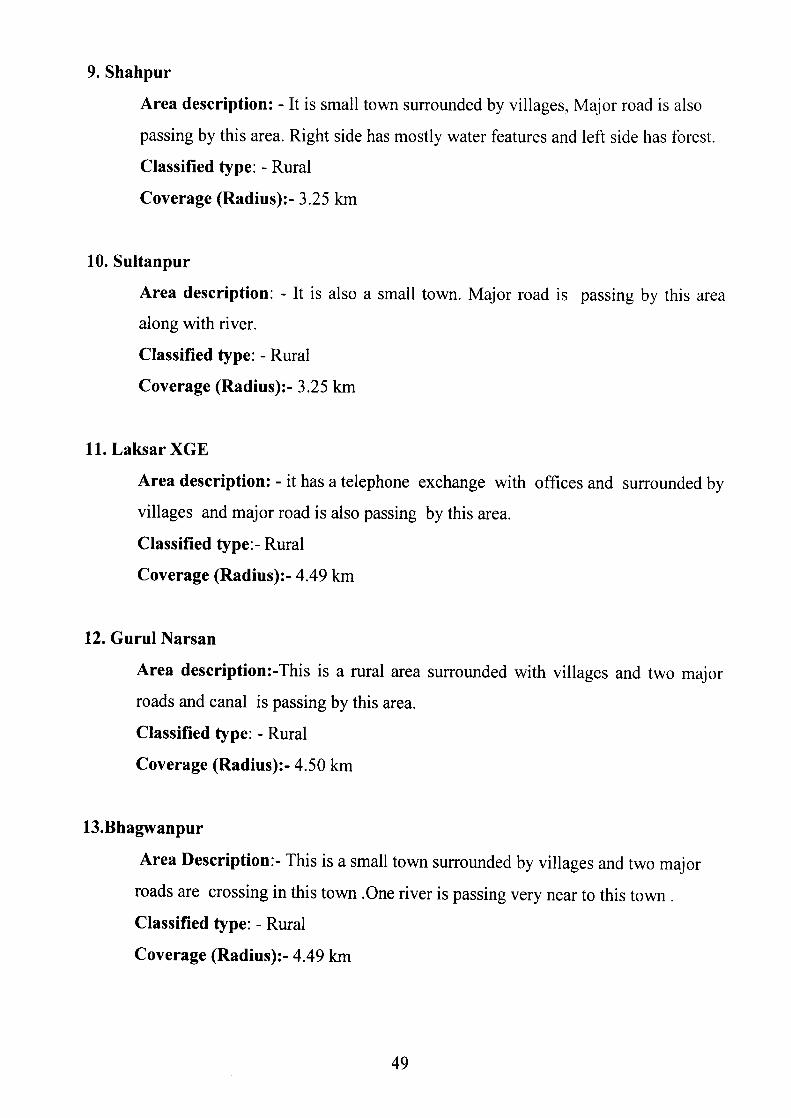
9. Shahpur
Area description: - It is small town surrounded by villages, Major road is also
passing by this area. Right side has mostly water features and left side has forest.
Classified type: - Rural
Coverage (Radius):- 3.25 km
10. Sultanpur
Area description: - It is also a small town. Major road is passing by this area
along with river.
Classified type: - Rural
Coverage (Radius):- 3.25 km
11. Laksar XGE
Area description: - it has a telephone exchange with offices and surrounded by
villages and major road is also passing by this area.
Classified type:- Rural
Coverage (Radius):- 4.49 km
12. Gurul Narsan
Area description:-This is a rural area surrounded with villages and two major
roads and canal is passing by this area.
Classified type: - Rural
Coverage (Radius):- 4.50 km
13.Bhagwanpur
Area Description:- This is a small town surrounded by villages and two major
roads are crossing in this town One river is passing very near to this town.
Classified type: - Rural
Coverage (Radius):- 4.49 km
14. Bahadrabad
Area description: - This area comes under haridwar city. One major road is
passing through this area This is very small commercial area with offices and
canal is also passing by this area.
Classified type: - Sub urban
Coverage (Radius):- 1.15 km
15. Dheerwali
Area description:- This is a important place in haridwar city. One side with
commercial area and other side has residential with small park and open area.
Some offices are also situated here.
Classified type: - Sub urban
Coverage (Radius):- 1.07 km
16. Dhanauri
Area description: - It is rural area surrounded with villages and very near to
canal and river.
Classified type: - Rural
Coverage (Radius):- 3.27 km
17. DTO Haridwar
Area description:- This is a commercial area of Haridwar city . One side has
canal and river and other side has hilly forest. Two major roads and railway lines
are passing. It is a tourist place with hotels but this is very small area
Classified type: - Sub urban
Coverage (Radius):- 1.05 km
50
18. Shyamlok
Area description: - Shyamlok is out side of the city, one side has hilly forest and
another side river. Railways lines and roads are passing through this area this, is
surrounding with villages
Classified type: - Rural
Coverage (Radius):- 3.54
19. Jwalapurl
Area description:- It is very near to Ganga canal. One side has mostly open area
and other side has commercial and residential area .Roads and railways line are
also passing by this area.
Classified type: - Sub urban
Coverage (Radius):- 1.15 km
20. Fire Station
Area description: - It is most important commercial area with dense houses near
bus station and major road and railways line are also passing very near to it.
Canal is also passing through this area.
Classified type: - Urban
Coverage (Radius):- 0.53 km
21.Jagjitpur(ziapota)
Area description: - This area is surrounded by villages and one major roads is
also passing. One side has large river.
Classified type: - Rural
Coverage (Radius):- 3.54 km
22.DTO Roorkee
Area description:- It is an important commercial area and canal is also passing
by this area.
Classified type: - Urban
51
Coverage (Radius):- 0.60 km
23.IIT Roorkee
Area description: - IIT Roorkee is an important educational institute with open
area but with large buildings.
Classified type: - Sub Urban
Coverage (Radius):- 1.00 km
24.Roshanabad
Area description: - It is a part of Haridwar city with sub urban area and it's one
side is open and another side is hilly forest.
Classified type: - Sub Urban
Coverage (Radius):- 1.29 km
25. Hridwar Main XGE
Area description: - Haridwar main XGE is the place which is surrounded with
the important offices and residences One side of this has industries and another
side has canal and river, major road and railway line are also passing.
Classified type: - Sub Urban
Coverage (Radius):- 1.24 km
26. Shiwalik Nagar XGE
Area description: - It is surrounded by residential and industrial area with social
facility and parks and open area along with river is also here..
Classified type: - Sub Urban
Coverage (Radius):- 1.28 km
27.Jwalapur2
Area description: - It is very near to railway station along with commercial area
with offices. Major roads, railway line and canal is also passing through this area.
Classified type: - Urban
52
Coverage (Radius):- 0.58 km
28.Hari Ki Pauri
Area description: - It is small commercial area and important tourist place s
here one needs special coverage. Mostly area is covered by water. Railway lin
and major road are also present.
Classified type: - Sub Urban
Coverage (Radius):- 0.74 km
29 Kankhal XGE
Area description:- Kanakhal XGE is surrounded by mixture of
commercial,residential with small social facilities . One side of this area covered
river and another side by canal.
Classified type: - Sub Urban
Coverage (Radius):- 1.29 km
30 Ramnagar XGE
Area description: - It is residencial area with some park and open area of
Roorkee city with one major road
Classified type: - Sub Urban
Coverage (Radius):- 1.30 km
31 Civil Lines XGE
Area description: - One side of this tower is residential and another side is
commercial area with major roads and canal.
Classified type: - Sub Urban
Coverage (Radius):- 1.28 km
53
32 Bheem Goda
Area description:- It is the residencial area alongwith open area.one side river is
passing and another side is covered by hilly area. Railway line and major road are
also passing.
Classified type: - Sub Urban
Coverage (Radius):- 1.30 km
33. Ranipur Moor
Area description: - This is fully commercial area with offices and park and with
social facility. Railway line and two major roads are passing.
Classified type: - urban
Coverage (Radius):- 0.56 km
34.Dhandera
Area description: - This is mostly Residential area with major roads and
railway lines
Classified type: - Sub Urban
Coverage (Radius):- 1.29 km
35. BHEL
Area description:- This is industrial area with small residencies and open
parks. It's one side is cover by hilly forest.
Classified type: - Sub Urban
Coverage (Radius):- 1.15 km
36. COER
Area description: - It is an educational institute, surrounded by villages. One
major road is passing and one side has water feature .
Classified type: - Rural
Coverage (Radius):- 3.55km
54
37 Ganesh pur
Area description:- This is a residencial area with small commercial part of
Roorkee city and roads are also passing through this area.
Classified type: - Sub Urban
Coverage (Radius):- 1.30 km
38 Chiriyapur
Area description: - This area is covered with forest. One side has river. Some
villages are present around this area. One major road (Highway) is passing by
this area.
Classified type: - Rural
Coverage (Radius):- 5.59km
6.5 BUFFERING AROUND THE EXISTING POSITIONS (COVERAGE OF
AREA)
After calculating the coverage for urban, sub urban and rural area by Okumura Hata
Model, we can make the buffer around the existing tower position by buffer analysis in
Arc GIS (shown in Fig 6.7). If coverage is decided then less coverage or no coverage
area can be identified (shown in Fig 6.7)
6.6 BUFFERING AROUND THE LINE FEATURES
During travelLing by roads and railway lines, more subscribers can use the mobile sets.
This also depends upon the area type. For rural, sub urban and urban at least sequentially
3.0 km, 1.0 km and 0.5 km coverage are needed. By buffering features in Arc GIS, this
type of coverage is possible. After making the buffer, new tower position should not lie
in these existing buffer. We should provide the coverage for road networks and railway
lines if there is no existing coverage or less coverage. Remaining roads and railway lines
can be visualized in the image, where no coverage or less coverage is. In Fig 6.8 light
blue line, pink line, and red line show the buffer of rural, sub urban and urban area. In
55
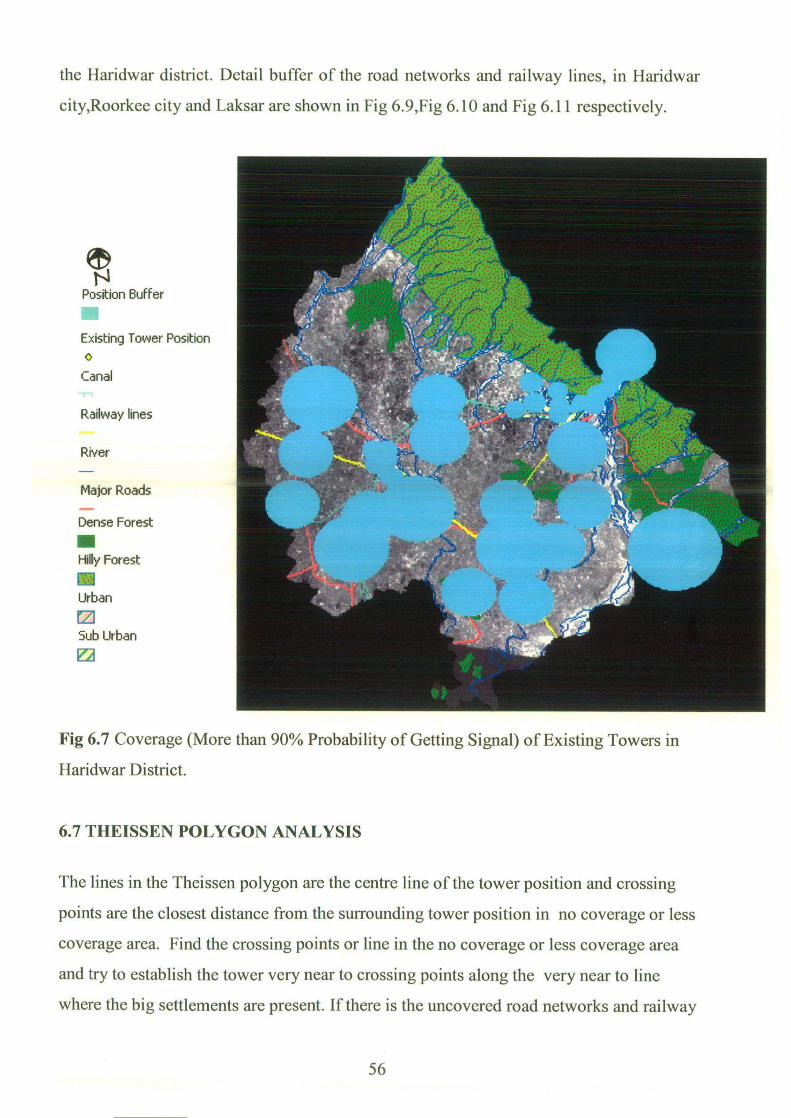
the Haridwar district. Detail buffer of the road networks and railway lines, in Haridwar
city,Roorkee city and Laksar are shown in Fig 6.9,Fig 6.10 and Fig 6.11 respectively.
Position Buffer
Existing Tower Position 0
Canal
Railway lines
River
Major Roads
Dense Forest 0 Hilly Forest E Urban
Sub Urban Ed
Fig 6.7 Coverage (More than 90% Probability of Getting Signal) of Existing Towers in
Haridwar District.
6.7 THEISSEN POLYGON ANALYSIS
The lines in the Theissen polygon are the centre line of the tower position and crossing
points are the closest distance from the surrounding tower position in no coverage or less
coverage area. Find the crossing points or line in the no coverage or less coverage area
and try to establish the tower very near to crossing points along the very near to line
where the big settlements are present. If there is the uncovered road networks and railway
56
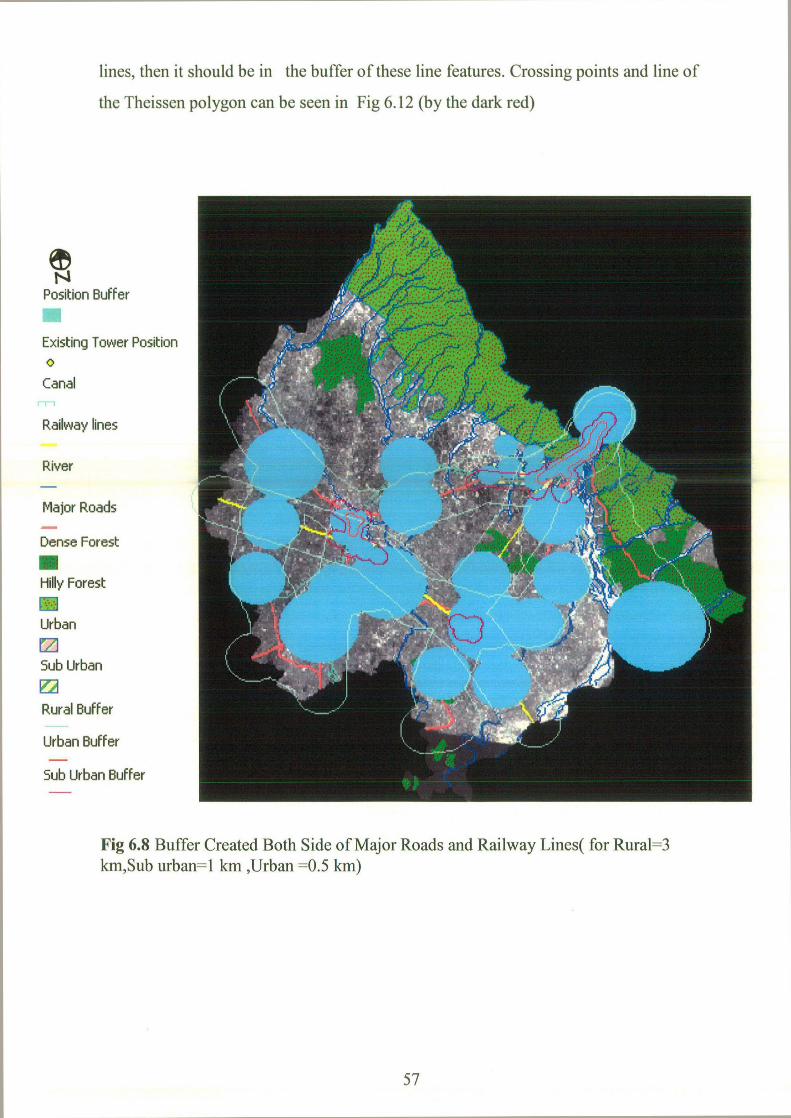
lines, then it should be in the buffer of these line features. Crossing points and line of
the Theissen polygon can be seen in Fig 6.12 (by the dark red)
Position Buffer
Existing Tower Position 0
Canal
Railway lines
River
Major Roads
Dense Forest
m Hilly Forest
RE Urban
Sub Urban
Rural Buffer
Urban Buffer
Sub Urban Buffer
Fig 6.8 Buffer Created Both Side of Major Roads and Railway Lines( for Rural=3 km,Sub urban=1 km ,Urban =0.5 km)
57
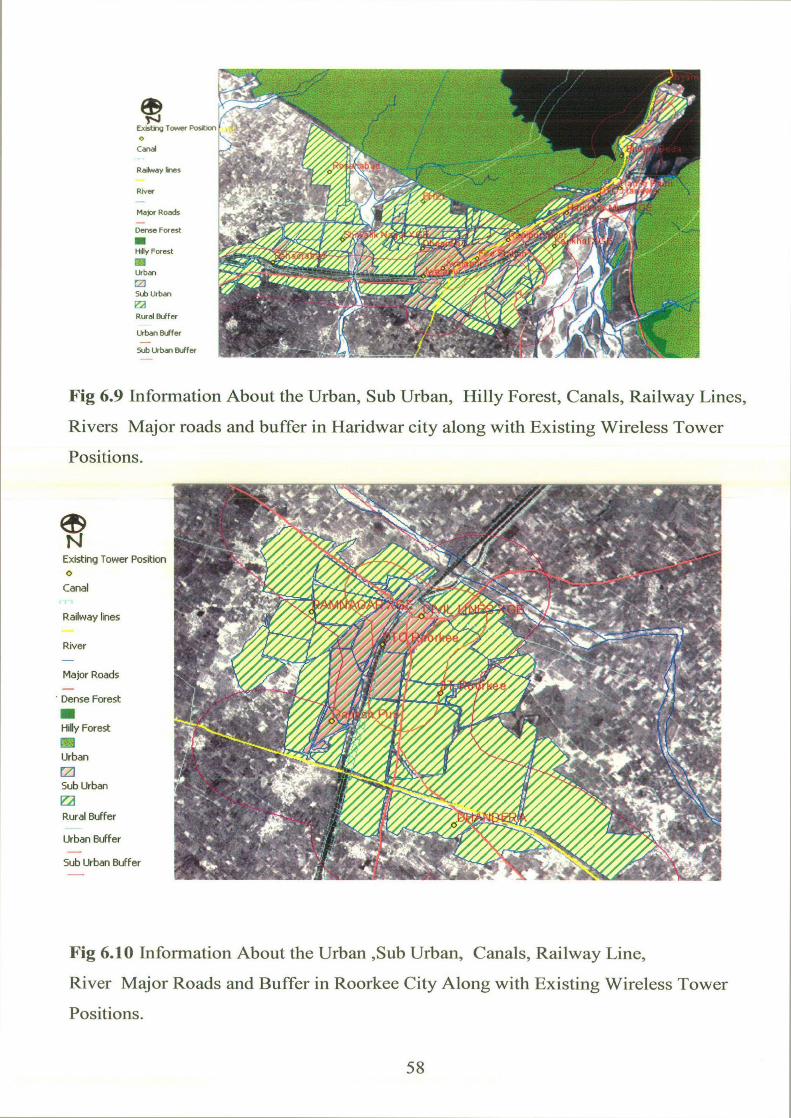
E, r n .. T—e, F~~v[w~ri
Canal ? 14%
Sc
Railway fins }`
River _ `k r
Maya Roads Dense Forest +, ̀
Hilly Forest
Urban
Sub Urban .., ® Rural Buffer '%~.; Urban B ffer 3y Sub Urban Buffer
Fig 6.9 Information About the Urban, Sub Urban, Hilly Forest, Canals, Railway Lines,
Rivers Major roads and buffer in Haridwar city along with Existing Wireless Tower
Positions.
Existing Tower Position 0
Canal
Railway lines
River
Major Roads
Dense Forest
0 Hilly Forest
Urban
rzi
Sub Urban
Rural Buffer
Urban Buffer
Sub Urban Buffer
Fig 6.10 Information About the Urban ,Sub Urban, Canals, Railway Line,
River Major Roads and Buffer in Roorkee City Along with Existing Wireless Tower
Positions.
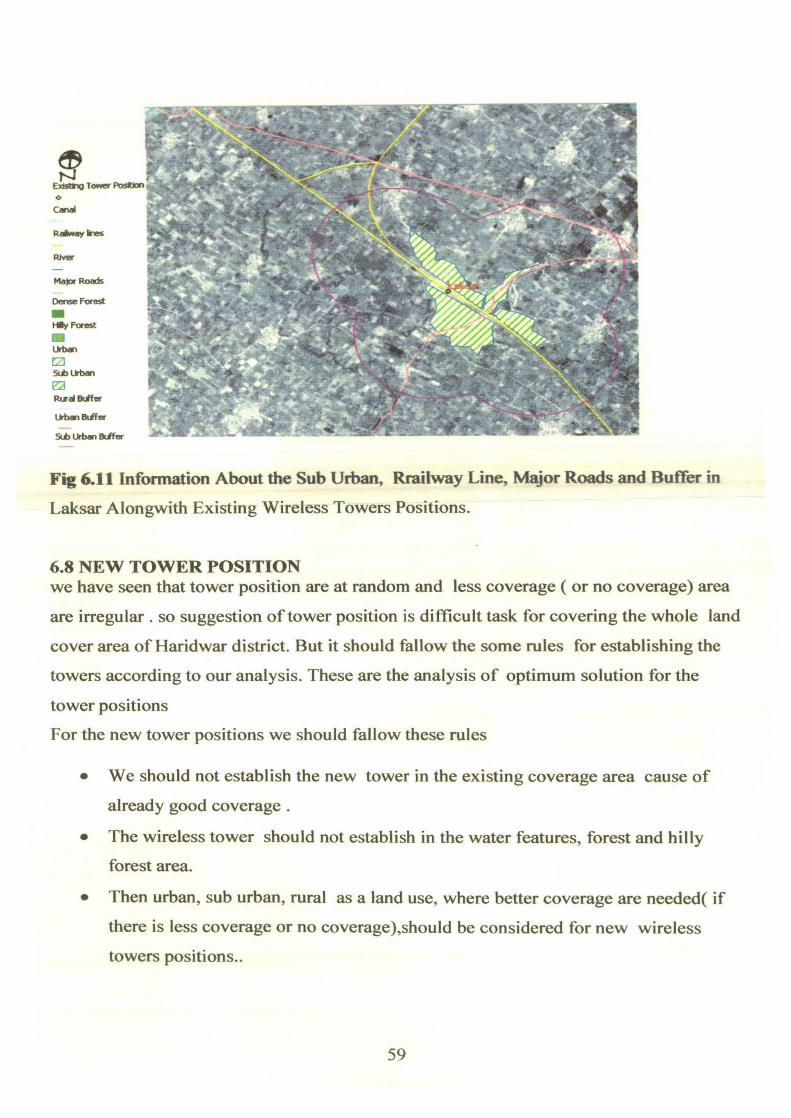
k : It t'
ExW&g Tawer Postoan.a ~. . ss~-. ` — *: r ~• _, ;
Ra way *Vs y t ~_ .
N{ajOf Roads 7- Vrt I,rA '. * i y o
DEI16C FOfQS# _._8
►
~~_Ct "` _-
Fly Past e 4 ,, ;1 r ti' ~d►~ a
Sib Urban 'f ,' r # f r , T ..
Rural Biffa ; a ` tkbl1181fff '~ om '~ ~ ~" . Y - t .
. . 7 r ~ ' i' *a, t. f*'. .'
Sub Urban Wier
Fig 6.11 Information About the Sub Urban, Rrailway Line, Major Roads and Buffer in
Laksar Alongwith Existing Wireless Towers Positions.
6.8 NEW TOWER POSITION we have seen that tower position are at random and less coverage ( or no coverage) area
are irregular . so suggestion of tower position is difficult task for covering the whole land
cover area of Haridwar district. But it should fallow the some rules for establishing the towers according to our analysis. These are the analysis of optimum solution for the
tower positions
For the new tower positions we should fallow these rules
• We should not establish the new tower in the existing coverage area cause of already good coverage.
• The wireless tower should not establish in the water features, forest and hilly forest area.
• Then urban, sub urban, rural as a land use, where better coverage are needed( if there is less coverage or no coverage), should be considered for new wireless towers positions..
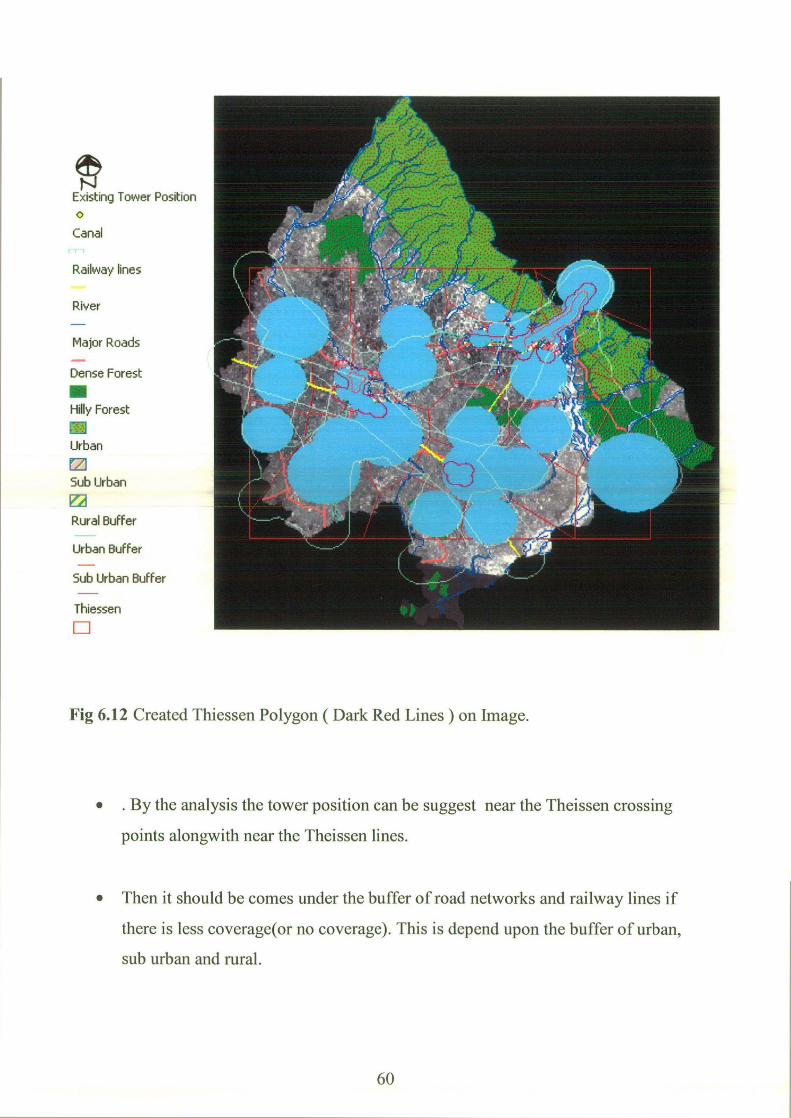
Existing Tower Position 0
Canal
Railway lines
River
Major Roads
Dense Forest
HNly Forest
Urban
Sub Urban
Rural Buffer
Urban Buffer
Sub Urban Buffer
Thiessen
Fig 6.12 Created Thiessen Polygon ( Dark Red Lines) on Image.
• . By the analysis the tower position can be suggest near the Theissen crossing
points alongwith near the Theissen lines.
• Then it should be comes under the buffer of road networks and railway lines if
there is less coverage(or no coverage). This is depend upon the buffer of urban,
sub urban and rural.
Z1
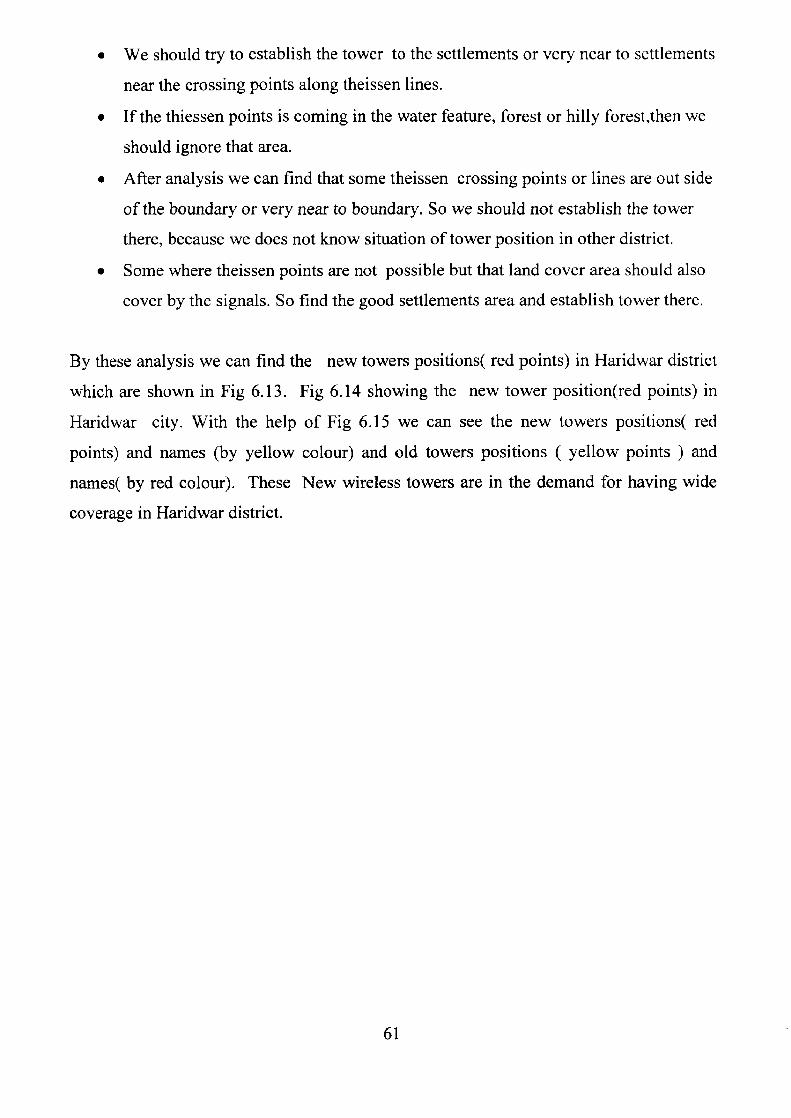
• We should try to establish the tower to the settlements or very near to settlements
near the crossing points along theissen lines.
• If the thiessen points is coming in the water feature, forest or hilly forest,then we
should ignore that area.
• After analysis we can find that some theissen crossing points or lines are out side
of the boundary or very near to boundary. So we should not establish the tower
there, because we does not know situation of tower position in other district.
• Some where theissen points are not possible but that land cover area should also
cover by the signals. So find the good settlements area and establish tower there.
By these analysis we can find the new towers positions( red points) in Haridwar district
which are shown in Fig 6.13. Fig 6.14 showing the new tower position(red points) in
Haridwar city. With the help of Fig 6.15 we can see the new towers positions( red
points) and names (by yellow colour) and old towers positions ( yellow points ) and
names( by red colour). These New wireless towers are in the demand for having wide
coverage in Haridwar district.
61
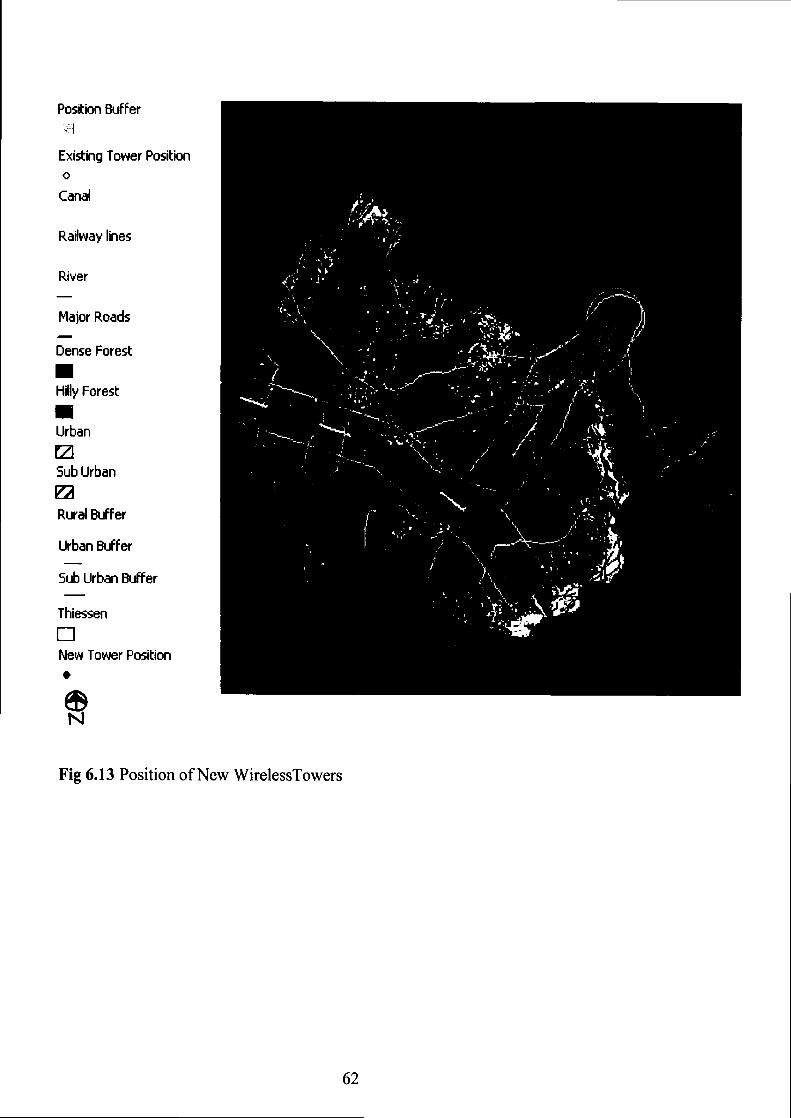
Position Buffer
Existing Tower Position 0
Canal
Railway lines
River
Major Roads
Dense Forest m Hilly Forest m Urban
Sub Urban
Rural Buffer
Urban Buffer
Sub Urban Buffer
Thiessen
New Tower Position •
Fig 6.13 Position of New WirelessTowers
62
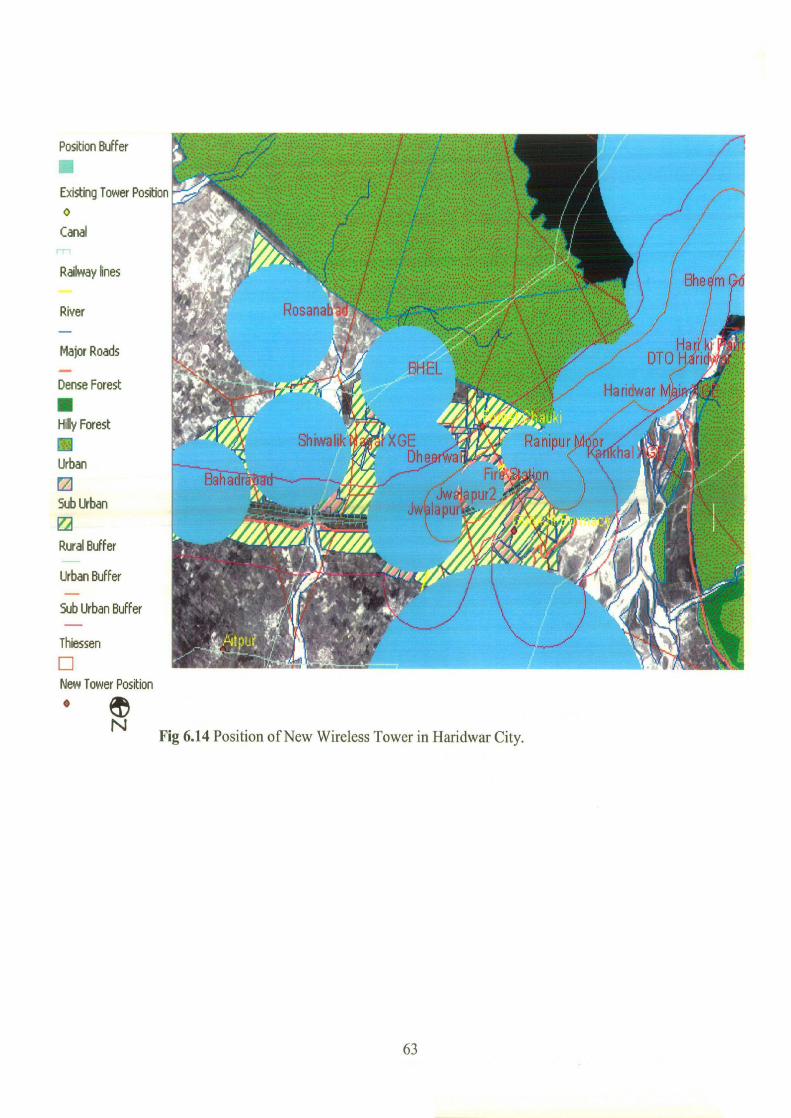
Position Buffer
. ••. I
Existing Tower Position
o e
Canal r
Railway lines ; ± l Bhe m
River Rosanabt ~r`
;. •:::... Har'(k~ Major Roads ~= ti ~ -
BHEL // DTO H.Irid
Dense Forest ® ; :; Haridwar
Hilly Forest ® ' ~ Shmahk XGE Ranipur P~1 r 1 ~~~
Urban 1 Dhe aA
® x r Jwa~ppurl, Sub Urban
Jw Ia purc !~ f 1
Rural Buffer
'1
Sub Urban Buffer ~.. Y a fy
1) Thiessen `• '
New Tower Position •
N Fig 6.14 Position of New Wireless Tower in Haridwar City.
63
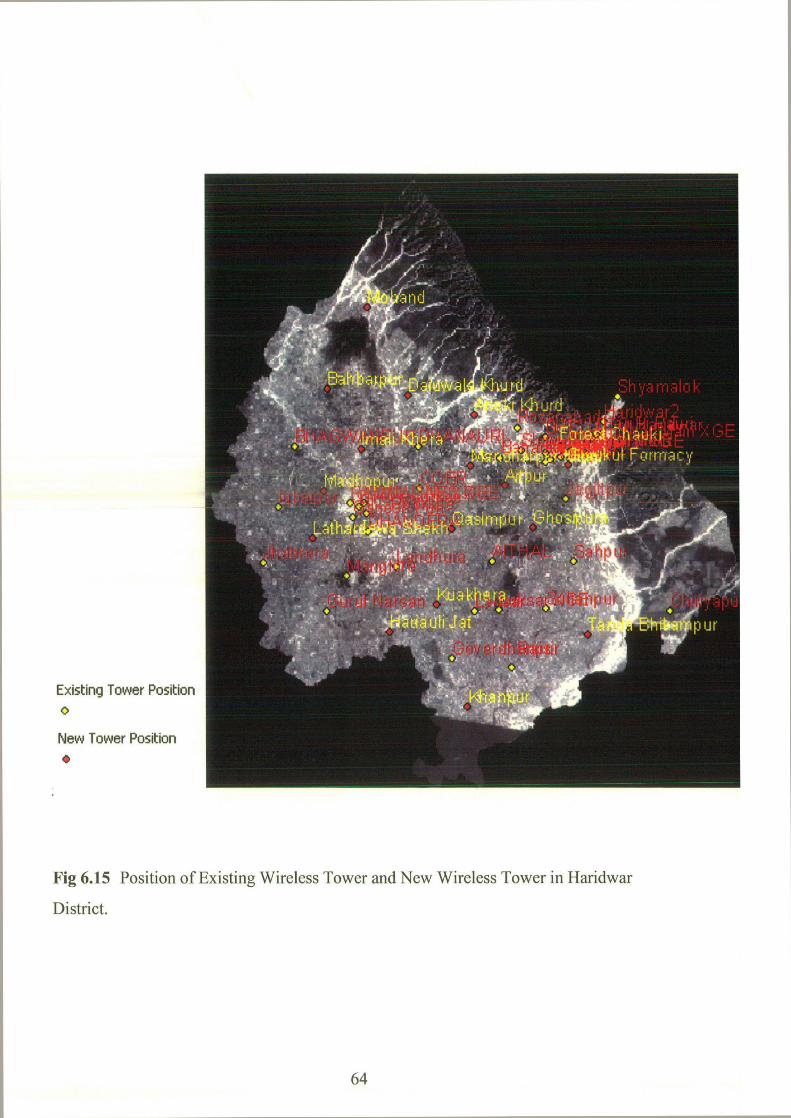
Existing Tower Position
New Tower Position
Fig 6.15 Position of Existing Wireless Tower and New Wireless Tower in Haridwar
District.
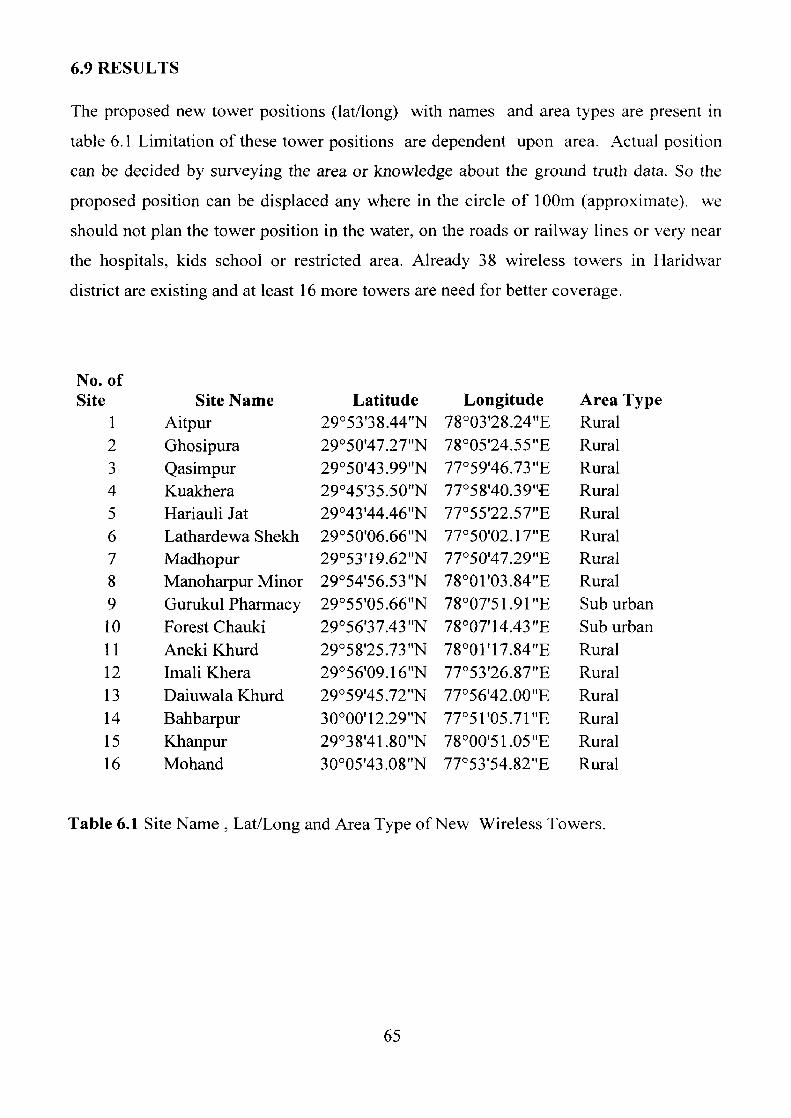
6.9 RESULTS
The proposed new tower positions (lat/long) with names and area types are present in
table 6.1 Limitation of these tower positions are dependent upon area. Actual position
can be decided by surveying the area or knowledge about the ground truth data. So the
proposed position can be displaced any where in the circle of 100m (approximate). we
should not plan the tower position in the water, on the roads or railway lines or very near
the hospitals, kids school or restricted area. Already 38 wireless towers in Haridwar
district are existing and at least 16 more towers are need for better coverage.
No. of Site
1 2 3 4 5 6 7 8 9 10 11 12 13 14 15 16
Site Name Aitpur Ghosipura Qasimpur Kuakhera Hariauli Jat Lathardewa Shekh Madhopur Manoharpur Minor Gurukul Pharmacy Forest Chauki Aneki Khurd Imali Khera Daiuwala Khurd Bahbarpur Khanpur Mohand
Latitude 29°53'38.44"N 29°50'47.27"N 29°50'43.99"N 29°45'35.50"N 29°43'44.46"N 29°50'06.66"N 29°53'19.62"N 29°54'56.53"N 29°55'05.66"N 29°56'37.43 "N 29°58'25.73"N 29°56'09.16"N 29°59'45.72"N 30°00'12.29 N 29°38'41.80"N 30°05'43.08"N
Longitude 78°03'28.24"E 78°05'24.55"E 77°59'46.73 "E 77°58'40.39E 77°55'22.57"E 77°50'02.17"E 77°50'47.29"E 78°01'03.84"E 78°07'51.91 "E 78°07'14 43 "E 78001'17.84"E 77°53'26.87"E 77°56'42.00"E 77°51'05.71 "E 78°00'51.05"E 77053'54.82"E
Area Type Rural Rural Rural Rural Rural Rural Rural Rural Sub urban Sub urban Rural Rural Rural Rural Rural Rural
Table 6.1 Site Name, Lat/Long and Area Type of New Wireless Towers.
M
9. Issues", Wacker A., Laiho-Steffens J., 1999, "Static Simulator for Studying
WCDMA Radio Network Planning Proc. IEEE VTC Spring Conf
10. CS 294-7: Radio Propagation Prof. Randy H. Katz CS Division University of
California, Berkeley Berkeley, CA 94720-1776 © 1996
1 1. I EMTS Radio Interface System Planning and Optimization Esmael Dinan Aleksc
K.urochkin Sam Kettani Issue Date: December 2002
12. The Use of Quantitative Association Rules in Cellular Network PlanningMichal
Okoniewski Study Paper on `Indicators for Telecom Growth' Study Paper No.
2/2005
13. .Algorithms and Software for Radio Signal Coverage Prediction in Terrains A
dissertation submitted to the Swiss Federal Institute of Technology (ETH) Zurich
for the degree of Doctor of Technical Sciences
14. Radiowave propagation, building databases, and GIS:anything in common? A
radio engineer's viewpoint Jean-Fre" de" ric Wagen}, Karim Rizk Wavecall SA,
EPFL-PSE/B, 1015 Lausanne, Switzerland.
15. Propagation Prediction Models Dieter J. Cichon 1, IBP PIETZSCH GmbH,
Germany Thomas Kilmer 1, E-Plus Mobilfunk GmbH, Germany.
16. GIS Aided Radio Wave Propagation Modeling and Analysis Li Qing Thesis
submitted to the Faculty of the Virginia Polytechnic Institute and State University
in partial fulfilment of the requirements for the degree
17.. Spectrum Auctions in India, Rekha Jain Indian Institute of Management
Ahmedabad, India [email protected]. in
18. .Coinchon M, Salovaara A-P, Wagen J-F, 2002, The impact of radio propagation
predictions on urban UMTS planning", in Proceedings of the International Zurich
Seminar on Broadband Communications 2002 (IZS1'02)
19. Maciel L R, Bertoni H L, Xia H H, 1993, "Unified approach to prediction of
propagation over building for all ranges of base station antenna height" IEEE
Transations onVehicular Technologies 42 (1)
20. Coverage and Capacity Calculations for 3G Mobile Network Planning Liang Guo,
Jie Zhang and Carsten Maple Department of Computing and Information Systems
University of Luton, Luton,
21..WCDMA radio network. planning S-72.4210 PG Course in Radio Communications
'l'o:mmi 1_leik.k.ila
22. Assignment of the Available Spectrum in the 900 MHz and 1800 MHz Bands to
the Existing Mobile Network Operators Consultation Paper 28 February 2005
23. 7, 3.A Coverage Area Estimation Model for Interference-Limited Non-Line-of-Sight
Point-to-Multipoint Fixed Broadband Wireless Communication Systems By
Vaidyanathan RamaSarma
24. Michel Mouly, Marie Pautet, The GSM SYSTEM FOR MOBILR
COMMUNICATIONS(1992)
25. ,The impact of radio propagation predictions on urban UMTS planning Mathias
Coinchon, Ari-Pekka Salovaara, Jean-Frederic Wagen, Univ. of Applied Sciences
of Western Switzerland in Fribourg, 1705 Fribourg, Switzerland
26. .GSM-Based Mobile Tele-Monitoring and Management System for Inter-Cities
Public Transportations M. AL-Rousan, A. R. AI-Ali and K. Darwish, Computer
27. G. Bussolino, "Use of geographic information systems and spatial data bases for
mobile radio applications", in CSELT Technical Reports (Vol.XXI, No.5,
December 1993)
28. An Intelligent Geographic Load Balance Scheme forMobile Cellular Networks Lin
Du,John Bigham, Laurie CuthbertDepartment of Electronic EngineeringQueen
Mary, University of LondonLondon E1 4NS, UK
29. A Comparison of Thiessen-polygon, Kriging, and Spline Models of UV Exposure
Zaria Tatalovich GIS Research Laboratory, Department of Geography, College of
Letters, Arts and Sciences, University of Southern California
911
Related Documents