PLANNING, MANAGEMENT, AND PERFORMANCE CHARACTERISTICS OF SMALL - MEDIUM SIZE BANKS IN THE MID-ATLANTIC REGION by Wilbert Charles Geiss, Jr. Dissertation in partial fulfillment of the requirements for the degree of Doctor of Philosophy Greenleaf University has been approved September 2003 Approved: Douglas J. McCready, Ph.D., Faculty Member and Chair Shamir Andrew Ally, Ph.D., Committee Member Norman Pearson, Ph.D, DBA, Ph.D (Mgt), Committee Member ACCEPTED & SIGNED: Douglas J. McCready, Ph.D., Mentor and Chair Shamir Andrew Ally, Ph.D., Chairman of the Board Norman Pearson, Ph.D., DBA, Ph.D. (Mgt), President, Greenleaf University

Welcome message from author
This document is posted to help you gain knowledge. Please leave a comment to let me know what you think about it! Share it to your friends and learn new things together.
Transcript

PLANNING, MANAGEMENT, AND PERFORMANCE CHARACTERISTICS OF SMALL - MEDIUM SIZE BANKS IN THE MID-ATLANTIC REGION by Wilbert Charles Geiss, Jr. Dissertation in partial fulfillment of the requirements for the degree of Doctor of Philosophy Greenleaf University has been approved September 2003 Approved: Douglas J. McCready, Ph.D., Faculty Member and Chair Shamir Andrew Ally, Ph.D., Committee Member
Norman Pearson, Ph.D, DBA, Ph.D (Mgt), Committee Member ACCEPTED & SIGNED:
Douglas J. McCready, Ph.D., Mentor and Chair
Shamir Andrew Ally, Ph.D., Chairman of the Board
Norman Pearson, Ph.D., DBA, Ph.D. (Mgt), President, Greenleaf University


ABSTRACT
This study was undertaken with the primary purpose of determining if there was any correlation between the level of strategic planning and financial performance of small and mid-size banks. To accomplish this task, data were collected from a sample of small and mid-sized banks in the Mid-Atlantic and Eastern Great Lakes states along with information from a Federal Reserve Bank data base.
The research was carried out using a mail survey, based upon a random sample of the banks in the target population. The data were analyzed using the Analysis of Variance technique and the Student-Newman-Kuells procedure where appropriate.
The findings of this study were that there was no correlation between the level of planning activities carried out by a financial institution and the performance of the institution as measured by the Return on Assets, the Return on Equity, and the Net Interest Margin. The findings also revealed that there was no correlation between the level of planning carried out by the financial institution and the management characteristics measured. The findings also found no correlation between the level of planning carried out and the size of the financial institutions within the target population.
These results were consistent and reaffirmed several prior studies indicating that there was little or no correlation between the level of planning and financial performance of the organization.
ACKNOWLEDGMENTS
The completion of this project was in large part due to the constant encouragement of my faculty advisor, Dr. J. Douglas McCready, at Greenleaf University. His helpful comments and interest in the project as the research study was undertaken were greatly appreciated. The input of the dissertation committee members; Dr. Norman Pearson and Dr. Shamir Ally assisted in the finalization of this document. Drs. McCready, Pearson, and Ally�s comments and suggestions were very helpful and improved the learning experience of this project. A final note of appreciation is extended to Dr. Thadeus Shura and Ms. Jan Winchell of Kent State University for their assistance in the statistical analysis and utilization of the Kent State University computing center for the actual processing of the analysis, and to Professor Harry Coblentz and Dr. Steven Powers, who were very helpful in the beginning of this research project, whose comments and encouragement were of great support.

DEDICATION
This dissertation is dedicated to my wife, Marilyn, and our children, Cindy, Brian, Jeffrey, and Christopher. Your support, understanding, and encouragement throughout this process has been a source of constant inspiration to see the project completed. Having had all four children in college at the same time as dad was undertaking this required much patience on their part and I am forever grateful for that. Thank you all for being there when it mattered most.
Finally, I would like to dedicate this to my mother, Mary Elizabeth Geiss, and to my mother-in-law, Lois June Lipp, who both passed away during the later stages of completing this project. Both were of great encouragement and support as I undertook this project, and I am truly sorry that they were never able to see me complete the research project.
TABLE OF CONTENTS
CHAPTER Page
1. INTRODUCTION . . . . . . . . . . . . . . . . . . . . . . . . . . . . . . 1 THE RESEARCH PROBLEM. . . . . . . . . . . . . . . . . . . . . . . 2 PURPOSE OF THE STUDY. . . . . . . . . . . . . . . . . . . . . . . . 4
SCOPE OF THE STUDY. . . . . . . . . . . . . . . . . . . . . . . . . . 5
DEFINITION OF TERMS . . . . . . . . . . . . . . . . . . . . . . . . .
6
ASSUMPTIONS. . . . . . . . . . . . . . . . . . . . . . . . . . . . . . . . 7
HYPOTHESES. . . . . . . . . . . . . . . . . . . . . . . . . . . . . . . . . 8
2. REVIEW OF LITERATURE . . . . . . . . . . . . . . . . . . . . . . . 14
STRATEGIC PLANNING. . . . . . . . . . . . . . . . . . . . . . . . .
15
STRATEGIC PLANNING AND ORGANIZATIONAL PERFORMANCE . . . . . . . . . . . . . . . . . . . . . . . . . . . . . .
23
3. THE RESEARCH METHODOLOGY. . . . . . . . . . . . . . . . . . 32
TARGET POPULATION . . . . . . . . . . . . . . . . . . . . . . . . . 33
SAMPLING PROCEDURE AND SAMPLE SIZE. . . . . . . . . . . 34
RESEARCH DESIGN. . . . . . . . . . . . . . . . . . . . . . . . . . . . 36
INSTRUMENTATION. . . . . . . . . . . . . . . . . . . . . . . . . . . 37
DATA COLLECTION PROCEDURES. . . . . . . . . . . . . . . . . 39
DATA ANALYSIS . . . . . . . . . . . . . . . . . . . . . . . . . . . . . 40 -i-
4. THE RESEARCH FINDINGS. . . . . . . . . . . . . . . . . . . . . . 46
THE SURVEY RESPONSE . . . . . . . . . . . . . . . . . . . . . . . 46
HYPOTHESIS TESTING. . . . . . . . . . . . . . . . . . . . . . . . . 52
5. SUMMARY, CONCLUSIONS, AND RECOMMENDATIONS. . . . . . . . . . . . . . . . . . . . . . . . . . 69
SUMMARY. . . . . . . . . . . . . . . . . . . . . . . . . . . . . . . . . .
69
LIMITATIONS . . . . . . . . . . . . . . . . . . . . . . . . . . . . . . . 70
CONCLUSIONS . . . . . . . . . . . . . . . . . . . . . . . . . . . . . . 72
RECOMMENDATIONS. . . . . . . . . . . . . . . . . . . . . . . . . . 77
BIBLIOGRAPHY. . . . . . . . . . . . . . . . . . . . . . . . . . . . . . . . . . . . . . . . 84
APPENDIX A. COVER LETTER . . . . . . . . . . . . . . . . . . . . . . . . . . . . . . 88
B. BANK PLANNING SURVEY QUESTIONNAIRE . . . . . . . . 90 C. BANK PLANNING SURVEY RESULTS - TOTALS. . . . . . . . 94
D. BANK PLANNING SURVEY RESULTS -
RETURN ON ASSETS. . . . . . . . . . . . . . . . . . . . . 97
E. BANK PLANNING SURVEY RESULTS - RETURN ON EQUITY. . . . . . . . . . . . . . . . . . . . 99

F. BANK PLANNING SURVEY RESULTS - NET INTEREST MARGIN. . . . . . . . . . . . . . . . . . 101
G. BANK PLANNING SURVEY RESULTS -
NUMBER OF PLANNERS. . . . . . . . . . . . . . . . . . 103
H. BANK PLANNING SURVEY RESULTS - AGE OF PLANNERS . . . . . . . . . . . . . . . . . . . . . 105
-ii-

I. BANK PLANNING SURVEY RESULTS -
EDUCATION OF PLANNERS. . . . . . . . . . . . . . . . 107 J. BANK PLANNING SURVEY RESULTS -
NUMBER OF DIRECTORS. . . . . . . . . . . . . . . . . 109 K. BANK PLANNING SURVEY RESULTS -
AGE OF DIRECTORS. . . . . . . . . . . . . . . . . . . . . 111 L. BANK PLANNING SURVEY RESULTS -
YEARS OF PLANNING. . . . . . . . . . . . . . . . . . . . 113 M. BANK PLANNING SURVEY RESULTS -
TOTAL ASSET SIZE. . . . . . . . . . . . . . . . . . . . . 115 N. MULTITRAIT-MULTIMETHOD MATRIX. . . . . . . . . . . . . 117
O. PERMISSION TO USE QUESTIONNAIRE
DEVELOPED BY WATTS . . . . . . . . . . . . . . . . . . 119 P. 1999 COMPARISON TO ORIGINAL
SURVEY RESULTS . . . . . . . . . . . . . . . . . . . . . 121
-iii-

CHAPTER 1
INTRODUCTION
The financial and monetary system in the United States has operated in a
very turbulent environment since 1980. The result of this turbulent environment
has been a record number failures of financial institutions during this recent
period and a movement towards larger and larger mergers in many geographic
areas. Examples of recent mergers announced during 1995 were the Chemical
Bank and Chase Corp., National City Bank and Integra Financial, and First
Interstate Bank and Wells Fargo mergers. Each of these mergers was completed
by early 1997. They resulted in institutions which have asset bases of at least $30
billion and were 50 percent larger than prior to the merger.
The merger activity continued during 1997 with the announcement of the
large mergers of Nations Bank Corp. acquiring Boatmens Bankshares, Mercantile
Bancorp acquiring Roosevelt Financial Group, Bank One acquiring First USA,
and smaller mergers such as Citizens Bankshares acquisition of UniBank and
Century National Bank.
Since the beginning of the deregulation of financial institutions in the early
1980's the role of management within the financial institutions has changed
significantly. The aspect of planning has been identified as extremely important
in determining the growth and success of virtually all businesses. This study was
2
undertaken to examine the relationship of strategic planning to the financial
performance results of small sized banks.
THE RESEARCH PROBLEM
Planning, organizing, controlling, and directing/leading are the four
primary management functions as described by Donnelly, Gibson, and
Ivancevich
(1998, p. 7 - 8), as well as others such as Robbins and Coulter (1999, p. 11 - 12),
Daft and Marcic (1998, p. 8 - 10) and Hellriegel, Jackson, and Slocum (1999, p.
9 - 11). Planning is often cited as the most critical of the management functions
in determining the overall long-term survival of the business entity. Managers
are taught in business schools and in management seminars that planning is
critical to the success of an organization in meeting its goals and objectives.
However, the specific relationship of the planning function to the profitability
and performance of the business entity is uncertain. It is because of this
uncertainty that this research project was undertaken.
The viability of the monetary and banking system of our country is
extremely important from an economic, political, as well as social perspective. As
reported by the Federal Reserve Board, the number of banks in the United States
at the end of 1997 was 9,325 versus 12,430 at the end of 1990. The vast majority
of these institutions are �small-to-mid-size�, as defined by asset size. The
Federal Reserve Board data indicated that of the 9,325 banks in the United States

3
at the end of 1997, 9,176 or 98.4 percent of the institutions were less than $1
billion in asset size.
Thus the viability of these smaller banks has a significant impact on the
geographic economies as well as the monetary system overall. Just as the long-
term viability of any business entity is based upon its financial performance, the
same is true for financial institutions. The success or lack of success of these
financial institutions in the future may be significant for several reasons. First,
they make up a very large proportion of the financial firms in our nation, 98.4
percent, as indicated by the Federal Reserve data stated earlier. Any structural
changes in the industry could have a potential impact economically, as well as
socially, as the majority of these institutions are in rural areas as opposed to
urban areas. Second, the financial and banking system is still undergoing the
effects of deregulation from the Depository Institutions Deregulation and
Monetary Control Act of 1980 (DIDMCA). Policy-makers and regulators are still
trying to adapt to this changing environment. Changes by policy-makers and
regulators could potentially alter the financial services delivery system as it is
currently known. A third factor is that small to mid-sized banks have been one
primary component of our �dual banking� system. The objective of this study
was not to analyze or determine the significance of these three factors but to look
at the small and mid-size banks and determine if strategic planning might play a
role in the long-term survival of these institutions, again assuming that by
planning the attainment of organizational goals may be enhanced.

4
Currently there is no clear cut answer whether or not strategic planning
influences the bottom line performance for businesses. Several studies such as
those by Ansoff (1988) and by Layton (1991) showed that a formal strategic
planning system was an important factor in leading to corporate success, as
measured by financial performance. Other researchers of the strategic planning
activity such as Watts ( 1987) and Malik and Karger (1975) have reported
conflicting evidence which both supports and refutes the significance of a formal
strategic planning process on the corporate success of an organization. The
challenge for this research project was to provide a quantifiable analysis of the
planning / performance relationship, taking into consideration the potential
influences of managerial, organizational, and environmental characteristics.
PURPOSE OF THE STUDY
In defining the purpose of this study, the main objective was to expand the
existing knowledge base regarding strategic planning practices in small sized
banks and the impact on performance of the institutions. In order to do this, it
was planned that a more up-to-date and complete description of the planning /
performance relationship would result by examining the strategic planning
practices of a random sample of small and mid-size banks and correlating their
performance results. The data gathered by this sample was used to describe , in a
quantifiable manner, the relationship between planning, managerial

5
characteristics, and financial performance for a sample of financial institutions
operating in a similar environment.
SCOPE OF THE STUDY
The first objective of this study was to determine if the level of planning
utilized had any significant impact upon the level of performance of the
institutions in question. The second objective was to identify management
characteristics which may be important to the strategic planning process within
the firm. The study was specifically limited to financial institutions within the
commercial banking sector of the economy. The study did not include financial
institutions which were classified as savings and loan associations or credit
unions. These categories of financial institutions were not included in the study
due to economic and practical considerations of the research design as it relates
to the available data base for the study. Along with identifying management
characteristics which may be important to the planning process in the financial
institutions, the study was also limited by the subject population. Again, only
firms in the commercial banking sector were analyzed to try and control for
various extraneous environmental factors, as all financial institutions operate in a
similar environment relative to regulations and operating practices. The sample
was a subset of the 10,320 commercial banking institutions in the United States as
of December 31, 1995. This subset is more clearly defined in Chapter 3, the

6
methodology portion of the text.
For this study it was assumed that the 208 financial institutions in the
random sample were representative of the 1040 banks in the population�s data
base of banks in the eight state area, including New York, New Jersey, Delaware,
Maryland, Virginia, Pennsylvania, Ohio, and West Virginia B with Total Assets
under $1 billion.
DEFINITION OF TERMS
In order to make the research meaningful and clear to all who may read this
dissertation the following terms are operationally defined as they are used in the
financial services sector of the economy.
Strategic Planning - very simply stated, strategic planning is long-range
planning. However, it goes beyond just the aspect of long-range planning for an
organization to develop a process whereby the organization looks at its resources
and the environment and then tries to determine where the organization should
be going in the next three to five year time frame. One of the most common
definitions of strategic planning is stated by Vancil and Lorrange (1975, p. 81 -
90). They state that it is a process using a time horizon of several years, whereby
management reassesses its current strategy by looking for opportunities and
threats in the environment and by analyzing the company�s resources to identify

7
its strengths and weaknesses.
Return on Assets - the return on assets is a financial ratio which allows the
observer to make some determination of the organization�s financial performance
relative to the assets which are at the firm�s disposal. Gitman (2000, p. 144)
stated in formula manner, the return on assets as follows:
ROA = net income after taxes / total assets. For financial firms in
the commercial banking sector, an ROA of 1.0% or greater
is desired. The 1.0% or higher ROA is a guideline of
minimum satisfactory performance.
Return on Equity - the return on equity is another financial ratio which
measures the firm�s overall profitability relative to the equity base which it has
available. In other words it tells the observer how much is earned by the firm
based upon the amount of equity the owners have invested in the business. Again,
Gitman (2000, p. 146) stated a formula, the return on equity is as follows:
ROE = net income after taxes / stockholders� equity. For firms in
the commercial baking sector an ROE of 125 or greater is
desired. The 12 % ROE is a general guideline of minimum
satisfactory performance.
Net Interest Margin - the net interest margin is a measure of how well the
institution is able to maintain a spread between the interest income to interest
expense. In very simplistic terms the higher the net interest margin the better, as it
indicates a very positive spread between what is being paid out in interest expense

8
versus what is being earned as interest income. It is another measure of financial
performance, but is more specific and not a general indicator of profitability
overall. Stated as a formula, the net interest margin is as follows:
NIM = (net interest income - net interest expense) average gross earning assets
There are no general �rules of thumb� for the NIM, but
typical net interest margins vary from 4.00% to 5.00%.
The �guidelines� stated above for the Return on Assets, Return on Equity,
and Net Interest Margin are based upon industry peer group analysis as
conducted by Robert Morris Associates and Shesenoff Group for the banking
sector of the economy. They are presented only as basic points for comparison
and not as actual specific averages for any one given time period.
Small Financial Institutions - for the purposes of this study, small financial
institutions were defined as those with an asset size of $1billion or less.
ASSUMPTIONS
For the purposes of this study the following assumptions were made to
perform the necessary analysis and evaluation of the stated research problem as
indicated in the hypotheses portion which follows.
First, it was assumed that the 208 banks contained in the random sample
were representative of the population from which the sample was obtained (the

9
1040 banks under $1 billion in asset size). Second, it was assumed that the
respondents answered the questions with openness, candor, and honesty with
regards to the questionnaire. The third assumption was that the results were not
biased towards one outcome over another.
HYPOTHESES
For this study there were three primary research hypotheses which were
tested. One deals with the relationship of the degree of planning utilized and the
financial performance of the institution, based upon the performance
measurements of Average Return on Assets, Average Return on Equity, and
Average Net Interest Margin. The second deals with the relationship of the
degree of planning utilized compared to the management / organizational
characteristics of the institution, based upon the specific characteristics of age,
education, number of persons involved in the planning process, as well as the age
and number of directors the institution had, and the number of years the
institution had been involved in a formal planning process. The final hypothesis
deals with the relationship of the degree of planning utilized and the size of the
financial institution.
For the specific statement of the relationship of planning relative to the
three financial performance measurements, the research hypotheses are as
follows:

10
H1a : that there is no statistical difference between the Average
Return on Assets for the four (4) planning groups, based upon
the degree of planning sophistication utilized.
H1b : that there is no statistical difference between the Average
Return on Equity for the four (4) planning groups, based upon
the degree of planning sophistication utilized.
H1c : that there is no statistical difference between the Average Net
Interest Margin for the four (4) planning groups, based upon
the degree of planning sophistication utilized.
For the specific statement of the relationship of planning to the various
management / organizational characteristics, the research hypotheses are as
follows:
H2a : that there is no statistical difference between the degree of
planning sophistication, based upon the number of persons
involved in the planning process for the four (4) quartiles of
number of persons involved in the planning process.
H2b : that there is no statistical difference between the degree of
planning sophistication, based upon the average age of the
individuals involved in the planning process for the four (4)

11
quartiles of average age of the planners.
H2c : that there is no statistical difference between the degree of
planning sophistication utilized, based upon the average
educational level of the individuals involved in the planning
process for the four (4) education level quartiles.
H2d : that there is no statistical difference between the degree of
planning sophistication, based upon the average number of
directors of the institution for the four (4) quartiles of number
of directors of the institution.
H2e : that there is no statistical difference between the degree of
planning sophistication utilized, based upon the average age of
the directors of the institution for the four (4) quartiles
segmenting the average age of the institutions� directors.
H2f : that there is no statistical difference between the degree of
planning sophistication, based upon the number of years the
institutions have been involved with a formal planning process
for the four (4) quartiles segmenting the number of years the
institutions have been involved with a formal planning process.

12
For the specific statement of the relationship of planning relative to the size
of the financial institution the research hypothesis is:
H3 : that there is no statistical difference between the degree of
planning sophistication, based upon the size of the financial
institution for the four (4) quartiles segmenting financial
institution size.
The remainder of the study is broken into four sections. The first section is
a review of the literature base related to the subject matter. Next is a presentation
of the methodology utilized for the research study. The third section is the
presentation of the actual research results of the survey. The last section is a
discussion of the conclusions of the research study and recommendations for
further study.
All data utilized in this study were deemed to be of a confidential nature
and the respondents were assured that there would be no identification of their
institutions by name in the results or indirect identification from the tabulation of
the responses.
As a final note, the original data collection for this study was done in 1996
utilizing 1995 statistics. Due to personal issues, specifically a major career change
and the sudden death of an immediate family member, this research was not
completed until 2001. As a result, 1999 data was obtained to see if there had been
any changes in the statistical relationships between the general performance

13
indicators and to determine what was the current status of the number of banks
in the United States.

14
CHAPTER TWO
REVIEW OF LITERATURE
This study was undertaken to determine if there was a relationship
between the level of planning and financial performance in small to mid-sized
financial institutions. The concept for this study was based upon the
management premise that planning, specifically planning strategically, is an
important part of the management function. Donnelly, Gibson, and Ivancevich
(1998, p. 140 - 142) state that , �planning included those managerial activities
that determine objectives for the future and the appropriate means for achieving
those objectives. The fact that most managers plan in some form is ample
evidence of its importance in management.�
Donnelly, Gibson, and Ivancevich (1998, p. 164) further state that,
�organizations today not only need to function in a competitive and hostile
environment but must be able to cooperate with other companies, perhaps even
with those that in other respects may be competitors.� The strategic planning
process can assist in this environment as it involves taking information from the
environment and deciding on organizational mission, objectives, strategies, and
portfolio plan.
Based upon the comments of Donnelly, Gibson, and Ivancevich as stated
earlier, this review of literature is segmented into two basic areas: 1.) Strategic
Planning, and 2.) Strategic Planning as related to Organizational Performance.

15
The specifics of the research methodology are presented in the third chapter of
the text. The purpose of the literature review was to obtain a broad base of
knowledge on strategic planning and to review the aspects of financial
institution’s management.
A. STRATEGIC PLANNING
The starting point for this section was to develop a clear understanding of
what strategic planning is and how it is defined. Strategic planning determines
where the organization should be going so that all organizational efforts can be
pointed in that direction. Strategic planning is the single most important
function of the chief executive officer or key decision-maker in any organization.
(Below, Morrisey, and Acomb, 1987, p. 1).
Chandler (1962, p. 12) was one of the first management writers to
introduce strategic planning into the discussion of how to improve organizational
performance. He stated that the concern of the strategic decision-making process
is the long-term health of the organization. The strategic plan is the first of three
major components of the integrated planning process. The strategic plan
establishes the basic nature and direction of the organization. Chandler (1962, p.
15) further states that development of the strategic plan requires involvement and
commitment of the chief executive officer or key decision-maker, and eventually
managers throughout the organization must become involved and committed to
support the total organizations efforts.

16
The history of strategic planning is relatively short when compared to many
other management concepts. Strategic planning can be traced to military
activities when the resources and technology required by warfare made planning a
necessity. The well known British military historian Hart (1968, p. 2) implied that
the term strategy is best confined to the meaning of �generalship� - the actual
direction of military force, as distinct from the policy that governs its employment.
In many cases terminology must be defined. Holloway (1968, p. 2 - 3)
states that the difference between strategic planning and strategic management is
nebulous at best. The value of strategic planning is that it both simulates and
stimulates. The strategic planning process permits one to simulate the future on
paper and modify the projections if needed. Strategic planning stimulates
executives to discharge their duties effectively. This is where the strategic
planning process or program comes into action.
Many other contributors to the planning literature, such as Steiner (1979)
and Drucker (1974) agree that a formal planning system is an important factor
leading to corporate success. (Success is typically defined in terms of financial
performance in the business community). As these major writers indicated,
planning is an important factor of corporate success. The saying that, �if you
don�t know where you are going, any road will lead you there,� illustrates that
need for planning, as a business must know where it is going. Pfeiffer (1991, p. 1)
states that another basic definition of strategic planning is that it is the process

17
by which an organization envisions its future and develops the necessary
procedures and operations to achieve that future. In other words, knowing where
we are going and which road to take to get us to that point!
Chandler (1968, p. 383) stated that the role of administration and function
of the administrator in the large American enterprise has been to plan and direct
the use of resources to meet short-term and long-term fluctuations and
developments in the market. Of the two types of administrative decisions, one
�the strategic� deals with the long-term allocation of existing resources and the
development of new ones essential to assure the continued health and future
growth of the enterprise. From this is derived the present concept of �strategic
planning� as a long-range versus a short-range objective for business entities.
Typically the modern day strategic plan looks beyond the immediate operating
circumstances and tries to view the business at two (2) to five (5) years from the
present, in terms of where the business wants to be, not necessarily where it is
going.
Ackoff reiterates the concept as presented by Chandler. Ackoff (1970, p. 4
- 5) stated that the longer the effect of a plan and the more difficult it is to
reverse, the more strategic it is. Strategic planning is long-range planning. But,
he states that both types of planning are necessary, short-range and long-range.
They may be looked at separately, but they cannot be separated in fact.
Another well known management writer Ansoff (1988, p. 205 - 206)
indicated that the prescriptions which have been developed for strategic planning

18
were based upon three underlying assumptions. First, reasonable people will do
reasonable things, and that managers will therefore welcome new ways of
thinking and will cooperate wholeheartedly. The second assumption was that the
key problem in strategy was to make the right decision, and that existing
operations - implementation systems and procedures would effectively translate
strategic decisions into actions. The third basic assumption was that strategic
formulation and strategic implementation are sequential and independent
activities. But, the accumulated experiences of the past twenty years has
progressively cast serious doubt on all three assumptions.
Cyert and March (1963, p. 21 and 289) discussed the process of decision-
making from the perspective of analyzing the behavioral theory of the firm. They
indicated that there are many questions about the behavior of business firms, but
only a few answers. The problems of how business firms ought to make decisions
- as contrasted with how they do make decisions - form the basis for an extended,
growing, and sophisticated literature.
There are many additional definitions or perspectives that have been
presented regarding planning in addition to those presented thus far in this
review. There are varying degrees of agreement as to such particulars as the
time-frame, resource allocation, who carries out the strategic planning process,
the methodology used, and the like. For many, the concept of strategic planning
is less clearly defined than operational planning. Often there is very little
differentiation between the terms corporate planning, strategic planning, and

19
long-range planning. One of the best known definitions of strategic planning is
that used by Vancil and Lorrange (1975, p. 81 - 90). They stated that the widely
accepted theory of corporate planning is simple: using a time horizon of several
years, top management reassesses its current strategy by looking for opportunities
and threats in the environment and by analyzing the company�s resources to
identify its strengths and weaknesses. Management may draw up several
alternative strategic scenarios and appraise them against the long-term objectives
of the organization. To begin implementing the selected strategy (or continue a
revalidated one), management screens it out in terms of the actions to be taken in
the near future.
Based upon the discussion to this point there is a fairly common
denominator or consensus of the authors that strategic planning is a process
whereby an organization looks at its resources and the environment, and tries to
determine where the organization should be going in the near future (three to five
years typically). This management function is primarily carried out by the top
level or senior management of the organization, but should have some input from
all levels of the organization, as it impacts the entire organization at all levels. It
is this basic premise, outlined above, that will be used when dealing with strategic
planning throughout the study to be undertaken.
The second phase of the study deals with trying to determine if there is any
correlation between several managerial / organizational characteristics and the
overall level of planning conducted by the organization. Most basic management

20
texts refer to several factors of management and organizational features that may
have some bearing on the planning and decision-making process within the
organization. Donnelly, Gibson, and Ivancevich (1998, p. 113 - 180) referred to
several characteristics of management which may have some influence on the
planning and decision-making process. They stated that factors such as the
educational level of the managers, the age, and the number of persons involved in
the planning / decision-making process may have some influence on the overall
process.
These same basic characteristics are reinforced by Flippo (1970, p. 184 -
186) as he discussed the importance of the number of persons involved in
committees and the decision-making process as well as general factors which may
influence the overall planning and decision-making such as educational level of
the persons involved and the experience level with the planning process.
Hitt, Middlemist, and Mathis (1986, p. 90 - 137) discussed these same
basic characteristics when looking at the decision-making and planning
environment in an organization. They discussed the importance of the number of
persons involved in the planning / decision-making process as well as the
potential influence on the planning process of such factors as age, education, and
overall experience of the persons involved with the process.
Robbins and Coulter (1998, p. 218 - 219) also mention similar concepts
when they discussed the problems of planning as related to a diverse work force
that is part of the manager�s future environment. Daft and Marcic (1998, p. 244)

21
state that �making choices depends upon a managers personality factors and
willingness to accept risk and uncertainty.� Again, characteristics such as age,
education, and others previously mentioned may have a significant influence on
the personality characteristics of a manager.
Before leaving this topic, a comment on the future of strategic planning /
management is in order. Is this concept of strategic planning a long-lasting
management function, or is it a short-term fad? Klay (1989, p. 427 - 428) sums
up the future of strategic planning / management quite well. He stated that the
issue at hand is not whether strategic formulation has a future, for it certainly
does. There can be little doubt that leaders will always involve themselves in the
formulation of strategy. What is in doubt is the future of anticipating strategy
formulation and particularly, the emerging body of perspective theory intended
to guide development and implementation of pro-active strategy.
Klay (1989, p. 427 - 428) further states that the future of prescriptive
strategic planning / management, the body of theory that prescribes methods for
pro-active strategy formulation and implementation, may well depend upon three
factors: perceived need to anticipate, practicability of prescriptions, and
perceived utility of implementing such prescriptions. It is assumed that the
future environment of organizations will be sufficiently turbulent that there will
be a need to anticipate. Competitive pressures and fundamental structural
changes in our economy and society will prompt many organizational leaders to
seek new ways to cope with changing conditions. Therefore, the future of

strategic
22
planning / management will depend mostly on the degree to which potential users
will perceive the set of prescriptions derived from the theory to be useful and
doable.
In keeping with the theme of a turbulent environment and the need to
anticipate change, Gebelein (1993, p. 17 - 19) stated that structural changes often
take place much faster than expected. The strategic choices that companies make
now will limit choices and raise new strategic issues in the future. In short, an
industry�s structure must be continually analyzed, and plans must be created or
modified in response to market changes.
Ruocco and Proctor (1994) argue that when an organization engages in
strategic planning that a structured approach to the process is recommended over
the unstructured or informal approach to long-range planning. They also noted
that the perceptions of the senior management team involved in the strategic
planning process were a critical component in the success of the planning process.
Glaister and Falshaw (1999) also looked at the overall strategic planning
process in a cross-section of industries. They surveyed 500 companies in the
United Kingdom and ended up with 113 useable responses. The findings of their
study showed that there were several management/organizational characteristics
that were somewhat common to all the firms responding. Approximately two-
thirds of the firms had a formal written mission statement and in excess of ninety
percent had a set of medium or long term goals. They found that there was
virtually no difference between the manufacturing sector and the service sector
23
when dealing with these managerial/organizational characteristics, and there was
overall agreement among the firms responding to their survey that strategic
planning was an important part of the management process for any firm.
Little information can be found in the literature that denies the importance
of planning as an overall function of management in any organization. But the
question is, is there a relationship between the planning conducted by an
organization and the overall level of performance of the organization? That is the
question to be reviewed in the next section of the literature review.
B. STRATEGIC PLANNING AND ORGANIZATIONAL PERFORMANCE
Organizational performance for banks as well as other types of bussinesses,
service or production oriented, is defined based upon �financial performance� of
the firm. Such measures of performance as Return on Assets, Return on Equity,
Net Interest Margin, Non-performing Asset Ratio, Non-interest Expense Margin,
etc. are typically used by accountants, analysts, and managers. For other types
of industries the terminology may be slightly different, but the end result is
basically the same - performance measurement! This is true even for the �non-
profit� organizations such as health care providers and the like. Performance is
measured by financial measures such as Net Operating Margin, Contractual
Allowance & Bad Debts Ratio, Overhead Ratios, and Surplus percentages for such

organizations. Again, the terminology changes slightly to meet the particular
24
industry in question, but the end result is the same.
When looking at the organizational performance of most industry sectors,
the financial ratios and the basic financial data are usually readily available.
Things such as annual reports and trade group statistics are usually quite
accessible. However, very little information has been reported as it relates to the
organization�s performance and its strategic planning process. The question
asked and then researched in this study was, when looking at industry statistics,
etc. why are some firms within an industry �high performers� - those with well
above industry averages for the performance measurements and others are
substantially �below� the average? Does the management planning process or
lack thereof, have any correlation to the organizational performance of the firm?
Layton (1991) in her study of the financial performance of the health care
industry found a positive correlation existed for executive managers of health care
organizations that performed a structured strategic planning process and the level
of financial performance of the organization. The results showed that the
correlation was more positive for larger health care organizations, but was also
positive for smaller health care organizations as well.
One of the most frequently used and quoted sources which supports long-
range (strategic) planning and its effects on the financial performance of the firms
is that of Thune and House ( 1970, p. 81 - 87). Their study dealt with thirty-six
(36) firms in six (6) different industries. The results of this longitudinal research

study found that formal planners financially outperformed those that
25
only had an informal planning process. Thus using the financial performance as a
measure of organizational performance, there was a direct correlation of
performance and planning.
In another study Ansoff, Avner, Brandenburg, Porter, and Radosevich
(1970, p. 3 - 7) studied the effect of formal planning on the success of acquisitions
made by United States manufacturing firms. They studied ninety-three (93) firms
as either planners, or non-planners and evaluated the resulting performance of
each group. The study results indicated a very strong relationship between formal
planning and the success of the firm�s acquisition. The planners outperformed
the non-planners in almost every characteristic that Ansoff, Avner, Brandenburg,
Porter, and Radosevich measured.
In a study specifically related to the financial services sector Wood and
LaForge (1979, p.516-526) segregated fifty (50) large banks into three categories;
non-planners, partial planners, and comprehensive planners. They found that
the banks that had a comprehensive long-range plan performed significantly
better than those that did not have a comprehensive plan. Sapp and Seiler (1981,
p. 32
- 36) in a study similar to that of Wood and LaForge, compared bank performance
to the level of planning. They grouped banks as non-planners, beginning
planners, intermediate planners, and sophisticated planners. They found that
increased levels of strategic planning were related to increased bank performance.

Another study which supports the positive relationship between strategic
planning and performance is that of Andersen (2000). Andersen studied three
26
(3) separate industry groups; food and household products companies, computer
products firms , and banking with a total of 230 respondents. The basic findings
were that strategic planning had a significant and positive impact on the overall
organizational performance of the firm, regardless of the industry being observed.
Watts (1987, p. 62 - 69), in a study of strategic planning and performance
of small banks found a mixed relationship between the level of planning
conducted by the financial institution and the financial performance of the
institution. In the study Watts analyzed two components; organizational
effectiveness and organizational efficiency as measures of performance, and the
level of correlation with the planning process. The results indicated that the level
of planning practiced and degree of sophistication was significantly and positively
related to organizational effectiveness. But, there was no significant relationship
between the level of planning practiced and degree of sophistication and
organizational efficiency.
Malik and Karger (1975, p. 26 - 31) also conducted a study investigating
the relationship between formal planning and financial performance which
resulted in a somewhat mixed correlation, but mostly positive. They analyzed
thirty-eight (38) firms in three industries and divided each industry group into
formal integrated long-range planners and non-integrated planners. They then
compared their financial performance using thirteen (13) different economic

measures. The formal planners substantially outperformed the informal planners
on nine of the financial measures. The results were mixed for the remaining four
27
economic performance measures.
Hopkins and Hopkins (1997) looked at a fairly wide array of financial
institutions and their strategic planning processes related to the financial
institutions performance. They found that the relationship between the intensity
of the organization�s strategic planning process and its financial performance was
very strong. They found that the level of intensity (sophistication) that firms�
used in their planning process was typically a function of various managerial
factors, specifically – �if managers believe that strategic planning leads to superior
financial performance, they will tend to focus on the strategic planning process
with greater intensity.�
There is a reasonable basis for opposition to the empirical support for a
positive relationship between a firm�s performance level and the degree of
sophistication of the strategic planning process used. As indicated, Watts� (1987)
research revealed a �mixed-bag� with one performance measure showing a
positive relationship and the other performance measure showing no relationship.
There are several studies that indicate that there is no relationship between
strategic planning and firm performance, or that a negative relationship actually
exists.
One such study that bears out the lack of a relationship between the level
of planning formality and the level of organizational performance was conducted
by Robinson and Pearce (1983, p. 197 - 207). This study was essentially a
replication of the prior study mentioned, by Wood and LaForge, which found a
28
positive relationship between the level of planning and the financial performance
in larger banks. Robinson and Pearce replicated the basic study, except they used
a population of smaller banks rather than large banks. The results of the study
revealed that there was no significant difference in performance between the
institutions which carried out a formal planning process and those that had a
non-formal planning process.
In a separate study, Whitehead and Gup (1985, found that in the financial
services industry there was no statistical evidence to confirm that strategic
planning increased the profitability of the financial institution. Additionally,
Shuman, Shaw, and Sussman (1985, p. 48 - 53) found in another performance
related study, that for the high growth firms there existed a negative correlation
between profitability of the business firm and formally prepared business plans
(long-range strategic plans). Similarly, Capon, Farley, and Hulbert (1994, p. 105
- 110) conducted a study dealing with the corporate planning practices of
manufacturing firms in the Fortune 500 Index. They found results similar to
those of many other researchers, that there was no strong correlation between the
planning practices of the manufacturing firms and their financial performance.
Their study was a meta-analysis of 113 firms� planning practices, which divided
the firms into five (5) categories of planners. Theses results were then correlated
with the financial performance of the firms. They concluded that strategic
planning can improve performance, but that it is not a necessary condition for
increasing the level of financial performance.
29
In another study dealing with the impact of planning upon performance of
the organization, Peterson and Silas (1996) surveyed 362 Michigan farm supply
and grain handling firms. Their study concluded that there was a fairly wide
range of planning activities conducted by the firms in the industry, but as with
many of the prior studies mentioned, there was not a high level of correlation
between the level of planning of the firms and the financial performance of the
firms. Peterson and Silas noted that of eighteen (18) major studies published
between 1970 and 1983, eight (8) had found a significant correlation between the
level of planning and the organizational performance, eight (8) had found no
significant relationship between the level of planning and the organizational
performance of the firm, and two (2) had found a mixed relationship between
planning and performance, which was dependant upon the industry being
studied.
In a somewhat different study Ketchen and Palmer (1999) looked at
strategic responses to poor organizational performance. They looked at the
behavioral theory of the firm and compared it with a threat-rigidity perspective.
In their study they found that specifically health care firms that are in trouble, ie.
have experienced poor financial performance in the past, are more likely to take
aggressive strategic action to attack the problem. As a result it is the poor
performers of the recent past that often develop the new innovative solutions to

industry-wide problems.
30
Another study, that conducted by Rogers, Miller, and Judge (1999) found
some unique, but similar results as many of the previously cited studies. Rogers,
Miller, and Judge found that when looking a financial institutions three items
became somewhat evident. First, they stated that, �planning and performance
may not be clearly understood without considering firm strategy.� Second, they
found that �strategy matters�, that is to say that the content of the strategy must
be understood and controlled if possible. Their last conclusion was that different
planning processes were used depending upon what differing strategies the
financial institutions were pursuing.
As can be seen from the various sources cited in this review of literature,
the actual results of implementing strategic planning on a firm�s performance are
very inconclusive. There are studies that indicate a very positive relationship
between the levels of planning and organizational performance. There are those
that have a mixed relationship or partial impact, and those that have no
relationship or impact, or even in extreme cases have a negative relationship.
In the banking sector of the economy in the United States the environment
in which banking institutions operate has changed quite radically since 1980. In
1980 the Depository Institutions Deregulation and Monetary Control Act
(DIDMCA) was passed by the United States Congress which implemented a
massive wave of banking deregulation, thus changing the environment in which

managers of financial institutions must operate. The deregulation brought about
by DIDMCA created a much more competitive and unstable environment, as
31
evidenced by the savings and loan crisis and numerous bank failures in the mid
and late 1980's.
Michael Porter (1987, p. 17 - 22) argued that �strategic planning� has
fallen out of fashion in today�s business community has other concerns such as
corporate culture, qualitiy, and implementation are viewed as the new tickets to
success. He stated that the need for strategic thinking and planning has never
been greater. Virtually no industry is immune from the growing competition
since 1977. The basic questions that good planning seeks to answer - the future
direction of competition, the needs of the consumer, and how to gain a
competitive advantage will never lose their relevance. �The solution is to
improve strategic planning, not to abolish it!�
It is in light of this background that this study was undertaken. Questions
which were examined are: 1.) Is there a correlation between the planning activity
and performance of the institution? 2.) Are there any similar managerial
characteristics of those firms that have a high level of organizational planning
and those that do not? 3.) Are there any similar organizational characteristics of
those firms that do have a formalized strategic planning process and those that
do not?

32
CHAPTER THREE
THE RESEARCH METHODOLOGY
In this chapter the basic research methodology used in the project is presented.
The research methods and design which have been reviewed as a part of the preparation
for this study are now combined into the methodology for the dissertation to be carried
out.
The development of the methodology followed the basic outline discussed by
Hoehn (1991). He described six (6) factors which must be addressed; the target
population, the sampling procedure and the sample, description of the research design,
instrumentation, data collection procedures, and data analysis. This study will follow
the format outlined above.
The environment in which the United States banking system has functioned has
been a rapidly changing one. Due to the relative importance of small banks,
numerically as a percentage of the total number of banks within the overall banking
system, the objective of this study was to look at the small banks and determine if
strategic planning may play a role in determining the long-term success and ultimately
the survival of these institutions.
Based upon the prior statement, the purpose of this study was to expand the

existing knowledge base regarding the planning practices in smaller banks and the
33
impact of strategic planning on the performance of the smaller financial institutions. In
order to accomplish this, it was planned that a more up-to-date and complete description
of the planning - performance relationship would result by examining the strategic
planning practices of a sample of smaller banks and their corresponding performance
results to see if any relationship exits. The data gathered by this study were used to
describe, in a quantifiable manner, the relationships between planning, managerial
characteristics, and financial performance of a sample of smaller banks operating in a
similar environment.
I. TARGET POPULATION
The subjects for this research project were drawn from a population of smaller size
banks located in the Central Atlantic and Eastern Great Lakes states. Specifically, these
institutions were located in Delaware, Maryland, New Jersey, New York, Pennsylvania,
Virginia, West Virginia, and Ohio. The banks were selected on a basis of size,
specifically based upon the asset size of the institutions. The size classification which
was used was banks with an asset size of $1,000,000 or less.
The total population of banks in the United States was 10,320 at the end of 1994,
based upon data supplied by the Federal Reserve Banking System (1995). Taking the
number of banks in the selected target population, as furnished by the Federal Reserve
System, the target population of banks represented 10.28% of the total banks in the
United States, and 45.58% of all the banks within the defined population geographic
area. Due to the wide variation of external factors affecting the target population such
34
as urban versus rural, statewide versus non-statewide banking, etc. when compared to
the entire banking system at large, it was assumed that the target population was
representative of total population of smaller banks within the United States.
Two specific reasons assisting in the decision to utilize the stated target
population as the data base for this research project were: first, the availability of data
for these banks, and second, the potential ability to conduct further comparisons by
future researchers, if desired. This was due to the compatibility of this data base to
existing Federal Reserve Bank peer analysis and private consulting firm�s peer analysis,
such B.E.I. Golombe Associates.
II. SAMPLING PROCEDURE AND THE SAMPLE
The sampling procedure was a simple random sample of the target population.
The random sample of the target population was selected utilizing a random numbers
table. A random sample was used in order to attempt to insure that the sample was
unbiased and had a high degree of probability that it was representative of the target
population as a whole.
Sproull (p. 112, 1988) states that the simple random sample is a probability
sampling method in which each element within the target population has an equal,
known, and non-zero chance of being selected for inclusion in the sample. The
advantages of the simple random sample being bias free and having control over the

variables outweighed the major disadvantage of the simple random sample that a fairly
large number of elements or respondents are necessary in order to achieve
35
representativeness in the sample.
The sample for this research project was a random sample drawn from the target
population of smaller banks in the states of Delaware, Maryland, New Jersey, New York,
Pennsylvania, Virginia, West Virginia, and Ohio. The target population consisted of
1040 banks, based upon the Federal Reserve Bank data as of December 31, 1994. The
sample size used was twenty (20) percent or 208 banks. The desired final useable
minimum sample size was based upon the utilization of Kraemer and Thiemann�s
Master Table for sample size. Kraemer and Thiemann (p 106, 1987) state for a desired
95% confidence interval with a 90% power factor and a critical affect size of 0.40 to 0.30
the necessary sample size would have to be between 49 and 91 responses.
Balian (p. 159, 1994) indicates that the sample size must be adjusted upwards
when doing a mail survey, by 70 - 300% in order to obtain the desired sample size for
final analysis. Thus using the lower sample size range of 49 and adjusting it upward by
300% would result in an initial mailing of 147 surveys. Using the higher sample size of
91 and adjusting it upward by 300% would result in an initial survey mailing of 273.
The twenty (20) percent sample size of 208 is virtually midway between the two sample
size extremes, after adjusting for traditional mail survey response levels.
Each bank was assigned a number based upon the total number of banks in the
target population and a random numbers table was used to select the two hundred eight
(208) institutions for inclusion in the sample.

36
III. RESEARCH DESIGN
This research study was carried out utilizing a non-experimental methodology.
This was decided after considering the effectiveness of both the experimental and the
non-experimental methodologies in relation to the purpose of the study, the population
base to be used, and the current state of strategic planning literature.
Due to the size of the target population and the corresponding sample size used, it
was deemed that the most appropriate form of non-experimental study would be the
survey method. Specifically, the survey technique used was the analytical survey, as the
desire was to explore the relationship or association between particular variables and
determine inferences regarding cause and effect between the variables in the research
topic, as discussed by Oppenheim (p. 12 - 20, 1992).
The design set forth for this research was specifically a mail survey based upon the
random sample of financial institutions from the defined population as previously
described in this chapter. The survey was broken into two main components. First, was
the group of questions related to the descriptors of the financial institution�s
management characteristics. Second, was the group of questions which described the
degree or level of planning carried out by the responding institutions.
The response to the set of questions dealing with the level of planning conducted
by the organization was tabulated using a scaled response value to determine each
individual financial institutions level of planning. This process is described in detail

later in this chapter in the section titled Data Analysis. These results were then analyzed
using a Federal Reserve Bank data base for corresponding banks utilizing the Average
37
Return on Assets, Average Return on Equity, and Net Interest Margin as measures of
financial performance. The analysis was conducted utilizing the Analysis of Variance
technique to determine if there was a significant difference in the three measures of
performance stated above and the level of planning conducted by the institutions.
Where appropriate, if there was a significant difference, the Student-Newman-Kuells test
was carried out to determine which planning groups were significantly different from the
other groups.
The same analysis procedure was used for the six (6) management /
organizational characteristics tabulated from the survey responses. Again, each
characteristic was analyzed based upon the level of planning carried out by the
organization to determine if there may be a relationship between the management /
organizational characteristics and the degree of planning carried out by the institutions.
Specifics of the various elements of the research design are discussed in greater
detail in the following sections of this chapter.
IV. INSTRUMENTATION
The specific type of instrument to be used is highly dependent upon the data
collection method, such as interview - interview schedule, observation - forms for
recording or rating respondents behavior, instrument administration - questionnaire,
checklist, skills test, etc. Sproull (p. 176 - 177, 1988) states �the most important factors

to consider in selecting an appropriate instrument are: 1.) does it measure the variables
appropriately, 2.) is it sufficiently valid and reliable, 3.) does it yield the appropriate
38
level of measurement for each variable, 4.) does it require an appropriate amount of time,
5.) is it easy to acquire subjects and respondents, 6.) is it easy to administer, 7.) is it easily
interpreted, and 8.) is its cost within the overall budget.�
For this research the appropriate instrument was deemed to be the questionnaire.
The survey instrument used for this study is presented in Appendix B. This decision
was based upon the type of information to be collected and the proposed manner of data
collection, as well as the time frame allotted for the study, and the cost considerations of
the research project. The issues of validity (does the instrument measure what it is
supposed to measure?) and reliability (does the instrument measure accurately and
consistently?) are critical to the overall results of any research project.
Both the validity and reliability of the basic survey instrument were previously
measured by Watts (p. 52 - 55, 1987), as this instrument was a variation of that used by
Watts in a similar study in 1987. The Watts instrument was varied only to the extent
that the portion dealing with entrepreneurship was not used. The reliability and validity
were tested by Watts using a multitrait-multimethod matrix approach. The testing used
by Watts was not dependent upon the portion of the instrument dealing with
entrepreneurship. In this analysis there was sufficient evidence of reliability and validity
coefficients being sufficiently large and different from zero that it demonstrated a high
degree of reliability and validity. Watts (p.52, 1987) found that the average correlation
of the validity coefficients was 0.75, which was sufficiently large and significantly
different from zero (alpha = 0.05).
In addition, to further insure that the survey instrument was designed to collect
39
the necessary data for the research questions, a draft of the survey instrument was given
to two professors at Kent State University to review. The two professors were in the
business and statistics departments and were asked to provide feedback regarding any
potential ambiguities and wording which might lead to unwarranted answers. Their
feedback resulted in the rewording of questions number 5, 12c, 12p, and 13 (base
information), and the addition of question 14c.
To further clarify the survey instrument, it was pre-tested by three randomly
selected respondents who were asked to comment on the clarity of the questions to
which they were responding. As a result of the pre-test responses and comments,
minor wording changes were made to questions number 5 and 12 (the introduction).
V. DATA COLLECTION PROCEDURES
There were three primary data collection methods potentially available for this
type of survey; the personal interview, the telephone interview, and the mail survey.
The data was collected for this project utilizing a mail survey questionnaire. The
questionnaire was developed to collect data relating to the degree of strategic planning
and managerial characteristics so that these factors may be compared to financial
performance for the sample respondents. The mail survey questionnaire is presented in
Appendix B. It was anticipated that the information gathered by the questionnaire
would utilize a rating scale for most of the data relative to the degree of strategic

planning employed by the institution and a form of coding system for factual data
related to managerial characteristics, so that it allowed for the potential to cross tabulate
40
and classify some of the information.
The personal interview format and the telephone interview format were deemed
to be inappropriate for this research study due the disadvantages of time and monetary
constraints. Due to the relatively wide geographic dispersion of the sample population,
the personal interview or telephone interview formats would have increased the time
needed to complete the survey and cost to complete the survey significantly beyond the
budget constraints of the project.
VI. DATA ANALYSIS
When conducting a basic analytical survey with some descriptive information,
there are numerous analytical techniques available to the researcher, as previously
discussed in the Review of Literature. Due to the type and the form of data collected,
the statistical procedure One-Way Analysis of Variance was used. The one-way analysis
of variance is a procedure used to test whether or not the means of two or more groups
or populations are the same. By utilizing this statistical test the researcher may
determine if the means of the various groups being tested were significantly different
from one another.
In addition the �Probability of F� or �p-value� was also calculated. This
procedure reinforces the one-way analysis of variance test and indicates to the
researcher the smallest significance level at which the null hypothesis may be rejected.
The data was then analyzed using the Student-Newman-Kuells Procedure for
those hypotheses which were rejected (i.e. not the same), to see which groups were
41
statistically different from any others within the test. This pairwise comparison further
validates the one-way analysis of variance by comparing the largest difference between
two means and determining if it is significantly different. If there is no significance, the
comparison goes to the next set. Only a small number of means are compared for
significance, rather than statistically testing every difference.
By utilizing these three procedures it was possible to determine the statistical
difference for the means of the four planning groups, based upon each of the variables
considered, how close to acceptance or rejection was the hypothesis, based upon the
probability, and which groups were different from the others for each of the variables
using the Student-Newman-Kuells procedure.
The analysis of variance is one of three widely available methods of data analysis
that has been used by researchers studying similar problems, as summarized by Boyd (p.
358 - 361, 1991). Boyd summarizes approximately twenty years of research as to the
effect of strategic planning on a firm�s performance. Boyd cites twenty-one (21) studies
as to their analysis methodology, sample population, controls, and classification of
planning and performance measures, along with their findings. In the twenty-one (21)
studies cited and summarized there were two analysis techniques that were most widely
used by the researchers; �analysis of variance� and �t-test�. These two analytical
techniques were used in sixteen of the twenty-one studies, the t-test was used eight (8)
times and the analysis of variance was used eight (8) times.

For this study the intent was to take the three dependent variables - the measures
of financial performance - Return on Assets, Return on Equity, and Net Interest Margin
42
and see if there was any statistical significance when compared to the level or degree of
strategic planning conducted by the corresponding firms. And then to conduct an
analysis regarding the specific management characteristics and the degree of strategic
planning undertaken by the firms.
An example of how the data was tabulated and analyzed is as follows. Assuming
approximately a twenty (20)percent response rate to the mail questionnaire there would
be forty-two (42) responses to analyze [1040 x 20% x 20%]. Utilizing the data bank of
information from the Federal Reserve Bank on institutions relative to their Return on
Assets, Return on Equity, and Net Interest Margin, an analysis of variance was calculated
on these dependent variables based upon various independent factors. The analysis took
the following approach: banking institutions were classified or grouped into four (4)
categories of utilization of strategic planning in their planning process - highly active
strategic planners, moderately active strategic planners, adequate strategic planners, and
low-level strategic planners.
The institutions were classified into the four planning categories based upon the
scaled tabulation of the questions in the survey instrument related to the level of
planning activity carried out by the institution. The responses were scaled as follows for
the questions 12, 13, and 14 of the survey instrument:
Extensive = 5 Moderate = 4 Adequate = 3 Limited = 2

Superficial = 1
The planning scores were then tabulated for each institution and the results were
43
ranked from high to low and were divided into four (4) quartiles. The upper quartile
(those institutions with the highest planning scores) was designated as �Highly Active
Strategic Planners.� The second quartile (those institutions with the second highest
planning scores) was designated as �Moderately Active Strategic Planners.� The third
quartile (those institutions with the second lowest planning scores) was designated as
�Adequate Strategic Planners.� The final quartile (those institutions with the lowest
planning scores) was designated as �Low-Level Strategic Planners.� The complete
ranking of the institutions, based upon the planning scores is presented in Appendix C
of this text.
Once the four groups were established, the Return on Assets, Return on Equity,
and Net Interest Margin was entered for each of the banks in the each of the four
groupings. A separate calculation was run for each of the three dependent variables
mentioned, utilizing the four classifications of strategic planning employed. The
�analysis of variance� was then calculated.
Next the F value was calculated and compared to the critical value of F from and
F Table at the 0.05 level (95% confidence level), given the degrees of freedom. If the
calculated value of F is equal to or exceeds the critical value of F at the desired
confidence level, then the hypothesis being tested may be rejected and conclusions my
then be drawn about the research hypothesis either for support or non-support. If the
calculated value of F is less than the critical value of F at the desired confidence level,
then the hypothesis being tested cannot be rejected.
The next step in the analysis was to determine the �Probability F” value or �p�
44
value. Again, using the 0.05 level of acceptance / rejection cut-off point, if the
probability �F� was greater than 0.05 then the hypothesis was not rejected. And if the
probability �F� value was less than 0.05 it meant that the data fell outside the 95% area
under the curve for the �F� values and was in the 5% area to the right, in the right-tail of
the �F� distribution.
The same basic analysis format was also used for testing the relationship between
the managerial characteristics and the level of planning used by the financial
institutions, as well as the relationship between the size of the financial institutions and
the level of planning used. The only deviation was that the variable for managerial
characteristics being analyzed or the size of the financial institution was broken into
quartiles to analyze relative to the degree of planning rather than the degree of planning
being broken into quartiles as with the measures of financial performance. All of the
statistical tabulations were processed utilizing the computer software package for
statistical analysis - SPSS release 4.1.
VII. CONFIDENTIALITY
All data was tabulated in a manner that would maintain the confidentiality of any
individual responding institution. Each financial institution was assigned a number for
identification purposes. All data was then tabulated based upon the numeric
identification rather than a characteristic which may have had the potential for
identifying the institution. The one possible identifying characteristic that may have had

the possibility of revealing the identity of a specific financial institution was Total Assets.
45
For the characteristics tabulated related to Total Assets, only the bank identifying
number was published in the corresponding Appendix tables.

46 CHAPTER FOUR
THE RESEARCH FINDINGS
THE SURVEY RESPONSE
The research process was based upon a data base of 1040 commercial banks in an
eight state area of the North-Central and Mid-Atlantic region of the United States.
Specifically the states of Delaware, Maryland, New Jersey, New York, Pennsylvania,
Virginia, West Virginia, and Ohio. The data base included all commercial banks in the
eight state area as previously defined, with Total Assets of less than $1 billion. This
data was obtained from the Federal Reserve Bank of Cleveland, Statistical Analysis
Division (statistical information as of December 31, 1994 for United States Commercial
Banks). A random sample of twenty (20) percent of the total data base was selected
using a computer generated random numbers table (Lotus 1,2,3 version 5.0). Each
bank was assigned a number from 1 to 1040 and the selection of the banks for the study
was then based upon the random numbers generated. This allowed each individual
institution to have an equal chance of being selected for the survey sample.
Upon the final printing of the survey questionnaire and the cover letter, the first
mailing was sent out during the month of May 1996. A total of 208 survey
questionnaires were sent out in the first mailing to the potential respondents. The first
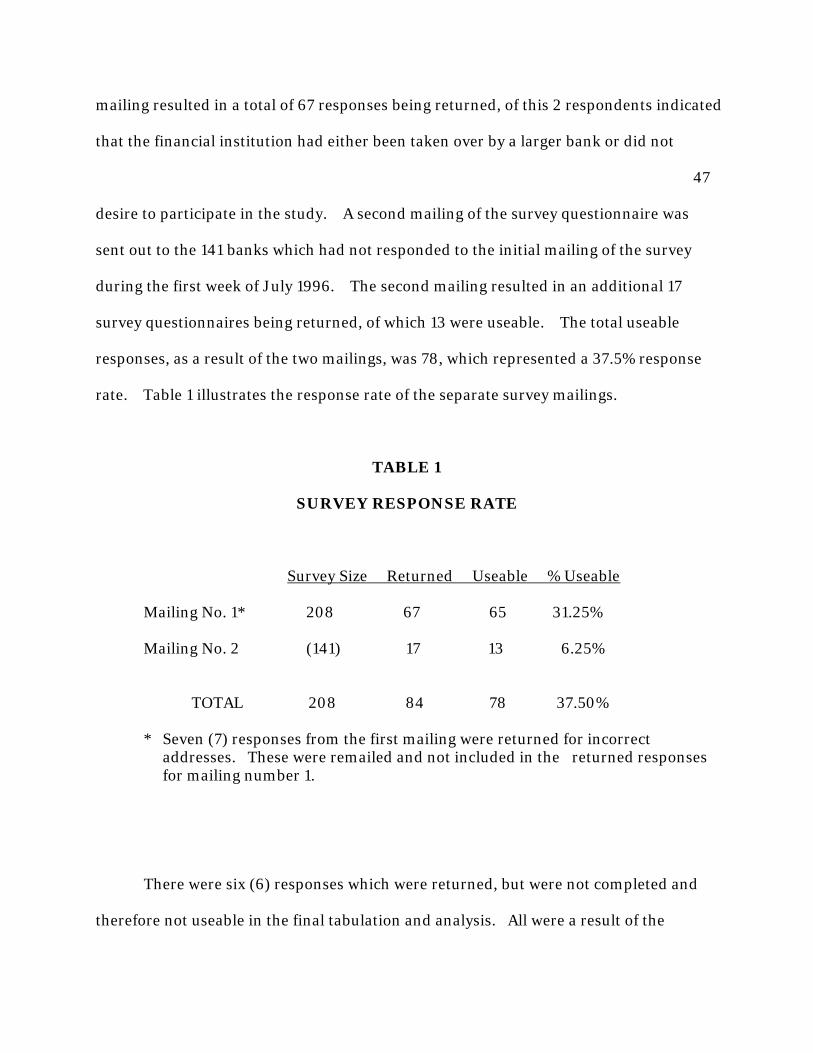
mailing resulted in a total of 67 responses being returned, of this 2 respondents indicated
that the financial institution had either been taken over by a larger bank or did not
47
desire to participate in the study. A second mailing of the survey questionnaire was
sent out to the 141 banks which had not responded to the initial mailing of the survey
during the first week of July 1996. The second mailing resulted in an additional 17
survey questionnaires being returned, of which 13 were useable. The total useable
responses, as a result of the two mailings, was 78, which represented a 37.5% response
rate. Table 1 illustrates the response rate of the separate survey mailings.
TABLE 1
SURVEY RESPONSE RATE
Survey Size Returned Useable % Useable
Mailing No. 1* 208 67 65 31.25%
Mailing No. 2 (141) 17 13 6.25%
TOTAL 208 84 78 37.50%
* Seven (7) responses from the first mailing were returned for incorrect addresses. These were remailed and not included in the �returned responses� for mailing number 1.
There were six (6) responses which were returned, but were not completed and
therefore not useable in the final tabulation and analysis. All were a result of the

respondents noting that they did not have the either adequate time or manpower to
48
complete the questionnaire or that they had been acquired by a larger institution and no
longer participated in many of the managerial characteristics at their local level
anymore. Of the 78 useable responses which were returned a total of 17 required
follow-up to clarify one or two specific data responses. The follow-up was done via
telephone contact. All of these calls were to clarify either the ages, education , or
number of directors or individuals involved in the planning process at the institution in
question.
The general make-up of the institutions responding to the survey is described in
Table 2. The average asset size of all the institutions in the random survey population
was $174,087,000 Total Assets. The average Return on Assets was 0.87% , the average
Return on Equity was 10.62%, and the average Net Interest Margin was 4.70% for the
survey population respectively. This compares to the actual results of those
institutions responding to the survey questionnaire as follows: average Total Asset size
was $160,996,000 average Return on Assets was 0.92%, the average Return on Equity
was 0.98%, and the average Net Interest Margin was 4.71%.
The general make-up of the group responsible for the planning process was quite
diverse, as indicated by the responses to the general information questions in the
survey. The average number of persons involved in the planning process for the
responding institutions was 7.3, with a range from 1 on the low end of the spectrum to
32 at the high end of the spectrum. The average age of the individuals involved in the
planning process, as identified above, was 49.9 years, with a range of 36.5 to 64.0. The

average educational level of the group responsible for the planning process at the
responding
49
TABLE 2
PROFILE OF RESPONDING INSTITUTIONS
_____________________________________________________
Potential Random Actual Sample Respondents Respondents
Average Total Assets $174,087,000 $160,997,000
Average Return on Assets 0.87% 0.92%
Average Return on Equity 10.62% 9.98%
Average Net Interest Margin 4.70% 4.71%
____________________________________________________________
banks was 15.0 years ( indicating 3 years of college education on the average). The
range of average education levels was from 12.0 years (completed high school) to 18
years (master�s degree). There was also a wide range in the number of years that the
responding institutions had been actively engaged in a formal planning process, ranging
from a low of 1 year to a high of 24 years with an average of 6.9 years of engaging in an
active planning process. The average number of bank directors for the responding
banks was 9.7 with a range of 4 at the low end to 19 at the high end. The average age of
the directors ranged from a high of 63.7 years to a low of 49.1 years, with an average age
of 58.9 years. A descriptive summary of the responding institutions is contained in

Table 3.
50
TABLE 3
DESCRIPTIVE SUMMARY OF RESPONDING INSTITUTIONS
_________________________________________________________
CHARACTERISTIC HIGH LOW AVE.
Number of persons involved in the planning process. 32 1 7.3
Average age of persons involved in the planning process. 64.0 36.5 49.9
Average education (years) of the persons involved in the planning process. 18.0 12.0 15.0
Number of years a formal planning process has been practiced. 24 1 6.9
Number of bank directors. 19 4 9.7
Average age of bank directors. 67.3 49.1 58.9
____________________________________________________________
General information related to the general planning process used for the
responding banks is as follows. A total of 37 respondents (47.7%) indicated that some
or all of their directors were active participants in the actual planning process. All 78
respondents indicated that the board of directors had the final approval authority for the

plan to be implemented. Of the 78 responding financial institutions, 26 (or 33.3%)
indicated that they used an outside facilitator to assist or coordinate the actual
51
planning process. In addition, 34 respondents (43.6%) indicated that they conducted the planning process at an off-site location. Table 4 presents the findings related to the general planning process used by the responding banks. TABLE 4 SUMMARY OF GENERAL PLANNING PROCESS
Frequency Percent
Are directors actively involved in the planning process?
YES 37 47.4% NO 41 52.6%
Does the board of directors have
final approval authority of the plan to be implemented?
YES 78 100.0% NO -0- -0-
Is an outside facilitator used to lead or coordinate the planning process?
YES 26 33.3% NO 52 66.7%
Is an off-site location used for developing the strategic plan?
YES 34 43.6% NO 44 56.4%

____________________________________________________________
52
HYPOTHESIS TESTING
Three (3) hypotheses were tested based upon the specific industry financial
performance measurements related to the level of planning conducted by the
institutions. The specific industry performance measurements used for this research
study were: 1.) the five year Average Return on Assets, 2.) the five year Average Return
on Equity, and 3.) the five year Average Net Interest Margin. Each of the three variables
was tested using the One-Way Analysis of Variance technique, Probability �F�, and
Student-Newman-Keulls procedure described previously in the Methodology portion, to
determine if there was or was not any statistical difference between the four (4) planning
groups for each variable.
HYPOTHESIS H1a - there is no statistical difference between the Average
Return on Assets for the four (4) planning groups, based upon the degree of planning
sophistication used by the financial institutions.
Table 5 illustrates the Analysis of Variance (ANOVA) and Student-Newman-Keulls
(SNK) performed to determine the relationship of financial performance, as measured by
the Average Return on Assets to the level of planning conducted by the responding
institutions. As can be seen from the ANOVA table, (Table 5), the calculated F value was
less than the critical value of F at the 0.05 level. Using the critical value of F from an F
Distribution Table at the 0.05 level, between 2.76 and 2.79 (the F distribution table uses
degrees of freedom in the denominator at the 60 level and the 100 level, for this
situation degrees of freedom were 77), and comparing this with the calculated test of F

of 1.587, it was determined that the test F was less than the critical value of F.
53
Therefore, Hypothesis H1a was accepted, that all four (4) planning groups were
statistically the same when correlated to the variable - Average Return on Assets.
The probability �F� indicated a value of 0.20, which was less than the test level
(0.05), therefore it also indicated that the hypothesis should be accepted. The SNK
value was determined to be 0.49, which was smaller than the test level ranges for SNK,
therefore, it was determined that at the 0.05 level no two groups were statistically
different.
HYPOTHESIS H1b - There is no statistical difference between the Average
Return on Equity for the four (4) planning groups, based upon the degree of planning
sophistication used by the financial institutions.
Table 6 illustrates the Analysis of Variance (ANOVA) and the Student-Newman-
Keulls (SNK) performed to determine the relationship of the financial performance, as
measured by the Average Return on Equity to the level of planning conducted by the
responding institutions. As illustrated in the ANOVA and SNK table, (Table 6), the
calculated value of F was less than the critical value of F at the 0.05 level. Using the
critical value of F as taken from an F Distribution Table at the 0.05 level, between 2.76
and 2.79, and comparing it with the calculated test F of 1.11, it was determined that the
test F was less than the critical value of F. Therefore, Hypothesis H1b was accepted,
that all four (4) planning groups were statistically the same when correlated to the
variable - Average Return on Equity.
The probability �F� indicated a value of 0.35, which was less than the test level
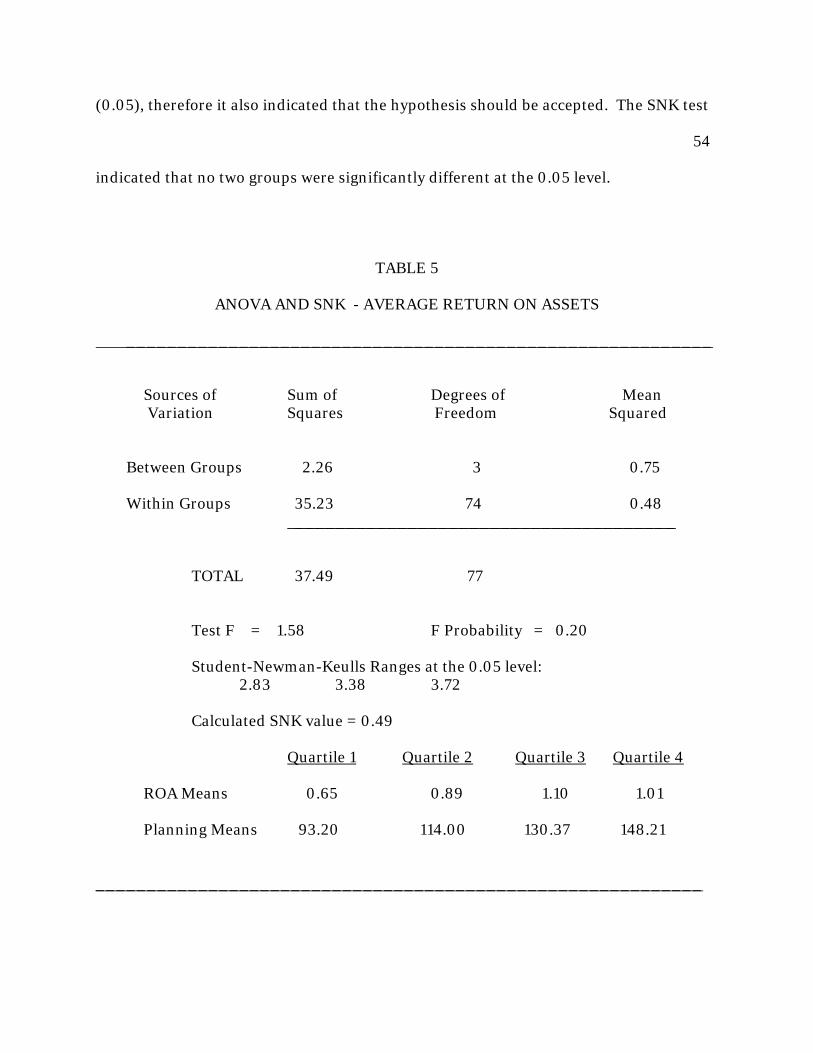
(0.05), therefore it also indicated that the hypothesis should be accepted. The SNK test
54
indicated that no two groups were significantly different at the 0.05 level.
TABLE 5 ANOVA AND SNK - AVERAGE RETURN ON ASSETS _________________________________________________________
Sources of Sum of Degrees of Mean Variation Squares Freedom Squared
Between Groups 2.26 3 0.75 Within Groups 35.23 74 0.48
_____________________________________
TOTAL 37.49 77
Test F = 1.58 F Probability = 0.20
Student-Newman-Keulls Ranges at the 0.05 level: 2.83 3.38 3.72
Calculated SNK value = 0.49
Quartile 1 Quartile 2 Quartile 3 Quartile 4
ROA Means 0.65 0.89 1.10 1.01
Planning Means 93.20 114.00 130.37 148.21
___________________________________________________________

55
TABLE 6
ANOVA AND SNK - RETURN ON EQUITY
______________________________________________________ Sources of Sum of Degrees of Mean Variation Squares Freedom Squared
________________________________________________________
Between Groups 230.96 3 76.99
Within Groups 5126.03 74 69.27 ____________________________________
TOTAL 5356.99 77
Test F = 1.11 F Probability = 0.35
Student-Newman-Keulls Ranges at the 0.05 level:
2.83 3.38 3.72
Quartile 1 Quartile 2 Quartile 3 Quartile 4
ROE Means 7.64 8.95 11.91 11.25
Planning Means 93.20 114.00 130.37 148.21 __________________________________________________________
HYPOTHESIS H1c - there is no statistical difference between the Average Net
Interest Margin for the four (4) planning groups, based upon the degree of planning
sophistication used by the financial institutions.
Table 7 illustrates the Analysis of Variance (ANOVA) and the Student-Newman-
Keulls (SNK) performed to determine the relationship of the financial performance, as
56
measured by the Average Net Interest Margin to the level of planning conducted by the
responding institutions. As shown in Table 7, the ANOVA and SNK table (Table 7), the
calculated F value was less than the critical value of F at the 0.05 level. Using the
critical value of F, between 2.76 and 2.79, from an F Distribution Table, and comparing
it with the calculate test F of 1.46, it was determined that the test F was less than the
critical value of F. Therefore, Hypothesis H1c was accepted, that all four (4) planning
groups were statistically the same when correlated to the variable - Average Net Interest
Margin.
The probability �F� indicated a value of 0.23, which was less than the test level
(0.05), and therefore it also indicated that the hypothesis should be accepted. The SNK
test indicated that no two groups were statistically different at the 0.05 level.
HYPOTHESIS H2a - there is no statistical difference between the degree of
planning sophistication, based upon the number of persons involved in the planning
process.
Table 8 illustrates the Analysis of Variance (ANOVA) and the Student-Newman-
Keulls (SNK) performed to determine the relationship of the managerial/organizational
characteristics, as measured by the Number of Persons Involved in the Planning Process
to the level of planning conducted by the responding institutions. As can be seen from
the ANOVA and SNK table, (Table 8), the calculated F value was greater than the critical
value of F at the 0.05 level. Using the critical value of F from an F Distribution Table at
the 0.05 level, between 2.76 and 2.79, and comparing it with the calculated test F of
0.15, it was determined that the test F was less than the critical value of F. Therefore,

57
Hypothesis H2a, that there was no statistical difference between the four (4) planning
groups when correlated to the variable - Number of Persons Involved in the Planning
Process could not be rejected.
The probability �F� indicated a value of 0.93, which was greater than the test
level (0.05), and therefore it also indicated that the hypothesis could not be rejected.
The SNK test indicated that no two groups were statistically different at the 0.05
confidence level.
TABLE 7 ANOVA AND SNK - AVERAGE NET INTEREST MARGIN ____________________________________________________________
Sources of Sum of Degrees of Mean Variation Squares Freedom Squared
___________________________________________________________
Between Groups 1.14 3 0.38
Within Groups 19.26 74 0.26 __________________________________
TOTAL 20.40 77
Test F = 1.46 F Probability = 0.23
Student-Newman-Keulls Ranges at the 0.05 level: 2.83 3.38 3.72
Quartile 1 Quartile 2 Quartile 3 Quartile 4
NIM Means 4.53 4.73 4.87 4.70

Planning Means 93.20 114.00 130.37 148.21
___________________________________________________________
58
TABLE 8
ANOVA AND SNK - NUMBER OF PERSONS INVOLVED IN THE PLANNING PROCESS
Sources of Sum of Degrees of Mean Variation Squares Freedom Squared
_____________________________________________________________
Between Groups 237.93 3 79.31
Within Groups 38449.06 74 519.58 _________________________________
TOTAL 38686.99 77
Test F = 0.15 F Probability = 0.93
Student-Newman-Keulls Ranges at the 0.05 level: 2.83 3.38 3.72
Quartile 1 Quartile 2 Quartile 3 Quartile 4
No. of Planners Means 2.45 4.59 7.12 15.53
Planning Means 117.50 117.14 125.29 125.26
_____________________________________________________________
HYPOTHESIS H2b - there is no statistical difference between the degree of
planning sophistication, based upon the average of the individuals involved in the
planning process, for the four (4) quartiles of average age of the planners.
Table 9 illustrates the Analysis of Variance (ANOVA) and the Student-Newman-
Keulls (SNK) performed to determine the relationship of managerial / organizational
characteristics, as measured by the Average Age of the Planners to the level of planning
59
conducted by the responding financial institutions. As can be seen from the ANOVA
table, (Table 9), the calculated F value was greater than the critical value of F at the 0.05
level. Using the critical value of F from an F Distribution Table at the 0.05 confidence
level, between 2.76 and 2.79, and comparing it with the calculated test F of 0.43, it was
determined that the test F was less than the critical value of F. Therefore, Hypothesis
H2b, that all four (4) quartiles of planners ages were statistically the same when
correlated to the degree of planning sophistication involved, could not be rejected.
The probability �F� indicated a value of 0.73, which was greater than the test level
F at the 0.05 confidence interval, therefore, it also indicated that the hypothesis should
not be rejected. The SNK indicated that no two groups were significantly different at
the 0.05 confidence level.
HYPOTHESIS H2c - there is no statistical difference between the degree of
planning sophistication, based upon the average education level of the individuals
involved in the planning process for the four (4) education level quartiles.
Table 10 illustrates the Analysis of Variance (ANOVA) and Student-Newman-
Keulls (SNK) performed to determine the relationship of managerial / organizational
characteristics, as measured by the Average Educational Level of the Planners involved in
the planning process to the level of planning conducted by the responding financial
institutions. As can be seen from the ANOVA table, (Table 10), the calculated F value
was less than the critical value of F at the 0.05 level. Using the critical value of F from
an F Distribution Table at the 0.05 confidence level, between 2.76 and 2.79, and

comparing it with the calculated test F of 1.52, it was determined that the test F was less
60
than the critical value of F. Therefore, Hypothesis H2c, that there was no statistical
difference among the four (4) groups, based upon the educational level of the planners
involved in the planning process, when correlated with the degree of planning
sophistication used by the responding financial institutions.
TABLE 9
ANOVA AND SNK - AVERAGE AGE OF PLANNERS
___________________________________________________________
Sources of Sum of Degrees of Mean Variation Squares Freedom Squared
____________________________________________________________
Between Groups 662.03 3 220.68 Within Groups 38024.96 74 513.85
__________________________________
TOTAL 38686.99 77
Test F = 0.43 F Probability = 0.73
Student-Newman-Keulls Ranges at the 0.05 level 2.83 3.38 3.72
Quartile 1 Quartile 2 Quartile 3 Quartile 4

Age of Planners Means 42.38 47.67 51.70 57.17
Planning Means 126.11 122.00 117.65 118.70 __________________________________________________________
61
The probability �F� indicated a value of 0.22, which was greater than the test
level F at the 0.05 confidence level, therefore it also indicated that the hypothesis
should be accepted. The SNK test also indicated that at the 0.05 confidence level no two
groups of planners based upon the average educational level were significantly different.
TABLE 10
ANOVA AND SNK - AVERAGE EDUCATION LEVEL OF THE PLANNERS
____________________________________________________________
Sources of Sum of Degrees of Mean Variation Squares Freedom Squared
____________________________________________________________
Between Groups 2246.48 3 748.83
Within Groups 36440.51 74 492.44 ____________________________________
TOTAL 38686.99 77
Test F = 1.52 F Probability = 0.22
Student-Newman-Keulls Ranges at the 0.05 level 2.83 3.38 3.72
Quartile 1 Quartile 2 Quartile 3 Quartile 4
Education Level Means 13.17 14.38 15.40 16.58
Planning Means 112.18 119.40 126.71 124.05
____________________________________________________________
62
HYPOTHESIS H2d - there is no statistical difference between the degree of
planning sophistication of the responding financial institutions, based upon the average
number of directors of the institutions, for the four (4) quartiles utilizing the number of
directors for the institutions.
Table 11 illustrates the Analysis of Variance (ANOVA) and Student-Newman-
Keulls (SNK) performed to determine the relationship of managerial / organizational
characteristics, as measured by the Average Number of Directors of the Financial
Institutions to the level of planning conducted by the responding institutions. As can be
seem from the ANOVA table, (Table 11), the calculated F value was less than the critical
value of F from an F Distribution Table at the 0.05 confidence level, between 2.76 and
2.79, and comparing it with the calculated test F of 0.15, it was determined that the test
F value was less than the critical value of F. Therefore, there was insufficient evidence
to reject Hpyothesis H2d, that there was no statistical difference in the four (4)
quartiles, based upon the Average Number of Directors of the Financial Institution,
when compared to the degree of planning used by the groups.
The probability �F� indicated a value of 0.93 which was greater than the test level
F at the 0.05 level, therefore it also indicated that the hypothesis that there was no
statistical difference in the four (4) quartiles, based upon the Average Number of
Directors of the Financial Institution, when compared to the level of planning used by

the groups should be accepted. The SNK test also indicated that no two groups were
significantly different at the 0.05 confidence level.
63
TABLE 11
ANOVA AND SNK - AVERAGE NO. OF DIRECTORS OF THE INSTITUTION
_________________________________________________________
Sources of Sum of Degrees of Mean Variation Squares Freedom Squared
Between Groups 237.93 3 79.31
Within Groups 38449.06 74 519.58 ________________________________________
TOTAL 38686.99 77
Test F = 0.15 F Probability = 0.93
Student-Newman-Keulls Ranges at the 0.05 level 2.83 3.38 3.72
Quartile I Quartile II Quartile III Quartile IV
No. of Director Means 6.35 8.70 10.50 13.33
Planning Means 123.35 119.44 120.57 120.71
__________________________________________________________

HYPOTHESIS H2E - there is no statistical difference between the degree of
planning sophistication, based upon the age of the directors of the financial institution,
for the four (4) quartiles segmenting the average age of the institutions� directors.
Table 12, illustrates the Analysis of Variance (ANOVA) and Student-Newman-
64
Keulls (SNF) performed to determine the relationship of managerial / organizational
characteristics, as measured by the Average Age of the Directors of the Financial
Institutions to the level of planning conducted by the responding institutions. As
shown in the ANOVA table, (Table 12), the calculated F value was less than the critical
value of F at the 0.05 confidence level. Using the critical value of F from an F
Distribution Table at the 0.05 level, between 2.76 and 2.79, and comparing it with the
calculated test F of 1.16, it was determined that the test F was less than the critical value
of F. Therefore, Hypothesis H2e, that there was no statistical difference between the
four (4) quartiles of directors, based upon the Average Age of the Directors of the
financial institutions when compared to the level of planning used by the groups.
The probability �F� indicated a value of 0.33, which was greater than the test
level (0.05), therefore it also supported the ANOVA that the hypothesis, that there was
no statistical difference between the four (4) quartiles of directors, based upon the
Average Number of Directors of the institutions compared to the level of planning used
by the groups, should be accepted. Likewise the SNK test indicated that there were no
two groups which were statistically different at the 0.05 confidence level.
HYPOTHESIS H2f - there is no statistical difference between the degree of
planning sophistication, based upon the number of years that the financial institutions
have been involved in a formal planning process for the four (4) quartiles segmenting

the number of years the institutions have been involved with a formal planning process.
65
TABLE 12
ANOVA AND SNK - AVERAGE AGE OF DIRECTORS
__________________________________________________________
Sources of Sum of Degrees of Mean Variation Squares Freedom Squared
____________________________________________________________
Between Groups 1733.68 3 577.89
Within Groups 36953.99 74 499.37 __________________________________
TOTAL 38686.99 77
Test F = 1.16 F Probability = 0.33
Student-Newman-Keulls Ranges for the 0.05 level 2.82 3.38 3.72
Quartile I Quartile II Quartile III Quartile IV
Age of Directors Means 53.37 57.65 60.33 63.87
Planning Means 113.42 121.84 121.80 126.55
____________________________________________________________
Table 13 illustrates the Analysis of Variance (ANOVA) and Student-Newman-

Keulls (SNK) performed to determine the relationship of managerial / organizational
characteristics, as measured by the Average Number of Years of Planning to the level of
planning sophistication conducted by the responding financial institutions. As can be
seen from the ANOVA table (Table 13), the calculated F value was less than the critical
66
value of F from an F Distribution Table at the 0.05 confidence level, between 2.76 and
2.79, and comparing it with the calculated test F of 0.62, it was determined that the test
F was less than the critical value of F. Therefore, Hypothesis H2f was accepted, that all
four (4) groups as segmented by the number of years involved in a formal planning
process for the institutions were statistically the same when compared with the level of
planning sophistication used by the financial institutions.
TABLE 13
ANOVA AND SNK - AVERAGE NUMBER OF YEARS PLANNING
____________________________________________________________
Sources of Sum of Degrees of Mean Variation Squares Freedom Squared
____________________________________________________________
Between Groups 942.31 3 314.10 Within Groups 37744.67 74 510.06
__________________________________
TOTAL 38686.98 77
Test F = 0.62 F Probability = 0.61
Student-Newman-Keulls Ranges at the 0.05 level 2.83 3.38 3.72
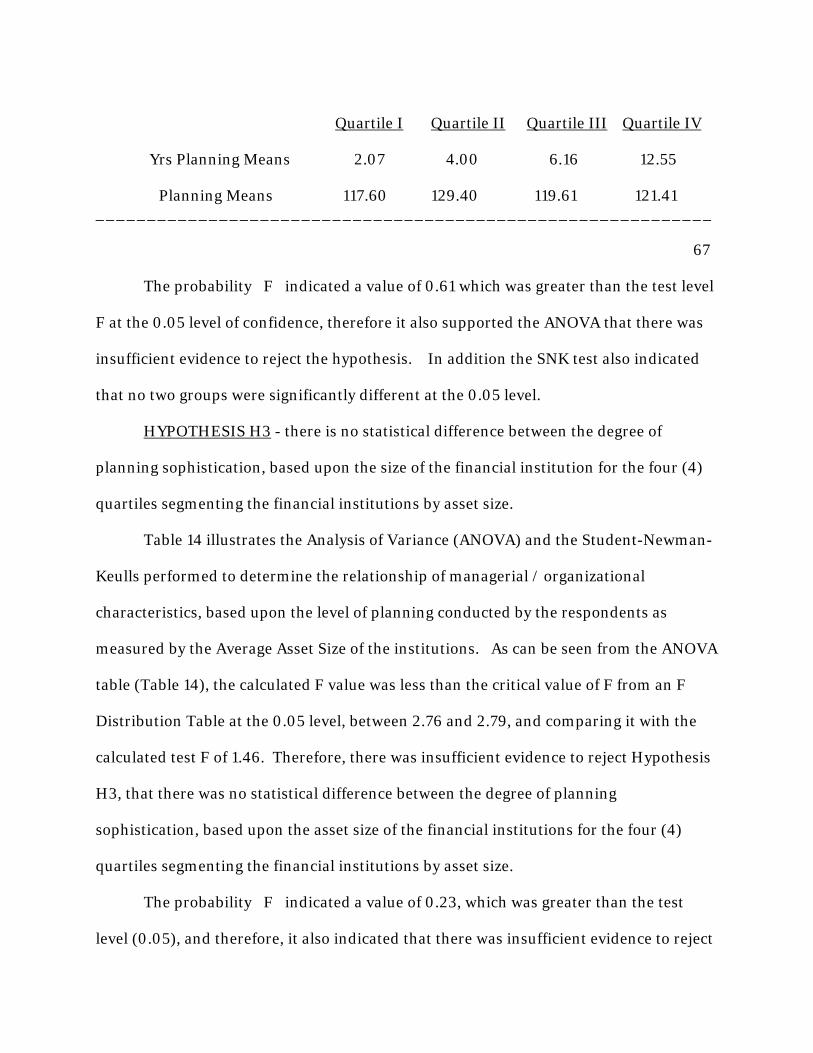
Quartile I Quartile II Quartile III Quartile IV
Yrs Planning Means 2.07 4.00 6.16 12.55
Planning Means 117.60 129.40 119.61 121.41 ____________________________________________________________
67
The probability �F� indicated a value of 0.61 which was greater than the test level
F at the 0.05 level of confidence, therefore it also supported the ANOVA that there was
insufficient evidence to reject the hypothesis. In addition the SNK test also indicated
that no two groups were significantly different at the 0.05 level.
HYPOTHESIS H3 - there is no statistical difference between the degree of
planning sophistication, based upon the size of the financial institution for the four (4)
quartiles segmenting the financial institutions by asset size.
Table 14 illustrates the Analysis of Variance (ANOVA) and the Student-Newman-
Keulls performed to determine the relationship of managerial / organizational
characteristics, based upon the level of planning conducted by the respondents as
measured by the Average Asset Size of the institutions. As can be seen from the ANOVA
table (Table 14), the calculated F value was less than the critical value of F from an F
Distribution Table at the 0.05 level, between 2.76 and 2.79, and comparing it with the
calculated test F of 1.46. Therefore, there was insufficient evidence to reject Hypothesis
H3, that there was no statistical difference between the degree of planning
sophistication, based upon the asset size of the financial institutions for the four (4)
quartiles segmenting the financial institutions by asset size.
The probability �F� indicated a value of 0.23, which was greater than the test
level (0.05), and therefore, it also indicated that there was insufficient evidence to reject

the hypothesis. The SNK test reinforced this finding showing that there was no two
groups with any significant difference at the 0.05 level.
68
TABLE 14
ANOVA AND SNK - AVERAGE ASSET SIZE
_______________________________________________________
_
Sources of Sum of Degrees of Mean Variation Squares Freedom Squared
_______________________________________________________ Between Groups 2163.64 3 721.22 Within Groups 36523.34 74 493.56
__________________________________
TOTAL 38686.98 77
Test F = 1.16 F Probability = 0.23
Student-Newman-Keulls Ranges at the 0.05 level 2.83 3.38 3.72
Quartile I Quartile I Quartile III Quartile IV
Asset Means 43,388 75,016 126,463 388,940
Planning Means 113.00 124.90 119.35 126.50
________________________________________________________
69
CHAPTER FIVE
SUMMARY, CONCLUSIONS, AND RECOMMENDATIONS
SUMMARY
As stated in the Introduction, the major purpose of this research was to
expand the existing knowledge base regarding the effects of strategic planning in
small and mid-sized banks and the impact upon performance of these
institutions. In addition several managerial/organizational characteristics were
evaluated as related to the overall planning practices used by the institutions in
this study. In preparation for this study a review of literature was conducted
which covered the fields of strategic planning and strategic planning related to
organizational performance. Literature covering the overall time frame of 1960
to the present was reviewed. Literature was obtained from numerous sources via
a library topical search, but current periodicals and journals in the field of
planning and strategic management were relied upon most heavily for the basis
of determining what had been done previously relative to the topic area.

The data collected was analyzed using the One-Way Analysis of Variance
technique along with the Probability "F" test, and the Student-Newman-Keulls
procedure. The variables, either the performance measurements or the
managerial/organizational characteristics were evaluated based upon the level of
70
planning used by the responding institutions.
Data was collected for the study utilizing a mail questionnaire and a data
base on financial performance of banks supplied by the Federal Reserve Bank of
Cleveland. Questionnaires were mailed to 208 banks with an asset size of less
than $1 billion in an eight state area of the Central Atlantic and Eastern Great
Lakes region. Useable data responses were received from 78 institutions. A five
year average of the Return on Assets, Return on Equity, and Net Interest Margin
was used for the analysis of financial performance based upon the level of strategic
planning conducted by the subject institutions. The average Age, Educational
Level, and Number of Planners, along with the average Number of Directors, Age
of Directors, and Number of Years of Planning were used as
managerial/organizational characteristics to see if there was any relationship to
the level of strategic planning conducted by the institutions.
LIMITATIONS
Even though the research findings of this study have been interesting and
to some degree unexpected, several limitations must be noted. First, when dealing
with performance measurements of any type it must be remembered that

numerous factors may be measured, but there is no meaningful method to
measure the "quality" of management. This study makes no attempt to allow for
the potential differences in management quality between various institutions, only
to compare the statistical difference in the level of planning engaged in by the
71
respondents.
Second is the limitation brought about by the use of the mail questionnaire
as the data gathering technique for the study. The utilization of the mail
questionnaire brings forth two primary issues of concern, that of the candor and
honesty of the responses and the overall representativeness of the target
population relative to the entire population being researched. The element of
candor and honesty of the respondents answers to the questions was dealt with
by utilizing a questionnaire similar to ones which had been successfully used in
the past. And by having several peers and practitioners review the questionnaire
prior to utilizing it in the research process. The limitation of representativeness
was dealt with by having the sampling performed by a completely randomized
process. Based upon comparisons of the average Asset Size, Return on Assets,
Return on Equity, and Net Interest Margin of the sample population and the
respondents there was very little difference in the two groups.
A final limitation of the study is the inability to generalize the findings of
this research to other similar sample populations. This study was designed to be
limited to a specific group of financial institutions of a restricted asset size in a
specific geographic location of the United States. Due to this limited focus any

generalizations of the research findings beyond the target population would be
inappropriate and inconclusive. In order to make any applications beyond the
target population, systematic replications and extensions would have to be
performed to validate the representativeness of the target population to other
72
populations.
Other methods, specifically the personal interview format, may have
afforded a more in-depth opportunity to examine the planning processes of
various institutions and possibly gain some additional insight as to the actual
structure of their process. But, due to the wide geographic dispersion of the
target population the factor of time and monetary considerations would prohibit
this method for most research studies of this nature.
CONCLUSIONS
The primary research objective of the research was to examine the
relationship of planning to the financial performance of small and mid-sized
financial institutions. Based upon the industry norms for satisfactory
performance stated in the Introduction, the survey respondents and the sample
population were both slightly below the norm as related to Return on Assets. The
desired industry norm for Return on Assets was 1.0 and the sample population
was at 0.87 and the survey respondents were at 0.92. The desired industry norm
for Return on Equity was 10.00 and the sample population was at 10.62 and the
survey respondents were at 9.98. Thus the sample population was slightly above
the norm and the survey respondents were basically right at the norm. In the

case of Net Interest Margin the stated industry norm is a range of 4.00 to 5.00.
Both the sample population and the survey respondents were within the stated
norm range, being 4.70 and 4.71 respectively.
The ten (10) variables researched were analyzed utilizing the One-Way
73
Analysis of Variance, Probability "F", and where appropriate, the Student-
Newman-Keulls procedure to determine the relationship between the variable
and the level of planning performed by the respondents'.
The first set of variables analyzed was the three (3) variables related to the
financial performance of the financial institutions (Hypotheses H1a, H1b, and
H1c). In the case of Hypothesis H1a, Average Return on Assets, the results found
that there was no significant difference in the Average Return on Assets for the
four (4) planning groups. And that there was no significant difference between
means of the four (4) groups.
Hypothesis H1b, Average Return on Equity, the results found that there
was no significant difference in the Average Return on Equity for the four (4)
planning groups. And that there was no significant difference between the
means of the four (4) groups.
Hypothesis H1c, Average Net Interest Margin, the results also found that
there was no significant difference in the Average Net Interest Margin for the four
(4) planning groups. And that there was no significant difference between the
means of the four (4) groups.
Thus it was concluded that there was no significant difference in the

financial performance of the sample population based upon the level of planning
conducted by the institutions, based upon the Average Return on Assets, the
Average Return on Equity, and the Average Net Interest Margin as measures of
financial performance. Also, there was no significant difference between the
74
means of the four (4) groups for each of the variables.
The second set of variables measured was the six (6) variables related to
managerial/organizational characteristics of the financial institutions (Hypotheses
H2a, H2b, H2c, H2d, H2e, and H2f). In the case of Hypothesis H2a, the Number
of Persons involved in the planning process, the results found that there was a
significant difference in the Number of Persons involved in the planning process
for the four (4) planning groups. It was also determined that there were two (2)
pairs of groupings whose means were significantly different from the others.
Specifically the High Planning Group mean was significantly different from the
Moderate and Adequate Planning Group means.
Hypothesis H2b, the Average Age of Planners, the results found that there
was again a significant difference in the Average Age of the Planners for the four
(4) planning groups. It was also determined that one pair of means were
significantly different from the others. This was specifically the Low Planning
Group mean being significantly different from the Adequate Planning Group mean.
The results of the analysis of Hypothesis H2c, the Average Education Level
of the Planners, found that there was no significant difference in the Average
Educational Level of the Planners for the four (4) planning groups. It was also

determined that there was no significant difference between the means of the four
(4) groups.
For Hypothesis H2d, the Average Number of Directors, it was found that as
75
with Hypothesis H2c there was no significant difference in the Average Number
of Directors for the four (4) planning groups. It was also found that there was no
significant difference between the means of the four (4) groups.
Hypothesis H2e, the Average Age of the Directors, also found that there
was no significant difference in the Average Age of the Directors for the four (4)
planning groups. It was also showed that there was no significant difference
between the means of the four (4) groups.
The final characteristic, Hypothesis H2f, the Average Number of Years
involved in planning, indicated that there was no significant difference in the
Average Numbers of Years of Planning for the four (4) planning groups. It also
found that there was no significant difference between the means of the four (4)
groups.
Thus it was found that for the six (6) managerial / organizational
characteristics, all six (6) characteristics had no significant difference for the four
(4) planning groups, and had no significant difference between the means of the
four (4) groups. There were no characteristics which were found to have
significant differences between the means for the groups.
The final variable measured, Hypothesis H3, was the Size of the Financial

Institution based upon assets. For this variable, as with the previous variables,
it was found that there was no significant difference between the four (4) groups,
nor was there any significant difference between the means of the four (4)
groups, based upon their asset size and their level of planning sophistication.
76
The results of this study found that there was no relationship between the
financial performance, as measured by the Return on Assets, the Return on
Equity, and the Net Interest Margin, and the level of planning conducted by the
financial institutions. It also found that there was no relationship between the six
(6) managerial/organizational characteristics: Average Educational Level of
Planners, Average Number of Directors, Average Age of Directors, and Average
Number of Years of Planning and the level of planning conducted by the financial
institutions.
Likewise the study found no relationship between the level of planning
sophistication of the financial institutions and the Asset Size of the financial
institutions.
The results of the analysis of data obtained from this study tend to agree
with the findings of several of the studies, mentioned in Chapter Two, which also
found no relationship between the level of financial performance of financial
institutions and the level of planning carried out by the institution. The studies
of Robinson and Pearce, Whitehead and Gup, and Shuman, Shaw, and Sussman,
which were discussed earlier, all arrived at similar conclusions regarding the level
of planning conducted relative to the financial performance of the institution.
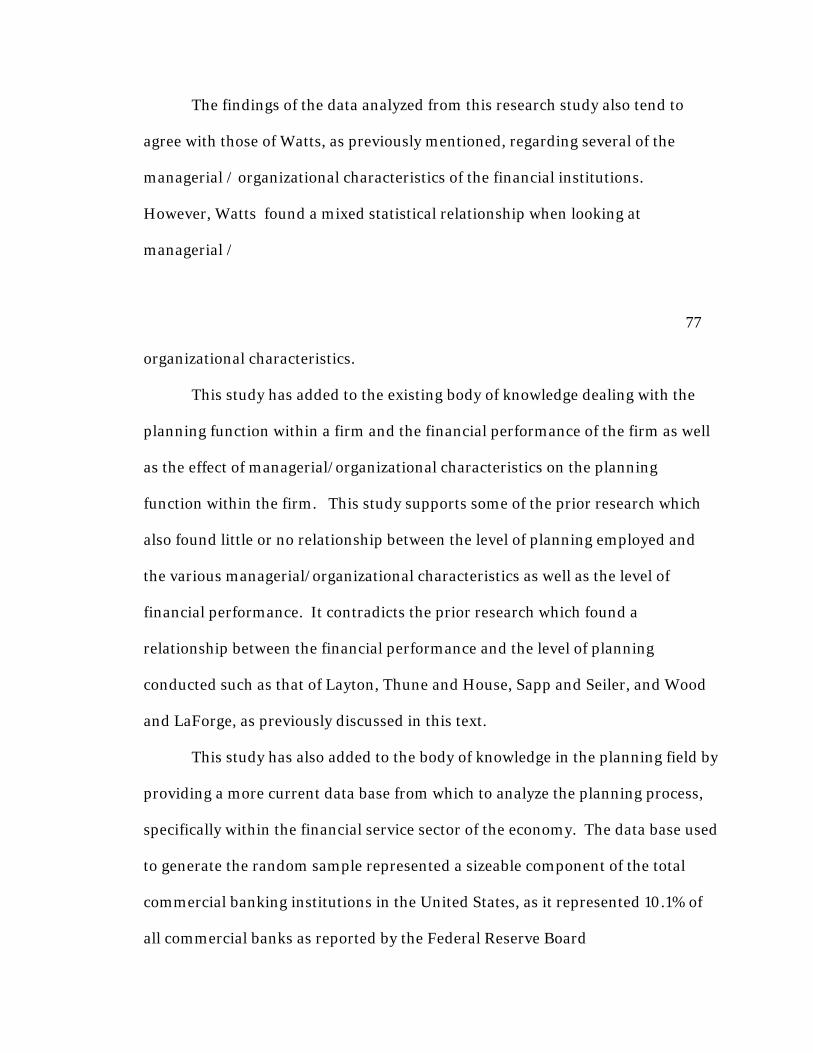
The findings of the data analyzed from this research study also tend to
agree with those of Watts, as previously mentioned, regarding several of the
managerial / organizational characteristics of the financial institutions.
However, Watts found a mixed statistical relationship when looking at
managerial /
77
organizational characteristics.
This study has added to the existing body of knowledge dealing with the
planning function within a firm and the financial performance of the firm as well
as the effect of managerial/organizational characteristics on the planning
function within the firm. This study supports some of the prior research which
also found little or no relationship between the level of planning employed and
the various managerial/organizational characteristics as well as the level of
financial performance. It contradicts the prior research which found a
relationship between the financial performance and the level of planning
conducted such as that of Layton, Thune and House, Sapp and Seiler, and Wood
and LaForge, as previously discussed in this text.
This study has also added to the body of knowledge in the planning field by
providing a more current data base from which to analyze the planning process,
specifically within the financial service sector of the economy. The data base used
to generate the random sample represented a sizeable component of the total
commercial banking institutions in the United States, as it represented 10.1% of
all commercial banks as reported by the Federal Reserve Board
RECOMMENDATIONS
The results of this study should be of practical significance to those dealing
with the planning / performance relationship in financial institutions as well as
non-financial institutions. The somewhat surprising results of this study
78
indicating the lack of a statistically significant difference in the specific
performance measures as related to the level of planning should raise questions
in the minds of current planners and managers trying to improve the overall
performance of their firms.
The lack of a significant difference in the performance measurements of
the four (4) planning groups has several implications for current managers of
organizations regardless of their industry sector. First, based upon the findings,
managers must question the role of planning and emphasis on the planning
function. As stated in the Introduction by Gibson, Donnelly, and Ivancevich,
planning is one of the four primary functions of management and is often cited as
the most critical as it relates to the overall long-term survival of the organization.
If this is true, maybe the manner in which the planning function is being
approached is inaccurate or inappropriate. The potential correlation between
sound planning, as a management tool, and the overall performance of the
organization, as indicated by several of the studies mentioned earlier, needs to be
more clearly delineated in the minds of employees at all levels of the
organization. In the training process it may be necessary to clarify more clearly

the linkage between the successful attainment of individual goals to the overall
attainment of organizational goals.
Chandler, as cited earlier, commented that the role of management /
administration has been to plan and direct the utilization of resources to meet
short-run and long-run goals of the firm related to fluctuations in the
79
marketplace. The results of this study may indicate that the planning function
being carried out by the organizations may be only short-term, thus the lack of a
significant difference in the variables and the planning function. The implication
may be that planners are caught-up in the short-term goals and objectives of the
organization and market pressures and as a result is actually doing very little
"strategic" (long-range) planning. Based upon short-term market situations it
would not be unreasonable to find many managers acting in the same manner -
to meet the same short-term needs, thus the lack of a significant difference in the
variables measured.
A third implication relates to the process of mergers and acquisitions. The
current trend of bank mergers and acquisitions over the past ten years is not
likely to diminish, therefore the management of the acquiring institution may
wish to more carefully examine the planning process of the institution to be
acquired to determine if there is a harmonious "fit" of the two organizations.
Even though they may have similar goals and objectives, there may be very
different planning processes to accomplish these goals. If there exists a
significantly differing view of the planning process by the two organizations it

may indicate potential problems during and immediately following the
acquisition process.
Further study is needed in the planning field to determine if the results of
this study are unique only to the limited target population surveyed, or are
applicable to the broader population of financial institutions in the United States.
As pressures continue to mount on executives to improve the financial
80
performance of their given institution, the need to determine what factors may
influence the attainment of corporate goals is imperative. The lack of statistical
difference between planning groups related to financial performance
measurements should prompt other researchers to ask "what does influence the
financial performance of a given group of firms?"
The researcher recommends to others who may deal with similar research
problems in the future to consider alternative analysis methods, such as multiple
linear regression. By utilizing a regression analysis method it would be possible
to reinforce the findings of this study and the results obtained utilizing the
Analysis of Variance. A linear regression analysis could be performed in two
fashions. First, would be the regression of the independent variable, the level of
planning conducted upon the dependent variable, the three individual financial
performance measures (Return on Assets, Return on Equity, and Net Interest
Margin. This analysis would offer a specific correlation of the level of planning to
the specific performance measurement. Then it would be possible to perform a
regression analysis utilizing the six managerial/organizational characteristics as
independent variables upon the dependent variable, the level of planning

conducted. This analysis would offer an indication of the correlation between the
six managerial/organizational characteristics and the level of planning conducted
by the organization. This research was limited by monetary constraints as to the
overall scope of its coverage and other researchers may have the opportunity to
conduct further research which would clarify the specific relationships between
81
the various components reviewed.
Additional recommendation for future research related to the planning
and financial performance topic is that future researchers develop some
technique to measure the overall quality of management involved in the
organizations which they are surveying. This process would most likely be a
subjective process due to the nature of the factor being measured, but it would
make some attempt to account for the wide variations in the management
capabilities which are present in all organizations.
A final recommendation for future researchers would be to look at the
social implications of bank mergers and acquisitions, possibly as a result of
strong or poor financial performance results, on the individual customer base
within a given community or region which the institution conducted business.
What impact does the merger have on a community if the financial institution is
the acquiror or the acquiree? This would be an entire separate study which could
be undertaken with potentially many far reaching possibilities.
In conclusion, this study has provided an empirical description of the
relationship of planning with measurable financial performance results of

financial institutions. The results were not what was anticipated by many of the
researcher's colleagues as the project was undertaken. Upon undertaking this
research project many of the researcher's colleagues in the banking community
were certain that the results would show a very clear distinction between the
financial performance of the four planning groups. The researcher was
somewhat
82
in agreement, due to the researcher's management training that planning was one
of the most critical functions of management, for a successful organization.
However, having some prior background in research, the researcher had also
learned not to be drawn into preconceived ideas about what results may be found
from research data, and as a result was not "totally" surprised by the results of the
data.
The results of this study have hopefully added to the understanding of the
planning relationship to financial performance in organizations. The researcher
hopes that in at least a small way the research conducted has contributed to the
overall theoretical and practical body of knowledge which will assist managers and
executives to improve the overall performance of their organizations, whether
through strategic planning or other methods.
Addendum to Research
Due to the fact that during this research project�s undertaking three very
unforeseen events took place which delayed the end results, the researcher went

back to the Federal Reserve Bank data bank and tried to do a brief comparison of
the initial 78 responding banks as to their Return on Assets, Return on Equity, and
Net Interest Margin. Appendix �P� shows the results of this brief comparison in
tabular form. Of the 78 financial institutions responding to the original survey in
1996, only 60 of them still existed. The other 18 had been merged into another
financial institution. This indicated that there was a 23.1% rate of
83
acquisition of banks in this group by other financial institutions. In addition 3
of the 60 banks remaining were no longer in the $1,000,000,000 and under asset
size.
The Average Return on Assets for the remaining 57 financial institutions
was 1.2% at the end of 1999. The Average Return on Equity for the institutions
was 12.4% at the end of 1999. And the Average Net Interest Margin for the
remaining institutions was 4.1% at the end of 1999.
84
BIBLIOGRAPHY Ackoff, R. (1970). A concept of corporate planning. New York: Wiley-
Interscience. Alreck, P., & Settle, R. (1985). The survey research handbook. Homewood, IL.:
Richard D. Irwin. Anderson, T.J., (2000). Strategic Planning, Autonomous Actions and Corporate
Performance. Long-range planning,33, (2). 184 - 200. Ansoff, H.I. (1988). The new corporate strategy. New York: John-Wiley & Sons. Ansoff, H.I., Avner, J., Brandenburg, R.C., Porter, F.E., & Radosevich, R. (1970).
Does Planning Pay? The Effects of Planning on Success of Acquisitions in American Firms. Long-range planning, 3. 2 - 7.
Balian, E. (1994). The graduate research guidebook. (3rd ed.). Lanham, MD:
University of America Press Below, P., Morrisey, G., & Acomb, B. (1987). The executive guide to strategic planning. San Francisco: Jossey-Bass Publishers. Boyd, B. (1991). Strategic Planning and Analytical Performance: A Meta-
Analytical Approach. Journal of management studies, 28. 358 - 361. Capon, N., Farley, J., & Hulbert, J. (1994). Strategic Planning and Financial
Performance: More Evidence. Journal of management studies, 31. 105 -

110. Chandler, A.D., Jr. (1962). Stategy and structure. Cambridge, MA: M.I.T. Press. Cyert, R.M., & Mauch, J.G. (1963). A behavioral theory of the firm. Englewood
Cliffs, N.J,: Prentice-Hall, Inc. Daft, R.L., & Maric, D. (1998). Understanding management (2nd ed.). Orlando,
FL.: The Dryden Press. Donnelly, J.H., Gibson, J.L., & Ivancevich, J.M. (1998). Fundamentals of Management. (10th ed.). Chicago: Richard D. Irwin.
85
Drucker, P.F. (1974). Management: tasks, responsibilites, and practices. New
York: Harper & Row Publishers. Federal Reserve Bank of Cleveland (1994). Data Services Division. Statistical
information from United States Banks database.
Federal Reserve Bank of Cleveland (1999). Data Services Division. Statistical information from United States Banks database.
Flippo, E.B. (1970). Management: a behavioral approach. (2nd ed.). Boston:
Allyn & Bacon, Inc. Gebelein, C. (1993). Strategic Planning: The Engine of Change. Planning review, 21 (5), 17 - 19. Gitman, L.J. (2000). Principles of managerial finance, (9th ed.). New York:
Addison-Wesley Longman, Inc. Glaister, K.W., & Falshaw, R. (1999). Strategic Planning: Still Going Strong? Long range planning, 32. (1). 107 - 116. Hart, B.H.L. (1967). Strategy. (2nd ed.). New York: Praeger. Hitt, M.A., Middlemist, R.D., & Mathis, R.L. (1986). Management concepts and effective practice. (2nd ed.). New York: West Publishing Company. Hoehn, L. (1991). Developing the Proposal. Workshop presented as part of the
Walden University Summer Session, Rosemont, MN. Hopkins, W.E., & Hopkins, S.A. (1997). Strategic Planning - Financial
Performance Relationships in Banks: a Casual Examination. Strategic

mangement journal, 18. (8). 635 - 652. Ketchen, D.J.,Jr., & Palmer, T.B. (1999). Strategic Responses to Poor
Organizational Performance: a Test of Competing Perspectives. Journal of management, 25. 683 - .
Klay, W.E. (1989). The Future of Strategic Management, Handbook of Strategic
Management. edited by Jack Robin, Gerald J. Miller, & W.B. Hidreth. New York: Marcel Decker.
Kraemer, H.C., & Thiemann, S. (1987). How many subjects?. Newbury Park, CA:
Sage Publications, Inc. 86
Layton, S.M. (1991). Strategic Planning and its Impact on Financial Performance
and Growth. DBA diss. Nova University. Malik, Z.A., & Karger, D.W. (1975). Does Long-Range Planning Improve
Company Performance?. Mangerial review, 64. 26 - 31. Oppenheim, A.N. (1992). Questionnaire design, interviewing, and attitude measurements. (2nd ed.). London: Print Publishers, Ltd. Peterson, H.C., & Silas, M. (1996). The impact of planning activities on the performance and expectations of Michigan input, supply, and grain handling frims. Michigan State University Staff Paper No. 96-34. Pfeiffer, J. W. (1991). Strategic planning, selected readings. San Diego, CA:
Pfeiffer & Company. Porter, M. (1987). Corporate Strategy: the State of Strategic Marketing. The economist, May 23. 17 - 22. Robbins, S.P. & Coulter, M. (1999). Management. (6th ed.). Upper Saddle River,
NJ.: Prentice Hall, Inc. Robinson, R.B., & Pearce, J.A. (1983). Impact of Formalized Strategic Planning
on Financial Performance in Small Organizations. Strategic management journal, 4. 197 - 207.
Rogers, P.R., Miller, A., & Judge, W.Q. (1999). Using Information - Processing
Theory to Understand Planning/Performance Relationships in the Context of Strategy. Strategic management journal, 20. 566 - 577.
Ruocco, P. & Proctor, T. (1994). Strategic Planning In Practice: a Creative

Approach. Marketing intelligence and planning, 12. (9). 24 - 29 Sapp, R.W., & Seiler, R.E. (1981). The Relationship Between Long Range
Planning and Financial Performance of U.S. Commerical Banks. Managerial planning, 29. 32 - 36.
Shuman, J.C., Shaw, J.J., & Sussman, G. (1985). Strategic Planning in Smaller
Rapid Growth Companies. Long range planning, 18. (6), 48 - 53. Sproull, N.L. (1988). Handbook of research methods. Metuchen, N.J.: The
Scarecrow Press, Inc.
87
Steiner, G.A. (1979). Strategic planning: what every manager must know. New
York: Free Press. Thune, S.S., & House, R.J. (1970). Where Long-Range Planning Pays-off:
Findings of a Survey of Formal and Informal Planners. Business horizons, 13. 81 - 87.
Vancil, R.F., & Lorrange, P. Strategic Planning in Diversified Companies. Harvard business review, 53. 81 -90. Watts, L.R. (1987). Small Bank Planning Practices, Ownership, Characteristics,
and Performance. Ph.D. diss., Arizona State University. Whitehead, D.D., & Gup, B.E. (1985). Bank and Thrift Profitability: Does
Strategic Planning Really Pay?. Economic review, Oct. Wood, D.R., & LaForge, R.L. (1979). The Impact of Comprehensive Planning on
Financial Performance. Academy of management journal, 22. (3), 516 - 526.

88
APPENDIX �A� BANK SURVEY COVER LETTER


90
APPENDIX �B� BANK PLANNING SURVEY QUESTIONNAIRE


94
APPENDIX �C� BANK PLANNING SURVEY RESULTS TOTALS


97 APPENDIX �D� BANK PLANNING SURVEY RESULTS RETURN ON ASSETS


99 APPENDIX �E� BANK PLANNING SURVEY RESULTS RETURN ON EQUITY
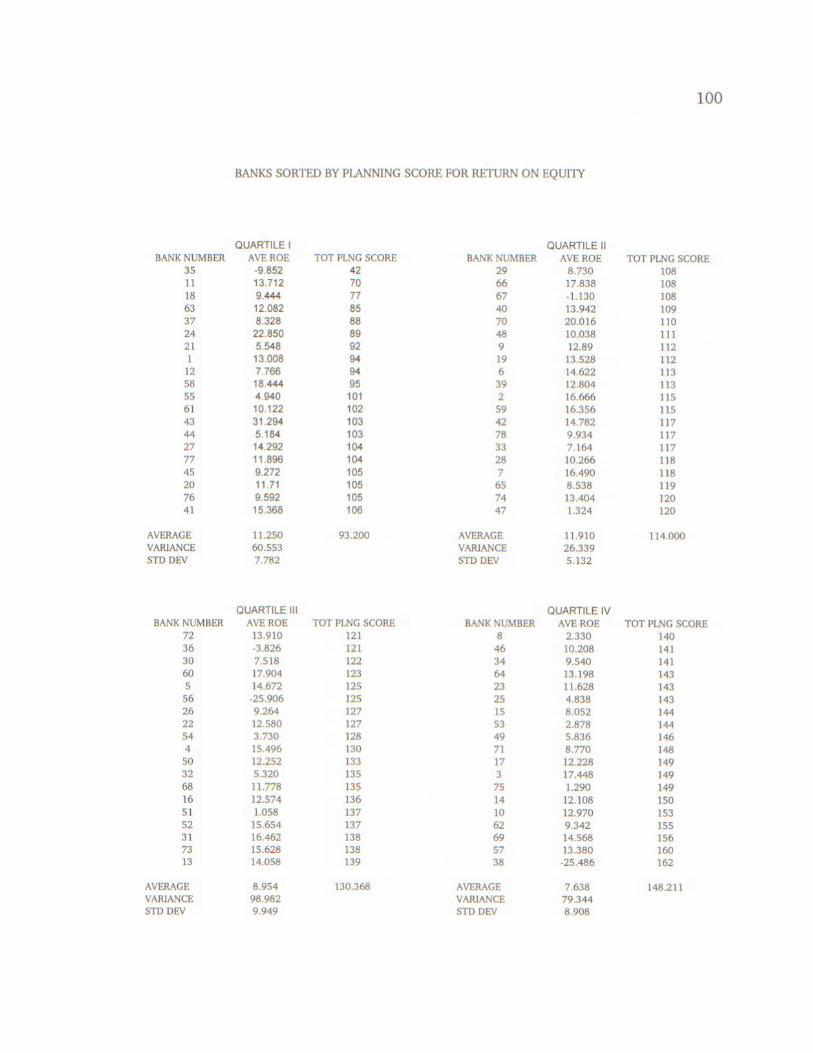

101
APPENDIX �F� BANK PLANNING SURVEY RESULTS NET INTEREST MARGIN

103

APPENDIX �G� BANK PLANNING SURVEY RESULTS NUMBER OF PLANNERS


105 APPENDIX �H� BANK PLANNING SURVEY RESULTS AGE OF PLANNERS


107 APPENDIX �I� BANK PLANNING SURVEY RESULTS EDUCATION OP PLANNERS
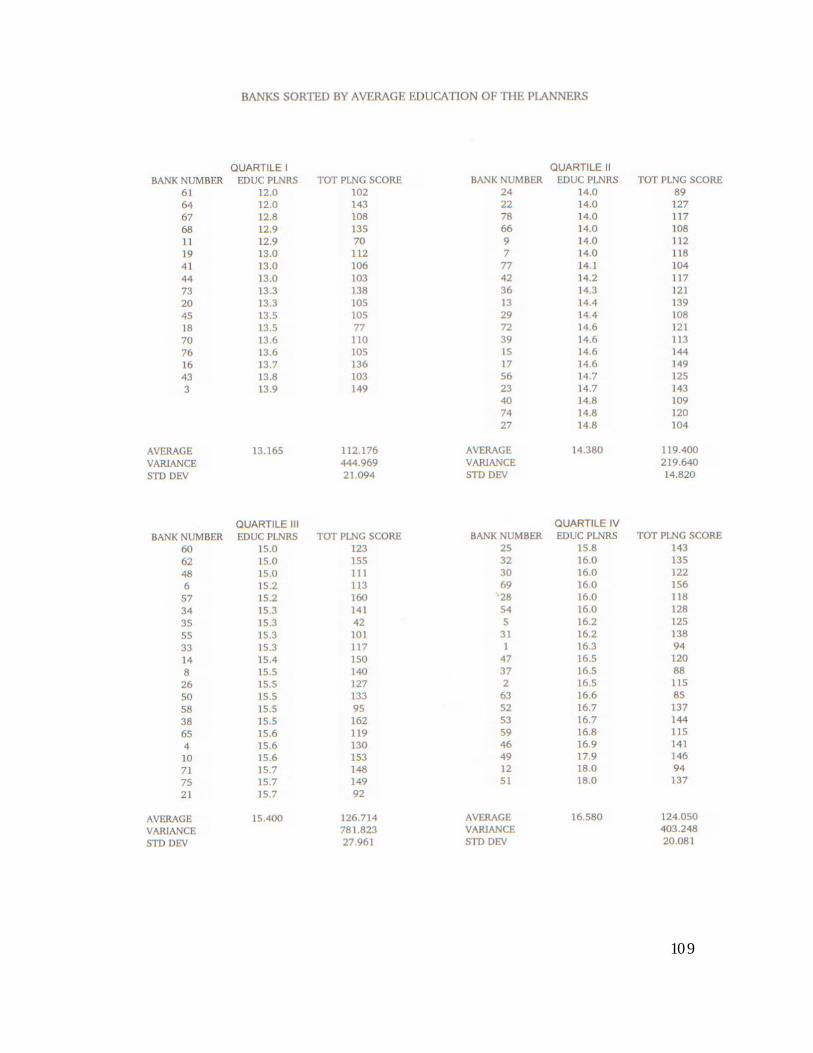
109

APPENDIX �J� BANK PLANNING SURVEY RESULTS NUMBER OF DIRECTORS
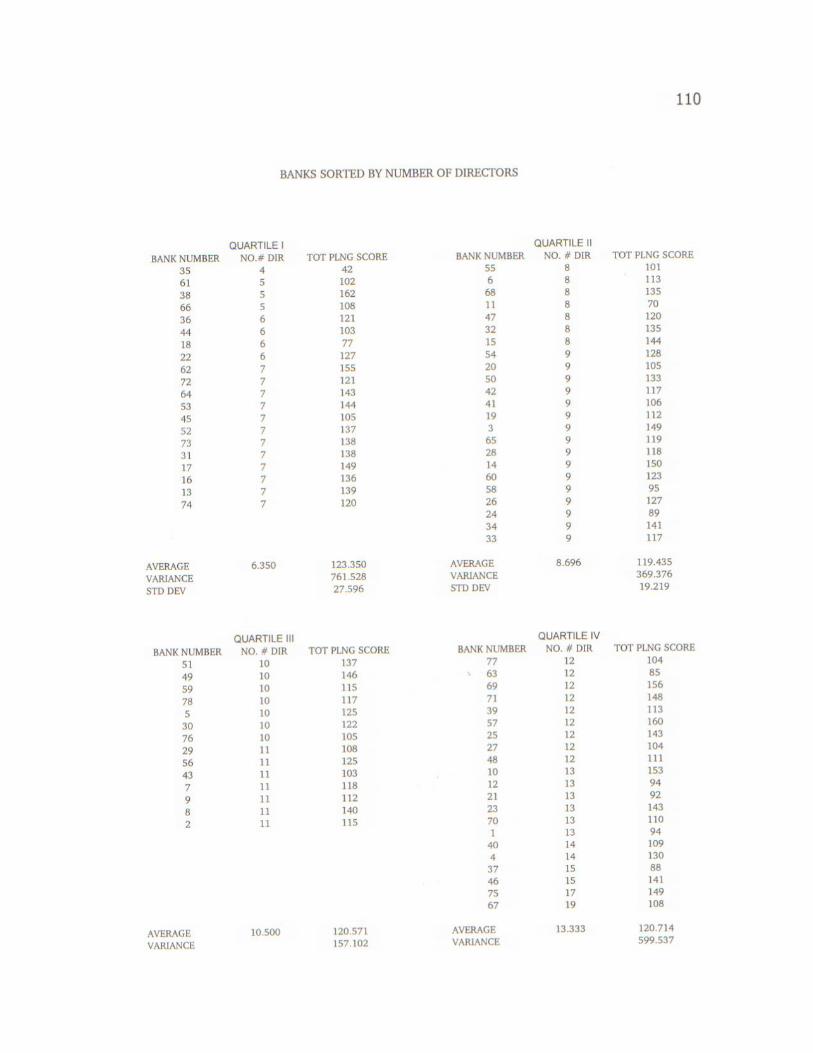

111 APPENDIX �K� BANK PLANNING SURVEY RESULTS AGE OF DIRECTORS


113 APPENDIX �L� BANK PLANNING SURVEY RESULTS YEARS OF PLANNING


115 APPENDIX �M� BANK PLANNING SURVEY RESULTS TOTAL ASSET SIZE

117

APPENDIX �N� BANK PLANNING SURVEY RESULTS MULTITRAIT - MULTIMETHOD MATRIX


119 APPENDIX �O� PERMISSION TO USE QUESTIONNAIRE DEVELOPED BY WATTS


121 APPENDIX �P� 1999 COMPARISON TO ORIGINAL SURVEY RESULTS

Related Documents