This PDF is a selection from a published volume from the National Bureau of Economic Research Volume Title: National Economic Planning Volume Author/Editor: Max F. Millikan, editor Volume Publisher: NBER Volume ISBN: 0-87014-310-7 Volume URL: http://www.nber.org/books/mill67-1 Conference Date: Publication Date: 1967 Chapter Title: Planning in India Chapter Author(s): Richard S. Eckaus Chapter URL: http://www.nber.org/chapters/c1427 Chapter pages in book: (p. 305 - 378)

Welcome message from author
This document is posted to help you gain knowledge. Please leave a comment to let me know what you think about it! Share it to your friends and learn new things together.
Transcript

This PDF is a selection from a published volume from the National Bureau of Economic Research
Volume Title: National Economic Planning
Volume Author/Editor: Max F. Millikan, editor
Volume Publisher: NBER
Volume ISBN: 0-87014-310-7
Volume URL: http://www.nber.org/books/mill67-1
Conference Date:
Publication Date: 1967
Chapter Title: Planning in India
Chapter Author(s): Richard S. Eckaus
Chapter URL: http://www.nber.org/chapters/c1427
Chapter pages in book: (p. 305 - 378)

Planning in India
RICHARD S. ECKAUS
MASSACHUSETTS INSTITUTE OF TECHNOLOGY
introductionIndian planning is an open process. Much of the controversy and thedebates that accompany the preparation of the plans are public. Theinitial aggregate calculations and assumptions are either explicitly statedor readily deducible, and the makers of the plans are not only sensitivebut responsive to criticism and suggestions from a wide variety of na-tional and international sources. From original formulation throughsuccessive modifications to parliamentary presentation, plan making inIndia has evolved as a responsive democratic political process.
NOTE: An unusually large group of people have made major contributions tothe research on which this paper is based, so much so, in fact, that the authorfeels be should be regarded as the rap porteur of a joint effort, especially with re-spect to the formulation of the model described. Yet, each individual mightpresent and evaluate the results differently; so no one but the author is respon-sible for the opinions of this paper and any errors which it might contain. Creditfor whatever merit there may be is shared with Professor S. Chakravarty of theDelhi School of Economics, Professor Louis Lefeber of Brandeis University,who participated in the original version of this paper, and Dr. Kirit Parikh,research associate of the Center for International Studies, M.I.T. The authoris also indebted to Professors Max Millikan and P. N. Rosenstein-Rodan ofM.I.T. Assistance has been provided by Mrinal Datta-Chaudhuri, Dr. T.Krishnam, Dr. Jayant Shah, and T. Weisskopf which has gone far beyonddoing calculations to order, and the author regards them as having been closeassociates. Professor Nino Andreatta of the University of Bologna; Dr. AshishChakravarti, Indian Statistical Institute; James A. Mirrlees, Cambridge University;and Dr. Per Sevaldson of the Central Bureau of Statistics, Oslo, Norway, wereinstrumental in starting the original project; and their early advice has continuedto be useful. The research has been financed by the India Project of the Center forInternational Studies, M.I.T., and the U.S. Agency for International Development,neither of which is responsible for the analysis and opinions expressed here. TheM.I.T. Computation Center has been generous and cooperative in making itsfacilities available.
In revising the paper after the conference, •the comments of Professors A.Manne and T. Koopmans were particularly helpful.

306 Planning in Individual Countries
The wide political participation in the preparation of the plan is un-derstandable if one realizes that the plan is not only intended as a setof prescriptions for economic behavior but represents the diverse aspira-tions of a nation for social advancement. Yet, the nation is not ahomogeneous political entity; it is composed of a variety of regional,linguistic, economic, cultural, and political groups. The many particularand frequently contradictory interests of each of these groups have tobe recognized and to the degree it is possible, accommodated within theframework of the plans. The political process which leads to the formu-lation of the final document is undoubtedly an impressive manifestationof the workings of an open society. By its very nature it generates manyproblems from the point of view of mapping an optimal strategy foreconomic development. Though there has been a considerable amountof debate over the plans, there has been relatively little explicit attentiongiven to alternative strategies or paths of economic growth and develop-ment. In fact the political discussions have been only tangentially con-cerned with questions of alternative compositions of national targetsand much more with the capacity for saving and taxation, problems ofdirect controls and price stability. The latter are, of course, directlyrelated to the setting of social-economic goals and to the mapping ofthe paths leading toward them. However, the relationships have not beenspelled out, and the signfficance of the plan targets for current and futurewelfare has been left implicit.
Although participation in the debates which accompany the prepara-tion of the plans is widespread, unfortunately it has not been well in-formed either on the welfare implications of the plan goals or on manyother plan implications. Planning efforts have been absorbed in attempt-ing to make a single plan whose goals, resource requirements, andresource availabilities were consistent. Alternative policies have re-ceived only limited consideration in part because the alternatives remainrelatively unknown. Plausible and consistent alternative plans are dif-ficult to prepare, and the enormous, amount of information needed fortheir formulation is not readily available to individuals and organizationsoutside the central government. Hence, in order for a range of alterna-tives to be available for consideration, the Planning Commission and theconcerned ministries would have had to prepare them, and this has notbeen done. The preparation of alternative plans and the comparison oftheir implications is not advocated as a service to potential critics. It isan essential part of the planning process, for only in this way can thefull implications of any single plan be appreciated.
This criticism of Indian planning must be seen in proper perspective.

Planning in india 307
No conceptually satisfactory techniques of planning or more generallyof making economic policy for development were readily at hand whenthe Indian plans were first being made. Even now, in spite of consider-able progress the operational techniques are relatively crude. Amongthe less-developed countries the Indian approach to planning is one ofthe most sophisticated. It may be just because of this fact that higherstandards are set in judging Indian performance than would be appro-priate elsewhere.
There are many important aspects of Indian planning which will notbe dealt with in this paper. In particular, issues related to implementa-tion of the plans will not be discussed. However, this omission shouldnot be taken as implying that the issues of plan implementation areunimportant. After a brief discussion of the techniques and functionsof planning in India the focus will turn to a method of analyzing theimplications for development of alternative targets and the significanceof such alternatives. This is, I believe, one area in which more intensiveeconomic analysis can help improve planning procedures.
The Techniques of Indian PlanningThe First Five-year Plan, though prepared in haste, embodied a pro-jection of an aggregate growth path generated by capital accumulationand financed largely by domestic saving described by a linear savingsfunction. The aggregate growth model was of a Harrod-Domar type;however, the linearity of the savings function implied a marginal savingsrate higher than the average. This in turn indicated a decreasing relianceon foreign assistance in spite of the higher levels of investment projected.This simple model, it should be noted, was a projection, not a planwhich could be implemented, although it did have implications for policywith respect to foreign exchange availability and government saving.Sectoral investment allocations were determined in the public sector bythe particular projects which were proposed. A glance at the First Planwill dispel, however, any notion that there was a lack of concern for thedistant future. This plan had in fact the most explicit set of aggregatecalculations. Yet it is not surprising that at this early stage detailedanalyses were not made of the significance of alternative future com-positions of output.
In the formulation of the Second Plan a simple aggregative Harrod-Domar growth model was again used for over-all projections with pa-rameters that were based on an optimistic extrapolation of the First Planexperience. For the purpose of answering questions about the strategy of

308 Planning in Individual Countries
resource allocation to such broadly defined sectors as agriculture andindustry, Professor P. C. Mahalanobis, director of the Indian StatisticalInstitute and member of the Planning Commission, prepared two- andfour-sector models which may have been influential in drawing up thePlan.1 The two-sector model, reminiscent of the Foidman model,2 wasused to demonstrate the relations between the allocation of investmentbetween the sectors and the over-all growth rate. It distinguishes con-sumer goods and investment goods, the latter usable to create capacityin either sector. A linear structure of production is assumed and a con-stant marginal utility of consumption, so that future and present con-sumption would provide the same benefits. The model ignores foreigntrade and consumption maintenance requirements for labor. Given theseconditions it follows that the long-run rate of growth depends on therelative allocation of investment to the capital goods producing sector.While the conclusion will not necessarily be maintained if the assump-tions are modified the model did serve the purpose of emphasizing thesignificance of the choice of planning horizon.
Mahalanobis's four-sector model was intended to indicate the invest-ment allocations which would achieve prescribed growth rates and em-ployment levels. Here, again, foreign trade was ignored, and demandconditions for investment and consumption were taken into account onlyinsofar as the investment allocation suggested by the two-sector modelcould be assumed to be relevant. Both models were too limited in scopeto indicate the most desirable allocation of resources among interde-pendent sectors. No attempt was made to find optimal allocations;dynamic interrelations were not taken into account; and the targets weredefined in highly aggregative terms. The models were not employed toexamine the significance of alternative long-term programs and in factcould have been used for that purpose only with substantial modifica-tion.
The detailed program of the Second Plan consisted of a collec-tion of particular projects including both unfinished First Plan un-dertakings and proposals for new ones. Though the sum total of the
1 "The Approach of Operational Research to Planning in India," and "DraftPlan Frame for the Second Five Year Plan," Sankhya, December 1955, pp. 3—89,These models have been the subject of a number of critical analyses which willnot, therefore, be repeated here. See S. Tsuru, "Some Theoretical Doubts onIndia's Plan Frame," Economic Weekly (annual number), January 1957; S. Chak-ravarty, The Logic of Investment Planning, pp. 43—48; R. Komiya, "A Note onProfessor Mahalanobis' Model of Indian Economic Planning" Review of Eco-nomics and Statistics, February 1959, pp. 29—35.
2 See E. Domar, "A Soviet Model of Growth," Essays in the Theory of Eco-nomic Growth, 1957, pp. 223—62.

Planning in India 309
investment costs of these projects was subject to over-all constraintsderived from the aggregate projections, there were nonetheless enoughresidual or "buffer" sectors to reduce the constraining influence of aggre-gate resource limitations on these projects. The exception was the limita-tion imposed by the scarcity of foreign exchange; however, this restric-tion operated primarily not as aggregate constraint but in terms ofavailability of foreign exchange financing for separate projects.
There was no explicit mechanism visible in the Second Plan for co-ordinating the development of the various sectors so as to avoid eitherbottlenecks or surpluses. To the extent that coordination and schedulingwas achieved it was through the screening procedures of the interminis-terial committees and working groups that met with Planning Commis-sion representatives. These committees were responsible for the setting ofthe detailed targets in the plans, as well as for the approval and phasingof projects. As one of their working tools these committees apparentlydid prepare commodity balances for the entire plan period, at leastfor particular items and sectors.
However, one must not conclude with the impression that the settingof the targets and the design of projects was or is now left entirely tothe deliberations of expert working committees of the central govern-ment. The economic influence of the Indian states makes itself feltboth at the highest political levels and through negotiations with thePlanning Commission and the other union ministries. The state gov-ernments come to the center not only as petitioners but as powerfuladvocates backed by substantial resources. They are determined to havea voice not only in matters affecting their regional economies, suchas the location of new plants, but on over-all economic policy as well.
The approach to the Third Plan was similar to that taken in the prep-aration of the Second Plan. Again there were macroeconomic projectionswhich, though less explicit, were accompanied this time by a clearerrecognition of the alternative possible values of parameters which inturn made some of the parameters themselves a matter of policy. Oneof the initial and continuing debates over the formulation of the ThirdPlan concerned the over-all magnitude of the plan in relation to aggre-gate resource availabilities.3 This time, however, there was no apparentattempt to use models such as those prepared by Professor Mahalanobisfor the formulation of the Second Plan for determining sectoral priori-ties. Instead, the consultation and review procedures appear to have
3 As an aspect of this discussion see I. M. D. Little, "Tax Policy and the ThirdPlan," Pricing and Fiscal Policies, A Study in Method, ed. P. N. Rosenstein-Rodan, Cambridge, Mass., 1964, pp. 30—76.

310 Planning in Individual Countries
operated more intensively and the calculations of commodity balanceswere done more extensively, in more detail and with greater attentiongiven to improving the basic data. It is impossible for an outsider toreconstruct the procedures by which relative priorities and schedulingwere established. The interplay of ministerial and state and local ambi-tions appear in some cases to have had as much influence as any over-alldirection from the Planning Commission itself. Indeed as John Lewispointed out, a framework was not provided by the Planning Commissionor by any of the ministries in which these various interests could bereconciled in a drive toward coordinated objectives.4
The detailed supervision of target setting, project choice, and re-source allocation by groups of experienced persons can go quite far intaking into account the most significant economic interactions. This isparticularly true when there are only limited feedback effects of one com-mittee's decisions on the work of other committees. However, India is toolarge a country and its economy is too complex for such a condition tohold completely. Of course, where interactions exist, overlapping• com-mittee membership and pyramided committee organization can at leastpartially recognize and account for feedback effects. More than that,no mechanical model of planning could ever substitute for the judgmentwhich such a system of committees could bring to bear on the formula-tion of policy. At the same time the system is necessarily a cumbersomeone, and its operation could be significantly improved by providingthese committees better analytical tools than are currently available.
Though Indian planning is an open process with broad politicalparticipation, it is also true that the latter has, for the most part, madeitself felt on the marginal rather than on the central issues. This is inpart because the central issues which relate to questions of welfare,income distribution, time preference, and the social control of eco-nomic activities have not always been adequately identified.
In addition to the Planning Commission and economic ministriesthere are other groups formally charged with economic planning respon-sibilities: the National Development Council, the advisory committees
See John P. Lewis, "India," Planning Economic Development, ed. Everett B.Hagen, 1963, pp. 98—104 and also his Quiet Crisis in India, Washington, 1962,especially Chaps. 4 and 5. Lewis's description of a "planning backward" approachin which a set of final demands are broken down by steps into specific phasedprojects would have provided a clearer conceptual framework than that whichappears to have dominated the Planning Commission. However, the detailedmeans of its implementation are by no means clear in Lewis's description,nor does this approach provide adequate recognition of the issues involved insetting the final demand goals, the constraints of initial conditions, and the im-portance of generating alternative plans.

Planning in india 311
on problems of individual sectors, and a consultative committee of mem-bers of Parliament. There are also informal groupings such as the con-sultative committee of the Prime Minister.5 For various reasons includ-ing inadequate staff, limited time, and, in some cases, with limited sig-nificance given to their roles, these groups have not provided guidancefor informed political participation in the process of planning. As aconsequence, in the procedures for formulation of the plans there hasbeen relatively little consideration of the specific composition of eco-nomic targets in the light of social preferences concerning present andfuture consumption subject to resource availabilities.6 These issueshave tended to become prime subjects of political debate only underthe pressure of a new budget embodying substantial tax increases orunder the impact of price inflation.
The Functions of indian PlanningThe function of economic planning is to provide guidelines for the useof scarce resources and to indicate the methods of implementation.But what is the practical content of this function in the mixed govern-ment—private enterprise system of India? The aggregative growth modelsimplicit in the plans have not provided particulars of economic policybut rough guidelines to total resource requirements. They have had onlygeneral implications for the government's current and capital budget,over-all investment licensing, foreign exchange use, as well as fiscal andmonetary policy. Although the Indian plans encompass the entire econ-omy, the decisions of the private sector can be only partially controlledby the government. Hence, the Indian plans as for most mixed econo-mies naturally speak with greater authority about the government thanthe private sectors. The five-year plans are sometimes represented as aset of detailed blueprints of a development program. It is nearer to thetruth to characterize the plans as a general statement of governmentintentions as to its own programs as well as with respect to those sec-
5 An informative description of the administrative and organizational structureof the Indian planning process is given in S. R. Sen, Planning Machinery in India,Economic Commission for Asia and the Far East, Conference of Asian EconomicPlanners, New Delhi, 1961.
6 However, this does not mean that Indian planning is particularly backwardin this respect. The same criticism would be valid for most planning activities.Fundamental criticisms of the planning process have been raised in India byProfessor Shenoy of Ahmedabad University among others. Professor Shenoy'sobjections are so basic, however, that they would appear to be more easily avoidedthan would the criticisms of persons committed in a general way to the pre-vailing brand of Indian socialism but skeptical of its implementation.

312 Planning in Individual Countries
toral programs open to private initiative. As far as implementation isconcerned, public sector projects can be carried out subject only togovernment financial and organizational constraints. For example, theplans contain extensive chapters on such specific topics as communityorganization and development, conservation, education and training,family and health planning, and scientific and technological research.All of these are important and proper concenis of development policy.At the same time, these are the programs whose precise effects oneconomic development are difficult to assess. Furthermore, many ofthese programs are carried out by the state governments which in theIndian federal system have major responsibility for agricultural policy,education, and welfare programs. Although the state governments arefully involved in the planning process, their effectiveness in implement-ing the plans is often lower than that of the union government. This isdue partly to the generally lesser administrative capacity of the localgovernments. In addition, and perhaps more importantly, the inevitablepolitical differences among the states, which cannot be fully resolved,manifest themselves in varying degrees of commitment to particularplan objectives.
As mentioned above, the plans cannot be detailed blueprints for thosesectors which are predominantly reserved for private initiative. In theseareas the plans indicate the types and levels of activity which are con-sidered to be consistent with the over-all targets. Control of expansionis exercised by means of investment licensing and foreign exchangequotas and other controls on resource allocation. Furthermore, guidanceto private investors is provided through the publication of sectoraltargets and access to the "industries officers" of the various ministriesas well as by the agricultural extension members. In certain instancesextension of private investment over and above the targeted levels hasbeen permitted. This was, for instance, notably the case during theSecond Plan, when the rate of expansion of coal mining scheduled forthe government sector was not achieved and private mining companiesmade up the deficiency.
The public sector can be directed toward plan targets by administra-tive fiat and with the financial resources of the central and state gov-ernments. The private sector cannot be so directed. Its response toeconomic incentives is regulated by the extensive system of direct con-trols. The incentives themselves are modified by monetary and fiscalpolicy. However, the goals of free market forces and of plan targets donot necessarily coincide, and the operations of the private sectorhave not always been well coordinated with those of the public sector

Planning in India 313
and with plan targets. Shortfalls in production, investment licenses whichare allowed to lapse, and unforeseen price increases are all signs ofinadequacies in carrying out this intrinsically difficult task.7
The function of the plans in setting the context and climate for privateactivity can hardly be overemphasized. More than what can be accom-plished with general statements of intent and speeches, the plans givequantitative indications of the rate and direction in which the govern-ment intends to move the economy. The quantitative specifications ofthe plans attempt to project precise relationships between activities inthe government and the private sectors. Given the natural sensitivity ofprivate enterprise to India's avowedly socialist goals, it is particularly im-portant to have concrete and explicit statements of government policytoward private business. The plans play an even larger role, however.To dismiss as window dressing the ringing phrases contained in theintroductory chapters of the plans would be a mistaken reaction, andmore than that, it would indicate a lack of understanding of the catalyticeffect of planning on Indian society. The plans provide symbolic leader-ship and orientation to a developing society.
Description of a Planning Model 8Indian planning will be analyzed in this paper by means of a linearprograming model in which the intertemporal relations involved in plan-ning are treated explicitly. It is a programing model because optimizationwith respect to constraints is presumably what planners try to do. Lin-earity is an unfortunate restriction which for the present is imposedby analytical, computational, and information constraints. Comparedto the real world and to certain aspects of planning procedures actually
It has been a continuing complaint about Indian planning by Indian business-men, and many foreign observers as well, that the private sector has sufferedfrom excessive controls and inadequate incentives. This may reflect, however, aset of goals different from the plan targets as well as mistakes in calculation ofwhat is necessary to achieve the targets. These issues will not be followed up herethough they are far-reaching in their significance.
8 The model used in this study is a generalization of the model presented inR. S. Eckaus and L. Lefeber, "Capital Formation: A Theoretical and EmpiricalAnalysis," Review of Economics and Statistics, May 1962, pp. 113—22 and L.Lefeber, "A Simple Optimizing Planning Model," Capital Formation and Eco-nomic Development, ed. P. N. Rosenstein-Rodan, Cambridge, Mass., 1964, pp. 83—109. It has been further developed by the contributions of Lefeber, Chakravarty,Parikh, and the author. It has a clear heritage from the programing models ofChapters 11 and 12 of Linear Programming and Economic Analysis, New York,1956, by R. Dorfman, P. A. Samuelson, and R. Solow. P. Sevaldson and ProfessorN. Andreatta were instrumental in recommending the approach.

314 Planning in Individual Countries
in use the model is a gross simpiffication in a number of respects. Inother aspects it is more sophisticated than methods currently used. Itshould be emphasized at the outset that the model is not intended norable to produce the "best" possible plan for India. It is a device forchecking consistency and exploring alternatives. After presenting themodel and some of the results obtained by it the strengths and weak-nesses of the approach will be evaluated.
The maximand of the model is the weighted sum of annual aggregateconsumption for the entire planning period, T, which at five years is thatof the Indian plans. This is a linear objective function:
(1) U
w(t) represents the relative weight placed on consump-tion in period t. The ratio between pairs of adjacent weights reflects asocial discount factor. Thus, setting the weight corresponding to thefirst time period equal to 1, the value of the objective function corre-sponds to the present discounted value of the stream of aggregate con-sumption over the entire plan period. The discount rate is assumed toremain constant over the plan horizon.9
Though the model is multisectoral, consumption is treated in the ob-jective function as a single, composite commodity since it is stipulatedthat sectoral outputs enter consumption in fixed proportions. In Equa-tion (2), F(t) represents the column vector of sectoral outputs desig-nated for consumption, and c is a diagonal matrix whose elements indi-cate the composition of C(t):
(2) cC(t) c = IciF;Eci = 1, for I = 1,
Although the use of a composite good as the consumption variable isundoubtedly a major abstraction it has computational merit in that itavoids the nonlinearities which may be associated with explicit de-mand elasticities and also circumvents the problem of separatelyweighting each good That enters consumption. This undoubted advan-tage has to be balanced against the damage done to reality by the im-position of a constraint which forbids substitution among types of con-sumption. In interpreting the significance of the assumption with re-spect to the computations to be presented, it should be kept in mind,
The assumption of constant discount rate is necessary to avoid the "regret"problem of R. Strotz, analyzed in "Myopia and Inconsistency in Dynamic UtilityMaximization," Review of Economic Studies, 1956, pp. 165—80.

Planning in India 315
however, that the level of aggregation is quite high. It is unlikely thatin a country like India the composition of consumption would changevery much among grossly defined sectors over such a short period asfive years. In any case, this is only a convenient formulation, and theconsumption proportions will be varied by exogenous specification,taking income levels into account, in order to explore the implicationsof alternative composition.'°
Annual consumption levels provided by a plan cannot be set withouttaking into account socially desired levels and growth rates of consump-tion, such as satisfaction of "minimum requirements" and either astable or monotonically increasing pattern. Substantial fluctuations inconsumption are not likely to be politically acceptable. Yet, in thismodel's solutions, satisfactory levels and growth rates of consumptioncannot be assured if they are not explicitly imposed as constraints. Thebehavior of consumption over time will otherwise depend on the inter-relationships between the productivity of the system, the discount rate,initial endowments, and terminal requirements. Depending on the rela-tive magnitudes of these quantities consumption behavior could bemonotonic but concentrated at the beginning or end of the planningperiod or fluctuate over time.
To ensure a rising pattern of consumption over time a set of "mono-tonicity" constraints are added as shown in (3).
(3) C(t+ 1) + for t = 1, . . . , T — 1
These inequalities require that consumption in any one period must beat least as great as consumption in the previous period augmented by agrowth factor (1 + p) where p is a politically determined parameter,which will presumably take into account the population growth rate.A lower bound is also placed on C( 1) to ensure that at least a minimumlevel of consumption is attained in the first period. This is shown byrelationship (4) •11
(4) C(1) C(l)There are other relations which explain the availability and other
uses of resources and output: the products of the different sectors may10 Pseudovariable proportions can be introduced into the market basket by stip-
ulating overlapping upper and lower limits within which the proportions them-selves can change. T. Weisskopf has experimented with consumption goods com-posed on this principle. The disadvantage is computational, and is due to theinevitable increase in the number of inequalities.
11 In the computations actually carried out for this paper the constraint in (4)was frequently not imposed for reasons explained below.

316 Planning in individual Countries
be used as inputs into current production, for capital formation, and forthe satisfaction of government and export demand. Furthermore, theseproducts may originate from domestic output or imports or—in somesuitable combination—from both. This is described by the distributionrelationships shown in (5), of which there is a set for each time period.
(5) aX(t) + F(t) + N(t) + Q(t) + H(t) + G(t) +E(t) — M(t) — X(t) for t = 1, . . . , T
All terms of this sum are to be read as column vectors, the elements ofwhich represent the different uses of the outputs of each sector. a is theLeontief matrix of input coefficients and X(t) is the column vectorof the domestic outputs corresponding to all sectors. Hence, the product,a column vector, shows the sum of the intermediate demands by all sec-tors for the goods of each sector.'2 Other uses, i.e., consumption, newcapital formation, capital replacement, inventory accumulation, govern-ment consumption, and exports are represented by the column vectorsF(t), N(t), Q(t), H(t), G(t), and E(t), respectively, of which the lasttwo will be stipulated exogenously. The negative term M(t) is a columnvector of supplies from imported sources.
Domestic production requires only capital capacity. The productionfunctions are described in (6).
(6) bX(t) — K(t) 0; where b for 1 = 1, . . . , T
b is a diagonal matrix composed of capital-output ratios. Capacity, K(t),is a composite capital which is committed to a particular sector, butwhich may change from period to period depending on the rate of de-preciation and the investment which is carried out in that sector.
The formation of capacity in each sector is shown in (7), whereZ(t + 1) denotes new capacity which first becomes available for usein period (t + 1). D (t + 1) is the amount of capital stock whichis disabled by the depreciation of some part of it. R (t + 1) is theamount of the disabled capital stock which is made productive againby the replacement of the depreciated component.
(7) K(t + 1) — K(t) — Z(t + 1) + D(t + 1) — R(t + 1) 0,
for 1= 1, . . ., T+2New additions to capacity are formed by blending different sectoral
outputs in fixed proportions and with specified gestation periods. Thus,
12 The a matrix itself, of course, is a summary of many production relationships.

Planning in India 317
in order to have the desired capacity increase in a particular sectoravailable at period t, designated parts of it must be completed in periodst — 1, t — 2, and t — Pi, P2, and are matrices which indicate theproportions in which each sector must deliver output to form capacitywhich is to become effective one, two, and three periods later. Thus,
(8) p1Z(t + 1) + p2Z(t + 2) + p3Z(t + 3) — N(t) 0,
fort+1,.. .,TTo account for depreciation a "one-horse-shay" model of capital is
assumed, so that productive services flow from capital at a constantrate after its creation until the end of its lifetime, at which point it losesall productivity. Capital lifetimes of twenty years for equipment andthirty-three years for construction are assumed, so that within a five-yearplanning model depreciation is exogenous. Given the different lifetimesfor different components, productive capacity is lost by the deprecia-tion of only a part of a unit of capital and, likewise, may be restored bythe replacement of only the depreciated part. The depreciation in eachperiod is
(9) D(t) = D(t), for t = 1, . . . , T + 3The proportions of depreciation of each type in each sector are indicatedby a square matrix r whose terms are The terms are theratios of depreciation proportions to the proportions in which the com-ponent parts are required for capacity. Thus, multiplying D,(t) by
will indicate the productive capacity lost through depreciation ofeach component. The actual capacity lost in each sector is the maximumof D2(t) (r1,/p15, r25/p21, . . . , The diagonal matrix d isformed from the matrix each of whose terms is the maximum offor each i and j. The capacity lost through depreciation is then
(10) V(t) = D(t)[d], for t = 1, . . . , T + 3The optimizing mechanism can now decide to restore all or part of thedepreciated capacity by replacing the worn-out components. Thus,
(11)13 Alternatively, it would have been possible to provide for deliveries of invest-
ment goods with variable gestation periods on which lower bounds would beset. This would provide additional flexibility which might in some circumstancesbe of particular utility as it would permit uncompleted investment to be carriedover without penalty. This latter formulation was not chosen for several reasons.It would, first of all, increase the computational burden. Secondly, on the basisof admittedly casual observation, this additional flexibility does not appear tobe practically an important phenomenon.
318 Planning in Individual Countries
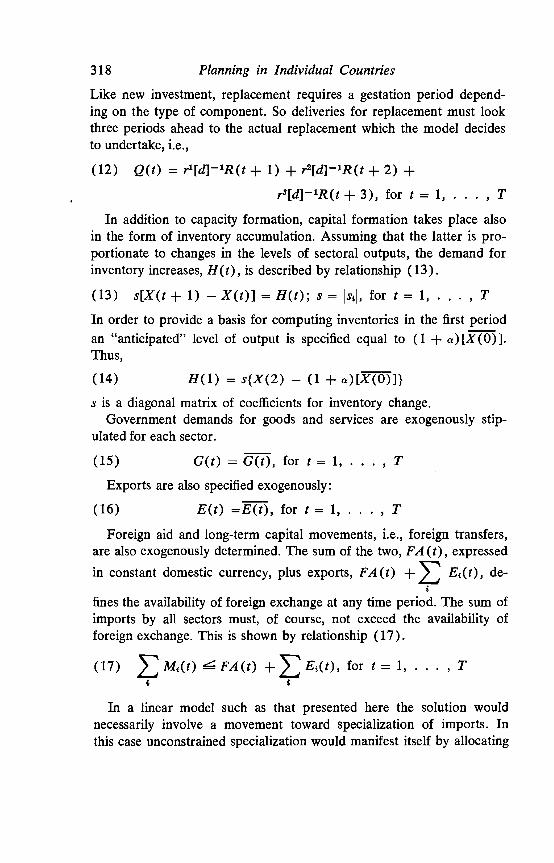
Like new investment, replacement requires a gestation period depend-ing on the type of component. So deliveries for replacement must lookthree periods ahead to the actual replacement which the model decidesto undertake, i.e.,
(12) Q(t) = r1[d]1R(t + 1) + + 2) +r8{d]'R(t + 3), for t = 1, . . . , T
In addition to capacity formation, capital formation takes place alsoin the form of inventory accumulation. Assuming that the latter is pro-portionate to changes in the levels of sectoral outputs, the demand forinventory increases, H(t), is described by relationship (13).
(13) s[X(t+ 1) —X(t)] =H(t); s= for t= 1, . . . , T
In order to provide a basis for computing inventories in the first periodan "anticipated" level of output is specified equal to (1 + a) [X(O)].Thus,
(14) H(l) s{X(2) — (1 + a)[X(O)]}
s is a diagonal matrix of coefficients for inventory change.Government demands for goods and services are exogenously stip-
ulated for each sector.
(15) G(t) = G(t), for t 1, . . . , TExports are also specified exogenously:
(16) E(t) =E(t), for t = 1, . . . , T
Foreign aid and long-term capital movements, i.e., foreign transfers,are also exogenously determined. The sum of the two, FA (1), expressed
in constant domestic currency, plus exports, FA (t) + > de-
fines the availability of foreign exchange at any time period. The sum ofimports by all sectors must, of course, not exceed the availability offoreign exchange. This is shown by relationship (17).
(17) FA(t) + for t = 1, . . . , T
In a linear model such as that presented here the solution wouldnecessarily involve a movement toward specialization of imports. Inthis case unconstrained specialization would manifest itself by allocating

Planning in India 319
all foreign exchange resources so as totally to replace domestic produc-tion by imports in one or a few sectors.14 This kind of specializationin a highly aggregated system would inject an extreme lack of realisminto the solution. At the same time the model should be given somefreedom to allocate foreign exchange to the sectors where it is mostuseful. This is done by imposing both import ceilings in all importingsectors and import floors where such should be necessary. The latterconsists of sectoral minimum import requirements that are "noncom-petitive" in the special sense that they must be satisfied before otherimports are allowed. If foreign exchange is left over after these mini-mums are satisfied, it is allocated according to cost advantage, i.e.,competitively, to other sectors.15 But now the import ceilings becomeoperational; so imports cannot completely displace domestic produc-tion in any one sector.
Relationship (18) describes the division of total imports into non-
competitive imports, and competitive imports
These are obtained for each time period by summing over the sectoralamounts.
(18)
____ ____
+
___
for t = 1, . . . , T
Import floors, i.e., the minimum levels of noncompetitive imports,are determined for each sector in terms of given proportions of thesectoral domestic outputs. This is shown by (19).
(19) M31(t) = for t = 1, . . . , T
Whatever foreign exchange is left over after satisfying noncompetitiveinput requirements can be distributed for competitive imports with the
1.4 If some foreign exchange were left over after the total displacement ofdomestic production in one or more sectors, it would be allocated to another sectorwhere, as a consequence, domestic production and imports. would take placesimultaneously. This, of course, would not contradict the contention that thesystem moves toward specialization; it means only that the system, quite sensibly,would not throw away good foreign exchange resources.
15 Cost advantage depends on the initial distribution of capital capacities aswell as the structure of production coefficients. Therefore, the allocation of theforeign exchange resources may be dominated by the initial conditions rather thana more comprehensive interpretation of cost advantage. Furthermore, changes inforeign prices are also neglected, and exports are exogenously stipulated. Hencethe concept of cost advantages is different in a number of respects from a dynamicinterpretation of Ricardian comparative advantage.

320 Planning in Individual Countries
limitation that not more than a given proportion of the remainingforeign exchange can be spent for imports in that sector. This is de-scribed under (20).
(20) +
____
— >for t = 1, . . . , T
must be chosen so as to exceed unity; otherwise the maximizing
mechanism has no freedom to allocate competitive imports according tocost advantage.
Up to this point constraints have been described which relate to theintraplan periods. The determination of the initial and terminal condi-tions must now be described. The initial conditions summarize the pro-ductive capacity of the economy in existence at the start of the planningperiod, i.e., the initial capital stocks K( 1). Furthermore, since capacityincreases follow a lagged gestation pattern, the incomplete projectsfrom the preplan period which are available for completion during thefirst years of the plan must also be specified. Their completion may ormay not be efficient—the decision on this is left to the optimizingmechanism. The initial conditions in the form of column vectors areshown in (21). Capacity increases maturing in the first period are notlisted since they are already included in K( 1) as potentially activeproductive capacity at the beginning of the plan.:
(21) K(1) K(1);13(O) = 13(0);12(0) = 12(0);12(_1) =
P(-1)12(0), for example, is the investment carried out in period 0 for com-pletion in period 2.
While the initial conditions reflect the state of the economy when theplanning period begins, the terminal conditions summarize the state ofthe economy to be attained by the end of the planning period. For avariety of reasons plans must be truncated at some point, and it is thefunction of the terminal conditions to reflect the postplan future intothe planning period. Barring terminal capital requirements set so high asto be infeasible, the planner has considerable scope for choice, with re-spect to these terminal conditions. The issues related to this choice havereceived so little explicit attention in Indian planning that it is hard toavoid the belief that their signfficance has not been adequately appre-ciated. Although there are good reasons for making short plans, thechoice of a planning period is essentially arbitrary. Yet short plans

Planning in india 321
should be consistent with both the long-run and continuing goals ofsociety as well as more immediate needs. The former objectives will in-clude raising the standard of living of the nation; the latter, for example,may reflect urgently felt military requirements. There are a variety oftechniques which can be employed to bring these postplan considera-tions within of a truncated planning period.
The terminal conditions will be set in two ways in the solutionswhich follow. First the targets of the Third Plan will be used. They willbe extrapolated by means of the sectoral intrapian growth rates as abasis for determining the investment necessary within the plan periodfor postplan period growth. With such terminal conditions the model willbe called the Target Model and its solutions, Target solutions. The nextanalysis will use a method of setting targets which makes them endog-enously determined as part of the solution. The technique is a variationof that presented by Chakravarty and Eckaus 16 and by R. Stone andAlan Brown.'7 The level of composite consumption attained in thelast period of planning is taken as the basis for the future growth pathof consumption. Even in this case, government purchases, exports, andforeign exchange reserves (exports plus foreign aid) continue to be spec-ified exogenously. Thus, because the last period's consumption is anendogenously determined variable of the optimizing system, the post-terminal sectoral output levels required to sustain a given rate of post-terminal consumption growth also become endogenously determinedvariables. Since in this case the model solution provides an optimaltransition to exogenously specified post-terminal growth rates it will becalled the Transit Model; and its solutions, Transit solutions.18
The determination of the post-terminal sectoral output levels requiredto sustain a given rate of consumption growth is shown by relationships(22) and (23). Equation (22) is the distribution relationship (5) intowhich the appropriate growth terms have been substituted, and (23) isthe sum of the particular solutions corresponding to the nonhomogeneouselements of the post-terminal growth: consumption, government, exportsand imports. The homogeneous elements in (22) relate to interindustryflows and to gross capital formation as well as inventory requirements.
16 S. Chakravarty and R. S. Eckaus, "An Approach to a Multisectoral PlanningModel," Capital Formation and Economic Development, especially pp. 112—15.General considerations involved in setting terminal conditions are discussed inS. Chakravarty and R. S. Eckaus, "Choice Elements in Intertemporal Planning,"Capital Formation . . . , pp. 68—83.
17 A Computable Model of Economic Growth, London, 1962.'8The nomenclature in the first version of this paper was not so specific. Origi-
nally what is now called the Transit Model was called the Basic Model and theTarget Model was not given a name.

322 Planning in Individual Countries
They are the terms multiplied by the b, d, and s coefficients. The non-homogeneous elements are the terms indicating the growth of C, G, E,and M, based on the levels which they attain in the last plan period andthe exogenously stipulated growth rates.
(22) X(t) = aX(t) + b1{X(t + 1) — X(t)J + b2[X(t + 2)] +b3[X(t+ 3) —X(t+2)J+s[X(t+ 1) —X(t)] +(1 + c/)t—TF(T) + (1 + 8)t—TR(T) + (1 +y)tTG(T) + (1 + €)tTE(T) + (1 + p.)tTM(T),for z=T+1,T+2,T+3
(23) X(t) = [I—a—+ t.)tT + [I — a — (b1 + s)8 —
b2(1 + 8)6 — b3(1•+ 8)281R(T)(1 + 8)t_T +[I—a— (b'+s)y—b2(1+y)7—b3(1+y)2y]G(T)(1 + + [I — a — (b' + s)e —b2(l + — b3(1 + E)2€]E(T)(1 + +[I--a— (1 +,4214M(T)(1 + = T + 1, T + 2, T + 3
The b coefficients are defined by
(24) b' = p'b; b2 = p2b; b3 = p3b
where p' = p45
The coefficients 8, y, €, and are the specified post-terminal growthrates for private consumption, replacement, government consumption,exports, and imports.
In the initial computations reported below the consumption com-position has been maintained unchanged throughout the postterminalperiod by projecting the sectoral components of consumption of the lastplan period with identical rates. This, of course, is not necessary; amore general framework could project the components of the last planperiod's consumption with different growth rates. Thus, as post-terminalconsumption levels increase, a faster growth could be registered for moreincome-elastic components. The particular approach taken was chosenfor its computational simplicity in the early stages of the research.
The extrapolation of imports is also based on a distribution that is en-dogenously determined in the last planning period. This is convenientbecause the post-terminal path itself has no built-in optimizing mecha-nism for the determination of choice variables, and the alternative pro-

Planning in India 323
cedure would be an arbitrary allocation of foreign exchange. Since im-ports as well as exports are projected at given growth rates over theentire post-terminal path, the post-terminal levels of foreign aid (or long-term capital flows) must be residually determined if a balance-of-pay-ments relationship is to be satisfied. Whether the need for aid increasesor decreases in the post-terminal period depends on the absolute amountof the deficit in the terminal year as well as on the growth rates at whichexports and imports are projected post-terminally. Since exports and for-eign aid are exogenously stated for the planning period itself, a stipula-tion of the post-terminal growth rates of exports and imports is sufficientto know whether the requirement for aid will increase or fall post-terminally.
The other nonhomogeneous elements, i.e., government demand anddepreciation, do not require explanation. Both of these are exogenouslystipulated already for the plan period. The projection of governmentdemand is exogenous for the post-terminal period also. Since the modelcannot decide for the post-terminal period what proportion of actualdepreciation to replace, the terminal period's level of replacement isprojected.
As mentioned earlier, (23) provides the sum of the particular solu-tions corresponding to the nonhomogeneous elements discussed above..Equation (23) expresses the post-terminal sectoral output levels re-quired to sustain the stipulated rates of growth as a function of thenonhomogeneous components from which the required terminal capaci-ties can readily be calculated with the help of the sectoral capital-outputratios. Again, because of the investment lag structure, the post-terminaloutput levels and capacity requirements must be determined for the firstthree post-terminal time periods.
The statement of the terminal conditions completes the system. Thesolution is obtained by maximizing the objective function, i.e., thepresent discounted value of the consumption stream over the plan period,subject to all the constraints. Given the parameters of the constraints,there will be a different solution for each specified rate of discount orcorresponding set of W(t). These solutions will be at vertices of thefeasible region in the consumption space defined by the intersection ofthe given sets of constraints. Of course, there may be different feasibleregions corresponding to different selections of the parameters of theconstraints. By varying the discount rate in combination with the pa-rameters of the constraints it is possible to derive all portions of thesocial production feasibility surfaces which are relevant for economicplanning. Of course, of the multifold infinity of possibilities, only the

324 Planning in Individual Countries
consequences of those changes in parameters which can be controlledby economic policymakers and which are likely to be descriptive ofchanges in the real economy will be interesting.
The solution is accompanied or sustained by a set of shadowprices which are the choice variables of the dual-minimum problem.Since the sectoral capacities and the supply of foreign exchange arethe only scarce resources in the system, the dual problem consists ofimputing those rents to the use of capacities and for the use of for-eign exchange which exhaust the value of the total product as wellas minimize the cost of production. The shadow price of foreign ex-change must always be positive, since imports can always be used toincrease the value of the maximand at some time. The shadow pricesor rents of capacities will be positive or zero depending on whether thecapacities of particular sectors are fully or only partially utilized. Be-cause of arbitrary initial conditions as well as other rigidities such asthe fixed composition of the consumption good, it is not surprising thatexcess capacity should exist in some time periods. Though the rentscorresponding to these capacities will be zero on such occasions, therespective outputs will still be positively priced as long as their produc-tion requires inputs of scarce commodities. If all sectors deliver inter-mediate goods to all other sectors it follows that none of the outputs canhave a zero shadow price even if all capacities but one are redundant.
The shadow price of a given sectoral output in any one time periodcannot be greater than the cost of producing a unit. Neither can thearbitrarily stipulated weight or market price of the composite consump-tion good exceed the cost of those current outputs which are required to
make up a market basket. In other words, W(t), where
is the proportion of the output of sector i needed to make up a unitof composite consumption good, and is the shadow price of the good.When the inequality holds, the cost of putting together a market basketwill exceed its current worth, and production for consumption will not takeplace. When, on the other hand, the equality holds, part of the sectoraloutputs will be used for providing consumer goods. Since the relation-ship between the W's of adjacent time periods embodies the socialdiscount factor, the shadow prices of the commodities are correspond-ingly also discounted over time. Though the shadow prices are theanalognes of competitive market prices, they cannot be adopted forthe actual market implementation of a plan. They refer to broad ag-gregates rather than specific commodities; hence they can serve only asindicators of the relative scarcities of a composite output of each sector.
Planning in India 325
Moreover they reflect the particular constraints of the model. For ex-ample, the shadow price that corresponds to the balance-of-paymentsconstraints is a shadow rate of foreign exchange but one which reflectsthe import constraints. If the balance-of-payments constraint is expressedin domestic currency then it will indicate what the current domesticvalue of a unit worth of foreign exchange converted at some constantexchange rate should be in any one time period. The foreign exchangeshadow price will not, however, reflect its value to sectors whose demandfor foreign exchange is arbitrarily limited by the constraints on speciali-zation of use of foreign exchange. In these sectors the value of foreignexchange will be greater than the dual price associated with the over-allforeign exchange constraint.
Each solution generates a complete specification period by period ofthe uses of resources for various types of production and the flows ofgoods to various uses all of which are consistent with the constraintsand optimize the objective function. In this paper the time paths of out-puts and inputs generated by the model will not be emphasized. Atten-tion will be concentrated on the terminal-year output levels and certainover-all characteristics of the solution, recognizing that they are sup-ported by a feasible and consistent set of resource allocations in eachperiod.
Description of the DataOne of the crucial problems in implementing planning models is thatof matching the information requirements of the theoretical frameworkswith the limited data which are practically available. Many of the com-promises which have been made between a more sophisticated theoreticalstructure and the practical formulation of the planning model have beendue to limitations in data. In a number of cases the compromises havebeen necessary because the work has been carried Out in a contextremoved from original sources of data and actual planning activities.
Thç Indian Third Five-year Plan period provides the basic settingfor the numerical implementation of the model. The structure of theeconomy reflected in most of the calculations is intended to be that ofIndia at the beginning of the Third Plan period. The magnitudes chosenfor the exogenous elements in the models are based on Indian conditionsexpected to prevail during the plan.'9
19 The alternative computations which will subsequently be compared are allbased on the same set of data and statistical assumptions. Hence, whatever theweaknesses of the data, I do not believe they detract from the strength of thequalitative comparisons.

326 Planning in Individual Countries
The numerical solutions remain hypothetical exercises. Though astrenuous attempt has been 'made to provide realistic data, assumptionsof convenience have been made in estimating parameters which wouldnot be tolerable if the purpose of calculations were to make specificplans for India rather than to gain general, order-of-magnitude in-sights. In particular, I should like to emphasize that I do not presumeto be laying down guidelines for Indian policymakers. The empirical re-sults are intended to be illustrative rather than definitive.
It should also be emphasized that the numerical estimates presentedare all based on secondary and public sources. No special data collectionactivities have been undertaken for the purpose of the computationsdescribed below, although officials of the government of India, especiallyin the Planning Commission, and members of the Indian Statistical Insti-tute have cooperated most generously.2° Thus, all the information usedfor the empirical implementation of the model is an adaptation of dataoriginally designed to serve other purposes, but it does appear to con-form to those on which Indian planning was based.
PRODUCTION DATA
As indicated in the description of the models the Leontief input-output assumptions of "fixed coefficients" of production have beenadopted to describe production conditions. The production data withwhich the model is provided are a set of ratios for each sector. Theseratios indicate for each type of use of a sector's outputs the inputs whichare required. The ratios can be changed exogenously from period toperiod and from one solution to the next. However, the models are notprovided with technological alternatives from which to make a choice.The general structure and logic of input-output tables have been dis-cussed in detail elsewhere 21 so that only a brief description will be givenhere of the tables used and of the adjustments which have been made inthem. For complete and detailed descriptions of the tables it is necessaryto apply to the original sources.
THE CURRENT-FLOW MATRICES
The first input-output flow tables for India were prepared for themiddle 1950s in the Indian Statistical Institute in Calcutta. Some origi-nal numerical experiments were made using an expanded version of
20 I am particularly indebted to Professor Alan Manne for his explanations ofthe background of the data in whose preparation he was a major collaborator.
21 W. Leontief e a!., Studies in the Structure of the American Economy, NewYork, 1953.

Planning in India 327
these original tables prepared by Ashish Chakravarti, now of the IndianStatistical Institute, Delhi. However, in early 1964, two new input-output tables became available for. 1959—60. One, issued by the IndianStatistical Institute, Delhi, and referred to here as the I.S.I. table, wasprepared under the direction of Dr. A. Rudhra and with the cooperationof Professor A. S. Manne of Stanford University, who was then a mem-ber of the India Project of the Center for International Studies, M.I.T.The second table was estimated in the Inter-Industry Study Group ofthe Planning Commission under the direction of Dr. K. S. Khrisnaswamy,chief, Economic Growth Section, and will be referred to here as theI.S.G. table. Inasmuch as somewhat more information as well as othersupporting data was currently available for the I.S.I. table as comparedto the I.S.G. table, the former has been used in the computational trials.
The 1959—60 I.S.I. table which has been used is basically that pre-sented in Notes on Perspective of Development, India: 1960—61 to1975_76.22 It is a thirty-sector table with inputs valued at producers'prices. The final uses of output are for the household, government, andexport sectors, for stock (inventory), gross fixed capital formation, andothers, a miscellaneous sector. In addition to the inputs of the inter-mediate producing sectors, wages and salaries, gross profit, and marginsare distinguished. The latter includes, wholesale and retail trade marginsand indirect taxes and subsidies. In this table only five sectors producefixed capital: the urban and rural construction sectors and the electrical,transport, and nonelectrical equipment sectors. Such industries as ce-ment, iron and steel, and nonferrous metals, rather than supplying out-puts directly for fixed capital formation deliver to the construction sectorwhich in this table is a processing rather than service industry. It re-ceives such inputs, processes them, and delivers fixed capital.
Many of the special features of the I.S.I. table have been suppressed,and it has been modified in several ways consistent with the objectiveof developing a technique of general applicability and to reduce corn-putational requirements.23 Although the thirty-one sectors of the I.S.I.
22 Perspective Planning Division, Planning Commission, April 1964, Pp. 183—87.23 In several sectors there was a negative input entered in the miscellaneous
"others" sector as an aggregative correction to overestimation of inputs toother sectors. These negative inputs were eliminated by allocating them amongthe other inputs of the sector using the proportions of the positive inputs as aguide. The undistributed inputs of the rail and motor transport sections were al-located using the proportions from the I.S.G. table.
Another major change in the IS.!. table was the creation of a residentialhousing sector, which provides rental services. This sector constitutes approxi-mately 7 per cent of the consumer budget; it is also the sector with the largestcapital-output ratio. The original experiments with the 1955—56 I.S.I. table rein-

328 Planning in individual Countries
table already represent a high degree of aggregation, preliminary trialsindicated that further aggregation was necessary in order to accommo-date the model to the available computational capacity. Unfortunately,this aggregation could not be done in a way which would both satisfytheoretical criteria and avoid bias and misrepresentation.24 This is dueto the lack of empirical knowledge which the criteria require and theprevious aggregation which has already been done on a theoretically un-satisfactory basis. Further aggregation to eleven sectors was carriedout, and Table 1 presents the revised 1959—60 I.S.I. table on an eleven-sector basis as used in the empirical experiments.
THE FIXED CAPITAL FORMATION RELATIONSHIPS
Capital is one of the two scarce factors, and its formation is the majorsource of growth in the planning models described above. This does notrepresent a refusal to grant the importance of natural resources orlabor inputs or changes in technology. The obstacles to an explicit treat-ment of factors other than capital are partly analytical, partly computa-tional and partly owing to the lack of adequate empirical information. Itwould, for example, require only a slight elaboration of the theoreticalstructures of the model in order to treat labor as if it were a capital fac-tor formed by education, health services, and similar inputs. That, how-ever, would not be completely satisfactory from a theoretical viewpoint,nor are there corresponding empirical relationships which are reason-ably well established.
The capital formation relationships are a kind of modffied accelera-tion principle with a detailed breakdown of sectoral inputs. There is arich literature on the theoretical issues raised by such coefficients, andthere is no point in summarizing it here. The use of the related aggregate
forced the view suggested by these characteristics that over-all results would besensitive to the size and growth rate for this sector. It was, therefore, decided toisolate residential housing from the miscellaneous "others" sector. In order toconstruct a residential property row, it was assumed that this sector delivers onlyto private consumption, and the amount of the delivery was the 520 crores ofrupees estimated as the output of the sector in the official national income ac-counts. This amount was subtracted. from the delivery of the "others" sector toprivate consumption. The residential housing column was formed by allocatingthe row total among the input sectors, using the relevant coefficients of the 1955—56 I.S.I. input-output table.
The "others" sector was made into a producing sector receiving inputs as indi-cated by its column vector. For the corresponding row vector the margin rowwas consolidated with the others row. This treatment of margins was done to con-form to the usual practice for wholesale and retail trade.
24 for example, A. A. Waters, "Production and Cost Functions: An Econ-ometric Survey," Econometrica, lanuary—April 1963, pp. 5—11.

TA
BL
E 1
Rev
ised
1.S
.I. I
nput
-Out
put C
oeff
icie
nt M
atri
x
12
34
56
78
910
11
1.A
gric
ultu
re a
nd p
lant
atio
ns.0
80.0
00.0
17.0
51.1
31.5
05.0
00.0
00.0
43.0
00.0
352.
Min
ing
and
met
als
.000
.208
.231
.025
.052
.004
.131
.041
.146
.005
.001
3.E
quip
men
t.0
00.0
20.0
37.0
16.0
03.0
03.0
00.0
00.0
16.0
00.0
004.
Che
mic
als
and
fert
ilize
rs.0
10.0
20.0
37.1
99.0
81.0
28.0
28.1
85.0
08.0
00.0
03
5.C
emen
t, gl
ass,
and
woo
d.0
00.0
11.0
05.0
11.0
25.0
03.
.000
.000
.221
.015
.000
6.Fo
od a
nd c
loth
ing
man
ufac
ture
s.0
08.0
02.0
02.0
34.0
18.0
57.0
00.0
00.0
00.0
00.0
017.
Ele
ctri
cal g
ener
atio
n.0
01.0
23.0
13.0
16.0
22.0
13,0
00.0
04.0
00.0
00.0
018.
Tra
nspo
rtat
ion
.007
.145
.073
.098
.070
.049
.118
.042
.026
.007
.021
9.C
onst
ruct
ion
.000
.000
.000
.000
.000
.000
.000
.000
.000
.000
.026
10.
Hou
sing
.000
.000
.000
.000
.000
.000
.000
.000
.000
..0
00.0
00
11.
Oth
er a
nd m
argi
n.0
05.0
28.1
35.0
32.0
89.0
55.0
68.0
17.1
07.0
45.0
00
Tot
al.1
11.4
58.5
50.4
80.4
91.7
18.3
46.2
88.5
67.0
71.0
87

330 Planning in Individual Countries
capital-output ratios for projections is well known and also much dis-cussed. As with so many aspects of computable multisectoral models,credit should be given to W. Leontief and his associates for theirpioneering work on the structure of capital.25
Although the empirical information necessary to fill in the capitalcoefficients matrix is far from satisfactory, a substantial amount of datais available. With some major exceptions the quality of information ofthis type for less developed countries such as India may be superiorto that for more developed economies. The relatively small size of manyof the modern sectors, as well as the extent and variety of reporting re-quired for the implementation of various government regulations, shouldfacilitate the estimation of sectoral marginal capital coefficients. Themajor exceptions are in agriculture and the traditional services andhandicrafts which bulk large in the economy. In these sectors there isno simple and reliable relation of capital accumulation to capacitychanges. These sectors could have been treated exogenously in ourmodels and in a real planning application might be handled best in thatway. Consistent with the experimental approach adopted here, thesesectors have been put on the same basis as other sectors, with calcula-tions being made for alternative estimates of their capital-output ratios.
In order to carry out the first trial computations on the alternativemodels with a plausible set of numbers a complete matrix of capitalcoefficients for India was first estimated in the Center for InternationalStudies, M.I.T. This had to be done in an extremely rough way, but allthe various sources of information publicly available were used. TheIndian Third Five-year Plan and various studies of the Indian PlanningCommission were the most important of these. In 1964 a new matrixof capital coefficients was estimated in the Indian Statistical Institute,New Delhi, by Vinod Prakash. These estimates appear to have beenbased on many of the same sources as well as other information notpublicly available. A comparison of the two capital-coefficient matricesshowed considerable agreement. The Prakash matrix was used as thebasis of most of the computations as the most recently availableauthoritative estimates. The original capital-coefficient matrix was usedto obtain additional detail beyond that available in the Prakash capitalcoefficients and as a source of the alternative estimates of capital re-quirements used in our sensitivity analyses. Since the Prakash estimateswere presented in the thirty-one-sector detail of the 1959—60 I.SI. matrix,
25 Studies in the Structure of the American Economy.

Planning in India 331
they were also aggregated using the 1959 output levels as weights. Table2 indicates the aggregate capital-output ratios for each sector.
In the model described there is scope for presenting some detail ofthe capital gestation process. The next step in data preparation, there-fore, was the disaggregation of the capital matrix by periods. The exist-ence of gestation periods of varying lengths is a major source of theproblems of coordinating the growth of different sectors in develop-ment programs. In addition, since in the less-developed regions delays
TABLE 2
Aggregate Capital-Coefficient Matrix
Adapted from I.S.I. Estimates
Agriculture and plantations 1.51
Mining and metals 2.42Equipment 0.91Chemicals and fertilizers 0.88Cement, glass, and wood 0.89Food and clothing manufactures 0.55Electrical generation 6.26Transportation 2.22Construction 0.15Housing 10.00
Other and margin 0.15
in making capital effective have a particularly high cost, it is importantto be able to analyze such delays. In India there has been particular con-cern expressed over this problem of planning. On the other hand, pub-lished empirical information about the gestation periods of capital proj-ects is relatively scarce both for developed and less-developed regions.There is a substantial body of informed comment, moreover, which holdsthat gestation periods in the more-developed countries are quite differ-ent from practices prevailing in the less-developed areas, but there isrelatively little organized information. Although the existence of severalstudies of the time patterns of capital creation indicates the feasibilityof such investigations, the secondary sources now available are com-pletely inadequate for this purpose, and no independent estimation wasattempted. In these circumstances a simple arbitrary pattern which
332 Planning in Individual Countries
could easily be modified as more information became available wasadopted to represent the gestation process. It was assumed that in orderto achieve an increment of capacity in period t one-third of the totaleventual contribution of the construction sector had to be forthcomingin each of three preceding periods. For the contribution of the equip-ment-producing sectors it was assumed that one-half of the total require-ments had to be provided in each of two periods preceding the periodin which capacity was to become effective. With these assumptions thematrices showing proportions of total requirements supplied by eachsector at period t for investment in every other sector which will maturein periods t + 1, t + 2, and t + 3 were estimated for India for the1960s, as shown in Tables 3, 4, and 5, respectively.
THE INVENTORY INVESTMENT RELATIONSHIPS
Although in some cases there may be technical requirements whichput close limits on inventories, in most sectors the stock-holding deci-sions are subject to a variety of influences whose net effect, in developedcountries at least, is a particularly volatile type of behavior. The pat-terns of inventory-holding in the less-developed areas have not beenstudied intensively, however, and relatively little empirical informationis available. Such information is notoriously difficult to collect, and thestatistical reporting systems of these areas have not been able to coverthis aspect of investment in a thorough and continuous manner. Somedata which do exist suggest that inventory accumulation may be a rela-tively more significant part of total investment in less-developed areasthan in advanced countries, however. The limitations of transport andcommunications and other uncertainties associated with deliveries wouldcontribute to such a pattern.
The assumptions behind the inventory investment relations whichhave been used are that a certain ratio of inventories to output is main-tained in each sector and that the proportions in which the individualsectors contribute to these inventories are fixed. These lead to theinventory accelerator relationships and for implementation require theprojection of inventory-output ratios. An initial source of informationused to implement these assumptions was the matrix of coefficientsestimated for India by Mr. Chakravarti. The aggregate ratios in thistable were compared with separate estimates prepared by ProfessorA. K. Sen.26 These sources of information were complemented withscattered data more recently available. The matrix of inventory coeffi-
26 "Working Capital in the Indian Economy: A Conceptual Framework andSome Estimates," Pricing and Fiscal Policies, pp. 125—46.

TA
BL
E 3
Prop
ortio
ns o
f T
otal
Req
uire
men
ts f
or I
nves
tmen
t in
Eac
h Se
ctor
Sup
plie
d by
Eac
h Se
ctor
at P
erio
d t t
o M
atur
e in
Per
iod
t +I
12
34
56
78
910
11
3.E
quip
men
t.0
69.2
48.2
58.2
45.2
22.3
14.4
42.3
27.0
00.1
609.
Con
stru
ctio
n.2
82.1
47.1
39.1
49.1
66.0
97.1
81.0
00.0
87.3
33.2
1311
.O
ther
and
mar
gin
.009
.032
.034
.032
.029
.041
.026
.057
.042
.000
.021
Tot
al.3
59.4
27.4
31.4
25.4
17.4
52.4
09.5
00.4
56.3
33.3
93
TA
BL
E 4
Prop
ortio
ns o
fT
otal
Req
uire
men
ts f
or I
nves
tmen
tin
Eac
h Se
ctor
Sup
plie
d by
Eac
h Se
ctor
at P
erio
d t t
o M
atur
e in
Peri
od t
+2
12
34
56
78
910
11
3.E
quip
men
t.0
69.2
48.2
58.2
45.2
22.3
14.2
02.4
42.3
27.0
00.1
609.
Con
stru
ctio
n.2
82.1
47.1
39.1
49.1
66.0
97.1
81.0
00.0
87.3
33.2
1311
.O
ther
and
mar
gin
.009
.032
.034
.032
.029
.041
.026
.057
.042
.000
.021
Tot
al.3
59.4
27.4
31.4
25.4
17.4
52.4
09.5
00.4
56.3
33.3
93

TA
BL
E 5
Prop
ortio
ns o
f T
otal
Req
uire
men
ts f
or I
nves
tmen
t in
Eac
h Se
ctor
Sup
plie
d by
Eac
h Se
ctor
at P
erio
d t t
o M
atur
e in
Per
iod
t +3
12
34
56
78
910
11
3.E
quip
men
t.0
00.0
00.0
00.0
00.0
00.0
00.0
00.0
00.0
00.0
00.0
009.
Con
stru
ctio
n.2
82.1
47.1
39.1
49.1
66.0
97.1
81.0
00.0
87.3
33.2
1311
.O
ther
and
.000
.000
.000
.000
.000
.000
.000
.000
.000
.000
.000
Tot
al.2
82.1
47.1
39.1
49.1
66.0
97.1
81.0
00.0
87.3
33.2
13

Planning in India 335
cients finally used, however, was based on the I.S.I. input-output tableand is presented in Table 6.
DEPRECIATION
The manner in which the productive capacity of capital stock dimin-ishes with time and use undoubtedly varies both with the type ofcapital and the purposes for which it is employed. These differencescould not be taken into account at the level of detail at which thesemodels are cast. Instead, as in other cases, a convention was adoptedwhich would not unduly complicate the models while providing a firstapproximation to the effects of depreciation. The time pattern of decaywas assumed to be that in which each unit of capital maintains its origi-nal productivity over its complete lifetime.
The operating life of many types of capital is twenty to twenty-fiveyears or more, which is substantially longer than the planning horizonof the short-term models. The pattern of capital decay chosen for themodel means, therefore, that depreciation is exogenous to the planperiod, being determined by the investment which took place in yearsprevious to the start of the plan. With this approach it became necessaryto estimate investment during the early postwar years for which rela-tively little statistical information existed. The actual amounts of depre-ciation specified exogenously for the five-year model starting in 1960—61are shown in Table 7,27 Since there was relatively little investment inthe 1940s, the assumption of a constant amount of replacement require-ments in each period was considered not unrealistic. The replacementrequirements to restore the depreciated capacity are shown in Table 8;and the proportions for restoring depreciated capacity, in Tables 9, 10,and 11.
IMPORTS
It is desirable to provide empirical information on the basis of whichthe planning models can assist in decisions on the type and quantityof goods to import rather than produce domestically. For this purpose, itis important to distinguish noncompetitive imports from competitiveimports. The former are imports for which no domestic capacity existsor can be created, while the latter represent sectors for which a "makeor buy" decision is relevant. Strictly speaking, noncompetitive imports
27 These estimates are different from those used in the initial version of thispaper. Re-examination indicated those initial estimates were likely to be sub-stantially too low and it appeared to be preferable to accept the I.S.I. estimates.As will be pointed out below, this change has had significant effects on the ThirdPlan Target solutions in particular.

TA
BL
E 6
Mat
rix
of I
nven
tory
Coe
ffic
ient
s
12
34
56
78
910
11
1.A
gric
ultu
re a
nd p
lant
atio
ns.3
15.0
00.0
22.0
29.0
94.2
92.0
00.0
00.0
07.0
00.0
072.
Min
ing
and
met
als
.001
.140
.248
.018
.036
.002
.106
.011
.023
.000
.000
3.E
quip
men
t.0
00.0
38.0
44.0
52.0
02.0
02.0
00.0
00.0
03.0
00.0
004.
Che
mic
als
and
fert
ilize
r.0
40.0
12.0
45.3
77.0
58.0
17.0
23.0
08.0
01.0
00.0
015.
Cem
ent,
glas
s1 a
nd w
ood
.002
.012
.007
.007
.018
.002
.000
.000
.035
.000
.000
6.Fo
od a
nd c
loth
ing
man
ufac
ture
s.0
31.0
04.0
03.0
22.0
12.0
39.0
00.0
00.0
00.0
00.0
007.
Ele
ctri
cal g
ener
atio
n.0
04.0
33.0
15.0
24.0
16.0
08.0
00.0
01.0
00.0
00.0
008.
Tra
nspo
rtat
ion
.000
.000
.000
.000
.000
.000
.000
.000
.000
.000
.000
9.C
onst
ruct
ion
.000
.000
.000
.000
.000
.000
.000
.000
.000
.000
.000
10.
Hou
sing
.000
.000
.000
.000
.000
.000
.000
.000
.000
.000
.000
11.
Oth
er a
nd m
argi
n.0
00.0
00.0
00.0
00.0
00.0
00.0
00.0
00.0
00.0
00.0
00
Tot
al.3
93.2
40.3
84.5
28.2
37.3
61.1
29.0
20.0
68.0
08

TA
BL
E 7
Dep
reci
ated
Cap
acity
by
Sect
ors
(rup
ees
cror
es)
1962
-63
1963
-64
1964
-65
1965
-66
1966
-67
1967
-68
1968
-69
Agr
icul
ture
and
pla
ntat
ions
277.
4009
281.
6406
285.
8804
290.
1202
294.
3599
298.
9025
303.
4451
Min
ing
and
met
als
71.4
057
72.4
970
73.5
884
74.6
798
75.7
711
76.9
404
78.1
097
Equ
ipm
ent
16.0
887
16.3
346
16.5
804
16.8
263
17.0
722
17.3
357
17.5
992
Che
mic
als
50.7
788
51.5
549
52.3
3 10
53. 1
071
53.8
832
54.7
147
55.5
462
Cem
ent,
glas
s, a
nd w
ood
16.1
588
16.4
058
16.6
527
16.8
997
17.1
467
17.4
113
17.6
759
Food
and
clo
thin
g m
anuf
actu
res
32.7
314
33.2
316
33.7
319
34.2
322
34.7
324
35.2
684
35.8
044
Ele
ctri
city
48.3
195
49.0
581
49.7
966
50.5
351
51.2
736
52.0
648
52.8
561
Tra
nspo
rtat
ion
84.5
926
85.8
855
87. 1
784
88.4
7 13
89.7
642
91.1
494
92.5
347
Con
stru
ctio
n1.
5697
1.59
361.
6176
1.64
161.
6656
1.69
131.
7170
Hou
sing
186.
8442
189.
6999
192.
5556
195.
4113
198.
2670
201.
3266
Oth
er a
nd m
argi
ns13
6.82
7713
8.91
8914
1.01
0214
3. 1
015
145.
1927
147.
4333
149.
6740

TA
BL
E 8
Rep
lace
men
t Req
uire
men
ts b
y Se
ctor
s
(rup
ees
cror
es)
1962
-63
1963
-64
1964
-65
1965
-66
1966
-67
1967
-68
1968
-69
Agr
icul
ture
and
pla
ntat
ions
143.
6563
145.
8519
148.
0475
150.
2431
152.
4388
154.
7912
157.
1437
Min
ing
and
met
als
65.8
512
66.8
577
67.8
642
68.8
706
69.8
771
70.9
554
72.0
338
Equ
ipm
ent
14.6
194
14.8
428
15.0
662
15.2
897
15.5
131
15.7
525
15.9
919
Che
mic
als
47.9
160
48.6
483
50.1
130
50.8
453
51.6
300
52.4
146
Cem
ent,
glas
s, a
nd w
ood
13.0
896
13.2
897
13.4
898
13.6
898
13.8
899
14.1
042
14.3
186
Food
and
clo
thin
g m
anuf
actu
res
30.2
738
30.7
365
31.1
992
31.6
619
32.1
246
33.1
161
Ele
ctri
city
40.5
330
41.1
525
42.3
915
43.0
110
43.6
747
44.3
385
Tra
nspo
rtat
ion
84.5
926
85.8
855
87.1
784
88.4
713
89.7
642
91.1
494
92.5
347
Con
stru
ctio
n1.
2641
1.28
341.
3027
1.34
141.
3621
1.38
28H
ousi
ng18
6.82
7418
9.68
2819
2.53
8219
5.39
3719
8.24
9120
1.30
8520
4.36
79O
ther
and
mar
gins
134.
1757
136.
2264
138.
2771
140.
3278
142.
3786
144.
5758
146.
7730
Tot
al91
6.00
0093
0.00
0094
4.00
0095
8.00
0097
2.00
0096
7.00
001,
002.
0000

TABLE 9
Proportions
for
Res
tori
ng D
epre
ciat
ed C
apita
l in
Peri
od t
+1
1.2
34
56
78
910
11
3.E
quip
men
t.0
00.0
00.0
00.0
00.0
00.0
00.0
00.0
00.0
00.0
00.0
009.
Con
stru
ctio
n.2
33.1
30.1
19.1
38.1
26.0
77.2
16.0
00.0
27.3
33.2
1711
.O
ther
and
mar
gins
.000
.000
.000
.000
.000
.000
.000
.000
.000
.000
.000
Tot
al.2
33.1
30.1
19.1
38.1
26.0
77.2
16.0
00.0
27.3
33.2
17
TA
BL
E 1
0.
Prop
ortio
nsfo
r R
esto
ring
Dep
reci
ated
Cap
ital
inPe
riod
t +
2
12
34
56
78
910
11
3.E
quip
men
t.1
33.2
69.2
84.2
59.2
75.3
39.1
56.4
42.4
06.0
00.1
549.
Con
stru
ctio
n.2
33.1
30.1
19.1
38.1
26.0
77.2
16.0
00.0
27.3
33.2
1711
.O
ther
and
mar
gins
.017
.035
.038
.034
.036
.045
.021
.057
.054
.000
.020
Tot
al.3
83.4
35.4
41.4
31.4
37.4
61.3
92.5
00.4
87.3
33.3
91

TA
BL
E 1
1
Prop
ortio
ns f
or R
esto
ring
Dep
reci
ated
Cap
ital i
n Pe
riod
t +
3
12
34
56
78
910
11
3.E
quip
men
t.1
33.2
69.2
84.2
59.2
75.3
39.1
56.4
42.4
06.0
00.1
549.
Con
stru
ctio
n.2
33.1
30.1
19.1
38.1
26.0
77.2
16.0
00.0
27.3
33.2
1711
.O
ther
and
mar
gins
.017
.035
.038
.034
.036
.045
.021
.057
.054
.000
.020
Tot
al.3
83.4
35.4
41.4
31.4
37.4
61.3
92.5
00.4
87.3
33.3
91

Planning in India 341
cannot be fitted within the classification scheme for the domestic econ-omy, and recognition of each type would require creation of a separatesector. Likewise, the requirements for each type of noncompetitiveimport should be related separately to its uses in the producing or finaldemand sectors. The treatment of competitive imports should providefor the decision between domestic production or import and take intoaccount the changing basis for such decisions as domestic capacitychanges.
A rigorous distinction of competitive and noncompetitive imports andthe adjustment of import requirements with the development of domesticcapacity was not possible within the limitations of the model structure,computational capacity, and data availability. Noncompetitive importswere treated as fixed fractions of the total output of the sectors in whichthey were assigned. The ratios of noncompetitive imports to outputwere calculated from the I.S.G. matrix mentioned above and used asnoncompetitive import coefficients. Table 12 lists these coefficients bysector.
As noted previously, in order to handle competitive imports withinthe model structure, ceilings were set on the use in each sector of theforeign exchange left over after the satisfaction of noncompetitive importneeds. These ceilings were in the form of ratios to sectoral output ofuncommitted foreign exchange. The ratios were based on the import in-formation in the I.S.I. and I.S.G. tables, with some adjustments based
TABLE 12
Import Coefficients by Sector
Noncompetitjve Competitive
Agriculture and plantations .01600 .301Mining and metals • 14500 . 199
Equipment, .23500 .348Chemicals and fertilizer .26100 .162Cement, glass, and wood .00400 .020Food and clothing manufactures .00008 .027Electrical generation .00000 .000Transportation .00000 .000Construction .00000 .000Housing .00000 .000Other and margin .00000 .020

342 Planning in Individual Countries
on judgment as to the sectors in which government policy would bemore or less restrictive in permitting import substitution for domesticproduction. These ratios are shown in Table 12.
EXPORTS
The exogenous treatment of this use of output is justified on theargument that the satisfaction of foreign demands is not affected bydomestic policy. This is only partly true, of course. Export duties orsubsidies and exchange rate policy can certainly change relative prices,but these influences are not within the structure of the model in anycase. Although for most of the major export sectors the domestic use ofoutput is not a major alternative, the choice between exporting andusing output domestically is significant for a number of sectors. No at-tempt was made to bring this choice within the framework of the modeleither, although it might be possible to do so in some cases.
The practical problem is the choice of methods for extrapolation ofexports in each sector. The technique used here is a simple one. Theinitial level of exports was estimated from preplan years, and an aver-age growth rate was projected for all exports. This is an arrangementof convenience which could be refined. The export levels projected arelisted for each sector in Table 13.
TABLE 13
Export Levels Projected for the Third Plan Period
(rupees crores)
1960-61 1962-63 1963-64 1964-65 1965-66
Agriculture and plantations 198.188 206.370 214.552 223.037 231.826Mining and metals 40.090 41.745 43.400 45.117 46.894Equipment 4.336 4.515 4.694 4.880 5.072Chemicals and fertilizer 15.088 15.711 16.334 16.980 17.649
Cement, glass, and wood 2.793 2.908 3.023 3.143 3.267Food and clothing manufactures 215.656 224.560 233.463 242.696 252.259Electrical generation 0.0 0.0 0.0. 0.0 0.0Transportation 0.0 0.0 0.0 0.0 0.0Construction 0.0 0.0 0.0 0.0 0.0Housing 0.0 0.0 0.0 0.0 0.0Other and margin 177.836 185. 178 192.519 200. 133 208.019
Total 645.000 681.000 708.000 736.000 765.000

Planning in India 343
TABLE 14
Government Expenditures by Sector
(rupees crores)
1961-62 1962-63 1963-64 1964-65 1965-66
Agriculture and plantations 0.0 0.0 0.0 0.0 0.0Mining and metals 0.0 0.0 0.0 0.0 0.0Equipment 97.596 101.204 104.993 108.601 112.209Chemicals and fertilizer 28.402 29.452 30.555 3 1.605 32.655Cement, glass, and wood 0.0 0.0 0.0 0.0 0.0Food and clothing manufactures 109.120 113. 154 117.389 121.423 125.457Electrical generation 4.923 5.105 5.296 5.478 5.660Transportation 0.0 0.0 0.0 0.0 0.0Construction 108.200 112.200 116.400 120.400 124.400Housing 0.0 0.0 0.0 0.0 0.0Other and margin 192.758 199.884 207.367 214.493 221.6 19
Total 541.000 56 1.000 582.000 602.000 622.000
GOVERNMENT
The government sector in the planning models is assumed to consistentirely of "public consumption," so resources delivered for this pur-pose do not contribute to productive capacity nor act as intermediateinputs to producing sectors. Again there is a substantial literature onthe extent to which these assumptions are justified for various typesof expenditure, and so the issues will not be reviewed here. The prob-lem becomes one of finding a reasonable basis on which to project anexogenous sector.
Considerable detail is available on the uses of funds in the budgetsof the union government and less detail for the state government budgets.For neither type of budget was it possible to find the detail on functionreclassified according to types of inputs used. The I.S.I. table providessuch a breakdown in the year for which it was estimated. With this in-formation and the Third Plan projections to aid in establishing growthrates, future deliveries to the government sector were estimated exog-enously. Table 14 presents these estimates.
FOREIGN AID
This is truly an exogenous element. For the purpose of the basicmodel net annual foreign aid was set at $500 million. As noted above,

344 Planning in Individual Countries
the allotment of foreign aid on an annual basis will lead to differentresults than specification of a total amount to be available over theentire plan in whatever annual pattern is desired.
CONSUMPTION
The models require specification of the proportions in which the totalconsumer budget is allocated among the outputs of the producing sec-tors. These proportions in actuality depend on the incomes achieved andthe patterns of relative prices and the price and income elasticities asso-ciated with the products of the various sectors. In this case the con-straints of the analytic framework are more severe than the data con-straints. Estimates of price and income elasticities are available for manyof the sectors, especially the more significant ones, though there arehigh levels of variance associated with the estimates, and for some sec-tors there is almost no information. On the assumption that, for sectorsdefined as grossly as those in this paper, consumption proportions wouldnot change markedly in a short period, the distribution of consumptionwas specified in advance.
For the purposes of the models computed here initial consumptionproportions were calculated from the I.S.I. transactions tables for1959—60. These are shown in Table 15.
INITIAL CAPACITY AND UNCOMPLETED CAPITAL
The endowments of capital stocks with which the plan period startsare initially the only productive resources available. These endowments
TABLE 15
Consumption Proportions Based on 1959 I.S.l. Table
Agriculture and plantations .42941Mining and metals .00048Equipment .0 1471
Chemicals and fertilizer .02384Cement, glass, and wood .0050 1Food and clothing manufactures .14101Electrical generation .00087Transportation .01476Construction .00000Housing .045 16
Other and margin .32475

Planning in India 345
are the result of events in the preplan period and exogenous to the planitself. Likewise, the amounts of uncompleted capital whose constructionhad started prior to the plan period with a view to completion duringthe plan period are exogenous. A rational planning procedure would co-ordinate the end of one plan with the beginning of another. In actuality,however, the Indian five-year plans have suffered somewhat from a lackof coordination between the plans. The Third Five-year Plan, thoughreferring to projects started during the Second Plan and to be completedduring the Fourth Plan, does not provide a detailed description of thedegree of completion of such projects at the beginning of the ThirdPlan nor a detailed sectoral classification. There were no other sourcesof public data from which such information could be extracted. It wasassumed, therefore, for the purposes of our trial computations that theIndian Planning Commission had attempted to schedule investmentactivity to provide a smooth transition between the plans. The growthof capital estimated for each sector in the Third Plan was extrapolatedbackward in order to estimate the amounts of investment which wouldhave taken place in the preplan period under this assumption to achievethe desired capital formation. The capital coefficient matrices describedpreviously were used for this latter purpose. In order to establish theinitial capital stocks the sectoral output levels in the year immediatelyprior to the plan are multiplied by the aggregate capital-output ratios.These totals were then adjusted for depreciation. The capital in processat the beginning of the plan is described in terms of the maximum amountof capital which could be formed in each sector in the first and secondplan periods, as this is determined by preplan investment activity. Themajor source of information for these calculations was a report pre-pared by M. R. Saluja as part of a joint project of the Indian StatisticalInstitute and the Center for International Studies.28 It was also assumedthat all sectors were operating at full capacity in the initial period.29Table 16 presents the initial conditions as computed above. The annualavailability of foreign aid was set at five hundred crores of rupees. This,with the projected exports, determines the total availability of foreignexchange.
28 "Methods and Sources for Output Levels, 1960—61 and 1965—66," Delhi,August 1964.
29 An attempt was made to adjust for the extent of initial idle capacity in thevarious sectors, but the data were not available in a form which would makethis possible. The adjustment for less than full use of capacity in order to de-termine initial effective capital endowment is a significant one since even smallerrors here may correspond to a substantial portion of the annual amounts ofinvestment. The well-known problems of defining capacity occur in an aggravatedform in such sectors as traditional agriculture.

346 Planning in Individual Countries
TABLE 16
Preplan Output Levels and Capital in Process
(rupees crores)
PreplanOutputs
Maximum CapitalFormation in
Period 1
Maximum CapitalFormation in
Period 2
Agriculture and plantations 7577.0 798.75 825.73Mining and metals 462.0 293.24 332.02Equipment 670.5 158.49 186.67
Chemicals and fertilizer 612.5 147.68 163.60
Cement, gla8s, and wood 450.6 58.21 62.46Food and clothing manufactures 2442.0 99.83 103.53
Electrical generation 108.0 162.29 180.50
Transportation 779.0 245.51 260.58Construction 1617.0 30.76 33.89Housing 579.8 399.98 410.40Other and margin 5854.6 191.78 196.99
Analysis of the indian Third Five-year Plan PeriodThe analytic framework for planning presented above is certainly anoversimplification of the real world and the problems of economic de-velopment. Likewise, the brief description of the data inputs cannot dofull justice to their inadequacies. Yet the framework is more sophis-ticated than that of other formal models currently employed, and thedata are not substantially different from those actually in use. Formalsophistication, however, is not itself an adequate criterion for judgingplanning methods. Less sophisticated techniques may be more realisticand more flexible, for example, in not being constrained to linearity inproduction relations and other constraints and in balancing a variety ofobjectives. Fortunately a choice need not be made, and a variety of ap-proaches to economic policy can be used simultaneously and consist-ently. The scope and comparative advantage of the approach describedhere may be appreciated better after an application to the Indian ThirdFive-year Plan is described. In using the model to judge the consistency,feasibility, and optimality of the Third Plan, criteria and constraintsare applied which are believed to be reasonable. However, the caveatmust be registered that these are not necessarily the criteria and con-

Planning in India 347
straints implicit in the Third Plan itself. The issues involved in this pointwill be discussed in greater detail below.
The application is in two stages. The first application is that of theTarget Model to the exogenously specified Third Five-year Plan targets,and the results are examined for a number of alternative specificationsof parameters and constraints. Secondly, the Transit Model is solvedwith terminal conditions endogenously determined, using equations22 and 23, also for alternative parameters and constraints. The re-suits of the two types of solutions are compared, and finally an ap-praisal is attempted of the model and its results.
The full solution of the model indicates not only the value of themaxirnand but all the allocations necessary to achieve it: the capitalformation in each sector in each period, the intensity of use of capitaland foreign exchange, and the distribution of output for its various uses.The solutions will not be presented here in their full detail, but thevalues of the maximands and some of their other major features will becompared, especially the general nature of the resource uses and scarci-ties in each solution.
THE THIRD PLAN TARGET SOLUTIONS
The over-all growth rate implied in the Indian Third Five-year Planwas about 5 per cent. As one would expect, the growth rates projectedfor specific sectors varied quite substantially from this average fi'gure.Table 17 indicates the 1960 gross output levels, the projected 1965'levels, and the implied average annual growth rates for the thirty-sectordetail of the I.S.I. input-output table.3° In inspecting the table it is usefulto recall that only the construction and equipment sectors in this classi-fication are capital-creating sectors.
Growth rates can be misleading as to the relative emphasis of theplan, since the initial output levels in some cases are so low. This isthe case to some extent in both the crude oil and fertilizer sectors. Inaddition, these are levels and growth rates of gross output and do not inthemselves indicate the planned growth of the Indian economy as meas-ured by final output or capital accumulation. Yet the over-all picture is
It is difficult from the Third Five-year Plan itself to construct a detailed yetcomprehensive breakdown of sectoral targets. W. B. Reddaway in his book, TheDevelopment of the indian Economy, London, 1962, provides a substantialamount of detail as does the publication of the Planning Commission, SelectedPlan Statistics. A recent study by Saluja, "Methods and Sources for Output Levels,1960—61 and 1965—66," is the source of the data reproduced here. The otherssector is omitted, as are margins; so the total is not equivalent to gross outputof the economy.

348 Planning in Individual Countries
TABLE 17
Third-Plan Targets Compared to Preplan Output Levels
(rupees crores)
Growth RateSector 1960-61 1965-66 (average annual)
Construction, urban and industrial 1201.0 1980.0 10.5Construction, rural 416.0 436.0 0.8Electrical equipment 126.0 362.0 23.5Transport equipment 201.0 417.0 15.7
Nonelectrical equipment 343.5 888.0 20.7Iron and steel 269.0 909.0 27.6Iron ore 7.8 22.0 23.1Cement 526 88.0 10.8Other metals 32.0 80.0 20.0Other minerals 45.4 77.0 11.1Plantations 196.0 250.0 5.0Leather and leather products 189.0 220.0 3.1Animal husbandry 1130.0 1323.0 3.2Food industries 1323.0 1733.0 5.5Food grains 3751.0 4767.0 4.9
Grain milled 223.3 279.0 4.5Cotton and other textiles 800.0 1093.0 6.5Jute textiles 130.0 165.0 4.9Other agriculture 2097.0 2571.0 4.1Chemical fertilizers 20.7 166.0 51.7Glass, wooden, and nonmetallicmineral products 398.0 620.0 9.3
Forestry products 180.0 262.0 7.9Motor transport 325.0 580.0 12.3Petroleum products 237.1 659.0 22.6Crude oil 3.2 46.0 70.3Rubber products 67.5 127.0 13.5
Rubber, synthetic 17.0Chemicals 284.0 742.0 21.2Railways 454.0 640.0 7.1Electricity 103.4 286.0 22.6Coal 109.0 206.0 13.6

Planning in India 349
relatively straightforward. With the exception of fertilizers the highestgrowth rates in the table are in the capital-producing sectors, their mostimportant suppliers, and in several import-substituting sectors. The sec-tors supplying consumer goods, which in India include relatively smallamounts of consumer durables, on the whole had lower growth ratesprojected for them. The rationalization of this relative emphasis wouldpresumably be based on two related arguments. First, capital is neededto provide the means by which to increase output in the consumer goodssector, and the well-known "accelerator effect" accounts for the moierapid growth of the capital goods sector itself. Secondly, capital is alsoneeded to provide import substitutes to reduce the reliance on foreignaid and, again, the capital equipment sectors must grow more rapidlythan the sectors which they are supplying. Of course, the relative em-phasis as between capital and consumer goods production, the plannedimport substitution, and, therefore, the requirements of foreign exchangereflect decisions as to the growth rate of the economy and the distri-bution of the benefits of the growth both in the intrapian and postplanperiods.
Although aggregate projections were made in the plan itself for thepost-Third Plan period no set of detailed sectoral postplan growthrates was presented. Since short-term planning requires this specifica-tion it was assumed for the purpose of the Target Model calculations thatthe intraplan sectoral growth rates would be carried into the future. Thisamounts to saying that no substantial changes in the composition ofoutput would be expected in the early postplan years.8' Otherwise theTarget Model was solved with the data inputs given in the previous sec-tion.
For the purposes of the solution, condition (4), which specified aminimum initial level for consumption, was omitted in order to reducethe possibility of finding that all the requirements could not be met. Thischange now permits the optimization procedure to reduce the consump-tion levels in the initial plan year as low as necessary in order to meetthe consumption growth constraint of later years. The feasibility issuein this respect thus becomes one of political acceptability of the solutionunless, even with zero consumption, no economically feasible solutioncan be found.
In fact, with the specified parameters and constraints no feasible31 It should be recalled at this point that the amounts of unfinished capital
carried into the first years of the plan are set in the calculations by assuming thatthe last years of the Second Five-year Plan were phased to provide smoothgrowth of capital and output to the Third Plan targets.

350 Planning in Individual Countries
solution could be found which was consistent with the Third Plan targets.Even with the maximand reduced to zero, that is, with no consumptionat all permitted in the plan period, there was no allocation of availableresources which would meet the constraints and achieve the targets. Thepoint made above about the absolute inflexibility of the constraints mustbe constantly kept in mind, however. It is possible that these constraintscreate some small bottleneck which if relieved ever so slightly wouldpermit the achievement of the targets with a substantial and generallysatisfactory level of consumption for the maximand. To investigate thispossibility the constraints limiting the use of foreign exchange for com-petitive imports were, first of all, removed completely. It had beenfound from previous experience that this would often result in a sub-stantially improved performance.32 In this case it was still not possibleto achieve a feasible solution. At this point, rather than to continueto search blindly for some way of obtaining a feasible solution, thetargets were reduced across the board, one percentage point at a time,until a feasible solution was achieved. With a feasible solution there areshadow prices and other indicators of relative scarcities which help indi-cate the reasons for the infeasibility of the full targets.33
A feasible solution was found when the targets were reduced by 4per cent. If an average annual rate of growth of 5 per cent had beenpostulated for the Third Plan, a reduction in target year outputs and
32 The parameters of the noncompetitive import constraints were based ondata from the I.S.G. table. The significance of this result will be discussed below.
Since, in the version of this paper originally presented, a feasible solutionwas presented with the Third Plan targets, it appears desirable to explain thisnew result. Subsequent to those calculations a number of minor changes havebeen made in the coefficients. The major change, however, and that responsiblefor this new result, was in the method of treating depreciation and the magni-tude of the depreciation estimates. The total and sectoral depreciation estimatesused originally were revised using the methods described briefly above. The newannual total of depreciation is about 500 crores above the original estimate. Itis interesting to quote the Third Plan on meeting depreciation requirements:"The estimate of investment on replacement shown (150 crores for industry only)falls short of the minimum requirements of the cotton textile, jute textile andwoolen textile industries in regard to which special studies have been made re-cently. The backlog of replacements in these three industries alone has been esti-mated at about Rs. 169 crores. The estimate that investment on replacement ac-count in the Third Plan will be of the order of Rs. 150 crores is more or less aprojection of the actual performance during the Second Plan. Even so it is on theoptimistic side in view of (a) the pressure on available resources of private enter-prise and institutional agencies for new investment and (b) the fact that millswith large backlogs of replacement are in no position to provide resources forrenovation commensurate with needs and (c) the small allocation made in thePlan to enable the N.I.D.C. to assist these programs financially" (Third Five YearPlan, p. 460).
Planning in india 351
capital stocks of 4 per cent corresponds to a reduction in the averageannual growth rate to 4.15 per cent. It is this 96 per cent level of theThird Plan. targets which will now be the subject of further analysis hereand which will, hereafter, be referred to as the Target solutions.
The value of the maximand or discounted value of consumption overthe Third Plan period, with a social rate of discount of 10 per centand at the 96 per cent level of targets, was Rs. 24,710 crores. The cor-responding undiscounted value of consumption was Rs. 32,712 crores.While this is feasible in the sense of being consistent with a solutionto the linear programing problem, certainly no plan for which this wasa true implication would be regarded as politically acceptable. The aver-age annual level of consumption in this solution of only Rs. 6,542 croreswith the 96 per cent level of targets compares with the level of consump-tion in 1959—60, prior to the beginning of the Third Plan, of approxi-mately Rs. 12,600 crores. In the solution the 1961—62 level of con-sumption was only Rs. 2,347 crores, and it grew at the minimum per-missible rate until the fourth and fifth year, when a total of Rs. 25,300crores of consumption was permitted.
In spite of the low level of the maximand in this target solutionthere were substantial amounts of idle capital throughout the plan period.Examination of the sectors in which this occurred, of the relative amountof investment in the various sectors, and of the shadow prices will helpin appreciating the kind of strain which the targets impose on the system.The largest amounts of idle capital relative to availabilities occur inthe consumers goods sectors and their major suppliers. In the firstperiod only construction capital is used to its fullest extent, and afterthat full capacity is reached in only the equipment and the miningand metals sectors until the last and post-terminal periods, when there isvirtually full-capacity operation in all sectors. This idle capacity is theresult, again, of all the constraints, but in this case it is probably thefixed input proportions and fixed consumption proportions which aremainly responsible. Since only the construction sector in the first periodis a bottleneck and that sector is, in reality, relatively easily expanded, aslight relaxation of input proportions or an increase in the productivecapacity of that sector might substantially improve the maximand. Forexample, housing requires little in the way of current inputs; yet itscapacity is kept idle in the early periods because its proportion of con-sumption is fixed and capacity is a limitation in other sectors. Similaradjustments to improve the maximand for the second, third, and fourthperiods in the equipment and mining and metals sectors, where capacityis formed less easily, would be more difficult to justify. While a reduction

352 Planning in Individual Countries
in the consumption proportions of these sectors might increase themaximand, these consumption proportions are already small. A furtherreduction would probably imply price increases in these sectors or theuse of price controls to avoid such an eventuality.34
An additional calculation was made on the Target Model solution inorder, to test the significance of the rigidities in input proportions andin consumption proportions. For this purpose it was assumed that out-put in the major consumer goods sectors could be produced in thesesectors without any current inputs whatsoever beyond those provided inthe solution and by the sector itself. Using the idle capacities generatedin a Target Model solution the additional potential output was computedand allocated to various uses on the basis of the model's allocations inthe fifth period, when capacity was being utilized almost fully.' The addi-tion to consumption under these generous assumptions was roughly Rs.32,500 crores and, with the amount produced otherwise, the totalconsumption would be roughly Rs. 65,000 crores during the five years.That would not be enough to maintain a constant per capita level ofconsumption given a population growth rate of at least 2 per cent, evenif the total could be distributed at will over the five-year period.
The real limitation on the level of consumption in the Target Modelsolutions is the size and composition of the Third Plan targets. These donot allow enough of current inputs and new capital to be diverted intothe consumption goods sectors and their major suppliers to produce ac-ceptable levels and rates of growth of consumption.
Anything which increases resource requirements for growth when re-sources are scarce will obviously reduce the level of performance asmeasured by the maximand. Anything which reduces resource require-ments when resources are scarce or loosens a binding constraint willimprove the maximand. A number of such changes and other modffica-tions have been tested in alternative solutions. The results are summar-ized in Table 18.
Column 1 of Table 18 lists the value of the maximand, i.e., dis-counted consumption, for each of the alternative solutions. Undis-counted consumption over the five years is presented in column 2. Thethird and fourth columns list the net investment and replacement invest-ment required by the targets. Since in some sectors where only one typeof capital input is required the model is indifferent between carryingout net new investment and replacement, some small amounts can beshifted between these two categories without affecting the results in any
There were, in fact, substantial price increases in coal in the early years ofthe Third Plan.

TA
BL
E 1
8
A S
umm
ary
of T
arge
t Mod
el S
olut
ions
with
Thi
rd P
lan
Tar
gets
(rup
ees
cror
es e
xcep
t col
umn
8)
Tot
al N
etT
otal
Net
Tot
alD
omes
ticG
ross
Max
iman
dIn
vest
men
tR
epla
cem
ent
Savi
ngs
GN
PD
omes
ticN
et D
omes
tic(d
isco
unte
dU
ndis
coun
ted
over
the
over
the
over
the
in L
ast
Prod
uct i
nSa
ving
s/N
NP
cons
umpt
ion)
Con
sum
ptio
nPl
anPl
anPl
anY
ear
Las
t Yea
rin
LaB
t Yea
r(1
)(2
).(3
)(4
)(5
)(6
)(7
)(8
)
1. T
hird
Pla
n T
arge
tsin
feas
ible
2. T
hird
Pla
n T
arge
ts, n
etfo
reig
n ca
pita
l inf
low
incr
ease
d by
100
%in
feas
ible
3. T
hird
Pla
n T
arge
ts, n
etfo
reig
n ca
pita
l inf
low
incr
ease
d by
100
%, n
oco
mpe
titiv
e im
port
cei
lings
infe
asib
leSo
lutio
ns w
ith 9
6% le
vel o
f T
hird
Pla
n ta
rget
s:4.
96%
of
Thi
rd P
lan
Tar
gets
,R
efer
ence
Sol
utio
n24
,710
32,7
1216
,076
.83,
253.
513
,576
.821
,320
.228
,591
.3.1
9136
05.
Soc
ial d
isco
unt r
ate,
W(t
)/W
(t+
l)—
l,32
,713
32,7
1316
,076
.8.
3,25
3.5
13,5
76.8
21,3
25.3
28,6
01.3
.191
125
6. S
ocia
l dis
coun
t rat
e,W
(t)/
W(t
+ 1
)—i,
=20
.0%
19,3
8732
,712
16,0
76.8
3,25
3.5
13,5
76.8
21,3
20.2
28,5
91.3
.191
360
7. C
(t+
1)?
1.02
5C(t
)24
,851
32,8
4916
,077
.03,
253.
313
,577
.021
,320
.628
,592
.0.f
lfl3
778.
C(t
+L
)>C
(t)
25,0
0232
,996
16,0
77.1
3,25
3.3
13,5
77.1
21,3
20.9
28,5
92.7
.191
394
(con
tinue
d)

TA
BL
E 1
8 (c
ontin
ued)
Tot
al N
etT
otal
Net
Tot
alD
omes
ticG
ross
Max
iman
ci(d
isco
unte
dco
nsum
ptio
n)(1
)
Und
isco
unte
dC
onsu
mpt
ion
(2)
Inve
stm
ent
over
the
Plan (3)
Rep
lace
men
tSa
ving
sov
er th
eov
er th
ePl
anPl
an(4
)(5
)
GN
Pin
Las
tY
ear
(6)
Dom
estic
Prod
uct i
nL
ast Y
ear
(7)
Net
Dom
estic
Savi
ngs/
NN
Pin
Las
t Yea
r(8
)
9.In
itial
con
stru
ctio
n ca
paci
tyin
crea
sed
by 5
%31
,490
39,5
4716
,064
.73,
225.
4'1
3,56
4.7
21,1
58.5
28,2
86.4
.183
393
10.
All
initi
al c
apac
ities
incr
ease
d by
10%
64,9
9678
,732
13,2
43.1
2,72
2.9
10,7
43.1
.
22,2
03.5
29,1
13.1
.115
798
11.
All
initi
al c
apac
ities
redu
ced
by 1
0%in
feas
ible
12.
Cap
ital o
utpu
t rat
io in
agri
cultu
re in
crea
sed
to 2
.5 f
rom
1.5
infe
asib
le13
.C
apita
l out
put r
atio
inho
usin
g re
duce
d fr
om10
to 7
.532
,612
'
40,8
4116
. 143
.03,
163.
115
,643
.021
,164
.0' 28
,295
.3.1
8364
614
.N
o co
mpe
titiv
e im
port
ceili
ngs
'
31,1
7740
.482
16,3
99.3
2,87
8.4
13,8
99.3
21,3
44.0
28,6
42.5
.191
706
15.
Net
cap
ital i
nflo
win
crea
sed
by 2
5%28
,068
37,1
7816
,197
.63,
115.
515
,573
.621
,339
.928
,601
.8.1
8689
616
.N
et c
apita
l inf
low
incr
ease
d by
50%
28,3
78'
37,5
6316
,189
.63,
125.
615
,438
.621
,347
.028
,595
.6.1
8269
417
.N
et c
apita
l inf
low
incr
ease
d by
100
%28
,948
38,2
6416
,176
.33,
139.
115
,176
.321
,354
.928
,569
.2.1
7437
3
(con
tinue
d)

TA
BL
E 1
8 (c
oncl
uded
)
•T
otal
Net
Tot
al N
etT
otal
Dom
estic
Gro
ssM
axim
and
Inve
stm
ent
Rep
lace
men
tSa
ving
sG
NP
Dom
estic
Net
Dom
estic
(dis
coun
ted
Und
isco
unte
dov
er th
eov
er th
eov
er th
ein
Las
tPr
oduc
t in
Savi
ngs/
NN
Pco
nsum
ptio
n)C
onsu
mpt
ion
Plan
Plan
Plan
Yea
rL
ast Y
ear
in L
ast Y
ear
(1)
(2)
(3)
(4)
(5)
(6)
(7)
(8)
18.
Net
cap
ital i
nflo
win
crea
sed
by 1
00%
,no
impo
rt c
eilin
gs36
,281
46,2
5316
,204
.43,
106.
511
,204
.421
,427
.428
,710
.6.1
7339
319
.N
et c
apita
l inf
low
redu
ced
by 2
5%19
,750
26,1
0715
,657
.63,
744.
613
,782
.621
,352
.828
,645
.6.1
8825
420
.N
o ne
t cap
ital i
nflo
w•
infe
asib
le21
.In
trap
lan
expo
rt g
row
thra
te a
t 3%
24,4
4532
,355
15,7
97.8
3,57
9.1
13,2
87.8
21,3
49.8
28,6
21.7
.184
108
22.
Intr
apla
n ex
port
gro
wth
rate
at 5
%25
,194
33,3
6015
,655
.33,
746.
813
,155
.321
,349
.728
,620
.0.1
8477
3
aSin
ce r
epla
cem
ent i
n so
me
sect
ors
requ
ires
the
sam
e ty
pe o
f ca
pita
l inp
uts
as n
ew n
et in
vest
men
t the
mod
el is
indi
ffer
ent i
n th
ese
case
s as
to th
e cl
assi
fica
tion
of th
e in
vest
men
t. T
his
acco
unts
for
mos
t of
the
smal
l var
iatio
ns in
the
tota
ls o
f ne
t inv
estm
ent a
ndre
plac
emen
t.
356 Planning in Individual Countries
way. Column 5 contains the net domestic savings estimate obtained bysubtracting the net foreign capital inflow from the calculated net invest-ment requirements. Terminal-year gross domestic product and grossdomestic output are listed in columns 6 and 7, and the ratio of netdomestic savings to net national product in the last year of the plan is incolumn
The Target solutions can be envisaged as taking place in three steps.First, the investment requirements of the targets are calculated from thestipulated initial and terminal conditions, using the specified capital-output ratios. Secondly, the model decides whether or not those require-ments can be met, given all the other constraints. Finally, it utilizes what-ever freedom it has to distribute the investment over the plan periodin order to maximize consumption. Only in the last step is the optimiza-tion feature called upon.86 The first step is really a straightforwardcalculation with capital-output ratios, but it is a comprehensive calcula-tion. The calculated initial conditions are the capital capacities at thebeginning of the plan period. These are greater than the capacities whichproduced the output of the preplan year by the amount of capitalwhich matures in the preplan year. The targets are not the outputs ofthe last plan year but the capacities with which the plan ends for thecapacity maturing in the last plan year, though it does not contribute tooutput, requires investment and saving. Moreover, in order to insurepost-terminal growth some investment and saving is required within theplan period for investment which will mature after the plan. The in-vestment assumed to have taken prior to the plan period for the planperiod can be subtracted, however. Inventory investment for all sectorsmust be added. All these calculations are performed as part of the targetsolutions.
The estimate of investment requirements in run 4, shown in column3 of Table 18, provides additional insight as to the reasons for thecharacter of the Target solutions. It indicates that for the 96 per centlevel of Third Plan targets adjusted as explained above, over Rs. 16,000crores of net investment would be required as compared to the Rs.10,000 crores estimated in the Third Plan itself. While some part of thediscrepancy may be due to differences in capital-output ratios and otherparameters, I do not believe such differences would account for the very
This table contains more information than was originally presented at theconference. Perhaps if it had been included originally it might have preventedsome misunderstandings.
36 In some situations the model might as a result of optimization provide morecapacity than called for by targets. This is not the case in the present circum-stances, however.

Planning in India 357
sizable Rather it seems likely that some part of the neces-sary components of investment were omitted or underestimated in theThird Plan preparations.
In runs 5 and 6 the discount rate applied to consumption in eachperiod in the maximand was changed with negligible results for thevalue of consumption and the allocation of resources. This is due inpart to the shortness of the planning period and the constraints on out-put which operate from both ends of the period. All subsequent trialswere made with a discount rate of 10.0 per cent in the maximand.
In runs 7 and 8 the growth constraints on consumption were succes-sively reduced and each time only a modest change resulted. This sug-gests that any tendency in the solutions to shift consumption towardthe beginning or end of the plan period was not important, probablybecause of all the other constraints imposed.
In solution 9, the initial capacity in construction, the bottleneck sectorat the outset of the plan period, was increased by 5 per cent, resulting ina substantial increase in the maximand. A 10 per cent across-the-boardincrease in initial capacities in run 10 breaks many bottlenecks, and thevalue of consumption rises beyond that which a 5 per cent growth ratewould produce, as is confirmed by the fact that the consumption growthconstraints are not binding. A 10 per cent increase in capacities has theeffect of putting the system almost half-way toward achievement of the96 per cent level of targets. Presumably with a somewhat lower value ofmaximand the degree of achievement of the targets could be raised. Ofcourse, while all the additional capacity is eventually useful, the mostimportant effect of such a change is to break the bottlenecks. If initiallyavailable capacities were reduced by 10 per cent, as in trial 11, the 96per cent level of Third Plan targets becomes infeasible.
The agricultural sector bulks large in the Indian economy, and theexpansion of its output has posed especially difficult problems. Thesensitivity of the solutions to success in this field is only indirectly andvery partially tested by changing the capital-output ratio in this sector.This was tried, however, in solution 12, in which the capital-outputratio was raised to 2.5 from 1.5 with the result that the 96 per cent levelof targets became infeasible again.
The housing sector, though not so large in terms of output, has thelargest capital-output ratio of any sector. This was reduced in run 13from 10 to 7.5 with substantial effects on the maximand as compared tosolution 4, as it reduced the requirements for inputs from the construe-tion sector in particular.
In solutions 14 through 22, various conditions relating to imports,

358 Planning in Individual Countries
exports, and foreign assistance were modified. In run 14 the constraintswere eliminated on the use of the foreign exchange left over after satis-fying the noncompetitive imports. This resulted in a substantial increasein the value of the maximand. The implication is that a relative useof foreign exchange by the various sectors which was different from thatwhich had prevailed at the end of the Second Plan at least would im-prove the performance of the system. In runs 15 through 22, the avail-ability of foreign aid is varied. When foreign aid is increased, in run 15,by 25 per cent, a total of Rs. 625 crores, the value of consumptionrises by more than seven times that amount as compared to solution 4.The successive increases in runs 16 and 17 have a much smaller effect,as the bottleneck of domestic resources remains intractable. When adoubling of foreign aid is combined with greater freedom in the use offoreign exchange, in solution 18, another substantial increase in themaximand takes place. In run 19, the reduction of foreign aid by Rs. 625crores over five years reduces the available consumption almost tentimes. With no foreign aid, as shown in Target solution 20, the 96 percent targets become infeasible.
It is interesting to note that reducing the growth rate of exports dur-ing the plan period actually reduces the value of the consumptionavailable in spite of exports being a drain on domestic resources. Asshown in runs 21 and 22, at the level at which the system operates inthe Target Model solutions the domestic resource requirements for in-creasing exports do not clash directly with the resource requirements forreaching the targets, and the increased exports do provide additionalforeign exchange.
During the Third Plan period there have been general shortfallswith respect to the plan targets. The reasons for these are certainlymore complex than can be explained by a linear programing model. Yetit is worth noting that the Target solutions can be interpreted as beingconsistent with the shortfalls and with the manner in which they oc-curred. The model produces a "feasible" solution only by scaling downthe Third Plan targets and by reducing per capita consumption levels.Since in actuality consumption could not be so constrained, resourceswould be pulled into agriculture and the other consumer goods sectors tosuch a degree that targets could not be achieved elsewhere. Yet thegovernment's commitment to the targets was sufficiently strong thatresources were not shifted wholesale to the consumption-supplyingsectors, and per capita consumption has risen only slightly. A set of al-ternative—or aggravating—explanatory factors for the Third Plan pe-riod are the bad monsoons and the increase in the military budget in

Planning in India 359
reaction to the Chinese border invasion. Further study would be neces-sary to put each of these influences and explanations in proper perspec-tive.
THE TRANSIT MODEL SOLUTIONS AND COMPARISONS WITH THE TARGETSOLUTIONS
The second stage in applying the model to the data was the computa-tion of a number of alternative solutions with terminal conditions setendogenously by means of equations 22 and 23. These will be calledthe Transit Model solutions. In these solutions the targets reflect theconditions that consumption, government expenditures, exports, and im-ports grow at rates which are specified exogenously in this set of solu-tions at 5 per cent, 2% per cent, 4 per cent, and 3 per cent respectively.The plan targets are now determined as part of an optimal solution andare only one aspect of the solution. There are a number of reasons whynone of the Transit Model solutions may represent the best possible"plan" for India. These will be described in detail in the last section ofthe paper and at this point the caveat will only be registered.
Table 19 summarizes some features of the solutions for alternativespecifications of the parameters and constraints. The differences be-tween the Target solutions and the Transit Model solutions are striking.The values of the maximand of the Transit Model solutions are higherin every case. On reflection, however, it is not completely surprising thatit should be so. The Transit Model is optimizing the weighted sum ofaggregate consumption and also ensuring a capability for post-terminalgrowth of which consumption is the largest component. The, compositionof consumption is not allowed to change within or after the plan periodnor is the composition of the government and export demands. Thus, theTransit Model maintains a substantial degree of consistency betweenthe orientation of the economy during and after the plan. Investmentis provided in the Transit Model solution in proportions and amountscompletely consistent with the exogenous specifications on the patternof consumption, etc., and with the intraplan optimization of the con-sumption maximand. It is interesting to note that the total amount ofnet investment in the Transit Model solutions is usually close to the Rs.10,000 crores originally estimated for the Third Plan. The Third Plantargets are apparently not in the same way compatible with the maxi-mand, and the Third Plan Target Solutions reflect this fact. The shadowprices of output and capital and the distribution of idle capacities in theTransit Model solutions also reflect the different orientation. In theTransit Model solutions there is less idle capacity over-all, and it is con-

TA
BL
E 1
9
Tra
nsit
Mod
el S
olut
ions
for
Thi
rd P
lan
Peri
od
(rup
ees
cror
es)
Tot
al N
etT
otal
Net
Tot
alD
omes
ticG
ross
Max
iman
dIn
vest
men
tR
epla
cem
ent
Savi
ngs
GN
PD
omes
ticN
et D
omes
tic(d
isco
unte
dco
nsum
ptio
n)U
ndis
coun
ted
Con
sum
ptio
nov
er th
ePl
anov
er th
ePl
anov
er th
ePl
anin
Las
tY
ear
Prod
uct i
nL
ast Y
ear
Savi
ngs/
NN
Pin
Las
t Yea
r(1
)(2
)(3
)(4
)(5
)(6
)(7
)(8
)
1. R
efer
ence
sol
utio
n; s
ocia
ldi
scou
nt r
ate
=10
%59
,435
72,0
349,
822.
4.
2,96
3.6
7,32
2.4
20,2
10.1
26,0
54.8
.079
201
2. S
ocia
l dis
coun
t rat
e,W
(t)/
W(t
+V
—i=
0%72
,034
72,0
349,
826.
42,
963.
67,
326.
420
,214
.126
,061
.0.0
7930
03.
Soc
ial d
isco
unt r
ate,
W(t
)/W
(t +
V—
i=20
%50
,674
72,0
079,
304.
22,
979.
06,
804.
219
,975
.525
,744
.3.0
7900
54.
C(t
+1)
.1.0
25C
(t)
60,0
0972
,641
9,86
3.7
2,89
4.3
7,36
3.7
20,1
84.1
26,0
30.9
.079
924
5. C
(t-i
-l)
C(t
)60
,009
72,6
419,
863.
72,
894.
37,
363.
720
,184
.1.0
7992
46.
All
initi
al c
apac
ities
incr
ease
d by
10%
65,0
0979
,402
10,9
00.1
2,78
7.2
8,40
0.1
22,0
22.3
28,4
25.9
.078
865
7. P
ostte
rmin
al c
onsu
mpt
ion
grow
th r
ate
redu
ced
to 2
.5%
59,9
9772
,820
7,86
1.0
2,41
9.4
5,36
1.0
19,5
79.1
25,5
63.3
.029
871
8. P
ostte
rmin
al c
onsu
mpt
ion
grow
th r
ate
incr
ease
dto
7.5
%58
,258
70,5
0712
,096
.42,
852.
39,
596.
420
,448
.426
,852
.8.1
3003
1
(con
tinue
d)

TA
BL
E 1
9 (c
oncl
uded
)
Tot
al N
etT
otal
Net
Tot
alD
omes
ticG
ross
Max
iman
dIn
vest
men
tR
epla
cem
ent
Savi
ngs
GN
PD
omes
ticN
et D
omes
tic(d
isco
unte
dU
ndis
coun
ted
over
the
over
the
over
the
in L
ast
Prod
uct i
nSa
ving
s/N
NP
cons
umpt
ion)
Con
sum
ptio
nPl
anPl
anPl
anY
ear
Las
t Yea
rin
Las
t Yea
r(1
)(2
)(3
)(4
)(5
)(6
)(7
)(8
)
9.C
( 1)
1.05
C(0
)in
feas
ible
10.
No
com
petit
ive
impo
rtce
iling
s59
,949
72,7
2410
,135
.32,
912.
17,
635.
320
,221
.025
,888
.7.0
7751
611
.N
et c
apita
l inf
low
incr
ease
d by
25%
59,7
8572
,496
9,83
4.7
2,95
1.9
7,33
4.7
20,2
39.6
26,0
59.1
.073
079
12.
Net
cap
ital i
nflo
win
crea
sed
by 5
0%60
,034
72,8
329,
839.
32,
956.
47,
339.
3:
20,0
99.3
25,8
16.1
.063
780
13.
Net
cap
ital i
nflo
wre
duce
d by
25%
59,1
1871
,547
8,84
8.4
2,93
1.5
6,34
8.4
19,6
47.3
25,3
17.4
.081
237
14.
Net
cap
ital i
nflo
wel
imin
ated
57,6
8469
,811
8.88
7,6
6,38
7.6
19,7
94.2
25,6
72.6
.107
955
15.
Intr
apla
n ex
port
grow
th r
ate
at 3
%59
,475
72,0
669,
658.
22,
942.
97,
158.
220
,112
.525
,911
.1.0
7777
316
.In
trap
lan
expo
rtgr
owth
rat
e at
5%
59,4
4572
,021
9,67
1.3
2,89
8.1
7,17
1.3
20,0
82.1
25,8
71.6
.079
556

362 Planning in Individual Countries
centrated in the capital-goods-producing sectors and their major sup-pliers. The shadow prices also reflect the emphasis on capital formationin the consumer goods sectors.
The growth rate for consumption associated with solutions 1 and 2,with a 10.0 per cent and 0.0 per cent rate of discount in the maximand,respectively, is 10.2 per cent. The monotonicity constraint is bindingonly between the second and third and the third and fourth periods.It is not binding at all when the constraint is reduced to 2.5 per centin solution 4; so its complete elimination in solution 5 does not furtheraffect the maximand.
The 10 per cent increase in capacities substantially improved the con-sumption goods output in Transit Model solution 6 but by no meansas radically as in the Target solution. This corresponds to a resultachieved when the Target model was solved for 80 per cent level of theThird Plan targets. In both the former and the latter case the targetsbecome relatively easy to achieve, and the model can concentrate onproducing as much consumption as possible during the plan periods sothat the Target solution comes to resemble the Transit Model solution.
A reduction in the desired post-terminal growth rate of consumptionby 2.5 per cent, in solution 7, amounts to about Rs. 400 crores in thefirst post-terminal year, for example. This change increases the value ofconsumption available in the plan period by about twice that amount.But an increase in the post-terminal consumption growth rate to 7.5 percent, in solution 8, reduces the availability of consumption by Rs. 1,500crores. The terminal-year capital stock goes up by 500 crores. The in-crease is relatively small because the model is still free to set the initiallevel of consumption and tries to "cheat" on the constraints of meetingterminal requirements by reducing initial levels of consumption by 169crores. The rate of growth of consumption in this latter case is still 4.2per cent. If the level of consumption in the initial period were fixedat 5 per cent above that of the preplan period, a Transit Model solutionbecame infeasible, as shown in 9 in Table 19.
Elimination of the import ceilings for competitive imports in solu-tion 10 increases the amount of consumption available by about Rs.500 crores and the terminal capital stocks by about Rs. 200 crores. Theimprovement in the corresponding Target solution when this change wasmade was much more dramatic. This was partly because in that solu-tion there was more idle capacity which could be used if the variousconstraints permitted it and partly because there was more imbalancebetween capacities and targets which increased the significance of for-eign exchange and the ability to use it freely. On the other hand, the

Planning in India 363
difference between the solutions also suggests for further research thepossibility that the Indian foreign exchange controls were not so com-patible with their targets as they would be in achieving a different setof targets.
As could be expected from the above discussion, a 25 per cent in-crease in the availability of foreign exchange, in solution 11 in Table 19,makes less difference than in the case of the Target solution, permittingonly Rs. 489 crores of additional consumption. The next 25 per centincrease in foreign aid, in solution 12, has a slightly bigger payoff interms of additional consumption in the plan period for the Transit Modelsolution than the Target solution. Likewise, reducing foreign aid hada smaller impact on the Transit Model solution as shown in its runs13 and 14. The reduction in the capital stocks at the end of the fifthperiod from Rs. 31,863 crores to Rs. 31,077 crores was much less thanthe reduction in consumption during the plan period as a result of thecomplete elimination of foreign aid.
When the stipulated rate of growth of exports is reduced by 1 per cent,in solution 15, increased resources become available for domestic use,but foreign exchange available is also reduced. The net effect of such achange or a 1 per cent increase in the rate of growth of exports, in solu-tion 16 is relatively unimportant.
It is instructive to compare typical national income accounts asso-ciated with the Target and Transit Model solutions. This is done inTable 20 for solution 4 in Table 18 and solution 1 in Table 19. In thefirst year the Target solution puts a great deal of effort into breakingthe bottlenecks and keeps all other activities at a low level, partly be-cause of the fixed consumption and input proportions. It also does thisin part because a higher first-year consumption would, because of theconsumption growth constraints, only increase the consumption require-ments in future years. The domestic savings rates in all years after thefirst are in the Target Model solution at levels which would generally beregarded as infeasible.37
The national income accounts associated with the Transit Model solu-tion look more conventional. On the other hand the domestic savings
37 This is, by no means, a new criticism of the Third Plan, although it has takendifferent forms depending on the analytical framework used and individual judg-ment as to the parameters which are within government control. Thus, P. N.Rosenstein-kodan thought the over-all capital-output ratio implicit in the planwas too low ("Alternative Numerical Models of the Third Five Year Plan ofIndia," Capital Formation and Economic Development, pp. 23—33). Other com-mentators, while accepting the implicit capital-output ratio, have considered theimplicit domestic savings rates as too high.

TA
BL
E 2
0
Nat
iona
l Inc
ome
Acc
ount
s: T
arge
t and
Tra
nsit
Mod
el S
olut
ions
with
Thi
rd P
lan
Tar
gets
(rup
ees
cror
es; t
arge
ts r
educ
ed to
96.
0 pe
rce
nt)
196
1-62
1962
-63
1963
-64
1964
-65
1965
-66
Tar
get M
odel
Sol
utio
n 4:
Con
sum
ptio
n2,
346.
952,
464.
312,
587.
5210
,181
.89
15,1
31.3
0In
vent
ory
chan
ge—
2,96
5.95
788.
602,
284.
871,
536.
9472
3.98
Fixe
d in
vest
men
t, ne
t1,
952.
212,
403.
092,
572.
893,
031.
393,
748.
74T
otal
inve
stm
ent
—47
3.55
3,80
4.52
5,43
3.57
5,14
7.25
4,95
2.25
Gov
ernm
ent e
xpen
ditu
re54
0.99
560.
9958
1.99
601.
9962
1.99
Val
ue a
dded
by
gove
rnm
ent
899.
7593
3.01
967.
941,
001.
201,
034.
46E
xpor
ts65
3.98
680.
9870
7.98
735.
9876
4.98
Impo
rts
1,15
3.98
1,18
0.98
1,20
7.98
1,23
5.98
1,26
4.98
Gro
ss n
atio
nal p
rodu
ct2,
814.
157,
262.
859,
071.
0416
,432
.34
21,2
40.0
2R
epla
cem
ent
540.
1961
2.83
575.
8057
8.90
479.
52N
et n
atio
nal p
rodu
ct2,
273.
966,
650.
028,
495.
2415
,853
.44
20,7
60.5
0Sa
ving
s-9
73.5
53,
304.
524,
933.
574,
647.
254,
452.
25G
ross
nat
iona
l out
put
5,47
6.27
9,95
6.23
12,4
06.3
622
,046
.08
28,5
11.1
4In
term
edia
te p
rodu
ct2,
206.
803,
470.
854,
145.
376,
454.
708,
143.
01
Con
sum
ptio
n/gr
oss
natio
nal p
rodu
ct0.
830.
330.
280.
610.
71T
otal
inve
stm
ent/g
ross
nat
iona
l pro
duct
—0.
160.
520.
590.
310.
23Sa
ving
s/gr
oss
natio
nal p
rodu
ct—
0.34
0.45
0.54
0.28
0.20
(con
tinue
d)

TA
BL
E 2
0 (c
oncL
uded
)
1961
-62
1962
-63
1963
-64
1964
-65
1965
-66
Tra
nsit
Mod
el S
olut
ion
1:C
onsu
mpt
ion
12,9
29.9
213
,576
.41
14,2
55.2
314
,978
.98
16,2
93.4
7
Inve
ntor
y ch
ange
4.30
189.
8431
8.65
464.
4434
1.18
Fixe
d in
vest
men
t, ne
t1,
803.
861,
776.
321,
637.
951,
583.
041,
702.
76
Tot
al in
vest
men
t2,
232.
812,
426.
792,
411.
392,
632.
822,
657.
56G
over
nmen
t exp
endi
ture
540.
9956
0.99
581.
9960
1.99
621.
99V
alue
add
ed b
y go
vern
men
t89
9.75
933.
0196
7.94
1,00
1.20
Exp
orts
653.
9868
0.98
707.
9873
5.98
764.
98Im
port
s1,
153.
981,
180.
981,
207.
98.
1,23
5.98
1,26
4.98
Gro
ss n
atio
nal p
rodu
ct16
,103
.48
16,9
97.2
217
,716
.57
18,7
15.0
120
,107
.50
Rep
lace
men
t42
4.63
460.
6245
4.77
585.
3361
3.62
Net
nat
iona
l pro
duct
15,6
78.8
516
,536
.60
17,2
61.7
918
,129
.68
19,4
93.8
8
Savi
ngs
1,73
2.81
1,92
6.79
1,91
1.39
2,13
2.82
2,15
7.56
Gro
ss n
atio
nal o
utpu
t20
,786
.62
21,9
59.4
922
,844
.25
24,1
60.8
525
,952
.13
Inte
rmed
iate
pro
duct
5,42
9.68
5,73
9.74
5,93
7.73
6,28
6.81
6,71
6.52
Con
sum
ptio
n/gr
oss
natio
nal p
rodu
ct0.
800.
790.
800.
800.
81T
otal
inve
stm
ent/g
ross
nat
iona
l pro
duct
0.13
0.14
0.13
0.14
0.13
Savi
ngs/
gros
s na
tiona
l pro
duct
0.10
0.11
0.10
0.11
0.10
-0'

366 Planning in individual Countries
rate is substantially lower than that which has been actually achieved.This suggests, as indicated earlier, that the economy could achievea higher growth rate in capital stock if it so desired. The savings ratesassociated with Transit Model solution 9 in fact run up to 15.6 percent in the last period. The differences in savings rates result in a greateraccumulation of total capital stock in the Target solutions, as would beexpected. The total stock is 7.5 per cent higher in Target solution 4 thanin Transit Model solution 1 in the fifth year of the plan period. In thepost-terminal years the differences are even larger. As would be expected,the Target solution provides for a larger accumulation in the capitalgoods sectors and their major suppliers and for a smaller accumulationin the consumer goods sectors.
AN APPRAISAL OF THE MODEL AND ITS APPLICATION
The lack of realism in the assumptions of the model was obvious whenthey were made. The consequences of those abstractions in the solutionsare less obvious, and the final task is to try to assess these consequencesand, therefore, the usefulness of the method. The application of themodel to the Indian Third Five-year Plan period provides a concretecontext for the discussion. To summarize the results of that application:There are no economically feasible solutions to the Target model withthe Third Five-year Plan targets inserted. Economically feasible solu-tions were obtained when the targets were reduced by 4 per cent.Even these would not be politically feasible, however, as they requirea reduction in per capita consumption during the plan period. To putthe results another way, these solutions are not consistent with otherplan goals of increasing per capita consumption. The solutions of theTransit Model with endogenously determined terminal conditions pro-vide uniformly larger levels and growth rates of consumption. The dif-ferences between the solutions are due to the size and composition ofthe investment and output targets. The Third Plan targets require muchmore investment and place relatively greater stress on investment andoutput of the capital goods sectors and their major suppliers as com-pared to the Transit Model solutions.
In actual planning situations the objective function and the con-straints are never so simple as those stipulated in the model. Increasedemployment and improved income distribution are examples of themany goals which have had, an important place in development debatesbut which are not explicit in the model. If additional constraints ormultiple objectives could be taken into account, what would be theeffect on the solutions? The answer cannot be given in detail, of course,

Planning in India 367
without solving the broader problems, but the general nature of the con-sequences are clear. If the additional constraints are binding, i.e., makeany difference at all in the solutions, the maximand in both the Targetsolutions and the Transit Model solutions would be reduced and, inother than exceptional circumstances, by different amounts. Thus, add-ing realism by adding employment constraints, for example, might ormight not diminish the difference between the Target and Transit Modelsolutions, but it would certainly not help with respect to the question offeasibility of the Third Plan targets. Moreover, the fact that employmentand other goals have nQt been treated explicitly in the model does notmean that the results are without implications for these goals. The usualway of computing the employment implications of a plan is to divideoutput by some productivity coefficients, and that could easily be donefor both the Target and Transit Model solutions if data were availableon productivity. Likewise, if it is possible to associate changes in in-come distribution with relative sectoral changes, these implications couldalso be worked out.
The planning horizon for the model is short, the five years correspond-ing to the Indian plans. No detailed plans have been prepared by thePlanning Commission which cover a longer period, but long-run strat-egies of development have been enunciated such as "import sub-stitution," "balanced development of agriculture and industry," and soon. Unfortunately, even the most fully elaborated strategies do not pro-vide the concreteness of quantitative projections; so it is impossible todetermine the consistency of any particular set of plan targets withlonger-run goals. In any case, having a Jonger horizon for the modelwould again not make any difference as far as the Third Plan Targetsolutions are concerned. Resources cannot be transferred from the fu-ture to the present, and a longer planning period would not help inachieving the Third Plan iargets. The implications of the Transit Modelsolutions for the future are fully revealed in the post-terminal conditionsmaintained and thus provide an explicit basis for judgment. However,it cannot be presumed that the Transit Model solutions for the ThirdPlan period would be identical to optimum solutions obtained for alonger planning horizon. In fact, that is almost certainly not the case.Having a longer horizon provides added flexibility in a number of re-spects, and general considerations suggest that the solutions will besensitive to the length of the planning horizon.38 It is impossible to pre-dict in this short-term model the effects of lengthening the planning
38 See S. Chakravarty, "Optimal Savings with a Finite Planning 1-lorizon," In-ternational Economic Review, September 1962, pp. 338—55.

368 Planning in individual Countries
horizon. In models such as that used here the solutions are of the"flip-flop" type, meaning, in this case, that consumption if unconstrainedwould tend to be concentrated at either the beginning or end of theplan. Due to the three-year gestation periods, the initial and terminalconditions create direct constraints on each period's outputs. In addi-tion, the growth constraints on consumption help prevent the flip-floptendency. Further work is in progress to explore the significance of ex-tending the planning horizon. Meanwhile, one can only say that theTransit Model solutions are optimal with respect to the objective func-tion, all the constraints, and the time period. They help indicate in arough way the type of changes which would have been necessary tocreate a set of feasible Third Plan targets. It is not suggested, however,that these solutions provide the best of all alternative paths. For ex-ample, some of the Third Plan objectives, such as creating the capacityto produce import substitutes, transcend the plan period itself. TheTransit Model solutions for five years cannot give an answer to thequestion of optimal import substitution policy, though the performanceof any particular solution in this respect can be gauged through thepost-terminal conditions which are stipulated for export and importgrowth.
The models are unsatisfactory in their production technology, omittingany possibility of diminishing returns or externalities or the contribu-tion of any other factor but capital and foreign exchange. Less sophisti-cated formal analyses can take such influences into account in detailedsectoral studies. Unfortunately, the integration into over-all plans ofsectoral studies which embody increasing returns, has not yet been ac-complished, though work is proceeding in that direction.
Technical coefficients can be changed exogenously in the models whensuch changes are known to be happening. In a practical applicationfurther disaggregation would help in dealing with some of the problemsassociated with changing coefficients. It is particularly important toextend the model structure to embody such changes since the creationof new sectors and the transformation of traditional sectors is of essentialimportance in the growth of less-developed areas.39
Agriculture provides, perhaps, the prime example of a sector whosetechnology is being transformed with the absorption of increasing
Technical coefficients were not changed in the model solutions presentedabove due to the relative shortness of the time span covered and lack of knowl-edge of what could be expected. Since in the Transit Model solutions the shadowprices tend to be lower than in the Target solutions changes in technical coeffi-cients are likely to be of less importance in the former.

Planning in India 369
amounts of inputs from the industrial sectors. If such changes had beentaken into account the values of the maximand would have been re-duced in both the Target and 'Transit Model solutions and, probably,by greater amounts in the former due to the greater strain imposedthere on industrial capacity.
Other have been mentioned earlier and, with additionaltime and space, still more could be described. It is important to havethem always in mind as they condition all the interpretations of theresults. Finally, however, in judging the model the real issue is notwhether it is a perfect and completely comprehensive approach, for noone would argue that, but whether it can do its particular job better thanother approaches which are available.
COMMENTEdward S. Mason
The paper under discussion consists of two parts; the first, a relativelyshort account of planning procedures in India and how theyhave developed; the second, a presentation in preliminary and tentativeform of a linear programing model for India. The connection betweenthe two parts is established by the author's conviction that the principaldeficiency in Indian planning is the lack of a technique that wouldpermit the planners rapidly to map out the implications of alternativesets of social preferences and the merits of alternative paths to develop-ment.
The author has shown that a model of fairly complicated structurecan be adapted to computation and has derived output values for al-ternative sets of inputs. The critical question is whether one "develop-ment path" can be shown by this exercise to be "better" than alternativepaths within any meaning of "better" that is significant for currentplanning operations. A judgment on this question rests on the validityof the statistical underpinning, the reasonableness of the very numerousconstraints introduced to facilitate computation and the relationship ofthe assumptions—the implied social preferences—to the social pref-erences that do and must underlie any realistic planning effort. In myopinion such a model is not yet ready for use as a practical planninginstrument. This is not to deny that it represents an important methodo-logical step toward what may in time become such an instrument.
Before turning to a consideration of the model, a few observationson the planning process in India are in order. I conceive of planning in

370 Planning in Individual Countries
the broad as consisting of technical advice on the totality of govern-mental decisions affecting the use of economic resources. Since, in acountry like India, well over three-quarters of economic activity, howevermeasured, are in the private sector, with agriculture, commerce andsmall-scale industry predominant, the governmental decisions that areof particular importance in affecting resource use have to do with taxa-tion and subsidies, price controls, licensing, import duties, foreign ex-change rates and allocations, and the like. In this area, an examinationof alternatives is important. and very much needed in India, but thePlanning Commission here stands on the periphery of decision-making.
The field of capital formation is another matter, and here the publicsector accounts for well over half of new investment. What role doesthe Planning Commission play in the allocation of these funds? What-ever the part played by its technical personnel, the Planning Commissionof an earlier era, led by a strong prime minister, was centrally involvedin the fundamental decisions to emphasize the heavy industry and im-port substitution that have shaped the Indian development programsince the beginning of the Second Plan. But these decisions, once made,have inevitably had the effect of changing the relations between thecommission and the ministries in the further expansion of public sectorindustrialization.
The heavy industrial complex which began to take shape some tenyears ago provides its own justification for investment funds and growsin an enclave with little connection with the rest of the Indian economy.The steel mills supply material to the heavy engineering installations atRanchi and, in turn, receive equipment from them. Both the mills andRanchi require electric power, and thermal plants are built to supplythese needs. The thermal plants need equipment, and the heavy electri-cal equipment plant at Bhopal is established and, in turn, secures itssupplies from the steel mills. All these enterprises require coal, and thegovernment opens new mines, thus creating a demand for heavy miningequipment from Ranchi. This enclave touches the rest of the economyas a demander of food stuffs and other consumer goods for its growinglabor force, and these demands for food have, perhaps, received inade-quate attention in Indian planning. It also demonstrates an insatiabledemand for transportation; and in the seven years following 1955—56,coal, iron and other ores, limestone and dolomite, iron and steel prod-ucts, petroleum, and cement accounted for more than 80 per cent ofthe increase in railway ton-miles. But to date this industrial complex hasaffected very little the rest of Indian economic activity. As in the Sovieteconomy, on whose development process this complex was indeed

Planning in India 371
modeled, investment goods have been devoted to the production ofother investment goods. Whether this has represented an optimal alloca-tion of development expenditures in India, I do not know, and I doubtvery much whether any techniques of economic analysis, includinglinear programing, would give us the answer. The point I am making isthat these fundamental decisions on the development of heavy industryhaving once been taken establish the flows of a large segment of publicinvestment for a long time to come.
By the same token, they shift somewhat the center of gravity of theplanning operation away from the Planning Commission toward theministries and other government agencies that are concerned with im-plementation. The author, while recognizing the importance of imple-mentation, puts these problems to one side in order to focus attentionon planning decisions. But the dividing line between planning andimplementation is not so clear-cut. In the process of carrying out de-cisions, the ministries become the repositories of the information essen-tial to the making of further planning decisions. The ministries becomeincreasingly the planners within the areas of their responsibilities, look-ing only to the Ministry of Finance for financial authorization and al-locations of foreign exchange. The Planning Commission comes in-creasingly to play the role of mediator and compromiser among claimantstates and ministries, attempting mainly to insure consistency amongthese competing claims.
As I read the story, the power and prestige of the Planning Commis-sion was at a high point some years ago when Prime Minister JawaharlalNehru took his position as chairman seriously and when the membershipconsisted of powerful officials and influential nonofficials. Since thattime, successive appointments to the commission itself have not main-tained the earlier standards, and the initiative of the commission hasbeen progressively transferred to other ministries and, particularly, theMinistry of Finance. The commission plays an important role in negotia-tions with the state governments, leading to the preparation of annualdevelopment plans; but central government development expendituresare largely a matter of negotiation between Finance and the developmentministries; and the Planning Commission has little or nothing to do withthe preparation of the foreign exchange budget. The five-year plans stillhelp shape the course of development, but the role of the PlanningCommission is increasingly that of a negotiator and compromiser ratherthan an initiator of development strategy.
The author, of course, recognizes—in fact, emphasizes—the fact thatthe Planning Commission is not the sole planning agency. He describes

372 Planning in Individual Countries
Indian planning as an open process with broad political participation,and calls attention to the activities of the economic ministries, the Na-tional Development Council, the advisory committees on problems ofindividual sectors, the consultative committee of members of Parlia-ment, and the various state governments. He goes on to say, however,that, ". . . these groups have not provided guidance for informedpolitical participation in the process of planning. As a consequence, inthe procedures for formulation of the plans there has been relatively littleconsideration of the specific composition of economic targets in the lightof social preferences concerning present and future consumption subjectto resource availabilities."
One question that concerns us is whether the position of the PlanningCommission in the present power structure is such as to make it possibleto initiate effectively the "consideration of the specific composition ofeconomic targets in the light of social preferences"? A second questionis whether the availability of techniques of analysis capable of establish-ing the relation of alternative types of resource use to economic growthand other social objectives would put the Planning Commission in thisposition? A third question, to which we now turn, is whether a linearprograming model, of the sort developed here, will do the trick?
It seems somewhat out of place, to say the least, to assign the taskof appraising a linear programing model for India to one who is, inKindleberger's phrase, quoting Frisch, merely a "conversational econ-omist." But I shall do the best I can. Let me say, at the outset, that Ifind it difficult to judge how seriously the author takes this model as anactual planning instrument. The results are described as preliminary andtentative. A number of defects are pointed out which may be correctibleby exogenous specifications or by changing coefficients as more informa-tion becomes available. As a first effort toward what, in the course oftime, may well become an effective planning instrument, the model de-serves high marks. But I doubt whether such a technique, even consid-ering possibilities of improvement, is likely to have much applicabilityfor the Fourth, Fifth, and possibly the Sixth Plan. And I wonder, in themeantime, whether a type of analysis specifying capital as the sole factorlimiting growth is quite what India needs at this juncture.
As I understand it, the primary purposes of the model are to answerthe questions: How much of current output should be saved andinvested? What types of investment will yield the largest presentvalue of consumption over a five-year period while providing terminalcapital installations capable of supporting a specified pattern and rate ofgrowth of output into the indefinite future? The answer is found, mainly,

Planning in india 373
by comparing the effects of alternative plan targets on the productivityof investment. The greater the productivity, the larger should be thepreference of future over present consumption. There are, of course,other social choices, and the model may or may not be useful in provid-ing information relevant to these choices. But here we are concernedwith the choice between present and future consumption as it may beaffected by prospective yields in alternative combinations of resourceuse.
For this purpose the paper specifies capital investment as the onlyproductive input. Foreign exchange is also recognized as a scarce input,but its quantity is exogenously specified. The volume of savings and in-vestment in a plan period in conformity with social preference is thedifference between the capital capacities at the beginning of the periodand the terminal capacity requirements needed to make possible stipu-lated post-terminal rates of growth for consumption, government ex-penditures, and exports. The problem of the planner is so to use theflow of investment funds as to maximize the present value of consump-tion during the period while at the same time preserving terminal capitalcapacities needed for post-terminal rates of growth. The optimizingmechanism depends on the discount rate used to determine the presentvalue of consumption and the yields to capital and foreign exchange in-puts in alternative sectoral combinations.
A good deal could be said about the difficulties of establishing initialcapital capacities on the basis of information now available in India.And more could be said about the propriety of establishing terminalcapital requirements on the basis of stipulated post-terminal growthrates—an invariant composition. of post-terminal output for consurñp-tion, government use, and exports—through the use of. highly aggregatedcapital-output ratios, input-output coefficients, and linear relationships.But I should like to focus attention on certain other difficulties.
It would appear to me that, considering the very large scope ofeconomic activity that is exogenously stipulated or governed by con-straints, the optimizing mechanism has a relatively small space in whichto operate. The commodity áomposition of consumption is assumed tobe fixed, and a minimum rate of growth of consumption is stipulated.Consumption accounts for 75—80 per cent of Indian output. As theauthor admits, a good deal of information exists on price and incomeelasticities of various consumer goods, but this information cannot befitted into a linear model. Government consumption is assumed to growat 2.5 per cent a year and exports at 4 per cent, and the compositionof government consumption and exports is given. Since the growth of

374 Planning in Individual Countries
export earnings is fixed and total capital inflows are stipulated, foreignexchange availability is exogenously determined. Public developmentalexpenditure on education, social welfare, research and development, andcommunity development lie outside the optimizing procedure becauseit is difficult to assess the relationship of these expenditures to growth.What appears to lie within the model is the allocation of constructionand equipment outputs to the nine other sectors of the eleven-sectormodel after the construction and equipment requirements of privateconsumption, government consumption, exports, and governmental de-velopmental expenditures on various services have been excluded. Itwould seem that a large part of planning decisions for which alternativesare worth considering have been left outside the optimizing procedures.
Within the model the relationships between investment and outputare stated in terms of fixed composite capital coefficients per unit ofhighly diverse combinations of outputs. There are no diminishing re-turns to capital investment and no economies of scale. Spatial relation-ships lie outside the compass of the model. The large steel—heavy indus-try—coal_electric power—chemical complex developing in northeast Indiais having a substantial impact on transport requirements. The averagelength of haul on the Indian railways, which increased steadily to 1963,has now started to decline. Changes in the structure of Indian industrymay be producing significant alterations in other input coefficients.
According to the author, "the relatively small size of many of themodern sectors as well as the extent and variety of reporting required forimplementation of various government regulations facilitate the estima-tion of sectoral, marginal capital coefficients." Modern sectors usuallyinclude both public and private enterprises and there may be, as forexample in steel, considerable difference between capital inputs perunit of output in public as against private enterprises. The capital re-quirements for a given expansion of output may depend on whether theexpansion is in the public or private sector. If such difficulties are en-countered in the estimation of marginal capital coefficients in the caseof steel, the difficulties are presumably much larger in estimating mar-ginal coefficients for the mining and metals sector as a whole, which em-braces a wide range of diverse activities.
The determination of such coefficients from historical data for suchrelatively new enterprises as Bhopal and Ranchi would seem to begrossly misleading as to what one might properly expect in the future.Rates of return for twelve public enterprises in 1960—61 varied all theway from 0.2 per cent for Hindustan Shipyards to 20 per cent forHindustan Antibiotics. These returns were in part determined by output

Planning in India 375
prices, and these prices in turn were to a considerable extent undergovernment control. Hindustan Antibiotics, for example, operateslargely by packaging imported ingredients for sale on a monopolymarket. Implicit to the model is the notion that historically derivedcapital-output ratios can be used as a basis for determining requirementsfor new investment. This could only be so if the historically determinedcoefficients are typical of what can be expected in the future, which,in an economy in the process of rapid structural change, is unlikely tobe true.
The allocation of capital and foreign exchange is supposed to be in-fluenced in the model by the imputed returns to inputs of capital andforeign exchange in the various sectOrs. Apart from the fact that theseimputed returns would be initially influenced by India's heavily distortedprice structure, I have great difficulty in understanding what relationthese imputed returns have to the earnings of investment as ordinarilyunderstood. According to the author, "Since the sectoral capacities andthe supply of foreign exchange are the only scarce resources in the sys-tem, the dual problem must consist of imputing those rents to the use ofcapacities and for the use of foreign exchange which exbaust the valueof the total product as well as minimize the cost of production. Theshadow price of foreign exchange must always be positive, since im-ports can always be used to increase the value of the maximand at sometime. The shadow prices or rents of capacities are positive or zero de-pending on whether the capacities of particular sectors are fully or onlypartially utilized."
Marginal rents then are either zero or positive depending on whetherthere is excess capacity. In any particular sector there are likely to beindustries with and without excess capacities. Presumably the optimiz-ing mechanism refrains from allocating new investment to areas accord-ing to the specifications of the aggregate capital coefficients matrix.Different combinations of output targets yield different statements ofcapital requirements. "Barring terminal capital requirements set sohigh as to be infeasible," says the author, "the planner has considerableopportunity for exercising choice. . . ." In fact, the political forcesin India as in many other less developed countries almost invariably settargets that do establish infeasible capital requirements. They may wellbe in process of doing it again in the Indian Fourth Plan, and there isnothing in a linear programing analysis that can prevent this from hap-pening. But even if this were not so, the choices which the model mapsout for the planner are, in my judgment, technocratic rather than eco-nomic choices. There are any number of combinations of outputs that

376 Planning in Individual Countries
can fulfill consistency conditions for current and capital inputs, and amodel such as this can suggest some of them. One of these combinationsis "better" than others, however, only within so limiting a set of assump-tions and constraints as to be of doubtful utility as a guide to policy de-cisions.
Whether any model in which it is assumed that income elasticities ofdemand remain constant, price elasticities of all inputs and outputs areassumed to be zero, there are no diminishing returns to investmentshort of the point at which excess capacity is reached, no economies ofscale, no substitution of factors, and no technological change can pre-tend to offer guidance to optimal investment decisions is certainly opento doubt. As the author says, within any five-year period, changes inthe composition of consumer demand and various substitutions that arepossible within the productive process may be small, but a specificationof terminal conditions on the assumption that subsequent growth willleave these relationships unchanged would seem to perpetuate the rigidi-ties in the system over a longer period.
As I have said earlier, it is somewhat unclear to me whether theauthor sees the model as a planning instrument that can be putto effective use in the near future. If it is to be envisaged as a tentativefirst step toward the creation of a much more complex model capableof taking account of considerations now neglected and awaiting for itsapplication a very substantial accretion and refinement of data, muchof the criticism I have offered is irrelevant. I would be inclined to be im-pressed and depressed by the thought that models of this type are justthe sort of thing that planners love to play with were it not for the factthat initial reactions in India seem to indicate doubts as to policy ap-plicability at least as great as those suggested above. Still, in its presentform, it may well support what seem to me two unfortunate tendenciesin Indian planning: a tendency to think of capital and foreign exchangeas the only necessary inputs and a penchant for controlled rather thanmarket solutions.
There are many alternatives that need to be examined by Indianplanners, but they do not seem to fit very well into a linear programingmodel. Among these are alternative forms of management in public-sector corporations; alternative price policies In electric power, coalmining, transportation, and some other areas; alternative ways of han-dling the serious overvaluation of the rupee; alternative ways of dis-tributing fertilizers, etc. Changes in these and other policies and practiceswill, of course, have repercussions throughout the economy, and it wouldbe highly desirable to have available some technique of general inter-

Planning in India 377
dependence analysis that would help to trace through these repercus-sions. The input-output relations can, at least roughly, be tracedthrough. But economics at this juncture is not quite capable of pro-viding an effective optimizing instrument, I think—at least not in India.I see no alternative, under present circumstances, to the slow iterativeprocedures now being followed in most effective planning operations.
Alan S. Manne, Stanford University
The Eckaus model of India's Third Plan is a welcome addition tothe literature on planning methodology. Unlike most other numericalmodels with interindustry detail, attention is focused on the time pathof adjustment. Rather than assume a smooth transition from the initialto the terminal conditions, the intertemporal choices are examinedexplicitly. However, before taking the numerical conclusions of thismodel too seriously for policy purposes, the following technical pointsshould be borne in mind:
1. In principle, the model could make allowance for technologicalchange, but, in fact, this has not been done. Without having allowedfor upward changes in input coefficients of certain consuming in-dustries, it is clear that the resulting output targets have a downwardbias. This would lead to significant errors in a number of rapidlygrowing and capital intensive sectors: chemical fertilizers, electricpower, petroleum, and steel. E.g., without allowing for an increasein the input coefficient of chemical fertilizers into agriculture, thefertilizer output target will be grossly underestimated.
2. It is not a safe gamble to suppose that output in the agriculturalsector will respond within a three-year period with the capital invest-ment coefficients assumed here. True, better organization and educa-tion within this sector (plus fertilizers and improved seeds) could bythemselves do the job. Nevertheless, it seems to many observers thatthis sector is going to require massive injections of fixed capital:irrigation work of all types, soil improvement, tractors, and imple-ments. These major investments constitute an alternative route—albeitan expensive one—for increasing agricultural output. It appears unwiseto recommend that India's planners ought to gamble exclusively on thelow-cost route via organization and education.
If these things are so, it follows that the most significant computerruns are those based on a pessimistic capital-output ratio for agriculture—perhaps 2.0:1 or even higher.
3. From the written presentation, it is not clear how much optimism

378 Planning in Individual Countries
has entered into the assessment of possibilities for import substitution.Informally, the author commented that the shadow price on foreignexchange occasionally turned out to be less than unity, and so it appearsthat foreign exchange did not constitute a serious bottleneck for themodel.
To most Indian planners, the foreign exchange bottleneck appearscritical. This is what motivates the emphasis upon the heavy engineer-ing industries. It would be desirable if the author were to present amore detailed tabulation of the model's allocations of foreign ex-change.
4. With a time horizon as short as five years, together with theinitial conditions applicable during the first three of these years, itis little wonder that the model is insensitive to alternate forms of thepayoff function. An investment allocation model of this type probablyneeds to be studied in the context of a time horizon of at least ten years.The longer time horizon is particularly important since it is known thataggregative models of this type (maximum discounted instantaneousconsumption) have a curious tendency toward flip-flop behavior.Whenever the discount rate lies below a certain critical level, nothingis consumed and everything is invested during the initial phase. Abovethis critical rate, everything is consumed and nothing is invested. Theauthor has not yet established that flip-flop behavior will fail to occurin a disaggregated model with a ten- or twenty-year time horizon.
Related Documents