Pengjun Zhao, Gert de Roo, Bin Lu; Planning for low-carbon urban growth; 45th ISOCARP Congress 1 Planning for low-carbon urban growth: the impact of urban form on transport and the environment on the urban fringe of Beijing 1. Introduction The capacity to reduce greenhouse gas emissions in cities and thereby achieve low-carbon cities is increasingly attracting the attention of those concerned with issues related to global climate change. Sustainable transport, characterized by less reliance on cars and fewer kilometres travelled by car, is seen as one of necessary principles in low-carbon city strategies. In the megacities of developing countries, sustainable transport is a primary issue related to the local and global environment (Gwilliam et al., 2004). According to the most recent data available, the annual growth rate in CO 2 emissions by the transport sector in developing countries is projected to be 3.4 percent (IEA, 2006). Moreover, in the context of rising motorization, the environmental effects of transport tend to be more negative. For example, estimates suggest that the developing world’s share of cars will rise from 25 percent in 1995 to 48 percent in 2050 (United Nations, 2001). In China, between 2001 and 2005, the private vehicle fleet grew by an average of 23 percent annually to over 18 million vehicles. In the same period, the transport sector’s use of petroleum increased from 24.6 percent to 29.8 percent of total use, and it is projected to reach 47 percent in 2030. Cars accounted for 7 percent of domestic CO 2 emissions and these are forecast to increase due to the rapid process of motorization (World Bank, 2007). This situation is more serious in the megacities. For example, in Beijing the number of private cars had reached 3.25 million in 2008, and will still increase at 15 percent annually in the coming years. Within a five-year period (2000–2005), trips by private cars increased by 6.6 percent, while trips by public transport only increased by 3.3 percent, with trips by bicycle decreasing by 3.3 percent. The transport sector accounted for 15 percent of urban energy consumption. Road transport- related air pollution was 23 percent of total air pollution, close behind industrial pollution (Huang, 2009). The emissions of CO, HC and NO x from road transport accounted for 78 percent, 83 percent and 46 percent respectively, of total emissions in the city. Many factors are claimed to strengthen the environmental effects related to motorized travel; for example, rapid urbanization and continuing population growth, skyrocketing motorization, rising incomes, improvements in the road system in the suburbs, weak traffic management and the vehicle and fuel technologies. Accordingly, various methods have been employed in an attempt to mitigate the environmental effects of motorized mobility, primarily air emissions management, technological innovations designed to reduce vehicle emissions, enhanced technology of vehicle fuel efficiency and travel-demand management designed to decrease car use. However, these methods are often criticized for various reasons. Firstly, although advances in technology can eventually reduce fuel usage and emissions per vehicle, the outcomes of these technological improvements may be offset by increasing car ownership and use (WBCSD, 2001). Secondly, changing people’s attitudes to dependence on and use of cars will be difficult due to increasing incomes and improvements in lifestyles (Ryley, 2001). Thirdly, financial approaches, such as indirect taxation policies including parking charges, fuel-tax levies, road tolls and distance-based charges, are often believed to contribute little to carbon reduction (Anable and Boardman, 2005). Therefore, more effective policy instruments could be added to reduce the negative environmental effects of transport. In relation to individual travel behaviour, the goal of accessibility is the primary concern in terms of increasing mobility. People do not need mobility in itself, normally, but rather a level of accessibility which enhances the degree to which they are able to participate in spatially unconnected activities such as jobs, shopping and schooling (Bertolini and le Clercq, 2003). Accordingly, spatial planning, considered with an emphasis on accessibility, would have a significant effect on individual travel patterns by giving shape to a proposed land- transport system. In fact, the potential contribution of spatial planning to the reduction of the environmental effects of transport has been substantiated by many empirical studies (see for example, Grazi et al., 2008; Hickman and Banister, 2007; Newman and Kenworthy, 1989),

Welcome message from author
This document is posted to help you gain knowledge. Please leave a comment to let me know what you think about it! Share it to your friends and learn new things together.
Transcript

Pengjun Zhao, Gert de Roo, Bin Lu; Planning for low-carbon urban growth; 45th ISOCARP Congress
1
Planning for low-carbon urban growth: the impact of urban form on transport and the environment on the urban fringe of Beijing
1. Introduction
The capacity to reduce greenhouse gas emissions in cities and thereby achieve low-carbon cities is increasingly attracting the attention of those concerned with issues related to global climate change. Sustainable transport, characterized by less reliance on cars and fewer kilometres travelled by car, is seen as one of necessary principles in low-carbon city strategies. In the megacities of developing countries, sustainable transport is a primary issue related to the local and global environment (Gwilliam et al., 2004). According to the most recent data available, the annual growth rate in CO2 emissions by the transport sector in developing countries is projected to be 3.4 percent (IEA, 2006). Moreover, in the context of rising motorization, the environmental effects of transport tend to be more negative. For example, estimates suggest that the developing world’s share of cars will rise from 25 percent in 1995 to 48 percent in 2050 (United Nations, 2001). In China, between 2001 and 2005, the private vehicle fleet grew by an average of 23 percent annually to over 18 million vehicles. In the same period, the transport sector’s use of petroleum increased from 24.6 percent to 29.8 percent of total use, and it is projected to reach 47 percent in 2030. Cars accounted for 7 percent of domestic CO2 emissions and these are forecast to increase due to the rapid process of motorization (World Bank, 2007). This situation is more serious in the megacities. For example, in Beijing the number of private cars had reached 3.25 million in 2008, and will still increase at 15 percent annually in the coming years. Within a five-year period (2000–2005), trips by private cars increased by 6.6 percent, while trips by public transport only increased by 3.3 percent, with trips by bicycle decreasing by 3.3 percent. The transport sector accounted for 15 percent of urban energy consumption. Road transport-related air pollution was 23 percent of total air pollution, close behind industrial pollution (Huang, 2009). The emissions of CO, HC and NOx from road transport accounted for 78 percent, 83 percent and 46 percent respectively, of total emissions in the city.
Many factors are claimed to strengthen the environmental effects related to motorized travel; for example, rapid urbanization and continuing population growth, skyrocketing motorization, rising incomes, improvements in the road system in the suburbs, weak traffic management and the vehicle and fuel technologies. Accordingly, various methods have been employed in an attempt to mitigate the environmental effects of motorized mobility, primarily air emissions management, technological innovations designed to reduce vehicle emissions, enhanced technology of vehicle fuel efficiency and travel-demand management designed to decrease car use. However, these methods are often criticized for various reasons. Firstly, although advances in technology can eventually reduce fuel usage and emissions per vehicle, the outcomes of these technological improvements may be offset by increasing car ownership and use (WBCSD, 2001). Secondly, changing people’s attitudes to dependence on and use of cars will be difficult due to increasing incomes and improvements in lifestyles (Ryley, 2001). Thirdly, financial approaches, such as indirect taxation policies including parking charges, fuel-tax levies, road tolls and distance-based charges, are often believed to contribute little to carbon reduction (Anable and Boardman, 2005). Therefore, more effective policy instruments could be added to reduce the negative environmental effects of transport.
In relation to individual travel behaviour, the goal of accessibility is the primary concern in terms of increasing mobility. People do not need mobility in itself, normally, but rather a level of accessibility which enhances the degree to which they are able to participate in spatially unconnected activities such as jobs, shopping and schooling (Bertolini and le Clercq, 2003). Accordingly, spatial planning, considered with an emphasis on accessibility, would have a significant effect on individual travel patterns by giving shape to a proposed land-transport system. In fact, the potential contribution of spatial planning to the reduction of the environmental effects of transport has been substantiated by many empirical studies (see for example, Grazi et al., 2008; Hickman and Banister, 2007; Newman and Kenworthy, 1989),

Pengjun Zhao, Gert de Roo, Bin Lu; Planning for low-carbon urban growth; 45th ISOCARP Congress
2
while Gordon (1997), for example, concluded that about one-third of the variation in per capita transport energy consumption is attributable to land use characteristics.
Examining the case of Beijing, the aim of this paper is to study the impact of urban form on urban transport on the city fringe and to reveal the performance of compact form in reducing carbon emissions in this context, and in this way develop the policy implications related to spatial planning for sustainable transport and low-carbon growth. Firstly, the relationship between urban form and two patterns of resident journey to work (JTW) are examined empirically using household survey data. The first pattern is car mode choice, estimated by the multinomial logit (MNL) model, in which socioeconomic and reference factors are controlled for. The second is the vehicle hours travelled (VMT) for the journey to work, which is estimated by a multiple regression analysis. Secondly, based on the empirical analysis, two scenarios are examined to reveal the potential contribution of alternative compact forms to reduce transport energy consumption and emissions.
2. Spatial planning, mobility and the environment
Spatial planning, facilitating urban form, can potentially contribute to the mitigation of environmental problems caused by transport. Many empirical studies have already found that as well as transport services, urban form can have a significant effect on travel patterns, even when resident socioeconomic factors are taken into account (for example, Ewing, 1995; Ewing et al., 1996; Frank and Pivo, 1994; Kitamura et al., 1997; Stead, 2001). Stead (2001) found that land use characteristics explain up to 27 percent of the variation in travel distances per person at the survey area level of analysis, although half of the variation in travel distance per person across different zones was explained by socioeconomic factors. Other research has found that the features of compact land development on the urban fringe, such as high density, a high level of jobs-housing balance and compact physical pattern, would enhance people’s accessibility to facilities and services, and thereby reduce the overall need for travel and the distance and duration of motorized journeys (for example, Cervero, 1995; Levinson and Kumar, 1997; Schwanen et al., 2004).
A recent study conducted by Grazi et al. (2008) using housing survey data in the Netherlands showed that the density of urban form has a significant impact on mobility (commuting distance and mode choice) and thus on CO2 emissions. They found that workers living in the highest density locations (more than 25 houses per hectare) tend to travel about 11.9 km less than workers in the least dense location. In more densely populated areas workers tend to change from car to other travel modes, notably public transport (metro and tram). Accordingly, the predicted CO2 emissions per passenger are lower in the highest density areas. When a worker migrates from lowest to highest urban density level, the CO2 emissions per passenger will be reduced by 47 percent.
In relation to cities found in developing countries, the form of land use is often believed to have a major influence on commuting patterns (Gauray et al., 1998; Khisty, 1993), although empirical research is scarce. For example, in megacities such as Kuala Lumpur, Jakarta and Manila there has been dramatic new development, characterized by urban sprawl on the city fringe, and it is claimed that this has led to longer commuting distances and greater traffic congestion in the central city area (Barter, 2000). Some studies have reported that rapid changes in land use, combined with other social and economic factors, have had an impact on travel patterns in China’s megacities, for example in Shanghai (Cervero and Day, 2008; Pan et al., 2009) and Beijing (Wang and Chai, 2008; Yang, 2006). Yang (2006) found that residential relocation to the city’s periphery, which has a low-level local jobs-housing balance, lengthened commuting times in Beijing. Wang and Chai (2008) found that decreases in the jobs-housing balance caused by the dismantling of the danwei (work unit) system have increased the demand for longer travel. A recent study by Pan et al. (2009) revealed that longer travel demand and greater car usage are caused by new forms of land development at the neighbourhood level, that is, the non-pedestrian/cyclist-friendly urban form which emerged after the 1990s.

Pengjun Zhao, Gert de Roo, Bin Lu; Planning for low-carbon urban growth; 45th ISOCARP Congress
3
Spatial planning will have an impact on mobility through its effects on aspects of urban form, including density, mixed land use and accessibility to transport infrastructures. These aspects of urban form determine the provision of housing location, workplace, the distribution of urban facilities and transport connections between locations and activities. Urban form defines basic contexts and constraints on individual travel behaviour. If a given urban form is promoted to reduce the need for motorized travel, spatial planning could be seen to have a prominent role in achieving this objective (Banister et al., 1997). Furthermore, workers’ travel patterns are also influenced by socioeconomic factors (Frank and Pivo, 1994; Stead, 2001). For example, Dieleman et al. (2002) found that people with higher incomes are more likely to own and use a private car than low-income households, while families with children use cars more often than single-person households. Household attitudes and preferences regarding residential location also have a significant impact on travel distance and travel mode choice (see review of Cao (Jason) et al., 2009). Without considering these socioeconomic and attitudinal factors, research into the impact of urban form on travel behaviour would present biased findings. Accordingly, this paper provides a more nuanced framework with which to view the impact of urban form on transport and related environmental issues (see Figure 1). The diagram conceptualizes the general relationship between urban form, transport and their environmental effects of energy consumption and CO2 emissions. The figure indicates the implications of spatial planning on the urban fringe for containing motorized mobility and contributing to low-carbon city objectives.
Figure 1: The relationship between spatial planning, transport and the environment
Urban form
(density, mixed land use, and
accessibility to transport
infrastructure and facilities)
Spatial Planning
Travel behaviour
(mode choice, vehicle kilometres
travelled)
Socioeconomic factors
(personal and household
characteristics)
Attitudes to residential
locations
Environmental effects
(energy consumption and carbon
dioxide emissions)
3. City context of Beijing
The city of Beijing has existed for more than 3,000 years and has been China’s capital since the thirteenth century. Beijing is a municipality directly governed by the central government. It has a land area of 16,410 square kilometres, stretching 160 kilometres from east to west and more than 180 kilometres from north to south. In 2006, its total population was 16.8 million (BSB [Beijing Statistic Bureau], various years). Beijing has a traditional city centre urban form, typical of China’s cities. The central area of a traditional Chinese city is characterized by a single central area which is connected to suburban areas by ring and radial motorways (see Figure 2).
Since the early 1980s, in parallel with the economic and political transformation process, Beijing has been undergoing rapid urban expansion stimulated by suburbanization. The obvious suburbanization of the population is characterized by the growth of the population in suburban districts of the city and the loss of population in the central districts. Suburbanization has greatly expanded Beijing’s urban space to the extent that, from 1981 to 2004, the built-up area of Beijing increased 3.5 times, from 310 square kilometres to 1,085

Pengjun Zhao, Gert de Roo, Bin Lu; Planning for low-carbon urban growth; 45th ISOCARP Congress
4
square kilometres. After the 1990s especially, new industrial high-tech zones and new housing estates in the peripheral areas appeared and started to shape Beijing into a poly-nucleated form (Ma, 2004). Figure 2: Urban form and the road transport system in Beijing
Source: the author, edited from BIUPD (Beijing Institute Urban Planning and Design), (2004).
In the context of such rapid urban growth, the process of motorization started in Beijing at
the end of the 1990s. The number of vehicles increased rapidly at an average rate of 15 percent each year from 2000 to 2008. Compared with the relatively stable levels in the numbers of urban residents, the dramatic increase in vehicles reflects a significant growth in vehicle ownership. In particular, the increasing levels of private car ownership has made a major contribution to this increase. The number of private cars increased almost five times between 2000 and 2005. This rapid process of motorization has also brought great challenges to the pursuit of an environmentally sustainable form of development in Beijing.
4. Methodology
4.1 Travel data
The travel data used in this paper is derived from a household interview survey conducted in Beijing in 2006. Among other questions, employed respondents were asked to report their one-way commuting time on average, and their travel mode for the journey to work. The respondents were also requested to provide information about their personal and household characteristics, such as the number of individuals employed, their occupations, travel modes and the annual household income. Questions about their attitudes and preferences concerning housing location choice were also asked. In the analysis in this paper, 370 employed respondents living on the urban fringe were used to reveal the impact of urban form on commuting on the city fringe. The area considered to be part of the city fringe is the

Pengjun Zhao, Gert de Roo, Bin Lu; Planning for low-carbon urban growth; 45th ISOCARP Congress
5
area in the inter-suburban districts which are generally located outside the Fourth Ring Road (see Figure 2). Table 1 provides a summary of the sample. Table 1: Data summary of the sample and individual worker’s commuting pattern
Variables Classification Cases Percentage
Commuting pattern Commuting by public transport 115 31.1
Commuting by car 68 18.4
Commuting by foot, bicycle or other transport mode 187 50.5
Household annual income Less than 20,000 (RBM) 88 23.8
Between 20000 and 50000 (RBM) 208 56.2
Equal or above 50000 (RBM) 74 20.0
Occupation Low-skilled professional or office worker 199 53.8
Middle or high-level professional or office worker 87 23.5
Other occupation 84 22.7
Gender Male worker 245 66.2
Female worker 125 33.8
Family composition Two earners 269 72.7
Single earner 101 27.3
Household preferences Prefer higher quality of community living environment 99 26.8
Prefer higher proximity to workplace 57 15.4
Prefer higher accessibility to transport 88 23.8
Prefer other features of the community in which they live 126 34.1
Total 370 100
4.2 Variables
In this paper, a multiple regression analysis is applied to examine the relationship between urban form and commuting patterns. The factors of urban form are analysed as independent variables. Urban form is measured in terms of density, mixed land use and transport accessibility. As mentioned in Section 2, many studies have reported that individual and household socioeconomic characteristics and household attitudes and preferences can largely explain variations in commuting patterns. Without controlling for such socioeconomic and preference factors, a study which attempts to examine the impact of urban form on commuting could not provide an adequate understanding of the relationship between land use and commuting patterns. This study employed a multiple regression analysis to examine the effects of urban form in relation to commuting patterns, while controlling for socioeconomic and preference factors. In this study, four variables were selected to indicate individual and household socioeconomic characteristics. They were the worker’s gender, annual household income, household composition (number of earners) and the worker’s occupation. Four variables were used to indicate household preferences regarding residential location choice: a preference for a higher quality community living environment, for closer proximity to the workplace, for greater accessibility to transport, or for other features of the community where they live.
4.3 Methods
The multinomial logit (MNL) model is applied to estimate workers’ travel mode choice. Public transport is seen as reference category. The probability of choosing the car mode or foot and bicycling mode can be presented as:
( )( ) 31321211110
lnlog XXXXpublicYP
XcarYPitP
carβββα +++=
=
== , and
( )( ) 32322212120&
&lnlog XXX
XpublicYP
XbfYPitP
bfβββα +++=
=
== , where
caritPlog and
caritPlog present the
value of the natural logarithm of probability at which a worker chooses car mode and foot or
Pengjun Zhao, Gert de Roo, Bin Lu; Planning for low-carbon urban growth; 45th ISOCARP Congress
6
bicycling or other mode (represented by ‘ bf & ’) respectively, compared with the probability
of choosing public transport. α is constant and β is a coefficient which will be estimated. 1
X
represents the sector of variables indicating urban form; 2
X stands for the sector of
socioeconomic factors; and 3
X represents the sector of preference factors.
Normally, the environmental effects of transport are examined though travel distance and travel duration by vehicle, for example vehicle kilometres travelled (VKT) and vehicle hours travelled (VHT). However, VKT only reflects circuituity. VHT reflects both of circuituity and increased congestion. Traffic congestion has been reported as one main aspect of transport in megacities that has an effect on the environment. For example, road congestion has led to the consumption of an additional 0.3 million tonnes of petrol each year since 2004. Accordingly, this paper reveals the environmental effects of urban form and transport by examining the time taken by workers when commuting by car. Workers’ commuting time by car is estimated as:
32322212130XXXT
carβββα +++= , where
carT is workers’ commuting time by car. α , β ,
1X ,
2X
and 3
X are defined as above.
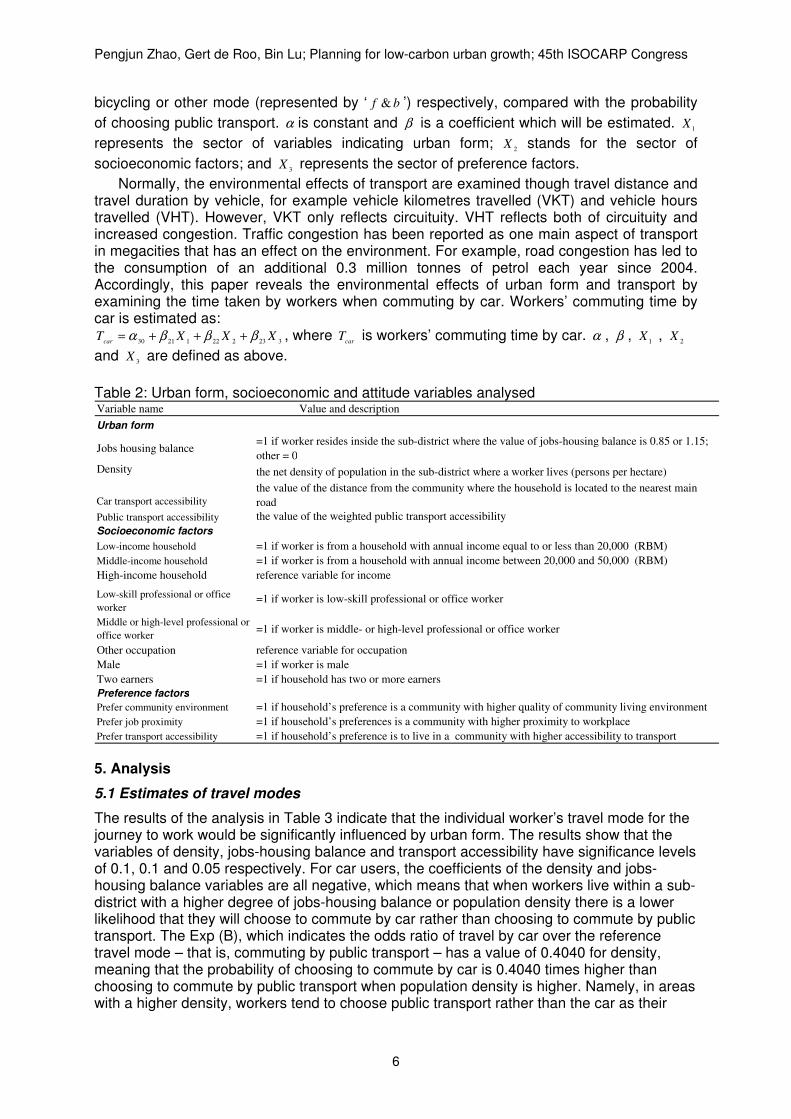
Table 2: Urban form, socioeconomic and attitude variables analysed Variable name Value and description
Urban form
Jobs housing balance=1 if worker resides inside the sub-district where the value of jobs-housing balance is 0.85 or 1.15;
other = 0
Density the net density of population in the sub-district where a worker lives (persons per hectare)
Car transport accessibility
the value of the distance from the community where the household is located to the nearest main
road
Public transport accessibility the value of the weighted public transport accessibility
Socioeconomic factors
Low-income household =1 if worker is from a household with annual income equal to or less than 20,000 (RBM)
Middle-income household =1 if worker is from a household with annual income between 20,000 and 50,000 (RBM)
High-income household reference variable for income
Low-skill professional or office
worker=1 if worker is low-skill professional or office worker
Middle or high-level professional or
office worker=1 if worker is middle- or high-level professional or office worker
Other occupation reference variable for occupation
Male =1 if worker is male
Two earners =1 if household has two or more earners
Preference factors
Prefer community environment =1 if household’s preference is a community with higher quality of community living environment
Prefer job proximity =1 if household’s preferences is a community with higher proximity to workplace
Prefer transport accessibility =1 if household’s preference is to live in a community with higher accessibility to transport
5. Analysis
5.1 Estimates of travel modes
The results of the analysis in Table 3 indicate that the individual worker’s travel mode for the journey to work would be significantly influenced by urban form. The results show that the variables of density, jobs-housing balance and transport accessibility have significance levels of 0.1, 0.1 and 0.05 respectively. For car users, the coefficients of the density and jobs-housing balance variables are all negative, which means that when workers live within a sub-district with a higher degree of jobs-housing balance or population density there is a lower likelihood that they will choose to commute by car rather than choosing to commute by public transport. The Exp (B), which indicates the odds ratio of travel by car over the reference travel mode – that is, commuting by public transport – has a value of 0.4040 for density, meaning that the probability of choosing to commute by car is 0.4040 times higher than choosing to commute by public transport when population density is higher. Namely, in areas with a higher density, workers tend to choose public transport rather than the car as their

Pengjun Zhao, Gert de Roo, Bin Lu; Planning for low-carbon urban growth; 45th ISOCARP Congress
7
mode of travel to work. Similarly, in a zone with a high jobs-housing balance, the likelihood of choosing to commute to work by car is 0.8275 times higher than choosing to commute by public transport, that is to say, a worker’s probability of choosing public transport is 1.2085 times higher than choosing to commute by car.
Table 3: Multinomial logit (MNL) model analysis for workers’ travel mode (n = 370)
Independent variables B Wald Exp(B) B Wald Exp(B)
Intercept 0.0498 0.0016 5.4282 25.403***
Urban form
Density -0.6038 3.782* 0.4040 0.0714 3.9362* 0.7986
Jobs-housing balance -0.8611 3.4024* 0.8275 0.6911 4.2742* 1.9960
Public transport accessibility 0.0022 0.0005 1.0020 0.0551 0.3969 1.0567
Car transport accessibility 1.6717 5.4000** 5.3210 0.0269 0.0015 1.0273
Socioeconomic factors
Male -0.1291 0.0704 0.8790 -1.0023 5.3293** 0.3670
Two earners 0.0656 0.0180 0.9370 -0.2292 0.2600 0.7952
Low income -0.2429 0.1460 0.7840 -0.0005 0.0000 0.9995
Middle income 0.4976 4.9464* 1.6080 -0.2617 4.2639* 0.7698
Low-skill professional or office
worker-1.3698 4.9122** 3.9340 0.0015 0.0000 1.0015
Middle or high-level professional or
management worker2.6967 15.4567*** 14.8300 -0.6472 5.0463* 1.9102
Preference factors
Prefer community environment 0.8755 3.9597* 2.4000 -0.2289 0.2221 0.7954
Prefer job proximity 0.0610 0.0133 1.0630 0.4971 0.3594 1.6440
Prefer transport accessibility 0.1024 0.0384 1.1080 -0.3514 0.5139 0.7037
Commuting time -0.0964 42.0952*** 0.9080 -0.1420 78.7624*** 0.8676
Model Fit Information -2LL (-2 times Log Likelihood) Chi-Square Sig.
443.6 302.9 0.000
PCP (percentage correctly predicted): 74.1
ªThe reference category is ‘commute by public transport’.
*indicates significance at 0.1 level; ** indicates significance at 0.05 level; ***indicates significance at 0.01 level
Carª Foot, bycicle or other transport modeª
Table 3 shows that the probability of a worker choosing to commute by foot, bicycle or other transport mode will become higher when the worker resides in an area with higher density or higher jobs-housing balance. The value of Exp (B), 0.7986, indicates that in higher density areas, the probability of choosing public transport is higher than choosing foot, bicycle or another transport mode. Similarly, a high jobs-housing balance would enhance the probability of choosing foot, bicycle or other transport mode. However, this probability is higher than that of choosing public transport, according to the value of Exp (B) (1.9960).
Table 3 also reveals the worker’s choice of car over foot, bicycle or other transport mode on the basis of the two odds ratios. Because both odds ratios use ‘commute by public transport’ as the reference travel mode, the ratio of the odds ratios is given in two volumes, for example, the ratio of the odds ratios of density, 0.7986/0.4040 = 1.9767, gives the odds of choosing to commute by foot, bicycle or other transport mode over commuting by car. In this case, the value of 1.9767 indicates that the probability of choosing foot, bicycle or other transport mode is 1.9767 times higher than that of choosing the car in an area with higher density. Similarly, in a zone with a high jobs-housing balance, the probability of commuting by car is lower than that of foot, bicycle or other transport mode.
5.2 Regression analysis of commuting time by car
The results in Table 4 show that on the city fringe, urban form would have an impact on worker’s commuting time by car. The variables indicating aspects of urban form, such as

Pengjun Zhao, Gert de Roo, Bin Lu; Planning for low-carbon urban growth; 45th ISOCARP Congress
8
density, jobs housing balance and transport accessibility, have statistically significant relationships with a worker’s commuting time by car. The negative coefficients of density and jobs-housing balance reveal that when a worker lives in a zone with a higher density or higher jobs-housing balance, he or she has a reduced commuting time by car. Similarly, the higher the level of public transport accessibility, the shorter the commuting time by car. One main reason for this may be that a high level of public transport provision would increase the use of public transport, which reduces road congestion. As a result, the commuter who travels by car will have a decrease in commuting time. These results suggest that spatial planning on the urban fringe would reduce the vehicle hours travelled (VHT) if it pursued high density, a better jobs-housing balance and high levels of public transport accessibility. Table 4: Regression analysis for workers’ one-way commuting time by car (n = 67)
B (unstandardized
coefficients)
Beta (Standardized
Coefficients)
t statistics
Intercept 1.631 0.1432
Urban form
Density -0.0764*** 0.374 -3.3584
Jobs-housing balance -2.5453* -0.0809 -1.9402
Public transport accessibility -1.7589** -0.2671 -2.0361
Car transport accessibility 8.7256* 0.1977 1.4602
Socioeconomic factors
Male -2.7241 -0.0715 -0.6439
Two earners 5.7218 0.1576 1.3045
Low income 9.4507* 0.2603 1.8666
Middle income 5.6823 0.1844 1.4701
Low-skill professional or office worker 15.1938** 0.4924 2.2955
Middle or high-level professional or office worker 7.9586 0.2242 1.2249
Preference factors
Prefer community environment 6.0308* 0.1757 1.837
Prefer job proximity -6.4936 -0.1429 -1.1031
Prefer transport accessibility 1.8803 0.0548 0.3966
R Square 0.434
Adjusted R Square 0.298
Std. Error of the Estimate 12.997
F 3.191
Sig. (a) 0.001
Notes:** indicates significant at p < 0.05; and * denotes significant at p < 0.10.
The variable of car transport accessibility has a relatively significant but positive
coefficient. This means that higher car transport accessibility is associated with longer commuting time. It also suggests that the provision of road transport infrastructure, particularly motorways, would lead to longer commuting times by car. It reflects the negative environmental effects of the current policy in Beijing, which focuses on the provision of major road projects to meet the ever-growing demand for mobility.
The empirical analysis above verifies that there is a significant relationship between urban form and travel patterns. The results also present evidence supporting the suggestion that compact urban form has a positive influence, reducing car use and decreasing the hours required to travel to work by car. Most of these findings are consistent with the conclusions of previous studies which use case studies in developed countries as reviewed in Section 2.
5.3 Savings in energy consumption and CO2 emissions from urban form
On the basis of the empirical findings above, this section will evaluate the potential consequences of compact urban form on energy consumption and CO2 emissions. The

Pengjun Zhao, Gert de Roo, Bin Lu; Planning for low-carbon urban growth; 45th ISOCARP Congress
9
reference situation is energy consumption and emissions from the journey to work (JTW) by passenger car in 2005. Table 5: Travel distance and mode in Beijing, 2005
Total Car Bus Metro Bicycle Walking and other modes
Total passenger trips on the urban fringe
(million passengers* trips /day) (pt )
21.5
Transport mode (percent) (tm ) 100 23.0 19.1 2.9 19.3 35.7
Trip frequency (trips/day) (tf ) 2.53
Vehicle occupancy (passengers per trip) (pp ) 1.26
Travel distance in average (km/per trip) (kmt ) 11.1 6.6 14
Purpose of trip (percent) 100
Journey to work 42.7
Daily living (shopping, school, etc.) 41.5
Other activities (entertainment, leisure, etc.) 15.8
Travel time per trip (minutes) 48.3 24.3 53.3 Data source: the author, edited from BTC (Beijing Transport Committee), 2005.
Table 5 shows the overall situation in relation to travel distance and transport mode in
Beijing in 2005, edited from the data of the Third City Transport Survey (BTC [Beijing Transport Committee], 2005). The total annual vehicle kilometres travelled (VKT) for JTW is
calculated as: ( )[ ] ppkmttftmptVcarcar
×××××= %7.42365 , where carV is annual kilometres
travelled for JTW by passenger car. The energy consumption and emissions are calculated using LEAP, the Long-range Energy Alternatives Planning System, which is a software tool used for energy policy analysis and climate change mitigation assessment developed at the Stockholm Environment Institute. In the modelling process, the energy intensity and emissions factors are adapted to the Chinese context. The results in Table 6 show that within China, passenger cars used for JTW consume 29.8 million gallons of petrol, producing a global-warming potential CO2 equivalent of 304.7 million kilograms.
Life-cycle energy analysis is conducted to compare the full range – ‘cradle-to-grave’ – of environmental effects of all energy use. Life-cycle energy inputs not only include direct energy inputs during vehicle operation, but also all the energy inputs of the fuel cycle, from wells to wheels, as well as the input needs for the complete vehicle cycle, including material recovery and vehicle disposal. This paper undertakes an analysis using the tool GREET, the Greenhouse Gases, Regulated Emissions, and Energy Use in Transportation Model, a fuel-cycle model developed by the Argonne National Laboratory in the USA. Table 6 presents the life-cycle energy demand of passenger cars in Beijing in 2005 as 37.7 million gallons of petrol, creating CO2 equivalents of 371.6 million kilograms. Table 6: Savings in energy consumption and emissions in journey to work by car
Energy consumption
in vehicle operation
Life-cycle energy
demand
Global-warming potential
CO2 equivalents
Life-cycle emissions of
CO2
Million Gallons
Petrol Equivalents
Million Gallons
Petrol Equivalents
Million Kilogrammes Million Kilogrammes
Estimate of actual situation 29.8 37.3 304.7 371.6
Scenario 1: Compact land use 24.6 30.8 266.9 331.4
Scenario 2 : Compact transit city 21.4 26.7 223.7 255.7
Savings by changing compact land use 5.2 6.5 37.8 40.2
A ‘what if’ approach is applied to analyse the different consequences arising from two different scenarios, based on two different urban forms examined in 2005. The first scenario is ‘compact land use’, which is characterized by only land use changes leading to higher urban density, a higher level of jobs-housing balance and higher level of public transport

Pengjun Zhao, Gert de Roo, Bin Lu; Planning for low-carbon urban growth; 45th ISOCARP Congress
10
accessibility. The second scenario is the ‘compact transit city’, which is represented by these changes in land use as well as enhanced public transport mode share indicated by the decreases in car usage for JTW.
According to the above analysis in Sections 5.2 and 5.3, commuting time by car and the use of the car would be reduced when there are increases in density, the jobs-housing balance and public transport accessibility. For example, Table 4 suggests that an increase in net population density of 10 persons per hectare would cause a reduction of 0.764 minutes in commuting time. Similarly, growth in the jobs-housing balance and public transport accessibility would be related to decreases in commuting times. These savings on commuting times by car due to changes in aspects of urban form can be transferred into savings of kilometres travelled by car, considering a given speed. Scenario 1 – ‘compact land use’ – in Table 6 assumes that urban form has changed insofar as net population density has increased by 10 residents per hectare, the jobs-housing balance has risen to a high level and public transport accessibility has increased by one unit. Accordingly, on average more than 5 minutes will be saved by each worker commuting by car from the city fringe, when other factors potentially influencing commuting travel remain unchanged. Considering this rate of time-saving, the savings in total annual kilometres travelled by car on the city fringe of Beijing in 2005 can be calculated based on a car speed of 35 km/h. Then the savings of transport energy consumption and CO2 emissions will be estimated. Table 6 shows that 5.2 million gallons of petrol will be saved in Scenario 1, accounting for 17.4 percent of the energy consumed in the actual situation, while CO2 will be reduced by 37.8 million kilograms. Life-cycle energy demand will be reduced by 6.5 million gallons of petrol and emissions of CO2 by 40.2 million kilograms. In Scenario 2 – the ‘compact transit city’ – which includes these changes in urban form, car usage for commuting decreases by 3 percent in response to the increased use of public transport. The modelling results shown in Table 6 reveal that energy consumption and emissions by cars used for commuting are dramatically reduced.
6. Conclusion
Sustainable transport has become a key issue with respect to low-carbon city because transport is a major contributor to energy consumption and CO2 emissions. The development of sustainable transport is particularly crucial in the rapidly growing megacities of China, as these megacities have been undergoing dramatic urban expansion combined with a process of rapid motorization. Planning urban form to achieve sustainable transport on the city fringe would contribute much to an overall city strategy designed to build a low-carbon city.
Using the case of Beijing, the empirical findings in this paper show that aspects of urban form have significant effects on workers’ car use and travel duration of the journey to work by car, with socioeconomic factors and household preferences regarding residential location being taken into account. Higher density, a high level of jobs-housing balance and a high level of public transport accessibility would all play a positive role in reducing car use and commuting times by car, on the city fringe. The outcomes of the scenarios have substantiated the positive performance of compact form in creating savings in energy consumption and CO2 emissions. These results suggest that spatial planning would play a positive role in obtaining low-carbon city objectives.
References
Anable J, Boardman B (2005) "Transport and CO2 ", UKERC Working Paper, August 2005 Banister D, Watson S, Wood C (1997) "Sustainable cities: transport, energy, and urban form",
Environment and Planning B, Vol. 24, No. 1, pp. 125-143 Barter P A (2000) "Transport dilemmas in dense urban areas: examples from Eastern Asia",
in Compact cities: sustainable urban forms for developing countries Eds M Jenks, R Burgess, London: E & FN Spon Press, pp. 271-284
Bertolini L, le Clercq F (2003) "Urban development without more mobility by car? Lessons from Amsterdam, a multimodal urban region", Environment & Planning A, Vol. 35, No. 4, pp. 575-589

Pengjun Zhao, Gert de Roo, Bin Lu; Planning for low-carbon urban growth; 45th ISOCARP Congress
11
BIUPD (Beijing Institute Urban Planning and Design), 2004, "Beijing City Master Plan (2004-2020)(in Chinese: Beijing cheng shi gong ti gui hua 2004-2020)".
BSB (Beijing Statistic Bureau), various years Beijing Statistic Yearbook (in Chinese: Beijing shi tong ji nian jian), Beijing Statistic Bureau.
BTC (Beijing Transport Committee), 2005, "Beijing Third (2005) Travel Surveys (in Chinese: Beijing di san ci jiao tong diao cha)", Beijing Transport Committee.
Cao (Jason) X, Mokhtarian P L, Handy S L (2009) "Examining the Impacts of Residential Self-Selection on Travel Behaviour: A Focus on Empirical Findings", Transport Reviews, Vol. 29, No. 3, pp. 359 - 395
Cervero R (1995) "Planned communities, self-containment and commuting : a cross-national perspective", Urban Studies, Vol. 32, No. 7, pp. 1135-1161
Cervero R, Day J (2008) "Residential Relocation and Commuting Behavior in Shanghai, China: The Case for Transit Oriented Development", (Working paper, UCB-ITS-VWP-2008-4 UC Berkeley Center for Future Urban Transport)
Dieleman F, Dijst M, Burghouwt G (2002) "Urban form and travel behaviour: micro-level household attributes and residential context", Urban Studies, Vol. 39, No. 3, pp. 507–527
Ewing R (1995) "Beyond density, mode choice, and single trips", Transportation Quarterly, Vol. 49, No. 4, pp. 15-24
Ewing R, DeAnna M, Li S C (1996) "Land use impacts on trip generation rates" Transportation Research Record, No. 1518, pp. 1-6.
Gauray R, Ernst-Young L L P, Khisty C J (1998) "Urban Transportation in Developing Countries: Trends, Impacts, and Potential Systemic Strategies", in Transportation Research Board's 77th Annual Meeting (Transportation Research Board, Washington, D.C.)
Grazi F, van den Bergh J C J, van Ommeren J (2008) "An Empirical Analysis of Urban Form, Transport, and Global Warming", The Energy Journal, Vol. 29, No. 4, pp. 97-122.
Gwilliam K, Kojima M, Johnson T (2004) "Reducing air pollution from urban transport", Washington, DC.: World Bank
Hickman R, Banister D (2007) "Transport and reduced energy consumption: What role can urban planning play? Working paper 1026", (Transport Studies Unit, Oxford University Centre for the Environment, Oxford, Uk.)
Huang J (2009) "Beijing will levy emissions fee for motorized vehicles", Beijing Youth Daily (in Chinese: Beijing qing nian bao)
IEA (2006) "World energy outlook", Paris: International Energy Agency Khisty C J (1993) "Transportation in developing countries: Obvious problems, possible
solutions", Transportation Research Board, No. 1396, pp. 44-49 Kitamura R, Mokhtarian P L, Laidet L (1997) "A micro-analysis of land use and travel in five
neighborhoods in the San Francisco Bay Area", Transportation, Vol. 24, No. 2, pp. 125–158
Levinson D M, Kumar A (1997) "Density and the journey to work" Growth and Change, Vol. 28, No. 2, pp. 147-172
Ma L J C (2004) "Economic reforms, urban spatial restructuring, and planning in China", Progress in Planning, Vol. 61, No. 3, pp. 237-260
Newman P W G, Kenworthy J R (1989) "Gasoline consumption and cities: a comparison of U.S. cities with a global survey", Journey of American Planners Association, Vol. 55, No. 1, pp. 24-37
Pan H, Shen Q, Zhang M (2009) "Influence of urban form on travel behavior in four neighborhoods of Shanghai", Urban Studies, Vol. 46, No. 2, pp. 275–294
Ryley T (2001) "Translating cycling policy into cycling practice" World Transport Policy and Practice, Vol. 7, No. 3, pp. 38-43
Schwanen T, Dijst M, Dieleman F M (2004) "Policies for urban form and their impact on travel: the Netherlands experiences", Urban Studies, Vol. 41, No. 3, pp. 579-603
Stead D (2001) "Relationships between land use, socioeconomic factors, and travel patterns in Britain" Environment and Planning B, Vol. 28, No. 4, pp. 499-528

Pengjun Zhao, Gert de Roo, Bin Lu; Planning for low-carbon urban growth; 45th ISOCARP Congress
12
United Nations (2001) Cities in a globalizing world: Global report on human settlements 2001, London: Earthscan
Wang D, Chai Y (2008) "The jobs-housing relationship and commuting in Beijing, China: the legacy of Danwei", Journal of Transport Geography, Vol. 17, No. 1, pp. 30-38
WBCSD (2001) "Mobility 2001: World Mobility at the End of the Twentieth Century and Its Sustainability", World Business Council for Sustainable Development
World Bank (2007) "An Overview of China’s Transport Sector – 2007, EASTE WORKING PAPER No. 15", Transport, Energy and Mining Sector Unit, Sustainable Development Department East Asia and Pacific Region
Yang J (2006) "Transportation Implications of Land Development in a Transitional Economy: Evidence from Housing Relocation in Beijing", Transportation Research Record, No. 1594, pp. 7-14
Authors
Pengjun Zhao, researcher, [email protected] Department of Urban and Regional Planning, Peking University, China Planning and Environmental Department, University of Groningen, the Netherlands
Gert de Roo, professor and dean, [email protected] Planning and Environmental Department, University of Groningen, the Netherlands
Bin Lu, professor and dean, [email protected] Department of Urban and Regional Planning, Peking University, China
Related Documents