Plankton biodiversity and species co-occurrence based on environmental DNA – a multiple marker study Sirje Sildever 1,2* , Peeter Laas 2,3* , Natalja Kolesova 2 , Inga Lips 2,4 , Urmas Lips 2 , Satoshi Nagai 1 1 Japan Fisheries Research and Education Agency, Fisheries Resources Institute, Fisheries Stock Assessment Center, Yokohama, Japan 2 Department of Marine Systems, Tallinn University of Technology, Tallinn, Estonia 3 Institute of Technology, Faculty of Science and Technology, University of Tartu, Tallinn, Estonia 4 EuroGOOS AISBL, Brussels, Belgium Corresponding author: Sirje Sildever ([email protected]); Satoshi Nagai ([email protected]) Academic editor: Jianghua Yang | Received 31 July 2021 | Accepted 9 October 2021 | Published 3 November 2021 Abstract Metabarcoding in combination with high-throughput sequencing (HTS) allows simultaneous detection of multiple taxa by targeting single or several taxonomically informative gene regions from environmental DNA samples. In this study, a multiple-marker HTS approach was applied to investigate the plankton diversity and seasonal succession in the Baltic Sea from winter to autumn. Four different markers targeting the 16S, 18S, and 28S ribosomal RNA genes were employed, including a marker for more efficient dinoflagellate detection. Typical seasonal changes were observed in phyto- and bacterioplankton communities. In phytoplankton, the appearance patterns of selected common, dominant, or harmful species followed the patterns also confirmed based on 20 years of phytoplankton monitoring data. In the case of zooplankton, both macro- and microzooplankton species were detected. However, no seasonal patterns were detected in their appearance. In total, 15 and 2 new zoo- and phytoplankton species were detected from the Baltic Sea. HTS approach was especially useful for detecting microzooplankton species as well as for investigating the co-oc- currence and potential interactions of different taxa. The results of this study further exemplify the efficiency of metabarcoding for biodiversity monitoring and the advantage of employing multiple markers through the detection of species not identifiable based on a single marker survey and/or by traditional morphology-based methods. Key Words bacteria, Baltic Sea, metabarcoding, phytoplankton, rRNA genes, seasons, zooplankton 1. Introduction Zoo-, phyto- and bacterioplankton are important compo- nents of marine food webs as grazers, primary producers, and decomposers (Azam et al. 1983; Fenchel 1988; Kiør- boe 1997; Calbet 2008). Interactions within and among those communities (Acevedo-Trejos et al. 2015; Cirri and Pohnert 2019; Camarena-Gómez et al. 2020) and environmental parameters shape their diversity and com- munity dynamics (Ojaveer et al. 1998; Andersson et al. 2010; Nishikawa et al. 2010; Suikkanen et al. 2013; Hirai et al. 2017; Forsblom et al. 2019). Changes in plankton communities are of particular interest due to the influ- ence on remineralization of organic matter, which can alter fluxes in the microbial loop (Spilling and Lindström 2008; Camarena-Gómez et al. 2018; Spilling et al. 2018). This can have a notable influence on the benthic com- munities (e.g. food availability and quality; Turner et al. 2015) as well as on the overall water quality (hypoxia; Spilling et al. 2014). Long-term monitoring of plankton communities is needed to identify and model the influence of interan- nual variability and global change, as suggested for the phytoplankton (Smayda 1998; Dale and Murphy 2014). Copyright Sildever et al. This is an open access article distributed under the terms of the Creative Commons Attribution License (CC BY 4.0), which permits unrestricted use, distribution, and reproduction in any medium, provided the original author and source are credited. Metabarcoding and Metagenomics 5: 175– 197 DOI 10.3897/mbmg.5.72371 Research Article * The authors contributed equally to the work

Welcome message from author
This document is posted to help you gain knowledge. Please leave a comment to let me know what you think about it! Share it to your friends and learn new things together.
Transcript
Plankton biodiversity and species co-occurrence based on environmental DNA – a multiple marker study
Sirje Sildever1,2*, Peeter Laas2,3*, Natalja Kolesova2, Inga Lips2,4, Urmas Lips2, Satoshi Nagai1
1 Japan Fisheries Research and Education Agency, Fisheries Resources Institute, Fisheries Stock Assessment Center, Yokohama, Japan2 Department of Marine Systems, Tallinn University of Technology, Tallinn, Estonia3 Institute of Technology, Faculty of Science and Technology, University of Tartu, Tallinn, Estonia4 EuroGOOS AISBL, Brussels, Belgium
Corresponding author: Sirje Sildever ([email protected]); Satoshi Nagai ([email protected])
Academic editor: Jianghua Yang | Received 31 July 2021 | Accepted 9 October 2021 | Published 3 November 2021
AbstractMetabarcoding in combination with high-throughput sequencing (HTS) allows simultaneous detection of multiple taxa by targeting single or several taxonomically informative gene regions from environmental DNA samples. In this study, a multiple-marker HTS approach was applied to investigate the plankton diversity and seasonal succession in the Baltic Sea from winter to autumn. Four different markers targeting the 16S, 18S, and 28S ribosomal RNA genes were employed, including a marker for more efficient dinoflagellate detection. Typical seasonal changes were observed in phyto- and bacterioplankton communities. In phytoplankton, the appearance patterns of selected common, dominant, or harmful species followed the patterns also confirmed based on 20 years of phytoplankton monitoring data. In the case of zooplankton, both macro- and microzooplankton species were detected. However, no seasonal patterns were detected in their appearance. In total, 15 and 2 new zoo- and phytoplankton species were detected from the Baltic Sea. HTS approach was especially useful for detecting microzooplankton species as well as for investigating the co-oc-currence and potential interactions of different taxa. The results of this study further exemplify the efficiency of metabarcoding for biodiversity monitoring and the advantage of employing multiple markers through the detection of species not identifiable based on a single marker survey and/or by traditional morphology-based methods.
Key Wordsbacteria, Baltic Sea, metabarcoding, phytoplankton, rRNA genes, seasons, zooplankton
1. IntroductionZoo-, phyto- and bacterioplankton are important compo-nents of marine food webs as grazers, primary producers, and decomposers (Azam et al. 1983; Fenchel 1988; Kiør-boe 1997; Calbet 2008). Interactions within and among those communities (Acevedo-Trejos et al. 2015; Cirri and Pohnert 2019; Camarena-Gómez et al. 2020) and environmental parameters shape their diversity and com-munity dynamics (Ojaveer et al. 1998; Andersson et al. 2010; Nishikawa et al. 2010; Suikkanen et al. 2013; Hirai et al. 2017; Forsblom et al. 2019). Changes in plankton
communities are of particular interest due to the influ-ence on remineralization of organic matter, which can alter fluxes in the microbial loop (Spilling and Lindström 2008; Camarena-Gómez et al. 2018; Spilling et al. 2018). This can have a notable influence on the benthic com-munities (e.g. food availability and quality; Turner et al. 2015) as well as on the overall water quality (hypoxia; Spilling et al. 2014).
Long-term monitoring of plankton communities is needed to identify and model the influence of interan-nual variability and global change, as suggested for the phytoplankton (Smayda 1998; Dale and Murphy 2014).
Copyright Sildever et al. This is an open access article distributed under the terms of the Creative Commons Attribution License (CC BY 4.0), which permits unrestricted use, distribution, and reproduction in any medium, provided the original author and source are credited.
Metabarcoding and Metagenomics 5: 175–197 DOI 10.3897/mbmg.5.72371
Research Article
* The authors contributed equally to the work
https://mbmg.pensoft.net
Sildever et al.: Multiple marker eDNA study targeting the Baltic Sea plankton176
In addition, the sampling frequency and coverage must be considered to obtain a realistic and clear overview of the community dynamics (Lips et al. 2014; Bunse et al. 2019; Griffiths et al. 2020). Traditionally, both zoo-and phytoplankton have been identified by using light microscopy (Edler and Elbrächter 2010; Djurhuus et al. 2018). However, for both groups, species identification may be hampered due to their variable or similar mor-phology (Hirai et al. 2017; Choquet et al. 2018). In the case of phytoplankton, the identification may be further hindered by small size, fixative induced changes in cell morphology, or due to their presence in low abundance (John et al. 2005; Zingone et al. 2006; Reguera and Pizarro 2008; Karlson et al. 2010; Rodríguez-Ramos et al. 2013). To overcome those limitations, molecular de-tection methods, such as molecular probes, chips, quan-titative polymerase chain reaction (qPCR), and digital PCR have been used (Ebenezer et al. 2012; Medlin and Orozco 2017; Nagai et al. 2016a; Ruvindy et al. 2018; Lee et al. 2020). Bacterioplankton has also been tradi-tionally identified based on a single cell or colony mor-phology using epifluorescence microscopy (Hobbie et al. 1977; Sieracki et al. 1985; Sousa et al. 2013; Mohamad et al. 2014). Since only a fraction of the bacteria detect-ed under epifluorescence microscope are culturable and morphologies of single cells may not be informative enough, molecular methods such as detection based on 16S ribosomal RNA (rRNA) gene have been widely used (Schmidt et al. 1991; Amann et al. 1995; Urakawa et al. 1999; Riemann et al. 2000).
To identify multiple species simultaneously and analyze several samples at once, metabarcoding and high-throughput sequencing (HTS) has been applied to investigate plankton diversity (Sogin et al. 2006; de Var-gas et al. 2015; Massana et al. 2015; Sunagawa et al. 2015; Chain et al. 2016; Nagai et al. 2016b; Gran-Stadniczeñko et al. 2018; Cui et al. 2019; Bucklin et al. 2019). Metabar-coding in combination with HTS allows simultaneous de-tection of multiple taxa by using universal or more spe-cific PCR primers to amplify taxonomically informative gene regions from environmental DNA (eDNA; Taberlet et al. 2012; Ji et al. 2013). Usage of multiple primers fur-ther facilitates the detection of a broad range of taxa (Stat et al. 2017; Zhang et al. 2018; Berry et al. 2019; Sawaya et al. 2019; Nagai et al. 2020a; Zhang et al. 2020). Also, as the approach provides detailed information on the whole community or specific groups targeted (Lima-Mendez et al. 2015; Sawaya et al. 2019; Djurhuus et al. 2020), it can be applied for biodiversity monitoring (Zaiko et al. 2015; Nagai et al. 2016b; c; 2018; 2020a; Valentini et al. 2016; Stat et al. 2017; Djurhuus et al. 2018). The method also allows detection of patterns in the species/groups appear-ances, providing detailed information on the environmen-tal conditions inhibiting/supporting their presence (Lal-lias et al. 2015; Brannock et al. 2016; Nagai et al. 2017; 2019; Banerji et al. 2018; Berry et al. 2019; Salonen et al. 2018; Sildever et al. 2019).
In the Baltic Sea, the HTS-approach has been previous-ly applied for investigating plankton communities along the salinity gradient (Herlemann et al. 2011, 2016; Hu et al. 2016; Piwosz et al. 2018; Rojas-Jimenez et al. 2019), in different seasons and environmental conditions (An-dersson et al. 2010; Majaneva et al. 2012, 2017; Laas et al. 2014, 2015, 2016; Lindh et al. 2015; Bunse et al. 2016), as well as for surveillance of non-indigenous species (Zaiko et al. 2015) and for detecting eukaryotic communities in sediments (Salonen et al. 2018). This study provides de-tailed information on the microplankton community dy-namics by targeting both bacteria and eukaryotes during a seasonal succession from winter to spring and spring to summer. The multi-marker HTS-approach was employed to analyze eDNA samples collected monthly based on the 16S, 18S, and 28S ribosomal RNA genes. Presence and patterns in the appearance of toxin-producing phytoplank-ton species were also investigated.
2. Methods
2.1 Sampling and DNA extraction
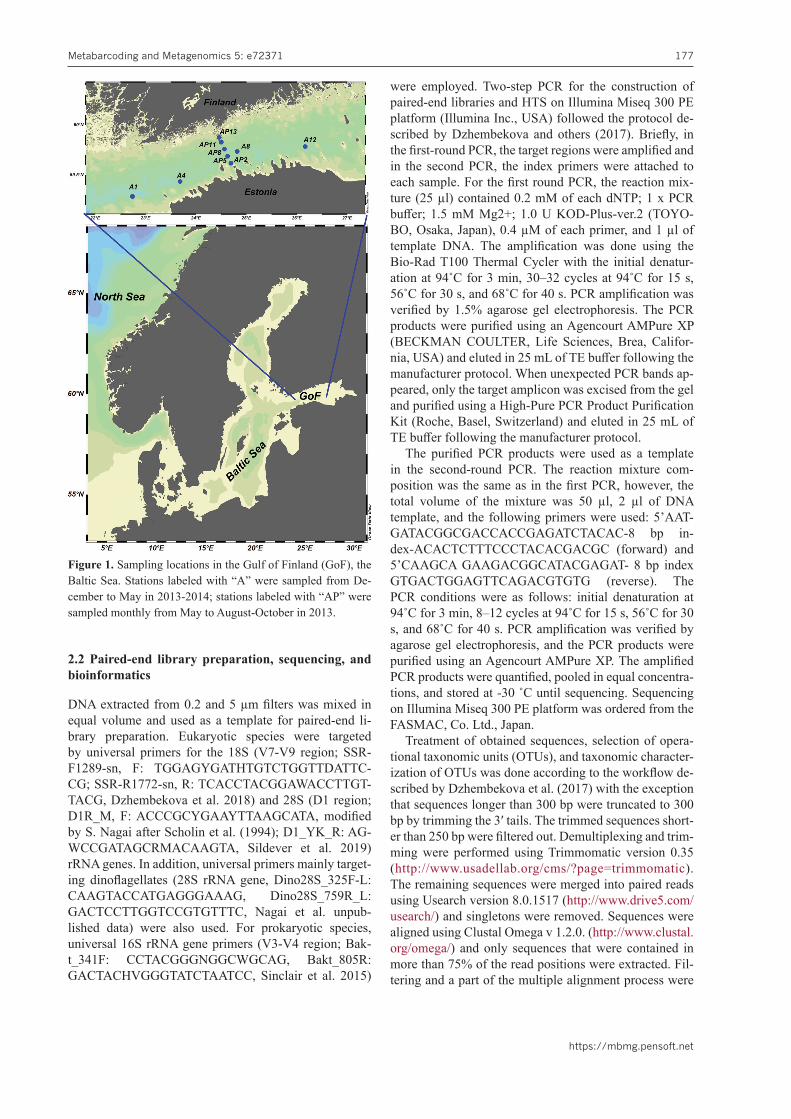
Water samples from 5 m depth were collected from 9 sta-tions in the Gulf of Finland (GoF), the Baltic Sea, from winter to late spring (2013 Dec – 2014 May; 4 stations), and from summer to autumn (2013 May-Oct; 5 stations; Fig. 1, Suppl. material 2, Table S1). In general, the sta-tions were sampled once per month, however stations A12, AP2, and AP5 were sampled on multiple occasions in May, June, and July (Suppl. material 2, Table S1). The data from those occasions was pooled and displayed based on the month in the manuscript. A rosette sampler (M1018, General Oceanics, U.S.A.) equipped with 8 Ni-skin water samplers (volume 1.7 l, model 1010, General Oceanics, U.S.A.) was used for sampling. Salinity and water temperature were measured with an OS320plus CTD probe (Idronaut s.r.l, Italy). The samples were col-lected into sterile bottles (342020-100, Nalgene, Thermo Scientific Nalgene Inc., U.S.A.) and filtered immediate-ly onboard the RV through 5.0 μm and 0.2 μm filters (Whatman 10462300, Puradisc FP 30, Merck, Germany) as described by Laas and others (2014, 2015). The sam-ple volume varied between 0.5 and 1.0 liters depending on the amount of particulate matter in the samples. Fil-ters were kept frozen at -20°C until the DNA extraction by CTAB (Lian et al. 2001) with the following modifi-cations: 300 μl of CTAB solution was pipetted into the syringe filters and the luer inlets and outlets were capped with Combi-Stopper Closing Cones (B. Braun Melsun-gen AG, Germany) to prevent the CTAB buffer leaking during the incubation. After incubation at 65 °C for 1 hour, 400 μl of TE buffer was added to the DNA extract taken from the filters to facilitate purification by chloro-form-isoamyl alcohol (24:1) following the protocol by Lian and others (2001).
Metabarcoding and Metagenomics 5: e72371
https://mbmg.pensoft.net
177
2.2 Paired-end library preparation, sequencing, and bioinformatics
DNA extracted from 0.2 and 5 µm filters was mixed in equal volume and used as a template for paired-end li-brary preparation. Eukaryotic species were targeted by universal primers for the 18S (V7-V9 region; SSR-F1289-sn, F: TGGAGYGATHTGTCTGGTTDATTC-CG; SSR-R1772-sn, R: TCACCTACGGAWACCTTGT-TACG, Dzhembekova et al. 2018) and 28S (D1 region; D1R_M, F: ACCCGCYGAAYTTAAGCATA, modified by S. Nagai after Scholin et al. (1994); D1_YK_R: AG-WCCGATAGCRMACAAGTA, Sildever et al. 2019) rRNA genes. In addition, universal primers mainly target-ing dinoflagellates (28S rRNA gene, Dino28S_325F-L: CAAGTACCATGAGGGAAAG, Dino28S_759R_L: GACTCCTTGGTCCGTGTTTC, Nagai et al. unpub-lished data) were also used. For prokaryotic species, universal 16S rRNA gene primers (V3-V4 region; Bak-t_341F: CCTACGGGNGGCWGCAG, Bakt_805R: GACTACHVGGGTATCTAATCC, Sinclair et al. 2015)
were employed. Two-step PCR for the construction of paired-end libraries and HTS on Illumina Miseq 300 PE platform (Illumina Inc., USA) followed the protocol de-scribed by Dzhembekova and others (2017). Briefly, in the first-round PCR, the target regions were amplified and in the second PCR, the index primers were attached to each sample. For the first round PCR, the reaction mix-ture (25 µl) contained 0.2 mM of each dNTP; 1 x PCR buffer; 1.5 mM Mg2+; 1.0 U KOD-Plus-ver.2 (TOYO-BO, Osaka, Japan), 0.4 µM of each primer, and 1 µl of template DNA. The amplification was done using the Bio-Rad T100 Thermal Cycler with the initial denatur-ation at 94˚C for 3 min, 30–32 cycles at 94˚C for 15 s, 56˚C for 30 s, and 68˚C for 40 s. PCR amplification was verified by 1.5% agarose gel electrophoresis. The PCR products were purified using an Agencourt AMPure XP (BECKMAN COULTER, Life Sciences, Brea, Califor-nia, USA) and eluted in 25 mL of TE buffer following the manufacturer protocol. When unexpected PCR bands ap-peared, only the target amplicon was excised from the gel and purified using a High-Pure PCR Product Purification Kit (Roche, Basel, Switzerland) and eluted in 25 mL of TE buffer following the manufacturer protocol.
The purified PCR products were used as a template in the second-round PCR. The reaction mixture com-position was the same as in the first PCR, however, the total volume of the mixture was 50 µl, 2 µl of DNA template, and the following primers were used: 5’AAT-GATACGGCGACCACCGAGATCTACAC-8 bp in-dex-ACACTCTTTCCCTACACGACGC (forward) and 5’CAAGCA GAAGACGGCATACGAGAT- 8 bp index GTGACTGGAGTTCAGACGTGTG (reverse). The PCR conditions were as follows: initial denaturation at 94˚C for 3 min, 8–12 cycles at 94˚C for 15 s, 56˚C for 30 s, and 68˚C for 40 s. PCR amplification was verified by agarose gel electrophoresis, and the PCR products were purified using an Agencourt AMPure XP. The amplified PCR products were quantified, pooled in equal concentra-tions, and stored at -30 ˚C until sequencing. Sequencing on Illumina Miseq 300 PE platform was ordered from the FASMAC, Co. Ltd., Japan.
Treatment of obtained sequences, selection of opera-tional taxonomic units (OTUs), and taxonomic character-ization of OTUs was done according to the workflow de-scribed by Dzhembekova et al. (2017) with the exception that sequences longer than 300 bp were truncated to 300 bp by trimming the 3′ tails. The trimmed sequences short-er than 250 bp were filtered out. Demultiplexing and trim-ming were performed using Trimmomatic version 0.35 (http://www.usadellab.org/cms/?page=trimmomatic). The remaining sequences were merged into paired reads using Usearch version 8.0.1517 (http://www.drive5.com/usearch/) and singletons were removed. Sequences were aligned using Clustal Omega v 1.2.0. (http://www.clustal.org/omega/) and only sequences that were contained in more than 75% of the read positions were extracted. Fil-tering and a part of the multiple alignment process were
Figure 1. Sampling locations in the Gulf of Finland (GoF), the Baltic Sea. Stations labeled with “A” were sampled from De-cember to May in 2013-2014; stations labeled with “AP” were sampled monthly from May to August-October in 2013.

https://mbmg.pensoft.net
Sildever et al.: Multiple marker eDNA study targeting the Baltic Sea plankton178
performed using the screen.seqs and filter. seqs com-mands in Mothur, as described in the Miseq SOP (http://www.mothur.org./wiki/MiSeq_SOP) (Schloss et al., 2011). Erroneous and chimeric sequences were detected and removed using the pre.cluster (diffs = 4) and chimera.uchime (minh = 0.1; http://drive5.com/usearch/manual/uchime_algo.html) (Edgar et al., 2011) commands in Mo-thur, respectively. Using the unique.seqs command of Mo-thur, the same sequences were collected into operational taxonomic units (OTUs). The contig sequences were counted as OTUs by count.seqs and used for the subse-quent taxonomic identification analysis. Demultiplexed, filtered, but untrimmed sequence data were deposited in the DDBJ Sequence Read Archive (https://www.ddbj.nig.ac.jp/dra/index-e.html; BioProject (PRJDB12325) and BioSamples (SAMD00406059-SAMD00406250), DRA accession number DRA012806).
The selected OTUs were taxonomically identified as follows: for the BLAST search, a subset of NCBI non-re-dundant nucleotides (NT) consisting of sequences that satisfied the below-mentioned conditions was prepared. The sequences used to identify OTUs were downloaded from the GenBank based on the following search criteria: “ribosomal”, “rrna” or “rdna”, and the search excluded keywords associated with “metagenome”, “uncultured” and “environmental”. The sequences of retrieved Gen-Bank IDs were downloaded from the nucleotide database at the NCBI FTP server on March 23, 2019, and were used to construct a template sequence database. Subse-quently, the taxonomic characterization for each OTU was performed using a BLAST search (Cheung et al., 2010) in NCBI BLAST+2.2.26+ (Camacho et al., 2009) with default parameters. The nucleotide subset described above was treated as a database, and all OTU represen-tative sequences were treated as queries. Subsequently, taxonomic information was obtained from the BLAST top bit-score hit for each query sequence.
For eukaryotes, only OTUs with blast top hit simi-larity of ≥ 0.99% and a minimum query cover of 70% were included in the further analysis. OTUs associated with multiple records from the same genus were merged if the multiple records consisted of sp. of the same ge-nus or when a single species was clustered together with other records identified as sp. from the same genus. For prokaryotes, only OTUs with > 50 total sequence reads were included in the further analysis. This rule was not applied for cyanobacteria that were identified to species level. The phylum and class/order level taxonomic group-ings were also confirmed based on the World Register of Marine Species (www.marinespecies.org) or the UniProt taxonomy database (www.uniprot.org). For OTUs asso-ciated with Dinophyceae and Bacillariophyceae, the class level grouping is shown instead of phylum level as both represent important and dominant phytoplankton groups. The autotrophic ciliate, Mesodinium rubrum, is included both in the phyto- and zooplankton results to show its dy-namics concerning both groups as it is usually analyzed together with phytoplankton.
2.3 Toxin-producing HAB species selection
The presence of toxin-producing HAB species among the detected OTUs was investigated by comparing the list of OTUs associated with phytoplankton species against the IOC-UNESCO Taxonomic Reference List of Harmful Micro Algae (Moestrup et al. 2021). Only OTUs asso-ciated with a single toxin-producing HAB species were included. To avoid the inclusion of OTUs with ambigu-ous identities, representative sequences of all OTUs as-sociated with the toxic HAB species were also manual-ly BLAST searched from the GenBank online database (https://blast.ncbi.nlm.nih.gov/Blast.cgi). The validity of the taxonomic names was checked against the AlgaeBase (http://www.algaebase.org/) and the World Register of Marine Species (http://www.marinespecies.org/). Only OTUs that had the ≥ 99.0 % BLAST top hit similarity with the associated single species were included in the further analysis.
2.4 Statistical analysis
The numbers of shared OTUs among different sampling years were counted and depicted as a Venn diagram by using the “vegan” package (Oksanen et al. 2020) in R version 4.0.2 (R Core Team, 2021). Presence-absence OTU data was used for all statistical analysis, and non-rarefied relative abundance data was used for visu-alizations in Fig. 3–7. Non-metric multidimensional scal-ing (NMDS) based on the Jaccard similarity index was applied to investigate the biodiversity among stations and sampling months by using “vegan”. Shepard diagrams were employed to assess the goodness of fit of the result-ing NMDS analysis (Suppl. material 1, Fig. S1). Differ-ences in biodiversity between the stations and sampling months were investigated by PERMANOVA using the Jaccard similarity index and 999 permutations and the assumption for homogeneity of multivariate dispersions was tested by ANOVA (betadisper function in “vegan”). Spearman correlations were applied to determine asso-ciations between common, dominant, or toxin-producing phytoplankton species and bacteria/zooplankton based on presence/absence data from 18S and 16S datasets. P-val-ue was adjusted for multiple comparisons by Benjami-ni-Hochberg correction (Benjamini and Hochberg 1995).
3. Results
3.1 Salinity and temperature
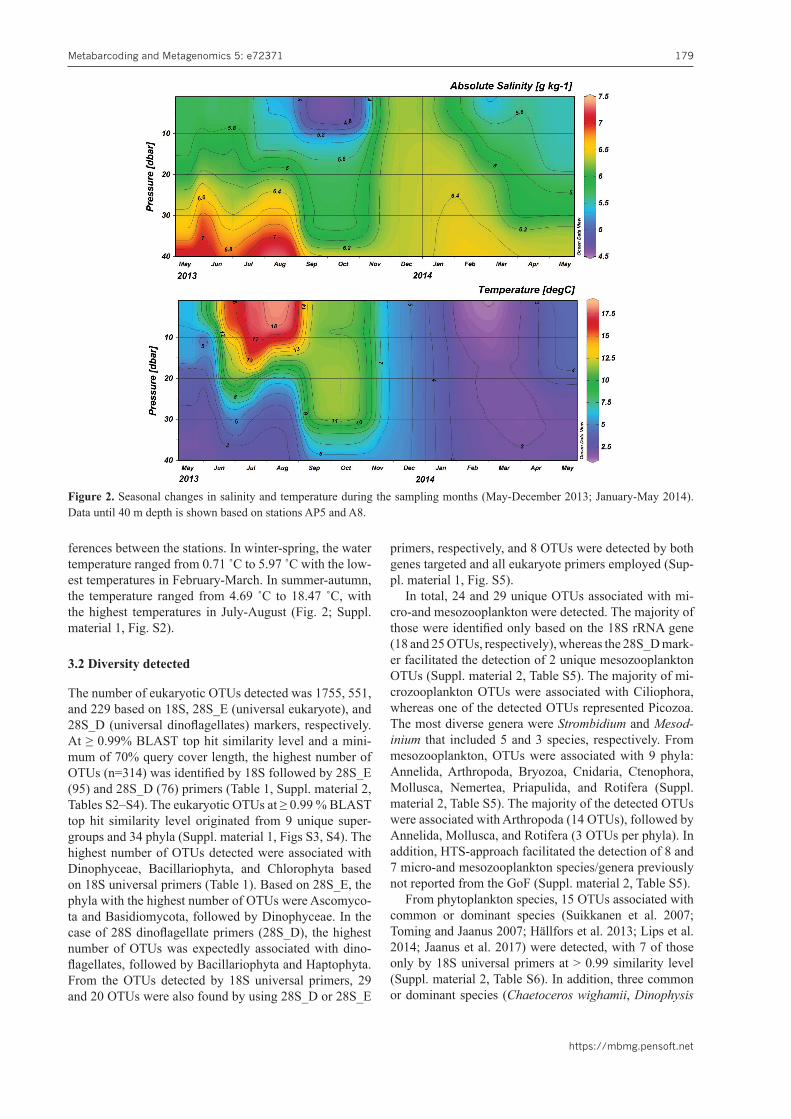
During winter-spring, salinity ranged from 5.11 g kg-1
to 6.56 g kg-1 with higher salinities at stations A1 and A4 located in the western GoF (Fig. 2; Suppl. material 1, Fig. S2). The physical-chemical background during winter-spring (2013–2014) is described in more detail by Lips and others (2017). In summer-autumn, salinity ranged from 4.58 g kg-1 to 5.70 g kg-1 with no notable dif-
Metabarcoding and Metagenomics 5: e72371
https://mbmg.pensoft.net
179
ferences between the stations. In winter-spring, the water temperature ranged from 0.71 ˚C to 5.97 ˚C with the low-est temperatures in February-March. In summer-autumn, the temperature ranged from 4.69 ˚C to 18.47 ˚C, with the highest temperatures in July-August (Fig. 2; Suppl. material 1, Fig. S2).
3.2 Diversity detected
The number of eukaryotic OTUs detected was 1755, 551, and 229 based on 18S, 28S_E (universal eukaryote), and 28S_D (universal dinoflagellates) markers, respectively. At ≥ 0.99% BLAST top hit similarity level and a mini-mum of 70% query cover length, the highest number of OTUs (n=314) was identified by 18S followed by 28S_E (95) and 28S_D (76) primers (Table 1, Suppl. material 2, Tables S2–S4). The eukaryotic OTUs at ≥ 0.99 % BLAST top hit similarity level originated from 9 unique super-groups and 34 phyla (Suppl. material 1, Figs S3, S4). The highest number of OTUs detected were associated with Dinophyceae, Bacillariophyta, and Chlorophyta based on 18S universal primers (Table 1). Based on 28S_E, the phyla with the highest number of OTUs were Ascomyco-ta and Basidiomycota, followed by Dinophyceae. In the case of 28S dinoflagellate primers (28S_D), the highest number of OTUs was expectedly associated with dino-flagellates, followed by Bacillariophyta and Haptophyta. From the OTUs detected by 18S universal primers, 29 and 20 OTUs were also found by using 28S_D or 28S_E
primers, respectively, and 8 OTUs were detected by both genes targeted and all eukaryote primers employed (Sup-pl. material 1, Fig. S5).
In total, 24 and 29 unique OTUs associated with mi-cro-and mesozooplankton were detected. The majority of those were identified only based on the 18S rRNA gene (18 and 25 OTUs, respectively), whereas the 28S_D mark-er facilitated the detection of 2 unique mesozooplankton OTUs (Suppl. material 2, Table S5). The majority of mi-crozooplankton OTUs were associated with Ciliophora, whereas one of the detected OTUs represented Picozoa. The most diverse genera were Strombidium and Mesod-inium that included 5 and 3 species, respectively. From mesozooplankton, OTUs were associated with 9 phyla: Annelida, Arthropoda, Bryozoa, Cnidaria, Ctenophora, Mollusca, Nemertea, Priapulida, and Rotifera (Suppl. material 2, Table S5). The majority of the detected OTUs were associated with Arthropoda (14 OTUs), followed by Annelida, Mollusca, and Rotifera (3 OTUs per phyla). In addition, HTS-approach facilitated the detection of 8 and 7 micro-and mesozooplankton species/genera previously not reported from the GoF (Suppl. material 2, Table S5).
From phytoplankton species, 15 OTUs associated with common or dominant species (Suikkanen et al. 2007; Toming and Jaanus 2007; Hällfors et al. 2013; Lips et al. 2014; Jaanus et al. 2017) were detected, with 7 of those only by 18S universal primers at > 0.99 similarity level (Suppl. material 2, Table S6). In addition, three common or dominant species (Chaetoceros wighamii, Dinophysis
Figure 2. Seasonal changes in salinity and temperature during the sampling months (May-December 2013; January-May 2014). Data until 40 m depth is shown based on stations AP5 and A8.

https://mbmg.pensoft.net
Sildever et al.: Multiple marker eDNA study targeting the Baltic Sea plankton180
acuta, Eutreptiella gymnastica) were detected at < 0.99 similarity level. Furthermore, 14 OTUs associated with toxin-producing HAB species (Moestrup et al. 2021) were recorded from the Gulf of Finland (Suppl. material 2, Table S6). OTUs associated with Alexandrium ostenfel-dii and Prymnesium polylepis were detected based on all the gene regions targeted (18S and 28S rRNA genes) and primers used, whereas species associated with 7 OTUs (Aphanizomenon flos-aquae; not toxic in the Baltic Sea; Sivonen et al. 1989; Šulčius et al. 2015), Aureococcus anophagefferens, Azadinium dexteroporum, Dinophysis norvegica, Dolichospermum planctonicum, Microcystis aeruginosa, Nodularia spumigena, Prymnesium faveola-tum, and Pseudo-nitzschia pungens) were only registered by one of the markers used. The spring-bloom dinoflagel-late species complex (DinoComplex), not distinguishable in Lugol-preserved samples by light microscopy, consist-ing of Apocalathium malmogiense, Biecheleria baltica, and Gymnodinium corollarium (Sundström et al. 2010) were also recorded. However, only G. corollarium se-quence was ≥ 0.99% similar to the sequences in the da-tabase. Apocalathium malmogiense and B. baltica were detected as a multihit by 18S universal primers, whereas G. corollarium could not be identified based on the 18S rRNA gene. In the case of 28S_E, B. baltica was not re-corded and A. malmogiense was detected at a < 0.99 sim-ilarity level, whereas sequences associated with G. cor-ollarium were present in several samples. The universal primers mainly targeting dinoflagellates (28S_D) could detect G. corollarium at ≥ 0.99 % similarity level, where-as B. baltica was present at < 0.99 similarity level, and A. malmogiense was not recorded. Another important spring bloom dinoflagellate Peridiniella catenata, was identified both based on 18S and 28S_D primers, but not based on the 28S_E. Skeletonema marinoi, a common diatom spe-cies (Hällfors et al. 2013; there as S. costatum), was only detected at ≥ 0.99 similarity level by 18S, but at < 0.99 similarity level by 28S_E and 28S_D primers.
Based on 16S universal primers, the presence of 893 prokaryotic OTUs (> 50 sequences) from 22 phyla and 63 order/class was detected (Table 2). Around 90% of the
bacterial sequences could be assigned to a specific phy-lum and around 82% to a class/order (Suppl. material 2, Table S7). On the phylum level, the highest number of OTUs was associated with Proteobacteria as well as with the Fibrobacteres, Chlorobi, and Bacteroidetes (FCB) group (Fig. 6). On the class/order level, the highest num-ber of OTUs belonged to Alphaproteobacteria, Bacteroi-detes/Chlorobi group, and Gammaproteobacteria (Table 2). Among the stations, the number of OTUs detected ranged from 23 to 247 for eukaryotes (depending on the marker) and from 326 to 851 for prokaryotes (Suppl. ma-terial 2, Table S8). The highest number of eukaryotic and prokaryotic OTUs was detected from station AP5 based on 28S_E, 28S_D, whereas in the case of 18S and 16S, the highest number of OTUs was present at station A8. The lowest number of OTUs was present at station AP8 based on 28S_E, and 16S, but at AP13, based on 18S and 28S_D (Suppl. material 2, Table S8).
3.3 Appearance patterns
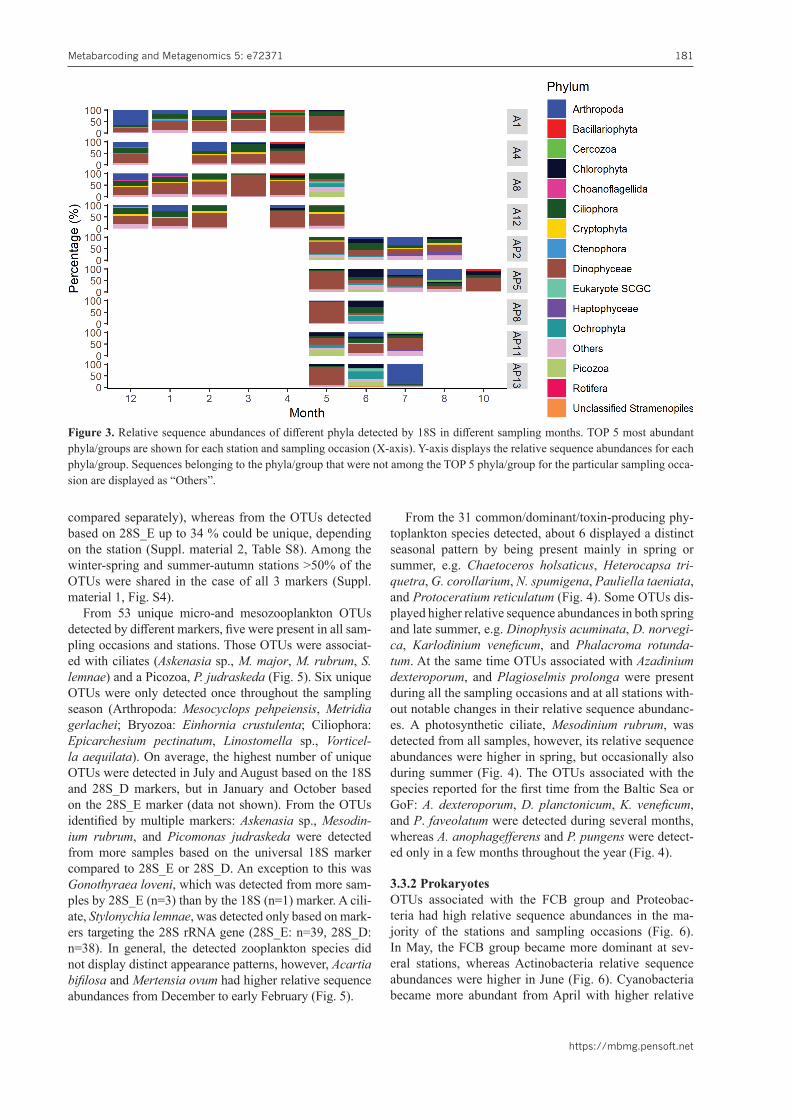
3.3.1 EukaryotesFrom all the class/phyla detected, Bacillariophyta, Cil-iophora, Chlorophyta, Dinophyceae, and Picozoa were present during all the sampling months based on different eukaryotic markers. Based on 18S and 28S_E, the rela-tive sequence abundances of Dinophyceae generally in-creased from February with the highest values from March to May (Figs 3, S6). Bacillariophyta had higher relative sequence abundances in April, whereas Ciliophora had higher relative sequence abundances from December to February/March as well as in May and June (Figs 5, S6). Chlorophyta displayed high relative sequence abundanc-es in spring (March, April), but also in June, August, and October (18S, 28SE; Figs 3, S6). The highest relative se-quence abundances for Picozoa were detected in May or in June based on both markers. The appearance patterns of phyla not detected from all sampling occasions also varied depending on the marker used. From all the OTUs detected by 18S and 28S_D <10 % were unique among the stations (winter-spring and summer-autumn stations
Table 1. Overview of eukaryotic OTUs associated with differ-ent phyla (> 10 OTUs).
Phyla 18S 28S 28S_DArthropoda 16 1Ascomycota 1 26 Bacillariophyta 36 10 18Basidiomycota 6 12 3Cercozoa 10 4 1Chlorophyta 24 7 2Ciliophora 31 4 2Cryptophyta 11 2 1Dinophyceae 86 11 37Haptophyta 15 6 5Ochrophyta 19 1eukaryote SCGC 11 Others* 48 13 5
Total nr. of OTUs 314 95 76* Full datasets for all markers available in Suppl. material 2, Tables S4–S6
Table 2. Overview of OTUs detected by 16S on class/order level.
Class/Order Nr. of OTUs Alphaproteobacteria 202Bacteria candidate phyla 11Bacteroidetes/Chlorobi group 173Betaproteobacteria 57delta/epsilon subdivisions 32Gammaproteobacteria 124Micrococcales 10Oligoflexia 12Synechococcales 35unclassified Actinobacteria 38unclassified Bacteria 73unclassified Verrucomicrobia 15Others* 111
Total nr. of OTUs 893* Full dataset available in Suppl. material 2, Table S3
Metabarcoding and Metagenomics 5: e72371
https://mbmg.pensoft.net
181
Figure 3. Relative sequence abundances of different phyla detected by 18S in different sampling months. TOP 5 most abundant phyla/groups are shown for each station and sampling occasion (X-axis). Y-axis displays the relative sequence abundances for each phyla/group. Sequences belonging to the phyla/group that were not among the TOP 5 phyla/group for the particular sampling occa-sion are displayed as “Others”.
compared separately), whereas from the OTUs detected based on 28S_E up to 34 % could be unique, depending on the station (Suppl. material 2, Table S8). Among the winter-spring and summer-autumn stations >50% of the OTUs were shared in the case of all 3 markers (Suppl. material 1, Fig. S4).
From 53 unique micro-and mesozooplankton OTUs detected by different markers, five were present in all sam-pling occasions and stations. Those OTUs were associat-ed with ciliates (Askenasia sp., M. major, M. rubrum, S. lemnae) and a Picozoa, P. judraskeda (Fig. 5). Six unique OTUs were only detected once throughout the sampling season (Arthropoda: Mesocyclops pehpeiensis, Metridia gerlachei; Bryozoa: Einhornia crustulenta; Ciliophora: Epicarchesium pectinatum, Linostomella sp., Vorticel-la aequilata). On average, the highest number of unique OTUs were detected in July and August based on the 18S and 28S_D markers, but in January and October based on the 28S_E marker (data not shown). From the OTUs identified by multiple markers: Askenasia sp., Mesodin-ium rubrum, and Picomonas judraskeda were detected from more samples based on the universal 18S marker compared to 28S_E or 28S_D. An exception to this was Gonothyraea loveni, which was detected from more sam-ples by 28S_E (n=3) than by the 18S (n=1) marker. A cili-ate, Stylonychia lemnae, was detected only based on mark-ers targeting the 28S rRNA gene (28S_E: n=39, 28S_D: n=38). In general, the detected zooplankton species did not display distinct appearance patterns, however, Acartia bifilosa and Mertensia ovum had higher relative sequence abundances from December to early February (Fig. 5).
From the 31 common/dominant/toxin-producing phy-toplankton species detected, about 6 displayed a distinct seasonal pattern by being present mainly in spring or summer, e.g. Chaetoceros holsaticus, Heterocapsa tri-quetra, G. corollarium, N. spumigena, Pauliella taeniata, and Protoceratium reticulatum (Fig. 4). Some OTUs dis-played higher relative sequence abundances in both spring and late summer, e.g. Dinophysis acuminata, D. norvegi-ca, Karlodinium veneficum, and Phalacroma rotunda-tum. At the same time OTUs associated with Azadinium dexteroporum, and Plagioselmis prolonga were present during all the sampling occasions and at all stations with-out notable changes in their relative sequence abundanc-es. A photosynthetic ciliate, Mesodinium rubrum, was detected from all samples, however, its relative sequence abundances were higher in spring, but occasionally also during summer (Fig. 4). The OTUs associated with the species reported for the first time from the Baltic Sea or GoF: A. dexteroporum, D. planctonicum, K. veneficum, and P. faveolatum were detected during several months, whereas A. anophagefferens and P. pungens were detect-ed only in a few months throughout the year (Fig. 4).
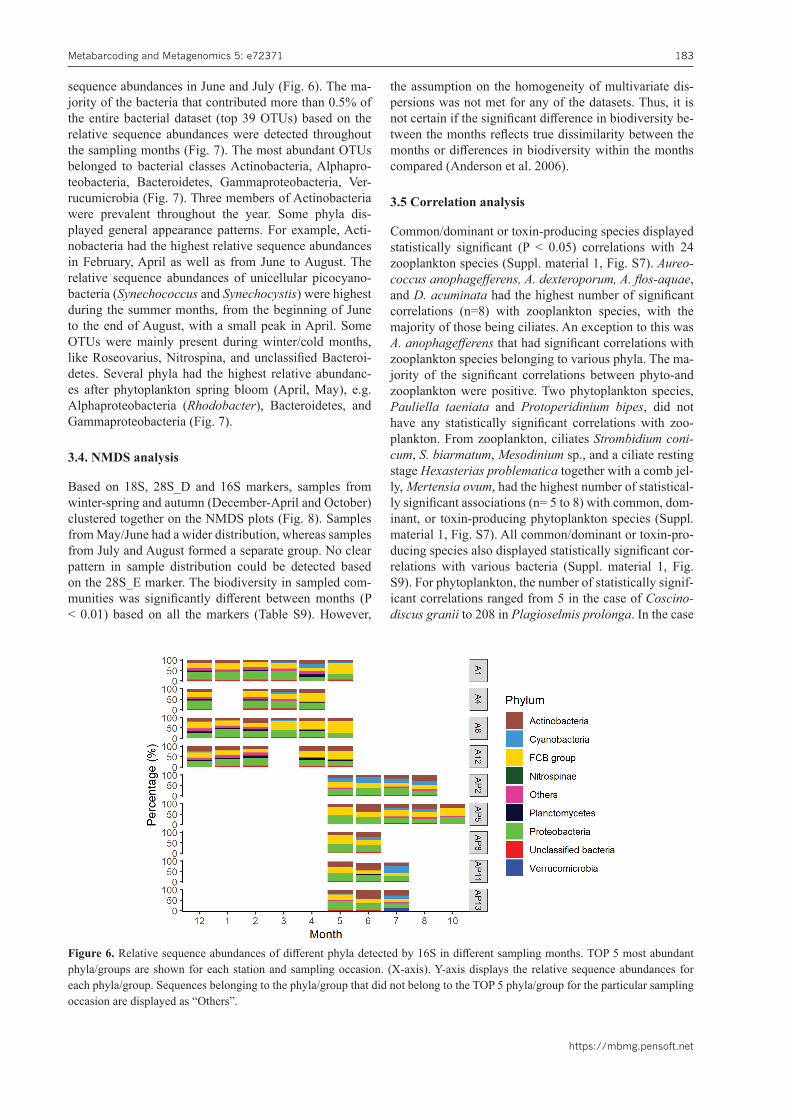
3.3.2 ProkaryotesOTUs associated with the FCB group and Proteobac-teria had high relative sequence abundances in the ma-jority of the stations and sampling occasions (Fig. 6). In May, the FCB group became more dominant at sev-eral stations, whereas Actinobacteria relative sequence abundances were higher in June (Fig. 6). Cyanobacteria became more abundant from April with higher relative

https://mbmg.pensoft.net
Sildever et al.: Multiple marker eDNA study targeting the Baltic Sea plankton182
Figure 4. Relative sequence abundances of common/dominant/toxin-producing species detected based on different markers. The X-axis represents stations and sampling months, Y-axis displays species detected. Species marked with bold are known to produce toxins (Moestrup, et al. 2020). Station and month labels marked with “_p” indicate months with pooled samples. Different colors indicate associations with different phyla. The size of the bubbles indicates relative sequence abundances. Vertical lines differentiate between the sampling months. *no toxicity confirmed from the Baltic Sea (Sivonen et al. 1989; Šulčius et al. 2015)
Figure 5. Relative sequence abundances of zooplankton species detected based on different markers. The X-axis represents stations and sampling months, Y-axis displays species detected. Station and month labels marked with “_p” indicate months with pooled samples. Different colors indicate associations with different phyla. The size of the bubbles indicates relative sequence abundances. Vertical lines differentiate between the sampling months.
Metabarcoding and Metagenomics 5: e72371
https://mbmg.pensoft.net
183
sequence abundances in June and July (Fig. 6). The ma-jority of the bacteria that contributed more than 0.5% of the entire bacterial dataset (top 39 OTUs) based on the relative sequence abundances were detected throughout the sampling months (Fig. 7). The most abundant OTUs belonged to bacterial classes Actinobacteria, Alphapro-teobacteria, Bacteroidetes, Gammaproteobacteria, Ver-rucumicrobia (Fig. 7). Three members of Actinobacteria were prevalent throughout the year. Some phyla dis-played general appearance patterns. For example, Acti-nobacteria had the highest relative sequence abundances in February, April as well as from June to August. The relative sequence abundances of unicellular picocyano-bacteria (Synechococcus and Synechocystis) were highest during the summer months, from the beginning of June to the end of August, with a small peak in April. Some OTUs were mainly present during winter/cold months, like Roseovarius, Nitrospina, and unclassified Bacteroi-detes. Several phyla had the highest relative abundanc-es after phytoplankton spring bloom (April, May), e.g. Alphaproteobacteria (Rhodobacter), Bacteroidetes, and Gammaproteobacteria (Fig. 7).
3.4. NMDS analysis
Based on 18S, 28S_D and 16S markers, samples from winter-spring and autumn (December-April and October) clustered together on the NMDS plots (Fig. 8). Samples from May/June had a wider distribution, whereas samples from July and August formed a separate group. No clear pattern in sample distribution could be detected based on the 28S_E marker. The biodiversity in sampled com-munities was significantly different between months (P < 0.01) based on all the markers (Table S9). However,
the assumption on the homogeneity of multivariate dis-persions was not met for any of the datasets. Thus, it is not certain if the significant difference in biodiversity be-tween the months reflects true dissimilarity between the months or differences in biodiversity within the months compared (Anderson et al. 2006).
3.5 Correlation analysis
Common/dominant or toxin-producing species displayed statistically significant (P < 0.05) correlations with 24 zooplankton species (Suppl. material 1, Fig. S7). Aureo-coccus anophagefferens, A. dexteroporum, A. flos-aquae, and D. acuminata had the highest number of significant correlations (n=8) with zooplankton species, with the majority of those being ciliates. An exception to this was A. anophagefferens that had significant correlations with zooplankton species belonging to various phyla. The ma-jority of the significant correlations between phyto-and zooplankton were positive. Two phytoplankton species, Pauliella taeniata and Protoperidinium bipes, did not have any statistically significant correlations with zoo-plankton. From zooplankton, ciliates Strombidium coni-cum, S. biarmatum, Mesodinium sp., and a ciliate resting stage Hexasterias problematica together with a comb jel-ly, Mertensia ovum, had the highest number of statistical-ly significant associations (n= 5 to 8) with common, dom-inant, or toxin-producing phytoplankton species (Suppl. material 1, Fig. S7). All common/dominant or toxin-pro-ducing species also displayed statistically significant cor-relations with various bacteria (Suppl. material 1, Fig. S9). For phytoplankton, the number of statistically signif-icant correlations ranged from 5 in the case of Coscino-discus granii to 208 in Plagioselmis prolonga. In the case
Figure 6. Relative sequence abundances of different phyla detected by 16S in different sampling months. TOP 5 most abundant phyla/groups are shown for each station and sampling occasion. (X-axis). Y-axis displays the relative sequence abundances for each phyla/group. Sequences belonging to the phyla/group that did not belong to the TOP 5 phyla/group for the particular sampling occasion are displayed as “Others”.

https://mbmg.pensoft.net
Sildever et al.: Multiple marker eDNA study targeting the Baltic Sea plankton184
Figure 7. Relative abundances of bacteria-associated OTUs (TOP 39). The X-axis represents stations and sampling months, Y-axis displays selected taxa. Order of taxa is derived from pair-wise similarity matrix based on r-values (Pearson). Station and month labels marked with “_p” indicate months with pooled samples. Different colors indicate associations with different phyla. The size of the bubbles indicates relative sequence abundances. Vertical lines differentiate between the sampling months.
Figure 8. A plot of NMDS analysis of diversity patterns in 38 samples of plankton collected from 9 stations in the Gulf of Finland, the Baltic Sea, A: 18S, B: 28S_E, C: 28S_D: 16S (k=3, stress 18S: 0.07; 28S_E: 0.15; 28S_D: 0.08; 16S: 0.06).
Metabarcoding and Metagenomics 5: e72371
https://mbmg.pensoft.net
185
of bacteria, the number of significant correlations ranged from 1 to 6. Five bacterial OTUs displaying the highest number of statistically significant correlations were as-sociated with Alphaproteobacteria, Micrococcales, and Cyanobacteria. On the phylum level, Proteobacteria and FCB group had the highest number of correlations with common/dominant or toxin-producing species (data not shown). From the common, dominant, or toxin-produc-ing species the highest number of statistically significant correlations were detected for A. anophagefferens (169), Plagioselmis prolonga (208), and Protoperidinium pellu-cidum (106).
4. Discussion
The aim of this study was to detect the diversity present and reveal changes in community composition during seasonal succession from winter to spring and summer to autumn. Based on four different markers, community composition, seasonal dynamics, and co-occurrence pat-terns were identified for bacterio-, phyto- and zooplank-ton. Two phytoplankton and 15 zooplankton species nov-el for the Baltic Sea were also detected.
4.1 Overview of the diversity detected
4.1.1 EukaryotesIn this study, the highest number of eukaryotic OTUs detected belonged to Dinophyceae (phytoplankton). An exception to this was the 28S_E marker, which detected the highest number of OTUs associated with Ascomycota (fungi). A high number of OTUs associated with Dino-phyceae has also been reported in previous studies from the Baltic Sea as well as from other localities around the world (de Vargas et al. 2015; Nagai, et al. 2016b; Dz-hembekova et al. 2017; Gran-Stadniczeñko et al. 2018; Moreno-Pino et al. 2018; Zhang et al. 2020). This has been explained by the higher rRNA gene copy numbers in Dinophyceae compared to some other groups, which can increase the number of sequences detected from this group (Zhu et al. 2005; Gran-Stadniczeñko et al. 2018). Based on the 28S_E primers, two fungal phyla (Asco-mycota and Basidiomycota), were associated with the TOP2 highest numbers of OTUs detected. Those phyla were also detected by the 18S rRNA gene. The detection of more fungi-associated OTUs by the 28S_E marker can be explained by its high species detection power in fungi (Schoch et al. 2012). In a previous study on planktonic fungi in the Baltic Sea, a higher dominance of Chytrido-mycota was reported at salinities < 8, whereas Ascomy-cota and Basidiomycota were more dominant at higher salinities (Rojas-Jimenez et al. 2019). Despite this gen-eral pattern, other phyla (e.g. Ascomycota) dominated at some stations even at salinities of < 8 (Rojas-Jimenez et al. 2019). In addition to salinity, the dominance of differ-ent phyla might be further influenced by other parameters,
e.g. nutrient concentrations, and phytoplankton biomass (Wang et al. 2018), which might explain the differences between the results of the present and previous studies.
4.1.1.1 ZooplanktonBased on the HTS-approach, 8 species of micro- and 7 species of mesozooplankton previously not recorded from the Baltic Sea were detected. Based on the zooplankton monitoring data from 2013/2014 (Estonian Env. Agency., 2021a), only 7 mesozooplankton species were detected by the traditional morphology-based approach compared to the 29 species detected by the HTS-approach. Microzoo-plankton is not a part of routine zooplankton monitoring, except for M. rubrum that is included in the phytoplank-ton analysis. The importance of including microzoo-plankton in the monitoring program has been recently emphasized due to their notable contribution (> 50 %) to the nano- and microplankton biomass (Lipsewers and Spilling 2018). To estimate biomass, microscopy-based analysis is necessary, however, to improve species-lev-el detection, molecular methods, such as HTS-approach, have been suggested (Lipsewers and Spilling 2018).
In the case of mesozooplankton, improved detection of zooplankton species based on HTS-approach compared to the morphology-based detection has been reported before (Lindeque, et al. 2013; Hirai, et al. 2015; 2017, Djurhuus, et al. 2018; Meredith et al. 2021). Especially, eDNA sam-ples in comparison to bulk community samples have shown increased diversity detection, as those are not in-fluenced by the mesh size, net avoidance, and destruction of fragile organisms, e.g. jellyfish (Djurhuus et al. 2018). In this study, two of the five newly detected species from the Baltic Sea were benthic species: Gonothyraea loveni and Halicryptus spinulosus. Increased detection of larvae of benthic organisms compared to morphology-based ob-servations has also been reported in other studies utilizing HTS (Lindeque et al. 2013; Hirai et al. 2017; Djurhuus et al. 2018). A potential explanation for this may be the diffi-culty of identifying the larvae of benthic organisms based on morphology (Lindeque et al. 2013; Hirai et al. 2017). In this study, larvae of two non-indigenous Marenzelleria species were also detected. Interestingly, only one of them is reported from the GoF (M. arctia; Blank et al. 2008; Maximov 2015). However, the other species M. viridis has been reported to be present until 2005 (Estonian Env. Agency 2021 b), after which it was reconsidered to be M. neglecta due to new information on salinity preferences (Bastrop and Blank 2006). However, based on the results obtained in this study, M. viridis might still be the species present in the GoF instead of M. neglecta. To confirm the presence of those non-indigenous species, further molec-ular study with increased sampling effort in the GoF is needed as already conducted for several other basins of the Baltic Sea (Bastrop and Blank 2006; Blank et al. 2008).
The HTS-approach also detected three of the most abundant mesozooplankton species in 2013/2014 based on the monitoring reports (Eurytemora affinis, Keratella

https://mbmg.pensoft.net
Sildever et al.: Multiple marker eDNA study targeting the Baltic Sea plankton186
quadrata, Limnocalanus macrurus; Estonian Env. Agen-cy 2021a). However, some dominant species (Eubosmina maritima, Synchaeta baltica, Pseudocalanus acuspes, and Pleopsis polyphenoides) were not detected by any of the three eukaryotic markers used. This might be due to the lack (S. baltica) or low number (max. 6) of 18S rRNA gene sequences available in the database (NCBI 2021). At the same time, more sequences were available for E. maritima, P. acuspes, and P. polyphenoides based on the mitochondrially encoded cytochrome c oxidase I (COI) gene (NCBI 2021). Thus, future studies targeting zooplankton by molecular tools should also include this marker (Machida et al. 2009; Bucklin et al. 2010; Zaiko et al. 2015). However, it should be noted that COI may detect fewer OTUs than the 18S rRNA gene (Djurhuus et al. 2018; Sawaya et al. 2019). Also, to obtain species-lev-el identification group-specific primers may be needed when targeting COI, potentially resulting in inconsistent amplification success (Bucklin, et al. 2016). Interesting-ly, no representatives of Cladocera were detected by the three eukaryotic markers used in this study, although ac-cording to the morphology-based monitoring data from 2013/2014 cladocerans were present (Estonian Env. Agency 2021b). However, this order has been previous-ly detected based on the 18S rRNA marker (Hirai, et al. 2017). Thus, the lack of detection may be influenced by the sampling method as surface water samples were used in this study compared to the net samples taken from the bottom of the water column to the surface by Hirai and others (2017). As cladocerans perform daily vertical mi-gration (Boch and Taylor 1973; Wong et al. 2008), the usage of surface water samples might have hindered their detection in the present study.
4.1.1.2 Common/dominant/toxin-producing speciesFrom the OTUs associated with toxin-producing species (Moestrup et al. 2021), two species, Azadinium dextero-porum, and Prymnesium faveolatum, have previously not been reported from the Baltic Sea (Hällfors 2004). Recently P. faveolatum was also detected from Skager-rak by the HTS-approach, but not by light microscopy (Gran-Stadniczeñko et al. 2018). In the routine phyto-plankton monitoring, Prymnesium is only identified to a genus level (Olenina et al. 2006), which may explain the lack of previous records from the Baltic Sea. For A. dexteroporum, potential misidentification as Heterocapsa rotundata that has a similar shape and size (A. dexteropo-rum: average length 8.5 µm, width 6.2 µm; Percopo et al. 2013; H. rotundata: length 10–15 µm, width 5–10 µm; Olenina et al. 2006; Iwataki 2008) might explain why it has not been recorded before. Aurococcus anophagef-ferns, another toxin-producing species recorded in this study, is not reliably identifiable by light microscopy due to its small size (around 3 µm) and lack of morphological characteristics (Wang and Lei 2016). However, the spe-cies has been previously reported from the GoF and Kat-tegat based on HTS-approach (Hu et al. 2016; Majaneva et al. 2017), but not by light microscopy (Hällfors 2004).
Other new records of toxin-producing phytoplank-ton species were Dolichospermum planctonicum (pre-viously Anabaena planctonica) and Pseudo-nitzschia pungens that have been previously reported from the southern Baltic, but not from the GoF (Hällfors 2004). Sequences of D. planctonicum were present in almost all sampling occasions and stations, potentially indicating that the species is common. The lack of detection of this species by light microscopy might be due to the absence of notable morphological differentiation from other Dol-ichospermum species present in the GoF (D. circinale, D. flosaquae, D. spiroides; Hällfors 2004; Rajaniemi et al. 2005) due to the high proportion of short filament fragments present in the phytoplankton samples instead of longer filaments. At the same time, Pseudo-nitzschia species have not been previously detected from the GoF or adjacent basins (Hällfors 2004). As Pseudo-nitzs-chia is identifiable to genus level by light microscopy (Hasle et al. 1996; Lelong et al. 2012), its presence in the GoF should be detectable. Pseudo-nitzschia pungens can grow even at a salinity of 5 (Pednekar et al. 2018), which is similar to the salinity in May when OTUs as-sociated with P. pungens were present. However, based on the available information, the species does not grow at temperatures below 10 ˚C (Korean strain; Cho et al. 2001). The water temperature in May at both stations was around 5 ˚C. In the Kiel Bight (southern Baltic Sea), Pseudo-nitzschia spp. bloom mainly in autumn (Wasmund et al. 2008), whereas at the entrance to the Baltic Sea (Skagerrak) P. pungens is present throughout the year (Hasle et al. 1996). As the sequences were only detected in May, it might also reflect introduction by ballast water. To confirm the presence of P. pungens or Pseudo-nitzschia spp. in the northern Baltic Sea further investigation is needed, involving morphology-based identification by electron microscope and molecular characterization by the internal transcribed spacer (ITS) region, which is a more informative marker than the 28S rRNA gene for this genus (Lim et al. 2018).
From the spring bloom dinoflagellate species, G. cor-ollarium from the DinoComplex and P. catenata, could be detected by the HTS-approach. However, two other members of the DinoComplex, A. malmogiense, and B. baltica were not detected or present at a low similarity level (<0.99%). In the case of the 18S rRNA gene, both species were classified together with other species, e.g. A. malmogiense was identified together with A. acicu-liferum and B. baltica together with B. cincta and B. brevisulcata at ≥ 0.99 % similarity level. In the case of A. malmogiense, this can be explained by the lack of dif-ferences in the 18S rRNA gene sequences between the two species (Annenkova et al. 2015). However, B. bal-tica and B. cincta belong to closely related, but different clades based on the 18S rRNA gene (Balzano et al. 2012). Although this indicates the potential for distinguishing between the species based on the 18S rRNA gene, the detection may be limited due to the shorter sequences obtained from HTS and following bioinformatic treat-
Metabarcoding and Metagenomics 5: e72371
https://mbmg.pensoft.net
187
ment (369 to 489 bp) compared to around 1500 bp used for the phylogenetic analysis (Balzano et al. 2012). As a future perspective, usage of longer sequences obtained by the third-generation sequencing or synthetic long-read sequencing approaches has the potential to improve species detection from the eDNA samples (Schlaeppi et al. 2016; Singer et al. 2016; Heeger et al. 2018; Tedersoo et al. 2018).
4.1.2 BacterioplanktonOverall, class-level taxa prominent within the bacterio-plankton community composition (BCC) and their sea-sonal succession, although providing a very general over-view, complemented near-perfectly the previous findings from the GoF that have used the same size fractioned filtration system (Laas et al. 2014; 2015; 2016). Together with these previous studies from the GoF, the dynamics of BCC at the surface layer are now well-documented from December of 2010 to May of 2014 and demonstrate repeating interannual patterns of changes in BCC at the surface layer. The dominance of various bacterial groups has also shown positive and negative associations with other parameters, e.g. nutrient concentrations, tempera-ture, Chl α, salinity, turbidity, phytoplankton biomass, diatom: dinoflagellate ratio (Andersson et al. 2010; Laas et al. 2014; 2015; Bunse et al. 2016), but especially with phytoplankton community composition (Camarena-Gó-mez et al. 2020). This was further demonstrated by the data from this study as BCC followed seasonal changes in phytoplankton community composition.
The highest number of OTUs were associated with Alphaproteobacteria and FCB group (Bacterioidetes/Chlorobi group), followed by Actinobacteria. In gen-eral, Cyanobacteria became more prevalent during summer and Flavobacteria during the spring bloom, al-though some members of the FCB group occur exclu-sively during summer bloom. Interestingly, the unicel-lular cyanobacteria, Synechocystis and Synechococcus, increased in relative sequence abundance also in April. Alphaproteobacteria were dominant at the surface lay-er throughout different seasons, compared to previous studies, SAR11 bacteria (Pelagibacterales) were less prevalent in their relative abundances, but they were still present throughout the year (Laas et al. 2014; 2015; 2016). Rhodobacter followed a similar occurrence pat-tern as observed during previous years (Laas et al. 2014; 2015; 2016). Studies encompassing other basins of the Baltic Sea have found salinity as a major factor con-trolling BCC (Herlemann et al. 2011). Actinobacteria and Betaproteobacteria (now reclassified as Betaproteo-bacterales) are generally more abundant in oligohaline areas (Herlemann et al. 2011; Laas et al. 2015), in the present study many OTUs belonging to these taxa re-mained even during the months with higher salinity (De-cember-February). However, the elevated occurrence of Betaproteobacterales in May and July was probably caused by the wider spread of freshwater in the surface layer of the GoF (Lips, et al. 2017).
4.2 Appearance patterns
4.2.1 ZooplanktonFrom the microzooplankton species registered in this and a previous study from the northern Baltic Prop-er (Johansson et al. 2004), Askenasia sp. was detected from a wider range of months, whereas Strobilidium sp. was present during a lesser number of months based on HTS. This can be explained by the yearly variability, as well as by the differences in the months covered: De-cember to August and October in this study, vs. April to December in the previous study. (Johansson et al. 2004). Detection in a wider time range may also be explained by the more sensitive detection based on DNA, than by morphology (Abad et al. 2016). Interestingly, in the case of mesozooplankton, the OTUs were generally detect-ed within the same months as based on monitoring data from the GoF in 2013/2014, but on a lower number of occasions (Estonian Env. Agency 2021a). Since it was a general pattern, differences in sample collection may serve as a potential explanation. In the case of zooplank-ton monitoring data, the samples are collected by using a 100 µm net throughout the water column (HELCOM 2021), which may help to detect the organisms present also below the 5 m depth used in this study. Further, the sequences present in low relative abundance may also be masked by sequences from other organisms present in higher total abundance or with higher rRNA gene copy numbers (Schneider et al. 2016; Mäki et al. 2017; Deagle et al. 2018). Thus, to obtain a comprehensive overview of both micro- and mesozooplankton appear-ance patterns in the GoF, further study applying both HTS and morphology-based approaches and taking into account different sampling strategies (water vs. zoo-plankton net) is needed.
From the Mesodinium species detected, M. rubrum and M. major displayed almost identical appearance pat-terns. These two species have been identified based on their morphology and division into distinct clades based on rRNA genes and internal transcribed spacer region (Garcia-Cuetos et al. 2012). Differences in their season-al abundance have also been reported from the Öresund, Baltic Sea, where M. rubrum is more abundant during summer and early autumn and M. major in winter and early spring (Garcia-Cuetos et al. 2012). In this study, no such differences were observed. As both M. rubrum and M. major have been detected from the GoF previously (Johnson, et al. 2016), further investigation is needed, whether the two species display temporal differences in their relative abundances similar to the Öresund. This in-formation can be useful for providing more detailed in-formation on the appearance of those important primary producers in post-bloom conditions (Lips and Lips 2017). In addition, M. rubrum appearance patterns can also re-flect the presence of toxin-producing Dinophysis species (Sjöqvist and Lindholm 2011) as it is the main prey item for D. acuminata and several other Dinophysis species (Park et al. 2006; Nagai et al. 2020b).

https://mbmg.pensoft.net
Sildever et al.: Multiple marker eDNA study targeting the Baltic Sea plankton188
4.2.2 Common/dominant/toxin-producing species ap-pearance patternsInvestigation of common/dominant/toxin-producing species appearances patterns based on their relative se-quence abundances displayed similar patterns with 20 years of phytoplankton monitoring data (for the species identifiable under light microscopy; Estonian Env. Agen-cy 2021c; Suppl. material 2, Table S6). It is recognized that the relative sequence abundances do not reflect the number of cells/organisms or biomass directly (Egge et al. 2013; Weber and Pawlowski 2013; Lamb et al. 2019). However, it may provide an overall impression of spe-cies/classes relative abundances (Eiler et al. 2013; Giner et al. 2016; Gran-Stadniczeñko et al. 2017; Schenk et al. 2019). For example, the relative sequence abundances obtained by HTS-approach have been reported to coin-cide with the yearly total abundance patterns detected by using light microscopy for the toxin-producing dinofla-gellate Alexandrium catenella (Nagai et al. 2019). Fur-thermore, in combination with light microscopy-based counts, the relative sequence abundances may provide a semi-quantitative estimate of cell abundances, which has high relevance for morphologically similar species, e.g. Pseudo-nitzschia spp. (Nagai et al. 2017).
In this study, the majority of the common/dominant/toxin-producing species detected appeared in various months throughout the year, and 2/3 of those species had the highest relative sequence abundances within the months with the highest biomass reported (Estonian Env. Agency, 2021c). For example, all detected cyanobacte-rial species had higher relative sequence abundances in summer, which is consistent with the previous knowledge from published studies (Kanoshina et al. 2003; Laamanen and Kuosa 2005) and long-term phytoplankton monitor-ing dataset (Estonian Env. Agency 2021c). However, 1/3 of the highest relative sequence abundances were record-ed in months different from the months with the highest biomass reported in the phytoplankton dataset. As the high relative sequence abundances were within the months of the known appearance for the species and the difference was usually one month earlier or later than previously recorded, it probably reflects variation in the conditions favoring or hindering their growth e.g. nutrient depletion, upwelling (Lips and Lips 2010; Lips et al. 2014). Thus, the detected species generally followed the previously known patterns in their appearance and abundance.
For species that were detected in this study, but not present in the long-term phytoplankton dataset, the ap-pearance patterns were investigated based on literature or based on the genus level information from the phy-toplankton dataset. For example, the toxin-producing di-noflagellate A. ostenfeldii was present during almost all the sampling months with the highest relative sequence abundances in July. However, in the Åland archipel-ago, the cells are present from May to September with the highest abundances in July, August, and September (Kremp et al. 2009; Hakanen et al. 2012; Le Tortorec et al. 2014). The detection of this species in winter and
early spring is surprising as the A. ostenfeldii cells have not been detected from the water column in the Åland archipelago at 10˚C (Jerney et al. 2019). Furthermore, the germination of A. ostenfeldii resting cysts is inhibited if the temperature is <10˚C (Jerney et al. 2019). Thus, the early detection in this study might result from the pres-ence of resuspended cysts in the water column. However, further investigation with higher frequency and morphol-ogy-based observations is needed to explain the detection of A. ostenfeldii associated sequences during winter and early spring. For another toxin-producing species, Au-reococcus anophagefferens, the sequences were detect-ed from July and August, whereas previously it has been recorded in March from the GoF (Majaneva et al. 2017) and in July from Kattegat (Hu et al. 2016). The species can grow from 0 ˚C to 25 ˚C and its blooms have been detected at various temperatures (Gobler et al. 2005 and references therein). For example, in the Sea of Okhotsk, the species is present throughout the year with higher relative sequence abundances during winter (Sildever et al. 2019). Its appearance in various environmental condi-tions is further supported by the capability to utilize or-ganic carbon and nitrogen (Mulholland et al. 2002). This may explain its presence in the GoF during summer when inorganic nutrients, especially nitrogen, are limiting phy-toplankton growth (Graneli et al. 1990; Moisander et al. 2003; Tamminen and Andersen 2007).
Contrary to A. anophagefferens, A. dexeteroporum was detected throughout the year with the highest rela-tive sequence abundances in January, February, and June. Based on the previous studies, the species can also grow in a wide temperature range (0.6 ˚C to 28˚C), depend-ing on the geographic origin of the strain (Percopo et al. 2013; Tillmann et al. 2015, 2020; Cavalcante et al. 2018). Furthermore, based on six years of weekly data analyzed by metabarcoding and HTS-approach, the species was detected throughout the year in the Sea of Okhotsk, from water temperatures of -1.7 ˚C to around 20˚C (Sildever et al. 2019). Thus, the high relative sequence abundances detected in this study during winter and summer, proba-bly reflect the capability of the species to utilize suitable conditions for growth in a broad temperature range. An-other species detected throughout the year was Karlod-inium veneficum, displaying peaks in relative sequence abundances also in various seasons, e.g. winter: from De-cember to February, and summer: May to July. A similar pattern of continuous presence and peaks in biomass/rel-ative sequence abundances at different months have been also shown in the east coast of the U.S.A. and the Sea of Okhotsk (Zhang et al. 2008; Sildever et al. 2019). At both localities, the species was detected from a wide salinity and temperature range: salinity of 0 to 32 g kg-1 and tem-perature of 4 ˚C to 30 ˚C in the east coast of US; salinity of 20 to 33 g kg-1 and temperature to -1.7 ˚C to 22 ˚C in the Sea of Okhotsk (Zhang et al. 2008; Sildever et al. 2019). Since K. veneficum is mixotrophic, its appearance may reflect the availability of its prey, as its growth rates can be 2 to 3 times higher when grown mixotrophically
Metabarcoding and Metagenomics 5: e72371
https://mbmg.pensoft.net
189
(Li et al. 1999). However, no pattern between the relative sequence abundances of K. veneficum and its prey (Cryp-tophyta) was detected in this study (data not shown).
Prymnesium parvum f. patelliferum is a form of P. parvum (Larsen 1999), a cosmopolitan euryhaline (salin-ities of 3 to 30 g kg-1), and eurythermal (5 ˚C to 30 ˚C) species (Edvarsen and Paasche 1998; Larsen and Bryant 1998). It has formed toxic blooms around the world (Ed-varsen and Paasche 1998; Johnsen et al. 2010; Roelke et al. 2016), as well as in the coastal waters of SW Finland and a brackish water lake on the Åland islands (Lindholm and Virtanen, 1992; Lindholm et al. 1999). Prymnesium parvum is present in several basins of the Baltic Sea, in-cluding the GoF (Hällfors 2004). The species has been detected throughout the year with the highest abundances recorded at the end of June and July in the Baltic Sea (Fistarol et al. 2003). The species has not been reported in the long-term monitoring data (Estonian Env. Agen-cy, 2021c), potentially explained by the difficulties with the morphology-based identification due to small size (Green et al. 1982) and the negative influence of sample fixation on cell morphology (Galluzzi et al. 2008). How-ever, the long-term dataset provided information on the appearance of Prymnesiales and Prymnesium: presence throughout the year with the highest biomass detected from May to August (Estonian Env. Agency 2021c). In this study, P. parvum f. patelliferum was recorded from May to August, but also in December, with the highest relative sequence abundances in May, and July-August. The lack of detection before May by the HTS approach might be potentially due to its presence in very low abun-dances, further influenced by the amount of water filtered (up to 1 L) as the species was present in low abundances also at times when it was detected by the HTS-approach (relative sequence abundances < 0.3%). Another Prym-nesium species detected in this study, P. faveolatum, has only been previously recorded from the Mediterranean Sea and the northern Atlantic (Fresnel et al. 2001; Ed-vardsen et al. 2011) and no detailed information is avail-able on its ecological preferences. Thus, further investi-gations are needed to confirm its appearance in different geographic locations and environmental conditions.
4.3 Potential interactions and co-appearance patterns
Based on the correlation analysis between the common, dominant, or toxin-producing phytoplankton and zoo-plankton species, the statistically significant (P < 0.05) associations probably reflect co-appearance and not in-teractions as the majority of the species from both groups were detected throughout the sampling period. This is further illustrated by the significant negative correlations between dinoflagellate, A. anophagefferens, and a cteno-phore, Mertensia ovum, as the dinoflagellate was only present in the samples from July and August, whereas the ctenophore species was present in the majority of the samples, except during those months. A similar, but op-posite pattern was displayed between a chrysophyte Pla-
gioselmis prolonga and several zooplankton species with the cryptophyte missing from the July-August samples. The significant positive correlations may also reflect the zooplankton presence following the presence of its prey, e.g. copepod Limnocalanus macrurus and diatoms Me-losira arctica and Skeletonema marinoi (Mäkinen et al. 2017) or ciliates and Heterocapsa triquetra (Stoecker and Evans 1985; Hansen, 1995). However, zooplankton gen-erally avoids grazing on toxin-producing phytoplankton species, e.g. Alexandrium ostenfeldii, A. anophageffer-ens, Prymnesium faveolatum (Graneli et al. 2003; Gobler et al. 2004; Sopanen et al. 2011), which should lead to negative associations between the taxa if the detected pat-terns reflect feeding.
In the case of correlations between common, domi-nant, or toxin-producing phytoplankton species and bac-teria, the majority of the significant correlations detected were positive, except for A. anophagefferens. However, as the negative correlations were detected between A. ano-phagefferens and bacteria belonging to various phyla and classes, the significant negative correlations might reflect differences in appearance patterns. On average, the highest number of bacterial OTUs from all stations were present from December to April (average number of OTUs: 506–603), whereas during the detection of A. anophagefferens in July-August, the average number of bacterial OTUs ranged around 380. The interactions between phytoplank-ton and bacteria can range from mutualistic to competitive or antagonistic (Cole, 1982; Seymour, et al. 2017) with potential shifts in the type of the relationship (Wang et al. 2010; Seyedsayamdost et al. 2011). The associations de-tected between phytoplankton and bacteria in this study might thus provide a broad snapshot of the diversity pres-ent in the phycosphere of the phytoplankton cells in differ-ent species (Johansson et al. 2019; Blifernez-Klassen et al. 2021). This information might provide useful insight for more detailed studies on the bacterial diversity associated with various phytoplankton species.
5. Conclusions
The results of this study provide the first information on plankton diversity and appearance patterns obtained by HTS-approach over various seasons from the Baltic Sea. The HTS-approach facilitated the detection of 15 zoo-plankton species previously not known from the Baltic Sea, with more than half of those being microzooplank-ton species. In the case of phytoplankton, the presence of two toxin-producing species was also recorded for the first time from the Baltic Sea. The presence of a diverse bacterial community was also registered. The phyto- and bacterioplankton dynamics followed the seasonal pat-terns known from long-term monitoring and previous studies displaying the reliable detection of plankton ap-pearance patterns with the HTS-approach. In the case of zooplankton species, the majority of the species were present throughout the sampling season, especially cili-
https://mbmg.pensoft.net
Sildever et al.: Multiple marker eDNA study targeting the Baltic Sea plankton190
ates associated with the microzooplankton. The correla-tion patterns between the phytoplankton and bacteria/zooplankton reflected patterns in species appearances. Overall, the results of this study support the usage of HTS-approach for plankton biodiversity monitoring as well as for following patterns in their seasonal dynamics.
Acknowledgments
The captain and the crew of RV “Salme” are thanked for their assistance during the sampling campaigns. Prof. N. Lundholm, Drs. H. Hällfors, S. Lehtinen, A. Jaanus, and A. Enke are thanked for the discussion on the potential presence of Pseudo-nitzschia pungens in the northern Baltic Sea. This study was supported by grants from Japan Society for the Promotion of Science Short-term Postdoctoral Fellowship (PE18028) [SN, SS], a Grant-in-Aid (Marine Metagenomics for Monitoring the Coastal Microbiota) by the Ministry of Agriculture, Forestry, and Fisheries of Japan [SN], a Grant-in-Aid for Scientific Research (Kiban-B) by the Japan Society for the Promo-tion of Science (Grant number: 18KK0182)[SN], JST/JICA, Science and Technology Research Partnership for Sustainable Development (JPMJSA1705) [SN], institu-tional research funding (IUT 19-6) of the Estonian Min-istry of Education and Research [IL, UL], Estonian Re-search Council grant PRG602 [UL], European Regional Development Fund and the program Mobilitas Pluss (MOBTP160) [SS].
References
Abad D, Albaina A, Aguirre M, Laza-Martínez A, Uriarte I, Iriarte A, Villate F, Estonba A (2016) Is metabarcoding suitable for estuarine plankton monitoring? A comparative study with microscopy. Marine Biology 163:149. https://doi.org/10.1007/s00227-016-2920-0
Acevedo-Trejos E, Brandt G, Bruggeman J, Merico A (2015) Mecha-nisms shaping size structure and functional diversity of phytoplank-ton communities in the ocean. Scientific Reports 5: 17–20. https://doi.org/10.1038/srep08918
Amann RI, Ludwig W, Schleifer K (1995) Phylogenetic Identification and In Situ Detection of Individual Microbial Cells without Cul-tivation. Microbiological Reviews 59(1): 143–169. https://doi.org/10.1128/mr.59.1.143-169.1995
Anderson MJ, Ellingsen KE, McArdle BH (2006) Multivariate disper-sion as a measure of beta diversity. Ecology Letters 9(6): 683–693. https://doi.org/10.1111/j.1461-0248.2006.00926.x
Andersson AF, Riemann L, Bertilsson S (2010) Pyrosequencing reveals contrasting seasonal dynamics of taxa within Baltic Sea bacterio-plankton communities. ISME Journal 4(2): 171–181. https://doi.org/10.1038/ismej.2009.108
Annenkova NV, Hansen G, Moestrup Ø, Rengefors K (2015) Recent ra-diation in a marine and freshwater dinoflagellate species flock. ISME Journal 9(8): 1821–1834. https://doi.org/10.1038/ismej.2014.267
Azam F, Fenchel T, Field J, Gray J, Meyer-Reil L, Thingstad F (1983). The Ecological Role of Water-Column Microbes in the Sea. Ma-
rine Ecology Progress Series 10: 257–263. https://doi.org/10.3354/meps010257
Balzano S, Gourvil P, Siano R, Chanoine M, Marie D, Lessard S, Sarno D, Vaulot D (2012) Diversity of cultured photosynthetic flagellates in the northeast Pacific and Arctic Oceans in summer. Biogeoscienc-es, 9(11): 4553–4571. https://doi.org/10.5194/bg-9-4553-2012
Banerji A, Bagley M, Elk M, Pilgrim E, Martinson J, Santo Domingo J (2018) Spatial and temporal dynamics of a freshwater eukaryotic plank-ton community revealed via 18S rRNA gene metabarcoding. Hydrobio-logia, 818(1): 71–86. https://doi.org/10.1007/s10750-018-3593-0
Bastrop R, Blank M (2006) Multiple invasions – A polychaete genus enters the Baltic Sea. Biological Invasions, 8: 1195–1200. https://doi.org/10.1007/s10530-005-6186-6
Benjamini Y, Hochberg Y (1995) Controlling the False Discovery Rate – A Practical and Powerful Approach to Multiple Testing. Journal of the Royal Statistical Society B 57: 289–300. https://doi.org/10.2307/2346101
Berry TE, Saunders BJ, Coghlan ML, Stat M, Jarman S, Richardson AJ, Davies CH, Berry O, Harvey ES, Bunce, M (2019) Marine en-vironmental DNA biomonitoring reveals seasonal patterns in bio-diversity and identifies ecosystem responses to anomalous climatic events. PLoS Genetics: 15(2): e1007943. https://doi.org/10.5061/dryad.sc673ds.
Blank M, Laine AO, Jürss K, Bastrop R (2008) Molecular identifica-tion key based on PCR/RFLP for three polychaete sibling species of the genus Marenzelleria, and the species’ current distribution in the Baltic Sea. Helgoland Marine Research 62 (2): 129–141. https://doi.org/10.1007/s10152-007-0081-8
Blifernez-Klassen O, Klassen V, Wibberg D, Cebeci E, Henke C, Rück-ert C, Chaudhari S, Rupp O, Blom, J, Winkler, A, Al-Dilaimi, A, Goesmann, A, Sczyrba, A, Kalinowski, J, Bräutigam, A, Kruse, O (2021) Phytoplankton consortia as a blueprint for mutually bene-ficial eukaryote-bacteria ecosystems: Biocoenosis of Botryococ-cus consortia. Scientific Reports 11: 1726. https://doi.org/10.1038/s41598-021-81082-1
Boch H, Taylor RR (1973) Diurnal vertical migration of an estuarine cladoceran, Podon polyphemoides, in the Chesapeake Bay. Marine Biology 19: 172-181. https://doi.org/10.1007/BF00353589
Brannock PM, Ortmann AC, Moss AG, Halanych KM (2016) Metabar-coding reveals environmental factors influencing spatio-temporal variation in pelagic micro-eukaryotes. Molecular Ecology, 25(15): 3593–3604. https://doi.org/10.1111/mec.13709
Bucklin A, Lindeque PK, Rodriguez-Ezpeleta N, Albaina A, Lehti-niemi, M (2016). Metabarcoding of marine zooplankton: Prospects, progress and pitfalls. Journal of Plankton Research 38(3): 393–400. https://doi.org/10.1093/plankt/fbw023
Bucklin A, Ortman BD, Jennings RM, Nigro LM, Sweetman CJ, Cop-ley N, Sutton T, Wiebe PH (2010) A “Rosetta Stone” for metazoan zooplankton: DNA barcode analysis of species diversity of the Sar-gasso Sea (Northwest Atlantic Ocean). Deep-Sea Research Part II: Topical Studies in Oceanography 57: 2234–2247.
Bucklin A, Yeh HD, Questel JM, Richardson DE, Reese B, Copley NJ, Wiebe PH (2019). Time-series metabarcoding analysis of zooplankton diversity of the NW Atlantic continental shelf. ICES Journal of Ma-rine Science 76(4):1162–1176. https://doi.org/10.1093/icesjms/fsz021
Bunse C, Bertos-Fortis M, Sassenhagen I, Sildever S, Sjöqvist C, Godhe A, Gross S, Kremp A, Lips I, Lundholm N, Rengefors K, Sefbom J, Pinhassi J, Legrand C (2016) Spatio-temporal interde-pendence of bacteria and phytoplankton during a Baltic Sea spring
Metabarcoding and Metagenomics 5: e72371
https://mbmg.pensoft.net
191
bloom. Frontiers in Microbiology 7: 517. https://doi.org/10.3389/fmicb.2016.00517
Bunse C, Israelsson S, Baltar F, Bertos-Fortis M, Fridolfsson E, Leg-rand C, Lindehoff E, Lindh MV, Martínez-García S, Pinhassi J (2019) High frequency multi-year variability in baltic sea microbial plankton stocks and activities. Frontiers in Microbiology 9: 3296. https://doi.org/10.3389/fmicb.2018.03296
Calbet A (2008) The trophic roles of microzooplankton in marine sys-tems. ICES Journal of Marine Science 65(3): 325–331. https://doi.org/10.1093/icesjms/fsn013
Camacho C, Coulouris G, Avagyan V, Ma N, Papadopoulos J, Bealer K, Madden T L (2009) BLAST+: architecture and applications. BMC Bioinformatics 10, 421. https://doi.org/10.1186/1471-2105-10-421
Camarena-Gómez MT, Lipsewers T, Piiparinen J, Eronen-Rasimus E, Perez-Quemaliños D, Hoikkala L, Sobrino C, Spilling K (2018) Shifts in phytoplankton community structure modify bacterial pro-duction, abundance and community composition. Aquatic Microbial Ecology 81:149-170. https://doi.org/10.3354/ame01868
Camarena-Gómez MT, Ruiz-González C, Piiparinen J, Lipsewers T, So-brino C, Logares R, Spilling K (2020) Bacterioplankton dynamics driven by interannual and spatial variation in diatom and dinofla-gellate spring bloom communities in the Baltic Sea. Limnology and Oceanography 66: 255–271. https://doi.org/10.1002/lno.11601
Cavalcante KP, Susini-Ribeiro SMM, Tillmann U (2018) First detection of species of the potentially toxic genus Azadinium (Amphidoma-taceae, Dinophyceae) in tropical coastal waters of Brazil. Revista Brasileira de Botanica 41(1): 209–218. https://doi.org/10.1007/s40415-017-0435-7
Chain FJJ, Brown EA, Macisaac HJ, Cristescu ME (2016) Metabarcod-ing reveals strong spatial structure and temporal turnover of zoo-plankton communities among marine and freshwater ports. Diversity and Distributions 22(5): 493–504. https://doi.org/10.1111/ddi.12427
Cho ES, Kotaki Y, Park JG (2001) The Comparison between Toxic Pseudo-nitzschia multiseries (Hasle) Hasle and Non-toxic P. pun-gens (Grunow) Hasle Isolated from Jinhae Bay, Korea. Algae 16(3): 275–285.
Choquet M, Kosobokova K, Kwaśniewski S, Hatlebakk M, Dhanasiri AKS, Melle W, Daase M, Svensen C, Søreide JE, Hoarau G (2018) Can morphology reliably distinguish between the copepods Cala-nus finmarchicus and C. glacialis, or is DNA the only way? Lim-nology and Oceanography: Methods 16(4): 237–252. https://doi.org/10.1002/lom3.10240
Cirri E, Pohnert G (2019) Algae-bacteria interactions that balance the planktonic microbiome. New Phytologist 223(1): 100–106. https://doi.org/10.1111/nph.15765
Cirri E, Vyverman W, Pohnert G (2018) Biofilm interactions-bacte-ria modulate sexual reproduction success of the diatom Seminavis robusta. FEMS Microbiology Ecology 94(11): 1–9. https://doi.org/10.1093/femsec/fiy161
Cole JJ (1982) Interactions between bacteria and algae in aquatic eco-systems. Annual Review of Ecology and Systematics 13: 291–314. https://doi.org/10.1146/annurev.es.13.110182.001451
Cui Y, Chun SJ, Baek SH, Lee M, Kim Y, Lee HG, Ko SR, Hwang S, Ahn CY, Oh HM (2019) The water depth-dependent co-occurrence patterns of marine bacteria in shallow and dynamic Southern Coast, Korea. Scientific Reports 9: 9176. https://doi.org/10.1038/s41598-019-45512-5
Dale B, Murphy M (2014) A retrospective appraisal of the importance of high-resolution sampling for harmful algal blooms: Lessons from
long-term phytoplankton monitoring at Sherkin Island, S.W. Ireland. Harmful Algae 40: 23–33. https://doi.org/10.1016/j.hal.2014.09.007
Deagle BE, Clarke LJ, Kitchener JA, Polanowski AM, Davidson AT (2018) Genetic monitoring of open ocean biodiversity: An evalua-tion of DNA metabarcoding for processing continuous plankton re-corder samples. Molecular Ecology Resources, 18, 391-406. https://doi.org/10.1111/1755-0998.12740
de Vargas C, Audic S, Henry N, Decelle J, Mahé F, Logares R, Lara E, Berney C, Le Bescot N, Probert I, Carmichael M, Poulain J, Romac S, Colin S, Aury J-M, Bittner L, Chaffron S, Dunthorn M, Engelen S, Flegontova O, Guidi L, Horák A, Jaillon O, Lima-Mendez, G, Lukeš, J, Malviya, S, Morard, R, Mulot, M, Scalco, E, Siano, R, Vin-cent, F, Zingone A, Dimier C, Picheral M, Searson S, Kandels-Lewis S, Acinas SG, Bork P, Bowler C, Gorsky G, Grimsley N, Hingamp P, Iudicone D, Not F, Ogata H, Pesant S, Raes J, Sieracki ME, Speich S, Stemmann L, Sunagawa S, Weissenbach J, Wincker P, Karsenti E (2015) Eukaryotic plankton diversity in the sunlit ocean. Science 348(6237): 1261605. https://doi.org/10.1126/science.1261605
Djurhuus A, Pitz K, Sawaya NA, Rojas-Márguez, J, Michaud B, Mon-tes E, Muller-Karger F, Breitbart M (2018) Evaluation of marine zooplankton community structure through environmental DNA me-tabarcoding. Limnology and Oceanography: Methods 16: 209–221. https://doi.org/10.1002/lom3.10237
Dzhembekova N, Moncheva S, Ivanova P, Slabakova N, Nagai S (2018) Biodiversity of phytoplankton cyst assemblages in surface sedi-ments of the Black Sea based on metabarcoding. Biotechnology and Biotechnological Equipment 32(6): 1–7. https://doi.org/10.1080/13102818.2018.1532816
Dzhembekova N, Urusizaki S, Moncheva S, Ivanova P, Nagai S (2017) Applicability of massively parallel sequencing on monitoring harm-ful algae at Varna Bay in the Black Sea. Harmful Algae 68: 40–51. https://doi.org/10.1016/j.hal.2017.07.004
Ebenezer V, Medlin LK, Ki J (2012) Molecular Detection, Quantifica-tion, and Diversity Evaluation of Microalgae. Marine Biotechnolo-gy 14: 129–142. https://doi.org/10.1007/s10126-011-9427-y
Edgar RC, Haas BJ, Clemente JC, Quince C, Knight R (2011) UCHIME improves sensitivity and speed of chimera detection. Bioinformatics 27(16): 2194–2200. https://doi.org/10.1093/bioinformatics/btr381
Edler L, Elbrächter M (2010) The Utermöhl method for quantitative phytoplankton analysis. In: Karlson B, Cusack C, Bresnan E (Eds) Microscopic and molecular methods for quantitative phytoplankton analysis. IOC Manuals and Guides, no. 55. UNESCO, Paris, 13–20.
Edvardsen B, Eikrem W, Throndsen J, Sáez AG, Probert I, Medlin LK (2011) Ribosomal DNA phylogenies and a morphological revision provide the basis for a revised taxonomy of the Prymnesiales (Hap-tophyta). European Journal of Phycology 46(3): 202–228. https://doi.org/10.1080/09670262.2011.594095
Egge E, Bittner L, Andersen T, Audic S, de Vargas C, Edvardsen B (2013) 454 Pyrosequencing to Describe Microbial Eukaryotic Community Composition, Diversity and Relative Abundance: A Test for Marine Haptophytes. PLOS ONE 8(9): e74371. https://doi.org/10.1371/journal.pone.0074371
Eiler A, Drakare S, Bertilsson S, Pernthaler J, Peura S, Rofner C, Simek K, Yang Y, Znachor P, Lindström ES (2013) Unveiling Distribu-tion Patterns of Freshwater Phytoplankton by a Next Generation Sequencing Based Approach. PLoS ONE 8(1): e53516. https://doi.org/10.1371/journal.pone.0053516
Estonian Environment Agency (2021a) National environmental mon-itoring sub-programme “Marine monitoring”. Zooplankton dataset

https://mbmg.pensoft.net
Sildever et al.: Multiple marker eDNA study targeting the Baltic Sea plankton192
(2013–2014). UT Estonian Marine Institute. Data available in Esto-nian Environment Agency`s database KESE: https://kese.envir.ee/kese/welcome.action [accessed 16.01.2021; In Estonian]
Estonian Environment Agency (2021b) National environmental mon-itoring sub-programme “Marine monitoring”. Zooplankton dataset (1993–2012). UT Estonian Marine Institute. Data available in Esto-nian Environment Agency`s database KESE: https://kese.envir.ee/kese/welcome.action [accessed 16.01.2021; In Estonian]
Estonian Environment Agency (2021c) National environmental moni-toring sub-programme “Marine monitoring”. Phytoplankton dataset (1993–2013). UT Estonian Marine Institute, Taltech Department of Marine Systems. Data available in Estonian Environment Agency`s database KESE: https://kese.envir.ee/kese/welcome.action [ac-cessed 16.01.2021; In Estonian]
Fenchel T (1988) Marine Plankton Food Chains. Annual Review of Ecology and Systematics 19: 19–38. https://doi.org/10.1146/an-nurev.es.19.110188.000315
Fistarol GO, Legrand C, Graneli E (2003) Allelopathic effect of Prym-nesium parvum on a natural plankton community. Marine Ecology Progress Series 255: 115–125. https://doi.org/10.3354/meps255115
Forsblom L, Engström-Öst J, Lehtinen S, Lips I, Lindén A (2019) En-vironmental variables driving species and genus level changes in annual plankton biomass. Journal of Plankton Research 41(6): 925–938. https://doi.org/10.1093/plankt/fbz063
Fresnel J, Prober I, Billard C (2001) Prymnesium faveolatum sp. nov. (Prymnesiophyceae), a new toxic species from the Mediterranean Sea. Vie et Milieu 51(1): 89–97. https://doi.org/10.1080/09670260701440992
Galluzzi L, Bertozzini E, Penna A, Perini F, Pigalarga A, Graneli E, Mag-nani M (2008) Detection and quantification of Prymnesium parvum (Haptophyceae) by real-time PCR. Letters in Applied Microbiology. 46: 261–266. https://doi.org/10.1111/j.1472-765X.2007.02294.x
Garcia-Cuetos L, Moestrup O, Hansen PJ (2012) Studies on the genus Mesodinium II. Ultrastructural and molecular investigations of five marine species help clarifying the taxonomy. Journal of Eukary-otic Microbiology 59(4): 374–400. https://doi.org/10.1111/j.1550-7408.2012.00630.x
Giner CR, Forn I, Romac S, Logares R, de Vargas C (2016) Environ-mental Sequencing Provides Reasonable Estimates of the Relative Abundance of Specific Picoeukaryotes. Applied and Environmen-tal Microbiology 82(15): 4757–4766. https://doi.org/10.1128/AEM.00560-16.
Gobler CJ, Deonarine S, Leigh-Bell J, Gastrich MD, Anderson OR, Wil-helm SW (2004) Ecology of phytoplankton communities dominated by Aureococcus anophagefferens: The role of viruses, nutrients, and microzooplankton grazing. Harmful Algae 3: 471–484.
Gobler CJ, Lonsdale DJ, Boyer GL (2005) A Review of the Causes, Effects, and, Potential Management of Harmful Brown Tide Blooms Caused by Aureococcus anophagefferens (Hargraves et Sieburth). Estuaries 28(5):726–749. https://doi.org/10.1007/BF02732911
Gran-Stadniczeñko S, Dunthorn Egge E, Hostyeva V, Logares R, Eikrem W, Edvardsen B (2018) Protist Diversity and Seasonal Dy-namics in Skagerrak Plankton Communities as Revealed by Me-tabarcoding and Microscopy. Journal of Eukaryotic Microbiology 66: 494–513. https://doi.org/10.1111/jeu.12700
Gran-Stadniczeñko S, Supraha L, Egge ED, Edvardsen B (2017) Hap-tophyte Diversity and Vertical Distribution Explored by 18S and 28S Ribosomal RNA Gene Metabarcoding and Scanning Electron
Microscopy. The Journal of Eukaryotic Microbiology 64: 514–532. https://doi.org/10.1111/jeu.12388
Green JC, Hibberd DJ, Pienaar RN (1982) The taxonomy of Prymne-sium (Prymnesiophyceae) including a description of a new cosmo-politan species, P. patellifera sp. nov., and further observations on P. parvum N. carter. British Phycological Journal 17(4): 363–382. https://doi.org/10.1080/00071618200650381
Griffiths JR, Lehtinen S, Suikkanen S, Winder M (2020) Limited ev-idence for common interannual trends in Baltic Sea summer phy-toplankton biomass. PLOS ONE 15(4): e0231690. https://doi.org/10.1371/journal.pone.0231690
Hakanen P, Suikkanen S, Franzén J, Franzén H, Kankaanpää H, Kremp A (2012) Bloom and toxin dynamics of Alexandrium ostenfeldii in a shallow embayment at the SW coast of Finland, northern Baltic Sea. Harmful Algae, 15: 91–99. https://doi.org/10.1016/j.hal.2011.12.002
Hansen PJ (1995) Growth and grazing response of a ciliate feeding on the red tide dinoflagellate Gyrodinium aureolum in monoculture and in mixture with a non-toxic alga. Marine Ecology Progress Series 121: 65–72. https://doi.org/10.3354/meps121065
Hällfors G (2004). Checklist of Baltic Sea Phytoplankton Species. Bal-tic Sea Environment Proceedings No. 95. https://www.helcom.fi/wp-content/uploads/2019/10/BSEP95.pdf [accessed: 01.01.2021]
Hällfors H, Backer H, Leppänen JM, Hällfors S, Hällfors G, Kuosa, H (2013) The northern Baltic Sea phytoplankton communities in 1903–1911 and 1993–2005: a comparison of historical and mod-ern species data. Hydrobiologia 707(1): 109–133. https://doi.org/10.1007/s10750-012-1414-4
Hasle GR, Lange CB, Syvertsen EE (1996) A review of Pseudo-nitzs-chia, with special reference to the Skagerrak, North Atlantic, and adjacent waters. Helgoländer Meeresuntersuchungen 50: 131–175. https://doi.org/10.1007/BF02367149
Heeger F, Bourne, EC, Baschien C, Yurkov A, Bunk B, Spröer C, Over-mann J, Mazzoni CJ, Monaghan MT (2018) Long-read DNA me-tabarcoding of ribosomal RNA in the analysis of fungi from aquatic environments. Molecular Ecology Resources 18(6): 1500–1514. https://doi.org/10.1111/1755-0998.12937
HELCOM (2021) Guidelines for monitoring mesozooplankton. https://helcom.fi/media/publications/Guidelines-for-monitoring-of-meso-zooplankton.pdf [accessed: 20.01.2021]
Herlemann DPR, Labrenz M, Ju K, Bertilsson S, Waniek JJ, Andersson AF (2011) Transitions in bacterial communities along the 2000 km salinity gradient of the Baltic Sea. The Isme Journal 5: 1571–1579. https://doi.org/10.1038/ismej.2011.41
Herlemann DPR, Lundin D, Andersson AF, Labrenz M, Jürgens K, Seymour JR (2016) Phylogenetic Signals of Salinity and Season in Bacterial Community Composition Across the Salinity Gradient of the Baltic Sea. The Isme Journal 7: 1–13. https://doi.org/10.3389/fmicb.2016.01883
Hirai J, Katakura S, Kasai H, Nagai S (2017) Cryptic Zooplankton Di-versity Revealed by a Metagenetic Approach to Monitoring Metazo-an Communities in the Coastal Waters of the Okhotsk Sea, North-eastern Hokkaido. Frontiers in Marine Science 4 1–13. https://doi.org/10.3389/fmars.2017.00379
Hirai J, Yasuike M, Nakamura Y, Hamaoka S, Katakura S, Takano Y, Nagai S (2015) Effects of plankton net characteristics on metagenet-ic community analysis of metazoan zooplankton in a coastal marine ecosystem. Journal of Experimental Marine Biology and Ecology 469: 36-43. https://doi.org/10.1016/j.jembe.2015.04.011

Metabarcoding and Metagenomics 5: e72371
https://mbmg.pensoft.net
193
Hobbie JE, Daley RJ, Jasper S (1977) Use of Nuclepore Filters for Counting Bacteria by Fluorescence Microscopy. Applied and Envi-ronmental Microbiology 33(5): 1225–1228. https://doi.org/10.1128/aem.33.5.1225-1228.1977
Hu YOO, Karlson B, Charvet S, Andersson AF (2016) Diversity of Pico – to Mesoplankton along the 2000 km Salinity Gradient of the Bal-tic Sea. Frontiers in Microbiology, 7: 679. https://doi.org/10.3389/fmicb.2016.00679
Iwataki M (2008) Taxonomy and identification of the armored dinofla-gellate genus Heterocapsa (Peridiniales, Dinophyceae). Plankton and Benthos Research. 3(3): 135-142. https://doi.org/10.3800/pbr.3.135
Jaanus A, Kuprijanov I, Kaljurand K, Lehtinen S, Enke A (2017) Op-timization of phytoplankton monitoring in the Baltic Sea. Jour-nal of Marine Systems 171: 65–72. https://doi.org/10.1016/j.jmarsys.2016.10.009
Jerney J, Ahonen SA, Hakanen P, Suikkanen S, Kremp A (2019) Gen-eralist Life Cycle Aids Persistence of Alexandrium ostenfeldii (Di-nophyceae) in Seasonal Coastal Habitats of the Baltic Sea. Journal of Phycology 55(6): 1226–1238. https://doi.org/10.1111/jpy.12919
Ji Y, Ashton L, Pedley SM, Edwards DP, Tang Y, Nakamura A, Kitching R, Dolman PM, Woodcock P, Edwards FA, Larsen TH, Hsu WW, Benedick S, Hamer KC, Wilcove, DS, Bruce C, Wang X, Levi T, Lott M, Emerson BC, Yu DW (2013) Reliable, verifiable and effi-cient monitoring of biodiversity via metabarcoding. Ecology Letters 16(10): 1245–1257. https://doi.org/10.1111/ele.12162
Johansson M, Gorokhova E, Larsson U (2004) Annual variability in cil-iate community structure, potential prey and predators in the open northern Baltic Sea proper. Journal of Plankton Research 26(1): 67–80. https://doi.org/10.1093/plankt/fbg115
Johansson ON, Pinder MIM, Ohlsson F, Egardt J, Töpel M, Clarke AK, (2019) Friends With Benefits: Exploring the Phycosphere of the Marine Diatom Skeletonema marinoi. Frontiers in Microbiology 10: 1828. https://doi.org/10.3389/fmicb.2019.01828
Johnsen TM, Eikrem W, Olseng CD, Tollefsen KE, Bjerknes V (2010) Prymnesium parvum: The Norwegian experience. Journal of the American Water Resources Association 46(1): 6–13. https://doi.org/10.1111/j.1752-1688.2009.00386.x
Johnson MD, Beaudoin DJ, Laza-Martinez A, Dyhrman ST, Fensin E, Lin S, Merculief A, Nagai S, Pompeu M, Setälä O, Stoecker DK (2016) The genetic diversity of Mesodinium and associated crypto-phytes. Frontiers in Microbiology 7: 2017. https://doi.org/10.3389/fmicb.2016.02017
Kanoshina I, Lips U, Leppänen JM (2003) The influence of weather conditions (temperature and wind) on cyanobacterial bloom devel-opment in the Gulf of Finland (Baltic Sea). Harmful Algae 2(1): 29–41. https://doi.org/10.1016/S1568-9883(02)00085-9
Kiørboe T (1997) Population regulation and role of mesozooplankton in shaping marine pelagic food webs. Hydrobiologia 363: 13–27. https://doi.org/10.1023/A:1003173721751
Kremp A, Lindholm T, Dreßler N, Erler K, Gerdts G, Eirtovaara S, Leskinen E (2009) Bloom forming Alexandrium ostenfeldii (Di-nophyceae) in shallow waters of the Åland Archipelago, Northern Baltic Sea. Harmful Algae 8(2): 318–328. https://doi.org/10.1016/j.hal.2008.07.004
Laamanen M, Kuosa, H (2005) Annual variability of biomass and heterocysts of the N2-fixing cyanobacterium Aphanizomenon flos-aquae in the Baltic Sea with reference to Anabaena spp. and Nodu-laria spumigena. Boreal Environment Research 10(1): 19–30.
Laas P, Elina Š, Lips I, Lips U, Simm J, Kisand V (2016) Near-Bot-tom Hypoxia Impacts Dynamics of Bacterioplankton Assemblage throughout Water Column of the Gulf of Finland (Baltic Sea). PLoS ONE 11(5): e0156147. https://doi.org/10.1371/journal.pone.0156147
Laas P, Simm J, Lips I, Lips U, Kisand V, Metsis M (2015) Redox-special-ized bacterioplankton metacommunity in a temperate estuary. PLoS ONE 10(4): e0122304. https://doi.org/10.1371/journal.pone.0122304
Laas P, Simm J, Lips I, Metsis M (2014) Spatial variability of winter bacterioplankton community composition in the Gulf of Finland (the Baltic Sea). Journal of Marine Systems 129: 127–134. https://doi.org/10.1016/j.jmarsys.2013.07.016
Lallias D, Hiddink JG, Fonseca VG, Gaspar JM, Sung W, Neill SP, Barnes N, Ferrero T, Hall, N, Lambshead PJD, Packer M, Thom-as WK, Creer S (2015) Environmental metabarcoding reveals het-erogeneous drivers of microbial eukaryote diversity in contrasting estuarine ecosystems. ISME Journal 9(5): 1208–1221. https://doi.org/10.1038/ismej.2014.213
Lamb PD, Hunter E, Pinnegar JK, Creer S, Davies RG, Taylor MI (2019) How quantitative is metabarcoding: A meta-analytical ap-proach. Molecular Ecology 28(2): 420–430. https://doi.org/10.1111/mec.14920
Larsen A (1999) Prymnesium parvum and P. patelliferum (Haptophyta) – One species. Phycologia 38(6): 541–543. https://doi.org/10.2216/i0031-8884-38-6-541.1
Larsen A, Bryant S (1998) Growth rate and toxicity of Prymnesium parvum and Prymnesium patelliferum (Haptophyta) in response to changes in salinity, light and temperature. Sarsia 83(5): 409–418. https://doi.org/10.1080/00364827.1998.10413700
Le Tortorec AH, Hakanen P, Kremp A, Olsson J, Suikkanen S, Simis SGH (2014) Stimulated bioluminescence as an early indicator of bloom development of the toxic dinoflagellate Alexandrium osten-feldii. Journal of Plankton Research 36(2): 412–423. https://doi.org/10.1093/plankt/fbt116
Lee H, Mi H, Min J, Park C, Jin H, Lee K, Young K (2020) Quantifica-tion of the paralytic shellfish poisoning dinoflagellate Alexandrium species using a digital PCR. Harmful Algae 92: 101726. https://doi.org/10.1016/j.hal.2019.101726
Lelong A, Hegeret H, Soudant P, Bates SS (2012) Pseudo-nitzschia (Bacillariophyceae) species, domoic acid and amnesic shellfish poi-soning: revisiting previous paradigms. Phycologia 51(2): 168–216. https://doi.org/10.2216/11-37
Li A, Stoecker DK, Adolf JE (1999) Feeding, pigmentation, photosyn-thesis and growth of the mixotrophic dinoflagellate Gyrodinium gal-atheanum. Aquatic Microbial Ecology 19(2): 163–176. https://doi.org/10.3354/ame019163
Lian C, Miwa M, Hogetsu T (2001) Outcrossing and paternity analy-sis of Pinus densiflora (Japanese red pine) by microsatellite poly-morphism. Heredity 87(1): 88–98. https://doi.org/10.1046/j.1365-2540.2001.00913.x
Lim HC, Tan SN, Teng ST, Lundholm N, Orive E, David H, Quija-no-Scheggia S, Leong SCY, Wolf M, Bates SS, Lim PT, Leaw CP (2018) Phylogeny and species delineation in the marine diatom Pseudo-nitzschia (Bacillariophyta) using cox1, LSU, and ITS2 rRNA genes: A perspective in character evolution. Journal of Phy-cology 54(2): 234–248. https://doi.org/10.1111/jpy.12620
Lindeque PK, Parry HE, Harmer RA, Somerfield PJ, Atkinson A (2013) Next generation sequencing reveals the hidden diversity of
https://mbmg.pensoft.net
Sildever et al.: Multiple marker eDNA study targeting the Baltic Sea plankton194
zooplankton assemblages. PLoS ONE 8(11): e81327. https://doi.org/10.1371/journal.pone.0081327
Lindh MV, Sjöstedt J, Andersson AF, Baltar F, Hugerth LW, Lundin D, Muthusamy S, Legrand C, Pinhassi J (2015) Disentangling season-al bacterioplankton population dynamics by high-frequency sam-pling. Environmental Microbiology 17(7): 2459–2476. https://doi.org/10.1111/1462-2920.12720
Lindholm T, Öhman P, Kurki-Helasmo K, Kincaid B, Meriluoto J (1999) Toxic algae and fish mortality in a brackish-water lake in Aland, SW Finland. Hydrobiologia 397: 109–120. https://doi.org/10.1023/A:1003667728458
Lindholm T, Virtanen T (1992) A bloom of Prymnesium parvum Carter in a small coastal inlet in Dragsfjärd, southwestern Finland. Envi-ronmental Toxicology and Water Quality 7(2): 165–170. https://doi.org/https://doi.org/10.1002/tox.2530070207
Lips I, Lips U (2010) Phytoplankton dynamics affected by the coastal upwelling events in the Gulf of Finland in July-August 2006. Journal of Plankton Research, 32(9): 1269–1282. https://doi.org/10.1093/plankt/fbq049
Lips I, Lips U (2017) The Importance of Mesodinium rubrum at Post-Spring Bloom Nutrient and Phytoplankton Dynamics in the Vertical-ly Stratified Baltic Sea. Frontiers in Marine Science 4: 407. https://doi.org/10.3389/fmars.2017.00407
Lips I, Rünk, N, Kikas V, Meerits A, Lips U (2014) High-resolution dy-namics of the spring bloom in the Gulf of Finland of the Baltic Sea. Journal of Marine Systems 129: 135–149. https://doi.org/10.1016/j.jmarsys.2013.06.002
Lips U, Laanemets J, Lips I, Liblik T, Suhhova I, Suursaar Ü (2017) Wind-driven residual circulation and related oxygen and nutrient dynamics in the Gulf of Finland (Baltic Sea) in winter. Estuarine Coastal and Shelf Science 195: 4−15. 10.1016/j.ecss.2016.10.006.
Lipsewers T, Spilling K (2018) Microzooplankton, the missing link in Finnish plankton monitoring programs. Boreal Environment Re-search 23:127-137. https://doi.org/10.25607/OBP-402
Machida RJ, Hashiguchi Y, Nishida M, Nishida S (2009) Zooplankton diversity analysis through single-gene sequencing of a communi-ty sample. BMC Genomics 10:438. https://doi.org/10.1186/1471-2164-10-438
Majaneva M, Blomster J, Müller S, Autio R, Majaneva S, Hyytiäinen K, Nagai S, Rintala JM (2017) Sea-ice eukaryotes of the Gulf of Fin-land, Baltic Sea, and evidence for herbivory on weakly shade-adapt-ed ice algae. European Journal of Protistology 57: 1–15. https://doi.org/10.1016/j.ejop.2016.10.005
Majaneva M, Rintala JM, Piisilä M, Fewer DP, Blomster J (2012) Compar-ison of wintertime eukaryotic community from sea ice and open water in the Baltic Sea, based on sequencing of the 18S rRNA gene. Polar Biology 35(6): 875–889. https://doi.org/10.1007/s00300-011-1132-9
Massana R, Gobet A, Audic S, Bass D, Bittner L, Boutte C, Chambou-vet A, Christen R, Claverie, JM, Decelle J, Dolan JR, Dunthorn M, Edvardsen B, Forn I, Forster D, Guillou L, Jaillon O, Kooistra WHCF, Logares R, Mahé F, Ogata H, Pawlowski J, Pernice MC, Probert I, Romac S, Richards T, Santini S, Shalchian-Tabrizi K, Sia-no R, Simon N, Stoeck T., Vaulot D, Zingone A, de Vargas C (2015) Marine protist diversity in European coastal waters and sediments as revealed by high-throughput sequencing. Environmental Microbi-ology 17(10): 4035–4049. https://doi.org/10.1111/1462-2920.12955
Maximov A (2015) The long-term dynamics and current distribution of macrozoobenthos communities in the Eastern Gulf of Finland, Bal-
tic Sea. Russian Journal of Marine Biology, 41(4): 300-310. https://doi.org/10.1134/S1063074015040094
Medlin LK, Orozco J (2017) Molecular Techniques for the Detection of Organisms in Aquatic Environments, with Emphasis on Harmful Algal Bloom Species. Sensors, 17: 1184. https://doi.org/10.3390/s17051184
Meredith C, Hoffman J, Trebitz A, Pilgrim E, Okum S, Martinson J, Cameron ES (2021) Evaluating the performance of DNA metabar-coding for assessment of zooplankton communities in Western Lake Superior using multiple markers. Metabarcoding and Metagenomics 5: e64735. https://doi.org/10.3897/mbmg.5.64735
Moestrup Ø, Akselmann R, Fraga S, Hoppenrath M, Iwataki M, Komárek J, Larsen J, Lundholm N, Zingone A (2021) IOC-UNES-CO Taxonomic Reference List of Harmful Micro Algae. http://www.marinespecies.org/hab/index.php [accessed 01.01.2021]
Mohamad NA, Jusoh NA, Htike ZZ (2014) Bacteria identification from microscopic morphology using naive Bayes. International Journal of Computer Science, Engineering and Information Technology 4(2): 1–9. https://doi.org/10.5121/ijcseit.2014.4201
Moreno-Pino M, Krock B, De la Iglesia R, Echenique-Subiabre I, Pizarro G, Vásquez M, Trefault N (2018) Next Generation Se-quencing and mass spectrometry reveal high taxonomic diversity and complex phytoplankton-phycotoxins patterns in Southeastern Pacific fjords. Toxicon 151: 5–14. https://doi.org/10.1016/j.toxi-con.2018.06.078
Mäki A, Salmi P, Kremp A, Tiirola M (2017) Sample Preservation, DNA or RNA Extraction and Data Analysis for High-Throughput Phytoplankton Community Sequencing. Frontiers in Microbiology, 8:1848. https://doi.org/10.3389/fmicb.2017.01848
Mäkinen K, Elfving M, Hänninen J, Laaksonen L, Rajasilta M, Vuo-rinen I, Suomela JP (2017) Fatty acid composition and lipid con-tent in the copepod Limnocalanus macrurus during summer in the southern Bothnian Sea. Helgoland Marine Research 71:11. https://doi.org/10.1186/s10152-017-0491-1
Nagai S (2018) Marine eukaryote and HAB monitoring in Japan with next generation technology. Harmful Algae News 60: 1–3. http://www.e-pages.dk/ku/1380/ [accessed: 01.01.2021]
Nagai S, Sildever S, Nishi N, Tazawa S, Kasai H, Shiomoto A, Katakura S (2020a) Progress of eukaryote metabarcoding in Okhotsk Sea. In: Takahashi S (Ed.) Proceedings of the 35th International Symposium on Okhotsk Sea and Polar Oceans, Mombetsu (Japan) 17-19 Febru-ary 2020, I-4.
Nagai S, Chen H, Kawakami Y, Yamamoto K, Sildever S, Kanno N, Oi-kawa H, Yasuike M, Nakamura Y, Hongo Y, Fujiwara A, Kobayashi T, Gojobori T (2019) Monitoring of the toxic dinoflagellate Alex-andrium catenella in Osaka Bay, Japan using a massively parallel sequencing (MPS)-based technique. Harmful Algae, 89: 101660. https://doi.org/10.1016/j.hal.2019.101660
Nagai S, Miyamoto S, Ino K, Tajimi S, Nishi H, Tomono J (2016a) Easy detection of multiple Alexandrium species using DNA chromatog-raphy chip. Harmful Algae 51: 97–106. https://doi.org/10.1016/J.HAL.2015.10.014
Nagai S, Hida K, Urusizaki S, Takano Y, Hongo Y, Kameda T, Abe K (2016b) Massively parallel sequencing-based survey of eukaryotic community structures in Hiroshima Bay and Ishigaki Island. Gene 576(2): 681–689. https://doi.org/10.1016/j.gene.2015.10.026
Nagai S, Hida K, Urushizaki S, Onitsuka G, Yasuike M, Nakamura Y, Fujiwara A, Tajimi S, Kimoto K, Kobayashi T, Gojobori T, Ototake
Metabarcoding and Metagenomics 5: e72371
https://mbmg.pensoft.net
195
M (2016c) Influences of diurnal sampling bias on fixed-point moni-toring of plankton biodiversity determined using a massively paral-lel sequencing-based technique. Gene 576(2): 667–675. https://doi.org/10.1016/j.gene.2015.10.025
Nagai S, Sildever S, Suzuki T, Nishitani G, Basti L, Kamiyama T (2020b) Growth and Feeding Behaviour of Mixotrophic Dinophysis Species in Laboratory Cultures. In: Durvasula SRV (Ed.) Dinofla-gellates: Classification, Evolution, Physiology and Ecological Sig-nificance. Nova Science Publishers, New York 129−168.
Nagai S, Urusizaki S, Hongo Y, Chen H, Dzhembekova N (2017) An attempt to semi-quantify potentially toxic diatoms of the genus Pseudo-nitzschia in Tokyo Bay, Japan by using massively parallel sequencing technology. Plankton Benthos Research 12(4): 248–258. https://doi.org/10.3800/pbr.12.248
NCBI (2021) Nucleotide database. https://www.ncbi.nlm.nih.gov/nu-cleotide/ [accessed: 15.01.2021]
Nishikawa T, Hori Y, Nagai S, Miyahara K, Nakamura Y, Harada K, Tanda M, Manabe T, Tada K (2010) Nutrient and Phytoplankton Dynamics in Harima-Nada, Eastern Seto Inland Sea, Japan During a 35-Year Period from 1973 to 2007. Estuaries and Coasts 33(2): 417–427. https://doi.org/10.1007/s12237-009-9198-0
Ojaveer E, Lumberg A, Ojaveer H (1998) Highlights of zooplankton dynamics in Estonian waters (Baltic Sea). ICES Journal of Marine Science 55(4): 748–755. https://doi.org/10.1006/jmsc.1998.0393
Oksanen J, Blanchet FG, Friendly M, Kindt R, Legendre P, McGlinn D, Minchin PR, O’Hara RB, Simpson GL, Solymos P, Stevens MHH, Szoecs E, Wagner H (2020) vegan: Community Ecology Package. R package version 2.5-2. https://cran.r-project.org/web/packages/vegan/index.html [accessed 01.01.2021]
Olenina I, Hajdu S, Edler L, Andersson A, Wasmund N, Busch S, Gö-bel J, Gromisz S, Huseby S, Huttunen M, Jaanus A, Kokkonen P, Ledaine I, Niemkiewicz E (2006) Biovolumes and Size-Classes of Phytoplankton in the Baltic Sea. Helsinki Commission Baltic Ma-rine Environment Protection Commission. Baltic Sea Environment Proceedings 106(0357–2994): 144. http://www.helcom.fi/Lists/Pub-lications/BSEP106.pdf
Park MG, Kim S, Hyung SK, Myung G, Yi GK, Yih W (2006) First successful culture of the marine dinoflagellate Dinophysis acumina-ta. Aquatic Microbial Ecology 45, 101-106. https://doi.org/10.3354/ame045101
Pednekar SM, Bates SS, Kerkar V, Matondkar SGP (2018) Environ-mental Factors Affecting the Distribution of Pseudo-nitzschia in Two Monsoonal Estuaries of Western India and Effects of Salinity on Growth and Domoic Acid Production by P. pungens. Estuaries and Coasts 41(5): 1448–1462. https://doi.org/10.1007/s12237-018-0366-y
Percopo I, Siano R, Rossi R, Soprano V, Sarno D, Zingone A (2013) A new potentially toxic Azadinium species (Dinophyceae) from the Mediterranean Sea, A. dexteroporum sp. nov. Journal of Phycology 49(5): 950–966. https://doi.org/10.1111/jpy.12104
Piwosz K, Całkiewicz J, Gołębiewski M, Creer S (2018) Diversity and community composition of pico- and nanoplanktonic protists in the Vistula River estuary (Gulf of Gdańsk, Baltic Sea). Estuarine, Coastal and Shelf Science 207: 242–249. https://doi.org/10.1016/j.ecss.2018.04.013
R Core Team (2021) R: A language and environment for statistical com-puting. R Foundation for Statistical Computing. https://www.r-proj-ect.org/ [accessed: 01.01.2021]
Rajaniemi P, Hrouzek P, Kaštovska K, Willame R, Rantala A, Hoffmann L, Komarek J, Sivonen K (2005) Phylogenetic and morphological evaluation of the genera Anabaena, Aphanizomenon, Trichormus and Nostoc (Nostocales, Cyanobacteria). International Journal of Systematic and Evolutionary Microbiology 55: 11–26. https://doi.org/10.1099/ijs.0.63276-0
Riemann L, Steward GF, Azam F (2000). Dynamics of bacterial com-munity composition and activity during a mesocosm diatom bloom. Applied and Environmental Microbiology, 66(2): 578–587. https://doi.org/10.1128/AEM.66.5.2282-2282.2000
Roelke DL, Barkoh A, Brooks BW, Grover JP, Hambright KD, Laclaire JW, Moeller PDR, Patino R (2016) A chronicle of a killer alga in the west: Ecology, assessment, and management of Prymnesium par-vum blooms. Hydrobiologia 764(1): 29–50. https://doi.org/10.1007/s10750-015-2273-6
Rojas-Jimenez K, Rieck A, Wurzbacher C, Jürgens K, Labrenz M, Grossart HP (2019) A salinity threshold separating fungal communi-ties in the Baltic Sea. Frontiers in Microbiology, 10: 680. https://doi.org/10.3389/fmicb.2019.00680
Ruvindy R, Bolch CJ, MacKenzie L, Smith KF, Murray SA (2018) qPCR Assays for the Detection and Quantification of Multiple Par-alytic Shellfish Toxin-Producing Species of Alexandrium. Frontiers in Microbiology 9: 3153 https://doi.org/10.3389/fmicb.2018.03153
Salonen IS, Chronopoulou PM, Leskinen E, Koho KA (2018) Metabar-coding successfully tracks temporal changes in eukaryotic commu-nities in coastal sediments. FEMS Microbiology Ecology 95(1): 1–11. https://doi.org/10.1093/femsec/fiy226
Sawaya NA, Djurhuus A, Closek CJ, Hepner M, Olesin E, Visser L, Kelble C, Hubbard K, Breitbart M (2019) Assessing eukaryotic bio-diversity in the Florida Keys National Marine Sanctuary through environmental DNA metabarcoding. Ecology and Evolution 9(3): 1029–1040. https://doi.org/10.1002/ece3.4742
Schenk J, Geisen S, Kleinbölting N, Traunspurger W (2019) Metabar-coding data allow for reliable biomass estimates in the most abun-dant animals on earth. Metabarcoding and Metagenomics 3: 117–126. https://doi.org/10.3897/mbmg.3.46704
Schlaeppi K, Bender SF, Mascher F, Russo G, Patrignani A, Camenzind T, Hempel S, Rillig MC, van der Heijden MGA (2016) High-reso-lution community profiling of arbuscular mycorrhizal fungi. New Phytologist 212(3): 780–791. https://doi.org/10.1111/nph.14070
Schloss P D, Gevers D, Westcott S L (2011) Reducing the effects of PCR amplification and sequencing Artifacts on 16s rRNA-based studies. PLoS ONE 6(12): e27310. doi:10.1371/journal.pone.0027310
Schmidt TM, DeLong EF, Pace NR (1991) Analysis of a marine pi-coplankton community by 16S rRNA gene cloning and sequenc-ing. Journal of Bacteriology 173(14) 43: 71–4378. https://doi.org/10.1128/jb.173.14.4371-4378.1991
Schneider J, Valentini A, Dejean T, Montarsi F, Taberlet P, Glaizot O, Fumagalli L (2016) Detection of invasive mosquito vectors using environmental DNA (eDNA) from water samples. PLoS ONE 11(9): e0162493. https://doi.org/10.1371/journal.pone.0162493
Seyedsayamdost MR, Case RJ, Kolter R, Clardy J (2011) The Jekyll-and-Hyde chemistry of Phaeobacter gallaeciensis. Nature Chemis-try 3(4): 331–335. https://doi.org/10.1038/nchem.1002
Seymour JR, Amin SA, Raina JB, Stocker R (2017) Zooming in on the phycosphere: The ecological interface for phytoplankton-bac-teria relationships. Nature Microbiology 2: 17065. https://doi.org/10.1038/nmicrobiol.2017.65

https://mbmg.pensoft.net
Sildever et al.: Multiple marker eDNA study targeting the Baltic Sea plankton196
Sieracki ME, Johnson PW, Sieburth JM (1985) Detection, Enumeration, and Sizing of Planktonic Bacteria by Image-Analyzed Epifluores-cence Microscopy. Applied and Environmental Microbiology 49(4): 799–810. https://doi.org/10.1128/aem.49.4.799-810.1985
Sildever S, Kawakami Y, Kanno N, Kasai H, Shiomoto A, Katakura S, Nagai S (2019) Toxic HAB species from the Sea of Okhotsk detected by a metagenetic approach, seasonality and environmental drivers. Harmful Algae 87: 101631. https://doi.org/10.1016/j.hal.2019.101631
Sinclair L, Osman OA, Bertilsson S, Eiler A (2015) Microbial com-munity composition and diversity via 16S rRNA gene amplicons: Evaluating the Illumina platform. PLoS ONE 10(2): 1–18. https://doi.org/10.1371/journal.pone.0116955
Singer E, Bushnell B, Coleman-Derr D, Bowman B, Bowers RM, Levy A, Gies EA, Cheng JF, Copeland A, Klenk HP, Hallam SJ, Hugen-holtz P, Tringe SG, Woyke T (2016). High-resolution phylogenetic microbial community profiling. ISME Journal, 10(8): 2020–2032. https://doi.org/10.1038/ismej.2015.249
Sivonen K, Kononen K, Carmichael WW, Dahlem AM, Rinehart KL, Kiviranta J, Niemela SI (1989) Occurrence of the hepatotoxic cy-anobacterium Nodularia spumigena in the Baltic Sea and structure of the toxin. Applied and Environmental Microbiology 55(8): 1990–1995. https://doi.org/10.1128/aem.55.8.1990-1995.1989
Sjöqvist C, Lindholm T (2011) Natural co-occurrence of Dinophysis acuminata (Dinoflagellata) and Mesodinium rubrum (Ciliophora) in thin layers in a coastal inlet. Journal of Eukaryotic Microbiology 58(4): 365-372. https://doi.org/10.1111/j.1550-7408.2011.00559.x
Smayda TJ (1998) Patterns of variability characterizing marine phy-toplankton, with examples from Narragansett Bay. ICES Jour-nal of Marine Science 55(4): 562–573. https://doi.org/10.1006/jmsc.1998.0385
Sogin ML, Morrison HG, Huber JA, Mark Welch D, Huse SM, Neal PR, Arrieta JM, Herndl, GJ (2006) Microbial diversity in the deep sea and the underexplored “rare biosphere”. PNAS 103(32): 12115–12120. https://doi.org/10.1073/pnas.0605127103
Sousa AM, Machado I, Nicolau A, Pereira MO (2013) Improvements on colony morphology identification towards bacterial profiling. Journal of Microbiological Methods 95: 327–335. https://doi.org/10.1016/j.mimet.2013.09.020
Spilling K, Lindström M (2014) Phytoplankton life cycle transforma-tions lead to species-specific effects on sediment processes in the Baltic Sea. Continental Shelf Research 28(17): 2488–2495. https://doi.org/10.1016/j.csr.2008.07.004
Spilling K, Kremp A, Klais R, Olli K, Tamminen T (2014) Spring bloom community change modifies carbon pathways and C:N:P: Chl a stoi-chiometry of coastal material fluxes. Biogeosciences 11(24): 7275–7289. https://doi.org/10.5194/bg-11-7275-2014
Spilling K, Olli K, Lehtoranta J, Kremp A, Tedesco L, Tamelander T, Klais R, Tamminen T (2018) Shifting Diatom—Dinoflagellate Dominance During Spring Bloom in the Baltic Sea and its Potential Effects on Biogeochemical Cycling. Frontiers in Marine Science 5: 327. https://doi.org/10.3389/fmars.2018.00327
Stat M, Huggett MJ, Bernasconi R, Dibattista JD, Berry TE, Newman SJ, Harvey ES, Bunce M (2017) Ecosystem biomonitoring with eDNA: Metabarcoding across the tree of life in a tropical marine environment. Scientific Reports 7(1): 1–11. https://doi.org/10.1038/s41598-017-12501-5
Stoecker DK, Evans GT (1985) Effects of protozoan herbivory and carnivory in a microplankton food web. Marine Ecology Progress Series 25: 159-167. https://doi.org/ 10.3354/meps025159
Suikkanen S, Laamanen M, Huttunen M (2007) Long-term changes in summer phytoplankton communities of the open northern Baltic Sea. Estuarine, Coastal and Shelf Science 71(3–4): 580–592. https://doi.org/10.1016/j.ecss.2006.09.004
Suikkanen S, Pulina S, Engström-Öst J, Lehtiniemi M, Lehtinen S, Bru-temark A 2013. Climate Change and Eutrophication Induced Shifts in Northern Summer Plankton Communities. PLoS ONE 8(6): 1–10. https://doi.org/10.1371/journal.pone.0066475
Sunagawa S, Coelho LP, Chaffron S, Kultima JR, Labadie K, Salazar G., Djahanschiri B, Zeller G, Mende DR, Alberti A, Cornejo-Castillo FM, Costea PI, Cruaud C, Ovidio F, Engelen S, Ferrera I, Gasol JM, Guidi L, Hildebrand F, Kokoszka F, Lepoivre C (2015). Structure and function of the global ocean microbiome. Science 348(6237): 1261359. https://doi.org/10.1126/science.1261359
Šulčius S, Pilkaityte R, Mazur-Marzec H, Kasperovičiene J, Ezhova E, Błaszczyk A, Paškauskas R (2015) Increased risk of exposure to microcystins in the scum of the filamentous cyanobacterium Apha-nizomenon flos-aquae accumulated on the western shoreline of the Curonian Lagoon. Marine Pollution Bulletin. 99: 264–270. https://doi.org/10.1016/j.marpolbul.2015.07.057
Taberlet P, Coissac E, Hajibabaei M, Rieseberg LH (2012) Environ-mental DNA. Molecular Ecology 21(8): 1789–1793. https://doi.org/10.1111/j.1365-294X.2012.05542.x
Tedersoo L, Tooming-Klunderud A, Anslan S (2018) Methods Pac-Bio metabarcoding of Fungi and other eukaryotes: errors, biases and perspectives. New Phytologist 217: 1370–1385. https://doi.org/10.1111/nph.14776
Tillmann U, Gottschling M, Nézan E, Krock B (2015) First records of Amphidoma languida and Azadinium dexteroporum (Amphi-domataceae, Dinophyceae) from the Irminger Sea off Iceland. Marine Biodiversity Records 8: 1–11. https://doi.org/10.1017/S1755267215001128
Tillmann U, Wietkamp S, Krock B, Tillmann A, Voss D, Gu H (2020) Amphidomataceae (Dinophyceae) in the western Greenland area, including description of Azadinium perforatum sp. nov. Phycologia 59(1): 63–88. https://doi.org/10.1080/00318884.2019.1670013
Toming K, Jaanus A (2007) Selecting potential summer phytoplankton eu-trophication indicator species for the northern Baltic Sea. Proceedings of Estonian Academy of Sciences. Biology Ecology 56(4): 297–311.
Turner JT (2015) Zooplankton fecal pellets, marine snow, phytodetritus and the ocean’s biological pump. Progress in Oceanography 130: 205–248. https://doi.org/10.1016/j.pocean.2014.08.005
Urakawa H, Kita-Tsukamoto K, Ohwada K (1999) Microbial diversity of marine sediments in Sagami Bay and Tokyo Bay, Japan, as deter-mined by 16S rRNA gene analysis. Microbiology 145: 3305–3315. https://doi.org/10.1111/j.1574-6941.2006.00126.x
Valentini A, Taberlet P, Miaud C, Civade R, Herder J, Thomsen PF, Bellemain E, Besnard A, Coissac E, Boyer F, Gaboriaud C, Jean P, Poulet N, Roset N, Copp GH, Geniez P, Pont D, Argillier C, Baudoin JM, Peroux T, Crivelli AJ, Olivier A, Acqueberge M, Le Brun M, Møller, PR, Willerslev E, Dejean T (2016) Next-generation moni-toring of aquatic biodiversity using environmental DNA metabar-coding. Molecular Ecology 25(4): 929–942. https://doi.org/10.1111/mec.13428
Wang LP, Lei K (2016) Rapid Identification and Quantification of Aureococcus anophagefferens by qPCR Method (Taqman) in the Qinhuangdao Coastal Area: A Region for Recurrent Brown Tide Breakout in China. Indian Journal of Microbiology 56(4): 491–497. https://doi.org/10.1007/s12088-016-0619-z

Metabarcoding and Metagenomics 5: e72371
https://mbmg.pensoft.net
197
Wang X, Li Z, Su J, Tian Y, Ning X, Hong H, Zheng T (2010) Lysis of a red-tide causing alga, Alexandrium tamarense, caused by bacteria from its phycosphere. Biological Control, 52, 123-130. https://doi.org/10.1016/j.biocontrol.2009.10.004
Wang Y, Sen B, He Y, Xie, N, Wang G (2018) Spatiotemporal distribu-tion and assemblages of planktonic fungi in the coastal waters of the Bohai Sea. Frontiers in Microbiology 9:584. https://doi.org/10.3389/fmicb.2018.00584
Wasmund N, Göbel J, Bodungen BV (2008) 100-years-changes in the phytoplankton community of Kiel Bight (Baltic Sea). Journal of Marine Systems 73(3–4): 300–322. https://doi.org/10.1016/j.jmarsys.2006.09.009
Weber AA-T, Pawlowski J (2013) Can Abundance of Protists Be In-ferred from Sequence Data: A Case Study of Foraminifera. PLOS ONE 8(2): e56739. https://doi.org/10.1371/journal.pone.0056739
Wong CK, Li, VCY, Chan, A (2008) Diel cycles of reproduction and vertical migration in the marine cladocerans Pseudevadne tergestina and Penilia avirostris. Journal of Plankton Research, 30(1): 65-73. https://doi.org/10.1093/plankt/fbm096
Zaiko A, Samuiloviene A, Ardura A, Garcia-Vazquez E (2015) Me-tabarcoding approach for nonindigenous species surveillance in ma-rine coastal waters. Marine Pollution Bulletin 100(1): 53–59. https://doi.org/10.1016/j.marpolbul.2015.09.030
Zhang GK, Chain FJJ, Abbott CL, Cristescu, ME (2018) Metabarcod-ing using multiplexed markers increases species detection in com-plex zooplankton communities. Evolutionary Applications 11(10): 1901–1914. https://doi.org/10.1111/eva.12694
Zhang H, Litaker W, Vandersea MW, Tester P, Lin S (2008) Geographic distribution of Karlodinium veneficum in the US east coast as de-tected by ITS-ferredoxin real-time PCR assay. Journal of Plankton Research 30(8): 905–922. https://doi.org/10.1093/plankt/fbn047
Zhang Y, Pavlovska M, Stoica E, Prekrasna I, Yang J, Slobodnik J, Zhang X, Dykyi E (2020) Holistic pelagic biodiversity monitoring of the Black Sea via eDNA metabarcoding approach: From bacteria to marine mammals. Environment International 135:105307. https://doi.org/10.1016/j.envint.2019.105307
Zhu F, Massana R, Not F, Marie D, Vaulot D (2005) Mapping of picoeu-karyotes in marine ecosystems with quantitative PCR of the 18S rRNA gene. FEMS Microbiology Ecology 52(1): 79–92. https://doi.org/10.1016/j.femsec.2004.10.006
Supplementary material 1Supplementary figuresAuthor: Sirje Sildever, Peeter Laas, Natalja Kolesova, Inga
Lips, Urmas Lipsb, Satoshi NagaiaData type: imagesExplanation note: Figure S1. Shepard diagrams for all the mark-
ers used for the NMDS analysis. Figure S2. Temperature and salinity in winter-spring (A, B) and summer-autumn (C, D) at various sampling locations. Figure S3. Overview of OTUs detected based on different markers in different higher taxo-nomic levels (18S, 28S_E, 28S_D: supergroups; 16S: phy-la). Group “Others” in 16S consists of phyla containing < 10 OTUs. Figure S4. Number of unique and shared eukaryotic OTUs detected by three eukaryote-targeting markers: 18S, 28S_E, 28S_ D. Figure S5. Venn diagrams of OTUs detected from winter-spring (A) and summer-autumn (AP) stations. Figure S6. Relative sequence abundances of different phyla/group detected by 28S_E in different sampling months. TOP 5 most abundant phyla/groups are shown for each station
and sampling occasion (X-axis). Y-axis displays the relative sequence abundances for each phyla/group. Sequences be-longing to the phyla/group that did not belong to the TOP 5 phyla/group for the particular sampling occasion are dis-played as “Others”. Figure S7. Correlation among OTUs as-sociated with common, dominant, or toxin-producing (bold) phytoplankton species (X-axis) and zooplankton species (microzooplankton species are marked with bold; Y-axis). Asterisks indicate statistically significant (p < 0.05) correla-tions after Benjamini-Hochberg correction. Figure S8. Cor-relation among OTUs associated with common, dominant, or toxin-producing (bold) phytoplankton species (X-axis) and bacteria (Y-axis). Asterisks indicate statistically significant (p < 0.05) correlations after Benjamini-Hochberg correction.
Copyright notice: This dataset is made available under the Open Database License (http://opendatacommons.org/li-censes/odbl/1.0/). The Open Database License (ODbL) is a license agreement intended to allow users to freely share, modify, and use this Dataset while maintaining this same freedom for others, provided that the original source and author(s) are credited.
Link: https://doi.org/10.3897/mbmg.5.72371.suppl1
Supplementary material 2Supplementary tablesAuthor: Sirje Sildever, Peeter Laas, Natalja Kolesova, Inga
Lips, Urmas Lipsb, Satoshi NagaiaData type: tablesExplanation note: Table S1. Coordinates of sampling stations
and sampling dates. Table S2. Results of the taxonom-ic identification in each OTU obtained from amplicon se-quence data using a partial 18S rRNA gene (universal prim-ers), _p indicates pooled samples from the same station and month. Table S3. Results of the taxonomic identification in each OTU obtained from amplicon sequence data using a partial 28S rRNA gene (universal primers, 28S_E), _p indi-cates pooled samples from the same station and month. Ta-ble S4. Results of the taxonomic identification in each OTU obtained from amplicon sequence data using a partial 28S rRNA gene (28S_D marker), _p indicates pooled samples from the same station and month. Table S5. Zooplankton species detected based on environmental DNA. Table S6. Common, dominant, or toxin-producing species detected based on environmental DNA. Baltic Sea phytoplankton checklist provides information on the previous detection of the species based on the different basins. Toxin-producing species are marked in bold. Appearance and the highest rel-ative sequence abundance (RA) are combined based on the data from all the markers that detected the species. Table S7. Results of the taxonomic identification in each OTU obtained from amplicon sequence data using a partial 16S rRNA gene (universal primers), _p indicates pooled samples from the same station and month. Table S8. Overview of the detected OTUs per station. Table S9. Overview of statistical analysis for diversity differences, statistically significant (p < 0.05) values are indicated in bold
Copyright notice: This dataset is made available under the Open Database License (http://opendatacommons.org/li-censes/odbl/1.0/). The Open Database License (ODbL) is a license agreement intended to allow users to freely share, modify, and use this Dataset while maintaining this same freedom for others, provided that the original source and author(s) are credited.
Link: https://doi.org/10.3897/mbmg.5.72371.suppl2
Related Documents