ABSTRACT Three freely meandering rivers in the Ama- zon basin were analyzed for statistical scaling properties and oxbow lake size-frequency dis- tributions. The rivers are the Purus (central Amazon, planform data), Juruá (central Ama- zon, planform and oxbow lake data), and Madre de Dios (Peruvian Amazon, oxbow lake data). Long reaches were found to be power- law scaling over more than two orders of mag- nitude. These river planforms are self-affine fractals. Oxbow lake data suggest that the lakes are sampled from a skewed hyperbolic (Pareto) size-frequency distribution. To examine the long-term behavior of freely meandering rivers, a deterministic continuum model of meandering rivers has been used for extensive simulations of free meandering mo- tion. The simulation outcomes are consistent with a dynamical state of self-organized criti- cality, which has the following characteristic behavior: (1) stationary mean sinuosity of the final state; (2) robustness, in the sense that the same final state is reached from any initial conditions; and (3) formation of a spatiotem- poral fractal structure. Sensitivity tests showed that this behavior is not affected by valley confinement down to a valley width of 50 w (river width), and by chute cutoffs of mature meanders up to 3 w long, but the average sinuosity value reached in the final state is sensitive to valley width less than 100 w, and chutes longer than 1.5 w. Comparison with empirical data confirmed the validity of the simulations as models of river meandering. All tests found data and simulation results to be in close agreement. INTRODUCTION The phenomenology of long-term meandering dynamics is notoriously difficult to study by em- pirical means. Meandering rivers are known to shed oxbow lakes by neck cutoffs, as well as short- circuiting by chute cutoffs during floods (Gagliano and Howard, 1984; Walters and Simons, 1984; Lewis and Lewin, 1983). Old maps and qualitative records over the past eight centuries have been used by various authors to describe meandering dynamics (Gagliano and Howard, 1984; Walters and Simons, 1984; Lewis and Lewin, 1983; Braga and Gervasoni, 1989). Unfortunately, such maps were infrequently updated in the past, and gener- ally it is not possible to reconstruct river evolution either qualitatively or quantitatively from histori- cal sources. Furthermore, the better known rivers (such as the Mississippi) have been subject to var- ious engineering experiments in artificial straight- ening since at least the middle of the nineteenth century, and are therefore no longer representative of natural meandering (Matthes, 1947). Aerial photographs, however, have been avail- able for about 70 years, but there are no records in the literature of air photographs surveying a long river reach at frequent intervals. Satellite images allow just that, but have been available for no more than two decades, and rivers large enough to be visible on satellite images evolve too slowly to reveal their dynamical properties over this time span. We are therefore left with indirect means; ex- tracting dynamical meaning from the properties of rivers as seen in a time instant, or simulating river evolution by means of a model abstracting in some way the physical processes responsible for meandering. This paper is a comparative analysis of planform geometry of natural and simulated rivers, complementing the simulation results of Stølum (1996) and Sun et al. (1996). EMPIRICAL RIVER PLANFORM DATA AND THEIR MEASUREMENT Four rivers were studied that in several re- spects approximate free and unforced meander- ing flow. The Purus and Juruá are tributaries of the Solimões (Amazon State, Brazil), and the Parana Breu is a former reach of the Juruá, by- passed by the main flow in an avulsion event but still actively meandering. Five reaches of these rivers were used to obtain planform statis- tics (Figs. 1–3, Table 1). In addition, one reach of the Juruá (Baker, 1978) and of the Madre de Dios River (Peruvian Amazon, Räsänen et al., 1992) were used to provide oxbow lake statis- tics. The various data were measured on satel- lite and radar images of the rivers. Landsat satellite images were obtained from the Land- sat Pathfinder Humid Tropical Forest Inven- tory Project (http://www.pathfinder.sr.unh. edu/pathfinder/browser/) and synthetic aperture radar (SAR) images from the Global Rainfor- est Mapping Study (http://southport.jpl.nasa. gov/amazon/imagebrowser/), in addition to the published sources. The statistical information extracted is plan- form scaling statistics and oxbow lake size-fre- quency distributions. “Scaling” refers to changes of shape or pattern when observed close up and from a distance. These statistical properties of river planforms are recurrent, characteristic out- comes of the meandering process, and therefore allow detailed quantitative comparison between real and simulated river meandering. The state of convolution of a meandering river planform is usually measured by the dimension- less parameter sinuosity, S S = L/l, (1) where L is the length of the river along its course from a point A to a point B, and l is the shortest length between the same points. L and l are con- veniently measured in units of average width, w. When the river is straight, sinuosity has a mini- mum value of one. In most cases, sinuosity rarely exceeds a value of four. Oxbow lakes have a finite length range, with a maximum value of ~40 w. Sinuosity does not record scaling information because it only contains information at one scale (the choice of unit of measurement). An appropri- ate basis for testing whether the river geometry contains scaling symmetry is the fractal dimen- sion, which is a property of objects with scal- ing geometry (Mandelbrot, 1983; Feder, 1988; Schroeder, 1991; Korvin, 1992; Peigen et al., 1992). Two fractal dimensions may be found in the river geometry: the similarity dimension, and the hierarchy dimension. The first is the same as the fractal dimension normally used in describing fractal geometries, including meandering river 1485 Planform geometry and dynamics of meandering rivers Hans-Henrik Stølum* Department of Earth Sciences, University of Cambridge, Downing Street, Cambridge CB2 3 EQ, United Kingdom GSA Bulletin; November 1998; v. 110; no. 11; p. 1485–1498; 18 figures; 1 table. *E-mail: [email protected].

Welcome message from author
This document is posted to help you gain knowledge. Please leave a comment to let me know what you think about it! Share it to your friends and learn new things together.
Transcript
ABSTRACT
Three freely meandering rivers in the Ama-zon basin were analyzed for statistical scalingproperties and oxbow lake size-frequency dis-tributions. The rivers are the Purus (centralAmazon, planform data), Juruá (central Ama-zon, planform and oxbow lake data), andMadre de Dios (Peruvian Amazon, oxbow lakedata). Long reaches were found to be power-law scaling over more than two orders of mag-nitude. These river planforms are self-affinefractals. Oxbow lake data suggest that thelakes are sampled from a skewed hyperbolic(Pareto) size-frequency distribution.
To examine the long-term behavior of freelymeandering rivers, a deterministic continuummodel of meandering rivers has been used forextensive simulations of free meandering mo-tion. The simulation outcomes are consistentwith a dynamical state of self-organized criti-cality, which has the following characteristicbehavior: (1) stationary mean sinuosity of thefinal state; (2) robustness, in the sense that thesame final state is reached from any initialconditions; and (3) formation of a spatiotem-poral fractal structure.
Sensitivity tests showed that this behavior isnot affected by valley confinement down to avalley width of 50 w (river width), and bychute cutoffs of mature meanders up to 3 wlong, but the average sinuosity value reachedin the final state is sensitive to valley width lessthan 100 w, and chutes longer than 1.5 w.
Comparison with empirical data confirmedthe validity of the simulations as models ofriver meandering. All tests found data andsimulation results to be in close agreement.
INTRODUCTION
The phenomenology of long-term meanderingdynamics is notoriously difficult to study by em-pirical means. Meandering rivers are known toshed oxbow lakes by neck cutoffs, as well as short-circuiting by chute cutoffs during floods (Gagliano
and Howard, 1984; Walters and Simons, 1984;Lewis and Lewin, 1983). Old maps and qualitativerecords over the past eight centuries have beenused by various authors to describe meanderingdynamics (Gagliano and Howard, 1984; Waltersand Simons, 1984; Lewis and Lewin, 1983; Bragaand Gervasoni, 1989). Unfortunately, such mapswere infrequently updated in the past, and gener-ally it is not possible to reconstruct river evolutioneither qualitatively or quantitatively from histori-cal sources. Furthermore, the better known rivers(such as the Mississippi) have been subject to var-ious engineering experiments in artificial straight-ening since at least the middle of the nineteenthcentury, and are therefore no longer representativeof natural meandering (Matthes, 1947).
Aerial photographs, however, have been avail-able for about 70 years, but there are no recordsin the literature of air photographs surveying along river reach at frequent intervals. Satelliteimages allow just that, but have been availablefor no more than two decades, and rivers largeenough to be visible on satellite images evolvetoo slowly to reveal their dynamical propertiesover this time span.
We are therefore left with indirect means; ex-tracting dynamical meaning from the propertiesof rivers as seen in a time instant, or simulatingriver evolution by means of a model abstractingin some way the physical processes responsiblefor meandering. This paper is a comparativeanalysis of planform geometry of natural andsimulated rivers, complementing the simulationresults of Stølum (1996) and Sun et al. (1996).
EMPIRICAL RIVER PLANFORM DATAAND THEIR MEASUREMENT
Four rivers were studied that in several re-spects approximate free and unforced meander-ing flow. The Purus and Juruá are tributaries ofthe Solimões (Amazon State, Brazil), and theParana Breu is a former reach of the Juruá, by-passed by the main flow in an avulsion eventbut still actively meandering. Five reaches ofthese rivers were used to obtain planform statis-tics (Figs. 1–3, Table 1). In addition, one reachof the Juruá (Baker, 1978) and of the Madre de
Dios River (Peruvian Amazon, Räsänen et al.,1992) were used to provide oxbow lake statis-tics. The various data were measured on satel-lite and radar images of the rivers. Landsatsatellite images were obtained from the Land-sat Pathfinder Humid Tropical Forest Inven-tory Project (http://www.pathfinder.sr.unh.edu/pathfinder/browser/) and synthetic apertureradar (SAR) images from the Global Rainfor-est Mapping Study (http://southport.jpl.nasa.gov/amazon/imagebrowser/), in addition to thepublished sources.
The statistical information extracted is plan-form scaling statistics and oxbow lake size-fre-quency distributions. “Scaling” refers to changesof shape or pattern when observed close up andfrom a distance. These statistical properties ofriver planforms are recurrent, characteristic out-comes of the meandering process, and thereforeallow detailed quantitative comparison betweenreal and simulated river meandering.
The state of convolution of a meandering riverplanform is usually measured by the dimension-less parameter sinuosity, S
S = L/l, (1)
where L is the length of the river along its coursefrom a point A to a point B, and l is the shortestlength between the same points. L and l are con-veniently measured in units of average width, w.When the river is straight, sinuosity has a mini-mum value of one. In most cases, sinuosity rarelyexceeds a value of four. Oxbow lakes have a finitelength range, with a maximum value of ~40 w.
Sinuosity does not record scaling informationbecause it only contains information at one scale(the choice of unit of measurement). An appropri-ate basis for testing whether the river geometrycontains scaling symmetry is the fractal dimen-sion, which is a property of objects with scal-ing geometry (Mandelbrot, 1983; Feder, 1988;Schroeder, 1991; Korvin, 1992; Peigen et al.,1992). Two fractal dimensions may be found inthe river geometry: the similarity dimension, andthe hierarchy dimension. The first is the same asthe fractal dimension normally used in describingfractal geometries, including meandering river
1485
Planform geometry and dynamics of meandering rivers
Hans-Henrik Stølum* Department of Earth Sciences, University of Cambridge, Downing Street, Cambridge CB2 3 EQ, United Kingdom
GSA Bulletin; November 1998; v. 110; no. 11; p. 1485–1498; 18 figures; 1 table.
*E-mail: [email protected].

reaches (Snow, 1989; Montgomery, 1996). Thesimilarity dimension records the same informa-tion as sinuosity, but shows how this informationchanges with change in scale, whereas sinuosityrecords the information only at a single scale de-fined by the choice of unit of measurement (e.g.,average river width). The hierarchy dimensioncharacterizes how meanders and higher-order un-dulations in the trace are distributed into a hierar-chy of sizes; this second fractal dimension is fullydefined in the following.
As mentioned, the river will shed off oxbowlakes through neck cutoff of mature meanders.Since these cut-off segments may persist for along time before they are obliterated by the activeriver, satellite images tend to reveal large num-bers of oxbow lakes next to high-sinuosity rivers.Oxbow lakes are caused by meandering motion,and the size (length)-frequency distribution ofoxbow lakes therefore contains information rele-vant to meandering dynamics.
Another cutoff process may also occur byformation of short-circuiting channels, or chutes.For the Purus and Juruá Rivers, discharge data in-dicate near steady state conditions (Fig. 4), andonly minor chute cutoffs (<3 w long) are occasion-ally seen on images obtained during bankfull dis-charge. Short chutes of this kind act to short-circuitneck cutoffs of mature meanders, whereas chutes>~10 w long short-circuit reaches of several me-anders and fundamentally change the meanderingdynamics. Whereas short chutes may easily de-velop during brief spells of overbank flooding as-sociated with steady, periodic discharge fluctua-tions (Hooke and Redmond, 1992; Hooke, 1995),long chutes spanning several meanders requiremore unpredictable discharge fluctuations (Levyor Cauchy distribution instead of the near-uniformdistribution suggested by Fig. 4). Consistentlyhigh sinuosities (>~2.5; Fig. 2, B–D) confirm along-term absence of long chute cutoffs.
SIMULATED VS. REAL RIVER PLANFORM DATA
A simulated reach was chosen at random forcomparison (Fig. 5B). The reach was obtainedusing assumptions of no lateral valley confine-ment and nearly steady discharge (chutes werelimited to a length of 0.2 w). Hence, it representsspatially free meandering, and is nearly free alsoof temporal forcing.
The simulator may represent free meanderingor any extent of valley confinement, and dis-charge conditions ranging from constant to fre-quent minor fluctuations that probe and short-circuit neck cutoffs with chutes up to 2 w long.This paper is part of a study of free meanderingdynamics per se, and hence simulated planformsunder these conditions were not compared to em-pirical data in detail.
Many meandering rivers are spatially free. Butthe second condition, near absence of temporalforcing by discharge fluctuations, is rarely real-ized in nature. Sensitivity tests (Fig. 6) demon-strate that simulated rivers are not affected byvalley confinement down to a valley width of
100 w, while they are highly sensitive to chutecutoffs longer than 1.5 w. This result was ob-tained by setting a uniform chute length thresh-old, which cut off all meanders at the criticallength. The result is therefore not entirely repre-sentative of natural chute processes, which occa-
H.-H. STØLUM
1486 Geological Society of America Bulletin, November 1998
Figure 1. Map of the southern central Amazon basin, Brazil, showing the five measuredriver reaches.

sionally act over longer distances, and for manybends not at all, depending on local bank condi-tions and the duration and magnitude of floods. Itshould therefore be considered an averaged re-sult, with the threshold approximately represent-ing the median chute length.
Hence, comparable rivers in nature would in-frequently have longer chutes of several riverwidths, and for most meanders no chutes at all.This condition is fulfilled for the three rivers stud-ied. Due to the presence of terraces, Juruá and Pu-rus are not entirely free over their entire length(Tricart, 1977). Over short reaches the river getsclose enough to a terrace on one side for the me-andering pattern to show signs of confinement.The sample of reaches in Figure 1 avoids theseparts, and consist of segments with relatively uni-form discharge between major tributaries.
FRACTAL GEOMETRY
Mandelbrot (1967, 1983) demonstrated thatcoastlines are scaling, in the sense that they don’thave structures (“wiggles”) only on a specific(intrinsic) length scale. Instead the same struc-tures recur over a wide scale range. An arbitraryand artificial length scale may be imposed bymeasuring the length of the coast with a standardyardstick, but the measured length will dependon the actual length of the yardstick. The lengthis therefore a function of yardstick length, andMandelbrot showed this relationship to be apower law. This function is equivalent to the geo-metrical property of self-similarity. Self-similar-ity means that the structure, (e. g., the coastline)appears to be similar (is having the same degreeof wiggliness) independent of the scale at whichone observes it. In order for this to be the case,the line has to be hierarchical; little wiggles aregrowing on top of larger ones, which means thatlarger wiggles are composed of smaller ones.This nested hierarchical structure is the essenceof fractality. Mandelbrot’s informal definition offractal is precisely: “A fractal is a shape made ofparts that are similar to, or repeat the whole insome way” (in Feder, 1988, p. 11).
Some fractals are deterministic, in the sensethat the parts exactly replicate the whole. Suchfractals are generally not found in nature (exceptin some plants), but can be constructed by itera-tively applying a mathematical transform to aninitial shape. Because such mathematical con-structions are deterministic, it is possible to de-rive their fractal dimensions analytically. Thefractal dimension is the exponent of the power-law scaling relationship.
A deterministic representation of the river frac-tal (i.e., a representation of the information con-tent of the river planform) may be formed by su-perimposing waves with different wavelength andamplitude. Each successive smaller scale of un-
DYNAMICS OF MEANDERING RIVERS
Geological Society of America Bulletin, November 1998 1487
Figure 2. Freely meandering reaches of Juruá and Purus Rivers redrawn from Landsat satel-lite images and synthetic aperture radar (SAR) images. (A) Juruá 1 reach (from Baker, 1978).(B) Juruá 2 reach. (C) Purus 2 reach. (D) Purus 1 reach.

dulation has to be superimposed on the previousso that the larger undulation forms a line throughthe inflection points of the smaller. However, theriver planforms of Figures 2 and 3 are examplesof statistical fractals, with a nested hierarchicalstructure of bends and undulations of varyingshape (Fig. 7). A statistical fractal is a structurewith random irregularities, and hence less orderedthan a deterministic fractal. But the fractal geom-etry is still manifest in statistical distributions ofcharacteristic attributes of the structure. Thus thegeometry in terms of averaged properties corre-sponds to a deterministic fractal.
The river planform in Figure 7 is a case of
asymptotic self-similarity (Schroeder, 1991), orself-affinity. Self-affinity implies that the scaling isanisotropic; the undulations become less pro-nounces the longer they are. Hence, there is a dif-ferent scaling rule in the x and y directions.Anisotropic scaling is less constrained thanisotropic scaling, and therefore more common innature. Well-known examples include diffusionfronts, rock surfaces, and map contours (Rodriguez-Iturbe and Rinaldo 1997, Rodriguez-Iturbe et al., 1994; Power and Tullis, 1991; Feder, 1988).
RIVER SCALING STATISTICS
The scaling properties of the Juruá and Purusreaches, treated as a whole, were found by mea-suring the planforms with yardsticks of differ-ent length (the divider method). By this methodthe fractal dimension, D, of the planform (thesimilarity dimension) is given by
N = ar –D, (2)
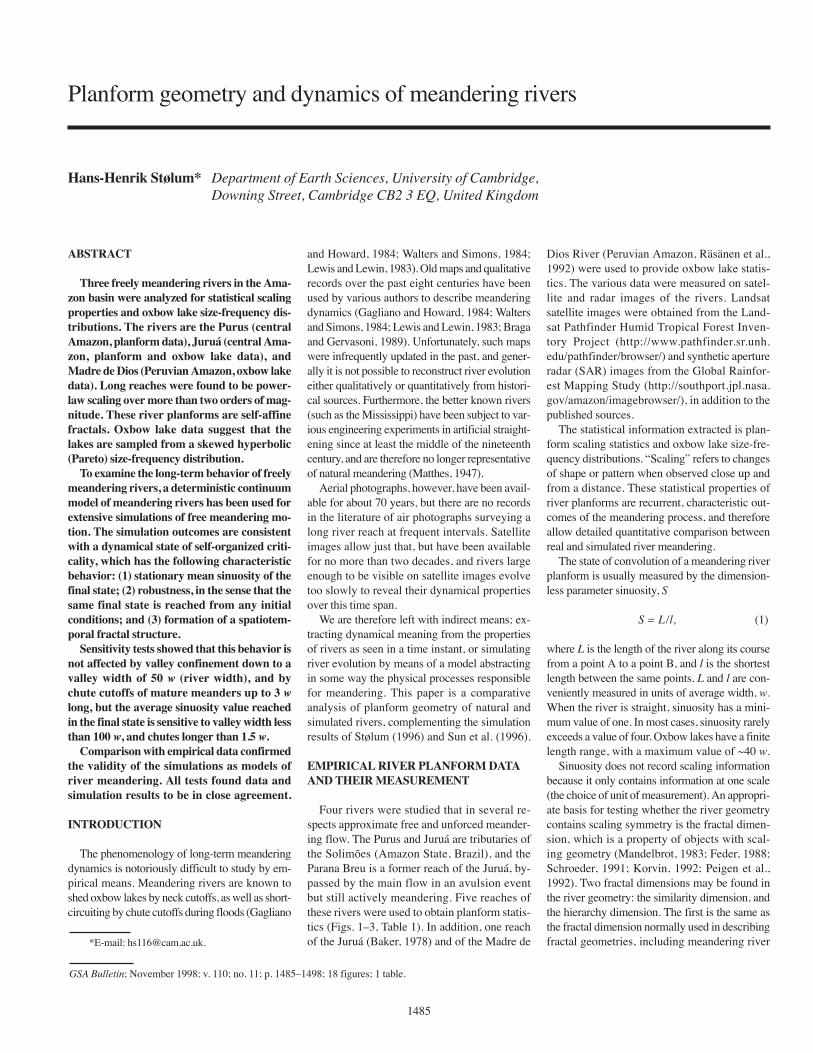
where r is the length of the yardstick in units ofaverage river width, a is a proportionality con-stant, and N is the number of yardsticks neces-sary to cover the entire planform. The dividermethod yielded fractal dimensions in the rangeof 1.18–1.47 over 1.2–2.3 orders of magnitude(Fig. 8).
The shortest relevant yardstick length is 1 w,but in most cases it seemed sufficient to use 2 was the smallest scale. The scaling interval wasidentified from the log-log plots of r vs. N by asimple procedure: if a distribution tail could befound with a gradient of ~1 (to within ±5%), thenthis range does not contain scaling information,and is outside the interval. Then a core part of thefractal interval with correlation coefficient r2 = 1was identified, mostly comprising three points. Ifmore points could be added, up to the limits setby tails of distribution, with only a small and lin-ear drop in r2 for each addition (<0.03 as an av-erage drop per addition, averaged over all addi-tions), then the entire set of included points can
be considered linear, and measuring the fractalrange and dimension of the planform.
Short scale ranges of 1.20 orders of magnitudeare associated with a clear crossover, and repre-sent the meanders themselves (Purus 2, Jurua 2,Parana Breu). This appeared to be a lower limit,as no improvement in r2 could be found by trun-cating these sets.
The longer ranges of 2–2.4 orders of magni-tude occur when no crossovers to a gradient of 1could be found within the measured scale range(Purus 1, Jurua 1, simulated). They represent thecomplete fractal structure generated by meander-ing, and comprise both meanders and higher orderundulations. Relative to the number of values(8–9 data points), these sets also had a high corre-lation coefficient, indicating geometrical continu-ity between meanders and undulations. This rangeappears to be near an upper limit; the lowest fre-quency undulations seen in these reaches were in-variably shallow with only a small contribution toN. Therefore, longer reaches contain little addi-tional structural information, and an asymptoticcrossover to a gradient of 1 is expected just out-side the measured range.
Fractal scaling of meandering river planforms(and ocean currents) was originally suggested byMandelbrot (1983, p. 99, 111), and analyzed bySnow (1989), Nikora (1991), Mullen and Kirwan(1994), and Montgomery (1996). For about 50meandering rivers, Snow (1989) and Montgomery(1996) found that the meanders themselves scaleover one order of magnitude. The range of scalingis highly sensitive to reach length, l, for l <400 w(Fig. 9A). The reaches studied by Scott (1989) andMontgomery (1996) were mostly around 200 w.Such short reaches contain no information aboutlong wavelength undulations, and therefore theseearlier measurements were strictly of the mean-ders themselves (and were also in this respectsomewhat truncated by the finite size of the sam-ples). Finally, correlation exists between the frac-tal dimension and sinuosity but varying widely be-tween rivers, as previously noted by Montgomery(1996) (Fig. 9B).
The main conclusion of all studies to date is
H.-H. STØLUM
1488 Geological Society of America Bulletin, November 1998
Figure 3. Synthetic aperture radar (SAR)image of Parana Breu (to the left) and JuruáRiver. The full reach of Parana Breu wasused in this study. The image was obtainedin the dry season, when the Parana has verylow discharge. The planform was thereforemade more clearly visible by contrast en-hancement. The image is otherwise unal-tered. It covers an area of 31 × 70 km. Fromthe Global Rainforest Mapping Project(http://southport.jpl.nasa.gov/amazon).
TABLE 1. SUMMARY DATA OF RIVER REACHESReach Length, Sinuosity Fractal Scaling
l dimension, range(w)* D (decades)
Simulated 570 2.83 1.28 2.05Juruá 1 1886 2.15 1.20 2.35Juruá 2 306 3.37 1.465 1.20Purus 1 800 2.95 1.18 2.35Purus 2 318 2.77 1.345 1.20Parana 263 3.21 1.415 1.20
BreuTok† 185 2.26 1.46 0.95Nowitna† 210 2.30 1.51 1.10
*w—river width.†Alaskan rivers. Data from Montgomery (1996).

that meandering river planforms are self-affinemonofractals with a natural scaling range of 2.4orders of magnitude. The generating mechanismis the meander cutoff process, with the actual me-anders being the generator shape. The structuremay be more precisely described as a prefractalbecause the self-affine geometry prevents it fromspanning more than about seven iterations of thegenerator (in the limit of infinite recursion thestructure becomes an ideal mathematical fractal).However, since naturally occurring fractals are al-ways finite, such prefractal structures are usuallyreferred to as fractal when they span at least two
orders of magnitude. If they span less than one or-der of magnitude it is difficult to establish the ex-act scaling rule. The oxbow lakes discussed in alater section clearly demonstrate this problem.
A more detailed scaling analysis should takeinto account the actual hierarchical structure ofthe planform, in the form of the smallest and sim-plest meanders superimposed on more complex,cumuliform meanders and larger scale undula-tions. This structure was analyzed by an inverserenormalization procedure (Fig. 10), startingwith measuring meander length l (shortest lengthbetween two successive inflection points), at agiven, small scale (average river width). The in-flection points were then connected to form anew, meandering line, which defines the next hi-erarchical level of meandering. The meandersspanned by this line were measured (using thesame unit). The process was terminated when asingle undulation spanned most of the river. Atall levels, the process was iterated from upstreamto downstream (right to left in Fig. 10). Duringthe process, various pronounced features wererecorded as meanders that persist unchanged ornearly unchanged through several levels of thehierarchy (“nearly unchanged” defined as lessthan an arbitrary threshold of change, in this case10% increase in length from one level to the nexthigher level). Such features have been recordedonly at their lowest level of occurrence, and ap-pear as dots in Figure 10 when recurring at higherlevels. This method quantifies the meander hier-archy with consistent accuracy. Details of the hi-erarchy are sensitive to the starting point, as wellas the direction chosen for the process. However,the overall statistics are not sensitive to these fac-tors, as found by initiating the hierarchy from ei-ther end of the reach.
The meander hierarchy of the Juruá 1 reachscales over two orders of magnitude when mea-
sured by meander length (Fig. 11). The fractal hi-erarchy dimension, Dh, characterizing the mean-der length scaling of this structure, is given by
N(L>l) = al –Dh, (3)
where L is the length of meanders in units of av-erage river width, and N is the number of mean-ders with length L larger than l. Dh was found tobe 1.13 for the Juruá 1 reach. This value wasfound by fitting a single least-square regressionline through the entire power-law interval (Fig.11). If the least accurate data are excluded (lev-els 1, 6, and 7), Dh(l) rises to 1.19 over 1.7decades. The meander amplitude or depth, m, isdefined in the inset to Figure 12 as orthogonal tol. Using the same procedure as above, m yieldsDh(m) = 1.63.
Hence the meandering river is a self-affinefractal (scales differently in different dimen-sions). Two hierarchy dimensions are requiredto describe the structure, because the undula-tions of the hierarchy become less pronouncedthe longer they are (Figs. 7 and 10). Althoughthe structure as a whole changes shape whenseen at different scales, the change of shape is invariant for all scales, given by the constant ratiok = Dh(l)/Dh(m) = 0.73.
The inverse renormalization procedure intro-duces a sampling stratification that brings thisout clearly. When each level (stratum) is repre-sented by its mean, a power-law relationship be-tween l and m becomes apparent (Fig. 12). Thenumber of measurements that form each meanvaries from 175 at the smallest scale to 2 at thesecond largest. If the hierarchical set of undula-tions had been self-similar, the ratio should re-main nearly constant (with only some randomvariation superimposed). The significant devia-tion from a power-law function at the highest
DYNAMICS OF MEANDERING RIVERS
Geological Society of America Bulletin, November 1998 1489
Figure 5. Qualitative comparison of simulated and actual free meandering river planforms. (A) Reach of Purus River. Redrawn from Landsatsatellite image. (B) Simulated river reach. Sinuosity = 2.83, length l = 570 w, iteration = 5200 starting from a nearly straight initial planform. w—river width. The following values of free parameters were used (Stølum, 1997): Froude number: Fr = 0.5; friction coefficient: Cf = 0.01; channelwidth/depth: w / ho = 20; sediment transport parameters: M = 5, β = 1.5.
Figure 4. Discharge (103 m3/s) measured atthe mouth of (A) Juruá and (B) Purus rivers(Richey et al., 1991). Years indicated by ab-scissa scale are from 1 September through 31August.

level is probably random, given that this point isbased on only one value (the largest undulation),and the considerable variance present in the data.
The stratification is imposed by the samplingprocedure and is not in itself indicative of naturaldiscretization. Therefore, the observed powerlaw is consistent with a continuous allometriclaw for the self-affine transformation of the form
, (4)
where the constant k is the exponent of thepower-law. k should not only be a constant withinany given reach, but also near constant for alltemporally and spatially unforced meanderingrivers. The data suggest that k ≈ 0.70.
OXBOW LAKE SIZE-FREQUENCY DISTRIBUTION
Published satellite and radar images of the Ju-ruá reach (Fig. 2A; Baker, 1978) and a freely me-andering reach of the Madre de Dios River, Ama-zon basin (Räsänen et al., 1992), reveal a largenumber of recent oxbow lake cutoffs, and alsosome oxbow lakes being formed and cutoffs justabout to occur. In all, 71 complete oxbow lakeswere identified from these images. The oxbow
lake sizes (lengths) were normalized prior tomeasurement by scaling the images such that theaverage river width was the same. This allowspooling of the samples since the relationship be-tween meander wavelength and average widthtend to be scale invariant, as demonstrated byempirical evidence from a number of rivers(Leopold et al., 1964, Leopold, 1994).
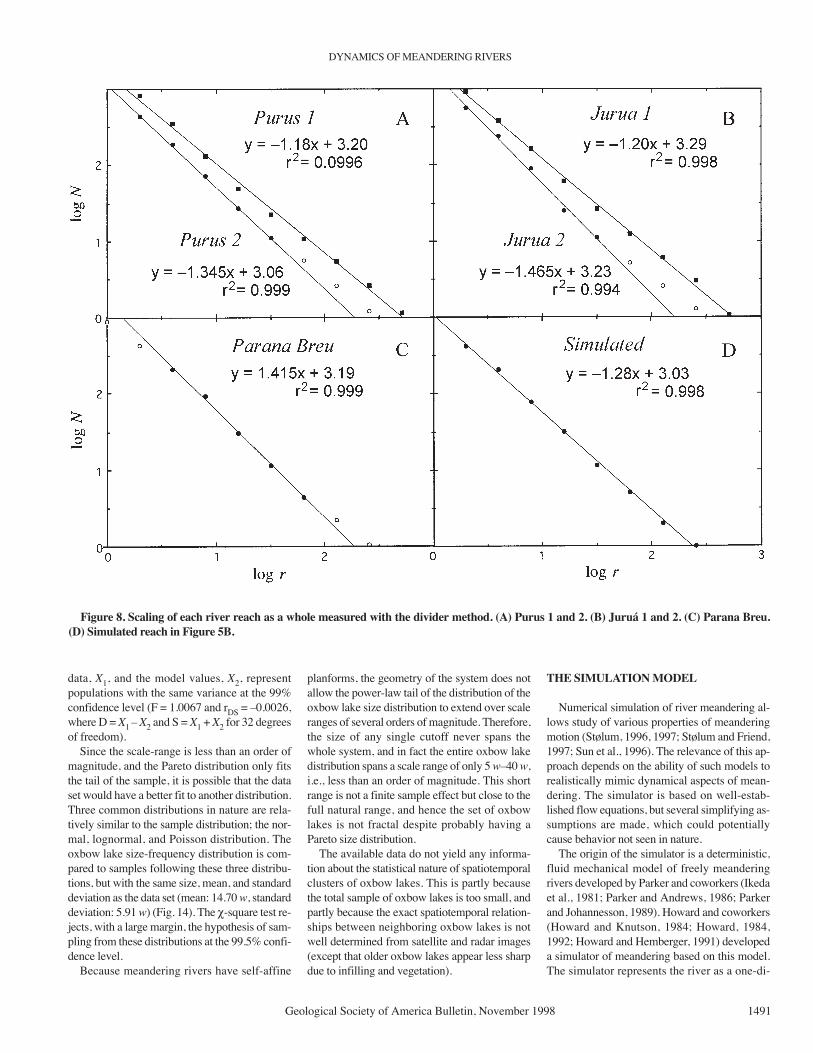
The cumulative oxbow lake size distributionof the pooled sample is shown in Figure 13, to-gether with two hypotheses (sampling from a lin-ear, and a Pareto distribution). Dadson (1998,Fig. 4.12) found a distribution of exactly thesame shape for 26 oxbow lakes from the spatiallyfree Anabunga River, Papua New Guinea. Theobserved distribution therefore appears to be aconsistent outcome of meandering dynamics.The scale range is too short to discriminate be-tween the two hypotheses in terms of goodnessof fit (both are statistically significant). However,unlike the Pareto distribution, the linear alterna-tive is not able to account for the form of the tailend of large oxbow lakes, which is a characteris-tic feature of the data.
The Pareto distribution (also known as the as-ymptotically hyperbolic distribution) looks some-what like a skewed normal distribution, but itslarge tail follows a power law. This distribution isan outcome of sampling from a fractal with a finitescale range (Mandelbrot, 1983). The large tail ofthe pooled sample fits a power-law cumulativedistribution given by
N(S>s) ∝ s–b (5)
with the constant b = 3.74 (Fig. 13, hypothesis2). N is the number of oxbow lakes with a lengthS larger than a given length S. Similar fits wereobtained using the samples from each river indi-vidually. The null hypothesis of sampling from aPareto distribution was tested for the pooledsample. It is accepted at the 99.9% confidencelevel when the correlation coefficient is used astest statistic. The correlation coefficient r2 =0.993 for 32 degrees of freedom implies a prob-ability of less than 0.01% for getting the ob-served goodness of fit if all deviations were ran-dom. Pitman’s variance test confirmed that the
dmdl
k ml
=
H.-H. STØLUM
1490 Geological Society of America Bulletin, November 1998
Figure 7. Reach of Murrumbidgee River, Australia, observed through resolution windows,each one decade wide, in total spanning roughly three orders of magnitude. Structure (mean-ders) occur at all scales, arranged in a nested hierarchy starting from the 100 m resolution pro-file. Note change of meander shape with change of scale, indicative of self-affine scaling sym-metry. Redrawn from map.
Figure 6. Sensitivity tests of confining valleywidth (A) and chute cutoff length threshold(B). Each value is the mean sinuosity <S> of10 simulations of 30 000 iterations each, allwith length l = 500 w; w—river width.
data, X1, and the model values, X2, representpopulations with the same variance at the 99%confidence level (F = 1.0067 and rDS = –0.0026,where D = X1 – X2 and S = X1 + X2 for 32 degreesof freedom).
Since the scale-range is less than an order ofmagnitude, and the Pareto distribution only fitsthe tail of the sample, it is possible that the dataset would have a better fit to another distribution.Three common distributions in nature are rela-tively similar to the sample distribution; the nor-mal, lognormal, and Poisson distribution. Theoxbow lake size-frequency distribution is com-pared to samples following these three distribu-tions, but with the same size, mean, and standarddeviation as the data set (mean: 14.70 w, standarddeviation: 5.91 w) (Fig. 14). The χ-square test re-jects, with a large margin, the hypothesis of sam-pling from these distributions at the 99.5% confi-dence level.
Because meandering rivers have self-affine
planforms, the geometry of the system does notallow the power-law tail of the distribution of theoxbow lake size distribution to extend over scaleranges of several orders of magnitude. Therefore,the size of any single cutoff never spans thewhole system, and in fact the entire oxbow lakedistribution spans a scale range of only 5 w–40 w,i.e., less than an order of magnitude. This shortrange is not a finite sample effect but close to thefull natural range, and hence the set of oxbowlakes is not fractal despite probably having aPareto size distribution.
The available data do not yield any informa-tion about the statistical nature of spatiotemporalclusters of oxbow lakes. This is partly becausethe total sample of oxbow lakes is too small, andpartly because the exact spatiotemporal relation-ships between neighboring oxbow lakes is notwell determined from satellite and radar images(except that older oxbow lakes appear less sharpdue to infilling and vegetation).
THE SIMULATION MODEL
Numerical simulation of river meandering al-lows study of various properties of meanderingmotion (Stølum, 1996, 1997; Stølum and Friend,1997; Sun et al., 1996). The relevance of this ap-proach depends on the ability of such models torealistically mimic dynamical aspects of mean-dering. The simulator is based on well-estab-lished flow equations, but several simplifying as-sumptions are made, which could potentiallycause behavior not seen in nature.
The origin of the simulator is a deterministic,fluid mechanical model of freely meanderingrivers developed by Parker and coworkers (Ikedaet al., 1981; Parker and Andrews, 1986; Parkerand Johannesson, 1989). Howard and coworkers(Howard and Knutson, 1984; Howard, 1984,1992; Howard and Hemberger, 1991) developeda simulator of meandering based on this model.The simulator represents the river as a one-di-
DYNAMICS OF MEANDERING RIVERS
Geological Society of America Bulletin, November 1998 1491
Figure 8. Scaling of each river reach as a whole measured with the divider method. (A) Purus 1 and 2. (B) Juruá 1 and 2. (C) Parana Breu. (D) Simulated reach in Figure 5B.

mensional series of points, or nodes, along theriver’s centerline. For each iteration, the positionof each point is recalculated starting at the up-stream end, which is fixed. The points are thenmoved according to the rate of laterally directedbank erosion in each point.
The results in this paper are based on the1990 version of the simulator as described byHoward (1992). This version follows fromParker and Johannesson (1989) and Johannessonand Parker (1989), which gave a somewhatmore accurate and complete description of me-andering than the 1984 model. This version ofthe simulator therefore does not have the smallbiases reported by Howard and Hemberger(1991) for the 1984 version. Detailed tests of theHoward (1992) second version provide goodprediction of the bed topography and flow char-acteristics in experimental meandering channelswith narrow width, vertical banks, and mobilesediment beds (Howard, 1992). Furthermore,this model, when combined with the assump-tion that bank erosion rates are proportional tonear-bank flow velocity, gives accurate esti-mates of bank erosion rates in natural channels(Hasegawa, 1989; Pizzuto and Meckelnburg1989; Howard 1992). A typical simulation out-come is shown in Figure 5B.
MODEL ASSUMPTIONS
The model contains several simplifying ide-alizations of channel geometry and flow proper-ties, which amount to elimination of secondaryeffects.
1. The channel width is assumed to be spa-tially and temporally constant.
2. The cross-stream (transverse) variation in
the vertically averaged downstream velocity isassumed to be linear instead of curved.
3. Water surface superelevation is assumed tobe linear instead of concave.
4. The energy gradient is assumed to be uni-form in the downstream direction.
5. The average channel depth is assumed to beuniform in the downstream direction.
6. Transient bedforms are not included (e.g.,ripples, dunes, migrating bars).
In addition, one less obvious simplificationis made.
7. There are negligible sidewall effects onnear-bank flow.
This assumption is reasonable only if turbu-lence is confined to a thin boundary layer or sup-pressed to a scale range significantly below theriver width. It is not a statement about the sec-ondary helicoidal flow frequently observed inmeandering channels, because this flow is a co-herent (whole flow) motion, caused by the fric-tional drag along the whole boundary, and not bylocal effects. The secondary flow is therefore nota form of turbulence, but an attribute of steadyflow. This was proved theoretically by Dean(1924) and experimentally by Taylor (1929). Inthe model, the effect of the secondary flow onthe near-bank velocity is described by an addi-tive constant.
Define the whole flow Reynolds number Re =ρUL / µ, which measures the ratio of inertial to vis-cous forces acting on a fluid element (Furbish,1997). U, L are the characteristic (mean) velocityand length (channel depth) of the flow. The fluiddensity and viscosity are ρ and µ. Confinement ofturbulence to a thin boundary layer occurs if Re isnear the critical threshold for the steady-turbulentflow phase transition. This threshold depends on
the properties of the system, but in experimentswith curved glass pipes, the transition region waslocated between Re = 3 × 10³ and 3 × 10⁴ (Taylor,1929). This was also the range where large-scalehelicoidal flow cells emerged. Re in the range of 5
H.-H. STØLUM
1492 Geological Society of America Bulletin, November 1998
Figure 10. Generation of a hier-archy of meanders and higher-order undulations from the Juruá 1reach by the inverse renormaliza-tion method described in the text.
Figure 9. Data from Table 1. (A) Scalingrange vs. length of measured reach. The twoshortest reaches are Nowitna and Tok Rivers,Alaska (from Montgomery, 1996). (B) Fractaldimension (D) vs. sinuosity. The values fall in abroad region, and the two lines indicate the ap-proximate limits of natural variation possible.

× 104 to 5 × 10⁵ is characteristic of high-sinuositymeandering rivers. For example, at bankfull dis-charge, Juruá has a mean flow velocity of 0.3 m/s,which gives a whole-flow Reynolds number ofroughly 0.8 × 10⁵ at bankfull discharge (cf. data inBaker, 1978, and the discharge data in Fig. 4).Qualitative studies of flow structure in meanderingrivers have repeatedly found a strong secondarycurrent in the form of one or two flow cells domi-nating the channel cross section, and correspond-ingly negligible turbulence at the scale of thechannel itself. Hence, phenomenologically, theserivers are near the critical threshold for steady tounsteady flow, but their Reynolds number is oneorder of magnitude larger than the experimentallyfound value at the transition.
Three experimentally established factors min-imize turbulence in natural meandering rivers. 1. Boundary deformation by erosional accom-modation in a clay-dominated medium reducesfriction relative to flow past a rigid smoothboundary (Wang et al., 1998). 2. Suspended loadin the form of clay thickens the boundary layerrelative to pure water (with a factor of five), andreduces frictional drag of the whole flow signif-icantly relative to pure water flow (Gust, 1976).3. Bedload enhances turbulence (Wang andLarsen, 1994).
Whereas Taylor’s experiments were done withpure water, a characteristic of meandering riversis high concentration of suspended load whenflow is at or above bankfull discharge. This is thecase even in densely forested basins. For exam-ple, the estimated suspended load (solid + dis-solved) of the Juruá at or above bankfull dis-charge is ~2 g/l, while the solid suspended load is0.5 g/l (Gibbs, 1967). The experiments of Gust(1976) were carried out with clay suspensions of1–10 g/l in seawater. These concentrations weresufficiently low not to alter the viscosity signifi-cantly from pure water. A large concentration ofdissolved electrolytes in the river enhances theflocculation of clay particles, making the solutionsimilar in this respect to sea water. The clay con-centration is less than used by Gust (1976), butwell within the same order of magnitude. Hence,in meandering rivers, a significant drag reductionfrom boundary shape accommodation and clay-solute suspension is expected relative to pure wa-ter flow in a rigid channel.
The Juruá bedload at the junction with theSolimões is <1% of the total solid load. This isrepresentative of the bedload supply and carryingcapacity of near spatially and temporally free me-andering rivers in general. This value was esti-mated by Baker (1978) from data in Gibbs(1967), on the basis of mean annual discharge.Using Figure 4, assuming a bankfull discharge of7500 m3/s lasting for one-fifth of a year, and car-rying a total suspended sediment yield of ~1013 gdry weight (90% of the total annual suspended
DYNAMICS OF MEANDERING RIVERS
Geological Society of America Bulletin, November 1998 1493
Figure 12. Allometric relationship between the mean values of l and m at each level of the un-dulation hierarchy; l—river length; m—depth (amplitude). Comparison of the Juruá 1 data(Figs. 10 and 11) and data from the simulated reach in Figure 5B.
Figure 11. Self-affine scaling of meander shape geometry over two orders of magnitude (Ju-ruá 1). See inset in Figure 12 for explanation of shape parameters.
sediment yield), the same result is obtained alsowhen discharge is at and above bankfull. Assum-ing 1% of total solid load as bedload, the rate ofbedload transport (gb) per unit river width is gb =0.003 kg/ms. Turbulence enhancement wasfound by Wang and Larsen (1994) for gb = 1.6kg/ms and more, so the amount of bedload in theJuruá is several orders of magnitude too small tohave this effect.
Thus, two factors found to reduce friction op-erate in meandering rivers, while a third factorknown to increase friction is ineffective. At thesame time, the density and viscosity of river wa-ter are not appreciably different from pure water.This is likely to be the reason why flow in mean-dering rivers behaves as if the whole-flowReynolds number is an order of magnitude lowerthan it appears to be when calculated (incor-rectly) on the basis of pure water flow.
In conclusion, treating the flow of high-sinu-osity meandering rivers as steady is a reasonableassumption. In most cases, turbulence will onlylocally and temporarily spread across the wholeflow. For example, if the river erodes a poorlyconsolidated sediment, turbulent perturbations ofnear-bank flow will occur when erosion takesplace abruptly by bank failure and slumping, al-though in densely forested areas this mode oferosion may be largely eliminated due to bankstabilization by roots. In nature, local perturba-tions of this kind are inevitable, but not funda-mental, aspects of the meandering dynamics.(That onset of meandering in a perfectly straightchannel requires turbulence is another matter:turbulence is not required to sustain meandering,only to initiate it from this extremal startinggeometry.)
In addition to the fluid mechanical approxima-tions above, several simplifying boundary condi-tion assumptions are made in the ideal case ofspatially and temporally free meandering:
1. Local bank erosion rate is determined in partby local curvature, and in part on a cumulativeupstream memory effect with exponential decay.
2. The dependence of erosion on velocity is linear.
3. The medium is homogeneous.4. The river flows in a wide valley (more
than 100 w).5. The surface gradient is constant.6. The channel is in equilibrium with the surface
gradient (i.e., no downcutting or aggradation).7. There is no discharge variation, and hence
there are no chute cutoffs.8. No branching processes occur (avulsions
and stream captures).Assumption 1 entails that the local rate of
bend migration is not simply correlated with lo-cal curvature, but is non-locally related to a cu-mulative influence of upstream curvature andbed topography (introducing a memory effect).
This assumption, and several predictions of themodel, were empirically tested and verified byFurbish (1991). This study provided heuristicjustification for the use of a convolution integralto describe the memory effect of upstream me-anders on migration rate at any given site alongthe river (Furbish, 1988, 1991). Furbish also pre-
dicted analytically from the convolution modelthat a scaling structure would be present in themeandering pattern, but his empirical data werelimited to properties of local bend kinematics.This paper extends the comparison to large-scalefeatures of meandering.
Assumption 2 appears to be a reasonable ap-
H.-H. STØLUM
1494 Geological Society of America Bulletin, November 1998
Figure 13. Pooled oxbow lake size-frequency distribution from Juruá 1 reach and Madrede Dios River and two statistically significant hypotheses (sampling from linear and Paretodistribution).

proximation, based on two reported tests (Pizzutoand Meckelnburg, 1989; Hasegawa, 1989) thatdemonstrate this linearity in two cases. Sun et al.(1996) proved that assumption 3 is not necessaryby allowing for self-formed heterogeneity (oxbowlake clay plugs, and point-bar sand bodies). Aslong as the heterogeneity is not also impartinglarge-scale anisotropy, there is no significant effecton the meandering dynamics and its resultingplanform pattern. Anisotropy as well as non-erodi-ble elements at or above river width scale, how-ever, will cause significant downstream variationin development, as proved experimentally by Jiaand Schumm (in Schumm et al., 1987).
Assumptions 4, 5, and 6 are possible and rea-sonable approximations for long reaches ofrivers in mature basins in the short term (as cor-responding to the simulations results of this pa-per). During the long-term evolution of the
basin, natural channels will inevitably fluctuatearound equilibrium with the valley surface, re-sulting in downcutting (formation of terraces) oraggradation (formation of crevasses and avul-sions). Assumptions 6, 7, and 8 are linked. Ifthere is equilibrium with the valley surface andno discharge variation, then neither chutes noravulsions will occur. Constant discharge is anapproximation to a situation of constant meanannual discharge and periodic fluctuations. Butthis is an exceptional state, possible only in thecentral parts of large, mature basins. Most mean-dering rivers are subject to erratic flood dis-charges and therefore are significantly forced bychutes. Even though the ideal case of absolutelyfree meandering is approximated over longreaches by some of the largest meandering riversin the world, it is not the general situation of me-andering rivers.
SIMULATION RESULTS
A detailed description of simulated spatiallyand temporally free meandering dynamics, usingthe second version of Howard’s simulator, wasgiven in Stølum (1996). The initial state is a quasi-straight course with small, random perturbations,and S ≈ 1. After an initial growth phase due toformation of a sine wave with increasing ampli-tude, the sinuosity falls off in steps as neighboringbends grow to meet each other, causing a series ofcutoffs. In both cases, the sinuosity reaches a sta-tionary state around an average sinuosity that is in-dependent of initial conditions. Increase in sinuos-ity is caused by the slow enlargement of riverbends due to bank erosion. Decrease is caused bycutoff events. These opposing processes self-orga-nize the sinuosity into a steady state around a meanvalue of S ≈ 3.14 when the dynamics are unforcedby chutes (Stølum, 1996).
The fractal (similarity) dimension of the simu-lated river planform in Figure 5B was found to be1.28 over two orders of magnitude (Fig. 8D), us-ing the divider method described previously.Both this value and the combination of fractal di-mension and sinuosity are well within the rangeof natural variation (Fig. 9B). Simulations alsoyield sets of oxbow lakes. The oxbow lake size-frequency distribution from a duration of 30 000iterations of the simulated river compares wellwith two hypotheses (sampling from an expo-nential, and a Pareto distribution) (Fig. 15). Thescale range of the distribution is too short to dis-criminate between these alternatives in terms ofgoodness of fit (both hypotheses are statisticallysignificant). Both alternatives imply a crossoverbetween two regimes. However, in the exponen-tial case, the tail of distribution of large oxbowlakes appears as a residual outside the distribu-tion. The Pareto alternative takes the tail fullyinto account, and is therefore a more parsimo-nious interpretation.
COMPARISON BETWEEN SIMULATIONAND EMPIRICAL DATA
Figure 5 compares a planform of the simu-lated river to a freely meandering reach of thePurus river. Both planforms contain similardownstream variations in local sinuosity andbend shapes. Qualitatively, therefore, the simu-lations represent natural free meandering withgreat accuracy. For example, such particularfeatures as the elongate, cumuliform meanderseen in Figure 16 occurs in both natural andsimulated planforms, and with approximatelythe same frequency.
The ranges of the similarity dimensions fromfree meandering rivers and simulated rivers over-lap (a lower limit in both cases is near 1.10, andthe upper limit is around 1.5). This is also true of
DYNAMICS OF MEANDERING RIVERS
Geological Society of America Bulletin, November 1998 1495
Figure 14. The size distribution of oxbowlakes compared to three common distribu-tions in nature, the normal, log normal, andPoisson. The oxbow lake distribution is signif-icantly different from all three.
Figure 15. Cumulative oxbow lake size-fre-quency distribution from a single run of a sim-ulated river and two statistically significanthypotheses (sampling from the exponentialand Pareto distributions).

the range of sinuosity values and the span of frac-tal dimension and sinuosity.
Both rivers and simulated planforms tend tohave a characteristic hierarchical structure in theform of meander bends superimposed on largerbends. The allometric relationship between bendshape parameters was statistically indistinguish-able between Jurua I and the simulated planform(Fig. 12). Hence, both river and simulation fol-low the same self-affine fractal geometry.
The oxbow lake size-frequency distributionsof the simulated and real rivers are also very sim-ilar. Since both cases can be represented by thePareto distribution, a comparison has been madebetween the large tails. Least-squares regressiondemonstrates that both tails fit power-law func-tions with comparable exponents (3.88 and 3.73).These exponents are sufficiently similar that anintermediate value could well represent both datasets (Fig. 17). It is therefore most likely that bothdata and the simulation result were sampled fromthe same Pareto distribution.
In conclusion, the convolution model appliedin the simulator successfully represents the spa-tial scaling structure of meandering rivers, as pre-dicted analytically by Furbish (1991).
DISCUSSION: THE FREE MEANDERINGRIVER AS A DYNAMICAL SYSTEM
River meandering involves nonlinear feedbackinteractions between flow within the channel and
the meandering pattern of the river. This has beenindicated by numerous observations of real andexperimental rivers (Bagnold, 1960; Schumm andKhan, 1972; Hickin, 1974; Hickin and Nanson,1975; Parker, 1976; Falcon Ascanio and Kennedy,1983; Odgaard, 1987; Nelson and Smith, 1989;Leopold, 1994). In the meandering process, theriver occasionally creates closed loops. Thiscauses the river to short-circuit, or bypass, result-ing in a separation of the loop from the active river(oxbow lake) (Brice, 1973, 1974; Lewis andLewin, 1983; Gagliano and Howard, 1984;Swanson, 1984; Hooke and Redmond, 1992;Hooke, 1995). These feedback processes in partdrive the meandering process. Meandering maytherefore be characterized as a self-excited processvia mutual adjustments between the velocity andboundary stress fields and evolving channel mor-phology. On this basis Furbish (1991) recognizedthat meander train evolution is essentially a self-organization process. Stølum (1996) found thatmeander train evolution leads to the dynamicalcondition of self-organized criticality (SOC).
Self-organized in this context means that “thesystem naturally evolves to the critical state with-out detailed specification of the initial conditions(i.e., the critical state is an attractor of the dynam-ics)” (Bak et al., 1987, 1988, p. 367). The originaldescription of self-organized criticality referred toavalanches on sand piles. Each avalanche can bedescribed as a communication of a noise signal.Parts of the system will be in a minimally stablestate, where any small perturbation or noise signal
may trigger an avalanche, bringing a region of thesystem into a more than minimally stable state.These regions will then impede the motion ofnoise generating avalanches in the minimally sta-ble regions. At the critical state, “the system willbecome stable precisely at the point when the net-work of minimally stable clusters has brokendown to the level where a noise signal cannot becommunicated through infinite distances. At thispoint there will be no length scale, and, conse-quently, no time scale” (Bak et al., 1988, p. 367).When the system becomes free of any intrinsicscale, fractal geometry emerges. The critical stateis not an equilibrium state where dynamics diedown. Instead it is characterized by stationaryfluctuations around a constant mean value ofsome state parameter of the system. (For an intro-duction to the subject, see Bak, 1996; Bak andPaczuski, 1993, or Bak and Chen, 1991.) Theanalogy between the classical self-organized crit-icality model of grain-pile avalanche dynamicsand river meandering is illustrated in Figure 18.
Any system in the self-organized criticality statewill have certain features in common with the the-oretical and experimental grain-pile model com-monly used to illustrate the concept (Bretz et al.,1992; Bak and Creutz, 1994; Frette et al., 1996). Agrain pile is formed by adding grains at a slow, uni-form rate. In the subcritical state, the angle of thepile is below the angle of repose. There will be oc-casional small avalanches that will locally lowerthe slope, but the system is characterized bybuildup. In the critical state, the system is maxi-
H.-H. STØLUM
1496 Geological Society of America Bulletin, November 1998
Figure 16. Air photograph of free meander-ing river, Amazon basin. The elongate bend inthe foreground is a characteristic feature ofhigh-sinuous meandering both in natural andsimulated rivers.
Figure 17. Comparison of tails of large oxbow lakes from the size-frequency distributions ofriver data (Fig. 13) and simulation result (Fig. 5B).

mally sensitive to small changes (minimally sta-ble), and the slope of the pile fluctuates around theangle of repose. Any additional grain may triggernothing, or an avalanche of any size up to the sizeof the system. Therefore the avalanche size distri-bution follows a scaling law with the largest possi-ble scale range and also the noise signal of grainsfalling off the table is scaling (flicker-noise; 1/fnoise). In the supercritical state, a temporally con-tinuous avalanche will span the entire system, andbring the angle steadily down to the angle of re-pose. The system is globally independent of initialconditions in the sense that it will go to the criticalstate from any starting point (hence this is a prop-erty of dynamical robustness or resilience). But atthe same time it is locally sensitive to initial condi-tions, in the sense that any change of the initialconditions will cause divergence of local trajecto-ries within the critical state.
The meandering river is a plane-filling shape,and the degree to which it fills the plane may bemeasured by the sinuosity, or by its fractal dimen-sion. In the supercritical state, the river nearly al-ways generates large spatiotemporal clusters ofcutoffs (avalanches) that span (migrate through)the whole system. In the subcritical state there is asteady buildup of sinuosity, and only small
avalanches of cutoff events (mostly appearing assingle, isolated cutoffs). The river has a tendencyto go toward an intermediate critical state inwhich spatiotemporal clusters of cutoff events oc-cur over the full-scale range available. The initialself-organization process usually leads to a singlesupercritical avalanche before the system goes tothe critical state, possibly undershooting andovershooting a couple of times, depending on theinitial geometry (Stølum, 1996).
In the critical state, the mean sinuosity is al-ways stationary in long simulation runs. The crit-ical state remains stationary also if small chutecutoffs or some valley confinement is allowed,but the mean sinuosity of the stationary state islowered (Fig. 6). Hence, the self-organized criti-cality dynamics is not sensitively dependent onthe river being spatially and temporally ab-solutely free. To complete the analogy, the equiv-alent of adding mass to a sand pile is addinglength to a river. The rate at which sand falls onthe sand pile is equivalent to the rate of lateralerosion by meandering.
That some form of functional scaling law willcharacterize the avalanche size-frequency distri-bution in the critical state is intuitively reasonable(given, of course, a large system run over many
iterations). The power-law (fractal) avalanchedistribution was derived analytically by Paczuskiand Bak (1993) for a one-dimensional self-orga-nized criticality model, and by Boettcher andPaczuski (1996) for a two-dimensional model. Itis a fundamental property of self-organized criti-cality that dynamics in this state always lead tospatial and temporal scaling phenomena.
Due to self-affine scaling of meanderingriver planforms, there is a size limit to thegrowth of single oxbow lakes. Therefore, sin-gle oxbow lakes will not span the whole systemunless we are looking at very short reaches.This does not mean that the sand-pile analogyis contrived. In the sand-pile analogy, ava-lanches correspond to spatiotemporal clustersof oxbow lakes, or to a mixture of clusters andisolated, single cutoffs. The self-organized crit-icality model of meandering predicts that suchclusters exist as precisely definable entities interms of a single measure, and that they have apower-law size-frequency distribution. Thishas been confirmed for avalanches over morethan two orders of magnitude (Stølum andFriend, 1997).
CONCLUSIONS
Meandering rivers are complex systems. Anintrinsic property of meandering dynamics is thecreation of oxbow lakes. Emergent properties ofmeandering rivers, not explainable by observa-tion of the local erosion process of meandering,are power-law distributed avalanches of oxbowlake cutoffs, organization of the river planform asa self-affine hierarchy of bends, self-affine sinu-osity fluctuations, and an apparent Pareto size-frequency distribution of oxbow lakes. Several ofthese properties have been measured for both realand simulated rivers, and are found to be in closeagreement. A description of meandering in termsof self-organized criticality explains the dynami-cal behavior of meandering rivers and their emer-gent properties.
ACKNOWLEDGMENTS
I thank Alan Howard of the University of Vir-ginia for generously making the simulator avail-able for this study, and for much useful advice.Discussions with Gary Parker, Peter Friend,Keith Richards, Pep Español, Simon Dadson,Don Turcotte, and Andy Woods improved manyaspects of the paper. Comments from reviewersDavid Furbish, Scott Snow, and Thomas Gardnerled to significant improvements of the final pa-per. Lawrence Rush wrote the analysis software.The project was supported by grants from BritishGas, Oryx (United Kingdom) Energy, Norwe-gian Research Council, Department of Trade andIndustry, and British Council.
DYNAMICS OF MEANDERING RIVERS
Geological Society of America Bulletin, November 1998 1497
Figure 18. Grain piles and meandering rivers: both systems are attracted by a critical state.
H.-H. STØLUM
1498 Geological Society of America Bulletin, November 1998
REFERENCES CITED
Bagnold, R. A., 1960, Some aspects of the shape of river mean-ders: U.S. Geological Survey Professional Paper 282-E,p. 135–144.
Bak, P., 1996, How nature works: New York, Springer (Coper-nicus), 205.
Bak, P., and Chen, K., 1991, Self-organized criticality: Scien-tific American, v. 264, p. 26–33.
Bak, P., and Creutz, M., 1994, Fractals and self-organized crit-icality, in Bunde, A., and Havlin, S., eds., Fractals in sci-ence: Berlin, Springer-Verlag, p. 27–47.
Bak, P., and Paczuski, M., 1993, Why nature is complex: Phys-ical World, part 12, v. 6, p. 39–43.
Bak, P., Tang, C., and Wiesenfeld, K., 1987, Self-organizedcriticality: An explanation of 1/f noise: Physical ReviewLetters, v. 59, p. 381–384.
Bak, P., Tang, C., and Wiesenfeld, K., 1988, Self-organizedcriticality: Physical Review A, v. 38, p. 364–374.
Baker, V. R., 1978, Adjustment of fluvial systems to climate andsource terrain in tropical and subtropical environments, inMiall, A. D., ed., Fluvial sedimentology: Canadian Soci-ety of Petroleum Geology Memoir 5, p. 211–230.
Boettcher, S., and Paczuski, M., 1996, Exact results for spa-tiotemporal correlations in a self-organized critical modelof punctuated equilibrium: Physical Review Letters,v. 76, p. 348–351.
Braga, G., and Gervasoni, S., 1989, Evolution of the Po River:An example of the application of historic maps, in Petts,G. E., Möller, H., and Roux, A. L., eds., Historical changeof large alluvial rivers: Western Europe: Chichester,United Kingdom, Wiley, p. 113–126.
Bretz, M., Cunningham, J. B., Kurczynski, P. L., and Nori, F.,1992, Imaging of avalanches in granular materials: Phys-ical Review Letters, v. 69, p. 2431–2434.
Brice, J., 1973, Meandering pattern of the White River in Indi-ana—An analysis, in Morisawa, M., ed., Fluvial geomor-phology: London, George Allen & Unwin, p.179–200.
Brice, J., 1974, Evolution of meander loops: Geological Soci-ety of America Bulletin, v. 85, p. 581–586.
Dadson, S. J., 1998, Self-organized criticality and river mean-dering [Bachelor’s thesis]: Oxford, United Kingdom,University of Oxford, School of Geography, 65 p.
Dean, W. R., 1924, The stream-line motion of fluid in a curvedpipe: Philosophical Magazine [London], v. 7, p. 673–695.
Falcon Ascanio, M. A., and Kennedy, J. F., 1983, Flow in allu-vial river curves: Journal of Fluid Mechanics, v. 133,p. 1–16.
Feder, J., 1988, Fractals: New York, Plenum, 283 p.Frette, V., Christensen, K., Malthe-Sørensen, A., Feder, J.,
Jøssang, T., and Meakin, P., 1996, Avalanche dynamics ina pile of rice: Nature, v. 379, p. 49–52.
Furbish, D. J., 1988, River bend curvature and migration: Howare they related?: Geology, v. 16, p. 752–755.
Furbish, D. J., 1991, Spatial autoregressive structure in mean-der evolution: Geological Society of America Bulletin,v. 103, p. 1576–1589.
Furbish, D. J., 1997, Fluid physics in geology: New York, Ox-ford University Press, 476 p.
Gagliano, S. M., and Howard, P. C., 1984, The neck cutoffoxbow lake cycle along the lower Mississippi river, inElliott, C. M. ed., River meandering: New York, Ameri-can Society of Civil Engineers, p. 147–158.
Gibbs, R. J., 1967, The geochemistry of the Amazon River sys-tem. Part 1. The factors that control the salinity and com-position and concentration of the suspended solids: Geo-logical Society of America Bulletin, v. 78, p. 1203–1232.
Gust, G., 1976, Observations on turbulent-drag reduction in adilute suspension of clay in sea-water: Journal of FluidMechanics, v. 75, p. 29–47.
Hasegawa, K., 1989, Universal bank erosion coefficient for me-andering rivers: American Society of Civil Engineers Jour-nal of Hydraulic Engineering, v. 115.
Hickin, E. J., 1974, The development of meanders in naturalriver-channels: American Journal of Science, v. 274,p. 414–442.
Hickin, E. J., and Nanson, G. C., 1975, The character of chan-nel migration on the Beatton River, northeastern BritishColumbia, Canada: Geological Society of America Bul-letin, v. 86, p. 487–494.
Hooke, J. M., 1995, River channel adjustment to meander cut-offs on the River Bollin and River Dane, northwest Eng-land: Geomorphology, v. 14, p. 235–253.
Hooke, J. M., and Redmond, C. E. 1992, Causes and nature ofriver planform change, in Billi, P., Hey, R. D., Thorne,C. R., and Tacconi, P., eds., Dynamics of gravel bedrivers: Chichester, United Kingdom, Wiley, p. 549–563.
Howard, A. D., 1984, Simulation model of meandering, inElliott, C. M., ed., River meandering: New York, Ameri-can Society of Civil Engineers, p. 952–963.
Howard, A. D., 1992, Modelling channel migration andfloodplain sedimentation in meandering streams, inCarling, C. A., and Petts, G. E., eds., Lowland flood-plain rivers: New York, John Wiley, p. 1–41.
Howard, A. D., and Hemberger, A. T., 1991, Multivariatecharacterization of meandering: Geomorphology, v. 4,p. 161–186.
Howard, A. D., and Knutson, T. R., 1984, Sufficient conditionsfor river meandering: A simulation approach: Water Re-sources Research, v. 20, p. 1656–1667.
Ikeda, S., Parker, G., and Sawai, K., 1981, Bend theory of rivermeanders. Part 1. Linear development: Journal of FluidMechanics, v. 112, p. 363–377.
Johannesen, H., and Parker, G., 1989, Linear theory of rivermeanders, in Ikeda, S., and Parker, G., eds., River mean-dering: American Geophysical Union Water ResearchMonograph 12, p. 379–415.
Knighton, D., 1998, Fluvial forms and processes: A new per-spective: New York, Wiley, and London, Hodder(Arnold), 383 p.
Korvin, G., 1992, Fractal models in the earth sciences: Amster-dam, Elsevier, 396 p.
Leopold, L. B., Wolman, M. G., and Miller, J. P., 1964, Fluvialprocesses in geomorphology: San Francisco, California,Freeman, 511 p.
Leopold, L. B., 1994, A view of the river: Cambridge, Massa-chusetts, Harvard University Press, 298 p.
Lewis, G. W., and Lewin, J., 1983, Alluvial cutoffs in Walesand the Borderlands: International Association of Sedi-mentologists Special Publication 6, p. 145–154.
Mandelbrot, B. B., 1967, How long is the coast of Britain? Sta-tistical self-similarity and fractional dimension: Science,v.155, p. 636–638.
Mandelbrot, B. B., 1983, The fractal geometry of nature: NewYork, Freeman, 468 p.
Matthes, G. H., 1947, Mississippi river cutoffs: American So-ciety of Civil Engineers Proceedings 73, part 1, Paper2329.
Montgomery, K., 1996, Sinuosity and fractal dimension of me-andering rivers: Area, v. 28, p. 491–500.
Mullen, C. P., and Kirwan, A. D. Jr., 1994, Surface flow struc-ture of the Gulf Stream from composite imagery andsatellite-tracked drifters: Nonlinear Processes in Geo-physics, v. 1, p. 64.
Nelson, J. M., and Smith, J. D., 1989, Flow in meanderingchannels with natural topography, in Ikeda, S., andParker, G., eds., River meandering: American Geophysi-cal Union Water Research Monograph 12, p. 321–377.
Nikora, V., 1991, Fractal structure of river planforms: WaterResources Research, v. 27, p. 1327–1333.
Odgaard, A. J., 1987, Streambank erosion along two rivers inIowa: Water Resources Research, v. 23, p. 1225–1236.
Paczuski, M., and Bak, P., 1993, Theory of the one-dimen-sional forest-fire model: Physical Review E, v. 48,p. R3214–R3216.
Parker, G., 1976, On the cause and characteristic scales of me-andering and braiding in rivers: Journal of Fluid Mechan-ics, v. 76, p. 457–480.
Parker, G., and Andrews, E. D., 1986, On the time developmentof meander bends: Journal of Fluid Mechanics, v. 162,p. 139–156.
Parker, G., and Johannesen, H., 1989, Observations on several
recent theories of resonance and overdeepening in mean-dering channels, in Ikeda, S., and Parker, G., eds., Rivermeandering: American Geophysical Union Water Re-search Monograph 12, p. 379–415.
Peitgen, H-O., Jürgens, H., and Saupe, D., 1992, Chaos andfractals: New York, Springer-Verlag, 984 p.
Pizzuto, J. E., and Meckelnburg, T. S., 1989, Evaluation of alinear bank erosion equation: Water Resources Research,v. 25, p. 1005–1013.
Power, W. L., and Tullis, T. E., 1991, Euclidean and fractalmodels for the description of rock surface roughness:Journal of Geophysical Research, v. 96, p. 415–424.
Räsänen, M., Neller, R., Salo, J., and Jungner, H., 1992, Recentand ancient fluvial deposition systems in the Amazonianforeland basin, Peru: Geological Magazine, v. 129,p. 293–306.
Richey, J. E., Victoria, R. L., Salati, E., and Forsberg, B. R.,1991, The biogeochemistry of a major river system: TheAmazon case study, in Degens, E. T., Kempe, S., andRichey, J. E., eds., Biogeochemistry of major worldrivers. SCOPE 42: Chichester, United Kingdom, Wiley,p. 57–74.
Rodriguez-Iturbe, I., and Rinaldo, A., 1997, Fractal riverbasins: Cambridge, England, Cambridge UniversityPress, 547 p.
Rodriguez-Iturbe, I., Marani, M., Rigon, R., and Rinaldo, A.,1994, Self-organized river basin landscapes: Fractal andmultifractal characteristics: Water Resources Research,v. 30, p. 3531–3539.
Schroeder, M. R., 1991, Fractals, chaos, power-laws: NewYork, Freeman, 429 p.
Schumm, S., and Khan, H., 1972, Experimental study of chan-nel patterns: Geological Society of America Bulletin,v. 83, p. 1755–1770.
Schumm, S. A., Mosley, M. P., and Weaver, W. E., 1987, Ex-perimental fluvial geomorphology: New York, Wiley,413 p.
Snow, R. S., 1989, Fractal sinuosity of stream channels: Pureand Applied Geophysics, v. 131, p. 99–110.
Stølum, H-H., 1996, River meandering as a self-organizationprocess: Science, v. 271, p. 1371–1374.
Stølum, H-H., 1997, Fluctuations at the self-organized criticalstate: Physical Review E, v. 56, p. 6710–6718.
Stølum, H-H., and Friend, P. F., 1997, Percolation theory ap-plied to simulated meanderbelt sandbodies: Earth andPlanetary Science Letters, v. 153, p. 265–277.
Sun, T., Meakin, P., Jøssang, T., and Schwarz, K., 1996, A sim-ulation model for meandering rivers: Water ResourcesResearch, v. 32, p. 2937–2954.
Swanson, J. E., 1984, Tazlina river meander loop—A case his-tory, in Elliott, C. M., ed., River meandering: New York,American Society of Civil Engineers, p. 231–239.
Taylor, G. I., 1929, The criterion for turbulence in curved pipes:Royal Society of London Proceedings, ser. A, v. 124,p. 243–249.
Tricart, J., 1977, Types de lits fluviaux en Amazonie brésili-enne: Annales de Geographie, v. 86, p. 1–54.
Walters, W. H., and Simons, D. B., 1984: Long-term changes oflower Mississippi river meander geometry, in Elliott,C. M., ed., River meandering: New York, American So-ciety of Civil Engineers, 318–329.
Wang, Z. Y., and Larsen, P., 1994, Turbulent structure of waterand clay suspensions with bed load: American Society ofCivil Engineers Journal of Hydraulic Engineering, v. 120,p. 577–600.
Wang, Z. Y., Larsen, P., and Xiang, X. K., 1994, Rheologicalproperties of sediment suspensions and their implications:Journal of Hydraulic Research, v. 4, p. 495–516.
Wang, Z. Y., Larsen, P., Nestmann, F., and Dittrich, A., 1998,Resistance and drag reduction of flows of clay suspen-sions: American Society of Civil Engineers Journal ofHydraulic Engineering, v. 124, p. 41–49.
MANUSCRIPT RECEIVED BY THE SOCIETY MAY 1, 1995REVISED MANUSCRIPT RECEIVED JULY 31, 1997MANUSCRIPT ACCEPTED OCTOBER 3, 1997
Printed in U.S.A.
Related Documents


![Morphodynamic regime and long-term evolution of meandering … · [2] Meandering rivers are highly nonlinear dynamic sys-tems, which produce complex and fascinating planimetric patterns.](https://static.cupdf.com/doc/110x72/5e898489b7100e61bf61bad7/morphodynamic-regime-and-long-term-evolution-of-meandering-2-meandering-rivers.jpg)