arXiv:1101.2047v3 [astro-ph.GA] 13 Dec 2011 Astronomy & Astrophysics manuscript no. sed˙ercsc c ESO 2011 December 14, 2011 Planck early results. XV. Spectral energy distributions and radio continuum spectra of northern extragalactic radio sources Planck Collaboration: J. Aatrokoski 1 , P. A. R. Ade 82 , N. Aghanim 53 , H. D. Aller 4 , M. F. Aller 4 , E. Angelakis 75 , M. Arnaud 69 , M. Ashdown 66,7 , J. Aumont 53 , C. Baccigalupi 80 , A. Balbi 33 , A. J. Banday 87,11,74 , R. B. Barreiro 60 , J. G. Bartlett 6,64 , E. Battaner 89 , K. Benabed 54 , A. Benoˆ ıt 52 , A. Berdyugin 86 , J.-P. Bernard 87,11 , M. Bersanelli 30,47 , R. Bhatia 8 , A. Bonaldi 43 , L. Bonavera 80,9 , J. R. Bond 10 , J. Borrill 73,83 , F. R. Bouchet 54 , M. Bucher 6 , C. Burigana 46 , D. N. Burrows 17 , P. Cabella 33 , M. Capalbi 2 , B. Cappellini 47 , J.-F. Cardoso 70,6,54 , A. Catalano 6,68 , E. Cavazzuti 2 , L. Cay´ on 21 , A. Challinor 57,66,13 , A. Chamballu 50 , R.-R. Chary 51 , L.-Y Chiang 56 , P. R. Christensen 78,34 , D. L. Clements 50 , S. Colafrancesco 44 , S. Colombi 54 , F. Couchot 72 , A. Coulais 68 , S. Cutini 2 , F. Cuttaia 46 , L. Danese 80 , R. D. Davies 65 , R. J. Davis 65 , P. de Bernardis 29 , G. de Gasperis 33 , A. de Rosa 46 , G. de Zotti 43,80 , J. Delabrouille 6 , J.-M. Delouis 54 , C. Dickinson 65 , H. Dole 53 , S. Donzelli 47,58 , O. Dor´ e 64,12 , U. D ¨ orl 74 , M. Douspis 53 , X. Dupac 37 , G. Efstathiou 57 , T. A. Enßlin 74 , F. Finelli 46 , O. Forni 87,11 , M. Frailis 45 , E. Franceschi 46 , L. Fuhrmann 75 , S. Galeotta 45 , K. Ganga 6,51 , F. Gargano 61 , D. Gasparrini 2 , N. Gehrels 5 , M. Giard 87,11 , G. Giardino 38 , N. Giglietto 27,61 , P. Giommi 3 , F. Giordano 27 , Y. Giraud-H´ eraud 6 , J. Gonz´ alez-Nuevo 80 , K. M. G ´ orski 64,92 , S. Gratton 66,57 , A. Gregorio 31 , A. Gruppuso 46 , D. Harrison 57,66 , S. Henrot-Versill´ e 72 , D. Herranz 60 , S. R. Hildebrandt 12,71,59 , E. Hivon 54 , M. Hobson 7 , W. A. Holmes 64 , W. Hovest 74 , R. J. Hoyland 59 , K. M. Huffenberger 90 , A. H. Jaffe 50 , M. Juvela 20 , E. Keih¨ anen 20 , R. Keskitalo 64,20 , O. King 79 , T. S. Kisner 73 , R. Kneissl 36,8 , L. Knox 23 , T. P. Krichbaum 75 , H. Kurki-Suonio 20,41 , G. Lagache 53 , A. L¨ ahteenm¨ aki 1,41 ⋆ , J.-M. Lamarre 68 , A. Lasenby 7,66 , R. J. Laureijs 38 , N. Lavonen 1 , C. R. Lawrence 64 , S. Leach 80 , R. Leonardi 37,38,24 , J. Le ´ on-Tavares 1 , M. Linden-Vørnle 15 , E. Lindfors 86 , M. L ´ opez-Caniego 60 , P. M. Lubin 24 , J. F. Mac´ ıas-P´ erez 71 , B. Maffei 65 , D. Maino 30,47 , N. Mandolesi 46 , R. Mann 81 , M. Maris 45 , E. Mart´ ınez-Gonz´ alez 60 , S. Masi 29 , M. Massardi 43 , S. Matarrese 26 , F. Matthai 74 , W. Max-Moerbeck 79 , M. N. Mazziotta 61 , P. Mazzotta 33 , A. Melchiorri 29 , L. Mendes 37 , A. Mennella 30,45 , P. F. Michelson 91 , M. Mingaliev 84 , S. Mitra 64 , M.-A. Miville-Deschˆ enes 53,10 , A. Moneti 54 , C. Monte 27,61 , L. Montier 87,11 , G. Morgante 46 , D. Mortlock 50 , D. Munshi 82,57 , A. Murphy 77 , P. Naselsky 78,34 , P. Natoli 32,2,46 , I. Nestoras 75 , C. B. Netterfield 18 , E. Nieppola 1,39 , K. Nilsson 39 , H. U. Nørgaard-Nielsen 15 , F. Noviello 53 , D. Novikov 50 , I. Novikov 78 , I. J. O’Dwyer 64 , S. Osborne 85 , F. Pajot 53 , B. Partridge 40 , F. Pasian 45 , G. Patanchon 6 , V. Pavlidou 79 , T. J. Pearson 12,51 , O. Perdereau 72 , L. Perotto 71 , M. Perri 2 , F. Perrotta 80 , F. Piacentini 29 , M. Piat 6 , S. Plaszczynski 72 , P. Platania 63 , E. Pointecouteau 87,11 , G. Polenta 2,44 , N. Ponthieu 53 , T. Poutanen 41,20,1 , G. Pr´ ezeau 12,64 , P. Procopio 46 , S. Prunet 54 , J.-L. Puget 53 , J. P. Rachen 74 , S. Rain` o 27,61 , W. T. Reach 88 , A. Readhead 79 , R. Rebolo 59,35 , R. Reeves 79 , M. Reinecke 74 , R. Reinthal 86 , C. Renault 71 , S. Ricciardi 46 , J. Richards 79 , T. Riller 74 , D. Riquelme 55 , I. Ristorcelli 87,11 , G. Rocha 64,12 , C. Rosset 6 , M. Rowan-Robinson 50 , J. A. Rubi ˜ no-Mart´ ın 59,35 , B. Rusholme 51 , J. Saarinen 86 , M. Sandri 46 , P. Savolainen 1 , D. Scott 19 , M. D. Seiffert 64,12 , A. Sievers 55 , A. Sillanp¨ a¨ a 86 , G. F. Smoot 22,73,6 , Y. Sotnikova 84 , J.-L. Starck 69,14 , M. Stevenson 79 , F. Stivoli 48 , V. Stolyarov 7 , R. Sudiwala 82 , J.-F. Sygnet 54 , L. Takalo 86 , J. Tammi 1 , J. A. Tauber 38 , L. Terenzi 46 , D. J. Thompson 5 , L. Toffolatti 16 , M. Tomasi 30,47 , M. Tornikoski 1 , J.-P. Torre 53 , G. Tosti 62,28 , A. Tramacere 49 , M. Tristram 72 , J. Tuovinen 76 , M. T¨ urler 49 , M. Turunen 1 , G. Umana 42 , H. Ungerechts 55 , L. Valenziano 46 , E. Valtaoja 86 , J. Varis 76 , F. Verrecchia 2 , P. Vielva 60 , F. Villa 46 , N. Vittorio 33 , B. D. Wandelt 54,25 , J. Wu 67 , D. Yvon 14 , A. Zacchei 45 , J. A. Zensus 75 , X. Zhou 67 , and A. Zonca 24 (Affiliations can be found after the references) Preprint online version: December 14, 2011 ABSTRACT Spectral energy distributions (SEDs) and radio continuum spectra are presented for a northern sample of 104 extragalactic radio sources, based on the Planck Early Release Compact Source Catalogue (ERCSC) and simultaneous multifrequency data. The nine Planck frequencies, from 30 to 857 GHz, are complemented by a set of simultaneous observations ranging from radio to gamma-rays. This is the first extensive frequency coverage in the radio and millimetre domains for an essentially complete sample of extragalactic radio sources, and it shows how the individual shocks, each in their own phase of development, shape the radio spectra as they move in the relativistic jet. The SEDs presented in this paper were fitted with second and third degree polynomials to estimate the frequencies of the synchrotron and inverse Compton (IC) peaks, and the spectral indices of low and high frequency radio data, including the Planck ERCSC data, were calculated. SED modelling methods are discussed, with an emphasis on proper, physical modelling of the synchrotron bump using multiple components. Planck ERCSC data also suggest that the original accelerated electron energy spectrum could be much harder than commonly thought, with power-law index around 1.5 instead of the canonical 2.5. The implications of this are discussed for the acceleration mechanisms effective in blazar shock. Furthermore in many cases the Planck data indicate that gamma-ray emission must originate in the same shocks that produce the radio emission. Key words. galaxies: active – BL Lacertae objects: general – quasars: general – radiation mechanisms: non-thermal – radio continuum: galaxies ⋆ Corresponding author: A. L¨ ahteenm¨ aki, [email protected] 1. Introduction This paper is part of the first series of publications based on measurements made with the Planck 1 satellite. Planck 1 Planck (http://www.esa.int/planck) is a project of the European Space Agency (ESA) with instruments provided by two scientific con- 1

Welcome message from author
This document is posted to help you gain knowledge. Please leave a comment to let me know what you think about it! Share it to your friends and learn new things together.
Transcript

arX
iv:1
101.
2047
v3 [
astr
o-ph
.GA
] 13
Dec
201
1Astronomy & Astrophysicsmanuscript no. sed˙ercsc c© ESO 2011December 14, 2011
Planck early results. XV. Spectral energy distributions and radiocontinuum spectra of northern extragalactic radio sources
Planck Collaboration: J. Aatrokoski1, P. A. R. Ade82, N. Aghanim53, H. D. Aller4, M. F. Aller4, E. Angelakis75, M. Arnaud69, M. Ashdown66,7,J. Aumont53, C. Baccigalupi80, A. Balbi33, A. J. Banday87,11,74, R. B. Barreiro60, J. G. Bartlett6,64, E. Battaner89, K. Benabed54, A. Benoıt52,A. Berdyugin86, J.-P. Bernard87,11, M. Bersanelli30,47, R. Bhatia8, A. Bonaldi43, L. Bonavera80,9, J. R. Bond10, J. Borrill73,83, F. R. Bouchet54,M. Bucher6, C. Burigana46, D. N. Burrows17, P. Cabella33, M. Capalbi2, B. Cappellini47, J.-F. Cardoso70,6,54, A. Catalano6,68, E. Cavazzuti2,L. Cayon21, A. Challinor57,66,13, A. Chamballu50, R.-R. Chary51, L.-Y Chiang56, P. R. Christensen78,34, D. L. Clements50, S. Colafrancesco44,
S. Colombi54, F. Couchot72, A. Coulais68, S. Cutini2, F. Cuttaia46, L. Danese80, R. D. Davies65, R. J. Davis65, P. de Bernardis29, G. de Gasperis33,A. de Rosa46, G. de Zotti43,80, J. Delabrouille6, J.-M. Delouis54, C. Dickinson65, H. Dole53, S. Donzelli47,58, O. Dore64,12, U. Dorl74, M. Douspis53,X. Dupac37, G. Efstathiou57, T. A. Enßlin74, F. Finelli46, O. Forni87,11, M. Frailis45, E. Franceschi46, L. Fuhrmann75, S. Galeotta45, K. Ganga6,51,
F. Gargano61, D. Gasparrini2, N. Gehrels5, M. Giard87,11, G. Giardino38, N. Giglietto27,61, P. Giommi3, F. Giordano27, Y. Giraud-Heraud6,J. Gonzalez-Nuevo80, K. M. Gorski64,92, S. Gratton66,57, A. Gregorio31, A. Gruppuso46, D. Harrison57,66, S. Henrot-Versille72, D. Herranz60,
S. R. Hildebrandt12,71,59, E. Hivon54, M. Hobson7, W. A. Holmes64, W. Hovest74, R. J. Hoyland59, K. M. Huffenberger90, A. H. Jaffe50,M. Juvela20, E. Keihanen20, R. Keskitalo64,20, O. King79, T. S. Kisner73, R. Kneissl36,8, L. Knox23, T. P. Krichbaum75, H. Kurki-Suonio20,41,
G. Lagache53, A. Lahteenmaki1,41⋆, J.-M. Lamarre68, A. Lasenby7,66, R. J. Laureijs38, N. Lavonen1, C. R. Lawrence64, S. Leach80,R. Leonardi37,38,24, J. Leon-Tavares1, M. Linden-Vørnle15, E. Lindfors86, M. Lopez-Caniego60, P. M. Lubin24, J. F. Macıas-Perez71, B. Maffei65,
D. Maino30,47, N. Mandolesi46, R. Mann81, M. Maris45, E. Martınez-Gonzalez60, S. Masi29, M. Massardi43, S. Matarrese26, F. Matthai74,W. Max-Moerbeck79, M. N. Mazziotta61, P. Mazzotta33, A. Melchiorri29, L. Mendes37, A. Mennella30,45, P. F. Michelson91, M. Mingaliev84,
S. Mitra64, M.-A. Miville-Deschenes53,10, A. Moneti54, C. Monte27,61, L. Montier87,11, G. Morgante46, D. Mortlock50, D. Munshi82,57,A. Murphy77, P. Naselsky78,34, P. Natoli32,2,46, I. Nestoras75, C. B. Netterfield18, E. Nieppola1,39, K. Nilsson39, H. U. Nørgaard-Nielsen15,
F. Noviello53, D. Novikov50, I. Novikov78, I. J. O’Dwyer64, S. Osborne85, F. Pajot53, B. Partridge40, F. Pasian45, G. Patanchon6, V. Pavlidou79,T. J. Pearson12,51, O. Perdereau72, L. Perotto71, M. Perri2, F. Perrotta80, F. Piacentini29, M. Piat6, S. Plaszczynski72, P. Platania63,
E. Pointecouteau87,11, G. Polenta2,44, N. Ponthieu53, T. Poutanen41,20,1, G. Prezeau12,64, P. Procopio46, S. Prunet54, J.-L. Puget53, J. P. Rachen74,S. Raino27,61, W. T. Reach88, A. Readhead79, R. Rebolo59,35, R. Reeves79, M. Reinecke74, R. Reinthal86, C. Renault71, S. Ricciardi46, J. Richards79,
T. Riller74, D. Riquelme55, I. Ristorcelli87,11, G. Rocha64,12, C. Rosset6, M. Rowan-Robinson50, J. A. Rubino-Martın59,35, B. Rusholme51,J. Saarinen86, M. Sandri46, P. Savolainen1, D. Scott19, M. D. Seiffert64,12, A. Sievers55, A. Sillanpaa86, G. F. Smoot22,73,6, Y. Sotnikova84,
J.-L. Starck69,14, M. Stevenson79, F. Stivoli48, V. Stolyarov7, R. Sudiwala82, J.-F. Sygnet54, L. Takalo86, J. Tammi1, J. A. Tauber38, L. Terenzi46,D. J. Thompson5, L. Toffolatti16, M. Tomasi30,47, M. Tornikoski1, J.-P. Torre53, G. Tosti62,28, A. Tramacere49, M. Tristram72, J. Tuovinen76,M. Turler49, M. Turunen1, G. Umana42, H. Ungerechts55, L. Valenziano46, E. Valtaoja86, J. Varis76, F. Verrecchia2, P. Vielva60, F. Villa46,
N. Vittorio33, B. D. Wandelt54,25, J. Wu67, D. Yvon14, A. Zacchei45, J. A. Zensus75, X. Zhou67, and A. Zonca24
(Affiliations can be found after the references)
Preprint online version: December 14, 2011
ABSTRACT
Spectral energy distributions (SEDs) and radio continuum spectra are presented for a northern sample of 104 extragalactic radio sources, basedon thePlanck Early Release Compact Source Catalogue (ERCSC) and simultaneous multifrequency data. The ninePlanck frequencies, from 30to 857 GHz, are complemented by a set of simultaneous observations ranging from radio to gamma-rays. This is the first extensive frequencycoverage in the radio and millimetre domains for an essentially complete sample of extragalactic radio sources, and it shows how the individualshocks, each in their own phase of development, shape the radio spectra as they move in the relativistic jet. The SEDs presented in this paper werefitted with second and third degree polynomials to estimate the frequencies of the synchrotron and inverse Compton (IC) peaks, and the spectralindices of low and high frequency radio data, including thePlanck ERCSC data, were calculated. SED modelling methods are discussed, with anemphasis on proper, physical modelling of the synchrotron bump using multiple components.Planck ERCSC data also suggest that the originalaccelerated electron energy spectrum could be much harder than commonly thought, with power-law index around 1.5 instead of the canonical2.5. The implications of this are discussed for the acceleration mechanisms effective in blazar shock. Furthermore in many cases thePlanck dataindicate that gamma-ray emission must originate in the sameshocks that produce the radio emission.
Key words. galaxies: active – BL Lacertae objects: general – quasars: general – radiation mechanisms: non-thermal – radio continuum: galaxies
⋆ Corresponding author: A. Lahteenmaki, [email protected]
1. Introduction
This paper is part of the first series of publications basedon measurements made with thePlanck1 satellite. Planck
1 Planck (http://www.esa.int/planck) is a project of the EuropeanSpace Agency (ESA) with instruments provided by two scientific con-
1

Planck Collaboration: SEDs and radio spectra of northern AGN
(Tauber et al. 2010; Planck Collaboration 2011a) is the third-generation space mission to measure the anisotropy of the cos-mic microwave background (CMB). It observes the sky in ninefrequency bands covering 30–857GHz with high sensitivityand angular resolution from 31′ to 5′. The Low FrequencyInstrument (LFI; Mandolesi et al. 2010; Bersanelli et al. 2010;Mennella et al. 2011) covers the 30, 44, and 70 GHz bands withamplifiers cooled to 20 K. The High Frequency Instrument (HFI;Lamarre et al. 2010; Planck HFI Core Team 2011a) covers the100, 143, 217, 353, 545, and 857 GHz bands with bolome-ters cooled to 0.1 K. Polarization is measured in all but thehighest two bands (Leahy et al. 2010; Rosset et al. 2010). Acombination of radiative cooling and three mechanical cool-ers produces the temperatures needed for the detectors and op-tics (Planck Collaboration 2011b). Two data processing centres(DPCs) check and calibrate the data and make maps of the sky(Planck HFI Core Team 2011b; Zacchei et al. 2011).Planck’ssensitivity, angular resolution, and frequency coverage make it apowerful instrument for Galactic and extragalactic astrophysicsas well as cosmology.
The paper uses data from thePlanck Early Release CompactSource Catalogue (ERCSC; Planck Collaboration 2011c). TheERCSC provides positions and flux densities of compact sourcesfound in each of the ninePlanck frequency maps. The flux densi-ties are calculated using aperture photometry, with careful mod-elling of Planck’s elliptical beams. The ERCSC includes datafrom the first all-sky survey, taken between 13 August 2009 and6 June 2010. This unique dataset offers the first glimpse of thepreviously unmapped millimetre and sub-millimetre sky. Itisused here to create spectral energy distributions of 104 radio-bright, northern active galactic nuclei (AGN), with the mostcomplete coverage in the radio to sub-millimetre frequencies todate.
Radio-loud AGN host jets of relativistic matter emanat-ing symmetrically from the core. These jets produce copiousamounts of non-thermal radiation, which dominates the spec-tral energy distributions (SEDs) of such sources compared withany thermal emission from the nucleus, i.e., the accretion disk.The SEDs typically consist of two broad-band bumps, the oneat lower frequencies attributed to synchrotron radiation,and theother at higher frequencies attributed to inverse Compton (IC)radiation. The peak frequencies of the two bumps vary fromone object to another. The peak of the synchrotron componentcan be between the infrared and X-ray domains, and the ICpeak can range from MeV to GeV energies. The sequence inthe peak frequencies of the emitted energy, and the factors thatcreate it, have been a hot topic in blazar research for morethan a decade (e.g., Fossati et al. 1997; Ghisellini et al. 1998;Padovani 2007; Ghisellini & Tavecchio 2008; Nieppola et al.2008; Ghisellini & Tavecchio 2008; Sambruna et al. 2010).
Research on blazar SEDs has concentrated on two ap-proaches. The first is fitting the SED with a simple function,usually a second or third order polynomial, to obtain the pivotalpeak frequencies and luminosities of the radiation components ina straightforward manner. This approach is typically used whenstudying large samples (Fossati et al. 1998; Nieppola et al.2006;Sambruna et al. 2006; Nieppola et al. 2008; Abdo et al. 2010a).The second approach is detailed modelling of the SED, startingwith the definition of initial parameters such as electron energy,
sortia funded by ESA member states (in particular the lead countriesFrance and Italy), with contributions from NASA (USA) and telescopereflectors provided by a collaboration between ESA and a scientific con-sortium led and funded by Denmark.
magnetic field intensity, and Doppler factor. This method ismoretime-consuming and is used mostly for individual sources (e.g.,Acciari et al. 2010; Collmar et al. 2010). The standard modelisa leptonic, homogeneous, one-zone model, where the emissionoriginates in a single component (for a review of the blazar emis-sion models, see Bottcher 2010). One-zone models are useful asfirst-order approximations, but, in reality, AGN jets are rarely, ifever, dominated by a single source of radiation. The material inthe jets flows through shocks in the jet, which locally enhancethe radiation (the “shock-in-jet” model; Marscher & Gear 1985;Valtaoja et al. 1992). There can be several of these shocks inthejet simultaneously, and adding these to the emission of the quies-cent jet, we have several radiation components. Therefore,ide-ally, the SEDs and radio spectra should be modelled with morethan one component. Such modelling is also necessary for theproper identification of the high frequency (IC) emission sites.
In this paper we use the nearly complete SEDs and well-covered radio spectra provided byPlanck to look for signs ofthese multiple components contributing to the total radiation thatwe observe. The paper is structured as follows. In Sects. 2 and 3we introduce our sample and summarize the multifrequency dataused in our study. The spectral energy distributions and radiospectra are discussed in Sects. 4 and 5, and their modelling isdescribed in Sect. 6. In Sect. 7 we discuss the implications of ourresults for understanding the acceleration mechanisms in blazarjets, and in Sect. 8 we summarize our conclusions. Throughoutthe paper we adopt the sign convention for spectral index,α:S ν ∝ να. The errors of numerical values marked with a plus–minus sign correspond to one standard deviation.
2. The sample
The complete sample presented in this paper consists of 104northern and equatorial radio-loud AGN. It includes all AGNwith declination≥ −10◦ that have a measured average radio fluxdensity at 37 GHz exceeding 1 Jy. Most of the sample sourceshave been monitored at Metsahovi Radio Observatory for manyyears, and the brightest sources have been observed for up to30 years. The sample can be divided into subclasses as fol-lows: 33 high-polarization quasars (HPQs), 21 low-polarizationquasars (LPQs), 21 BL Lacertae objects (BLOs), 19 normalquasars (QSOs), 9 radio galaxies (GALs), and one unclassi-fied source (J184915+67064). (See, for example, Hovatta et al.(2008, 2009) for additional information on the classification.) Byhigh-polarized quasars we mean objects which have a measuredoptical polarization≥ 3% at some epoch, while low-polarizedquasars have a polarization≤ 3%. Normal quasars have no po-larization measured, so they could be either HPQs or LPQs.Radio galaxies are non-quasar AGN. The full sample is listedin Table 1. Columns 1 and 2 give the name and J2000 name forthe source, and for some sources an alternative name is giveninCol. 3. The coordinates of the sources are given in Cols. 4 and5. The start dates of thePlanck scans are listed in Cols. 6 and 7.The average 37 GHz flux density from Metsahovi observationsis given in Col. 8. For Col. 9 onwards, see Sect. 4.
3. Multifrequency data
The core of our data set is thePlanck ERCSC. The con-struction and contents of the catalogue are described inPlanck Collaboration (2011c). For most sources, the ERCSCflux density values are averages of two scans, separated by aboutsix months. To enable extensive multifrequency studies with a
2

Planck Collaboration: SEDs and radio spectra of northern AGN
simultaneous data set, thePlanck Extragalactic Working Grouphas coordinated a programme in which ground-based and space-borne telescopes observe the sources in unison withPlanck. Inthis paper we present SEDs based on the averaged ERCSC fluxdensities and on multifrequency supporting observations takenwithin two weeks of thePlanck scans. In a later paper we willpresent single-epoch SEDs, constructed from all the availablePlanck and supplementary simultaneous multifrequency data.This collaborative programme includes 12 observatories aroundthe world (Table 2). Archival data have been obtained fromthe literature and from the the search tool at the ASI (AgenziaSpaziale Italiana) Science Data Center (ASDC) web page2.
3.1. Radio and submillimetre data
Centimetre-band observations were obtained with the Universityof Michigan Radio Astronomy Observatory’s (UMRAO) 26-m prime focus paraboloid equipped with radiometers operatingat central frequencies of 4.8, 8.0, and 14.5 GHz. Observationsat all three frequencies employed rotating polarimeter systemspermitting both total flux density and linear polarization to bemeasured. A typical measurement consisted of 8–16 individ-ual measurements over a 20–40 min period. Frequent drift scanswere made across stronger sources to verify the telescope point-ing correction curves, and observations of programme sourceswere intermixed with observations of a grid of calibrator sourcesto correct for temporal changes in the antenna aperture effi-ciency. The flux scale was based on observations of Cassiopeia A(Baars et al. 1977). Details of the calibration and analysistech-niques are described in Aller et al. (1985).
Six-frequency broadband radio spectra were obtained withthe RATAN-600 radio telescope in transit mode by observing si-multaneously at 1.1, 2.3, 4.8, 7.7, 11.2, and 21.7 GHz (Parijskij1993; Berlin & Friedman 1996). The parameters of the receiversare listed in Table 3, whereνc is the central frequency,∆ν is thebandwidth,∆T is the sensitivity of the radiometer over a 1 s in-tegration,Tphys is the physical temperature of the front-end am-plifier, andTsys is the noise temperature of the whole system atthe given frequency. Data were reduced using the RATAN stan-dard softwareFADPS (Flexible Astronomical Data ProcessingSystem) reduction package (Verkhodanov 1997). The flux den-sity measurement procedure at RATAN-600 is described byAliakberov et al. (1985).
The 37 GHz observations were made with the 13.7-mMetsahovi radio telescope using a 1 GHz bandwidth, dual-beamreceiver centred at 36.8 GHz. The observations were ON–ONobservations, alternating the source and the sky in each feedhorn. The integration time used to obtain each flux density datapoint typically ranged from 1200 to 1400 s. The detection limitof the telescope at 37 GHz is∼ 0.2 Jy under optimal conditions.Data points with a signal-to-noise ratio less than four werehan-dled as non-detections. The flux density scale was set by obser-vations of DR 21. Sources NGC 7027, 3C 274, and 3C 84 wereused as secondary calibrators. A detailed description of the datareduction and analysis is given in Terasranta et al. (1998). Theerror estimate in the flux density includes the contributionfromthe measurement rms and the uncertainty of the absolute calibra-tion.
Quasi-simultaneous centimetre/millimetre radio spectra fora large number ofPlanck blazars have been obtained withinthe framework of a Fermi-GST related monitoring pro-gramme of gamma-ray blazars (the F-GAMMA programme,
2 http://www.asdc.asi.it
Fuhrmann et al. 2007; Angelakis et al. 2008). The frequencyrange spans 2.64 GHz to 142 GHz using the Effelsberg 100-m and IRAM 30-m telescopes. The Effelsberg measurementswere conducted with the secondary focus heterodyne receivers at2.64, 4.85, 8.35, 10.45, 14.60, 23.05, 32.00, and 43.00 GHz.Theobservations were performed quasi-simultaneously with cross-scans, i.e., slewing over the source position in the azimuthandelevation directions, with an adaptive number of sub-scansforreaching the desired sensitivity (for details, see Fuhrmann et al.2008; Angelakis et al. 2008). Pointing offset correction, gaincorrection, atmospheric opacity correction, and sensitivity cor-rection have been applied to the data.
The Institut de Radioastronomie Millimetrique (IRAM) ob-servations were carried out with calibrated cross-scans using theEMIR horizontal and vertical polarisation receivers operating at86.2 and 142.3GHz. The opacity-corrected intensities werecon-verted to the standard temperature scale and corrected for smallremaining pointing offsets and systematic gain-elevation effects.The conversion to the standard flux-density scale was done us-ing the instantaneous conversion factors derived from frequentlyobserved primary calibrators (Mars, Uranus) and secondarycal-ibrators (W3(OH), K3-50A, NGC 7027). From this programme,radio spectra measured quasi-simultaneously with thePlanckobservations have been collected for a total of 37Planck blazarsduring the period August 2009 to June 2010.
Many of the sources in the sample were monitored at15 GHz using the 40-m telescope of the Owens Valley RadioObservatory (OVRO) as part of a larger monitoring programme(Richards et al. 2011). The flux density of each source wasmeasured approximately twice weekly, with occasional gapsdue to poor weather or instrumental problems. The telescopeis equipped with a cooled receiver installed at prime focus,with two symmetric off-axis corrugated horn feeds sensitive toleft circular polarization. The telescope and receiver combina-tion produces a pair of approximately Gaussian beams (157′′
FWHM), separated in azimuth by 12.′95. The receiver has a cen-tre frequency of 15.0 GHz, a 3.0 GHz bandwidth, and a noise-equivalent reception bandwidth of 2.5 GHz. Measurements weremade using a Dicke-switched dual-beam system, with a secondlevel of switching in azimuth to alternate source and sky in eachof the two horns. Calibration was referred to 3C 286, for which aflux density of 3.44 Jy at 15 GHz is assumed (Baars et al. 1977).Details of the observations, calibration, and analysis aregivenby Richards et al. (2011).
The Very Large Array (VLA) and (since spring 2010) theExpanded VLA also observed a subset of the sources as simulta-neously as possible. Most of the VLA and EVLA runs were brief1–2 hour blocks of time. In a one-hour block of time, in additionto flux calibrators and phase calibrators, typically 5–8Plancksources were observed. In many cases, VLA flux density andphase calibrators were themselves of interest, since they werebright enough to be detected byPlanck. For these bright sources,the integration times could be extremely short. At 4.86 GHz and8.46 GHz, each target was observed for approximately 30 s. Theintegration times were typically 100 s at 22.46GHz and 120 sat 43.34GHz. All VLA/EVLA flux density measurements werecalibrated using standard values for one or both of the primarycalibrator sources used by NRAO (3C 48 or 3C 286), and theuvdata were flagged, calibrated and imaged using standard NRAOsoftware,AIPS or CASA. The VLA and EVLA were in differentconfigurations at different times in the several months durationof the observations. As a consequence, the angular resolutionchanged. In addition, for a given configuration, the resolutionwas much finer at higher frequencies. For that reason, sources
3

Planck Collaboration: SEDs and radio spectra of northern AGN
Table 2. Optical and radio observatories that participated in thePlanck multifrequency campaigns
RadioObservatory Frequencies [GHz]APEX, Chile 345ATCA, Australia 4.5 – 40Effelsberg, Germany 2.64 – 43IRAM Pico Veleta, Spain 86, 142Medicina, Italy 5, 8.3Metsahovi, Finland 37OVRO, USA 15RATAN-600, Russia 1.1, 2.3, 4.8, 7.7, 11.2, 21.7UMRAO 4.8, 8.0, 14.5VLA, USA 5, 8, 22, 43
OpticalObservatory BandKVA, Spain RXinglong, China i
Table 3. Parameters for the RATAN-600 receivers.
fc [GHz] ∆ f [GHz] ∆T [mK] Tphys [K] Tsys [K]
21.7 2.5 3.5 15 7711.2 1.4 3 15 657.7 1.0 3 15 624.8 0.9 2.2 15 392.3 0.4 8 310 951.1 0.12 15 310 105
that showed signs of resolution in any VLA configuration or atany VLA frequency have been carefully flagged.
The Planck-ATCA Co-eval Observations (PACO) project(Massardi et al. 2011a) consists of observations of a compila-tion of sources selected in the Australia Telescope 20 GHz sur-vey (AT20G; Massardi et al. 2011b) taken with the AustraliaTelescope Compact Array (ATCA) in the frequency range 4.5–40 GHz. The observations were carried out at several epochsclose in time withPlanck satellite observations covering July2009 – August 2010. The PACO sample is a complete, flux-density limited, and spectrally-selected sample over the wholesouthern sky, with the exception of the region with Galacticlat-itude |b| < 5◦.
The Simultaneous MedicinaPlanck Experiment (SiMPlE;Procopio et al. 2011) uses the 32-m Medicina single-dish an-tenna at 5 and 8.3 GHz to observe the 263 sources of theNew ExtragalacticWMAP Point Source (NEWPS) sample(Massardi et al. 2009) withδ > 0◦, and partially overlappingwith the PACO observations for−10◦ < δ < 0◦. The project be-gan in June 2010. Because of the lack of simultaneity with theERCSC, the data have been used here to match the PACO ob-servations in the overlapping region and to add informationforδ > 70◦, a region so far poorly covered at 5 GHz.
Twelve sources from our sample were observed in thesubmillimetre domain with the 12-m Atacama PathfinderEXperiment (APEX) in Chile. The observations were made us-ing the LABOCA bolometer array centred at 345 GHz. Datawere taken at two epochs in 2009: September 3–4 2009 andNovember 12 2009. The data were reduced using the script pack-ageminicrush3, version 30-Oct-2009, with Uranus used as cali-brator.
3 http://www.submm.caltech.edu/∼sharc/crush/
3.2. Optical data
The optical observations were made with the 35-cm KVA(Kungliga Vetenskapsakademien) telescope on La Palma,Canary islands. All observations were made through theR-bandfilter (λeff = 640 nm) using a Santa Barbara ST-8 CCD camerawith a gain factor of 2.3e−/ADU and readout noise of 14 elec-trons. The binning of pixels by 2× 2 pixels resulted in a platescale of 0.′′98 per pixel. We obtained three to six exposures of180 s per target. The images were reduced in the standard wayof subtracting the bias and dark frames and dividing by twilightflat-fields.
The flux densities of the target and three to five stars in thetarget field were measured with aperture photometry and themagnitude difference between the target and a primary referencestar in the same field was determined. Using differential modemakes the observations insensitive to variations in atmospherictransparency and accurate measurements can be obtained evenin partially cloudy conditions. TheR-band magnitude of theprimary reference star was determined from observations madeon photometric nights, using comparison stars in known blazarfields as calibrators (Fiorucci & Tosti 1996; Fiorucci et al.1998;Raiteri et al. 1998; Villata et al. 1998; Nilsson et al. 2007)andtaking into account the color term of theR-band filter employed.After theR-band magnitude of the primary reference star was de-termined, the object magnitudes were computed from the mag-nitude differences. At this phase we assumedV −R = 0.5 for thetargets. Several stars in the field were used to check the qualityof the photometry and stability of the primary reference. The un-certainties in the magnitudes include the contribution from bothmeasurement and calibration errors.
The monitoring at Xinglong Station, National AstronomicalObservatories of China, was performed with a 60/90-cm f/3Schmidt telescope. The telescope is equipped with a 4096×4096E2V CCD, which has a pixel size of 12µm and a spatial reso-
4

Planck Collaboration: SEDs and radio spectra of northern AGN
lution of 1.′′3 per pixel. The observations were made with anifilter. Its central wavelength and passband width are 668.5 and51.4 nm, respectively. The exposure times are mostly 120 s butcan range from 60 to 180 s, depending on weather and moonphase.
3.3. Swift
The Swift Gamma-Ray-Burst (GRB) Explorer (Gehrels et al.2004) is a multi-frequency space observatory devoted to thedis-covery and rapid follow up of GRBs. There are three instrumentson board the spacecraft: the UV and Optical Telescope (UVOT,Roming et al. 2005), the X-Ray Telescope (XRT, Burrows et al.2005) sensitive in the 0.3 − 10.0 keV band, and the Burst AlertTelescope (BAT, Barthelmy et al. 2005) sensitive in the 15 –150 keV band. Although the primary scientific goal of the satel-lite is the observation of GRBs, the wide frequency coverageisuseful for AGN studies because it covers the region where thetransition between synchrotron and inverse Compton emissionusually occurs.
When not engaged in GRB observations,Swift is availablefor target of opportunity (ToO) requests. TheSwift team de-cided to devote an average of three ToO per week to the si-multaneous observations ofPlanck AGN. The simultaneity ofSwift observations within two weeks to thePlanck first or sec-ond scan, or both, is shown in Table 4, marked sim1st, sim2nd,or sim 1st 2nd, respectively.
3.3.1. UVOT
Swift UVOT observations were carried out using the “filter ofthe day”, i.e., one of the lenticular filters (V, B, U, UVW1,UVM2, andUVW2), unless otherwise specified in the ToO re-quest. Therefore images are not always available for all filters.
The photometry analysis of all our sources was performedusing the standard UVOT software distributed within theHEAsoft 6.8.0 package, and the calibration included in the latestrelease of the “Calibration Database” (CALDB). A specific pro-cedure has been developed to process all the ToO observationsrequested by thePlanck project. Counts were extracted from anaperture of 5′′ radius for all filters and converted to flux densi-ties using the standard zero points (Poole et al. 2008). The fluxdensities were then de-reddened using the appropriate values ofE(B−V) for each source taken from Schlegel et al. (1998), withAλ/E(B − V) ratios calculated for UVOT filters using the meangalactic interstellar extinction curve from Fitzpatrick (1999). Novariability was detected within single exposures in any filter.
3.3.2. XRT
The XRT is usually operated in “Auto State” mode which auto-matically adjusts the CCD read-out mode to the source bright-ness, in an attempt to avoid pile-up (see Burrows et al. 2005;Hill et al. 2004 for details of the XRT observing modes). As aconsequence, part of the data sample was collected using themost sensitive Photon Counting (PC) mode while WindowedTiming (WT) mode was used for bright sources.
The XRT data were processed with theXRTDAS softwarepackage (v. 2.5.1, Capalbi et al. 2005) developed at the ASDCand distributed by the NASA High Energy Astrophysics ArchiveResearch Center (HEASARC) within theHEASoft package (v.6.9). Event files were calibrated and cleaned with standard filter-ing criteria with thexrtpipeline task, using the latest calibration
files available in the Swift CALDB. Events in the energy range0.3–10keV with grades 0–12 (PC mode) and 0–2 (WT mode)were used for the analysis.
Events for the spectral analysis were selected within a cir-cle of a 20-pixel (∼ 47′′) radius, centred on the source posi-tion, which encloses about 90% of the point spread function(PSF) at 1.5 keV (Moretti et al. 2005). For PC mode data, whenthe source count rate is above∼ 0.5 counts/s data are signifi-cantly affected by pile-up in the inner part of the PSF. For suchcases, after comparing the observed PSF profile with the analyt-ical model derived by Moretti et al. (2005), we removed pile-upeffects by excluding events detected within a certain inner radiusaround the source position, and used an outer radius of 30 pix-els. The value of the inner radius was evaluated individually foreach observation affected by pile-up, depending on the observedsource count rate.
Ancillary response files were generated with thexrtmkarftask applying corrections for the PSF losses and CCD defects.Source spectra were binned to ensure a minimum of 20 countsper bin to allow theχ2 minimization fitting technique to beused. We fitted the spectra adopting an absorbed power-lawmodel with photon indexΓx . When deviations from a singlepower-law model were found, we adopted a log-parabolic lawof the formF(E) = KE−(a+b log(E)) (Massaro et al. 2004) whichhas been shown to fit the X-ray spectrum of blazars well (e.g.,Giommi et al. 2005; Tramacere et al. 2009). This spectral modelis described by only two parameters:a, the photon index at1 keV, andb, the curvature of the parabola. For both modelsthe amount of hydrogen-equivalent column density (NH) wasfixed to the Galactic value along the line of sight (Kalberla et al.2005).
3.4. Fermi-LAT Observations and Data Analysis
The Large Area Telescope (LAT) onboardFermi is an electron-positron pair-conversion telescope sensitive to gamma-rays ofenergies from 20 MeV to above 300 GeV. TheFermi-LAT con-sists of a high-resolution silicon microstrip tracker, a CsI ho-doscopic electromagnetic calorimeter, and an anticoincidencedetector for charged particles background identification.A fulldescription of the instrument and its performance can be foundin Atwood et al. (2009). The large field of view (∼2.4 sr) allowsthe LAT to observe the full sky in survey mode every 3 hours.The LAT PSF strongly depends on both the energy and the con-version point in the tracker, but less on the incidence angle. For1 GeV normal incidence conversions in the upper section of thetracker, the PSF 68% containment radius is 0.6◦ .
The Fermi-LAT data considered for this analysis cover theperiod from 4 August 2008 to 4 November 2010. They have beenanalyzed using the standardFermi-LAT ScienceTools softwarepackage4 (version v9r16) and selecting for each source onlyphotons above 100 MeV, belonging to the diffuse class (Pass6V3 IRF, Atwood et al. 2009) which have the lowest backgroundcontamination. For each source, we selected only photons withina 15◦ region of interest (RoI) centred around the source itself.In order to avoid background contamination from the brightEarth limb, time intervals where the Earth entered the LAT Fieldof View (FoV) were excluded from the data sample. In addi-tion, we have excluded observations in which the source wasviewed at zenith angles larger than 105◦, where Earth’s albedogamma-rays increase the background contamination. The datawere analyzed with a binned maximum likelihood technique
4 http://fermi.gsfc.nasa.gov/ssc/data/analysis/documentation/Cicerone/
5

Planck Collaboration: SEDs and radio spectra of northern AGN
(Mattox et al. 1996) using the analysis software (gtlike) devel-oped by the LAT team5. A model accounting for the diffuseemission as well as the nearby gamma-ray sources is includedin the fit.
The diffuse foreground, including Galactic interstellar emis-sion, extragalactic gamma-ray emission, and residual cos-mic ray (CR) background, has been modelled using themodels6 gll iem v02 for the Galactic diffuse emission andisotropic iem v02 for the extra-galactic isotropic emission. Eachsource has been fit with a power law function
dNdE=
N(γ + 1)Eγ
Eγ+1max− Eγ+1
min
(1)
where both the normalization factorN and the photon indexγare left free in the model fit. The model also includes all thesources within a 20◦ RoI included in theFermi-LAT one yearcatalogue (Abdo et al. 2010b), modelled using power law func-tions. If a source included in the model is a pulsar belongingtothe Fermi pulsar catalog (Abdo et al. 2010d), we have modelledthe source using a power-law with exponential cut-off and thespectral parameters from the pulsar catalogue. For the evaluationof the gamma-ray SEDs, the whole energy range from 100 MeVto 300 GeV is divided into two equal logarithmically spaced binsper decade. In each energy bin the standardgtlike binned anal-ysis has been applied assuming for all the point sources in themodel a power law spectrum with photon index fixed to−2.0.Assuming that in each energy bin the spectral shape can be ap-proximated by a power law, the flux density of the source in allselected energy bins was evaluated, requiring in each energy bina test statistic (TS)7 greater than 10. If the TS is lower than 10, anupper limit is evaluated in that energy bin. Only statistical errorsfor the fit parameters are shown in the plots. Systematic effectsare mainly based on uncertainties in the LAT effective area de-rived from the on-orbit estimations, and are<5% near 1 GeV,10% below 0.10 GeV, and 20% above 10 GeV.
The LAT gamma-ray spectra of all AGN detected by Fermiare studied in Abdo et al. (2010c), based on 11 months ofFermi-LAT data. For this paper, we derived the gamma-ray SEDsof the 104 sources in the sample in three time intervals, pre-sented in Table 4. In the first interval theFermi-LAT observa-tions are simultaneous to thePlanck first or second scan, or both,within two weeks (marked sim1st, sim2nd, or sim1st 2nd inTable 4). TheFermi-LAT data have in this case been integratedover two weeks. In the second interval the gamma-ray data arequasi-simultaneous to thePlanck first or second scan, or both,having been integrated over two months (2M1st, 2M 2nd, or2M 1st 2nd in Table 4). In the third interval are sources forwhich Fermi-LAT data have been averaged over 27 months dueto their faintness (27m in Table 4).
Note that eight sources (0306+102, 0355+508, 0804+499,0945+408, J1130+3815, 1413+135, 1928+738, 2005+403) thatappear as significant gamma-ray detections in the 27 monthdataset presented in this work, have not been included in anyFermi catalogue published so far (Abdo et al. 2010b). They canbe considered new gamma-ray emitting sources, taking into ac-
5 http://fermi.gsfc.nasa.gov/ssc/data/analysis/documentation/Cicerone/CiceroneLikelihood
6 http://fermi.gsfc.nasa.gov/ssc/data/access/lat/BackgroundModels.html
7 The test statistic (TS) is defined as TS= −2 ln(L0/L1) with L0 thelikelihood of the null-hypothesis model as compared to the likelihoodof a competitive model,L1
count the possibility that their association with the radiosourceis purely spatial.
4. Spectral energy distributions
The SEDs for the whole sample are shown in Figs. 18 –121 (inpanels on the left). ThePlanck measurements and the simulta-neous auxiliary data are indicated by red circles. The grey pointsrepresent archival data obtained from the literature and using theASDC search tool. The measurements were regarded as simul-taneous if they were taken within two weeks (for radio frequen-cies) or five days (for optical and higher energies) of thePlanckmeasurement. Previous studies of the radio variability of blazars(Hovatta et al. 2008; Nieppola et al. 2009) have shown that thetwo-week simultaneity limit is appropriate, as large-scale radioflux-density changes on that timescale are quite rare. The SEDswere fitted with second and third degree polynomials, namely
logνFν = c1(logν)2 + c2(logν) + c3, (2)
and
logνFν = c4(logν)3 + c5(logν)2 + c6(logν) + c7, (3)
whereci (i = 1 . . .7) are fit parameters. We calculated the peakfrequencies of the components from the third degree fit by de-fault and used the second degree fit only if it seemed by visualin-spection to be more accurate. Typically, in these cases, thethirddegree fit would not yield a sensible result at all. In the SEDsinFigs. 18 –121, third degree fits are marked with a dashed line,second degree fits with a dotted line.
The fits were divided into two classes, A and B, accordingto the fit quality, A being superior. We emphasize that this divi-sion is the subjective view of the authors, and is only meant toillustrate the varying quality of the SED fits. The classes havenot been used in calculating the correlation coefficients (see be-low). We were able to obtain meaningful synchrotron fits for 60sources (15 class A fits), and IC fits for 30 sources (10 classA fits). For 21 sources we were able to fit both components.The synchrotron and IC peak frequencies are listed in Table 1.Columns 9 and 10 give the peak frequency and the fit quality forthe synchrotron component, and Cols. 11 and 12 give the peakfrequency and the fit quality for the inverse Compton compo-nent.
Figure 1 shows the distributions of the logarithms of the peakfrequencies. The synchrotron peak frequencies, logνSp, are typi-cally very low, as we are dealing with bright radio sources. Theyrange over two orders of magnitude, from 12.2 to 14.3, the av-erage of the distribution being 13.2 ± 0.5. The source with thehighestνSp in the near-ultraviolet domain is 0716+714. The ICpeak frequencies, logνICp , range over three orders of magnitude,from MeV to the high GeV gamma-ray region. The distributionaverage is 22.0± 0.9. The source with the highest IC peak fre-quency is 1156+295, with logνICp = 23.5. The source with thelowest IC peak frequency, with logνICp = 20.5, is 0836+710.
We have plotted the interdependence of the component peaksin Fig. 2. The two peak frequencies seem to have no significantcorrelation, which is confirmed by the Spearman rank correla-tion test (ρ = 0.301,P = 0.092, both class fits included). Thereis, however, a tendency for the sources with highνSp to have ahigh νICp . In the synchrotron-self-Compton (SSC) scenario, theseparation of the component peaks depends on many factors,such as the electron Lorentz factors, magnetic field strengths,and particle densities. Therefore the lack of correlation as such
6

Planck Collaboration: SEDs and radio spectra of northern AGN
Fig. 1. The distributions of the synchrotron (top panel) and IC(bottom panel) peak frequencies.
does not allow any strong statements to be made about the originof the IC radiation (SSC, or external Compton, EC).
We also compared our peak frequencies with those ofAbdo et al. (2010a). These comparisons are illustrated in Fig. 3,where the one-to-one correspondence is shown with a dashedline. Both correlations are significant according to the Spearmantest (ρ = 0.629, P = 0.003 for the synchrotron peaks andρ = 0.660,P = 0.010 for the IC ones).
5. Radio spectra
In addition to the spectral energy distributions, we have plottedthe standard radio spectra for the sample sources. The aim wasto look for signs of multiple components contributing to thesyn-chrotron emission. The spectra are shown in Figs. 18–121 (inpanels on the right). Red circles indicate low frequency (LF; ≤70 GHz) data simultaneous toPlanck, red stars indicate ERCSCLFI data, blue circles indicate high frequency (HF;> 70 GHz)data simultaneous toPlanck, and blue stars indicate ERCSC HFIdata. As can be seen, thePlanck data and the supporting multi-frequency data provide an excellent opportunity to find the sig-natures of possible multiple components or anomalous spectralshapes. A statistical study of extragalactic radio sourcesin the
Fig. 2. The correlation of the peak frequencies of the synchrotronand the IC components. Solid circles denote class A fits, andopen circles class B fits.
Fig. 3. Comparison between our synchrotron and IC peak fre-quencies and those of Abdo et al. (2010a). The synchrotron peakfrequencies are shown in the top panel and IC peak frequenciesin the bottom panel. The dashed lines illustrate the one-to-onecorrespondence. Solid circles denote class A fits, and open cir-cles class B fits.
7

Planck Collaboration: SEDs and radio spectra of northern AGN
ERCSC is presented in Planck Collaboration (2011i), and SEDsof extreme radio sources, such as Gigahertz-Peaked Spectrum(GPS) sources in Planck Collaboration (2011j).
In Figs. 4 and 5 we have plotted the distributions of the LFand HF spectral indices using only the Planck data for the latter.When plotting the HFα values, we have only taken into accountthose sources with three or more data points. This leaves us with84 sources out of the 104. The sources with only onePlanckscan are shown hatched in Figs. 4 and 5. Figure 6 showsαLFversusαHF. As expected, the LF indices are fairly flat, with anaverage of−0.06. Their distribution is narrow, with 91% of theindices being in the rangeαLF = −0.5–0.5. There are a coupleof sources with remarkably steep LF spectra, namely 0552+398and 2021+614, both havingαLF ≤ −0.8. At the other end wehave 0007+106 which has an inverted spectrum withαLF = 0.86.Also 1228+126 has a steep spectrum, although the fit value maybe exaggerated in this case (see Fig. 75). For clarity, this sourcehas been omitted from Figs. 4 and 6.
The HF indices are concentrated around−0.5, having an av-erage of−0.56. Rather similar distributions for LF and HF spec-tral indices were found in Planck Collaboration (2011i), espe-cially in their Fig. 7. However, a large part of theαHF distribu-tion is in the flat domain withαHF ≥ −0.5. Extreme examples are1413+135 (αHF = 0.02) and 0954+658 (αHF = 0.34). It is unex-pected that the spectral indices of blazars at sub-millimetre andFIR frequencies should be this flat. Only 28 of the 84 sourceswith HF spectral fits shown in Figs. 18–121 haveα < −0.7,the “canonical” value for optically thin spectra, correspondingto an electron energy indexs of about 2.4. This has two possibleexplanations: either the total HF spectra are defined by severalunderlying components, or the energy spectrum of the electronpopulation producing the radiation is much harder than generallyassumed. Although some HF spectra show evidence for severalsub-components or even an upturn at the highest frequencies,many others appear to be perfectly straight and therefore per-haps originate from a single optically thin component. At thehighestPlanck frequencies the lifetimes of radiating electronsare short, and one would in most cases expect to see the opti-cally thin spectra steepened by energy losses, with indicesrang-ing from the originalαthin to αthin − 0.5 and beyond. This makesspectral indices> −0.7 even more remarkable.
To rule out contamination by dust in the host galaxies, wehave estimated the possible contribution of an extremely brightsubmillimetre galaxy. We also estimated the flux densities of2251+158 at several submillimetre bands in the case its lumi-nosity were similar to the submillimetre galaxy. The compari-son shows that if the dust component in 2251+158 were of thesame brightness as in the extremely bright submillimetre galaxy,its emission would be completely swamped by the non-thermalemission from the jet. The LF and HF spectral indices havebeen calculated using ERCSC data which for most sources isan average of twoPlanck scans separated by about six months.However, the HF spectral index distribution for the sourcesthathave been observed only once byPlanck is quite similar to thatof the whole sample. The implications of this result are discussedin more detail in Sect. 7.
As Fig. 6 shows, BLOs, HPQs and LPQs have differentαHFdistributions. In Table 5 we have listed the average spectral in-dices for both frequency ranges for all subgroups. The LF spec-tra of radio galaxies are very steep on average, but the valueis greatly influenced by the uncertain fit of 1228+126. If thissource is left out of the calculations, the averageαLF for galax-ies is 0.10 ± 0.52. LPQs have the steepest spectra in the HFrange. However, the standard deviations of the samples are sub-
Table 5. Average spectral indices for AGN subclasses. The er-rors correspond to one standard deviation.
Class number LF number HF averageαLF averageαHF
BLO 21 20 −0.01± 0.25 −0.34± 0.26HPQ 33 28 −0.06± 0.22 −0.58± 0.27LPQ 21 18 −0.08± 0.30 −0.80± 0.27QSO 19 10 −0.05± 0.28 −0.57± 0.26GAL 9 7 −0.25± 0.66 −0.55± 0.19
−1.0 −0.5 0.0 0.5 1.0αLF
0
10
20
30
40
Num
ber
All (104) <αLF>= −0.07 ± 0.31single−scan (46) <αLF>= −0.06 ± 0.34
Fig. 4. Distribution of LF spectral indices for the whole sample(104 sources). The sources that have only been scanned once byPlanck are shown hatched (46 sources).
stantial, which can also be seen as the large scatter in Fig. 6.To quantify the possible differences between the AGN classes,we ran the Kruskal-Wallis ANOVA test. For the LF indices wecould find no significant differences. However, in the case of theHF indices, the distributions of the subgroups differ significantly(P < 0.001). Multiple-comparisons test with t distribution tellsus that LPQs differ from all other subgroups (P ≤ 0.031). Also,BLO indices have a different distribution from all quasar sub-groups (P ≤ 0.019).
6. Modelling the SEDs and spectra of blazars
Spectral energy distributions rapidly became one of the maintools for understanding blazar physics after the EGRET instru-ment aboard theCompton Gamma-ray Observatory (CGRO)satellite discovered strong gamma-ray emission from 3C 279(Hartman et al. 1992) and, subsequently, from a large numberofother radio-bright AGN. It was rapidly accepted that the double-peaked overall shape of the radio-to-gamma SED was due tosynchrotron and inverse Compton radiation, but beyond thistheagreement ended. The data simply lacked the sensitivity andthe time coverage to sufficiently constrain the models. Even themost detailed and convincing effort for 3C 279 (Hartman et al.2001) could be criticized for unrealistic physical assumptions(Lindfors et al. 2005).
With the coming of theFermi andSwift satellites, ground-based TeV telescopes, and other satellite data, the inverseCompton high-energy SED of a large number of AGN can nowbe determined with hugely improved accuracy and time cov-erage. This has initiated a new era of AGN modelling (e.g.,
8

Planck Collaboration: SEDs and radio spectra of northern AGN
−1.5 −1.0 −0.5 0.0 0.5αHF
0
5
10
15
20
25N
umbe
r
All (84) <αHF>= −0.56 ± 0.29single−scan (40) <αHF>= −0.59 ± 0.28
Fig. 5. Distribution of HF spectral indices for the 84 sources thathad three or more data points. The sources that have only beenscanned once byPlanck are shown hatched (40 sources).
−1.0 −0.5 0.0 0.5 1.0αLF
−1.5
−1.0
−0.5
0.0
0.5
α HF
HPQLPQQSOBLOGALUNK
Fig. 6. LF spectral indicesαLF versus HF spectral indicesαHFfor the various AGN subclasses.
Proceedings of the Workshop “Fermi meets Jansky: AGN inRadio and Gamma Rays”; Fermi meets Jansky 2010). However,since the IC spectrum is created by the relativistic electrons scat-tering either the synchrotron photons (SSC) or external photons(EC), accurate knowledge of the shape of the synchrotron com-ponent is essential for all realistic modelling. Here thePlanckdata are invaluable, since they provide the first simultaneousmultifrequency coverage of the crucial radio-to-IR part ofthesynchrotron spectrum.
However, most of the ERCSC data are not suitable for de-tailed modelling, since they are averages of two spectra takenabout six months apart. Considering the strong SED variabil-ity, accurate modelling can be done only with the finalPlanckdatasets and their several individual scans. Here we limit our-selves to a short discussion of howPlanck and supporting datacan be used to improve our understanding of blazar physics.
The basic picture of a blazar is well established: a blackhole surrounded by an accretion disk and a broad-line emit-
ting region (BLR), and a relativistic jet which produces thelower-frequency bump of the SED through synchrotron emis-sion. The jet is not totally stable; VLBI imaging shows hownew components, identified as relativistic shocks in the jet,emerge from the radio core at intervals ranging from monthsto years. These growing and decaying shocks are also respon-sible for the total flux density variations in the radio-to-IR,and at least partly also in the optical regime. The importantthing to note is that the synchrotron SED is rarely, if ever, theproduct of a single synchrotron-radiating component. The na-ture of the radio core is still being debated, as is the natureand the extent of the jet flow upstream of the radio core, be-tween it and the black hole (e.g., Marscher & Jorstad 2010;Marscher et al. 2010). Shocked jet models (Marscher & Gear1985; Hughes et al. 1989; Valtaoja et al. 1992) provide a goodaccount of the multifrequency variations in the total flux density.In the particular case of 3C 279, Lindfors et al. (2006) showedthat the optical variations can also be moderately well explainedas the higher-frequency part of the shock emission.
The origin of the IC component is a matter of intense de-bate. In theCGRO era, the favoured alternative was that thehigh-frequency radiation originates close to the black hole andthe accretion disk, inside the BLR and well upstream of the ra-dio core. With a strong radiation field external to the jet, exter-nal Compton is then likely to be the dominant emission mech-anism. A minority view was that at least a part of the gamma-ray flaring comes from much farther out, at or downstreamfrom the radio core. The evidence for this was that, statisti-cally speaking, strong gamma-ray flaring tended to occur af-ter the beginning of a millimetre flare (Valtaoja & Terasranta1996; Lahteenmaki & Valtaoja 2003) and after the ejectionofa new VLBI component (Jorstad et al. 2001). Occurring welloutside the BLR, SSC seems in this case to be the only vi-able emission mechanism, but on the other hand simple SSCmodels have generally failed to explain the gamma-ray emis-sion, requiring unrealistically low magnetic field strengths inother than the extreme TeV BL Lac objects. With newFermidata, the evidence for gamma-ray emission from the radio jethas strengthened (Kovalev et al. 2009; Pushkarev et al. 2010;Leon-Tavares et al. 2011; Nieppola et al. 2010; Tornikoskiet al.2010; Valtaoja et al. 2010), but the source of the upscattered pho-tons remains a puzzle.
Most of the attempts to model the high-energy bump haveadopted a “reverse engineering” method, starting from the sec-ondary IC SED and not from the primary synchrotron SED.The original electron energy spectrum is considered to be ratherfreely adjustable, with parameters chosen to produce a goodfitof the calculated IC spectrum to the observations within theas-sumed model. In most cases, the synchrotron spectrum is as-sumed to originate in a single homogeneous component, and of-ten the spectrum is adjusted only to the optical data, withoutany attempt to explain the radio-to-IR part of the SED. Thereis not much observational or theoretical evidence for the actualphysical existence of such an IR-to-optical component: it is sim-ply assumed to be there, because it can produce the observed ICspectrum.
To some extent such an approach is justifiable if the gamma-rays originate upstream of the radio core, and are thereforenotdirectly connected to the observed radio jet and shocks, andtheirlower-frequency synchrotron emission. However, even in thiscase physically more realistic models must take into account alsothe radio-to-IR part, for several reasons. First, whateverthe exactmechanism, the radio shocks also contribute to the IC spectrum,and their contribution must be accounted for in the model fits.
9

Planck Collaboration: SEDs and radio spectra of northern AGN
Assuming reasonable physical parameters, the shocks can quiteoften produce part or all of the observed X-ray emission throughthe SSC mechanism (e.g., Lindfors et al. 2006). Indeed, a stan-dard method for estimating the physical parameters of VLBIcomponents is to assume that the X-ray emission is producedthrough SSC (Ghisellini et al. 1993; Marscher 1987). Secondly,the components seen in the radio, especially in thePlanck HFIregime, contribute to the optical synchrotron emission, and thiscontribution must be subtracted from the putative IR-to-opticalcomponent, which, as explained above, in many models gener-ates the whole IC spectrum. For example, in the present sam-ple, at least 0235+164, 0917+449, 0954+658, 2227−088, andespecially 2251+158 show ongoing millimetre-to-submillimetreflaring, which leaves little room for any additional componentsbetween the highestPlanck frequencies and the optical. This isthe case in particular if the optically thin spectra are originallyvery flat, as we argue in Sects. 6.1 and 7.
On the other hand, if gamma-rays do come from the shocksat, or downstream from, the radio core, as increasing evidenceindicates, the obvious first step is to model the shocks them-selves and their spectra as accurately as possible usingPlanckand other radio data, and only after that attempt to calculate theIC radiation they produce.
Finally, it is clear that the more realistic multicomponentmodels, whatever their exact details, will give rather differentphysical parameter values than the single-component models. Asan example, if the X-ray emission and the gamma-ray emissionare not produced by a single component but by two (or evenmore) components, the derived electron energy spectral parame-ters will be quite different.
6.1. Some examples of different spectra and theirimplications
In this section we highlight five examples of different spectra ofERCSC sources which have been scanned only once byPlanckand therefore have true snapshot spectra presented in Figs.18–121. As stated before, our aim at this stage is not to model thesesources, but to draw attention to some features commonly seenin the spectral energy distributions, and to their implications forfuture multi-epoch modelling of thePlanck sources. We havefitted the radio-to-optical spectra with one or several standardself-absorbed sychrotron components (based on a power-lawas-sumption for the electron energy spectrum). These are not modelfits from a numerical, physical code (except for Figs. 16 and 17),but rather are meant to guide the eye and to illustrate the generalshape of the radio-to-optical spectra.
We also use support observations to address the behaviourof the five example sources. In Figs. 7–11 we have plotted the37 GHz long-term flux density curves for the five sources. Thelong-term data have been taken at Metsahovi Radio Observatory.
Even without numerical modelling we can address two im-portant topics with these sources. The first one is the spectralflatness of the optically thin radiation possibly hinting atnon-standard acceleration processes. The second one concerns theorigin of the IC component. As Figs. 12–17 show there does notappear to be room for additional synchrotron components be-tween thePlanck and the optical frequencies. The IC radiationmust therefore originate in the same shocks that also produce theradio emission, in contradiction to most theoretical models.
0234+285 (Fig. 12). This source was in a very uneventfulstate during thePlanck observing period (Fig. 7) and shows aspectrum typical of sources in a quiescent stage. The radio spec-trum can be modelled with a single synchrotron component, hav-
0
1
2
3
4
5
1990 1995 2000 2005 2010
Flu
x de
nsity
(Jy
)
Years
0234+285
0
1
2
3
4
2009.5 2010 2010.5
Flu
x de
nsity
(Jy
)
Years
0234+285
Fig. 7. The 37 GHz lightcurve of 0234+285, measured atMetsahovi Radio Observatory, showing continuous variability.The period whenPlanck was observing the source is indicatedby the hatched region in the lower panel, which is a blow-up ofthe last year.
Fig. 8. The 37 GHz lightcurve of 0235+164, details as in Fig. 7.
Fig. 9. The 37 GHz lightcurve of 1253−055 (3C 279), details asin Fig. 7.
10

Planck Collaboration: SEDs and radio spectra of northern AGN
Fig. 10. The 37 GHz lightcurve of 1413+135, details as in Fig. 7.
Fig. 11. The 37 GHz lightcurve of 2251+158 (3C 454.3), detailsas in Fig. 7.
ing αthin = −0.61, which apparently steepens by∆α = −0.5and smoothly joins the optical spectrum (see also Fig. 29). Thissynchrotron component can be identified with the latest signifi-cant flare (new shock), which peaked about two years earlier at37 GHz (Fig. 7). During low flux levels, in the absence of recentflares/shocks, the underlying, relatively stable jet may also con-tribute significantly to the synchrotron emission. Anothersimilarexample is the source 0007+106 (Fig. 19). Lacking mid-IR data,we cannot prove that there is no additional synchrotron compo-nent, between thePlanck frequencies and the optical, that mightbe the main source of the IC flux (Fig. 29). However, the moststraightforward interpretation of the data is that the IC flux alsocomes from the synchrotron component outlined in Fig. 12: froma rather old shock far downstream the jet, and far beyond theBLR.
0235+164 (Fig. 13). The bumpiness of the radio spectrumshows clear evidence of multiple components (shocks) con-tributing to the observed total flux density. We have outlined twopossible synchrotron components, which together could explainmost of the observed radio spectrum. Although 0235+164 wasrelatively quiescent during thePlanck observation (Fig. 8), therewere at least four strong flares during the previous five years, andthey all are likely to be still contributing significantly tothe totalradio flux density, at least around 1010 Hz and below. Assuming
reasonable physical parameters for these shocks, they can alsoproduce significant amounts of X-rays through the SSC mecha-nism, which must be accounted for in a proper multicomponentmodelling of the IC spectrum. As with 0234+285, the higher-turnover component withαthin = −0.4 can be joined smoothly tothe optical spectrum assuming a steepening by about∆α = −0.5,leaving no room for additional mid-IR components.Fermi mea-sured only upper limits for the gamma-ray flux, which may bedue to the fact that even the most recent shock, peaking around100 GHz, is already about two years old (Fig. 8).
1253−055 (3C 279). (Fig. 14). Again, the highest-peakingradio component withαthin = −0.6 can be made to smoothlyjoin the steep optical spectrum. From Fig. 14 it is rather obviousthat there can be no additional mid-IR components which mightprovide a significant contribution to the IC spectrum. If we as-sume that there is another synchrotron component turning oversomewhere above thePlanck frequencies and joining smoothlyto the optical spectrum, Fig. 14 shows that its flux density can-not exceed the dashed line at any IR frequency between 1012 and1014.5 Hz. This is the case even if we make the assumption thatthe spectrum of the component seen at the highestPlanck fre-quencies steepens very rapidly above 857 GHz. Consequently,theFermi gamma-rays must originate in the latest shock, whichstarted a few months before thePlanck observation (Fig. 9).
1413+135 (Fig. 15). This source exhibits a totally flat spec-trum, with both the LF and the HF spectral indices approxi-mately 0. Possible explanations are: an underlying electron en-ergy indexs ≈ 1, which is rather unlikely; the superpositionof many self-absorbed synchrotron components (shocks of var-ious ages) with different turnover frequencies; or a continuousjet dominating the flux and having an integrated spectral indexclose to zero over a wide frequency range. As Fig. 10 shows, thesource has been rather inactive for over a decade, with no ma-jor ourbursts. The HFI spectrum may indicate an upturn, hintingat the presence of an IR component. We show a possible spec-tral decomposition, including an IR-peaking component. FurtherPlanck observations are needed to ascertain the reality and thenature of this component, which may be either a synchrotronflare seen at an early developmental stage or, possibly, an in-frared dust component. The correct alternative can be identifiedthrough variability information.
2251+158 (3C 454.3). (Figs. 16 and 17). This source ex-hibits the most spectacular case of ongoing IR flaring, show-ing a very strong synchrotron component with a self-absorptionturnover at about 80 GHz and a very flat (α = −0.2) opticallythin spectrum. As Fig. 11 shows, a series of spectacular flar-ing events has occurred in 2251+158 during the last five years,with Planck observing the source during the early stages of thestrongest outburst ever seen in the source. In Fig. 16 we showa model fit to the radio-to-optical data, using a preliminaryver-sion of the code that we are developing (Tammi et al., in prepa-ration). A close-up of the fit in the radio regime is shown inFig. 17. As Fig. 119 also shows, it is impossible to squeeze inanother component between the strong radio-IR flare and theoptical regime. The gamma-ray emission must come from thegrowing shock that we see both in the total flux density monitor-ing curve (Fig. 11) and in the SED (Fig. 119). Most of the theo-retical model scenarios assume that gamma-rays originate closeto the black hole and the accretion disk, well within the BLR andfar upstream of the radio core. This is not a viable alternative for2251+158, in which gamma-rays must come from the new shockcomponent, parsecs downstream from the radio core. As Fig. 11shows, at the time of thePlanck observation the shock had al-ready been growing for about half a year, which, changed into
11

Planck Collaboration: SEDs and radio spectra of northern AGN
Fig. 12. A possible single-component spectrum for 0234+285 toillustrate the general shape. Red circles, LF data simultaneous toPlanck; blue circles, HF data simultaneous toPlanck.
Fig. 13. A possible multiple-component spectrum for 0235+164to illustrate the general shape. Symbols as in Fig. 12.
the source frame, translates into a distanceL = D2c(1+z)−1∆tobs(whereD is the Doppler boosting factor,c the speed of light,z the redshift, and∆tobs the time elapsed from the onset of theflare), of at least 10 pc down the jet, assuming a modest value ofD ≈ 10, or 90 pc using the value ofD = 33.2 from Hovatta et al.(2009). This is the distance that the shock has moved down-stream after emerging from the radio core.
7. The shape of the synchrotron spectrum:nonstandard acceleration mechanisms?
If the electron energy distribution is assumed to be a simplepower-law with the formN(E) = KE−s, the synchrotron spec-trum of a single homogeneous source has an optically thick low-frequency part with a spectral indexα = +2.5, a turnover, and anoptically thin part with a spectral indexα related to the electronenergy index byα = −(s − 1)/2. Energy losses eventually causethe spectrum to steepen toα − 0.5.
Fig. 14. The radio spectrum of 1253−055 shows that there is noroom for another component between radio and optical regimes.Symbols as in Fig. 12.
1413+135
1010 1011 1012 1013
ν (Hz)
0.1
1.0
F ν (
Jy)
Fig. 15. The radio spectrum of 1413+135 is very flat and can befitted with multiple components. Symbols as in Fig. 12.
Fig. 16. The radio-optical SED of 2251+158 (3C 454.3) fittedwith one component and synchrotron emission from the jet(dashed line) using a model by Tammi et al. (in preparation).The radio spectrum is shown in Fig. 17.
12

Planck Collaboration: SEDs and radio spectra of northern AGN
Fig. 17. A close-up of the radio spectrum and model fit of2251+158 (3C 454.3), details as in Fig. 16.
Since the earliest times of AGN research, the canonical valuefor α has been assumed to be about−0.75, corresponding tos =2.5. Such an electron energy index emerges naturally from thesimplest first-order Fermi acceleration mechanism, and blazarsalso tend to show slopes around this value at the high-frequency(10 to 100 GHz) end of the radio spectrum, where the sourcesare typically assumed to be optically thin. However,Planck datanow challenge this commonly accepted view. As Fig. 4 shows,the LF spectral slopes are, in the main, quite flat, and sometimeseven rising. It is likely that in most cases this results fromthesuperposition of several distinct synchrotron components, sincethe spectra are generally not smooth, and we also know fromVLBI observations that there are nearly always several compo-nents (shocks) present in any source (see also Sect. 6). The HFspectra (Fig. 5), on the other hand, are often straight within thePlanck flux density error bars, and give a definite impressionof optically thin radiation. In some cases, such as 2251+158,the spectrum even shows a clear self-absorption turnover athighfrequencies, followed by a flat optically thin part withα = −0.2(Figs. 16 and 17).
The flatness of the HF spectra, shown in Fig. 5, is remark-able. Only a third of the sources haveα steeper than−0.7, while15 haveα > −0.3. While the present data are not sufficient to ex-clude the possibility that multiple components produce theflat-ness, and some sources such as 0954+658 do show evidence ofan additional IR component (see also, e.g., Raiteri et al. 1999),we consider such an explanation unlikely for the whole sample.The errors inαHF cannot explain the very flat spectral indices,since they generally are smaller than∆α ≈ 0.1.
In Table 6 we list the 10 sources that fullfill the followingcriteria. They have been scanned only once byPlanck and theyhaveαHF > −0.5 + ∆α, where∆α is the HF spectral fit errorshown in Figs. 18 – 121. These form the most extreme end oftheαHF distribution shown in Fig. 5. Three of them may showindications of multiple HF components in the spectra, but for theseven other sources the HF spectra appear to be straight withinthe Planck errors. If this is indeed the case, they cannot be ex-plained with standard acceleration mechanisms withs ≥ 2.
The rise of a submillimetre flare is quite fast (see, for exam-ple, the JCMT monitoring data of Stevens et al. 1994); the self-absorption turnover of a fresh shock component passes throughthe Planck HFI frequencies rather rapidly, and one thereforesees it only rarely in the snapshot high frequency spectra. (Inthe present data only 2251+158 is clearly such a case, al-
Table 6. A list of the 10 sources scanned only once byPlanckand withαHF > −0.5+∆α. S= straight HF spectrum; B= bumpyHF spectrum, possibly indicating multiple components.
Source αHF Spectral shape
0003−066 −0.38± 0.09 S0059+581 −0.19± 0.09 S0235+164 −0.40± 0.03 S0430+052 −0.34± 0.05 S1308+326 −0.41± 0.08 B?1413+135 0.02± 0.12 B1418+546 −0.16± 0.04 S1652+398 −0.21± 0.04 B1823+568 −0.31± 0.13 S2251+158 −0.20± 0.02 S
though 0235+164 and 1652+398 might be others.) Instead, inmost cases we expect to see optically thin submillimetre spec-tra which have already experienced energy losses. Therefore theobserved high-frequency spectral-index distribution of asam-ple of sources should show a range fromαthin = −(s − 1)/2 toαthin−0.5 and beyond, as the exponential steepening sets in, withspectral indices steeper than the initialαthin dominating. The ob-served distribution in Fig. 5 is thus incompatible with an initialαthin around−0.7, as we should then see a few values aroundα = −0.7 and a distribution peaking towards−1.2, reflecting the∆α = −0.5 steepening due to energy losses.
Instead, the spectral index distribution is compatible with anelectron indexs ≈ 1.5, resulting in a distribution ofαthin hav-ing smallest values around−0.2 to−0.3 and a maximum around−0.7. Such a suggestion of a very hard original electron spec-trum is not entirely new; Valtaoja et al. (1988) studied the shockspectra and concluded thatα is around−0.2, and Hughes et al.(1991) also concluded that the flux density variations can bestbe modelled with very hard spectra. Gear et al. (1994) also foundthat submillimetre spectra in a sample of 48 sources tended to beflat. Indeed, the distribution they found (their figure 7) is quitesimilar to ours (Fig. 5).
As noted above, alternative explanations for theαHF distri-bution cannot be totally excluded. However, we consider sourcessuch as 2251+158 (Figs. 16 and 17) to be compelling evidencefor the existence of very hard non-standard electron spectra. Theimplications of this possibility are discussed below.
If the original αthin really is around−0.2, the distributionshown in Fig. 5 becomes easy to understand: in many slightlyolder HFI components we see the expected spectral steepeningfrom−0.2 to−0.7 and beyond. One way to test this hypothesis isto try to estimate the ages of the highest-frequency spectral com-ponents, either from their turnover frequencies or from thetotalflux-density monitoring: the older the component, the lowertheturnover frequency and the steeper the spectra. However, thisanalysis is beyond the scope of this paper and reliable conclu-sions require morePlanck data than presently exist.
An electron energy spectral index as hard as 1.5 has ma-jor implications for the acceleration mechanisms dominating inblazar shocks. Particle acceleration efficiency is strongly gov-erned by the compression ratio of the flow, which in turn is con-fined by well-known plasma physics, preventing the spectralin-dex from becoming arbitrarily small. For a relativistic shock thetraditional first-order Fermi mechanism usually produces spec-tral indices of 2.2 or so (and not 2.5, which follows from thenonrelativistic theory), but not smaller. There are a few options,however, for bypassing thes ≈ 2.2 limit. For example, power-
13

Planck Collaboration: SEDs and radio spectra of northern AGN
law spectra withs & 1 have been found in certain kinds ofoblique shocks (e.g., Kirk & Heavens 1989), as well as in par-allel shocks in the case of large-angle particle scatteringdueto very strong turbulence (e.g., Stecker et al. 2007), or whenthe compression ratio felt by the particles is higher than thatfelt by the plasma (Ellison et al. 1990; Virtanen & Vainio 2005).The last alternative is an especially interesting one, becausethe combination of low density and relatively strong magneticfield—conditions likely to be found in Poynting-flux-dominatedAGN jets—quickly leads to non-negligible Alfven speeds andenhancement of the compression ratio felt by the particles and,consequently, to very hard particle spectra (Tammi 2008a,b, andreferences therein). High Alfven speeds and scattering centresthat are not frozen into the plasma also enablesecond-orderFermi acceleration, which can produce power-law spectra evenwith s < 1 in relativistic parallel shocks (Virtanen & Vainio2005) and can work on time-scales comparable to the fastestblazar flares (Tammi & Duffy 2009).
As a simple order-of-magnitude reality check we can esti-mate the conditions required by the standard first-order accel-eration in a parallel step shock in the presence of an increasedscattering-centre compression ratio due to turbulence trans-mission (Vainio et al. 2003). Following the analysis of Tammi(2008b), we can estimate that in order to achieves ≈ 1.5 in ashock with Lorentz factorΓ = 10, magnetic field strength of theorder of 0.02–2Gauss (depending on the composition and thedensity of the plasma) is needed. This is in good agreement withthe usual modelling parameters of these sources, although weemphasise that the analysis used here is a simple one and maybe limited to parallel shocks and weak turbulence.
8. Conclusions
We have presented the averagedPlanck ERCSC spectra togetherwith supporting ground and satellite observations obtained si-multaneously with thePlanck scans. The 104 SEDs, supple-mented with archival data, demonstrate the usefulness ofPlanckdata in determining the SED peak frequencies and fluxes and inmodelling the spectral energy distributions in greater detail. Inparticular, the data demonstrate that the synchrotron spectrumcontains contributions from several physically distinct AGNcomponents: the LF and HF spectra are rarely smooth, except atthe highest radio frequencies where the source component withthe highest turnover becomes optically thin. The LF spectral in-dices cluster aroundα = 0, also indicating the superposition ofmany components with different turnover frequencies. In mod-elling the synchrotron and inverse-Compton SEDs, a multicom-ponent approach is therefore necessary. While physical mod-elling is beyond the scope of this paper, which uses averaged,rather than single-epoch,Planck ERCSC flux densities, we haveshown some examples of multicomponent decomposition of theSEDs and the conclusions that can be drawn from the data.
The sources display remarkable variability, which must alsobe taken into account in modelling the SEDs. We have presentedsome examples of total flux density monitoring to demonstratehow sources have been observed duringPlanck scans in differentstages of activity.
ThePlanck HFI spectra are remarkably flat, with only a mi-nority of sources having spectral indices steeper than the “canon-ical” α = −0.7, and many apparently havingαthin around−0.2to −0.4. We suggest that the most likely interpretation for thevery flat and straight synchrotron spectra observed byPlanck isa very hard original electron spectral energy index, clearly be-low s = 2. While this possiblity must be confirmed by future
data, an indexs = 1.5 is compatible with the HF spectral indexdistribution seen in our sample. In a number of sources, energylosses steepen the HF spectra by∆α = 0.5 from about−0.3 toabout−0.8, and further to−1 and beyond, which can explainthe observed distribution. The hardness of the electron spectrumwould also mean that the synchrotron SED peak is in most casesrelated to the maximum electron Lorentz factor achieved in theacceleration process. The hard spectra also require a rethinkingof the acceleration processes dominating in the relativistic jetsand shocks.
For some sources the HF spectra are flat or even rising, in-dicating the presence of multiple synchrotron-emitting compo-nents peaking in the gigahertz to terahertz regime, and ongo-ing flaring at still higher frequencies. However, in many casesthe Planck HFI spectrum appears to join the optical spec-trum smoothly, leaving little room for additional still higher-frequency components. In these cases, the inverse-Comptongamma-rays must originate in the synchrotron (i.e., shock)com-ponents seen in thePlanck data.
Acknowledgements. The Planck Collaboration acknowledges the support of:ESA; CNES and CNRS/INSU-IN2P3-INP (France); ASI, CNR, and INAF(Italy); NASA and DoE (USA); STFC and UKSA (UK); CSIC, MICINNandJA (Spain); Tekes, AoF and CSC (Finland); DLR and MPG (Germany); CSA(Canada); DTU Space (Denmark); SER/SSO (Switzerland); RCN (Norway);SFI (Ireland); FCT/MCTES (Portugal); and DEISA (EU). A description ofthe Planck Collaboration and a list of its members, indicating which tech-nical or scientific activities they have been involved in, can be found viahttp://www.rssd.esa.int/Planck. The Metsahovi and Tuorla observing projectsare supported by the Academy of Finland (grant numbers 212656, 210338,121148, 127740 and 122352). UMRAO is supported by a series ofgrants fromthe NSF and NASA, and by the University of Michigan. This publication ispartly based on data acquired with the Atacama Pathfinder Experiment (APEX).APEX is a collaboration between the Max-Planck-Institut f¨ur Radioastronomie,the European Southern Observatory, and the Onsala Space Observatory. Thisresearch is partly based on observations with the 100-m telescope of theMPIfR (Max-Planck-Institut fur Radioastronomie) at Effelsberg, the IRAM 30-m telescope, and the Medicina (Noto) telescope operated by INAF–Istitutodi Radioastronomia. This paper makes use of observations obtained at theVery Large Array (VLA) which is an instrument of the NationalRadioAstronomy Observatory (NRAO). The NRAO is a facility of the NationalScience Foundation operated under cooperative agreement by AssociatedUniversities, Inc. The observations at Xinglong station are supported by theChinese National Natural Science Foundation grants 10633020, 10778714, and11073032, and by the National Basic Research Program of China (973 Program)No. 2007CB815403. The OVRO 40-m monitoring program is supported inpart by NASA. The Australia Telescope is funded by the Commonwealth ofAustralia for operation as a National Facility managed by CSIRO. TheFermiLAT Collaboration acknowledges generous ongoing support from a numberof agencies and institutes that have supported both the development and theoperation of the LAT as well as scientific data analysis. These include theNational Aeronautics and Space Administration and the Department of Energyin the United States, the Commissariat a l’Energie Atomique and the CentreNational de la Recherche Scientifique/ Institut National de Physique Nucleaireet de Physique des Particules in France, the Agenzia Spaziale Italiana and theIstituto Nazionale di Fisica Nucleare in Italy, the Ministry of Education, Culture,Sports, Science and Technology (MEXT), High Energy Accelerator ResearchOrganization (KEK) and Japan Aerospace Exploration Agency(JAXA) in Japan,and the K. A. Wallenberg Foundation, the Swedish Research Council and theSwedish National Space Board in Sweden. Additional supportfor science anal-ysis during the operations phase is gratefully acknowledged from the IstitutoNazionale di Astrofisica in Italy and the Centre National d’Etudes Spatiales inFrance. Part of this work is based on archival data, softwareor on-line servicesprovided by the ASI Science Data Center ASDC. We thank theFermi LAT teamreviewers, S. Ciprini and M. Giroletti, for their effort and valuable comments.
ReferencesAbdo, A. A., Ackermann, M., Agudo, I., et al. 2010a, ApJ, 716,30Abdo, A. A., Ackermann, M., Ajello, M., et al. 2010b, ApJS, 188, 405Abdo, A. A., Ackermann, M., Ajello, M., et al. 2010c, ApJ, 715, 429Abdo, A. A., Ackermann, M., Ajello, M., et al. 2010d, ApJS, 187, 460Acciari, V. A., Aliu, E., Arlen, T., et al. 2010, ApJ, 715, L49
14

Planck Collaboration: SEDs and radio spectra of northern AGN
Aliakberov, K., Mingaliev, M., Naugol’naya, M., & et al. 1985, Astrophys.Issled. (Izvestiya SAO), 19, 60
Aller, H. D., Aller, M. F., Latimer, G. E., & Hodge, P. E. 1985,ApJS, 59, 513Angelakis, E., Fuhrmann, L., Marchili, N., Krichbaum, T. P., & Zensus, J. A.
2008, Mem. Soc. Astron. Italiana, 79, 1042Atwood, W. B., Abdo, A. A., Ackermann, M., et al. 2009, ApJ, 697, 1071Baars, J. W. M., Genzel, R., Pauliny-Toth, I. I. K., & Witzel,A. 1977, A&A, 61,
99Barthelmy, S. D., Barbier, L. M., Cummings, J. R., et al. 2005, Space Sci. Rev.,
120, 143Berlin, A. & Friedman, P. 1996, in 25th General Assembly of the International
Union of Radio Science, 750Bersanelli, M., Mandolesi, N., Butler, R. C., et al. 2010, A&A, 520, A4+Bottcher, M. 2010, ArXiv e-prints, 1006.5048Burrows, D. N., Hill, J. E., Nousek, J. A., et al. 2005, Space Sci. Rev., 120, 165Capalbi, M., Perri, M., Saija, B., Tamburelli, F., & Angelini, L. 2005, available
at http://heasarc.gsfc.nasa.gov/docs/swift/analysis/xrt swguidev1 2.pdfCollmar, W., Bottcher, M., Krichbaum, T. P., et al. 2010, A&A, 522, A66Ellison, D. C., Reynolds, S. P., & Jones, F. C. 1990, ApJ, 360,702Fermi meets Jansky. 2010, in Proceedings of the Workshop ”Fermi meets
Jansky: AGN in Radio and Gamma Rays”, ed. T. Savolainen, E. Ros, R. W.Porcas, & J. A. Zensus (Max-Planck-Institut fur Radioastronomie, Bonn,Germany)
Fiorucci, M. & Tosti, G. 1996, A&AS, 116, 403Fiorucci, M., Tosti, G., & Rizzi, N. 1998, PASP, 110, 105Fitzpatrick, E. L. 1999, PASP, 111, 63Fossati, G., Celotti, A., Ghisellini, G., & Maraschi, L. 1997, MNRAS, 289, 136Fossati, G., Maraschi, L., Celotti, A., Comastri, A., & Ghisellini, G. 1998,
MNRAS, 299, 433Fuhrmann, L., Krichbaum, T. P., Witzel, A., et al. 2008, A&A,490, 1019Fuhrmann, L., Zensus, J. A., Krichbaum, T. P., Angelakis, E., & Readhead,
A. C. S. 2007, in American Institute of Physics Conference Series, Vol. 921,The First GLAST Symposium, ed. S. Ritz, P. Michelson, & C. A. Meegan,249–251
Gear, W. K., Stevens, J. A., Hughes, D. H., et al. 1994, MNRAS,267, 167Gehrels, N., Chincarini, G., Giommi, P., et al. 2004, ApJ, 611, 1005Ghisellini, G., Celotti, A., Fossati, G., Maraschi, L., & Comastri, A. 1998,
MNRAS, 301, 451Ghisellini, G., Padovani, P., Celotti, A., & Maraschi, L. 1993, ApJ, 407, 65Ghisellini, G. & Tavecchio, F. 2008, MNRAS, 387, 1669Giommi, P., Piranomonte, S., Perri, M., & Padovani, P. 2005,A&A, 434, 385Hartman, R. C., Bertsch, D. L., Fichtel, C. E., et al. 1992, ApJ, 385, L1Hartman, R. C., Bottcher, M., Aldering, G., et al. 2001, ApJ, 553, 683Hill, J. E., Burrows, D. N., Nousek, J. A., et al. 2004, in Society of Photo-Optical
Instrumentation Engineers (SPIE) Conference Series, Vol.5165, Societyof Photo-Optical Instrumentation Engineers (SPIE) Conference Series, ed.K. A. Flanagan & O. H. W. Siegmund, 217–231
Hovatta, T., Nieppola, E., Tornikoski, M., et al. 2008, A&A,485, 51Hovatta, T., Valtaoja, E., Tornikoski, M., & Lahteenmaki, A. 2009, A&A, 494,
527Hughes, P. A., Aller, H. D., & Aller, M. F. 1989, ApJ, 341, 54Hughes, P. A., Aller, H. D., & Aller, M. F. 1991, ApJ, 374, 57Jorstad, S. G., Marscher, A. P., Mattox, J. R., et al. 2001, ApJ, 556, 738Kalberla, P. M. W., Burton, W. B., Hartmann, D., et al. 2005, A&A, 440, 775Kirk, J. G. & Heavens, A. F. 1989, MNRAS, 239, 995Kovalev, Y. Y., Aller, H. D., Aller, M. F., et al. 2009, ApJ, 696, L17Lahteenmaki, A. & Valtaoja, E. 2003, ApJ, 590, 95Lamarre, J., Puget, J., Ade, P. A. R., et al. 2010, A&A, 520, A9+
Leahy, J. P., Bersanelli, M., D’Arcangelo, O., et al. 2010, A&A, 520, A8+Leon-Tavares, J., Valtaoja, E., Tornikoski, M., Lahteenmaki, A., & Nieppola, E.
2011, ArXiv e-prints, arXiv:1102.1290Lindfors, E. J., Turler, M., Valtaoja, E., et al. 2006, A&A,456, 895Lindfors, E. J., Valtaoja, E., & Turler, M. 2005, A&A, 440, 845Mandolesi, N., Bersanelli, M., Butler, R. C., et al. 2010, A&A, 520, A3+Marscher, A. P. 1987, in Superluminal Radio Sources, ed. J. A. Zensus &
T. J. Pearson, 280–300Marscher, A. P. & Gear, W. K. 1985, ApJ, 298, 114Marscher, A. P. & Jorstad, S. G. 2010, ArXiv e-prints, 1005.5551Marscher, A. P., Jorstad, S. G., Larionov, V. M., et al. 2010,ApJ, 710, L126Massardi, M., Bonaldi, A., Bonavera, L., et al. 2011a, ArXive-prints, 1101.0225Massardi, M., Ekers, R. D., Murphy, T., et al. 2011b, MNRAS, 412, 318Massardi, M., Lopez-Caniego, M., Gonzalez-Nuevo, J., etal. 2009, MNRAS,
392, 733Massaro, E., Perri, M., Giommi, P., & Nesci, R. 2004, A&A, 413, 489Mattox, J. R., Bertsch, D. L., Chiang, J., et al. 1996, ApJ, 461, 396Mennella et al. 2011, Planck early results 03: First assessment of the
Low Frequency Instrument in-flight performance (Submittedto A&A,[arXiv:astro-ph/1101.2038])
Moretti, A., Campana, S., Mineo, T., et al. 2005, in Society of Photo-OpticalInstrumentation Engineers (SPIE) Conference Series, Vol.5898, Societyof Photo-Optical Instrumentation Engineers (SPIE) Conference Series, ed.O. H. W. Siegmund, 360–368
Nieppola, E., Hovatta, T., Tornikoski, M., et al. 2009, AJ, 137, 5022Nieppola, E., Tornikoski, M., & Valtaoja, E. 2006, A&A, 445,441Nieppola, E., Tornikoski, M., Valtaoja, E., et al. 2010, in Proceedings of the
Workshop ”Fermi meets Jansky: AGN in Radio and Gamma Rays”, ed.T. Savolainen, E. Ros, R. W. Porcas, & J. A. Zensus (Max-Planck-Institutfur Radioastronomie, Bonn, Germany), 89–92
Nieppola, E., Valtaoja, E., Tornikoski, M., Hovatta, T., & Kotiranta, M. 2008,A&A, 488, 867
Nilsson, K., Pasanen, M., Takalo, L. O., et al. 2007, A&A, 475, 199Padovani, P. 2007, Astrophysics and Space Science, 309, 63Parijskij, Y. N. 1993, IEEE Antennas Propagation Magazine,35, 7Planck Collaboration. 2011a, Planck early results 01: The Planck mission
(Submitted to A&A, [arXiv:astro-ph/1101.2022])Planck Collaboration. 2011b, Planck early results 02: The thermal performance
of Planck (Submitted to A&A, [arXiv:astro-ph/1101.2023])Planck Collaboration. 2011c, Planck early results 07: The Early Release
Compact Source Catalogue (Submitted to A&A, [arXiv:astro-ph/1101.2041])Planck Collaboration. 2011d, Planck early results 08: The all-sky early Sunyaev-
Zeldovich cluster sample (Submitted to A&A, [arXiv:astro-ph/1101.2024])Planck Collaboration. 2011e, Planck early results 09: XMM-Newton follow-up
for validation of Planck cluster candidates (Submitted to A&A, [arXiv:astro-ph/1101.2025])
Planck Collaboration. 2011f, Planck early results 10: Statistical analysis ofSunyaev-Zeldovich scaling relations for X-ray galaxy clusters (Submitted toA&A, [arXiv:astro-ph/1101.2043])
Planck Collaboration. 2011g, Planck early results 11: Calibration of the lo-cal galaxy cluster Sunyaev-Zeldovich scaling relations (Submitted to A&A,[arXiv:astro-ph/1101.2026])
Planck Collaboration. 2011h, Planck early results 12: Cluster Sunyaev-Zeldovich optical Scaling relations (Submitted to A&A, [arXiv:astro-ph/1101.2027])
Planck Collaboration. 2011i, Planck early results 13: Statistical properties ofextragalactic radio sources in the Planck Early Release Compact SourceCatalogue (Submitted to A&A, [arXiv:astro-ph/1101.2044])
Planck Collaboration. 2011j, Planck early results 14: Early Release CompactSource Catalogue validation and extreme radio sources (Submitted to A&A,[arXiv:astro-ph/1101.1721])
Planck Collaboration. 2011k, Planck early results 15: Spectral energy distri-butions and radio continuum spectra of northern extragalactic radio sources(Submitted to A&A, [arXiv:astro-ph/1101.2047])
Planck Collaboration. 2011l, Planck early results 16: The Planck view of nearbygalaxies (Submitted to A&A, [arXiv:astro-ph/1101.2045])
Planck Collaboration. 2011m, Planck early results 17: Origin of the submil-limetre excess dust emission in the Magellanic Clouds (Submitted to A&A,[arXiv:astro-ph/1101.2046])
Planck Collaboration. 2011n, Planck early results 18: The power spectrum ofcosmic infrared background anisotropies (Submitted to A&A, [arXiv:astro-ph/1101.2028])
Planck Collaboration. 2011o, Planck early results 19: All-sky temperature anddust optical depth from Planck and IRAS — constraints on the “dark gas” inour Galaxy (Submitted to A&A, [arXiv:astro-ph/1101.2029])
Planck Collaboration. 2011p, Planck early results 20: New light on anoma-lous microwave emission from spinning dust grains (Submitted to A&A,[arXiv:astro-ph/1101.2031])
Planck Collaboration. 2011q, Planck early results 21: Properties of the in-terstellar medium in the Galactic plane (Submitted to A&A, [arXiv:astro-ph/1101.2032])
Planck Collaboration. 2011r, Planck early results 22: The submillimetre proper-ties of a sample of Galactic cold clumps (Submitted to A&A, [arXiv:astro-ph/1101.2034])
Planck Collaboration. 2011s, Planck early results 23: The Galactic coldcore population revealed by the first all-sky survey (Submitted to A&A,[arXiv:astro-ph/1101.2035])
Planck Collaboration. 2011t, Planck early results 24: Dustin the diffuse in-terstellar medium and the Galactic halo (Submitted to A&A, [arXiv:astro-ph/1101.2036])
Planck Collaboration. 2011u, Planck early results 25: Thermal dust in nearbymolecular clouds (Submitted to A&A, [arXiv:astro-ph/1101.2037])
Planck Collaboration. 2011v, The Explanatory Supplement to the Planck EarlyRelease Compact Source Catalogue (ESA)
Planck HFI Core Team. 2011a, Planck early results 04: First assessment ofthe High Frequency Instrument in-flight performance (Submitted to A&A,[arXiv:astro-ph/1101.2039])
15

Planck Collaboration: SEDs and radio spectra of northern AGN
Planck HFI Core Team. 2011b, Planck early results 06: The High FrequencyInstrument data processing (Submitted to A&A, [arXiv:astro-ph/1101.2048])
Poole, T. S., Breeveld, A. A., Page, M. J., et al. 2008, MNRAS,383, 627Procopio, P., Massardi, M., Righini, S., et al. 2011, ArXiv e-prints, 1106.2085Pushkarev, A. B., Kovalev, Y. Y., & Lister, M. L. 2010, ApJ, 722, L7Raiteri, C. M., Villata, M., Lanteri, L., Cavallone, M., & Sobrito, G. 1998,
A&AS, 130, 495Raiteri, C. M., Villata, M., Tosti, G., et al. 1999, A&A, 352,19Richards, J. L., Max-Moerbeck, W., Pavlidou, V., et al. 2011, ApJS, 194, 29Roming, P. W. A., Kennedy, T. E., Mason, K. O., et al. 2005, Space Sci. Rev.,
120, 95Rosset, C., Tristram, M., Ponthieu, N., et al. 2010, A&A, 520, A13+Sambruna, R. M., Donato, D., Ajello, M., et al. 2010, ApJ, 710, 24Sambruna, R. M., Gliozzi, M., Tavecchio, F., Maraschi, L., &Foschini, L. 2006,
ApJ, 652, 146Schlegel, D. J., Finkbeiner, D. P., & Davis, M. 1998, ApJ, 500, 525Stecker, F. W., Baring, M. G., & Summerlin, E. J. 2007, ApJ, 667, L29Stevens, J. A., Litchfield, S. J., Robson, E. I., et al. 1994, ApJ, 437, 91Tammi, J. 2008a, in International Cosmic Ray Conference, Vol. 2, International
Cosmic Ray Conference, 251–254Tammi, J. 2008b, International Journal of Modern Physics D,17, 1811Tammi, J. & Duffy, P. 2009, MNRAS, 393, 1063Tauber, J. A., Mandolesi, N., Puget, J., et al. 2010, A&A, 520, A1+Terasranta, H., Tornikoski, M., Mujunen, A., et al. 1998, A&AS, 132, 305Tornikoski, M., Nieppola, E., Valtaoja, E., Leon-Tavares, J., & Lahteenmaki, A.
2010, in Proceedings of the Workshop ”Fermi meets Jansky: AGN in Radioand Gamma Rays”, ed. T. Savolainen, E. Ros, R. W. Porcas, & J. A. Zensus(Max-Planck-Institut fur Radioastronomie, Bonn, Germany), 85–88
Tramacere, A., Giommi, P., Perri, M., Verrecchia, F., & Tosti, G. 2009, A&A,501, 879
Vainio, R., Virtanen, J. J. P., & Schlickeiser, R. 2003, A&A,409, 821Valtaoja, E., Haarala, S., Lehto, H., & Valtaoja, L. 1988, A&A, 203, 1Valtaoja, E. & Terasranta, H. 1996, A&AS, 120, 491Valtaoja, E., Terasranta, H., Urpo, S., et al. 1992, A&A, 254, 71Valtaoja, E., Tornikoski, M., Leon-Tavares, J., et al. 2010, in Proceedings of
the Workshop ”Fermi meets Jansky: AGN in Radio and Gamma Rays”, ed.T. Savolainen, E. Ros, R. W. Porcas, & J. A. Zensus (Max-Planck-Institut furRadioastronomie, Bonn, Germany), 73–76
Verkhodanov, O. V. 1997, in Astronomical Society of the Pacific ConferenceSeries, Vol. 125, Astronomical Data Analysis Software and Systems VI, ed.G. Hunt & H. Payne, 46–+
Villata, M., Raiteri, C. M., Lanteri, L., Sobrito, G., & Cavallone, M. 1998,A&AS, 130, 305
Virtanen, J. J. P. & Vainio, R. 2005, ApJ, 621, 313Zacchei et al. 2011, Planck early results 05: The Low Frequency Instrument data
processing (Submitted to A&A, [arXiv:astro-ph/1101.2040])
1 Aalto University Metsahovi Radio Observatory, Metsahovintie 114,FIN-02540 Kylmala, Finland
2 Agenzia Spaziale Italiana Science Data Center, c/o ESRIN, viaGalileo Galilei, Frascati, Italy
3 Agenzia Spaziale Italiana, Viale Liegi 26, Roma, Italy
4 Astronomy Department, University of Michigan, 830 DennisonBuilding, 500 Church Street, Ann Arbor, Michigan 48109-1042,U.S.A.
5 Astroparticle Physics Laboratory, NASA/Goddard Space FlightCenter, Greenbelt, MD 20771, U.S.A.
6 Astroparticule et Cosmologie, CNRS (UMR7164), Universit´eDenis Diderot Paris 7, Batiment Condorcet, 10 rue A. Domon etLeonie Duquet, Paris, France
7 Astrophysics Group, Cavendish Laboratory, University ofCambridge, J J Thomson Avenue, Cambridge CB3 0HE, U.K.
8 Atacama Large Millimeter/submillimeter Array, ALMA SantiagoCentral Offices, Alonso de Cordova 3107, Vitacura, Casilla 763
0355, Santiago, Chile
9 Australia Telescope National Facility, CSIRO, P.O. Box 76,Epping,NSW 1710, Australia
10 CITA, University of Toronto, 60 St. George St., Toronto, ON M5S3H8, Canada
11 CNRS, IRAP, 9 Av. colonel Roche, BP 44346, F-31028 Toulousecedex 4, France
12 California Institute of Technology, Pasadena, California, U.S.A.
13 DAMTP, University of Cambridge, Centre for MathematicalSciences, Wilberforce Road, Cambridge CB3 0WA, U.K.
14 DSM/Irfu/SPP, CEA-Saclay, F-91191 Gif-sur-Yvette Cedex, France
15 DTU Space, National Space Institute, Juliane Mariesvej 30,Copenhagen, Denmark
16 Departamento de Fısica, Universidad de Oviedo, Avda. CalvoSotelo s/n, Oviedo, Spain
17 Department of Astronomy and Astrophysics, Pennsylvania StateUniversity, 525 Davey Lab, University Park, PA 16802, U.S.A.
18 Department of Astronomy and Astrophysics, University of Toronto,50 Saint George Street, Toronto, Ontario, Canada
19 Department of Physics & Astronomy, University of BritishColumbia, 6224 Agricultural Road, Vancouver, British Columbia,
16

Planck Collaboration: SEDs and radio spectra of northern AGN
Canada
20 Department of Physics, Gustaf Hallstromin katu 2a, University ofHelsinki, Helsinki, Finland
21 Department of Physics, Purdue University, 525 NorthwesternAvenue, West Lafayette, Indiana, U.S.A.
22 Department of Physics, University of California, Berkeley,California, U.S.A.
23 Department of Physics, University of California, One ShieldsAvenue, Davis, California, U.S.A.
24 Department of Physics, University of California, Santa Barbara,California, U.S.A.
25 Department of Physics, University of Illinois at Urbana-Champaign,1110 West Green Street, Urbana, Illinois, U.S.A.
26 Dipartimento di Fisica G. Galilei, Universita degli Studidi Padova,via Marzolo 8, 35131 Padova, Italy
27 Dipartimento di Fisica M. Merlin dell’Universita e del Politecnicodi Bari, 70126 Bari, Italy
28 Dipartimento di Fisica, Universita degli Studi di Perugia, 06123Perugia, Italy
29 Dipartimento di Fisica, Universita La Sapienza, P. le A. Moro 2,Roma, Italy
30 Dipartimento di Fisica, Universita degli Studi di Milano,ViaCeloria, 16, Milano, Italy
31 Dipartimento di Fisica, Universita degli Studi di Trieste, via A.Valerio 2, Trieste, Italy
32 Dipartimento di Fisica, Universita di Ferrara, Via Saragat 1, 44122Ferrara, Italy
33 Dipartimento di Fisica, Universita di Roma Tor Vergata, Via dellaRicerca Scientifica, 1, Roma, Italy
34 Discovery Center, Niels Bohr Institute, Blegdamsvej 17,Copenhagen, Denmark
35 Dpto. Astrofısica, Universidad de La Laguna (ULL), E-38206 LaLaguna, Tenerife, Spain
36 European Southern Observatory, ESO Vitacura, Alonso de Cordova3107, Vitacura, Casilla 19001, Santiago, Chile
37 European Space Agency, ESAC, Planck Science Office, Caminobajo del Castillo, s/n, Urbanizacion Villafranca del Castillo,
Villanueva de la Canada, Madrid, Spain
38 European Space Agency, ESTEC, Keplerlaan 1, 2201 AZNoordwijk, The Netherlands
39 Finnish Centre for Astronomy with ESO (FINCA), University ofTurku, Vaisalantie 20, FIN-21500, Piikkio, Finland
40 Haverford College Astronomy Department, 370 Lancaster Avenue,Haverford, Pennsylvania, U.S.A.
41 Helsinki Institute of Physics, Gustaf Hallstromin katu 2, Universityof Helsinki, Helsinki, Finland
42 INAF - Osservatorio Astrofisico di Catania, Via S. Sofia 78,Catania, Italy
43 INAF - Osservatorio Astronomico di Padova, Vicolodell’Osservatorio 5, Padova, Italy
44 INAF - Osservatorio Astronomico di Roma, via di Frascati 33,Monte Porzio Catone, Italy
45 INAF - Osservatorio Astronomico di Trieste, Via G.B. Tiepolo 11,Trieste, Italy
46 INAF/IASF Bologna, Via Gobetti 101, Bologna, Italy
47 INAF/IASF Milano, Via E. Bassini 15, Milano, Italy
48 INRIA, Laboratoire de Recherche en Informatique, UniversiteParis-Sud 11, Batiment 490, 91405 Orsay Cedex, France
49 ISDC Data Centre for Astrophysics, University of Geneva, ch.d’Ecogia 16, Versoix, Switzerland
50 Imperial College London, Astrophysics group, Blackett Laboratory,Prince Consort Road, London, SW7 2AZ, U.K.
51 Infrared Processing and Analysis Center, California Institute ofTechnology, Pasadena, CA 91125, U.S.A.
52 Institut Neel, CNRS, Universite Joseph Fourier GrenobleI, 25 ruedes Martyrs, Grenoble, France
53 Institut d’Astrophysique Spatiale, CNRS (UMR8617) UniversiteParis-Sud 11, Batiment 121, Orsay, France
54 Institut d’Astrophysique de Paris, CNRS UMR7095, UniversitePierre & Marie Curie, 98 bis boulevard Arago, Paris, France
55 Institut de Radioastronomie Millimetrique (IRAM), Avenida DivinaPastora 7, Local 20, 18012 Granada, Spain
56 Institute of Astronomy and Astrophysics, Academia Sinica,Taipei,Taiwan
57 Institute of Astronomy, University of Cambridge, Madingley Road,Cambridge CB3 0HA, U.K.
58 Institute of Theoretical Astrophysics, University of Oslo, Blindern,Oslo, Norway
59 Instituto de Astrofısica de Canarias, C/Vıa Lactea s/n, La Laguna,Tenerife, Spain
60 Instituto de Fısica de Cantabria (CSIC-Universidad de Cantabria),Avda. de los Castros s/n, Santander, Spain
61 Istituto Nazionale di Fisica Nucleare, Sezione di Bari, 70126 Bari,Italy
62 Istituto Nazionale di Fisica Nucleare, Sezione di Perugia,06123Perugia, Italy
63 Istituto di Fisica del Plasma, CNR-ENEA-EURATOM Association,Via R. Cozzi 53, Milano, Italy
64 Jet Propulsion Laboratory, California Institute of Technology, 4800
17

Planck Collaboration: SEDs and radio spectra of northern AGN
Road, Manchester, M13 9PL, U.K.
66 Kavli Institute for Cosmology Cambridge, Madingley Road,Cambridge, CB3 0HA, U.K.
67 Key Laboratory of Optical Astronomy, National AstronomicalObservatories, Chinese Academy of Sciences, 20A Datun Road,Chaoyang District, Beijing 100012, China
68 LERMA, CNRS, Observatoire de Paris, 61 Avenue del’Observatoire, Paris, France
69 Laboratoire AIM, IRFU/Service d’Astrophysique - CEA/DSM -CNRS - Universite Paris Diderot, Bat. 709, CEA-Saclay, F-91191Gif-sur-Yvette Cedex, France
70 Laboratoire Traitement et Communication de l’Information, CNRS(UMR 5141) and Telecom ParisTech, 46 rue Barrault F-75634ParisCedex 13, France
71 Laboratoire de Physique Subatomique et de Cosmologie,CNRS/IN2P3, Universite Joseph Fourier Grenoble I, InstitutNational Polytechnique de Grenoble, 53 rue des Martyrs, 38026Grenoble cedex, France
72 Laboratoire de l’Accelerateur Lineaire, Universite Paris-Sud 11,CNRS/IN2P3, Orsay, France
73 Lawrence Berkeley National Laboratory, Berkeley, California,U.S.A.
74 Max-Planck-Institut fur Astrophysik, Karl-Schwarzschild-Str. 1,85741 Garching, Germany
75 Max-Planck-Institut fur Radioastronomie, Auf dem Hugel69,53121 Bonn, Germany
76 MilliLab, VTT Technical Research Centre of Finland, Tietotie 3,Espoo, Finland
77 National University of Ireland, Department of ExperimentalPhysics, Maynooth, Co. Kildare, Ireland
78 Niels Bohr Institute, Blegdamsvej 17, Copenhagen, Denmark
79 Owens Valley Radio Observatory, Mail code 249-17, CaliforniaInstitute of Technology, 1200 E California Blvd, Pasadena,CA91125, U.S.A.
80 SISSA, Astrophysics Sector, via Bonomea 265, 34136, Trieste, Italy
81 SUPA, Institute for Astronomy, University of Edinburgh, RoyalObservatory, Blackford Hill, Edinburgh EH9 3HJ, U.K.
82 School of Physics and Astronomy, Cardiff University, QueensBuildings, The Parade, Cardiff, CF24 3AA, U.K.
83 Space Sciences Laboratory, University of California, Berkeley,California, U.S.A.
84 Special Astrophysical Observatory, Russian Academy of Sciences,Nizhnij Arkhyz, Zelenchukskiy region, Karachai-Cherkessian
Republic, 369167, Russia
85 Stanford University, Dept of Physics, Varian Physics Bldg,382 ViaPueblo Mall, Stanford, California, U.S.A.
86 Tuorla Observatory, Department of Physics and Astronomy,University of Turku, Vaisalantie 20, FIN-21500, Piikkio, Finland
87 Universite de Toulouse, UPS-OMP, IRAP, F-31028 Toulouse cedex4, France
88 Universities Space Research Association, Stratospheric Observatoryfor Infrared Astronomy, MS 211-3, Moffett Field, CA 94035, U.S.A.
89 University of Granada, Departamento de Fısica Teorica y delCosmos, Facultad de Ciencias, Granada, Spain
90 University of Miami, Knight Physics Building, 1320 Campo SanoDr., Coral Gables, Florida, U.S.A.
91 W. W. Hansen Experimental Physics Laboratory, Kavli Institutefor Particle Astrophysics and Cosmology, Department of Physicsand SLAC National Accelerator Laboratory, Stanford University,Stanford, CA 94305, U.S.A.
92 Warsaw University Observatory, Aleje Ujazdowskie 4, 00-478Warszawa, Poland
18

Planck
Collaboration:S
ED
sand
radiospectra
ofnorthernA
GN
,Online
Materialp
1Table 1. The complete 1 Jy northern sample of AGN. Column 8 refers to the 37 GHz observations of Metsahovi Radio Observatory.
(1) (2) (3) (4) (5) (6) (7) (8) (9) (10) (11) (12)Name J2000 Name Alias R.A.(J2000) Dec(J2000) 1st scan 2nd scan S ave[Jy] logνs Syn quality logνIC IC quality
0003−066 0006−0623 NRAO5 00:06:13.90 −06:23:36.00 2009-12-12 ... 2.06 13.1 A ... ...0007+106 0010+1058 IIIZW2 00:10:31.01 10:58:29.50 2009-12-25 ... 1.04 ... ... ... ...0048−097 0050−0929 PKS0048−097 00:50:41.20 −09:29:06.00 2009-12-23 ... 1.34 14.1 A ... ...0059+581 0102+5824 TXS 0059+581 01:02:45.76 58:24:11.14 2010-01-28 ... 2.97 13.6 B ... ...0106+013 0108+0135 OC012 01:08:38.77 01:35:00.30 2010-01-04 ... 1.85 12.7 B ... ...J0125−0005 0125−0005 01:25:28.84 −00:05:56.00 2010-01-08 ... 1.24 13.6 B ... ...0133+476 0136+4751 DA55 01:36:58.59 47:51:29.10 2010-01-29 ... 3.02 12.8 A ... ...0149+218 0152+2207 01:52:18.06 22:07:07.70 2010-01-24 ... 1.06 ... ... ... ...0202+149 0204+1514 4C15.05 02:04:50.41 15:14:11.00 2010-01-24 ... 1.64 ... ... ... ...0212+735 0217+7349 02:17:30.81 73:49:32.60 2009-09-13 2010-02-11 2.05 12.4 B ... ...0224+671 0228+6721 02:28:50.05 67:21:03.00 2009-09-13 2010-02-10 1.28 ... ... ... ...0234+285 0237+2848 4C28.07 02:37:52.41 28:48:09.00 2010-02-03 ... 2.86 13.1 A 22.1 B0235+164 0238+1636 02:38:38.80 16:36:59.00 2010-02-01 ... 2.33 13.1 A ... ...0238−084 0241−0815 02:41:04.80 −08:15:20.75 2010-01-24 ... 1.33 ... ... ... ...0306+102 0309+1029 PKS0306+102 03:09:03.60 10:29:16.00 2010-02-06 ... 1.01 12.9 B ... ...0316+413 0319+4130 3C84 03:19:48.16 41:30:42.10 2010-02-13 ... 14.01 ... ... 22.9 B0333+321 0336+3218 NRAO140 03:36:30.11 32:18:29.30 2010-02-15 ... 1.49 ... ... ... ...0336−019 0339−0146 CTA026 03:39:30.94 −01:46:36.00 2010-02-10 ... 2.21 13.1 B ... ...0355+508 0359+5057 NRAO150 03:59:29.75 50:57:50.20 2009-09-13 2010-02-19 5.92 ... ... ... ...0415+379 0418+3801 3C111 04:18:21.28 38:01:35.80 2010-02-22 ... 5.97 ... ... ... ...0420−014 0423−0120 OA129 04:23:15.80 −01:20:33.10 2010-02-21 ... 7.27 13.2 B ... ...0430+052 0433+0521 3C120 04:33:11.10 05:21:15.60 2010-02-24 ... 2.65 ... ... ... ...0446+112 0449+1121 PKS0446+112 04:49:07.67 11:21:28.00 2010-02-27 ... 1.41 ... ... ... ...0458−020 0501−0159 PKS0458−020 05:01:12.81 −01:59:14.00 2010-03-01 ... 1.86 ... ... ... ...0507+179 0510+1800 05:10:02.37 18:00:41.58 2009-09-13 2010-03-03 1.14 ... ... ... ...0528+134 0530+1331 PKS0528+134 05:30:56.42 13:31:55.15 2009-09-14 2010-03-07 4.55 ... ... 21.8 B0552+398 0555+3948 DA193 05:55:30.81 39:48:49.17 2009-09-22 2010-03-09 3.18 ... ... 21.4 B0605−085 0607−0834 PKS0605−085 06:07:59.70 −08:34:50.00 2009-09-19 2010-03-17 1.73 13.2 B ... ...0642+449 0646+4451 OH471 06:46:32.03 44:51:16.59 2009-09-30 2010-03-162.36 12.5 B 22.7 B0716+714 0721+7120 07:21:53.30 71:20:36.00 2009-10-04 2010-03-10 2.12 14.3 A 23.4 B0723−008 0725−0054 PKS0723−008 07:25:50.70 −00:54:56.00 2009-10-09 2010-04-02 1.05 13.0 A ... ...0735+178 0738+1742 PKS0735+17 07:38:07.40 17:42:19.00 2009-10-10 2010-03-31 1.93 ... ... ... ...0736+017 0739+0137 07:39:18.03 01:37:04.60 2009-10-12 2010-04-04 1.85 14.0 B ... ...0748+126 0750+1231 07:50:52.05 12:31:04.83 2009-10-14 2010-04-04 2.42 12.7 A 21.5 A0754+100 0757+0956 OI090.4 07:57:06.64 09:56:34.90 2009-10-15 2010-04-06 1.33 13.0 B ... ...0805−077 0808−0751 08:08:15.54 −07:51:09.89 2009-10-22 2010-04-12 1.05 12.7 B ... ...0804+499 0808+4950 08:08:39.67 49:50:36.50 2009-10-12 2010-03-27 1.30 13.3 B ... ...0823+033 0825+0309 PKS0823+033 08:25:50.30 03:09:24.00 2009-10-24 2010-04-14 1.48 13.7 B ... ...0827+243 0830+2411 OJ248 08:30:52.08 24:10:60.00 2009-10-21 2010-04-091.48 ... ... ... ...0836+710 0841+7053 4C71.07 08:41:24.37 70:53:42.20 2009-10-12 2010-03-17 1.80 12.9 B 20.5 B0851+202 0854+2006 OJ287 08:54:48.80 20:06:30.00 2009-10-27 2010-04-153.90 13.1 B 21.8 B0906+430 0909+4253 3C216 09:09:33.50 42:53:46.08 2009-10-23 2010-04-091.02 13.2 B ... ...0917+449 0920+4441 09:20:58.46 44:41:53.99 2009-10-25 2010-04-11 1.27 12.7 A 21.7 A0923+392 0927+3902 4C39.25 09:27:03.01 39:02:20.90 2009-10-28 2010-04-15 7.06 ... ... 22.7 B0945+408 0948+4039 4C40.24 09:48:55.34 40:39:44.60 2009-10-31 2010-04-18 1.32 13.1 B ... ...0953+254 0956+2515 09:56:49.88 25:15:16.05 2009-11-08 2010-04-27 1.13 13.1 B ... ...0954+658 0958+6533 S40954+65 09:58:47.20 65:33:54.00 2009-10-21 2010-03-30 1.03 12.8 B 21.7 B1036+054 1038+0512 10:38:46.78 05:12:29.09 2009-11-29 2010-05-16 1.13 ... ... ... ...

Planck
Collaboration:S
ED
sand
radiospectra
ofnorthernA
GN
,Online
Materialp
2Table 1. continued.
(1) (2) (3) (4) (5) (6) (7) (8) (9) (10) (11) (12)Name J2000 Name Alias R.A.(J2000) Dec(J2000) 1st scan 2nd scan S ave [Jy] logνs Syn quality logνIC IC quality
TEX1040+244 1043+2408 10:43:09.00 24:08:35.00 2009-11-19 2010-05-10 1.02 ... ... ... ...1055+018 1058+0133 OL093 10:58:29.61 01:33:58.80 2009-12-07 2010-05-24 3.96 12.7 B 22.5 AJ1130+3815 1130+3815 QSO B1128+385? 11:30:53.28 38:15:18.50 2009-11-21 2010-05-15 1.16 12.9 B ... ...1150+812 1153+8058 11:53:12.50 80:58:29.15 2009-10-16 2010-03-07 1.11 ... ... ... ...1150+497 1153+4931 11:53:24.47 49:31:08.83 2009-11-16 2010-05-11 1.40 ... ... ... ...1156+295 1159+2914 4C29.45 11:59:31.83 29:14:44.00 2009-12-04 2010-05-31 2.00 13.4 A 23.5 B1219+044 1222+0413 12:22:22.55 04:13:15.78 2009-12-29 ... 1.39 ... ... ... ...1222+216 1224+2122 PKS1222+216 12:24:54.51 21:22:47.00 2009-12-18 ... 1.16 14.2 B 22.7 B1226+023 1229+0203 3C273 12:29:06.69 02:03:08.60 2010-01-02 ... 24.37 14.1 B 20.8 A1228+126 1230+1223 3C274 12:30:49.42 12:23:28.00 2009-12-26 ... 14.04 13.4 B ... ...1253−055 1256−0547 3C279 12:56:11.17 −05:47:21.50 2010-01-13 ... 17.20 12.8 B 22.7 B1308+326 1310+3220 AUCVn 13:10:28.66 32:20:43.80 2009-12-21 ... 2.26 12.6 B ... ...1324+224 1327+2210 13:27:00.86 22:10:50.16 2010-01-05 ... 1.15 12.8 B ... ...1413+135 1415+1320 14:15:58.80 13:20:24.00 2010-01-25 ... 1.51 ... ... ... ...1418+546 1419+5423 OQ530 14:19:46.60 54:23:14.00 2009-12-06 ... 1.16 ... ... 20.6 B1502+106 1504+1029 OR103 15:04:24.98 10:29:39.00 2010-02-08 ... 1.30 ... ... ... ...1510−089 1512−0905 PKS1510−089 15:12:50.53 −09:05:59.00 2010-02-14 ... 2.48 13.4 B ... ...1546+027 1549+0237 15:49:29.44 02:37:01.20 2010-02-21 ... 2.42 13.8 B ... ...1548+056 1550+0527 15:50:35.27 05:27:10.45 2010-02-21 ... 2.04 ... ... ... ...1606+106 1608+1029 4C10.45 16:08:46.20 10:29:07.80 2010-02-24 ... 1.65 ... ... ... ...1611+343 1613+3412 DA406 16:13:41.00 34:12:48.00 2010-02-23 ... 3.03 13.5 B ... ...1633+382 1635+3808 4C38.41 16:35:15.49 38:08:04.50 2010-03-02 ... 2.90 ... ... 21.6 B1638+398 1640+3946 16:40:29.63 39:46:46.03 2010-03-04 ... 1.18 ... ... ... ...1642+690 1642+6856 16:42:07.85 68:56:39.76 2009-11-06 2010-01-17 1.74 ... ... ... ...1641+399 1642+3948 3C345 16:42:58.81 39:48:37.00 2010-03-05 ... 7.89 12.2 A ... ...1652+398 1653+3945 MARK501 16:53:52.20 39:45:36.00 2010-03-09 ... 1.00 ... ... ... ...1739+522 1740+5211 S41739+52 17:40:36.98 52:11:43.00 2010-03-30 ... 1.45 ... ... ... ...1741−038 1743−0350 PKS1741−038 17:43:58.86 −03:50:04.60 2009-09-13 2010-03-18 4.39 ... ... ... ...1749+096 1751+0939 PKS1749+096 17:51:32.70 09:39:01.00 2009-09-13 2010-03-21 4.50 13.0 A 23.2 A1803+784 1800+7828 S51803+784 18:00:45.40 78:28:04.00 2009-10-11 2010-02-02 1.90 13.5 A 23.1 A1807+698 1806+6949 3C371.0 18:06:50.70 69:49:28.00 2009-10-21 2010-01-07 1.37 14.3 A 23.1 B1823+568 1824+5651 4C56.27 18:24:07.07 56:51:01.50 2010-04-17 ... 1.60 13.0 B ... ...1828+487 1829+4844 3C380 18:29:31.80 48:44:46.62 2010-04-11 ... 2.38 14.0 B ... ...J184915+67064 1849+6705 18:49:15.89 67:06:40.90 2009-10-12 2009-12-25 1.82 12.6 A ... ...1928+738 1927+7358 4C73.18 19:27:48.50 73:58:01.60 2009-09-28 2010-01-18 2.61 ... ... 21.0 B1954+513 1955+5131 19:55:42.74 51:31:48.55 2009-10-09 2010-05-06 1.35 13.7 B ... ...2007+776 2005+7752 S52007+77 20:05:31.10 77:52:43.00 2009-09-25 2010-01-27 1.40 13.1 B ... ...2005+403 2007+4029 20:07:44.94 40:29:48.60 2009-10-17 2010-05-02 2.04 ... ... ... ...2021+614 2022+6136 OW637 20:22:06.68 61:36:58.80 2009-12-20 2010-05-261.25 ... ... ... ...2037+511 2038+5119 20:38:37.04 51:19:12.66 2009-11-25 2010-05-18 2.46 13.2 B ... ...2121+053 2123+0535 21:23:44.52 05:35:22.09 2009-11-02 2010-05-08 1.74 ... ... ... ...2131−021 2134−0153 PKS2131−021 21:34:10.31 −01:53:17.24 2009-11-02 2010-05-09 1.46 ... ... ... ...2134+004 2136+0041 OX057 21:36:38.59 00:41:54.21 2009-11-04 2010-05-10 3.34 ... ... 21.0 A2136+141 2139+1423 21:39:01.31 14:23:36.00 2009-11-11 2010-05-16 1.29 12.5 B ... ...2145+067 2148+0657 21:48:05.46 06:57:38.60 2009-11-10 2010-05-16 7.37 ... ... ... ...2200+420 2202+4216 BLLAC 22:02:43.30 42:16:39.00 2009-12-13 2010-06-06 3.35 13.8 B 22.6 A2201+315 2203+3145 4C31.63 22:03:14.98 31:45:38.30 2009-12-02 2010-05-30 2.53 14.2 B 20.7 B2201+171 2203+1725 22:03:26.89 17:25:48.20 2009-11-21 2010-05-24 1.21 13.5 B ... ...

Planck
Collaboration:S
ED
sand
radiospectra
ofnorthernA
GN
,Online
Materialp
3Table 1. continued.
(1) (2) (3) (4) (5) (6) (7) (8) (9) (10) (11) (12)Name J2000 Name Alias R.A.(J2000) Dec(J2000) 1st scan 2nd scan S ave [Jy] logνs Syn quality logνIC IC quality
2216−038 2218−0335 22:18:52.04 −03:35:36.90 2009-11-14 2010-05-21 1.41 14.0 B ... ...2223−052 2225−0457 3C446 22:25:47.26 −04:57:01.40 2009-11-15 2010-05-23 5.58 12.7 B 22.0 A2227−088 2229−0832 22:29:40.09 −08:32:54.50 2009-11-14 2010-05-23 1.94 ... ... 20.7 B2230+114 2232+1143 CTA102 22:32:36.41 11:43:50.90 2009-11-27 2010-05-31 3.84 13.2 B 22.6 B2234+282 2236+2828 22:36:22.47 28:28:57.41 2009-12-10 ... 1.03 13.0 B ... ...2251+158 2253+1608 3C454.3 22:53:57.75 16:08:53.60 2009-12-06 ... 9.42 13.9 B 22.6 A4C45.51 2354+4553 23:54:21.68 45:53:04.00 2010-01-11 ... 1.12 ... ... ... ...2353+816 2356+8152 23:56:22.79 81:52:52.26 2009-09-19 2010-02-08 1.59 ... ... ... ...

Planck Collaboration: SEDs and radio spectra of northern AGN, Online Material p 4
Table 4. Simultaneity of high energy data toPlanck observations displayed in the SEDs.
B1950 Name J2000 Name UVOT SWIFT-XRT FERMI0003−066 0006−0623 sim1st sim1st sim1st0007+106 0010+1058 ... ... 27m0048−097 0050−0929 sim1st sim1st sim1st0059+581 0102+5824 ... ... sim1st0106+013 0108+0135 ... ... sim1stJ0125−0005 0125−0005 ... ... sim1st0133+476 0136+4751 sim1st sim1st sim1st0149+218 0152+2207 ... ... sim1st0202+149 0204+1514 ... ... sim1st0212+735 0217+7349 ... ... 27m0224+671 0228+6721 ... ... sim1st0234+285 0237+2848 sim1st sim1st sim1st0235+164 0238+1636 sim1st sim1st sim1st0238−084 0241−0815 ... ... sim1st0306+102 0309+1029 ... ... 27m0316+413 0319+4130 ... ... 27m0333+321 0336+3218 ... ... 27m0336−019 0339−0146 ... ... sim1st0355+508 0359+5057 ... ... sim1st0415+379 0418+3801 ... ... sim1st0420−014 0423−0120 sim1st sim1st sim1st0430+052 0433+0521 sim1st sim1st sim1st0446+112 0449+1121 ... ... 27m0458−020 0501−0159 ... ... 27m0507+179 0510+1800 ... ... sim1st0528+134 0530+1331 sim2nd sim1st 2nd sim1st0552+398 0555+3948 sim1st sim1st sim1st0605−085 0607−0834 ... ... sim1st0642+449 0646+4451 sim1st sim1st sim1st0716+714 0721+7120 sim1st 2nd sim1st 2nd sim1st 2nd0723−008 0725−0054 ... ... ...0735+178 0738+1742 ... ... 27m0736+017 0739+0137 sim1st sim1st sim1st0748+126 0750+1231 sim2nd sim2nd 2M 2nd0754+100 0757+0956 ... ... 2M1st0805−077 0808−0751 ... ... sim1st0804+499 0808+4950 sim1st sim1st 2M 1st0823+033 0825+0309 ... ... 27m0827+243 0830+2411 ... ... 2M1st0836+710 0841+7053 sim2nd sim2nd 2M 2nd0851+202 0854+2006 sim2nd sim2nd 2M 1st 2nd0906+430 0909+4253 ... ... ...0917+449 0920+4441 sim1st sim1st 2M 1st0923+392 0927+3902 sim2nd sim2nd sim2nd0945+408 0948+4039 ... ... 2M1st0953+254 0956+2515 ... ... 2M1st0954+658 0958+6533 sim1st sim1st 2M 1st1036+054 1038+0512 ... ... 2M1stTEX1040+244 1043+2408 ... ... 2M1st1055+018 1058+0133 sim1st sim1st 2M 1stJ1130+3815 1130+3815 ... ... 2M1st1150+812 1153+8058 ... ... sim1st1150+497 1153+4931 sim1st sim1st 2M 1st1156+295 1159+2914 sim1st 2nd sim1st 2nd sim1st 2nd1219+044 1222+0413 ... ... 27m1222+216 1224+2122 sim1st sim1st sim1st1226+023 1229+0203 sim1st sim1st sim1st1228+126 1230+1223 sim1st sim1st sim1st1253−055 1256−0547 sim1st sim1st sim1st1308+326 1310+3220 sim1st sim1st sim1st1324+224 1327+2210 ... ... sim1st1413+135 1415+1320 ... ... sim1st1418+546 1419+5423 ... sim1st 27m1502+106 1504+1029 ... ... 27m1510−089 1512−0905 sim1st ... sim1st1546+027 1549+0237 sim1st sim1st sim1st1548+056 1550+0527 ... ... sim1st

Planck Collaboration: SEDs and radio spectra of northern AGN, Online Material p 5
Table 4. continued.
B1950 Name J2000 Name UVOT SWIFT-XRT FERMI1606+106 1608+1029 ... ... sim1st1611+343 1613+3412 sim1st sim1st sim1st1633+382 1635+3808 ... sim1st sim1st1638+398 1640+3946 ... ... 27m1642+690 1642+6856 ... ... 2M1st1641+399 1642+3948 sim1st sim1st sim1st1652+398 1653+3945 ... ... 27m1739+522 1740+5211 ... ... 27m1741−038 1743−0350 ... ... sim1st1749+096 1751+0939 sim2nd sim2nd sim2nd1803+784 1800+7828 sim1st sim1st sim1st1807+698 1806+6949 sim1st sim1st 2M 1st1823+568 1824+5651 ... ... 27m1828+487 1829+4844 ... ... 27mJ184915+670 1849+6705 sim2nd sim2nd ...1928+738 1927+7358 sim1st sim1st 2M 1st1954+513 1955+5131 ... ... ...2007+776 2005+7752 ... ... 27m2005+403 2007+4029 ... ... 2M1st2021+614 2022+6136 ... ... 2M1st2037+511 2038+5119 ... ... 2M1st2121+053 2123+0535 ... ... 2M1st2131−021 2134−0153 ... ... 2M1st2134+004 2136+0041 sim2nd sim2nd 2M 2nd2136+141 2139+1423 ... ... 2M1st2145+067 2148+0657 sim1st sim1st sim1st2200+420 2202+4216 sim1st 2nd sim1st 2nd sim1st 2nd2201+315 2203+3145 sim1st sim1st sim1st2201+171 2203+1725 ... ... 2M1st2216−038 2218−0335 ... ... sim1st2223−052 2225−0457 sim2nd sim2nd 2M 2nd2227−088 2229−0832 ... sim1st 2M 1st2230+114 2232+1143 sim1st sim1st sim1st2234+282 2236+2828 ... ... sim1st2251+158 2253+1608 sim1st sim1st sim1st4C45.51 2354+4553 ... ... sim1st2353+816 2356+8152 ... ... 27m

Planck Collaboration: SEDs and radio spectra of northern AGN, Online Material p 6
Fig. 18. Left-panel: The SED of the source 0003−066. Grey circles show the historical data. The red circles show data simultaneousto thePlanck observations. The dotted and dashed lines show the second and third degree polynomials, respectively, fitted to thesynchrotron and IC bumps in the SED.Right-panel: The radio spectrum of 0003−066. Red circles, LF data simultaneous toPlanck;red stars, ERCSC LFI data; blue circles, HF data simultaneous toPlanck; blue stars, ERCSC HFI data. The dashed and dotted linesare fits to simultaneous LF and HF data.
Fig. 19. 0007+106

Planck Collaboration: SEDs and radio spectra of northern AGN, Online Material p 7
Fig. 20. 0048−097

Planck Collaboration: SEDs and radio spectra of northern AGN, Online Material p 8
Fig. 21. 0059+581
Fig. 22. 0106+013
Fig. 23. J0125−0005

Planck Collaboration: SEDs and radio spectra of northern AGN, Online Material p 9
Fig. 24. 0133+476
Fig. 25. 0149+218
Fig. 26. 0202+149

Planck Collaboration: SEDs and radio spectra of northern AGN, Online Material p 10
Fig. 27. 0212+735
Fig. 28. 0224+671
Fig. 29. 0234+285

Planck Collaboration: SEDs and radio spectra of northern AGN, Online Material p 11
Fig. 30. 0235+164
Fig. 31. 0238−084
Fig. 32. 0306+102

Planck Collaboration: SEDs and radio spectra of northern AGN, Online Material p 12
Fig. 33. 0316+413
Fig. 34. 0333+321
Fig. 35. 0336−019

Planck Collaboration: SEDs and radio spectra of northern AGN, Online Material p 13
Fig. 36. 0355+508
Fig. 37. 0415+379
Fig. 38. 0420−014

Planck Collaboration: SEDs and radio spectra of northern AGN, Online Material p 14
Fig. 39. 0430+052
Fig. 40. 0446+112
Fig. 41. 0458−020

Planck Collaboration: SEDs and radio spectra of northern AGN, Online Material p 15
Fig. 42. 0507+179
Fig. 43. 0528+134
Fig. 44. 0552+398

Planck Collaboration: SEDs and radio spectra of northern AGN, Online Material p 16
Fig. 45. 0605−085
Fig. 46. 0642+449
Fig. 47. 0716+714

Planck Collaboration: SEDs and radio spectra of northern AGN, Online Material p 17
Fig. 48. 0723−008
Fig. 49. 0735+178
Fig. 50. 0736+017

Planck Collaboration: SEDs and radio spectra of northern AGN, Online Material p 18
Fig. 51. 0748+126
Fig. 52. 0754+100
Fig. 53. 0805−077

Planck Collaboration: SEDs and radio spectra of northern AGN, Online Material p 19
Fig. 54. 0804+499
Fig. 55. 0823+033
Fig. 56. 0827+243

Planck Collaboration: SEDs and radio spectra of northern AGN, Online Material p 20
Fig. 57. 0836+710
Fig. 58. 0851+202
Fig. 59. 0906+430

Planck Collaboration: SEDs and radio spectra of northern AGN, Online Material p 21
Fig. 60. 0917+449
Fig. 61. 0923+392
Fig. 62. 0945+408

Planck Collaboration: SEDs and radio spectra of northern AGN, Online Material p 22
Fig. 63. 0953+254
Fig. 64. 0954+658
Fig. 65. 1036+054

Planck Collaboration: SEDs and radio spectra of northern AGN, Online Material p 23
Fig. 66. TEX1040+244
Fig. 67. 1055+018
Fig. 68. J1130+3815

Planck Collaboration: SEDs and radio spectra of northern AGN, Online Material p 24
Fig. 69. 1150+812
Fig. 70. 1150+497
Fig. 71. 1156+295
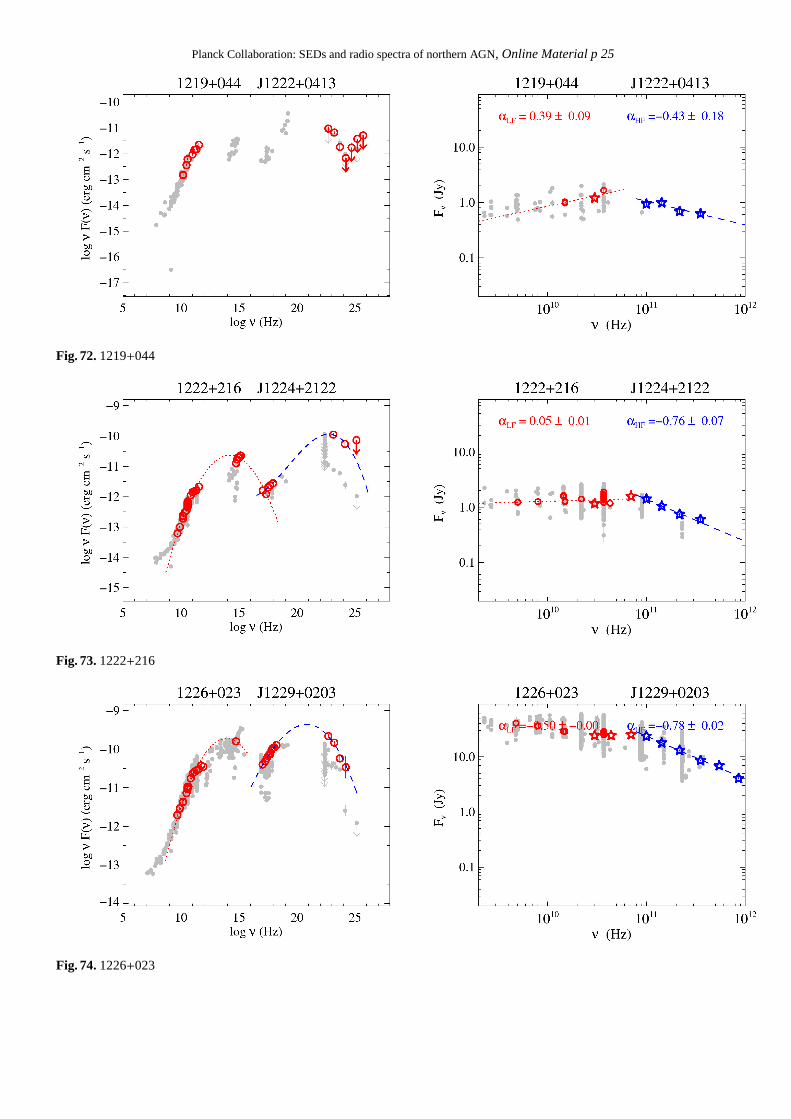
Planck Collaboration: SEDs and radio spectra of northern AGN, Online Material p 25
Fig. 72. 1219+044
Fig. 73. 1222+216
Fig. 74. 1226+023

Planck Collaboration: SEDs and radio spectra of northern AGN, Online Material p 26
Fig. 75. 1228+126
Fig. 76. 1253−055
Fig. 77. 1308+326

Planck Collaboration: SEDs and radio spectra of northern AGN, Online Material p 27
Fig. 78. 1324+224
Fig. 79. 1413+135
Fig. 80. 1418+546

Planck Collaboration: SEDs and radio spectra of northern AGN, Online Material p 28
Fig. 81. 1502+106
Fig. 82. 1510−089
Fig. 83. 1546+027

Planck Collaboration: SEDs and radio spectra of northern AGN, Online Material p 29
Fig. 84. 1548+056
Fig. 85. 1606+106
Fig. 86. 1611+343

Planck Collaboration: SEDs and radio spectra of northern AGN, Online Material p 30
Fig. 87. 1633+382
Fig. 88. 1638+398
Fig. 89. 1642+690

Planck Collaboration: SEDs and radio spectra of northern AGN, Online Material p 31
Fig. 90. 1641+399
Fig. 91. 1652+398
Fig. 92. 1739+522

Planck Collaboration: SEDs and radio spectra of northern AGN, Online Material p 32
Fig. 93. 1741−038
Fig. 94. 1749+096
Fig. 95. 1803+784

Planck Collaboration: SEDs and radio spectra of northern AGN, Online Material p 33
Fig. 96. 1807+698
Fig. 97. 1823+568
Fig. 98. 1828+487

Planck Collaboration: SEDs and radio spectra of northern AGN, Online Material p 34
Fig. 99. J184915+670
Fig. 100. 1928+738
Fig. 101. 1954+513

Planck Collaboration: SEDs and radio spectra of northern AGN, Online Material p 35
Fig. 102. 2007+776
Fig. 103. 2005+403
Fig. 104. 2021+614

Planck Collaboration: SEDs and radio spectra of northern AGN, Online Material p 36
Fig. 105. 2037+511
Fig. 106. 2121+053
Fig. 107. 2131−021

Planck Collaboration: SEDs and radio spectra of northern AGN, Online Material p 37
Fig. 108. 2134+004
Fig. 109. 2136+141
Fig. 110. 2145+067

Planck Collaboration: SEDs and radio spectra of northern AGN, Online Material p 38
Fig. 111. 2200+420
Fig. 112. 2201+315
Fig. 113. 2201+171

Planck Collaboration: SEDs and radio spectra of northern AGN, Online Material p 39
Fig. 114. 2216−038
Fig. 115. 2223−052
Fig. 116. 2227−088

Planck Collaboration: SEDs and radio spectra of northern AGN, Online Material p 40
Fig. 117. 2230+114
Fig. 118. 2234+282
Fig. 119. 2251+158

Planck Collaboration: SEDs and radio spectra of northern AGN, Online Material p 41
Fig. 120. 4C45.51
Fig. 121. 2353+816
Related Documents