A&A 571, A28 (2014) DOI: 10.1051/0004-6361/201321524 c ESO 2014 Astronomy & Astrophysics Planck 2013 results Special feature Planck 2013 results. XXVIII. The Planck Catalogue of Compact Sources Planck Collaboration: P. A. R. Ade 91 , N. Aghanim 64 , F. Argüeso 21 , C. Armitage-Caplan 96 , M. Arnaud 77 , M. Ashdown 74,6 , F. Atrio-Barandela 19 , J. Aumont 64 , C. Baccigalupi 90 , A. J. Banday 99,10 , R. B. Barreiro 71 , J. G. Bartlett 1,72 , E. Battaner 101 , A. Beelen 64 , K. Benabed 65,98 , A. Benoît 62 , A. Benoit-Lévy 27,65,98 , J.-P. Bernard 99,10 , M. Bersanelli 37,54 , P. Bielewicz 99,10,90 , J. Bobin 77 , J. J. Bock 72,11 , A. Bonaldi 73 , L. Bonavera 71 , J. R. Bond 9 , J. Borrill 14,93 , F. R. Bouchet 65,98 , M. Bridges 74,6,68 , M. Bucher 1 , C. Burigana 53,35 , R. C. Butler 53 , J.-F. Cardoso 78,1,65 , P. Carvalho 6 , A. Catalano 79,76 , A. Challinor 68,74,12 , A. Chamballu 77,16,64 , X. Chen 61 , H. C. Chiang 30,7 , L.-Y Chiang 67 , P. R. Christensen 86,40 , S. Church 95 , M. Clemens 49 , D. L. Clements 60 , S. Colombi 65,98 , L. P. L. Colombo 26,72 , F. Couchot 75 , A. Coulais 76 , B. P. Crill 72,87 , A. Curto 6,71 , F. Cuttaia 53 , L. Danese 90 , R. D. Davies 73 , R. J. Davis 73 , P. de Bernardis 36 , A. de Rosa 53 , G. de Zotti 49,90 , J. Delabrouille 1 , J.-M. Delouis 65,98 , F.-X. Désert 57 , C. Dickinson 73 , J. M. Diego 71 , H. Dole 64,63 , S. Donzelli 54 , O. Doré 72,11 , M. Douspis 64 , X. Dupac 43 , G. Efstathiou 68 , T. A. Enßlin 82 , H. K. Eriksen 69 , F. Finelli 53,55 , O. Forni 99,10 , M. Frailis 51 , E. Franceschi 53 , S. Galeotta 51 , K. Ganga 1 , M. Giard 99,10 , G. Giardino 44 , Y. Giraud-Héraud 1 , J. González-Nuevo 71,90,? , K. M. Górski 72,102 , S. Gratton 74,68 , A. Gregorio 38,51 , A. Gruppuso 53 , F. K. Hansen 69 , D. Hanson 83,72,9 , D. L. Harrison 68,74 , S. Henrot-Versillé 75 , C. Hernández-Monteagudo 13,82 , D. Herranz 71 , S. R. Hildebrandt 11 , E. Hivon 65,98 , M. Hobson 6 , W. A. Holmes 72 , A. Hornstrup 17 , W. Hovest 82 , K. M. Huffenberger 28 , A. H. Jaffe 60 , T. R. Jaffe 99,10 , W. C. Jones 30 , M. Juvela 29 , E. Keihänen 29 , R. Keskitalo 24,14 , T. S. Kisner 81 , R. Kneissl 42,8 , J. Knoche 82 , L. Knox 31 , M. Kunz 18,64,3 , H. Kurki-Suonio 29,47 , G. Lagache 64 , A. Lähteenmäki 2,47 , J.-M. Lamarre 76 , A. Lasenby 6,74 , R. J. Laureijs 44 , C. R. Lawrence 72 , J. P. Leahy 73 , R. Leonardi 43 , J. León-Tavares 45,2 , C. Leroy 64,99,10 , J. Lesgourgues 97,89 , M. Liguori 34 , P. B. Lilje 69 , M. Linden-Vørnle 17 , M. López-Caniego 71 , P. M. Lubin 32 , J. F. Macías-Pérez 79 , B. Maffei 73 , D. Maino 37,54 , N. Mandolesi 53,5,35 , M. Maris 51 , D. J. Marshall 77 , P. G. Martin 9 , E. Martínez-González 71 , S. Masi 36 , M. Massardi 52 , S. Matarrese 34 , F. Matthai 82 , P. Mazzotta 39 , P. McGehee 61 , P. R. Meinhold 32 , A. Melchiorri 36,56 , L. Mendes 43 , A. Mennella 37,54 , M. Migliaccio 68,74 , S. Mitra 59,72 , M.-A. Miville-Deschênes 64,9 , A. Moneti 65 , L. Montier 99,10 , G. Morgante 53 , D. Mortlock 60 , D. Munshi 91 , J. A. Murphy 85 , P. Naselsky 86,40 , F. Nati 36 , P. Natoli 35,4,53 , M. Negrello 49 , C. B. Netterfield 22 , H. U. Nørgaard-Nielsen 17 , F. Noviello 73 , D. Novikov 60 , I. Novikov 86 , I. J. O’Dwyer 72 , S. Osborne 95 , C. A. Oxborrow 17 , F. Paci 90 , L. Pagano 36,56 , F. Pajot 64 , R. Paladini 61 , D. Paoletti 53,55 , B. Partridge 46 , F. Pasian 51 , G. Patanchon 1 , T. J. Pearson 11,61 , O. Perdereau 75 , L. Perotto 79 , F. Perrotta 90 , F. Piacentini 36 , M. Piat 1 , E. Pierpaoli 26 , D. Pietrobon 72 , S. Plaszczynski 75 , E. Pointecouteau 99,10 , G. Polenta 4,50 , N. Ponthieu 64,57 , L. Popa 66 , T. Poutanen 47,29,2 , G. W. Pratt 77 , G. Prézeau 11,72 , S. Prunet 65,98 , J.-L. Puget 64 , J. P. Rachen 23,82 , W. T. Reach 100 , R. Rebolo 70,15,41 , M. Reinecke 82 , M. Remazeilles 73,64,1 , C. Renault 79 , S. Ricciardi 53 , T. Riller 82 , I. Ristorcelli 99,10 , G. Rocha 72,11 , C. Rosset 1 , G. Roudier 1,76,72 , M. Rowan-Robinson 60 , J. A. Rubiño-Martín 70,41 , B. Rusholme 61 , M. Sandri 53 , D. Santos 79 , G. Savini 88 , D. Scott 25 , M. D. Seiffert 72,11 , E. P. S. Shellard 12 , L. D. Spencer 91 , J.-L. Starck 77 , V. Stolyarov 6,74,94 , R. Stompor 1 , R. Sudiwala 91 , R. Sunyaev 82,92 , F. Sureau 77 , D. Sutton 68,74 , A.-S. Suur-Uski 29,47 , J.-F. Sygnet 65 , J. A. Tauber 44 , D. Tavagnacco 51,38 , L. Terenzi 53 , L. Toffolatti 20,71 , M. Tomasi 54 , M. Tristram 75 , M. Tucci 18,75 , J. Tuovinen 84 , M. Türler 58 , G. Umana 48 , L. Valenziano 53 , J. Valiviita 47,29,69 , B. Van Tent 80 , J. Varis 84 , P. Vielva 71 , F. Villa 53 , N. Vittorio 39 , L. A. Wade 72 , B. Walter 46 , B. D. Wandelt 65,98,33 , D. Yvon 16 , A. Zacchei 51 , and A. Zonca 32 (Affiliations can be found after the references) Received 21 March 2013 / Accepted 26 November 2013 ABSTRACT The Planck Catalogue of Compact Sources (PCCS) is the catalogue of sources detected in the first 15 months of Planck operations, the “nominal” mission. It consists of nine single-frequency catalogues of compact sources, both Galactic and extragalactic, detected over the entire sky. The PCCS covers the frequency range 30–857 GHz with higher sensitivity (it is 90% complete at 180 mJy in the best channel) and better angular resolution (from 32.88 0 to 4.33 0 ) than previous all-sky surveys in this frequency band. By construction its reliability is >80% and more than 65% of the sources have been detected in at least two contiguous Planck channels. In this paper we present the construction and validation of the PCCS, its contents and its statistical characterization. Key words. cosmology: observations – radio continuum: general – submillimeter: general 1. Introduction This paper, one of a set associated with the 2013 release of data from the Planck 1 mission (Planck Collaboration I 2014), ? Corresponding author: J. González-Nuevo, e-mail: [email protected] 1 Planck (http://www.esa.int/Planck) is a project of the European Space Agency (ESA) with instruments provided by two sci- entific consortia funded by ESA member states (in particular the lead countries France and Italy), with contributions from NASA (USA) and telescope reflectors provided by a collaboration between ESA and a sci- entific consortium led and funded by Denmark. describes the first release of the Planck Catalogue of Compact Sources (PCCS). The main goal of the Planck mission is to measure anisotropies in the cosmic microwave background (CMB), the relic radiation of the big bang; this radiation is “contaminated” by foreground emission arising from cosmic structures of all scales located between the CMB and us – galaxies, galaxy clus- ters, and gas and dust distributed on small as well as large scales within the Milky Way. In order to reveal the rich cosmologi- cal information concealed in the CMB such foreground emis- sion must be characterized and separated (Planck Collaboration XII 2014). As a by-product, the study of foregrounds delivers an Article published by EDP Sciences A28, page 1 of 22

Welcome message from author
This document is posted to help you gain knowledge. Please leave a comment to let me know what you think about it! Share it to your friends and learn new things together.
Transcript
A&A 571, A28 (2014)DOI: 10.1051/0004-6361/201321524c© ESO 2014
Astronomy&
AstrophysicsPlanck 2013 results Special feature
Planck 2013 results. XXVIII. The Planck Catalogue of CompactSources
Planck Collaboration: P. A. R. Ade91, N. Aghanim64, F. Argüeso21, C. Armitage-Caplan96, M. Arnaud77, M. Ashdown74,6, F. Atrio-Barandela19,J. Aumont64, C. Baccigalupi90, A. J. Banday99,10, R. B. Barreiro71, J. G. Bartlett1,72, E. Battaner101, A. Beelen64, K. Benabed65,98, A. Benoît62,
A. Benoit-Lévy27,65,98, J.-P. Bernard99,10, M. Bersanelli37,54, P. Bielewicz99,10,90, J. Bobin77, J. J. Bock72,11, A. Bonaldi73, L. Bonavera71,J. R. Bond9, J. Borrill14,93, F. R. Bouchet65,98, M. Bridges74,6,68, M. Bucher1, C. Burigana53,35, R. C. Butler53, J.-F. Cardoso78,1,65, P. Carvalho6,
A. Catalano79,76, A. Challinor68,74,12, A. Chamballu77,16,64, X. Chen61, H. C. Chiang30,7, L.-Y Chiang67, P. R. Christensen86,40, S. Church95,M. Clemens49, D. L. Clements60, S. Colombi65,98, L. P. L. Colombo26,72, F. Couchot75, A. Coulais76, B. P. Crill72,87, A. Curto6,71, F. Cuttaia53,
L. Danese90, R. D. Davies73, R. J. Davis73, P. de Bernardis36, A. de Rosa53, G. de Zotti49,90, J. Delabrouille1, J.-M. Delouis65,98, F.-X. Désert57,C. Dickinson73, J. M. Diego71, H. Dole64,63, S. Donzelli54, O. Doré72,11, M. Douspis64, X. Dupac43, G. Efstathiou68, T. A. Enßlin82,H. K. Eriksen69, F. Finelli53,55, O. Forni99,10, M. Frailis51, E. Franceschi53, S. Galeotta51, K. Ganga1, M. Giard99,10, G. Giardino44,Y. Giraud-Héraud1, J. González-Nuevo71,90 ,?, K. M. Górski72,102, S. Gratton74,68, A. Gregorio38,51, A. Gruppuso53, F. K. Hansen69,
D. Hanson83,72,9, D. L. Harrison68,74, S. Henrot-Versillé75, C. Hernández-Monteagudo13,82, D. Herranz71, S. R. Hildebrandt11, E. Hivon65,98,M. Hobson6, W. A. Holmes72, A. Hornstrup17, W. Hovest82, K. M. Huffenberger28, A. H. Jaffe60, T. R. Jaffe99,10, W. C. Jones30, M. Juvela29,E. Keihänen29, R. Keskitalo24,14, T. S. Kisner81, R. Kneissl42,8, J. Knoche82, L. Knox31, M. Kunz18,64,3, H. Kurki-Suonio29,47, G. Lagache64,A. Lähteenmäki2,47, J.-M. Lamarre76, A. Lasenby6,74, R. J. Laureijs44, C. R. Lawrence72, J. P. Leahy73, R. Leonardi43, J. León-Tavares45,2,
C. Leroy64,99,10, J. Lesgourgues97,89, M. Liguori34, P. B. Lilje69, M. Linden-Vørnle17, M. López-Caniego71, P. M. Lubin32, J. F. Macías-Pérez79,B. Maffei73, D. Maino37,54, N. Mandolesi53,5,35, M. Maris51, D. J. Marshall77, P. G. Martin9, E. Martínez-González71, S. Masi36, M. Massardi52,
S. Matarrese34, F. Matthai82, P. Mazzotta39, P. McGehee61, P. R. Meinhold32, A. Melchiorri36,56, L. Mendes43, A. Mennella37,54, M. Migliaccio68,74,S. Mitra59,72, M.-A. Miville-Deschênes64,9, A. Moneti65, L. Montier99,10, G. Morgante53, D. Mortlock60, D. Munshi91, J. A. Murphy85,
P. Naselsky86,40, F. Nati36, P. Natoli35,4,53, M. Negrello49, C. B. Netterfield22, H. U. Nørgaard-Nielsen17, F. Noviello73, D. Novikov60, I. Novikov86,I. J. O’Dwyer72, S. Osborne95, C. A. Oxborrow17, F. Paci90, L. Pagano36,56, F. Pajot64, R. Paladini61, D. Paoletti53,55, B. Partridge46, F. Pasian51,
G. Patanchon1, T. J. Pearson11,61, O. Perdereau75, L. Perotto79, F. Perrotta90, F. Piacentini36, M. Piat1, E. Pierpaoli26, D. Pietrobon72,S. Plaszczynski75, E. Pointecouteau99,10, G. Polenta4,50, N. Ponthieu64,57, L. Popa66, T. Poutanen47,29,2, G. W. Pratt77, G. Prézeau11,72, S. Prunet65,98,
J.-L. Puget64, J. P. Rachen23,82, W. T. Reach100, R. Rebolo70,15,41, M. Reinecke82, M. Remazeilles73,64,1, C. Renault79, S. Ricciardi53, T. Riller82,I. Ristorcelli99,10, G. Rocha72,11, C. Rosset1, G. Roudier1,76,72, M. Rowan-Robinson60, J. A. Rubiño-Martín70,41, B. Rusholme61, M. Sandri53,D. Santos79, G. Savini88, D. Scott25, M. D. Seiffert72,11, E. P. S. Shellard12, L. D. Spencer91, J.-L. Starck77, V. Stolyarov6,74,94, R. Stompor1,
R. Sudiwala91, R. Sunyaev82,92, F. Sureau77, D. Sutton68,74, A.-S. Suur-Uski29,47, J.-F. Sygnet65, J. A. Tauber44, D. Tavagnacco51,38, L. Terenzi53,L. Toffolatti20,71, M. Tomasi54, M. Tristram75, M. Tucci18,75, J. Tuovinen84, M. Türler58, G. Umana48, L. Valenziano53, J. Valiviita47,29,69,
B. Van Tent80, J. Varis84, P. Vielva71, F. Villa53, N. Vittorio39, L. A. Wade72, B. Walter46, B. D. Wandelt65,98,33, D. Yvon16,A. Zacchei51, and A. Zonca32
(Affiliations can be found after the references)
Received 21 March 2013 / Accepted 26 November 2013
ABSTRACT
The Planck Catalogue of Compact Sources (PCCS) is the catalogue of sources detected in the first 15 months of Planck operations, the “nominal”mission. It consists of nine single-frequency catalogues of compact sources, both Galactic and extragalactic, detected over the entire sky. ThePCCS covers the frequency range 30–857 GHz with higher sensitivity (it is 90% complete at 180 mJy in the best channel) and better angularresolution (from 32.88′ to 4.33′) than previous all-sky surveys in this frequency band. By construction its reliability is >80% and more than 65%of the sources have been detected in at least two contiguous Planck channels. In this paper we present the construction and validation of the PCCS,its contents and its statistical characterization.
Key words. cosmology: observations – radio continuum: general – submillimeter: general
1. Introduction
This paper, one of a set associated with the 2013 release ofdata from the Planck1 mission (Planck Collaboration I 2014),
? Corresponding author: J. González-Nuevo,e-mail: [email protected] Planck (http://www.esa.int/Planck) is a project of theEuropean Space Agency (ESA) with instruments provided by two sci-entific consortia funded by ESA member states (in particular the leadcountries France and Italy), with contributions from NASA (USA) andtelescope reflectors provided by a collaboration between ESA and a sci-entific consortium led and funded by Denmark.
describes the first release of the Planck Catalogue of CompactSources (PCCS).
The main goal of the Planck mission is to measureanisotropies in the cosmic microwave background (CMB), therelic radiation of the big bang; this radiation is “contaminated”by foreground emission arising from cosmic structures of allscales located between the CMB and us – galaxies, galaxy clus-ters, and gas and dust distributed on small as well as large scaleswithin the Milky Way. In order to reveal the rich cosmologi-cal information concealed in the CMB such foreground emis-sion must be characterized and separated (Planck CollaborationXII 2014). As a by-product, the study of foregrounds delivers an
Article published by EDP Sciences A28, page 1 of 22
A&A 571, A28 (2014)
extensive catalogue of discrete compact sources as well asa series of maps of the Galactic diffuse emission; both ofthese are valuable resources for a variety of studies in thefields of Galactic and extragalactic astrophysics (e.g. PlanckCollaboration XIX 2011; Planck Collaboration Int. XIV 2014;Planck Collaboration VII 2011; Planck Collaboration XXIII2011; Planck Collaboration XXIX 2014).
In 1983 the IRAS survey (Beichman et al. 1988) revolution-ized astronomy with the discovery of ultra-luminous infraredgalaxies and debris disks, etc and is still relevant to active as-trophysical research 30 years after its completion. Planck is atlonger wavelengths but at comparable depths and promises toprovide the community with an invaluable data set from the ra-dio to sub-mm for many years to come.
The Planck Early Release Compact Source Catalogue(ERCSC; Planck Collaboration VII 2011) presented cataloguesof discrete sources detected during Planck’s first 1.6 all-skysurveys. It has already been exploited for follow-up obser-vations (e.g., AMI Consortium et al. 2012; Kurinsky et al.2013) and for astrophysical investigations including the first di-rect determination of the bright end of the extragalactic sourcecounts at frequencies ≥100 GHz (Planck Collaboration Int. VII2013); the study of the spectral properties of radio sources(Planck Collaboration XIII 2011; Planck Collaboration XIV2011; Bonavera et al. 2011) and of their long-term variability(Chen et al. 2013); as well as accurate estimates of the luminos-ity function of dusty galaxies in the very local Universe (i.e.,distances ≤100 Mpc) at several millimetre and submillimetrewavelengths (Negrello et al. 2013) and of their dust mass andstar-formation rate functions (Clemens et al. 2013). Moreover, az = 3.26 strongly lensed submillimetre galaxy detected withinthe '135 deg2 of the phase 1 Herschel-ATLAS survey and pos-sibly associated with a proto-cluster of dusty galaxies was foundto be associated with an ERCSC source (Herranz et al. 2013;Fu et al. 2012), highlighting the potential of Planck surveys fordetecting extremely high-redshift sources.
This paper presents a new Planck catalogue, the PCCS,which uses deeper observations (from the first 15 months ofPlanck operations) and better calibration and analysis proce-dures (Planck Collaboration II 2014; Planck Collaboration III2014; Planck Collaboration V 2014; Planck Collaboration VI2014; Planck Collaboration X 2014; Planck Collaboration VIII2014) to improve on the results from the ERCSC. The PCCScomprises nine single-frequency source lists, one for eachPlanck frequency band. It contains high-reliability sources, bothGalactic and extragalactic, detected over the entire sky. ThePCCS differs in philosophy from the ERCSC in that it puts moreemphasis on the completeness of the catalogue, without greatlyreducing the reliability of the detected sources (>80% by con-struction). A comparison of the PCCS and ERCSC results ispresented in Sect. 4.3.
This paper describes the construction and content of thePCCS; scientific results from the catalogue will appear inlater papers. In Sect. 2 we describe the data, source detectionpipelines, selection criteria, and photometry methods used in theproduction of the PCCS. In Sect. 3 we discuss the validationprocesses (both internal and external) performed to assess thequality of the catalogues. The main characteristics of the PCCSare summarized in Sect. 4, and a description of the content anduse of the catalogue is presented in Sect. 5. Finally, in Sect. 6 wesummarize our conclusions. Details of the different photometryestimators are described in Appendix A.
2. The Planck Catalogue of Compact Sources
2.1. Data
The data obtained from the Planck nominal mission between2009 August 12 and 2010 November 27 have been pro-cessed into full-sky maps by the Low Frequency Instrument(LFI; 30–70 GHz) and High Frequency Instrument (HFI;100–857 GHz) Data Processing Centres (DPCs) (see PlanckCollaboration II 2014; Planck Collaboration VI 2014). The dataconsist of two complete sky surveys and 60% of the third survey.This implies that the flux densities of sources obtained from thenominal mission maps are the average of at least two observa-tions separated by roughly six months.
The nine Planck frequency channel maps were used as in-put to the source detection pipelines. The CMB dipole is re-moved during the map making stage. For the highest-frequencychannels, 353, 545, and 857 GHz, a model of the zodiacal emis-sion (Planck Collaboration XIV 2014) was the only foregroundemission subtracted from the maps before detecting the sources.The relevant properties of the frequency maps are summarizedin Table 1.
2.2. Source detection pipelines
Compact sources were detected in each frequency map by look-ing for peaks after convolving with a linear filter that preservesthe amplitude of the source while reducing both large scale struc-ture (e.g., diffuse Galactic emission) and small scale fluctuations(e.g., instrumental noise) in the vicinity of the sources.
Although the matched filter is optimal for uniform Gaussiannoise, the real data present additional challenges. For exam-ple, the power spectrum is needed to construct the matchedfilter and this quantity is not known a priori and has to bedetermined directly from the data. We have explored the per-formance of different filters using realistic Planck simulations,among them our implementation of a matched filter and the firstand second members of the Mexican Hat wavelet family, MHWand MHW2 (González-Nuevo et al. 2006; López-Caniego et al.2006), and for these particular data we have chosen the last ofthese, MHW2, which performs better than the MHW and simi-larly to the matched filter.
The MHW2 has only one free parameter, the scale R, to belocally optimized, and is less sensitive to artefacts (e.g., missingpixels) or very bright structures in the image, like those foundin the Galactic plane. These bright structures introduce instabil-ities in the determination of the power spectrum needed to con-struct the matched filter and reduce its performance. The MHW2is robust and gives good performance at all Galactic latitudes.Besides, it has previously been used to detect compact sourcesin astronomical images, including realistic simulations of Planck(López-Caniego et al. 2006; González-Nuevo et al. 2006; Leachet al. 2008) and data from WMAP (López-Caniego et al. 2007;Massardi et al. 2009).
The MHW2 filter in Fourier space is given by
ψ (kR) ∝ (kR)4 τ(kR), (1)
where k is the wavenumber; τ is the beam profile or pointspread function, approximated by a Gaussian τ(x) = (1/2πσb
2)exp[− 1
2 (x/σb)2]; and σb is the Gaussian beam dispersion.Two independent implementations of the MHW2 algorithm
have been used, one by the LFI DPC and another by the HFIDPC. The outputs of the two implementations have been com-pared and the results are compatible at the level of statistical
A28, page 2 of 22
Planck Collaboration: Planck 2013 results. XXVIII.
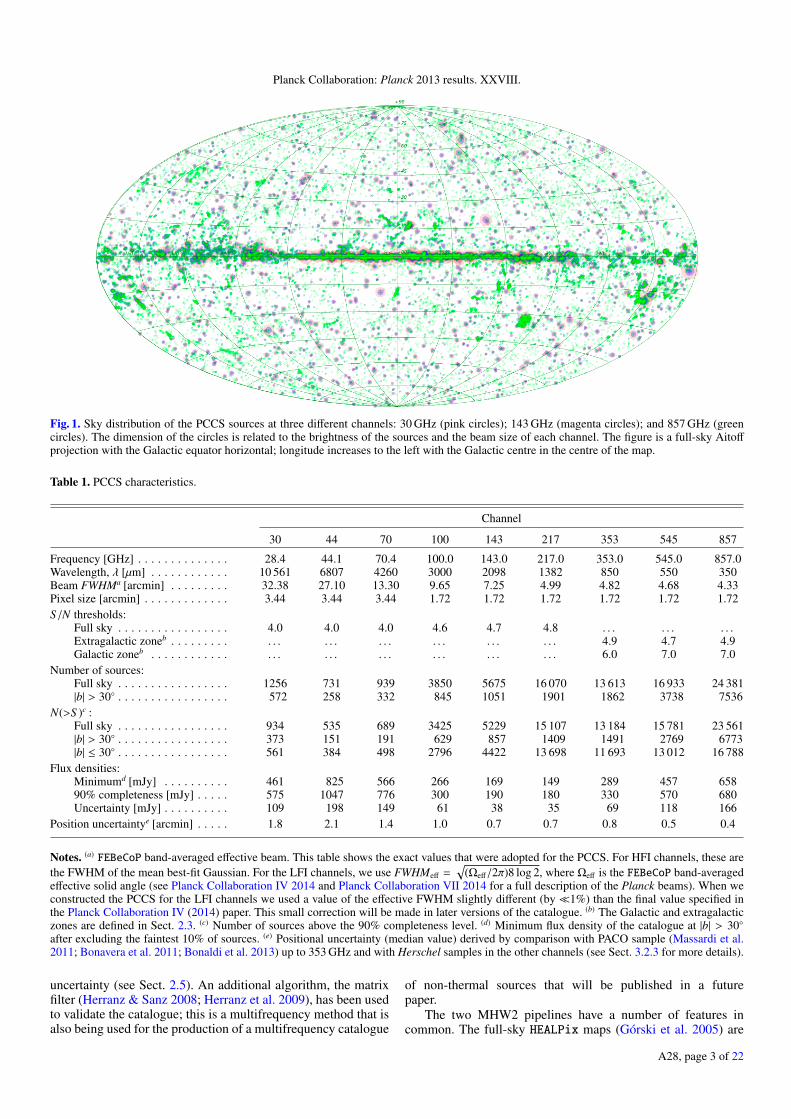
Fig. 1. Sky distribution of the PCCS sources at three different channels: 30 GHz (pink circles); 143 GHz (magenta circles); and 857 GHz (greencircles). The dimension of the circles is related to the brightness of the sources and the beam size of each channel. The figure is a full-sky Aitoffprojection with the Galactic equator horizontal; longitude increases to the left with the Galactic centre in the centre of the map.
Table 1. PCCS characteristics.
Channel
30 44 70 100 143 217 353 545 857
Frequency [GHz] . . . . . . . . . . . . . . 28.4 44.1 70.4 100.0 143.0 217.0 353.0 545.0 857.0Wavelength, λ [µm] . . . . . . . . . . . . 10 561 6807 4260 3000 2098 1382 850 550 350Beam FWHMa [arcmin] . . . . . . . . . 32.38 27.10 13.30 9.65 7.25 4.99 4.82 4.68 4.33Pixel size [arcmin] . . . . . . . . . . . . . 3.44 3.44 3.44 1.72 1.72 1.72 1.72 1.72 1.72S/N thresholds:
Full sky . . . . . . . . . . . . . . . . . 4.0 4.0 4.0 4.6 4.7 4.8 . . . . . . . . .Extragalactic zoneb . . . . . . . . . . . . . . . . . . . . . . . . . . . 4.9 4.7 4.9Galactic zoneb . . . . . . . . . . . . . . . . . . . . . . . . . . . . . . 6.0 7.0 7.0
Number of sources:Full sky . . . . . . . . . . . . . . . . . 1256 731 939 3850 5675 16 070 13 613 16 933 24 381|b| > 30 . . . . . . . . . . . . . . . . . 572 258 332 845 1051 1901 1862 3738 7536
N(>S )c :Full sky . . . . . . . . . . . . . . . . . 934 535 689 3425 5229 15 107 13 184 15 781 23 561|b| > 30 . . . . . . . . . . . . . . . . . 373 151 191 629 857 1409 1491 2769 6773|b| ≤ 30 . . . . . . . . . . . . . . . . . 561 384 498 2796 4422 13 698 11 693 13 012 16 788
Flux densities:Minimumd [mJy] . . . . . . . . . . 461 825 566 266 169 149 289 457 65890% completeness [mJy] . . . . . 575 1047 776 300 190 180 330 570 680Uncertainty [mJy] . . . . . . . . . . 109 198 149 61 38 35 69 118 166
Position uncertaintye [arcmin] . . . . . 1.8 2.1 1.4 1.0 0.7 0.7 0.8 0.5 0.4
Notes. (a) FEBeCoP band-averaged effective beam. This table shows the exact values that were adopted for the PCCS. For HFI channels, these arethe FWHM of the mean best-fit Gaussian. For the LFI channels, we use FWHMeff =
√(Ωeff/2π)8 log 2, where Ωeff is the FEBeCoP band-averaged
effective solid angle (see Planck Collaboration IV 2014 and Planck Collaboration VII 2014 for a full description of the Planck beams). When weconstructed the PCCS for the LFI channels we used a value of the effective FWHM slightly different (by 1%) than the final value specified inthe Planck Collaboration IV (2014) paper. This small correction will be made in later versions of the catalogue. (b) The Galactic and extragalacticzones are defined in Sect. 2.3. (c) Number of sources above the 90% completeness level. (d) Minimum flux density of the catalogue at |b| > 30after excluding the faintest 10% of sources. (e) Positional uncertainty (median value) derived by comparison with PACO sample (Massardi et al.2011; Bonavera et al. 2011; Bonaldi et al. 2013) up to 353 GHz and with Herschel samples in the other channels (see Sect. 3.2.3 for more details).
uncertainty (see Sect. 2.5). An additional algorithm, the matrixfilter (Herranz & Sanz 2008; Herranz et al. 2009), has been usedto validate the catalogue; this is a multifrequency method that isalso being used for the production of a multifrequency catalogue
of non-thermal sources that will be published in a futurepaper.
The two MHW2 pipelines have a number of features incommon. The full-sky HEALPix maps (Górski et al. 2005) are
A28, page 3 of 22
A&A 571, A28 (2014)
divided into small, square patch maps using a gnomonic projec-tion. The patches should be large enough to get a fair sample ofthe noise in each, but small enough that the noise and foregroundcharacteristics are close to uniform across each patch. The num-ber of patches is chosen to allow sufficient overlap to removedetections in the borders of the patches where edge effects be-come important. In both pipelines the scale R of the filter is opti-mized by finding the maximum signal-to-noise ratio (S/N) of thesources in the filtered patch. The optimal scale is determined foreach patch independently and, while it is always near to unity,it is usually smaller near the Galactic plane, e.g., 0.6 < R < 1.2at 30 GHz, and bigger when the beam is smaller when comparedto the pixel size, e.g., 1.1 < R < 1.5 at 70 GHz. Detectionsabove a given S/N threshold are retained and the positions of thedetected objects are translated from patch coordinates to spheri-cal coordinates. The final stage is to remove multiple detectionsof the same object from different patches. No attempt has beenmade to remove detected sources from the maps.
LFI: The compact source detection pipeline used in the LFI ispart of the IFCAMEX software package2. It can be used to de-tect sources with no prior information on their position (blindmode), or at the position of known objects (non-blind mode).For this analysis we blindly search for objects over the full skywith S/N ≥ 2 to produce a preliminary catalogue of potentialsources with positions, flux densities. and uncertainties. In thesecond step, IFCAMEX is run in non-blind mode, using as in-put the coordinates of the objects detected in the first step andkeeping those with S/N ≥ 4. In this case the patch is centredon the position of the source. The goal of this second iteration isto minimize the already small border and projection effects andto refine the estimation of the position and S/N of each detec-tion, keeping only those objects that still have a S/N above thethreshold, and thus improving the reliability of the catalogue.In addition, and given the large size of the LFI beams, a fit-ting algorithm has been incorporated to find the centroids of thesources, achieving sub-pixel coordinate accuracy. Moreover, wehave taken into account the effective non-Gaussian shape of thebeams in the estimation of the flux density. This is done apply-ing a correction factor to the IFCAMEX flux density estimationobtained by comparing the flux density of a simulated Gaussiantest source of a given scale R with that of source convolved withthe effective non-Gaussian beam of the detector at each of theLFI frequencies. This correction factor is small, typically <1%.Further details of this procedure can be found in Massardi et al.(2009).
HFI: The novel features of the HFI implementation were de-signed to deal with the challenging environment for source de-tection in the high frequency channels. They aim to reduce thenumber of spurious detections with minimal impact on the num-ber of real sources found. Each patch is filtered at the optimalscale, and also at four other scales bracketing the optimal scale.The dependence of the amplitude of the detection on the filterscale is compared with the predicted behaviour of a point source.The χ2 between the observed and predicted values is minimizedto provide an alternative measurement of the amplitude. The val-ues of the S/N, χ2, and the ratio of the two measurements of theamplitude determine whether a source is accepted or rejected.There is also an additional criterion for removing spurious de-tections that is based on the number of connected pixels, above athreshold, associated with a detection in the filtered patch at the
2 http://max.ifca.unican.es/IFCAMEX
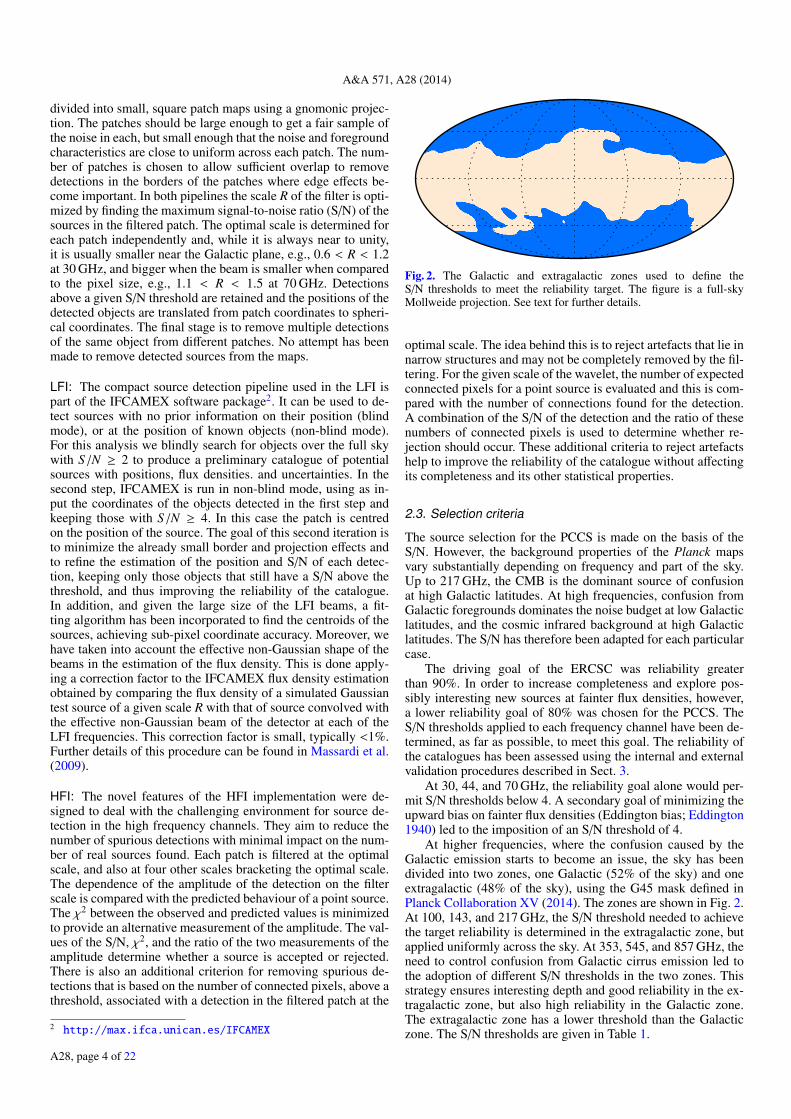
Fig. 2. The Galactic and extragalactic zones used to define theS/N thresholds to meet the reliability target. The figure is a full-skyMollweide projection. See text for further details.
optimal scale. The idea behind this is to reject artefacts that lie innarrow structures and may not be completely removed by the fil-tering. For the given scale of the wavelet, the number of expectedconnected pixels for a point source is evaluated and this is com-pared with the number of connections found for the detection.A combination of the S/N of the detection and the ratio of thesenumbers of connected pixels is used to determine whether re-jection should occur. These additional criteria to reject artefactshelp to improve the reliability of the catalogue without affectingits completeness and its other statistical properties.
2.3. Selection criteria
The source selection for the PCCS is made on the basis of theS/N. However, the background properties of the Planck mapsvary substantially depending on frequency and part of the sky.Up to 217 GHz, the CMB is the dominant source of confusionat high Galactic latitudes. At high frequencies, confusion fromGalactic foregrounds dominates the noise budget at low Galacticlatitudes, and the cosmic infrared background at high Galacticlatitudes. The S/N has therefore been adapted for each particularcase.
The driving goal of the ERCSC was reliability greaterthan 90%. In order to increase completeness and explore pos-sibly interesting new sources at fainter flux densities, however,a lower reliability goal of 80% was chosen for the PCCS. TheS/N thresholds applied to each frequency channel have been de-termined, as far as possible, to meet this goal. The reliability ofthe catalogues has been assessed using the internal and externalvalidation procedures described in Sect. 3.
At 30, 44, and 70 GHz, the reliability goal alone would per-mit S/N thresholds below 4. A secondary goal of minimizing theupward bias on fainter flux densities (Eddington bias; Eddington1940) led to the imposition of an S/N threshold of 4.
At higher frequencies, where the confusion caused by theGalactic emission starts to become an issue, the sky has beendivided into two zones, one Galactic (52% of the sky) and oneextragalactic (48% of the sky), using the G45 mask defined inPlanck Collaboration XV (2014). The zones are shown in Fig. 2.At 100, 143, and 217 GHz, the S/N threshold needed to achievethe target reliability is determined in the extragalactic zone, butapplied uniformly across the sky. At 353, 545, and 857 GHz, theneed to control confusion from Galactic cirrus emission led tothe adoption of different S/N thresholds in the two zones. Thisstrategy ensures interesting depth and good reliability in the ex-tragalactic zone, but also high reliability in the Galactic zone.The extragalactic zone has a lower threshold than the Galacticzone. The S/N thresholds are given in Table 1.
A28, page 4 of 22
Planck Collaboration: Planck 2013 results. XXVIII.
2.4. Photometry
For each source in the PCCS we have obtained four differentmeasures of the flux density. They are determined by the sourcedetection algorithm; aperture photometry; point spread function(PSF) fitting; and Gaussian fitting. Only the first is obtained fromthe filtered maps, and the other measures are estimated from thefull-sky maps at the positions of the sources. The source de-tection algorithm photometry, the aperture photometry and thePSF fitting use the Planck band-average effective beams, calcu-lated with FEBeCoP (Fast Effective Beam Convolution in Pixelspace; Mitra et al. 2011; Planck Collaboration IV 2014; PlanckCollaboration VII 2014). Notice that only the PSF fitting uses amodel of the PSF that depends on the position of the source andthe scan pattern.
Detection pipeline photometry (DETFLUX). As described inSect. 2.2, the detection pipelines assume that sources are point-like. The amplitude of the detected source is converted to fluxdensity using the area of the beam and the conversion from mapunits into intensity units. If a source is resolved its flux densitywill be underestimated. In this case it may be better to use theGAUFLUX estimation.
Aperture photometry (APERFLUX). The flux density is esti-mated by integrating the data in a circular aperture centred at theposition of the source. An annulus around the aperture is usedto evaluate the level of the background. The annulus is also usedto make a local estimate of the noise to calculate the uncertaintyin the estimate of the flux density. The flux density is correctedfor the fraction of the beam solid angle falling outside the aper-ture and for the fraction of the beam solid angle falling in theannulus. The aperture photometry was computed using an aper-ture with radius equal to the average full width at half maximum(FWHM) of the effective beam, and an annulus with an inner ra-dius of 1 FWHM and an outer radius of 2 FWHM. The effectivebeams were used to compute the beam solid angle corrections.For details see Appendix A.1.
PSF fit photometry (PSFFLUX). The flux density is obtainedby fitting a model of the PSF at the position of the source to thedata. The model has two free parameters, the amplitude of thesource and a background offset. The PSF is obtained from the ef-fective beam. For details see Appendix A.2.
Gaussian fit photometry (GAUFLUX). The flux density is ob-tained by fitting an elliptical Gaussian model to the source. TheGaussian is centred at the position of the source and its ampli-tude, size, and axial ratio are allowed to vary, as is the back-ground offset. The flux density is calculated from the amplitudeand the area of the Gaussian. For details see Appendix A.3.
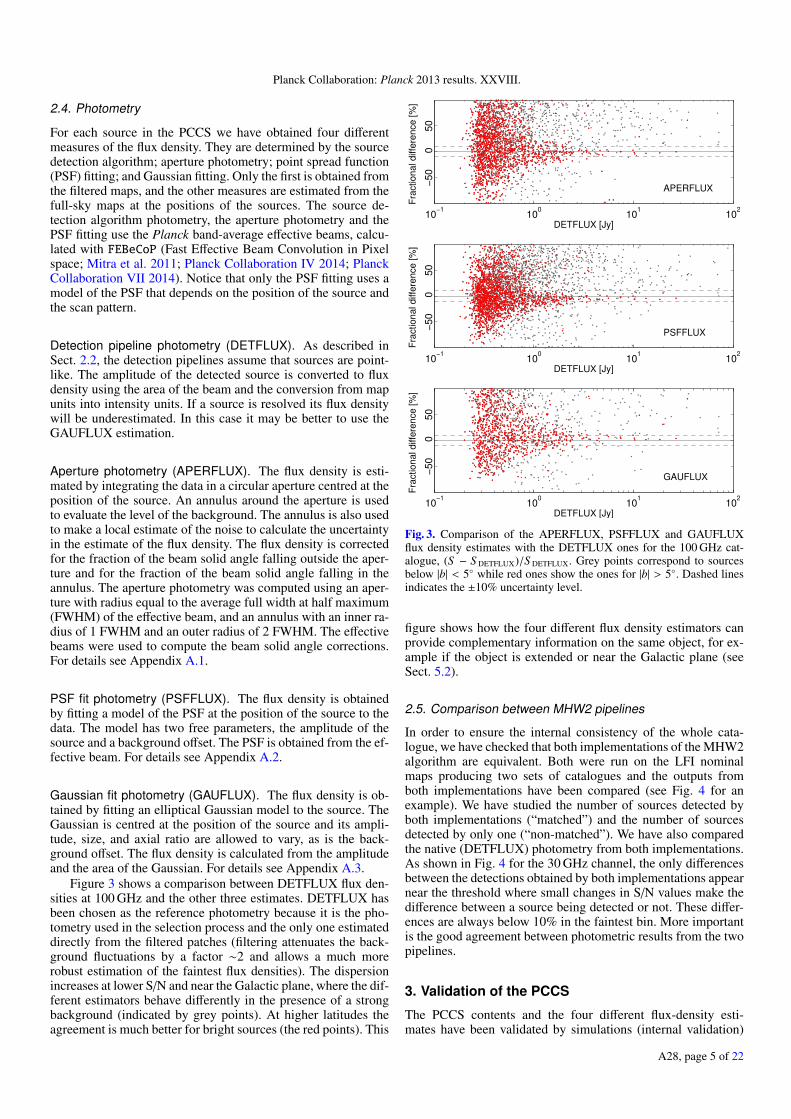
Figure 3 shows a comparison between DETFLUX flux den-sities at 100 GHz and the other three estimates. DETFLUX hasbeen chosen as the reference photometry because it is the pho-tometry used in the selection process and the only one estimateddirectly from the filtered patches (filtering attenuates the back-ground fluctuations by a factor ∼2 and allows a much morerobust estimation of the faintest flux densities). The dispersionincreases at lower S/N and near the Galactic plane, where the dif-ferent estimators behave differently in the presence of a strongbackground (indicated by grey points). At higher latitudes theagreement is much better for bright sources (the red points). This
10−1
100
101
102
APERFLUX
−5
0 0
50
DETFLUX [Jy]
Fra
ctional diffe
rence [%
]
10−1
100
101
102
PSFFLUX
−5
0 0
50
DETFLUX [Jy]
Fra
ctional diffe
rence [%
]
10−1
100
101
102
GAUFLUX
−5
0 0
50
DETFLUX [Jy]
Fra
ctional diffe
rence [%
]
Fig. 3. Comparison of the APERFLUX, PSFFLUX and GAUFLUXflux density estimates with the DETFLUX ones for the 100 GHz cat-alogue, (S − S DETFLUX)/S DETFLUX. Grey points correspond to sourcesbelow |b| < 5 while red ones show the ones for |b| > 5. Dashed linesindicates the ±10% uncertainty level.
figure shows how the four different flux density estimators canprovide complementary information on the same object, for ex-ample if the object is extended or near the Galactic plane (seeSect. 5.2).
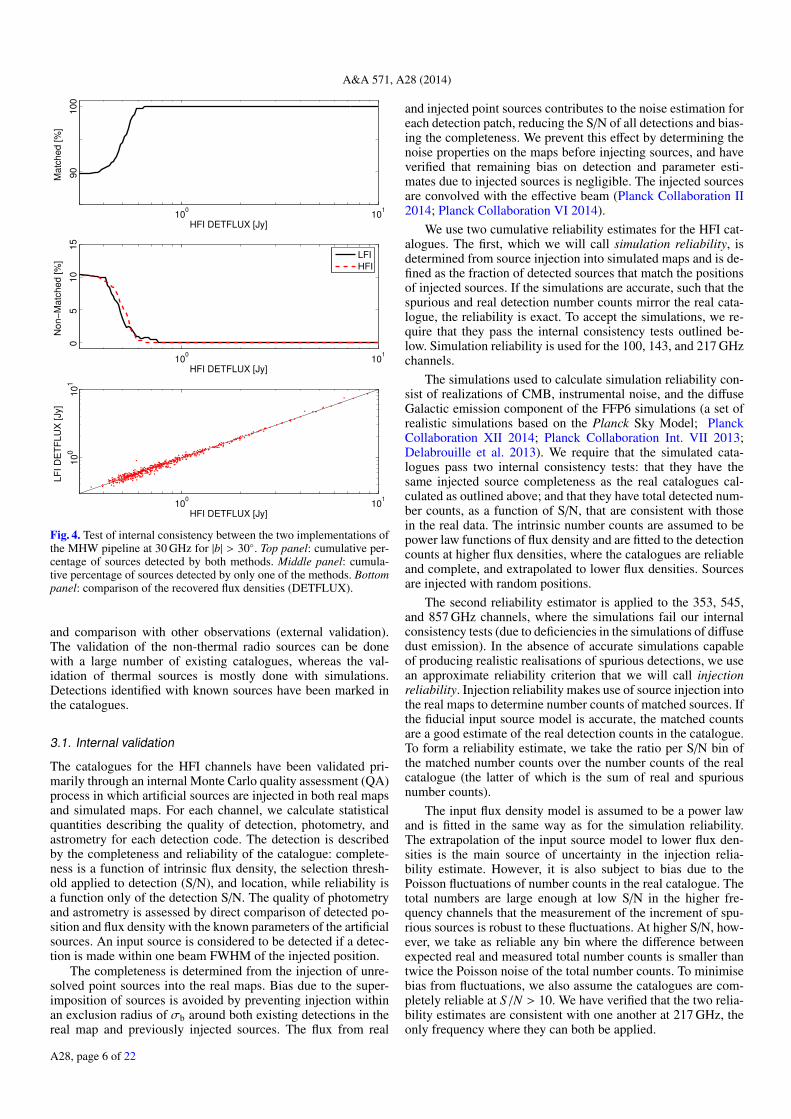
2.5. Comparison between MHW2 pipelines
In order to ensure the internal consistency of the whole cata-logue, we have checked that both implementations of the MHW2algorithm are equivalent. Both were run on the LFI nominalmaps producing two sets of catalogues and the outputs fromboth implementations have been compared (see Fig. 4 for anexample). We have studied the number of sources detected byboth implementations (“matched”) and the number of sourcesdetected by only one (“non-matched”). We have also comparedthe native (DETFLUX) photometry from both implementations.As shown in Fig. 4 for the 30 GHz channel, the only differencesbetween the detections obtained by both implementations appearnear the threshold where small changes in S/N values make thedifference between a source being detected or not. These differ-ences are always below 10% in the faintest bin. More importantis the good agreement between photometric results from the twopipelines.
3. Validation of the PCCS
The PCCS contents and the four different flux-density esti-mates have been validated by simulations (internal validation)
A28, page 5 of 22
A&A 571, A28 (2014)
100
101
HFI DETFLUX [Jy]
Matc
hed [%
]
90
100
100
101
HFI DETFLUX [Jy]
Non−
Matc
hed [%
]
0
5
10
15
100
101
HFI DETFLUX [Jy]
LF
I D
ET
FLU
X [Jy]
10
010
1
LFI
HFI
Fig. 4. Test of internal consistency between the two implementations ofthe MHW pipeline at 30 GHz for |b| > 30. Top panel: cumulative per-centage of sources detected by both methods. Middle panel: cumula-tive percentage of sources detected by only one of the methods. Bottompanel: comparison of the recovered flux densities (DETFLUX).
and comparison with other observations (external validation).The validation of the non-thermal radio sources can be donewith a large number of existing catalogues, whereas the val-idation of thermal sources is mostly done with simulations.Detections identified with known sources have been marked inthe catalogues.
3.1. Internal validation
The catalogues for the HFI channels have been validated pri-marily through an internal Monte Carlo quality assessment (QA)process in which artificial sources are injected in both real mapsand simulated maps. For each channel, we calculate statisticalquantities describing the quality of detection, photometry, andastrometry for each detection code. The detection is describedby the completeness and reliability of the catalogue: complete-ness is a function of intrinsic flux density, the selection thresh-old applied to detection (S/N), and location, while reliability isa function only of the detection S/N. The quality of photometryand astrometry is assessed by direct comparison of detected po-sition and flux density with the known parameters of the artificialsources. An input source is considered to be detected if a detec-tion is made within one beam FWHM of the injected position.
The completeness is determined from the injection of unre-solved point sources into the real maps. Bias due to the super-imposition of sources is avoided by preventing injection withinan exclusion radius of σb around both existing detections in thereal map and previously injected sources. The flux from real
and injected point sources contributes to the noise estimation foreach detection patch, reducing the S/N of all detections and bias-ing the completeness. We prevent this effect by determining thenoise properties on the maps before injecting sources, and haveverified that remaining bias on detection and parameter esti-mates due to injected sources is negligible. The injected sourcesare convolved with the effective beam (Planck Collaboration II2014; Planck Collaboration VI 2014).
We use two cumulative reliability estimates for the HFI cat-alogues. The first, which we will call simulation reliability, isdetermined from source injection into simulated maps and is de-fined as the fraction of detected sources that match the positionsof injected sources. If the simulations are accurate, such that thespurious and real detection number counts mirror the real cata-logue, the reliability is exact. To accept the simulations, we re-quire that they pass the internal consistency tests outlined be-low. Simulation reliability is used for the 100, 143, and 217 GHzchannels.
The simulations used to calculate simulation reliability con-sist of realizations of CMB, instrumental noise, and the diffuseGalactic emission component of the FFP6 simulations (a set ofrealistic simulations based on the Planck Sky Model; PlanckCollaboration XII 2014; Planck Collaboration Int. VII 2013;Delabrouille et al. 2013). We require that the simulated cata-logues pass two internal consistency tests: that they have thesame injected source completeness as the real catalogues cal-culated as outlined above; and that they have total detected num-ber counts, as a function of S/N, that are consistent with thosein the real data. The intrinsic number counts are assumed to bepower law functions of flux density and are fitted to the detectioncounts at higher flux densities, where the catalogues are reliableand complete, and extrapolated to lower flux densities. Sourcesare injected with random positions.
The second reliability estimator is applied to the 353, 545,and 857 GHz channels, where the simulations fail our internalconsistency tests (due to deficiencies in the simulations of diffusedust emission). In the absence of accurate simulations capableof producing realistic realisations of spurious detections, we usean approximate reliability criterion that we will call injectionreliability. Injection reliability makes use of source injection intothe real maps to determine number counts of matched sources. Ifthe fiducial input source model is accurate, the matched countsare a good estimate of the real detection counts in the catalogue.To form a reliability estimate, we take the ratio per S/N bin ofthe matched number counts over the number counts of the realcatalogue (the latter of which is the sum of real and spuriousnumber counts).
The input flux density model is assumed to be a power lawand is fitted in the same way as for the simulation reliability.The extrapolation of the input source model to lower flux den-sities is the main source of uncertainty in the injection relia-bility estimate. However, it is also subject to bias due to thePoisson fluctuations of number counts in the real catalogue. Thetotal numbers are large enough at low S/N in the higher fre-quency channels that the measurement of the increment of spu-rious sources is robust to these fluctuations. At higher S/N, how-ever, we take as reliable any bin where the difference betweenexpected real and measured total number counts is smaller thantwice the Poisson noise of the total number counts. To minimisebias from fluctuations, we also assume the catalogues are com-pletely reliable at S/N > 10. We have verified that the two relia-bility estimates are consistent with one another at 217 GHz, theonly frequency where they can both be applied.
A28, page 6 of 22
Planck Collaboration: Planck 2013 results. XXVIII.
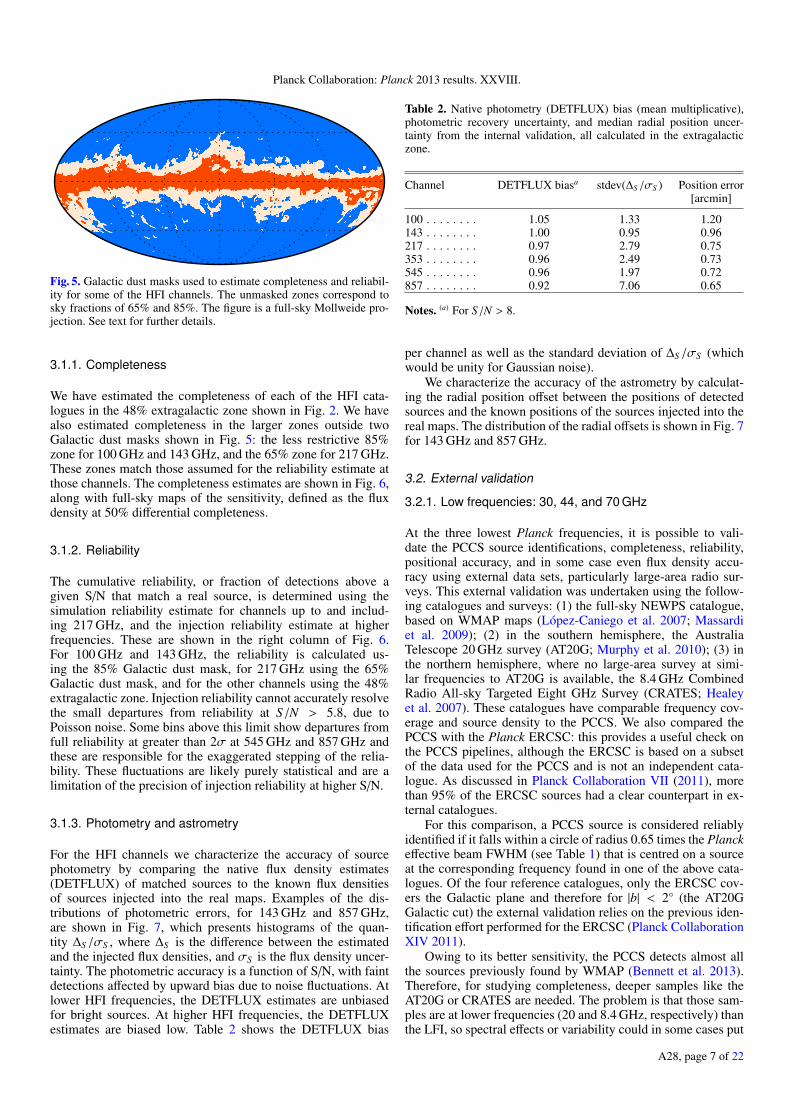
Fig. 5. Galactic dust masks used to estimate completeness and reliabil-ity for some of the HFI channels. The unmasked zones correspond tosky fractions of 65% and 85%. The figure is a full-sky Mollweide pro-jection. See text for further details.
3.1.1. Completeness
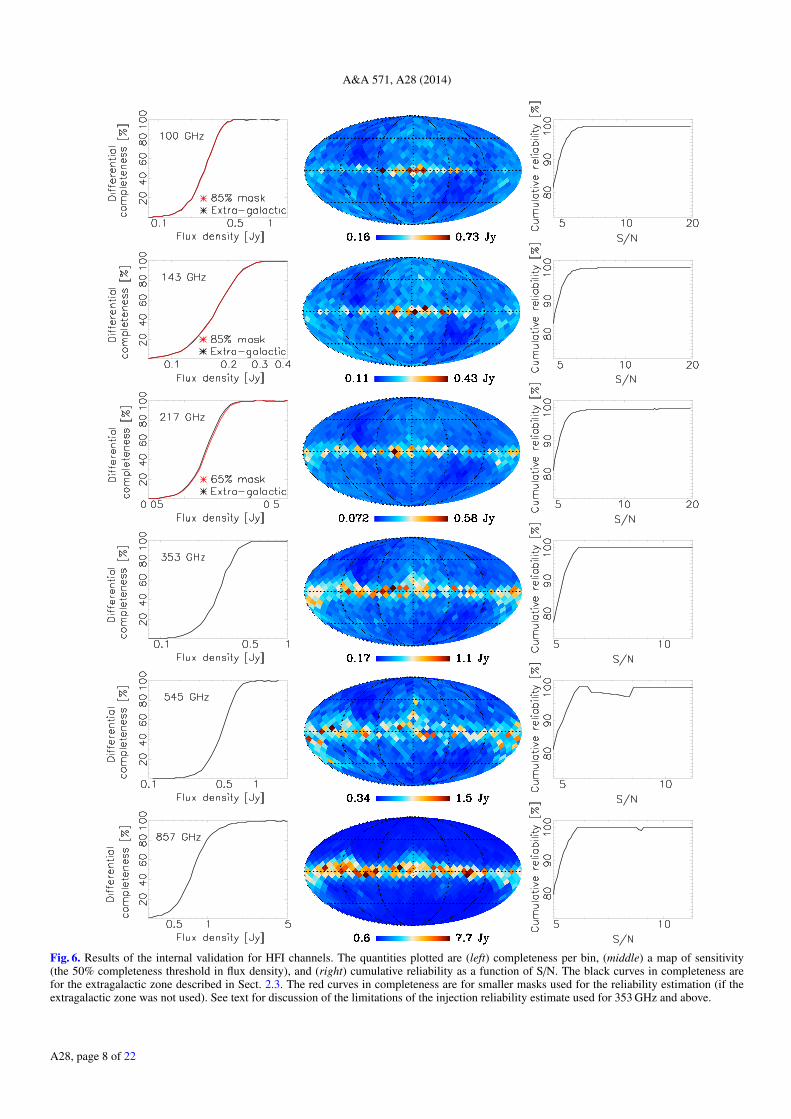
We have estimated the completeness of each of the HFI cata-logues in the 48% extragalactic zone shown in Fig. 2. We havealso estimated completeness in the larger zones outside twoGalactic dust masks shown in Fig. 5: the less restrictive 85%zone for 100 GHz and 143 GHz, and the 65% zone for 217 GHz.These zones match those assumed for the reliability estimate atthose channels. The completeness estimates are shown in Fig. 6,along with full-sky maps of the sensitivity, defined as the fluxdensity at 50% differential completeness.
3.1.2. Reliability
The cumulative reliability, or fraction of detections above agiven S/N that match a real source, is determined using thesimulation reliability estimate for channels up to and includ-ing 217 GHz, and the injection reliability estimate at higherfrequencies. These are shown in the right column of Fig. 6.For 100 GHz and 143 GHz, the reliability is calculated us-ing the 85% Galactic dust mask, for 217 GHz using the 65%Galactic dust mask, and for the other channels using the 48%extragalactic zone. Injection reliability cannot accurately resolvethe small departures from reliability at S/N > 5.8, due toPoisson noise. Some bins above this limit show departures fromfull reliability at greater than 2σ at 545 GHz and 857 GHz andthese are responsible for the exaggerated stepping of the relia-bility. These fluctuations are likely purely statistical and are alimitation of the precision of injection reliability at higher S/N.
3.1.3. Photometry and astrometry
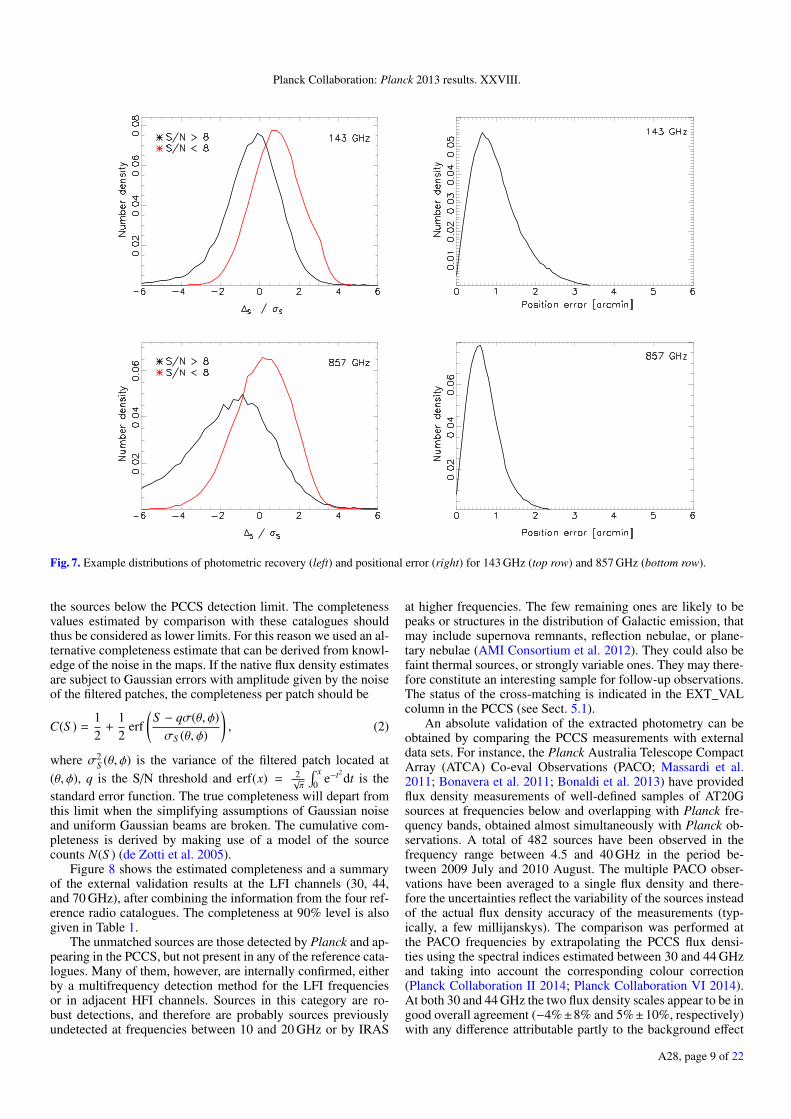
For the HFI channels we characterize the accuracy of sourcephotometry by comparing the native flux density estimates(DETFLUX) of matched sources to the known flux densitiesof sources injected into the real maps. Examples of the dis-tributions of photometric errors, for 143 GHz and 857 GHz,are shown in Fig. 7, which presents histograms of the quan-tity ∆S /σS , where ∆S is the difference between the estimatedand the injected flux densities, and σS is the flux density uncer-tainty. The photometric accuracy is a function of S/N, with faintdetections affected by upward bias due to noise fluctuations. Atlower HFI frequencies, the DETFLUX estimates are unbiasedfor bright sources. At higher HFI frequencies, the DETFLUXestimates are biased low. Table 2 shows the DETFLUX bias
Table 2. Native photometry (DETFLUX) bias (mean multiplicative),photometric recovery uncertainty, and median radial position uncer-tainty from the internal validation, all calculated in the extragalacticzone.
Channel DETFLUX biasa stdev(∆S /σS ) Position error[arcmin]
100 . . . . . . . . 1.05 1.33 1.20143 . . . . . . . . 1.00 0.95 0.96217 . . . . . . . . 0.97 2.79 0.75353 . . . . . . . . 0.96 2.49 0.73545 . . . . . . . . 0.96 1.97 0.72857 . . . . . . . . 0.92 7.06 0.65
Notes. (a) For S/N > 8.
per channel as well as the standard deviation of ∆S /σS (whichwould be unity for Gaussian noise).
We characterize the accuracy of the astrometry by calculat-ing the radial position offset between the positions of detectedsources and the known positions of the sources injected into thereal maps. The distribution of the radial offsets is shown in Fig. 7for 143 GHz and 857 GHz.
3.2. External validation
3.2.1. Low frequencies: 30, 44, and 70 GHz
At the three lowest Planck frequencies, it is possible to vali-date the PCCS source identifications, completeness, reliability,positional accuracy, and in some case even flux density accu-racy using external data sets, particularly large-area radio sur-veys. This external validation was undertaken using the follow-ing catalogues and surveys: (1) the full-sky NEWPS catalogue,based on WMAP maps (López-Caniego et al. 2007; Massardiet al. 2009); (2) in the southern hemisphere, the AustraliaTelescope 20 GHz survey (AT20G; Murphy et al. 2010); (3) inthe northern hemisphere, where no large-area survey at simi-lar frequencies to AT20G is available, the 8.4 GHz CombinedRadio All-sky Targeted Eight GHz Survey (CRATES; Healeyet al. 2007). These catalogues have comparable frequency cov-erage and source density to the PCCS. We also compared thePCCS with the Planck ERCSC: this provides a useful check onthe PCCS pipelines, although the ERCSC is based on a subsetof the data used for the PCCS and is not an independent cata-logue. As discussed in Planck Collaboration VII (2011), morethan 95% of the ERCSC sources had a clear counterpart in ex-ternal catalogues.
For this comparison, a PCCS source is considered reliablyidentified if it falls within a circle of radius 0.65 times the Planckeffective beam FWHM (see Table 1) that is centred on a sourceat the corresponding frequency found in one of the above cata-logues. Of the four reference catalogues, only the ERCSC cov-ers the Galactic plane and therefore for |b| < 2 (the AT20GGalactic cut) the external validation relies on the previous iden-tification effort performed for the ERCSC (Planck CollaborationXIV 2011).
Owing to its better sensitivity, the PCCS detects almost allthe sources previously found by WMAP (Bennett et al. 2013).Therefore, for studying completeness, deeper samples like theAT20G or CRATES are needed. The problem is that those sam-ples are at lower frequencies (20 and 8.4 GHz, respectively) thanthe LFI, so spectral effects or variability could in some cases put
A28, page 7 of 22
A&A 571, A28 (2014)
Fig. 6. Results of the internal validation for HFI channels. The quantities plotted are (left) completeness per bin, (middle) a map of sensitivity(the 50% completeness threshold in flux density), and (right) cumulative reliability as a function of S/N. The black curves in completeness arefor the extragalactic zone described in Sect. 2.3. The red curves in completeness are for smaller masks used for the reliability estimation (if theextragalactic zone was not used). See text for discussion of the limitations of the injection reliability estimate used for 353 GHz and above.
A28, page 8 of 22
Planck Collaboration: Planck 2013 results. XXVIII.
Fig. 7. Example distributions of photometric recovery (left) and positional error (right) for 143 GHz (top row) and 857 GHz (bottom row).
the sources below the PCCS detection limit. The completenessvalues estimated by comparison with these catalogues shouldthus be considered as lower limits. For this reason we used an al-ternative completeness estimate that can be derived from knowl-edge of the noise in the maps. If the native flux density estimatesare subject to Gaussian errors with amplitude given by the noiseof the filtered patches, the completeness per patch should be
C(S ) =12
+12
erf(
S − qσ(θ, φ)σS (θ, φ)
), (2)
where σ2S (θ, φ) is the variance of the filtered patch located at
(θ, φ), q is the S/N threshold and erf(x) = 2√π
∫ x0 e−t2
dt is thestandard error function. The true completeness will depart fromthis limit when the simplifying assumptions of Gaussian noiseand uniform Gaussian beams are broken. The cumulative com-pleteness is derived by making use of a model of the sourcecounts N(S ) (de Zotti et al. 2005).
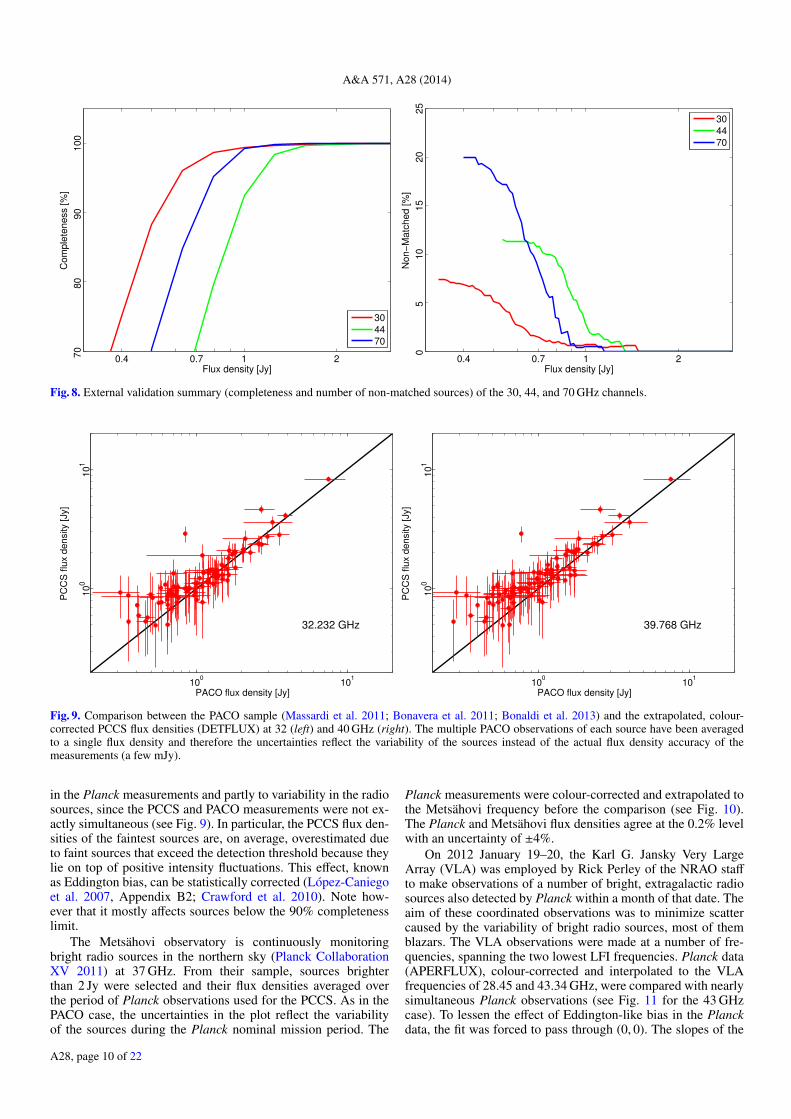
Figure 8 shows the estimated completeness and a summaryof the external validation results at the LFI channels (30, 44,and 70 GHz), after combining the information from the four ref-erence radio catalogues. The completeness at 90% level is alsogiven in Table 1.
The unmatched sources are those detected by Planck and ap-pearing in the PCCS, but not present in any of the reference cata-logues. Many of them, however, are internally confirmed, eitherby a multifrequency detection method for the LFI frequenciesor in adjacent HFI channels. Sources in this category are ro-bust detections, and therefore are probably sources previouslyundetected at frequencies between 10 and 20 GHz or by IRAS
at higher frequencies. The few remaining ones are likely to bepeaks or structures in the distribution of Galactic emission, thatmay include supernova remnants, reflection nebulae, or plane-tary nebulae (AMI Consortium et al. 2012). They could also befaint thermal sources, or strongly variable ones. They may there-fore constitute an interesting sample for follow-up observations.The status of the cross-matching is indicated in the EXT_VALcolumn in the PCCS (see Sect. 5.1).
An absolute validation of the extracted photometry can beobtained by comparing the PCCS measurements with externaldata sets. For instance, the Planck Australia Telescope CompactArray (ATCA) Co-eval Observations (PACO; Massardi et al.2011; Bonavera et al. 2011; Bonaldi et al. 2013) have providedflux density measurements of well-defined samples of AT20Gsources at frequencies below and overlapping with Planck fre-quency bands, obtained almost simultaneously with Planck ob-servations. A total of 482 sources have been observed in thefrequency range between 4.5 and 40 GHz in the period be-tween 2009 July and 2010 August. The multiple PACO obser-vations have been averaged to a single flux density and there-fore the uncertainties reflect the variability of the sources insteadof the actual flux density accuracy of the measurements (typ-ically, a few millijanskys). The comparison was performed atthe PACO frequencies by extrapolating the PCCS flux densi-ties using the spectral indices estimated between 30 and 44 GHzand taking into account the corresponding colour correction(Planck Collaboration II 2014; Planck Collaboration VI 2014).At both 30 and 44 GHz the two flux density scales appear to be ingood overall agreement (−4%±8% and 5%±10%, respectively)with any difference attributable partly to the background effect
A28, page 9 of 22
A&A 571, A28 (2014)
0.4 0.7 1 2Flux density [Jy]
Co
mp
lete
ne
ss [
%]
70
8
0
90
1
00
30
44
70
0.4 0.7 1 2Flux density [Jy]
No
n−
Ma
tch
ed
[%
]
0
5
10
15
20
25
30
44
70
Fig. 8. External validation summary (completeness and number of non-matched sources) of the 30, 44, and 70 GHz channels.
100
101
PACO flux density [Jy]
PC
CS
flu
x d
ensity [Jy]
32.232 GHz
10
010
1
100
101
PACO flux density [Jy]
PC
CS
flu
x d
ensity [Jy]
39.768 GHz
10
010
1
Fig. 9. Comparison between the PACO sample (Massardi et al. 2011; Bonavera et al. 2011; Bonaldi et al. 2013) and the extrapolated, colour-corrected PCCS flux densities (DETFLUX) at 32 (left) and 40 GHz (right). The multiple PACO observations of each source have been averagedto a single flux density and therefore the uncertainties reflect the variability of the sources instead of the actual flux density accuracy of themeasurements (a few mJy).
in the Planck measurements and partly to variability in the radiosources, since the PCCS and PACO measurements were not ex-actly simultaneous (see Fig. 9). In particular, the PCCS flux den-sities of the faintest sources are, on average, overestimated dueto faint sources that exceed the detection threshold because theylie on top of positive intensity fluctuations. This effect, knownas Eddington bias, can be statistically corrected (López-Caniegoet al. 2007, Appendix B2; Crawford et al. 2010). Note how-ever that it mostly affects sources below the 90% completenesslimit.
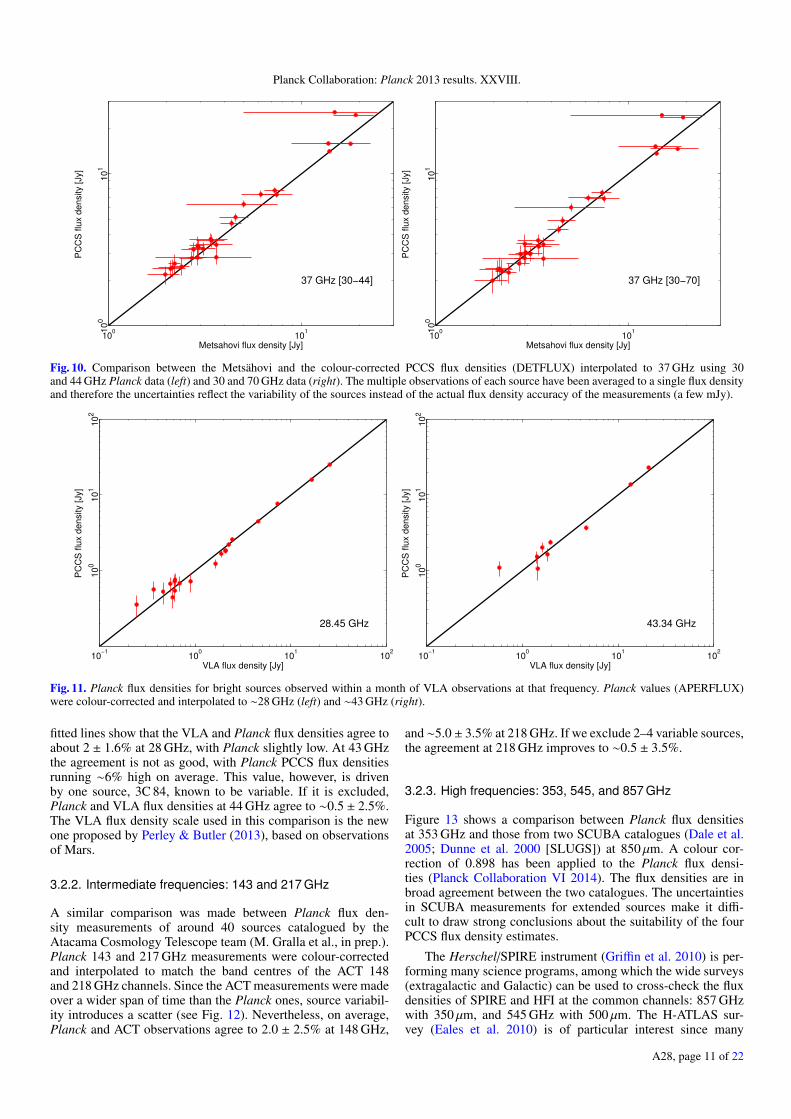
The Metsähovi observatory is continuously monitoringbright radio sources in the northern sky (Planck CollaborationXV 2011) at 37 GHz. From their sample, sources brighterthan 2 Jy were selected and their flux densities averaged overthe period of Planck observations used for the PCCS. As in thePACO case, the uncertainties in the plot reflect the variabilityof the sources during the Planck nominal mission period. The
Planck measurements were colour-corrected and extrapolated tothe Metsähovi frequency before the comparison (see Fig. 10).The Planck and Metsähovi flux densities agree at the 0.2% levelwith an uncertainty of ±4%.
On 2012 January 19–20, the Karl G. Jansky Very LargeArray (VLA) was employed by Rick Perley of the NRAO staffto make observations of a number of bright, extragalactic radiosources also detected by Planck within a month of that date. Theaim of these coordinated observations was to minimize scattercaused by the variability of bright radio sources, most of themblazars. The VLA observations were made at a number of fre-quencies, spanning the two lowest LFI frequencies. Planck data(APERFLUX), colour-corrected and interpolated to the VLAfrequencies of 28.45 and 43.34 GHz, were compared with nearlysimultaneous Planck observations (see Fig. 11 for the 43 GHzcase). To lessen the effect of Eddington-like bias in the Planckdata, the fit was forced to pass through (0, 0). The slopes of the
A28, page 10 of 22
Planck Collaboration: Planck 2013 results. XXVIII.
100
101
Metsahovi flux density [Jy]
PC
CS
flu
x d
ensity [Jy]
37 GHz [30−44]
10
010
1
100
101
Metsahovi flux density [Jy]
PC
CS
flu
x d
ensity [Jy]
37 GHz [30−70]
10
010
1
Fig. 10. Comparison between the Metsähovi and the colour-corrected PCCS flux densities (DETFLUX) interpolated to 37 GHz using 30and 44 GHz Planck data (left) and 30 and 70 GHz data (right). The multiple observations of each source have been averaged to a single flux densityand therefore the uncertainties reflect the variability of the sources instead of the actual flux density accuracy of the measurements (a few mJy).
10−1
100
101
102
VLA flux density [Jy]
PC
CS
flu
x d
en
sity [
Jy]
10
01
01
10
2
28.45 GHz
10−1
100
101
102
VLA flux density [Jy]
10
01
01
10
2
PC
CS
flu
x d
en
sity [
Jy]
43.34 GHz
Fig. 11. Planck flux densities for bright sources observed within a month of VLA observations at that frequency. Planck values (APERFLUX)were colour-corrected and interpolated to ∼28 GHz (left) and ∼43 GHz (right).
fitted lines show that the VLA and Planck flux densities agree toabout 2 ± 1.6% at 28 GHz, with Planck slightly low. At 43 GHzthe agreement is not as good, with Planck PCCS flux densitiesrunning ∼6% high on average. This value, however, is drivenby one source, 3C 84, known to be variable. If it is excluded,Planck and VLA flux densities at 44 GHz agree to ∼0.5 ± 2.5%.The VLA flux density scale used in this comparison is the newone proposed by Perley & Butler (2013), based on observationsof Mars.
3.2.2. Intermediate frequencies: 143 and 217 GHz
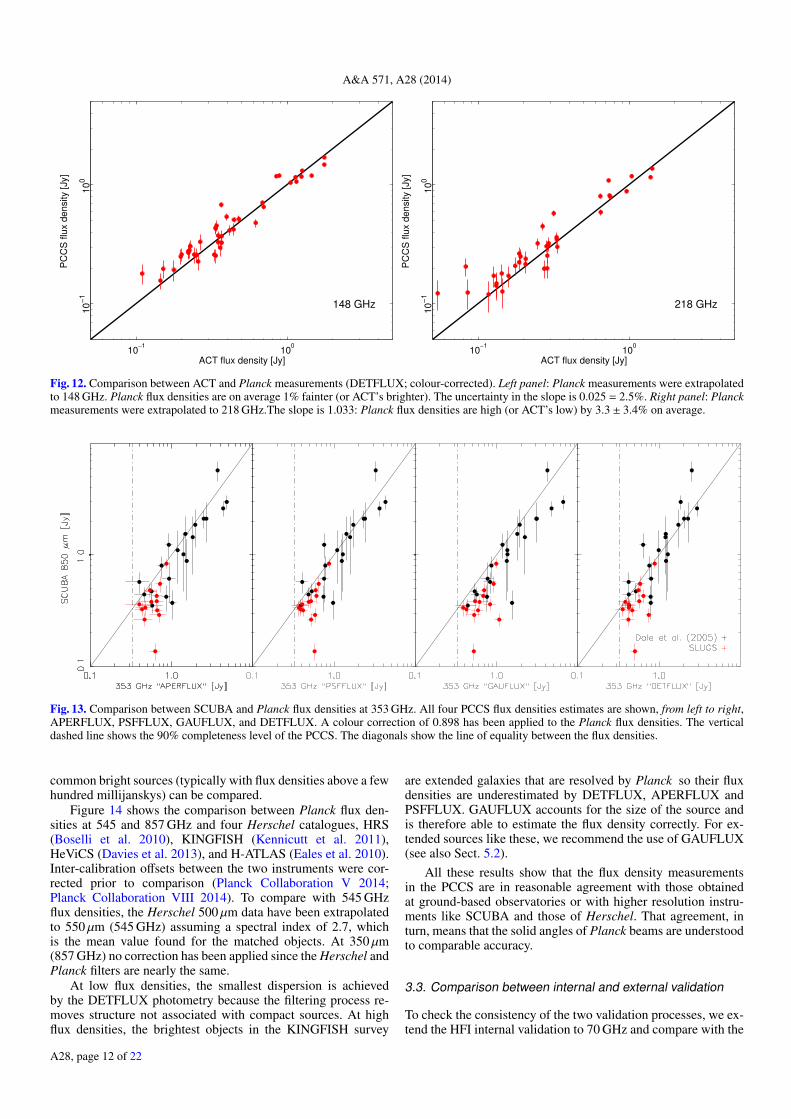
A similar comparison was made between Planck flux den-sity measurements of around 40 sources catalogued by theAtacama Cosmology Telescope team (M. Gralla et al., in prep.).Planck 143 and 217 GHz measurements were colour-correctedand interpolated to match the band centres of the ACT 148and 218 GHz channels. Since the ACT measurements were madeover a wider span of time than the Planck ones, source variabil-ity introduces a scatter (see Fig. 12). Nevertheless, on average,Planck and ACT observations agree to 2.0 ± 2.5% at 148 GHz,
and ∼5.0 ± 3.5% at 218 GHz. If we exclude 2–4 variable sources,the agreement at 218 GHz improves to ∼0.5 ± 3.5%.
3.2.3. High frequencies: 353, 545, and 857 GHz
Figure 13 shows a comparison between Planck flux densitiesat 353 GHz and those from two SCUBA catalogues (Dale et al.2005; Dunne et al. 2000 [SLUGS]) at 850 µm. A colour cor-rection of 0.898 has been applied to the Planck flux densi-ties (Planck Collaboration VI 2014). The flux densities are inbroad agreement between the two catalogues. The uncertaintiesin SCUBA measurements for extended sources make it diffi-cult to draw strong conclusions about the suitability of the fourPCCS flux density estimates.
The Herschel/SPIRE instrument (Griffin et al. 2010) is per-forming many science programs, among which the wide surveys(extragalactic and Galactic) can be used to cross-check the fluxdensities of SPIRE and HFI at the common channels: 857 GHzwith 350 µm, and 545 GHz with 500 µm. The H-ATLAS sur-vey (Eales et al. 2010) is of particular interest since many
A28, page 11 of 22
A&A 571, A28 (2014)
10−1
100
ACT flux density [Jy]
PC
CS
flu
x d
ensity [Jy]
148 GHz
10
−1
10
0
10−1
100
ACT flux density [Jy]
PC
CS
flu
x d
ensity [Jy]
218 GHz
10
−1
10
0
Fig. 12. Comparison between ACT and Planck measurements (DETFLUX; colour-corrected). Left panel: Planck measurements were extrapolatedto 148 GHz. Planck flux densities are on average 1% fainter (or ACT’s brighter). The uncertainty in the slope is 0.025 = 2.5%. Right panel: Planckmeasurements were extrapolated to 218 GHz.The slope is 1.033: Planck flux densities are high (or ACT’s low) by 3.3 ± 3.4% on average.
Fig. 13. Comparison between SCUBA and Planck flux densities at 353 GHz. All four PCCS flux densities estimates are shown, from left to right,APERFLUX, PSFFLUX, GAUFLUX, and DETFLUX. A colour correction of 0.898 has been applied to the Planck flux densities. The verticaldashed line shows the 90% completeness level of the PCCS. The diagonals show the line of equality between the flux densities.
common bright sources (typically with flux densities above a fewhundred millijanskys) can be compared.
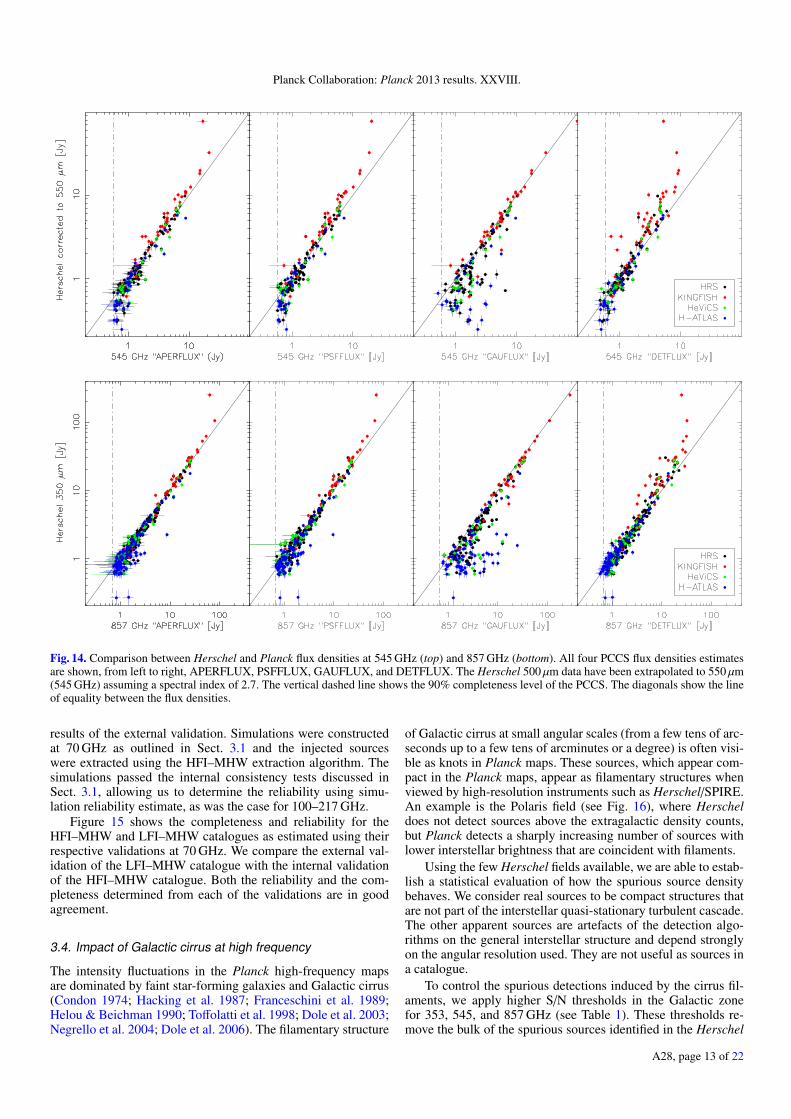
Figure 14 shows the comparison between Planck flux den-sities at 545 and 857 GHz and four Herschel catalogues, HRS(Boselli et al. 2010), KINGFISH (Kennicutt et al. 2011),HeViCS (Davies et al. 2013), and H-ATLAS (Eales et al. 2010).Inter-calibration offsets between the two instruments were cor-rected prior to comparison (Planck Collaboration V 2014;Planck Collaboration VIII 2014). To compare with 545 GHzflux densities, the Herschel 500 µm data have been extrapolatedto 550 µm (545 GHz) assuming a spectral index of 2.7, whichis the mean value found for the matched objects. At 350 µm(857 GHz) no correction has been applied since the Herschel andPlanck filters are nearly the same.
At low flux densities, the smallest dispersion is achievedby the DETFLUX photometry because the filtering process re-moves structure not associated with compact sources. At highflux densities, the brightest objects in the KINGFISH survey
are extended galaxies that are resolved by Planck so their fluxdensities are underestimated by DETFLUX, APERFLUX andPSFFLUX. GAUFLUX accounts for the size of the source andis therefore able to estimate the flux density correctly. For ex-tended sources like these, we recommend the use of GAUFLUX(see also Sect. 5.2).
All these results show that the flux density measurementsin the PCCS are in reasonable agreement with those obtainedat ground-based observatories or with higher resolution instru-ments like SCUBA and those of Herschel. That agreement, inturn, means that the solid angles of Planck beams are understoodto comparable accuracy.
3.3. Comparison between internal and external validation
To check the consistency of the two validation processes, we ex-tend the HFI internal validation to 70 GHz and compare with the
A28, page 12 of 22
Planck Collaboration: Planck 2013 results. XXVIII.
Fig. 14. Comparison between Herschel and Planck flux densities at 545 GHz (top) and 857 GHz (bottom). All four PCCS flux densities estimatesare shown, from left to right, APERFLUX, PSFFLUX, GAUFLUX, and DETFLUX. The Herschel 500 µm data have been extrapolated to 550 µm(545 GHz) assuming a spectral index of 2.7. The vertical dashed line shows the 90% completeness level of the PCCS. The diagonals show the lineof equality between the flux densities.
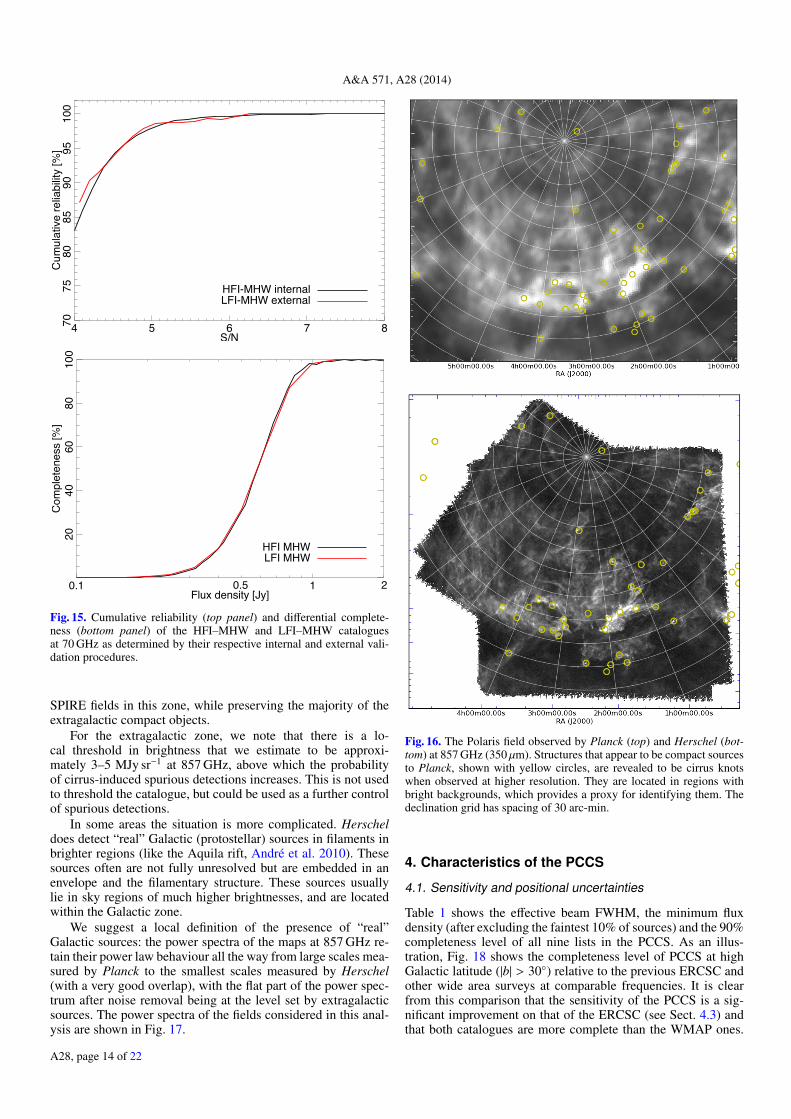
results of the external validation. Simulations were constructedat 70 GHz as outlined in Sect. 3.1 and the injected sourceswere extracted using the HFI–MHW extraction algorithm. Thesimulations passed the internal consistency tests discussed inSect. 3.1, allowing us to determine the reliability using simu-lation reliability estimate, as was the case for 100–217 GHz.
Figure 15 shows the completeness and reliability for theHFI–MHW and LFI–MHW catalogues as estimated using theirrespective validations at 70 GHz. We compare the external val-idation of the LFI–MHW catalogue with the internal validationof the HFI–MHW catalogue. Both the reliability and the com-pleteness determined from each of the validations are in goodagreement.
3.4. Impact of Galactic cirrus at high frequency
The intensity fluctuations in the Planck high-frequency mapsare dominated by faint star-forming galaxies and Galactic cirrus(Condon 1974; Hacking et al. 1987; Franceschini et al. 1989;Helou & Beichman 1990; Toffolatti et al. 1998; Dole et al. 2003;Negrello et al. 2004; Dole et al. 2006). The filamentary structure
of Galactic cirrus at small angular scales (from a few tens of arc-seconds up to a few tens of arcminutes or a degree) is often visi-ble as knots in Planck maps. These sources, which appear com-pact in the Planck maps, appear as filamentary structures whenviewed by high-resolution instruments such as Herschel/SPIRE.An example is the Polaris field (see Fig. 16), where Herscheldoes not detect sources above the extragalactic density counts,but Planck detects a sharply increasing number of sources withlower interstellar brightness that are coincident with filaments.
Using the few Herschel fields available, we are able to estab-lish a statistical evaluation of how the spurious source densitybehaves. We consider real sources to be compact structures thatare not part of the interstellar quasi-stationary turbulent cascade.The other apparent sources are artefacts of the detection algo-rithms on the general interstellar structure and depend stronglyon the angular resolution used. They are not useful as sources ina catalogue.
To control the spurious detections induced by the cirrus fil-aments, we apply higher S/N thresholds in the Galactic zonefor 353, 545, and 857 GHz (see Table 1). These thresholds re-move the bulk of the spurious sources identified in the Herschel
A28, page 13 of 22
A&A 571, A28 (2014)
70
7580
8590
9510
0
4 5 6 7 8S/N
Cum
ulat
ive
relia
bilit
y [%
]
LFI-MHW externalHFI-MHW internal
2040
6080
100
0.1 1Flux density [Jy]
Com
plet
enes
s [%
]
0.5 2
LFI MHWHFI MHW
Fig. 15. Cumulative reliability (top panel) and differential complete-ness (bottom panel) of the HFI–MHW and LFI–MHW cataloguesat 70 GHz as determined by their respective internal and external vali-dation procedures.
SPIRE fields in this zone, while preserving the majority of theextragalactic compact objects.
For the extragalactic zone, we note that there is a lo-cal threshold in brightness that we estimate to be approxi-mately 3–5 MJy sr−1 at 857 GHz, above which the probabilityof cirrus-induced spurious detections increases. This is not usedto threshold the catalogue, but could be used as a further controlof spurious detections.
In some areas the situation is more complicated. Herscheldoes detect “real” Galactic (protostellar) sources in filaments inbrighter regions (like the Aquila rift, André et al. 2010). Thesesources often are not fully unresolved but are embedded in anenvelope and the filamentary structure. These sources usuallylie in sky regions of much higher brightnesses, and are locatedwithin the Galactic zone.
We suggest a local definition of the presence of “real”Galactic sources: the power spectra of the maps at 857 GHz re-tain their power law behaviour all the way from large scales mea-sured by Planck to the smallest scales measured by Herschel(with a very good overlap), with the flat part of the power spec-trum after noise removal being at the level set by extragalacticsources. The power spectra of the fields considered in this anal-ysis are shown in Fig. 17.
Fig. 16. The Polaris field observed by Planck (top) and Herschel (bot-tom) at 857 GHz (350 µm). Structures that appear to be compact sourcesto Planck, shown with yellow circles, are revealed to be cirrus knotswhen observed at higher resolution. They are located in regions withbright backgrounds, which provides a proxy for identifying them. Thedeclination grid has spacing of 30 arc-min.
4. Characteristics of the PCCS
4.1. Sensitivity and positional uncertainties
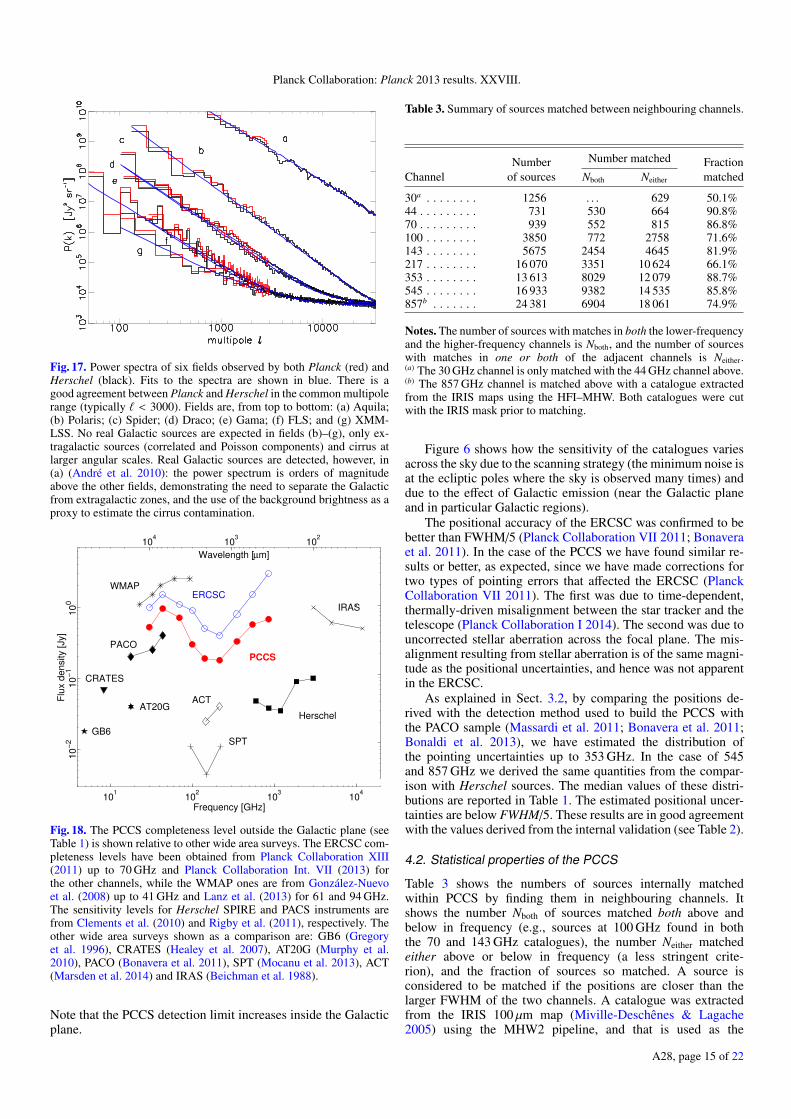
Table 1 shows the effective beam FWHM, the minimum fluxdensity (after excluding the faintest 10% of sources) and the 90%completeness level of all nine lists in the PCCS. As an illus-tration, Fig. 18 shows the completeness level of PCCS at highGalactic latitude (|b| > 30) relative to the previous ERCSC andother wide area surveys at comparable frequencies. It is clearfrom this comparison that the sensitivity of the PCCS is a sig-nificant improvement on that of the ERCSC (see Sect. 4.3) andthat both catalogues are more complete than the WMAP ones.
A28, page 14 of 22
Planck Collaboration: Planck 2013 results. XXVIII.
Fig. 17. Power spectra of six fields observed by both Planck (red) andHerschel (black). Fits to the spectra are shown in blue. There is agood agreement between Planck and Herschel in the common multipolerange (typically ` < 3000). Fields are, from top to bottom: (a) Aquila;(b) Polaris; (c) Spider; (d) Draco; (e) Gama; (f) FLS; and (g) XMM-LSS. No real Galactic sources are expected in fields (b)–(g), only ex-tragalactic sources (correlated and Poisson components) and cirrus atlarger angular scales. Real Galactic sources are detected, however, in(a) (André et al. 2010): the power spectrum is orders of magnitudeabove the other fields, demonstrating the need to separate the Galacticfrom extragalactic zones, and the use of the background brightness as aproxy to estimate the cirrus contamination.
101
102
103
104
PCCS
ERCSCWMAP
PACO
CRATES
GB6SPT
ACTAT20G
Herschel
IRAS
Frequency [GHz]
Flu
x d
ensity [Jy]
10
−2
10
−1
10
0
Wavelength [µm]
102
103
104
Fig. 18. The PCCS completeness level outside the Galactic plane (seeTable 1) is shown relative to other wide area surveys. The ERCSC com-pleteness levels have been obtained from Planck Collaboration XIII(2011) up to 70 GHz and Planck Collaboration Int. VII (2013) forthe other channels, while the WMAP ones are from González-Nuevoet al. (2008) up to 41 GHz and Lanz et al. (2013) for 61 and 94 GHz.The sensitivity levels for Herschel SPIRE and PACS instruments arefrom Clements et al. (2010) and Rigby et al. (2011), respectively. Theother wide area surveys shown as a comparison are: GB6 (Gregoryet al. 1996), CRATES (Healey et al. 2007), AT20G (Murphy et al.2010), PACO (Bonavera et al. 2011), SPT (Mocanu et al. 2013), ACT(Marsden et al. 2014) and IRAS (Beichman et al. 1988).
Note that the PCCS detection limit increases inside the Galacticplane.
Table 3. Summary of sources matched between neighbouring channels.
Number Number matched FractionChannel of sources Nboth Neither matched
30a . . . . . . . . 1256 . . . 629 50.1%44 . . . . . . . . . 731 530 664 90.8%70 . . . . . . . . . 939 552 815 86.8%100 . . . . . . . . 3850 772 2758 71.6%143 . . . . . . . . 5675 2454 4645 81.9%217 . . . . . . . . 16 070 3351 10 624 66.1%353 . . . . . . . . 13 613 8029 12 079 88.7%545 . . . . . . . . 16 933 9382 14 535 85.8%857b . . . . . . . 24 381 6904 18 061 74.9%
Notes. The number of sources with matches in both the lower-frequencyand the higher-frequency channels is Nboth, and the number of sourceswith matches in one or both of the adjacent channels is Neither.(a) The 30 GHz channel is only matched with the 44 GHz channel above.(b) The 857 GHz channel is matched above with a catalogue extractedfrom the IRIS maps using the HFI–MHW. Both catalogues were cutwith the IRIS mask prior to matching.
Figure 6 shows how the sensitivity of the catalogues variesacross the sky due to the scanning strategy (the minimum noise isat the ecliptic poles where the sky is observed many times) anddue to the effect of Galactic emission (near the Galactic planeand in particular Galactic regions).
The positional accuracy of the ERCSC was confirmed to bebetter than FWHM/5 (Planck Collaboration VII 2011; Bonaveraet al. 2011). In the case of the PCCS we have found similar re-sults or better, as expected, since we have made corrections fortwo types of pointing errors that affected the ERCSC (PlanckCollaboration VII 2011). The first was due to time-dependent,thermally-driven misalignment between the star tracker and thetelescope (Planck Collaboration I 2014). The second was due touncorrected stellar aberration across the focal plane. The mis-alignment resulting from stellar aberration is of the same magni-tude as the positional uncertainties, and hence was not apparentin the ERCSC.
As explained in Sect. 3.2, by comparing the positions de-rived with the detection method used to build the PCCS withthe PACO sample (Massardi et al. 2011; Bonavera et al. 2011;Bonaldi et al. 2013), we have estimated the distribution ofthe pointing uncertainties up to 353 GHz. In the case of 545and 857 GHz we derived the same quantities from the compar-ison with Herschel sources. The median values of these distri-butions are reported in Table 1. The estimated positional uncer-tainties are below FWHM/5. These results are in good agreementwith the values derived from the internal validation (see Table 2).
4.2. Statistical properties of the PCCS
Table 3 shows the numbers of sources internally matchedwithin PCCS by finding them in neighbouring channels. Itshows the number Nboth of sources matched both above andbelow in frequency (e.g., sources at 100 GHz found in boththe 70 and 143 GHz catalogues), the number Neither matchedeither above or below in frequency (a less stringent crite-rion), and the fraction of sources so matched. A source isconsidered to be matched if the positions are closer than thelarger FWHM of the two channels. A catalogue was extractedfrom the IRIS 100 µm map (Miville-Deschênes & Lagache2005) using the MHW2 pipeline, and that is used as the
A28, page 15 of 22
A&A 571, A28 (2014)
30−44 GHz
N=224
N(α>1)/N=0.100.1
0.2
44−70 GHz
N=192
N(α>1)/N=0.000.1
0.2
70−100 GHz
N=264
N(α>1)/N=0.000.1
0.2
Fra
ctio
n o
f so
urc
es
−1 0 1 2 3
100−143 GHz
N=564
N(α>1)/N=0.00
Spectral index
0.1
0.2
143−217 GHz
N=670
N(α>1)/N=0.13
217−353 GHz
N=887
N(α>1)/N=0.77
353−545 GHz
N=1284
N(α>1)/N=0.94
−1 0 1 2 3
545−857 GHz
N=2510
N(α>1)/N=0.97
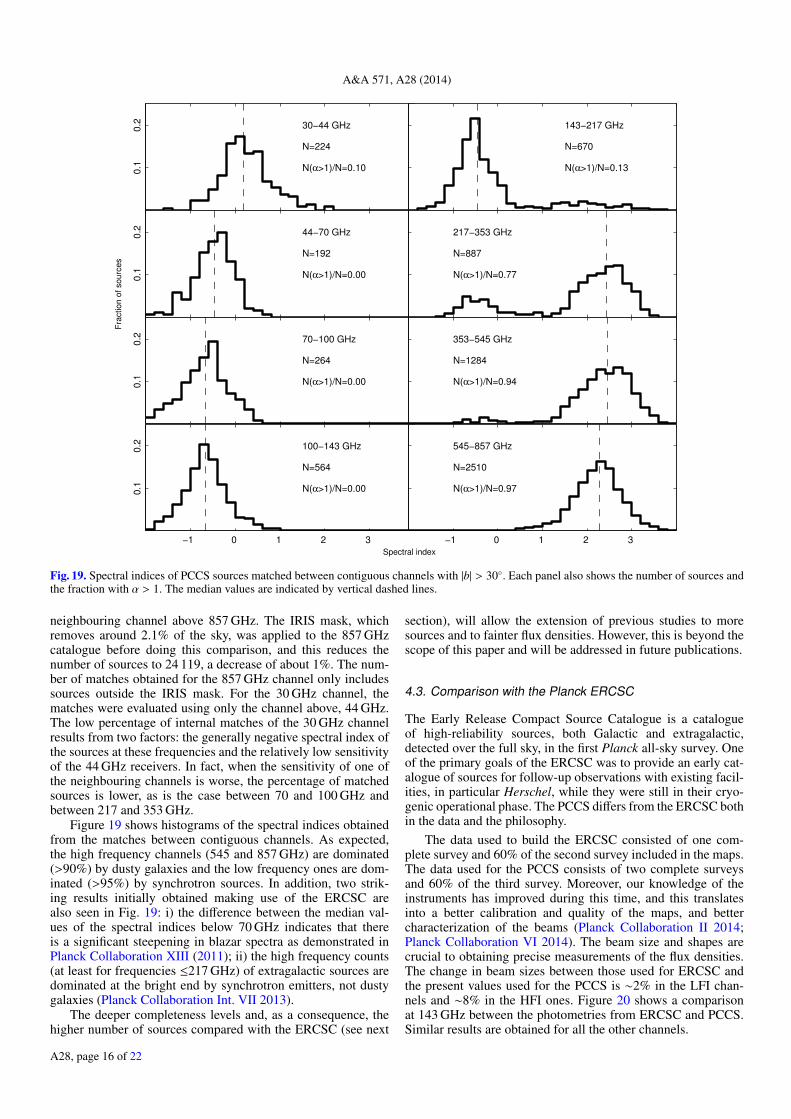
Fig. 19. Spectral indices of PCCS sources matched between contiguous channels with |b| > 30. Each panel also shows the number of sources andthe fraction with α > 1. The median values are indicated by vertical dashed lines.
neighbouring channel above 857 GHz. The IRIS mask, whichremoves around 2.1% of the sky, was applied to the 857 GHzcatalogue before doing this comparison, and this reduces thenumber of sources to 24 119, a decrease of about 1%. The num-ber of matches obtained for the 857 GHz channel only includessources outside the IRIS mask. For the 30 GHz channel, thematches were evaluated using only the channel above, 44 GHz.The low percentage of internal matches of the 30 GHz channelresults from two factors: the generally negative spectral index ofthe sources at these frequencies and the relatively low sensitivityof the 44 GHz receivers. In fact, when the sensitivity of one ofthe neighbouring channels is worse, the percentage of matchedsources is lower, as is the case between 70 and 100 GHz andbetween 217 and 353 GHz.
Figure 19 shows histograms of the spectral indices obtainedfrom the matches between contiguous channels. As expected,the high frequency channels (545 and 857 GHz) are dominated(>90%) by dusty galaxies and the low frequency ones are dom-inated (>95%) by synchrotron sources. In addition, two strik-ing results initially obtained making use of the ERCSC arealso seen in Fig. 19: i) the difference between the median val-ues of the spectral indices below 70 GHz indicates that thereis a significant steepening in blazar spectra as demonstrated inPlanck Collaboration XIII (2011); ii) the high frequency counts(at least for frequencies ≤217 GHz) of extragalactic sources aredominated at the bright end by synchrotron emitters, not dustygalaxies (Planck Collaboration Int. VII 2013).
The deeper completeness levels and, as a consequence, thehigher number of sources compared with the ERCSC (see next
section), will allow the extension of previous studies to moresources and to fainter flux densities. However, this is beyond thescope of this paper and will be addressed in future publications.
4.3. Comparison with the Planck ERCSC
The Early Release Compact Source Catalogue is a catalogueof high-reliability sources, both Galactic and extragalactic,detected over the full sky, in the first Planck all-sky survey. Oneof the primary goals of the ERCSC was to provide an early cat-alogue of sources for follow-up observations with existing facil-ities, in particular Herschel, while they were still in their cryo-genic operational phase. The PCCS differs from the ERCSC bothin the data and the philosophy.
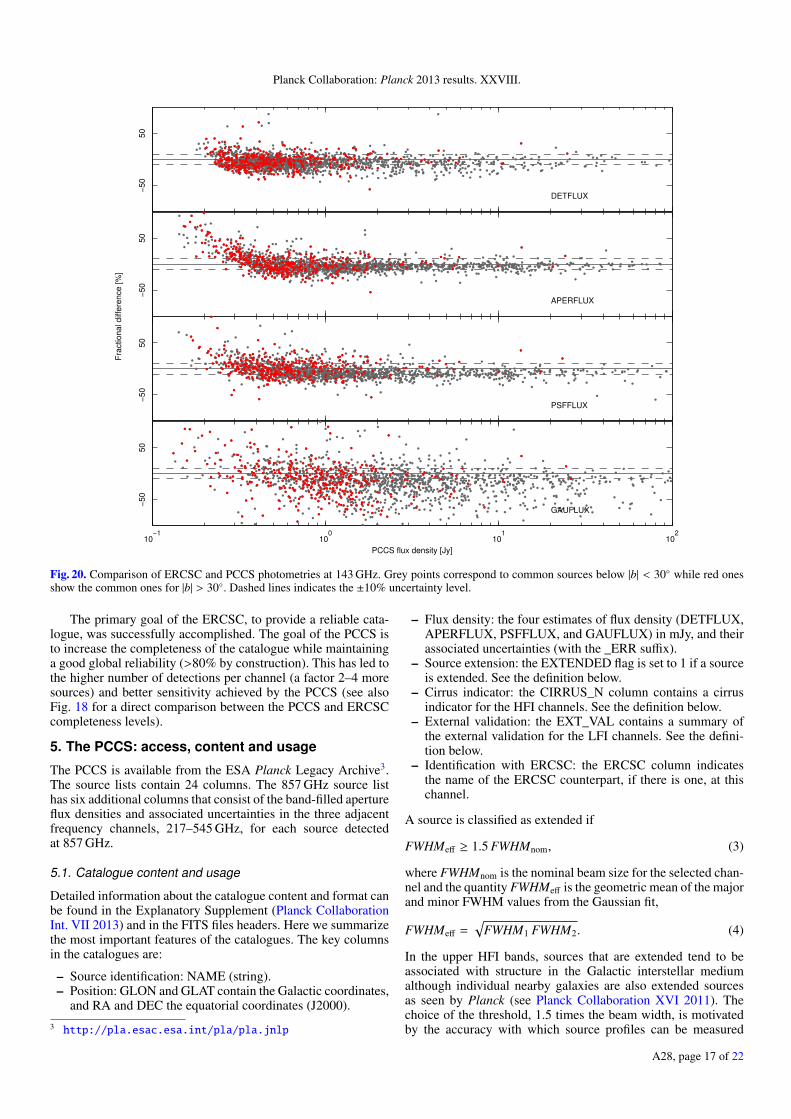
The data used to build the ERCSC consisted of one com-plete survey and 60% of the second survey included in the maps.The data used for the PCCS consists of two complete surveysand 60% of the third survey. Moreover, our knowledge of theinstruments has improved during this time, and this translatesinto a better calibration and quality of the maps, and bettercharacterization of the beams (Planck Collaboration II 2014;Planck Collaboration VI 2014). The beam size and shapes arecrucial to obtaining precise measurements of the flux densities.The change in beam sizes between those used for ERCSC andthe present values used for the PCCS is ∼2% in the LFI chan-nels and ∼8% in the HFI ones. Figure 20 shows a comparisonat 143 GHz between the photometries from ERCSC and PCCS.Similar results are obtained for all the other channels.
A28, page 16 of 22
Planck Collaboration: Planck 2013 results. XXVIII.
DETFLUX
−5
05
0
APERFLUX
−5
05
0
PSFFLUX
−5
05
0
Fra
ctio
na
l d
iffe
ren
ce
[%
]
10−1
100
101
102
GAUFLUX
−5
05
0
PCCS flux density [Jy]
Fig. 20. Comparison of ERCSC and PCCS photometries at 143 GHz. Grey points correspond to common sources below |b| < 30 while red onesshow the common ones for |b| > 30. Dashed lines indicates the ±10% uncertainty level.
The primary goal of the ERCSC, to provide a reliable cata-logue, was successfully accomplished. The goal of the PCCS isto increase the completeness of the catalogue while maintaininga good global reliability (>80% by construction). This has led tothe higher number of detections per channel (a factor 2–4 moresources) and better sensitivity achieved by the PCCS (see alsoFig. 18 for a direct comparison between the PCCS and ERCSCcompleteness levels).
5. The PCCS: access, content and usage
The PCCS is available from the ESA Planck Legacy Archive3.The source lists contain 24 columns. The 857 GHz source listhas six additional columns that consist of the band-filled apertureflux densities and associated uncertainties in the three adjacentfrequency channels, 217–545 GHz, for each source detectedat 857 GHz.
5.1. Catalogue content and usage
Detailed information about the catalogue content and format canbe found in the Explanatory Supplement (Planck CollaborationInt. VII 2013) and in the FITS files headers. Here we summarizethe most important features of the catalogues. The key columnsin the catalogues are:
– Source identification: NAME (string).– Position: GLON and GLAT contain the Galactic coordinates,
and RA and DEC the equatorial coordinates (J2000).3 http://pla.esac.esa.int/pla/pla.jnlp
– Flux density: the four estimates of flux density (DETFLUX,APERFLUX, PSFFLUX, and GAUFLUX) in mJy, and theirassociated uncertainties (with the _ERR suffix).
– Source extension: the EXTENDED flag is set to 1 if a sourceis extended. See the definition below.
– Cirrus indicator: the CIRRUS_N column contains a cirrusindicator for the HFI channels. See the definition below.
– External validation: the EXT_VAL contains a summary ofthe external validation for the LFI channels. See the defini-tion below.
– Identification with ERCSC: the ERCSC column indicatesthe name of the ERCSC counterpart, if there is one, at thischannel.
A source is classified as extended if
FWHMeff ≥ 1.5 FWHMnom, (3)
where FWHMnom is the nominal beam size for the selected chan-nel and the quantity FWHMeff is the geometric mean of the majorand minor FWHM values from the Gaussian fit,
FWHMeff =√
FWHM1 FWHM2. (4)
In the upper HFI bands, sources that are extended tend to beassociated with structure in the Galactic interstellar mediumalthough individual nearby galaxies are also extended sourcesas seen by Planck (see Planck Collaboration XVI 2011). Thechoice of the threshold, 1.5 times the beam width, is motivatedby the accuracy with which source profiles can be measured
A28, page 17 of 22
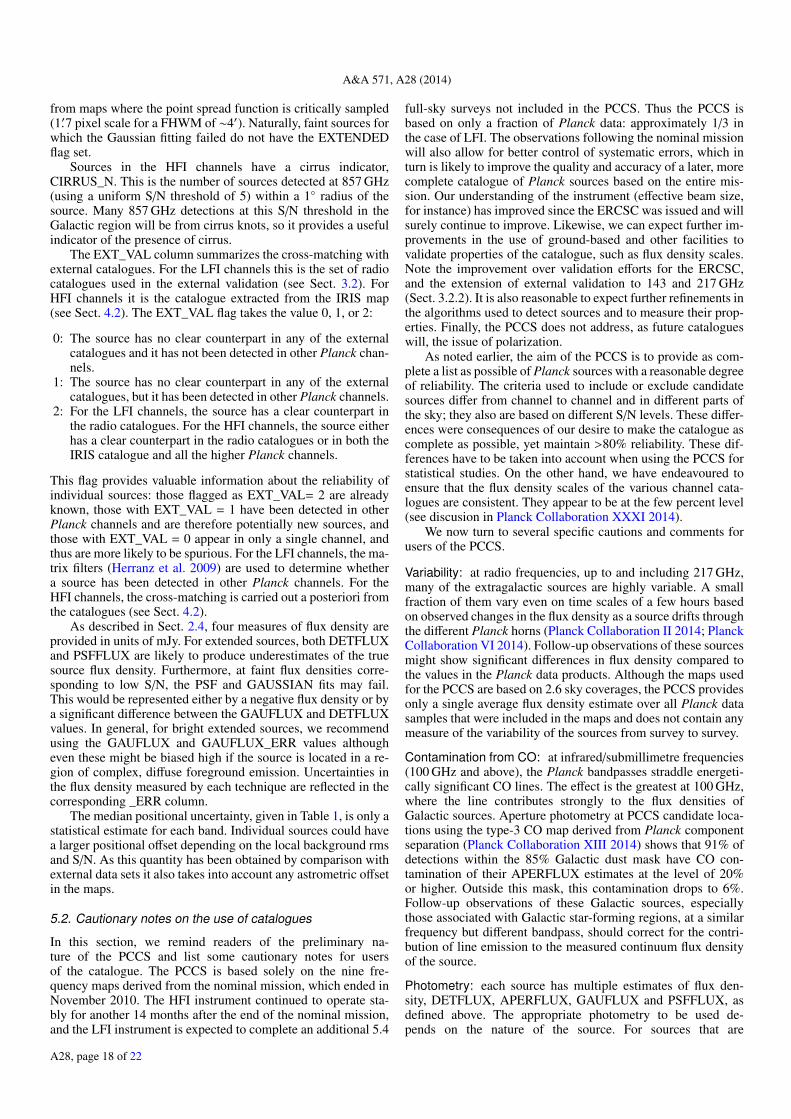
A&A 571, A28 (2014)
from maps where the point spread function is critically sampled(1.′7 pixel scale for a FHWM of ∼4′). Naturally, faint sources forwhich the Gaussian fitting failed do not have the EXTENDEDflag set.
Sources in the HFI channels have a cirrus indicator,CIRRUS_N. This is the number of sources detected at 857 GHz(using a uniform S/N threshold of 5) within a 1 radius of thesource. Many 857 GHz detections at this S/N threshold in theGalactic region will be from cirrus knots, so it provides a usefulindicator of the presence of cirrus.
The EXT_VAL column summarizes the cross-matching withexternal catalogues. For the LFI channels this is the set of radiocatalogues used in the external validation (see Sect. 3.2). ForHFI channels it is the catalogue extracted from the IRIS map(see Sect. 4.2). The EXT_VAL flag takes the value 0, 1, or 2:
0: The source has no clear counterpart in any of the externalcatalogues and it has not been detected in other Planck chan-nels.
1: The source has no clear counterpart in any of the externalcatalogues, but it has been detected in other Planck channels.
2: For the LFI channels, the source has a clear counterpart inthe radio catalogues. For the HFI channels, the source eitherhas a clear counterpart in the radio catalogues or in both theIRIS catalogue and all the higher Planck channels.
This flag provides valuable information about the reliability ofindividual sources: those flagged as EXT_VAL= 2 are alreadyknown, those with EXT_VAL = 1 have been detected in otherPlanck channels and are therefore potentially new sources, andthose with EXT_VAL = 0 appear in only a single channel, andthus are more likely to be spurious. For the LFI channels, the ma-trix filters (Herranz et al. 2009) are used to determine whethera source has been detected in other Planck channels. For theHFI channels, the cross-matching is carried out a posteriori fromthe catalogues (see Sect. 4.2).
As described in Sect. 2.4, four measures of flux density areprovided in units of mJy. For extended sources, both DETFLUXand PSFFLUX are likely to produce underestimates of the truesource flux density. Furthermore, at faint flux densities corre-sponding to low S/N, the PSF and GAUSSIAN fits may fail.This would be represented either by a negative flux density or bya significant difference between the GAUFLUX and DETFLUXvalues. In general, for bright extended sources, we recommendusing the GAUFLUX and GAUFLUX_ERR values althougheven these might be biased high if the source is located in a re-gion of complex, diffuse foreground emission. Uncertainties inthe flux density measured by each technique are reflected in thecorresponding _ERR column.
The median positional uncertainty, given in Table 1, is only astatistical estimate for each band. Individual sources could havea larger positional offset depending on the local background rmsand S/N. As this quantity has been obtained by comparison withexternal data sets it also takes into account any astrometric offsetin the maps.
5.2. Cautionary notes on the use of catalogues
In this section, we remind readers of the preliminary na-ture of the PCCS and list some cautionary notes for usersof the catalogue. The PCCS is based solely on the nine fre-quency maps derived from the nominal mission, which ended inNovember 2010. The HFI instrument continued to operate sta-bly for another 14 months after the end of the nominal mission,and the LFI instrument is expected to complete an additional 5.4
full-sky surveys not included in the PCCS. Thus the PCCS isbased on only a fraction of Planck data: approximately 1/3 inthe case of LFI. The observations following the nominal missionwill also allow for better control of systematic errors, which inturn is likely to improve the quality and accuracy of a later, morecomplete catalogue of Planck sources based on the entire mis-sion. Our understanding of the instrument (effective beam size,for instance) has improved since the ERCSC was issued and willsurely continue to improve. Likewise, we can expect further im-provements in the use of ground-based and other facilities tovalidate properties of the catalogue, such as flux density scales.Note the improvement over validation efforts for the ERCSC,and the extension of external validation to 143 and 217 GHz(Sect. 3.2.2). It is also reasonable to expect further refinements inthe algorithms used to detect sources and to measure their prop-erties. Finally, the PCCS does not address, as future catalogueswill, the issue of polarization.
As noted earlier, the aim of the PCCS is to provide as com-plete a list as possible of Planck sources with a reasonable degreeof reliability. The criteria used to include or exclude candidatesources differ from channel to channel and in different parts ofthe sky; they also are based on different S/N levels. These differ-ences were consequences of our desire to make the catalogue ascomplete as possible, yet maintain >80% reliability. These dif-ferences have to be taken into account when using the PCCS forstatistical studies. On the other hand, we have endeavoured toensure that the flux density scales of the various channel cata-logues are consistent. They appear to be at the few percent level(see discusion in Planck Collaboration XXXI 2014).
We now turn to several specific cautions and comments forusers of the PCCS.
Variability: at radio frequencies, up to and including 217 GHz,many of the extragalactic sources are highly variable. A smallfraction of them vary even on time scales of a few hours basedon observed changes in the flux density as a source drifts throughthe different Planck horns (Planck Collaboration II 2014; PlanckCollaboration VI 2014). Follow-up observations of these sourcesmight show significant differences in flux density compared tothe values in the Planck data products. Although the maps usedfor the PCCS are based on 2.6 sky coverages, the PCCS providesonly a single average flux density estimate over all Planck datasamples that were included in the maps and does not contain anymeasure of the variability of the sources from survey to survey.
Contamination from CO: at infrared/submillimetre frequencies(100 GHz and above), the Planck bandpasses straddle energeti-cally significant CO lines. The effect is the greatest at 100 GHz,where the line contributes strongly to the flux densities ofGalactic sources. Aperture photometry at PCCS candidate loca-tions using the type-3 CO map derived from Planck componentseparation (Planck Collaboration XIII 2014) shows that 91% ofdetections within the 85% Galactic dust mask have CO con-tamination of their APERFLUX estimates at the level of 20%or higher. Outside this mask, this contamination drops to 6%.Follow-up observations of these Galactic sources, especiallythose associated with Galactic star-forming regions, at a similarfrequency but different bandpass, should correct for the contri-bution of line emission to the measured continuum flux densityof the source.
Photometry: each source has multiple estimates of flux den-sity, DETFLUX, APERFLUX, GAUFLUX and PSFFLUX, asdefined above. The appropriate photometry to be used de-pends on the nature of the source. For sources that are
A28, page 18 of 22
Planck Collaboration: Planck 2013 results. XXVIII.
unresolved at the spatial resolution of Planck, APERFLUX andDETFLUX are most appropriate. Even in this regime, PSF orGaussian fits of faint sources fail and consequently these havea PSFFLUX/GAUFLUX value of NaN (“Not a Number”). Forbright resolved sources, GAUFLUX might be most appropriatealthough GAUFLUX appears to overestimate the flux density ofthe sources close to the Galactic plane due to an inability to fitfor the contribution of the Galactic background at the spatial res-olution of the data. For the 353–857 GHz channels, the complexnature of the diffuse emission and the relative undersampling ofthe beam produces a bias in DETFLUX, we therefore recom-mend that APERFLUX is used instead (see Fig. 14).
Calibration: the absolute calibration uncertainties of Planckare <1% for 30–217 GHz and are <1.2% at 353 GHz. For 545and 857 GHz, the absolute calibration uncertainty is <10%(Planck Collaboration II 2014; Planck Collaboration V 2014;Planck Collaboration VI 2014; Planck Collaboration VIII 2014).For these two channels the calibration uncertainty is an apprecia-ble systematic error on the photometry, which is not included inthe internal validation (as it was not simulated) or the externalcomparison with Herschel photometry (see Sect. 3.2.3) as theinter-calibration between HFI and SPIRE was corrected prior tocomparison.
Colour correction: the flux density estimates have not beencolour corrected. Colour corrections are described in PlanckCollaboration II (2014) and Planck Collaboration VI (2014). Thetypical amplitude of the correction is below 4% for synchrotron-like spectra in the LFI channels and below 15% for thermal emis-sion in the HFI channels. Colour corrections can be calculatedusing Planck unit conversion and colour correction software(UC_CC), included in the data release (Planck CollaborationIX 2014), which uses the instrumental bandpasses (PlanckCollaboration Int. VII 2013).
Cirrus/ISM: a significant fraction of the sources detected in theupper HFI bands could be associated with Galactic interstel-lar medium features or cirrus. The value of CIRRUS_N in thecatalogue can be used to flag sources that might be clusteredtogether and thereby associated with ISM structure. CandidateISM features can also be selected by choosing objects withEXTENDED =1 although nearby Galactic and extragalacticsources that are extended at Planck spatial resolution will meetthis criterion too. The 857 GHz brightness proxy described inSect. 3.4 can also be used as indicator of cirrus contamination.
6. Conclusions
The PCCS lists sources extracted from the Planck nominal mis-sion data in each of its nine frequency bands. By constructionits reliability is >80% and a special effort was made to use sim-ple selection procedures in order to facilitate statistical analy-ses. With a common detection method for all the channels andthe additional three photometric estimates, spectral analysis canalso be performed safely. The deeper completeness levels and,as a consequence, the higher number of sources compared withthe ERCSC, will allow the extension of previous studies to moresources and to fainter flux densities. The PCCS is the naturalevolution of the ERCSC, but both lack polarization and multi-frequency information. Future releases will take advantage of thefull mission data and they will contain information on propertiesof sources not available in this release, including polarizationand variability, and association of sources detected in differentbands.
This paper describes the construction and properties of thispreliminary catalogue. We have not attempted to exploit thePCCS for science purposes, preferring instead to leave this tofuture papers and to the wider community.
Acknowledgements. The development of Planck has been supported by:ESA; CNES and CNRS/INSU-IN2P3-INP (France); ASI, CNR, and INAF(Italy); NASA and DoE (USA); STFC and UKSA (UK); CSIC, MICINN,JA and RES (Spain); Tekes, AoF and CSC (Finland); DLR and MPG(Germany); CSA (Canada); DTU Space (Denmark); SER/SSO (Switzerland);RCN (Norway); SFI (Ireland); FCT/MCTES (Portugal); and PRACE (EU).A description of the Planck Collaboration and a list of its members,including the technical or scientific activities in which they have beeninvolved, can be found at http://www.sciops.esa.int/index.php?project=planck&page=Planck_Collaboration. This research has madeuse of Aladin. We are deeply grateful to Rick Perley and the U.S. National RadioAstronomy Observatory for participating in the joint Planck-VLA observations.We also thank Steve Eales and the H-ATLAS team (Eales et al, 2010 PASP 122499E) for sharing their SPIRE catalogs prior to publication, allowing a compar-ison of flux densities between HFI and SPIRE.
Appendix A: Photometry
This appendix describes in detail the photometry methods usedin the PCCS.
A.1. Aperture photometry
The aperture photometry is evaluated by centring a circularaperture on the position of the source. An annulus around thisaperture is used to evaluate the background. In the absence ofnoise, the observed flux density of the source, S obs, may bewritten as:
S obs =
S ap − S an
k20
k22 − k2
1
, (A.1)
where k0 is the radius of the aperture, k1 and k2 are the inner andouter radii of the annulus, and, S ap and S an are the flux densitiesof the source in the aperture and annulus. Both S ap and S ann maybe written in terms of the true flux density of the source, S true.This gives the following relationship between the observed andtrue flux densities of the source:
S obs =
Ωk0
Ω−
(Ωk2 −Ωk1
Ω
) k20
k22 − k2
1
S true, (A.2)
where Ω is the solid angle of the beam, and Ωk0 , Ωk1 , and Ωk2
are the beam solid angles out to the radii of k0, k1 and k2. Thisprovides the correction factor to be applied to the observed fluxdensity, which accounts for both the flux density of the sourcemissing from the aperture and that removed through backgroundsubtraction.
Assuming a circularly symmetric Gaussian beam and thatk0, k1 and k2 are given in units of the FWHM, Eq. (A.2) may bewritten as:
S obs =
1 − (12
)4k20
−
(12
)4k21
−
(12
)4k22 k2
0
k22 − k2
1
S true. (A.3)
We used a radius of 1 FWHM for the aperture, k0 = 1, and theannulus is located immediately outside of the aperture and has awidth of 1 FWHM, k1 = 1 and k2 = 2.
The beams however are not exactly Gaussian so the effec-tive FWHM is used to determine the radii of the aperture andannulus, and the correction factor is evaluated using:
S obs =
(4ΩFWHM1 −ΩFWHM2
3Ω
)S true, (A.4)
A28, page 19 of 22
A&A 571, A28 (2014)
where ΩFWHM1 and ΩFWHM2 are the beam solid angles withinradii of 1 and 2 times the effective FWHM.
The noise level per pixel is estimated from the variance of thepixels that lie in the annulus, hence the uncertainties in the esti-mates of the background and the flux density within the aperturemay be evaluated, allowing the uncertainty on S obs to be cal-culated. The diffuse sky emission is a source of uncertainty inthe photometry, thus it contributes a component to the “noise”that is correlated between pixels. Given that the exact degree ofcorrelation is not known and is likely to vary with position onthe sky, a correction factor to account for the correlated noiseis evaluated by performing aperture photometry nearby, in re-gions without detected sources. Its value is such that it scales theresiduals normalized by the uncertainties to a Gaussian of unitvariance.
A.2. PSF photometry
The PSF photometry is obtained by fitting a model of the PSFto the map at the position of the source. The PSF is obtainedfrom the effective beam (Planck Collaboration II 2014; PlanckCollaboration VI 2014). The model of the source is
m = AP + C, (A.5)
where P is the PSF at the position of the source, A is the am-plitude of the source and C is a the (constant) background. Thebest-fit values of the parameters β = (A,C) are found by min-imising the χ2 between the model and the data, d,
χ2(β) = (d − m(β))TN−1(d − m(β)), (A.6)
where N is the covariance matrix of the noise. The noise is as-sumed to be uncorrelated between pixels and proportional to theinverse of the number of hits in each pixel. The overall normal-ization of the noise is adjusted by setting χ2 = 1 at the best-fitvalue of the parameters. This has the effect of inflating the uncer-tainties to account for any mismatch between the modelled PSFand the true shape of the source in the map. The uncertainties onthe parameters are computed from the curvature of the χ2. Thebest-fit amplitude and its uncertainty are converted to units offlux density using the area of the PSF.
A.3. Gaussian fit photometry
The Gaussian fit photometry is obtained by fitting a 2-dimensional Gaussian to the map at the position of the source.The model consists of a elliptical Gaussian centred at the posi-tion of the source plus a linear background,
m(x) = A exp[−xTQ−1x/2
]+ B · x + C, (A.7)
where A is the amplitude of the source, Q is the covariance ma-trix of the elliptical Gaussian profile, and B and C are the back-ground parameters. It is assumed that the source is at the originof the coordinates x. The components of Q can be expressed asa function of the semi-axes a and b, and an orientation angle θas
Q−1 = RTC−1R, (A.8)
where R is the rotation matrix,
R =
[cos θ − sin θsin θ cos θ
], (A.9)
and
C−1 =
[1/a2 0
0 1/b2
]. (A.10)
There are seven parameters to fit
β = [A, B1, B2,C, a, b, θ]. (A.11)
The model is fitted to the data by minimising the χ2 (A.6) be-tween a pixelized version of the model m and the data d. The un-certainties on the parameters are given by the diagonal elementsof the covariance matrix of the fit. Assuming that the ellipticalGaussian model is a good approximation to the real source pro-file, the amplitude of the source and its uncertainty are convertedto units of flux density using the area of the Gaussian.
ReferencesAMI Consortium, Perrott, Y. C., Green, D. A., et al. 2012, MNRAS, 421, L6André, P., Men’shchikov, A., Bontemps, S., et al. 2010, A&A, 518, L102Beichman, C. A., Neugebauer, G., Habing, H. J., Clegg, P. E., & Chester, T. J.,
1988, Infrared astronomical satellite (IRAS) catalogs and atlases, Vol. 1:Explanatory supplement, 1
Bennett, C. L., Larson, D., Weiland, J. L., et al. 2013, ApJS, 208, 20Bonaldi, A., Bonavera, L., Massardi, M., & De Zotti, G. 2013, MNRAS, 428,
1845Bonavera, L., Massardi, M., Bonaldi, A., et al. 2011, MNRAS, 416, 559Boselli, A., Eales, S., Cortese, L., et al. 2010, PASP, 122, 261Chen, X., Rachen, J. P., López-Caniego, M., et al. 2013, A&A, 553, A107Clements, D. L., Rigby, E., Maddox, S., et al. 2010, A&A, 518, L8Clemens, M. S., Negrello, M., De Zotti, G., et al. 2013, MNRAS, 433, 695Condon, J. J. 1974, ApJ, 188, 279Crawford, T. M., Switzer, E. R., Holzapfel, W. L., et al. 2010, ApJ, 718, 513Dale, D. A., Bendo, G. J., Engelbracht, C. W., et al. 2005, ApJ, 633, 857Davies, J. I., Bianchi, S., Baes, M., et al. 2013, MNRAS, 428, 834de Zotti, G., Ricci, R., Mesa, D., et al. 2005, A&A, 431, 893Delabrouille, J., Betoule, M., Melin, J.-B., et al. 2013, A&A, 553, A96Dole, H., Lagache, G., & Puget, J.-L. 2003, ApJ, 585, 617Dole, H., Lagache, G., Puget, J.-L., et al. 2006, A&A, 451, 417Dunne, L., Eales, S., Edmunds, M., et al. 2000, MNRAS, 315, 115Eales, S., Dunne, L., Clements, D., et al. 2010, PASP, 122, 499Eddington, Sir, A. S. 1940, MNRAS, 100, 354Franceschini, A., Toffolatti, L., Danese, L., & de Zotti, G. 1989, ApJ, 344, 35Fu, H., Jullo, E., Cooray, A., et al. 2012, ApJ, 753, 134González-Nuevo, J., Argüeso, F., López-Caniego, M., et al. 2006, MNRAS, 369,
1603González-Nuevo, J., Massardi, M., Argüeso, F., et al. 2008, MNRAS, 384, 711Górski, K. M., Hivon, E., Banday, A. J., et al. 2005, ApJ, 622, 759Gregory, P. C., Scott, W. K., Douglas, K., & Condon, J. J. 1996, ApJS, 103, 427Griffin, M. J., Abergel, A., Abreu, A., et al. 2010, A&A, 518, L3Hacking, P., Condon, J. J., & Houck, J. R. 1987, ApJ, 316, L15Healey, S. E., Romani, R. W., Taylor, G. B., et al. 2007, ApJS, 171, 61Helou, G., & Beichman, C. A. 1990, in Liege International Astrophysical
Colloquia 29, ed. B. Kaldeich, 117Herranz, D., & Sanz, J. L. 2008, IEEE J. Select. Topics Signal Process., 2, 727Herranz, D., López-Caniego, M., Sanz, J. L., & González-Nuevo, J. 2009,
MNRAS, 394, 510Herranz, D., González-Nuevo, J., Clements, D. L., et al. 2013, A&A, 549, A31Kennicutt, R. C., Calzetti, D., Aniano, G., et al. 2011, PASP, 123, 1347Kurinsky, N., Sajina, A., Partridge, B., et al. 2013, A&A, 549, A133Lanz, L. F., Herranz, D., López-Caniego, M., et al. 2013, MNRAS, 428, 3048Leach, S. M., Cardoso, J.-F., Baccigalupi, C., et al. 2008, A&A, 491, 597López-Caniego, M., Herranz, D., González-Nuevo, J., et al. 2006, MNRAS, 370,
2047López-Caniego, M., González-Nuevo, J., Herranz, D., et al. 2007, ApJS, 170,
108Marsden, D., Gralla, M., Marriage, T. A., et al. 2014, MNRAS, 439, 1556Massardi, M., López-Caniego, M., González-Nuevo, J., et al. 2009, MNRAS,
392, 733Massardi, M., Bonaldi, A., Bonavera, L., et al. 2011, MNRAS, 415, 1597Mitra, S., Rocha, G., Górski, K. M., et al. 2011, ApJS, 193, 5Miville-Deschênes, M.-A. & Lagache, G. 2005, ApJS, 157, 302Mocanu, L. M., Crawford, T. M., Vieira, J. D., et al. 2013, ApJ, 779, 61Murphy, T., Sadler, E. M., Ekers, R. D., et al. 2010, MNRAS, 402, 2403Negrello, M., Magliocchetti, M., Moscardini, L., et al. 2004, MNRAS, 352, 493
A28, page 20 of 22
Planck Collaboration: Planck 2013 results. XXVIII.
Negrello, M., Clemens, M., Gonzalez-Nuevo, J., et al. 2013, MNRAS, 429, 1309Perley, R. A., & Butler, B. J. 2013, ApJS, 204, 19Planck Collaboration VII. 2011, A&A, 536, A7Planck Collaboration XIII. 2011, A&A, 536, A13Planck Collaboration XIV. 2011, A&A, 536, A14Planck Collaboration XV. 2011, A&A, 536, A15Planck Collaboration XVI. 2011, A&A, 536, A16Planck Collaboration XIX. 2011, A&A, 536, A19Planck Collaboration XXIII. 2011, A&A, 536, A23Planck Collaboration Int. VII. 2013, A&A, 550, A133Planck Collaboration 2013, The Explanatory Supplement to the Planck 2013 re-
sults, http://www.sciops.esa.int/wikiSI/planckpla/index.php?title=Main_Page (ESA)
Planck Collaboration I. 2014, A&A, 571, A1Planck Collaboration II. 2014, A&A, 571, A2Planck Collaboration III. 2014, A&A, 571, A3Planck Collaboration IV. 2014, A&A, 571, A4Planck Collaboration V. 2014, A&A, 571, A5Planck Collaboration VI. 2014, A&A, 571, A6Planck Collaboration VII. 2014, A&A, 571, A7Planck Collaboration VIII. 2014, A&A, 571, A8Planck Collaboration IX. 2014, A&A, 571, A9Planck Collaboration X. 2014, A&A, 571, A10Planck Collaboration XI. 2014, A&A, 571, A11Planck Collaboration XII. 2014, A&A, 571, A12Planck Collaboration XIII. 2014, A&A, 571, A13Planck Collaboration XIV. 2014, A&A, 571, A14Planck Collaboration XV. 2014, A&A, 571, A15Planck Collaboration XVI. 2014, A&A, 571, A16Planck Collaboration XVII. 2014, A&A, 571, A17Planck Collaboration XVIII. 2014, A&A, 571, A18Planck Collaboration XIX. 2014, A&A, 571, A19Planck Collaboration XX. 2014, A&A, 571, A20Planck Collaboration XXI. 2014, A&A, 571, A21Planck Collaboration XXII. 2014, A&A, 571, A22Planck Collaboration XXIII. 2014, A&A, 571, A23Planck Collaboration XXIV. 2014, A&A, 571, A24Planck Collaboration XXV. 2014, A&A, 571, A25Planck Collaboration XXVI. 2014, A&A, 571, A26Planck Collaboration XXVII. 2014, A&A, 571, A27Planck Collaboration XXVIII. 2014, A&A, 571, A28Planck Collaboration XXIX. 2014, A&A, 571, A29Planck Collaboration XXX. 2014, A&A, 571, A30Planck Collaboration XXXI. 2014, A&A, 571, A31Planck Collaboration Int. XIV. 2014, A&A, 564, A45Rigby, E. E., Maddox, S. J., Dunne, L., et al. 2011, MNRAS, 415, 2336Toffolatti, L., Argueso Gomez, F., de Zotti, G., et al. 1998, MNRAS, 297, 117
1 APC, AstroParticule et Cosmologie, Université Paris Diderot,CNRS/IN2P3, CEA/lrfu, Observatoire de Paris, Sorbonne ParisCité, 10 rue Alice Domon et Léonie Duquet, 75205 Paris Cedex 13,France
2 Aalto University Metsähovi Radio Observatory and Dept of RadioScience and Engineering, PO Box 13000, 00076 AALTO, Finland
3 African Institute for Mathematical Sciences, 6-8 Melrose Road,7945 Muizenberg, Cape Town, South Africa
4 Agenzia Spaziale Italiana Science Data Center, via del Politecnicosnc, 00133 Roma, Italy
5 Agenzia Spaziale Italiana, Viale Liegi 26, 00198 Roma,Italy
6 Astrophysics Group, Cavendish Laboratory, University ofCambridge, J J Thomson Avenue, Cambridge CB3 0HE, UK
7 Astrophysics & Cosmology Research Unit, School of Mathematics,Statistics & Computer Science, University of KwaZulu-Natal,Westville Campus, Private Bag X54001, 4000 Durban, SouthAfrica
8 Atacama Large Millimeter/submillimeter Array, ALMA SantiagoCentral Offices, Alonso de Cordova 3107, Vitacura, Casilla763 0355, Santiago, Chile
9 CITA, University of Toronto, 60 St. George St., Toronto,ON M5S 3H8, Canada
10 CNRS, IRAP, 9 Av. colonel Roche, BP 44346, 31028 ToulouseCedex 4, France
11 California Institute of Technology, Pasadena, California, USA12 Centre for Theoretical Cosmology, DAMTP, University of
Cambridge, Wilberforce Road, Cambridge CB3 0WA, UK13 Centro de Estudios de Física del Cosmos de Aragón (CEFCA),
Plaza San Juan, 1, planta 2, 44001 Teruel, Spain14 Computational Cosmology Center, Lawrence Berkeley National
Laboratory, Berkeley, California, USA15 Consejo Superior de Investigaciones Científicas (CSIC), 28006
Madrid, Spain16 DSM/Irfu/SPP, CEA-Saclay, 91191 Gif-sur-Yvette Cedex, France17 DTU Space, National Space Institute, Technical University of
Denmark, Elektrovej 327, 2800 Kgs. Lyngby, Denmark18 Département de Physique Théorique, Université de Genève,
24 quai E. Ansermet, 1211 Genève 4, Switzerland19 Departamento de Física Fundamental, Facultad de Ciencias,
Universidad de Salamanca, 37008 Salamanca, Spain20 Departamento de Física, Universidad de Oviedo, Avda. Calvo
Sotelo s/n, 33007 Oviedo, Spain21 Departamento de Matemáticas, Universidad de Oviedo, Avda.
Calvo Sotelo s/n, 33007 Oviedo, Spain22 Department of Astronomy and Astrophysics, University of
Toronto, 50 Saint George Street, Toronto, Ontario, Canada23 Department of Astrophysics/IMAPP, Radboud University
Nijmegen, PO Box 9010, 6500 GL Nijmegen, The Netherlands24 Department of Electrical Engineering and Computer Sciences,
University of California, Berkeley, California, USA25 Department of Physics & Astronomy, University of British
Columbia, 6224 Agricultural Road, Vancouver, British Columbia,Canada
26 Department of Physics and Astronomy, Dana and David DornsifeCollege of Letter, Arts and Sciences, University of SouthernCalifornia, Los Angeles, CA 90089, USA
27 Department of Physics and Astronomy, University CollegeLondon, London WC1E 6BT, UK
28 Department of Physics, Florida State University, Keen PhysicsBuilding, 77 Chieftan Way, Tallahassee, Florida, USA
29 Department of Physics, Gustaf Hällströmin katu 2a, University ofHelsinki, 00014 Helsinki, Finland
30 Department of Physics, Princeton University, Princeton,New Jersey, USA
31 Department of Physics, University of California, One ShieldsAvenue, Davis, California, USA
32 Department of Physics, University of California, Santa Barbara,California, USA
33 Department of Physics, University of Illinois atUrbana-Champaign, 1110 West Green Street, Urbana, Illinois, USA
34 Dipartimento di Fisica e Astronomia G. Galilei, Università degliStudi di Padova, via Marzolo 8, 35131 Padova, Italy
35 Dipartimento di Fisica e Scienze della Terra, Università di Ferrara,via Saragat 1, 44122 Ferrara, Italy
36 Dipartimento di Fisica, Università La Sapienza, P. le A. Moro 2,00185 Roma, Italy
37 Dipartimento di Fisica, Università degli Studi di Milano, viaCeloria, 16, 20133 Milano, Italy
38 Dipartimento di Fisica, Università degli Studi di Trieste, via A.Valerio 2, Trieste, Italy
39 Dipartimento di Fisica, Università di Roma Tor Vergata, via dellaRicerca Scientifica, 1, Roma, Italy
40 Discovery Center, Niels Bohr Institute, Blegdamsvej 17,Copenhagen, Denmark
41 Dpto. Astrofísica, Universidad de La Laguna (ULL), 38206La Laguna, Tenerife, Spain
42 European Southern Observatory, ESO Vitacura, Alonso de Cordova3107, Vitacura, Casilla 19001 Santiago, Chile
43 European Space Agency, ESAC, Planck Science Office, Caminobajo del Castillo, s/n, Urbanización Villafranca del Castillo,Villanueva de la Cañada, 28691 Madrid, Spain
44 European Space Agency, ESTEC, Keplerlaan 1, 2201 AZNoordwijk, The Netherlands
A28, page 21 of 22
A&A 571, A28 (2014)
45 Finnish Centre for Astronomy with ESO (FINCA), University ofTurku, Väisäläntie 20, 21500, Piikkiö, Finland
46 Haverford College Astronomy Department, 370 Lancaster Avenue,Haverford, Pennsylvania, USA
47 Helsinki Institute of Physics, Gustaf Hällströmin katu 2, Universityof Helsinki, 00014 Helsinki, Finland
48 INAF – Osservatorio Astrofisico di Catania, via S. Sofia 78, 95123Catania, Italy
49 INAF – Osservatorio Astronomico di Padova, Vicolodell’Osservatorio 5, 35122 Padova, Italy
50 INAF – Osservatorio Astronomico di Roma, via di Frascati 33,00040 Monte Porzio Catone, Italy
51 INAF – Osservatorio Astronomico di Trieste, via G.B. Tiepolo 11,34131 Trieste, Italy
52 INAF Istituto di Radioastronomia, via P. Gobetti 101, 40129Bologna, Italy
53 INAF/IASF Bologna, via Gobetti 101, 40129 Bologna, Italy54 INAF/IASF Milano, via E. Bassini 15, 20133 Milano, Italy55 INFN, Sezione di Bologna, via Irnerio 46, 40126 Bologna, Italy56 INFN, Sezione di Roma 1, Università di Roma Sapienza, Piazzale
Aldo Moro 2, 00185 Roma, Italy57 IPAG: Institut de Planétologie et d’Astrophysique de Grenoble,
Université Joseph Fourier, Grenoble 1/CNRS-INSU, UMR 5274,38041 Grenoble, France
58 ISDC Data Centre for Astrophysics, University of Geneva, Ch.d’Ecogia 16, 1290 Versoix, Switzerland
59 IUCAA, Post Bag 4, Ganeshkhind, Pune University Campus,411 007 Pune, India
60 Imperial College London, Astrophysics group, BlackettLaboratory, Prince Consort Road, London, SW7 2AZ, UK
61 Infrared Processing and Analysis Center, California Institute ofTechnology, Pasadena, CA 91125, USA
62 Institut Néel, CNRS, Université Joseph Fourier Grenoble I, 25 ruedes Martyrs, 38042 Grenoble, France
63 Institut Universitaire de France, 103 bd Saint-Michel, 75005 Paris,France
64 Institut d’Astrophysique Spatiale, CNRS (UMR 8617) UniversitéParis-Sud 11, Bât. 121, 91405 Orsay, France
65 Institut d’Astrophysique de Paris, CNRS (UMR 7095), 98bisboulevard Arago, 75014, Paris, France
66 Institute for Space Sciences, 077125 Bucharest-Magurale, Romania67 Institute of Astronomy and Astrophysics, Academia Sinica, 10617
Taipei, Taiwan68 Institute of Astronomy, University of Cambridge, Madingley Road,
Cambridge CB3 0HA, UK69 Institute of Theoretical Astrophysics, University of Oslo, 1029
Blindern, 0315 Oslo, Norway70 Instituto de Astrofísica de Canarias, C/Vía Láctea s/n, 38205
La Laguna, Tenerife, Spain71 Instituto de Física de Cantabria (CSIC-Universidad de Cantabria),
Avda. de los Castros s/n, 39005 Santander, Spain72 Jet Propulsion Laboratory, California Institute of Technology, 4800
Oak Grove Drive, Pasadena, California, USA73 Jodrell Bank Centre for Astrophysics, Alan Turing Building,
School of Physics and Astronomy, The University of Manchester,Oxford Road, Manchester, M13 9PL, UK
74 Kavli Institute for Cosmology Cambridge, Madingley Road,Cambridge, CB3 0HA, UK
75 LAL, Université Paris-Sud, CNRS/IN2P3, 91898 Orsay, France76 LERMA, CNRS, Observatoire de Paris, 61 avenue de
l’Observatoire, 75014 Paris, France77 Laboratoire AIM, IRFU/Service d’Astrophysique – CEA/DSM –
CNRS – Université Paris Diderot, Bât. 709, CEA-Saclay, 91191Gif-sur-Yvette Cedex, France
78 Laboratoire Traitement et Communication de l’Information, CNRS(UMR 5141) and Télécom ParisTech, 46 rue Barrault, 75634 ParisCedex 13, France
79 Laboratoire de Physique Subatomique et de Cosmologie,Université Joseph Fourier Grenoble I, CNRS/IN2P3, InstitutNational Polytechnique de Grenoble, 53 rue des Martyrs, 38026Grenoble Cedex, France
80 Laboratoire de Physique Théorique, Université Paris-Sud 11 &CNRS, Bât. 210, 91405 Orsay, France
81 Lawrence Berkeley National Laboratory, Berkeley, California,USA
82 Max-Planck-Institut für Astrophysik, Karl-Schwarzschild-Str. 1,85741 Garching, Germany
83 McGill Physics, Ernest Rutherford Physics Building, McGillUniversity, 3600 rue University, Montréal, QC, H3A 2T8, Canada
84 MilliLab, VTT Technical Research Centre of Finland, Tietotie 3,02044 Espoo, Finland
85 National University of Ireland, Department of ExperimentalPhysics, Maynooth, Co. Kildare, Ireland
86 Niels Bohr Institute, Blegdamsvej 17, Copenhagen, Denmark87 Observational Cosmology, Mail Stop 367-17, California Institute
of Technology, Pasadena, CA 91125, USA88 Optical Science Laboratory, University College London, Gower
Street, London, UK89 SB-ITP-LPPC, EPFL, 1015 Lausanne, Switzerland90 SISSA, Astrophysics Sector, via Bonomea 265, 34136 Trieste, Italy91 School of Physics and Astronomy, Cardiff University, Queens
Buildings, The Parade, Cardiff, CF24 3AA, UK92 Space Research Institute (IKI), Russian Academy of Sciences,
Profsoyuznaya Str, 84/32, 117997 Moscow, Russia93 Space Sciences Laboratory, University of California, Berkeley,
California, USA94 Special Astrophysical Observatory, Russian Academy of Sciences,
Nizhnij Arkhyz, Zelenchukskiy region, 369167Karachai-Cherkessian Republic, Russia
95 Stanford University, Dept of Physics, Varian Physics Bldg, 382 viaPueblo Mall, Stanford, California, USA
96 Sub-Department of Astrophysics, University of Oxford, KebleRoad, Oxford OX1 3RH, UK
97 Theory Division, PH-TH, CERN, 1211, 23 Geneva, Switzerland98 UPMC Univ Paris 06, UMR7095, 98bis boulevard Arago, 75014
Paris, France99 Université de Toulouse, UPS-OMP, IRAP, 31028 Toulouse
Cedex 4, France100 Universities Space Research Association, Stratospheric
Observatory for Infrared Astronomy, MS 232-11, Moffett Field,CA 94035, USA
101 University of Granada, Departamento de Física Teórica y delCosmos, Facultad de Ciencias, 18071 Granada, Spain
102 Warsaw University Observatory, Aleje Ujazdowskie 4, 00-478Warszawa, Poland
A28, page 22 of 22
Related Documents