Attention and Visuomotor Processing 1 Placing a Tool in the Spotlight: Spatial Attention Modulates Visuomotor Responses in Cortex Todd C. Handy 1 , Jana Schaich Borg 2 , David J. Turk 2 , Christine Tipper 1 , Scott T. Grafton 2 , & Michael S. Gazzaniga 2 1 Department of Psychology, University of British Columbia 2 Center for Cognitive Neuroscience, Dartmouth College 10/23/04 Running head: Attention and Visuomotor Processing Correspondence: Todd C. Handy, Ph.D. Department of Psychology University of British Columbia 2136 West Mall Vancouver, BC Canada V6T 1Z4 phone: (604) 822-2706 fax: (604) 822-6923 [email protected]

Welcome message from author
This document is posted to help you gain knowledge. Please leave a comment to let me know what you think about it! Share it to your friends and learn new things together.
Transcript
Attention and Visuomotor Processing 1
Placing a Tool in the Spotlight:Spatial Attention Modulates Visuomotor Responses in Cortex
Todd C. Handy1, Jana Schaich Borg2, David J. Turk2, Christine Tipper1,Scott T. Grafton2, & Michael S. Gazzaniga2
1Department of Psychology, University of British Columbia2Center for Cognitive Neuroscience, Dartmouth College
10/23/04
Running head: Attention and Visuomotor Processing
Correspondence: Todd C. Handy, Ph.D.Department of PsychologyUniversity of British Columbia2136 West MallVancouver, BC Canada V6T 1Z4phone: (604) 822-2706fax: (604) [email protected]
Attention and Visuomotor Processing 2
Abstract
Visual spatial attention has long been associated with facilitatory effects on visual
perception. Here we report that spatial attention can also modulate implicit visuomotor
processing in dorsal regions of human cortex. Participants underwent fMRI scanning while
performing a voluntary attentional orienting task that varied the category of a task-irrelevant
object in the attended location (tool vs. non-tool). Data were then analyzed as a function of the
attended location (left vs. right visual field) and the object category in that location. We found
that the fMRI BOLD response in two visuomotor-related regions––the supplementary motor area
(SMA) and the left inferior parietal lobule (IPL)––showed an interaction between the location of
attention and the location of the tool in the bilateral display. Further, these responses were
statistically distinct from those regions in dorsal cortex showing activity modulated only by the
tool location or only by the attended location. While the effects of attending non-foveally within
the visual field have been well-documented in relation to visual perception, our findings support
the proposal that voluntary visuospatial attention may also have consequences for the implicit
planning of object-directed actions.
Attention and Visuomotor Processing 3
To what extent can spatial attention facilitate the visuomotor responses that occur in
dorsal cortex when graspable objects such as cups and utensils come into view? At issue is
whether the modulatory effects of spatial attention––long identified as facilitating perception-
related processes in the ventral visual pathway (for a review, see Handy, Hopfinger, & Mangun,
2001)––extend to action-related processes in the dorsal visual pathway. The possibility stems
from the links that have been established between implicit visuomotor activity and spatial
attention. In particular, computational modeling has suggested that selection in the motor system
for an object-specific grasping response should be capable of biasing visual attention to the
location of that object (Ward, 1999), a position consistent with much behavioral evidence (e.g.
B o n f i g l i o l i , D u n c a n , R o r d e n , & K e n n e t t , 2 0 0 2 ; C r a i g h e r o ,
Fadiga, Rizzolatti, & Umiltà, 1999; Deubel, Schneider, & Paprotta, 1998; Humphreys &
Riddoch, 2001; Pavese & Buxbaum, 2002; Riddoch, Humphreys, Edwards, Baker, & Willson,
2003; Rizzolatti, Riggio, & Sheliga,1994; Tipper, Lortie, & Baylis, 1992; Tucker & Ellis, 1998,
2004; Weir et al., 2003) and recently supported via event-related potential data (Handy, Grafton,
Shroff, Ketay, & Gazzaniga, 2003). Yet whether the reciprocal relationship exists––with spatial
attention modulating the implicit visuomotor response (VMR) generated by a graspable
object––remains unknown. We investigated this question in the following study using event-
related fMRI.
Our experiment was predicated on examining VMRs to graspable objects as a function of
whether or not spatial attention was voluntarily oriented to their location at the time of
presentation. Towards operationalizing VMRs, neuroimaging evidence has shown that a
number of different dorsal cortical regions may implicitly respond when a graspable object
comes into view, including both dorsal and ventral premotor cortex (PMd and PMv), the region
just anterior to PMd (prePMd), the supplementary motor area (SMA), the region just anterior to
SMA (preSMA), and the inferior parietal lobule (IPL)(e.g., Chao & Martin 2000; Grafton,
Attention and Visuomotor Processing 4
Fadiga, Arbib, & Rizzolatti,1997; Grèzes & Decety, 2002; Grèzes, Tucker, Armony, Ellis, &
Passingham, 2003; Jeannerod, 2001)––all regions linked to visuomotor-related functions (see
Picard & Strick, 2001). While the specific combination of areas manifesting a VMR has varied
between studies, the visual field location of the object appears to be a critical determinant in the
anatomical pattern of the response. Specifically, we found that when a tool was presented in the
right visual field (RVF) location of a bilateral display, a VMR was observed in bilateral prePMd
and bilateral IPL, as measured via fMRI (Handy et al., 2003). However, when the object
locations were switched such that the tool was in the left visual field (LVF) location of the
display, no VMR was found; instead, prePMd and IPL now appeared to show a systematic
decrease in the fMRI signal. Building on this earlier result––which did not include a
manipulation of voluntary attentional orienting––the current goal was to characterize the VMR
generated by a lateralized tool as a function of (1) its visual field location and (2) whether or not
attention was voluntarily oriented to that location at the time of presentation. If spatial attention
can modulate visuomotor activity in the dorsal visual pathway, it predicted that an effect of
attention would be observed on the VMRs generated.
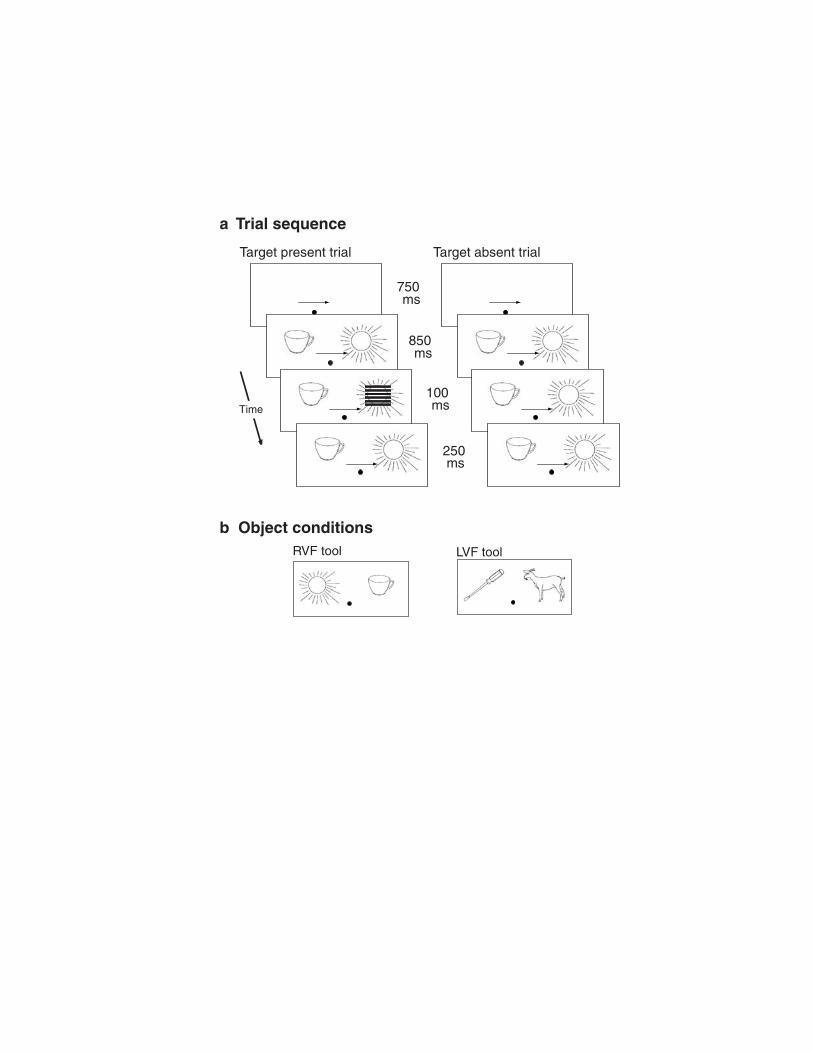
To test this prediction, participants underwent fMRI scanning while performing a
visuospatial attention task (Fig. 1). On each trial an object was displayed on either side of
fixation, one object always a tool (e.g., a utensil) and the other always a non-tool (e.g., a
seahorse). Prior to the appearance of these objects, a cue was presented at fixation that indicated
the location of an upcoming target that––if present on that trial––would be superimposed over
the object in the cued location. Only the object locations were thus relevant to the task.
Participants were instructed to hold central fixation while covertly orienting their attention to the
cued location. Importantly, eye position was monitored during scanning to confirm that fixation
was maintained. Data analysis then centered on examining the event-related fMRI responses to
the onset of the object displays on non-target trials as a joint function of the location of attention
(left vs. right visual field) and the type of object in the attended location (tool vs. non-tool).
Attention and Visuomotor Processing 5
Materials and Methods
Participants
Twenty-one right-handed volunteers were paid to participate in the study. All were
neurologically normal, had normal or corrected-to-normal eyesight, and gave their informed
consent according to the procedures approved by the Dartmouth Committee for the Protection of
Human Subjects.
Task Design.
Trial sequence and timing are shown in Figure 1. Stimuli were controlled and displayed
using Presentation software (http://nbs.neuro-bs.com). The objects came from a canonical set of
line drawings (Snodgrass & Vanderwart, 1980), with 50 different objects in each of the two
object categories (tools and non-tools). Based on ratings provided in Snodgrass and Vanderwart
(1980), tools and non-tools were equated for familiarity (3.6 vs. 3.6, respectively, on a scale of 5)
and complexity (2.5 vs. 2.6). On each trial objects were randomly drawn from their category
with replacement, with all trials having one tool and one non-tool. Post-experiment debriefing
confirmed that all participants remained naïve as to the distinction in object categories. The
objects were no larger than approximately 1.5° in either the vertical and/or horizontal dimension
(depending on object type), and were presented approximately 2.5° to center from fixation, with
the bottom of each object resting on the horizontal meridian. Each participant performed a total
of five trial blocks, with each block corresponding to one functional run during fMRI scanning.
Blocks began and ended with 20 s of fixation-only "rest" and had a total of 84 trials, equally
divided among the four combinations of attend left and attend right (for the cuing condition) and
tool-left and tool-right (for the tool location condition). Randomly interspersed with the trials
were 27 fixation-only intervals lasting one, two, or three TRs in duration; these intervals were
included in order to optimize deconvolution of the event-related hemodynamic response (e.g.,
Miezin et al., 2000).
Attention and Visuomotor Processing 6
The task required discriminating the spatial frequency of a square-wave grating stimulus
that had either a lower (~3 cycles/degree) or higher (~4 cycles/degree) spatial frequency.
However, targets were presented on only 20 of the 84 trials, in order to restrict fMRI analysis to
trials that contained only objects in the display and that engendered no manual response.
Further, to reduce the number of manual responses made by participants, a go/no-go design was
used that required a manual response to be made (with the thumb) only when the target matched
a pre-specified spatial frequency (low or high, counterbalanced between participants, as was
hand/thumb of response). Because our goal was to maximize attentional orienting to the cued
location, the spatial cue always predicted the correct target location. Although this meant that
comparisons could not be made between the reaction times to attended versus unattended targets,
prior behavioral and event-related potential (ERP) evidence has demonstrated that attention is
more optimally focused on the cued location under 100% predictive cuing, relative to conditions
that include a small percentage of targets at uncued locations (Handy & Mangun, 2000).
Nevertheless, in addition to the fMRI analyses reported below, we also examined the fMRI data
for evidence indicating that attention was in fact oriented in response to the spatial cues1. In
order to confirm that fixation was maintained throughout each trial, eye movements were
monitored during scanning using a sclaral reflectance system (Applied Sciences Laboratories
Model 504, Bedford, MA). Five participants were excluded from data analysis due to large (>
1°) and frequent eye movements during scanning. Reported results are for the remaining 16
participants.
fMRI Recording and Analysis.
fMRI data were collected using a 1.5T SIGNA scanner (GE Medical Systems,
Milwaukee, WI) with a fast gradient system for echo-planar imaging (EPI). Dense foam padding
was used for head stabilization. Scanning was performed in a dimly-lit room, with the visual
stimuli rear-projected to a screen behind the participant's head and viewed via a headcoil-
mounted mirror. EPI images in-plane with the AC-PC line were acquired using a gradient-echo
Attention and Visuomotor Processing 7
pulse sequence and sequential slice acquisition (TR = 2500 ms, TE = 35 ms, flip angle = 90°, 25
contiguous slices at 4.5 mm skip 1 mm, in-plane resolution of 64 x 64 pixels in a FOV of 24 cm).
Each functional run began with four TRs during which no data were acquired, to allow for
steady-state tissue magnetization. The beginning of each trial and fixation-only interval was
synchronized to the onset of acquisition for each EPI volume. A total of 172 EPI volumes were
collected in each functional run, and a total of five functional runs were performed by each
participant. High-resolution, T1-weighted axial images were also taken of each participant (TR
= 25 ms, TE = 6 ms, bandwidth = 15.6 kHz, voxel size = 0.9375 x 1.25 x 1.2 mm). Data were
processed and analyzed using SPM99 (http://www.fil.ion.ucl.ac.uk/spm). For each subject the
EPI images were corrected for motion (Friston et al., 1996) and then spatially-normalized into
MNI stereotaxic coordinates using the EPI template provided with SPM99 (Friston et al., 1995a).
The normalized EPI images were then spatially smoothed using an isotropic 8 mm Gaussian
kernel.
The smoothed, normalized single-subject EPI data were analyzed via multiple regression
using the general linear model (Friston et al., 1995b). In particular, the event-related responses
to the onset of the bilateral object displays were examined, with the model including regressors
(or ßs) for (1) each trial type without targets (as effects of interest) and (2) each trial type with
targets (as effects of non-interest). Regressors were based on the canonical event-related
hemodynamic response function, temporal derivatives of the event-related responses were
included as additional regressors, and low-frequency scanner and/or physiological noise was
modeled via linear, quadratic, and cubic regressors of non-interest. Group-level analyses were
based on a random-effects model using one-sample t-tests. Following this random-effects
analysis, mean ß values for the effects of interest averaged across all voxels within each
significant cluster were extracted from the SPM99 data files using custom scripts implemented in
MATLAB (The MATHWORKS Inc., Natick, MA). Time series data for these same clusters
were derived using ROI Toolbox as implemented in SPM99 (http://spm-
Attention and Visuomotor Processing 8
toolbox.sourceforge.net/documentation.html). The time series themselves were computed using
selective averaging with condition as the filter. All reported voxel coordinates were converted to
Talairaich coordinates (Talairaich & Tournoux, 1988) using a modified version of the mni2tal
MATLAB script (www.harvard.edu/~slotnick/scripts.htm).
Results
Because our study was designed to characterize how visual attention modulates implicit
VMRs, fMRI data analysis was anatomically restricted a priori to those voxel clusters occurring
in regions previously linked to visuomotor functions: the peri-motor/premotor area (e.g., Chao &
Martin 2000; Grafton et al., 1997; Grèzes & Decety, 2002; Grèzes et al., 2003; Handy et al.,
2003; Jeannerod, 2001), and adjacent parietal and prefrontal regions (Battaglia-Mayer et al.,
2003; Burnod et al., 1999; Caminiti et al., 1998; Marconi et al., 2001; Matelli & Luppino, 2001).
Towards identifying relevant voxel clusters of interest, the data were treated as a 2 x 2 design,
with factors of tool location (LVF vs. RVF) and whether or not the tool's location was covertly
attended (attended vs. unattended). Initial fMRI analysis thus consisted of a set of three contrast
pairs in order to identify voxel clusters in the anatomical area of interest (AOI) showing: (1) a
main effect of tool location, (2) a main effect of attention state, and/or (3) their interaction––that
is, a difference in attention effects between the visual fields. Importantly, this approach of
holding the tool location constant and varying whether or not attention was oriented to the tool's
location parallels the conventions adopted in electrophysiological studies of spatial attention,
where analyses are based on holding stimulus conditions constant and varying the attentional
state in order to ascribe effects on stimulus processing to an influence of the latter, rather than a
change in the former (see e.g., Mangun, 1995; Mangun & Hillyard, 1995). For any significant
voxel clusters found in our AOI in the aforementioned contrast pairs, we then wanted to
characterize the nature of the response in each cluster across all four conditions of interest. In
this manner cluster-specific statistical analyses would be used as the means of verifying the
Attention and Visuomotor Processing 9
response profile idiosyncratic to each voxel cluster, rather than simply interpreting the response
profile based on the results of the initial statistical maps.
fMRI
All contrasts reported are based on a random-effects model and reported at p < .001
(uncorrected), with a minimum spatial extent (k) of 5 contiguous voxels. Voxel coordinates are
given in the stereotaxic coordinates of Talairach and Tournoux (1988).
Main Effects Contrasts
For main effects of tool location, no significant voxel clusters were found in the AOI that
had a significantly larger fMRI blood oxygen-level-dependent (BOLD) response when the tool
was in the LVF display location, relative to the RVF (Fig. 2a, left). In contrast, two voxel
clusters in our AOI were found showing a significantly larger BOLD response when a tool was
in the RVF display location, relative to the LVF (Fig. 2a, right). Using the labels of Figure 2a
(right), the maxima of cluster 1 was located at -28/-52/54 (t = 5.34; cluster size k = 10 voxels)
and the maxima of cluster 2 was located at -28/-5/63 (t = 4.77; k = 9 voxels). For main effects of
attention, no significant voxel clusters were found in our AOI that had a significantly larger
BOLD response when the tool's location in the display was attended relative to unattended (Fig
2b, left), or unattended relative to attended (Fig. 2b, right).
Interaction Contrasts
Examining the interaction between the tool's location in the display and the effect of
attending to that specific location––that is, effects unique to attending to a tool in the LVF vs.
effects unique to attending to a tool in the RVF––no significant voxel clusters were found in the
AOI that had a larger BOLD response for an attended vs. unattended tool in the LVF, relative to
an attended vs. unattended tool in the RVF (Fig. 2c, left). However, five significant voxel
clusters were found in the AOI that had a larger BOLD response for an attended vs. unattended
Attention and Visuomotor Processing 10
tool in the RVF, relative to an attended vs. unattended tool in the LVF (Fig. 2c, right). As
labeled in Figure 2c (right), the maxima of cluster 1 was located at -4/9/33 (t = 4.68; k = 10
voxels), the maxima of cluster 2 at -4/-5/48 (t = 5.64; k = 17 voxels), the maxima of cluster 3 at
-51/-29/46 (t = 5.10; k = 10 voxels), the maxima of cluster 4 at 40/-20/56 (t = 4.89; k = 18
voxels), and the maxima of cluster 5 at 44/-13/45 (t = 4.77; k = 12 voxels).
Cluster Response Profiles
Results reported in this section are summarized in Table 1, which also provides the
general anatomical locus of each cluster, along with Brodmann's area. The response profiles for
the two clusters showing a main effect of tool location are presented in Figure 3. The bar graphs
plot the mean response (or mean ß) within each cluster as a function of the tool's location (LVF
or RVF) and whether or not that location was attended. As can be seen, both clusters show
overall larger responses with the tool in the RVF location of the display. This pattern was
confirmed within each cluster via a repeated-measures ANOVA performed on the mean
responses, with factors of tool location (LVF vs. RVF) and attention (tool's location attended vs.
unattended). For cluster 1, there was a main effect of tool location (F(1,15) = 22.36; p < .0005).
For cluster 2, there was a main effect of tool location (F(1,15) = 22.85; p < .0005), as well as an
interaction between the tool's location x attention interaction (F(1,15) = 4.56; p < .05). However,
when the effect of attention was examined independently within each visual field for cluster 2
via one-sample t-tests, the attention effect was not significant in either the LVF (t(15) = 1.38) or
RVF (t(15) = 2.57). While these results indicated that these two voxel clusters were manifesting
a differential sensitivity to the visual field location of the tool in the display, there was no reliable
effect of attention on the responses that were observed in these clusters.
In contrast, for the five clusters identified via the interaction contrasts (Fig. 2c), the
response profiles in Figure 4 show patterns suggesting that activity within each cluster was not
simply covarying with the visual field location of the tool. Instead, each response profile was
Attention and Visuomotor Processing 11
consistent with an increased response for an attended relative to unattended tool in the RVF, and
a decreased response for an attended relative to unattended tool in the LVF. To confirm this
pattern, we performed within each cluster a repeated-measures ANOVA on the mean responses
(or mean ßs) that had factors of attended location (LVF vs. RVF) and the object in that location
(tool vs. non-tool). In all 5 clusters, a significant main effect of attention was observed: cluster 1
(F(1,15) = 22.45; p < .0005), cluster 2 (F(1,15) = 34.02; p < .0001), cluster 3 (F(1,15) = 32.22; p
< .0001), cluster 4 (F(1,15) = 24.69; p < .0005), and cluster 5 (F(1,15) = 21.97; p < .0005).
Importantly, however, interactions between the attended location and the object in that location
were also observed for cluster 2 (F(1,15) = 6.98; p < .05) and cluster 3 (F(1,15) = 5.67; p < .05).
When the effect of attention was examined independently within each visual field for cluster 2
via one-sample t-tests, the attention effect reached significance in both the LVF (t(15) = 7.01; p
< .05) and RVF (t(15) = 16.81; p < .005). For cluster 3, the attention effect also reached
significance in both the LVF (t(15) = 6.07; p < .05) and RVF (t(15) = 4.77; p < .05). Taken
together, these results indicate that while clusters 1, 4, and 5 had responses dominated by the
location of attention within the visual field, the responses in clusters 2 and 3 showed a sensitivity
to the interaction between the location of attention and the object in the attended location such
that there was an increase in the BOLD response for tools in the attended RVF and a decreased
BOLD response for tools in the attended LVF
Behavior
Analysis of manual responses to the targets indicated that independent of the VF of the
target, overall discrimination performance was better with a tool relative to a non-tool in the
target location. For reaction times (RTs), this was manifest as a significant main effect of object
(F(1,15) = 5.94; p < .05), with RTs faster when a tool was in the attended location, relative to a
non-tool (941 ms vs. 976 ms in LVF, 934 vs. 957 in RVF). There was no main effect of visual
field (F(1,15) = 1.04) or tool by VF interaction (F(1,15) = 1.24). For accuracy, there was also a
significant main effect of object (F(1,15) = 7.27; p < .05), with the correct response rate higher
Attention and Visuomotor Processing 12
when a tool was in the attended location relative to a non-tool (0.986 vs. 0.966 in LVF, 0.993 vs.
0.989 in RVF). Again, there was no main effect of VF (F(1,15) = 0.01) or tool by VF
interaction (F(1,15) = 0.65). These results thus suggest that independent of the VF involved,
having a graspable object in the attended location had a facilitatory effect on response
performance.
Discussion
Our study was designed to examine whether voluntary spatial attention can facilitate the
implicit VMRs that occur in dorsal cortex when a graspable object comes into view. In this
regard we report two main findings. First, the fMRI BOLD response in two visuomotor-related
areas––SMA and left IPL––showed an interaction between the location of attention and the
location of the tool in the bilateral display. That is, the response profiles in these two areas were
uniquely determined by the combination of the attended visual field and whether a tool was in
that location, and further, were statistically dissociable from those regions in cortex showing
activity modulated only by the tool location or only by the attended location. Second, this
interaction in SMA and left IPL took the form of a positive BOLD response for tools in the
attended RVF and a negative BOLD response for tools in the attended LVF. In other words, not
only did attending to the location of the tool modulate the nature of the visuomotor response
generated in SMA and left IPL, but the effect took the form of a bidirectional BOLD response
that varied with the visual field involved. Given these findings, a number of critical questions
follow.
First, how do the current results expand our understanding of voluntary attentional
orienting and the role it plays in visual processing? The effects of attending non-foveally within
the visual field have long been tied primarily––if not exclusively––to influences on visual
perception. For example, attention improves signal detection performance (e.g., Bashinski &
Bacharach, 1980; Downing, 1988; Handy et al., 1996), increases visual sensory gain (e.g.,
Attention and Visuomotor Processing 13
Heinze et al., 1994; Hillyard et al., 1999), and amplifies stimulus-evoked activity in object
perception areas of the ventral visual processing stream (e.g., Wojciulik et al., 1998). Yet as we
discuss below, what our data indicate is that attention may also have consequences for the
implicit planning of object-directed actions––actions which are often performed in the absence of
directly foveating the object in question. Hands are shaken while maintaining eye contact, coffee
cups are grabbed while reading the newspaper, and doors are opened without looking down at
the knobs or handles. Indeed, given that overt perceptual goals in the real world typically
involve foveating an object of interest rather than covertly attending to it, our results are not
inconsistent with the view that the perceptual benefits of spatial attention may be a secondary
consequence of a mechanism that evolved primarily to facilitate premotor planning (e.g.,
Rizzolatti et al., 1987; Rizzolatti et al., 1994).
If spatial attention can be viewed as modulating implicit VMRs, how might this effect be
described at a more specified level? We suggest that the answer lies in considering the functions
of the particular regions involved. Activation of IPL has been associated with both paying
attention to planned motor actions (e.g., Rushworth, Ellison, & Walsh, 2001; Rushworth, Krams,
& Passingham, 2001; Rushworth et al., 1997) and sensorimotor processing in general (e.g.,
Mattingley et al., 1998), whereas SMA has been tied to the organization, awareness, and
perceptual control of movement (e.g., Haggard & Magno, 1999; Haggard & Whitford, 2004).
Moreover, both IPL and SMA––along with preSMA and PMd––have been shown to activate
more strongly when imagining versus actually executing a reaching movement (e.g., Gerardin et
al., 2000). Such data are consistent with the proposal that voluntary spatial attention may serve
to facilitate the implicit planning of object-directed actions. However, our prior findings showed
that under conditions where spatial attention was not voluntarily oriented, left IPL showed a
similar pattern to that observed here––a positive BOLD response for tools in the RVF location of
the display and a negative BOLD response for tools in the LVF location––while no effects of any
kind were found in SMA (Handy et al., 2003). This raises the possibility that the effects of
Attention and Visuomotor Processing 14
voluntary spatial attention in the visuomotor domain can be more narrowly characterized as
gating the functions of SMA––functions associated with higher-level aspects of visuomotor
planning (e.g., Haggard & Magno, 1999; Haggard & Whitford, 2004).
Given that voluntary spatial attention appears to differentially modulate VMRs as a
function of visual field, how should these differences be interpreted? One of the hallmarks of
spatial attention is that we have a stronger bias to orient to the RVF rather than the LVF (e.g.,
Mangun et al., 1994; Reuter-Lorenz et al., 1990), a visual field bias also seen in the influence of
visuomotor processing on involuntary attentional orienting (e.g., Handy et al., 2003; see also
Riddoch et al., 2003). Taken in this context, the current data are not surprising in showing a
similar asymmetry. Yet the deeper question here is whether the negative BOLD response (NBR)
identified for tools in the attended LVF should be considered as functionally significant. One
position is that it should not be, a position viewing the facilitatory effects of spatial attention on
visuomotor processing as being restricted to the RVF. Consistent with this possibility, much
evidence has suggested that the representation and planning of motor movements may be
lateralized to the left cerebral hemisphere (e.g., Bradshaw, 2001; Haaland & Harrington, 1996;
Rushworth, Krams, & Passingham, 2001; Schluter et al., 2001). As a result, this may produce a
RVF bias in action-related processing when viewing natural scenes containing objects in both
visual hemifields (e.g., Boles, 1983, 1994). In other words, the RVF bias would be driven by a
left hemisphere dominance for visuomotor processing––a possibility certainly congruent with the
involvement of left but not right IPL in the current data pattern.
The alternative position is that the NBR is in fact indicative of a functional consequence
for attention-visuomotor interactions in the LVF, but what evidence supports that position?
Although an NBR may be due in part to a redistribution of cerebral blood flow in response to
non-local neural activity, it appears to include a significant contribution from local decreases in
neural activity (e.g., Shmuel et al., 2002; Smith et al., 2004). This indicates that the NBR
Attention and Visuomotor Processing 15
reported here may in fact reflect changes in neural activation states. At the same time, the NBR
was associated with only one of our four experimental conditions and occurred in voxel clusters
identified via a positive BOLD response in at least one of the other three experimental
conditions. As a consequence, the NBR was not being generated in a brain region––such as the
precuneus and posterior cingulate gyrus––that may show a non-selective decrease in
hemodynamic activity in response to the onset of cognitive activity in general (e.g., Shulman et
al., 1997; Raichle, 1999). Likewise, we could not attribute the NBR to an artifact of a global
scaling correction during data analysis, as this data transformation was rightly not included in
our fMRI analysis protocols (e.g., Aguirre et al., 1998; Desjardins et al., 2001). Instead,
behavioral performance demonstrated that independent of the visual field involved, manual
responses were quicker and more accurate with a tool in the attended location relative to a non-
tool. While there is growing recognition that meaningful fMRI patterns will not always correlate
with behavioral performance (see Wilkinson & Halligan, 2004), our data show that conditions
associated with a NBR in SMA and left IPL were also associated with facilitated behavioral
performance. At the same time, regions of visual cortex have been shown to have a BOLD
response that varies in its direction (positive or negative) depending on the visual field location
stimulated (Shmuel et al., 2002) and attentional state (e.g., Smith et al., 2000; Tootell et al.,
1998), both factors involved in the current data pattern. The available evidence thus makes it
difficult to conclusively rule out––at least for now––the possibility that attentional modulation of
VMRs for LVF objects may in fact be characterized as manifesting a functionally-significant
NBR.
Regardless of whether to functionally interpret the NBR reported here, the overarching
issue raised by our study is that in a brain showing dissociable visual pathways for perception
and action (e.g., Milner & Goodale, 1995; Mishkin et al., 1983), spatial attention appears to have
the capacity to modulate activity in both processing streams. As such, a final question to
consider is whether attention-related modulations of visuomotor processing in the dorsal "action"
Attention and Visuomotor Processing 16
stream occur directly or are mediated via attentional effects arising in the ventral "perception"
stream. On the one hand, action-related processes can operate on visual object representations
that are independent of representations associated with canonical visual perception (e.g., Ganel
& Goodale, 2003; Hodges et al., 1999). Further, the priming of semantic information during
object recognition has been shown to include activation of premotor cortex when the object in
question is associated with grasping (e.g., Martin et al., 1995, 1996). Such evidence would
support the possibility that object recognition processes in the dorsal visual stream can in fact
influence action-related processing in the dorsal visual stream. On the other hand, in the
corticocortico projections extending beyond the V2/V3/V4 complex in occipital cortex, the input
into posterior parietal cortex is dominated by information originating in parafoveal retinotopic
locations, whereas the input into the inferior temporal cortex is dominated by information
originating in the fovea (e.g., Baizer, Ungerleider, & Desimone, 1991; Morel and Bullier, 1990).
Given that spatial attention can modulate sensory processing within the V4 region (e.g., Heinze
et al., 1994; Woldorff et al., 1997), it would appear that the neurophysiology is in place to allow
a direct influence of attention on visuomotor processing in dorsal cortex. Nevertheless, given
that significant cross-talk certainly exists between the dorsal and ventral processing streams (e.g.,
Milner & Goodale, 1995; Van Essen & DeYoe, 1995; Seki, 1993), it would not be surprising to
find that attention can exert an influence on visuomotor processing via both direct and indirect
routes. What our data here suggest is that we should now be asking exactly these questions.
Attention and Visuomotor Processing 17
References
Aguirre, G. K., Zarahn, E., & D'Esposito, M. (1998). The inferential impact of global signal
covariates in functional neuroimaging analyses. NeuroImage, 8, 302-306.
Baizer, J. S., Ungerleider, L. G., & Desimone, R. (1991). Organization of visual inputs to the
inferior temporal and posterior parietal cortex in macaques. The Journal of Neuroscience, 11,
168-190.
Bashinski, H. S., & Bacharach, V. R. (1980). Enhancement of perceptual sensitivity as the
result of selectively attending to spatial locations. Percept. & Psychophys. 28, 241-248.
Battaglia-Mayer, A., Caminiti, R., Lacquaniti, F., & Zago, M. (2003). Multiple levels of
representation of reaching in the parieto-frontal network. Cerebral Cortex 13, 1009-1022.
Boles, D. B. (1983). Hemispheric interaction in visual field asymmetry. Cortex, 19, 99-113.
Boles, D. B. (1994). An experimental comparison of stimulus type, display type, and input variable
contributions to visual field asymmetry. Brain and Cognit., 24, 184-197.
Bonfiglioli, C., Duncan, J., Rorden, C., & Kennett, S. (2002). Action and perception: Evidence
against converging selection processes. Vis. Cognit., 9, 458-476.
Bradshaw, J. L. (2001). Asymmetries in preparation for action. Trends in Cognitive Sci., 5, 184-
185.
Burnod, Y., Baraduc, P., Battaglia-Mayer, A., Guigon, E., Koechlin, E., Ferraina, S., Lacquaniti,
F., & Caminiti, R. (1999). Parieto-frontal coding of reaching: an integrated framework. Exp.
Brain Res., 129, 325-346.
Caminiti, R., Ferraina, S., & Battaglia Mayer, A. (1998). Visuomotor transformations: early
cortical mechanisms of reaching. Curr. Opinion in Neurobiol., 8, 753-761.
Chao, L. L., & Martin, A. (2000). Representation of manipulable man-made objects in the dorsal
stream. NeuroImage 12, 478-484.
Corbetta, M., & Shulman, G. L. (2002). Control of goal-directed and stimulus-driven attention
in the brain. Nat. Reviews Neurosci. 3, 201-215.
Attention and Visuomotor Processing 18
Craighero, L., Fadiga, L., Rizzolatti, G., & Umiltà, C. (1999). Action for perception: A motor-
visual attentional effect. J. Exp. Psychol. Hum. Percept. Perform. 25, 1673-1692.
Desjardins, A. E., Kiehl, K. A., & Liddle, P. F. (2001). Removal of confounding effects of
global signal in functional MRI analyses. NeuroImage, 13, 751-758.
Deubel, H., Schneider, W. X., & Paprotta, I. (1998). Selective dorsal and ventral processing:
Evidence for a common attentional mechanism in reaching and perception. Vis. Cognit., 5,
81-107.
Downing, C. J. (1998). Expectancy and visuo-spatial attention: Effects on perceptual quality. J.
Exp. Psychol. Hum. Percept. Perform. 13, 228-241.
Friston, K. J., Williams, S., Howard, R., Frackowiak, R. S., & Turner, R. (1996). Movement-
related effects in fMRI time-series. Magnetic Resonance in Medicine 35, 346-355.
Friston, K. J., Ashburner, J., Frith, C. D., Poline, J.-P., Heather, J. D., & Frackowiak, R. S. J.
(1995a). Spatial registration and normalization of images. Human Brain Mapp. 2, 165-189.
Friston, K. J., Holmes, A. P., Worsley, K. J., Poline, J.-P., Frith, C. D., & Frackowiak, R. S. J.,
(1995b). Statistical parametric maps in functional imaging: A general linear approach.
Human Brain Mapp. 2, 189-210.
Ganel, T., & Goodale, M. A. (2003). Visual control of action but not perception requires
analytical processing of object shape. Nature, 426, 664-667.
Gerardin, E., et. al. (2000). Partially overlapping neural networks for real and imagined hand
movements. Cerebral Cortex 10, 1093-1104 (2000).
Giesbrecht, B., Woldorff, M. G., Song, A. W., & Mangun, G. R. (2003). Neural mechanisms of
top-down control during spatial and feature attention. NeuroImage, 19, 496-512.
Grafton, S. T., Fadiga, L., Arbib, M. A., & Rizzolatti, G. (1997). Premotor cortex activation
during observation and naming of familiar tools. NeuroImage 6, 231-236.
Grèzes, J., & Decety, J. (2002). Does visual perception of object afford action? Evidence from a
neuroimaging study. Neuropsychologia, 40, 212-222.
Attention and Visuomotor Processing 19
Grèzes, J., Tucker, M., Armony, J., Ellis, R., & Passingham, R. E. (2003). Objects automatically
potentiate action: an fMRI study of implicit processing. Eur. J. Neurosci., 17, 2735-2740.
Haaland, K. Y., & Harrington, D. L. (1996). Hemispheric asymmetry of movement. Curr.
Opinion in Neurobiol., 6, 796-800.
Haggard, P., & Magno, E. (2001). Localising awareness of action with transcranial magnetic
stimulation. Exp. Brain Res., 127, 102-107.
Haggard, P, & Whitford, B. (2004). Supplementary motor area provides an efferent signal for
sensory suppression. Cognitive Brain Res., 19, 52-58.
Handy, T. C., Grafton, S. T., Shroff, N. M., Ketay, S., & Gazzaniga, M. S. (2003). Graspable
object grab attention when the potential for action is recognized. Nat. Neurosci. 6, 421-427.
Handy, T. C., Hopfinger, J. B., & Mangun, G. R. (2001). Functional neuroimaging of attention
processes. In R. Cabeza & A. Kingstone (Eds.) Handbook on Functional Neuroimaging of
Cognition (pp. 75-108). Cambridge, MA: MIT Press
Handy, T. C., Kingstone, A., & Mangun, G. R. (1996). Spatial distribution of visual attention:
Perceptual sensitivity and response latency. Percept. & Psychophys., 58, 613-627.
Handy, T.C. & Mangun, G.R. (2000). Attention and spatial selection: Electrophysiological
evidence for modulation by perceptual load. Percept. & Psychophys., 62, 175-186.
Heinze, H. J., et al. (1994). Combined spatial and temporal imaging of brain activity during
visual selective attention in humans. Nature, 372, 543-546.
Hillyard, S. A., Vogel, E. K., & Luck, S. J. (1999). Sensory gain control (amplification) as a
mechanism of selective attention: electrophysiological and neuroimaging evidence. In G.
W. Humphreys, J. Duncan, & A. Treisman (Eds.) Attention, Space, and Action: Studies in
Cognitive Neuroscience (pp. 31-53). New York: Oxford.
Hodges, J. R., Spatt, J., & Patterson, K. (1999). "What" and "how": evidence for the dissociation
of object knowledge and mechanical problem-solving skills in the human brain. Proceedings
of the National Academy of Sciences, USA, 96, 9444-9448.
Attention and Visuomotor Processing 20
Hopfinger, J. B., Buonocore, M. H., & Mangun, G. R. (2000). The neural mechanisms of top-
down attentional control. Nat. Neurosci. 3, 284-291.
Humphreys, G. W., & Riddoch, M. J. (2001). Detection by action: neuropsychological evidence
for action-defined templates in search. Nature Neuroscience, 4, 84-88.
Jeannerod, M. (2001). Neural simulation of action: A unifying mechanism for motor cognition.
NeuroImage, 14, S103-S109.
Kastner, S., De Weerd, P., Desimone, R., & Ungerleider, L. G. (1998). Mechansims of directed
attention in the human extrastriate cortex as revealed by functional MRI. Science, 282, 108-
111.
Mangun, G. R. (1995). Neural mechanisms of visual selective attention. Psychophysiology, 32,
4-18.
Mangun, G. R., & Hillyard, S. A. (1995). Mechanisms and models of selective attention. In M.
D. Rugg & M. G. H. Coles (Eds.) Electrophysiology of Mind: Event-Related Brain
Potentials and Cognition, pp. 40-85. New York: Oxford.
Mangun, G. R., Luck, S. J., Plager, R., Loftus, W., Hillyard, S. A., Handy, T. C., Clark, V. P., &
Gazzaniga, M. S. (1994). Monitoring the visual world: Hemispheric asymmetries and
subcortical processes in attention. J. Cognit. Neurosci., 6, 267-275.
Marconi, B. et al. (2001). Eye-hand coordination during reaching. I. Anatomical relationships
between parietal and frontal cortex. Cerebral Cortex 11, 513-527.
Martin, A., Haxby, J. V., Lalonde, F. M., Wiggs, C. L., & Ungerleider, L. G. (1995). Discrete
cortical regions associated with knowledge of color and knowledge of action. Science, 270, 102-
105.
Martin, A., Wiggs, C. L., Ungerleider, L. G., & Haxby, J. V. (1996). Neural correlates of category-
specific knowledge. Nature, 379, 649-652.
Matelli, M., & Luppino, G. (2001). Parietofrontal circuits for action and space perception in the
macaque monkey. NeuroImage, 14, S27-S32.
Attention and Visuomotor Processing 21
Mattingley, J. B., Husain, M., Rorden, C., Kennard, C., & Driver, J. (1998). Motor role of
human inferior parietal lobe revealed in unilateral neglect patients. Nature, 392, 179-182.
Miezin, F. M., Maccotta, L., Ollinger, J. M., Petersen, S. E., & Buckner, R. L. (2000).
Characterizing the hemodynamic response: Effects of presentation rate, sampling procedure,
and the possibility of ordering brain activity based on relative timing. NeuroImage, 11, 735-
759.
Milner, A. D., & Goodale, M. A. (1995). The Visual Brain in Action. New York: Oxford.
Mishkin, M., Ungerleider, L. G., & Macko, K. A. (1983). Object vision and spatial vision: Two
cortical pathways. Trends Neurosci. 6, 414-417.
Morel, A. & Bullier, J. (1990). Anatomical segregation of two cortical visual pathways in the
macaque monkey. Visual Neuroscience, 4, 555-578.
Pavese, A., & Buxbaum, L. J. (2002). Action matters: The role of action plans and object
affordances in selection for action. Vis. Cognition, 9, 559-590.
Picard, N., & Strick, P. L. (2001). Imaging premotor areas. Curr. Opin. Neurobiol. 11, 663-672.
Reuter-Lorenz, P. A., Kinsbourne, M., & Moscovitch, M. (1990). Hemispheric control of spatial
attention. Brain and Cognition, 12, 240-266.
Raichle, M. E. (1999). The neural correlates of consciousness: an analysis of cognitive skill
learning. In M. S. Gazzaniga (Ed.) The New Cognitive Neurosciences (pp. 1305-1318).
Cambridge, MA: MIT Press.
Riddoch, M. J., Humphreys, G. W., Edwards, S., Baker, T., & Willson, K. (2003). Seeing the
action: neuropsychological evidence for action-based effects on object selection. Nat.
Neurosci. 6, 82-89.
Rizzolatti, G., Riggio, L., Dascola, I., & Umiltá, C. (1987). Reorienting attention across the
horizontal and vertical meridians: Evidence in favor of a premotor theory of attention.
Neuropsychologia, 25, 31-40.
Attention and Visuomotor Processing 22
Rizzolatti, G., Riggio, L., & Sheliga, B. M. (1994). Space and selective attention. In C. Umilta
and M. Moscovitch (Eds.) Attention and Performance, XV(pp. 231-265). Cambridge, MA:
MIT Press.
Rushworth, M. F. S., Nixon, P. D., Renowden, S., Wade, D. T., & Passingham, R. E. (1997). The
left parietal cortex and motor attention. Neuropsychologia, 35, 1261-1273.
Rushworth, M. F. S., Krams, M., & Passingham, R. E. (2001a). The attentional role of the left
parietal cortex: The distinct lateralization and localization of motor attention in the human
brain. J. Cogn. Neurosci. 13, 698-710.
Rushworth, M. F. S., Ellison, A., & Walsh, V. (2001b). Complementary localization and
lateralization of orienting and motor attention. Nat. Neurosci., 4, 656-661.
Schluter, N. D., Krams, M., Rushworth, M. F. S., & Passingham, R. E. (2001). Cerebral
dominance for action in the human brain: the selection of actions. Neuropsychologia, 39, 105-
113.
Seki, S. (1993). A Vision of the Brain. Boston: Blackwell.
Shmuel, A., Yacoub, E., Pfeuffer, J., Van de Moortele, P.-F., Adriany, G., Hu, X., & Ugurbil, K.
(2002). Sustained negative BOLD, blood flow and oxygen consumption response and its
coupling to the positive response in the human brain. Neuron, 36, 11-95-1210.
Shulman, G. L., Fiez, J. A., Corbetta, M., Buckner, R. , Miezin, F. M., Raichle, M. E., &
Petersen, S. E. (1997). Common blood flow changes across visual tasks: II. Decreases in
cerebral cortex. J. Cogn. Neurosci., 9, 648-663.
Smith, A. T., Singh, K. D., & Greenlee, M. W. (2000). Attentional suppression of activity in the
human visual cortex. Neuroreport, 11, 271-277.
Smith, A. T., Williams, A. L., & Singh, K. D. (2004). Negative BOLD in the visual cortex:
evidence against blood stealing. Human Brain Mapping, 21, 213-220.
Snodgrass, J. G., & Vanderwart, M. (1980). A standardized set of 260 pictures: Norms for name
agreement, image agreement, familiarity, and visual complexity. J. Exp. Psychol. Hum.
Learn. Mem. 6, 174-215.
Attention and Visuomotor Processing 23
Talairach, J. and Tournoux, P. (1988). Co-planar Stereotaxic Atlas of the Human Brain. New
York: Thieme Medical Publishers.
Tipper, S. P., Lortie, C., & Baylis, G. C. (1992). Selective reaching: Evidence for action-
centered attention. J. Exp. Psychol. Hum. Percept. Perform. 18, 891-905.
Tootell, R. B. H., Hadjikhani, N., Hall, E. K., Marrett, S., Vanduffel, W., Vaughan, J. T., & Dale,
A. M. (1998). The retinotopy of visual spatial attention. Neuron, 21, 1409-1422.
Tucker, M. & Ellis, R. (1998). On the relations between seen objects and components of
potential actions. J. Exp. Psychol. Hum. Percept. Perform. 24, 830-846.
Tucker, M. & Ellis, R. (2004). Action priming by briefly presented objects. Acta Psychologica,
116, 185-203.
Van Essen, D. C., & DeYoe, E. A. (1995). Concurrent processing in the primate visual cortex. In
M. S. Gazzaniga (Ed.) The Cognitive Neurosciences (pp. 383-400). Cambridge, MA: MIT.
Ward, R. (1999). Interaction between perception and action systems: a model for selective
action. In G. W. Humphreys, J. Duncan, and A. Treisman (Eds.) Attention, Space, and
Action: Studies in Cognitive Neuroscience (pp. 311-332). New York: Oxford University
Press.
Weir, P. L., Weeks, D. J., Welsh, T. N., Elliott, D., Chua, R., Roy, E. A., & Lyons, J. (2003).
Influence of terminal action requirements on action-centered distractor effects. Experimental
Brain Research, 149, 207-213.
Wilkinson, D., & Halligan, P. (2004). The relevance of behavioural measures for functional-
imaging studies of cognition. Nat. Rev. Neurosci., 5, 67-73.
Woldorff, M. G., Fox, P. T., Matzke, M., Lancaster, J. L., Veeraswamy, S., Zamarripa, F.,
Seabolt, M., Glass, T., Gao, J. H., Martin, C. C., & Jerabek, P. (1997). Retinotopic
organization of early visual spatial attention effects as revealed by PET and ERPs. Human
Brain Mapping, 5, 280-286.
Wojciulik, E., Kanwisher, N., & Driver, J. (1998). Covert visual attention modulates face-
specific activity in the human fusiform gyrus: an fMRI study. J. Neurophys. 79, 1574-1578.
Attention and Visuomotor Processing 24
Footnote
1. The volitional orienting of visual spatial attention is associated with the activation of a
bilateral parietal-prefrontal network comprising the superior parietal lobule (SPL) and
dorsolateral prefrontal cortex (DLPFC)(e.g., Corbetta & Shulman, 2002; Hopfinger et al., 2000;
Giesbrecht et al., 2003; Kastner et al., 1998). This predicted that our spatial cues should have
activated a similar network. In addition to the fMRI analysis reported in the Results, we thus
applied a second general linear model to our fMRI data that specifically examined the event-
related responses to the onset of the spatial cues as a function of their location. Both LVF and
RVF cues elicited an increased fMRI BOLD response in bilateral SPL and DLPFC, a pattern not
only consistent with the top-down orienting of visual spatial attention, but one that differed from
the network of areas typically associated with VMRs, including IPL, PMd, PMv, prePMd, SMA,
and preSMA (e.g., Chao & Martin, 2000; Grafton et al., 1997; Grèzes & Decety, 2002; Grèzes et
al., 2003; Handy et al., 2003; Jeannerod, 2001; Picard & Strick, 2001).
Attention and Visuomotor Processing 25
Table 1. Voxel clusters, by Figure and Cluster Number.
====================================================================
Anatomical Locus
Figure Cluster # BA Gyrus Response Profile
------------ ------------ ---------------------------------- ----------------------------------
2a/3 1 6 L Superior Frontal Tool Location
2 7 L SPL Tool Location
------------ ------------ ---------------------------------- ----------------------------------
2c/4 1 24 Anterior Cingulate Attended Location
2 6 Medial Frontal Attended x Tool Location
3 40 L IPL Attended x Tool Location
4 4 R Pre-Central Attended Location
5 4 R Pre-Central Attended Location
-------------------------------------------------------------------------------------------------------------------
Note: "Response Profile" is based on significance of statistics performed on mean response
across attention and tool conditions within each cluster, as reported in Results. Voxel statistics
and maxima coordinates are also reported in the Results. BA = Brodmann's area, L = left, R =
right, IPL = inferior parietal lobule, SPL = superior parietal lobule.
====================================================================
Attention and Visuomotor Processing 26
Figure Legends
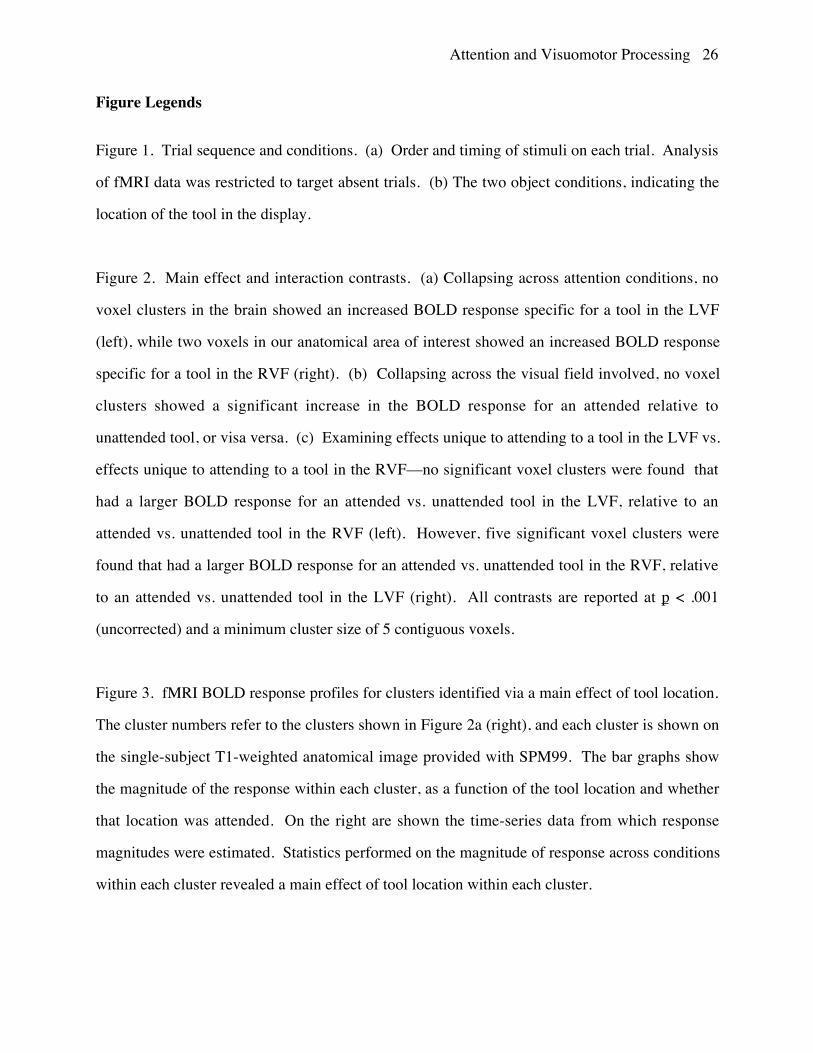
Figure 1. Trial sequence and conditions. (a) Order and timing of stimuli on each trial. Analysis
of fMRI data was restricted to target absent trials. (b) The two object conditions, indicating the
location of the tool in the display.
Figure 2. Main effect and interaction contrasts. (a) Collapsing across attention conditions, no
voxel clusters in the brain showed an increased BOLD response specific for a tool in the LVF
(left), while two voxels in our anatomical area of interest showed an increased BOLD response
specific for a tool in the RVF (right). (b) Collapsing across the visual field involved, no voxel
clusters showed a significant increase in the BOLD response for an attended relative to
unattended tool, or visa versa. (c) Examining effects unique to attending to a tool in the LVF vs.
effects unique to attending to a tool in the RVF––no significant voxel clusters were found that
had a larger BOLD response for an attended vs. unattended tool in the LVF, relative to an
attended vs. unattended tool in the RVF (left). However, five significant voxel clusters were
found that had a larger BOLD response for an attended vs. unattended tool in the RVF, relative
to an attended vs. unattended tool in the LVF (right). All contrasts are reported at p < .001
(uncorrected) and a minimum cluster size of 5 contiguous voxels.
Figure 3. fMRI BOLD response profiles for clusters identified via a main effect of tool location.
The cluster numbers refer to the clusters shown in Figure 2a (right), and each cluster is shown on
the single-subject T1-weighted anatomical image provided with SPM99. The bar graphs show
the magnitude of the response within each cluster, as a function of the tool location and whether
that location was attended. On the right are shown the time-series data from which response
magnitudes were estimated. Statistics performed on the magnitude of response across conditions
within each cluster revealed a main effect of tool location within each cluster.
Attention and Visuomotor Processing 27
Figure 4. fMRI BOLD response profiles for clusters identified via the interaction contrast. The
cluster numbers refer to the clusters shown in Figure 2c (right), and each cluster is shown on the
single-subject T1-weighted anatomical image provided with SPM99. The bar graphs show the
magnitude of the response within each cluster, as a function of the tool location and whether that
location was attended. On the right are shown the time-series data from which response
magnitudes were estimated. Statistics performed on the magnitude of response across conditions
within each cluster showed that all five clusters showed a main effect of attention. However,
only clusters 2 and 3––corresponding to SMA and left IPL, respectively––also showed a
significant interaction between the tool location and attended location.
LVF toolRVF tool
b Object conditions
a Trial sequence
Time
100 ms
250 ms
850 ms
750 ms
Target present trial Target absent trial
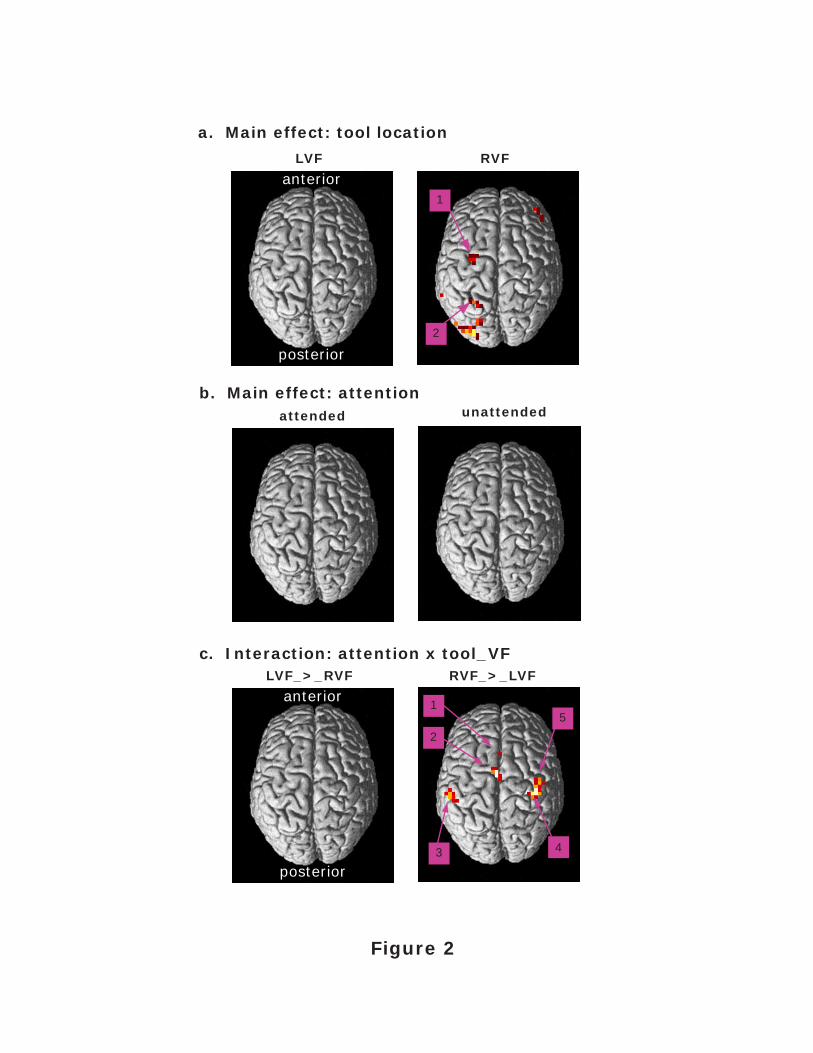
Figure 2
anterior
posterior
attended unattended
1
2
3 4
5
c. Interaction: attention x tool_VF
anterior
posterior
a. Main effect: tool location
LVF RVF
1
2
b. Main effect: attention
LVF_>_RVF RVF_>_LVF
Figure 3
Response
Resp
onse
tool locationLVF RVF
attended
unattended
-0.02
-0.01
0.00
0.01
0.02
-0.02
-0.01
0.00
0.01
0.02
attended
unattended
tool locationLVF RVF
Resp
onse
-0.06
-0.04
-0.02
0.00
0.02
0.04
0.06
Resp
onse
-0.06
-0.04
-0.02
0.00
0.02
0.04
0.06
Resp
onse
attendedunattended -0.06
-0.04
-0.02
0.00
0.02
0.04
0.06
Resp
onse
attendedunattended
-0.06
-0.04
-0.02
0.00
0.02
0.04
0.06
Resp
onse
attendedunattended -0.06
-0.04
-0.02
0.00
0.02
0.04
0.06
attendedunattended
Resp
onse
Tool-location LVF RVFCluster
1
2
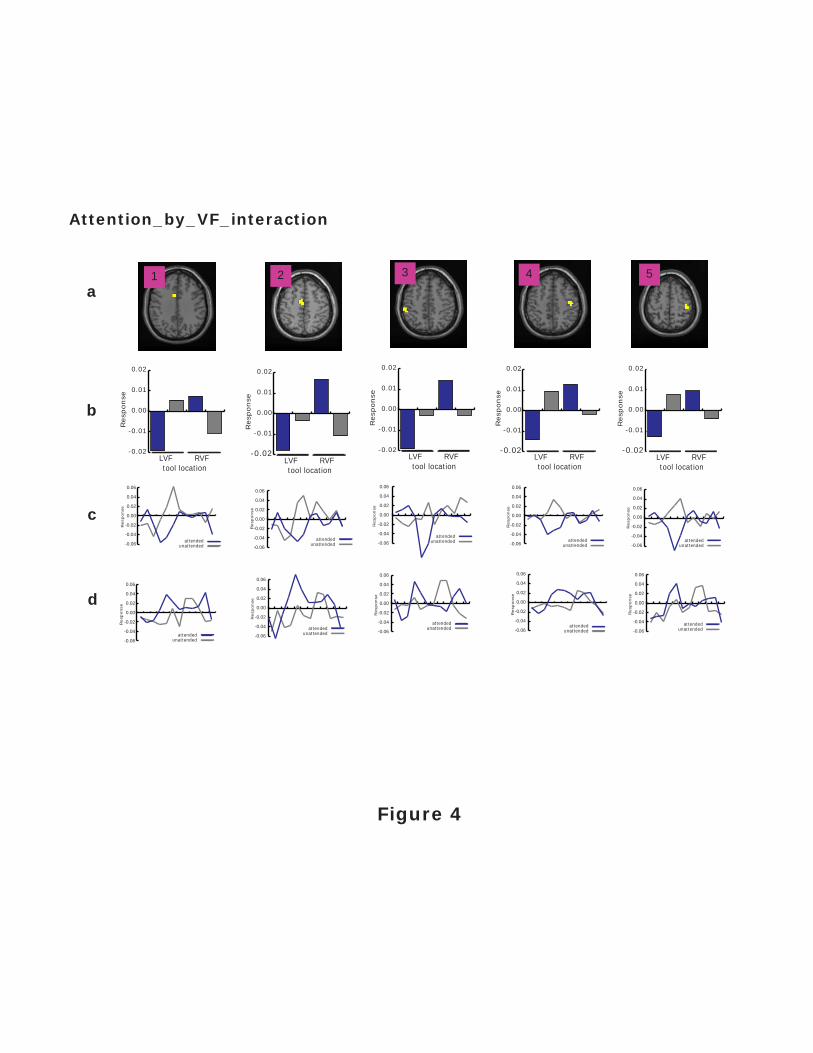
Figure 4
a
-0.02
-0.01
0.00
0.01
0.02
tool locationLVF RVF
Resp
onse
-0.02
-0.01
0.00
0.01
0.02
tool locationLVF RVF
Resp
onse
-0.02
-0.01
0.00
0.01
0.02
tool locationLVF RVF
Resp
onse
-0.02
-0.01
0.00
0.01
0.02
tool locationLVF RVF
Resp
onse
-0.02
-0.01
0.00
0.01
0.02
tool locationLVF RVF
Resp
onse
Attention_by_VF_interaction
-0.06
-0.04
-0.02
0.00
0.02
0.04
0.06
Resp
onse
attendedunattended
attendedunattended-0.06
-0.04
-0.02
0.00
0.02
0.04
0.06
Resp
onse
attendedunattended
-0.06
-0.04
-0.02
0.00
0.02
0.04
0.06
Resp
onse
attendedunattended-0.06
-0.04
-0.02
0.00
0.02
0.04
0.06
Resp
onse
attendedunattended-0.06
-0.04
-0.02
0.00
0.02
0.04
0.06
Resp
onse
attendedunattended-0.06
-0.04
-0.02
0.00
0.02
0.04
0.06
Resp
onse
attendedunattended-0.06
-0.04
-0.02
0.00
0.02
0.04
0.06
Resp
onse
attendedunattended-0.06
-0.04
-0.02
0.00
0.02
0.04
0.06
Resp
onse
attendedunattended-0.06
-0.04
-0.02
0.00
0.02
0.04
0.06
Resp
onse
attendedunattended
-0.06
-0.04
-0.02
0.00
0.02
0.04
0.06
Resp
onse
b
c
d
1 2 3 4 5
Related Documents