Pla2g12b and Hpn Are Genes Identified by Mouse ENU Mutagenesis That Affect HDL Cholesterol Aleksandra Aljakna, Seungbum Choi, Holly Savage, Rachael Hageman Blair, Tongjun Gu, Karen L. Svenson, Gary A. Churchill, Matt Hibbs, Ron Korstanje* The Jackson Laboratory, Bar Harbor, Maine, United States of America Abstract Despite considerable progress understanding genes that affect the HDL particle, its function, and cholesterol content, genes identified to date explain only a small percentage of the genetic variation. We used N-ethyl-N-nitrosourea mutagenesis in mice to discover novel genes that affect HDL cholesterol levels. Two mutant lines (Hlb218 and Hlb320) with low HDL cholesterol levels were established. Causal mutations in these lines were mapped using linkage analysis: for line Hlb218 within a 12 Mbp region on Chr 10; and for line Hlb320 within a 21 Mbp region on Chr 7. High-throughput sequencing of Hlb218 liver RNA identified a mutation in Pla2g12b. The transition of G to A leads to a cysteine to tyrosine change and most likely causes a loss of a disulfide bridge. Microarray analysis of Hlb320 liver RNA showed a 7-fold downregulation of Hpn; sequencing identified a mutation in the 39 splice site of exon 8. Northern blot confirmed lower mRNA expression level in Hlb320 and did not show a difference in splicing, suggesting that the mutation only affects the splicing rate. In addition to affecting HDL cholesterol, the mutated genes also lead to reduction in serum non-HDL cholesterol and triglyceride levels. Despite low HDL cholesterol levels, the mice from both mutant lines show similar atherosclerotic lesion sizes compared to control mice. These new mutant mouse models are valuable tools to further study the role of these genes, their affect on HDL cholesterol levels, and metabolism. Citation: Aljakna A, Choi S, Savage H, Hageman Blair R, Gu T, et al. (2012) Pla2g12b and Hpn Are Genes Identified by Mouse ENU Mutagenesis That Affect HDL Cholesterol. PLoS ONE 7(8): e43139. doi:10.1371/journal.pone.0043139 Editor: Henrik Einwaechter, Klinikum rechts der Isar der TU Mu ¨ nchen, Germany Received March 29, 2012; Accepted July 16, 2012; Published August 17, 2012 Copyright: ß 2012 Aljakna et al. This is an open-access article distributed under the terms of the Creative Commons Attribution License, which permits unrestricted use, distribution, and reproduction in any medium, provided the original author and source are credited. Funding: This work was supported by the National Institute of General Medical Sciences (grant GM076468 to AA, RK and GC); the National Heart, Lung, and Blood Institute (grant HL095668 and an American Recovery and Reinvestment Act (ARRA) supplement to RK and a National Research Service Award (NSRA) fellowship 1F32 HL095240 to RHB); and by the National Cancer Institute Cancer Core (grant CA034196 to the Jackson Laboratory). The funders had no role in study design, data collection and analysis, decision to publish, or preparation of the manuscript. Competing Interests: The authors have declared that no competing interests exist. * E-mail: [email protected] Introduction Over the past few decades the incidence of cardiovascular diseases, caused by underlying atherosclerosis, has increased and become a public health concern [1,2,3,4]. HDL cholesterol level is a negative risk factor for atherosclerosis and raising its level has been identified as a preventative strategy for disease management [5,6,7]. Despite considerable progress that has been made through genetic associations and studies on model organisms to unravel regulation of the HDL particle and its cholesterol content, recent studies suggest that gaps in knowledge about HDL regulation and its role in the disease remain to be filled [8]. First, genes identified to date explain only a small percentage of genetic variation, suggesting that many genes are yet to be identified [9]. Second, several clinical studies have identified individuals with a significant atherosclerosis burden despite low, normal, or elevated levels of HDL cholesterol [7,10]. Third, although torcetrapib trials demonstrated significant increase in HDL cholesterol levels, the study failed to show a reduction in cardiovascular events [10]. Knowing and understanding genes that affect the HDL choles- terol, function, and protein content in full detail is critical: It will help us understand its role in lipid metabolism and in the development of atherosclerosis, and predict unwanted side effects of future treatment [6,8]. We aim to discover novel genes that contribute to the phenotypic variability of HDL cholesterol levels. One approach for identifying novel genes is by N-ethyl-N- nitrosourea (ENU) mutagenesis in mice [11,12]. Genes identified through this approach would either directly affect the HDL particle, its cholesterol content, or both, or indirectly influence metabolites and metabolic pathways that in turn affect the HDL particle, its cholesterol content, or both. Using this approach we established 2 mouse lines (Hlb218 and Hlb320) with low HDL cholesterol, identified the causal mutations, and characterized the mutants. Materials and Methods Animals, Housing, and Diet Mutant mice (G0) were generated as part of The Jackson Laboratory’s Heart, Lung, Blood, and Sleep Disorder Mutagenesis Program by treating male C57BL/6J (B6) mice with N-ethyl-N- nitrosourea (ENU). Protocols for generating, phenotyping and heritability testing of these ENU lines were described previously [12]. Briefly, to capture both dominant and recessive mutations, G0 mice were backcrossed twice to the B6 strain to generate G2 mice, which were then backcrossed to G1 mice to generate third generation ENU mutants (G3). Phenotyping G3 progeny identi- fied two unique G3 animals with low HDL cholesterol levels that were then used to establish new inbred lines (Hlb218 and Hlb320): first, G3 (N2F1) animals were backcrossed to B6 mice (the third PLOS ONE | www.plosone.org 1 August 2012 | Volume 7 | Issue 8 | e43139

Welcome message from author
This document is posted to help you gain knowledge. Please leave a comment to let me know what you think about it! Share it to your friends and learn new things together.
Transcript

Pla2g12b and Hpn Are Genes Identified by Mouse ENUMutagenesis That Affect HDL CholesterolAleksandra Aljakna, Seungbum Choi, Holly Savage, Rachael Hageman Blair, Tongjun Gu,
Karen L. Svenson, Gary A. Churchill, Matt Hibbs, Ron Korstanje*
The Jackson Laboratory, Bar Harbor, Maine, United States of America
Abstract
Despite considerable progress understanding genes that affect the HDL particle, its function, and cholesterol content, genesidentified to date explain only a small percentage of the genetic variation. We used N-ethyl-N-nitrosourea mutagenesis inmice to discover novel genes that affect HDL cholesterol levels. Two mutant lines (Hlb218 and Hlb320) with low HDLcholesterol levels were established. Causal mutations in these lines were mapped using linkage analysis: for line Hlb218within a 12 Mbp region on Chr 10; and for line Hlb320 within a 21 Mbp region on Chr 7. High-throughput sequencing ofHlb218 liver RNA identified a mutation in Pla2g12b. The transition of G to A leads to a cysteine to tyrosine change and mostlikely causes a loss of a disulfide bridge. Microarray analysis of Hlb320 liver RNA showed a 7-fold downregulation of Hpn;sequencing identified a mutation in the 39 splice site of exon 8. Northern blot confirmed lower mRNA expression level inHlb320 and did not show a difference in splicing, suggesting that the mutation only affects the splicing rate. In addition toaffecting HDL cholesterol, the mutated genes also lead to reduction in serum non-HDL cholesterol and triglyceride levels.Despite low HDL cholesterol levels, the mice from both mutant lines show similar atherosclerotic lesion sizes compared tocontrol mice. These new mutant mouse models are valuable tools to further study the role of these genes, their affect onHDL cholesterol levels, and metabolism.
Citation: Aljakna A, Choi S, Savage H, Hageman Blair R, Gu T, et al. (2012) Pla2g12b and Hpn Are Genes Identified by Mouse ENU Mutagenesis That Affect HDLCholesterol. PLoS ONE 7(8): e43139. doi:10.1371/journal.pone.0043139
Editor: Henrik Einwaechter, Klinikum rechts der Isar der TU Munchen, Germany
Received March 29, 2012; Accepted July 16, 2012; Published August 17, 2012
Copyright: � 2012 Aljakna et al. This is an open-access article distributed under the terms of the Creative Commons Attribution License, which permitsunrestricted use, distribution, and reproduction in any medium, provided the original author and source are credited.
Funding: This work was supported by the National Institute of General Medical Sciences (grant GM076468 to AA, RK and GC); the National Heart, Lung, andBlood Institute (grant HL095668 and an American Recovery and Reinvestment Act (ARRA) supplement to RK and a National Research Service Award (NSRA)fellowship 1F32 HL095240 to RHB); and by the National Cancer Institute Cancer Core (grant CA034196 to the Jackson Laboratory). The funders had no role instudy design, data collection and analysis, decision to publish, or preparation of the manuscript.
Competing Interests: The authors have declared that no competing interests exist.
* E-mail: [email protected]
Introduction
Over the past few decades the incidence of cardiovascular
diseases, caused by underlying atherosclerosis, has increased and
become a public health concern [1,2,3,4]. HDL cholesterol level is
a negative risk factor for atherosclerosis and raising its level has
been identified as a preventative strategy for disease management
[5,6,7]. Despite considerable progress that has been made through
genetic associations and studies on model organisms to unravel
regulation of the HDL particle and its cholesterol content, recent
studies suggest that gaps in knowledge about HDL regulation and
its role in the disease remain to be filled [8]. First, genes identified
to date explain only a small percentage of genetic variation,
suggesting that many genes are yet to be identified [9]. Second,
several clinical studies have identified individuals with a significant
atherosclerosis burden despite low, normal, or elevated levels of
HDL cholesterol [7,10]. Third, although torcetrapib trials
demonstrated significant increase in HDL cholesterol levels, the
study failed to show a reduction in cardiovascular events [10].
Knowing and understanding genes that affect the HDL choles-
terol, function, and protein content in full detail is critical: It will
help us understand its role in lipid metabolism and in the
development of atherosclerosis, and predict unwanted side effects
of future treatment [6,8]. We aim to discover novel genes that
contribute to the phenotypic variability of HDL cholesterol levels.
One approach for identifying novel genes is by N-ethyl-N-
nitrosourea (ENU) mutagenesis in mice [11,12]. Genes identified
through this approach would either directly affect the HDL
particle, its cholesterol content, or both, or indirectly influence
metabolites and metabolic pathways that in turn affect the HDL
particle, its cholesterol content, or both. Using this approach we
established 2 mouse lines (Hlb218 and Hlb320) with low HDL
cholesterol, identified the causal mutations, and characterized the
mutants.
Materials and Methods
Animals, Housing, and DietMutant mice (G0) were generated as part of The Jackson
Laboratory’s Heart, Lung, Blood, and Sleep Disorder Mutagenesis
Program by treating male C57BL/6J (B6) mice with N-ethyl-N-
nitrosourea (ENU). Protocols for generating, phenotyping and
heritability testing of these ENU lines were described previously
[12]. Briefly, to capture both dominant and recessive mutations,
G0 mice were backcrossed twice to the B6 strain to generate G2
mice, which were then backcrossed to G1 mice to generate third
generation ENU mutants (G3). Phenotyping G3 progeny identi-
fied two unique G3 animals with low HDL cholesterol levels that
were then used to establish new inbred lines (Hlb218 and Hlb320):
first, G3 (N2F1) animals were backcrossed to B6 mice (the third
PLOS ONE | www.plosone.org 1 August 2012 | Volume 7 | Issue 8 | e43139

backcross); then their progeny (N3F1) with the low HDL
cholesterol phenotype were further intercrossed (the number of
intercross generations varied by experiment; see materials and
methods section of each experiment for generation information).
Both lines were cryopreserved and are publically available. The
Mouse Genome Database (www.informatics.jax.org) accession
numbers and JAXH Mice database (http://jaxmice.jax.org) stock
numbers are as follows: Hlb218—MGI:2678708, stock #008508;
Hlb320—MGI:3575147, stock #008507. C57L/J (C57L) and
C57BL/6J-LdlrHlb301/J (Ldlr ENU) mice were purchased from The
Jackson Laboratory, Bar Harbor, ME. All mice were housed in a
temperature- and humidity-controlled pathogen-free facility with a
12 h:12 h light:dark cycle. Mice were housed in pressurized,
individually ventilated duplex cages on shaved pine bedding and
had free access to acidified water and a standard rodent chow diet
containing 6% fat by weight (5kK2 LabDiet, Brentwood, MO).
Mice involved in the test for susceptibility to atherosclerosis were
fed an atherogenic diet (18.5% dietary fat, 1.9% corn oil, 50%
sucrose, 4.1% cellulose, 20% casein, 1% cholesterol, 0.5% cholic
acid, 5% mineral mix, 1% vitamin mix, 0.3% DL-methione,
0.13% a-tocopherol, 1% choline chloride; similar to the previously
described diet) [13]. All experiments were approved by The
Jackson Laboratory’s Animal Care and Use Committee.
Genetic Mapping and Linkage AnalysisTo map the ENU mutations to a chromosomal position, linkage
analyses on (ENUxC57L) F2 mice were performed. The C57L
strain was chosen as a mapping strain because, while it provided
enough polymorphisms to perform genetic mapping, its genetic
proximity to the background strain of the ENU mutants (B6)
reduced the presence of HDL cholesterol quantitative trait loci
(QTL) caused by natural polymorphisms between the two strains.
Briefly, mutant mice (Hlb218 generation — N3F5; Hlb320
generation — N3F8) were crossed with C57L mice, and F1
offspring were intercrossed to generate 81 Hlb218 and 75 Hlb320
F2 progeny, which were phenotyped at 8 weeks of age for plasma
HDL cholesterol levels as described below. DNA from each F2
mouse was extracted from the tail tip, isolated by phenol:chloro-
form extraction, and genotyped by KBiosciences, Herts, UK for
58 (Hlb218) and 61 (Hlb320) single-nucleotide markers (polymor-
phic between B6 and C57L) that cover the complete genome
(http://cgd.jax.org/cgdsnpdb). Linkage analysis was performed
using interval mapping methods specific for a binary trait within
the R/QTL package (R version 2.8.0, qtl version 1.09–43). Mice
that exhibited plasma HDL cholesterol levels similar to B6 and
C57L were considered not affected and were coded 0. Mice with
plasma HDL cholesterol levels that were two standard deviations
below the mean of normal B6 mice (#40.2 mg/dL for females and
#50.0 mg/dL for males) were considered affected and were coded
1. A genome-wide scan was done with 1,000 permutations. The
significant LOD score threshold was calculated by permutation
testing at a= 0.05 [14]. For (Hlb2186C57L)F2 mice the threshold
LOD score was 3.44, and for (Hlb3206C57L)F2 mice it was 3.46.
The mode of inheritance of the allele was determined by
performing a one-way ANOVA using the effect plot function
within the R/QTL package and confirmed by Tukey-Kramer
HSD: animals were grouped by genotype and sex, and the average
HDL cholesterol level of each group was compared [15]. Once a
chromosomal position was identified, affected animals with
crossovers on that chromosome were genotyped with additional
polymorphic markers to narrow the interval.
Analysis of HDL Cholesterol, Total Cholesterol,Triglyceride, Alkaline Phosphatase, and Thyroxine
Blood was collected via retro-orbital sinus from animals that
were food-deprived for 4 hours in the morning. Blood intended for
preparation of plasma was collected into tubes containing EDTA.
Plasma and serum were separated by centrifugation (14,000 rpm
for 10 minutes in an Eppendorf Centrifuge 5424 with rotor FA-
45-24-11 [20,2386g/14,860 rpm]) and frozen at 220uC until
analyzed. Plasma and serum samples were analyzed for lipid, total
alkaline phosphatase, and thyroxine levels on the Beckman
Coulter Synchron CXH5 Delta autoanalyzer (Beckman Coulter,
Inc., Brea, CA) within one week of collection date (HDL
cholesterol: enzymatic reagent kit #650207; total cholesterol:
enzymatic reagent kit #467825; triglycerides: enzymatic reagent
kit #445850; total alkaline phosphatase: enzymatic reagent kit
#442670; thyroxine: enzymatic reagent kit #445995). Serum lipid
levels: Hlb218 generation — N3F8; Hlb320 generation — N3F11.
Alkaline phosphatase and thyroxine levels: Hlb320 generation —
N3F9.
Microarray and RNAseq AnalysisLivers from 3 Hlb218 (N3F4), 3 Hlb320 (N3F5), and 6 B6 males
were obtained for gene expression analysis (microarray and
RNAseq). All males were 8 weeks old. Prior to tissue collection,
males were housed individually for 3 days, food-deprived for
4 hours (7 am to 11 am) on the day of tissue collection, sacrificed
by cervical dislocation, and perfused using DEPC treated 0.9%
NaCl solution. The liver samples were stored in RNAlater
(Ambion, Austin, TX) and homogenized in TRIzolTM (Invitrogen,
Carlsbad, CA). Total RNA was isolated by TRIzolTM Plus
methods according to the manufacturer’s protocols. RNA quality
was assessed using an Agilent 2100 Bioanalyzer instrument and
RNA 6000 Nano LabChip assay (Agilent Technologies, Palo Alto,
CA).
For microarray analysis, RNA was prepared using an IlluminaHTotalprep RNA amplification kit according to the manufacturer’s
protocol (Ambion, Austin, TX). Liver RNA samples were
hybridized on Illumina Mouse-6 Expression 1.1 BeadChips
(Illumina, San Diego, CA) using the Illumina BeadStation 5006followed by statistical analysis of the data. Probe set data (mean
pixel intensities by bead type) were created using BeadStudio
(version 3.0.19.0) and processed using the R/beadarray package
[16,17]. The data were log-transformed and normalized [18].
ANOVA models were used to determine gene expression
differences between each mutant strain and the B6 controls [19].
Statistical tests were performed using a modified F-statistic that
incorporates shrinkage estimates of variance components [20]. P-
values were calculated by permuting model residuals 1,000 times.
Calculations were done using the R/maanova package. To
identify candidate genes in the mapped interval, statistical
significance was calculated using Bonferroni correction: correction
was applied to a subset of genes in the mapped interval to account
for multiple testing. To identify all of the significantly differenti-
ated genes between Hlb320 and B6, the false discovery rate (FDR)
was estimated using a q-value calculation for the set of statistically
significant probes [21]. Gene expression data is available through
Gene Expression Omnibus (GEO) Accession GSE37902.
For RNAseq, the NEBNext mRNA Sample Prep Master Mix
Set I kit (New England Biolabs, Inc., Ipswich, MA) was used to
prepare the sequencing libraries. These libraries were sequenced
single-end on an Illumina HiSeq 2000 instrument (Illumina, San
Diego, CA). Every read was aligned to the NCBI mouse reference
genome (mm9) using the Bowtie alignment software tolerating 2
mismatches [22]. Mismatches with high base quality scores that
Pla2g12bP and Hpn Affect HDL Cholesterol Levels
PLOS ONE | www.plosone.org 2 August 2012 | Volume 7 | Issue 8 | e43139

occurred only in the unique mapping of a read to the genome were
considered potential SNP sites. SNPs were called at sites where the
percentage of reads containing the apparent SNP were at least
90% of all reads mapped to the site, and where at least 5 high
quality score reads were present. Finally, SNPs were annotated
based on known SNPs from UCSC (http://genome.ucsc.edu),
dbSNP (http://www.ncbi.nlm.nih.gov/projects/SNP/), and the
Center for Genome Dynamics SNP database (http://cgd.jax.org/
cgdsnpdb/). SNPs were further confirmed by Sanger sequencing.
Sanger SequencingThe mutation in Hlb218 identified by RNAseq was confirmed
by Sanger Sequencing. The third exon of Pla2g12b was amplified
using genomic DNA from Hlb218 and B6 mice. Conservation of
the mutated cysteine was assessed by evaluating the sequence of
exon 3 in 12 mammals (Ensembl accessed in May 2012). The
mutation in Hlb320 was identified by comparing the sequences of
all Hpn exons, including the splice sites, between Hlb320 and B6.
All PCR products were sequenced using an Applied Biosystems
3730 DNA Analyzer system (Applied Biosystems, Foster City, CA).
Hearing Evaluation by Auditory Brainstem Responses(ABRs)
Five 9-week-old B6 and Hlb320 (N3F11) males were anaesthe-
tized with intraperitoneal injections of 2% tribromoethanol and
placed on a heating pad set to 37.8uC. Platinum sub-dermal
electrodes (Astro-Med, Inc., Warwick, RI) were inserted subcuta-
neously. The negative lead was inserted under the left ear, the
positive lead was placed on the top of the head, and the ground
was set between the eyes. The Smart EP High Frequency System
(Intelligent Hearing System, Inc., Miami FL) was used to deliver
both white noise at variable frequencies and decibels and pure
tones as well as to record the electrical activity of the cells along the
auditory pathway. Filters were set to exclude signals outside the
range of 100–3000 Hz, and amplification was at 200 K with an
analysis time of 10 msec (averaged responses were digitized and
displayed on a PC screen). First stimulus presentation consisted of
a white-noise click (2–8 kHz) at 70 dB, and depending on the
response, was followed by increasing or decreasing volumes
initially in 10 dB and subsequently in 5 dB steps to determine the
auditory threshold. Mice were then subjected to pure-tone stimuli
of 8, 16 and 32 kHz (duration 3 msec, 1.5 msec rise and fall time)
and auditory brain response (ABR) was measured in dB SPL.
Northern Analysis of Hpn mRNATotal liver RNA from animals used for microarray analysis was
also utilized to confirm lower Hpn expression level and to test for
splice variants. Northern blot was performed according to the
Ambion NorthernMax Kit (Ambion, Austin, TX) manual
instructions. Briefly, the secondary structure of RNA samples
was denatured by incubating the samples with added formalde-
hyde load dye for 15 minutes at 65uC. The samples were run on
denatured agarose gel, transferred onto BrightStar-Plus positively
charged nylon membrane (Ambion, Austin, TX) by downward
transfer assembly, cross-linked using UV Stratalinker 1800
(Stratagene, La Jolla, CA), and hybridized with the BrightStar
Psoralin-Biotin labeled (Ambion, Austin, TX) mouse hepsin probe
for 12 hours at 55uC [23]. The antisense sequence of the probe is
as follows: 59-GTCCACGCAAAAGAAGCCCGATGTGCCGT-
TGGCGCCCGCAGTGCGCACAT-39. The probe was designed
to target exon 6 of Hpn-201 using the mouse genome map from
NCBI (mm9 accessed in January 2011) and was made by
Integrated DNA Technologies (IDT, Inc., Coralville, IA). The
detection was done using the BrightStar BioDetect Kit (Ambion,
Austin, TX) according to manufacturer’s instructions. To assure
equal loading and transfer of RNA, the same RNA was probed
with a b-actin Mouse DECAtemplate probe provided with the
NorthernMax Kit. b-actin is an internal control and assumed to be
expressed at a constant level between samples. The hybridization
with the b-actin Mouse DECAtemplate probe was done at 42uC.
Histological Analysis of LiverLivers from 20-week-old Hlb218 (N3F8), Hlb320 (N3F11), and
B6 females fed chow diet were collected. One liver lobe was fixed
in 10% neutral buffered formalin, embedded in paraffin, and
stained with Mayer’s hematoxylin and eosin (H&E). Another lobe
from the same female was embedded in OCT, stained with oil red
O, and counterstained with Mayer’s hematoxylin.
Histological Analysis of Susceptibility to Formation ofAtherosclerotic Lesions in Aorta
Susceptibility to atherosclerosis was assessed as previously
described [24], with some modifications. Briefly, sections from
the aortic root were compared by visual examination of
histological slides. Ten 20-week-old females from each strain
(Hlb218 (N3F8), Hlb320 (N3F11), B6 and Ldlr ENU) were
assessed: 5 females from each stain were kept on chow diet and the
other 5 females were place on atherogenic diet at 9 weeks of age
and kept on atherogenic diet for 10 weeks. Hearts from females
sacrificed by cervical dislocation were collected, placed in 0.9%
saline for at least 1 hour, trimmed from extraneous tissue (lung
and thyroid) using a dissecting scope, and cut on a plane parallel to
a plane formed by drawing a line between the tips of the atria. The
top half of the heart with the atria and ascending aorta was fixed in
4% PFA (16% PFA diluted in PBS to 4% PFA) overnight,
embedded in OCT, and sectioned using a cryostat at 220uC; 10-
mm sections were stained with oil red O and counterstained with
Mayer’s hematoxilin. The cross section containing the area where
the coronary artery and ascending aorta join was used as a
landmark to identify the identical physiological region in each
animal. All cross sections of the 300-mm area above the landmark
in the aortic root were compared by visual examination.
Western Blot for APOA1Serum (4 males per strain; Hlb320 (N3F14)) was diluted in
protein lysis buffer (1:50 T-PER [Pierce, part of Thermo Fisher
Scientific, Rockford, IL], 0.2% sodium dodecyl sulfate, and mini
protease inhibitors cocktail tablet [Roche, Indianapolis, IN]).
Serum protein concentration (mg/ml) was quantified using
Bradford reagent (Sigma Life Sciences, St. Louis, MO) according
to the manufacturer’s instructions. Equal volumes of diluted serum
were mixed with 46 XT-sample buffer (4:1, Bio-Rad Laborato-
ries, Hercules, CA) containing XT Reducing Agent (Bio-Rad
Laboratories, Hercules, CA), incubated for 15 minutes at 65uC,
separated on SDS polyacrylamide gel (Bio-Rad Laboratories,
Hercules, CA), and electro-transferred to 0.45 mm nitrocellulose
membrane (Bio-Rad Laboratories, Hercules, CA). The membrane
was blocked overnight at 4uC, probed with primary rabbit anti-
APOA1 antibody (ab40453, 1:1,000, Abcam, Cambridge, MA),
incubated with HRP-conjugated anti-rabbit secondary antibody
(cat#7074S, 1:5,000, Cell Signaling Technology, Inc., Danvers,
MA), detected with Amersham ECLplus western blotting detec-
tion system (GE Healthcare Bio-Sciences, Piscataway, NJ), and
visualized on Kodak scientific imaging film. The quantity of
APOA1 protein level was calculated by dividing the intensity of
the APOA1 protein band, measured using the ImageJ 1.44o
Pla2g12bP and Hpn Affect HDL Cholesterol Levels
PLOS ONE | www.plosone.org 3 August 2012 | Volume 7 | Issue 8 | e43139
program (National Institutes of Health, Bethesda, WD), by total
serum protein concentration (mg/ml). Comparison of normalized
serum APOA1 level between 2 groups was done with Student’s 2-
sample t-test using JMP9 (SAS Institute, Inc., Cary, NC).
Results
Generating the ENU Mutant LinesThe Jackson Laboratory’s Heart, Lung, Blood, and Sleep
Disorder Mutagenesis program generated ENU mutant mice (G0)
by treating B6 males with ENU, an alkylating agent that induces
random point mutations in the DNA of spermatogonial stem cells
by virtue of single-base mismatching to the unrepaired alkylated
base. We estimated that G1 mice carry 150 mutations on average,
and subsequent backcrossing and inbreeding would further reduce
the number of non-causal mutations. We expect each additional
backcross to reduce the number of mutation by 50% [12].
Phenotyping of G3 progeny identified two unique G3 animals with
low HDL cholesterol levels that were then backcrossed to B6 [12].
The progeny of B66G3 was estimated to carry on average
approximately 38 mutations, which subsequently was used to
establish the lines (Hlb218 and Hlb320) by further intercrossing
animals with low HDL cholesterol. HDL cholesterol levels in these
two newly established lines were significantly lower compared to
HDL cholesterol levels in B6 mice (Table 1).
Low HDL Cholesterol Levels in Hlb218 Is Caused by aMutation in Pla2g12b
The analysis of the F2 progeny from a cross between Hlb218 and
C57L localized the mutation on Chr 10, with a peak near single-
nucleotide polymorphism (SNP) marker rs13480619 and a signifi-
cant LOD score of 11.8 (Figure 1A). Comparison of plasma HDL
cholesterol levels by genotype (one-way ANOVA) in F2 mice at the
peak marker suggested that the mode of inheritance of low HDL
cholesterol levels in Hlb218 is recessive: F2 mice that were
homozygous for the B6 (BB) allele had significantly lower HDL
cholesterol levels compared to F2 mice that were heterozygous (LB)
or homozygous for the C57L (LL) allele (Figure 1B). The interval
containing the mutation was further narrowed to 11.73 Mbp
(Figure 1C) by genotyping the affected animals with a crossover
within the interval using additional SNP markers. The analysis of
high-throughput sequence data of liver RNA transcripts in the
11.73 Mbp interval revealed only one single point mutation in the
region, while liver expression analysis (both microarray and
RNAseq) did not show any significantly differentially expressed
genes within the interval. The mutation, in the third exon of
Pla2g12b, causes a transition of G to A that transforms the TGT
(cysteine) codon into TAT (tyrosine) at amino acid position 129.
Sanger sequencing of the exon confirmed the mutation (Figure 1D).
The mutated cysteine in Pla2g12b is conserved among 12 eutherian
mammals. In accordance with the guidelines for mouse strain and
genetic nomenclature, the Mouse Genomic Nomenclature Com-
mittee named the allele Pla2g12bHlb218 and the strain C57BL/6J-
Pla2g12bHlb218/J.
Pla2g12bHlb218 Alters Serum Lipid Levels and IncreasesHepatic Triglycerides
In addition to a 92% decrease in HDL cholesterol, the mutation
also led to a 58% reduction in triglyceride levels (Table 1). Despite
the abnormal lipid profile, the size of atherosclerotic lesions in
Hlb218 mice remained similar to B6 (Figure 2 C–D vs. A–B).
Histological analysis of livers from Hlb218 females showed an
increase in accumulation of fat droplets (Figure 3 C–D vs. A–B).
Low HDL Cholesterol Levels in Hlb320 Is Caused by aMutation in Hpn
The chromosomal position of the mutation in Hlb320 was
identified using the same strategy as used for Hlb218. The analysis
of the F2 progeny from a cross between Hlb320 and C57L
mapped the mutation to Chr 7, with a peak near SNP rs4226386
and a significant LOD score of 12.4 (Figure 4A). One-way
ANOVA of plasma HDL cholesterol by genotype in F2 mice at
the peak marker suggested that the mode of inheritance of low
HDL cholesterol levels in Hlb320 was additive: F2 mice
homozygous for the B6 allele (BB) had significantly lower HDL
cholesterol levels compared to F2 mice homozygous for the C57L
(LL) allele, while F2 mice that were heterozygous (LB) had an
intermediate HDL cholesterol level (Figure 4B). The interval
containing the mutation was further narrowed to 21.2 Mbp
(Figure 4C) by genotyping the affected animals with a crossover
within the interval using additional SNP markers. Comparison of
gene expression in the recombinant interval identified 3 differen-
tially expressed genes in the region: Hamp (approximately 2.65-fold
downregulated), Hamp2 (approximately 4-fold downregulated),
and Hpn (approximately 7-fold downregulated). Sequencing of the
promoter region, the coding region, and splice sites of Hamp and
Hamp2 did not reveal any mutations (data not shown), suggesting
that trans-regulation is the cause of the expression difference.
Sequencing of Hpn identified a single nucleotide mutation of T to
C in the second base pair in the 39 splice site of exon 8 (Figure 4D).
Northern blot analysis confirmed lower liver Hpn expression in
Hlb320 in comparison to B6 and did not detect any alternative
splice variants (Figure 5). Also, comparison of liver gene expression
between Hlb320 and B6 revealed 106 significantly differentially
expressed genes (q,0.05) located on other chromosomes (Table 2).
In accordance with the guidelines for mouse strain and genetic
nomenclature, the Mouse Genomic Nomenclature Committee
named the allele HpnHlb320 and the strain C57BL/6J-HpnHlb320/J.
HpnHlb320 Alters Serum Lipid Levels without Affecting theAPOA1 Levels, the Size of Atherosclerotic Lesions inAorta, and Hepatic Triglyceride Levels
The mutation led to a 24% reduction in HDL cholesterol level
and a 21% reduction in triglyceride level (Table 1). Decreased
cholesterol levels in lipoprotein particles could be caused by either
decreased loading of cholesterol into the particle or by lower levels
of the particles themselves. Because APOA1 is the most abundant
Table 1. Serum total cholesterol, HDL-cholesterol, andtriglyceride levels for B6, Hlb218, and Hlb320. Each value isexpressed as mean (mg/dL) 6 SD measured in serum (n = 5per strain).
StrainTotalcholesterol
HDL-cholesterol Triglycerides
Females B6 74.265.5 60.963.7 112.0613.9
Hlb218 5.063.4** 5.163.4** 47.0618.5**
Hlb320 46.263.0** 39.162.2** 79.0613.5*
Males B6 90.064.7 79.663.6 106.466.3
Hlb218 5.861.7** 6.263.0** 43.3612.5**
Hlb320 67.066.6** 60.664.9** 84.066.3*
**P,0.0001.*P,0.01.doi:10.1371/journal.pone.0043139.t001
Pla2g12bP and Hpn Affect HDL Cholesterol Levels
PLOS ONE | www.plosone.org 4 August 2012 | Volume 7 | Issue 8 | e43139

apolipoprotein in an HDL particle, the APOA1 level could be
used to estimate the level of HDL particle. Despite the reduction in
HDL cholesterol levels in Hlb320 mice, APOA1 levels, measured
by western blot, remained similar between Hlb320 and B6
(Figure 6). Although Hlb320 mice have an abnormal serum lipid
profile, the size of their atherosclerotic lesions, as well as liver lipid
accumulation, remained similar to B6 (Figure 2 E–F vs. A–B and
Figure 3 E–F vs. A–B).
Hlb320 Mice Show Similar Phenotypes as Hpn KnockoutMice
An Hpn knockout mouse on a mixed B6/129 genetic
background was previously generated by Wu et al [25]. These
mice had higher serum alkaline phosphatase (ALP) level, loss of
hearing, and lower thyroxine level compared to their control
littermates [26]. Evaluation of these traits in Hlb320 males showed
that, compared to age-matched B6 male controls, homozygous
Figure 1. Identification of the mutation in C57BL/6J-Pla2g12bHlb218/J on Chr 10. [A] Linkage analysis of (Hlb2186C57L) F2 animals forplasma HDL cholesterol levels showed a significant linkage on Chr 10; LOD score of 11.8 at a= 0.05. [B] Mean plasma HDL cholesterol values (HDL-C6SEM) by genotype and sex in the F2 population at peak marker rs13480619 (*significant difference compared to LL (P,0.001); **significantdifference compared to LB (P,0.001)). [C] Genotyping for additional SNP markers in F2 animals with low HDL cholesterol level and recombination inthe mapped region narrowed the region with the mutation to 11.73 Mbp (between dashed vertical lines). Triangles above the upper black line aremarkers; numbers below the line represent the physical Mb location on Chr 10 (NCBI, mm9). [D] Chromatographs of genomic DNA sequence of theHlb218 mouse versus the B6 control. The open rectangle highlights the transition of G to A in exon 3 of Pla2g12b. Corresponding amino acids areshown by the appropriate single letter code above the chromatographs.doi:10.1371/journal.pone.0043139.g001
Pla2g12bP and Hpn Affect HDL Cholesterol Levels
PLOS ONE | www.plosone.org 5 August 2012 | Volume 7 | Issue 8 | e43139

Hlb320 males also had significantly elevated serum ALP levels
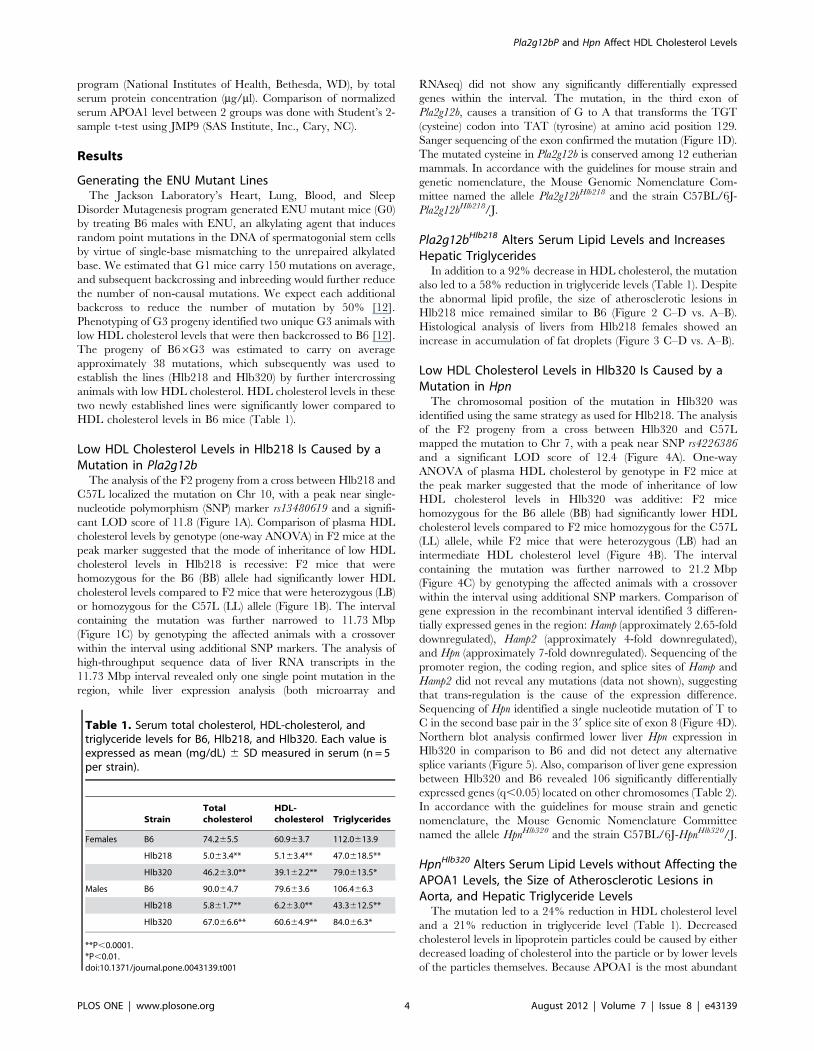
(Figure 7) and exhibited hearing loss (Figure 8), but did not show
reduced thyroxine levels (data not shown).
Discussion
The regulation of HDL cholesterol is strongly influenced by
genetic factors, yet genes identified so far explain only a small
portion of the heritability. To find novel genes that influence
serum HDL cholesterol levels, we used ENU mutagenesis and
identified causal mutations in 2 newly established ENU mouse
lines with low HDL cholesterol levels.
The mutation in Hlb218 leads to a 92% decrease in HDL
cholesterol and is a transition from G to A in the third exon of
Pla2g12b, which leads to an amino acid change in the protein
(C129Y). Analysis of the amino acid sequence using DiANNA, a
software tool for cysteine state and disulfide bond partner
prediction (http://clavius.bc.edu/,clotelab/DiANNA/), predict-
ed the cysteine to be involved in formation of a disulfide bond
[27]. The change of the amino acid would cause a loss of the
disulfide bond and influence protein structure and binding
capability. Pla2g12b encodes the group XIIB secreted phospholi-
pase A2 (sPLA2GXIIB) and belongs to a family of structurally
related enzymes (sPLA2). Unlike other sPLA2 enzymes, sPLA2G-
XIIB is catalytically inactive and was hypothesized to act as a
Figure 2. Comparison of atherosclerotic lesion size betweenmutant lines and B6. Hypolipidemic 20-week-old ENU females(Hlb218 and Hlb320) showed similar susceptibility to atherosclerosis(lesion formation) as age-matched B6 females on chow (panels C and Evs. A) and atherogenic diet (panels D and F vs. B). All cross sections ofthe 300-mm area above the aortic root, where coronary arteries (CA) andascending aorta (AO) join, were compared (n = 5 females per strain foreach diet; 2.56magnification). Cross sections were stained with oil redO and counterstained with Mayer’s hematoxilin. The figure showsrepresentative cross sections from selected females. The black arrowpoints to areas with lesion formation. Cross sections from Ldlr ENU(panels G and H) were included as a positive control.doi:10.1371/journal.pone.0043139.g002
Figure 3. Histological comparison of liver from mutant linesand B6. Livers from 20-week-old Hlb218, Hlb320, and B6 females fedchow diet were collected. Liver cross sections from 5 females of eachstrain were stained with H&E and oil red O and compared. The figureshows representative liver sections from selected females. A, C, E —H&E stain; B, D, F — oil red O stain with Mayer’s hematoxylincounterstain. Hlb218 mice showed increased liver lipid level. CV –central vein.doi:10.1371/journal.pone.0043139.g003
Pla2g12bP and Hpn Affect HDL Cholesterol Levels
PLOS ONE | www.plosone.org 6 August 2012 | Volume 7 | Issue 8 | e43139

ligand [28]. Lack of Pla2g12b has recently been shown to cause
decreased serum lipids (total cholesterol, HDL cholesterol,
triglycerides, and free fatty acids) and increased liver fatty droplets
[29].
The mutation in Pla2g12b causes homozygous Hlb218 mice to
have low serum total cholesterol, HDL cholesterol, and triglycer-
ide levels as well as to accumulate lipid droplets in liver. In
addition, their litter size is smaller (2–3 pups per litter), suggesting
that this gene may play a role in fertility or gestation. Hlb218 mice
appear to be smaller at birth and tend to develop more slowly in
comparison to B6 mice, but catch up to B6 in size as they age.
Despite low cholesterol levels and fatty liver, after 10 weeks on an
atherogenic diet, atherosclerotic lesions in Hlb218 mice were
similar in size to those in B6. The Pla2g12b knockout mice,
recently described by Guan et al, and Hlb218 mutant mice have
both shared and unique phenotypes [29]. Both mouse models have
very low serum lipid levels and accumulate fatty droplets in the
liver. While the decrease in cholesterol level is similar in both
mouse models (approximately 92% reduction), the effect on
triglyceride level is lower in Hlb218 mutants compared to Pla2g12b
knockouts (58% vs. 78% reduction). Unlike Pla2g12b knockout
mice, Hlb218 mice showed no differentially expressed genes in the
Figure 4. Identification of the mutation in C57BL/6J-HpnHlb320/J on Chr 7. [A] Linkage analysis of (Hlb3206C57L) F2 animals for plasma HDLcholesterol levels showed a significant linkage on Chr 7; LOD score of 12.4 at a= 0.05. [B] Mean plasma HDL cholesterol values (HDL-C6SEM) bygenotype and sex in the F2 population at peak marker rs4226386 (*significant difference compared to LL (P,0.0001); **significant differencecompared to LB (P,0.01)). [C] Genotyping for additional SNP markers in F2 animals with low HDL cholesterol level and recombination in the mappedregion narrowed the region with the mutation to 21.2 Mbp (between dashed vertical lines). Triangles above the upper black line are markers;numbers below the line represent the physical Mb location on Chr 7 (NCBI, mm9). [D] Chromatographs of genomic DNA sequence of the Hlb320mouse versus the B6 control. The open rectangle highlights the transition of T to C in the second base pair in the 39 splice site of exon 8 of Hpn.doi:10.1371/journal.pone.0043139.g004
Pla2g12bP and Hpn Affect HDL Cholesterol Levels
PLOS ONE | www.plosone.org 7 August 2012 | Volume 7 | Issue 8 | e43139

liver. While Guan et al identified several downregulated genes by
qPCR (Hmgcs1, Hmgcr, Fasn, Scd1, Slc27a3, Slc27a4, Slc27a5, and
Slc27a6), our microarray data showed no differentially expressed
genes between livers from Hlb218 and B6 mice. One explanation
for differences in the phenotype is the difference in genetic
background: Pla2g12b knockout mice are on a mixed B6/129/
FVB genetic background, while Hlb218 mice are on a uniform B6
background. Another explanation is the difference in genetic
alternation of Pla2g12b: the knockout completely lacks expression
of the functional gene, while our mutant has normal gene
expression with an amino acid change in the protein.
The precise mechanism and the mode of the effect (direct or
indirect) by which Pla2g12b dysfunction affects serum lipid levels
and leads to hepatic steatosis must still be elucidated. Hypolipid-
emia and hepatic steatosis are maladaptive and can result from the
following: 1) an increased lipid supply inside the liver (increased
endogenous synthesis of cholesterol and fatty acid accompanied by
an inability to efflux synthesized lipid out of the liver); 2) reduced
utilization by the liver (b-oxidation mitochondria); 3) reduced
clearance of lipids from the liver (apoliporotein B packaging/
secretion or the hepatobilliary pathway); 4) an increased lipid
supply to the liver (influx of lipids from peripheral tissues/
increased catabolism of lipids by the liver); or 5) changes in several
other pathways (modification of lipoprotein particles in serum,
uptake of lipoprotein particles by the liver, phosphatidylcholine
biosynthesis or secretion, acceptance/storage of lipids in adipose
tissue, discharge of bile into intestine, targeting of chylomicrons or
functionality of chylomicrons released by the intestine, absorbance
of lipids in the intestine, or insulin resistance) [30,31,32,33,34].
Liver gene expression data in Pla2g12b knockout mice and our
Hlb218 mutant mice suggest that the first two possibilities
(increased endogenous synthesis of cholesterol and fatty acid and
changes in b-oxidation in mitochondria) are unlikely causes of
abnormal lipid metabolism. The remaining above-mentioned
pathways are still plausible explanations for hypolipidemia and
hepatic steatosis, but considering the data by Guan et al, abnormal
VLDL secretion seems to be a likely mechanism. To further prove
that, in the absence of a functional sPLA2GXIIB, VLDL secretion
from liver is dysfunctional, experimental results must show that 1)
lower serum APOB100 and increased liver APOB levels are not
caused by increased clearance of VLDL and LDL particles from
serum by the liver; 2) lipid content of APOB48 containing
lipoprotein particles remains unchanged; and 3) the lipid loading
capacity of chylomicrons in the intestine is not affected by
feedback from excess lipid in the liver. Further studies are needed
to properly describe the role of Pla2g12b in lipid and lipoprotein
particle metabolism and to dissect the responsible mechanism.
Several other members of secreted PLA2 have already been found
to play a role in cholesterol metabolism and atherosclerosis, and
sPLA2GXIIB may be one of the missing links [35]. Both Pla2g12b
knockout and the Hlb218 mutant are valuable tools in the further
study of this gene and will be useful in dissecting how protein
regulates lipids and lipoproteins in serum and liver.
The causal mutation in Hlb320 leads to a 24% decrease in
HDL cholesterol and was identified as a change from a T into C in
the second base pair in the 39 splice site of exon 8 of Hpn. Hlb320
mice have a 7-fold lower Hpn mRNA expression. Lack of obvious
alternative splice variant in the northern blot analysis and presence
of a band of similar size but lower intensity in Hlb320 suggest that
the mutation leads to either 1) an alternative splice variant of a size
similar to the size of the B6 splice variant that is degraded either
through a nonsense-mediated decay or no-go decay but cannot be
easily identified as an alternative splice variant due to resolution of
the northern blot; or 2) a reduced splicing rate. Although
nonsense-mediated decay or no-go decay remain possible expla-
nations for lower mRNA level, Aebi, et al showed that the T-C
mutation at intron position +2 results in a correctly spliced product
but at a reduced rate, which suggests that a reduced splicing rate is
the likely mechanism to explain lower Hpn mRNA in Hlb320 [36].
Hpn encodes hepsin — a type II transmembrane serine protease
expressed mainly on the surface of hepatocytes whose extracellular
part has serine protease domain and a poorly conserved scavenger
receptor cysteine-rich domain [37,38,39,40]. Biochemical and in
vitro studies have shown that hepsin participates in proteolytic
digestion, initiation of blood coagulation, cell growth, and tissue
remodeling. Its inhibition leads to growth arrest and changes in
morphology, and its overexpression is associated with cancer
[25,41]. Previously published work did not test whether Hpn affects
the serum lipid profile, and in the current study we show that a
mutation in Hpn leads to low total cholesterol, HDL cholesterol,
and triglyceride levels, suggesting a novel function of this gene in
lipid metabolism.
Low lipid levels in Hlb320 mice did not lead to accumulation of
fat in the liver and did not change the size of atherosclerotic lesions
but did significantly affect liver metabolism as shown by
differentially expressed genes. While genes coding for enzymes
participating in glycolysis, glucose transport, lipogenesis, and
formation of ketone bodies (Gck, Foxa3, Acaca, and Bdh2) were
downregulated, genes coding for enzymes participating in b–
oxidation, breakdown of triglycerides, urea cycle, synthesis of
vitamin C, and reactive oxygen species elimination (Acot8, Lpl,
Rhbg, Asns, Gstm, Gulo, Gale, Cyp1a2, and Ucp2) were upregulated
[42,43,44,45,46,47,48,49,50,51,52]. Interestingly, Elovl3, Insig2,
Mvk, Fitm1, Rdh9, and Saa1 were also upregulated, suggesting
increased cholesterol synthesis and cytosolic lipid droplet forma-
tion [53,54,55,56,57,58]. Notably, genes involved in lipoprotein
particle metabolism (other than Saa1) were not differentially
expressed and serum APOA1 protein levels were not significantly
different, suggesting that lipoprotein particles are not the cause of
the abnormal lipid level phenotype (Table 2).
Hpn knockout mice, created by Wu et al, and Hlb320 mice
showed similar phenotypes. Both Hpn knockout and Hlb320 mice
are viable and fertile, have increased concentration of serum total
nonspecific alkaline phosphatase, and decreased hearing ability
[25,26]. Unlike Hpn knockout mice, however, Hlb320 mice
showed no difference in thyroxine levels (data not shown). While
Wu et al reported no differences in growth and size, we observed
Hlb320 pups to be smaller than B6 control mice. Some of the
differences between the knockout and our mutant might be due to
the difference in genetic background (Hpn knockout mice are on a
Figure 5. Northern blot analysis of Hpn mRNA expression. Totalliver RNA from B6 and Hlb320 mice was hybridized with a mouse Hpnoligo probe and b-actin probe (loading control). The mRNA length ofHpn in B6 and Hlb320 was the same, while liver expression wasrelatively lower in Hlb320 compared to B6.doi:10.1371/journal.pone.0043139.g005
Pla2g12bP and Hpn Affect HDL Cholesterol Levels
PLOS ONE | www.plosone.org 8 August 2012 | Volume 7 | Issue 8 | e43139

Table 2. List of significantly (q,0.05) differentially expressed genes in Hlb320 livers compared to B6. Column 1 lists down-regulated genes; column 2 lists up-regulated genes.
Current gene name Chr Fold change Current gene name Chr Fold change
Hpn 7 27.02 LOC194586 UN 5.67
H2-Q8 UN 24.00 Hbb-b1 7 3.99
Hamp2 7 23.95 Hba-a1 11 3.63
Foxq1 13 23.38 Dct 14 3.62
Cib3 8 23.28 Mfsd2a 4 2.97
H2-Q6 17 23.01 Gstm2 3 2.87
Serpina12 12 22.94 Lhpp 7 2.71
Hamp 7 22.65 Ly6d 15 2.61
Slc3a1 17 22.50 LOC384677 UN 2.50
LOC232400 UN 22.48 Saa1 7 2.47
LOC241041 UN 22.40 Slc1a2 2 2.44
Egr1 18 22.36 Insig2 1 2.34
CRAD-L UN 22.29 Orm2 4 2.17
Rbp1 9 22.06 Cyp2a5 7 2.10
Bdh2 3 22.03 Zap70 1 2.09
Mug2 6 22.03 Fitm1 14 1.87
LOC226654 UN 22.00 Crygn 5 1.86
Foxa3 7 21.97 Snhg11 2 1.86
H2-Q6 17 21.94 Gstm3 3 1.85
Serpina1e 12 21.92 St3gal6 16 1.85
Slc13a2 11 21.92 Gal3st1 11 1.84
Gck 11 21.91 Tox 4 1.84
Dclk3 9 21.86 Ucp2 7 1.79
H2-Q7 17 21.82 Lgals1 15 1.77
H2-D1 17 21.69 Cyp4a12a 4 1.75
H2-Q5 17 21.68 Rhbg 3 1.74
Sfxn1 13 21.67 Elovl3 19 1.73
Acaca 11 21.66 Lpl 8 1.69
Hgfac 5 21.65 Cyp2a4 7 1.67
Irf5 6 21.64 Rdh9 10 1.67
Hsd11b1 1 21.60 Acnat2 4 1.65
Rps27 3 21.58 Snhg11 2 1.65
Smyd1 6 21.58 Gale 4 1.64
St6gal1 16 21.57 Tlr5 1 1.58
Raet1b UN 21.57 Cib2 9 1.57
Amdhd1 10 21.55 Fam25c 14 1.56
Cyp2f2 7 21.55 Mvk 5 1.55
Gm2a 11 21.51 Asns 6 1.53
Sox9 11 21.51 Cdca3 6 1.52
Tmc7 7 21.45 Gulo 14 1.47
Nme7 1 21.44 Pltp 2 1.46
Got2 8 21.44 Clstn3 6 1.45
Hrsp12 15 21.41 Pafah2 4 1.44
Tsc22d4 5 21.40 Ccl21a 4 1.43
Tpst1 5 21.39 6430573F11Rik 8 1.42
Cpsf1 15 21.37 Acot8 2 1.41
Gss 2 21.36 Cyp1a2 9 1.39
Gas2 7 21.34 Ccbp2 9 1.38
Pla2g12bP and Hpn Affect HDL Cholesterol Levels
PLOS ONE | www.plosone.org 9 August 2012 | Volume 7 | Issue 8 | e43139

mixed B6/129 genetic background, while Hlb320 mice are on a
uniform B6 background) or due to a difference in the level of
expression (the knockout completely lacks expression of the
functional gene while our mutant has reduced expression).
The mechanism by which hepsin affects serum lipid levels
remains to be studied. Since serum analysis showed low lipid levels
with no increase in lipid accumulation in liver or aorta, we
speculate that lipids from serum and synthesized in the liver must
be utilized by hepatocytes for energy and necessary metabolites
(bile acids, hormones, etc). Increased b-oxidation, detoxification
through the glutathione-ascorbate cycle, and urine formation and
decreased glycolysis and lipogenesis, as shown in our microarray
analysis, supports the hypothesis that lipolysis and higher energy
expenditure through b-oxidation of triglycerides are taking place
in hepatocytes. Such changes in metabolism of the liver can be
triggered by excessive exercise, lack of food intake (starvation), or
abnormal hormonal signaling (epinephrine, norepinephrine, glu-
cagon, growth hormone, testosterone). One possibility is that the
cleavage target of hepsin affects one of the above processes. Hepsin
has been shown to cleave pro-hepatocyte growth factor (pro-
HGF), coagulation factor VII, laminin 332 pro-urokinase
plasminogen (pro-UPA), pro-macrophage-stimulating protein
(pro-MSP), the extracellular domain of the epidermal growth
factor receptor, and prostasin [59,60,61]. Hepsin is one of the 3
most efficient proteases known to cleave pro-HGF [62]. Hepato-
cyte growth factor (HGF, mature form of pro-HGF) is a molecule
that not only has been shown to play a role in embryonic
development, migration, morphogenesis, regeneration, cell surviv-
al in various tissues, and diseases including cancer, but has also
been recently shown to govern hepatic glucose metabolism
through an HGF-cMet-Insulin receptor hybrid [62,63]. This
latest finding makes HGF a good candidate for explaining a
potential mechanism that leads to abnormal lipid levels in our
Hlb320 mutant. If hepsin cleaves pro-HGF into mature HGF,
then lack of or lower expression of hepsin would lead to lower
circulation of mature HGF and less glucose absorbance by
hepatocytes. Shortage of glucose in the liver would lead to
Table 2. Cont.
Current gene name Chr Fold change Current gene name Chr Fold change
Tgfbr1 4 21.31 Adhfe1 1 1.37
Il1rap 16 21.29 Slc22a1 17 1.36
Rab14 2 21.21 Cenpm 15 1.35
Sepw1 7 1.33
Mcm6 1 1.29
Copz2 11 1.27
Srxn1 2 1.23
doi:10.1371/journal.pone.0043139.t002
Figure 6. Serum APOA1 level in Hlb320 and B6. Western blotanalysis showed similar serum APOA1 levels in Hlb320 (n = 4) and B6(n = 4) male mice (P = 0.15). [A] Serum APOA1; bands from the westernblot from representative animals. [B] Statistical comparison ofquantified serum APOA1 level. The intensity of the APOA1 proteinband for each animal was quantified and then normalized by the totalserum protein concentration (mg/ml) in the sample from that animal.Normalized serum APOA1 level is expressed as mean6SEM.doi:10.1371/journal.pone.0043139.g006
Figure 7. Serum alkaline phosphatase level in Hlb320 and B6.Serum total alkaline phosphatase (ALP) level in Hlb320 males (n = 5) wassignificantly higher than in B6 males (n = 5; P,0.0001). Total ALP activityis expressed as mean6SEM.doi:10.1371/journal.pone.0043139.g007
Pla2g12bP and Hpn Affect HDL Cholesterol Levels
PLOS ONE | www.plosone.org 10 August 2012 | Volume 7 | Issue 8 | e43139
utilization of lipids and proteins as an energy source, which would
dramatically change metabolism. Interestingly, HGF has also been
shown to stimulate receptor kinase activity in both osteoclasts and
osteoblasts, which could be a potential explanation for elevated
bone ALP, and mutations in HGF have been shown to lead to
hearing loss [64,65]. The HGF-cMet system is already a target for
the development of clinical therapeutics for many diseases,
including cancer [66]. Mouse models like our Hlb320 mutant
and the Hpn knockout will be useful in dissecting the mechanism of
HGF regulation and its effect on lipid metabolism and in better
understanding potential side effects of current drugs targeting
HGF.
To summarize, we demonstrated that genetic mapping of an
ENU mutant with a closely related inbred strain is an efficient
method to identify genes involved in the phenotype under
investigation when combined with identification of expression
and coding differences in the mapped interval using microarray
and high-throughput RNA sequencing. We identified novel
mutations in Pla2g12b and Hpn that affect serum HDL cholesterol
levels as well as other lipid levels. These new mouse models will be
useful in the further dissection of the pathways leading to
differences in cholesterol levels and metabolic disease.
Acknowledgments
We thank Harry Whitmore, Fred Rumill, and Beverly Macy for their help
in mouse husbandry and sample collection; The Jackson Laboratory
Scientific Services department for assistance with genotyping, microarray
expression, RNAseq, sequencing, histology; Jennifer Ryan for hearing
evaluation; Mark Lessard for imaging of histological slides; Jesse Hammer
for figure preparation; Cynthia McFarland for quantitative analysis of the
samples; and Joanne Currer for editorial assistance.
Author Contributions
Conceived and designed the experiments: RK. Performed the experiments:
AA HS SC. Analyzed the data: AA TG RK GC MH RHB. Contributed
reagents/materials/analysis tools: KS. Wrote the paper: AA RK.
References
1. Lopez AD, Mathers CD, Ezzati M, Jamison DT, Murray CJ (2006) Global and
regional burden of disease and risk factors, 2001: systematic analysis of
population health data. Lancet 367: 1747–1757.
2. Mathers CD, Loncar D (2006) Projections of global mortality and burden of
disease from 2002 to 2030. PLoS Med 3: e442.
3. Ward JR, Wilson HL, Francis SE, Crossman DC, Sabroe I (2009) Translational
mini-review series on immunology of vascular disease: inflammation, infections
and Toll-like receptors in cardiovascular disease. Clin Exp Immunol 156: 386–
394.
4. Lloyd-Jones D, Adams RJ, Brown TM, Carnethon M, Dai S, et al. (2010)
Executive summary: heart disease and stroke statistics–2010 update: a report
from the American Heart Association. Circulation 121: 948–954.
5. Toth PP (2007) Reducing cardiovascular risk by targeting high-density
lipoprotein cholesterol. Curr Atheroscler Rep 9: 81–88.
6. Farmer JA, Liao J (2011) Evolving concepts of the role of high-density
lipoprotein in protection from atherosclerosis. Curr Atheroscler Rep 13: 107–
114.
7. Movva R, Rader DJ (2008) Laboratory assessment of HDL heterogeneity and
function. Clin Chem 54: 788–800.
8. Strong A, Rader DJ (2010) Clinical Implications of Lipid Genetics for
Cardiovascular Disease. Curr Cardiovasc Risk Rep 4: 461–468.
9. Teslovich TM, Musunuru K, Smith AV, Edmondson AC, Stylianou IM, et al.
(2010) Biological, clinical and population relevance of 95 loci for blood lipids.
Nature 466: 707–713.
10. Ragbir S, Farmer JA (2010) Dysfunctional high-density lipoprotein and
atherosclerosis. Curr Atheroscler Rep 12: 343–348.
11. Nadeau JH, Frankel WN (2000) The roads from phenotypic variation to gene
discovery: mutagenesis versus QTLs. Nat Genet 25: 381–384.
12. Svenson KL, Bogue MA, Peters LL (2003) Invited review: Identifying new
mouse models of cardiovascular disease: a review of high-throughput screens of
mutagenized and inbred strains. J Appl Physiol 94: 1650–1659; discussion 1673.
13. Nishina PM, Verstuyft J, Paigen B (1990) Synthetic low and high fat diets for the
study of atherosclerosis in the mouse. J Lipid Res 31: 859–869.
14. Broman KW, Sen S (2009) A guide to QTL mapping with R/qtl. New York:
Springer.
15. Broman KW, Wu H, Sen S, Churchill GA (2003) R/qtl: QTL mapping in
experimental crosses. Bioinformatics 19: 889–890.
16. Gentleman RC, Carey VJ, Bates DM, Bolstad B, Dettling M, et al. (2004)
Bioconductor: open software development for computational biology and
bioinformatics. Genome Biol 5: R80.
17. Dunning MJ, Smith ML, Ritchie ME, Tavare S (2007) beadarray: R classes and
methods for Illumina bead-based data. Bioinformatics 23: 2183–2184.
18. Bolstad BM, Irizarry RA, Astrand M, Speed TP (2003) A comparison of
normalization methods for high density oligonucleotide array data based on
variance and bias. Bioinformatics 19: 185–193.
19. Kerr MK, Martin M, Churchill GA (2000) Analysis of variance for gene
expression microarray data. J Comput Biol 7: 819–837.
20. Cui X, Hwang JT, Qiu J, Blades NJ, Churchill GA (2005) Improved statistical
tests for differential gene expression by shrinking variance components estimates.
Biostatistics 6: 59–75.
21. Wu H, Kerr K, Cui X, Churchill GA (2003) MAANOVA:A Software Package
for the Analysis of Spotted cDNA Microarray Experiments. In: Parmigiani G,
Garrett ES, Irizarry RA, Zeger S, editors. The Analyis of Gene Expression Data:
Methods and Software. New York: Springer. pp. 313–339.
22. Langmead B, Trapnell C, Pop M, Salzberg SL (2009) Ultrafast and memory-
efficient alignment of short DNA sequences to the human genome. Genome Biol
10: R25.
23. Chomczynski P (1992) One-hour downward alkaline capillary transfer for
blotting of DNA and RNA. Anal Biochem 201: 134–139.
24. Paigen B, Morrow A, Holmes PA, Mitchell D, Williams RA (1987) Quantitative
assessment of atherosclerotic lesions in mice. Atherosclerosis 68: 231–240.
25. Wu Q, Yu D, Post J, Halks-Miller M, Sadler JE, et al. (1998) Generation and
characterization of mice deficient in hepsin, a hepatic transmembrane serine
protease. J Clin Invest 101: 321–326.
26. Guipponi M, Tan J, Cannon PZ, Donley L, Crewther P, et al. (2007) Mice
deficient for the type II transmembrane serine protease, TMPRSS1/hepsin,
exhibit profound hearing loss. Am J Pathol 171: 608–616.
27. Ferre F, Clote P (2005) Disulfide connectivity prediction using secondary
structure information and diresidue frequencies. Bioinformatics 21: 2336–2346.
28. Rouault M, Bollinger JG, Lazdunski M, Gelb MH, Lambeau G (2003) Novel
mammalian group XII secreted phospholipase A2 lacking enzymatic activity.
Biochemistry 42: 11494–11503.
29. Guan M, Qu L, Tan W, Chen L, Wong CW (2011) Hepatocyte nuclear factor-4
alpha regulates liver triglyceride metabolism in part through secreted
phospholipase A GXIIB. Hepatology 53: 458–466.
Figure 8. Comparison of hearing ability in Hlb320 and B6.Homozygous Hlb320 (n = 5) males had significantly lower hearing abilitythan age-matched B6 control males (n = 5) at 8 kHz, 16 kHz, and 32 kHz.Auditory brainstem response (ABR) threshold values (in dB SPL) areshown as mean6SEM for each auditory stimulus frequency (kHz).doi:10.1371/journal.pone.0043139.g008
Pla2g12bP and Hpn Affect HDL Cholesterol Levels
PLOS ONE | www.plosone.org 11 August 2012 | Volume 7 | Issue 8 | e43139

30. Hooper AJ, Adams LA, Burnett JR (2011) Genetic determinants of hepatic
steatosis in man. J Lipid Res 52: 593–617.31. Hebbard L, George J (2011) Animal models of nonalcoholic fatty liver disease.
Nat Rev Gastroenterol Hepatol 8: 35–44.
32. Anderson N, Borlak J (2008) Molecular mechanisms and therapeutic targets insteatosis and steatohepatitis. Pharmacol Rev 60: 311–357.
33. Sundaram M, Yao Z (2010) Recent progress in understanding protein and lipidfactors affecting hepatic VLDL assembly and secretion. Nutr Metab 7: 35.
34. Cohen JC, Horton JD, Hobbs HH (2011) Human fatty liver disease: old
questions and new insights. Science 332: 1519–1523.35. Murakami M, Taketomi Y, Sato H, Yamamoto K (2011) Secreted phospho-
lipase A2 revisited. J Biochem 150: 233–255.36. Aebi M, Hornig H, Weissmann C (1987) 59 cleavage site in eukaryotic pre-
mRNA splicing is determined by the overall 59 splice region, not by theconserved 59 GU. Cell 50: 237–246.
37. Leytus SP, Loeb KR, Hagen FS, Kurachi K, Davie EW (1988) A novel trypsin-
like serine protease (hepsin) with a putative transmembrane domain expressed byhuman liver and hepatoma cells. Biochemistry 27: 1067–1074.
38. Tsuji A, Torres-Rosado A, Arai T, Le Beau MM, Lemons RS, et al. (1991)Hepsin, a cell membrane-associated protease. Characterization, tissue distribu-
tion, and gene localization. J Biol Chem 266: 16948–16953.
39. Kurachi K, Torres-Rosado A, Tsuji A (1994) Hepsin. Methods Enzymol 244:100–114.
40. Somoza JR, Ho JD, Luong C, Ghate M, Sprengeler PA, et al. (2003) Thestructure of the extracellular region of human hepsin reveals a serine protease
domain and a novel scavenger receptor cysteine-rich (SRCR) domain. Structure11: 1123–1131.
41. Torres-Rosado A, O’Shea KS, Tsuji A, Chou SH, Kurachi K (1993) Hepsin, a
putative cell-surface serine protease, is required for mammalian cell growth. ProcNatl Acad Sci U S A 90: 7181–7185.
42. Massa ML, Gagliardino JJ, Francini F (2011) Liver glucokinase: An overview onthe regulatory mechanisms of its activity. IUBMB life 63: 1–6.
43. Friedman JR, Kaestner KH (2006) The Foxa family of transcription factors in
development and metabolism. Cell Mol Life Sci 63: 2317–2328.44. Wang C, Rajput S, Watabe K, Liao DF, Cao D (2010) Acetyl-CoA carboxylase-
a as a novel target for cancer therapy. Front Biosci 2: 515–526.45. Lehninger AL, Sudduth HC, Wise JB (1960) D-beta-Hydroxybutyric dehydro-
genase of muitochondria. J Biol Chem 235: 2450–2455.46. Laffel L (1999) Ketone bodies: a review of physiology, pathophysiology and
application of monitoring to diabetes. Diabetes Metab Res Rev 15: 412–426.
47. Bartlett K, Eaton S (2004) Mitochondrial beta-oxidation. Eur J Biochem 271:462–469.
48. Hunt MC, Solaas K, Kase BF, Alexson SE (2002) Characterization of an acyl-coA thioesterase that functions as a major regulator of peroxisomal lipid
metabolism. J Biol Chem 277: 1128–1138.
49. Mead JR, Irvine SA, Ramji DP (2002) Lipoprotein lipase: structure, function,regulation, and role in disease. J Mol Med 80: 753–769.
50. Weiner ID, Verlander JW (2011) Role of NH3 and NH4+ transporters in renal
acid-base transport. Am J Physiol Renal Physiol 300: F11–23.
51. Mandl J, Szarka A, Banhegyi G (2009) Vitamin C: update on physiology and
pharmacology. Br J Pharmacol 157: 1097–1110.
52. Ralph SJ, Rodriguez-Enriquez S, Neuzil J, Moreno-Sanchez R (2010)
Bioenergetic pathways in tumor mitochondria as targets for cancer therapy
and the importance of the ROS-induced apoptotic trigger. Mol Aspects Med 31:
29–59.
53. Brolinson A, Fourcade S, Jakobsson A, Pujol A, Jacobsson A (2008) Steroid
hormones control circadian Elovl3 expression in mouse liver. Endocrinology
149: 3158–3166.
54. Ikonen E (2008) Cellular cholesterol trafficking and compartmentalization. Nat
Rev Mol Cell Bio 9: 125–138.
55. Miziorko HM (2011) Enzymes of the mevalonate pathway of isoprenoid
biosynthesis. Arch Biochem Biophys 505: 131–143.
56. Gross DA, Snapp EL, Silver DL (2010) Structural insights into triglyceride
storage mediated by fat storage-inducing transmembrane (FIT) protein 2. PLoS
One 5: e10796.
57. Liden M, Tryggvason K, Eriksson U (2003) Structure and function of retinol
dehydrogenases of the short chain dehydrogenase/reductase family. Mol Aspects
Med 24: 403–409.
58. King VL, Thompson J, Tannock LR (2011) Serum amyloid A in atherosclerosis.
Curr Opin Lipidol 22: 302–307.
59. Bugge TH, Antalis TM, Wu Q (2009) Type II transmembrane serine proteases.
J Biol Chem 284: 23177–23181.
60. Ganesan R, Kolumam GA, Lin SJ, Xie MH, Santell L, et al. (2011) Proteolytic
activation of pro-macrophage-stimulating protein by hepsin. Mol Cancer Res 9:
1175–1186.
61. Chen M, Chen LM, Lin CY, Chai KX (2010) Hepsin activates prostasin and
cleaves the extracellular domain of the epidermal growth factor receptor. Mol
Cell Biochem 337: 259–266.
62. Nakamura T, Sakai K, Matsumoto K (2011) Hepatocyte growth factor twenty
years on: Much more than a growth factor. J Gastroenterol Hepatol 26 Suppl 1:
188–202.
63. Fafalios A, Ma J, Tan X, Stoops J, Luo J, et al. (2011) A hepatocyte growth
factor receptor (Met)-insulin receptor hybrid governs hepatic glucose metabo-
lism. Nat Med 17: 1577–1584.
64. Grano M, Galimi F, Zambonin G, Colucci S, Cottone E, et al. (1996)
Hepatocyte growth factor is a coupling factor for osteoclasts and osteoblasts in
vitro. Proc Natl Acad Sci U S A 93: 7644–7648.
65. Schultz JM, Khan SN, Ahmed ZM, Riazuddin S, Waryah AM, et al. (2009)
Noncoding mutations of HGF are associated with nonsyndromic hearing loss,
DFNB39. Am J Hum Genet 85: 25–39.
66. Kataoka H, Kawaguchi M (2010) Hepatocyte growth factor activator (HGFA):
pathophysiological functions in vivo. FEBS J 277: 2230–2237.
Pla2g12bP and Hpn Affect HDL Cholesterol Levels
PLOS ONE | www.plosone.org 12 August 2012 | Volume 7 | Issue 8 | e43139
Related Documents